GardnerComments.pdf - Sagebrush Ecosystem Program
182
Proposed Amendments to Nevada’s Sage Brush Ecosystem Plan Submitted by Rural Heritage Preservation Project Dec. 18, 2013 Background and Discussion Nevada is third behind Idaho and California as the most burned over states in the Union. Nevada averages 400,000 acres and over 1.2 million animals burned annually. Nevada fires spew out over 40 million pounds of pollution containing mercury, benzene, ozone, carbon monoxide, particulates and many other kinds of pollutants annually. Before 1950 an average of less than 10,000 acres burned in Nevada annually. Because of the failed policies of the Federal Government the number of acres and animals burned has increased forty times from 10,000 acres to 400.000 acres burned per year, and from 30,000 animals to over 2.2 million animals burned each year. Pollution has also increased by forty times from one million pounds of pollution to over forty million pounds of pollution spewed into the atmosphere each year. The fires of Nevada produce more pollution than all the mines, power plants, vehicles, construction and agriculture in Nevada combined. (See Attachment 1, Smoked Bear Press Release) In 1999 alone, Nevada lost 45,000 acres of bighorn sheep habitat, 668,000 acres of antelope habitat, 144,000 acres of sage grouse habitat, 481,000 acres of chukar habitat, 304,000 acres of mule deer summer range and 341.000 acres of deer winter range to wildfire. (See Attachment 2, Nevada Wildlife Almanac, 4452, Printed by the Nevada State Printing Office, Carson City, Nev.) Cause and effect The Federal Government has reduced sheep grazing on Federal Lands by over 90 percent and cattle grazing by 50 percent within the State of Nevada since 1960. The results of these reductions were not unpredictable. In 1994, Elko County appointed a Grazing Task Force to gather information regarding public lands management within the state. After months of investigation the Task Force found that Federal agency decisions had caused significant decline in the number of livestock and duration of grazing on public lands in Elko County. From 1992 through 1994, cattle numbers in Elko County had declined by 63,000 head. "Livestock grazing acts as an important fire prevention tool. "There is a direct rrelation between the height and density of grasses and the spread, duration, and intensity of wildfires." 1 of 182
-
Upload
khangminh22 -
Category
Documents
-
view
2 -
download
0
Transcript of GardnerComments.pdf - Sagebrush Ecosystem Program

Proposed Amendments to Nevada’s Sage Brush Ecosystem Plan Submitted by Rural Heritage Preservation Project
Dec. 18, 2013
Background and Discussion
Nevada is third behind Idaho and California as the most burned over states in the Union. Nevada averages 400,000 acres and over 1.2 million animals burned annually. Nevada fires spew out over 40 million pounds of pollution containing mercury, benzene, ozone, carbon monoxide, particulates and many other kinds of pollutants annually.
Before 1950 an average of less than 10,000 acres burned in Nevada annually. Because of the failed policies of the Federal Government the number of acres and animals burned has increased forty times from 10,000 acres to 400.000 acres burned per year, and from 30,000 animals to over 2.2 million animals burned each year. Pollution has also increased by forty times from one million pounds of pollution to over forty million pounds of pollution spewed into the atmosphere each year. The fires of Nevada produce more pollution than all the mines, power plants, vehicles, construction and agriculture in Nevada combined. (See Attachment 1, Smoked Bear Press Release)
In 1999 alone, Nevada lost 45,000 acres of bighorn sheep habitat, 668,000 acres of antelope habitat, 144,000 acres of sage grouse habitat, 481,000 acres of chukar habitat, 304,000 acres of mule deer summer range and 341.000 acres of deer winter range to wildfire.
(See Attachment 2, Nevada Wildlife Almanac, 4452, Printed by the Nevada State Printing Office, Carson City, Nev.)
Cause and effect
The Federal Government has reduced sheep grazing on Federal Lands by over 90 percent and cattle grazing by 50 percent within the State of Nevada since 1960. The results of these reductions were not unpredictable. In 1994, Elko County appointed a Grazing Task Force to gather information regarding public lands management within the state. After months of investigation the Task Force found that Federal agency decisions had caused significant decline in the number of livestock and duration of grazing on public lands in Elko County. From 1992 through 1994, cattle numbers in Elko County had declined by 63,000 head. "Livestock grazing acts as an important fire prevention tool. "There is a direct rrelation between the height and density of grasses and the spread, duration, and intensity of wildfires."
1 of 182
trubald
Text Box
Comments and Documents submitted to SETT by Mr. Cliff Gardner 2/2/2014

The Task Force found that the U. S. Forest Service was reducing livestock use on Forest lands as a means of gaining control of permittee's vested water rights. (See Attachments 11, 12,and 13)
The Task Force found that, "Large federal expenditures on fire management had not proven cost effective. "Examples included the Tin Cup and Dawley fires in 1994. More than a half million dollars were spent to suppress these fires." Local fire control would have been more timely, efficient, and cost effective." (See Attachment 3, Elko County Board of Commissioners Grazing Task Force - Findings and Recommendations, June 1995) (See also, Attachment 4, Effects of Long-term Livestock Grazing on Fuel Characteristics in Rangelands by Kirk W. Davies, others) (See too, Attachment 9, Benefits of Grazing and Wildfire Risk, by John M. Harmer)
In a report to the Elko County Commission in Aug. of 2000, Dr. Tony Lesperance reported that for every A.U.M not utilized another half acre was going up in flames each year. (See Attachment 5, The Relationship Between Livestock Grazing And Fire.)
Natural Regulation - Fire - and Concerns for Public Health and Safety
Natural regulation implemented by federal officials is not new. Policy allowing fires started by lightning to burn within limits became a standard soon after forest reserves were created. At that time, the practice of deliberately clearing land with small fires was known as "light burning." It had champions among settlers, loggers, foresters, and others who saw the limited burning as a way to reduce fuel, increase water flow, regenerate pasture, and prevent catastrophic fire. Early advocates of light burning took their cue from regular burning by Indians.
Light burn policy came to an end however, soon after the Big Blowup fire of 1910 occurred. A bad fire season was limping to a close in late August of that year when unexpected winds of near-hurricane velocity struck the panhandle of Idaho and western Montana. The big Blowup raced thirty, forty, and fifty miles in a burst. Smoke from the blaze reached as far east as Boston. Because of the constant fall of ash from the fire, persons living in central and eastern Montana called it the summer of white snow. Flames scorched more than 3 million acres in two days, and kept on burning, destroying logging camps and small towns in its path. No fewer than eighty five people were killed.
The ferocity of the Big Blowout, which came on the heels of other devastating fires triggered a call for a systemic policy change. Less than a year later, the National Forest Service firefighting program was born. Those who fought the Big Blowout united in the desire to never let anything like the Big Blowup Fire of 1910 happen again.
The war against fire proved a success, if measured in acres burned. The amount of forest and grassland consumed by fire dropped dramatically, from an average of about 30 million acres a year at the turn of
2 of 182

the century, and from highs of 40 to 50 million acres a year in the drought years of the 1930's to an average of about 5 million acres a year in the 1970's.
The war also produced the lovable Smokey Bear, who first appeared in 1944 as fire's poster boy. Nothing before or since has influenced the way wildfire has been fought in America? (The book, Fire and Ashes, by John N. Maclean, Chapter 4, pp 195, 196 and 197)
Now it appears, we are back to implementing these same failed policies as were implemented decades ago. We have to ask. Can the high cost in lives, property, rehabilitation, and fire control be justified simply for the purpose of policy that may be in vogue at this time?
Perhaps two of the best laboratories for determining the long term effects of natural regulation are the Sheldon National Wildlife Refuge and Hart Mountain National Wildlife Refuge. Unbeknown to most, one of the most intensive predator control programs ever carried out here in the west was implemented in the early 1920's on an area that was then described as the northwest corner of Nevada and south central Oregon. Between 1921 and 1934, 7,500 coyotes and bobcats were systematically removed. By 1935 it was estimated that antelope numbers had increased to more than 10,000 animals. Mule deer were becoming more and more abundant and sage grouse were being seen by the thousands. (See page 3 of, Visits To The Sheldon National Wildlife Refuge In 1989, Attachment # 6)
Some might say, what is so significant about that. Well, the significance is, historically, or at least at the time of first exploration into the region no wildlife of any significance was seen in the region. Predator control, you might say, was the father of the Hart Mountain and Sheldon Refuges.
Now, some seventy five or so years later, we are experiencing the opposite situation. Each year fewer and fewer wildlife of nearly every kind are being seen on the Sheldon and Hart Refuges. In fact, on close inspection it can be seen, when wildlife numbers began to decline beginning in the 1960's and 70's such occurred first on refuge lands simply because, that was where the elimination of livestock grazing and reductions in predator control practices were first implemented.
Probably one of the most beneficial things accomplished by refuge personnel over the years has been the narrative reports that have been kept year by year. Beginning in 1940 at Hart and Sheldon, estimated numbers of animals, production, and yearly activities have been well recorded. (See Attachment #7, History of Predator Control Practices on the Sheldon National Wildlife Refuge and Hart Mountain Range, Report No. 110)
3.2.1 Conservation Objectives -
Short Term
3 of 182

- Reduce the amount of sage-grouse habitat loss due to large acreage wildfires and invasion by non-native species.
- Reinstate livestock grazing use within allotments to equal that of the time of first adjudications.
Long Term
- Maintain an ecologically healthy and intact sagebrush ecosystem that is resistant to the invasion of non-native species and resilient after disturbances.
- Maintain traditional levels of grazing use on all public lands.
- Seek to more readily activate non-active A.U.M.s within allotment on above average moisture years.
3.2.2 Conservations Policies - Public Health and Safety - Paradigm Shift.
- Prioritize public health and safety of those living within fire districts - emphasize the importance of encouraging local control and leadership when conducting firefighting measures within rural communities - recognize and encourage traditional fire fighting methods of controlling wildfire.
- Prioritize the importance of quick response - wildfires at all times should be put down when conditions are right for putting them down. (See, Rural Heritage Preservation Project, Finding of Facts, Findings #25 and #27)
Cheatgrass Concerns - Cheatgrass Myths
A good many species of wildlife benefited from cheatgrass, including bighorn sheep, deer, pronghorn antelope and Elk. In summer and in fall, the bulk of chukar diets is composed of cheatgrass seeds. Sage grouse became more and more abundant in during the time when cheatgrass was becoming more and more prevalent across the intermountain west.
Personnel at Hart Mountain found deer and bighorn feeding on cheatgrass and doing well in 1941. (See Attachment 7, Rural Heritage Preservation Project, Report No. 110, History of predator Control practices on the Sheldon National Wildlife Refuge and Hart Mountain Antelope Range, pp 23, 24)
Cheatgrass is one of the most important sources of feed for livestock and wildlife found in the Great Basin. Mule deer, with their small muzzles often reach beneath existing sagebrush during winter in order to nibble new shouts of green cheatgrass when green feed is not available elsewhere.
4 of 182

Cheatgrass is a good source of feed even when it is in a cured condition. Livestock, like people, tend to like a variety of foods. Some plants, like shrubs and browse, are often high in protein while cured grasses are often good source of energy. So if a cow, or sheep or antelope, depending on the kind of country they are in, can eat a little desert shrub or maybe some greasewood - or if they are in the mountains, some quaking aspen or rosebush, or chockcherry,, along with cheatgrass, they get along fine. In fact, it is not uncommon to see cattle during winter on cheatgrass range that look better than cows that are being fed a full ration of hay. (See Attachments, 15 and 16, Is Cheatgrass of any Nutritional Value? by Dr. L. Ben Bruce, and Cheatgrass:Changing Perspectives and Management Strategies, by F.L. Emmerich, F. H. Tipton and J.A. Young)
Cheatgrass invasions when not managed wisely have proven harmful during recent decades. Cheatgrass infested plant communities can present a fire hazard only when rangelands are not grazed properly.
It's not cheatgrass that has caused the huge fires that have been burning out of control during recent decades. The drive to reduce and eliminate grazing whenever and wherever possible during recent decades has taken its toll. Instead of rangeland feed being utilized as it once was in the 1940's, 50's and 60's, large amounts of feed are left on our western rangelands from year to year - setting the stage for catastrophic wildfires that consume thousands upon thousands of acres at a time - at the expense of ranching families - at the expense of taxpayers - and at the expense of wildlife.
The assumption that cheatgrass has displaced native vegetation within sage brush steppe rangeland may be incorrect. Beginning in 1979, a fourteen year study was undertaken in southeastern Oregon soon after scientist found two isolated areas deep within large lava flow areas where livestock had never grazed not had cheatgrass been introduced. During the study several things were learned. First of all, contrary to popular belief, it was found that the number of plants per square yard was not what had been expected. At the Eastern Site it was found that 59 percent of the ground was barren of vegetation, while at the West Site, ground barren of vegetation ranged from 84 percent in 1980 to 76 percent in 1991.
Most significant was the increase in cheatgrass which occurred at the West Site beginning in 1980. Apparently, there was an unintended introduction of cheatgrass by the scientist themselves. Site previously barren of vegetation became populated by cheatgrass, yet no loss of perennial grasses, forbs, or shrubs was noted during the remainder of the study. Cheatgrass does not crowd out native vegetation as some believe. (See Attachment 14, Pristine Vegetation of The Jordan Creator Kipukas: 1978-79 by Robert R. Kindschy)
Perhaps the most important study accomplished recently addressing the issue of cheatgrass, fire, grazing relationships was completed by Kirk W. Davies in 1993 near Burns Oregon.
5 of 182

In that study scientist instigated controlled burns, first to as area that had not been grazed since 1936, comparing it to a second area that had been routinely grazed to the time of burning.
Surprisingly, perennial bunchgrass increased 1.6 fold within the grazed area - while cheatgrass increased 49 fold within the protected area.
What was learned was, grazing serves to reduce fire intensity, thereby reducing soil hating, which then causes greater perennial bunch grass and forbs survival, which in turn prevents a cheatgrass invasion.
(See Attachment 10, a paper titled, Interaction of historical and non-historical disturbances maintains native plant communities - K.W. Davies, Svejcar and Bates. See too, discussion within, Rural Heritage Preservation Project's Findings of Facts)
6 of 182

(1) September 27, 2013
-----------------
Smoked Bear Press Release
Nevada is third behind Idaho and California as the most burned over states in the nation. Nevada
averages 400,000 acres and over 1.2 million animals burned annually. Nevada fires spew out over 40
million pound of pollution containing mercury, benzene, ozone, carbon monoxide, particulates and
many Other kinds of pollutants.
Before 1950, an avera~e of less than 10,000 acres burned in Nevada annually. Because of the failed
policies of the Federal Government, the number of acres and animals burned has increased forty times
form 10,000 acres to 400,000 acres and from 30,000 animals to over 1.2 million animals burned each
year. The pollution to over forty ,million pounds of pollution.
The Federal Government has reduced sheep grazing on Federal Lal'ld oy over 90% and cattle grazing by
over 50% in Nevada since 1950. A reversal of this government policy would reduce the fuel loads and
thus the fires would likewise diminish. But the Federal Government continues to reduce grazing and the
present policies of the Federal Government indicate that the reduction in grazing will continue. Grazing
in 2013 in several Nevada counties was again reduced. Each time grazing is reduced more acres and
ariimals Durn aM more pollUtion iS spewed into the air.
Until 2012 California held the dubious distinction of being the most burned state over the last twelve
years, but Idaho passed California in 2012 when Idaho had over 1.6 million acres burn.
Elko County is the most burned over county in Nevada, and probably in the nation, with an average of
over 2oo,ooo acres outning per year. Each average year aver soo,ooo animals (Vertebrates) burn and over 20 million pounds of pollution is spewed in the air from Elko County fires. This increase pollution is
a major health hazard for downwind communities, especially Salt Lake City. The Wasatch Mountains act
as a catcher's mitt to catch the pollution from the prevailing winds. The fires of Nevada produce more
pollution than all the mines, power plants, vehicles, construction and agriculture in Nevada combined.
For more information go to smokedbear.com or call:
A. Grant Gerber, Travis W. Gerber or Zachary A. Gerber
4914th Street
Elka, NV 89801
(775)-738-9258 Telephone
7 of 182

PAGE 8
'·• ;. ' . ::. : ,. : ' :' ' . ~. •'. '••,:
. ~.: ): : : ,: . ' '
4452
NEVADA DIVISION OF WILDLIFE
11 ___ oo_va_neyRoad ~-·~_.··~-- .•... · ... ·. Reno, Nevada "". e a1 . . 89512 ~ m ~ . -~
~-';s.\5 .·. ~ .. "U.1'bn.JC ,_ t (2)
Art a c h H'? e ""~~t·
Nevada Wildlife Almanac Is a publication of the Nevada Division of Wildlife, Bureau of Conservation Education and Is funded In part by Federal Aid through Sportflstl & Wildlife Restoration.
... . '
~:~~~.~f: ' "' ' ''? .. 1\;<• ~ ' ', .... ~,. •;. '1: . ' ....... .
'••,.._.., ,:, I ·:~.,..!~~"·-,_ ,.\ ,• '' '•' '
r;u.nr:J .. ;r, g :1r r.:u~Ft\1)~~:.\l?:Ft . DOWNEY. CREER RNCH RUBY VALLEY NV 89833
'•;'•,
WILDLIFE ALMANAC
Bulk rate US Postage
PAID Reno; NV
Permit# 618
8 of 182

I~ IIV'- LIIC \.IQ.;;:>Q Ut
Nevada where the intere~t in pursuing l;lig
· ·;:;1\t:m.nt, Ultr gaf~le
biologist's role in deer · inanagement and how
: .. ; . .: ~: . ~ :. ~ '
'
· 'P~~ manage~entofd~er trrNeliaqa.ls an. evol~lng
I'
r~any ~ll1C?~Ict plaY. ~ ro.le · In the manageme"ftt, 9f. · .. your wildlife'. The Division . ·. ' ' ,
essen~1.a1, out. Crttt~ Cpllly,ir11P6rtahtl
' ;.! ., ~
FIRES AFFECT 1 .5 MILLION ACRES-RESEEDING PROJECTS PLANNED 8Y KELLY CLARK
Nevada's 1999 fire season set records that state wildlife biologists hope will never be broM ken. As of Sept. 1, 1999, a recordMbreaklng 1.5 million acres of Nevada wildlands had burned. Vast expanses of wildlife habitat, including more than 45,000 acres of bighorn sheep habitat, 668,000 acres of antelope habitat, 144,000 acres of sage grouse habitat, 481,000 acres of chukar habitat, 304,00
Fire Information Sources
BLM Reno state office Mike Holbert 861~6767 Jo.Simpson 861-6629
BLM Elko field office Don Dagnan 738-4071
BL,.M .Internet site for fire information www.nv.blm.gov/wgbcc/ default.htm
USFWS Sheldon Refuge (541) 947-3315
acres of mule deer summer range and 341,000 acres of deer winter range were affected during the fires that swept the state in July and August.
One of the hardest hit areas was Game ManagementArea 6 in the NE portion of the state. Early reports by biologists show that the Clover Fire, in western Elko Co. and northern Lander Co.
burned 72,000 acres in the lzzenhood Range and the Dinosaur Hills, areas used extensively by wintering deer. In the past these areas supported an average of 1,742 deer, and the impacts to them are expected to be significant.
At the September Wildlife Commission meeting, commissioners heard
reports on the fires and their impacts on wildlife. One proposal to close Unit 065, which is located southwest of Elko, was heard, but commissioners decided to leave the unit open citing deer mobility and ample time for the deer to move to better habitat. However commissioners did decide to close the unit to sage grouse hunting due to concerns about limited
FIRE'S INFLUENCE ON DEER HABITAT 8Y DOV~:HUNT · ..
Mute q~~V liy~ .in a wi.~~. . . .· forbs and shrubs, like . only a limite.d number .of variety Qf:habitats, includ- saget>rush andbitterbrush, deer can pass. Th.is in ing openel::miferpp~ and.$6me grasses. Natural turn can decr"·'~<the herd forests ~nd f()rest edges, ·· ····and rriliii~:~-ma\ie factors·oan · due to the la~ftj~f suitable woodlan~s; :and shrub · limit the habitat, which in habitat concHtl~lit$'at that rangelallldis: These .. turn car:tcause hardships· .. time of year.'.jr~;~'~ ' . . . habitats>provide wine!:·.. on the deer herd using · · · breaks during.th~·cdlct.. . . · .. · th~lrt:'. F.o'(instance, a · winter and s.hC!<:te during wln:ter range critical to a the warm !!JUI11111er ... ·. paliic~far·cieer herd may .. months.j:,~:~·swell ~s 'be altered or losfdue to .. escape:eoverfr~m) preda- fire or other factors .. When· . tors. ~qditionally,. these . the suitability of a. habitat habitat$':9\J:pport favored ·is altered, it cap create a ·· food soi.ircesinclu<:!ing .·' "bottlen'eck" through .which:. . . . • . .. . .
· ·· · · · . · · · Contmued on page 2
mobility and vulnerability of the remaining population pockets on small pieces of habitat throughout the area.
Since the fires, federal, state, county and local governments have orgaM nized to assess damages Continued on page 2
INSIDE
ALMANAC
ETHICS.: ............. · ..... .;. 2
RANGE REHAB ........ 3
DEER HISTORY ........... 3
DUNPHY HIL.L.S .......... 4
URBANIZATION .......... 4
BIOL.OGISTS ROLE ..... 5
ESTIMATING .............. 5
PREDATOR .................. 6
ADVISORY BOARDS .. 6
WINTER OF '92·93 ..... 7
F'EEDORNOT ............ 7
SURVEY ..................... 7 REGULATION .•..••••• , .•.• 8
9 of 182
Cliff
Highlight
Cliff
Highlight
Cliff
Highlight
Cliff
Highlight
Cliff
Highlight

I
\'."""'v""'"'~'-t llt'""'""'''-"~t
Co.) were under review. groups.
ETHICAL BEHAVIOR IN
BURN AREAS . BY MAUREEN ANGEL
Division of Wildlife asks hunters and other
· outdoor enthusiasts to practice good ethical behavior in burn areas while out in the field this fall and winter.
Larry Barngrover, NDOW eastern re-:gional manager, Elko, says he is concerned about activities in or around the burn areas. "Ma·ny of the wildlife species that are iri these fire. ar.eas are ·
·. still disorientecl and ..• are probably still trying to adjust to whatever habitat is ieft," said
. Barngrover. · ·
Historically fir~s tended to b.urn in a patchwork· pattern. There will be "patches'' of unburned vegetation left In the burned areas, and the wildlife left in these areas will seek out th.ese small patches of sagebrush, aspen, or other vegetation that is left.
"We would recommend that people try to leave these animals alone and not increase the impacts on them by chasing them with four':' · wheelers, motorcycles, or other motori~.ed vehicles," Barngrover said. "I believe that most people consider it to be wiethicartd pursue or intensively hunt those ariii:nals in the little patches of vegetation that have not burned. It's just not a sporting proposition."
Another r~ason for not using off-road vehicles in thE> burned areas is the potential damage to the land itself. Vehicle traffic can accelerate erosion once the areas start receiving seasonal rains. Off-road activity will leave trails and tracks throughout the area, further intensifying the erosion cycle.
INFLUENCE OF FIRE Cont'd from page 1
community, which is heavily utilized by mule deer, burned.pn the order of every 50 to 100 years. Higher elevation vegetation (mountain shrub communities) may have sustained burns every 25-50 years. "Cool" fires, in the absence of cheatgrass, create greater edge effect by burning a mosaic through the vegetation, which may be crucial to mule deer for thermal and escape cover and provides a new growth of key forage species. Hot, wind driven fires on the other hand, especially in the Wyo-
. ming big sage communities, can be devastating to mule cjeer habitat and create a loss that may not be recovered for many years, if ever. These same hot fires, when occurring in shrub habitats infested with cheatgrass, may burn as often as every three to five years, and create a monotypic stand of cheatgrass which offers virtually no mule deer habitat benefits. The Winnemucca BLM District estimates that of the three million acres of
Wyoming big sage present in the District, one million acres has been converted to cheatgrass by this accelerated fire cycle over the past 14 years. Should this rate of conversion be maintained and go unchecked, very little Wyoming big sage will be left in this area within 30 years.
What are the answers? We know fire will come, and we know habitat will burn. Science is moving forward with several experimental methods to control cheatgrass, both biological and chemical in nature. Until such time as these methods prove effective, it behooves sportsman's and conservation groups alike to work with land management agencies like the BLM and Forest Service to rehabilitate critical habitats as soon as possible following a fire. This can be a costly endeavor and requires work at many levels to achieve positive results, but is of the ways that the cheatgrass/fire cycle can be broken.
l.l~O"¥JIIIJ~01 '1'11" '"''"K''II ... ('tO~) 41J6·l)1~7 ., .. . .. Ser\ting Clark, Esmem:alda; Lincoln and Nye Counties.
Nevada Board of Wildlife Commissioners: Chairman: Bill Bradley Vice Chair: Boyd Spratling· Secretary: Terry CraWforth Merv Matorian Jack Coons Bill Frade David Jickling Marlene Kirch Jelindo Tiberti
Almanac Staff:. ConseJVatlon Edt~cation Bureau Chief: David K Rice Editor: Maureen Angel Assistant Edit()r: Kelly Qlark
Nevada Wlldilfe Almariac This publication receives funding through the Federal Aid in Sport Fish.& Wildlife Program. Federal and state law require that there shall be no differ~lice in the treatment of individuals because ofrace, oolor,. creed; religion, national origin, sex or disability. If you believe you have been discriminated agailist, contact either:
Administrator· . Dlvl~ion'or. Wildlife P.O:· Box 10678 Rerio; NV 89520~0022 or : ·.. · .· ··. Office fo~ Equal Opportunity u.s. Dept.. of the Interior · Office of the. Secretary Washington, D.C. 20240
Printed by the Nevada State Printing Office
Carson City, NV
10 of 182
Cliff
Highlight
Cliff
Highlight
Cliff
Highlight
Cliff
Highlight

·.' -.
c c
~ . :- . .
--- ----cc __ _
c ELKO COUNTY BOARD OF COMMISSIONERS
c GRAZING TASK FORCE
FINIJINGS ccccc ANDc .
-RECOMMENDATIONS
c c - _ JUNE t995
11 of 182

TABLE OF CONTENTS
SECTION PAGE
EXECUTIVE SUMMARY . . . . . . . . . . . . . . . . . . . . . . . . . . . . . . . . . . . . . . . . . . . iii 1 . 1 INTRODUCTION . . . . . . . . . . . . . . . . . . . . . . . . . . . . . . . . . . . . 1 - 1 1 .2 SURVEY TECHNIQUE . . . . . . . . . . . . . . . . . . . . . . . . . . . . . . . . 1 - 3
1.2.1 Procedure . . . . . . . . . . . . . . . . . . . . . . . . . . . . . . . . . . . 1 - 3 1.3 PROBLEMS AND RECOMMENDATIONS . . . . . . . . . . . . . . . . . . . . 1 - 4
1.3.1 Evidentiary Hearings . . . . . . . . . . . . . . . . . . . . . . . . . . . . 1 - 4 1.3. 1.1 Problem . . . . . . . . . . . . . . . . . . . . . . . . . . 1 - 4 1.3.1.2 Situation Assessment . . . . . . . . . . . . . . . . 1 - 4 1.3.1.3 Task Force Recommendations . . . . . . . . . . . 1 - 7 1 .3. 1.4 References ........... ·. . . . • . . . . . . . . 1 - 8
1.3.2 Federal Range Management . . . . . . . . . . . . . . . . . . . . . . . 1 - 8 1.3.2.1 Problem . . . . . . . . . . . . . . . . . . . . . . . . . . 1 - 8 1.3.2.2 Situation Analysis • . . . . . . . . . . . . . . . . . . 1 - 8 1 .3.2.3 Task Force Recommendations . . . . . . . . . . . 1 - 11 1 .3.2.4 References . . . . . . . . . . . . . . . . . . . . . . . . 1 - 12
1.3.3 Economics . . . . . . . . . . . . . . . . • . . . . . . . . . . . . . . . . . . 1 - 12 1 .3.3.1 Problem . . . . . . . . . . . . . . . . . . . . . . . . . . 1 - 12 1.3.3.2 Situation Analysis . . . . . . . . . . . . . . . . . . . 1 - 12 1.3.3.3 Task Force Recommendations. . . . . . . . . . . 1 - 13 1.3.3.4 References . . . . . . . . . . . . . . . . . . . . . . . . 1 - 13
1.3.4 Water . . . . . . . . . . . . . . . . . . . . . . . . . . . . . . . . . . . . . . 1 - 14 1.3.4.1 Problem . . . . . . . . . . . . . . . . . . . . . . . . . . 1 - 14 1.3.4.2 Situation Analysis . . . . . . . . . . . . . . . . . . . 1 - 14 1.3.4.3 Task Force Recommendations . . . . . . . . . . . 1 - 15 1.3.4.4 References . . . . . . . . . . . . . . . . . . . . . . . . 1 - 15
1.3.5 Fire Management . . . . . . . . . . . . . . . . . . . . . . . . . . . . . . 1 - 16 1.3.5.1 Problem . . . . . . . . . . . . . . . . . . . . . . . . . . 1 - 16 1.3.5.2 Situation Analysis . . . . . . . . . . . . . . . . . . . 1 - 16 1.3.5.3 Task Force Recommendations . . . . . . . . . . . 1 - 17 1.3.5.4 Reference . . . . . . . . . . . . . • . . . . . . . . . . 1 - 17
1.3.6 Endangered Species Management (Lahontan cutthroat trout) 1 - 18 1.3.6.1 Problem . . . . . . . . . . . . . . . . . . . . . . . . . . 1 - 18 1.3.6.2 Situation Analysis . . . . . . . . . . . . . . . . . . . 1 - 18 1.3.6.3 Task Force Recommendations . . . . . . . . . . . 1 - 21 1.3.6.4 References . . . . . . . . . . . . . . . . . . . . . . . . 1 - 22
1.3.7 Predator Control . . . . . . . . . . . . . . . . . . . . . . . . . . . . . . . 1 - 22 1.3.7.1 Problem . . . . . . . . . . . . . . . . . . . . . . . . . . 1 - 22 1.3. 7.2 Situation Analysis . . . . . . . . . . . . . . . . . . . 1 - 22 1.3.7.3 Task Force Recommendations . . . . . . . . . . . 1 - 24 1.3. 7.4 References . . . . . . . . • . . . . . . . . . . . . . . . 1 - 24
1.3.8 Wildlife Management . . . . . . . . . . . . . . . . . . . . . . . . . . . 1 - 25 1.3.8. 1 Problems . . . . . . . . . . . . . . . . . . . . . . . . . 1 - 25
June 1995
12 of 182

SECTION
TABLE OF CONTENTS
PAGE
1.3.8.2 Situation Analysis . . . . . . . . . . . . . . . . . . . 1 - 25 1.3.8.3 Task Force Recommendations . . . . . . . . . . . 1 - 28 1.3.8.4 References . . . . . . . . . . . • . . . . . . • . . . . • 1 - 29
1.3.9 Misinformation Regarding the Ranching Community and Livestock Production on Public Lands . . . . . . . . . . . . . . . . 1 - 29 1.3.9.1 Problem • • . . . . . . . . . . . . . . . . . . . . • . . . 1 - 29 1.3.9.2 Situation Analysis . . . . . . . . . . . . . . . . . . . 1 - 29 1.3.9.3 Task Force Recommendations . . . . . . . . . . • 1 - 31 1.3.9.4 References . . . . . . . . . . . . . . . . . . . . . . . . 1 - 31
2.1 CONCLUSION ..................................... .
-June 1995 ii
13 of 182

EXECUTIVE SUMMARY
In December of 1994, Elko County Commissioners appointed a seven member Grazing Task
Force to gather information about processes and policies used by public land management
agencies in relation to livestock grazing permits on public land within the County. The purpose
of the Task Force was to gather and document information on how agencies are making policies
and decisions affecting ranchers.
In February of 1995 the Task Force members creafed a list of the entities that have
I responsibility and interest in agriculture in our County. Frbm February to June, they interviewed
at least 132 individuals that represent agencies with direct responsibilities to the livestock
industry, advisors, and our livestock operators.
Task Force members have also expended many hours trying to read pages and pages of badly
written, pompously phrased federal directives and "plans" {allotment management plans
{AMPs), coordinated resource management plans (CAMPs), land and resource management
plans (LRMPs}, and dozens of amendments to plans and proposed rules to "amendment"
regulations and plans, all with various acronyms. Co~munication does not seem to be the
objective of unnecessarily long, repetitive, or contradictory emissions. Sometimes, hidden in
wordy paragraphs, intimidation and control are implied. On the other hand, the authors of these
federal documents may not understand their own agency concepts since they present them so
poorly.
June 1995 iii
14 of 182

Veritable tomes are routinely presented to ranchers and others with the condescending
admonition to "read it and then ask questions" as if they, like bureaucrats, get paid for putting
in eight-hour days pondering pages.
Government employees should be required to take writing courses so they can produce concise,
readable documents and, incidentally, save paper (trees) and ink, to say nothing of time and tax
payer money.
Task Force members concluded that much of the presently recognized conflict is due to a lack
of communication and coordination between federal agency personnel and the livestock
permittees, as well as between federal and state agencies. The lack of dialogue so necessary
for public land range management programs to be successful has become an obstacle to
cooperation in the past 5 to 7 years.
The U.S. Forest Service (USFS) and U.S.D.I, Bureau Land Management (BLM) have different
enabling legislation for multiple use management of their respective plots of lands, however,
the two agencies have common contentious issues.
Other agencies with direct legislative mandates that involve public land management are Fish
and Wildlife Service (USFWS) and Nevada Division of Wildlife (NDOW). These agencies express
their Endangered Species Act responsibilities and wildlife population management objectives
through USFS and BLM.
Also present in this mix of concern for land management health are the Natural Resource
Conservation Service (NRCS); University of Nevada, Reno, Agriculture Extension Service;
June 1995 iv
15 of 182

National Soil Conservation Districts; and U.S.D.A. Animal Damage Control Program (within
Animal and Plant Health Inspection Service). These agencies exist to help livestock producers
use the range properly; not to regulate and penalize. The attitudes of these public employees
(people well-educated in specific services) are decidedly different from those in other federal
agencies.
The National Environmental Policy Act (NEPA) process professes to encourage input from the
general public, livestock producers, and County officials, but these people who are most
affected by NEPA decisions find their input receives almost no consideration. Meanwhile, the
strident voices of distant environmental organizations are given unwarranted priority. Their
members have the time, money, and political clout to influence agency personnel who either
do not know the difference between questionable science and sound science or choose to
ignore it. Land management goals should not be determined by emotionally driven agendas.
In recent years there have been numerous court cases in the western states in which
management policies have been challenged and have served to force an agenda that focuses
on preservation of resources rather than sound health and balanced utilization practices. This
emphasis of land management by lawsuit is one source of the conflict in rural counties.
Federal agencies have failed to assess and communicate impacts of land management decisions
in regard to grazing practices. Federal secrecy and bureaucratic screening of information has
resulted in a misinformed public. The example in our County is the successful appeal of the
1986 Humboldt National Forest Land and Resource Management Plan which resulted in the
Forest's Amendment #2 regarding grazing utilization standards. The fact that the USFS stated
June 1995 v
16 of 182
Cliff
Highlight
Cliff
Highlight
Cliff
Highlight
Cliff
Highlight
Cliff
Highlight
Cliff
Highlight

the amendment would not affect grazing outputs is simply not true. The effect has been
devastating to the local ranching community.
In light of the tremendous human and economic hardships resulting from recent federal
decisions such as Amendment #2, the Task Force recommends, as a first step, thatthe existing
decision-making process used by federal agencies be overhauled:
1. Congressional representatives should recommend restructuring USFS and BLM appeal processes.
2. Elko County should be a party to federal land management decisions and the appeals process.
3. The Board of Commissioners should act as agent for obtaining effective public participation from the citizens of Elko County about public land management decisions.
Task Force members believe these steps are justified. The Commissioners, representing the
people of Elko County in which the public land lies, support proper grazing and maintenance of
vegetation necessary to maintain and protect water quality and to prevent soil erosion, therefore
should have a strong voice in public land management. At times when communications
between ranchers and federal agencies break down, the County is the proper forum to represent
ranchers and resolve conflicts.
June 1995 vi
17 of 182

CHAPTER 1: GRAZING TASK FORCE
1 . 1 INTRODUCTION
Members of the Grazing Task Force appointed by Bko County Commissioners in February of
1995 believe the current media and federal agencies' attack on livestock producers, many of
whom lease public lands, is resulting in damage to the resource it is supposed to protect and
is threatening one of the County's main industries. Federal control has not benefitted wildlife,
has not progressed in 25 years in re-establishing Lahontan Cutthroat Trout, and has damaged
the local economy.
We believe wild fires are destructive and excessive build-up of fuels can be prevented by
allowing flexibility in grazing systems for appropriate utilization.
We see ranchers blamed for overgrazing by "wild" horses which are allowed on ranges year
round while cattJe and sheep are not. We recognize that flexibility is necessary for livestock
operators to meet the changing variables that are a part of managing a dynamic subject like the
land. The Task Force accepts that the considerations for good management are complex and
that there are many possible solutions.
While portions of society have dramatically shifted their perceptions of federal land
management, their demands for resources, including those produced by the livestock industry,
have persisted. If ranchers are eradicated (as many will be if using public lands is denied), an
June 1995 1 - 1
18 of 182
Cliff
Highlight
Cliff
Highlight
Cliff
Highlight
Cliff
Highlight
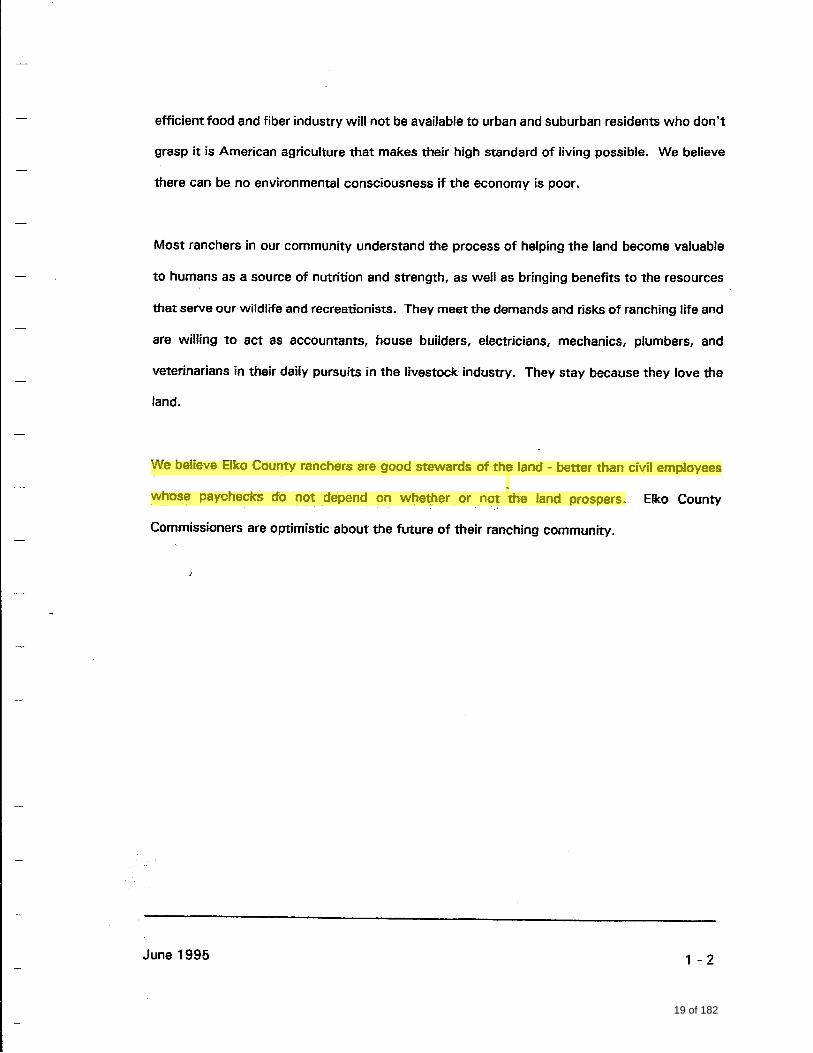
efficient food and fiber industry will not be available to urban and suburban residents who don't
grasp it is American agriculture that makes their high standard of living possible. We believe
there can be no environmental consciousness if the economy is poor.
Most ranchers in our community understand the process of helping the land become valuable
to humans as a source of nutrition and strength, as well as bringing benefits to the resources
that serve our wildlife and recreationists. They meet the demands and risks of ranching life and
are willing to act as accountants, house builders, electricians, mechanics, plumbers, and
veterinarians in their daily pursuits in the livestock industry. They stay because they love the
land.
We believe Elko County ranchers are good stewards of the land - better than civil employees .
whose paychecks do not depend on whether or not the land prospers. Elko County
Commissioners are optimistic about the future of their ranching community.
June 1995 1 - 2
19 of 182
Cliff
Highlight

1 .2 SURVEY TECHNIQUE
1.2.1 Procedure
In February of 1995, the Elko County Commissioners appointed the following seven people to
the Grazing Task Force:
• Leta Collard, Task Force Coordinator • Llee Chapman • Roberta Skelton
Roy Eisner • Gene Gustin • • Mary Branscomb • Von Sorenson
The Task Force proceeded to gather information about processes and policies used by public
land management agencies when they determine how Elko County ranchers use the public lands
they lease and how these policies affect individuals. The Task Force has completed eighteen
meetings with at least 132 participa,nts from a variety of backgrounds, including:
t •
•
• • •• • •
June 1995
93 members of the ranching community from 6 geographic areas within the County;
22 agency representatives {17 federal people including 5 USFS, 5 BLM, 2 USFWS, 1 National Resource Conservation District {NRCO), 3 Animal Damage Control (ADC), and 1 Ruby Valley Wildlife Refuge) and 5 state people (4 Nevada Division of Wildlife (NOOW) and 1 Nevada Wild Horse Commission);
8 independent consultants;
2 representatives from University of Nevada, Reno, Agriculture Extension;
2 from the County Wildlife Commission;
2 Holistic Resource Management instructors; and
3 representatives from the Elko County Conservation Association •
1 - 3
20 of 182
Cliff
Highlight
Cliff
Highlight
Cliff
Highlight
Cliff
Highlight
Cliff
Highlight
Cliff
Highlight
Cliff
Highlight
Cliff
Highlight
Cliff
Highlight
Cliff
Highlight
Cliff
Highlight
Cliff
Highlight

1.3 PROBLEMS AND RECOMMENDATIONS
The Task Force findings and recpmmendations on nine major issues raised in the meetings are
addressed within this section.
1.3.1 Evidentiary Hearings
1.3. 1 . 1 Problem
Federal agency decisions have caused significant declines in the number of·
·livestock and duration of grazing on public lands in Elko County. The USFS
and BLM appeal processes are set up to clear the federal government of alleged
incorrect action instead of being an impartial forum for determining the merits
of appeals. The existing processes force the complaining party to appeal to
the same agency that made the decision.
1 .3. 1 .2 Situation Assessment
The appeal processes used by the USFS and BLM are expensive and tend to. coerce ranchers
into giving in and agreeing to the agency's decision. Ranchers have no legal avenues other than
to exhaust all administrative remedies and then proceed to court. Since· the agencies control
the administrative process, ranchers can spend inordinate amounts of time and money white
agency people support their fellow workers' decisions. If ranchers choose to pursue court
action, the costs are usually prohibitive. While agencies have the resources of the federal
June 1995 1 - 4
/
21 of 182
Cliff
Highlight
Cliff
Highlight

government, paid for by taxpayers, ranchers have limited funding. Due process is seldom
served.
Livestock producers in Elko County are experiencing harassment including significant animal unit
month (AUM) reductions and fines for peny infractions.
In April of 1990, USFS was writing letters stating that they were "strongly committed to
minimizing Federal requirements to allow individual permittees the maximum flexibility in their
operations. We are also committed to reducing our paperwork to allow our employees more
time in the field .... " (USFS letter signed for Intermountain Regional Forester, Stan Tixier by
Robert Joslin, April 16, 1990).
Hoping this rhetoric was true, livestock producers in Elko County attempted to cooperate and
compromise with the agencies. The result has been new permit terms making their ranch
operations uneconomical. One example occurred during the recent drought when many
ranchers took voluntary non-use of part of their allotments to avoid damaging rangelands. Now
that the drought is over and rangelands have abundant forage, the federal government will not
reinstate those AUMs.
Task Force members recognize that policies are subject to interpretation and individual agency
employees have their own dynamics which vary widely from one range manager to another and
from District to District. For that reason, instead of the intended flexibility and coordination,
undesirable results are occurring in Elko County.
June 1995 1 - 5
22 of 182
Cliff
Highlight
Cliff
Highlight

The new standards and guidelines developed by the USFS are unrealistic and unattainable. The
agency forced 42% of the ranchers in Elko County to remove livestock earlier than their permit
date last year. Ranchers say the agency's current policies are designed to create such hardship
on ranchers that many will go out of business. However, the USFS (Humboldt National Forest
Plan Amendment #2) promises the ranchers, in writing that forage utilization standards n do not
significantly alter ... outputs. "
The USFS has recently decreased AUMs and imposed fines for the slightest infractions of
permits. Examples include:
• A permittee with two or three cows on the wrong side of a fence for a couple of days received a 25% reduction in AUMs on his entire allotment.
• A permittee put out less cattle than allotted to avoid rangeland damage. When the permittee requested a refund of a portion of his grazing fee, the USFS replied "I cannot approve a credit for a permit violation. By not placing these 49 head on the Forest you have violated ... your Term Grazing Permit." The ranch was forced to pay for A UMs that they volunteered to rest.
• The reason the particular permittee did not put out the cattle was lack of water because the USFS did not install a water pump they had agreed to install. Also, in the early spring of 1994 there was a lack of sufficient forage for full turnout.
• A permittee was told by the USFS thatthe agency has never reduced their AUMs, but pointed out the USFS reduced the number of acres so much the permittee would be charged with resource damage if he used the allotted number of AUMs;
• When a permittee was fined for unauthorized use (six cows from a different ranch were observed by the USFS) he asked why he was not informed of the USFS inspection. The USFS responded that "It would have been inappropriate for you to accompany them on this ride. While in the field my staff observes all resource conditions whether it be a range fire, areas of over utilization, or livestock in excess of the permitted date •.. . You are correct in stating that the USFS will consult, cooperate and coordinate with the permittee when allotment management planning is conducted •.. the inspection was not part of your allotment management planning. "
• Another USFS letter received by same permittee states "Consider this letter a warning. The Humboldt National Forest recommendations for the next offense
June 1995 1 -6
23 of 182
Cliff
Highlight

is suspension of 25% for up to 5 years or, if it is determined that your actions are intentional, cancellation of a portion or all of your Term Grazing Permit. "
• The same permittee noted that the USFS tone of their annual operating plan changed considerably in 1 993. Seven new conditions were forced upon him if he was to obtain the permit.
• A permittee received a letter from the USFS stating "Numbers and seasons listed on the permit are non-negotiable. Unless the permit ..• is signed by me it is not valid. I cannot sign this permit until it is signed by you. Without a valid permit you have no authorization to graze your livestock on National Forest System lands. n Where was the consultation, coordination, and cooperation?
• Another permittee was sent a derogatory and adversarial letter from the USFS claiming that overgrazing had occurred on the allotment. When the permittee responded in writing, requesting the location of the problem, the agency refused to visit with the permittee or to identify the area of alleged overgrazing.
In numerous cases cited above the federal government either had no data to support its claims
of permit violations or the data was subjective and unsubstantiated.
1 .3.1 .3 Task Force Recommendations
• A County evidentiary hearing process should be available to any County citizen who desires a hearing of facts regarding a USFS or BLM decision that directly affects the citizen. The process should include an opportunity to submit written and oral comments. Both sides should be present during oral testimony and allowed to examine and cross-examine the other side. Transcripts of the hearing should be made available. County appointed impartial mediatofs should evaluate the evidence and make a decision.
• Evidentiary hearings should be held whether or not the USFS or BLM people responsible for the dispute participate. In such cases, sufficient information should be presented so the County can determine whether a Congressional inquiry or judicial intervention is warranted.
June 1995 1 - 7
24 of 182
Cliff
Highlight

1.3. 1.4 References
• Interviews with ranchers and copies of their correspondence files.
• Humboldt National Forest Amendment #2, July 1990.
1.3.2 Federal Range Management
t .3.2.1 Problem
The USFS has set unachievable standards and guidelines that jeopardize the
existence of livestock production on public lands in Elko County and other
parts of Nevada. Also, uncertain science is setting the standards for
•utilization level· policies and an absence of livestock operator involvement in
identifying and prioritizing management concerns and potential resolutions is
common.
1.3.2.2 Situation Analysis
In 1986 the Toiyabe National Forest issued theit Forest-wide land and Resource Management
Plan. It was the first ~orest Plan in Nevada and ranchers did not have experience with the
planning process. The plan included range management standards and guidelines for utilization
of forage by livestock. No scientific range studies, professional literature, or other information
June 1995 1 - 8
25 of 182
Cliff
Highlight
Cliff
Highlight

existed to document the rationale for the numbers. The analysis of utilization standards listed
in the plan did not document the reductions in AUMs that subsequently occurred.
The Toiyabe National Forest Plan was appealed by the Sierra Club on several grounds, with a
finding by the court in favor of the USFS. The major issue was wilderness.
The Humboldt National Forest Plan was then appealed by the Toiyabe Chapter of the Sierra
Club, et. al. They prevailed in the appeal and the Forest amended it's plan. In the resultant
opening paragraph of the amendment to the plan (Amendment #2, July 1990) it states that
"these changes do not significantly alter the direction, goals and objectives, management
prescriptions, or outputs. "
However, the NEPA analysis for Amendment #2, which includes evaluating economic effects
of proposed actions, failed to calculate the true impacts of adjusting livestock grazing systems
to these new demands. Riparian zones make up less than 1 % of the total management
environment, yet, the amendment results in a skewed priority which ignores the abundance of
healthy vegetation in the balance of the allotment and data showing the continuing trend toward
improved range conditions on the Forest.
In pursuing the sources for the supporting science for these appeals and then a February 1995
lawsuit by the National Wildlife Federation et. al., against the Humboldt National Forest
regarding livestock grazing, the Task Force further discovered that consistent methods of
monitoring and evaluating grazing impacts are missing from the systems that our land
management agencies employ.
June 1995 1 - 9
26 of 182
Cliff
Highlight
Cliff
Highlight

We discovered pursuits by the National Biologic Initiative of Nevada, operating out of the
University of Nevada, Reno, to develop scientific data which the land managing agencies could
access and partnership on. This program has been in existence for just two years.
Another example of the state of confusion and conflict in scientific methods surrounding
rangeland health is the 1994 printing of the National Research Council's publication Rangeland
Health, New Methods to Classify, Inventory, and Monitor Rangelands. Working groups,
through the National Research Council, are currently involved in developing "qualitative
assessment" standards that interdisciplinary teams across agency lines would use to aid in
evaluating general health of rangeland environments.
Another range management tool that ranchers are dealing with is the Coordinated Resource
Management Planning (CAMP) process, which was originally designed out of concern for better
blending of land management decisions. Elko County has completed at least three CRMP
agreements and several others are in process. During the Task Force interviews, members
heard a variety of comments from all the various participants and representative entities
involved in the CRMP process. People agree that the goal to bring management of the private
and public land and all the affected parties together is a lofty and necessary one. However,· the
process becomes encumbered with meeting schedule difficulties, authority conflicts, rotating
agency staff representatives, concessions by livestock operator with few if any by agencies,
and financial resource restrictions. The level of frustrations with the process seems to be
escalating.
Holistic Resource Management (HRM) is another form of cooperative range management that
holds the hope of bringing divergent interests together. The Elko County Commissioners have
June 1995 1 - 10
27 of 182
Cliff
Highlight
Cliff
Highlight
Cliff
Highlight
Cliff
Highlight

decided to retain a professional HAM trainer to work with operators of a ranch in the County
on an experimental five year study of the HAM process. The project will be under the guidance
of the Agriculture Extension office.
Basic to the HRM philosophy of resource management is the fact that the livestock operator {in
this case the focal point) has their sustained well-being considered in all management actions.
All actions are framed in a modeling that scopes the environmental, financial, and legislative
implications as goals are drawn up. A team of affected interests collaborates together to set
priorities and landscapes based on views and values held in common by all parties working on
the total land operation. Collaboration is based on arriving at sets of common values, whereas
the CAMP program is based on compromise, meaning everyone is giving up values to come to
an agreement.
It has been made clear to the Task Force that the level of divergent scientific thinking
demonstrates the presence of political pressure rather than the coordinated effort so necessary
to effective management of our County's natural resources.
Livestock permittees must increase their direct involvement in the planning, monitoring, and
documentation of the land they are responsible for. As this is the only way they will assure
verification of their management practices.
1.3.2.3 Task Force Recommendations
• Elko County should assure that a reasonable percent of a permittees allotment is monitored to obtain data representative of the particular habitat type (e.g.; riparian vegetation) on the entire allotment. Agencies should not be allowed to
June 1995 1 - 11
28 of 182
Cliff
Highlight

other parts of the world. Moreover, it is estimated 20% of all American jobs come through the
processing, manufacturing, wholesaling and retailing of agricultural products.
Ranches are valued on an animal unit basis. Today, the real estate value of an animal unit il;;
approximately one half of 1972. The decline in cattle numbers in Bko County from 1992 to
1994 has been approximately 63,000 head. The loss in terms of economic wealth is 116
million dollars.
The impact of the lost income and resultant expenses incurred by the ranch community, affects
local business communities who supply services for the industry. An annual spendable lost
income in the area of up to $17 million has been estimated.
1.3.3.3 Task Force Recommendations
• Develop a proposal from the County declaring the value of the ranching industry and a commitment to sustained levels of AUMs on public land in order to keep a stable, healthy industry.
1.3.3.4 References
• The Impact of Federal Land Policies on the Economy of Elko County, Nevada, prepared by Eastern Economic Analysis Center, May 31, 1994.
• Costs and Returns for a Cow-Calf Enterprise in Elko County, Nevada by Rodney C. Torell, Nevada Cooperative Extension, University of Nevada, Reno, 1990.
• Status of Federal Land Grazing in Elko County, A report to the Board of Elko County Commissioners Grazing Task Force by Great Basin Resource Management, February 1995.
June 1995 1- 13
29 of 182
Cliff
Highlight

1.3.4 Water
1 .3.4. 1 Problem
The federal government appears 'to be attempting to gain control over private
water rights.
1.3.4.2 Situation Analysis
Elko County citizens are concerned that the commandeering of water sources by the federal
government will lead to rangeland and wildlife damage, which in turn will adversely affect the
economic and social benefits gained from wise water management at a local level.
Most of the water in Elko County first surfaces in the mountains, often within forest
boundaries. Most of these sources were in private ownership long before 1905 when the USFS
was created. Now, the USFS is trying to control these private rights. The agency is not
offering financial compensation for water rights and has shown the tendency to disregard
Nevada water laws.
Many-springs and streams in 8ko County are used for stock water, irrigation, domestic use,
and wildlife. Actions taken by the federal government have either directly lessened water flow
or forbidden the water right holders to maintain springs, streams, and historic ditches.
Elko County• s economy and the availability of water for its domestic and other needs depend
heavily on agriculture's ability to use water sources within Elko County. Many of these sources
June 1995 1 - 14
30 of 182
Cliff
Highlight
Cliff
Highlight
Cliff
Highlight

may be small but are, in the aggregate, critical to the County. The position taken by the federal
government in asserting ownership to these waters has a direct bearing on the availability of
the water. Allocation and control of water is vested in the states. Federal interference of
vested water rights and other property rights _of Elko County and its citizens is a violation of
state law.
1.3.4.3 Task Force Recommendations
• The County should continue to be plaintiff in the Elko County, Nevada, Board of County Commissioners, Duval, et. a/. law suit {CV-N-95-0038-ECR) against the USFS, which will clarify the water control issue. Pursue the requested relief including a court declaration that the USFS has no water right and should be enjoined from restricting the use of said water and right of way and continue to seek damages from the agency.
• Pursue and support legislation declaring that the federal government does not own water on public lands in Nevada; and ,
• Actively work with the state of Nevada on a proposed water policy to insure it includes the necessary constraints on federal control of water.
1 .3.4A References
• Elko County, Nevada, Board of County Commissioners, Duval, et. al. law suit (CV-N-95-0038-ECR)
• Interviews with livestock operators and USFS personnel
• Status of Federal Land Grazing in Elko County, A report to the Board of Elko County Commissioners Grazing Task Force by Great Basin Resource Management, February 1995.
June 1995 1 - 15
31 of 182

1.3.5 Fire Management
1.3.5.1 Problem
Elko County has an average of 180 wildfires each year. These wildfires create
a serious hazard to life and property. The danger of wildfires in the county is
due to an over abundance of dry vegetation.
1.3.5.2 Situation Analysis
Significant opportunities exist in Elko County to reduce wildfires with forage management on
private and public land. A recently established wildfire advisory board {through Elko County
Ordinance 1995-8} will be responsible for gathering scientific and technical data concerning the
direct, indirect, and cumulative cause and effect of forage management.
Uvestock grazing is an important fire prevention tool. There is a direttcorrefation between the
height and density of grazable grasses and the spread, duration, and intensity of wildfires. The
wildfire advisory board will study timing, duration, and intensity of grazing; range conditions;
and resource utilization levels which may affect wildfire hazard mitigation. Th~ board will make
recommendations to the Commission regarding optimum grazing practices to minimize wildfire
danger in the County.
large federal expenditurEnr on fire management have not proven cost effective. Examples
include the Tin Cup and Dawley fires in 1994. More than a half million dollars were spent to
June 1995 1 - 16
32 of 182
Cliff
Highlight
Cliff
Highlight
Cliff
Highlight

suppress these fires. Local fire control would have been more timely, efficient, and cos't
effective.
1.3.5.3 Task Force Recommendations
• Implement Elko County Wildfire Ordinance;
• Formulate a County-wide fire management plan; and
• Consolidate fire funds and equipment under the purview of the County fire management plan.
1.3.5.4 Reference
Elko Col)nty Ordinance 1995-8
June 1995 1 - 17
33 of 182
Cliff
Highlight
Cliff
Highlight

1 .3.6 Endangered Species Management (Lahontan cutthroat trout)
1.3.6.1 Problem
The livestock industry is unfairly being accused of being a leading cause of LCT
population declines and the Willingness of Elko County to assist in coordinating
the efforts to delist the LCT is not being recognized.
1.3.6.2 Situation Analysis
The fish has been protected under the Endangered Species Act since 1970. During the 25
years of protection and recovery actions by the federal government, the status of the fish has
not improved significantly.
County government reflects the direct concerns of the users of our County's public lands and
has the ability and interest to mobilize local efforts toward resolution of problems. In light of
this, Elko County prepared an LCT Management Plan and submitted it to U.S. Fish and Wildlife
Service in May of 1994. The Plan was prepared to enhance the efforts of federal and state
agencies to recover and protect LCT, specifically in Efko County.
The County offered to provide leadership for the cooperation and coordination of local, state,
and federal agencies with private landowners and with the Te-moak tribe. Their plan identifies
numerous steps to accelerate the delisting process, including stream surveys, habitat
enhancements, and hatchery brood stocks.
June 1995 1 - 18
34 of 182
Cliff
Highlight

In January of 1995 U.S. Fish and Wildlife Service completed their Recovery Plan for LCT. The
agency requested over 16.3 million dollars from the U.S. Treasury. The money requested for
the first task, coordination and revision of the 1995 LCT recovery plan, is 5.8 million dollars.
Assuming the Recovery Plan is designed to delist LCT, why does the Rsh and Wildlife Service
want 5.8 million dollars to rewrite the plan published this year? Spending money on streams
and lakes with the goal of providing more ,appropriate habitat for sustained populations would
be a more logical way to recover and delist a species.
An additional 7.9 million dollars is being requested for developing and implementing LCT
reintroduction plans. Why reintroduction plans were not developed during the first 25 years
that the species has been listed is unknown. The remainder of the request, 2.5 million dollars,
is to manage LCT populations existing outside of their native range. The prudence of spending
that much money to put LCT in streams and lakes where they never naturally existed instead
of spending the money on LCT where they already exist, is puzzling.
The federal LCT Recovery Plan did not mention the Elko County LCT Management Plan or the
possibility of assistance from local government. Why no money or recovery tasks were
allocated to any entity other than the federal government is unknown. The situation
demonstrates the basic observed deficiency in open communication and necessary cooperation
for better levels of health and harmony in public land management.
Fish and Wildlife Service and environmental groups have long argued that livestock grazing is
the primary cause of LCT problems. The federal LCT Recovery Plan states npfincipal threats
to LCT include: Habitat loss associated with livestock grazing practices, •.• . " By listing
June 1995 1 - 19
35 of 182

livestock grazing first, readers are led to assume that livestock grazing is the largest threat to
LCT. This is simply not true.
In reality, removal of all livestock from LCT streams will not change the overall status of LCT
in Nevada. COMPETITION WITH NON-NATIVE TROUT, INTRODUCED EARLY IN OUR
COUNTRY'S HISTORY BY FEDERAL AND STATE AGENCIES AND PRIVATE CITIZENS, IS THE
MAIN REASON THERE ARE FEWER PURE LCT THAN THERE WERE HISTORICALLY.
U.S. Fish and Wildlife Service recognizes that before the middle of the nineteenth century only
native fish species inhabited LCT waters. A survey of Humboldt National Forest indicated that,
before 1935, many LCT streams had already been stocked with non-native trout. The Fish and
Wildlife Service LCT Recovery Plan notes that within the Ruby Mountains in the upper Humboldt
River basin, more than 95 percent of the LCT populations have been lost because of
displacement by non-native trout species.
OTHER MAJOR PROBLEMS SUFFERED BY LCT HABITAT INCLUDE DROUGHTS, FLOODS,
URBAN DEVELOPMENT, AND WATER MANAGEMENT POLICIES. THESE NATURAL AND
HUMAN-INDUCED THREATS TO LCTWILL REMAIN, WHETHER OR NOT LIVESTOCK GRAZING
CONTINUES.
The federal LCT Recovery Plan states that nunrestricted livestock grazing often exceeded the
carrying capacity of the range, especially in fragile riparian areas (Chaney ct {
"unrestricted livestock grazing" was provided for Nevada riparian areas, nor is such evidence
available. Whether the land is private or federal, livestock grazing in Nevada is managed, it is
not n unrestricted. n
Is the Endangered Species Act being abused by the federal government and environmental
groups? The presence or the mere "potential for the future introduction of LCT" is being used
by these entities to restrict livestock grazing. If it continues, ranching will no longer be
economical in much of Elko County. Livestock did not cause the demise of LCT nor will
eliminating livestock grazing improve the status of LCT in Nevada. Facts need to be
disseminated to agencies and the public to correct past misrepresentations.
1.3.6.3 Task Force Recommendations
• Encourage cooperation and coordination between ranchers and fisheries biologists, including the development of innovative ways to continue to operate profitable ranches, while protecting water quality and fisheries;
• Conduct a symposium on livestock grazing and fisheries, with the goal of opening communications and reaching common ground on as many points as possible;
• Provide federal agencies with the numerous reports . that demonstrate the compatibility of livestock grazing and riparian vegetation, including trout streams;
• Meet with the Nevada State Director of Rsh and Wildlife Service. Discuss conversion of federal funds to County funds for the purpose of LCT recovery;
• Introduce the Elko County LCT Management Plan at the suggested fisheries symposium for discussion; and
• Petition for delisting of the LCT at the earliest opportunity.
June 1995 1 -21
37 of 182

1 .3.6.4 References
• Elko County LCT Management Plan, May 1994.
• U.S. Fish and Wildlife Service LCT Recovery Plan, January 1995.
• Meeting with Nevada Division of Wildlife, March 31, 1995.
• Meetings with USFS and BLM Fisheries Biologists, May 29, 1995.
1.3. 7 Predator Control
1.3.7.1 Problem
lack of sufficient predator control to optimize livestock and wildlife numbers.
1 .3. 7.2 Situation Analysis
Predator control is necessary to produce food and other goods at an affordable cost. In 1915
Congress appropriated $125,000 to study how to control animals injurious to livestock and to
assist in predator control on national forests and other public lands. Whereas individual
livestock producers previously had controlled predators, now the federal government expanded
control.
Today, the U.S.Oepartment of Agriculture, Animal Damage Control (AOC) program works to
alleviate problems created when wildlife damages agricultural, urban, or natural resources, or
June 1995 1-22
38 of 182

presents a threat to public health and safety. The ADC program also protects endangered and
threatened species from wildlife depredation.
The principal predator in Elko County is the coyote. The primary food of coyotes is meat, with
up to 98% of the yearlong diet consisting of animal matter, approximately 20% of which is
poultry, livestock (particularly domestic sheep) and wildlife, including deer, antelope, upland
game birds, and waterfowl. Mountain lions and bobcats also cause losses, particularly to
domestic sheep. According to the Elko office of ADC, predation by coyotes and ravens causes
more mortality to sage grouse, cranes, deer, and pronghorn than any other factor.
At the present time, due to a law suit by the Humane Society (Winnemucca District, BLM) and
other animal rights group pressures, much of Nevada's ADC program is limited to "emergency
control." They have to wait for a confirmed loss and a reQuest from a rancher before
performing control activities. This process does not allow for prevention, thereby limiting the
effectiveness of the program.
Another factor that limits ADC' s effectiveness and flexibility is the relinQuishing of its lead
agency status on NEPA documents to the USFS and BLM. Historically, ADC was in charge of
its own work plans, methods, and guidelines. Since 1989, the USFS and BLM have written the
animal damage control guidelines and NEPA documents. In April of 1995 BLM' s Elko District
issued its most recent environmental assessment regarding animal damage control, referring to
it as "Integrated Wildlife Damage Management." That document restricts many ADC activities,
but is overall a responsive, well written analysis of the issues and management alternatives.
Nationwide, the USFS is presently turning the NEPA process back over to ADC, which will
June 1995 1-23
39 of 182

allow the agency doing the damage control work the opportunity to describe how the job should
be done.
ADC records indicate that statewide coyote populations are increasing and statewide mountain
lion populations are high and stable, and expanding their ranges. Raven numbers have also
increased substantially in Nevada.
1.3. 7.3 Task Force Recommendations
• Support ADC in retaining lead agency status for NEPA analyses, plans, and other management activities on public lands;
• Support ADC in obtaining lead agency status for NEPA analyses on lands managed by the BLM; and
• Provide information to the community about Jhe benefits of predator control, not only for livestock production, but for human safety and wildlife populations.
1 .3. 7.4 References
• U.S.D.A., Animal and Plant Health Inspection Service, Animal Damage Control Office Personnel, Elko, Nevada.
• U.S.D.A., Animal and Plant Health Inspection Service, Animal Damage Control Office Fact Sheets.
• U.S.D.A., Animal and Plant Health Inspection Service, Animal Damage Control Office Work Plans.
• BLM, Elko District, Integrated Wildlife Damage Management Program 1994-98 Environmental Assessment, April 1995.
• Oregon State University Extension Services Extension Circulars r.e., Animal Damage Control.
• Oregon Department of Fish and Wildlife Publication, Coyote Ecology and Removal Study, 1 977.
June 1995 1 -24
40 of 182

1.3.8 Wildlife Management
1.3.8. 1 Problems
Elk: The reallocation of AUMS from livestock grazing to elk forage by public land
management agencies is creating further unjust economic hardship to the
ranching community.
Deer: Perception that livestock grazing and healthy deer populations are
incompatible.
Wild Horses: Competition between livestock, wildlife, and wild horses for available
forage and land.
1.3.8.2 Situation Analysis
Elk
The recent move by public land management agencies and the Nevada Division of Wildlife to
increase elk populations is of concern to the ranching community. In particular, the conversion
of existing cattle AUMs to forage for elk is at issue.
The reallocation of forage will have a significant effect on the future economic viability of
ranching in Elko County. Though the federal agencies go through the motions of public
comment periods, per NEPA, they ignore the concerns of ranchers.
June 1995 1-25
41 of 182
Cliff
Highlight
Cliff
Highlight
Cliff
Highlight

Nevada's elk are introduced, non-native, large ungulates, fully equivalent to large beef cows in
dietary considerations. Elk consume a significant amount of forage.
At a time when strict federal forage utilization standards have resulted in devastating AUM
reductions to local ranchers, further reductions in AUMs in order to increase elk herds is
intolerable to the ranching community unless compensation occurs.
The introduction of elk will not greatly enhance the Elko County or State treasury by increasing
revenues from hunters. Elk and deer compete for cover. Consequently when elk invade an
area, deer gradually move out. An increase in elk numbers will be detrimental to both the
existing deer herds and to the livestock. industry.
Deer
Livestock and wildlife production are both legitimate, traditional, and desirable uses of public
rangeland. It is well known that the two uses have long complimented each other in Nevada.
Livestock grazing has caused changes in vegetation and wildlife in Nevada. One of the most
significant changes in wirdlife composition has been a dramatic increase in the number of mule
deer. Deer were rare in Nevada at the turn of the century, as were other wild game species.
Historically, the grasslands of this region were not good deer habitat. However, cattle grazing
caused an invasion of sagebrush that has created a much better forage for deer.
June 1995 1-26
42 of 182
Cliff
Highlight

Deer populations in Elko County, as well as other portions of Nevada soared dramatically,
starting in 1920-1930. In 1991, the Director of the BLM stated, "rangelands managed by BLM
are in better condition today than at any time in this century and they are improving still ..• Over
the past quarter century there have been some dramatic increases in big game numbers on
public rangelands in the presence of livestock grazing •• . despite a great increase in human
populations in western states . . . • We need to recognize the role played by ranchers and other
property owners in helping achieve this."
Though weather, harvest levels, human encroachments on habitat, and other factors cause
fluctuations in deer herd levels, big game populations remain at harvestable levels. However,
a new breed of sportsman is appearing. As urban populations grow, people who do not
understand the many complexities of range management, but like to hunt, are forming
misconceptions. Some sportsmen demand cuts in livestock numbers, believing overgrazing is
destroying the deer herds. They do not realize that if livestock had not been introduced there
would be no deer to hunt. The fact complete removal of all livestock would not help the deer
herd is not understood by some.
Wild Horses
Wild horses previously managed at low levels blossomed into destructive herds in the 1970's,
after the Wild Horse and Burro Act was passed. Horses are being managed to a point at this
time, but the damage they have done to rangelands is blamed on cattle.
June 1995 1-27
43 of 182
Cliff
Highlight

1.3.8.3 Task Force Recommendations
Elk
Deer
• The County Commission should participate as a full signatory party to elk herd plans and memorandums of understanding between agencies that manage elk;
• Monitor elk herd reintroductions and expansions;
• Hold federal and state agencies accountable for maintaining elk herds within the areas displayed and numbers presented in elk herd management plans;
• Arrange meetings between federal and state agency personnel and ranchers t{) discuss fair and just compensation for the reduction of AUMs to livestock production on public lands. Also discuss the impact of elk wintering on private property and reasonable compensation to ranchers;
• Form elk herd unit management teams composed of grazing permittees, state wildlife biologists, and public land management agency officials. The teams will monitor forage used by elk and livestock during the year and offer recommendations on elk and livestock management strategies for the herd unit area; and
• Establish distribution management hunts to control elk numbers in identified conflict areas on private and public lands.
• Increase public information about the history of Nevada deer herds and emphasize that livestock created the existing plant communities that deer prefer.
Wild Horses
• Encourage better control and reduced numbers of wild horses; and
• Provide more local oversight of wild horse management.
June 1995 1 -28
44 of 182
Cliff
Highlight

1.3.8.4 References
• Status of Federal Land Grazing in Elko County by Great Basin Resource Management, Elko, Nevada.
• Interviews with Nevada Division of Wildlife personnel, Elko District BLM Wild Horse Specialist, and livestock producers.
• Nevada Revised Statute 504.430: Preservation of Wild Horses.
• Management and Planning History, Elko District BLM, May 1995.
• Wild Horse and Burro Herd Use Area Map, State of Nevada by BLM.
1 . 3. 9 Misinformation Regarding the Ranching Community and livestock Production
on Public lands
1.3.9. 1 Problems
There have been false, unsubstantiated accusations by USFS personnel against
ranchers as a group. Agency employees are accusing the ranching community
of threatening USFS employees• lives. This type of action puts ranchers in a
false, negative light with the public.
1.3.9.2 Situation Analysis
The USFS appears to be taking advantage of a national tragedy, the unrelated bombing of a
federal building, to cast a negative fight on ranchers as a group. The USFS alleged before
Congress and the national press that ranchers are threatening their employees lives. The
June 1995 1-29
45 of 182
Cliff
Highlight
Cliff
Highlight

agency has created the image of armed and dangerous ranchers on public lands in the west.
The Forest Supervisor for Nevada has been quoted in several news articles that make an
analogy between Nevada ranchers and "Billy the Kid", stating that the Kid was a juvenile
delinquent with no socially redeeming factors.
The same Forest Supervisor was quoted as stating that if Nevada counties managed public
lands they would "look like hell." It is offensive for ranchers as well as any one else in Elko
County to read such a quote from a Nevada based federal official whose salary they pay. To
add injury to insult, the same Forest Supervisor, according to a recent letter to the County
Board of Commissioners, no longer considers himself a resident of the state. He happens to
reside in Reno, Nevada. His statements lead to further confusion and mistrust within the Elko
ranching community.
The situation stems from the agency listening to one vocal segment of society with no intent
to listen to the remainder of society. The agency is reacting very positively to anti-grazing
pressure and at the same time ignoring the voice of the ranching community.
A significant portion of Elko County's economy is at stake as well as the natural resources the
federal agencies are charged with managing. Many agency personnel are choosing to ignore
their multiple use mandates in favor of seeking approval from environmentalists.
Members of environmental groups that do not accept the use of public rangelands by private
livestock producers are abusing NEPA and the Endangered Species Act to influence decisions.
The public land management agencies appear to be encouraging these abuses. Instead, the
June 1995 1-30
46 of 182

agencies should be working with the ranchers, the actual land users, to find solutions to
differences in opinion.
1.3.9.3 Task Force Recommendations
• Work with Congressional and State representatives to provide a remedy for the accusations which are unsubstantiated by USFS personnel against ranchers.
• Pursue civil action with federal agency personnel making unsubstantiated accusations against ranchers.
1.3.9.4 References
• Interviews with livestock producers.
June 1995 1 -31
47 of 182

2.1 CONCLUSION
The Grazing Task Force is aware of differing views on how public lands should be managed.
At one end of the spectrum there are advocates of the Wildlands Project who promote the
concept of returning North America to a pre-1492 condition. These people propose a vast
system of connected wilderness reserves that would crisscross the continent. These
wilderness areas would be off limits to people, with connecting corridors and buffer zones all
across the continent. The group states that cows, guns, and motors should be eliminated from
the continent.
The opposite end of the spectrum is the segment of society that opposes any preservation of
land for recreation, aesthetics, cultural, or environmental considerations. They believe in
maximum use of every acre of land for short term monetary gains at this time in history. They
seem to think that future inventions will take care of problems and pollution they create.
The Task Force interviewed people that appeared more balanced in their view points than either
end of the spectrum. However, large differences in public land management philosophies exist.
There have been many different approaches and pursuits identified that offer a variety of land
mangement possibilities. Empowering individual livestock operators with the flexibility to
develop systems and philosophies appropriate to their individual needs is necessary to retaining
a whole and healthy resource.
Within our community there are many people with land management expertise. Some work for
the taxpayers in that capacity, others work to express their expertise in the complexities of
livestock and ranch management. Enriching the level of communication and understanding
between managed and manager, is the job at hand. Our range resource will continue to be the
looser if the conflict is allowed to continue.
June 1995 2 - 1
48 of 182

Meeting common ground will take hard work and practical solutions. The alternatives are to
place time and money into natural resources or to fight in court. The Task Force is optimistic
and hopes that innovative people will continue to work together to keep our local livestock
industry in business. The ranching community is a vital part of Elko County. The non-livestock
scenario would be one of subdivisions, condominiums, and shopping centers in Ruby Valley and
other parts of our beautiful community. Aesthetics, wildlife, fisheries, recreation, cowboy
culture, and other resources would suffer tremendously. In the long run, the irretrievable
commitment of land to development would occur. The choice to allow livestock grazing to
continue at a sustained economic level is beneficial to everyone.
June 1995 2-2
49 of 182

Rangeland Ecol Manage 63:662-669 I November 2010 I DOl: 1 0.2111/REM-0-1CHJ0006.1
Effects of Long~ Term livestock Grazing on Fuel Characteristics in Rangelands: An Example From the Sagebrush Steppe
Kirk W. Davies, 1 Jonathan D. Bates, 1 Tony]. Svejcar,2 and Chad S. Boyd1
Authors are 1Rangeland Scientists and 2Research Leader, United States Departmmt of Agriculture-Agricultural Research Service, Eastern Oregon Agricultural Research Center, 67826-A Hwy 205, Bums, OR 97720, USA.
Abstract Livestock grazing potentially has substantial influence on fuel characteristics in rangelands around the globe. However, information quantifying the impacts of grazing on rangeland fuel characteristics is limited, and the effects of grazing on fuels are important because fuel characteristics are one of the primary factors determining risk, severity, continuity, and size of wildfires. We investigated the effects of long-term (70+ yr) livestock grazing exclusion (nongrazed) and moderate levels of livestock grazing (grazed) on fuel accumulations, continuity, gaps, and heights in shrub-grassland rangelands. Livestock used the grazed treatment through 2008 and sampling occurred in mid- to late summer in 2009. Nongrazed rangelands had over twofold more herbaceous standing crop than grazed rangelands (P < 0.01 ). Fuel accumulations on perennial bunchgrasses were approximately threefold greater in nongrazed than grazed treatments. Continuity of fuels in nongrazed compared to grazed treatments was also greater (P < 0.05). The heights of perennial grass current year's and previous years' growth were 1.3-fold and 2.2-fold taller in nongrazed compared to grazed treatments (P < 0.01). The results of this study suggest that moderate livestock grazing decreases the risk of wildfires in sagebrush steppe plant communities and potentially other semi-arid and arid rangelands. These results also suggest wildfires in moderately grazed sagebrush rangelands have decreased severity, continuity, and size of the burn compared to longterm nongrazed sagebrush rangelands. Because of the impacts fuels have on fire characteristics, moderate levels of grazing probably increase the efficiency of fire suppression activities. Because of the large difference between fuel characteristics in grazed and nongrazed sagebrush rangelands, we suggest that additional management impacts on fuels and subsequently fires need to be investigated in nonforested rangelands to protect native plant communities and prioritize management needs.
Resumen El pastoreo del ganado tiene una influencia fundamental sobre las caracterfsticas de los combustibles en los pastizales alrededor del mundo. Sin embargo, informacion que mida los impactos del pastoreo en las caracteristicas de los combustibles de los pastizales es limitada. Los efectos que tiene el pastoreo en los combustibles son importantes ya que las caracteristicas de los combustibles son uno de los factores mas importantes para determinar el riesgo, severidad, continuidad, y tamaiio de los incendios de pastizales. Invesrigamos los efectos della exclusion del pastoreo (no pastoreo) a largo plazo ( + 70 aiios) y niveles moderados de pastoreo por e1 ganado en la acumulaci6n de combustibles, continuidad, espacios y alturas en pastizales compuestos de arbusto-pastos. El ganado fue utilizado en los tratamientos de pastoreo durante el2008 y las muestras se tomaron desde mediados y hasta finales del verano del 2009. Pastizales sin pastoreo tuvieron > 2 veces mas producci6n herbacea que las areas pastoreadas (P < 0.01). La acumulaci6n de combustibles en zacates amacollados fue aproximadamente 3 veces mayor en los tratamienros sin pastoreo que en los tratamientos pastoreados. La continuidad del combustible en tratamientos sin pastoreo en comparaci6n con los tratamientos de pastoreo fue tambien mayor (P < 0.05). La altura de los pastos perennes en el aiio en curso y el aiio posterior fueron 1.3 y 2.2 veces mas altas en tratamientos sin pastoreo comparado con los tratamientos pastoreados (P< 0.01). Los resultados de este estudio sugieren que el pastoreo moderado por el ganado disminuye el riesgo de un incendio en las comunidades de plantas en los pastizales de "sagebrush" y potencialmente en otros pastizales semiaridos y aridos. Estos resultados tambien sugieren que los incendios naturales en pastizales de "sagebrush" pastoreados moderadamente han disminuido en severidad, continuidad y tamaiio de los incendios comparados con los pastizales de "sagebrush" con largos periodos sin pastoreo. Debido al impacto que los combustibles tienen sobre las caracteristicas del fuego, niveles moderados de pastoreo probablemente incrementan la eficacia en el control de incendios. Debido a la gran diferencia entre las caracterfsticas de los combustibles en pastizales de "sagebrush" pastoreados y no pastoreados, sugerimos un manejo adicional de los impactos sobre los combustibles y subsecuentemente los incendios necesitan ser investigados en pastizales no-boscosos para proteger comunidad de plantas nativas y priorizar las necesidades de manejo.
Key Words: Artemisia arbuscula, Artemisia tridentata, bunchgrass, cattle, fire, fuel management, wildfire, wildfire risk
The Eastern Oregon Agricultural Research Center is jointly funded by the United States Department of Agriculture-Agricultural Research Service and Oregon Stale University.
INTRODUCTION Mention of a proprietary_product does not constitute a guarantee or warranty of the product by
USDA or the authors· and does not imply its approval to the exclusion of other products. Correspondence: Kirk W. Davies, United States Deper1ment of Agricul!ure-Agricultural Research
Service, Eastern Oregon Agricultural Research Center. 67826-A Hwy 205, Burns. OR 97720, USA. Email: [email protected]
Manuscript received 4 January 2010: manuscript accepted 7 September 2010.
662
Because livestOck grazing and fire occur across most rangelands around the world, grazing-induced modifications to fuel characteristics are probably having a substantial impact on many plant communities (Davies et al. 2009). Domestic cattle graze large expanses of shrub and grasslands in the arid and
RANGELAND ECOLOGY & MANAGEMENT 63(6) November 2010 50 of 182
Cliff
Highlight
Cliff
Highlight
Cliff
Highlight
Cliff
Highlight
Cliff
Highlight
Cliff
Highlight
Cliff
Highlight

semi-arid regions of Africa, Americas, Australia, and Asia. Many of these areas are also prone to wildfire and/or are occasionally prescribed burned. Grazing has the potential to significantly affect fire characteristics (Blackmore and Vitousek 2000; Kerby et al. 2007; Waldram et al. 2008). For example, _Qj~tori~J )leavy Jjv~§to~~ gr~jgg ¥I fore~ aJt~.r~~ fu~ characteristics, decreasing the likelihood of low severity wildfires and increasing the probability of high severity wildfires in forest systems by increasing small tree densities (Zimmerman and Neuenschwander 1984; Belsky and Blumenthal 1997}. Heavy grazing reduced competition experienced by seedling trees by reducing the herbaceous understory, and the reduction in the herbaceous understory also reduced the frequency of light severity fires that would have removed small trees (Zimmerman and Neuenschwander 1984; Belsky and Blumenthal 1997). Historical heavy grazing by livestock that caused these changes in forest stand dynamics is not the same as current managed livestock grazing (Borman 2005}. Thus, little .is known regarding the impact of moderate levels of livestock grazing (35-50% of available forage with alternating timing of use) on fuel characteristics, especially in rangelands.
Understanding the impact of grazing on fuels in rangelands is important because fuel characteristics influence wildfire risk, severity, continuity, and size, and the effectiveness of fire suppression effortS. Waldtam et al. (2008} demonstrated that white rhino grazing decreased fuel loads and continuity in South Africa. Subsequently, white rhino removals resulted in larger, less patchy fires (Waldram et al. 2008). In forested systems, fuel characteristics have been demonstrated to influence fire size, severity, and suppression effectiveness (Moghaddas and Craggs 2007; Ritchie et al. 2007). The need to understand the impacts of management on fuels is widely recognized in forested systems {Wimberly et al. 2009}. However, the impact of moderate levels of grazing on fuel heights, amounts, spatial arrangement, and continuity remains largely unexplored in rangelands. Davies et al. (2009} reported that there appeared to be greater fine fuel accumulations on perennial bunchgrass in nongrazed compared to grazed rangelands, suggesting that grazing influenced the total and spatial accumulations of fuels. However, Davies et al. (2009) did not empirically test grazing effects on fuels. Blackmore and Vitousek (2000} measured a decrease in total fine fuel accumulations and grass canopy heights with grazing in dry forests of Hawaii. Similarly, Briggs et al. (2002) reported that grazing in the tallgrass prairie reduced fine fuel loads by more than 30%. Archibald et al. (2009) reported that higher grazing density was an important factor limiting the area burnt in southern Africa. The previous studies evaluated the immediate effects of grazing, but a more complete understanding of grazing effects on fuel characteristics will require long-term research to allow cumulative effects to be expressed. Furthermore, studies need to measure fuel characteristics after the main growing season, during the wildfire season, and before livestock grazing to determine if effects are more than just immediate impacts of grazing on current year's plant production. Measuring fuel characteristics before annual livestock grazing also provides important information for two common scenarios. Frrst, the season of livestock grazing use is sometimes rotated among pastures (Holechek et aL 1998), thus wildfires frequently burn plant communities that were not grazed
63{6) November 2010
immediately before the fire, but are experiencing the influence of long-term grazing. Second, prescribed bums in arid and semi-arid systems often require that grazing be curtailed for 1 yr to build up enough fuels for a successful burn under climatic conditions that allow for effective control (Bunting et al. 1987). Jp~g-t~ ~Jl:~Ji!~W~- Qf Jiy~~ ~g WQ~lg ~QW ~!#JipJ§
years of plant growth to accumulate. In dry systems, where decomposition is relatively slow (Coliteaux et al. 1995}, accumulationS may significantly increase the fine fuel loads. Long-term grazing may also cause plant community compositional changes that influence fuel characteristics that would not be evident in short-term studies. In some forested systems, long-term heavy grazing has caused a shift from herbaceous species to more small trees (Zimmerman and Neuenschwander 1984) and in South African savanna, long-term heaving grazing results in the spread of nonflammable stoloniferous species (Waldram et al. 2008}. Derner and Whitman (2009) reported a shift in perennial grass dominance with long-term heavy grazing in the northern mixedgrass prairie that influenced fuel continuity. 'l'hus, to determine the impact of moderate levels of grazing on fuels in rangelands, longterm grazing and nongrazing treatments are needed.
The need to understand the effects of grazing on fuels in rangelands is also critical because of the threat of invasive plants. Fuel accumulations have the potential to increase the severitY of tlie fire, which ean open native plant co.tiffiitifiities t<> exotic plant invasion. Davies et al. (2009} suggested that fuel accumulations, by increasing fire severity, were probably the cause of a postfire invasion of. exotic annual grass in pristine shrub-grassland communities. Fuel characteristics can also influence the probability of wildfire risk. Because exotic plant jpv~!'),IJ$ M~ li!ft~p fa~jJj~efJ. !;Jy fJ~~ ID p~t_iv~ pJ!liJt ~9!TI!IJ!lnities (Stohlgren et al. 1999; Chambers et aL 2007), the influence of fuel on wildfire risk also affects the threat of exotic plant invasions. Therefore, it is critical to determine the impact of grazing on fuels in rangelands to sustain native rangeland plant communities and the fauna dependent upon them.
To determine the impact of grazing on fuel characteristics in rangelands, we investigated the effects of long-term {70+ yr) livestock exclusion compared to long-term moderate livestock grazing in semi-arid, sagebrush (Artemisia L.} steppe piant communities in the northern Great Basin. We hypothesized that livestock grazing would 1} reduce fine fuel accumulations, 2} alter the spatial arrangement of fuels, and 3) decrease fuel continuity (consistency of fuels across space}.
METHODS
Study Area The study was conducted at the 6475-ha Northern .Great Basin Experimental Range (NGBER) .in _southeastern Oregon {lat 43°29'N, long 119°43'W), about 56 km west of Bums, Oregon. Climate at the NGBER is representative of the northern Great Basin with cool, wet winters and ·hot; dry summers. The NGBER headquarters received on average 300 mm of pr~cipi~tion annually dllring the past 50 yr (1956-2005). Annual precipitation for plant growth (1 October-30 September) in 2004, 2005, 2006, 2007, 2008, and 2009 was 120%, 118%,71%, 80%, 66%, and 88% of the long-term average, respectively. Elevation at the study sites
663
51 of 182

ranges from 1360 m to 1520 m above sea level. Topography at the study sites is variable with slopes ranging from oo to 15° and aspects from north to south. Soils at the study sites are Aridisols, Mollisols, and Andisols with shallow to moderately deep soil profiles before reaching a restrictive layer. Dominant vegetation vliti~:!i PY ~tl1dY sit!!, Mo®~ big s.~gepiJJ.Sh (/irt.f1!11isig tridentata subsp. vaseyana [Rydb.] Beetle), Wyoming big sagebrush {A. tridentata subsp. wyomingensis [Beetle and A. Young] S. L. Welsh}, or low sagebrush (A. arbuscula Nutt.} was the dominant shrub depending on study site. Dominant perennial bunchgrass was Thurber's needlegrass {Achnatherwn thurberianum [Piper] Barkworth), Idaho fescue (Festuca idahoensis Elmer)~ or bluebunch wheatgrass (Pseudoroegneria spicata [Pursh] A. LOve}. Other common perennial bunchgrass species in the study area included prairie junegrass (Koeleria macrantha {Ledeb. JJ. A. Schultes), squirreltail (Elymus elymaides [Raf.] Swezey), needle and thread (Hesperostipa comata [Trin. and Rupr.] Barkworth), Sandberg bluegrass (Poa secunda J. Presl), and Indian ricegrass . (Achnatherum bymenoides [Roem. and Schult. J .Barkworth). The plant communities used in this study are common across the Intermountain West (Daubenmire 1970; Davies et al. 2006; Davies and .Bates 2010) and are not believed to have recently evolved with high numbers of large herbivores (Mack and Thompson 1982). Historical fire return intervals are estimated to be 50-100+ yr for the less productive sagebrush plant communities (Wright and .Bailey 1982; Mensing et al. 2006} and < 25 yr for more productive sagebrush plant communities (Miller and Rose 1999; Miller and Heyerdah12008).
Experimental Design To determine the effect of grazing on fuel characteristics, we used a randomized block design with two treatments (grazed and nongrazed). Treatments were applied at eight different sites with differing vegetation, soils, and topography. Nongrazed treatments were 2-ha livestock grazing exclosures established in 1936. Native herbivores, including but not limited to mule deer, pronghorn, elk, and rodents, had access to vegetation inside the exclosures. The grazed treatment plots were located adjacent to the exclosures and within the same soil, topography, and vegetation association as the exclosures. Density data collected in 1937 revealed no differences in Sandberg bluegrass, large perennial bunchgrass grasses, annual grasses, perennial forbs, and annual forbs between inside and outside the exclosures (P > 0.05). The grazed treatments adjacent to the exclosures were grazed by cattle through 2008. Grazed treatments were moderate, 30-50% use of the available forage. From 1938 to 1949 livestock use was rotation grazing with stocking rates determined from range surveys conducted in 1998 aQd 1?44. frgm 1949 :tglOO?, the gr@ng progr~ w~s ~ deferred-rotational system with an occasional year of complete rest. Grazing pressure ranged between 0.15 and 036 animal unit months (AUMs} per hectare with the average pressure of 0.22 AUMs per hectare. No grazing occurred prior to sampling in 2009. Grazing sites were in eight different pastures ranging in size from 65 ha to 810 ha.
Measurements Fuel characteristics were sampled in late July and early August of 2009. This time period coincides with the wildfire season
664
and the peak of the dry and hot period in this region. Each site was sampled using a 30 X 60 m plot centered in the treatment plot to limit edge effects. Four 20-m transects, spaced at 15-m intervals, were established in each 30 X 60 m plot. Fuel cover, by cover type, was measured along each 20-m transect using the line-intercept method (Caufield 1941). Cover types included perennial bunchgrass, total herbaceous vegetation, ground litter, fuel gaps (areas lacking fuels), and shrubs. Herbaceous vegetation cover measurements included current and previous years' standing growth. Shrub cover included live and dead standing cover. Fuel biomass was measured by clipping herbaceous standing crop (current and previous years' erect vegetation} and gathering ground litter (litter between herbaceous plants) inside 151-m2 frames randomly located in each 30 X 60 m plot. Herbaceous biomass was oven dried, separated into current and previous years' growth, and then weighed. The current year's growth was used to determine herbaceous annual biomass production. Ground litter was oven dried and then weighed. Fuel biomass accumulations on individual perennial bunchgrasses were determined by clipping 20 randomly selected perennial buuchgrasses in each 30 X 60 m plot. Perennial bunchgrass fuel accumulations were oven dried, separated into current and previous years' growth, and then weighted. Perennial bunchgrass heights were measured by randomly selecting 50 individuals and measuring the tallest current and previous years' growth.
Statistical Analysis Analysis of variance was used to determine the influence of grazing on fuel characteristics by comparing the moderately grazed treatment to the long~erm nongrazed treatment {S,.Plus v.8; Insightful Corp, Seattle, WA). The eight sites were treated as blocks in the analyses. Differences between means were considered significant if P-values were equal to or less than 0.05 (ex.= 0.05}. Means are reported with standard errors {mean+SE). For analyses, fuel cover was separated into the f()Jlpvyipg ~pv~r J;yp!>_~: p~~MW PJ:m.~bgJ:~I>s ~9~ P.~rp.f!,~~~;rg_!; vegetation, ground litter, fuel gaps, and shrubs. Total herbaceous cover was the sum of perennial bunchgrass and other herbaceous vegetation cover. Fuel loads were analyzed as total herbaceous vegetation standing crop, current year's herbaceous vegetation biomass, ground litter, and total fine fuels (standing crop plus ground litter}. Perennial bunchgrass fuel accumulations were analyzed as total accumulations, current year's biomass, and previous years• biomass. Perennial bunchgrass heights were analyzed as current and previous years• growth-
RESULTS
Fuel Cover and Gaps Long-term moderate levels of livestock grazing generally decreased the amount (Fig. 1) and continuity (Fig. 2} of fuel cover in rangelands. Perennial grass and total herbaceous cover were less in grazed than nongrazed treatments (P =:o 0.01 and < 0.01 ). The perennial buuchgrass cover was approximately twofold more in the ungrazed compared to the grazed treatments. Total herbaceous cover was about 1.5-fold more in the exclosures than the grazed treatments (P < 0.01). Gaps in
Rangeland Ecology & Management
52 of 182

60
-Grazed 50 ~ Non-grazed
~~ 40 '/;
• f~ ~ i .._
30 ~
.,. I i ~ 0 *
20 ,,: S:~. :''
i ez I tf'
10 i II I 0 PG Therb Gaps Shrub Litter
Cover group
Figure 1. Percent cover (mean+SE) by group in moderately grazed and nongrazed sagebrush rangelands. Vegetation cover measurements included live and dead standing cover. PG indicates perennial bunchgrass; Therb, total herbaceous vegetation; Gaps, fuel gaps; Shrub, sagebrush and other shrubs; and Litter, ground litter. Asterisks (*) indicate significant difference between treatments (P< 0.05).
the fuel covered more soil surface in grazed than nongrazed treatments {P=0.04). Fuel gap cover was 1.2-fold greater in the grazed compared to nongrazed treatments. In contrast to the other cover values, shrub and ground litter cover values were not different between treatments (P= 0.91 and 0.25, respectively}.
Livestock influence on fuel continuity varied by cover type {Fig. 2). The nongrazed treatment had larger continuous (without a gap in it) perennial bunchgrass cover and smalier
60
-Glazed 50 j,?,,,.j Nan-grazed
40
20
10
0'----PG UHer
Cover group
Figure 2. Continuous cover length (mean+SE} by group in moderately grazed and nongrazed sagebrush rangelands. Continuous vegetation cover is cover without a gap in it and continuous gap cover is a gap in cover without any vegetation cover in it. Vegetation cover measurements included live and dead standing cover. PG indicates perennial bunchgrass; Gaps, fuel gaps; Shrub, sagebrush and other shrubs; and Litter, ground litter. Asterisks (*} indicate significant difference between treatments {P< 1l05}.
63(6) November 20i0
-Grazed .. .. li£liiil'il. Non-grazed
600 m oE Cl ::::. Ill Ill
400 m E 0 :0 iii j
1.1. 200
f.·
0 STC Herb Uttar Total
Functional group
FiJure 3. Fuel accumulations {mean+SE) by functional group in moderately grazed and nongrazed Sagebrush rangelands. STG Indicates herbaceous vegetation standing crop (current and past years· growth still erect); Herb, current year's herbaceous vegetation growth; Litter, ground litter; and Total, herbaceous vegetation standing crop and litter. ASterisks {*) indicate significant difference between treatments {P<0.05}.
fuel gaps (P<0.01 and =0.03, respectively). The length of continuous perennial grass cover was 1.5-fold longer in the nongrazed compared to the grazed treatments. The length of fuel gaps were about 13-fold longer in the grazed than nongrazed treatments. Shrub and ground litter cover continuity did not differ by treatment (P = o.n and O.H, tespettively}.
Fuel Loads Livestock grazing influenced some of the fuel load characteristics in rangeland plant communities (Fig. 3}. The nongrazed treatment had greater herbaceous standing crop biomass than the grazed treatment (P < 0.01}. Herbaceous vegetation standing crop biomass was more than twofold greater in nongrazed than grazed treatments. Total fine fuel accumulations varied by treatment (P<O.Ol}. Total fine fuel accumulations were twofold higher in nongrazed compared to grazed treatments. However, ground litter did not differ between treatments (P;:::;: 0.4:8). A difference in herbaceous vegetation annual biomass production between treatments was not detected (P=0.21}.
Perennial Grass Fuel Characteristic Livestock grazing also influenced the fuel characteristics of perennial bunchgrasses. Fuel accumulations on top of perennial bunchgrass crowns were more than 2.8-fold greater in the nongrazed compared to grazed treatments (P < 0.01; Fig. 4A). However, a difference in perennial bunchgrass current year's biomass production between the treatments was not detected (P=0.11). Average heights of perennial bunchgrasses were greater in the nongrazed than grazed treatments (P.,:;:::: 0.01; Eg. 4B). Perennial bunchgrasses were 1.3-fold taller in the nongrazed compared to grazed treatment. Similarly, previous years' growth was also taller in the nongrazed compared to grazed treatments {P<O.Ol}. Previous years• growth of
665
53 of 182

50 I A. B. I • -Glazed I .l 40 a:;w Norrgmzaa I ::::- :~;: <: I .!!! ;::e ,e.
30 I ~: !:!!
I ~x~
"' -~2
13 I ~ E ~ 0 20 I J :0
~ I
..
30 ! :E ~
20 :r
U- I 10 I 10
.~ l
I I 0 ,.:. >" 0
TPG LPG PG PYG
Perennial grass
Figure 4. Fuel accumulations (A) and heights (B; mean+SE) of perennial bunchgrass in moderately grazed and nongrazed sagebrush rangelands. TPG indicates current and previous years' biomass; LPG, current year's biomass; PG, current year's growth; and PYG. previous years' growth. Asterisks (*} indicate significant difference between treatments {P<0.05).
perennial bunchgrasses was 2.2-fold taller in the nongrazed .$~ g;@!.!i t.r~~.tm~n,~ ..
DISCUSSION
Moderate livestock grazing on sagebrush rangelands influences fuel accumulations, continuity, and height, which in tum influences burn characteristics and wildfire risk. Our data demonstrate that moderate levels of livestock grazing decrease fine fuel loading and continuity. These alterations have the potential to decrease the probability, continuity, size, and severity of wildfires in sagebrush rangelands. Livestock grazing impacts several fuel characteristics simultaneously. This greatly increases its potential influence on wildfires. The influence of grazing on fuels, by affecting fire severity, may also affect postfire plant community response and assembly in sagebrush plant communities and potentially other semi-arid and arid rangelands.
Contrary to the impacts reported from heavy grazing in foreSted sysfems (Zimriieriiian and Neuenscliwandet 1984; Belsky and Blumenthal 1997}, moderate long-term grazing in sagebrush rangelands appears to decrease the probability of severe, catastrophic wildfires. Our results support speculation by others {Conrad and Poulton 1966; Davies et al. 2009} that moderate grazing can reduce fuel accumulation and may subsequently reduce fire severity. The lower accumulation of fuel, especially on the perennial bunchgrass crowns, would decrease the likelihood of a severe wildfire. Heavy grazing in forested systems can increase small woody vegetation (Zimmerman and Neuenschwander 1984), whereas moderate levels of grazing on sagebrush rangeland did not appear to influence woo4y vs:~P-on (figs! J ~.Iii .~)! Jh~s, diff~nmc~ in fue~ accumulations were a result of herbaceous vegetation. The differences in fuel accumulations between moderately grazed and nongrazed rangelands in this study would have been even more pronounced if grazing would have occurred in the
666
sampling year prior to sampling. However, by not allowing grazing of the current years' plant growth, we were able to establish that the influence of grazing on fuels in sagebrush rangelands is not limited to just the predicable immediate effect of grazing removing current years• plant growth. Considering our ~ts m ~QJ.l.t~ wit~Jsrn!1i~ evmJ:!~~ ~s: iJwn~g~~ ~ff~~ 9f grazing on fuel loads (Blackmore and Vu:ousek 2000; Briggs et aL 2002), moderate levels of livestock grazing are probably reducing the severity of wildfires on rangelands globally.
The probability of burning and burn continuity may be decreased in moderately grazed sagebrush rangelands because of a reduction in £ne fuels, larger gaps between fuels, less continuous fuels, and shorter £ne fuef heights. The height and amount of fine fuels are correlated positively with the ability of fire to spread, especially across fuel gaps (Bradstock and Gill 1993; Blackmore and Vitousek 2000}. Similarly, Miller and Heyerdahl (2008} reported that variation in fire frequency in rangelands was driven by £ne fuel abundance and continuity, and Miller and Urban {2000} demonstrated that .fine fuels from grass were critical for fire spread and were correlated positively with increasing fire frequency in drier plant communities. Waldram et al. (2008} also reported that the removal of a large herbivore in Africa increased the fuel loads and continuity and this caused larger fires with less unburned patches. Larger fuel gaps iii moderately grazed sagebrush rangelands woUld feqi.ilie longer flame heights to be crossed; however, the effects of grazing on other fuel characteristics would decrease flame lengths. Less £ne fuel and shorter fuel height produces shorter flame lengths {Bradstock and Gill 1993). Thus, moderate grazing affects several fuel characteristics to cumulatively decreli5e the fl~mmability of sageb111sh rangelands. The probability of burning and the continuity of the bum would be influenced by the rate of spread, which would be slower in the moderately grazed compared to nongrazed treatments. Blackmore and Vitousek (2000} reported that a reduction in fine fuel amounts and heights greatly suppressed the rate of fire spread. Shorter flame lengths and a reduced rate of spread in moderately grazed sagebrush rangelands would probably also increase the effectiveness of suppression efforts.
Moderate livestock grazing is probably direcdy and indirectly lengthening fire return intervals in native sagebrush rangelands. Directly, livestock are reducing fuels that would promote ignition and spread an~ indirectly, livest~ck are mcreasing the effecclveness of fire suppression. Similarly, livestock grazing in combination with fire suppression has probably lengthened fire intervals in forested systems (Schoennagel et aL 2004). However, extreme climatic conditions during a fire may reduce the effects of livestock grazing on fires. Fire spread is correlated to fuels and climatic conditions, with wind having a strong effect {Cliettey et a.L 1993). Gedalof et al. (2005) reported that fuel treatments in forested systems may not be effective at reducing the area burned nnder extreme climatic conditions. Fuels appear to be more important tha:,1 climate in determining fire spread and severity in drier ecosystems (Schoennagel et al. 2004). Regardless, under similar climatic _gpn@:r,jp:qs_,JpJJg-t§!mt JlQI1~mP Cf9~PM~d. IP m.Pl:f~}:~rely ,~a~d sagebrush rangelands would be more likely to burn, bunt with less patches of unburned within the burn perimeter, and produce fires that would be more difficult to suppress.
Rangeland Ecology & Management
54 of 182

Moderate levels of cattle grazing in sagebrush plant communities also affect the spatial arrangement of fuels. Moderate grazing reduced the accumulation of fuels on perennial bunchgrass crowns, but did not alter the accumulation of fine fuels between plants. Thus, moderate grazing reduces the heterogeneity of fuels between perennial grass crowns and interspaces. This alteration of spatial heterogeneity of fuel accumulations would impact the variability of £re severity within the plant community. By reducing the fuel accumulations on perennial bunchgrasses, grazing decreases the potential for fire-induced mortality of perennial grasses. Fuel accumulations on perennial grasses would increase their probability of suffering fire-induced mortality (Odion and Davis 2000; Davies et al. 2009}. Micro-site fuel accumulations increase soil heating and this elevates the vulnerability of perennial grasses to fire (Odion and Davis 2000).
The effect of moderate grazing on fuel accumulation on perennial bunchgrasses has signi£cant implications to postfire plant community recovery and assembly. Perennial bunchgrasses, as the dominant herbaceous functional group, are the most critical vegetation to preventing exotic plant invasions in sagebrush rangelands (Davies 2008; James et aL 2008}. A decrease in perennial bunchgrass densities from fire-induced mortality allowed Wyoming big sagebrush plant communities to be invaded by art exotic annual grass (Davies et al. 2009). Complete exclusion of livestock grazing compared to moderate livestock grazing would increase the probability of postfire exotic plant invasion by increasing the risk of fire-induced mortality of perennial bunchgrasses.
The results of this study also suggest that fuel management needs to be _a l.Mger q:m~em oD r.lol_ngd3JJ!Js_. M:m.agem~m: of fuels in .forested systems has long been recognized as needed to decrease fire severity and facilitate desirable postfire plant community responses {Dodge 1972; Allen et al. 2002; Mitchell et al. 2009). Recently, the public has started to recognize the need for fuel treatments in forests. Large stand-replacing wildfires have increased public concern and recognition of the need for fuel treatments to reduce fire hazards in forests (Schwilk et al. 2009). Despite the recent increase in awareness of fuel management needs in forests, native rangelands are rarely the focus of fuel management or research. However, rangeland plant communities with much lower fuel loads than traditionally targeted for fuel management may need fuelreducing management to prevent undesirable postfue piant community responses (Davies et al. 2009}. Our research demonstrates that management actions (moderate grazing or not grazing) in rangeland systems can have significant impacts on fuel characteristics. Understanding the interactions between fire and grazing is critical to proper rangeland management (Atcrubald et al. 2005). Thus, -the effect of fuel management en rangeland plant communities will need to be addressed, especially with the threat of invasive plants and continued climate change.
Moderate levels of cattle grazing, by reducing the risk of catastrophic wildfires and postfire exotic plant invasions, may protect sag~brush ;rap.gela.nd plant ~ommumties <JnQ th~ f~l.tn5!dependent upon them. Beck et al. (2009) and Rhodes et al. {2010) measured a decrease in sage-grouse habitat quality following fire in Wyoming big sagebrush plant communities. Davies et al. (2009} measured a substantial exotic annual grass
63(6) November 2010
invasion in long-term grazing--excluded treatments in Wyoming big sagebrush plant communities post:fire.. However, the response of plant communities will vary signi£cantly depending on the level of grazing and specific plant community. Historical heavy grazing had severe negative impacts on plant communities t:lJa_t did not ~voJve with high ~itJg p_r~~!lre ffl~i~hner 1994; Noss 1994; Belsky and Blumenthal 1997; Jones 2000). For example, heavy grazing can promote exotic annual grass invasion by decreasing native plants (Daubenmire 1970; Mack 1981; Knapp 1996}, which increases the continuity of fuels and risk ofwildfire (Whisenant 1990; D'Antonio and Vitousek 1992; Davies and Svejcar 2008)~ Livestock grazing needs to be properly managed to promote the most benefit and reduce negative impacts. Comparing our results to evaluations of historical grazing impacts (Fleischner 1994; Noss 1994; Belsky and Blumenthal1997; Jones 2000} supports Borman's (2005) statement that historical livestock grazing is not the same as current appropriately managed cattle grazing.
MANAGEMENT IMPLICATIONS
Moderate levels of long-term • cattle grazing have signi£cant impacts on fuel characteristics and subsequently may alter the risk, size, severity, and continuity of wildfires on sagebrush rangelands. Our results suggest that moderate livestock grazing reduces the risk of wildfires on sagebrush rangelands by decreasing the amount of fine fuel available for ignition and limiting potential fire spread by reducing fute fuel continuity, accumulation, and height. The reduction in potential spread of fire in long-term modera~ly grazed sagebru~h pl;mt c0mmunities can also increase the efficiency of suppression efforts. Sagebrus~ rangelands that are long-term moderately grazed compared to long-term not grazed would be more difficult to burn with prescribed fires, but may be more likely to produce a mosaic burn effect. The appropriateness of extrapolating the results of this study to short-term livestock grazing exclusion has not been determined and thus caution must be exercised when assuming the effects of short-term grazing exclusion. Due to altered fuel characteristics, moderate livestock grazing may elongate the length of fire return interval on native rangelands. This· would be a concern in rangelands that progress from herbaceous and woody co-dominant plant communities to woody dominant plant communities without periodic fire (e.g., Archer et al. 1995}. Thus, in these rangelands; active prescribed burning may also be needed to maintain desired plant communities. The potential severity of wildfireS or prescribed fires is decreased because of a reduction in fuel accumulations with moderate levels of grazing and probably, more importantly, a reduction in fuel loading on perelifiial btmchgrass crowns. By reducing the potential severity and probability of wildfues in sagebrush rangelands, moderate grazing compared to long-term grazing exclusion may decrease the risk of exotic plant invasions. Our results suggest long-term grazing exclusion compared to moderate livestock grazing would increase the probability tha:t s~gebJJJsll steppe plant c9IQJl1\mi#es would burn. Increased p.robability of. wildfire is a concern because Becket al. (2009) and Rhodes et al. (2010} reported that fire decreases the habitat value of less productive sagebrush plant communities to sagebrush obligate wildlife species. Thus, we
667
55 of 182

suggest that there are some potentially negative consequences that must be fully considered before implementing long-term livestock grazing exclusion in sagebrush plant communities and probably other semi.,-arid and arid plant communities. The results of this study and Davies et al. (2009) suggest that fuel management rese;rrch in rangelands is needed to adequately quantify the impacts of different management scenarios on fuels and subsequently fires to protect and maintain desired plant communities and the fauna indigenous to those plant communities. ·
ACKNOWLEDGMENTS
Assistance with data collection by Carrie Cimo, Julie Garner, Jennifer Trenary, Aleta Nafus, and Ryan Morgan was greatly appreciated. We thank Drs Dave Ganskopp and Jeremy James for reviewing earlier drafts of the manuscript. Constructive comments and thoughtful reviews by anonymous reviewers were valued.
LITERATURE CITED
AI.I.EN, G. D., M. SAVAGE, D. A. FALK, K. F. SUCKI.ING, T. w. SwErNMt, T. SCHULKE,
P. B. STACEY, P. MoRGAN, M. HoFFMAN, AND J. T. KtiNGa. 2002. Ecological restoration of southwestern ponderosa pine ecosystems: a broad perspective. Ecological Applications 12:1418-1433.
ARCIIER, S., D. S. SGH!MEL, AND E A. HoLLAND. 1995. Mechanisms of shrubland expansion: land use, climate, or C02? Climate Change 29:91-99.
ARcHIBALD, S., W. J. BoNo, W. D. SrOCK, AND D. H. K. FAJRBANKS. 2005. Shaping the landscape: fire-grazer interactions in an African savanna. Ecological Applications 15:96-109.
ARcHIBAlD, S., D. P. RoY, B. W. VAN W1taEN, AND R. J. ScHoLES. 2009. What limits fire? An examination of drivers of burnt area in South Africa. Global Change Biology 15:61:Hi30.
BECK, J. L, J. W. GDNNru.v, AND K. P. REESE. 2009. Recovery of greater sage-grouse habitat features in Wyoming big sagebrush following prescribed tire. Restoration Ecology 17:393-403.
BELsKY, A. J., AND D. M. BluMENrnAL. 1997. Effects of livestock grazing on stand dynamics and soils in upland forestS of the Interior WeSt. conservation Biology 11:315-a27.
BLACKMORE, M., AND P. M. VJTDIISB(. 2000. Cattle grazing, forest loss, and fuel loading in a dry forest ecosystem at Pu'u Wa'aWa'a Ranch, Hawai'i. Biotropica 32:625-632.
BoRMAN, M. M. 2005. Forest stand dynamics and livestock grazing in historical context. Conservation Biology 19:1658-1662.
BRADSTDcK, R. A., AND A. M. GILL 'HI93. Fire In semi~arid, mallee shrublands: size of 11ames from discrete fuel arrays and their role in the spread of fire. International Journal of Wildland Fire 3:3-12.
BRIGGS, J. M., G. A. HocH, ANo L G: JoHNSON. 2002. Assessing the rate, mechanisms, and consequences of the conversion of tallgrass prairie to Juniperus virginiana forest. Ecosystems 5:578-586.
BuNTING, S. G •• B. M. Kitsoae, AND G. L BusHEY. 1987. Guidelines for prescribed burning sageorusli;ira5s rangelands iii the northern Great Basin. Ogden; or. USA: USDA Forest Se!Vice,lntennountain Research Station, General Technical Report INT-231. 33 p.
GANAao, R. H. 1941. Application of the line interception methods in sampling range vegetation. Journal of Forestry 39:388-394.
CHAMBERS, J. G., B. A. RoUNDY, R. R. BLANK, S. MEYER. AND A. WHnTAKER. 2007. What makes Great Basin sagebrush ecosystems invasible by Bromus tectorum? Ecological Monogmphs17::11'1-145.
CHENEY, N. P., J. S. Goutn, AND W. R. CATCHPOLE.1993. The influence of fuel, weather and fire shape variables on fire spread in grasslands. lntemational Journal of Wildland Fire 3:31-44.
663
CONRAD, C. E., AND G. E. PoULTON. 1966. Effect of a wildfire on Idaho fescue and bluebunch wheatgrass. Journal of Range Management 19:138-141.
Go!liEAUX, M., P. BOTTNER, AND B. BElls. 1995. Utter decomposition, climate and litter quality. Trends in Ecology & Evolution 10:63-66.
D'ANToNIO, G. M., AND P. M. VJTDUSEK. 1992. Biological invasions by exotic grasses, the grass/fire cycle, and global change. Annual Reviews in Ecology and Systematics 23:63--87.
DAUBENMIRF, R. 1970. Steppe vegetation of Washington. Pullman, WA. USA: Washington State University, Washington Agricultural Experiment Station Technical Bulletin 62 ... 131 p.
DAviES, K. W. 2008. Medusahead dispersal and establishment in sagebrush steppe plant communities. RangelandEcotogy and Management 61:11 G-115.
DAVIES, K. W., AND J. D. BATES. 2010. Vegetation characteristics of mountain and Wyoming big sagebrush plant communities in the northern Great Basin. Rangeland Ecology Management 63:461-465.
DAVIES, K. W., J. D. BATES, ANoR. F. Mll.tER. 2006. Vegetation characteristics across part of the Wyoming big sagebrush alliance. Rangeland Ecology and Management59:567-575.
DAVIES, K. W., AND T. J. SVEJCAR. 2008. Comparison of medusahead-invaded and noninvaded Wyoming big sagebrush steppe in southeastern Oregon. Rangeland Ecology and Management 61:623-629. .
DAVIES, K. W., T. J. SVEJOOI, AND J.D. BATES. 2009. InteraCtion of historical and nonhistorical disturbances maintains native plant communities. Ecological Applications 19:1536-1545.
DemER, J. D., ANO A. J. WHITMAN. 2009. Plant interspaces resulting from contrasting grazing management in northern mixed-grass prairie: implications for ecosystem iunction. Rangeland Ecology and Management 62:83:;88.
DooGE, M. 1972. Forest fuel accumulation: a growing problem. Science 177: 139-142.
FLBSGHNER, T. L 1994. Ecological costs of livestock grazing in western North America. Conservation Biology 8:629-644.
GEDALOF, Z., D. L PmRsoN, AND N. J. MAtl1llA. 2005. Atmospheric, climatic, and ecological controls on extreme wildfire years in the northwestern United states. EcologicaJ Applications 15:154-174.
HOlECIIEK, J. L, R. D. PtEPER, ANo G. H. HERBEl.. 1998. Range management principles and practices. 3rd ed. Upper Saddle River, NJ, USA: Prentice-Hal~ Inc. 542 p.
JAMES, J. J., K. W. DAVIES, R. L SHELEY, AND Z. T. AANDERUD. 2008. linking nitrogen partitioning and species abundance to invasion resistance in the Great Basin. Oecologia 156:637-648.
JoNES, A. 2000, Effects of cattle grazing on North America arid ecosystems: a quarititative review. Western North America Natumlistaa:155-164.
KelBY, J. D., S. 0. FtmlENDORF, ANG 0. M. ENGLE. 2007.landscape heterogeneity and fire behavior: scale-dependent feedback between fire and grazing processes. landscape Ecology 22:507-516.
KNAPP, P. A. 1996. Gheatgrass {Bromus tectorum L) dominance in the Great Basin Desert: hist01y, persistence, and influences to human activities. Global Environmental Change 6:37-52.
MACK, R. N. 198t Invasion of Bromus teCttirum L into western Nortfi America: an ecological chronicle. Agro-Ecosystems 7:145-165.
MACK, R. N., AND J. N. THOMPSON. 1982. Evolution in steppe with few. large, hooved mammals. American Natum/ist119:757-773.
MENSI~ls, s., S. lMNosroN, AND P. BARKER. 2006. long-tenn fire history in Great Basin sagebrush reconstructed from macroscopic charcoal in spring sediments, Newark Valley, Nevada. Western North American Naturalist 66: 64-77.
MillER, G., AND D. L URBAN. 2000. Connectivity of forest fuels and surface fire regimes. landscape Ecology 15:145-154.
Mn.LER, R. F., AND E. K. HEYERDAIIL 2008. Ane-scale variation of historical tire regimes in sagebrush-steppe and juniper woodland: an example from Galifomia, USA. International Journal of Wildland Fire 17:245-254.
M1UER, R. F., AND J. A. Rose. 1999. Fire history and western juniper encroachment In sagebrush steppe. Joumal of Range Management 52:55(}-559.
MITCIIRI.. S. R"' M. E. HARMON, AND K. E. B. O'CDNNm.. 2009. Forest fuel reductions alters fire severity and ·long-term· carbon storage in three Pacific Northwest ecosystems. Ecofogical Applications 19:643-655;
Rangeland Ecology & Management
56 of 182
Cliff
Highlight

-} 5 .I
THE RELATIONSHIP BETWEEN LIVESTOCK GRAZING AND FIRE
' ...
A SPECIAL REPORT PREPARED FOR THE ELKO COUNTY BOARD OF COMMISSIONERS, WELLS, NEVADA AUGUST 8, 2000
by
ANTHONY L. LESPERANCE, COMMISSIONER
57 of 182

..
COW COUNTY CATTLE NUMBERS 1971-1998
:l~~:lt1~~~m~l~-~~~~:~[)~~~~tilf~I!~i:~~l~~:l~):~]r~~~I:)j:f~~:~:l:l~~iii~:il]l!i:~-1l:li:~r~'l 71-75 417.0
76-80 375.0
8i -85 393.4
86-90 339.4
91-95 295.8
96-98 302.3
NOTES: 1. ONLY CATTLE NUMBERS AS OF JANUARY 1, AS REPORTED BY THE
STATE STATISTICIAN. ARE USED
2.. REPORTED VALUES ARE THE AVERAGE FOR THE 5 YEAR PERIOD
3. ABOVE CATTLE NUMBER MUST BE MULTIPUED BY 1,000 FOR ACTUAL NUMBER
4. COW COUNTIES INCLUDE; ELKO. EUREKA, HUMBOLDT, LANDER, NYE AND WHITE PINE
58 of 182

COW COUNTY CATTLE NUMBERS AS OF JANUARY 1
450
0 400 g_ .... X
a: 350 w m :E ::> z 300
y = 1.016e+4 - 4.9434x R = 0.93
250b-----~------r-----~----~------~-----,
1970 1980 YEAR
1990 2000
2
59 of 182

ACRES DESTROYED BY RANGE FIRE, 1971-1999
I:~~~~f:~Ii.-~~jl~m~li:~~:;I~~l~:t~~~\l:::~]:l;i;:~l~l:l~I~~:l~:*i::::;:;,;;l~f~:~l~:~i~••~~l®:::~~~:l 71 -7 5 1 0 '641
76-80 36,561
81-85 58,467
86-90 193,766
91-95 210,044
96-99 695,066
NOTES: 1. FIRE ACREAGE BASED ON NUMBERS PROVIDED BY THE NDF AND BLM
2. REPORTED VALUES ARE THE AVERAGE FOR THE 5 YEAR PERIOD
3
60 of 182

C/) UJ a: (.)
800000
600000
c( 400000
200000
ACRES OF RANGE BURNED BY YEAR
y = - 4.602e+7 + 2.330e+4x R = 0.85
0~~---r------~----~----~------~----~ 1970 1980 1990 2000
YEAR
4
61 of 182

RELATIONSHIP BETWEEN CATTLE NUMBERS AND FIRE
71 -75 417,000 10,641
76-80 375,000 36,561
81-85 393,400 58,467
86-90 339,400 193,766
91-95 295,800 210,044
96-99 302,300 695,066
NOTES 1. ALL REPORTED NUMBERS ARE THE AVERAGE OF THE FIVE YEAR INCREMENT
5
62 of 182

RELATIONSHIP BE1WEEN CATTLE AND FIRE
800 y = 1560.5753 - 3.8433x R = 0.74
g 600 o_ ,.. X (}) w 400 0:· 0 <C
200
0~--~--~------~--~~--~~----~ 250 300
NOTES:
350 CATfLE X 1,000
400 450
1. WHEN X= 400,000 CATTLE, Y = 23.3, OR WHEN 400,000 CATTLE EXIST IN THE COW COUNTIES, 23,300 ACRES WOULD BURN
2. WHEN X= 200,000 CATTLE, Y = 791.9, OR WHEN 200,000 CATTLE EXIST IN THE COW COUNTIES. 791,900 ACRES WOULD BURN
3. THUS, 791,900 ACRES - 23,300 ACRES = 768,600 ACRES/200,000 CATTLE= 3.84 ACRES PER HEAD CATTLE
4. ONE MAY ASSU:METHATEVERYCOWWILLGRAZE RANGELAND ON THE AVERAGE 8 MONTHS PER YEAR, THUS 3.84 ACRES/8 MONTHS = 0.5 ACRES PER AUM
WHAT THIS MEANS IS THAT THIS RELATIONSHIP INDICATES THAT FOR EVERY AUM NOT BEING UTILIZED AT PRESENT AMOUNTS TO ANOTHER ONE HALF ACRE GOING UP IN FLAMES!
6
63 of 182
Cliff
Highlight
Cliff
Highlight
Cliff
Highlight

..
~ a: (.)
800000
600000
ACRES OF RANGE BURNED BY YEAR
y = * x"309.9044 R = 0.98
< 400000
200000
0~----~----~--~~--~----~----~ 1970 1980 1990 2000
YEAR
NOTES: 1 . GRAPH OF ACRES BURNED BY YEAR USING A
LOGARITHMIC EXPRESSION OF THE CURVE, RATHER THAN A STRAIGHT LINE
2. 1F THIS TREND CONTINUES, WE CAN EXPECT SOMEWHERE AROUND TWO MILLION ACRES TO BURN ON THE AVERAGE FOR THE YEARS 2001-2005, OR A TOTAL OF AROUND TEN MJLLION ACRES. ROUGHLY TIIE SIZE OF ELKO COUNTY.
7
64 of 182

Affach~~w.t
{6) VISITS TO THE SHELDON NATIONAL WILDLIFE REFUGE IN 1989
In the Spring of 1989 my wife Bertha and I were invited by Harry and Joy Wilson to visit the
Sheldon National Wildlife Refuge, which is located north of Winnemucca in northwestern
Nevada just south of the Oregon state line. Created for the purpose of protecting pronghorn
antelope, the Refuge comprises a huge area, somewhere around 460,000 acres. Harry wanted
us to assess for ourselves the deteriorating range and environmental conditions, which Harry
believed was being caused by agency mismanagement.
At that time US Fish and Wildlife Service personnel were nearing the end of a long effort to rid
the Refuge of livestock permittees - Harry and Joy being among the last to be forced to leave.
It had been a frustrating thing for Harry and Joy, as it had been for all the others as they were
being forced from the refuge- having to witness the fallacy and injustice of the agencies action
- not only from the stand point that they were losing their livelihoods, but also from the
standpoint of having to watch the area they loved fall into a deteriorating condition.
Harry had spent his entire life there in the Virgin Valley, his father having purchased the
property where Harry and Joy were then living, from homesteaders long before the Refuge was
created. Now they were being forced to give up their rights to graze the lands surrounding
their property, even though they had been assured by the government at the time when the
refuge was being established, that their right to graze would forever be protected.
That left the Wilsons with their lands which were located within the heart of the refuge of being
of small value now that they were losing their rights to graze their livestock on the surrounding
refuge lands during summer.
Harry said that during his youth it had been a family tradition to count the antelope each Fall as
they left the high country and headed for the Black Rock Desert for the Winter. He said at
times antelope would come through the valley strung out in bunches of a thousand or more.
He estimated that at that time there were at feast ten thousand antelope summering on the Big
Spring Table each year. (Big Spring Table being a high mesa that lay just North of where they
lived). But now, after years of government management, there were few antelope left.
1 related to what Harry was saying, for in Ruby Valley our family had similar experiences, only
with us it was deer. Back in the 1940's and even up until the late 1960's, we would watch the foothills above the ranch as the deer migrated South in the Fall and North in the Spring. They
too would migrate through in bunches of a thousand head or more if the weather caught them
right. And like Harry, we too had seen the great herds diminish because of over harvest and
reductions in predator control practices.
1
65 of 182

Harry explained their disappointment having to work with people who knew the truth about
the true benefits of livestock grazing, yet were determined to follow political agendas for the
complete removal of livestock from refuge lands.
Harry told us, that for most of his life, he and his father had summered their cattle on the Big
Spring Table, but then in 1985, because the antelope were having their young in the same area
that the Wilson's cattle were being grazed, the Refuge people decided that Big Spring Table was
a natural kidding area, and that it needed to be protected. And so the following year they had
Harry graze his cattle on further to the south on Gooch Table where there had no grazing of
livestock allowed for some time. Not surprisingly, the following Spring, the antelope were
found on the Gooch Table instead of the Big Springs Table where Harry had grazed his cattle
previously.
Harry showed me a copy of a Refuge Memorandum concerning "Wilson- winter grazing", in
which it was acknowledged, (when discussing a proposal to allow Winter grazing on the Gooch
Table) that:
"In the spring of 1986, Gooch Table was grazed for the first time since the CRMP was implemented. Antelope use increased markedly the following year."
Within the same memorandum it is stated:
"The area north of highway 140 from Hazelton lake to the Nevada-Oregon state line has been in non-use since the early 1940's ... (In the early years) Big Spring was one of the few waters on this major stock driveway between southeastern Oregon and the railhead at Winnemucca. After it was fenced, this area has had only occasional trespass grazing. The importance of this area lies in its educational value as a study area . . . Surprisingly little response from non-use has occurred since livestock exclusion."
Yet, as Harry explained, even with their acknowledgement of the benefits of livestock grazing,
and the fact that the range did not improve when large areas of the Refuge were excluded from
livestock use, the Refuge people went right on pressuring and harassing the permittees until
they either gave up and moved off the Refuge or became willing sellers.
Harry and Joy then took us to see the old Kinney Camp Ranch. Kinney Camp had been
purchased by the government but was soon abandoned shortly after the refuge was created.
Much of the uniqueness of the old Kinney Camp Ranch was its buildings. The house, the barn
and even the chicken house were made of native stone quarried right there in the Virgin Valley.
There had been four small ranches purchased from the Dufurrena brothers when the Refuge
was created, but the Kinney Camp Ranch empathized, more than the others, what had been
lost after the government had taken management. Just below the old buildings was where the
2
66 of 182

meadows used to be. The Dufurrena Family had put up between 250 and 300 ton of hay there.
Now the meadows were gone and a huge gully had formed. A gully that gets deeper each year
as the Spring runoff rushes to the alkali flats below, only to evaporate in the desert sun.
The green meadows bordered by willow and rosebush that once provided so much benefit to
both wildlife and cattle are now gone as well. The only thing left being a few remnants of dead
willow along the ditches, Marge Dufurrena Stephens, whom Harry and Joy introduced us to
later that day, said that as a girl she had spent many hours picking wild currants along those
ditches so that her mother could make jams and jelly. Today the wild current bushes are gone,
the willows are gone, as are the wildlife that one frequented the area.
Marge also told us of the great numbers of sage grouse that were all through that country
when she was a girl. She said that the Dufurrena Family had relatives in Alturas, California,
about 100 miles to the West across the high desert country. Every year her dad, Tom
Dufurrena would load up the family and make their yearly trip to Alturas. The thing Marge
remembered most of those trips were the great numbers of sage grouse that were seem along
the way. She said that sage grouse would be in every draw, just thousands and thousands of
sage grouse, all across the desert.
That evening, after we had returned to the ranch where we were to spend the night with Harry
and Joy, Harry showed me a copy of a letter dated Nov. 5, 1981, concerning a "possible land
exchange with the Wilsons". In its contents a comparison was made between the ({offered
property" owned by Harry and Joy and that of the Virgin Ranch where Harry and Joy had been
living, and also the 1000 Creek Ranch, one of the ranches that had been abandoned, as had
been the Kinney Camp Ranch -which context lent much credit to what Harry was saying. We
quote the language as follows:
"Management of the Virgin Ranch, historically and at present, has been under A Special Use Permit to the Wilson Family, first Harry's Dad and now Harry. It is our belief that while not providing many wildlife benefits under existing conditions it is providing for some diversity and at the same time maintaining the integrity of the meadows themselves. One has only to look at Kinney Camp or 1000 Creek Ranch to witness the destruction of once productive meadow complexes through the management philosophy of "let nature take its course" as has been prescribed by some environmentalists that have toured the area. Gullies large enough to swallow a freight train are evident at 1000 Creek Ranch where all management was terminated some years ago."
This statement does more to explain the reason for our frustration than anything a rancher
could say. In the public's mind the BLM, Forest Service and Wildlife folks have held the moral
high-ground for years. Few people have wanted to believe that bureaucracy is destructive to
3
67 of 182

resources. As a consequence, agency personnel have been able to go on year after year subtly
attacking ranching and mining for their own advantage while carefully ignoring the destruction
caused by their own rank and file.
The agency people know livestock grazing is beneficial to resources and they know the best way
of accomplishing successful grazing is via traditional practice. But they're also reminded that
collectively they have other objectives, principally to gain absolute and complete control of the
lands and resources. And they know too, that if they instigate certain policy, detrimental to
private interest, it is only a matter of time until certain people will be forced to sell out, or trade
their ranches for property in other areas.
After returning home I had time to reflect on all that Harry had shown us, and got to thinking,
all during the time that Harry and Joy were showing us around the Refuge we hadn't seen any
antelope. Nor had we seen sage grouse. That prompted me to write for a copy of the current
"Season Recommendations" put out by the Nevada Department of Wildlife for that area. I was
curious to see what kind of antelope numbers the wildlife agency was listing for the Sheldon.
Not surprisingly, data found within the seasons recommendation booklet indicated that every
management unit surrounding the Refuge had much better production than did the Wildlife
Refuge.
Data within the booklet also indicated that in 1989 only 15 fawns were being raised for every
100 does on Sheldon as compared to 42 fawn per every 100 head of does for the remainder of
the state. Fall composition counts for deer were little better. Mule deer production on the
Sheldon was only 23 young for every 100 does as compared to 44 fawns for every 100 does for
the remainder of Northern Nevada.
Thinking further I concluded that I would call Rich Capurro. Rich was as familiar with the
Sheldon as anyone I knew- he and his family, beginning with his uncle and his father, had
hunted on the Sheldon for years. When I got Rich on the phone I told him of my recent trip to
the Sheldon and ask why it might be that we were not seeing sage grouse there on the refuge.
After thinking a moment Rich said, "Well, if you really want to find sage grouse you shouldn't
even go hunting on the Refuge. You should go down on Buster Dufurrena's range, that's where
all the sage grouse are."
That is when it first began to dawn on me,- what Rich was saying was correct. Wherever
sheepmen were still operating in the state was where we were finding the most wildlife. Of
course there would be a great many sage grouse found on Buster Dufurrena's range- he was
one of the last remaining sheepemen left operating in that part of the country. And why not,
isn't it the sheepmen that keep the predators down?
4
68 of 182

Then I began thinking of all the things my parents had told me over the years- about how and
why effective predator programs were brought into being, and what it had been like in the
years leading up to the time when effective predator control were put in place. My Mother
had talked a lot of growing up in Diamond Valley- of the time when she was 3 or 4 years old, or
in 1912 or so, when there had been a major outbreak of rabies- and how her father had put up
a fence around the yard to keep she and her younger brother and the ranch dogs from being
bitten- and of the problems they had with the rabid coyotes biting their cattle- and how it
seemed that every few days the family would hear a mad cow begin to bawl down in the field,
and of her father getting his gun to go put the poor animal out of its misery. She said that on
the worst year of the outbreak her father had lost 40 head cattle out of the 300 or so cattle he
owned at the time, to rabies.
And so began the spread of rabies, into California, Oregon, Washington, Idaho and all across the
West- resulting in Congress budgeting $125,000 to the National Biological Survey in 1914 for a
predator control program to be initiated throughout a major portion of the country. In the
years that followed many young men supplemented their incomes by working as government
trappers, my Mother's uncles being some of them. Later the program was expanded to include
the use of toxins and airplanes. The effect was dramatic. Not only did the use of toxins reduce
the numbers of coyotes and bobcats, but it kept the numbers of crows, skunks and badgers
down as well.
Dad too, told of what it was like during that period. He told of the great numbers of crows
(ravens) that were in Ruby Valley when he was a boy. He said the crows were so thick they
were just like blackbirds. He remembers the crows being so hungry that they were turning over
cowpies so they could get at the bugs.
After a number of years of effective predator control the numbers of coyotes, crows, skunks
and other predators began to dwindle however. And as they did, more and more song birds
were seen. The same was true with deer and sage grouse. Where once deer had been so
scarce that when someone did find a track they would follow it for days, now they were being
seen everywhere. Sage grouse it was said, had become so thick they could be killed by the
gunny sack full.
The dramatic increase in mule deer that occurred between 1920 and 1940 is well recorded. In
a special publication put out in 1964 by the Nevada Fish and Game Commission, titled Nevada
Wildlife Centennial Issue, it is mentioned that the Forest Service's population estimates for
mule deer for the Ruby Mountains, were only 10 animals in 1921 and 1922, 30 in 1923 and
1924, and 45 in 1925. In 1926 there was an estimated 115 animals; in 1927, 125; no estimates
were made for 1928 and 29. Then in 1930 there was an estimate of 500 deer. In 1932, 750- in
1933, 1000- in 1934, 1,250- in 1935, 1.325- in 1936, 1,500- in 1937, 1,600- in 1938, 1, 750;
5
69 of 182

and in 1939, 3,000 deer. By the mid 1940's the number of deer on the Rubys was incredible.
No one knew for sure how many deer there were, but there were thousands upon thousands.
On the Toiyabes', deer populations seemed to increase a bit sooner than they did on the Rubys.
Many residents believed that by the mid 1930's, the mule deer population in the Toiyabes' had
reached incredible proportions. Some Austin residents claimed that when the Toiyabe deer
herd reached its peak, 500 to 1,000 deer could be counted on almost any Summer evening in
Kingston Canyon alone. During the first Spring deer ride, conducted by the US Forest Service in
1938, along the foothills of the East side of the Toiyabe Range, 1,299 deer were counted in a
distance of seven miles.
Many people argue that the large numbers of wildlife that were present on the Sheldon Refuge
in the 1920's, 30's and 40's were typical of what existed prior to the coming of the white man,
but no evidence exists in support of such theory. When John Fremont passed through that
country in 1843, his cartographer, Charles Preuss described a harsh and inhospitable land. On
December 23, he wrote; Grass is poor; God knows how the animals will get through.
On December 31, (while traveling somewhere near the Black Rock Desert) Preuss wrote that
on that day: " ... they had found nothing but dry, shallow basins, their way "broken by gullies
and impeded by sage, and sandy on the hills, where there is not a blade of grass"
And on January 5, Charles Preuss wrote; The animals are dying one after another.
The only game the party had seen since leaving Fort Vancouver some months before were "vast
numbers of rabbits near Summer lake". But then, as they proceeded through the country
between the Black Rock Desert and Pyramid lake they saw mountain sheep "bounding across
some high cliffs, but the sheep were too quick for the men to get a shot". This was the only
game that the Fremont party has seen on their entire trip from Fort Vancouver. It was not until
after they crossed the Sierra somewhere to the South of the Truckee that they found their first
real game.
In the book The Clever Coyote, by S.P. Young and H.H.T. Jackson (1951) Stackpole Co.
Harrisbury, PA and Wildl. lnst., Washington DC p 411 and also in a paper, "Predator Control and
Wildlife Management. JJ Transactions of the sixth North American Wildlife Conference (1941)
pp 294- 298, reference is made to the effects of a predator control program that was
conducted in the 1920's involving the area that was later to become the Sheldon National
Wildlife Refuge.
"In 1920 recognition was given to those involved in the predator control program that is referenced above. Estimated antelope numbers that year in South-Central Oregon and Northwestern Nevada were 500 animals. Between 1921 and 1934, 7,500 coyotes and bobcats were systematically removed. In 1935 it was estimated that antelope number had increased to
6
70 of 182

more than 10,000 animals." This was the first major predator control program ever to be initiated in the West. Its effectiveness speaks for its self. Pronghorn antelope became so numerous, interest in the species led to the creation of the Sheldon Antelope shortly thereafter.
All and all, there is no mystery why it was that the Wilsons and Dufurrenas were seeing so many antelope and sage grouse in the 1930's and 40's. It was not because these species had been there forever. It was because of the effects of grazing and predator control.
There is no question that the Sheldon is one of the best possible examples showing the fallacy of allegations of resource destruction at the hands of private interest. The Sheldon is an area that once supported hundreds and hundreds of cattle- where sheep were run by the thousands- an area that was right on the historical stock driveway between Southern Oregon and the railhead at Winnemucca- an area that not only supported thousands of livestock but thousands and thousands of antelope as well -an area where sage grouse could be seen in every draw- where livestock use has been systematically reduced and now eliminated- where the government has had absolute and complete control- where there has never been pesticides or herbicides used- Yet after over 50 years of governmental control and management, with the agency people accomplishing everything they have ever wanted including the removal of all private interest from the land -they produce fewer wildlife than any other area in Northern Nevada.
On our last trip to the Sheldon, Harry gave me an additional document that is quite interesting.
The document, which is titled CULTURAL RESOURCES INVENTORY: HART MOUNTAIN NATIONAL
ANTELOPE REFUGE, SHELDON NATIONAL WILDLUFE REFUGE, states in its abstract; "This report
describes the results of an intensive survey and inventory of eight historic resources located on
Hart Mountain Refuge and Sheldon Refuge".
On page 44 of the report, there is an assessment of the Kinney Camp Ranch which discusses the
importance of the old rock structures from a historical perspective. The discussion is quite
interesting as well, wherein it states:
11The area adjacent to the ranch was once an irrigated, productive wet Meadow, supplying hay for ranchers' livestock, and providing habitat for a variety of wildlife species. Now it is an inhospitable greasewood flat with gaping gully running through it rapidly undercutting the road. The area is used little by wildlife. The site provides a good illustration of the effects of man's activities on the environment especially when compared to other areas on the Refuges where ongoing irrigation and haying is providing wildlife habitat and historic buildings are stili in use.
Need we say more?
7
71 of 182

ANTELOPE 1
1989 NORTHERN NEVADA ANTELOPE SUMMER HERD COMPOSITION
AREA BUCKS/100 DOES FAWN/100 DOES AREA
lA 54 44 NORTH lB 59 45 WASHOE lC 30 64 COUNTY lD 29 50 3A 38 54 HUMBOLDT 3B 43 51 COUNTY .. , 3C 55 :1.5 .. SHELDON 4A 44 64 w. PERSHING 5 38 49' ,i
HUMBOLDT 6A 38 56 NORTH FORK 68 19 48 ) ROCK CREEK 6C 35 30 OWYHEE DESERT 7C 48 57 O'NEIL 70 51 54 BISHOP CREEK 7E 32 28 BROWNS BENCH 8A 67 60 GRANITE 8B 42 29 PEQUOP TOANA lOA 29 M RUBY VALLEY lOB 34 M STEPTOE VALLEY llA 31 20 ANTELOPE VALLEY llB 28 20 SPRING VALLEY llC 43 23 SNAKE VALLEY 14A M M 14B 56 29 LANDER - EUREKA
Northern Nevada average 42 Fawn/100 Doe Sheldon is Fawn/100 Doe
The above data was taken from the 1990, Nevada Department of Wildlife, SEASON RECOMMENDATIONS - ANTELOPE.
72 of 182
Cliff
Highlight
Cliff
Highlight
Cliff
Highlight
Cliff
Highlight
Cliff
Highlight
Cliff
Highlight
Cliff
Highlight
Cliff
Highlight

MGMT. UNITS
011,012,013
014 015 021 022 031 032 033 034 035
041-046
051 061-065 066,067,068 0 71 1 0 7 9 1 081
101-108 111-115
121
131,132,133
141-146 151-155
MULE DEER
1989 NEVADA DEER SEASON NORTHERN NEVADA HERD COMPOSITION SUMMARY
1989 FALL HERD 1990 SPRING HERD COMPOSITION COMPOSITION BUCKS/ FAWNS/ FAWNS/ PERCENT
100 DOES 100 ADULTS 100 ADULTS LOSS
28 27 18 N. WASHOE & w. HUMBOLDT
38 28 11 WASHOE 20 37 36 w. WASHOE 21 30 30 s. WASHOE 41 34 29 s. WASHOE 27 44 29 N.HUMBOLDT 28 43 26 N.W.HUMBOLDT 29 23- 20 ',SHELDON 26 34 18 w. HUMBOLDT 30 49 35 HUMBOLDT 34 37 41 PERSHING &
S. HUMBOLDT 28 40 32 SANTA ROSA 18 64 40 INDEPENDENCE 21 55 41 TUSCARORA 1.9 59 42 O'NEIL &
JARBRIDGE 22, 59 42 RUBY 20 41 27 SPRING VALLEY ?--=> 44 37 N. EGAN &
CHERRY CREEK 15 33 26 WHITE PINE-
QUINN 20 50 29 EUREKA· 23 47 31 LANDER
NORTHERN NEVADA 44 32 ~SHELDON 23 20'
SHELDON - "Recruitment of fawns to the yearling age class was below maintenance levels for the population for the third year in a row. 11
Page I -9
The above data· was taken from the 1990, Nevada Department of Wildlife MULE DEER SEASON RECOMMENDATIONS.
73 of 182
Cliff
Highlight
Cliff
Highlight
Cliff
Highlight
Cliff
Highlight

[ TIME 01/01/1995 00:88 ~-lAME CLIFF GARDNER FAX 7757792352 TEL 7757792352
!rroundwater 4 fewer miles of karst/ se ~~ .. _ miles of shallow rock that rna require blasting. · tw I!J f!47;Y~ /';; t:nJ /;;1 e Y't>u f; t-c.t ~1/'t: CtJ h.;v.J.:t pcJ TRE ELECTRICITY FAILED. - .::.....--~-- -~-------··-· ·• THE FOLLOWING DATA WAS LOST
Topogra~-?\relief alotg?,g~th the Sheldon Route Alternative and the proposed route ranges from nearly flat to r~~~sfm~'1~0W.~ of very steep relief. While terrain can affect the cost of construction, it ii~eltlnMDMflliMmpared to other factors (e.g., length of the route and pipeline class
~ . . . . .
erodible, compaction prone and hydric soils, while the Sheldon Route Alternative crosses fewer miles of highly wind erodible, prime farmland, stony-rocky, and droughty soils, or areas with shallow bedrock.
Two registered wells and two springs are known to occur within 300 feet of the route alternative, whereas three wells and one spring are within 300 feet of the proposed ronte. Ruby estimates that the route alternative would require an additional 665,100 gallons of water for hydrostatic testing and dust control, an approximate 1.5 percent increase in water use.
According to the FWS, the Sheldon NWR is the largest and most pristine piece of land representative of the sagebrush steppe ecosystem in the nation that is not grazed by domestic livestock, and is benefiting from current efforts to remove feral horses and burros (FWS, 2008a). The fact that it is not grazed is important because grazing is both highly destructive to the habitat and increases the opportunity for noxious weed dispersal from livestock, horses, or burros inadvertently picking up seeds and moving them around and between their pastures. Grazing also contributes to the expansion of juniper trees into grasslands and other communities because juniper seeds germinate only after passing through the alimentary tract of an animal.
Approximately 300 species of birds, mammals, amphibians, fish, and reptiles and 650 species of plants are present on the Sheldon NWR. Data suggest that wildlife diversity within the Sheldon NWR may be higher than areas outside its borders (Herbst, 1996; Williams and Storm, 1978). A literature review conducted by Ruby of the two routes suggests the number of mammals along the routes is about even, with 51 species known to occur on the Sheldon NWR. (not including feral horses or burros) and 54 <,-•
species south of the NWR.. A total of 111 species of breeding birds are known to occur on the Sheldon NWR, in comparison to 67 species to the south of the NWR. Waterfowl comprise the major difference between the two areas. A total of 19 species of reptiles and amphibians 'are known to occur on the Sheldon NWR, compared to 8 species to the south of the NWR.
We note that the literature review covered the Sheldon NWR as a whole. We believe that it is very likely that species richness along the corresponding portions of the proposed pipeline route, which is in a more remote, undisturbed area (as evidenced by lack of adjacent highway and 22 fewer nearby mines/pits/quarries), may be higher than that of the route alternative within the State Highway 140 easement. The FWS disagrees with this position stating that while it may seem intuitive that species richness and diversity are often greatly reduced within a highway right-of-way, the species richness and diversity along the State Highway 140 corridor within the Sheldon NWR is an atypical situation. The FWS bases its opinion on the fact that grazing and wildlife management on the Sheldon NWR are controlled, whereas the proposed pipeline route has been subjected to grnzing pressures over many decades. Further, the FWS states that it coordinates closely with NDOT to limit the amount of the highway easement that is maintained (including blading and/or grading, mowing, etc.) so that optimal quantities of undisturbed habitat are allowed to flourish on the refuge. The FWS fmther notes that pygmy rabbits occupy sagebrush habitat within the unpaved portion of the existing road right-of-way. As a result, the portion of the State Highway 140 easement that is within the NWR boundary has relatively limited invasive species cover, much greater native vegetation cover, and far less cleared or bladed areas than is typically found outside of the refuge along the highway.
3-36
74 of 182

(7)
Rural Heritage Preservation Project, Report No. 110. History of Predator Control Practices on the Sheldon National Wildlife Refuge and Hart Mountain Antelope Range.
Compiled and edited by Cliff Gardner.
Perhaps, the best laboratories for determining the true benefits of effective predator control practices, have been our national wildlife refUges. The greatest of these being the Sheldon National Wildlife RefUge, and Hart Mountain National Wildlife RefUge.
Unbeknown to most, one of the most intensive predator control programs ever carried out here in the west was implemented in the early 1920's on an area that was then described as the northwest corner of Nevada and south central Oregon.
Between 1921 and 1934, 7,500 coyotes and bobcats were systematically removed By 1935 it was estimated that antelope numbers had increased to more than·l 0,000 animals. Mule deer were becoming more and more abundant and sage grouse were being seen by the thousands.
Now you might say what is so significant about that. Wen the significance is, historically, or at least at the time of first foreign exploration into the region no wildlife of any significance were seen in the region, not by Peter Skeen Ogden, not by John Work, nor John C. Fremont.
Predator control, you might say, was the father of Hart Mountain and the Sheldon RefUges. Of course you won't hear this .from those in government. The last thing they want is for anyone to recognize and understand, the part that predator control practices have played in creating wildlifo abundance here in the west.
Now, some seventy jive or so years later, we are experiencing an opposite situation. Each year fewer and fower wildlife of nearly every kind are being seen on the Sheldon and at Hart Mountain. In fact, on close inspection it can be seen, when wildlife numbers began to decline beginning in the 1960's and 70's such occurred first on RefUge lands simply because, that was where the elimination of livestock grazing and reductions in predator control practice were first implemented
Probably one of the most beneficial things accomplished by RefUge personnel over the years has been the narrative reports that have been kept year by year. Beginning in 1940 at Hart and Sheldon, estimated numbers of animals, production, and yearly activities have been well recorded
Over the years, Rural Heritage Preservation Project has been fortunate enough to acquire copies of these records, and what we have found is amazing. These records may
1 75 of 182

well be the best records ever produced reveling the true benefitsof western settlement on lands and wildlife.
Following you will find our summery of history and findings as they were recorded by Refuge staff over the years.
SHELDON NATIONAL WILDLIFE REFUGE, 1939- 2000
1940 - Coyotes were not considered to be a menace to game in the area in 1939.
Losses to wildlife by predatory animals would have been serious without protection through the government control project. 376 coyotes and 12 bobcats, were destroyed- of these 41 coyotes were taken by refuge personnel. Coyote control is necessary, poison is distributed during winter- personnel also shoot coyotes when seen.
Personnel observed where a coyote had buried two sage grouse eggs.
1941 - one coyote shot, no trapping or poisoning done this season.
3,528 antelope censured- estimate there are 4,000 in neighborhood.
33.8% bucks 37.2% does 29% fawns
1942- coyotes observed frequently- ravens on increase and undoubtedly a big factor with sage grouse production. Coyotes have been seen to take full grown antelope -refuge personnel never miss a chance to shoot coyotes when seen.
Estimate- 1,000 to 1,500 deer on refuge.
Findings indicate all browse types in fine shape.
194 3 - since 1937 there has been an increase in predators until their numbers are far above the best interests of the refuge. Numerous ranchers in and adjacent to this area have reported heavy damage on the lambing and calving ground mostly by coyotes.
Definite control action should be taken, especially in view of the poor hatches of sage hen during the last two years.
2 76 of 182

There seemed to be a definite shortage of antelope fawns in all the herds.
Adverse weather in the first week of June attributed to loss of sage grouse nests and young. Sage grouse remained abundant however. As many as 45 young birds were seen at one time on the lawn at headquarters. They enjoy feeding on white clover and dandelion. Large flocks are well scattered throughout the refuge and are in excellent condition - in spite of the loss of young birds the population seems to be on the increase.
Cattle maintained good fles~ additional grazing use and better distributions are needed in many of the meadow areas to reduce the accumulation of grass mat.
1944- coyotes are becoming more and more under control through the aid of trappers. Present population is quite a bit less than observed last year.
Ravens are the refuge nuisance with magpies a close second- it is hoped to utilize the carcasses (of trapped animals) in the establishment of poison stations to reduce these species.
Food and cover conditions have been excellent- deer and antelope face the coming winter in fine condition.
1945- a large buck in fair condition was found after having been killed by coyotes.
While repairing fence Mr. Jacobs found many leg bones of small antelope fawns that had been carried there by ravens. Two deer apparently killed by coyotes were found during Dec.
Deer fawn to doe ratio was high.
Sage grouse numbers seen at headquarters was smaller this season
Browse species as well as herbaceous forage plants made good growth during the season.
1946- Counts of sage grouse during July indicated an average of five to seven birds per brood while the largest count consisted of twelve young. The usual flock of sage hens appeared on the refuge headquarters lawn in early July and made daily use of it. The greatest number counted was 21 but during most of the summer, a flock of 13 remained.
3 77 of 182
Cliff
Highlight
Cliff
Highlight
Cliff
Highlight
Cliff
Highlight
Cliff
Highlight
Cliff
Highlight
Cliff
Highlight
Cliff
Highlight
Cliff
Highlight
Cliff
Highlight

There seems to have been a satisfactory survival of antelope fawns this fall. Mr. Rouse states he found an average one fawn per every three adults, indicating a 25% increase. Approximately 15 coyotes were taken by refuge personnel during the period.
1947- As a result of a very extensive poison program carried out on the antelope range this winter- coyotes are scarce this spring: In January~ 22 poison stations were established throughout the antelope wintering grounds using wild horses for the purpose. It was impossible to locate all coyotes killed; but a total of33 dead coyotes were found during February.
Note: 1947 was the year 1080 was introduced
Beginning on March 20, a Division of Predator and Rodent control plane was brought in and an additional250 poison station were put out on the refuge and about 150 on the adjacent country where antelope were ranging.,
Biologist Rouse r~rted that 90 % of antelope does observed in late May were lactating or wet does.
There was a good hatch and survival of sage grouse this year. Broods averaged about six to eight young during June.
A good deer fawn crop with a high percentage of fawns was produced this year. One doe with triplets was noted.
It seems evident that our control program oflast winter was effective. We have reports from stockmen who rode the Badger M~untain area that several dead coyotes were found. Undoubtedly the excellent antelope and deer fawn crops are in part due to the scarcity of coyotes.
1948 - This past winter, 23 1080 poison stations were established. In addition a total of 47 coyotes and 5 bobcats were shot by refuge personnel
Local stockmen who have been riding report sage grouse to be more abundant than they have been for many years. Predators are seldom seen.
No evidence of unusually heavy browsing or food shortage has been observed.
During the early part of Dec. fifty additional horse meat stations treated with 1080 were established. Already several dead coyotes have been found.
4
78 of 182
Cliff
Highlight
Cliff
Highlight
Cliff
Highlight
Cliff
Highlight
Cliff
Highlight
Cliff
Highlight
Cliff
Highlight
Cliff
Highlight
Cliff
Highlight
Cliff
Highlight
Cliff
Highlight
Cliff
Highlight
Cliff
Highlight
Cliff
Highlight
Cliff
Highlight
Cliff
Highlight

1949- Despite the severe winter it appears sage grouse population came through in good shape.
Fifty 1080 bate stations were once again.distnouted throughout the refuge. Bobcats have been observed with greater regularity however.
Sage grouse are probably more numerous this year than at anytime since the refuge was established. Broods averaged six young per brood.
The greatest member of sage grouse observed on the refuge lawn at any one time was forty two birds.
The percentage of mule deer fawns appears to be quite high.
An exceptionally good fawn crop was produced. According to dab4 60% if the total antelope population were fawns.
All cattle were in excellent condition when removed this fall.
1950 - coyotes continue to be relatively scarce over most of the area.
Pygmy rabbits seen in the Badger Flat area are reasonably numerous there.
According to "old timers" sage grouse are now approaching the abundance .known in this country in the early days. Although weather conditions were not favorable during the nesting seaso~ counts made during June showed an average of slightly more than six birds per brood.
Note: Marge Dtifitrrena Stephens. told ofliving on the Kinney Camp Ranch before it was sold to the federal government for the creation of the Sheldon Game Range in 1937. Marge said, the Dufurrena Family had relatives in Alturas, California, about 100 miles to the west across the high desert country. Every year her dad Tom Dlffi,trrena would load up the family and make their yearly trip to Alturas. The thing Marge remembered most of those trips were the great numbers of sage grouse that were seen along the way. She said that sage grouse would be in every draw, just thousands and thousands of sage grouse, all across the desert.
Sage grouse appeared as usual on the headquarters lawn about July 10. This year they far exceeded any previous numbers seen and on one occasion totaled 140 counted on the lawn. It is estimated there are 7,000 birds on the range, and it is believed this is a conservative figure.
Mr. Jacobs reports having counted 71 broods of sage grouse while traveling a distance, of · about 15 miles. The birds are dusting themselves in the road. They average about 8 chicks per brood.
5
79 of 182
Cliff
Highlight
Cliff
Highlight
Cliff
Highlight
Cliff
Highlight
Cliff
Highlight
Cliff
Highlight
Cliff
Highlight
Cliff
Highlight
Cliff
Highlight
Cliff
Highlight
Cliff
Highlight
Cliff
Highlight
Cliff
Highlight
Cliff
Highlight
Cliff
Highlight
Cliff
Highlight
Cliff
Highlight
Cliff
Highlight
Cliff
Highlight
Cliff
Highlight
Cliff
Highlight

It is believed that coyotes are up some this year over last. Predator control work, 1080 statiQ.ns, will be held to a minimum this year as the coyotes are helping to hold the large numbers ofblacktailed jackrabbits in check.
1951- There is no indication of a shortage of food on the winter range of either the deer or antelope.
Rarely is a coyote seen on the refuge or vicinity.
Sage grouse brood counts up to the middle of Jl.Dle showed broods to average about 7.6 young per brood. While coyote numbers are low~ coyotes are still capable of doing damage. One sheep outfit running immediately south of the refuge reported the loss of7 ewes during May. Two other sheepmen reported losses in excess of20 head during the same period. It is the plan, weather conditions pennitt:in& to place approximately the same number of 1080 treated stations a month earlier this coming winter.
Grazing conditions are good over the entire area this year.
In February, I noticed a large concentration of sage grouse in an 8 mile area between the top ofMcKinney Camp hill and the junction of Cedarville road. Hundreds ofbirds were seen on both sides of the road as far as the eyes could see. The sage brush was not entirely covered by snow here and the birds were apparently feeding on the sage~ They remained in this vicinity for three weeks.
On February 8, I counted approximately 2000 head of antelope around Railroad Point and Thousand Creek Valley~ The snow in the vicinity was all gone except the drifts. This range had plenty of shadscale, Bud Sage, Antelope Bros~ and other feeds. No heavy usage of this area had occui:red since the winter of 48-49.
1952- The over-all population if sage grouse on the refuge this year is believed to exceed that of the past two years, and is estimated to be around 11,000 birds. Two sage hen kills were noted on Hell Creek in one day, that appeared to be the work of coyotes. Bide Steward reports an increase of coyotes around the Bimer Ranch.
Figures for the refuge this year show antelope fawn-doe ratio to be40.8 %to 592 %, this exceeds the fawn ration of31.4 % and 31.5 % for the past two years.
Grass and other forage is in excellent condition this year as a result of abundant moisture. There is more than adequate feed for both livestock and game this year. Observations made in late August on the beef roundup showed excellent forage and water conditionscattle were fat. ,
6
80 of 182
Cliff
Highlight
Cliff
Highlight
Cliff
Highlight
Cliff
Highlight
Cliff
Highlight
Cliff
Highlight
Cliff
Highlight
Cliff
Highlight
Cliff
Highlight
Cliff
Highlight
Cliff
Highlight
Cliff
Highlight
Cliff
Highlight
Cliff
Highlight
Cliff
Highlight

1953 -Although it appears that the 1080 bait has the coyotes pretty well under control, there is evidence that we still have a fair population of these predators present on the refuge .
. There is an estimated.13,000 sage grouse using the refuge areas:. The average brood size this year is 6.3 as compared to 7.61ast year.
The adult antelope- kid :ratio is 72.6% adults to 27.4% kids~ compared to last year~s figures of 57.5 % adults to 24.5 % kids.
-1954 - Average number of sage grouse chicks per broo~ 4.07. Percent ofhens with broods, 84 %.
There is a higher concentration of coyotes this year. Their barking and yodeling can be heard mornings and evenings.
We do not have the increase in antelope that we should have.
By use of a combination of 1080 poison, coyote getters, and trapping~ the predator control division is doing a fairly good job of controlling predators. Perhaps some greater effort should be taken to remove more bobcats. There are probably two bobcats to every one coyote on the refuge.
Note: Strychnine was used for the control of predators for 11Uli1JI years, bifore 1080 became available. Strychnine was difficult to use, for it took a certain level of skill, just to get coyotes to take i~ but was more effective in keeping a broad variety of predators under control- whereas 1080 was not effective in controlling bobcats, skunks. badgers, ·crows and ravens. Consequently, in the years following the introduction of 1080, persons serious about controlling predators had to find alternative methods for controlling such animals as bobcats and ravens, and so forth. Uifortunately, this never happened to any great degree, either at Sheldon, or at Hart Mountain. John Scharjj; long time manager of the Malheur National Wildlife Refuge, on the other hand, did carry on an effective program for keeping the number of ravens and bobcats at a minimum for many, many years. A.nd it worked well. Production of wildlife remained good at Malheur right up until John Scharff retired in 1981.
1955 - Although we feel that our deer range is adequate to meet the needs of our deer her~ there. is a good possibility that we may be reaching our maximum carrying capacity.
7
81 of 182
Cliff
Highlight
Cliff
Highlight
Cliff
Highlight
Cliff
Highlight
Cliff
Highlight
Cliff
Highlight
Cliff
Highlight
Cliff
Highlight
Cliff
Highlight
Cliff
Highlight

Although coyotes and bobcats are fairly numerous throughout the refuge~ it is felt that there is probably not more than a desirable number to play their part in game management and rodent control.
Editor's note -At this point, it appears that personnel were softening in their war on predators. 1080 stations continued to be put out each year, but with less enthusiasm and more sparingly than before.
Golden eagles continue to appear in moderate numbers, and no doubt account for a relatively few antelope kids and sage grouse. It is felt, however, that the benefit we obtain from removal of rodents will balance out against the damage done, and no control measures are being taken.
It appears that the sage grouse population is down somewhat from last year. The count shows only 57.7% of the hens had broods and the number of chicks per hen was 1.99
To our perplexity and anxiety our antelope population continues to decrease each year. We are endeavoring in every way to determine the cause offJ?.e decrease in antelope. Some are of the opinion that the predators are the cause, or at least a m~or factor. The writer is not at all convinced that this is the case.
This year for the first time in the last few years our sage grouse population seems to be at a stand-still
1956- All in all we find our antelope population still on the downward trend. We still do not know what is causing this. Jacobs says that he sees coyotes and bobcats on numerous occasions. He states that he has recently noted antelope hair in six different coyote droppings. It is felt we need more predator control on our antelope winter range. Antelope counts on areas adjacent to the refuge shows that the downward trend outside the refuge is not as great as inside.
From casual observations, the deer population appears to be less than at this time last year. It is estimated that there are perhaps around 1200 deer on the refuge this year, as compared with an estimate of 1800 last year.
Murial Jacobs, who is our refuge predator control man, says that in his opinion there are at present more coyotes on the refuge than there has been in recent years. Almost without exception all deer taken on the Game Range this fall were in good-to-excellent condition. Most of them were very fat.
Through a stepped up predator control program, which our Branch has worked out with the predator and Rodent control division, a full-time trapper has been stationed in the
Duferrena area for the winter. fll " · · ·~ t . ~ ; :' .. ·.
8
82 of 182
Cliff
Highlight
Cliff
Highlight
Cliff
Highlight
Cliff
Highlight
Cliff
Highlight
Cliff
Highlight
Cliff
Highlight
Cliff
Highlight
Cliff
Highlight
Cliff
Highlight
Cliff
Highlight
Cliff
Highlight
Cliff
Highlight
Cliff
Highlight
Cliff
Highlight
Cliff
Highlight
Cliff
Highlight
Cliff
Highlight
Cliff
Highlight
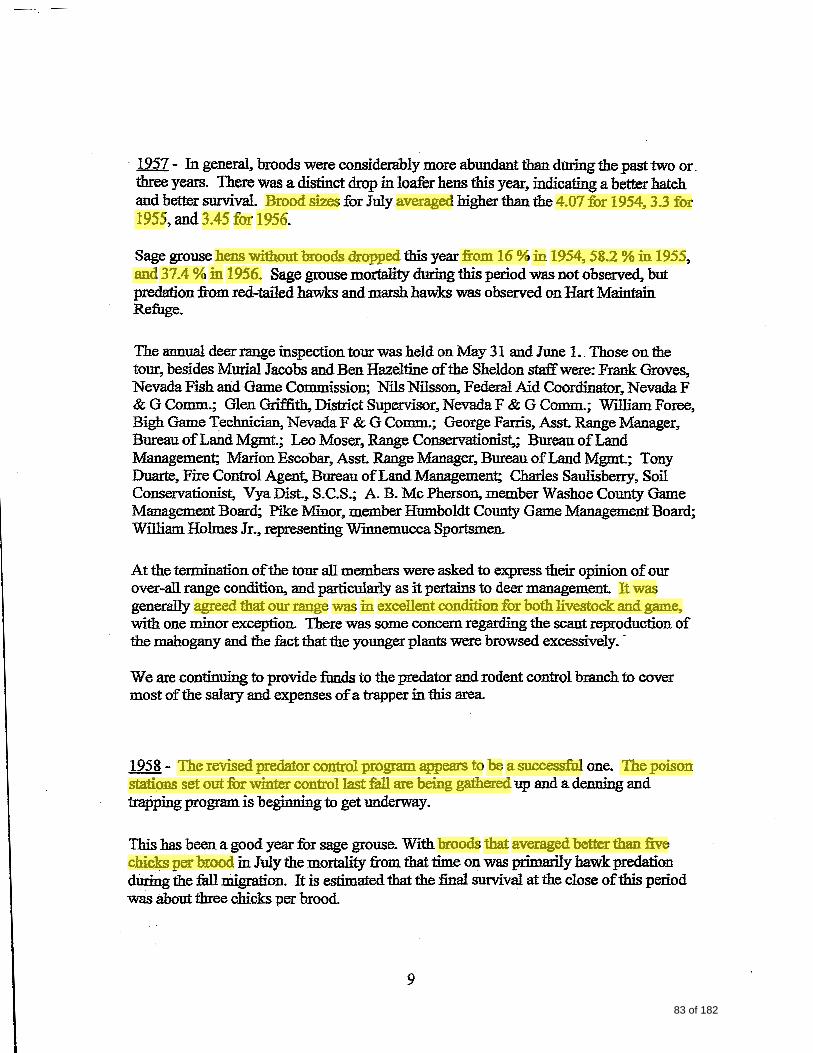
· 1957- In general, broods were considerably more abundant than during the past two or. three years. There was a distinct drop in loafer hens this year, indicating a better hatch and better survival. Brood sizes for July .averaged higher than the 4.07 for 1954, 3.3 for 1955, and 3.45 for 1956.
Sage grouse hens without broods dropped this year from 16% in 1954, 58.2 %in 1955, and 37.4% in 1956. Sage grouse mortality during this period was not observed, but predation :from red-tailed hawks and marsh hawks was observed on Hart Maintafu Refuge.
The annual deer range inspection tour was held on May 31 and June 1. _Those on the tour, besides Murial Jacobs and Ben Hazeltine of the Sheldon staff were: Frank Groves, Nevada Fish and Game Commission; Nils Nilsson, Federal Aid Coordinator, Nevada F & G Comm.; Glen Griffi~ District Supervisor, NevadaF & G Comm.; William Foree, Bigh Game Technician, Nevada F & G Comm.; George Farris, Asst. Range Manager, Bureau ofLa.D.d Mgmt.; Leo Moser, Range Conservationist,; Bureau of Land Management; Marion Escobar, Asst. Range Manager, Bureau of Land Mgmt.; Tony Duarte, Fire Control Agent, Bureau of Land Management; Charles Saulisberry, Soil Conservationist Vya Dist., S.C.S.; A. B. Me Pherson, member Washoe County Game Management Board; Pike Minor, member Humboldt County Game Management Board; William Holmes Jr., representing Wmnemucca Sportsmen.
At the termination of the tour all members were asked to express their opinion of our over-all range condition, and particularly as it pertains to deer management. It was generally agreed that our range was in excellent condition for both livestock and game, with one minor exception. There was some concem regarding the scant reproduction of the mahogany and the fact that the younger plants were browsed excessively. ·
We are continuing to provide funds to the predator and rodent control branch to cover most of the salary and expenses of a trapper in this area.
1958 - The revised predator control program appears to be a successful one. The poison stations set out for winter control last fall are being gathered up and a denning and trapping program is beginning to get underway.
This has been a good year for sage grouse. With broods that averaged better than five chicks per brood in July the mortality from that time on was primarlly hawk predation during the fall migration. It is estimated that the :final survival at the close of this period was about three chicks per brood.
9
83 of 182
Cliff
Highlight
Cliff
Highlight
Cliff
Highlight
Cliff
Highlight
Cliff
Highlight
Cliff
Highlight
Cliff
Highlight
Cliff
Highlight
Cliff
Highlight
Cliff
Highlight
Cliff
Highlight
Cliff
Highlight
Cliff
Highlight
Cliff
Highlight
Cliff
Highlight
Cliff
Highlight

Poison bait stations (1 080 compound) were set throughout the refuge beginning on Nov. 7. Claude Mathews total catch from December 1957 through Nov. 1958 was 149 coyotes and 99 bobcats.
1959- Observations indicate a high coyote population. A predator control man trapped from June to November- 44, 1080 stations have been placed on and adjacent to the refuge.
The refuge manager has made a request to the Bureau ofLand Management for a reduction in grazing on public lands, and a month later turnout for cattle next spring.
Note: The author of this summery believes that environmental philosophy and the hippie movement emerged within American society at about the same time. 1960 seemed to be the turning point-at Ruby Lake, at the Sheldon, at Hart Mountain, within the ranks of Forest Service employees and among BLMs employees, all of a sudden, everything that was perceived as wrong was blamed on the private sector . .
1960- Average sage grouse chicks per hen. 1958-2.83 1959-1.40 1960-1.03.
It is estimated that production of2 chicks per hen is necessary to offset normal year around losses.
Grouse feathers and bones were common on watering areas, particularly on meadows where the birds spend the early morning feeding. In a few cases, bobcat and coyote sign was found near scattered feathers. Grouse remains were found in the stomach contents of three coyotes shot from the air.
A coyote was working the Dufurrena ponds every night during the gosling hatch. Entire broods disappeared as fast as they hatched. The coyote population is as high, ff not higher than last year.
Hayden Purdy, predator and rodent control trapper has 1080 stations baited and is using cyanide getters again this year.
Note: Something seems to be amiss. Persons making entries in the narrative reports are indicating they are continuing to carry on fairly extensive predator control practices year after year, yet they indicate as well, that they ere seeing greater and greater numbers of coyotes year by year. It doesn't add up. Either they are effectively lowering the number of coyotes on the RefUge or they are not. And if they aren ·~ they need to jindout why . .
10 84 of 182
Cliff
Highlight
Cliff
Highlight
Cliff
Highlight
Cliff
Highlight
Cliff
Highlight
Cliff
Highlight
Cliff
Highlight
Cliff
Highlight
Cliff
Highlight
Cliff
Highlight
Cliff
Highlight
Cliff
Highlight
Cliff
Highlight
Cliff
Highlight
Cliff
Highlight

1961 - Again, as in 1960 and 1959 our yearly sage grouse production has been extremely low. Remains of dead birds were found at almost all watering areas during the summer. From sign.and voice, coyotes seem to be holding their own or increasing.
1962- Col<t wet weather during the hatching period again raised havoc with the broods. Predation did not appear to be .higher than usual on all age classes. Worden observed and immature golden eagle kill a young grouse at Hobble Spring, and Worden and Sekora found five ravens feeding on the warm body of a young grouse at Gooch Spring.
1963 - Storms in May agajn killed off many broods of sage grouse chicks. There is no doubt in our minds but what there has been a "coyote comeback" on the refuge. Trapper Purdy has had one ofhis best years _ever in his war on the "wild dogs".
1964- The 5.22 inches of rain in May land June resulted ina loss of most of the sage grouse chicks this year. Antelope also had problems. Many kids were bom that had no opportunity to dry off for several days after being dropped on wet ground- we feel that this resulted in early kid losses higher than normal.
During the year ending April30, 1964 our predator and rodent control men took 245 coyotes, 46 bobcats and 63 badgers. In addition to this, twenty-eight 1080 poison stations were also placed on the Sheldon Range. In February Trapper Haydon Purdy and Pilot Ted Barber gunned 105 coyotes on and adjacent to the Sheldon Range. Prior to the antelope kidding season in May and the gunning and denning crew of the of Predator and Rodent Control killed 49 coyotes in 21 hours flying time and located 4 dens containing 12pups.
Note: Again, they seem to be actively taking predators, yet they continue to see plenty of coyotes. It is evident that they are putting out fewer 1080 stations than they had previously put out. That may have had an effect Then too. rm wondering if they might have been experiencing an iriflwe of coyotes coming in from outside the RefUge. Perhaps Nevada and Oregon were not carrying on effective programs during this period A.nd if this were the case, then many more coyotes would have been filtering into the Refuge each year than would occur otherwise.
1965 - Sage grouse chick survival within a few days of hatching was the lowest in the past decade. Trapper Hayden Purdy gunned 211 coyotes and one bobcat in 49 hours flying time in the Sheldon area. Twenty seven 1080 poison stations were also placed on
11
85 of 182
Cliff
Highlight
Cliff
Highlight
Cliff
Highlight
Cliff
Highlight
Cliff
Highlight
Cliff
Highlight
Cliff
Highlight
Cliff
Highlight

the area during the winter of 1964 and 65. In spite of the impressive mnnber of coyotes "controlled" during the past year, we still got' em.
1966- During the winter of 1965-66 twenty eight 1080 poison stations were placed on the area. Sheep carcasses were used to provide coyotes a change from a horse meat diet, and good amounts were taken.
Trapping was concluded on April30 with a reported take of 146 coyotes, 33 bobcats, and 34 badgers. Refuge personnel killed a few more animals as well.
In 1957 sage grouse production was 4 chicks per hen- since that time Sheldon's grouse have dwindled from an estimated 9,000 birds to 3,000 birds at the end of 1966.
Note: Think of it, in the years following 194~. when 50 or so 1080 stations were being placed on the Sheldon each year, sage grouse chick production was 6 to 8 chicks per brood Numbers of hens producing broods each year were also higher. As the number of 1080 stations were reduced, more and more. coyotes were being seen and heard As coyot~ increased, size ofbroods and percent of hens successfully raising broods declined
1967 - Antelope kid production during 1967 was the poorest in several years. After many years of coyote control of varying intensities we have gradually reduced the program to about 40 hours of aerial gunning on the antelope kidding ground.
We see coyotes diligently hunting kidding grounds loaded with one to ten day old kids. We have seen them catch them. There are many more unseen ones which we can do nothing about.
Mountain lions are considered rare in this part of Nevada. An important stop was made this year when this fine animal was placed on the game list from its previous unprotected status. Lions are protected on hunting areas of the Sheldon range.
1968 - Nevada Fish and Game Department biologist reported an average of 1.3 chicks per hen and average brood size of3.6 chicks for Humboldt and Washoe Counties.
The low production rate of 16 antelope kids per 100 adults is the poorest experienced since accurate aerial censuring was begun in 1954. As was the case with antelope, our mu1e deer herd presented the second year of poor reproduction. Again, we do not have ·the answer and feel research is needed to detennine the cause.
12
86 of 182
Cliff
Highlight
Cliff
Highlight
Cliff
Highlight
Cliff
Highlight
Cliff
Highlight
Cliff
Highlight
Cliff
Highlight
Cliff
Highlight
Cliff
Highlight
Cliff
Highlight
Cliff
Highlight
Cliff
Highlight
Cliff
Highlight

For the first time in many years, formal predator control was not practiced on Sheldon. Lack of money and no apparent need for control were the primary reasons. A marked increase in the frequency of coyote observations was noted during the year.
1969 - Although antelope kid production was up to 28 kids per 100 does, and increase of 5 kids per 100 does, over 1968, we are not overly enthused. Accurate censusing of antelope began in 1954, since then the average kid production for the Sheldon and Hart Mountain herds has been 41 kids per 100 adults. Our year of greatest production was 1957 when 70 kids per 100 adults were recorded, which is considered average for the antelope ranges of Wyoming and Montana.
1970 - Predators. Coyotes are the most common animal in this classification; however, their numbers do not constitute any problem. We are not aware of, nor have we attempted to determine, any conflicts between coyotes and wildlife.
1971- Sage grouse routes were run several times with negative results. The effect of the early summer storms on this year's production is evident in the fact that only six broods were observed, is an indication of the poor nesting results. Refuge production is estimated at 100 birds
The antelope production rate of 5 kids per I 00 adults is the all-time low since aerial censusing began in 1954. This, however, reflects the survival of the Memorial Day storm rather than true production figures. No figure is available for the number of kids dropped.
The deer population remained comparable to 1970, with an estimated total, as of December 31, of 600 animals. Habitat checks suggest a carrying capacity for more animals. Bag checks during hunting season indicate this area is not producing the big racks it was once noted for. Two and three point bucks accounted for 72% of the kill.
1972 - We are not aware of, nor have we attempted to determine, any conflict between coyotes and wildlife. Coyotes are not legally hunted on the area, but deer hunters and others undoubtedly take a few.
The part of the Sheldon Range that is grazed by livestock is rated from a poor to low good range condition.
13 87 of 182
Cliff
Highlight
Cliff
Highlight
Cliff
Highlight
Cliff
Highlight
Cliff
Highlight
Cliff
Highlight
Cliff
Highlight
Cliff
Highlight
Cliff
Highlight
Cliff
Highlight
Cliff
Highlight
Cliff
Highlight
Cliff
Highlight

1973 - No record.
1974- No record.
1975 - Land use and abuse by grazing continues to be one of great contrast. Wildlife habitat conditions are deteriorating, with key browse species (bitterbrush) being consumed prior to winter periods. Mountain mahogany reproduction is nil and every meadow bottom in experiencing varying forms of erosion.
Note: Isn't it amazing, from the time the Refuge was created, up until the late 1960's, Refuge personnel claimed the Sheldon range was in good condition, then all of a sudden it's not. They seem to forget that when the most livestock were being grazed upon the lands was when they were producing the greatest numbers of wildlife. It makes one wonder, are they really concerned about wildlife, or do they have other objectives?
1976 - No winter inventory was flown in 1976 by the Service.
Declining deer populations throughout the State in the late 60's and early 70's evidently bottomed out in 1974 according to Nevada Fish and Game personnel.
Sage grouse brood data was collected by both the Nevada Fish and Game, and Service. The State biologist did all of his surveys on foot, walking nearly 35 miles as measured by a pedometer. The ratio of 151 chicks /100 hens was indicative of poor production, well below the 150 per hundred average for Washoe County.
1977 - Predator control has not been practiced on Sheldon since 1967.
Sage grouse populations remained low throughout this area compared to those of the late 1950's and early 1960's. A sage grouse I range relationship study will began next year.
1978 - Thirteen antelope kids were radio collared between May 15 and May 30. Many coyote- doe- kid encounters were observed. Usually one, but up to three coyotes were involved, All predator victims recovered were judged to be in excellent physical condition at time of death.
14 88 of 182
Cliff
Highlight
Cliff
Highlight
Cliff
Highlight
Cliff
Highlight
Cliff
Highlight
Cliff
Highlight
Cliff
Highlight
Cliff
Highlight

Of the 15 kids which were radio collared, 9 died involving coyotes, 1 died of malnutrition or abandonment, and one died of exposure or abandonment.
Two mule deer studies were undertaken, both by M.S. candidates at the University of Nevada. The :final objective ofboth are to gairi. a better understanding ofhow livestocJ:c grazing or other management practices affect fawn production/survival and habitat selection by all age and sex classes throughout the year.
Twenty-six deer~ including three fawns, were trapped in December 1977. Eighteen were bucks7 eight were does. Seven additional does were trapped and radio collared while on winter range, to total 14 does with radios.
Fourteen fawns were radioed on Bald Mountain in June 1978. Three were .killed by coyotes, one died of pneumonia, and the fate of one is unknown. The remaining nine fawns and four does were monitored throughout the year.
(Phase 2 of the study involved sage grouse) Some specific questions for which it is hoped answers will be found are:
1. Is nesting affected by range condition?
2. Does range condition affect brood size and number ofbroods?
3. How do sage grouse respond when their habitats are grazed less intensely or not at all?
4. Is there a net benefit in sage grouse populations when range conditions are improved?
Problems have plagued this project, which is contracted through the University of Nevada. After completing the first year of field work the graduate student resigned. The principal investigator, Dr. Don Klebenow plans to spend considerable time in the field in 1979 and assign another student.
1979 - Of the antelope fawns collared in 1977, mortality was 79 %in 1978,. and 57 % in 1979. N"mety {90) percent of fawn mortality occurred within the :first three weeks of life. Predation was the main cause of death- accounting for 82% in 1978, and 67 %in 1979. Coyotes were involved in ninety four percent of the deaths.
Coyotes are seen :frequently and are consider~ abundant and increasing. Jackrabbit populations have been increasing since 1976 .
. Note: From this time forward we see no more information presented within the Sheldon Narrative Reports regarding the above mentioned studies.
15
89 of 182
Cliff
Highlight
Cliff
Highlight
Cliff
Highlight
Cliff
Highlight
Cliff
Highlight
Cliff
Highlight
Cliff
Highlight
Cliff
Highlight

1980 - A protracted period of cold, wet weather during the critical first few days of peak: poult hatch resulted in extremely low chick survival. The poult to hen ratio for 1980 was .54.
1981 - The year 1981 was the second and third year grazing systems have been implemented for most of the grazing units. Nearly 200,000 acres that are no longer being grazed because of identified wildlife conflicts.
As happened last year~ sage grouse chick survival was directly related to cold, wet weather du:r:ing the first couple weeks after hatching.
1982- Within the next five years we anticipate using prescnoed fire fur brush control on meadows. F.ire will also be used on the uplands to mask or obliterate the secondary haul roads.
Note: Again. we are seeing changing points of view among management-fewer and fewer livestock- more and more use of fire as a means of managing rangelands- the obliteratiorz of roads and roadways -less and less predator control -all a part of the new, all back to nature philosophy that has impregnated society in recent years.
Within 5 to 10 years the area will be put back into grazing program to maintain the meadows in a condition preferred by sage grouse. And best of all, we anticipate that most of the drainages will be converted from intermittent to a perennial stream.
1983 - (Deer) The winter of 1982- 83 resulted in a winter kill of24 percent of 1982,s fawns. Forage production of grass, forbs and browse was excellent though somewhat late due to the weather.
We are hopeful that Jo Meeker's selenium analysis of collected antelope tissues will shed some light relative to remaining low kid-doe ratios.
1984- Sage grouse brood counts was down by 40 %. . 7 chicks per hen again was the average brood size.
Normally, about 400 antelope are on Gooch Table to kid and breed, this year only 78 antelope were seen; 13 bucks, 64 does and 1 kid. Coyotes were observed actively
16
90 of 182
Cliff
Highlight
Cliff
Highlight
Cliff
Highlight
Cliff
Highlight
Cliff
Highlight
Cliff
Highlight
Cliff
Highlight
Cliff
Highlight
Cliff
Highlight
Cliff
Highlight

hunting antelope during the mid-winter survey. The selenium deficiency that researcher, Jo Meeker, is looking into could also be a factor.
Note: It seems odd, that Refuge personnel would think that selenium deficiency might be a problem at this time and juncture, when obviously it was not a problem back in the 1940's, 50's, when the Sheldon was producing optimum numbers of wildlife?
1985 - The antelope kid /doe ratio of36 per 100 does is a marked improvement over the previous three years.
The 1985 spring surveys reflected an over-winter kill of 41 percent in deer fawns.- the highest in recent years, and was typical of that found in other northern Nevada areas.
Chicks per hen in sage grouse ranged from .4 to .7 and averaged 57 chicks per hen. Broods per 100 hens were down 45 percent over the long term average. The same picture was wide spread over northern Nevada and NDOW did not authorize a hunting season in 1985.
1986- Refuge fire crews responded to 3 fires on Sheldon during July. For most of August the entire crew and engines were detailed to the large fire complex which occurred inN. E. Oregon involving fire fighters from all over the west. One fire on Hart Mt and two :fires on Sheldon occurred late in the year (Sept)
The 1986 spring surveys reflected an over winter kill of36 percent in deer fawns- down slightly from a year ago, but still high.
All upland bird production improved this year over the past four years. Chicks per hen in sage grouse averaged 3.6 chicks per hen.
1987- Antelope kid to doe ratios of38 kids per 100 does is good.
Production for all upland birds improved, ranging from fair in grouse and quail to good in chukars and huns. Waterhole counts in June to mid-July indicated average sage grouse production at 3.9 chicks per hen.
. 1988 - A horseback survey of sage grouse broods in July along Rodero Creek resulted in a count of21 total birds, which included three adult males and three broods averaging :five young per brood.
17
91 of 182
Cliff
Highlight
Cliff
Highlight
Cliff
Highlight
Cliff
Highlight
Cliff
Highlight
Cliff
Highlight
Cliff
Highlight
Cliff
Highlight

Note: Average post deer hunt fawn to doe ratios for the ~ame period, 1977 through 1988 was 51 fawns per 100 does. Average over-winter loss of fawns during the years 1977 through 1988, as was determined by Refuge Stqffwas 27 percent. 27 Percent over winter loss, would still/eave replacement numbers at about 38 replacement animals for every 100 does- which should be enough to sustain heard levels. The problem isbecause coyotes often take as many adult animals during winter months" fawn recounts in the spring do not iilways present a true picture ofhow many animals are being lost each winter.
Perhaps the best way of determining population trends and year by year production is to do as the ranchers do. When more deer are seen on a range from one year to the next, and there seems to be more fawns showing up, then you know deer are doing well. If you are seeing fewer deer from year to year, and the fawn crop is not all that good, than you know deer are not doing well. The same can be said of coyotes and other predators When you began seeing a great many dead animals around that have been killed by one predator or another And when you are seeing and hearing coyotes on a regular basis, and you began noticing where deer are being killed by one predator or another, or you hear coyotes howling more often than usual. than you know you have a problem. It's not a perfect way of monitoring trends in wildlife, hut it works.
1989 - The fall, 1988 and spring:. 1989 mule deer surveys, which were conducted by NDOW, revealed a large over-winter fawn loss on the Sheldon. Deer went into the winter of 1988-89 in poor condition due to low forage quality which resUlted from the very dry summer. Relatively severe weather during January and Febmary was enough to cause a larger-than-normal fawn loss.
Coyote numbers remain high on Sheldon. They appeared to be especially numerous around Dufurrena
1990 - Production trends,. calculated from fall survey data, show a decline in deer over the past 30 years. On some sage grouse leks, numbers of males have declined to less than 50 %of past years.
The chick I hen ratio of 0.57 and the chick/adult ratio of 0.39 were low. The average brood size was 3 chicks I hen.
.1991 - In anticipation of the continuation of the drought which is persisting in this area, letters were sent to Refuge grazing permittees beginning in December, 1990 advising them to seek alternative areas to graze their cattle in 1991. A lawsuit was :filed by the
18
92 of 182
Cliff
Highlight
Cliff
Highlight

Wilderness Society, the Oregon Natural Desert Association, Inc., and the Sierra Club Legal Defense Fund to temporarily halt domestic Livestock grazing on Hart Mountain National Antelope Refuge. It was decided that the drought conditions existing on the Refuge and the implications of the Hart Mountain-lawsuit for the Sheldon NWR grazing program were sufficient reason for curtailing grazing on Sheldon for 1991.
Antelope prodUction was 13 :fawns/100 does, down from last year,s 48/100.
Sage grouse leks were surveyed between 21 ·March and 22 April. Five of 12leks surveyed were found active.
1992 - Antelope production was 38 fawns 1100 does~ up from last year's 13.
Of 154 deer counted, 48 where bucks, 96 were does and 10 were fawns.
Sage grouse chick/hen ratio averaged 13.
1993 - Extensive riparian evaluations were initiated in 1992 to obtain baseline data on all drainages, including intermittent areas. Three-quarters of the Refuge watersheds have been evaluated, a total of 108 miles. Preliminary results indicate that 64% and 45 % of low and moderate-high gradient streams, respectively, are in low resource condition.
The permit issued toR. C. Roberts was originally issued for two months however, due to problems associated with overuse, use was reduced by two weeks. Both R. C. Roberts and Harry Wrlson were required to provide range riders to keep cattle dispersed throughout the allotment and away :from riparian areas.
Note: This was the last year grazing permits were issued on the Sheldon National Wildlife Refoge.
Pronghorn production estimates for 1993 were 6 fawns/100 does.
After eight years of drought, the deer were in poor condition and the heavy winter snows resulted in poor winter survival. 13 fawns/100 does was slightly up from last year's 10 fawns/100 does.
There has been a steady decline mmule deer numbers in northwest Nevada since the late 1970's. In 1979, the northwest Nevada deer herd population estimate was 14,321 animals. The 1993 population estimate was 3,389.
Only 38 sage grouse consisting of9 mails, 10 females, and 19 chicks were counted.
19
93 of 182
Cliff
Highlight
Cliff
Highlight
Cliff
Highlight
Cliff
Highlight
Cliff
Highlight
Cliff
Highlight
Cliff
Highlight
Cliff
Highlight
Cliff
Highlight
Cliff
Highlight
Cliff
Highlight
Cliff
Highlight

1994- The Nevada Department of Wildlife :flew the post-season flight in September and counted only 15 pronghorn fawns per 100 does.
Of 464 deer counted, 82 were bucks~ 274 were does~ and 108 were fawns.
A total of92 sage grouse (53 hensand39 chiCks) was observed- 0.74 chicks per hen. Poor production on the Refuge was consistent with declines in sage grouse populations throughout the region.
Basin big sage in a tributary to Rodero Creek, a known pygmy rabbit use area was burned in fal11993. No evidence of use was found in the burned area immediately after the fire. However, monitoring will continue to determine the effects of :fire on pygmy rabbits.
1995- Prescribed Fire- The complex experienced a busy and productive bum season with 36 bum days in the field and 3,652 acres treated during 12 bums.
Note: The above two paragraphs indicate that personnel contirmed to pursue prescribed burning of sage areas even though it was indicated that such practices were destructive of pygmy rabbit (sensitive species) habitat
We are slowly making progress on the water rights issue on Sheldon NWR. Our plan is to file new water rights where none exist and to change existing water rights as needed to reflect a primary use for wildlife pmposes. Filing for water rights is expected to take several years. (Permittees owned the water rights before their use was eliminated).
Note: I could not have said it better myself. We ranchers came to the conclusion years ago, one of the main reasons grazing was being eliminated on public lands was to make way for governmental filings. Its been interesting to note, in cases when permittees were earful not to object to the government's claim of their water, agency personnel have chosen to allow the permittee to run, at least a portion of their original allotted use, whereas on the other hand, whenever permittees have objected to the agencies filing on their water rights, their permits were canceled entirely.
Because of extremely poor pronghorn production recorded on Hart Moun• Refuge staff conducted a pronghorn survey in July. A total of763 pronghorn were counted and only 4 were fawns. (0.5 fawns/1 00 adults). Pronghorn production on the Refuge was the lowest recorded in 40 years. Fawn/doe ratios the past 5 years {1991-1995) averaged 15, which is far below maintenance levels (25 fawns/1 OOdoes). Pronghorn populations have decreased approximately 30 % since 1990.
Predator survey data from Hart Mountain indicate an increased trend in coyote observations.
20
94 of 182
Cliff
Highlight
Cliff
Highlight
Cliff
Highlight
Cliff
Highlight
Cliff
Highlight
Cliff
Highlight
Cliff
Highlight
Cliff
Highlight

Spring deer surveys were conducted by NDOW in February of 1995. The survey showed a significant over-winter loss of fawns on the refuge. Fawns/100 adults dropped from 30/100 in the fall to 9/100 in the spring iridicating a 70% mortality of fawns.
A spring helicopter census of all known leks on the refuge was conducted by NDOW. A total of 302 males were observed- down 139 birds from that which were counted in 1994.
A survey of pygmy rabbits was conducted in the Swan Lake prescribed burn unit in June prior to burning. Several recently active burrows were located. No pygmy rabbits were seen during the survey. The area has not been resurveyed since the prescribed burn.
1996 - NDOW flew the post-season pronghorn survey in September and reported 11 fawns/1 00 does.
The reasons for the extremely poor production are not fully known.
1997 - no record.
1998 - NDOW flew the post-season pronghorn survey in September and reported 14 fawns/1 00 does. The spring pronghorn population estimate for 1998 was 632 animals. This is a low estimate because 760 adults were classified during the summer survey. The population has decreased dramatically compared to the 1991 estimate of2109 animals.
The 1.1 chicks/hen was close to that required for population maintenance.
No cattle grazing permits have been issued since 1994 when all permits were purchased and retired.
1999 - Mule deer composition survey was completed by NDOW in November. A total of 330 deer were classified with 69 bucks, 141 does, and 120 fawns. The fawn ratio was 15 higher this year than last year, which was the highest since 1979. Fawn ratios almost doubled the 10 year average. Deer numbers are increasing on the Refuge but remain 40 t() 50% below the highs of the 1980's.
21 95 of 182
Cliff
Highlight
Cliff
Highlight
Cliff
Highlight
Cliff
Highlight
Cliff
Highlight
Cliff
Highlight
Cliff
Highlight

A helicopter census of sage grouse leks on the refuge was conducted by NDOW in April. Three hundred ninety-one males were counted, which is up from 290 males observed during the 1989 census. This is the 3rd year numbers of male sage grouse have increased.
2000- NDOW reported counting 37 pronghorn fawn per 100 does- the population is . . mcreasmg.
The fall mule deer composition survey was completed by NDOW in November. A total of383 deer were classified with 91 bucks, 186 does, and 106 fawns. Reproduction continues to be good, but dropped to the lowest level since 1995.
HART MOUNTAIN NATIONAL WILDLIFE REFUGE. 1938-2000
1940 and 41 - On Nov. 18, personnel noted 500 or so sage grouse flying up the meadows to water in evenings. On Dec. 29, there were 49 cocks observed on the Blizzard Ridge strutting ground. There is an abundance of food and cover over a wide area for this species on the Refuge.
Estimates of deer on and adjacent to the refuge- 3,500 animals. 73 does and 75 fawns were observed. None ofthe range in the area covered by the survey showed any overutilization. The principal forage species were almost uniformly under-utilized except on small, localized areas were livestock and game were both using the range.
On June 12, 18 does were checked and 15 had twin fawns. During the week ending the 14th, 73 does and 74 fawns were observed.
Antelope are in excellent condition for the winter time. Even those taken for disease investigation were beautiful, plump carcasses. Approximately 1500 remaining outside the refuge to the south. The 1939 count disclosed 1903 antelope on the refuge.
The most conspicuous observation is the absence of coyotes on and adjacent to the Refuge. They failed to show up during July as they did in the past, which we attribute to the .control operations which have included very efficient den hunting. On May 12 we did observe where a coyote had buried two sage grouse eggs.
22 96 of 182
Cliff
Highlight
Cliff
Highlight
Cliff
Highlight
Cliff
Highlight
Cliff
Highlight
Cliff
Highlight
Cliff
Highlight
Cliff
Highlight
Cliff
Highlight
Cliff
Highlight
Cliff
Highlight
Cliff
Highlight
Cliff
Highlight
Cliff
Highlight
Cliff
Highlight

376 coyotes and 12 bobcats were taken on or immediately adjacent to the Refuge. Of these, 41 coyotes were taken by Refuge personnel, and the reminder were taken by the Government hunter operating under the District Agent.
In 1936 before the refuge became a fact, there were 4 bands of sheep numbering some 5,000 head were grazed on the range during the entire year. Four to five hundred head of cattle were kept year long also, while two or three bands of sheep (1,200 to 1,600 per band) were grazed a part of the year, and cattle estimated, totaling nearly 1,000 head were grazed though the main part ofthe spring-summer-fall season.
In 1939, 10,341 sheep months and 2805 cow months of use was taken.
Note: The information presented here is significant All the claims made by those working for government for all these years, claiming that livestock grazing was destructive of rangelands and wildlifo, when in fact, the rangelands of the west were made more productive and beneficial for wildlifo via the running of vast numbers of sheep and cattle. Its been a fraud, perpetrated for the reasons of creating and enhancing governmental industry. From the time of the creation of the first national parks and forest reserves until now- the number one objective of those choosing to work for government, is agency creation and preservation. All the propaganda and rhetoric claiming harm and destruction is just that, its propaganda perpetrated for the purpose of justifYing governmental presence, control, and management.
Mountain Sheep
A mountain sheep restocking project, in which 23 of these animals, 13 ewes, 3 lambs, and 7 rams, form the Montana National Bison Range, were liberated on the refuge.
Poor condition of several of the animals released had not been anticipated. - experience with a pneumonia like disorder, and coughing which at times was very prevalent- Range Rider Jacobs spent most of his time on the Mt. Sheep project since their release.
Found two ewes and ram down on grease wood flat. They were feeding on grease wood, dry thistle and some salt brush leaves that had gathered near the roots of the brush. All three were coughing some - in fair condition.
On Jan. 11, Jacobs found two ewes and one ram down on the flat in the grease wood, They were feeding on the grease wood. Drove them back to the hillside and went to camp for some hay, but when he came back they were down feeding on the grease wood again. Jacobs put the hay out and drove the sheep to it, they paid no attention to the hay and went back to feeding on the grease wood.
By the end of January, they were not going to the grease wood but working higher, feeding mostly on green grass and not coughing so much.
23 97 of 182
Cliff
Highlight

On Feb. 6. Jacobs observed green cheat grass from 2 to 4 inches high- species of bunch grass from 4 to 6 inches high.
While looking for sheep in the head of canyon, just north of DeGarmo, Feb. 21, Jacobs noticed deer feeding on blue bunch wheat grass, the dry grass was about 8 to 10 inches tall, mixed with short green grass, the deer would paw the grass until nearly all the dry was broken off, then feed on the short green grass". Deer have the green grass up in the · canyon fairly well grazed.
March 15, Jacobs located 3 ewes and ram feeding on cheat grass. -continued to record their feeding on cheat grass for some time- improvement in their condition was notedalso that they seemed to be contented.
March 18, counted 1 OS deer in McKee and Schuster fields, deer are feeding on green cheat grass.
April 8, counted 74 deer feeding on green cheat grass.
The general forage condition over the entire Refuge where game animals used was excellent.
1942 - Blizzard like snow storm from the north, Apri127 and 28, that covered the refuge with a heavy blanket of wet snow, certain to have destroyed many sage grouse nests. The wind driven snow packed in every nook and spot - then as the snow melted it flooded the surface of the ground - several hens were observed in maneuvers indicating they were searching for nests.
No records for 1943 through 1952.
1953- deer are in excellent shape- hunters quartered their deer in the field, several of the quartered animals weighed over 200 lbs. One hog dressed deer with a 35 inch antler spread weighted 220 lbs.
There was one bighorn ewe seen regularly with the Keily cattle during March and April, even climbing on top of hay stacks, and on Apri120 going north with the cattle driven to the Grazing Service range, but returning the next day. She is a young ewe in excellent condition all of the time.
Coyotes were never observed to be present in numbers or to be destructive to valuable . species during this period. This is a result of the District Agents control operations.
24 98 of 182
Cliff
Highlight
Cliff
Highlight
Cliff
Highlight
Cliff
Highlight
Cliff
Highlight

1954- Strutting grounds were observed along Blizzard Ridge east of headquarters. The action is always worth the trouble of getting up at 4:00 a m. From 10 to 60 cocks were usually in sight at one time. Several nests locate<L containing from 4 to 10 eggs. Nest destroyed by badgers are found occasionally, crows are also suspected.
From all indications, the refuge will have a bumper crop of deer this year- the deer are in fine condition.
Coyotes present in small number, no sight records for the period.
Jac~ cottontail, and pygmy rabbits, showing an increase during the period.
The major Sage Grouse study on the refuge was undertaken by a graduate student of the Oregon Wildlife Research Unit- a total of six hundred eighty females and chicks were observed- average brood count was 5.15 chicks per hen- percentage of hens with chicks 60.5 -percentage of hens without chicks was 39.5.
Mr. M.L. Ricks, Government hunter, has been working on the refuge since July and has taken a goodly number of coyotes and bobcats.
1955 - Wildcats and coyotes are very numerous. Eight hundred dollars was provided this year, from refuge funds to hire a trapper. The money was turned over to Peditor and Rodent Control agents who are using it to pay the regular trapper in this district He is already overloaded with territory so it would appear we are pouring our money down a rat hole.
Sage grouse population is down somewhat from last year at this time, due no doubt to the very poor nesting success last spring.
The antelope population has taken an alarming decrease. We have a serious disease called 30-06itis in the area between Hart Mountain and Sheldon. If my memory serves me only twelve percent of the does had kids last year.
Note - Apparently they believe that too many deer being harvested by hunters. 30-06 rifles were the most favored rifles used at that time.
Coyotes are definitely on the increase and we have received numerous reports, or rather complaints from our permittees.
25 99 of 182
Cliff
Highlight
Cliff
Highlight
Cliff
Highlight
Cliff
Highlight
Cliff
Highlight
Cliff
Highlight
Cliff
Highlight
Cliff
Highlight
Cliff
Highlight
Cliff
Highlight
Cliff
Highlight
Cliff
Highlight
Cliff
Highlight
Cliff
Highlight
Cliff
Highlight
Cliff
Highlight
Cliff
Highlight
Cliff
Highlight
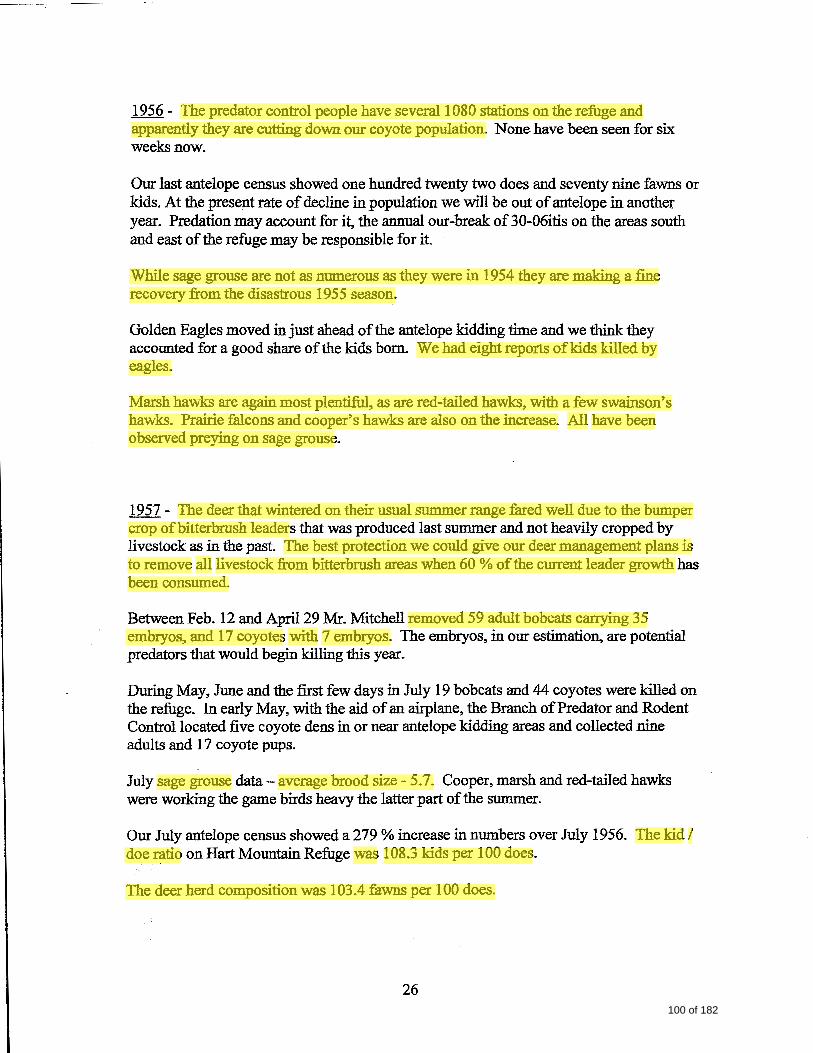
1956 - The predator control people have several I 080 stations on the refuge and apparently they are cutting down our coyote population. None have been seen for six weeks now.
Our last antelope census showed one hundred twenty two does and seventy nine fawns or kids. At the present rate of decline in population we will be out of antelope in another year. Predation may account for it, the annual our-break of30-06itis on the areas south and east of the refuge may be responsible for it
While sage grouse are not as numerous as they were in 1954 they are making a fine recovery from the disastrous 1955 season.
Golden Eagles moved in just ahead of the antelope kidding time and we think they accounted for a good share of the kids born. We had eight reports ofkids killed by eagles.
Marsh hawks are again most plentiful, as are red-tailed hawks, with a few swainson's hawks. Prairie falcons and cooper's hawks are also on the increase. All have been observed preying on sage grouse.
1957 - The deer that wintered on their usual summer range fared well due to the bumper crop ofbitterbrush leaders that was produced last summer and not heavily cropped by livestock as in the past. The best protection we could give our deer management plans is to remove all livestock from bitterbrush areas when 60 % of the current leader growth has been consumed.
Between Feb. 12 and April29 Mr. Mitchell removed 59 adult bobcats carrying 35 embryos, and 17 coyotes with 7 embryos. The embryos, in our estimation, are potential predators that would begin killing this year.
During May, June and the first few days in July 19 bobcats and 44 coyotes were killed on the refuge. In early May, with the aid of an airplane, the Branch of Predator and Rodent Control located five coyote dens in or near antelope kidding areas and collected nine adults and 17 coyote pups.
July sage grouse data- average brood size - 5. 7. Cooper, marsh and red-tailed hawks were working the game birds heavy the latter part of the summer.
Our July antelope census showed a 279 % increase in numbers over July 1956. The kid I doe ratio on Hart Mountain Refuge was 108.3 kids per 100 does.
The deer herd composition was 103.4 fawns per 100 does.
26 100 of 182
Cliff
Highlight
Cliff
Highlight
Cliff
Highlight
Cliff
Highlight
Cliff
Highlight
Cliff
Highlight
Cliff
Highlight
Cliff
Highlight
Cliff
Highlight
Cliff
Highlight
Cliff
Highlight
Cliff
Highlight
Cliff
Highlight
Cliff
Highlight
Cliff
Highlight
Cliff
Highlight

There has been no change in the number of cattle grazing the refuge this year from last year. Mr. Flynn, Warner Valley sheepmen, grazed 1 ,200 sheep on the top ofthe mountain.
1958 - With the first good hatching and survival year for this species in several years, the sage grouse population took a decided upswing. July brood counts showed 5.7 chicks per brood. The fall flight of hawks, primarily red tailed and marsh hawk, put additional winged predators in the area and a noticeable amount of predation occurred. Hawks were observed to harass and knock down flying grouse and several fresh grouse remains were found.
Twelve grouse were found during the month of August; seven kills from winged predation.
Antelope came through another year in good condition. July census revealed a kid : doe ratio of 111 kids to 100 does.
Coyote and bobcat populations are high in spite of constant control through trapping, poisoning, and the use of coyote getters. 1080 stations were again activated late in the period.
Bitterbrush condition improved over that of 1955 when the Barnhardy area experienced 100 % utilization on new leader growth by the end of August and Indian Springs had 80 % utilization.
1959- Due to bad weather during the early brood period, most of the sage grouse broods were small this year. Of the total hens observed on the refuge, 83.5% were without chicks. This high percentage of hens without chicks is attributed largely to inclimate weather during the early brood period.
Sage grouse mortalities, though few carcasses have been found, appear to be high. One brood near headquarters was believed to have dropped from five chicks to two during the month of July.
The July, 1959 aerial census on Hart Mountain Refuge and adjacent areas revealed a population of772 antelope; an increase of 169 animals over the July, 1958 figure. Kid survival is lower this year, however, with 78.4 kids per 100 does as compared to 111.3 kids per 100 does in 1958.
Predators, while not overly abundant on the refuge, are increasing moderately.
27 101 of 182
Cliff
Highlight
Cliff
Highlight
Cliff
Highlight
Cliff
Highlight
Cliff
Highlight
Cliff
Highlight
Cliff
Highlight
Cliff
Highlight
Cliff
Highlight
Cliff
Highlight
Cliff
Highlight
Cliff
Highlight
Cliff
Highlight
Cliff
Highlight
Cliff
Highlight
Cliff
Highlight
Cliff
Highlight
Cliff
Highlight
Cliff
Highlight
Cliff
Highlight
Cliff
Highlight
Cliff
Highlight
Cliff
Highlight

1960- Predation on sage grouse continued into this period, primarily from migrating hawks, owls and eagles.
All during the summer and up until the middle of October the headquarter area supported a large number of sage grouse. It was common for the Refuge Manager to count several dozen feeding on Quarters No. 1 lawn every morning.
1961 - For the third straight year our sage grouse brood counts indicated a drastic loss of chicks during the hatching period and shortly afterwards. Prolonged storms were the major factor in this loss, and although some hens renested and came off with chicks in June and early July, the damage was done, and we ended up with over 50 % of our hens with no broods during the June counts.
The predator and Rodent Control Branch appears to have coyotes well under control on the refuge, although the general trend in coyote numbers the past two years has been upward. Most coyotes seen during this period have been juvenile animals.
1962 - In general, reproduction and survival of sage grouse was below the maintenance level of two chicks per hen in July. Three cases of predation were recorded. Two grouse were killed by hawks and one by a golden eagle. Hawks were busy working sage grouse areas throughout most of July and all of August.
Coyotes were well represented on the refuge this period, with 11 being seen by Trainee Frost. Bobcats are not so often seen but it is evident that we still have them in fair numbers.
1963- We finished out the year with a slight increase in grouse, due to the chick-perhen average of 3.15.
Range forage conditions this period were excellent.
1964 - Coyotes appear to be on the increases. During November and December coyotes could be heard in the evenings.
A total of 49 adult coyotes and 31 pups, plus one bobcat, were obtained; and 15 dens located. Eleven coyotes and the bobcat were examined for food habits. Two coyotes
. contained sage grouse.
28 102 of 182
Cliff
Highlight
Cliff
Highlight
Cliff
Highlight
Cliff
Highlight
Cliff
Highlight
Cliff
Highlight
Cliff
Highlight
Cliff
Highlight
Cliff
Highlight
Cliff
Highlight
Cliff
Highlight
Cliff
Highlight
Cliff
Highlight

Forage conditions over most of the refuge show considerable improvement over the past several years.
1965- Sage grouse production and chick survival received another setback this year, with high losses during heavy June rains.
Coyotes are still on a slow increase. A total of 20 adult coyotes, 17 pups, and two bobcats were obtained.
Range forage conditions were again above average.
1966 - In 1966 we made some changes in our approach to predator control. This new approach was adopted to more closely conform with Bureau policies. The major change was the elimination of 1080, traps and getters, unless a specific problem arises.
Cottontails and pigmy rabbits are frequently seen in the big sage areas and on the west slopes of the mountain.
1967 - There were two known cases of grouse predation noted during the year, one by a golden eagle and the other by a marsh hawk. Brood sizes averaged 4.5.
Antelope production was fair with 41 kids per 100 does.
Mule deer production was low - concern is being voiced by sportsmen and others.
Coyote control efforts were confined to 35 hours of aerial gunning.
For the first time since the refuge was established two units received complete or partial deferment.
1968 - The combined antelope count for both the Hart Mountain and Sheldon Biological Units was 955 animals, a decline of23 percent from last year, and the lowest count in the past 10 years.
The mule deer population is estimated at about 350 animals.
Coyotes were more evident than usual this year.
29 103 of 182
Cliff
Highlight
Cliff
Highlight
Cliff
Highlight
Cliff
Highlight
Cliff
Highlight
Cliff
Highlight
Cliff
Highlight
Cliff
Highlight
Cliff
Highlight
Cliff
Highlight
Cliff
Highlight
Cliff
Highlight
Cliff
Highlight
Cliff
Highlight

1969 - Some signs of deer mortality were reported by bighorn sheep and deer hunters. The said they found the remains of at least a dozen bucks along the west encampment.
Coyotes were sighted almost every day during refuge travels. They are quite abundant, their evening serenades attesting to the fact.
1970- Brood counts showed average brood size to be 4.6 compared to 3. 7 from our limited count for 1969.
Rangeland on Hart Mountain was in good condition during 1970, with cattle doing well.
1971 - Sage grouse counts yielded averages of2.1 chicks per brood and 0.9 chicks per hen.
The antelope kid ratio was 20 kids per 100 does. This was the poorest ratio obtained since intensive surveys were began in 1954.
1972- Sage grouse brood counts averaged 3.3. Average number of chicks per hen, 2.3.
Antelope kid ratios was 43 kids per 100 does- a 100 percent increase from last year.
1973 - no record.
1974 - no record.
1975 - Average sage grouse brood size was 3.2.
An August pronghorn survey was conducted. The data indicated it was a poor production year for pronghorn.
1976 - A mu1e deer census was conducted in April. There were 49 yearlings per 100 does.
30 104 of 182
Cliff
Highlight
Cliff
Highlight
Cliff
Highlight
Cliff
Highlight
Cliff
Highlight
Cliff
Highlight
Cliff
Highlight
Cliff
Highlight
Cliff
Highlight
Cliff
Highlight
Cliff
Highlight

1977 - July brood counts indicate an average brood size, 4.2.
1978 - Coyotes were again abundant.
Sage grouse brood counts were conducted in June and July. The results show a marked decline in production and/or survival of chicks. Only seven out of twenty-nine hens observed were with broods.
Pronghorn production was down again this year with a ratio of 17 kids per 100 does.
1979 - Deer herd composition was 51 fawns per 100 does.
Eleven out of25 sage grouse hens were with broods. The ayerage brood size was 3.6 chicks.
1980 - Antelope kid to doe ratio was 13.3 to 100 does.
Mule deer composition was 51 fawn for every 100 adults.
No sage grouse brood counts were conducted.
1981- Five sage grouse broods were located containing only 2-3 chicks. Eight females were seen in July that did not have chicks.
The antelope kid to doe ratio was 28.9 kids for every 100 does.
1982 - Range conditions were excellent.
The kid to doe ratio was 201100.
Severity of the 1982-83 winter and cool-wet spring hurt sage grouse, valley quail and chukars. Brood counts on all these species were down by 35 percent. Sage grouse chicks per hen was .7 chicks.
31 105 of 182
Cliff
Highlight
Cliff
Highlight
Cliff
Highlight
Cliff
Highlight
Cliff
Highlight
Cliff
Highlight
Cliff
Highlight
Cliff
Highlight
Cliff
Highlight
Cliff
Highlight
Cliff
Highlight
Cliff
Highlight
Cliff
Highlight
Cliff
Highlight
Cliff
Highlight
Cliff
Highlight

1983 - Pronghorn kid to doe ratio was 23 kids for every 100 does on the Refuge and 28 kids for every 100 does off the Refuge.
Spring helicopter survey indicated a 36 % over winter fawn loss in Refuge deer. The area surrounding the Refuge in Lake and Harney counties showed a 60+ % fawn loss.
Sage grouse production in southeast Oregon and northern Nevada have been on a long downward trend. It has reached the point that land managing agencies in this geographic area have become critically concerned.
If the trends continue to fall, we will probably see sage grouse become a listed, sensitive, if not endangered species.
1984 - Pronghorn Antelope doe to kid ratio was 100 to 34 on the refuge. Kid production was higher on units south of the refuge at 48 fawn per 100 does.
Mule deer counts on April 7 showed 64 yearlings per 100 does. This was a 22 %winter loss from last fall's fawn crop of 96 fawns per 100 does.
1985 - By the end of July, it became apparent Hart Mountain pronghorn population was lower than the latest five-year average.
Although many twins and even triplets were observed this year, the fall fawn ratio was below normal, at 45 fawns per 100 does. The wildfire in the intermediate Hills burned about 2500 acre of bitterbrush in late August. By October the I 50+ deer using this area were in poor condition with their ribs showing. Coyotes were taking the fawns and weaker adults.
1986 - Due to the mild spring, sage grouse had good clutches of five or more chicks in May. However, by summer many hens that had good clutches were seen with 0-2 chicks. Chick mortality from predation appears to have been great this year.
There were 0.55 chicks per hen for all the hens seen ... not a very productive year.
32
106 of 182
Cliff
Highlight
Cliff
Highlight
Cliff
Highlight
Cliff
Highlight
Cliff
Highlight
Cliff
Highlight
Cliff
Highlight
Cliff
Highlight
Cliff
Highlight
Cliff
Highlight
Cliff
Highlight
Cliff
Highlight

1987- Pronghorn recruitment on the Refuge was 6% greater than recruitment south of the Refuge prior to 1968. Conversely, after 1968, recruitment averaged 26 % greater south of the Refuge. The last year coyotes were dehoerately controlled on the Refuge was 1968.
Sage grouse size decreased 3 percent from last year and recruitment {chick per hen) declined 17 percent.
1988 - Refuge's 51 kids per 100 pronghorn does is well above the long-term average.
Before August, or September, it was difficult to confidently tell visitors where to view deer. Fawns per 100 adults dropped by 79 % and was 42 points below the long-term average of 54 fawns per 100 does. Drought and or predation could be responsible.
Sage grouse productivity declined for a third year.
1989 - Grazing- There were thirty fenced units on which a deferred rotation grazing system is typically used. The average stocking rate for Hart is 17 acres per au.m., compared to averages of 8 acres per au.m. on BLM and USFS lands in Lake County.
Riparian zones and meadows determined when cattle needed to be moved and made it difficult to stay in a unit full term. In most cases the creeks and meadows had reached allowable use {50 %) in two weeks.
Our major permittee retired this year, vacating 40% of the refuge's a.u.m's.
The 1988 mule deer fawn crop was a failure, showing only 14 fawns per 100 adults in the fall and 8 fawn or yearlings in spring.
32 % of female sage grouse hatched and reared broods to flight stage, average brood size was 3.05.
1990- Cattle were removed from a unit when stubble height reached 4" along waterways on bank breakage was occurring. . .. there was an overall reduction of 58% to a total of 3044 au.m.s.
Sage grouse females were surveyed from June 15 to July 8. Chicks per hens was 0.45. _17% of female sage grouse hatched and reared broods to flight stage, chicks per brood was2.69.
33 107 of 182
Cliff
Highlight
Cliff
Highlight
Cliff
Highlight
Cliff
Highlight
Cliff
Highlight
Cliff
Highlight
Cliff
Highlight
Cliff
Highlight
Cliff
Highlight
Cliff
Highlight
Cliff
Highlight
Cliff
Highlight
Cliff
Highlight

1991 - Pronghorn productivity was below average on the Refuge (18 fawns per 100 does).
A post hunt ground survey was conducted. A total of 261 deer was counted including 48 bucks, 172 does, and 41 fawns. A survey of spring herd composition was conducted via helicopter. A total of277 deer was counted including 242 adults and 35 fawns. The 14 fawns per 100 does ratio compares to the fall count of 19 fawns per 100 does for a 26 % over winter loss of fawns.
Sage grouse chick per hen ratio was 0.26 at Hart Mountain in 1991, 88 % below the long term average of2.1 0 chicks per hen. Surveys conducted by the Oregon Department of Fish and Wildlife also showed below average productivity in Lake County at 0.38 chicks per 100 hens and Harney County at 0.29 chicks per 100 hens.
1992 - The spring mule deer censes revealed, 14 fawns per 100 adults - compared to the fall count of 19 fawns per 100 adults, indicating a 25 % over winter loss of fawns.
Sage Grouse - Lek census results indicated that male attendance declined 31 % at five leks between 1992 and 1987-91. The decline probably is related to the low productivity rates of0.45 and 0.26 chicks per 100 hens obser\red in 1990 and 1991.
Surveys conducted by ODFW also showed below average productivity in Lake County at 0.38 chicks per 100 hens and Harney County at 0.29 chicks per 100 hens in 1992.
1993 - Pronghorn herd composition ratios were 14 fawns per 100 does. The 1993 fawn to doe ration was 53 % less than the 1988-92 average of 30 fawns per 100 does, and 61 % less than the 1955-92 average of36 fawns per 100 does.
The March 1994 mule deer survey included a sample of 155 deer, with a ratio of 31 fawns per 100 adults, and a 100 % over winter survival of fawns. ODFW reported a ratio of 16 fawns per 100 adults, and a 42 % over winter survival rate for fawns on deer ranges south of the Refuge.
1994- No livestock grazing occurred in spring pending completion of the Comprehensive Management Plan. Approval of the plan in August 1994 resulted in
_cessation of livestock grazing for 15 years.
34 108 of 182
Cliff
Highlight
Cliff
Highlight
Cliff
Highlight
Cliff
Highlight
Cliff
Highlight
Cliff
Highlight
Cliff
Highlight

The Refuge fire crew participated in numerous wildfire assignments, both locally as well as in the southwest during the season. The crew responded to fires on neighboring BLM and USFS Lands.
Note: You would think that persons responsible for managing federal lands and resources would pay attention to their own data. Obviously, when livestock are removed from the lands, fire foels increase, and the incident of wildfire, destructive to wildlife and wildlife habitat increases. Many years have come and gone since the USFS, BLM, NDOW, and USFWS began their campaign to eliminate livestock grazing on public lands- Yet personnel working within these agencies continue to ignore the fact that it is their own policy of livestock removal that has led to the destruction of millions and millions of animals and their habitat- what asinine ignorance -what arrogance.
Pronghorn herd composition ratios were 22 fawns per 100 does. The 1994 fawn to doe ratio was 15% less than the 1989-93 average, and 31% less than the 1974-93 average .
. . . compared with BLM land south of the Hart Refuge, fawn ratios were lower on the Refuge, which is a consistent trend.
We drove vehicles and rode horses for a total of256 miles ofbrood survey routes. 164 birds were seen. A ratio of 0.42 chicks per hen, was 44 %lower than the 5-year average of 0.73, and 77 percent lower than the 30-year average of 1.83.
Note: Think of it, during the first years following federal acquisition of the area, Refuge personnel were counting as many as 500 sage grouse flying past Refuge headquarters each morning on their way to feed on adjacent meadows. Now, in the same area, after discontinuing predator control and all livestock grazing practicesJ they are driving 250 mile lookingfor sage grouse and they only find 164 birds. My Gosh, how ignorant can these people be, blaming reductions of sage grouse on private sector activities, when they themselves have caused the problems we now face.
1995 - Pronghorn Fawn to doe ration was less than 0.8 fawns per doe. This is below both the short term 1990-94 average of25 fawns per 100 does, and the long term 1955-94 average of 40 fawns per 100 does.
The results of the July survey were very disappointing. At less than one fawn per 100 does, reproduction was virtually non-existent. The ODFW found reproduction was similar off the Refuge.
One hundred and three deer were recorded, 82 adults and 21 fawns. Over winter mortality was 35 %. On the south end of the Refuge, 58 deer were found, 15 fawns and 43 adults. We had a hard time :finding deer.
35 109 of 182
Cliff
Highlight
Cliff
Highlight
Cliff
Highlight
Cliff
Highlight
Cliff
Highlight
Cliff
Highlight
Cliff
Highlight
Cliff
Highlight
Cliff
Highlight
Cliff
Highlight
Cliff
Highlight

Sage grouse surveys indicate that the population on the Refuge has declined considerably since 1990. A total of 80 sage grouse were observed. The percentage of hens with broods was 2.9 %. It is hoped that the sage grouse are at the bottom of their downward trend.
1996 - One hundred and seven deer were recorded, the fawn ration was 8 fawns per 100 adults. ..an over winter mortality of 65 % was calculated.
Sage grouse leks were surveyed between 22 April and 1 May. Four horseback routes were not surveyed due to being understaffed. Only 3 sage grouse (2 chicks and 1 hen) were observed on the brood surveys.
1997 - Pronghorn production at 31 fawns per 100 does- was above last years 17 fawns per 100 does.
Mule deer ratios (by two counts)were 62 fawns for 100 does and 47 fawns per 100 does.
Rooster attendance at leks increased 98 %form the 1996 surveys at the traditional leks surveyed. Attendance was 17% below the short term average of 1992-1996.
1998 - Pronghorn fawn to doe ratio was 12 fawn for every 100 does.
Mule deer rations were 70 fawns per 100 does
1999 - The pronghorn fawn to doe ratio of 38 fawn per 100 does was above last years 12 fawn per 100 does. This was the best fawn recruitment year since 1992.
The mule deer fawn to doe ratio was 74 fawn per 100 does.
Pooled sage grouse data for four leks indicate that the trend for sage grouse remains down with attendance 44 %below the long term average. The fact that Rattlesnake lek had no roosters this year, and Hilltop lek had a bleak number of 4 roosters is troublesome.
2000- The pronghorn fawn to doe ratio of 40 per 100 does was above last years 38 fawn p~r 100 does.
36 110 of 182
Cliff
Highlight
Cliff
Highlight
Cliff
Highlight
Cliff
Highlight
Cliff
Highlight
Cliff
Highlight
Cliff
Highlight
Cliff
Highlight
Cliff
Highlight
Cliff
Highlight

Considering the fawn to doe ratios of recent years, the deer herd on Hart Mountain NAR would appear to be on an upward trend, but have yet to see a noticeable increase in the overall population.
For the third consecutive year, rooster attendance was almost static at the 4 traditional leks surveyed.
Conclusion: Jf habitat fragmentation, roads, power lines, fence lines or overgrazing are problematic for wildlife, then why is it that sage grouse, deer and pronghorn began their decline sooner on Refuge Lands than elsewhere? Truth is, a person can travel, here, there and everywhere, throughout the Great Basin, whether it be in the most isolated valleys or well developed areas- whether there are many roads and power lines and fences or non at all - whether there is a great amount of cheat grass in evidence, or non at all, few sage grouse will be seen.
What has made a difference however, is whether or not there has been effective predator control practices implemented recently within given areas. Predator control is the greatest factor efficting sage grouse production.
The second most important factor effecting sage grouse is livestock grazing. Sage grouse abundance as it was experienced in the late 1800's and early 1900's was a product of predator control and grazing impact.
There are very few sheep outfits left in Great Basin any longer. Most went out of business in the 1970 and 80's. A few have hung on however, despite ever increasing agency interference. And so, coyotes and ravens are controlled at least to some degree in the areas where sheep are run. And it helps. Ask any person that gets around the country and they will tell you. Jf you want to find good deer hunting go to where sheep are grazed during the summer months. A similar thing can be said about sage grouse. Jf you want to find sage grouse, go to where sheep are run in winter and in summer.
The worst thing that has happened for sage grouse was the coming of intense agency management. The campaign by agency officials to reduce and eliminate predator control and livestock grazing on public lands during the last fifty years cannot be ignored
Jf we are to restore sage grouse productivity to its former status we must reinstate the kinds of practices and incentives that were in place early in the history of western rangeland management. Then and only then will we see sage grouse flourish again.
37 111 of 182

Finding# 1
RURAL HARITAGE PRESERVATION PROJECT Finding of Facts
Historical, Scientific and Economic Analysis
History of fire in the Great Basin
( 8)
The first trappers and explorers to enter the west saw many burned over areas on the Snake Plains and throughout the Mid West, but not in the Great Basin. Apparently, even though the Indians of the Great Basin did bum from time to time for various reasons, the practice must have been rare indeed, for hardly anyone traveling through the Great Basin mentioned seeing burned over areas during the period, 1825 through 1900. Most wrote of traveling through valleys filled with artemisia, wormwood or creosote brush.
Many wrote of the difficulty they were having in places, making it through heavy brush, up to three inches in diameter. Yet no one ever mentioned coming to areas where travel was made easier because the brush had been burned away. Nor was there mention that the travelers had reached an area where there was an abundance of feed because of past fires. The most abundant animals found at that time were rabbits. And its no wonder, jack rabbits, pigmy rabbits and cottontail do well when a country is covered with large mature sage brush, greasewood, or rabbit brush, or a combination of all three. Jack rabbits, cottontail, and pigmy rabbits cannot survive in areas where sagebrush has been removed.
It's no wonder the Indians were not burning a lot back at that time. Rabbits were an important food source for them. Burning would only eliminate the rabbit's habitat, which in tum would eliminate the rabbits themselves. The Indians knew this. (Pioneering the West, by the Egan Family, p. 3 6) Keep in mind, the harvest of rabbits was far more important to the Indians at that time than was the harvest of bighorn, antelope or deer, simply because there were not a lot of bighorn, deer, or antelope around.
So why than, were there so few fires when it was recorded that there was a good deal of brush throughout the country? Just because there was a lot of brush in the country at that time does not mean that there was a lot of grass under or between the brush, or that the brush was as healthy or as thick as it may have been at a later date. When there is not a lot of grass. growing between and under the sage brush to help carry the fire, and a lot of the brush is half dead and not doing well, it makes it difficult for a fire to spread.
Allen Savory, Steve Rich And the Testimony of Jedediah Smith
As has been shown by Allen Savory and Steve Rich, when desert plants are not impacted by grazing on a regular basis, they often become unproductive and wolfy, to such a degree they often die. (See Document 21-c.), Plant frequency, plant health and plant vigor improve when plants are regularly impacted by large numbers of ungulates. (See testimony of Loyd Sorensen, Document 3-a., p 7. See also, Kipuka Study Sites, 50-a.).
1
112 of 182

Most historians believe Jedediah Smith was the first white man to cross through the Great Basin to the coast of California. In 1826 with 14 men and 28 horses, Smith left Cache Valley (Utah) traveling south. He passed through the tip of today's Nevada, then followed the Majove River into southern California. Jedediah had agreed to meet his two trapping partners, David Jackson and William Sublette, the following June for a rendezvous in Cache Valley. So in June of 1827, Jedediah took two of his best men and set out up the American River of the Sierra Nevada's and across central Nevada to keep his commitment. Later, in a letter to William Clark, Smith described the trip:
After traveling 22 days from the east side of Mount Joseph (Sierra Nevada's), I struck the southwest comer of the Great Salt Lake, traveling over a country completely barren and destitute of game. We frequently traveled without water, sometimes for two days, over sandy deserts where there was no sign of vegetation and when we found water in some of the rocky hills we most generally found Indians who appeared the most miserable of the human race When we arrived at the Salt Lake, we had but one horse and one mu1e remaining, which were so feeble and poor that they cou1d scarcely carry the little camp equipage which I had along. The balance of my horses I was compelled to eat. (See Document, 1-a.)
Most historians believe that Smith and his men came out of the mountains just south of Walker Lake, and very likely crossed through Nevada very near where the towns of Manhattan, Belmont and Current are now located- which areas, during the early 1900's have supported thousands of cattle and sheep
If Jedediah Smith's testimony regarding vegetative condition found within the Great Basin in the early 1800's is correct, then one must conclude that the findings of Allen Savory, Steve Rich, Loyd Sorensen and the Kipuka Study are correct, plant health and frequency is improved by grazing impact.
One must conclude as well, the reason that the earliest explorers and trappers were not seeing many burned over areas in the Great Basin in the mid 1800's was because of the lack of vegetative frequency.
Up until the 1970's, most fires (which typically were started by lightening) rarely burned more then an acre or two. Once in a while, when conditions were right, a fire wou1d get out of control and bum as much as one or two hundred acres, but nothing like the fires experienced in recent years. (See Document 52-a. and 52-f.)
The catastrophic fires that have been occurring since the late 1970's, which have resulted in the loss of millions of acres of wildlife habitat, correlate with federal and state policy which has called for reduced livestock grazing. (See Tony Lesperance Report, Document 52-h. See too Documents, 52-i., 52-j., 52-1., 52-b. and 43-d.)
Request No. 1, please send us a copy of all the documented evidence you may have indicating that our interpretation of the testimony given by the earliest explorers, trappers and
2
113 of 182

emigrants to enter the Great Basin is wrong regarding wildfire frequency during the period, 1825 through 1900.
Request No. 2. please send us a copy of all the documented evidence you may have indicating that our interpretation of the testimony of Jedediah Smith, Allen Savory, Steve Rich, Loyd Sorensen, and the Kipuka study regarding pre-settlement plant health and frequency is incorrect.
Request No. 3. please send us a copy of all the documented evidence you may have indicating that the imdings in the Lesperance Report (referenced above) are incorrect.
Finding#2 History of vegetative cover in northern Nevada
There are a number of authoritative accounts giving descriptions of vegetative cover which existed within the Great Basin during the later part of the 1880's and early 1900's. The King Expedition, which traveled across Great Basin during 1867, 68 and 69, included a plant biologist named Sereno Watson, who kept extensive notes describing the various plant species he encountered. Capt. James Simpson also thoroughly described the vegetative cover he saw when he crossed through the Great Basin in 1858 and 1859. (See Document 6-d., See too, Book 13-39, Report of Explorations across the Great Basin of the Territory of Utah For a Direct Wagon- Route From Camp Floyd To Genoa, In Carson Valley, in 1859, pp 29,30,31)
Less scientific, but important as well are the writings of Joe Meek, Zenos Leonard, Peter Skeen Ogden, Jedediah Smith and James Clyman, who gave good accounts of their experiences when crossing through the Great Basin. They wrote not only of vegetative conditions, but also of the kinds and numbers of wildlife they were encountering. Later there were accounts by Lieutenant E. G. Beckwith, Howard Egan and Edward Kern. Collectively, these writings tell oflittle feed, starving horses and no game. (See, I-a. and 5-b., see also Book 13-39, pp 29,30,31.)
Despite modem perceptions by some that the native rangelands ofNevada or elsewhere in the West were hurt or destroyed by the settlement of the region, the opposite seems to be true. The area that is now known as Nevada went from a place where the first explorers said the country could not support their horses while crossing through the Great Basin to an area that was feeding over a million sheep and over 500 thousand cattle in the early to mid 1900's. (See Document I -a., see too, Book 3-1, Northeast Nevada Frontier) In this regard too, one should read the book, "When And If It Rains" (Document II -a. or Book 26-1) which includes accounts of a good many of the early settlers of the West who testified that the rangelands improved dramatically once livestock were introduced. (See too, Document 21-c.)
Request No. 4, please send us a copy of all the documented evidence you may have indicating that our interpretation of the testimony of Sereno Watson, Capt, James Simpson, Joe Meek, Zenos Leanard, Peter Skeen Ogden, James Clayman, Lieutenant E.G. Beckwith, Howard Egan and Edward Kern regarding conditions in the Great Basin in the 1800's is incorrect.
3
114 of 182

Request No. 5, please send us a copy of all the documented evidence you may have indicating that the testimony within the book, "If and When it rains" indicating that the rangelands of western America were improved by the introduction of livestock is incorrect.
Finding#3 History of effects of livestock grazing in Nevada
There never has been the destruction of the range by livestock grazing as has been alleged by so many within the various resource management agencies, who's purpose it has been to gain a management position over the western public lands. (See documents 9-a. & 1 0-a.) There have been prolonged droughts at times of course, when it appeared that the range was deteriorating, but then when good years have come, it always seems that there is grass and feed everywhere. Desert plants are tremendously resilient, and the feed that will grow on the best years can be phenomenal. (See Document,ll-a.)
The Yager Journal
Perhaps, one of the more interesting aspects of early exploration and travel in the west accrued along the Humboldt River. The very earliest trappers and explorers to travel the Humboldt found feed exceedingly poor. Within a short period of time however, even though thousands and thousands of horses and cattle had been driven along the Humboldt corridor, all testimony indicates that feed conditions were improving rather than deteriorating as many now believe.
To give an idea of just how large many ofthe wagon trains were, in 1862, James Yager wrote, "at camp Weaver River our train was joined by eight or nine wagons & this morning we were joined by the train that camped by us last night fifteen wagons making in all about forty wagons & seventy men." Five days later Yeger wrote, "Petersons' train of thirty one wagons & (L)ouises of fifteen became connected at one time this morning, making a train of eighty nine wagons and a carriage." You would think, with all the thousands of cattle and horses and people traveling along the Humboldt during that time - with all the impacts of setting up camp, then repacking again - all the livestock coming and going and watering twice a day, plus all the feed that was being consumed, there would have been much talk of everything being eaten off and abused. But such was not the case. Y eger and others traveling along the Humboldt during the latter years of the migration to California, mentioned over and over, how good the grass was.
Interesting too, is that the immigrants that were passing through the Great Basin in the very late 1850's and early 60"s were seeing more sage grouse than the earlier travelers had seen. Does this testimony not indicate that resource conditions were improving rather than deteriorating because ofthe impacts oflarge hoofed animals traversing the area? We think it does.
Lewis and Clark, Peter Skeen Ogden and John Work
When Lewis and Clark were traveling up the Missouri River in 1804 and 1805 - wherever they found buffalo they found other wildlife such as elk, deer and antelope. as well. Peter Skeen Ogden and John Work had similar experiences. Ogden had to leave the Humboldt during the winter of
4
115 of 182

1828 and 29 because his party was facing starvation. When they reached the eastern snake plains and buffalo they found a good many elk and antelope as well. In 1831, John Work also found elk, antelope and even mountain sheep to be more numerous where there were buffalo, both on the eastern snake plains and in southwestern part oftoday's Montana.
The reason there may have been more deer, elk and antelope found in areas where large numbers of buffalo are found may have been twofold. First, buffalo, because they were more numerous and in ways more vulnerable to predation, may have acted as a buffer drawing predators away from other species. And two, everything seems to benefit when herds of large hoofed animals such as buffalo or cattle impact an area. Insect production increases, mice become more numerous, marmot and ground squirrel populations increase. Deer, elk, antelope and even bird life become more abundant.
Spanish Colonization in California
Spanish efforts to colonize Alta California in the late 1700's revealed a similar circumstance . As was recorded in the book, Old Spanish Trail, by LeRoy R. Haftn and Ann W Hafen: Once decided upon, the project to colonize Upper California was carried out in typical Spanish fashion , soldier and friar marching side by side to found the twin outposts of presidio and mission... Expeditions were to proceed both by land and by sea.
Two small vessels, sent from Lower California in 1769 were loaded with men and supplies for the new enterprise. Agricultural implements, seeds. tools, provisions, and church paraphernalia were taken aboard.
The land contingent was formed in two parties. The first, led by Captain Rivera, comprised Spanish soldiers and Christian Indians who drove along some 400 animals ...
Portola and Sierra, with the second land party, followed the Rivera Trail and reached San Diego on July 1st [1769]. .. Conditions were not heartening. Ninetythree of the would-be colonizers had perished on shipboard or since landing... Of the nearly 300 who had undertaken the venture only 126 [remained]. ..
Frantically, one ship was sent back for supplies. while Portola, true to his orders, pushed northward by land with most of the able-bodied men for Monterey ... Portola and his men succeeded in their heroic march to Monterey and on the journey accidentally discovered important San Francisco Bay. Supplies ran low on the return trip, writes Portola:
I ordered that at the end of each day's march, one of the weak old mules which carried our baggage and ourselves, should be killed . ... we shut our eyes and fell on that sculy mule (what misery!) like hungry lions, we ate twelve in as many days... At last we entered San Diego. smelling frightfully of mules.
5
116 of 182

[Upon his return] Portola found things in a deplorable state. Numbers of the sick had died; hostile Indians had pillaged the camp; provisions were running low. Some urged the abandonment of the venture... Finally the relief ship came; to the friars it was an answer to their novena, a nine-day vigil of prayer.
It is hard now to understand how, in a land of such bountiful natural resources, there was then such poverty in California and such utter dependence on the importations of food and supplies from elsewhere. But crops were not raised successfully during the first years, and it took time for domestic animals to increase.
By 1820, forty years after livestock had been introduced to southern California, horses had grown so numerous they were a nuisance and had to be controlled. Jose del Carmen Lugo, native of Los Angeles, recalled:
When I was eight or ten years old, that is, from 1821 to 1824, there were great numbers of wild and very troublesome horses. They would come to the very outskirts of town and eat the pasturage, leaving the gentled horses without food even often coaxing them away. The government fmally decided, in agreement with the pueblo (Los Angeles], to have a general killing of these wild horses.
By 1841, California had changed dramatically. A Frenchman, Du:fiat de Motras making an inspection for his government described Los Angeles:
The pueblo of Los Angeles is extremely rich... Within an area of 15 or 20 square leagues. local residents own over 80,000 cattle, 25,000 horses, and 10,000 sheep. Vineyards yield 600 barrels of wine, and an equal amount ofbrandy ...
In late October of that same year, the Bidwell-Bartleson party (recognized as the first American immigrants to reach California by way of the Great Basin) had reached the upper San Joaquin Valley. The passage over the Sierras had been extremely hazardous; the whole company was gaunt and worn. On Oct. 30, as the party was descending the west side of the Sierras:
Bidwell was only too happy to breakfast on the wind-pipe and lights - lungs of a fat coyote shot by one of the company. By nightfall, however, he was able to tum to his journal in almost a delirium of delight: " ... Joyful sight to us poor famished wretches!! Hundreds of antelope in view! Elk tracks, thousands! Killed two antelopes and some wild fowls, the valley of the river was very fertile and the young tender grass covered it, like a field of wheat in May. (The Humboldt, highroad of the west, by Dale L. Morgan)
In May of 1844, as Fremont traveled south through the San Joaquin Valley, he noted the favorable environment and abundant animal life about them:
6
117 of 182

Flowers and oaks were only part of the wild beauty of this valley. There were vast herds of wild horses and cattle, tule elk, pronghorn antelopes, and blacktail deer. Overhead there were flights of ducks and geese that passed like small storm clouds ... [And later]: They crossed the Tuolumne, Merced, Kings and Kern Rivers, ... In this part of the San Joaquin Valley the wild horse herds were larger than any the men had ever seen. Horses roamed the grassland like herds of buffalo on the Great Plains ... he noted the favorable environment and abundant animal life about them. (Fremont, Explorer for a Restless Nation, by Ferol Egan)
It was not until large herds of cattle and horses began to appear across the West, that western range lands that wildlife began to increase. In fact it was in the 1940's and 50's, at the very time that our range lands were alleged to be in their poorest condition, that we were seeing the greatest number of mule deer, sage grouse, ducks and even song birds throughout the Great Basin.
Request No. 6, please send us a copy of all the documented information you may have indicating that our findings regarding the testimony of James Yager, Lewis and Clark, Peter Skeen Ogden, LeRoy and Ann Hafen, Charles Fremont and James Bidwell which indicate that wildlife habitat is improved when large numbers of ungulents began impacting an area on a regular basis is incorrect.
Finding#4 Custom and Culture, Settlement and Predator Control
The environmental movement is based on the assumption that all was optimum prior to the coming of white man; that grass was tall, lakes and rivers were crystal clear and wildlife was evident at every turn. But historical records and first-hand accounts indicate otherwise. When Jedediah Smith, Peter Skene Ogden and John Fremont first made tracks throughout the West, they found the rivers muddy, the grass poor and game hard to find. These men and others like them, in order to survive, learned to live as the Indians lived, relying at times on insects, their dogs or horse meat in order to survive. (See Documents, I-a., 5-a., 5-b. And 5-c.)
Once white man began settling the region, many changes began to occur. First, these people from far-off lands had been exposed to ideas and practices developed throughout the world. They had knowledge of agriculture, cloth, metal and gun powder. They had domestic animals, horses, cattle, chickens and pigs. Rather than spending their time moving from place to place they took up land, remained in one place, dependent on their agriculture. Their greatest need was to protect their crops, their pigs, their chickens and their livestock. And this they did with guns, traps, or by whatever means.
By the turn of the century every country store across America was selling reasonably priced, 22 caliber rifles. Stevens, Winchester, Savage, Marlin and Remington were making, 22 rifles that sold for $1. 98 to $7.00 a piece, depending on the make and model. Every boy, white and Indian, along with their fathers and many of their sisters were controlling predators. By 1910 large numbers of men in every community were trapping during the winter months. School age boys, too, had trap lines that they tended going and coming from school. Coyotes, bobcats, badgers,
7
118 of 182
skunks and weasels, nearly all fur-bearers were fair game. Crows, magpies, and "chicken-hawks" were shot on sight. Then in 1912 there was a major outbreak of rabies in central Nevada So bad was the epidemic, that rural families had to keep their children and dogs locked up or fenced in. See Documents, 3-a. through 3-j., see also, Book 3-1, Northeast Nevada Frontier)
By 1914 the rabies epidemic had spread to nearly all the western states. It became a national health problem. In July of 1916, Senator Key Pittman of Nevada sponsored a bill through Congress appropriating $25,000 for rabies control. In the 1930's toxins (primarily strychnine) and airplanes were being used to control predators. The results were phenomenal, coyotes, skunks and crows and other predators became few, while deer herds exploded. In many areas sage chickens could be harvested "by the gunny sack full". Ducks and other waterfowl clouded the skies and song birds were everywhere. (See Book, 3-1, Northeast Nevada Frontier, see also Documents, 30-a., 45-a, 45-b., 45-d. and 45-e., see too, Documents 6-a. through 6-c.)
But then, in the 1950's the federal government began reducing predator control, first by discontinuance ofbounty systems, and by requiring absolute proof that predators were destroying livestock before action could be taken, then later by outlawing the use of toxins, reductions in predator control funds and by not allowing predator control in wildlife refuges and wilderness areas. Such measures have had a profound effect. Not only has the curtailment of predator control helped put thousands of families out of the sheep business over the years, but deer, duck, upland game and song bird populations have declined as well. (See Docmnents, 55-a, 55-f.)
It is recognized however, reductions in predator control have not been the only factor which has had adverse affects on local communities. The inability of local citizens to influence outcomes of public land policy have also had an adverse affect the economic well-being of ranching communities. (See Documents, 13-a. through 13-c.)
Request No.7, please send us a copy of all the documented information you may have indicating the implementation of the American system of government which rfcognizes and protects the right of property has not led to the greatest prosperity for those living within our boarders than any other that provided anywhere throughout the history of the world.
Request No. 8, please send us a copy of all the documented information you may have indicating that reductions in predator control practices as were implemented by state and federal agencies beginning in the late 1950's has not caused great declines in wildlife here in the West.
Request No.9, please send us a copy of all the documented information you may have indicating that the quality of lakes, streams and rivers was not improved by western settlement as is indicated by documents, 5-a., 5-b., and 5-c.
Finding#S History of mule deer in the Great Basin
It's not hard to trace the history of mule deer in the Great Basin. The logs, diaries, journals and
8
119 of 182

other accounts which were written by those who crossed through the American West during the 1800's hardly ever mentioned deer. Some have said that the reason that deer were not seen during that period was because the earliest explorers and trappers were only traveling down the valleys and along the rivers where they would not have seen the deer which were in the mountains. But nearly all the trapping parties had one or two men with them whose responsibility it was to scout the country in all directions, looking for game and new trapping areas. Every stream and every pond that could be trapped, and every canyon that may have held game was sought out. And when no game was found, as was often the case, then it was beaver tail and horse meat that sustained the trappers. (See Documents, 1-a., See also, book 13-30, Peter Skene Ogden's Snake Country Journals -1824-25 and 1825-26)
The explorers and trappers did find a few antelope from time to time however, but not often. Perhaps the most telling, was the condition of the American Indians at that time. By every account it seems the Indians were so poor, hardly any of them wore moccasins. Nor is there evidence that they had cradle-boards for their little ones. It wasn't that they did not have knowledge of such things; rather they didn't have the material to make them. Apparently, on rare occasions, when the native people of the Great Basin were able to harvest an antelope or deer, the hide of the animal was used for making bags for storing food stuffs which they often carried with them. (See book, 13-39, Report Of Explorations Across The Great Basin of the Territory ofUtah For A Direct Wagon-Rout From Camp Floyd To Genoa, In The Carson Valley, In 1859, see too, Document, 7-a. pp 20,21,22 and 23)
Deer did not become plentiful until the late 1930's- after sheep and cattle had been introduced into the country and effective predator control programs had been put in place. Records kept by Forest Service personnel monitoring the Toiyabe Mountains and Ruby Mountains during the early history ofF orest Reserves bears this out. In the Ruby Mountains, 10 deer were seen in 1921-followed by a steady increase until an estimated 3,000 animals were seen in 1939. By the mid 1940's deer numbers on the Ruby Mountains were in the thousands. No one knew how many there were for certain. In California, Utah, Oregon, Washington, Idaho, Colorado, Wyoming, everywhere it was the same, as predator control practices improved, so too were there more wildlife. Deer, sage grouse, song birds, every pray animal seemed to benefit from predator control. (See pages 5 and 6, document 22-a. See also, 3-a. throughj., see also, 54-a and 55-d.)
Early history indicates that there were very few, if any, mountain lions in the Great Basin at the time of early exploration and settlement. Research by employees of the Nevada Department of Wildlife found only one early reference, wherein the Territorial Enterprise (Virginia City) on June 27, 1867, reported that a "catamount" was killed in the Six Mile Canyon area. The writer stated that "This is the first animal of its kind we have ever heard of in this region" Apparently, there were no lions seen again anywhere in Nevada until sometime in the early 1920's. (See, Division of Wildlife Comprehensive Mountain Lion Management Plan, 1995)
Perhaps one of the greatest testimonies in this regard was that which is revealed in the book Beltran: Basque Sheepman of the American West. Beltran Paris came to the United States in 1912. Soon after he arrived he went to work for the Williams sheep outfit which summered in the Gold Creek and Bruneau areas of northern Elko County and wintered near Frenchman and Gabbs
9
120 of 182

Nevada. After working for Williams for several years, Beltran went into the sheep business for himself in Butte Valley. Beltran's brother Arnaud also worked for Williams for a number of years, but later went to work for Baker Ranch, and then the Adams and McGill outfit. This meant that both Arnaud and Beltran had spent a good many years in the outdoors, covering vast areas throughout Nevada, yet, neither Beltran nor Arnaud had seen or heard of a lion until the early 1920's.
Beltron wrote: "My brother Arnaud was the first to find out about the lions. He was camptending for Adams and McGill and one morning when they were trailing their sheep south to the desert his herder came and told him eight of his big ewes were dead. Arnaud thought maybe they ate something bad so he went over there. He saw right away an animal had killed them. Well, bobcats were worth a little money and he kept two number three traps in his camp. He set them around the dead sheep and then told the herder to move his bunch out of there. The next day Arnaud went back and he sure was surprised. There was a great big lion in his traps. He was pretty scared but the lion didn't do anything. They don't want to hurt their foot. Anyway, Arnaud shot that one and skinned it out. His boss was so happy he gave Arnaud a ten-dollar reward. That was the fust lion any ofus ever saw in this country."
Historical evidence indicates that the great deer herds of the 40's and 50's and 60's were a product of settlement and predator control - and that mountain lions in Nevada are a product of our deer herds.
Interestingly, according to the Division of Wildlife, Comprehensive Mountain Lion Management Plan (1995), in 1994 a male lion that was radio-collared in Idaho moved 250 miles to central Nevada. Certainly, if mountain lions are capable of traveling so far - if there had been an abundance of deer in the Great Basin in the 1800's, there should have been large numbers of mountain lions in the Great Basin as well.
Request No. 11, please send us a copy of all the documented information you may have indicating that our rmdings regarding the history of mule deer is incorrect.
Finding# 6 History of Sage Grouse within the Great Basin
Perhaps Sage Grouse, is a good indicator for determining the general well-being of a number of species found within northern Nevada. The period of greatest sage grouse abundance in the 1940's and 50's, coincides with the period when there were the most mule deer, song birds, rodents, snakes and frogs and so forth throughout northern Nevada. (See, 57-a., 4-a., and 4-b., 5-b. and 6-b., see too, 45-a., 45-b., 45-d., 45-e., 30,a and 3-a.)
Records show there were no sage grouse seen in the Great Basin during early exploration. Jedediah Smith never mentioned them when he told of crossing through the Great Basin in 1827. Peter Skene Ogden never mentioned them when he was trapping the Humboldt in 1828 and 29. Zenos Leonard never mentioned sage grouse when crossing through the region now known as Nevada. Nor did Milton Sublet, Joe Meek or James Clyman mention them. (See 1-a. and 5-b.) A
10
121 of 182

few sage grouse were seen in the Great Basin in the 1850's however. Capt. E.G. Beckwith, while conducting a survey for a possible railroad-route along the 41st parallel in 1854, wrote of seeing "sage cock" on one occasion, while traveling north "on the plain" east of the Franklin River in Ruby Valley. Captain James H. Simpson also encountered "sage cock" while crossing through the Great Basin and back in 1858 and 59- once at Pacific Spring, once in Ko-bah Valley west of Eureka, and once in Spring Valley on their return trip. (See book, 13-51, Report by E.G Beckwith -For a Railroad Route South of the 401
h Parallel, See too, Book, 13-39, Report Of Explorations Across The Great Basin of the Territory of Utah For A Direct Wagon-Route From Camp Floyd To Genoa, In The Carson Valley
Perhaps the best accounts indicating the early status of sage grouse in the Great Basin were those written by Julian Steward and Robert Ridgway. Robert Ridgway, served as the zoologist for the King Expedition during the time when that party was making its geological assessments along the 40th Parallel during 1867, 68 and 69. The significance ofRobert Ridgway's "ornithology report" or assessment of bird life, which took place over the three year period when they were covering a good deal of the area between Sierras and the Wasatch Mountains of Utah, was that, during all of that three year period, while inspecting one valley after another and climbing mountain after mountain, Mr. Ridgway only mentioned seeing "sagehen" (centrocercus urophasianus) five times. One sighting was on Peavine,just north ofReno, one was near Wadsworth, on the north end of the Virginia Mountains, one was near Fort Ruby, where Ridgway observed a "sage hen" being pursued and then taken by two eagles, one was near Secret Pass at the north end of Ruby Valley, and one was near the City of Rocks in southern Idaho (See Document, 6-c.)
Equally important to Robert Ridgway's work was that of ethnologist Julian Steward. Between 1931 and 1936, Julian Steward made numerous trips throughout Nevada, southern Idaho, western Utah and the Owens Valley area of California, interviewing native people and recording, among other things, the food items used by all the various groups in each of the valleys he visited. Most ofthe people he interviewed were in their 70's or 80's. So most of them were born in the 1860's or 70's, and had gained much of their knowledge from their parents and grandparents. (See Document, 7 -a.)
The significance of Julian Steward's work was in discovering testimony showing just how scarce game was in the 1800's. As an example, in all of Mr. Steward's interviews, elk are mentioned only once, and that was in regards to hunting elk in the area of Yellowstone. Sage grouse was only mentioned once as well, and that was ofTemoke, hunting sage grouse in Ruby Valley.
In contrast to the above, persons living in the 1940's and 50's and 60's told of encountering large numbers of sage grouse during their lives. (See testimony of Frank Temoke, 45-d., Frank Delmue, 45-c., Steve Sewell, 45-d., Jake Reed, 17-b., Dave Rage, 45-a., Raymond Mendive, 3-a., and Jack Walther, 45-b.).
Request No. 12, please send us a copy of all the documented information you may have indicating that our imdings regarding the history of sage grouse is incorrect.
11
122 of 182

Finding#7 History of bitter-brush, then and now
Testimony by the earliest trappers and explorers regarding vegetative cover in the Great Basin, mirrors, to a great degree, testimony regarding sage grouse. By every account, the country was barren and the feed was poor in the1820's and 30's. But then, it seems that those who traveled throughout the Great Basin in the 1850's and 60's, found better feed. Perhaps the country, at that time, was experiencing dry periods and wet periods, no different than what has been witnessed since that time.
The more detailed records of Captain James H. Simpson and Sereno Watson indicate that the vegetative cover (in terms of the kinds and types that were found) of that period was similar to that of recent times. Capt. Simpson, after traveling from Camp Floyd in Utah to Genoa and back again in 1858 and 59, described the plains and valleys as being vast areas dominated by sagebrush, with very little grass. He wrote of mountain ranges clothed with pinion and juniper, with some quaking aspen in the larger basins and draws. He also wrote of mountain mahogany, and of timber being on the tops of some mountain ranges.
Sereno Watson's accounts were more detailed and scientific than were those of Capt. Simpson. Records indicate that Watson found bitterbrush, (purshia tridentata), on nearly all of the mountain ranges from Sierras to the Uinta Mountains in northern Utah.
Some argue that overgrazing of grasses in the late 1800's and early 1900's caused sagebrush and bitterbrush to increase throughout the Great Basin. Others say that betterbrush was overgrazed during that same period by sheep. Regardless, when the agencies began restricting livestock use in the 1970's it generally took only a year or so of rest, and the plants, from grass to browse, would burst forth with lush foliage. Pictures taken at that stage were used to show how the range had improved. However, what is not shown is how these same plants within a short time become decadent and unproductive when left ungrazed. (See Document 54-a, Vegetative Stagnation in Three-Phase Big Game Enclosures, by Paul T. Tueller and Jerald D. Tower) In truth plants of all kinds need to be routinely grazed or hedged in order to remain productive.
Request No. 13, please send us a copy of all the documented information you may have indicating that our imdings regarding the history of bitter-brush is incorrect.
Finding#8 Effects of wildfire has had on bitter-brush communities and mule deer throughout Nevada
The biggest changes in plant communities and range condition have come about since the 1970's, after the agencies began cutting permits and removing livestock from the range. It was then that we began experiencing the out-of-control fires that have been raging throughout the west in recent years. And it has been because of the fires that we have been losing so much of our range and wildlife resources (as Dr. Tony Lesperance predicated would happen, back in 2000). (See Document, 52-h., see too, 52-a., through 52-f., see too, 52-e. & 52-f.)
12
123 of 182

Some have said that mule deer can live in areas where there is no bitterbrush. That may be, but for the most part, it has always been in those areas where there have been good stands ofbitterbrush that mule deer have flourished. In northern and western Nevada, in eastern Nevada, in Utah, Idaho and California, wherever there have been good stands ofbitterbrush, and where effective predator control programs have been ongoing, is where there has been good deer production over the years. (See Document, 54-b.)
Every year it seems, we are losing more and more bitterbrush to wildfire. Which is something that we can no longer allow to happen - for in truth, we have lost most of our best deer habitat already. Why is that you might ask? Well its simple really, wherever you see bitterbrush growing, you can be assured you are in an area that not only grows good bitterbrush, but grows a lot of grass as well. Which means, that if little grazing has occurred and lightening strikes, it is these areas that bum first. (See Documents, 52-b., 52-e. and 52-f.)
However it doesn't end there, for the agencies then require that such areas not be grazed for at least two years, even though such policy is not backed by science. And so, unfortunately, the stage is set for more and more cheat grass growth, which in turn sets the stage for more and more wildfires, which spread over more and more area. And so, on and on we go, destroying more and more wildlife habitat, destroying more and more of our native rangelands, destroying more and more deer and sage grouse habitat, while at the same time endangering and destroying the economic viability of ranching operations. (See Document, 52-g.)
Request No. 14, please send us a copy of all the documented information you may have indicating that our fmdings regarding the effects of fire on bitter-brush is incorrect.
Finding#9 Importance of private land ownership and the effects of such regarding the preservation of bitter-brush communities
If a person drives around the base of the Ruby Mountains today, that person might notice that there are areas along the foothills which appear darker than others. These darker areas generally include a good stand of different kinds of brush- mostly bitter-brush. It may also be noticed that in contrast, there are other areas where it appears that such stands of brush have been removed by wildfire. Interestingly, in most instances, the areas where the brush has been removed by wildfire are areas that are managed by the Forest Service, whereas the areas that remain covered with healthy stands of mountain sage and bitterbrush are generally privately held lands.
Simply put, the reason for all this is, while it has been the policy of those within the federal agencies over the last 30 years or so, to leave fifty percent or more of the available feed within allotments each year - which policy has led to the situation where we are now experiencing the terrible fires we are having, the ranching community has continued to graze their lands in a manner which prevents excessive fuel buildup. Which indicates, of course, that its been a very good thing that lands surrounding the Ruby Mountains have been in private ownership for all these years, for if there hadn't have been, the deer would have suffered even more than they have over the last several years.
13
124 of 182

For years, ever since the early 1940's, the Ruby Mountains have been recognized as the finest deer producing area in the state. Certainly, there are other mountain ranges that have the same potential for producing as many deer as do Ruby Mountains. So why the difference? It's obvious really, ranching and private land management have not only had a positive effect on reducing wildfire over the years, but ranchers also do a good job of controlling predators, which does not often occur on Forest Service or BLM lands, because of ever increasing regulation and public pressure to protect predators. Perhaps more lands should be transferred into private ownership, rather than the other way around.
Request No. 15, please send us a copy of all the documented information you may have indicating that our findings regarding the effects of private land ownership have on deer habitat is incorrect.
Finding# 10 Importance of solar reception, and what happens when overstory becomes excessive
If any one of us were to walk out to our front yards during summer and place an object on the ground covering an area, say, 6" long by 6" wide, and we were to leave it there for three or four days, we would find at the end of that period, that the grass which was covered by the object would have turned yellow. And we know that if we were to leave it there long enough, that the grass would die completely. The reason being of course, plants simply cannot survive without sunlight.
The same thing happens when a layer of dead grass is left on a mountain meadow from year to year. Within a short time fine stemmed grasses and plants oflower stature, such as dandelion and clover, soon die and plant diversity is lost. (See Documents, 23-a. through 23-h.)
Rangeland grasses also deteriorate and die away when they are not impacted as they should be by regular grazing. It's true, overgrazing can lead to weakened pants and reduced production. But the opposite is even worse. Take the 1940's and 50's as an example; right at the time when we were running the greatest number of sheep and cattle on our rangelands, was when we had the most deer and sage grouse in the country. And they all did well too. In fact, evidence indicates that the sheep and cattle and deer were healthier and bigger and fatter than then they are today. And so, what does this mean, except that the reductions in grazing that have occurred since the 1970's have been wrong from the beginning. And now, the only thing we are accomplishing by continuing to ignore the truth is to cause more and more fuel buildup on our rangelands - which not only jeopardizes the public health and safety of our citizens, but leads to the loss of thousands and thousands of acres of prime wildlife habitat as well. (See Documents, 23 -a through 23-h., see too, Document 21-c.)
Request No. 16, please send us a copy of all the documented information you may have indicating that our findings regarding the importance of solar reception is incorrect.
14
125 of 182

Finding# 11 Historical effects of grazing on riparian areas
It became popular in the 1980's and 90's for the Forest Service to set utilization standards for grazing on riparian areas. For example, if a rancher turned his livestock out on the range where there were riparian areas, such as along a creek or meadow area, and his cattle were to eat more than 40 to 45 percent of the feed in one of the riparian areas, it didn't matter if the cattle had only been in the pasture for a very short time, or that less than ten percent of the feed had been utilized on the surrounding lands, the rancher was to remove to his livestock immediately, for if he did not he would have his permit reduced by as much as 25 percent. Needles to say, such policy has caused great hardship for a good many permittees. (See Documents, 13-a. through 13-c. and 17 -a. through 17 -c.)
The discerning thing about the whole affair is, after nearly a decade had passed it was learned, that the very policy, which had by then put a great many people out of business, was not supported by sound science. And in fact was repudiated by studies which had been completed at the Starkey Experiemental Station in Oregon - which studies show conclusively that the removal and reductions of livestock use on riparian areas can not be supported scientifically. (See Document, 19-a. through 19-c.)
The Starkey Experimental Studies
Over a period of 12 years, graduate students and scientists measured the effects of cattle grazing on every riparian value imaginable. They applied rest rotation grazing, season long grazing, short duration grazing, deferred rotation, and non-use. They monitored and determined effects on soil compaction, infiltration rates, streambank erosion, sediment loads, biological content of the water itself, effects on fish reds, impacts on streamside vegetation, vegetative health and feed production. And when it was all said and done, they found that nearly all riparian area values were not harmed, and if anything, benefitted from livestock grazing. An Environmental Impact Statement addressing these issues should be initiated as soon as possible so as to prevent continuing degradation of riparian areas found throughout the state of Nevada.
Request No. 17, please send us a copy of all the documented information you may have indicating that our findings regarding the historical effects of grazing on riparian areas is incorrect.
Finding# 12 Knowledge gained more recently
It has been more than twenty years now, since the Forest Service first implemented it's riparian utilization standards throughout much of central Nevada. Great change has occurred since that time. The sheep industry is nearly nonexistent now. Nearly half the cattle which once grazed upon the public lands in the 1950's are now gone. As a result, great social-economic harm has been done to the livestock industry throughout Nevada. (See Documents, 17-a. though 17-c.)
Adverse impacts on environmental values are also a concern. We know now that because of the
15
126 of 182

removal of livestock from riparian habitats, such areas have now become overgrown with dead and decadent willow growth which shades out the majority of grasses and other understory that existed formerly. In many places, such detrimental overgrowth has made it nearly impossible for a person to get through thickets and creek bottoms, even on foot. (See Documents, 20-a. and 20-c. See also documents 45-c. through 45 f.)
Accumulative, long term, and short term impacts are becoming more and more evident year by year, including degraded riparian habitats, loss of riparian understory, increased fuel buildup, ever increasing loss of wildlife habitat - and a range livestock industry that is now on the verge of collapse because of adverse policy set forth by state and federal agencies.
Request No. 18, please send us a copy of all the documented information you may have indicating the information presented in Documents, 17-a. through 17-c., 20-a. through 20-c., and 45-c. through 45-f. is incorrect.
Finding# 13 Possible reductions in water flow
There is a good deal of scientific information which indicates, that when grazing is reduced or livestock are removed from typical mountain pastures in Nevada and elsewhere throughout the Inter-mountain West, woody vegetation increases to such a point that more often than not, it causes significant reductions in water production. (See Documents, 43-a. through 43-f.) Rural Heritage Preservation Project fmds that one of the greatest mistakes ever made was when the public allowed the USDA Forest Service to go forward with it's policy of reducing livestock grazing on Forest lands in the 1980's and 90's without forcing them to complete an Environmental Impact Study regarding all possible, cumulative, long term and short term, adverse effects which would result because of reduced livestock grazing; including, reductions in production of water flow; the destruction of wildlife habitat, due to ever increasing wildfire, and overstory production within riparian areas; and the effects of such on the livestock industry and local economy.
Request No. 19, please send us a copy of all the documented information you may have indicating that an Environmental Impact Statement does not need to be completed regarding the issues stated above.
Finding# 14 Mismanagement of our nation's wildlife refuges
Nowhere, at any time, in the history of the world has socialist management ofland and resources worked. It did not work in Russia, nor is it working here in the United States. Yet more and more lands here in the United States are being put into the hands of government- to the determent of wildlife, to the detriment of our economy and to the detriment of the future of this nation. (See Documents, 40-a. through 40-£, see too, Documents, 22-a. through 22-i.)
Request No. 20, please send us a copy of all the documented information you may have indicating that the information presented in Documents, 40-a. through 40-f., and Documents,
16
127 of 182

22-a. t4rough 22-i. is incorrect.
Findings # 15 Importance of removing mature vegetative cover
Those who did a lot of hunting back in the 1950's and 60's report there were not only a lot more deer at that time, but that the deer were fatter than they are today. When skinning a deer back then, there would always be a layer of hard fat, an inch or so thick over the rump- something you seldom see these days. Much of the difference appears to be the greater number of sheep that were present in the country in the 1950's and 60's. Back then it seemed, there were bands of sheep moving through the country nearly everywhere, and as they would move through, they would take a little from nearly every plant. They would nibble the tops off of the grass; they would eat the weeds back; they would take a little quaking aspen, a little chokecherry, and a little rosebush, nearly everything. And then they would move on, returning again the following year. It was the very closest thing to being the ultimate way of achieving short duration grazing ever known. The various range plants beneficed tremendously. It would not be long until all the vegetation that had been impacted was bursting forth again with new foliage, which nearly always was richer in nutrient value than it would have been if all the plants had not been hedged. (See Documents, 45a., 55-a., and 53-e.)
In the 1970's, some began suggesting that livestock were hurting the range - that cattle were taking too much of the deer's feed. Their focus seemed to be on bitterbrush- claiming that there was little winter feed left for deer. Soon, demands were being made, calling for the removal of livestock from the range. Finally, a study was initiated to determine the truth of the matter, whereby there were enclosures built at different locations throughout the state, so that cattle could be excluded, and the effects of grazing could be determined. The results were not what many expected. Instead of finding that there was more feed produced when livestock were excluded, the plants (mostly bitterbrush) yielded less production. (See Document, 55-a.) This finding confirmed that vegetation ifleft unpruned becomes decadent and unproductive. The most effective way of pruning range plants is by livestock grazing.
Nothing demonstrates this better than those areas where livestock have been removed altogether. Wherever livestock removal occurs, it is not long until deer, elk, and even birds began to leave the so called "protected areas" for places where livestock grazing is ongoing. Think of it, if you were an elk would you want to feed in an area where every time you reached for mouthful of grass, you would get a mouthful of feed which was half dead matter left from the previous year's growth? Of course not. If such were the case, it would not be long until you would move to an area where the majority of feed had been removed the year before. This is true for deer, sage grouse, blue grouse and every other animal. Plants of every kind are made more palatable, healthier, more productive, and more nutritious, when areas are grazed by domestic livestock (See Documents, 22-a., 22-b., 22-f., 21-d., 45-g., 23-a. and 23-c.)
Request No. 21, please send us a copy of all the documented information you may have indicating that the information presented in Documents, 22-a.,22-b., 22-f., 21-d., 45-g., 23-a., is incorrect,
17
128 of 182

Finding# 16 Importance of grazing impact on sage grouse production
In 1986, Carol Evens completed a thesis in partial fulfillment of the requirements for the degree of Master of Science in Renewable Natural Resources, titled, The Relationship of Cattle Grazing to Sage Grouse Use of Meadow Habitat on the Sheldon National Wildlife Refuge. Perhaps this study, more than any other, depicts the importance of grazing to sage grouse.
The study found that sage grouse tend to avoid meadow areas of dense rank vegetation but would use areas once they were "opened up" by grazing, particularly late in summer when sage grouse nutritional needs are met by eating succulent regrowth, high in protein, which is found to be more prevalent where livestock have been grazed. (See Documents 3-b., 45-g., and 45-h., see also, Document 23-a.)
Many persons within the various resource management agencies have acknowledged that grazed meadows are more beneficial to sage grouse than are ungrazed meadows, but are quick to point out that the season long grazing practices the past were detrimental to sage grouse. We find that history and science do not support such a conclusion. To this time, we have found no studies which show that the season long grazing practices of the 1930's, 40's or 50's, were anything but beneficial to sage grouse.
Request No. 22, please send us a copy of all the documented information you may have indicating that our findings, as outlined above, regarding effects of traditional grazing practices on sage grouse, are incorret.
Finding# 17 History of cheatgrass and the effect cheatgrass has had on wildfire frequency and intensity within northern Nevada
There has been a lot of criticism of cheatgrass in recent years - that it is nothing but a weed that crowds out native vegetation, serves no useful purpose, and causes increased intensity and frequency of wildfire. The reason we are experiencing the huge catastrophic fires of recent times is not because there is more cheatgrass around now than there was back in early part of the 1900's. Cheatgrass has been around for a long time. Records indicate that cheatgrass was identified in each of the eleven western states as early as 1910. The large fires that have been occurring recently are caused by reductions in grazing. If we were to allow livestock grazing to occur as it did in the 1940's, 50's and 60's, we would not have the huge catastrophic wildfires we are now experiencing. (See Document, 52-h.)
Truth is cheatgrass is one of the most important sources of feed for both livestock and wildlife that is found in the Great Basin. Mule deer, with their small muzzles often reach beneath existing sagebrush during winter in order to nibble new little shouts of green cheatgrass when green feed is unavailable elswhere. Chukar too, use these same green shoots of cheatgrass during winter - to such a degree it is doubtful they can survive without it.
18
129 of 182

Cheatgrass is a good source of feed even when it is in a cured condition. Livestock, like people, tend to like a variety of foods. Some plants, like shrubs and browse, are often high in protein while dry grass is often a good source of energy. So if a cow, or a horse, depending on the kind of country they're in, can eat a little desert shrub or maybe some grease-wood - or if they are in the mountains, some quaking aspen or rosebush, or chockcherry, along with cheatgrass, they get along fine. In fact, it is not uncommon to see cattle or horses during winter on a cheatgrass range that look better than cows and horses that are sometimes being fed a full ration of hay during winter months. (See Documents, 51-a. and 51-b.)
And, as far as the theory, that cheatgrass crowds out native grasses is concerned, there is considerable evidence indicating that such is not the case. Beginning in 1979, there was a 14-year study done in southeastern Oregon soon after scientists found two isolated areas deep within large lava flow areas where livestock had never grazed, nor had cheatgrass been introduced. During the study several things were learned. First of all, contrary to popular belief, it was found that the frequency of plants (number of plants per square yard) was not what had been expected. At the Eastern Site it was found that 59 percent of the ground was barren of vegetation, while at the West Site, ground barren of vegetation ranged from 84 percent in 1980 to 76 percent in 1991. (See Document, 50-a.)
These fmdings support what the earliest explorers and trappers had to say about the country in its pristine state. Jededia Smith, Peter Skeen Ogden and Fremont all described the country as barren and unproductive. (They also support fmdings of Steve Rich, see Document 21-c.)
Most significant was the increase in cheatgrass which occurred at the West Site beginning in 1980. Apparently, there was an unintended introduction of cheatgrass by the scientist themselves. Soil previously barren of vegetation became populated by cheatgrass, yet no loss of perennial grasses, forbs, or shrubs was noted during the remainder of the study. Cheatgrass does not crowd out native vegetation as so many allege.
Request No. 23, please send us a copy of all the documented evidence you may have indicating that our findings, as are outlined above regarding cheatgrass are incorrect.
Finding# 18 History of western settlement and the establishment and recognition of road rights-of-way, ditch rights-of-way, mineral claims, water rights, and the right of bonafide residents and settlers to the use of wood, stone, gravel and clay
Up until the time when settlement began in earnest west of the Mississippi, it had always been the practice of Congress to sell large tracts of land to speculators who in tum would sell said lands to those who wanted a place of their own. This of course, had never gone well with those who were settling the land. So when it was learned that Mexico and Canada were issuing patents in recognition of claims of land and mineral rights, so that the lands would be claimed under the name of either Mexico or Canada, it wasn't long until representatives in Congress began receiving letters from their constituents urging the passage of legislation recognizing the right of preemption
19
130 of 182

- suggesting that, should the citizens of the United States not be allowed the right to lay claim to lands, water rights and mineral deposits on the open lands in the West, then, perhaps many settlers would have little choice, but to file claims with the Mexican or Canadian governments. Not long after, Congress did begin passing laws recognizing peoples right to take up homesteads and lay claim to mineral rights. (See Document, 16-a. and 16-b.)
However, it was not until William Stewart, the first Senator from the newly formed State of Nevada, introduced a bill in Congress (which was adopted on July of 1866) that mineral claims, claims to the use of waters which arise on public lands, claims of ditch rights-of-ways, and road rights-of-ways were fully recognized by Congress.
The 1866 Act, did not however, establish procedure whereby settlers and miners could file their claims with the federal government. Instead, language within the 1866 Act required that rights of settlers be recognized "by local law and custom and rules ofthe courts". Which language was interpreted by the courts to mean, that, it was to be the states which were to establish mechanisms for the recognition of claim of rights on the open and public lands found throughout the western United States. And so it is to this day, that State law dictates the manner by which claims for water rights, road rights-of-way, ditch rights-of-way and mineral claims are to be recognized and established.
Unfortunately, it seems that persons working within government do not like the idea that "rights" can be recognized on our nation's federal or public lands. As a consequence, persons within the various resource management agencies have, for years, carried on a constant political campaign, working to rid the country of any legal precedence which might force the recognition of mineral rights, the right to prospect, a rancher's right to graze, ditch rights of way, road rights of way, the right ofbonafide citizens and settlers to the free use of wood, stone, gravel and clay found on federal or public lands, or the right of individuals to recreate and camp wherever they so chose upon the public or federal lands which are found within the western United States. (See Documents, 3-a., 5-a., 5-c., 6-b., 8., 9-a., 9-b., 1 0-a., 12-a., 12-b., 13-a., 13-b., 13.c. 14., 14-b., 14-c., 15-a, 15-b., 15-c., 15-d., 16-a, 16-b., 17-a., 17-d., 17-d., 18-a., 18-b., 18c., 19-a., 22-a., 22-b., 22-g., 22-h., 24-a., 24-b., 24-c., 24-c., 25-a., 25-b., 25-c., 26-a., 27-a., 33-b., 33-c., 36-a., 36-b., 36-c.,37-a., 39-a, 39-b., 39-c., 39-d., 39-e., 39-£, 39-g., 39-i., 40-a., 40-b., 40-c., 40-c., 40-d., 40-e., 43-a., 43-b., 43-c., 44-a., 44-b., 44-c., 44-d., 47-a-1. 47-a-2, 63-a., 63-b., and 63-c.
Request No. 24, please send us a copy of all the documented evidence you may have indicating that our imdings, regarding the history of western settlement west of the Mississippi are incorrect.
Finding# 19 History, of the recording of claims of road rights-of-way by the general public and county commissioners and the attempt by Forest Service personnel to extinguish such rights
The fact that it has been the goal of leading official working for the Department of Interior and the Department of Agriculture that all rights historically established and recognized, should be
20
131 of 182

terminated is not unclear. (See Document, 9-a. & la-a.) Conflicts between rights holders and those within Interior and Agriculture, who believe that the government should have full and complete authority over all government resources have been in constant play since the very beginning. (See Documents, 12-a. & 12-b., 13-a. through 13-c., 15-a. through 15-d. and 8-a. through 18-c.) (See too, 24-a. through 24-d., 25-a. trough 25-d., 26-a., 27-a., 28-a. through 28-g., 33-a.& 33-b.) (Also, see the book, Storm Over Range Land) In truth, the history of the USDA Forest Service and Bureau of Land Management is a history of attacks on the range livestock industry and other rights holding interests.
It was for this reason that citizens ofElko County wanting to lay claim to road rights-of-way, .filed maps marked, Map Case 328522, Exhibits A-I through Tool, Sheets 1 through 40, at the County Recorders office, on September, 26, 1992.
It was for this same reason that the Elko County Board of Commissioners set forth claims to these same roadways by Resolution No. 14-98 on the 6th day of January, 1999.
As well, it is our finding said roads as claimed by citizens ofElko County and the Elko County Board of Commissioners, are roads which were developed and used during the very early days of settlement for the purpose of securing wood, stone and other earthly materials from the public lands for the purpose of accomplishing settlement; and that such roads, and all of them, were established long before Forest Reserves were created; and that such roads, and all of them, continue to be used for a variety of purposes, including fire protection, hunting, access to water diversions, fence fixing, caring for livestock, prospecting, mining, moving livestock, weed control, pinenuting, gathering wild berries, post cutting, wood gathering, outings, educational events and sightseeing, and are in fact, roadways which are recognized pursuant to "the Act of July 26, 1866. Which rights are best understood when reading the following decision written by Federal District Judge, Peirson M. Hall.
In the case UNITED STATES v. 9,947.71 ACRES OF LAND, Federal District Judge, Peirson M. Hall wrote; "It ... arises from the sheer logic of the proposition that, when the government granted mining rights on the vast mountainous, and often impassable, areas of the west which were in public domain, assessable only by passing over the public domain, it granted, as a necessary corollary to mining rights, the right not only to pass over the public domain but also a property right to the continued use of such roadway or trail, once it was established and used for that purpose. To realize the force of the proposition just stated, one need but to raise their eyes, when traveling through the West to see the innumerable roads and trails that lead off, and on, through "the public domain, into the wilderness where some prospector has found a stake (or broke his heart) or a homesteader has found "the valley of his dreams and laboriously and sometimes at very great expense built a road to conform to the terrain, and which in many instances is the only possible surface access to the property by vehicles required to haul heavy equipment, supplies and machinery. If the builders of such roads to property surrounded by the public domain had only a right thereto revocable at the will of the government, and had no property right to maintain and use them after the roads were once built, then the rights granted for development and settlement of the public domain, whether for mining, homesteading, town site, mill sites, lumbering, or other uses, would have been a delusion and a cruel and empty vision,
21
132 of 182

inasmuch as the claim would be lost by loss of access, as well as the investment therein, which in many cases of mines required large sums of money, before a return could be had."
Request No. 25, please send us a copy of all the documented evidence you may have indicating that the information presented in Finding #19 is incorrect.
Finding#20 Importance of road rights-of-way to ranchers, mining and recreationist
The founders of this nation did not want the people to have to go to the government to be permitted or licensed before they could do or accomplish things. They wanted the people to have "rights" so that they might be secure in their investments and their ability go forward and get things done. They didn't want the people to be beholden to the government for every little thing. That's why our fathers and our grandfathers left their homelands. That's what freedom was all about. They knew from experience, that once a government, or a king gains control of people's lives or their businesses, via permitting processes, or by regulation, or both, and there is no longer recognition of property interest, then soon comes economic stagnation, favoritism, corruption, payoffs and tyranny.
That's why, during the early history of this nation, and during western settlement, "that such rights as the right of persons to use certain waters, or to clean their ditches, or to use certain roads were granted and recognized. When the settlers arrived in the unsettled West, there were no coal mines, saw mills, or lumber yards. There was only the material at hand, and so the settlers took up their shovels and their axes and they went upon the mountains and they cut logs and poles for making their homes, their corrals and their outbuilding, and they used the clay from the valley floors for their roofing.
And soon the pioneers were turning their livestock upon the rangelands, and economically viable units were born. To farm in the harsh environments found in the West was not always feasible, but the environment did lend itself to raising cattle and sheep. And soon there were mines and mining operations, and towns, and a railroad that crossed through the county. And so more roads were developed and cattle and sheep were driven from one range to another, or from certain ranges to various towns and to shipping points And for anyone to say today, that there was not a road or trail created up every canyon and every draw, long before the Forest Reserves were created, is to avoid the truth and ignore the past. And to say that such was bad for the environment or bad for wildlife, is also to ignore the past, and to ignore the truth.
Request No. 26, please send us a copy of all the documented evidence you may have indicating that the information presented in Finding #20 is incorrect.
Finding#21 Importance of road rights-of-way to certain wildlife
It is the finding of the Rural Heritage Preservation Project, that public roads, which are often
22
133 of 182

----------
graded and maintained by county governments, are beneficial to goshawk and other avian predators. It has been found that ground squirrels, native to the state Nevada are frequently found in large numbers along such roads. Apparently, roads of this type provide the kind of habitat ground squirrels need, in that a balance in created whereby the road-ways provide open areas adjacent to desirable feed which is necessary for their survival.
When a survey was conducted in the Harrison Pass area, southeast of Jiggs, NV, a far greater number of avian predator nests were found in the quaking aspen along the old road-way leading from Ruby Valley to Jiggs, than were found along either the Green Mountain Creek drainage to the north, or the Road Canyon drainage to the south. Neither were ground squirrels found in the Road Canyon drainage, or the Green Mountain Creek drainage, whereas, ground squirrel were found to be numerous along the road in Harrison Pass.
Before new policy is implemented which might cause harm to such species as the Richardson's ground squirrel or Northern goshawk, further investigation needs be completed?
Request No. 27, Would it not be wise, to conduct cooperative research with private individuals and organizations, regarding possible adverse effects on ground squirrels and hawks before new plans are implemented? And too, would it not be wise, to conduct cooperative research with individuals and private organizations, regarding possible adverse effects caused by such things as ever increasing wildfire intensity and frequency, or vegetative decadence on sage grouse because of the lack of sufficient grazing impact, or because of local fire fighters inability to access certain areas because of road closures?
Finding#22 Right of due process, Federal Administrative Procedures Act
One of the greatest infringements in individual rights, that has occurred, regarding public land management and oversight by the Federal government has been the outright abolishment of a citizens right to due process. Somewhere along the line, it became acceptable in the minds of many court justices and within the various agencies, that governmental actions could be arbitrarily imposed so long as the "experts" within government "thought" certain actions could be beneficial and by so doing, have been ignoring altogether the peoples right that evidential hearings be held for determining possible infringement on investment backed expectations; or determining by scientific method, whether or not a public good would in fact be achieved once the action was advanced.
Such abandonment of the peoples right of due process runs so foul to the original intent of the notion of free government it should not be tolerated at any time, or at any level within society -particularly, when law is now in place which calls for such processes to occur under the U.S. Administrative Procedure Act, and I or the Nevada Administrative Procedure Act.
Request N. 28, please send us a copy of all the documented evidence you may have indicating that the information presented in Finding #22 is incorrect.
23
134 of 182

Finding#23 History and effects of off-road or four-wheeler traffic within the Jarbidge, Mountain City and Ruby Mountains Ranger Districts.
It is our finding, that if the Forest Service were to follow mandates as are set forth in the "Final Rule" dated, November 9, 2005, which states; "Current regulations prohibit trail construction Sec. 261.10(a) and operation of vehicles in a manner damaging to the land, wildlife, or vegetation", then it would be the new "four-wheeler" roads that would be considered for closure, and not the existing RS 2477 road rights-of-way which extend through private lands. For it is the very nature of four-wheelers, that they must be driven up a ridge in a perpendicular manner or else they will tip over, which cause tracks to be created whereby higher than ordinary erosion occurs.
Clearly, if the new rule calls for the protection of rights-of-way which are recognized pursuant to RS 2477 of the United States Code, then all roads which were constructed by those who settled the lands prior to the creation of Forest Reserves, which roads have now been recognized by Elko County, must be recognized by the Forest Service.
The importance of keeping traditional road rights-of-way open for continued use can not be overstated - for in truth, it is these roads, which were created and made better by the use of teams traveling to and from the mountains, hauling logs, and firewood. And because it was not easy for persons with a team and wagon to make their way up a canyon and back with a loaded wagon, the very best routes were taken, following terrain which offered the least obstacles and steepest grades, that roads were created which cause the least amount of erosion possible.
Request No. 29, please send us a copy of all the documented evidence you may have indicating that the information presented in Finding #23 is incorrect.
Finding#24 Importance of road rights-of-way and livestock grazing - and how each serve to protect against out-of-control wildfire and destruction of native plant communities
Road rights-of-ways traditionally used and recognized are not only important in that they allow for quick access to areas where wildfire may start - but they often serve as fire breaks as well -perhaps not by themselves entirely - but can, with little more effort, be made to play a significant part in stopping the spread of wildfire.
Livestock grazing too, is critically important, not only because grazing removes such a large percentage of the fuel which feeds wildfire, but also because livestock create trails at intervals throughout allotments which tend to cool fires down and make them burn more slowly. It can not be denied that when fires burn cooler and more slowly, they are far easier to bring under control. And too, it must be remembered, when fires do bum at cooler temperatures, there are fewer plants lost. And when there are fewer plants lost, the range generally returns to its original state sooner because of the natural reseeding that occurs during years that follow.
24
135 of 182

Request No. 30, please send us a copy of all the documented evidence you may have indicating that the information presented in Finding #24 is incorrect.
Finding#25 The situation ranching families lmd themselves in under present circumstances
As it stands today, if a member of a ranching family happens to start a fire, which then spreads to lands managed by either the Forest Service or Bureau of Land Management, the cost for fighting the fire can be billed to that person or ranching family who owns the premises where the fire started - which cost can be in the hundreds of thousands, or even millions of dollars. Yet on the other hand, if a fire happens to have started on pubic lands, for whatever reason, and it crosses over onto private land, and is to burn buildings, haystacks and standing feed, or even a home, it is unlikely that the ranching family effected will be reimbursed.
And then you couple that with the fact that it is the government that is now creating the very situations which are causing the largest, the most ferocious and the most catastrophic fires known since the time of first settlement - plus the fact that its been the unwritten policy of both the state Department of Forestry and the BLM and the Forest Service to let fires burn unless it threatens a home or a structure. Then you began to understand what a terrible situation ranching families are facing today.
This is why it is so that the right for local communities to regain control over the affairs of their local communities once more. Its about the right of local self government, and the right to protect one's property, one's life and ones family.
Request No. 31, please send us a copy of all the documented evidence you may have indicating that the information presented in Finding #25 is incorrect.
Finding#26 Importance of seeding creasted wheat grass to areas which are burned over by wildfire
The practice of seeding crested wheat grass to rangelands began in northern Nevada in the late 1940's or early 50's, and today some of the very best deer habitat is found in those areas which were seeded to crested wheat grass in the past. It is a fact, that bitterbrush and many other native plants, including grasses, often come back sooner, and do a better when crested wheat grass is planted. And since crested wheat grass bums cooler, if fires do reoccur, they burn with less intensity than they would otherwise. And too, of course, when a fire burns cooler and with less intensity, fewer bitterbrush and native grass plants are lost. There is no question, the planting of crested wheat grass is a win, win situation.
As for sage grouse. The whole notion that crested wheat seedings are bad is false. In the 1940's there were sage grouse everywhere in Ruby Valley; and there were a good many sage grouse strutting grounds as well, both on the west side of the valley and on the east side of the valley.
25
136 of 182

Most of the strutting grounds which were in existence at that time were located on the white sage flats south of Medicine Spring on the east side of the valley. Since then, there has been no change in vegetation cover in that area. yet sage grouse no longer strut there. Today there is only one known sage grouse strutting ground being used in south Ruby Valley, and that is located within a crested wheat seeding south of Harrison Pass. Today's problem is not that we have been destroying sage grouse strutting grounds by seeding creasted wheat grass; the problem is we have far too many predators killing sage grouse. Without question, seeding burned over areas to crested wheat grass is the best possible solution for obtaining desirable condition for the benefit of a wide variety of wildlife. (See 51-a and, 3-b.)
Request No. 32, please send us a copy of all the documented evidence you may have indicating that the information presented in Finding #26 is incorrect.
Finding#27 Local volunteer fire tlghters shall be allowed to use whatever equipment which is at their disposal when fighting wildfire within Nevada
There is probably no one, anywhere, that faces greater threat to life and property than those citizens now living within the rural communities of Nevada whose homes and ranches lay adjacent to the public lands. Not only because the various resource management agencies have so dramatically reduced livestock grazing, which in places is causing two or more years of fire fuel to accumulate, but also because of current policy which often disallows private individuals the use of farm and ranch equipment to suppress wildfire on public lands.
In the past, citizens living within many of the outlying areas of Nevada have been told, that they cannot use their dozers or loaders in suppressing wildfire because of the need to protect archaeological sites, and that permission must be granted before any equipment can be used for the suppression of wildfire on public lands. (See Documents, 52-a. through 52-d.)
It is our fmding there is no group of people that are better acquainted with the history and archaeological features of rural communities than are the people that live there. It is our recommendation that the various resource management agencies adopt policy, requiring personnel to hold public meetings within the various local communities for the purpose of gaining information as to where known archaeological sites are, in order that such places be mapped so that they can be protected at times when wildfire suppression and mop up is occurring.
Request No. 33, please send us a copy of all the documented evidence you may have indicating that the information presented in Finding #27 is incorrect.
Finding#28 Importance of the right of individual home and property owner to fight wildfire in the traditional manner as they have since the west was settled
26
137 of 182

For anyone reading the Declaration of Independence, it becomes abundantly clear that one of the greatest problems those living within New England prior to the American Revolution faced was not being able to freely conduct local self government. Not only were King George and the people of Great Britain imposing whatever laws they so desired upon the people of New England, but in addition, they were interfering with the people's ability to adopt policy and ordinances for the protection and management of everyday affairs within their communities.
In many ways, the situation the founders found themselves in is not much different from that which many persons living within the public land states face today. Think of it. If those living in the various communities in New England needed to put in structures for the purpose of flood control, as and example, the local people had no way of collecting taxes or passing law or policy as a means of accomplishing such an objective- for it was the people of England that had control, and for them such concerns were of no interest.
That's what persons living within the rural areas ofNevada face today. For when it comes to the Public Lands, its not the local people that have the say - rather its people living in New York or Denver or Las Vegas that get to decide just how the majority of lands that lay within our communities are to be governed, and they certainly aren't going to be effected by wildfire; or because there may be too many predators taking down calves; or that the lack of grazing on the Forest lands is causing reductions in water production, or that ranching families are no longer able to make a living because of some unfair act by the BLM or Forest Service. And so those who live in the rural areas of Nevada go on and on, year after year, facing the fact that they don't really have control over fire policy, or grazing policy or anything else that goes on the public lands upon which they are dependant.
As it stands today, if the Forest Service so chooses, citizens living within the rural areas in Nevada can be denied even the right to go onto the public lands with their tractors or a shovel without agency permission. Issues involving the Public Health and Safety and general well-being of local communities must be decided by those who's lives and property are most effected. To do otherwise runs in direct conflict to the most dear principles of a free and just society.
Request No. 34, please send us a copy of all the documented evidence you may have indicating that the information presented in Finding #28 is incorrect.
Finding#29 Nothing is more important than Quick Response when fighting wildfrre
We find that such road rights-of-way as have been recognized and claimed by the Elko County Board of Commissioners are critically important for aiding in the prevention of catastrophic wildfire, which, as everyone knows, can be the greatest threat to human life and safety known in our area. (See 52-a. through 52-c.) Keeping the roads leading into the mountains open is "a public health and safety" issue!
27
138 of 182

One of the greatest threats to life and limb, is when persons responsible for the property and lives of family members takes it upon themselves to do whatever it takes to stop a wildfire - which wildfire may or may not have gotten out of control because of excessive fuel loads brought on by irresponsible management of our public lands, or the unwillingness of governmental officials to see that everything is done that can be done to see that ftres are put down when conditions are such that they can be put down.
Anyone who has ever fought ftre over a period of years, comes to realize at one point or another, that certain conditions often arise, when the winds that are driving a fire may go down; or began to blow in a different direction; or a light rain may come; or the temperature drops, which allow for persons to get on a fire and get it put out - which conditions may not occur again for quite a while - or even worse, conditions can turn worse, where the humidity may go down, the temperature may rise and a seventy or eighty mile an hour wind come up, which can only result in disaster.
Too often in the past, its been an unwritten policy that wildfire can be ignored to some degree until such time as when a structure is in harms way. We cannot allow that to happen any longer. All fires must be put down when conditions are right for putting them down.
It is our finding that one of the greatest mistakes made is not getting on the fires immediately. Quick response is critically important, for the bigger a fire becomes the more difficult it is to put out. And the more difficult a ftre is to put out, the greater chance there is that it will destroy the homes and property or even the lives of citizens within local communities.
Request No. 35, please send us a copy of all the documented evidence you may have indicating that the information presented in Finding #2 is incorrect. And too, please send us a copy of all the documented evidence you may have, indicating that the issue of road closers is not a Public Health and Safety issue.
Finding#30 Effects of predator control
The sound and effective predator control practices that were put in place during the late 1930's and extending through the 1960's did more to create an abundance of wildlife of every kind than all else combined. And, if it were not for the on-going predator control practices that continue to this day (even though they have been dramatically cut back and reduced over the years) wildlife numbers would be similar to those of pre-settlement times.
Request No. 35, please send us a copy of all the documented evidence you may have indicating that findings regarding the effectiveness of predator control are incorrect.
Finding#31 The history of Bighorn Sheep in Nevada
Research thus far completed by Great Basin Consulting indicates there were far fewer bighorn
28
139 of 182

sheep found in the Great Basin during the early 1800's than many originally thought. Of all the many accounts which were written during the period, 1827 through 1866, thus for only three references' have been found wherein bighorn may have been seen in the Great Basin.
First; hunters accompanying the John Work party while trapping throughout today's northern Nevada in 1831 saw tracks but no bighorn until they reached today' s southeast Oregon where they saw four sheep near the Owyhee River.
And second: Cartographer Charles Preuss while traveling south on a rout taking the Fremont party from Fort Vancouver (Washington) and on to Walker Lake in 1843, saw mountain sheep near Pyramid Lake, "bound across some high cliffs, too quickly to get a shot".
And third; when recounting his trip across the Great Basin in 1845, Fremont mentioned seeing bighorn sheep somewhere between the Ruby Mountains and Walker Lake.
Only three instances where sheep were seen during a 33 year period, from 1827 through 1860, is practically no sheep at all when considering all the thousands of miles that were traveled by the mountain men, explorers and emigrants during that period.
Certainly, pictographs depicting mountain sheep are found at different locations throughout the Great Basin, but to say that sheep were abundant historically because there were images of sheep found does not make it so.
Perhaps the best work done which can shed light on the question of sheep abundance during the period immediately proceeding western settlement was that which was completed by ethnologist Julian Steward. Between 1931 and 1936, Julian Steward made numerous trips throughout much of the State of Nevada, southern Idaho, western Utah, and the Owens Valley area of California, interviewing native people and recording, among other things, the food items used by the various groups in each of the valleys he visited. Most of the people he interviewed were in their 70's or 80's and had gained much of their knowledge from their parents and grandparents.
The significance of Julian Steward's work was in discovering testimony showing just how scarce game was in the 1800's. As an example, in all of Mr. Steward's interviews, elk are mentioned only once, and that was in regards to hunting elk in the area of Yellowstone. Sage grouse was only mentioned once as well, and that was ofTemoke, hunting sage grouse in Ruby Valley. The same can be said of mountain sheep. Just because the natives mentioned that their forefathers hunted mountain sheep from time to time does not mean they were not scarce and difficult to obtain.
That there were very few large game of any kind to be found anywhere within much of western America during that period, is indicated by the fact that the native people lived in brush shelters rather than skin lodges during winter; that moccasins were rare, and that no cradle boards were mentioned. What skins were acquired were mostly used for food storage apparently. Even successful rabbit hunts had to have been the exception rather than the norm, for testimony indicates that there were never enough rabbit skin robes for more then a few persons.
29
140 of 182

Small game was of relatively great importance. Reptiles, rodents, and insects all supplied food. Rodents and other small mammals held several advantages over large game. They remained in restricted localities and did not require a long chase as is the case when large animals are hard to find. Insects were of great importance. During some years, grasshoppers and Mormon crickets were abundant and could be taken in quantities that would last for months. Plant foods were also important. Unfortunately, even they were inadequate.
On good years pine nuts could be had over much of the Great Basin, but even then, good crops of pine nuts only occurred on occasion. Even on good years it was difficult for family groups to gather enough pine nuts during the naturally short harvesting period to last all winter. Consequently, starvation was not uncommon among the native people during that period.
Perhaps one of the best accounts ever written depicting just how harsh conditions my have been for many ofthe native people in the 1800's was written by Meriwether Lewis, ofthe famed Lewis and Clark expedition. In 1805, it was the plan of Meriwether Lewis to make contact with the Shoshone people on the west side of the continental divide, where he thought, they could trade for food and horses and lay over a few days before crossing the Lolo Pass. However, "the Chief informed us that they had nothing but berries to eat and gave us some cakes of service berries and chokecherries which had been dryed in the sun; of these I made a harty meal ... "
The following day, Meriwether Lewis; "sent Drewyer and Shields before this morning in order to kill some meat as neither the Indians nor ourselves had anything to eat... "after the hunters had been gone about an hour we set out. We had just passed through the narrows when we saw one of the spies [one of the Indians who was following and watching the white hunters] comeing up ... he had come to inform us that one of the whitemen had killed a deer ... "in an instant they all gave their horses the whip ... as I was without [ s ]tirrups and an Indian behind me the jostling was disagreeable I therefore reigned up my horse and forbid the Indian to whip him who had given him the lash every jum[p] for a mile fearing he should loose a part of the feast. The fellow .was so uneasy that he left me and the horse dismounted and ran on foot at full speed I am confident a mil
, e.
" ... when they arrived where the deer was which was in view of me they dismounted and ran in tumbling over each other like a parcel of famished dogs each seizing and tearing away a part of the intestens which had been previously thrown out by Drewyer who killed it; the seen was such when I arrived that had I not have had a pretty keen appetite myself I am confident I should not have taisted any part of the venison shortly. Each one had a piece of some description and all eating most ravenously. Some were eating the kidnies the smelt (spleen) and liver and the blood runing from the comers of their mouths, others were in a similar situation with the paunch and guts but the exuding substance in this case from their lips was of a different description. One of the last who att[r]acted my attention on particularly had been fortunate in his allotment or reather active in the devision, he had provided himself with about nine feet of the small guts one end of which he was chewing on while with his hands he was squezzing the contents out at the other. I really did not-until now think that human nature ever presented itself in a shape so nearly allyed to the brute creation." (Spelling left unchanged)
30
141 of 182

Keep in mind, Lewis and Clark at this time, were right in the midst of some of the best bighorn sheep country found anywhere within the North American continent. If there was an abundance of bighorn sheep and other game in those presettlement times, why was it that the Shoshone people were starving as they were? Why was it that they had only one skin lodge within their camp while all the other inhabitations were brush wickiups? And why was it that the tribe had not gathered and dried large quantities of meat during the season?
Request No. 36, please send us a copy of all the documented evidence you may have indicating that the information presented in Finding #31 is incorrect.
(References can be found on line at, gardnerfiles. com)
End.
31
142 of 182
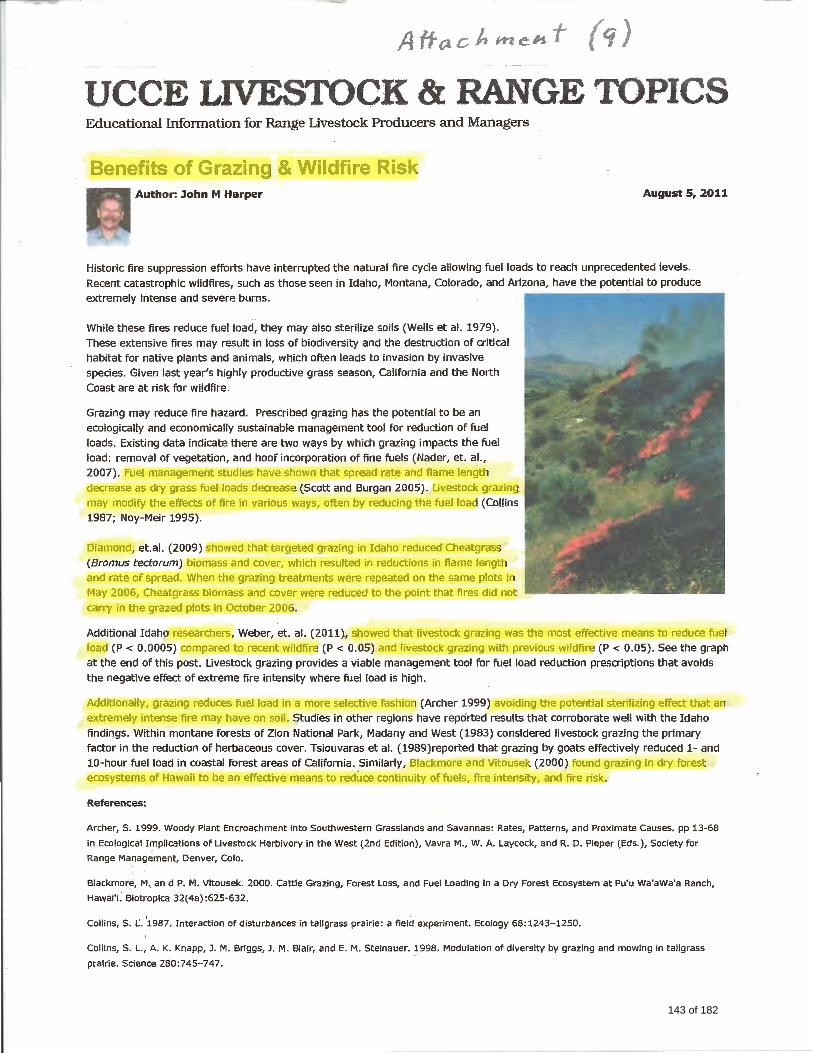
(q)
UCCE LIVESTOCK & RANGE TOPICS Educational Information for Range Livestock Producers and Managers
Benefits of Grazing & Wildfire Risk Author: John M Harper August 5, 2011
Historic fire suppression efforts have interrupted the natural fire cycle allowing fuel loads to reach unprecedented levels. Recent catastrophic wildfires, such as those seen in Idaho, Montana, Colorado, and Arizona, have the potential to produce extremely intense and severe burns.
While these fires reduce fuel load, they may also sterilize soils (Wells et al. 1979). These extensive fires may result in loss of biodiversity and the destruction of critical habitat for native plants and animals, which often leads to invasion by invasive species. Given last year's highly productive grass season, California and the North Coast are at risk for wildfire.
Grazing may reduce fire hazard. Prescribed grazing has the potential to be an ecologically and economically sustainable management tool for reduction of fuel loads. Existing data indicate there are two ways by which grazing impacts the fuel load: removal of vegetation, and hoof incorporation of fine fuels (Nader, et. al., 2007). Fuel management studies have shown that spread rate and flame length decrease as dry grass fuel loads decrease (Scott and Burgan 2005). Uvestock grazing may modify the effects of fire in various ways, often by reducing the fuel load (Collins 1987; Noy-Meir 1995).
Diamond, et.al. (2009) showed that targeted grazing in Idaho reducecr Cheatgrcrss (Bromus tectorum) biomass and cover, which resulted in reductions in flame length and rate of spread. When the grazing treatments were repeated on the same plots in May 2006, Cheatgrass biomass and cover were reduced to the point that fires did not carry in the grazed plots in October 2006.
Additional Idaho researchers, Weber, et. al. (2011), showed that livestock grazing was the most effective means to reduce fuel load (P < 0.0005) compared to recent wildfire (P < 0.05) and livestock grazing with previous wildfire (P < 0.05). See the graph at the end of this post. Uvestock grazing provides a viable management tool for fuel load reduction prescriptions that avoids the negative effect of extreme fire intensity where fuel load is high .
Additionally, grazing reduces fuel load in a more selective fashion (Archer 1999) avoiding the potential sterilizing effect that an extremely intense fire may have on soil . Studies in other regions have reported results that corroborate well with the Idaho findings. Within montane forests of Zion National Park, Madany and West (1983) considered livestock grazing the primary factor in the reduction of herbaceous cover. Tsiouvaras et al. (1989)reported that grazing by goats effectively reduced 1- and 10-hour fuel load in coastal forest areas of California. Similarly, Blackmore and Vitousek (2000) found grazing in dry forest ecosystems of Hawaii to be an effective means to reduce continuity offuels, fire intensity, and fire risk.
References:
Archer, S. 1999. Woody Plant Encroachment into Southwestern Grasslands and Savannas: Rates, Patterns, and Proximate Causes. pp 13-68
in Ecological Implications of livestock Herbivory in the West (2nd Edition), Vavra M., W. A. Laycock, and R. D. Pieper (Eds.), Society for
Range Management, Denver, Colo.
Blackmore; M .. an d P. M. Vitousek. 2000. Cattle Grazing, Forest Loss, and Fuel Loading in a Dry Forest Ecosystem at Pu'u Wa'aWa'a Ranch,
Hawai'i .-Biotropica 32( 4a) :625-632.
Collins, S. t:. '1987. Interaction of disturbances in tallgrass prairie: a field experiment. Ecology 68:1243-1250.
Collins, S. L., A. K. Knapp, J. M. Briggs, J. M. Blair, and E. M. Steinauer. 1998. Modulation of diversity by grazing and mowing in tallgrass
prairie. Science 280:745-747.
143 of 182
Cliff
Highlight
Cliff
Highlight
Cliff
Highlight
Cliff
Highlight
Cliff
Highlight
Cliff
Highlight
Cliff
Highlight
Cliff
Highlight
Cliff
Highlight
Cliff
Highlight
Cliff
Highlight
Cliff
Highlight
Cliff
Highlight
Cliff
Highlight
Cliff
Highlight
Cliff
Highlight
Cliff
Highlight

Diamond JM, Call CA, Devoe N (2009) Effects of targeted cattle grazing on fire behavior of cheatgrass-dominated rangeland in the northern
Great Basin, USA. International Journal of Wildland Fire 18, 944-950. http://dx.doi.org/10.1071/WF08075.
Madany, M. H. and N. E. West. 1983. Livestock Grazing-Fire Regime Interactions within Montane Forests of Zion National Park, Utah. Ecology
64(4):661-667 .
Nader, G., z . Henkin, E. Smith, R Ingram, and N. Narvaez. 2007. Planned Herbivory in the Management of Wildfire Fuels. Rangelands October
2007 18-24.
Noy-Meir, I. 1995. Interactive effects of fire and grazing on structure and diversity of Mediterranean grasslands. Journal of Vegetation Science
6:701-710.
Tsiouvaras, c. N., N. A. Havlik, and J. w. Bartolome. 1989. Effects of Goats on Understory Vegetation and Fire Hazard Reduction in a Coastal
Forest in California. Forest Science. 35(4):1125-1131.
Weber,K. T., B. McMahan, and G. Russell. 2011. Effect of Livestock Grazing and Fire History on Fuel Load in Sagebrush-Steppe Rangelands
In: Wildfire Effects on Rangeland Ecosystems and Livestock Grazing in Idaho.
http://giscenter.isu.edu/research/techpq/nasa wildfire/template.htm.
Wells, C. G., R. E. Campbell, L. F. DeBano, C. E. Lewis, R. L. Fredriksen, E. C. Franklin, R. C. Froelich, and P. H. Dunn. 1979. National Fire
Effects Workshop (1978:Denver, Colo.). USDA Forest Service General Technical Report W0-7. 34pp.
1.6 -
-
-
Grazing and Wildfire
1.8 2.1
Ill
Grazing \<Vildfire
Treatment Grazing & Fuel Load from Weber,et. al. (2011)
3.4 ill
\ ---
f.--
f.--
f.--
f.--
~~-
Control
144 of 182

VADA 35 CENTS
245 M80 02/10/96 805 Cliff Gar-dnt-r-HC 60 Box 700
R11b .. ~{ Valle·-(, NV 8'?83:=:-
TUESDAY, JULY 18, 1995 14 Pages
Grazing tasl~ force tells of Toiyabe cattle decline
By Mike Antrobus The number of cattle grazing on
the Toiyabe National Forest in central Nevada has been drasticallv reduced, according to a report ~presented to U.S. Rep. Barbara Vucanovich. R-Nev., by the Elko County Grazing Task Force.
The number of grazing permittees on the Toiyabe National Forest was disputed two weeks ago by Nevada Assemblyman John Carpenter, RElko, and Toiyaoe National Forest Supervisor Jim Nelson during an Elko Courity Commission meeting.
Nelson told commissioners there were currently about 80 permittees on that forest, while Carpenter contended there were no more than six.
A check of forest service records showed the entire Toiyabe Forest,· which includes more than four million acres scattered from the Austin area to eastern California, allowed 68 permits on 82 grazing allotments,
but livestock permittees in central Nevada number vezy few.
Gene Gustin, chairman of the Elko County Public Land Use Advisory Commission and a member of the grazing task force, presented a map of grazing allotments in central Nevada between Austin and Tonopah to Vucanovich when she was in Elko July 8.
The map shows allotments situated on the east slope of the Toiyabe Mountain range. and on the Toquima and Monitor Mountain ranges.
Gustin said the map focused on this area because ranchers there have suffered some of the most severe grazing reductions in the state and because the grazing permits held on allotments there will expire Dec. 31.
Those permittees now run only a fraction of the cattle they once grazed upon national forest land, he said. The Clifford Ranch, for exam-
ple, which once ran 1,000 head of cattle year-round, now runs 10 head during the spring, 31 during the summer and 23 during the winter.
A 1976 forest service map showed there were 33 grazing allotments in this region. Now there are only six: the Francisco C&H and Pablo/Wall Canyon C&H in the Toiyabe range. the Moores Creek C&H in the Toquima range and the Saulsbury C&H, Stone Cabin C&H and Horse Heaven C&S in the Monitor range.
Tony Valdes, the USFS's Tonopah district ranger, said that in addition to those six allotments now being considered for permit renewal, there are four inactive allotments in the area: two in the Monitor range, one in the Toquima and one in the Toiyabe.
According to a scoping document put out by the forest service on permit renewal for the six allotments, Valdes ''will decide whether to authorize livestock grazing as proposed.
145 of 182

Above are the six grazing allotments on the Toiyabe National Forest in central Nevada up for re1zewal Dec. 31: the Francisco C&H, red~ Pablo/Wall Canyon C&H, blue, the Moores Creek ·c&H, magenta, the Saulsbury C&H, cyan,' Stone Cabin C&H, grey, and Horse Heaven C&S, yellow. The Elko County Grazing Task Force said the area has seen the most drastic reduction in livestock in the state, down from 33 allotments in 1976.
eliminate grazing use or authorize a change in grazing use." He noted that at least one of the allotments is facing a possible 75 percent reduction.
The district ranger said while the emphasis on the forest was shifting from grazing to wildlife, including a growing elk herd and recreational use, ''we're not out to end livestock grazing."
He said allotments now in non use eventually will be returned to grazing, probably in five years.
''The right operator with the appropriate grazing method will be successful," he said, "but if they want to operate the same old way as 50 years ago, they will not be successful."
Valdes added, however, that ranchers who are burdened with a lot of debt could go bankrupt not matter how well they run their operation.
Gustin suggested that the determining factor of whether many ranching operations in Nevada will survive is not what grazing methods are used but rather how they are influenced by federal management of the public lands.
He said the livestock industry in central Nevada began a tremendous decline in 1986 when Supervisor Nelson arrived on the scene and began implementing a grazing management method · based upon forage utilization.
Nelson was named supervisor of the Humboldt National Forest in addition to Toiyabe supervisor last year; and now utilization standards are used to determine when cattle are removed on both forests, Gustin said.
"Jim Nelson has been down in the Toiyabe National Forest for several years, and since he's been down there. we've seen drastic cuts in allotments and AUMs [animal unit months], he said. "Histo.cy will repeat itself [on the Humboldt forest] if left unchecked."
146 of 182

SUMMARY
EVIDENCE THAT THE FOREST SERVICE AND BLM PEOPLE INTEND TO GAIN CONTROL OF PERMITTEES WATER RIGHTS
In November of 1.984 there was a report completed by the Surveys and Investigations Staff, titled A REPORT TO THE COMMITTEE ON APPROPRIATIONS U.S. HOUSE OF REPRESENTATIVES on the WATER POLICY OF THE BUREAU OF LAND MANAGEMENT RELATING 1'0 THE GRAZING MANAGEMENT PROGRAM
In the opening statement of the report it is stated:
"To utilize the public rangelands as specified by Congress, it is essential that the Bureau of Land Management (BLM) have the use and control of the water on its lands. In recent years, however, BLM has encouraged private individuals to file for water rights on stockwater developments on public lands. Private ownership of these rights has negative implications for multiple use of public lands because it allows a singleuse interest, i.e., livestock grazing, to control the use of the water."
In that same year the USDA Forest S~rvice Watershed and Air Management Staff, also came out with a similar document titled, Development of Forest Service Water Rights Policy Relating to Grazing - An Overview.
On page 11, under SUMMARY for the section titled Management Implications, it is stated:
"The Forest Service believes it is essential for water rights to remain with the land, rather than with individual permittees. This provides the flexibility necessary for management of the National Forests and grasslands in the public interest, regardless of who the permittee may be. It is for this reason that all water rights applications by other parties are protested where the water use might curtail or result in less efficient Forest Service management."
On March 21, 1995, the Elko County Grazing Task Force sent a FOIA request, to R.M. "Jim" Nelson, Supervisor of the Toiyabe National Forest asking for 1 among other things, a list of all water filings, including claims of vested rights submitted to the state Water Engineer for the Toiyabe National Forest.
In response, Mr. Nelson supplied a list of 640 Forest-Service filings for water rights, of which there were 390 filings for stockwater, most of which were claims of vested rights. (See Documents 36 & 37)
147 of 182

Employees of the Bureau of Land Management are also_taking action to gain control of stockwater. In 1990 the State Dlrector of the BLM for Nevada established policy requiring that permittees sign over half their water rights before the BLM will approve applications for water developments.
These policies raise serious questions. In United States v. New Mexico {438 U.S. 696 1978) the U.S. Supreme Court confirmed the New Mexico District Court decision that " ... any water rights arising from cattle grazing by permittees on the forest should be adjudicated to the permittee under the law of prior appropriation and not to the United States."
The Court said, "The United States contends that, since Congress clearly foresaw stockwatering on national forest, reserved rights must be recognized for this purpose. The New Mexico Courts disagreed and held that any stockwatering rights must be allocated under state Law to individual stockwaterers. We agree."
On June 6, 1995, Cliff and Bertha Gardner sent FOIA requests to both the Forest Service and the BLM, asking for all documents disclosing written delegation of authority orders authorizing federal officers, agents or employees to file for stockwater rights under state law. The agencies in their letters of response supplied no documents even referencing "stockwater".
There is no question what the agency people have in mind, once grazing permits are canceled or abandoned, water rights will automatically go to the next party of application, which will be the Forest Service or Bureau of Land Management - which policy appears to be in direct conflict to the position of the United States Supreme Court.
And what of the clear mandate of Congress as outlined in the Taylor Grazing Act 11 to stabilize the livestock industry dependent upon the public range 11 ?
When permittees are being forced to abandon their permits, is such action helping to stabilize the livestock industry?
And what of the mandate set forth in the Multiple Use and Sustained-Yield Act- of "achieving and maintaining in perpetuity a high-level annual or regular output of renewable resources 11 ?
Are the agency people maintaining a high-level of output by putting people out of business?
148 of 182

•
United States Department of Agriculture
. Leta Colford
Forest Service
Coordinator, Elko County Grazing Task Force 1239 Parkview Dr. Elko, NV 89801
Re: Freedom of Information Request (FOIA)
Dear Ms. Collard:
Toiyabe National Forest 1200 Franklin Way Sparks, Nevada 89431
File Code: 6270
Date: April 18, 1995
Thank for your interest in the Toiyabe National Forest. This is in response to your FOIA request of March 21, 1995. Your letter requested three items:
1. Names of livestock grazing allotments, permittees names, number of AUM's permitted and number AUM's of actual use for years 1980 to our most recent recordings,
2. Listing, nature, or description of all filings of water, including claims of vested rights, either by the Forest Service individually or jointly under the Nevada State water statutes,
3. Documents clarifying the joint management policies of Elk herds between the Nevada Division of Wildlife and the Toiyabe.
Item 3 was provided to you in our letter of April 6, 1995. Item 2 is attached to this letter. Item i is being re~erred to the Regional Forester, Region 4. Some of the records you request in item i do not exist or would need to be created. FOIA does not require an agency to create a record where no record exists. This will require a "no record" response from the agency. The Regional Forester is the only offical who can provide you with a no record response. Therefore, we are referring item 1 of your request to his office for processing.
This completes our response to your request. If you have questions regarding your request or our response, please contact Robert Larkin, FOIA Coordinator at (702) 355-5317.
fl r; 2 l/. "'I i ¥)'*-' I I ' !.(;'..> J ..: ... ... -3 Or" !V
,..,.--
.J...a :r--
149 of 182

Sincerely,
fi(tdlft/(~ ~A.M. "JIM" NELSON
0 Forest Sup9f1fisor
Enclosure
cc:PB-R4
150 of 182

4/14/95
TOIYABE CLAIMS SUBMITTED TO NV STATE ENGINEER
The attached document is a listinguf Toiyabe National Forest water rights and water right claims which are included in the Forest's watershed information system and have been submitted to the Nevada State Engineer. The data in this system is unedited. The following codes apply to the-appropriate columns:
RANGER DT = Ranger District 01 = Carson 02 = Bridgeport 03 = Austin 04 = Tonopah 05 = Las Vegas
ST FILE NO = File number assigned by the State of Nevada
SOURCE NAME = Water source
PUBP = Purpose of use ---- 01 = Domestic
02 = Recreation 03 = Fisheries
04&05 = Stockwater 06 = Supplemental watering 07 = Wildlife 08 = Municipal 09 = Mining 10 = ·Industrial 11 = Power
DUB YR = Date of first use or priority date
CFS 1 = Water use in cubic feet per second
151 of 182

4/14/95 11:05:59 AM Database WIS Query FOIA2 Page 1
TOIYABE CLAIMS SUBMITTED TO NV STATE ENGINEER
STATE US_OTHER RANGER_DT ST_FILE_NO SOURCE_NAME PURP DUB_ YR CFS _1 --------------------------------------------------------------------------32 1 01 01431 HUNTER CR 11 4.00 32 1 01 01436 HUNTER CR 11 6.00 32 1 01 02741 BROWNS CR 4 1880 .002-32 1 01 02742 WINTERS CR 4 1880 .015_ 32 1 01 02794 MUD SPR 1 04 1880 000015 32 1 01 03260 DEEP CAN CR 5 1880 .015._ 32 1 01 03261 DEEP CYN SPR. 5 1880 .015 32 1 01 03291 W F GRAYS CR 5 1880 .015_ 32 1 01 03292 BRONCO CK. SPR. 5 1880 .015_ 32 1 01 03385 THORPE SPR 04 1863 000015 32 1 01 20265 WELL 1 .015~ 32 1 01 21779 OPHIR CR SPR 2 1880 .006 32 1 01 23727 WELL 5 1 1967 .070. 32 1 01 23728 WELL 4 1 1967 .070 32 1 01 39469 WINTERS SPR 2 1950 .150 32 1 01 39470 DAVIS CR SPR 2 1970 .100 32 1 01 40425 SIERRA CR 7 1864 .015 32 1 01 2743 OPHIR CR 4 1880 .030 32 1 02 A-21780 ALill.f CR SPR 2 .020 32 1 02 P-03481 RUBY SPR 5 .015 32 1 02 P-03482 PETE SPR 5 .015 32 1 02 P-03483 WELLINGTON SPR 5 .025 32 1 02 P-03484 WEDERTZ SPR 5 .025 32 1 02 P-03485 MICKEY SPR 5 .015 32 1 02 P-03486 UPPR SCOTTS SPR 5 .015 32 1 02 P-03487 TAYLOR SPR 5 .015 32 1 02 P-03488 DEAD OX SPR 4 .015 32 1 02 P-03489 SAND CAN SPR 5 .015 32 1 02 P-03490 LOST SPR 5 .015 32 1 02 P-03491 UNNAMED SPR 5 .015 32 1 02 P-03492 UNNAMED SPR 5 .015 32 1 02 P-03493 UNNAMED SPR 5 .015 32 1 02 P-03494 SUMMIT SPR 5 .015 32 1 02 P-03495 O'BANION SPR 5 .015 32 1 02 P-03496 U PINE GR SP 5 .015 32 1 02 P-03497 UNNAMED SPR 5 .015 32 1 02 P-03498 PINE GROVE SPR 5 .015 32 1 02 P-03499 LWR PINE GRV SP 5 .015 32 1 02 P-03500 UNNAMED SPR 5 .015 32 1 02 P-03501 SCO'IT SPR 5 .030 32 1 02 P-03502 UNNAMED SPR 5 .015 32 1 02 P-03503 UNNAMED SPR 5 .015 32 1 02 P-03504 UNNAMED SPR 5 .015 32 1 02 P-03505 TWIN SPR #1 5 .015 32 1 02 P-03506 TWIN SPR #2 4 .015 32 1 02 P-03507 ROCKLAND SPR 5 .015 32 1 02 P-03971 ALKALI SPR 4 .015 32 1 02 P-03972 ALKALI WELL 4 .015 32 1 02 P-03973 UNNAMED SPR 4 .015 32 1 02 P-03974 HAY SPR #4 4 .015 32 1 02 P-03975 HAY SPR #3 4 .015
152 of 182

4/14/95 11:05:59 AM Database WIS Query FOIA2 Page 2
TOIYABE CLAIMS SUBMIITED TO NV STATE ENGINEER .
STATE US_OTHER RANGER_DT ST_FILE_NO SOURCE_NAME PURP DUB YR CFS 1 - ---------------------------------------------------------------------------32 1 02 P-03976 HAY SPR #2 4 .015 32 1 02 P-03977 POOL SPR 4 .015 32 1 02 P-03978 TABLE MTN SP 4 .015 . 32 1 02 P-03979 LRG WILLIAMS SP 4 .015 32 1 02 P-03980 UNNAMED SPR 4 .015 32 1 02 P-03981 ASPEN SPR 4 .015 32 1 02 P-03982 POWELL FLAT SPR 4 .015 32 1 02 P-03983 GENZ SPR #1 4 .015 32 1 02 P-03984 POWELL MTN SPR 4 .015 32 1 02 P-03985 LIZARD SPR 4 .015 32 1 02 P-03986 STAGE ROAD SPR 4 .015 32 1 02 P-03987 CANYON SPR 4 .015 32 1 02 P-03988 STONE CABIN SP 4 .015 32 1 02 P-03989 ROCK CABIN SPR 4 .015 32 1 02 P-03990 WINDMILL WELL 4 .015' 32 1 02 P-03991 LAVA SPR #1 4 .015 32 1 02 P-03992 LAVA SPR #2 4 .015 32 1 02 P-03993 LAVA SPR #3 4 .015 32 1 02 P-03994 UNNAMED SPR 4 .015 32 1 03 00124 UNNAMED SPR 04 000000 32 1 03 00425 KELLY CR 06 000000 32 1 03 02443 KINGSTON CR 06 000000 32 1 03 02484 BOG SPR 04 000000 32 1 03 02485 BLACKBURN SP 06 000000 32 1 . 03 02667 MOHAWK CR 01 1907 000015 32 1 03 02799 IDLEWILD CR 04 1863 000015 32 1 03 02800 TUBBS SPR 04 1863 000015 32 1 03 02801 JOES SPR 04 1863 000015 32 1 03 02948 REYNOLDS CR 06 000000 32 1 03 03127 MARBLE SPR 00 000000 32 1 03 03263 WINDLASS SPR 04 1863 000015 32 1 03 03265 SUMMIT SPR 04 1863 000015 32 1 03 03266 BOB SCOTTSPR 04 1863 000015 32 1 03 03267 BLACKBIRDSPR 04 1863 000015 32 1 03 03268 CAMPGRND SPR 04 1863 000015 32 1 03 03269 REEDER SPR 04 1863 000015 32 1 03 03270 GOODYEAR SPR 04 1863 000015 32 1 03 03271 BLACKBIRD CR 04 1863 000015 32 1 03 03376 SUNNYSIDE CR 04. 1863 001200 32 1 03 03381 BADE CR 04 . 1863 000015 32 1 03 03382 SAGEHEN SPR 04 1863 000015 32 1 03 03383 CAHILL SPR 04 1863 000015 32 1 03 03388 CHARLES SPR 04 1863 000015 32 1 03 03393 MIDAS SPR 04 1863 000015 32 1 03 03395 SLGHTRHSESPR 04 1863 000015 32 1 03 03396 U UNDROWN SP 04 1863 000015 32 1 03 03397 CRYSTAL SPR 04 1863 000015 32 1 03 03398 FEO SPR 04 1863 000015 32 1 03 03399 DITTO SPR 04 1863 000015 32 1 03 03400 UP COLECMPSP 04 1863 000015 32 1 03 03401 ALHAMBRA SPR 04 1863 000015
153 of 182

4/14/95 11:05:59 AM Database WIS Query FOIA2 Page 3
TOIYABE CLAIMS SUBMI'ITED TO NV STATE ENGINEER
STATE us_:oTHER RANGER_DT ST_FILE_NO SOURCE_NAME PURP DUB YR CFS 1 - ---------------------------------------------------------------------------32 1 03 03402 MUSTANG SPR 04 1863 000015 32 1 03 03403 SECRETBASINS 04 1863 000015. 32 1 03 03404 SCHOONOVR SP 04 1863 000015 32 1 03 03405 SCHNOUR CR 04 1860 000015 32 1 03 03406 WILLOW SPR 04 1863 000015 32 1 03 03407 JOKER SPR 04 1863 000015 32 1 03 03408 EAGLE SPR . 04 1863 000015 32 1 03 03409 GOLDPARK SPR 04 1863 000015 32 1 03 03410 POPCORN SPR 04 1863 000015 32 1 03 03411 DRY SPR 04 1863 000015 32 1 03 03412 TULE SPRS 04 1863 000015 32 1 03 03413 BOBCAT SPR 04 1863 000015 32 1 03 03414 BLACK SPR 04 1863 000015 32 1 03 03415 MIKE SPR 04 1863 000015 32 1 03 03416 UPPER MITE S 04 1863 000015 32 1 03 03417 GOLDPARK CR 04 1863 000015 32 1 03 03418 SHORTY SPR 04 1863 000015 32 1 03 03420 U BARRETTSPR 04 1863 000015 32 1 03 03421 S BARRETT SP 04 1863 000015 32 1 03 03422 SBARRETT SP2 04 1863 000015 32 1 03 03423 CHKCHRRY SPR 04 1863 000015 32 1 03 03426 ROUGH CAN SP 04 1863 000015 32 1 03 03427 BONITA SPR 04 1863 000015 32 1 03 03428 L BONITA SPR 04 1863 000015 32 1 03 03429 BEN SPRING 04 1863 000015 32 1 03 03430 L BECKER SPR 04 1863 000015 32 1 03 03431 WATERFALL SP 04 1863 000015 32 1 03 03432 BINGO SPR 04 1863 000015 32 1 03 03433 BRADY SPR 04 1863 000015 32 1 03 03437 BIG BARRETTS 04 1863 000015 32 1 03 03438 GRANITE SPR 04 1863 000015 32 1 03 03439 CLPPR GAP SP 04 1863 000015 32 1 03 03440 COW SPR 04 000000 32 1 03 03440 NORTHUMBRLDS 04 000000 32 1 03 03446 BROOKS CNSPR 04 1863 000015 32 1 03 03448 MURPHY SPR 04 1863 000015 32 1 03 03450 PNT OFROCKSS 05 1863 000015 32 1 03 03452 U MURPHY SPR 04 1863 000015 32 1 03 03454 NUTMEG SPR 04 1863 000015 32 1 03 03455 PORTER SPR 04 1863 000015 32 1 03 03456 BREWER SPR 04 1863 000015 32 1 03 03457 BRITTON SPR 04 1863 000015 32 1 03 03458 NEIWERT SPR 04 1863 000015 32 1 03 03459 L BREWER SPR 04 1863 000015 32 1 03 03460 LAWRENCE SPR 04 1863 000015 32 1 03 03462 LPNE TREE SP 04 1863 000015 32 1 03 03464 FIRST CAN SP 04 1863 000015 32 1 03 03467 TANK CN SPR 04 1863 000015 32 1 03 03468 UNNAMED SPR 04 1863 000015 32 1 03 03469 V BATCH CRK 04 1863 000015 32 1 03 03470 VEATCH CANSP 4 1863 000015
154 of 182

4/14/95 11:05:59 AM Database WIS Query FOIA2 Page 4
TOIYABE CLAIMS SUBMITTED TO NV STATE ENGINEER
STATE US_OTHER RANGER_DT ST_FILE_NO SOURCE_NAME PURP DUB_ YR CFS _1 --------------------------------------------------------------------------32 1 03 03472 INDIAN CNSPR 04 1863 000015 32 1 03 03473 CROW CAN SPR 04 1863 000015 32 1 03 03474 MARSHALL CRK 04 1863 000015 32 1 03 03478 CHUKAR SPR 04 1863 000015 32 1 03 03479 SKUNKCABBSPR 04 1863 000015 32 1 03 03698 SCHMIDTLN SP 04 1863 000015 32 1 03 03699 ALUM SPR 04 1863 000015 32 1 03 03701 BC WELLS SPR 04 1863 000015 32 1 03 03703 15 MILE SPR 04 1863 000015 32 1 03 03816 UNNAMED SPR 04 000025 32 1 03 03820 UNNAMED SPR 04 000025 32 1 03 03825 MORGAN CREEK 04 000025 32 1 03 03826 MORGAN CR SP 04 000025 32 1 03 03827 TABLE SPRING 04 000025 32 1 03 03828 MORGAN SPR 04 1863 000025 32 1 03 03966 CORRAL SPR 04 1863 000015 32 1 03 03967 UNDICATOR SP 04 1863 000015 32 1 03 04016 BUTLER SPR 04 1863 000025 32 1 03 04017 LONG SPR 04 1863 000025 32 1 03 04018 LONG CAN SPR 04 1863 000015 32 1 03 04019 NO NAME SPR 04 1863 000015 32 1 03 04020 UNNAMED SPR 04 1863 000150 32 1 03 04021.UNNAMED SPR 04 1863 000015 32 1 03 04022 NFWILLOW CR 04 1863 000015 32 1 03 04023 F WILLOW CR 04 1863 000015 32 1 03 04024 MILL CAN SPR 04 1863 000015 32 1 03 04025 TURQOISE SPR 04 1863 000015 32 1 03 04026 SAM SPR 04 1863 000015 32 1 03 04027 DEER SPRING 04 1863 000015 32 1 03 04028 SECRET SPR 04 1863 000015 32 1 03 04029 MILL SPRING 04 000015 32 1 03 04030 HENRYMEYERSP 04 1863 000015 32 1 03 04031 UNNAMED SPR 04 1863 000015 32 1 03 04032 BRADLEY SPR 04 1863 000015 32 1 03 04033 lONE SPR 04 1863 000015 32 1 03 04034 BILL SPR 04 1863 000015 32 1 03 04035 RTRN MINE SP 04 1863 000015 32 1 03 04036 ELSWORTH SPR 04 1863 000015 32 1 03 04037 BIG SPRING 04 1863 000015 32 1 03 04038 MILTON. CREEK 04 1860 000015 32 1 03 04039 TREMBLE SPR 04 1860 000015 32 1 03 04040 FENCELINE SP 04 1860 000015 32 1 03 04041 WARNER SPR 04 1863 000015 32 1 03 04042 VALFC' SPR 04 1863 000015 32 1 03 0404~ ·- E SPR 04 1863 000015 32 1 03 (\I• ~ r SPR 04 1863 000015 32 1 03 ;t . SPR 04 1863 000015 32 1 03 'fG 04 000015 32 1 03 SP 04 000025 32 1 03 l?R 04 000025 32 1 03 04 000025
155 of 182

4/14/95 11:05:59 AM Database WIS QueryFOIA2 Page 5
TOIYABE CLAIMS SUBMITTED TO NV STATE ENGINEER
STATE US_OTHER RANGER_DT ST_FILE_NO SOURCE_NAME PURP DUB YR CFS 1 - ---------------------------------------------------------------------------32 1 03 04051 COW SPR 04 1863 000015 32 1 03 o4052 NRTHUMBRLDSP 04 1863 000015 32 1 03 04053 MTN SPR 04 1863 000015 32 1 03 04054 WILLOW SPG 04 1863 000015 32 1 03 .04055 CHUKAR SPR 04 1863 000015 32 1 03 04056 E WATER SPR 04 000015 32 1 03 04057 SECRET SPR 04 000015 32 1 03 04093 WATER CYN SP 04 00001~ 32 1 03 04094 CHIMNEY SPR 04 1863 000015 32 1 03 04095 SLATE SPR 04 1863 000015 32 1 03 04096 L CHARNAC SP 04 1863 000015 32 1 03 04097 ROADSIDE SPR 04 1863 000015~ 32 1 03 04098 NEW BOB SCOT 04 1863 000015 32 1 03 04343 COPENHAGENCR 06 000000~ 32 1 03 05058 HILLSIDE SPR 04 000015 32 1 03 05059 TUNNEL SPR 04 000015. 32 1 03 05894 SPANISH CR 06 000000 32 1 03 06057 RED CR 06 000000 32 1 03 06238 STAR SPR 09 000000 32 1 03 06239 ARTIC SPR 09 000000 32 1 03 07507 MIDDLE CR SP 09 000000 32 1 03 07510 UNNAMED SPR 09 000000 32 1 03 07620 REYNOLDS CR 06 000000 32 1 03 08942 DISTLER SPR 06 000000 32 1 03 09068 UNAMED.SPR 00 000000 32 1 03 09363 LEBEAU CR 06 000000 32 1 03 09663 W UNION SPR 09 000000 32 1 03 10315 MARBLEFALLSP 04 000000 32 1 03 10316 OTTAWA SPR 00 000000 32 1 03 10688 BLACKBRN SPR 04 1863 000030 32 1 03 10691 KINGSTONCGSP 02 1947 000018 32 1 03 10693 G STATIONSPR 01 1932 000004 32 1 03 11697 IKES CR 06 000000 32 1 03 11998 WELL 09 000000 32 1 03 11999 MARSHALL CRK 09 000000 32 1 03 12057 REYNOLDS CR 06 000000 32 1 03 12320 DISHRAG SPR 04 1863 000015 32 1 03 13063 SHEEP CR 06 000000 32 1 03 13064 SANTA FE CR 12 000000 32 1 03 13065 SHOSHONE CR 12 000000 32 1 03 14557 LEFT FORK SP 09 000000 32 1 03 16560 CLAY SPR 06 000000 32 1 03 17127 UPPERUNIONSP 04 1863 000015 32 ·1 03 17394 LWR UNION SP 04 1863 000015 32 1 03 ----- -- l 1 08 000000 32 1 03 ~-~ ( .. CRK 08 000000 32 1 03 _7 I. 08 000000 32 1 03 )PR 02 1962 000030 32 1 03 t 02 1963 000015 32 1 03 SPR 04 1863 000015 32 1 03 08 000000
156 of 182

'!f.L'-tf':J? .l.l!U':J!':J~ AM Database WIS Query FOIA2 Page 6
TOIYABE CLAIMS SUBMITTED TO NV STATE ENGINEER
STATE US_OTHER RANGER_DT ST_FILE_NO SOURCE_NAME PURP DUB YR CFS 1 - ---------------------------------------------------------------------------32 1 03 24508 PARK CAN CR 09 000000 32 1 03 25235 UNAMED SPR 01 000000 32 1 03 25452 WELL 08 000000 32 1 03 26520 UNNAMED SPR 02 000000 32 1 04 00767 BARLEY CREEK 06 000000 32 1 04 01077 INKHOUSE-SPR 09 000000 32 1 04 02159 GRANITE CR 01 000000 32 1 04 02244 MEADOW CREEK 06 000000 32 1 04 02291 GOOD SPR 1 04 1880 000015 32 1 04 02725 BROAD CR SPR 05 1863 000015 32 1 04 02725 SILVER SPR 04 1880 000015 32 1" 04 02777 HUNTS CRTRIB 06 000000 32 1 04 02777 HUNTS CRTRIB 06 000000 32 1 04 02777 HUNTS CRTRIB 06 000000 32 1 04 02777 HUNTSCRTRIB 06 000000 32 1 04 02786 L CTTNWD CR 04 1880 000015 32 1 04 02787 HUNTS CREEK 04 1880 000015 32 1 04 02788 MILDREDS SPR 04 1880 000015 32 1 04 02789 BIGWHITESAGE 04 1880 000015 32 1 04 02790 BIG TEN SPR 04 1880 000015 32 1 04 02791 NF WILLOW CR 09 000000 32 1 04 02792 GOOD SPR 2 04 1880 000015 32 1 04 02793 MUD SPR 2 04 1880 000015 32 1 04 02793 WILLOW CR 09 000000 32 1 04 02795 FLATS SPR 04 1880 000015 32 1 04 02796 RIDGE SPR 04 1880 000015 32 1 04 02797 HORSETRAPSPR 04 1880 000015 32 1 04 02798 LEFT FORKSPR 04 1880 000015 32 1 04 02798 WILLOW CR 09 000000 32 1 04 02810 JEFFERSON CR 04 1880 000010 32 1 04 02857 INDIAN CR 01 000000 32 1 04 02908 JETT CREEK 09 000000 32 1 04 03132 KNOLL SPR 01 000000 32 1· 04 03132 KNOLL SPR 04 000000 32 1 04 03244 BRSH RBBT SP 04 1863 000025 32 1 04 03245 WARNER SPR 04 1863 000025 32 1 04 03246 LEDBETTER SP 04 1863 000025 32 1 04 03247 LAME SPR 04 1863 000025 32 1 04 03248 WILDCARROTSP 04 1863 000025 32 1 04 03249 UPRLITMEDSPR 04 1863 000025 32 1 04 03250 CRIPPLE SPR 04 1863 000025 32 1 04 03251 RAT TRAP SPR 04 1863 000025 32 1 04 03252 REDWOOD SPR 04 1863 000025 32 1 04 03253 U CLVRDLE SP 04 1863 000025 32 1 04 03254 SILVER CR SP 04 000015 32 1 04 03255 RYCROFT SPR 04 1863 000015 32 1 04 03256 SAGEHEN SPR 04 1863 000015 32 1 04 03257 SHOSHONE SPR 04 1863 000015 32 1 04 03258 PIPE ORGAN S 04 1863 000015 32 1 04 03259 SOLDIER SPR 04 1863 000015 32 1 04 03276 KEOUGH SPR 04 1863 000025
157 of 182

lf/lLf/~5 11:05:59 AM Database WIS Query FOIA2 Page 7
TOIYABE CLAIMS SUBMITTED TO NV STATE ENGINEER
STATE US_OTHER RANGER_DT ST_FILE_NO SOURCE_NAME PURP DUB YR CFS 1 - ---------------------------------------------------------------------------32 1 04 03277 SEYLER SPR 04 1863 000025 32 1 04 03278 HORSE CAN 1 04 1863 000025 32 1 04 03279 HORSE CAN 2 04 1863 000025 32 1 04 03312 GEORGES SPR 04 1863 000015 32 1 04 03313 BARLEY ST SP 04 1863 000015 32 1 04 03314 HOUSECANSP=2 04 1863 000015 32 1 04 03315 HOUSE SPR . 04 1863 000015 32 1 o4 03316 INDIANGRDSP1 04 1863 000015 32 1 04 03317 INDN GRDNSP2 04 1863 000015 32 1 04 03318 HORSETRAPSPR 04 1863 000015 32 1 04 03320 WILLOWCRSPR1 04 1863 000015 32 1 04 03321 WILLOWCRSPR2 04 1863 000015 32 1 04 03322 BURNT CABN S 04 1863 000015 32 1 04 03323 STUDHORSESPR 04 1863 000015 32 1 04 03324 JE'IT SPR 04 1863 000015 32 1 04 03326 HARMON 04 1863 000015 32 1 04 03327 DAVE SPR 04 1863 000015 32 1 04 03328 JOE SPR 04 1863 000015 32 1 04 03333 STEVENS SPR 04 1863 000025 32 1 04 03334 WEST 4MILESP 04 1863 000025 32 1 04 03335 FOURMILE SPR 04 1863 000025 32 1 04 03336 GOLDEN IRISS 04 1863 000025 32 1 04 03337 GOLDEN IRIS2 04 1863 000025 32 1 04 03338 BARREL SPR 04 1863 000015 32 1 04 03339 LFCTTNWD SPR 04 1863 000025 32 1 04 03340 CTTNWOOD SPR 04 000025 32 1 04 03341 L CTTNWD SPR 04 1863 000025 32 1 04 03342 GALE SPR 04 1863 000015 32 1 04 03343 BANK SPR 04 1863 000015 32 1 04 03344 UPPERMUDSPR 04 1863 000015 32 1 o4 03345 L MUJ) SPR 04 1863 000015 32 1 04 03346 WARM SPR 04 1863 000015 32 1 04 03347 WARM SPR 1 04 1863 000015 32 1 04 03348 WARM SPR 2 04 1863 000015 32 1 04 03349 WARM SPR 3 04 1863 000015 32 1 04 03350 MUSTANG SPR 04 1863 000015 32 1 04 03351 BOTTOM SPR 04 1863 000015 32 1 04 03352 DRY CANYON S 04 1863 000025 32 1 04 03353 RIGHTFORKSPR 04 1863 000025 32 1 o4 03354 CTTNWD BSNSP 04 1863 000025 32 1 04 03355 BARNEY MDWSP 04 1863 000025 32 1 04 03356 E BARNEY MSP 04 1863 000025 32 1 04 03357 LEFT FORKSPR 04 1863 000025 32 1 04 03358 BARNEY TRSPR 04 1863 000025 32 1 04 03370 TOMS CAN SPR o4 1863 000025 32 1 04 03371 WALL CAN 1SP 04 1863 000015 32 1 04 03372 WALL CAN 2 04 1863 000015 32 1 04 03373 WALL CAN 3 S 04 1863 000015 32 1 04 03374 WALL CAN 4SP 04 1863 000015 32 ·1 04 03375 CHINAGARDN S 04 1863 000015 32 1 04 03376 BOYD CAN SPR 04 1863 000025
158 of 182

4/14/95 11:05:59 AM Database WIS Query FOIA2 Page 8
TOIYABE CLAIMS SUBMI'ITED TO NV STATE ENGINEER
STATE US_OTHER RANGER_DT ST_FILE_NO SOURCE_NAME PURP DUB_ YR CFS _1 --------------------------------------------------------------------------32 1 04 03377 ANTELOPE SPR 04 1863 000025 32 1 04 03378 U ANTELOPESP 04 1863 000025 32 1 04 03379 HORSE CAN 3 04 1863 000025 32 1 04 03380 WOODCANYONSP 04 1863 000025 32 1 04 03745 Q SPRING 01 1867 000015 32 1 04 03746 BOX SPRING 04 1867 000015 32 1 04 03747 TRIPLE SPR . 04 1867 000015 32 1 04 03748 TEMPL SP 1 04 1863 000015 32 1 04 03749 TEMPLE SPR 2 04 1863 000015 32 1 04 03750 TEMPLE SPR 3 04 1863 000015 32 1 04 03751 BULL FRAME S 04 1863 000015 32 1 04 03752 LOWER REB SP 04 1870 000015 32 1 04 03753 REBELLION SP 04 1863 000015 32 1 04 03754 WARREN SPR 04 1863 000015 32 1 04 03755 PROSPECT SP1 04 1863 000015 32 1 04 03756 PROSPECT SP2 04 1863 000015 32 1 04 03757 LOWER ANTONE 04 1863 000015 32 1 04 03758 FLOWER MINE 04 1863 000015 32 1 04 03772 BROWN TROUT 04 1863 000015 32 1 04 03774 HOOPER SPR 04 1863 000015 32 1 04 03776 BITTERBRUSHS 04 1863 000015 32 1 04 03777 SAGEHENSPR#2 04 1863 000015 32 1 04 03778 SAGEHENSPR#1 04 1863 000015 32 1 04 03779 LARK SP 04 1863 000015 32 1 04 03781 BOSCOVICH SP 04 1863 000015 32 1 04 03782 KINGBIRD SPR 04 1863 000015 32 1 04 03783 RED ROCK SPR 04 1863 000015 32 1 04 03784 A SPRING 04 1863 000015 32 1 04 03786 SAPSUCKER SP 04 1863 000015 32 1 04 03787 FLICKER SPR 04 1863 000015 32 1 04 03789 CUTOFF SPR 2 04 1863 000015 32 1 04 03790 CUTOFF SPR 1 04 1863 000015 32 1 04 03792 TOWHEE SPR 04 1863 000015 32 1 04 03794 SCUFFE SPR 01 1870 000015 32 1 04 03794 SCUFFES SPR 01 1870 000015 32 1 04 03794 UP SCUFFESSP 01 1870 000015 32 1 04 03795 LTTABLEMTSPR 04 1863 000015 32 1 04 03796 LONE PINE SP 04 1863 000015 32 1 04 03797 PINE TREE SP 04 1863 000015 32 1 04 03799 TRAIL.SPR 04 1863 000015 32 1 04 03800 CORCORANDIVS 04 1863 000015 32 1 04 03801 BEND SPRS 04 1863 000015 32 1 04 03802 NF CORCORANS 04 1863 000015 32 1 04 03803 BARLEY CR 01 1863 000080 32 1 04 03805 DRY FORK SPR 04 1863 000015 32 1 04 03806 UP N WATTLES 04 1863 000015 32 1 04 03807 ELK SPRS 04 1863 000015 32 1 04 03808 ZELINDA SPR 04 1863 000015 32 1 04 03810 N WATTLES SP 04 1863 000015 32 1 04 03811 N TABLEMTNSP 04 1863 000015 32 1 04 03812 N FORK SPR#2 04 1863 000015
159 of 182

4/14/95 11:05:59 AM Database WIS Query FOIA2 Page 9
TOIYABE CLAIMS SUBMITTED TO NV STATE ENGINEER
STATE US_OTHER RANGER_DT ST_FILE_NO SOURCE_NAME PURP DUB_ YR CFS _1 --------------------------------------------------------------------------32 1 04 03813 L FORK SPR#4 o4 1863 000015 32 1 04 03814 SO FORK SPR1 04 1863 000015 32 1 04 03815 N FORK SPR#3 04 1863 000015 32 1 04 03818 CLEAR LAKE 04 1863 000015 32 1 04 03821 NORTH TRAIL 04 1863 000015 32 1 04 03822 CHICKADEE SP 04 1863 000015 32 1 04 03824 N FORK SPR#1 o4 000015 32 1 04 03829 RAVEN SPR o4 1863 000015 32 1 04 03830 SMALL SPR 04 1863 000015 32 1 04 03831 CRAIG SPR 04 1863 000015 32 1 04 03832 BOLT SPR 04 1863 000015 32 1 04 03833 UPPER ANTONE 04 1863 000015 32 1 04 03834 STEEP SPR 04 1863 000015 32 1 o4 03835 LISA SPR 04 1863 000015 32 1 04 03836 BULL SPR 04 1863 000015 32 1 04 03841 TITMOUSE SPR 04 1863 000015 32 1 04 03842 SWALLOW SPR 04 1863 000015 32 1 04 03843 BROTHERTONS 04 1863 000015 32 1 04 03844 DANE SPR 04 1863 000015 32 1 04 03846 S FORK SPR#2 04 1863 000015 32 1 04 03848 MOSQUITOSPR4 04 1863 000015 32 1 04 03852 L FORK SPR#1 04 1863 000015 32 1 04 03853 L FORK SPR#2 04 1863 000015 32 1 04 03854 DAME 1 04 1863 000015 32 1 04 03855 CHAT SPR 04 1863 000015 32 1 04 03856 IRIS SPRING 04 1863 000015 32 1 04 03857 MID TRAIL SP 04 1863 000015 32 1 04 03858 HIDDEN SPR 04 1902 000015 32 1 04 03860 VIREO SPR 04 1863 000015 32 1 04 03861 WATERFALL 1 04 1863 000015 32 1 04 03862 SHRIKE SPR 04 1863 000015 32 1 04 03865 GEORGES SPR 04 1863 000015 32 1 04 03867 CAMP SPR 3 04 1863 000015 32 1 04 03868 CAMP SPRS 04 1863 000015 32 1 04 03869 SPRAY SPR 1 04 1863 000015 32 1 04 03870 SPRAY SPR 2 04 1863 000015 32 1 04 03871 MAGPIE SPR 04 1863 000015 32 1 04 03872 SEEGOUPEN SP 04 000015 32 1 04 03875 COWBIRD SPR 04 1863 000015 32 1 04 03876 FLYCATCHER S 04 1863 000015 32 1 04 03880 THRUSH SPR 04 1863 000015 32 1 04 03881 NARROWS SPR 04 1863 000015 32 1 04 03884 SAWMILL SPR 04 1863 000015 32 1 04 03885 SO FORK SPR2 04 000015 32 1 04 03886 HAYSTACKSPRl 04 1863 000015 32 1 04 03887 HAYSTACK SPR 04 1863 000015 32 1 04 03888 DANE SPR 2 04 1863 000015 32 1 04 03889 DAME 3 04 1863 000015 32 1 04 03890 BED SPR 04 1863 000015 32 .1 04 03891 ORIOLE SPR 04 1863 000015 32 1 04 03892 BLACKBIRD SP 04 000015
160 of 182

-----
4/14/95 11:05:59 AM Database WIS Query FOIA2 Page 10
TOIYABE CLAIMS SUBMITTED TO NV STATE ENGINEER
STATE US_OTHER RANGER_DT ST_FILE_NO SOURCE_NAME PURP DUB YR CFS 1 - ---------------------------------------------------------------------------32 1 04 03893 COPPRNAUT SP 04 1863 000015 32 1 04 03894 MUSTANG SPR 04 1863 000015 32 1 04 03895 HEAD CUT SP 04 1863 000015 32 1 04 03896 BUSHTIT SPR 04 1863 000015 32 1 04 03897 HAYSTACK SPR 04 1863 000015 32 1 04 03898 BIG MEADOW 3 04 1863 000015 32 1 04 03898 JETT CREEK - 09 000000 32 1 04 03899 BIG MEADOW 2 04 1863 000015 32 1 04 03900 BIG MEADOW 1 04 1863 000015 32 1 04 03901 NUTCRACKER S 04 1863 000015 32 1 04 03902 .WREN SP 04 1863 000015 32 1 04 03903 LOWER EYRIE 04 1863 000015 32 1 04 03904 UPPER EYRIE 04 1863 000015 32 1 04 03905 UP HAYSTACK 04 1863 000015 32 1 04 03906 BASIN SPR 04 1863 000015 32 1 04 03907 I SPR 04 1863 000015 32 1 04 03908 PALMAN SPR 04 1863 000015 32 1 04 03909 LOW HAYSTACK 04 1863 000015 32 1 04 03910 OWL SPR 04 1863 000015 32 1 04 03911 036 SPR 04 1863 000015 32 1 04 03912 STONE CORRAL 04 1863 000015 32 1 04 03913 UP STONE COR 04 1863 000015 32 1 04 03914 COOPERS HAWK 04 1863 000015 32 1 04 03915 EAGLE SP 04 1863 000015 32 1 04 03916 SOUTH SPR 04 1863 000015 32 1 04 03917 KINGFISHER S 04 1863 000015 32 1 04 03918 IRISH SPR 04 1863 000015 32 1 04 03919 JANS SPR 04 1863 000015 32 1 04 03920 CLOVER SPR 2 04 1863 000015 32 1 04 03921 WLLW BSN SPR 04 1863 000015 32 1 04 03922 ELKHORN SPR 04 1863 000015 32 1 04 03923 WHITE ROCK S 04 1863 000015 32 1 04 03924 UPPER ELKHOR 04 1863 000015 32 1 04 03925 SEEP SPR 04 1863 000015 32 1 04 03926 LOW WATTLES 04 1863 000015 32 1 04 03927 DRY WASH SPR 04 1863 000015 32 1 04 03929 CODY SPRING 04 1863 000015 32 1 04 03930 LOGAN SPRING 04 000015 32 1 04 03931 LOW RED ROCK 04 1863 000015 32 1 04 03932 UP RED ROCK 04 1863 000015 32 1 04 03933 TANAGER SPR 04 1863 000015 32 1 04 03934 GROSBEAK SP 04 1863 000015 32 1 04 03938 SISKIN SPR 04 1863 000015 32 1 04 03939 CROSSBILL SP 04 1863 000015 32 1 04 03940 JUNCO SPR 04 1863 000015 32 1 04 03942 SHREW SPR 04 1863 000015 32 1 04 03943 MOLE SPR 04 1863 000015 32 1 04 03944 BAT SPR 04 1863 000015 32 1 04 03945 RINGTAIL SPR 04 1863 000015 32 1 04 03946 WEASEL SPR 04 1863 000015 32 1 04 03947 BADGER SPR 04 1863 000015
161 of 182

't/J.'t/~:> .ll : U:>: :>~ A~l Database WIS Query FOIA2 Page 11
TOIYABE CLAIMS SUBMITI'ED TO NV STATE ENGINEER
STATE US_OTHER RANGER_DT ST_FILE_NO SOURCE_NAME PURP DUB YR CFS 1 - ---------------------------------------------------------------------------32 1 04 03948 SCUFFE SPR 01 1870 000015 32 1 04 04005 FITZPATRICKS 04 1863 000015 32 1 04 04006 INDIAN SPR 04 1863 000015 32 1 04 04108 JACKRABBIT S 04 1863 000015 32 1 04 04109 COTTONTAIL 1 04 1863 000015 32 1 04 04110 CORCORAN CRK 04 1870 000015 32 1 04 04110 CORCORAN SPS 04 1863 000015 32 1 04 04110 HAND SPRING 04 000015 32 1 04 04110 LOWER CORCOR 04 1863 000015 32 1 04 04110 SIDE SPR 04 1863 000015 32 1 04 04110 STONEHOUSE S 04 1863 000015 32 1 04 04111 BUNTING SPR 04 1863 000015 32 1 04 04111 GOLDFINCH SP 04 1863 000015 32 1 04 04111 PASCO CREEK 04 1885 000015 32 1 04 04112 BARLEY CREEK 04 1900 000020 32 1 04 04112 FAWN SPR 04 1863 000015 32 1 04 04112 LOWER YCC SP 04 1863 000015 32 1 04 04112 ROBIN SP 04 1863 000015 32 1 04 04113 ANDREWS CRK 04 1874 000015 32 1 04 04115 MEADOW CREEK 04 1867 000015 32 1 04 04115 PINE CREEK 04 1874 000015 32 1 04 04116 TRAIL CREEK 04 1874 000015 32 1 04 04126 BIGMEADOWSSP 04 1863 000015 32 1 04 04126 FOUR MILE SP 04 1863 000015 32 1 04 04126 GNATCATCHER 04 1863 000015 32 1 04 04126 JAY SPR 04 1863 000015 32 1 04 04126 L FORK SPR#3 04 1863 000015 32 1 04 04126 L FORK SPR#5 04 1863 000015 32 1 04 04126 LOW CRANE SP 04 1863 000015 32 1 04 04126 MOSQUITOSP#1 04 1863 000015 32 1 04 04126 MOSQUITOSP#5 04 1863 000015 32 1 04 04126 PHOEBE 1 04 1863 000015 32 1 04 04126 PHOEBE 2 04 1863 000015 32 1 04 04126 PHOEBE 3 04 1863 000015 32 1 04 04126 S FORK SPR#1 04 1863 000015 32 1 \ 04 04126 S FORK SPR#3 04 1863 000015 32 1 04 04126 UP BIG MDWSP 04 1863 000015 32 1 04 04126 UP CRANE SPR 04 1863 000015 32 1 04 04126 WARBLER SPR. 04 1863 000015 32 1 04 04126 WATERFALL 2 04 1863 000015 32 1 04 04908 BELMONT SPR 01 000000 32 1 04 05533 PEAVINE CR 06 000000 32 1 04 05798 CAINE SPR 02 000000 32 1 04 05799 MUD SPR 04 000000 32 1 04 05980 CEDAR CRRLSP 04 000000 32 1 04 05981 WOOD CHPR SP 04 000000 32 1 04 06324 N TWIN RIVER 06 000000 32 1 04 06395 S TWIN RIVER 09 000000 32 1 04 06663 CLURDLE CRK 06 000000 32 ·1 04 06694 RGR STA SPR 01 000000 32 1 04 08099 PALOALTO SPR 01 000000
.----·· --
162 of 182

lff-,14/95 11:05:59 AM Database WIS Query FOIA2 Page 12
TOIYABE CLAIMS SUBMITIED TO NV STATE ENGINEER
STATE US_OTHER RANGER_DT ST_FILE_NO SOURCE_NAME PURP DUB YR CFS 1 - ---------------------------------------------------------------------------32 1 04 09559 UNNAMED SPR 09 000000 32 1 -04 10195 PEAVINE CR 09 000000 32 1 04 10195 UNNAMED SPRS 08 000000 32 1 o4 10530 WILLOW SPR 12 000000 32 1 04 10606 MEADOW SPR 01 1863 000050 32 1 04 12129 06 000000 32 1 o4 12570 PEAVINE CR 06 000000 32 1 04 13179 WELL 01 000000 32 1 04 13612 BELCHER CR 09 000000 32 1 04 15272 BELCHER CR 06 000000 32 1 04 17416 INKHOUSE CR 01 000000 32 1 04 20632 PINE CREEK 02 1962 000004 32 1 04 21657 WELL 02 000000 32 1 04 26282 UNNAMED SPR 09 000000 32 1 04 28339 UNNAMED CR 06 000000 32 1 04 39467 UNNAMED SPR 02 1978 000086 32 1 04 39468 PEAVINE CG S 02 1936 000015 32 1 04 41367 SAULSBURYWEL 04 1950 000015 32 1 04 022469 GNAT SPRING 4 1905 .015 32 1 05 10305 MAZEY SPR 1 1943 0.500 32 1 05 A 5560 TROUGH SPR 4 1943 0.020 32 1 05 A 9539 DEER CR SPR 1 1936 1.00 32 1 05 A 10146 STANLEY B SP 1 1937 0.0211 32 1 05 A 10220 SCOUT SPRING 1 1938 0.011 32 1 05 A 10306 RAINBOW SPR 1 1943 0.600 32 1 05 A 12828 MCFARLAND SP 1 1949 0.05 32 1 05 A 12829 WHISKEY SPR 1 1949 0.05 32 1 05 A 12838 CAVE SPR 1 1 1949 0.089 32 1 05 A 13493 TWINFALLS SP 1 1950 0.013 32 1 05 A 16764 EAST SPRING 7 1955 0.0134 32 1 05 A 22302 MARYJANE WELL 1 1964 0.005 32 1 05 A 36347 WELL 1 1978 0.100 32 1 05 A 39471 WOOD SPRING 7 1991 000015 32 1 05 A 39472 SAWMILL SPR.#1 7 1979 0.015 32 1 05 A 39473 SAWMILL SPR. #2 7 1979 0.015 32 1 05 A 39474 TROUGH SPR 7 1979 000015 32 1 05 A 39476 STEEP SPRING 7 1979 0.015 32 1 05 A 39477 CLARK CYN SEEP 7 1979 000015 32 1 05 A 39481 L SCOUT SPR 7 1979 0.015 32 1 05 A 39482 JOHNS-SPR 7 1979 0.015 32 1 05 A 39483 HIGH MACK SPR 7 1979 0.015 32 1 05 A 39484 MIDL MACKS SPR 7 1979 0.015 32 1 05 A 39485 LWR MACKS SP 7 1979 0.015 32 1 05 A 39486 MUD SPRINGS 7 1979 0.015 32 1 05 A 39487 GLEN SPRINGS 7 1979 0.015 32 1 05 A 39488 WEST MUD SPRING 7 1979 0.015 32 1 05 A 39489 BIGFALLS SPR 7 1979 0.015 32 1 05 A 39490 CHARLSTN SPR 7 1979 000015 32 1 05 A 39491 PEAK SPRING 7 1979 000015 32 1 05 A 40281 WALLACE CYN SPR 7 1980 000015 32 1 05 A 40282 TWO SPRINGS 7 1980 0.015
163 of 182

----
- 4/1.'4J95 11:05:59 AM Database WIS Query FOIA2 Page 13
TOIYABE CLAIMS SUBMITTED TO NV STATE ENGINEER
STATE US_ OTHER RANGER_DT ST_FILE_NO SOURCE_NAME PURP DUB YR CFS 1 - ---------------------------------------------------------------------------32 1 05 A 40283 MARYJANE FALLS 7 1980 0.015 32 1 05 A 40284 SNOWSLIDE SP 7 1980 0.015. 32 1 05 A 40287 MIKULICH- SPR 7 1980 0.004 32 1 05 A 40312 TRAIL CN SPR 7 0.015 32 1 05 A 40313 MUMMY MTN SP 7 1980 0.015 32 1 05 A 40314 N.FK SPRING #1 7 1980 0.015 32 1 05 A 40315 N. FK. SPR #2 - 7 1980 0.015 32 1 05 A 40316 N. FK SPR.#3 7 1980 0.015 32 1 05 A 40317 RBRS ROOST SPR 7 1980 0.015 32 1 05 A 40318 UPPR DEER CR SP 7 1980 0.015 32 1 05 A 40341 ~ SPR 7 1980 0.015 32 1 05 A 40342 HILLSIDE SPR 7 1980 0.015 32 1 05 A 40344 EASTSPR 2 7 1980 0.015 32 1 05 A 40345 LOOP SPRING 7 1980 0.015 32 1 05 A 40346 DEER CREEK 7 0.015 32 1 05 A 40346 DEER CREEK 7 1980 0.015 32 1 05 A 50843 SKI LEE WELL #1 2 1980 0.086 32 1 05 A 50845 TWO SPRINGS 2 0.015 32 1 05 A 53222 THREE SPR 2 1944 0.09 32 1 05 A 54885 DEE BEE SPRING 7 0.001 32 1 07 02803 KELLI SPR 04 1863 000015 32 1 07 04050 UNNAMED SPR 04 000025
164 of 182

Ecological Applications, 19(6), 2009, pp. 1536-1545 © 2009 by the Ecologic-al Society of America
Interaction of historical and nonhistorical disturbances maintains native plant communities
K. w. DAVIES/ T. J. SVEJCAR, AND J .D. BATES
• J
I' #633
United States Departmem of Agriculture-Agricultural Research Service, Eastern Oregon Agricultural Research Center, 67826-A Highway 205, Burns, Oregon 97720 USA
Abstract. Historical disturbance regimes are often considered a critical element in maintaining native plant communities. However, the response of plant communities to disturbance may be fundamentally altered as a consequence of invasive plants, climate change, or prior disturbances. The appropriateness of historical disturbance patterns under modern conditions and the interactions among disturbances are issues that ecologists must address to protect and restore native plant communities. We evaluated the response of Artemisia tridentata ssp. wyomingensis (Beetle & A. Young) S.L. Welsh plant communities to their historical disturbance regime compared to other disturbance regimes. The historical disturbance regime of these plant communities was periodic fires with minimal grazing by large herbivores. We also investigated the influence of prior disturbance (grazing) on the response of these communities to subsequent disturbance (burning). Treatments were: (1) ungrazed (livestock grazing excluded since 1936) and unburned, (2) grazed and unburned, (3) ungrazed and burned (burned in 1993), and (4) grazed and burned. The ungrazed-burned treatment emulated the historical disturbance regime. Vegetation cover, density, and biomass production were measured the 12th, 13th, and 14th year post-burning. Prior to burning the presence of Bromus tectorum L., an exotic annual grass, was minimal ( <0.5% cover), and vegetation characteristics were similar between grazed and ungrazed treatments. However, /_.litter accumulation was almost twofold greater in ungrazed than in grazed treatments. Long-'" term grazing exclusion followed by burning resulted in a substantial B. tectorum invasion, but burning the grazed areas did not produce an invasion. The ungrazed-burned treatment also had less perennial vegetation than other treatments. The accumulation of litter (fuel) in ungrazed treatments may have resulted in greater fire-induced mortality of perennial vegetation in ungrazed compared to grazed treatments. Our results demonstrate that prior disturbances exert a strong influence on the response of plant communities to subsequent disturbances and suggest that low-severity disturbances may be needed in some plant communities to increase their resilience to more severe disturbances. Modern deviations from historical conditions can alter ecosystem response to disturbances, thus restoring the historical disturbance regime may not be an appropriate strategy for all ecosystems.
Key words: Artemisia tridentata; Bromus tectorum; cheatgrass; ecosystem management;fire; grazing; historical conditions; invasive plants; Northern Great Basin E..>::perimental Range, Oregon, USA; prior disturbance; sagebrush.
INTRODUCTION
Historical disturbances are often considered a requirement to maintain native plant communities, and this has resulted in the reconstruction of historical disturbance regimes to direct ecosystem management. The best management of ecosystems has been assumed to be accomplished by reestablishing historical disturbance regimes (Baker 1994, Cissel eta!. 1999, Suding et a!. 2004, Wright and Agee 2004). Generally, it is believed that the greater the deviation from past disturbance patterns, the more negative the ecosystem impacts. Restoration of ecosystems can often be accomplished by reinstating historical disturbance re-
Manuscript received 20 January 2009; accepted 23 January 2009. Corresponding Editor: E. Cuevas.
1 E-mail: [email protected]
gimes (Baker 1993, 1994, Suding eta!. 2004). However, some ecosystems have experienced irrevocable changes in environmental conditions and biotic potentials that could potentially alter the response of the plant community to disturbance (Suding eta!. 2004). For example, climate change or invasive plants may result in a different plant community response to disturbance than expected under historical conditions (Millar and Woolfenden 1999, Suding et al. 2004).
Another possible deviation from historical conditions that could have profound implications to reinstating historical disturbance regimes is previous disturbances. Prior disturbances have been associated with an increasing severity of subsequent disturbances (Platt et al. 2002, Kulakowski and Veblen 2007), and successive disturbances may have compounding negative effects (Paine et a!. 1998). However, interactions among
1536
165 of 182
Cliff
Highlight
Cliff
Highlight
Cliff
Highlight
Cliff
Highlight
Cliff
Highlight

September 2009 HISTORICAL AND NONHISTORICAL DISTURBANCE 1537
different disturbances have seldom been empirically tested. To protect and restore native plant communities, it is critical to understand the influence of prior disturbances on subsequent disturbances and to determine if successive disturbances have a compounding effect. The outcome of reintroducing historical disturbances is not clear, especially with the threat of invasive plants and other deviations from past conditions.
Deviations from historical disturbance regimes, such as livestock grazing of plant communities that did not evolve with large numbers of large herbivores, are generally considered negative. Plant communities that did not evolve with large herbivore pressure are not expected to be able to tolerate livestock grazing (Fleischner 1994, Noss 1994, Belsky and Blumenthal 1997, Jones 2000). In a review of the literature without differentiating between grazing utilization levels, Jones (2000) suggested that livestock grazing has detrimental effects on arid ecosystems of North American that evolved with few large herbivores. However, there is some disagreement on the effects of livestock grazing of these plant communities depending on level of utilization (e.g., Rice and Westoby 1978, West et al. 1984, Rickard 1985, Eckert and Spencer 1986, 1987, Courtois et al. 2004, Manier and Hobbs 2006). Currently, many of these plant communities that did not evolve with large herbivores are grazed by domestic livestock and have the potential to bum, thus a better understanding of the effects of interactions between historical and nonhistorical disturbances is critical. Returning plant communities to their historical disturbance regime would involve prescribed burning of some plant communities and potentially removing domestic livestock. The impact of returning the historical disturbance regime remains uncertain under current conditions. For exan1ple, the response of Artemisia tridentata ssp. wyomingensis (Beetle & A. Young) S.L. Welsh plant communities to their historical disturbance regime of periodic fire without domestic livestock grazing is unknown under modem conditions.
Artemisia tridentata ssp. wyomingensis (hereafter "A. tridentata") plant communities of the Great Basin and Intermountain West (USA) are estimated to have a historical fire-return interval of 50 to > 100 years (Wright and Bailey 1982, Mensing et a!. 2006). The plant communities of the Great Basin and Intermountain West evolved with few large herbivores, and thus domestic livestock use of these plant communities is considered a deviation from the historical disturbance regime (Mack and Thompson 1982). The historical disturbance regime for these communities would have been periodic fires without domestic livestock grazing.
. European settlement of western Northern America has generally elongated fire-return interval in late sera! A. tridentata plant communities (Davies et al. 2008) and introduced domestic livestock to this region in large numbers in the mid-to-late 1800s (Oliphant 1968).
In many ecosystems there is a threat of invasion by exotic species following disturbance, which represents a risk not present during much of the past. Reinstatement of the historical disturbance regime in A. tridentata plant communities raises some concerns because of the threat of invasion by Bromus tectorum L., an exotic annual grass, following fire. B. tectorum invasion can promote fires that are too frequent for the reestablishment of A. tridentata and detrimental to native herbaceous vegetation (Stewart and Hull 1949, Whisenant 1990). Modernday burning may promote ilie invasion of these communities by B. tectorum (Stewart and Hull 1949, Young and Allen 1997). The initial increase in resources with burning (Hobbs and Schimel 1984, Young and Allen 1997, Davies et a!. 2007a) would favor B. tectorum invasion (Young and Allen 1997). However, Davies et al. (2007a) demonstrated that prescribed fall burning of late sera! A. tridentata plant communities could be accomplished without promoting B. tectorum invasion. Burned A. tridentata communities were more resistant to B. tectorum invasion than unburned communities in the fourth growing season post-burn (Davies et al. 2008). Similar to fire, grazing by domestic livestock has been identified as a causal agent of B. tectorum invasion by reducing the ability of the native plant communities to resist invasion and by dispersing B. tectorum seeds (Daubenmire 1970, Mack 1981, Knapp 1996). However, B. tectorum has been found in plant communities that have experienced minimal or no domestic livestock grazing (Svejcar and Tausch 1991, Davies et al. 2006).
To evaluate the response of native plant communities to their historical disturbance regimes under modern conditions and to determine the influence of prior disturbances on subsequent disturbances, we investigated the effects of historical and nonhistorical disturbance patterns to A. tridentata plant communities in the northern Great Basin. Management directed by the historical disturbance regime would exclude livestock grazing and periodically apply prescribed fire to late sera! A. tridentata plant communities. We speculated that burning of plant communities grazed by livestock would have more negative impacts on desirable vegetation than would burning of plant communities protected from livestock use, because large herbivore grazing is a deviation from the historical disturbance regime of these communities. Thus, we expected to see a compounding effect (Paine et al. 1998) when fire follows long-term use by large herbivores. We also speculated that the ungrazed compared to the grazed treatment would have greater cover, density, and biomass production of native grasses and forbs. We hypothesized that (I) deviations from historical disturbance regimes would negatively impact native plant communities, (2) prior disturbances would significantly impact subsequent disturbances, and (3) successive disturbances, i.e., long-term grazing followed by fire, would have compounding negative effects on native plant communities.
166 of 182

1538 K. W. DAVIES ET AL. Ecological Applications Vol. 19, No.6
METHODS
Study area
The study was conducted at the Northern Great Basin Experimental Range (NGBER) in southeastern Oregon (43°29' N, 119°43' W) about 56 km west of Burns, Oregon, USA. Climate is typical of the northern Great Basin with cool, wet winters and hot, dry summers. The NGBER received on average 300 mm of precipitation annually during the past 50 years (1956-2005). Precipitation during the sampling years was 117%, 115%, and 70% of the long-term average in 2004-2005, 2005-2006, and 2006-2007, respectively. Elevation at the study sites is -1400 m above sea level and topography is generally flat (slopes 0-3°). Soils at the study sites are coarseloamy, mixed frigid, Orthidic Durixerolls, loamy mixed, frigid, shallow Aridic Durixerolls, and coarse-loamy Aridic Durie Haploxerolls. Artemisia tridentata ssp. wyomingensis is the dominant shrub at all sites and dominant bunchgrass species varies by site. Achnatherum thurberianum (Piper) Barkworth (Thurber's needlegrass), Festuca idahoensis Elmer (Idaho fescue), Koeleria macrantha (Ledeb.) J.A. Schultes (prairie junegrass), Pseudoroegneria spicata (Pursh) A. Love (bluebunch wheatgrass), and Elymus elymoides (Raf.) Swezey (squirreltail) are common large perennial bunchgrasses on the study sites.
Experimental design
To determine the effects of grazing and fire on vegetation, a randomized block with a complete twoby-two factorial design was used. Treatments were applied at three different sites with different herbaceous species composition and soil characteristics. Treatments were the factorial combinations of burned or unburned and grazed or ungrazed: (I) ungrazed and unburned, (2) ungrazed and burned, (3) grazed and unburned, and (4) grazed and burned. Ungrazed treatments were 2-ha livestock-grazing exclosures established in 1936. Thus, prior to 1936 they experienced livestock grazing. Native herbivores had access to vegetation inside the exclosures. The grazed treatment plots were located, in 1936, adjacent to the exclosures and on the same soil type as the exclosures. Density data collected in 1937 revealed no differences in the densities of Poa secunda J. Pres], large perennial grasses, annual grasses, perennial forbs, and annual forbs between inside and outside the exclosures (P > 0.05). Bromus tectorum was not present inside or outside the exclosures in 1937. The grazed treatments adjacent to the exclosures were grazed by cattle until 1990. Livestock grazing pressure was moderate, 30-40% use of available forage. From 1938 to 1949livestock use was rotation grazing with stocking rates determined from range surveys conducted in 1938 and 1944. From 1949 to 1990, the grazing program was a deferred-rotation system with occasional years of complete rest. Grazing treatments were not identical among sites because the sites were in three different
65-ha pastures. In 1992 and 1993 the cover, density, and biomass production of herbaceous species were not statistically different between the ungrazed and grazed treatments (Rose et al. 1994). However, in both years litter biomass was almost two-fold higher in the ex closures compared to outside (Rose et al. 1994). No fires occurred at the study sites during the study (1936-2007), except for the prescribed burn treatments. In late September ofl993, prescribed burning treatments were applied as strip-head fires using drip torches to ungrazed and grazed 0.4-ha plots at each site. Air temperature was between 20° and 27°C, wind speeds varied from 6 to 21 kmfhr, and relative humidity was between 8% and 22% during the prescribed burns. Fine fuel loads (standing biomass and litter) averaged across all sites was 689 kg/ha in grazed treatments and 793 kg/ha in ungrazed treatments prior to the burning (Rose et al. 1994 ). Fine fuel loads prior to burning were measured using 30, 0.2-m2 frames per treatment.
Measurements
Vegetation characteristics were sampled in 2005, 2006, and 2007, the 12th, 13th, and 14th years post-burning, respectively. Sample sizes were optimized through the use of previous data from this ecosystem (Davies et al. 2006, 2007a, Bates et al. 2009). Each treatment replicate was sampled using a 30 X 60 m plot centered in the treatment area to limit edge effects. Five 30-m transects, spaced at 15-m intervals, were established in the 30 X
60 m plot. Herbaceous canopy cover was estimated and density was measured by species inside 40 X 50 em frames (0.2 m2
) located at 3-m intervals on each transect line, resulting in 10 frames per transect and 50 frames per plot. Bare ground, moss, and litter cover were also measured in the 40 X 50 em frames. Shrub cover by species was measured by line-intercept method (Canfield 1941) along the five 30-m transect lines per plot. Shrub density by species was measured by counting all individuals rooted in five 2 X 30 m belt transects. Herbaceous biomass by functional group was determined in late June in each year by clipping, oven drying, and then. weighing the current year's growth from 25 randomly located 1-m2 frames per treatment replicate.
Statistical analysis
Repeated-measures analysis of variances (ANOVA) using the Proc Mix procedure in SAS version 9.1 (SAS Institute 2002) were used to determine the influence of grazing and fire on vegetation characteristics. Fixed variables were grazed and burned treatments and their interaction. Random variables were sites and site-bytreatment interactions. Covariance structures were determined using the Akaike's information criterion (Littell et al. 1996). Data were tested for normality using the univariate procedure in SAS version 9.1 (SAS Institute 2002). Data that violated assumptions of normality were log-transformed. Response variable means are reported with standard errors (mean ± SE).
167 of 182

September 2009 HISTORICAL AND NONHISTORICAL DISTURBANCE 1539
14 *
- Grazed-burned 12 rzz21 Ungrazed-burned
IIIIGrazed-unburned
10 !ll§§§l8l Ungrazed-unburned
;e ~
8 * * ....
~ * 0 6 0
* 4
2
0 i _.,... m
POSE PG BRTE
Functional group PF AF
Fto. I. Functional-group cover of the four treatments averaged over 2005, 2006, and 2007 at the Northern Great Basin Experimental Range, Oregon, USA. Vegetation key: POSE= Poa secunda, PG =tall perennial bunchgrass, BRTE = Bromus tectorum, PF = perennial forb, and AF = annual forb. Treatment key: ungrazed =livestock excluded since 1936, grazed = moderately grazed by livestock until 1990, burned= prescribed fall burned in 1993, and unburned= no prescribed burning. Data are means + SE; an asterisk (*) indicates significant interaction between grazing and burning treatments for that functional group (P < 0.05).
For these analyses, herbaceous cover, density, and biomass production were grouped into five functional groups: P. secunda, large native perennial grasses, B. tectorum (only annual grass present), perennial forbs, and annual forbs. P. secunda was treated as a separate perennial-grass functional group because of its smaller stature and relatively rapid phenological development compared to other perennial grasses in this ecosystem (Davies 2008, James et al. 2008). Functional groups are a common classification of plants based on physiological and morphological characteristics (Lauenroth et a!. 1978). Plant functional groups are an important and useful classification for management (Davies et a!. 2007b), also facilitate comparisons among sites with varying species composition, and simplify analysis (Boyd and Bidwell 2002).
RESULTS
Cover
The interaction between burning and grazing treatments influenced cover of all herbaceous functional groups (P < 0.01) (Fig. 1). Poa secunda cover was decreased with burning and protection from grazing prior to burning amplified this decrease (P < 0.01). Poa secunda cover was highest in the ungrazed-unburned . treatment and lowest in the ungrazed-burned treatment. The responses of large perennial bunchgrass cover to burrting varied by grazing treatment (P < 0.01). Large perennial bunchgrass cover increased with burning in the grazed treatments, while it was not affected by
burning in ungrazed treatments. Large perennial bunchgrass cover was greatest in the grazed burned treatment and lowest in the ungrazed-burned treatment. Bromus tectorum cover appears to generally increase with burning; however, the magnitude of the increase was larger in ungrazed compared to grazed treatments (P < 0.01). Bromus tectorum cover was 8.6-fold greater in the ungrazed-burned treatment than in any of the other treatments. Similarly, annual forb cover generally increased with burning and its greatest increase was in the ungrazed burned treatment (P < 0.01). Annual forb cover was dominated by introduced annual forbs. Perennial forb cover was lower with grazing in the unburned treatment; however, the situation was reversed in the burned treatments with more perennial forb cover in the grazed compared to ungrazed plots (P < 0.01). The interaction between burning and grazing treatments influenced cover of moss and bare ground (P < 0.01), but not Artemesia tridentata ssp. wyomingensis or Chrysothamnus viscidiflorus (Hook.) Nutt. (green rabbitbrush) cover (P=0.34 and 0.77, respectively) (Fig. 2). Grazing, burning, and their interaction did not influence litter cover (P > 0.05). Though differences in bare ground were small, burning increased bare ground more than grazing and the grazed treatments had higher bare ground compared to ungrazed treatments (P < 0.01) . Moss cover decreased with burning, but its decrease was greater in ungrazed treatments (P < 0.01). Burning decreased A. tridentata cover and increased C. viscidifiorus cover (P = 0.04 and <0.01, respectively). Grazing
168 of 182

1540 K. W. DAVIES ET AL. Ecological Applications
Vol. 19. No.6
60
* -Grazed-burned
50 fZZ2I Ungrazed-burned Elil!ll Grazed-unburned ll88ll8Sl Ungrazed-unburned
40
;g g___ ,_
30 (]) > 0 (.)
20 ~ 10
0
*
~~Ill ... ,., ~ii Bare Utter Moss ARTR CHVI
Cover group
FIG. 2. Shrub species, litter, and moss cover, and bare ground of the four treatments averaged over 2005, 2006, and 2007 at the Northern Great Basin Experimental Range. Cover types: Bare= bare ground, ARTR =Artemisia tridentata ssp. wyomingensis, and CHVI = Chrysothamnus viscidiflorus. Treatment key: Ungrazed =livestock excluded since 1936, Grazed= moderately grazed by livestock until 1990, Burned= prescribed fall burned in 1993, and Unburned= no prescribed burning. Data are means+ SE; an asterisk(*) indicates significant interaction between grazing and burning treatments for that cover group (P < 0.05).
did not influence A. tridentata cover (P = 0.43), but slightly increased C. viscidiflorus cover (P = 0.05). No interactions existed between year and treatment for any of the functional groups, litter, or bare ground cover values (P > 0.05).
Density
Large perennial bunchgrass and B. tectorum densities were influenced by the interaction of burning and
600
500
400
o;" 300
~ 200 (ij .g 100 ·:;;: '6 25 c = ~ 20 "iii
ffi 15 0
10
- Grazed-burned t'ZZl Ungrazed-burned !li!lll!l!li!ll Grazed-unburned ~ Ungrazed-unburned
*
POSE PG
grazing (P < 0.01) (Fig. 3). Chrysothamnus viscidiflorus density was also influenced by the interaction between burning and grazing (P < 0.01). Poa secunda, perennial forb, annual forb, and A. tridentata ssp. wyomingensis densities were not influenced by the interaction between burning and grazing treatments (P > 0.05). Burning decreased perennial bunchgrass density in the ungrazed treatment, but did not influence bunchgrass density in the grazed treatment (P < 0.01). Large perennial
*
in
BRTE PF AF Functional group
FIG. 3. Functional-group density of the four treatments averaged over 2005, 2006, and 2007 at the Northern Great Basin Experimental Range. Functional groups and treatments are as in Fig. I. Data are means+ SE; an asterisk (*) indicates significant interaction between grazing and burning treatments for that functional group (P < 0.05).
169 of 182

September 2009 HISTORICAL AND NONHISTORICAL DISTURBANCE 1541
* -Grazed-burned
300 lZZZl Ungrazed-burned
m ..c
~ 200
c .Q 0 100 ::; ""0 0 a.. 80 (I)
* i!i!11!1i! Grazed-unburned
t •. !ll8ll888 Ungrazed-unburned
*
~ ~
1 '
* (I) c:tt 60 E 0 iii 40
20
0 ~
I
=ii E POSE PG BRTE PF AF
Functional group
FtG. 4. Functional-group biomass production of the four treatments averaged over 2005, 2006, and 2007 at the Northern Great Basin Experimental Range. Functional groups and treatments are as in Fig. I. Data are means + SE; an asterisk (*) indicates significant interaction between grazing and burning treatments for that functional group (P < 0.05).
bunchgrass density was approximately 1.9-fold greater in the grazed-burned compared to the ungrazed-burned treatment. Burning appears to increase B. tectorum density; however, this was magnified when applied to ungrazed treatments (P < 0.01). B. tectorum density was more than 15-fold greater in the ungrazed burn treatment than any of the other treatments. Burning generally increased C. viscidiflorus density; however, the increase in C. viscidiflorus density was largest in the ungrazed-treatment (P < 0.01). C. viscidiflorus density was lowest in ungrazed-unburned (0.25 ± 0.08 individuals/m2 [mean ± SE]), followed by grazed-unburned (0.31 ± 0.10 individuals/m2), grazed-burned (0.45 ± 0.12 individualsfm\ and ungrazed-burned (0.54 ± 0.14 individualsfm2) treatment. Burning decreased P. secunda and perennial forb density (P < 0.01), but their densities were not influenced by grazing (P > 0.05). In general, annual forb density increased with burning (P = 0.02), but was not influenced by grazing (P = 0.36). Annual forb density was dominated by introduced species. Artemisia tridentata density was 6.8-fold greater in the unburned (0.34 ± 0.03 individuals/m2
) compared to the burned (0.05 ± 0.01 individuals/m2
) treatments (P = 0.04), but did not differ by grazing treatment (P=0.98). Year by treatment interactions did not influence density of any of the functional groups (P > 0.05).
Biomass
Biomass production of large perennial bunchgrass, B. )ectorum, perennial forb, and annual forb were influenced by the interaction of burning and grazing (P < 0.01) (Fig. 4). The interaction between grazing and buri).ing was not significant for P. secunda biomass production (P = 0.22). Large perennial bunchgrass
production increased with burning in the grazed treatment, but did not increase with burning in the ungrazed treatment (P < 0.01). Burning the grazed treatment increased perennial bunchgrass production 1.6-fold. Burning generally increased B. tectorum biomass production; however the magnitude was larger in the ungrazed treatments (P < 0.01). Bromus tectorum biomass production increased more than 49-fold with burning in the ungrazed treatment. Perennial forb biomass production decreased when the ungrazed treatment was burned, but was not influenced by burning in the grazed treatment (P < 0.01). Perennial forb biomass decreased three-fold when the ungrazed treatment was burned. Biomass production of annual forbs, mainly comprised of introduced species, increased with burning; however, the increase was magnified when burning ungrazed treatments (P < 0.01). Annual forb production increased 2.7-fold with burning in the ungrazed treatment and 1.5-fold with burning in the grazed treatment. The ungrazed-burned treatment was the only treatment to produce more annual than perennial herbaceous vegetation biomass. Biomass of the functional groups was not influenced by interactions between year and treatment (P > 0.05).
DISCUSSION
Individual circumstances will dictate the value of emulating historical disturbance regimes for maintaining native plant communities. Disturbance impacts may be altered by changes in climatic conditions and/or anthropogenic impacts. Further complicating the issue of reinstating historical disturbance regimes are invasive species. In our specific example, the historical disturbance regime of Artemesia tridentata ssp. wyomingensis
170 of 182

1542 K. W. DAVIES ET AL Ecological Applications Vol. 19, No. 6
FtG. 5. Photograph of the grazed and burned treatment on the left and the ungrazed and burned treatment on right, in 2007, 14 years post-fire. Treatments are adjacent to each other (note the similar ridge in the background of the photographs). Native perennial bunchgrass and the exotic annual-grass Bromus tectorum are dominating the grazed-burned and the ungrazed-burned treatments, respectively. Note the continuity of fine fuels (mainly previous year's B. tectorum tillers) in the ungrazed-bnrned compared to the grazed-burned treatment. Photo credit: K. W. Davies.
plant communities is estimated to have consisted of a 50- to > 100-year fire-return interval (Wright and Bailey 1982, Mensing et aL 2006) and a lack of large-herbivore grazing pressure (Mack and Thompson 1982). Emulating this disturbance regime for A. tridentata ssp. wyomingensis plant communities did not produce the expected effect of shifting the dominance from shrubs to
native forbs and perennial grasses. Long-term protection from livestock grazing followed by fire resulted in a substantial Bromus tectorum invasion (Fig. 5) and a large increase in nonnative annual forbs. In the ungrazed treatment, herbaceous dominance shifted from perennial vegetation to annual vegetation with burning. The ungrazed-burned treatment was the only treatment to have a substantial invasion of B. tectorum. Invasions by annual grasses are especially problematic because exotic annual-grass invasions can degrade wildlife habitat, reduce biodiversity, and potentially alter ecosystem functions (Davies and Svejcar 2008). This is especially concerning because the B. tectorum invasion does not appear to be a short-term response to burning, but is evident approximately a decade and a half postfire and does not appear to be dissipating.
Though herbivory at the levels domestic livestock graze these landscapes is not considered part of the historical disturbance regime in the Intermountain West and Great Basin (USA) (Mack and Thompson 1982) and has been reported as a causal agent of B. tectorum invasion (Daubenmire 1970, Mack 1981, Knapp 1996), our results suggest that under current conditions light to moderate livestock grazing, as a disturbance to reduce litter accumulation, may indirectly prevent B. tectorum invasion. The level of grazing pressure is critical, because heavy grazing would facilitate B. tectorum invasion by decreasing native plant species (Daubenmire 1970, Mack 1981, ,Knapp 1996). However, in our study long-term livestock-grazing exclusion decreases the ability of the
native herbaceous community to tolerate fire, thereby creating safe sites and allowing B. tectorum an opportunity to invade. Lack of grazing allows fine fuels to accumulate, potentially resulting in greater mortality of desirable vegetation from fire in ungrazed compared to grazed treatments. Grazing has been demonstrated to reduce the accumulation of fine fuels, while protection from grazing allows accumulation of fine fuels (Belsky and Blumenthal 1997). The exclosures in our study had almost double the amount of litter compared to the grazed treatment, containing 105 kg/ha more fine fuel prior to burning (Rose et al. 1994 ). Though the accumulation of fuels does not appear to be dramatic, the spatial distribution of the fine fuels is probably critical. Most of the fine fuels appear to be accumulating around and in the crown areas of the native perennial grasses, probably increasing the likelihood of fireinduced mortality. Odion and Davis (2000) found that increases in soil heating from micro-site fuel accumulations increased the vulnerability of perennial grasses to fire.
The nonhistorical disturbance regime maintained the native plant community, while emulating the historical disturbance regime appeared to facilitate the decline of the native plant community. An understanding of ecological relationships among disturbances and plant community dynamics is critical, as historical disturbance regimes may not always be appropriate to maintain native plant communities under current conditions. Other authors have also suggested that invasive species and changes in other factors may alter the relationships among disturbance patterns and plant communities (Millar and Woolfenden 1999, Suding et aL 2004). Our results rnn counter to the intuitively appealing assumption that the best management of ecosystems can be accomplished by mimicking historical disturbance regimes (Baker 1993, Baker 1994, Cissel et a!. 1999,
171 of 182

September 2009 HISTORICAL AND NONHISTORICAL DISTURBANCE 1543
Mortiz and Odion 2004, Wright and Agee 2004 ). Ecologists must also consider that changing biotic and abiotic factors may influence the composition of plant communities relative to historical conditions. Millar et al. (2007) suggested that current and future forest management cannot be adequately directed by past forest conditions.
The shift of our plant community from native perennial species to exotic annual species with longterm grazing exclusion followed by fire supports theories of alternative or multiple steady states (Westoby et al. 1989, Friedel 1991, Laycock 1991, Suding et a!. 2004). The increase in exotic annuals and decrease in perennials over the 14-year period suggests that this is not a transitional vegetation state. Codominance by exotic annual grasses increases the risk of frequent fires that would be detrimental to remaining native vegetation (Whisenant 1990, D'Antonio and Vitousek 1992). The historical disturbance regime facilitated the onset of a new disturbance regime that would probably have very negative impacts on native flora and fauna. The effects of exotic-plant invasions are probably especially destructive when they increase fire frequency (Vitousek 1990, D'Antonio and Vitousek 1992). However, the similarity in vegetation characteristics between the grazed-unburned and the ungrazed-unburned treatments would not suggest that the unburned-ungrazed treatment was approaching a transition to a different state that could be induced by one disturbance (Figs. 1-4). The lack of obvious differences between the grazedunburned and the ungrazed-unburned treatments supports previous reports of minor differences between ungrazed and light to moderately grazed treatments (West et al. 1984, Rickard 1985, Courtois et al. 2004, Manier and Hobbs 2006); however, comparing the grazed-burned and the ungrazed-burned treatments suggests there were substantial functional or structural differences between grazed and ungrazed plant communities. This stresses the importance of understanding the relationships among community structure, ecological processes (such as colonization), and disturbances.
Our results demonstrate that prior disturbance history can have a substantial influence on the response and recovery of plant communities to individual disturbances. The effects of different prior disturbance history were evident almost a decade and half post-fire and do not appear to be dissipating. Prior disturbances have been reported to be associated with fire severity and extent (Kulakowski and Veblen 2007) and susceptibility to wind damage (Kulakowski and Veblen 2002) in subalpine forests. Stand age and increases in fuel loads as controlled by prior disturbances were suggested as the major factors explaining the severity and extent of disturbances (Kulakowski and Veblen 2002, 2007). Our study illustrates that prior disturbances can influence the response of plant communities to subsequent disturbances by reducing and influencing distribution of fuel loads. The prior disturbance history was critical in
determining post-fire susceptibility to exotic-plant invasion and, thus, if the plant community could recover. This supports previous assertions that prior land-use activities influence ecosystem function and structure (Foster et al. 2003). Because grazing and fire occur across the majority of wildlands around the globe, grazing, as a disturbance that modifies fuel loads prior to fire, is probably having substantial influence on plant communities and, subsequently, fauna dependent upon those plant communities.
Forests are traditionally thought of as the vegetation type requiring fuel reductions to facilitate desired responses to fire (Dodge 1972, Allen et al. 2002). Given the potential for forests to accumulate high fuel loads due to fire suppression (Dodge 1972, Allen et al. 2002), it is not a surprise that they have been the primary focus for fuel-reducing research and management. However, our results suggest that plant communities with much lower fuel loads may also need fuel-reducing disturbances to prevent negative community shifts following fire. Invasive species and probably climate change have produced conditions where fuel loads within the natural range of variability can result in severe negative responses to fire. Continued climate change and the introduction of new invasive species will probably exacerbate this situation. This also suggests that plant communities with excessive fuel loads may be at greater risk than previously identified. Climate change, anthropogenic stressors, and invasive species have created situations where management strategies need to focus on promoting ecosystem resistance and resilience (Millar et al. 2007). Thus, nonhistorical disturbances may be needed to promote community resistance and resilience in the face of changing environments and land uses.
Multiple disturbances that occur in short succession have been identified as having greater effects than the same disturbances either individually or with greater temporal separation (Paine et a!. 1998). However, grazing prior to fire reduced the negative effects of fire on plant communities. Thus, successive disturbances may either compound (Paine et al. 1998, Kulakowski and Veblen 2007) or mediate their effects. The effects of successive disturbances depend upon the impact of the preceding disturbance on the community. Paine et al. (1998) summarized studies where an initial disturbance produced a negative effect and amplified the negative impact of a subsequent disturbance. Kulakowski and Veblen (2007) reported that increases in fuels from prior disturbances increased fire severity. Long-term grazing reduced fine-fuel loads and thus decreased the negative effects of fire. Low-severity disturbances may mediate the effects of potentially more severe disturbances, even without altering species composition. Thinning and lowseverity fires have been suggested to increase resilience of forested systems to more severe disturbances (Allen et al. 2002). Our results caution against assuming disturbances that have limited temporal separation will have greater influence on communities than disturbances separated by
------- ~----- -~
172 of 182

1544 K. W. DAVIES ET AL. Ecological Applications Vol. 19, No.6
a greater amount of time or single disturbances. A better understanding of the interactions between disturbances and ecological processes will be necessary to predict the impacts of multiple disturbances, regardless of historical knowledge.
Conclusions
One of the goals of ecosystem management is to restore historical disturbance regimes (Grumbine 1994). However, our results indicate that deviations from historical conditions have the potential to alter ecosystem response to disturbances, suggesting historical disturbance regimes may not be an appropriate model for current management. Recognizing that because modern conditions differ from historical conditions, the response of ecosystems to historical disturbance regimes may have also been altered is a critical element to understanding the interactions between disturbance and ecosystem dynamics. Returning ecosystems to "historical" or "pre-European settlement" conditions by reintroducing historical disturbance is probably a simplistic view of ecosystem dynamics. The effects of the prior disturbance on plant communities will determine if the successive disturbance effects are compounded or mediated. Even plant communities that are not accumulating fuels beyond historical conditions may need low-severity fuel-reducing disturbances to improve their resilience to more-severe disturbances. Objectives for ecosystem management probably need to be focused on specific measurable goals that society has determined are valuable (soil stability, biodiversity, wildlife habitat, forage production, etc.) instead of trying to emulate historical disturbance regimes and conditions. A more mechanistic view of disturbances will become even more critical with the continued global spread of organisms and global climate change.
AcKNOWLEDGMENTS
Assistance with data collection by summer rangeland technicians, graduate students, and research assistants is greatly appreciated. Specifically, the authors thank Rob Sharp, Dustin Johnson, Aleta Nafus, Georjanna Pokorney, Erica Ersch, Missy Merrill, Felix Bell, Carmen Williams, Genie Brown, Shawna Lang, Josh Monson, Matt Coffman, Rachel Svejcar, Ed Rhodes, and Stacy McKnight for their hard work. The authors are grateful to JeiT Rose and Rick Miller for their assistance with the implementation of the burn treatments. Thoughtful reviews by Dustin Johnson and Aleta Nafus were greatly appreciated. We also thank Jeremy James and Martin (Marty) Vavra for reviewing this manuscript. Thoughtful reviews and constructive criticisms by anonymous reviewers were valued.
The Eastern Oregon Agricultural Research Center (EOARC) is jointly funded by the USDA-Agricultural Research Service and Oregon State University. Mention of a proprietary product does not constitute a guarantee or warranty of the product by USDA or the authors and does not imply its approval to the exclusion of other products.
LITERATURE CITED
·Allen, C. D., M. Savage, D. A. Falk, K. F. Suckling, T. W. Swetnam, T. Schulke, P. B. Stacey, P. Morgan, M. HolTman, and J. T. Klingel. 2002. Ecological restoration of southwest-
ern ponderosa pine ecosystems: a broad perspective. Ecological Applications 12:1418-1433.
Baker, W. L. 1993. Spatially heterogeneous multi-scale response of landscapes to fire suppression. Oikos 66:66-71.
Baker, W. L. 1994. Restoration of Landscape structure altered by fire suppression. Conservation Biology 8:763-769.
Bates, J. D., E. C. Rhodes, K. W. Davies, and R. N. Sharp. 2009. Post-fire succession in big sagebrush steppe with livestock grazing. Rangeland Ecology and Management 62: 98-110.
Belsky, A. J., and D. M. Blumenthal. 1997. Effects of livestock grazing on stand dynamics and soils in upland forests of the interior West. Conservation Biology 11:315-327.
Boyd, C. S., and T. G. Bidwell. 2002. Effects of prescribed fire on shinnery oak plant communities in western Oklahoma. Restoration Ecology 10:324-333.
Canfield, R. H. 1941. Application of the line intercept method in sampling range vegetation. Journal of Forestry 39:388-394.
Cissel, J. H., F. J. Swanson, and P. J. Wiesberg. 1999. Landscape management using historical fire regimes: Blue River, Oregon. Ecological Applications 9:1217-1231.
Courtois, D. R., B. L. Perryman, and H. S. Hussein. 2004. Vegetation change after 65 years of grazing and grazing exclusion. Journal of Range Management 57:574-582.
D'Antonio, C. M., and P. M. Vitousek. 1992. Biological invasions by exotic grasses, the grass/fire cycle, and global change. Annual Review of Ecology and Systematics 23:63-87.
Daubenmire, R. 1970. Steppe vegetation of Washington. Washington Agricultural Experiment Station Technical Bulletin 62.
Davies, K. W. 2008. Medusahead dispersal and establishment in sagebrush steppe plant communities. Rangeland Ecology and Management 61:110-115.
Davies, K. W., J.D. Bates, and R. F. Miller. 2006. Vegetation characteristics across part of the Wyoming big sagebrush alliance. Rangeland Ecology and Management 59:567-575.
Davies, K. W., J.D. Bates, and R. F. Miller. 2007a. Short-term effects of burning Wyoming big sagebrush steppe in southeast Oregon. Rangeland Ecology and Management 60:515-522.
Davies, K. W., M. L Pokorny, R. L. Sheley, and J. J. James. 2007b. Influence of plant functional group removal on inorganic soil nitrogen concentrations in native grasslands. Rangeland Ecology and Management 60:304-310.
Davies, K. W., R. L. Sheley, and J. D. Bates. 2008. Does prescribed fall burning Artemisia tridentata steppe promote invasion or resistance to invasion after a recovery period? Journal of Arid Environment 72:1076-1085.
Davies, K. W., and T. J. Svejcar. 2008. Comparison of medusahead-invaded and noninvaded Wyoming big sagebrush steppe in southeastern Oregon. Rangeland Ecology and Management 61:623-629.
Dodge, M. 1972. Forest fuel accumulation-a growing problem. Science 177:139-142.
Eckert, R. E., and J. S. Spencer. 1986. Vegetation response on allotments grazed under rest-rotation management. Journal of Range Management 39:166-174.
Eckert, R. E., and J. S. Spencer. 1987. Growth and reproduction of grasses heavily grazed under rest-rotation management. Journal of Range Management 40:156-159.
Fleischner, T. L. 1994. Ecological costs of livestock grazing in western North America. Conservation Biology 8:629-644.
Foster, D., F. Swanson, J. Aber, I. Burke, N. Brokaw, D. Tilman, and A. Knapp. 2003. The importance of land-use legacies to ecology and conservation. BioScience 53:77-88.
Friedel, M. H. 1991. Range condition assessment and the concept of threshold. Journal of Range Management 44:422-427.
173 of 182

September 2009 HISTORICAL AND NONHISTORICAL DISTURBANCE 1545
Grumbine, R. E. 1994. What is ecosystem management? Conservation Biology 8:27-38.
Hobbs, N. T., and D. S. Schimel. 1984. Fire effects on nitrogen mineralization and fixation in mountain shrub and grassland communities. Journal of Range Management 37:402-405.
James, J. J., K. W. Davies, R. L. Sheley, and Z. T. Aanderud. 2008. Linking nitrogen partitioning and species abundance to invasion resistance in the Great Basin. Oecologia 156:637-648.
Jones, A. 2000. Effects of cattle grazing on North America arid ecosystems: a quantitative review. Western North America Naturalist 60:155-164.
Knapp, P. A. 1996. Cheatgrass (Bromus tectorum L.) dominance in the Great Basin Desert: history, persistence, and influences to human activities. Global Environmental Change 6:37-52.
Kulakowski, D., and T. T. Veblen. 2002. Influences of fire history and topography on the pattern of severe wind blowdown in a Colorado subalpine forest. Journal of Ecology 90:806-819.
Kulakowski, D., and T. T. Veblen. 2007. Effect of prior disturbances on the extent and severity of wildfire in Colorado subalpine forests. Ecology 88:759-769.
Lauenroth, W. K., J. L. Dodd, and P. L. Sims. 1978. The effects of water- and nitrogen-induced stresses on plant community structure in a semiarid grassland. Oecologia 36:211-222.
Laycock, W. A. 1991. Stable states and thresholds of range condition on North American rangelands: a viewpoint. Journal of Range Management 44:427-435.
Littell, R. C., G. A. Milliken, W. W. Stroup, and R. D. Wolfinger. 1996. SAS system for mixed models. SAS Institute, Cary, North Carolina, USA.
Mack, R.N. 198l.lnvasion of Bromus tectorum L. into western North America: an ecological chronicle. Agro-Ecosystems 7: 145-165.
Mack, R. N., and J. N. Thompson. 1982. Evolution in steppe with few large, hooved mammals. American Naturalist I 19: 757-773.
Manier, D. J., and N. T. Hobbs. 2006. Large herbivores influence the composition and diversity of shrub-steppe communities in the Rocky Mountains, USA. Oecologia 146:641-651.
Mensing, S., S. Livingston, and P. Barker. 2006. Long-term fire history in Great Basin sagebrush reconstructed from macroscopic charcoal in spring sediments, Newark Valley, Nevada. Western North American Naturalist 66:64-77.
Millar, C. I., N. L. Stephenson, and S. L. Stephens. 2007. Climate change and forests of the future: managing in the face of uncertainty. Ecological Applications 17:2145-2151.
Millar, C. I., and W. B. Woolfenden. 1999. The role of climate change in interpreting historical variability. Ecological Applications 9:1207-1216.
Moritz, M. A., and D. C. Odion. 2004. Prescribed fire and natural disturbance. Science 306: 1680.
Noss, R. F. 1994. Cows and conservation biology. Conservation Biology 8:613-616.
Odion, D. C., and F. W. Davis. 2000. Fire, soil heating, and the formation of vegetation patterns in chapatral. Ecological Monographs 70:149-169.
Oliphant, J. 0. 1968. On the cattle ranges of the Oregon country. University of Washington Press, Seattle, Washington, USA.
Paine, R. T., M. J. Tegner, and E. A. Johnson. 1998. Compounded perturbations yield ecological surprises. Ecosystems 1:535-545.
Platt, W. J., B. Beckage, R. F. Doren, and H. H. Slater. 2002. Interactions of large-scale disturbances: prior fire regimes and hurricane mortality of savanna pines. Ecology 83:1566-1572.
Rice, B., and M. Westoby. 1978. Vegetative responses of some Great Basin shrub communities protected against jackrabbits or domestic stock. Journal of Range Management 31: 28-34.
Rickard, W. H. 1985. Experimental cattle grazing in a relatively undisturbed shrub steppe community. Northwest Science 59: 66-72.
Rose, J. A., R. F. Millar, and T. Svejcar. 1994. Vegetation and livestock exclusion in the sagebrush steppe. Pages 53-63 in R. Angell, et al. Management of Great Basin rangelands annual report, 1994. Special Report 935. Oregon State University, Eastern Oregon Agricultural Research Center, Burns, Oregon, USA.
SAS Institute. 2002. SAS version 9.1. SAS Institute, Cary, North Carolina, USA.
Stewart, G., and A. C. Hull. 1949. Cheatgrass (Bromus tectorum L.): an ecological intruder in southern Idaho. Ecology 30:58-74.
Suding, K. N., K. L. Gross, and G. R. Houseman. 2004. Alternative states and positive feedbacks in restoration ecology. Trends in Ecology and Evolution 19:46-53.
Svejcar, T., and R. Tausch. 1991. Anaho Island, Nevada: a relict area dominated by annual invader species. Rangelands 13:233-236.
Vitousek, P. M. 1990. Biological invasions and ecosystem process: toward an integration of population biology and ecosystem studies. Oikos 57:7-13.
West, N. E., F. D. Provenza, P. S. Johnson, and M. K. Owens. 1984. Vegetation change after 13 years of livestock grazing exclusion on sagebrush semidesert in west central Utah. Journal of Range Management 37:262-264.
Westoby, M., B. Walker, and I. Noy-Mier. 1989. Opportunistic management for rangelands not at equilibrium. Journal of Range Management 42:266-274.
Whisenant, S. G. 1990. Changing fire frequencies on Idaho's Snake River Plains: ecological and management implications. Pages 4-10 E. D. McArthur, E. M. Romney, S.D. Smith, and P. T. Tueller, compilers. in Proceedings-Symposium on cheatgrass invasion, shrub die-ofT, and other aspects of shrub biology and management, 4-7 April 1989, Las Vegas, Nevada, USA. General Technical Report INT-276. USDA Forest Service, Intermountain Research Station, Ogden, Utah, USA.
Wright, C. S., and J. K. Agee. 2004. Fire and vegetation history in the eastern Cascade Mountains, Washington. Ecological Applications 14:443-459.
Wright, H. A., and A. W. Bailey. 1982. Fire Ecology: United States and Southern Canada. John Wiley and Sons, New York, New York, USA.
Young, J. A., and F. L. Allen. 1997. Cheatgrass and range science: 1930-1950. Journal of Range Management 50:530-535.
174 of 182

t } ,, ' f .;:
I ! r
PRISTINE VEGETATION OF THE JORDAN CRATER KIPUKAS: 1978-91
Robert R. Kindschy
ABSTRACT
During the past 14 :years, information has been gathered concerning the pristine vegetation of the two major kipukas within southeastern Oregon's Jordan Crater Research Natural Area. Such information is valuable when assessing the status of vegetation on comparable sites under management. Cheatgrass is present in minor amounts in all the plant communities. Variation in abundance is apparently related to the amount of timely precipitation in a given year. Cheatgrass awaits a disturbance, which reduces the competitiveness of native perennials, to establish temporary dominance.
INTRODUCTION
Approximately two to three thousand years ago (Mehringer 1987) a major eruption of basalt lava covered 6,880 ha (16,995 acres) of sagebrush steppe near Jordan Valley in southeastern Oregon (43°10' N. latitude and 117°20' W.longitude). Unusually nonviscous lava isolated two areas ofland, forming islands or kipukas. Neither site has been influenced by human activities, including grazing by livestock. As such. they provide "benchmark" information about pristine plant communities within the Owyhee Upland Province (Franklin and Dyrness 1973). The entire lava flow was declared a Research Natural Area (RNA) in June 1975 (Kindschy and Maser 1978).
The eastern kipuka is 3.5 ha (8.6 acres) in area, while the western is smaller at 1.4 ha (3.4 acres). However, the more rugged west kipuka has a greater variety of habitats and, consequently, greater plant species richness. Elevations are similar, 1,335 m (4,380 it) at the west kipuka and 1,27 4 m (4,180 it) at the eastern. Soils differ between the kipukas (table 1).
METHODS
Both kipukas are accessible only by helicopter or by rather arduous hiking across the lavas. Each was visited on an irregular basis throughout the past 14 years of monitoring. Plant production was determined using standard plot clip and weight techniques with conversion to air dry weights employed. Line intercept transects were randomly run to measure frequency and density by plant species and land barren of vegetation. Foliar cover of sagebrush was determined using the variable plot method (Cooper
Paper presented at the Symposium on Ecology, Management, and Restoration of Intermountain Annual Rangelands, Boise. ID, May 18-22, 1992.
Rob&rt R. Kindschy is a biologist with the Bureau of Land Management in Vale, OR 97918.
85
1957). Cryptogam frequency was measured both by line intercept and by systematic points taken at 1.5-m intervals.
Sagebrush height was directly measured on all plants within belt transects. Age class characterization of sagebrush was by consensus of three range scientists. Decadent plants exhibited >50 percent dead material.
Soils were described in 1983 by soil scientists Daniel E. Brown and James A. Pomerening, Bureau of Land Management, U.S. Department oftheJnterior.
RESULTS Vegetative cover in rangeland communities is always
of interest to biologists. In 1991, the east kipuka exhibited 59 percent of the ground barren of vegetation; 21.4 percent of this was rock. Figure 1 shows the percentage of ground cover. Bluebunch wheatgrass (Agsp} accounted for 24.6 percent of cover. Sandberg's bluegrass (Posa) represented 3.6 percent. More significant were the forbs, Lomatium (5.9 percent) and CrepUJ_ (1.7 per,cent). Such palatable forbs appear to diminish ~der grazing pressure by livestock. Wyoming big sagebrush comprised 5.2 per-. ~ cent of the mtercept.
Plant frequency, determined in June 1978, documented the ratio of grasses:forbs:shrubs on the east kipuka. Figure 2 illustrates this relationship. Frequency of native, perennial forbs is of interest. At 30 to 45 percent of the vegetation, forbs within this pristine env.ronment appear to be more prevalent than on similar sites subjected to domestic livestock use.
Figure 3 portrays percent composition of vegetation on ·the east kipuka in June 1978. Again, it is significant that the forb, Lomatium, comprised 25.5 percent of species. Crepis represented over 4 percent. Bluebunch wheatgrass (Agsp) approached half the vegetation present at 49.1 per-. cent. Figure 4 depicts plant production during 1978. Lomatium, by far, was the maximum producer at 462 kglha. Bluebunch wheatgrass (Agsp) was second at 182 kg/ha.
Wyoming big sagebrush crown cover varied little between 1986 measurements and those of 1991 (fig. 5). The range was between 5 and 7.5 percent. Sagebrush height, which averaged 84.6 em, was remarkably consistent (fig. 6). Of interest was the dellf!ity of sagebrush by age class (fig. 7). It was apparent that this stand on the east ki.puka was in trouble.
Whether this was due to the persistent drought is questionable, although stress may have contributed to the loss of older sagebrush plants. A lack of seedlings and young may be related_to the competition from well-established perennial grasses and forbs. Sagebrush reproduction appears common on many grazed rangelands elsewhere in southeastern Oregon during the continuing drought.
llll!liiliiillliiilill----------------·--·--·--·---·--175 of 182
Cliff
Highlight
Cliff
Highlight
Cliff
Highlight
Cliff
Highlight
Cliff
Highlight
Cliff
Highlight
Cliff
Highlight
Cliff
Highlight
Cliff
Highlight
Cliff
Highlight
Cliff
Highlight
Cliff
Highlight
Cliff
Highlight

Tabla 1-Summary of soils data for Jordan Crater kipukas
Soil type
Classification
Parent material
Physiography
Stoniness
Eastkipuka
Anawalt variant (mesic) silt loam.
Clayey, montomorillonetic. mesic.
Uthic Xerollic Haplargid.
Residium from Pliocene olivine basalt. Basaltic rasidium results in a more clayey and a less sketetal SOJ1 than the rhyolitic rasidium of the west kipuka.
Slopes are 1 percent to 5 percent on the crest and about 20 percent to 30 percent around the outer margin. Rimrock common around outer margin.
Stones are 0. 7 to 1.5 m apart on the surface (Class 3). Rock outcrop is exposed on about 2 percent of area
Westklpuka
Old camp very gravelly sill loam.
Loamy-skeletal, mixed mesic.
Uthic Xerollic Haplargid.
Residium from Miocene rhyolite.
Slopes are 3 percent to 8 percent. The edge of the surrounding lavas is about 2 m higher thanthekipuka.
Stones are 0.2 to 9 m apart (Class 2). Rhyolite pebbles cover 50 percent of soil surface. Rock outcrop exposed on 10 percent to 15 percent of area.
4.8Posa
Figure 1-Ground cover percentages at east kipuka in 1991.
figure 3-Per®ntage of species in vegetation of east kipuka, June 1978.
54 45
15
30 Studyi1 Study#2
40
-Grass -Forb
d Shrub
Figure 2-Percentage of grass, forb, and shrub vegetation on the east kipuka sites in June 1978.
86
500 462 N ·ci 'f./ . y, I / ,. 'iS }' . e ,-:;; I f'
.c 400 ~--s,.J~ H !>...;:7 - ~~---~-----_.;......:...._.~~,~----h"'•.._:;__"-
~ - E;3Mr.wvo .c 300 WiD Mise forb
i ~ PhJaX ... • Crepis CJ 200
ca ~ Astragalus
::s l!llll!lJ l.Dma1ium c 100 fffffd Brte c c( Posa
0 Agsp
Species
figure 4-Annual plant growth (kg/ha) on east kipuka during 1978.
l I
176 of 182
Cliff
Highlight
Cliff
Highlight
Cliff
Highlight
Cliff
Highlight

Vegetation on the west kipuka is favored by site diversity but restricted by a more-limiting soil. Interestingly, the vegetation within the Wyoming big sagebrush/ bluebunch wheatgrass community changed little between
7.5 ~1991
-1986
- 5.0 c Q)
~ Q)
a. 2.5
0
Figure 5-Wyoming big sagebrush crown cover (percent} at east kipuka, 1986 and 1991.
150 r-----------------------------------------------------------------------,
-E 100 (,) -- ..
.&: t» ·a; 50 ::t:
0 ~~~~~~~~~~~~~~~~~~~
Figure 6-Height of Wyoming big sagebrush at east kipuka, June 1991. Average height for the sample was 84.6 em.
moaad • Decadent
IJII Mature
-Young
Plants/hectare
Figure 7-Density of sagebrush by age class at east kipuka, July 1991.
1,247
87
i-; ·'
1980 1991
Figure 8-Transect vegetation components {percent), west kipuka, 1980 and 1991.
t f..,_, rr-,.f.'l-"l.'"t-j:. '·t·• c.t!'i J, ... ~fii (.1 ...-'1.-<L.I ..J;-.,;? .. ~...-,~J;!P.- •f(' t J.·,~·Oji·~,.
- Agsp UPosa ~Barren
• Brte E§ Artr-wyo C Chna
.~1- , .t. ,~ ··"' . .;.'u-6'~J · r;; f$·£1 q-;:- as .. r. . ;-~ l t .-~ -"' · ~-. ""'~ ~ ' t:._.::J """"" 1-her:.;-r::: c /:- ~:~ _:
1980 and 1991 (:fig. 8). Most significant was the increase in cheatgrass (Bromus tectorum) from undetected in 1980 to 10 percent of the foliar intercept in 1991. Soil previously barren of vegetation appeared to have been populated by cheatgrass. No loss in perennial grasses, forbs, or shrubs was noted. Unusually heavy spring rainfall in 1991 may have created an environment conducive to annuals, such as cheatgrass, in the interspaces between existing perennials.
Comparison of data among the various pristine communities on the west kipuka showed the differences in vegetation (fig. 9) among various communities. Frequency of occurrence data on the west kipuka illustrates tbe differences among the various communities (fig. 10).
Cryptogam. occurrence on the wlst kipuka is shown in figure 11. Two samples in 1987 showed little difference between plant communities. Mosses and lichens comprised roughly 42 percent of the "hits" (frequency of occurrence) in pristine habitats. These soils were loose and fluffy.
Figure 12 illustrates the results of a study conducted during 1991 on the west kipuka. Cheatgrass was present in all the pristine plant communities, but was most abundant in the deeper soils of the basin big sagebrush site.
7
2
15
Sagebrushlbluebunch Sagebrush/fescue
•·· 58
Talus
Figure 9-Canopy intercept if vegetation (percent), west kipuka, September 1980.
-Agsp
IIJPosa
~Stlh mFeid
~Sihy Berte ~ Crepis
llW Penstemon
~ Artr-wyo
Oama !mEl Mossllich
177 of 182
Cliff
Highlight
Cliff
Highlight

100
83
42 -c: (j)
~ 25 22
35 28
Q.)
Q.
0
Barren soli Rock Utter
Figure 10--Frequency of ground cover occurrence (percent), west kipuka, September 1980.
43 41.6
Artr/Agsp Comm.
Figure 11-Frequency of moss and lichen occurrence (percent), west kipuka, 1987.
~Talus 1.37 1.5 SIJ!ngers -E • WyoAnr -- Feld c:
CIS • WyoArtr 5:
1.0 - Agsp Ch 0) • BaslnArlr ... cu AQsp (j)
z 0 -(I) 0.5 0 c: as -Ch i5
0
Figure 12-Cheatgrass occurrence in various plant communities, west kipuka, September 1991.
~Talus stringer
-~~ - WyoArtr Agsp1
Vegetated
-Percent hils
~Percent absent
88
CONCLUSIONS
Pristine vegetation has been influenced through the introduction of :flora from other areas over time. Such is the case with the kipukas of the Jordan Crater RNA. Cheatgrass is presently a component of the ecosystem. It will likely remain so for many millennia. Cheatgrass abundance appears to be governed by opportunity. Stress on perennial plants from drought, fire, or biological agents creates an opportunity for temporary abundance and perhaps dominance of annuals such as cheatgrass.
Future monitoring of the kipuka vegetation will determine plant species composition change. This paper documents the rather stable vegetative assemblage during the 1980's.
REFERENCES Cooper, C. F. 1957. The variable plot method for estimat
ing shrub density. Journal of Range Management. 10: 111-115.
Franklin. J. F.; Dymess, C. T. 1973. Natural vegetation of Oregon and Washington. Gen. Tech. Rep. PNW-8. Portland, OR: U.S. Department of Agriculture, Forest Service, Pacific Northwest Forest and Range Experiment Station. 417 p.
Kindschy, R. R.; Maser, C. 1978. Jordan Crater research natural area. Supplement No. 7 to Franklin, Jerry F.; Hall, Frederick C.; Dyrness, C. T.; Maser, Ohris. Federal research natural areas in Oregon and Washington; a guidebook for scientists and educators [lS'Z-2]. :">. 1rtland, OR: U.S. Department of Agriculture, Forest Service, Pacific Northwest Forest and Range Experiment Station.
Mehringer, P. J., Jr. 1987. Late Holocene environments on the northern periphezy of the Great Basin. Final report to Bureau of Land Management for contract YA551-CT5-340075.
178 of 182

Dr. L. Ben Bruce. Nevada Cooperative Extension, Coflege ofAgriculture, Biotechnology and Natural Resources
At the UNR Gund Ranch, we have been doing ' some preliminary work on using cattle grazing to ' create firebreaks. This involves primarily fall and winter grazing of donnant cheatgrass. That brought up some questions about its nutritional value and what type of cattle to use to graze it.
Some lab work and a literature scan show some interesting things about the nutritional value of cheatgrass. First off, it is not all that much different than many of the native species occurring on our rangelands. Laboratory analysis of samples of Great Basin wUdrye and cheatgrass taken in October at the Gund ranch show that oath plants contained about 3 percent crude protein. The wil~ drye had slightly less energy than cheatgrass.
Michael McMinnis and Martin Vavra pub~ lished a paper in the Journal of Range Management in 1987 (JRM 40:60) that gave values for crude protein and acid detergent fiber (ADF) for cheatgrass, bluebunch wheatgrass, Sandberg's bluegrass, needlegrass and bottlebrush squirreltail over time. Keep in mind that ADF values are inversely related to energy, so lower values mean more energy and lower values are desired.
<1~ E~r~~<;(~::E~~jltl1:?Jc;~·L~ t1!0@f~
....... ~-----~--·~
Fall samples of these plants showed a range of 3% protein to 6% protein. Cheatgrass was the low sample at 3%, but wasn't much lower than bluebunch or Sandberg's bluegrass. The ADF ranged from 57% to 51%. The 51% has the most energy, 'Yhich was Sandberg's bluegrass. Cheatgrass was not the worst. and was verv close to the bi!iliest energy value at 52%. The one with the least energy was squirreltail.
The Gund Ranch values for fall cheatgrass were better with 3.5% protein and 48% ADF. Wheat straw is 3.5% protein and 54% ADF. Cheatgrass is the much better energy source. I think what this means is that standing fall dar~ mant cheatgrass does have some feed value. Definitely not the stuff you want replacement heifers on or· late pregnancy cows, but might be useful in second trimester or for other animals that don't have a high nutrient demand.
There is still a lot to learn about late grazing cheatgrass, but it appears that protein supplementation is going to be necessary. Compared to native plants, cheatgrass tends to be lower in protein, but not bad relative to other dormant plants ir c:; .ergy. ... "
~1\lc: \ c;;Jc:'!i'f.'"'{:r~.m.1t'!.ft"::,n~ E:~n:0_t;g('P(S:;r;;::s?
179 of 182

RANGELANDS 15(1). February 1993 .,_ vi
---------------------------··------·- ----
Cheatgrass: Changing Perspectives and Management Strategies
f.L. Emmerich, F.H. Tipton, and J.A. Young
Since the turn of the century, cheatgrass has spread across the Intermountain West. permanently altering the flora of the sagebrush steppe. This extremely adaptable species has created much controversy because of its negative and positive attributes. Our purpose is to ·show how one ranch located in north-central Nevada successfully uses cheatgrass for a significant portion ofits forage base. Ranchers and land managers may want to reevaluate their attitudes towards cheatgrass arid implement management strategies to make beneficial use of this grass.
Ranch Description The T Quarter Circle Ranch, located in Humboldt
County, Nevada, is a cow/calf operation and runs 1,100 head of brood cows in its base herd. This ranch is currently a year-long grazing operation in which the brood cow herd is maintained on salt desert range during winter, sagebrush foothills in spring, and river bottom pastures during summer.
Ownership and management is held by third {Jane and Hank Angus) and fourth (Nancy and Frosty Tipton} family generations. During interviews for a project involving ranch and range changes {Emmerich et al. 1992}, the Tiptons and Angus' exhibited significant attitudes towards the impact of cheatgrass on the T Quarter Circle rangeland. They are aware of benefits of cheatgrass and its less desirable qualities, yet cheatgrass has become one of the most important forage species for their livestock.
Important Attributes of Cheatgra.ss In reviewing cheatgrass literature, three relevant attrib
utes were pinpointed. First, cheatgrass is an abundant forage (Fleming et al. 1942}. Sufficient precipitation allows cheatgrass to grow and produce relatively abundant herbage, harvested by grazing animals as forage. Second. forage production can be unstable from year to year. It is highly dependent on am.ount and timing of moisture (Stewart and Young 1 gag)_ Cheatgrass·yield can vary from near zero production to exceeding the harvest needs of the livestock herd. Third. fire is a significant factor in the extension and perpetuation of cheatgrass. This species is highly flammable and prompts range fire.
First and third authors are research technician and research scientist. U.S. Department of Agricullure. Agricultural Research Service. 920 Valley Road. Reno. Nev. 89512. Second author is co-owner and manager of the T -Quarter Circle Ranch. Winnemucca. Nev. 89445.
Our appreciation to the T Quarter Circle family ranchers who were willing to discuss changing aspects of the rangeland. Oral ln!enriews during 1989 and 1990 with ramily members provided the basis of material used in !his article. Typed transcripts ol the interviews from the T Quarter Citcle Ranch Project are located in the Oral History Archives. University of Nevada. Reno. Our gra\etulness to the reviewers of \his article who took thought and care in suggesting improvements.
This in turn results in the loss of native shrub species and _may convert the shrub/grass rangelands to cheatgrassdominated range {Young et al. 1987).
An Abundant Forage According to range studies in Great Basin communi
ties, cheatgrass can average from 800 to 1,400 pounds/acre of air-dried forage (Hull and Pechanec 1947}. Exceptional moisture can produce 4,000 pounds/ acre of cheatgrass. as noted at Emigrant Pass. near Elko. Nevada, during the 1964 growing season (Young et al. 1987).
Cheatgrass has primarily impacted the sagebrush steppe. Yet, the T Quarter Circle range provides an example of cheatgrass in the more arid portions of the sagebrush zone and even on the upper margins of the salt desert (Young and Tipton 1990}. As cheat grass encroaches into the salt desert shrub community, it colonizes bare ground amongst established perennial pla)lts. Cheatgrass appears to continually adapt to a variety of different range types, even those with less.moisture. B~cause it has a low tolerance for soluble salts, cheatgrass plants occupy sites of lower salt content as they migrate into the saft desert shrub environment.
On the salt desert rangelands of the T Quarter Circle. the cheatgrass plants retain their seeds late into the cooler months. In October 1986. cheatgrass seeds were collected on the T Quarter Circle winter range and analyzed for nutrient content. The analysis revealed cheatgrass seed was nutritionally similar to feed grains (Table 1}.
On the T Quarter Circle, calves are generally weaned by October. and the main herd is turned onto winter desert range. Frosty Tipton stated that the cheatgrass seed on this range is comparable to turning their cattle onto a grain field, as the herd fattens for the winter months.
By November, with cooler weather approaching, the cattle spread across the desert range. The livestocttwirrtenng in this type ofenvfrorunentbrnwoo-on shrubssu.cn aswinterfatand fourwing sallbusil- The shrubs provide a digestible protein source, wnife carbohydrates in cured grass spkies suppfY energy t() complete a balanced ~ration (DeFion 1986).
In spring, cattle graze on the fresh growth of cheat grass and other species, as they slowly progress from the desert valley into the foothill country. Water sources are shut off in the lower winter areas by April. Control over water in the desert valley ensures cattle move towards water sources at higher elevations. and permits re-growth and seed production on the winter range areas.
As grasses mature in the high country, some cattle
180 of 182
Cliff
Highlight
Cliff
Highlight

38 RANGELANDS 15(1}. February 1993
T Quarler Circle cattle passing through winter range. Photo by Nancy Tipton, 1991. • • begin to drift toward the home meadows. The ranchers drive the rest of the herd down to river bottom summer pastures starting in late June. As the cattle move through the shadscale winter range; they readily graze, often
......... favoring mature cheatgrass plants rather than mature < · native perennials. The ranchers commented that in the
past the cattle never grazed . these shadscale flats in summer since little or no cheat grass was available amongst native shrubs.
Cheat grass has increased in the desert community type . the past few decades, and the· ranch owners consider cheatgrass a positive change in the range forage composition. They observe their cattle selecting this species. and cheatgrass provides a suitable feed where bare ground existeq previously. When cattle utilize cheatgrass, the intensjty of use on native grasses may decrease,
Table1.
Cheatgrass• Barley feed Corn seed high grade feed
meal
(%) (%} (%) Protein 9.0 13.5 9.1 Fat 1.6 3.5 4.2 Crude Fiber 11.0 8.7 2.1 N-free Extract 62.0 60.5 70.8
benefiting the rangeland condition. Frequently, cheatgrass intrusion is consicfered a result
of overgrazing or disturbance to the land (Hull and Pechanec 1947). Frosty Tipton, however, indicated that the recent encroachment of cheatgrass into the desert rangeland .used by the T Quarter Circle was not due to excessive grazing. Their desert range has been continuously winter use, with cattle brought on after seed ripe and moved off by spring. There have not been years of intensive overuse on this land. Instead, it was the aggressive • adaptive characteristics of cheatgrass ·to occupy open ground. Research bySvejcar and Tausch {1991) indicates that cheatgrass can appear in pristine areas or stable communities never grazed by cattle. Research by Melgoza and Nowak (1991) suggests that cheatgrass can
Concentrates ..
Corn and Aye Wild Wheat. soft oat feed grain oats Pacific Coast
good grade States
(%} (%) {%) (%} 10.9 12.6 12.7 9.9 4.0 1.7 5.5 2.0 6.1 2.4 15.2 2.7
64.9 70.9 50.9 72.6
"Information -for cheatgrass seed obtained from Dr. James A. Yeung. Analysis conducted by Agritest Commercial lab., Twin Falls. Idaho, t986-.. Concentrate percents obtained from Morrison. Frank B. 1956. Feeds and Feeding: A Handbook tor the Studem and Stockman. 22nd ea. The Mornson Publishing Co .• Ithaca. New York. 1156 p.
181 of 182
RANGElANDS 15(1). February1993
successfuily compete with established perennial plants.
Variability in Forage Production Cheatgrass production varies from year to year. often
dependent upon amount and distribution of moisture. Cheatgrass is considered a winter annual, but it may not germinate until spring in Nevada. Germination occurs in the fall in northern Nevada about once every 5 years. With sufficient fall moisture, seeds germinate and produce a basal rosette of leaves that provide succulent forage. ff this germination occurs in the fall and temperatures permit growth, the leaves can provide considerable forage during fall and winter. If germination occurs late ·in fall, the plant remains in the rosette stage during winter and produces little harvestable forage. The ground portion of these plants is virtually dormant, yet the root system is actively growing. Such over-winter root development allows cheatgrass to exploit soil moisture once temperatures moderate in fate winter/early spring.
During low precipitation years when.poor cheatgrass crops are produced, the seedlings of native grasses seem to be favored. This tendency has been noted during evaluation of the monitoring studies on the T Quarter Circle rangeland. Thus, . if cheatgrass provides the bulk of a seasonal forage base, there is need to buffer the uncertainty of cheatgrass production. Extra forage in the form of leased pasture or hay is a prudent option available to ranches when confronted by fluctuating cheatgrassyield.
Modern range management practices have also led to better condition rangeland. thus lessening the impact of a poor cheatgrassr year. The benefits of good condition rangelands are particularly evident during recent drought years on the T .Quarter Circle. The owners have been cautious, keeping their utilization rates between 30 to 50 percent. The rangeland offers a variety of native forage species. although the cattle are often observed selecting cheatgrass.
Wildfire The relation between cheatgrass and wildfires is a vital
concern. The fine herbage of early-maturing cheatgrass greatly increases the chance of fire ignition, and the density of cheatgrass allows a rapid rate of fire spread.
In 1985, the T Quarter Circle Ranch experienced two extensive fires burning approximately 65.000 acres of winter use rangeland. It was necessary for the ranch to re-adjust their grazing patterns and reduce their base herd to accommodate the loss of range forage.
Rangeland fire is a concern, and the T Quarter Circle owners are constantly aware of its consequences. In the past, salt desert ranges have apparently been free of wildfires, lacking sufficient herbaceous fuel to spread fire. Recent encroachment of cheatgrass into these arid habitats has brought the risk of wildfires. which permit cheatgrass and other annuals to invade open sites created by the loss of desert shrubs (Young and Tipton 1990). Palatable desert shrubs such as shadscale, wintertat, and fourwing saltbush,' which are not adapted to periodic fires,
39
provide a much needed protein source on these winter ranges.
Management of cheatgrass must include fuel load management. Resting cheatgrass-dominated ranges in a grazing system that is meant to favor perennial grass is an open invitation for disasier.Cattlegrazing can reduce the accumulation of cheatgrass fiffer and in tum reduce accumulation of fuel to fessen fire hazard (Pellant 1990. Young and Tipton 1990}. By incorporating the concept of winter grazing, there is a reduction in excess cheat grass herbage and seed source, yet protection to the dormant perennial grasses.
looking Back Fifty Years As we reflect back on more than fifty years of ranching
and land management experience dealing with cheat~ grass, perhaps a quotation from Fleming et al. (1942) would be appropriate:
On account of its { cheatgrass} wide and abundant distribution and its ability to maintain a high density of ground cover year after year it would seem tha·t we should now recognize this grass as a highly important part of Nevada·s grazing resources .... Because of its grazing value at various stages of growth and maturity. it contributes at least as much feed for the grazing livestock as many other single forage plants found on Nevada ranges. Broncograss ( cheatgrass) has become a permanent source ot feed on many of our most important rangelands and it will necessarily have to be take!'l into consideration in the determination of seasonal use and in making grcu:ing capacity estimates_ J
The insight of Fleming and his coauthors concerning cheatgrass and its impact on Nevada rangelands is still considered to be valid today. Cheatgrass range needs to be managed, possibly as an annual grass range rather than as a perennial grass range. The challenge is to manage grazing on these rangelands in a manner that protects the range productivity while making beneficial use of the forage resource. T Quarter Circle is an example of that kind-of management.
References
OeFion, James G. 198&. The Case for Cheatgra~s. Rangelands-8(1 }:14-17.
Emmerich, F.J.., J.A. Young, and J.W. Burkhardt. 1992. A Nevada Ranch Family: Their Success Through Four Generations. Rangelands. 14{2):66 · 70.
Fleming, C.E., M.A. Shipley, M.R. Miller. 1942.. Bronco Grass (Bromus tectorum} on Nevada Ranges. Bulletin No. 159. Agricultural Experiment Station. The University of Nevada. Reno. Nevada. 21 ~ . .
Hull, A.C. Jr., and Joseph A. Pechanec. 1947. Cheatgrass-A Challenge to Range Research. J. of Forestry. 45:555 -564.
Melgoza, Graciela and RobertS. Nowak. 1991. Competition between Cheatgrass and Two Native Species after Fire: Implications from Observation and Measurements of Root Distribution. J. of Range Manage. 44(1):27 -33.
Pellant. Mike. 1990. The Cheatgrass-Wildfire Cycle: Are There Any Solutions? In: Proceedings-Symposium on Cheatgrass Invasion. Shrub Die-off, and Other Aspects of Shrub Biology and Management. Forest Service. Intermountain Research Station. General Technical Report INT-276. November 1990. pp. 11 18.
182 of 182