Long-Term Dynamics of Production, Respiration, and Net CO 2 Exchange in Two Sagebrush-Steppe...
15
Rangeland Ecol Manage 59:585–599 | November 2006 Long-Term Dynamics of Production, Respiration, and Net CO 2 Exchange in Two Sagebrush-Steppe Ecosystems Tagir G. Gilmanov, 1 Tony J. Svejcar, 2 Douglas A. Johnson, 3 Raymond F. Angell, 4 Nicanor Z. Saliendra, 5 and Bruce K. Wylie 6 Authors are 1 Associate Professor, Dept of Biology and Microbiology, South Dakota State University, Ag Hall 304, Box 2207B, Brookings, SD 57007; 2 Research Leader, USDA-Agricultural Research Service, East Oregon Agricultural Research Center, 67826-A Hwy 205, Burns, OR 97720; 3 Plant Physiologist, USDA-Agricultural Research Service, Forage and Range Research Laboratory, Utah State University, Logan, UT 84322; 4 Rangeland Scientist, USDA-Agricultural Research Service, East Oregon Agricultural Research Center, 67826-A Hwy 205, Burns, OR 97720; 5 Postdoctoral Plant Physiologist, USDA Forest Service, Forestry Sciences Laboratory, 5985 Hwy K, Rhinelander, WI 54501; and 6 Senior Scientist, SAIC, US Geological Survey Center for Earth Resources Observation and Science, Sioux Falls, SD 57198. Abstract We present a synthesis of long-term measurements of CO 2 exchange in 2 US Intermountain West sagebrush-steppe ecosystems. The locations near Burns, Oregon (1995–2001), and Dubois, Idaho (1996–2001), are part of the AgriFlux Network of the Agricultural Research Service, United States Department of Agriculture. Measurements of net ecosystem CO 2 exchange (F c ) during the growing season were continuously recorded at flux towers using the Bowen ratio-energy balance technique. Data were partitioned into gross primary productivity (P g ) and ecosystem respiration (R e ) using the light-response function method. Wintertime fluxes were measured during 1999/2000 and 2000/2001 and used to model fluxes in other winters. Comparison of daytime respiration derived from light-response analysis with nighttime tower measurements showed close correlation, with daytime respiration being on the average higher than nighttime respiration. Maxima of P g and R e at Burns were both 20 g CO 2 m 2 d 1 in 1998. Maxima of P g and R e at Dubois were 37 and 35 g CO 2 m 2 d 1 , respectively, in 1997. Mean annual gross primary production at Burns was 1 111 (range 475–1 715) g CO 2 m 2 y 1 or about 30% lower than that at Dubois (1 602, range 963–2 162 g CO 2 m 2 y 1 ). Across the years, both ecosystems were net sinks for atmospheric CO 2 with a mean net ecosystem CO 2 exchange of 82 g CO 2 m 2 y 1 at Burns and 253 g CO 2 m 2 y 1 at Dubois, but on a yearly basis either site could be a C sink or source, mostly depending on precipitation timing and amount. Total annual precipitation is not a good predictor of carbon sequestration across sites. Our results suggest that F c should be partitioned into P g and R e components to allow prediction of seasonal and yearly dynamics of CO 2 fluxes. Resumen Presentamos una sı´ntesis de mediciones de largo plazo del intercambio de CO 2 de 2 ecosistemas intermontanos de estepas de ‘‘Sagebrush’’ del oeste del Estados Unidos. Las localidades cercanas a Burns, Oregon (1995–2001) y Dubois, Idaho (1996–2001) son parte de la red AgriFlux del Servicio de Investigacio ´n Agrı ´cola del Departamento de Agricultura del los Estados Unidos. Durante la estacio ´ n de crecimiento se registraron en forma continua mediciones del intercambio neto de CO 2 del ecosistema (F c ) en torres de flujo usando la te ´cnica de Bowen de la relacio ´n de balance de energı´a. Los datos se dividieron en productividad primaria bruta (P g ) y respiracio ´ n del ecosistema (R e ) usando el me ´todo de funcio ´ n de respuesta a la luz. Los flujos invernales se midieron durante los periodos de 1999/2000 y 2000/2001 y se usaron para modelar los flujos en otros inviernos. La comparacio ´ n de la respiracio ´ n diurna, derivada del ana ´lisis de respuesta a la luz, con las mediciones nocturnas de la torre mostro ´ una correlacio ´n estrecha siendo la respiracio ´ n diurna en promedio mayor a la respiracio ´ n nocturna. En 1998, los valores ma ´ ximos a P g y R e en Burns fueron ambos de 20 g CO 2 m 2 d 1 . En Dubois, en 1997, los valores ma ´ximos de P g y R e fueron 37 y 35 g CO 2 m 2 d 1 , respectivamente. La media anual de la produccio ´ n primaria bruta en Burns fue de 1 111 (rango 475–1 715) g CO 2 m 2 an ˜o 1 o aproximadamente 30% menor que en Dubois (1 602, rango 963–2 162 g CO 2 m 2 an ˜o 1 ). A trave ´s de los an ˜ os, ambos ecosistemas fueron depo ´ sitos netos de CO 2 atmosfe ´rico con una media de intercambio neto de CO 2 del ecosistema de 82 g CO 2 m 2 an ˜o 1 en Burns y 253 g CO 2 m 2 an ˜o 1 en Dubois, pero en base anual, cualquier sitio pudo ser un depo ´ sito o fuente de C, dependiendo de la cantidad de precipitacio ´nye ´poca en que esta ocurre. Los valores medios y rangos de P g y R e de los ecosistemas de ‘‘Sagebrush’’ de nuestro estudio fueron similares a los valores de los ecosistemas de zacates cortos y praderas mixtas del norte. Research was supported in part by the Cooperative Agreement ‘‘CO 2 Flux Program’’ 58-5360-4-469 between the USDA-Agricultural Research Service (USDA-ARS) and South Dakota State University and by the Collaborative CO 2 Flux Scaling Project funded through GL/CRSP, USDA-ARS Headquarters, and National Program Staff, and by USDA-ARS AgriFlux participants. Funding for B.K.W.’s work was performed under US Geological Survey contract 03CRCN0001 under the Land Remote Sensing and Geographic Analysis and Monitoring Programs. Any use of trade, product, or firm names is for descriptive purposes only and does not imply endorsement by the US Government. Correspondence: Tagir G. Gilmanov, Dept of Biology and Microbiology, South Dakota State University, Ag Hall 304, Box 2207B, Brookings, SD 57007. Email: [email protected] Manuscript received 22 November 2005; manuscript accepted 23 July 2006. RANGELAND ECOLOGY & MANAGEMENT 59(6) November 2006 585
-
Upload
independent -
Category
Documents
-
view
2 -
download
0
Transcript of Long-Term Dynamics of Production, Respiration, and Net CO 2 Exchange in Two Sagebrush-Steppe...

Rangeland Ecol Manage 59:585–599 | November 2006
Long-Term Dynamics of Production, Respiration, andNet CO2 Exchange in Two Sagebrush-Steppe Ecosystems
Tagir G. Gilmanov,1 Tony J. Svejcar,2 Douglas A. Johnson,3
Raymond F. Angell,4 Nicanor Z. Saliendra,5 and Bruce K. Wylie6
Authors are 1Associate Professor, Dept of Biology and Microbiology, South Dakota State University,Ag Hall 304, Box 2207B, Brookings, SD 57007; 2Research Leader, USDA-Agricultural Research Service,
East Oregon Agricultural Research Center, 67826-A Hwy 205, Burns, OR 97720;3Plant Physiologist, USDA-Agricultural Research Service, Forage and Range Research Laboratory,
Utah State University, Logan, UT 84322; 4Rangeland Scientist, USDA-Agricultural Research Service,East Oregon Agricultural Research Center, 67826-A Hwy 205, Burns, OR 97720; 5Postdoctoral Plant Physiologist,
USDA Forest Service, Forestry Sciences Laboratory, 5985 Hwy K, Rhinelander, WI 54501; and6Senior Scientist, SAIC, US Geological Survey Center for Earth Resources Observation and Science, Sioux Falls, SD 57198.
Abstract
We present a synthesis of long-term measurements of CO2 exchange in 2 US Intermountain West sagebrush-steppe ecosystems.The locations near Burns, Oregon (1995–2001), and Dubois, Idaho (1996–2001), are part of the AgriFlux Network of theAgricultural Research Service, United States Department of Agriculture. Measurements of net ecosystem CO2 exchange (Fc)during the growing season were continuously recorded at flux towers using the Bowen ratio-energy balance technique. Datawere partitioned into gross primary productivity (Pg) and ecosystem respiration (Re) using the light-response function method.Wintertime fluxes were measured during 1999/2000 and 2000/2001 and used to model fluxes in other winters. Comparison ofdaytime respiration derived from light-response analysis with nighttime tower measurements showed close correlation, withdaytime respiration being on the average higher than nighttime respiration. Maxima of Pg and Re at Burns were both 20 gCO2
�m�2 � d�1 in 1998. Maxima of Pg and Re at Dubois were 37 and 35 g CO2�m�2 � d�1, respectively, in 1997. Mean annual
gross primary production at Burns was 1 111 (range 475–1 715) g CO2�m�2 � y�1 or about 30% lower than that at Dubois
(1 602, range 963–2 162 g CO2�m�2 � y�1). Across the years, both ecosystems were net sinks for atmospheric CO2 with a mean
net ecosystem CO2 exchange of 82 g CO2�m�2 � y�1 at Burns and 253 g CO2
�m�2 � y�1 at Dubois, but on a yearly basis eithersite could be a C sink or source, mostly depending on precipitation timing and amount. Total annual precipitation is not a goodpredictor of carbon sequestration across sites. Our results suggest that Fc should be partitioned into Pg and Re components toallow prediction of seasonal and yearly dynamics of CO2 fluxes.
Resumen
Presentamos una sıntesis de mediciones de largo plazo del intercambio de CO2 de 2 ecosistemas intermontanos de estepas de‘‘Sagebrush’’ del oeste del Estados Unidos. Las localidades cercanas a Burns, Oregon (1995–2001) y Dubois, Idaho (1996–2001)son parte de la red AgriFlux del Servicio de Investigacion Agrıcola del Departamento de Agricultura del los Estados Unidos.Durante la estacion de crecimiento se registraron en forma continua mediciones del intercambio neto de CO2 del ecosistema (Fc) entorres de flujo usando la tecnica de Bowen de la relacion de balance de energıa. Los datos se dividieron en productividad primariabruta (Pg) y respiracion del ecosistema (Re) usando el metodo de funcion de respuesta a la luz. Los flujos invernales se midierondurante los periodos de 1999/2000 y 2000/2001 y se usaron para modelar los flujos en otros inviernos. La comparacion de larespiracion diurna, derivada del analisis de respuesta a la luz, con las mediciones nocturnas de la torre mostro una correlacionestrecha siendo la respiracion diurna en promedio mayor a la respiracion nocturna. En 1998, los valores maximos a Pg y Re en Burnsfueron ambos de 20 g CO2
�m�2 � d�1. En Dubois, en 1997, los valores maximos de Pg y Re fueron 37 y 35 g CO2�m�2 � d�1,
respectivamente. La media anual de la produccion primaria bruta en Burns fue de 1 111 (rango 475–1 715) g CO2�m�2 � ano�1 o
aproximadamente 30% menor que en Dubois (1 602, rango 963–2 162 g CO2�m�2 � ano�1). A traves de los anos, ambos
ecosistemas fueron depositos netos de CO2 atmosferico con una media de intercambio neto de CO2 del ecosistema de 82 gCO2
�m�2 � ano�1 en Burns y 253 g CO2�m�2 � ano�1 en Dubois, pero en base anual, cualquier sitio pudo ser un deposito o fuente de
C, dependiendo de la cantidad de precipitacion y epoca en que esta ocurre. Los valores medios y rangos de Pg y Re de los ecosistemasde ‘‘Sagebrush’’ de nuestro estudio fueron similares a los valores de los ecosistemas de zacates cortos y praderas mixtas del norte.
Research was supported in part by the Cooperative Agreement ‘‘CO2 Flux Program’’ 58-5360-4-469 between the USDA-Agricultural Research Service (USDA-ARS) and South Dakota
State University and by the Collaborative CO2 Flux Scaling Project funded through GL/CRSP, USDA-ARS Headquarters, and National Program Staff, and by USDA-ARS AgriFlux participants.
Funding for B.K.W.’s work was performed under US Geological Survey contract 03CRCN0001 under the Land Remote Sensing and Geographic Analysis and Monitoring Programs.
Any use of trade, product, or firm names is for descriptive purposes only and does not imply endorsement by the US Government.
Correspondence: Tagir G. Gilmanov, Dept of Biology and Microbiology, South Dakota State University, Ag Hall 304, Box 2207B, Brookings, SD 57007.
Email: [email protected]
Manuscript received 22 November 2005; manuscript accepted 23 July 2006.
RANGELAND ECOLOGY & MANAGEMENT 59(6) November 2006 585

Nuestros resultados sugieren que Fc debe ser dividida en los componentes de Pg y Re para permitir la prediccion de las dinamicasestacional y anual de los flujos de CO2.
Key Words: CO2 flux tower measurements, gross primary production, ecosystem respiration, flux partitioning, daytimerespiration, nighttime respiration, light-response function method, US Intermountain West.
INTRODUCTION
Sagebrush-steppe (Artemisia-Pseudoroegneria) ecosystems covermore than half (36 million ha) of the shrub-steppe subzone ofthe US Intermountain West and represent about 14% of thetotal US rangeland area (Yorks 1980; West 1983). Sagebrushrangelands are used as a forage resource for livestock pro-duction and have important wildlife and biogeochemicalfunctions (Rickard et al. 1988). Since the mid-1990s, contin-uous measurements of CO2 exchange were obtained at 2sagebrush-steppe sites in the US Department of Agriculture-Agricultural Research Service (USDA-ARS) AgriFlux Network(Svejcar et al. 1997; Angell et al. 2001; Gilmanov et al. 2003a).These long-term measurements covered a wide range ofenvironmental conditions (cold and warm, wet and dry years)that make them valuable for modeling CO2 fluxes across largeareas of the Intermountain West occupied by this ecosystem.Information concerning the magnitudes of these fluxes andtheir relationships to major environmental factors is essentialfor understanding the role of sagebrush-steppe ecosystems inregional and continental carbon budgets under various climatechange and management scenarios.
MATERIALS AND METHODS
Tower CO2 flux data analyzed in this study were obtained at2 sagebrush-steppe sites located in Oregon and Idaho, UnitedStates. The Oregon site was established in 1995 on the NorthernGreat Basin Experimental Range (438299N, 1198439W, 1 380 melevation), located 64 km west of Burns, Oregon. The site isa 65-ha ungrazed Wyoming big sagebrush (Artemisia tridentataNutt., subspecies wyomingensis) community with shrub canopycover of about 10%. Vegetation includes Thurber’s needlegrass(Stipa thurberiana Piper), bluebunch wheatgrass (Pseudoroeg-neria spicata (Pursh) A. Love), Sandberg’s bluegrass (Poasandbergii Vasey), bottlebrush squirreltail (Sitanion hystrix(Nutt.) Smith), prairie lupine (Lupinus lepidus Dougl.), hawks-beard (Crepis occidentalis Nutt.), and longleaf phlox (Phloxlongifolia Nutt.). Maximum leaf area index (LAI) is estimatedas 0.56 m2 �m�2. Soil at the site is described as aridic durichaploxerolls and orthidic duricerolls, with coarse-to-fine sandyloam texture in the Holte-Milcan complex with 0%–2% slopes.Grazing at the site has been excluded since 1995.
The Idaho site is located at the US Sheep Experiment Station(448169N, 1128089W, 1 700 m elevation), about 10 km north ofDubois, Idaho. Shrubs at the site include three-tip sagebrush(Artemisia tripartita Rydb. spp. rupicola Beetle), green rabbit-brush (Chrysothamnus viscidifloris [Hook] Nutt.), and grayhorsebrush (Tetradymia canescens DC.); shrub canopy cover isabout 40%. Herbaceous vegetation is dominated by bluebunchwheatgrass and arrowleaf balsamroot (Balsamorhiza sagittata[Pursh] Nutt.). Other common understory species includeneedle-and-thread grass (Stipa comata Trin. and Rupr.), Sand-
berg’s bluegrass, junegrass (Koeleria cristata L. Pers.), yarrow(Achillea millefolium L.), tapertip hawksbeard (Crepis acumi-nata Nutt.), longleaf phlox, and milkvetches (Astragalus spp.).Maximum measured LAI for Dubois was 1.03 m2 �m�2. Soils areclassified as a complex of typic calcixerolls, pachic haploxerolls,and pachic argixerolls of loamy texture with slopes of 0%–12%.
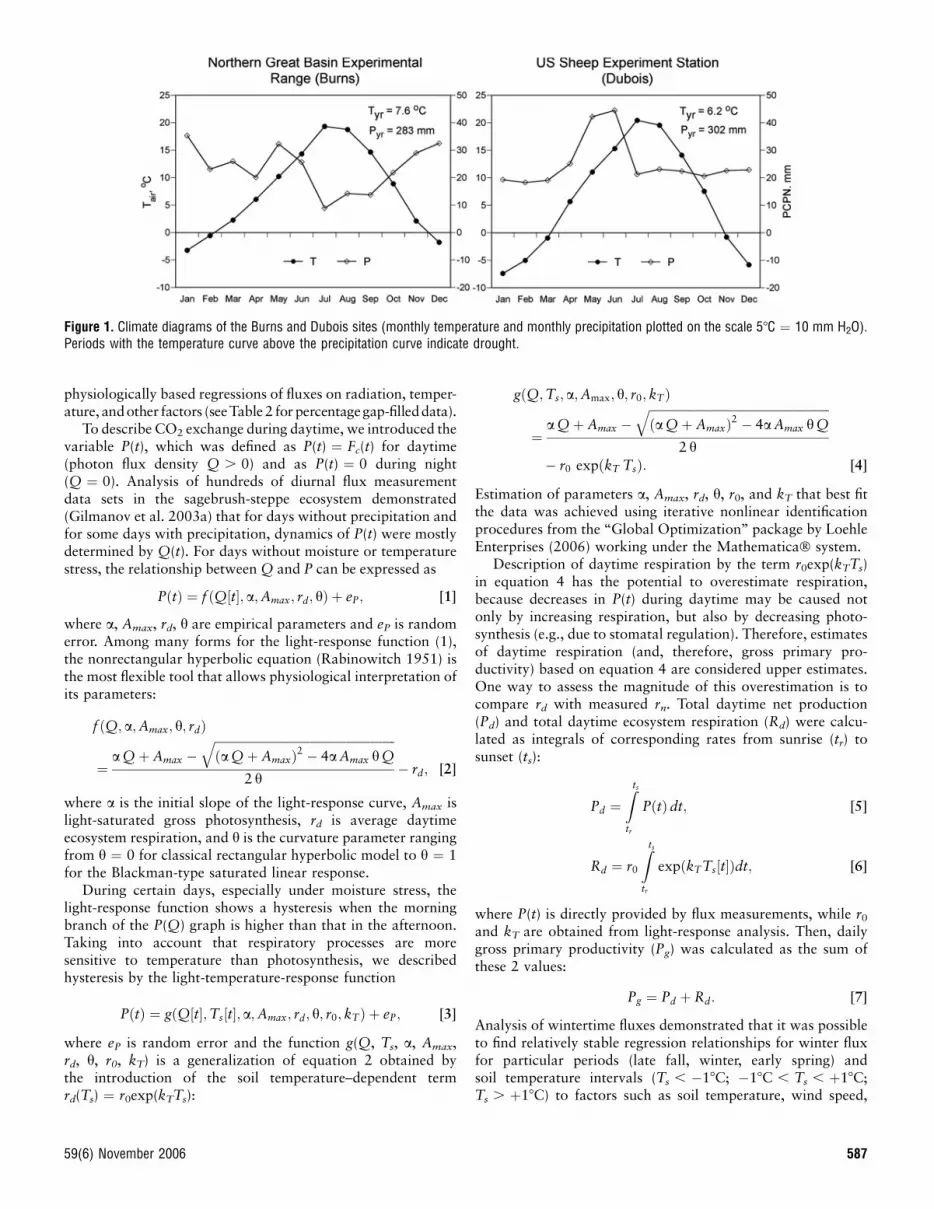
Climatic characteristics of the 2 sites (Fig. 1) are quite similar(mean temperature 7.68C and 6.28C, and precipitation 283 mmand 302 mm at the Burns and Dubois sites, respectively), butseasonal characterizations of the 2 sites are different, whichaffect their productivity. This agrees with growing seasonduration (determined from the tower-flux data as a periodwhen gross photosynthetic assimilation is continuously posi-tive), where the Dubois growing season (202, range 190–220 d)is 45 days shorter than that at the Burns site (247, range218–273 d). Precipitation distribution at the Dubois site hasa pronounced May–June maximum, which makes the Duboissite more favorable for biomass production than the Burns site.Drought is typical at Burns from mid-June to September.
Measurements of net CO2 exchange, Fc, mg CO2�m�2 � s�1
(see Table 1 for the list of symbols and units), were conducted atboth sites using Bowen ratio-energy balance (BREB) instrumen-tation (Model 023/CO2 Bowen ratio system, Campbell Scientific,Logan, UT). Methodology and operation of the BREB systemwere described in detail by Dugas (1993), Campbell Scientific(1995), and Dugas et al. (1999). At the data postprocessing stage,fluxes were corrected 1) for the effects of vapor density andtemperature differences at the 2 sampling heights (Webb et al.1980) and 2) for the conditions when the direction of the heat orwater flux was opposite to the sign of the temperature or moisturegradient, respectively, or when the Bowen ratio was close to�1.0(Ohmura 1982). In the latter case, estimation of the turbulenttransfer coefficient Kh could not be made with the BREBalgorithm but was obtained using the empirical relationshipbetween Kh and wind speed (W. A. Dugas, personal communi-cation, 2004) or estimated using wind speed and the stabilityfunction for heat transfer (Monteith and Unsworth 1990).
Measurements at the Burns site began in 1995 and at theDubois site in 1996 and were limited to April�Octoberthrough 2000. During the winters of 1999/2000 and 2000/2001, systematic measurements of winter fluxes were made,which required thermal insulation and heating of the fieldequipment. CO2 flux measurements during the winters of 1999/2000 and 2000/2001 were used to identify phenomenologicalmodels relating wintertime fluxes to environmental factors(Gilmanov et al. 2004b) that could be used to gap-fill winterfluxes for years without cold-season measurements.
CO2 flux data generated by the BREB algorithm (includingcorrections) were postprocessed for outliers by visual inspectionof diurnal fluxes (time domain graphs) and physiological light-response functions. These missing points were gap-filled usingappropriate algorithms at the later stages of analysis. Gap-fillingtechniques consisted of either interpolation of time series or
586 Rangeland Ecology & Management
physiologically based regressions of fluxes on radiation, temper-ature, andother factors (seeTable 2 for percentagegap-filleddata).
To describe CO2 exchange during daytime, we introduced thevariable P(t), which was defined as P(t) ¼ Fc(t) for daytime(photon flux density Q . 0) and as P(t) ¼ 0 during night(Q ¼ 0). Analysis of hundreds of diurnal flux measurementdata sets in the sagebrush-steppe ecosystem demonstrated(Gilmanov et al. 2003a) that for days without precipitation andfor some days with precipitation, dynamics of P(t) were mostlydetermined by Q(t). For days without moisture or temperaturestress, the relationship between Q and P can be expressed as
PðtÞ ¼ f ðQ½t�; a;Amax; rd; hÞ þ eP; [1]
where a, Amax, rd, h are empirical parameters and eP is randomerror. Among many forms for the light-response function (1),the nonrectangular hyperbolic equation (Rabinowitch 1951) isthe most flexible tool that allows physiological interpretation ofits parameters:
f ðQ; a;Amax; h; rdÞ
¼a Qþ Amax �
ffiffiffiffiffiffiffiffiffiffiffiffiffiffiffiffiffiffiffiffiffiffiffiffiffiffiffiffiffiffiffiffiffiffiffiffiffiffiffiffiffiffiffiffiffiffiffiffiffiffiffiffiffiffiffiffiffiffiffiffiða Qþ AmaxÞ2 � 4a Amax h Q
q2 h
� rd; [2]
where a is the initial slope of the light-response curve, Amax islight-saturated gross photosynthesis, rd is average daytimeecosystem respiration, and h is the curvature parameter rangingfrom h ¼ 0 for classical rectangular hyperbolic model to h ¼ 1for the Blackman-type saturated linear response.
During certain days, especially under moisture stress, thelight-response function shows a hysteresis when the morningbranch of the P(Q) graph is higher than that in the afternoon.Taking into account that respiratory processes are moresensitive to temperature than photosynthesis, we describedhysteresis by the light-temperature-response function
PðtÞ ¼ gðQ½t�;Ts½t�; a;Amax; rd; h; r0; kTÞ þ eP; [3]
where eP is random error and the function g(Q, Ts, a, Amax,rd, h, r0, kT) is a generalization of equation 2 obtained bythe introduction of the soil temperature–dependent termrd(Ts) ¼ r0exp(kTTs):
gðQ;Ts; a;Amax; h; r0; kTÞ
¼a Qþ Amax �
ffiffiffiffiffiffiffiffiffiffiffiffiffiffiffiffiffiffiffiffiffiffiffiffiffiffiffiffiffiffiffiffiffiffiffiffiffiffiffiffiffiffiffiffiffiffiffiffiffiffiffiffiffiffiffiffiffiffiffiffiða Qþ AmaxÞ2 � 4a Amax h Q
q2 h
� r0 expðkT TsÞ: [4]
Estimation of parameters a, Amax, rd, h, r0, and kT that best fitthe data was achieved using iterative nonlinear identificationprocedures from the ‘‘Global Optimization’’ package by LoehleEnterprises (2006) working under the Mathematica� system.
Description of daytime respiration by the term r0exp(kTTs)in equation 4 has the potential to overestimate respiration,because decreases in P(t) during daytime may be caused notonly by increasing respiration, but also by decreasing photo-synthesis (e.g., due to stomatal regulation). Therefore, estimatesof daytime respiration (and, therefore, gross primary pro-ductivity) based on equation 4 are considered upper estimates.One way to assess the magnitude of this overestimation is tocompare rd with measured rn. Total daytime net production(Pd) and total daytime ecosystem respiration (Rd) were calcu-lated as integrals of corresponding rates from sunrise (tr) tosunset (ts):
Pd ¼Zts
tr
PðtÞ dt; [5]
Rd ¼ r0
Zts
tr
expðkTTs½t�Þdt; [6]
where P(t) is directly provided by flux measurements, while r0
and kT are obtained from light-response analysis. Then, dailygross primary productivity (Pg) was calculated as the sum ofthese 2 values:
Pg ¼ Pd þ Rd: [7]
Analysis of wintertime fluxes demonstrated that it was possibleto find relatively stable regression relationships for winter fluxfor particular periods (late fall, winter, early spring) andsoil temperature intervals (Ts , �18C; �18C , Ts , þ18C;Ts . þ18C) to factors such as soil temperature, wind speed,
Figure 1. Climate diagrams of the Burns and Dubois sites (monthly temperature and monthly precipitation plotted on the scale 58C ¼ 10 mm H2O).Periods with the temperature curve above the precipitation curve indicate drought.
59(6) November 2006 587

and snow depth (Gilmanov et al. 2004b). These empiricalrelationships were used to gap-fill winter fluxes for years whenwinter flux measurements were not available.
Annual totals of gross primary production (GPP) andecosystem respiration (RE) were calculated as the sums of
measured or estimated daily values, while net ecosystem CO2
exchange, NEE ¼ GPP�RE. Both the daily estimates of Pg, Re,and Fc, as well as their annual totals, GPP, RE, and NEE, basedon tower flux measurements, have errors characterized bya number of systematic and random components (Moncrieffet al. 1996; Baldocchi 2003; Foken et al. 2004). A formalprocedure for uncertainty analysis and error propagationcalculation for tower flux measurements and postprocessing isnot yet available, although several research teams have come upwith error approximations for annual flux totals, with SENEE inthe 90–250 g CO2
�m�2 � y�1 range for grassland, wetland,crop, and forest ecosystems on relatively level terrain (Gouldenet al. 1996; Lee et al. 1999; Yang et al. 1999; Lafleur et al.2001; Lohila et al. 2004; Hagen et al. 2006).
RESULTS
At both the Burns and Dubois sites, meteorological conditionsduring the years of study were different from long-termaverages (Table 2). At Burns, the weather was warmer andwetter than normal, whereas at Dubois, the weather was colderand drier than normal. Observations at both sites includedyears with contrasting weather, with 1998 being the wettestand 2001 being the driest, resulting in considerable deviationsfrom long-term precipitation averages. Particular weatherevents occurred that were important for interpretation ofweather–productivity relationships at the Burns site. At thepeak of the 1996 growing season at the Burns site, a suddendrop of temperature occurred on 18 and 19 June with dailyminima of �7.28C and �5.98C, respectively. This apparentlyresulted in severe frost damage of photosynthetic tissues, asdemonstrated by a nearly 2-week-long drop of gross primaryproductivity from Pg . 10 g CO2
�m�2 �d�1 during the first2 weeks of June to values less than 1 g CO2
�m�2 �d�1 duringthe third and fourth weeks of June 1996. Although photosyn-thetic capacity of the vegetation was somewhat restoredduring July and August, total annual gross primary produc-tion (GPP) for 1996 was substantially lower than expectedfrom the temperature and amount of precipitation receivedthat year.
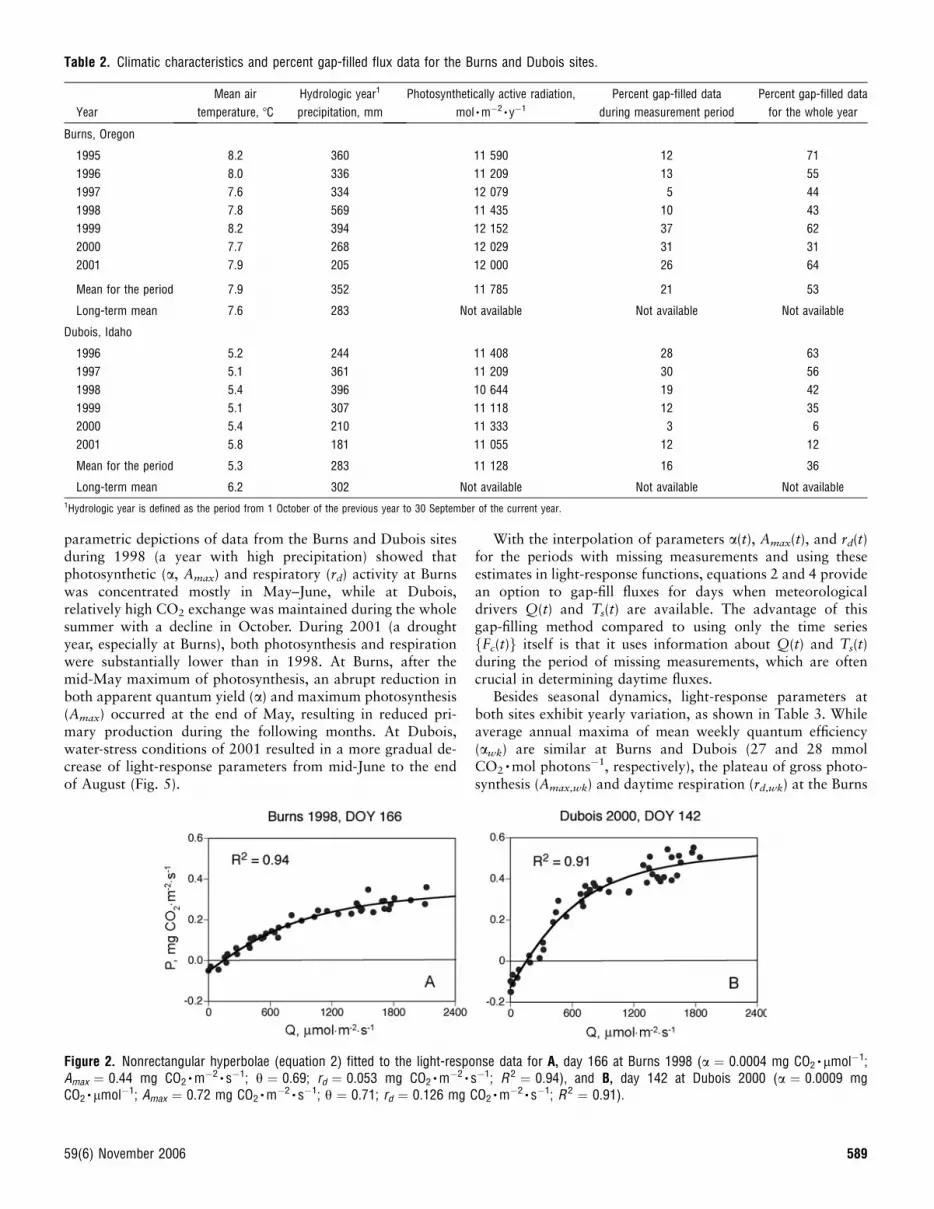
Light-Response FunctionsLight-response functions for days when CO2 exchange wasdriven by photosynthetically active radiation (PAR) are shownin Figure 2, which describes the nonrectangular hyperbolic fit(equation 2) to the data for day 166 at Burns in 1998 and forday 142 at Dubois in 2000, which exemplify cases of closeP(Q) relationships.
More commonly, temperature or moisture conditions alsocan affect CO2 exchange in addition to radiation. This resultsin a hysteresis effect on light response. Those cases are illus-trated in Figure 3, which shows typical light-temperature-response surfaces P(Q,Ts) for day 155 at Burns 1996 and day183 at Dubois 1998.
Examination of the time-domain plots of light-responseparameters demonstrated that patterns existed for seasonaland year-to-year dynamics. These patterns reflected both thephenological dynamics of production and respiration duringthe year (regular uni- or bimodal patterns) and the fluctuationsduring particular years (Figs. 4, 5; Table 3). For example,
Table 1. Table of symbols.
Latin symbols
A Intercept of the regression line
Amax Light-saturated gross photosynthesis, mg CO2�m�2 � s�1
Amax,wk Mean weekly light-saturated gross photosynthesis, mg CO2�m�2 � s�1
b Slope of the regression line
ex Error term for variable x in regression equation
f(. . .) Function of given arguments
Fc Net ecosystem CO2 exchange, mg CO2�m�2 � s�1
Fd 24-h integral of net ecosystem CO2 exchange, g CO2�m�2 � d�1
g(. . .) Function of given arguments
GPP Annual gross primary production, g CO2�m�2 � y�1
Kh Turbulent transfer coefficient, m2 � s�1
kT Coefficient of the exponential relationship of respiration on
temperature (8C)�1
n Sample size
NEE Annual net ecosystem CO2 exchange, g CO2�m�2 � y�1
NEEcum Cumulative NEE, g CO2�m�2
p Probability level, dimensionless
P Daytime CO2 flux, mg CO2�m�2 � s�1
PAR Photosynthetically active radiation, lmol �m�2 � s�1
Pd Daytime net CO2 flux integral, g CO2�m�2 � d�1
Pg Gross primary productivity, mg CO2�m�2 � s�1 or g CO2
�m�2 � d�1
PCPN Atmospheric precipitation, mm � day�1 or mm � y�1
PCPNhyd Hydrologic year precipitation, mm � y�1
Pyr Mean annual precipitation, mm � y�1
Q Photon flux density, lmol �m�2 � s�1 or daily PAR total, mol �m�2 � d�1
r Correlation coefficient
r0 Mean daytime ecosystem respiration at reference temperature
Ts ¼ 0, mg CO2�m�2 � s�1
rd Mean daytime ecosystem respiration, mg CO2�m�2 � s�1
rd,wk Mean weekly daytime ecosystem respiration, mg CO2�m�2 � s�1
Rd Daytime integral of ecosystem respiration, g CO2�m�2 � d�1
Re Total ecosystem respiration, mg CO2�m�2 � s�1 or g CO2
�m�2 � d�1
RE Annual ecosystem respiration, g CO2�m�2 � y�1
rn Nighttime ecosystem respiration, mg CO2�m�2 � s�1
rn,wk Mean weekly nighttime ecosystem respiration, mg CO2�m�2 � s�1
SE Standard error
sx Standard error of parameter x
t Time or Student’s t statistic (depending on context)
tr Time of sunrise
ts Time of sunset
Ts Soil temperature, 8C
Tyr Mean annual air temperature, 8C
Greek symbols
a Apparent quantum efficiency, mg CO2� lmol�1, g CO2
�mol�1,
or mmol CO2�mol�1
awk Mean weekly apparent quantum efficiency, mg CO2�lmol�1,
g CO2�mol�1, or mmol CO2
�mol�1
h Curvature of the light-response curve, dimensionless
588 Rangeland Ecology & Management
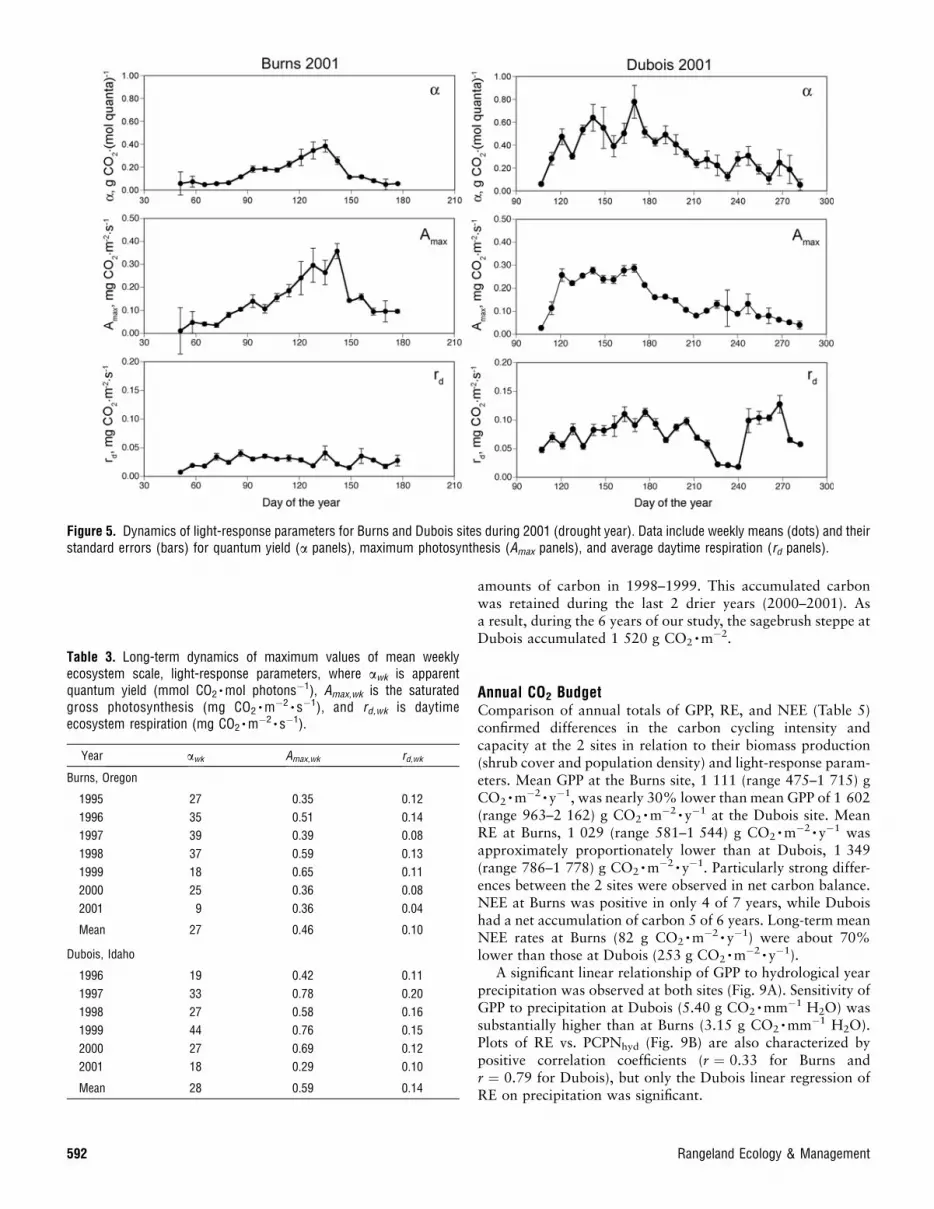
parametric depictions of data from the Burns and Dubois sitesduring 1998 (a year with high precipitation) showed thatphotosynthetic (a, Amax) and respiratory (rd) activity at Burnswas concentrated mostly in May–June, while at Dubois,relatively high CO2 exchange was maintained during the wholesummer with a decline in October. During 2001 (a droughtyear, especially at Burns), both photosynthesis and respirationwere substantially lower than in 1998. At Burns, after themid-May maximum of photosynthesis, an abrupt reduction inboth apparent quantum yield (a) and maximum photosynthesis(Amax) occurred at the end of May, resulting in reduced pri-mary production during the following months. At Dubois,water-stress conditions of 2001 resulted in a more gradual de-crease of light-response parameters from mid-June to the endof August (Fig. 5).
With the interpolation of parameters a(t), Amax(t), and rd(t)for the periods with missing measurements and using theseestimates in light-response functions, equations 2 and 4 providean option to gap-fill fluxes for days when meteorologicaldrivers Q(t) and Ts(t) are available. The advantage of thisgap-filling method compared to using only the time seriesfFc(t)g itself is that it uses information about Q(t) and Ts(t)during the period of missing measurements, which are oftencrucial in determining daytime fluxes.
Besides seasonal dynamics, light-response parameters atboth sites exhibit yearly variation, as shown in Table 3. Whileaverage annual maxima of mean weekly quantum efficiency(awk) are similar at Burns and Dubois (27 and 28 mmolCO2
�mol photons�1, respectively), the plateau of gross photo-synthesis (Amax,wk) and daytime respiration (rd,wk) at the Burns
Figure 2. Nonrectangular hyperbolae (equation 2) fitted to the light-response data for A, day 166 at Burns 1998 (a ¼ 0.0004 mg CO2� lmol�1;
Amax ¼ 0.44 mg CO2�m�2 � s�1; h ¼ 0.69; rd ¼ 0.053 mg CO2
�m�2 � s�1; R 2 ¼ 0.94), and B, day 142 at Dubois 2000 (a ¼ 0.0009 mgCO2
� lmol�1; Amax ¼ 0.72 mg CO2�m�2 � s�1; h ¼ 0.71; rd ¼ 0.126 mg CO2
�m�2 � s�1; R 2 ¼ 0.91).
Table 2. Climatic characteristics and percent gap-filled flux data for the Burns and Dubois sites.
Year
Mean air
temperature, 8C
Hydrologic year1
precipitation, mm
Photosynthetically active radiation,
mol �m�2 � y�1
Percent gap-filled data
during measurement period
Percent gap-filled data
for the whole year
Burns, Oregon
1995 8.2 360 11 590 12 71
1996 8.0 336 11 209 13 55
1997 7.6 334 12 079 5 44
1998 7.8 569 11 435 10 43
1999 8.2 394 12 152 37 62
2000 7.7 268 12 029 31 31
2001 7.9 205 12 000 26 64
Mean for the period 7.9 352 11 785 21 53
Long-term mean 7.6 283 Not available Not available Not available
Dubois, Idaho
1996 5.2 244 11 408 28 63
1997 5.1 361 11 209 30 56
1998 5.4 396 10 644 19 42
1999 5.1 307 11 118 12 35
2000 5.4 210 11 333 3 6
2001 5.8 181 11 055 12 12
Mean for the period 5.3 283 11 128 16 36
Long-term mean 6.2 302 Not available Not available Not available
1Hydrologic year is defined as the period from 1 October of the previous year to 30 September of the current year.
59(6) November 2006 589

site are substantially lower than those at Dubois (0.46 and0.10 mg CO2
�m�2 � s�1 compared to 0.59 and 0.14 mgCO2
�m�2 � s�1, respectively).
Daytime vs. Nighttime RespirationComparison of daytime (rd) and nighttime (rn) respiration forvarious sites and years reveals that CO2 evolution during lightand dark periods of the same day may be different (e.g., due toprecipitation events), though the trend is toward a 1:1 relation-ship. The regression model for individual days at the Burns sitein 1998 (n ¼ 227 and R2 ¼ 0.63) was
rd ¼ ð0:0084 6 0:0027Þ þ ð1:029 6 0:053Þrn: [9]
The intercept was significantly greater than 0, while the slopewas not significantly different from 1 (p ¼ 0.05). For Dubois2000 (n ¼ 348 days, R2 ¼ 0.74) the regression model,
rd ¼ ð0:0064 6 0:0018Þ þ ð0:961 6 0:031Þrn [10]
had an intercept that was significantly greater than 0, anda slope that was not significantly different from 1 (p ¼ 0.05).
The relationship becomes clearer if we group day- andnighttime respiration data into weekly blocks. For Burns1998, the relationship between weekly averaged daytime andnighttime respiration was given by
rd;wk ¼ ð0:0041 6 0:0017Þ þ ð1:02 6 0:11Þrn;wk: [11]
This showed that the regression lies above the 1:1 line, thoughnearly parallel to it.
The regression equation for the weekly grouped Dubois2000 data was
rd;wk ¼ ð�0:031 6 0:001Þ þ ð1:140 6 0:078Þrn;wk: [12]
Compared to the daily data where outliers tended to distort theoverall relationship, regression of the weekly grouped data,calculated taking into account errors in both variables (we usedthe LinearFit program by Harrison 1996), showed that both theintercept and slope were significantly greater than the 1:1relationship. This means that for Dubois 2000 data, daytimerespiration on average was higher than nighttime respiration.
Table 4 summarizes regression parameters for weekly day-time vs. nighttime respiration for all years of study. Out of all
Figure 3. Hysteresis of light-response in sagebrush-steppe ecosystems shown for day 155 at Burns 1996: A, P–Q diagram and light-response curvefitted by equation 2 (dashed line); B, light-temperature-response surface described by equation 4 (a ¼ 0.0011 mg CO2
� lmol�1; Amax ¼ 0.43 mgCO2
�m�2 � s�1; h ¼ 0.71; r0 ¼ 0.052 mg CO �m�2 � s�1; kT ¼ 0.051 (8C) �1; R 2 ¼ 0.88), and day 183 at Dubois 1998; C, P–Q diagram and light-response curve fitted by equation 2 (dashed line); and D, light-temperature-response surface described by equation 4 (a ¼ 0.0005 mg CO2
� lmol�1;Amax ¼ 0.47 mg CO2
�m�2 � s�1; h ¼ 0.98; r0 ¼ 0.020 mg CO2�m�2 � s�1; kT ¼ 0.084 (8C) �1; R2 ¼ 0.96).
590 Rangeland Ecology & Management

13 years, only in 1 year (Dubois, 1999) the slope b of theregression rd,wk ¼ a þ brn,wk was less than 1. Nevertheless,because of high data variability and resulting high standarderrors (sb) of the b estimates for individual years, only in 3 yearsout of 13 were the regression slopes significantly greater than 1(p , 0.05) (Burns, 1999, 2000; Dubois, 2000).
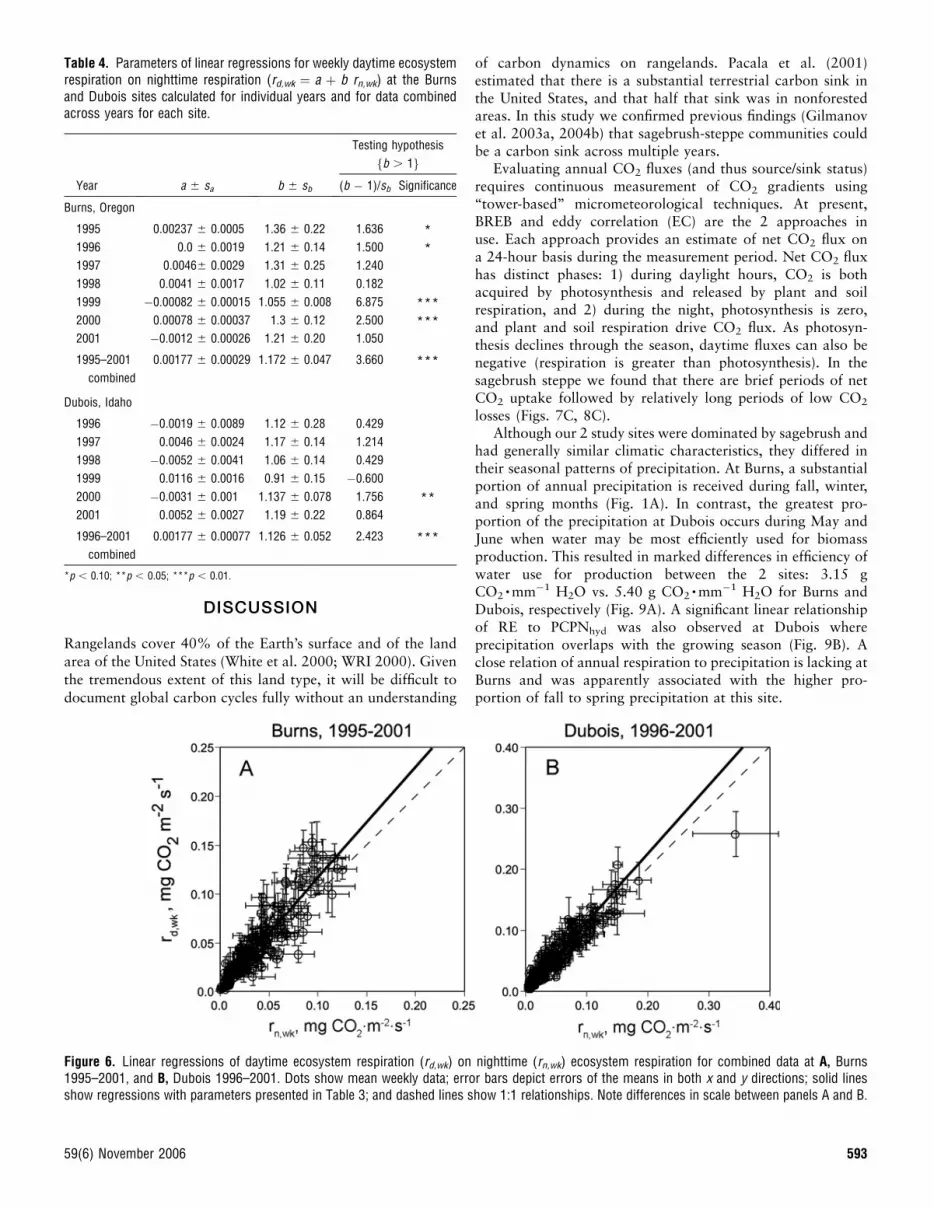
Combining data across all years for both sites into a singlescatter diagram and calculating the corresponding regressions(Fig. 6) indicated that slopes of the linear regression of rd,wk vs.rn,wk were greater than 1 (p ¼ 0.001) (Table 4).
Seasonal and Yearly Dynamics of CO2 Exchange ComponentsEstimates of daytime respiration (Rd) from light-responseanalysis were combined with daytime flux integrals (Pd) toobtain daily gross primary productivity (Pg) (Figs. 7A, 8A). Theestimated daytime (Rd) and measured nighttime (Rn) respira-tion values were summed to obtain 24-hour respiration(Re ¼ Rd þ Rn, Figs. 7B, 8B). Gap-filling during daytime wasperformed using light-response equations 2 and 4 with param-eters interpolated according to their seasonal patterns (Figs. 4,5). Nighttime fluxes were gap-filled using several methods,including 1) linear interpolation in cases with few missing 20-minute values, 2) use of diurnal patterns of respiration curves(Falge et al. 2001), 3) applying regressions of nighttime fluxesto environmental drivers (e.g., soil temperature and mois-ture), or 4) extrapolation of light-response functions for thecorresponding day to PAR values of 0 (Q ¼ 0). During
winter, gap-filling was performed using regressions of Fc withsoil temperature, wind speed, and snow depth establishedfor periods with available flux measurements (Gilmanovet al. 2004b).
Maximum Pg at Burns occurred in late May–early June andreached 20 g CO2
�m�2 � d�1 (1998). Maximum Re was alsonearly 20 g CO2
�m�2 �d�1 for several years, especially 1996.During 7 years of measurements, various combinations ofproduction and respiration processes occurred, resulting insubstantial changes of annual carbon budget. Considerablevariation was evident in particular years with a source of CO2
in 1996 and 2000 and a sink in 1997 and 1998. Across the 7-year period, the sagebrush-steppe site at Burns accumulated573 g CO2
�m�2 (Fig. 7D). This is equivalent to about 4 timesthe mean aboveground biomass at this site (767 kg �DM �ha�1).Thus, for our study years, the Burns site may be characterizedas a weak sink for atmospheric carbon.
The carbon cycle at the Dubois site was distinguished bysignificantly higher assimilation (Pg of 37 g CO2
�m�2 �d�1 wasobserved in 1997) and respiration fluxes (maximum Re of 35 gCO2
�m�2 � d�1 occurred the same year) than that at Burns.While the seasonal pattern of Pg(t) reached a single peak inMay–June, the seasonal curve of Re(t) typically was bimodalwith a first peak during the growing season and a smallersecond maximum in the fall (Fig. 8B). The curve of accumu-lated net ecosystem exchange (NEEcum) (Fig. 8D) indicates thatproduction and respiration in this ecosystem were in balanceduring 1996–1997. The ecosystem accumulated significant
Figure 4. Dynamics of light-response parameters for the Burns and Dubois sites during 1998 (a year with high precipitation). Data include weeklymeans (dots) and their standard errors (bars) for quantum yield (a panels), maximum photosynthesis (Amax panels), and average daytime respiration(rd panels).
59(6) November 2006 591
amounts of carbon in 1998–1999. This accumulated carbonwas retained during the last 2 drier years (2000–2001). Asa result, during the 6 years of our study, the sagebrush steppe atDubois accumulated 1 520 g CO2
�m�2.
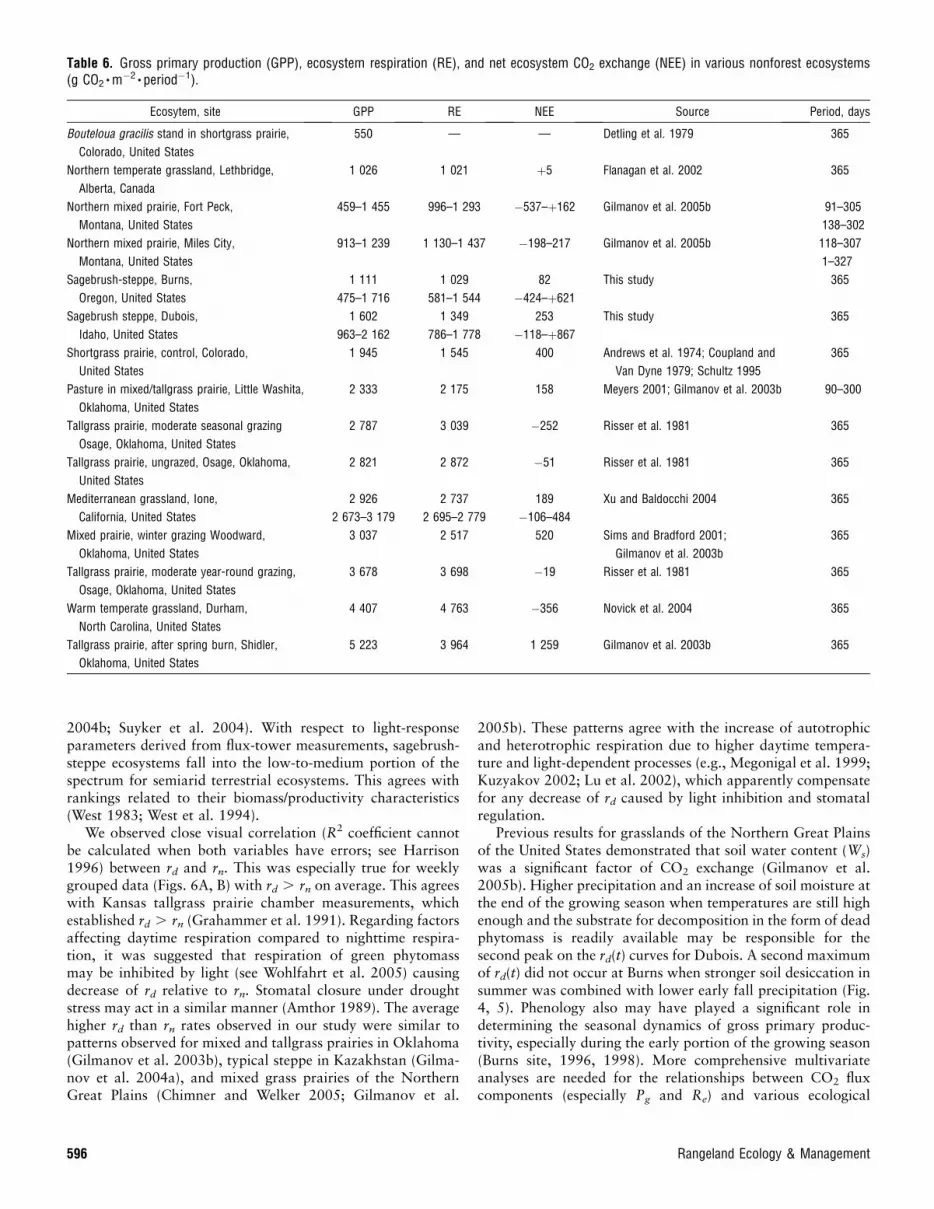
Annual CO2 BudgetComparison of annual totals of GPP, RE, and NEE (Table 5)confirmed differences in the carbon cycling intensity andcapacity at the 2 sites in relation to their biomass production(shrub cover and population density) and light-response param-eters. Mean GPP at the Burns site, 1 111 (range 475–1 715) gCO2
�m�2 � y�1, was nearly 30% lower than mean GPP of 1 602(range 963–2 162) g CO2
�m�2 � y�1 at the Dubois site. MeanRE at Burns, 1 029 (range 581–1 544) g CO2
�m�2 � y�1 wasapproximately proportionately lower than at Dubois, 1 349(range 786–1 778) g CO2
�m�2 � y�1. Particularly strong differ-ences between the 2 sites were observed in net carbon balance.NEE at Burns was positive in only 4 of 7 years, while Duboishad a net accumulation of carbon 5 of 6 years. Long-term meanNEE rates at Burns (82 g CO2
�m�2 � y�1) were about 70%lower than those at Dubois (253 g CO2
�m�2 � y�1).A significant linear relationship of GPP to hydrological year
precipitation was observed at both sites (Fig. 9A). Sensitivity ofGPP to precipitation at Dubois (5.40 g CO2
�mm�1 H2O) wassubstantially higher than at Burns (3.15 g CO2
�mm�1 H2O).Plots of RE vs. PCPNhyd (Fig. 9B) are also characterized bypositive correlation coefficients (r ¼ 0.33 for Burns andr ¼ 0.79 for Dubois), but only the Dubois linear regression ofRE on precipitation was significant.
Figure 5. Dynamics of light-response parameters for Burns and Dubois sites during 2001 (drought year). Data include weekly means (dots) and theirstandard errors (bars) for quantum yield (a panels), maximum photosynthesis (Amax panels), and average daytime respiration (rd panels).
Table 3. Long-term dynamics of maximum values of mean weeklyecosystem scale, light-response parameters, where awk is apparentquantum yield (mmol CO2
�mol photons�1), Amax,wk is the saturatedgross photosynthesis (mg CO2
�m�2 � s�1), and rd,wk is daytimeecosystem respiration (mg CO2
�m�2 � s�1).
Year awk Amax,wk rd,wk
Burns, Oregon
1995 27 0.35 0.12
1996 35 0.51 0.14
1997 39 0.39 0.08
1998 37 0.59 0.13
1999 18 0.65 0.11
2000 25 0.36 0.08
2001 9 0.36 0.04
Mean 27 0.46 0.10
Dubois, Idaho
1996 19 0.42 0.11
1997 33 0.78 0.20
1998 27 0.58 0.16
1999 44 0.76 0.15
2000 27 0.69 0.12
2001 18 0.29 0.10
Mean 28 0.59 0.14
592 Rangeland Ecology & Management
DISCUSSION
Rangelands cover 40% of the Earth’s surface and of the landarea of the United States (White et al. 2000; WRI 2000). Given
the tremendous extent of this land type, it will be difficult to
document global carbon cycles fully without an understanding
of carbon dynamics on rangelands. Pacala et al. (2001)estimated that there is a substantial terrestrial carbon sink inthe United States, and that half that sink was in nonforestedareas. In this study we confirmed previous findings (Gilmanovet al. 2003a, 2004b) that sagebrush-steppe communities couldbe a carbon sink across multiple years.
Evaluating annual CO2 fluxes (and thus source/sink status)requires continuous measurement of CO2 gradients using‘‘tower-based’’ micrometeorological techniques. At present,BREB and eddy correlation (EC) are the 2 approaches inuse. Each approach provides an estimate of net CO2 flux ona 24-hour basis during the measurement period. Net CO2 fluxhas distinct phases: 1) during daylight hours, CO2 is bothacquired by photosynthesis and released by plant and soilrespiration, and 2) during the night, photosynthesis is zero,and plant and soil respiration drive CO2 flux. As photosyn-thesis declines through the season, daytime fluxes can also benegative (respiration is greater than photosynthesis). In thesagebrush steppe we found that there are brief periods of netCO2 uptake followed by relatively long periods of low CO2
losses (Figs. 7C, 8C).Although our 2 study sites were dominated by sagebrush and
had generally similar climatic characteristics, they differed intheir seasonal patterns of precipitation. At Burns, a substantialportion of annual precipitation is received during fall, winter,and spring months (Fig. 1A). In contrast, the greatest pro-portion of the precipitation at Dubois occurs during May andJune when water may be most efficiently used for biomassproduction. This resulted in marked differences in efficiency ofwater use for production between the 2 sites: 3.15 gCO2
�mm�1 H2O vs. 5.40 g CO2�mm�1 H2O for Burns and
Dubois, respectively (Fig. 9A). A significant linear relationshipof RE to PCPNhyd was also observed at Dubois whereprecipitation overlaps with the growing season (Fig. 9B). Aclose relation of annual respiration to precipitation is lacking atBurns and was apparently associated with the higher pro-portion of fall to spring precipitation at this site.
Table 4. Parameters of linear regressions for weekly daytime ecosystemrespiration on nighttime respiration (rd,wk ¼ a þ b rn,wk) at the Burnsand Dubois sites calculated for individual years and for data combinedacross years for each site.
Year a 6 sa b 6 sb
Testing hypothesis
fb . 1g
(b � 1)/sb Significance
Burns, Oregon
1995 0.00237 6 0.0005 1.36 6 0.22 1.636 *1996 0.0 6 0.0019 1.21 6 0.14 1.500 *1997 0.00466 0.0029 1.31 6 0.25 1.240
1998 0.0041 6 0.0017 1.02 6 0.11 0.182
1999 �0.00082 6 0.00015 1.055 6 0.008 6.875 ***2000 0.00078 6 0.00037 1.3 6 0.12 2.500 ***2001 �0.0012 6 0.00026 1.21 6 0.20 1.050
1995–2001
combined
0.00177 6 0.00029 1.172 6 0.047 3.660 ***
Dubois, Idaho
1996 �0.0019 6 0.0089 1.12 6 0.28 0.429
1997 0.0046 6 0.0024 1.17 6 0.14 1.214
1998 �0.0052 6 0.0041 1.06 6 0.14 0.429
1999 0.0116 6 0.0016 0.91 6 0.15 �0.600
2000 �0.0031 6 0.001 1.137 6 0.078 1.756 **2001 0.0052 6 0.0027 1.19 6 0.22 0.864
1996–2001
combined
0.00177 6 0.00077 1.126 6 0.052 2.423 ***
*p , 0.10; **p , 0.05; ***p , 0.01.
Figure 6. Linear regressions of daytime ecosystem respiration (rd,wk) on nighttime (rn,wk) ecosystem respiration for combined data at A, Burns1995–2001, and B, Dubois 1996–2001. Dots show mean weekly data; error bars depict errors of the means in both x and y directions; solid linesshow regressions with parameters presented in Table 3; and dashed lines show 1:1 relationships. Note differences in scale between panels A and B.
59(6) November 2006 593

Data in Table 6 allow comparison of GPP and RE values forthe sagebrush steppe with other nonforested ecosystems. Theproduction and respiration estimates from our study for thesagebrush steppe of the Intermountain West were similar topublished values for the shortgrass and mixed prairies of theNorthern Great Plains and the High Central Plains of NorthAmerica. However, they are lower than values of GPP and REfor more productive ecosystems in the United States includingthe mixed and tallgrass prairies of the Central and SouthernGreat Plains, Mediterranean grasslands in California, andwarm-temperate grasslands of the East Coast.
During the course of this study (1995–2001), both the Burnsand Dubois sites were carbon sinks, taking up from theatmosphere more CO2 than they released. Because the slopesof the trend lines of the GPP–PCPN plots are higher than onRE–PCPN plots (Fig. 9), we observe predominance of CO2-sinkactivity in years with more precipitation and source activity indrier years (Fig. 7, 8). These patterns are in agreement withdata for mixed prairies of the Northern and Central GreatPlains, where both the BREB and the EC tower measurementsdemonstrated predominance of CO2-source activity in droughtyears (Meyers 2001; Gilmanov et al. 2003b, 2005b). Duringthe entire study period, NEE at Burns and Dubois averaged 82
and 253 g CO2�m�2 � y�1, respectively. We would expect
relatively large accumulations of organic carbon at these sites(especially Dubois) given these sink strengths. It is possible thatthese water-stressed sites have become more active sinks asatmospheric CO2 has increased during the past 100þ years(Morgan et al. 2001, 2004; Mielnick et al. 2001). It is alsopossible that combustion of aboveground biomass played a rolein carbon dynamics.
The Dubois site was a sink for CO2 with average NEE ; 0.7t C �m�2 � y�1. An estimate of the total amount of organiccarbon in this ecosystem is about 116 t C � ha�1. If we assumethat the NEE level of 0.7 t C � ha�1 � y�1 is maintained at theDubois site, it would take less than 200 years to accumulatethis amount of organic carbon. However, an alternativescenario would be to assume variations in the NEE dynamicswhen high values (; 0.7 t C �ha�1 � y�1) occur as bursts duringfavorable periods, with lower or even negative NEE values inbetween. This suggests an accumulation of 116 t �C �ha�1 maytake 1 000 or more years. Why, with such a high CO2-sinkpotential at Dubois, is there no substantial accumulation oforganic carbon? The explanation may be partially due towildfires, which ensure periodic mineralization of organicmatter. Wildfires are a natural part of sagebrush-steppe eco-
Figure 7. Seasonal and year-to-year dynamics of: A, gross primaryproductivity Pg; B, ecosystem respiration Re; C, net ecosystem CO2
exchange Fc; D, cumulative net ecosystem CO2 exchange NEEcum; and E,accumulated precipitation of the hydrologic year PCPNhyd at the Burnssite during 1995–2001. Note differences in scale between Figs. 7 and 8.
Figure 8. Seasonal and year-to-year dynamics of: A, gross primaryproductivity Pg; B, ecosystem respiration Re; C, net ecosystem CO2
exchange Fc; D, cumulative net ecosystem CO2 exchange NEEcum; and E,accumulated precipitation for the hydrologic year PCPNhyd at the Duboissite during 1996–2001. Note differences in scale between Figs. 7 and 8.
594 Rangeland Ecology & Management

systems in the Intermountain West, with estimates of fireintervals ranging from 2–28 to 60–110 years (Whisenant1990; Knapp 1995; Miller and Rose 1999). Fires substantiallyaffect structure and composition of the ecosystem withconsequences for CO2, water, and energy fluxes (Johnson etal. 1999; West and Yorks 2002; Obrist et al. 2003).
Assuming that 1 t of phytomass corresponds to 0.45 t C, we
may conclude that with a NEE of 253 g CO2�m�2 � y�1 (¼ 0.69
t C �ha�1 � y�1), it would take less than 7 years to renew the total(above þ belowground) biomass of 10 t �ha�1 (4.5 t C �ha�1)
(West 1983; West et al. 1994) for the sagebrush steppe. Witha more realistic assumption of variable NEE between fires, we
would estimate a biomass turnover period of about 13 years,which is within the estimate of the average fire interval of 12–15years in the sagebrush steppe of south-central Oregon (Millerand Rose 1999). Using a NEE of 82 g CO2
�m�2 � y�1 (¼ 0.224 tC � ha�1 � y�1) estimated for Burns, and variable NEE ratesbetween fires, we obtain a biomass turnover time of 40 yearsor more. This is closer to the fire interval estimate of 60–100years suggested by Whisenant (1990).
The Dubois site was dominated by three-tip sagebrush andhad shrub canopy cover of 40%, whereas the Burns site wasdominated by Wyoming big sagebrush and had shrub cover ofabout 10%. In much of the Intermountain West, fire returnintervals for communities at the high end of shrub cover (e.g.,40%) would be 15–25 years, whereas those with low cover(e.g., 10%) would have fire return intervals of 50–75 years.From a historical perspective, sites with higher productivityexperienced a short fire return interval, and the less productivesites had slower fuel accumulation and burned less frequently.
The range of values for ecosystem-scale, light-responseparameters fa, Amax, rdg for sagebrush-steppe sites in ourstudy (Figs. 4, 5; Table 3) were similar to parameters estimatedfor ecosystems of the Northern Great Plains in North America.This includes values for the northern short-mixed grass prairiesin Lethbridge, Alberta, Canada (awk ¼ 17 mmol CO2
�molphotons�1, Amax,wk ¼ 0.6 mg CO2
�m�2 � s�1, rd,wk ¼ 0.11 mgCO2
�m�2 � s�1), Fort Peck, Montana, USA (awk ¼ 18 mmolCO2
�mol photons�1, Amax,wk ¼ 0.56 mg CO2�m�2 � s�1,
rd,wk ¼ 0.20 mg CO2�m�2 � s�1), Miles City, Montana, USA
(awk ¼ 17 mmol CO2�mol photons�1, Amax,wk ¼ 0.40 mg
CO2�m�2 � s�1, rd,wk ¼ 0.20 mg CO2
�m�2 � s�1), and Mandan,North Dakota, USA (awk ¼ 20 mmol CO2
�mol photons�1,Amax,wk ¼ 0.57 mg CO2
�m�2 � s�1, rd,wk ¼ 0.15 mgCO2
�m�2 � s�1) (Flanagan et al. 2002; Gilmanov et al.2005b). This is not surprising because of similar climates andgrass cover in the northern mixed prairies (though they lacka significant shrub component). The light-response parametersfor our sagebrush-steppe study sites were lower than those formore productive mixed prairie sites, such as the one atCheyenne, Wyoming, USA (awk ¼ 34 mmol CO2
�mol photons�1,Amax,wk ¼ 1.25 mg CO2
�m�2 � s�1, rd,wk ¼ 0.28 mgCO2
�m�2 � s�1), or tallgrass prairies and agricultural crops(Luo et al. 2000; Gilmanov et al. 2003b; Gilmanov et al.
Table 5. Annual totals of climatic and CO2 exchange characteristics forthe 2 sagebrush-steppe sites during the study period: PCPNhyd
(hydrologic year precipitation), Tyr (mean annual air temperature), GPP(gross primary production), RE (ecosystem respiration), and NEE (netecosystem CO2 exchange).
Year
PCPNhyd
mm � yr�1 Tyr 8C
GPP g �CO2�
m�2 � y�1
RE g �CO2�
m�2 � y�1
NEE g � CO2�
m�2 � y�1
Burns 1995–2001
1995 360 8.23 1 147 1 074 73
1996 336 7.96 1 120 1 544 �424
1997 334 7.61 1 343 918 426
1998 569 7.78 1 716 1 095 621
1999 394 8.19 1 152 924 227
2000 268 7.71 828 1 069 �245
2001 205 7.90 475 581 �106
Mean 352 7.91 1 111 1 029 82
SE 106 0.22 360 266 344
Dubois 1996–2001
1996 244 5.24 1 185 1 176 9
1997 361 5.05 1 892 1 778 114
1998 396 5.36 2 162 1 690 472
1999 307 5.11 2 075 1 209 867
2000 210 5.36 1 335 1 453 �118
2001 181 5.77 963 786 177
Mean 283 5.32 1 602 1 349 253
SE 78 0.23 461 336 328
Figure 9. Gross primary production, GPP (A), and total ecosystem respiration, RE (B) (g CO2�m�2 � y�1) for the Burns and Dubois sites in relation
to hydrologic year precipitation, PCPNhyd (mm � y�1). Burns: GPP ¼ 3.15 �PCPNhyd þ 1.74, R2 ¼ 0.85, p ¼ 0.003; RE ¼ 0.85 � PCPNhyd þ 729,R2 ¼ 0.11, p ¼ 0.12 (nonsignificant); Dubois: GPP ¼ 5.40 � PCPHhyd þ 72.15, R2 ¼ 0.84, p ¼ 0.01; RE ¼ 3.41 � PCPNhyd þ 382, R2 ¼ 0.63,p ¼ 0.06.
59(6) November 2006 595
2004b; Suyker et al. 2004). With respect to light-responseparameters derived from flux-tower measurements, sagebrush-steppe ecosystems fall into the low-to-medium portion of thespectrum for semiarid terrestrial ecosystems. This agrees withrankings related to their biomass/productivity characteristics(West 1983; West et al. 1994).
We observed close visual correlation (R2 coefficient cannotbe calculated when both variables have errors; see Harrison1996) between rd and rn. This was especially true for weeklygrouped data (Figs. 6A, B) with rd . rn on average. This agreeswith Kansas tallgrass prairie chamber measurements, whichestablished rd . rn (Grahammer et al. 1991). Regarding factorsaffecting daytime respiration compared to nighttime respira-tion, it was suggested that respiration of green phytomassmay be inhibited by light (see Wohlfahrt et al. 2005) causingdecrease of rd relative to rn. Stomatal closure under droughtstress may act in a similar manner (Amthor 1989). The averagehigher rd than rn rates observed in our study were similar topatterns observed for mixed and tallgrass prairies in Oklahoma(Gilmanov et al. 2003b), typical steppe in Kazakhstan (Gilma-nov et al. 2004a), and mixed grass prairies of the NorthernGreat Plains (Chimner and Welker 2005; Gilmanov et al.
2005b). These patterns agree with the increase of autotrophicand heterotrophic respiration due to higher daytime tempera-ture and light-dependent processes (e.g., Megonigal et al. 1999;Kuzyakov 2002; Lu et al. 2002), which apparently compensatefor any decrease of rd caused by light inhibition and stomatalregulation.
Previous results for grasslands of the Northern Great Plainsof the United States demonstrated that soil water content (Ws)was a significant factor of CO2 exchange (Gilmanov et al.2005b). Higher precipitation and an increase of soil moisture atthe end of the growing season when temperatures are still highenough and the substrate for decomposition in the form of deadphytomass is readily available may be responsible for thesecond peak on the rd(t) curves for Dubois. A second maximumof rd(t) did not occur at Burns when stronger soil desiccation insummer was combined with lower early fall precipitation (Fig.4, 5). Phenology also may have played a significant role indetermining the seasonal dynamics of gross primary produc-tivity, especially during the early portion of the growing season(Burns site, 1996, 1998). More comprehensive multivariateanalyses are needed for the relationships between CO2 fluxcomponents (especially Pg and Re) and various ecological
Table 6. Gross primary production (GPP), ecosystem respiration (RE), and net ecosystem CO2 exchange (NEE) in various nonforest ecosystems(g CO2
�m�2 � period�1).
Ecosytem, site GPP RE NEE Source Period, days
Bouteloua gracilis stand in shortgrass prairie,
Colorado, United States
550 — — Detling et al. 1979 365
Northern temperate grassland, Lethbridge,
Alberta, Canada
1 026 1 021 þ5 Flanagan et al. 2002 365
Northern mixed prairie, Fort Peck,
Montana, United States
459–1 455 996–1 293 �537–þ162 Gilmanov et al. 2005b 91–305
138–302
Northern mixed prairie, Miles City,
Montana, United States
913–1 239 1 130–1 437 �198–217 Gilmanov et al. 2005b 118–307
1–327
Sagebrush-steppe, Burns,
Oregon, United States
1 111
475–1 716
1 029
581–1 544
82
�424–þ621
This study 365
Sagebrush steppe, Dubois,
Idaho, United States
1 602
963–2 162
1 349
786–1 778
253
�118–þ867
This study 365
Shortgrass prairie, control, Colorado,
United States
1 945 1 545 400 Andrews et al. 1974; Coupland and
Van Dyne 1979; Schultz 1995
365
Pasture in mixed/tallgrass prairie, Little Washita,
Oklahoma, United States
2 333 2 175 158 Meyers 2001; Gilmanov et al. 2003b 90–300
Tallgrass prairie, moderate seasonal grazing
Osage, Oklahoma, United States
2 787 3 039 �252 Risser et al. 1981 365
Tallgrass prairie, ungrazed, Osage, Oklahoma,
United States
2 821 2 872 �51 Risser et al. 1981 365
Mediterranean grassland, Ione,
California, United States
2 926
2 673–3 179
2 737
2 695–2 779
189
�106–484
Xu and Baldocchi 2004 365
Mixed prairie, winter grazing Woodward,
Oklahoma, United States
3 037 2 517 520 Sims and Bradford 2001;
Gilmanov et al. 2003b
365
Tallgrass prairie, moderate year-round grazing,
Osage, Oklahoma, United States
3 678 3 698 �19 Risser et al. 1981 365
Warm temperate grassland, Durham,
North Carolina, United States
4 407 4 763 �356 Novick et al. 2004 365
Tallgrass prairie, after spring burn, Shidler,
Oklahoma, United States
5 223 3 964 1 259 Gilmanov et al. 2003b 365
596 Rangeland Ecology & Management
factors (Gilmanov et al. 2003a; Wylie et al. 2003; Gilmanov etal. 2005b). Opportunities for such analyses are increasing asmore complete data sets for carbon, water and energy fluxes,and ancillary onsite and remotely sensed variables becomeavailable from various CO2 flux networks (Law et al. 2002;Baldocchi 2003; Gilmanov et al. 2005a).
CONCLUSIONS AND IMPLICATIONS
Long-term BREB measurements of CO2 exchange in thesagebrush-steppe ecosystem at the Burns and Dubois sitesdemonstrated a high seasonal and yearly variability. For bothsites during our study period, there were years when NEE waspositive (a CO2 sink) and years when NEE was negative (a CO2
source). During 7 years of study at Burns, the sagebrush-steppeecosystem was a weak sink for atmospheric carbon, approach-ing carbon balance. However, the Dubois site was a substantialcarbon sink during the 6 years of our study, accumulating1 520 g CO2
�m�2. Data from our 2 study sites confirmedconclusions made earlier with data from the steppes of CentralAsia and Northern Great Plains grasslands that analysis ofecosystem-scale, light-response functions can be used to obtainmeasurement-based estimates of daytime ecosystem respira-tion. These values are consistent with direct nighttime towerCO2 fluxes and suggest the utility and accuracy of thepartitioning Fc into Pg and Re components. Such separationof the net flux into its physiologically specific componentsallowed quantitative prediction of seasonal and yearly dynam-ics of CO2 fluxes. Light-response parameters (a, Amax, rd), dailyproductivity and respiration rates (Pg, Re), as well as the meanvalues and ranges of GPP and RE for sagebrush-steppeecosystems were consistent with literature values for short-grass and northern mixed prairie ecosystems under similargeographical and climatic conditions. Our results supportconclusions by Follett et al. (2001) about the high potentialof grazing lands to fix and store atmospheric carbon. Given thelarge land area occupied by rangelands, attempts to balanceglobal carbon cycles will require a better understanding ofcarbon fluxes on rangelands, of which sagebrush steppe aloneoccupies about 40 million hectares. There are several importantpoints that arose from our research: 1) the 2 sites were bothsinks for atmospheric CO2 during the study period, 2) eithersite could be a sink or source in any given year, 3) precipitationwas a good predictor of carbon sequestration within a site, and4) total yearly precipitation level was not a good predictor ofcarbon sequestration across sites. The last point suggests thatprecipitation timing (rain at the right time) may be critical indetermining productivity and thus carbon sequestration ofsagebrush-steppe rangelands.
ACKNOWLEDGMENT
The authors thank John Hendrickson for providing LAI data for the
Dubois site.
LITERATURE CITED
AMTHOR, J. S. 1989. Respiration and crop productivity. New York: Springer.
215 p.
ANDREWS, R., D. C. COLEMAN, J. E. ELLIS, AND J. S. SINGH. 1974. Energy flow
relationships in a shortgrass prairie ecosystem. In: Proceedings of the First
International Congress of Ecology. Wageningen, The Netherlands: Centre for
Agricultural Publishing and Documentation. p 22–28.
ANGELL, R. F., T. SVEJCAR, J. BATES, N. Z. SALIENDRA, AND D. A. JOHNSON. 2001. Bowen
ratio and closed chamber carbon dioxide flux measurements over sage-
brush steppe vegetation. Agricultural and Forest Meteorology 108:153–161.
BALDOCCHI, D. D. 2003. Assessing the eddy covariance technique for evaluating
carbon dioxide exchange rates of ecosystems: past, present and future. Global
Change Biology 9:479–492.
CAMPBELL SCIENTIFIC. 1995. Model 023/CO2 Bowen ratio system. Instruction manual.
Revision 8/95. Logan, UT: Campbell Scientific. p 1-1–6-6.
CHIMNER, R. A., AND J. M. WELKER. 2005. Ecosystem respiration responses to
experimental manipulations of winter and summer precipitation in a mixed-
grass prairie, WY, USA. Biogeochemistry 73:257–270.
COUPLAND, R. T., AND G. M. VAN DYNE. 1979. Systems synthesis grassland
ecosystems of the world. In: R. T. Coupland [ED.]. Grassland ecosystems of
the world: analysis of grasslands and their uses. Oxford, England: Oxford
University Press. p 97–106.
DETLING, J. K, W. J. PARTON, AND H. W. HUNT. 1979. A simulated model of Bouteloua
gracilis biomass dynamics of the North American shortgrass prairie.
Oecologia 38:167–191.
DUGAS, W. A. 1993. Micrometeorological and chamber measurements of CO2 flux
from bare soil. Agricultural and Forest Meteorology 67:115–128.
DUGAS, W. A., M. L. HEUER, AND H. S. MAYEUX. 1999. Carbon dioxide fluxes over
bermudagrass, native prairie, and sorghum. Agricultural and Forest Meteo-
rology 93:121–139.
FALGE, E., P. ANTHONI, M. AUBINET, C. BERNHOFER, G. BURBA, R. CEULEMANS, R. CLEMENT, H.
DOLMAN, A. GRANIER, P. GROSS, T. GRUNWALD, D. HOLLINGER, N. O. JENSEN,
G. KATUL, P. KERONEN, A. KOWALSKI, TA LAI CHUN, B. E. LAW, T. MEYERS,
J. MONCRIEFF, E. MOORS, J. W. MUNGER, K. PILEGAARD, €U. RANNIK, C. REBMANN,
A. SUYKER, J. TENHUNEN, K. TU, S. VERMA, T. VESALA, K. WILSON, S. WOFSY,
D. BALDOCCHI, AND R. OLSON. 2001. Gap filling strategies for defensible annual sums
of net ecosystem exchange. Agricultural and Forest Meteorology 107:43–69.
FLANAGAN, L. B., L. A. WEVER, AND P. J. CARLSON. 2002. Seasonal and interannual
variation in carbon dioxide exchange and carbon balance in a northern
temperate grassland. Global Change Biology 8:599–615.
FOKEN, T., M. GOCKEDE, M. MAUDER, L. MAHRT, B. D. AMIRO, AND W. MUNGER. 2004.
Post-field data quality control. In: X. Lee, W. Massman, and B. Law [EDS.].
Handbook of micrometeorology: a guide for surface flux measurement and
analysis. Dordrecht, The Netherlands: Kluwer Academic Publishers. p 181–208.
FOLLETT, R. F., J. M. KIMBLE, AND R. LAL. 2001. The potential of U.S. grazing lands to
sequester soil carbon. In: R. F. Follett, J. M. Kimble, and R. Lal [EDS.]. The
potential of U.S. grazing lands to sequester carbon and mitigate the
greenhouse effect. Boca Raton, FL: Lewis Publishers. p 401–430.
GILMANOV, T. G., M. W. DEMMENT, B. K. WYLIE, E. A. LACA, K. AKSHALOV, D. D.
BALDOCCHI, L. BELELLI, J. A. BRADFORD, R. L. COULTER, W. A. DUGAS, W. E. EMMERICH,
L. B. FLANAGAN, A. B. FRANK, M. R. HAFERKAMP, D. A. JOHNSON, T. P. MEYERS, J. A.
MORGAN, M. NASYROV, C. E. OWENSBY, M. S. PEKOUR, K. PILEGAARD, N. Z. SALIENDRA,
M. J. SANZ, P. L. SIMS, J. F. SOUSSANA, L. L. TIESZEN, AND S. B. VERMA. 2005a.
Quantification of the CO2 exchange in grassland ecosystems of the world
using tower measurements, modeling and remote sensing. In: F. P. O’Mara,
R. J. Wilkins, L. ‘t Mannetje, D. K. Lovett, P. A. M. Rogers, and T. M. Boland
[EDS.]. XX International Grassland Congress: offered papers, 26 June–1 July
2005, University College Dublin, Dublin, Ireland. Wageningen, The Nether-
lands: Wageningen Academic Publishers. p 587.
GILMANOV, T. G., D. A. JOHNSON, AND N. Z. SALIENDRA. 2003a. Growing season CO2
fluxes in a sagebrush-steppe ecosystem in Idaho: Bowen ratio/energy balance
measurements and modeling. Basic and Applied Ecology 4:167–183.
GILMANOV, T. G., D. A. JOHNSON, N. Z. SALIENDRA, K. AKSHALOV, AND B. K. WYLIE. 2004a.
Gross primary productivity of the true steppe in Central Asia in relation to
NDVI: scaling up CO2 fluxes. Environmental Management 33:S492–S508.
GILMANOV, T. G., D. A. JOHNSON, N. Z. SALIENDRA, T. J. SVEJCAR, R. F. ANGELL, AND K. L.
CLAWSON. 2004b. Winter CO2 fluxes above sagebrush-steppe ecosystems in
Idaho and Oregon. Agricultural and Forest Meteorology 126:73–88.
59(6) November 2006 597

GILMANOV, T. G., L. L. TIESZEN, B. K. WYLIE, L. B. FLANAGAN, A. B. FRANK, M. R.
HAFERKAMP, T. P. MEYERS, AND J. A. MORGAN. 2005b. Integration of CO2 flux and
remotely sensed data for primary production and ecosystem respiration
analyses in the Northern Great Plains: potential for quantitative spatial
extrapolation. Global Ecology and Biogeography 14:271–292.
GILMANOV, T. G., S. B. VERMA, P. L. SIMS, T. P. MEYERS, J. A. BRADFORD, G. G. BURBA, AND
A. E. SUYKER. 2003b. Gross primary production and light response parameters
of four Southern Plains ecosystems estimated using long-term CO2-flux tower
measurements. Global Biogeochemical Cycles 17(2)1071:40-1–40-16.
GOULDEN, M. L., J. W. MUNGER, S.-M. FAN, AND B. C. DAUBE. 1996. Measurements of
carbon sequestration by long-term eddy covariance: methods and critical
evaluation of accuracy. Global Change Biology 2:169–182.
GRAHAMMER, K., M. D. JAWSON, AND J. SKOPP. 1991. Day and night soil respiration
from a grassland. Soil Biology and Biochemistry 23:77–81.
HAGEN, S. C., B. H. BRASWELL, E. LINDER, S. FROLKING, A. D. RICHARDSON, AND D. Y.
HOLLINGER. 2006. Statistical uncertainty of eddy flux-based estimates of gross
ecosystem carbon exchange at Howland Forest, Maine—art. no. D08S03.
Journal of Geophysical Research—Atmospheres 111:NIL_1–NIL_12.
HARRISON, D. M. 1996. Experimental data analyst. Champaign, IL: Wolfram
Research. 373 p.
JOHNSON, D. A., T. G. GILMANOV, N. Z. SALIENDRA, AND J. W. WALKER. 1999. Carbon dioxide
fluxes on control and burned sites on sagebrush-steppe rangeland in the western
USA. In: D. Eldridge and D. Freudenberger [EDS.]. Proceedings of the VI Interna-
tional Rangeland Congress; 19–23 July 1999; Townsville, Queensland, Australia.
Aitkenvale, Queensland, Australia: VI International Rangeland Congress. p 746–747.
KNAPP, P. A. 1995. Intermountain West lightning-caused fires: climatic predictors
of area burned. Journal of Range Management 48:85–91.
KUZYAKOV, Y. 2002. Separating microbial respiration of exudates from root
respiration in non-sterile soils: a comparison of four methods. Soil Biology
and Biochemistry 34:1621–1631.
LAFLEUR, P. M., N. T. ROULET, AND S. W. ADMIRAL. 2001. Annual cycle of CO2
exchange at a bog peatland. Journal of Geophysical Research 106:3071–3081.
LAW, B. E., D. D. BALDOCCHI, P. BAKWIN, P. BERBIGIER, K. DAVIS, A. J. DOLMAN, M. FALK,
J. D. FUENTES, A. GOLDSTEIN, A. GRANIER, A. GRELLE, D. HOLLINGER, I. A. JANSSENS,
P. JARVIS, N. O. JENSEN, G. KATUL, Y. MAHLI, G. MATTEUCCI, T. MEYERS, R. MONSON,
W. MUNGER, W. OECHEL, R. OLSON, K. PILEGAARD, U. K. T. PAW, H. THORGEIRSSON,
R. VALENTINI, S. VERMA, T. VESALA, K. WILSON, S. WOFSY, E. FALGE, AND L. GU. 2002.
Environmental controls over carbon dioxide and water vapor exchange of
terrestrial vegetation. Agricultural and Forest Meteorology 113:97–120.
LEE, X., J. D. FUENTES, AND H. H. HEUMANN. 1999. Long-term observation of the
atmospheric exchange of CO2 with a temperate deciduous forest in southern
Ontario, Canada. Journal of Geophysical Research 104:15975–15984.
LOEHLE ENTERPRISES. 2006. Global optimization 5.2. Global nonlinear optimization
using Mathematica. Naperville, IL: Loehle Enterprises. 108 p.
LOHILA, A., M. AURELA, J. P. TUOVINEN, AND T. LAURILA. 2004. Annual CO2 exchange of
a peat field growing spring barley or perennial forage grass. Journal of
Geophysical Research 109:D18116,1–13.
LU, Y., A. WATANABE, AND M. KIMURA. 2002. Contribution of plant-derived carbon to
soil microbial biomass dynamics in a paddy rice microcosm. Biology and
Fertility of Soils 36:136–142.
LUO, Y., D. HUI, W. CHENG, J. S. COLEMAN, D. W. JOHNSON, AND D. A. SIMS. 2000.
Canopy quantum yield in a mesocosm study. Agricultural and Forest
Meteorology 100:35–48.
MEGONIGAL, J. P., D. B. ALBERT, A. S. ALLEN, S. C. WHALEN, D. T. TISSUE, AND B. D.
BOVARD. 1999. A plant-soil-atmosphere microcosm for tracing radiocarbon
from photosynthesis through methanogenesis. Soil Science Society of
America Journal 63:665–671.
MEYERS, T. P. 2001. A comparison of summertime water and CO2 fluxes over
rangeland for well watered and drought conditions. Agricultural and Forest
Meteorology 106:205–214.
MIELNICK, P. C., W. A. DUGAS, H. B. JOHNSON, H. W. POLLEY, AND J. SANABRIA. 2001. Net
grassland carbon flux over a subambient to superambient CO2 gradient. Global
Change Biology 7:747–754.
MILLER, R. F., AND J. A. ROSE. 1999. Fire history and western juniper encroachment
in sagebrush steppe. Journal of Range Management 52:550–559.
MONCRIEFF, J. B., Y. MALHI, AND R. LEUNING. 1996. The propagation of errors in long-
term measurements of land-atmosphere fluxes of carbon and water. Global
Change Biology 2:231–240.
MONTEITH, J. L., AND M. H. UNSWORTH. 1990. Principles of environmental physics.
London, England: Edward Arnold. 291 p.
MORGAN, J. A., D. R. LECAIN, A. R. MOSIER, AND D. G. MILCHUNAS. 2001. Elevated CO2
enhances water relations and productivity and affects gas exchange in C3 and
C4 grasses of the Colorado shortgrass prairie. Global Change Biology 7:
451–466.
MORGAN, J. A., A. R. MOSIER, D. G. MILCHUNAS, D. R. LECAIN, AND W. R. PARTON. 2004.
CO2 enhances productivity, alters species composition, and reduces digest-
ibility of shortgrass steppe vegetation. Ecological Applications 14:208–219.
NOVICK, K. A., M. B. S. SIQUEIRA, J. JUANG, R. OREN, P. C. STOY, G. G. KATUL, AND D. S.
ELLSWORTH. 2004. Carbon dioxide and water vapor exchange in a warm
temperate grassland. Oecologia 138:259–274.
OBRIST, D., E. H. DELUCIA, AND J. A. ARNONE III. 2003. Consequences of wildfire on
ecosystem CO2 and water vapour fluxes in the Great Basin. Global Change
Biology 9:563–574.
OHMURA, A. 1982. Objective criteria for rejecting data for Bowen ratio flux
calculations. Journal of Applied Meteorology 21:595–598.
PACALA, S. W., R. A. HOUGHTON, R. A. BIRDSEY, L. HEATH, E. T. SUNDQUIST, R. F. STALLARD,
P. CIAIS, P. MOORCROFT, J. P. CASPERSEN, E. SHEVLIAKOVA, B. MOORE, G. KOHLMAIER,
E. HOLLAND, H. GLOOR, M. E. HARMON, S.-M. FAN, J. L. SARMIENTO, C. L. GOODALE,
D. SCHIMEL, C. B. FIELD, G. C. HURTT, D. BAKER, AND P. PEYLIN. 2001. Consistent
land- and atmosphere-based U.S. carbon sink estimates. Science 292:
2316–2320.
RABINOWITCH, E. I. 1951. Photosynthesis and related processes. Volume 2, part 1.
New York, NY: Interscience Publishers. 1208 p.
RICKARD, W. H., L. E. ROGERS, B. E. VAUGHANAND, AND S. F. LIEBETRAU [EDS.]. 1988.
Shrub-steppe: balance and change in a semi-arid terrestrial ecosystem.
Amsterdam, The Netherlands: Elsevier. 272 p.
RISSER, P. G., E. C. BIRNEY, H. D. BLOCKER, S. W. MAY, W. J. PARTON, AND J. A. WIENS.
1981. The true prairie ecosystem. Stroudsburg, PA: Hutchinson Ross
Publishing Company. 557 p.
SCHULTZ, J. 1995. The ecozones of the world: the ecological divisions of the
geosphere. Berlin, Germany: Springer. 449 p.
SIMS, P. L., AND J. A. BRADFORD. 2001. Carbon dioxide fluxes in a Southern Plains
prairie. Agricultural and Forest Meteorology 109:117–134.
SUYKER, A. E., S. B. VERMA, G. G. BURBA, T. J. ARKERBAUER, D. T. WALTERS, AND K. G.
HUBBARD. 2004. Growing season carbon dioxide exchange in irrigated and
rainfed maize. Agricultural and Forest Meteorology 124:1–13.
SVEJCAR, T., H. MAYEUX, AND R. ANGELL. 1997. The rangeland carbon dioxide flux
project. Rangelands 19:16–18.
WEBB, E. K., G. I. PEARMAN, AND R. LEUNING. 1980. Correction of flux measurements
for density effects due to heat and water vapour transfer. Quarterly Journal of
Royal Meteorological Society 106:85–100.
WEST, N. E. 1983. Western Intermountain sagebrush steppe. In: N. E. West [ED.].
Temperate deserts and semideserts. Amsterdam, The Netherlands: Elsevier
Scientific Publishing. p 351–374.
WEST, N. E., J. M. STARK, D. W. JOHNSON, M. M. ABRAMS, J. R. WIGHT, D. HEGGEM, AND
S. PECK. 1994. Effects of climatic change on the edaphic features of arid
and semiarid lands of western North America. Arid Soil Research and
Rehabilitation 8:307–351.
WEST, N. E., AND T. P. YORKS. 2002. Vegetation responses following wildfire on
grazed and ungrazed sagebrush semi-desert. Journal of Range Management
55:171–181.
WHISENANT, S. G. 1990. Changing fire frequencies on Idaho’s Snake River Plains:
ecological and management implications. General Technical Report INT-276.
Washington, DC: US Department of Agriculture, Forest Service. p 4–10.
WHITE, R. P., S. MURRAY, AND M. ROHWEDER. 2000. Pilot analysis of global
ecosystems: grassland ecosystems. Washington, DC: World Resources
Institute. 100 p.
WOHLFAHRT, G., C. NEWESELY, A. CERNUSCA, M. BAHN, AND A. HASLWANTER. 2005. Estimation
of daytime ecosystem respiration to determine gross primary production of
a mountain meadow. Agricultural and Forest Meteorology 130:13–25.
598 Rangeland Ecology & Management

WRI. 2000. Taking stock of ecosystems-grassland ecosystems. In: World
resources 2000–2001: people and ecosystems—the fraying web of life.
Washington, DC: World Resources Institute. p 119–131.
WYLIE, B. K., D. A. JOHNSON, E. LACA, N. Z. SALIENDRA, T. G. GILMANOV, B. C. REED, L. L.
TIESZEN, AND B. B. WORSTELL. 2003. Calibration of remotely sensed, coarse
resolution NDVI to CO2 fluxes in a sagebrush-steppe ecosystem. Remote
Sensing of Environment 85:243–255.
XU, L., AND D. D. BALDOCCHI. 2004. Seasonal variation in carbon dioxide exchange
over a Mediterranean annual grassland in California. Agricultural and Forest
Meteorology 123:79–96.
YANG, P. C., T. A. BLACK, AND P. D. BLANKEN. 1999. Spatial and temporal variability of
CO2 concentration and flux in a boreal aspen forest. Journal of Geophysical
Research 104:27653–27661.
YORKS, T. P. 1980. FRODAS: an integrated resource data analysis system
for the forest range. In: T.P. Yorks and C. McMullen [EDS.]. The western
shrub and grasslands. Fort Collins, CO: Colorado State University.
p 173–183.
59(6) November 2006 599