
Ecosystem simulations supporting ecosystem-based fisheries management in the Coral Triangle,...
14
ecological modelling 214 ( 2 0 0 8 ) 361–374 available at www.sciencedirect.com journal homepage: www.elsevier.com/locate/ecolmodel Ecosystem simulations supporting ecosystem-based fisheries management in the Coral Triangle, Indonesia C.H. Ainsworth ∗ , D.A. Varkey, T.J. Pitcher Fisheries Centre, University of British Columbia, 2202 Main Mall, V6T 1Z4 Vancouver, Canada article info Article history: Received 18 November 2007 Received in revised form 14 February 2008 Accepted 28 February 2008 Published on line 29 April 2008 Keywords: Ecosystem-based management Raja Ampat Indonesia Ecopath Ecosim Coral reef Trophic cascades abstract A comprehensive field study ongoing in Eastern Indonesia has provided data for a tropho- dynamic Ecosim ecosystem model of the Raja Ampat archipelago on the west coast of New Guinea. Model dynamics have been tuned to agree with local catch and relative biomass time series data developed for this project, and validated by experts. The model is used in this article to investigate five high priority research questions related to ecosystem-based fisheries management (EBFM) in the region. Regency fisheries managers and scientific part- ners working in Indonesia posed the questions. Here, we analyze the ecosystem impacts of blast fishing, including trophic effects and removal of refuge space. Removal of refuge space is as harmful to juvenile reef fish populations as direct mortality from the fishery itself; reef damage is cumulative due to the slow re-growth rate of corals. We quantify the likely ecolog- ical and economic impacts of limiting commercial fisheries for groupers. Artisanal fisheries benefit slightly and system biodiversity is improved, but the improvement is lost if artisanal fisheries increase effort to compensate for missing catch. We forecast the effects of limiting commercial net fisheries for reef fish. There is a marginal increase in reef fish biomass and an unexpected benefit to large pelagic species due to reduced interception of their anchovy prey. We evaluate the exploitation status of anchovy and tuna and report on the ecosystem effects of these fisheries. All fisheries appear fully exploited in Raja Ampat or nearly so. There is an indication that anchovies provide an ecosystem service: a large population may act to buffer fluctuations in large pelagic fish biomass under climate variation. © 2008 Elsevier B.V. All rights reserved. 1. Introduction 1.1. Raja Ampat Raja Ampat is located in the centre of the Southeast Asia ‘coral triangle’; it contains some of the most biodi- verse coral reef ecosystems ever recorded (Donnelly et al., 2003; McKenna et al., 2002) and possesses over 75% of the world’s known coral species (Halim and Mous, 2006). This remote island group in Eastern Indonesia faces challenges, however, like other coral reef areas in the world, relat- ∗ Corresponding author. Tel.: +1 604 908 2665; fax: +1 604 822 8934. E-mail address: c.ainsworth@fisheries.ubc.ca (C.H. Ainsworth). ing to overexploitation of fishery resources (Pandolfi et al., 2003), destructive fishing practices (Erdmann and Pet-Soede, 1996; Pet-Soede and Erdmann, 1998), land-based pollution (Kaczmarsky et al., 2005) and outbreaks of coralivores such as the crown of thorns starfish (Acanthaster planci)—a source of mass mortality in corals (Chesher, 1969). There have been fishery depletions in Raja Ampat across a wide range of taxa but many examples of pristine coral reef wilderness remain thanks in part to a low, although increasing, human population (McKenna et al., 2002; Dohar and Anggraeni, 2007). 0304-3800/$ – see front matter © 2008 Elsevier B.V. All rights reserved. doi:10.1016/j.ecolmodel.2008.02.039
-
Upload
independent -
Category
Documents
-
view
3 -
download
0
Transcript of Ecosystem simulations supporting ecosystem-based fisheries management in the Coral Triangle,...

Efi
CF
a
A
R
R
1
A
P
K
E
R
I
E
E
C
T
1
1
RAv2wrh
0d
e c o l o g i c a l m o d e l l i n g 2 1 4 ( 2 0 0 8 ) 361–374
avai lab le at www.sc iencedi rec t .com
journa l homepage: www.e lsev ier .com/ locate /eco lmodel
cosystem simulations supporting ecosystem-basedsheries management in the Coral Triangle, Indonesia
.H. Ainsworth ∗, D.A. Varkey, T.J. Pitcherisheries Centre, University of British Columbia, 2202 Main Mall, V6T 1Z4 Vancouver, Canada
r t i c l e i n f o
rticle history:
eceived 18 November 2007
eceived in revised form
4 February 2008
ccepted 28 February 2008
ublished on line 29 April 2008
eywords:
cosystem-based management
aja Ampat
ndonesia
copath
cosim
oral reef
a b s t r a c t
A comprehensive field study ongoing in Eastern Indonesia has provided data for a tropho-
dynamic Ecosim ecosystem model of the Raja Ampat archipelago on the west coast of New
Guinea. Model dynamics have been tuned to agree with local catch and relative biomass
time series data developed for this project, and validated by experts. The model is used in
this article to investigate five high priority research questions related to ecosystem-based
fisheries management (EBFM) in the region. Regency fisheries managers and scientific part-
ners working in Indonesia posed the questions. Here, we analyze the ecosystem impacts of
blast fishing, including trophic effects and removal of refuge space. Removal of refuge space
is as harmful to juvenile reef fish populations as direct mortality from the fishery itself; reef
damage is cumulative due to the slow re-growth rate of corals. We quantify the likely ecolog-
ical and economic impacts of limiting commercial fisheries for groupers. Artisanal fisheries
benefit slightly and system biodiversity is improved, but the improvement is lost if artisanal
fisheries increase effort to compensate for missing catch. We forecast the effects of limiting
commercial net fisheries for reef fish. There is a marginal increase in reef fish biomass and
rophic cascades an unexpected benefit to large pelagic species due to reduced interception of their anchovy
prey. We evaluate the exploitation status of anchovy and tuna and report on the ecosystem
effects of these fisheries. All fisheries appear fully exploited in Raja Ampat or nearly so.
There is an indication that anchovies provide an ecosystem service: a large population may
act to buffer fluctuations in large pelagic fish biomass under climate variation.
. Introduction
.1. Raja Ampat
aja Ampat is located in the centre of the Southeastsia ‘coral triangle’; it contains some of the most biodi-erse coral reef ecosystems ever recorded (Donnelly et al.,003; McKenna et al., 2002) and possesses over 75% of the
orld’s known coral species (Halim and Mous, 2006). Thisemote island group in Eastern Indonesia faces challenges,owever, like other coral reef areas in the world, relat-
∗ Corresponding author. Tel.: +1 604 908 2665; fax: +1 604 822 8934.E-mail address: [email protected] (C.H. Ainsworth).
304-3800/$ – see front matter © 2008 Elsevier B.V. All rights reserved.oi:10.1016/j.ecolmodel.2008.02.039
© 2008 Elsevier B.V. All rights reserved.
ing to overexploitation of fishery resources (Pandolfi et al.,2003), destructive fishing practices (Erdmann and Pet-Soede,1996; Pet-Soede and Erdmann, 1998), land-based pollution(Kaczmarsky et al., 2005) and outbreaks of coralivores suchas the crown of thorns starfish (Acanthaster planci)—a sourceof mass mortality in corals (Chesher, 1969). There have beenfishery depletions in Raja Ampat across a wide range oftaxa but many examples of pristine coral reef wildernessremain thanks in part to a low, although increasing, humanpopulation (McKenna et al., 2002; Dohar and Anggraeni,2007).

i n g
362 e c o l o g i c a l m o d e l l1.2. BHS EBM Project
The Raja Ampat Regency government has developed initia-tives to protect the marine environment and serve as many as24,000 commercial and artisanal fishers who rely on it (Doharand Anggraeni, 2007). For example, a decree by the Bupati(Regent) in 2003 declared Raja Ampat to be a Maritime Regencyand helped to establish a new network of marine reservesin 2006 covering more than 650,000 ha of sea area and 44%of reef area. The fisheries office (Departemen Kelautan danPerikanan, DKP) has further pledged to declare as much as 30%of the marine area protected in the Regency, exceeding thenational goal of 20% (Rahawarin, personal communication,2007).
Recently, the Regency government entered into a compre-hensive program of field study and ecological modelling withThe Nature Conservancy (TNC), Conservation International(CI), World Wildlife Fund (WWF) and the University of BritishColumbia (UBC) with the goals of increasing the body of scien-tific knowledge in this region, exploring marine protected area(MPA) zoning options and supporting ecosystem-based fisherymanagement (EBFM). This article summarizes the results of a2-year effort to integrate field data into a synthesis food-webmodel, built in the Ecopath with Ecosim modelling framework(EwE: Christensen and Pauly, 1992; Walters et al., 1997). We usethe model to explore the trophodynamic impacts of manage-ment policies in an EBFM framework.
Trophic ecosystem models provide a valuable tool to helpus understand the ecology of coral reefs. They offer a frame-work on which we can integrate data from a variety ofsources, evaluate the commensurability of the data, findcommonalities and identify gaps in knowledge. We can deter-mine the controlling trophic linkages and predict the foodweb’s major response to management plans; EwE has beenapplied throughout the world for this purpose (Christensenand Walters, 2005). The approach allows us to tease apart theinteracting influences of fisheries and frame the activities ofhuman beings in a whole-ecosystem context. The modellinglends itself to the use of quantitative ecosystem indicatorsthat can provide a synoptic view of the ecosystem and so makemodel predictions more interpretable by scientists, stakehold-ers and the public.
1.3. EBFM research questions
We collaborated with researchers in partner institutes (TNC,CI, WWF, UBC and Packard Foundation), and we received inputfrom DKP in order to develop five high priority research ques-tions of relevance to the implementation of EBFM in RajaAmpat. They are listed here. Section 2 describes how weaddressed these questions using the EwE model.
(1) What are the likely ecosystem effects of changes in theanchovy fishery under the following management scenar-ios?
• Anchovy fishery is completely removed from RajaAmpat.• A limited anchovy fishery is allowed.• Anchovy fishery continues to increase in size.
2 1 4 ( 2 0 0 8 ) 361–374
(2) What are the likely effects of restricting the commercialexploitation of groupers?
(3) What are the likely effects of excluding all net fisheries forreef fish in Raja Ampat?
(4) What are the likely effects of blast fishing under the fol-lowing scenarios?• Status quo.• Increase.
(5) What are the likely effects of an increase in the tuna fish-ery?
There is a wide range of interpretations used by fisherymanagement bodies throughout the world as to what con-stitutes EBFM (e.g., Marasco et al., 2007), but all include theecosystem-wide consequences of alterations in biomassesand trophic pathways. Accordingly, our analysis highlightschanges in trophic interactions that may occur as a result ofalternative management plans. This is acknowledged to beone of the strengths of the Ecopath with Ecosim (EwE) mod-elling approach (Plaganyi, 2007).
2. Methods
2.1. Ecopath with Ecosim
We have used EwE ecosystem simulation software to representthe ecology of the coral reef environment (EwE: Christensenand Pauly, 1992; Walters et al., 1997). EwE is a mass-balancetrophic simulator that acts as a thermodynamic accountingsystem. It summarizes biomass or energy flows in and out offunctional groups, which are groups of similar species aggre-gated by life history and niche characteristics, and apportionsthe production of groups to predators and fisheries accord-ing to diet and catch matrices. The model can representthe impacts of human beings through fishery removals andincidental mortality (Christensen et al., 2004), habitat mod-ification (this manuscript) and pollution (Okey et al., 2004).It can represent abiotic effects such as climate fluctuationsthrough the use of production forcing patterns, and it canrepresent animal behaviour through interaction rate parame-ters and density-dependant mediation functions (Christensenet al., 2004). Reviews of EwE are found in Fulton et al.(2003), Christensen and Walters (2004, 2005), Plaganyi andButterworth (2004) and Plaganyi (2007).
For parameterization of the ecosystem models we referthe readers to online technical publications by Ainsworth etal. (2007), who detailed the development of preliminary mod-els for Raja Ampat, and Ainsworth et al. (2008), who updatedthe models, re-tuned dynamics to fishery catch histories andrelative biomass, and included extensive field-gathered data.Data used in the models from the BHS EBM Project includesinformation from dive transects, fish stomach sampling, com-munity interviews, coastal surveys, published literature andother sources; the models have also been reviewed by biol-ogists in Indonesia. The technical reports describe a suite
of ecosystem models representing Raja Ampat in the pastand present (1990 and 2005), and smaller sub-areas in thearchipelago. This article uses the present-day model of RajaAmpat for all predictions.
g 2 1
aGekuwfig2bdgge(Apatta
spicaihit
tb
2
LudiTntienaTzag
hdoicR
e c o l o g i c a l m o d e l l i n
The Raja Ampat model describes the region from 129◦12′End 0◦12′N to 131◦30′E and 2◦42′S off the west coast of Newuinea in the Indonesian province of Papua. The study areancompasses approximately 610 islands, including the ‘fourings’: Batanta, Misool, Salawati and Waigeo. The modelses 98 functional groups to represent the ecosystem, ofhich 31 are reef fish groups and 25 are pelagic or demersalsh groups (representing 1203 fish species altogether); theseroups include juvenile and sub-adult age stanzas. A further2 groups are macroinvertebrates, 9 are mammals, turtles orirds and the remainder are plankton, primary producers andetritus groups. There are more than 2400 diet linkages. Theroup design highlights commercially important species (e.g.,roupers, Napoleon wrasse Cheilinus undulatus and tuna), andcologically important species such as herbivores, bioeroderse.g., parrotfish) and corallivores (e.g., crown-of-thorns starfishcanthaster planci). Trophic vulnerabilities, which are criticalarameters in the dynamic model Ecosim describing risk-dverse feeding behaviour, were tuned to observational data inhe 1990 model and transferred to the 2005 model using a novelechnique that assumes stationarity in density-dependent for-ging tactics (Ainsworth et al., 2008).
The Ecosim model uses four mediation functions to repre-ent the following non-trophic behavioural effects: (1) pelagiciscivores corralling small pelagics to the surface facilitat-
ng predation by sea birds, (2) hermatypic scleractinian coralsonferring protection against predators to juvenile reef fishnd some invertebrates, (3) mangroves and sea grass provid-ng similar protection and (4) cleaner wrasse improving theealth of large reef-associated fish reducing their vulnerabil-
ty to predators. The first two mediation functions are relevanto experiments in this article, and are elaborated on later.
The following section will discuss the five research ques-ions in more detail, and introduce modifications that haveeen designed in order to answer these questions.
.2. (Q1) Effects of the anchovy fishery
ocated mainly in coastal areas adjacent to the centralpwelling region of Dampier St., a large anchovy fishery is con-ucted in Raja Ampat by a mobile lift net fleet (called bagans)
n which paired vessels use lanterns at night to attract fish.he fish, called ikan tri locally, are dried on racks in largeumbers. There are 17 Engaulids identified in Raja Ampat ofhe genera Stolephorus, Setipinna and Thryssa; Stolephoruss the dominant genus by biomass in shallow habitats andspecially important is S. indicus (Erdmann, personal commu-ication, 2007). All of these genera have been represented insingle aggregated EwE functional group called ‘anchovies’.he functional group is divided into juvenile and adult stan-as using a multi-species equilibrium model (Christensen etl., 2004); ages are partitioned according to maturation androwth parameters assembled by Ainsworth et al. (2007).
Amarumollo and Farid (2002) suggested that there mightave been a decline in anchovy abundance in Raja Ampatue to overfishing, although Erdmann and Pet (2002) pointed
ut uncertainties in their conclusion. Since most of the catchs trans-shipped at sea for sale in Java (Bailey, personalommunication, 2007), catch figures are not recorded inegency statistics or anywhere else. It is therefore difficult
4 ( 2 0 0 8 ) 361–374 363
to estimate the tonnage being caught. However, Bailey et al.(2008) used a technique based on interviews and counts of dry-ing racks to estimate annual catch of anchovy as 13,000 tonnesin Raja Ampat. We have used a higher value, 0.5 tonnes km−2
for the adult stanza in Raja Ampat, which equates to about22,500 tonnes, based on the estimate of Ainsworth et al.(2007).
We use Ecosim simulations to determine the level of catchand biomass of anchovies at equilibrium under a range offishing mortalities. This produces a multi-species surplus pro-duction curve upon which we can plot the current exploitationstatus (we discuss multi-species equilibrium curves in moredetail under ‘maximization of tuna fisheries’).
As anchovy biomass increases or declines we can analyzebiomass changes in other functional groups of the ecosys-tem, as may be affected through direct trophic effects likepredation, or indirect effects like competition. The changingbiomasses of other functional groups may have positive ornegative net effects on other fishing sectors. We thereforeperform a simple bioeconomic analysis, holding the fishingrate per functional group constant at 2005 levels for otherfishing sectors and determining the impact on their fisheryvalues that result from the changing ecosystem biomass den-sities.
To further investigate trophic effects of anchovy deple-tion we have employed a network analysis routine in Ecopathcalled mixed trophic impacts (MTI). MTI is a form of sensi-tivity analysis that summarizes the net impact of functionalgroups and fisheries on each other. It considers direct and indi-rect trophic interactions caused by predation and competition.The routine is based on the Leontief matrix (Leontief, 1951),and was applied to Ecosim by Ulanowicz and Puccia (1990).Christensen et al. (2004) provide more detail.
The anchovy population in Raja Ampat is fertilized by peri-odic wind-driven upwelling events in the central study regionand throughout the archipelago (Erdmann, personal commu-nication, 2007). Fluctuations in primary production may affectthe anchovy population with secondary effects that cascadethroughout the food web (Beamish, 1995; McFarlane et al.,2000; Chassot et al., 2007). We therefore introduce stochas-tic climate effects into the dynamic simulation in the form ofa randomized annual primary production forcing function inorder to test whether a depressed anchovy population mightimpact the variability of pelagic piscivore populations. This issimilar to a population viability analysis conducted by Pitcheret al. (2005), but uses a novel technique to scale the projectedprimary production trend to historical data.
The randomized climate series is created by sampling withreplacement of a primary production anomaly trend esti-mated by Ainsworth et al. (2008) using a historic 1990 EwEmodel. Those authors used an automated optimization rou-tine in Ecosim to reconstruct the primary production patternfrom 1990 to 2005. The pattern represents annual modifiersof the phytoplankton production rate (production/biomass,units: year−1) that would best explain residuals between pre-dicted and observed time series of catch and relative biomass
when used as a forcing function in the 1990–2005 simulation.The residuals for 32 functional groups were minimized usinga least-squares fitting criterion, assuming that the productionpattern cascades up the food web to affect higher order groups.
i n g
364 e c o l o g i c a l m o d e l lThe amplitude of the primary production anomaly patternwas subsequently scaled by Ainsworth et al. (2008) to recreatethe observed phytoplankton variability, about 4.7% per year,as measured by SeaWifs satellite data (SAU, 2006). The scal-ing procedure ensures that the degree of primary productionvariability is representative of the past. In testing the effectsof stochastic climate in this way we also assume that pastvariability in primary production might be similar to futurevariability.
There are several major sources of process and modeluncertainty that influence the predicted dynamics of pelagicpiscivores. The unsure biomass estimates of tuna, anchovyand other indirect players contribute to the uncertainty, butthe greatest source of error may relate to the predation mor-tality functional response described by Ecosim’s vulnerabilityparameters. Uncertainty in these terms reflects our imperfectknowledge of density-dependant predator and prey behaviour,and also the carrying capacity of the ecosystem. Ainsworthet al. (2008) document the process of tuning the model toobserved time series in order to provide a plausible set ofvulnerability parameters for this ecosystem.
2.3. (Q2) Restricting commercial fisheries on groupers
In order to determine the effects of restricting commercialfisheries for groupers (Serranidae), we have assumed that thefollowing gear types are used primarily for the commercialexploitation of groupers (number in parenthesis indicates EwEfleet identification number in Ainsworth et al., 2007): divingwith spear (7), diving for live fish (8), diving with cyanide (9)and blast fishing (10). The other gear types exploiting groupersare therefore assumed to be primarily artisanal: spear and har-poon (1), permanent trap (5) and set line (14). The distinctionbetween artisanal and commercial catch is difficult to drawdue to the unreported and unregulated nature of Raja Ampatreef fish fisheries and widespread casual local trade. A signif-icant portion of the catch that we here call artisanal may besold locally or traded within islands and villages, but we havechosen these gear types to highlight the distinction betweenfishing sectors that require low capital investment and/orwhose products are destined for a small-scale local market,versus fishing sectors that require high capital investmentand/or whose products are destined for regional or interna-tional market. For example, capital-intensive fishing methodssuch as compressor diving are assumed to be commercial;also fisheries that produce a high value product suitable forexport such as cyanide fishing to capture groupers, Napoleonwrasse (Cheilinus undulatus) and other live reef fish (Erdmannand Pet-Soede, 1996; Pet-Soede and Erdmann, 1998). Blast fish-ing provides a high yield of low-value product, which is likelyto be absorbed by a large regional market, and so is assumedto be commercial.
In the simulation model, we reduce the amount of com-mercial fishing on groupers and examine the effect on theartisanal gear types. We look at two scenarios, where artisanalfishing effort remains constant, and when it increases to keep
the total amount of grouper catch constant. Effects of restrict-ing commercial fisheries are framed in terms of the impact toartisanal fisheries production and assemblage changes causedby trophic dynamics.2 1 4 ( 2 0 0 8 ) 361–374
2.4. (Q3) Restrictions to reef fish net fisheries
There are concerns that the livelihoods of artisanal fishersin Raja Ampat, particularly around the rural communitiesof Weigeo, Kofiau and Misool Islands, might be threatenedby the commercial exploitation of reef-associated fish. Somecommercial fishing is done by foreigners originating in urbancentres like Sorong on the west coast of New Guinea. Asa potential management tool, we evaluate the ecosystemimpacts of restricting net fisheries that operate in inshoreareas around Raja Ampat by varying the model net fisheries(shore gillnet (3) and driftnet (4)) and examine a range of sce-narios including total closure. Non-net gear types that capturereef fish are spear and harpoon (1), reef gleaning (2), perma-nent trap (5), portable trap (6), diving with spear (7) and divingfor live fish (8). We perform similar tests of the model as theones described above for groupers.
2.5. (Q4) Effects of blast fishing
Blast fishing is a dangerous and damaging fishery that haslong-term impacts on the health of coral reef communities(Pauly et al., 1989). It has been illegal in Indonesia since1985 when Fisheries Law No. 9 came into effect legislatingacceptable harvest areas and catching methods, and intro-ducing some protection against pollution and other damages(Purwaka and Sunoto, 2002). Penalties for blast fishing arestrict in Indonesia, and can include up to 10 years in prisonand/or a 100 million Rupiah fine (more than $10,000) butenforcement and monitoring are seriously lacking (Donnellyet al., 2003).
Blast fishing is known to occur in Raja Ampat, however,estimates of the frequency vary widely (McKenna et al., 2002;Erdmann and Pet, 2002; Donnelly et al., 2003). Aerial surveys in2006 for the BHS-EBM Project did not detect any active opera-tions (Barmawi, personal communication, 2007), neverthelessit is perceived by locals to be a serious threat to ecosystemhealth (Muljadi, 2004; Halim, 2007). The blasting operationsprovide a high quantity of low-value fish. Fish caught withthis method are easily identified in markets by their pul-verized flesh and low value. Nevertheless, there is a strongeconomic incentive for fishers to continue the practice (Bailey,2007) despite the fact that the cumulative effect of blast fish-ing greatly reduces the profitability of the reef system in thelong term (Pet-Soede et al., 1999).
Simulating the effects of removals from blast fishing isstraightforward in the EwE models; we can capture theimpacts on both targeted and bycatch species as we can withmost gear types. However, to accurately simulate non-trophiceffects caused by the removal of complex substrate requiresthe use of special mediation functions. With these, we canattempt to capture the refuge benefit that juvenile fish andinvertebrates gain from high coral biomass. The Raja Ampatmodel uses mediation functions to emulate this benefit, wherethe vulnerability of juvenile fish and invertebrates to theirpredators increases as the biomass of coral is reduced.
We used a simple linear mediation function. As thebiomass of corals decreases, the trophic vulnerabilities of themediated groups increase to a maximum of two times thebaseline Ecopath vulnerability value. The vulnerability value

g 2 1
rmtwgottwansarttge
dbtfifif
2
Iwl‘edmaabfmWi(as
ati(flmbevtopc
e c o l o g i c a l m o d e l l i n
epresents the maximum allowable increase in the predationortality for a given predator–prey interaction when preda-
or biomass is high. Therefore, as modelled, if coral biomassere to decrease to zero, predation mortality on the mediated
roups would have the potential to double under conditionsf high predator biomass. Using a higher maximum thanwo has almost no effect under the conditions of the presentest. The mediation functions affect all predators in the sameay, regardless of attack mode. Mediation functions were
pplied to 27 reef fish functional groups, including all juve-ile age stanzas in the model, and two invertebrate groups:mall crabs and octopus. For the purpose of this analysis, were only concerned with juvenile stanzas of the following 12eef fish groups: groupers, snappers, Napoleon wrasse, coralrout, large/medium/small reef-associated, large/small plank-ivores, macro algal browsing, eroding grazers and scrapingrazers. For functional group descriptions consult Ainswortht al. (2008).
Some other applications of mediation functions in EwE areescribed by Okey et al. (2004) (sea floor shading by planktonlooms) and Cox et al. (2002) (tunas mediating forage fish mor-ality caused by birds). We frame ecosystem results from blastshing in terms of the assemblage change at various levels ofshing effort, and the effect on juvenile fish biomass resultingrom a loss in coral reef habitat.
.6. (Q5) Maximization of tuna fisheries
n order to determine the resource potential of tuna stockse have constructed multi-species catch and biomass equi-
ibrium curves for skipjack tuna (Katsuwonus pelamis) andother tuna’ (including 10 other species of Scombridae). Thequilibrium analysis produces outputs analogous to biomassynamic models commonly used in single-species fisheriesanagement. The biomass of an exploited group will usu-
lly be highest under zero fishing effort (the catch then willlso be zero); this biomass level is referred as B0, or virginiomass. As fishing intensity increases, catch on the subjectunctional group will increase to a maximum called maxi-
um sustainable yield (MSY: Russell, 1931; Graham, 1935).hen fisheries take exactly this amount, the biomass at max-
mum sustainable yield (BMSY) can be maintained indefinitelyin principle, with caveats). However, when catches exceed thismount, recruitment overfishing occurs and catches will beub-optimal.
As with analogous single-species methods, the equilibriumnalysis relies on the assumption of deterministic popula-ion behaviour in growth, recruitment and mortality, and sos subject to similar criticisms as biomass dynamic modelssee Larkin, 1977; Punt and Smith, 2001). Climate variation,or example, can only reduce the estimate of safe harvestimits. However, an equilibrium analysis using an ecosystem
odel offers a major advantage over single-species methodsecause it accounts for species interactions. Even though ancosystem model represents a greatly simplified and abstractersion of the ecosystem, the number of trophic and non-
rophic interactions increases exponentially with the numberf functional groups. These interactions can combine in unex-ected ways to affect stock dynamics. Multispecies productionurves can potentially differ drastically compared to a single-4 ( 2 0 0 8 ) 361–374 365
species assessment, and it is prudent to analyze sources of thediscrepancy in an EBFM framework.
We also develop an optimal tuna fishing solution by useof the policy search routine in Ecosim (Christensen andWalters, 2004). The routine uses a non-linear optimizationprocedure to iteratively step towards the vector of fishingfleet effort that maximizes an objective function. The solu-tion we present maximizes the sustainable amount of catchavailable from tuna groups by maneuvering the ecosysteminto a hyper-productive form, eliminating predators and com-petitors, while enhancing prey and supporting groups. Byengineering the ecosystem to support high tuna yields we canexceed the single-species sustainable catch limits predictedby MSY. It is important to note that this does not representa reasonable policy option. Under this extreme scenario, theecosystem is simplified, biodiversity is reduced and the riskof catastrophic stock failure may also be increased. Such apolicy would also be socially undesirable: the increased catchrate could only be achieved in principle through the coopera-tion of fishing sectors, some of which must sacrifice earningsto service the tuna fleet. This solution can be viewed as atheoretical ‘upper-limit’ on ecosystem production as set bythermodynamics.
Among other modelling uncertainties, Ecosim has aninherent limitation in representing migratory functionalgroups like tuna (Martell, 2004). The default assumption wemake here is that predation and fishing mortality trends else-where it its range (i.e., outside of Raja Ampat) mirror thechanges detailed in the model.
3. Results
3.1. (Q1) Effects of the anchovy fishery
Fig. 1 shows the ecosystem effects of Raja Ampat anchovyfisheries at levels of fishing mortality above and below thebaseline 2005 year (F2005 ≈ 0.5 year−1). All values represent theequilibrium ecosystem condition reached after a 20-year sim-ulation from 2005 to 2025. Each data series represents changesin the aggregate biomass of EwE functional groups shown inthe figure. As the anchovy fishery increases to four times itscurrent level of fishing mortality, anchovy biomass is reducedto approximately 60% of its current value (see Fig. 2) and manyof their predators decline. The biomass of large, medium andsmall reef-associated fish increase slightly, no more than 3%,due to a release of predation mortality from pelagic piscivores.However, the biomass of large, medium and small pelagic fish,which feed on anchovy, is decreased by as much as 80%. Thelarge pelagic group includes skipjack tuna and other tuna,mackerel and billfish: these are reduced to 53%, 36%, 66% and19% of their current biomass levels, respectively, when theanchovy fishing rate is increased to four times the 2005 level.Seabirds are among the predators that suffer the most from aloss of anchovy biomass; a 30% decline in the biomass of birdsseems likely under these conditions.
The multi-species equilibrium analysis presented in Fig. 2suggests that anchovies are not currently overexploited byhumans in Raja Ampat. Although there are large uncertaintiesassociated with the estimate, catch from fisheries accounts for

366 e c o l o g i c a l m o d e l l i n g 2 1 4 ( 2 0 0 8 ) 361–374
Fig. 1 – Ecosystem biomass changes with increasing anchovy exgroups have been combined into these generic categories. X-axis
Fig. 2 – Multispecies catch and biomass equilibriums forRaja Ampat anchovy at various levels of fishing mortality.Solid curve is catch; open circles are biomass. Vertical lines:dashed (F2005); solid (F0.1); dotted (FMSY). Triangle marker on
increasing their fishing effort, trolling operations for tunaloose more than 50% of their catch value. The bagan fishery fol-lows then other commercial fisheries for large pelagics. Due toa small increase in the biomass of reef fish and exploited inver-
X-axis shows multi-species optimum F (FOPT). Exploitationis currently at 60% of FMSY.
approximately 19% of the total mortality of this group. Recallthat we used a relatively large anchovy catch estimate fromAinsworth et al. (2007), 70% larger than the estimate madeby Bailey et al. (2008), while at the same time this modeluses a revised anchovy biomass of 1.0 tonnes km−2 down from1.5 tonnes km−2 of the preliminary model of Ainsworth et al.(2007). It is worth noting therefore that even under these con-ditions there is still no evidence of recruitment overfishing bythe bagan fishery.
The current fishing mortality on anchovy (F2005) is calcu-lated to be 0.5 year−1, which is approximately 60% of FMSY
(0.85 year−1). The precautionary fisheries management targetF0.1 is lower than FMSY, at 0.7 year−1. We also present the multi-species optimum fishing mortality (FOPT), 0.65 year−1, whichmaximizes the combined fishery value of anchovy, skipjack
tuna, other tuna, billfish and mackerel. It is very similar tothe F0.1 exploitation level considering the range of error of themodel. When anchovy fishing mortality is at FOPT, the com-bined value of these fisheries is about 7% higher than underploitation. The biomasses of all relevant EwE functionalshows anchovy fishing mortality relative to 2005 levels.
the current conditions (F2005). When anchovy fishing mortalityis at FMSY, the combined value of these fisheries is only 3.6%higher than current conditions.
Fig. 3 shows the results of an MTI sensitivity analysis. Of allanchovy predators, birds have the greatest effect on anchovypopulations. The relationship in Fig. 3 will reflect a strongdirect predator–prey interaction, but it is also affected by themediation function mentioned earlier, in which tuna facili-tate the consumption of anchovies by birds. Losses in anchovybiomass will not only have a direct negative impact on the birdpopulation as a loss of prey; it will also reduce the biomass oftuna and other large pelagics (see Fig. 2) thereby removing afacilitation effect that worked in the birds’ favour.
In Fig. 4, we model an anchovy population collapse.Economic impacts extend throughout the fleet. Without
Fig. 3 – Mixed trophic impacts on anchovy as impactedgroup. These functional groups benefit from high anchovybiomass through predation or indirect relationships. Birdshave the strongest negative impact on anchovy biomass.

e c o l o g i c a l m o d e l l i n g 2 1 4 ( 2 0 0 8 ) 361–374 367
Fig. 4 – Incidental economic impacts of a major anchovycollapse. Fishery values assume status quo levels of fishingpressure and reflect the post-collapse ecosystem biomasse
ti
aomlfiaovtfff
3
WcTi
Fig. 5 – The effect of anchovy biomass on the variability oflarge pelagic piscivore populations. Based on 20-yearMonte Carlo simulations (2005–2025) using stochasticclimate forcing (n = 10). Error bars show 1S.D. Y-axis shows
FgAl
quilibrium. Anchovy biomass is near zero.
ebrates from predation release, there is an incidental increasen the value of some reef and invertebrate fisheries.
Fig. 5 considers an ecosystem service performed bynchovy. High anchovy biomass may have a stabilizing effectn large pelagic piscivore populations under stochastic cli-ate variation. The average coefficient of variation for the
arge pelagic groups (skipjack, other tuna, mackerel and bill-sh) is highest when anchovy biomass is low. When anchovy ist BMSY, there is a greater amount of variation in the biomassf its pelagic predators. When anchovy is at B0 there is lessariability. There are uncertainties relating to the fact thathe wide-ranging nature of the large pelagic species cannot beully represented in the model (see Section 2). It is also unclearrom these results whether a large anchovy population wouldorestall a major perturbation in piscivore populations.
.2. (Q2) Restricting commercial fisheries on groupers
hen commercial fishing for groupers is eliminated, theatch of artisanal gear types increases by about 3% (Fig. 6A).his assumes no increase in the artisanal harvest rate; the
mprovement is a result of the additional grouper biomass that
ig. 6 – Artisanal benefits of restricting commercial grouper fisherouper biomasses are available for the artisanal fleet (artisanalssumes constant artisanal harvest rate at 2005 level. (B) Assum
evels.
average coefficient of variation for the biomass of largepelagic groups.
becomes available for artisanal fishers. The artisanal harvestrate could otherwise be increased by 17.5% to maintain thesame amount of grouper catch overall (right—Fig. 6B).
In terms of system biodiversity, there is no advantage toshifting fishing effort from commercial gear types to arti-sanal gear types unless there is a concurrent reduction ingrouper catch. When commercial catch is completely replacedby artisanal catch, ecosystem biodiversity remains the sameto within 0.01% using the Q90 ecosystem biodiversity index(Ainsworth and Pitcher, 2005). For comparison, there is a 2.5%increase in Q90 biodiversity if artisanal fishing effort does notreplace the missing commercial effort. The Shannon–Weaverbiodiversity statistic did not detect any notable differencesbetween the scenarios (Shannon and Weaver, 1949; adaptedfor EwE by Ainsworth, 2006).
Halting commercial fisheries for groupers results in anincrease in the biomass of large reef fish, structural benthos
(from the cessation of blast fishing), small and medium reeffish (Fig. 7). It also results in the decrease of some demersal anddeepwater fish, which are more heavily exploited by artisanalgear types.ries. When commercial fisheries are restricted, higherfisheries: dark grey; commercial fisheries: light grey). (A)es increasing artisanal effort to maintain steady catch

368 e c o l o g i c a l m o d e l l i n g 2 1 4 ( 2 0 0 8 ) 361–374
Fig. 7 – Ecosystem biomass change when commercialfishing for groupers is eliminated. When commercialfisheries for groupers are eliminated, the left most groupsincrease in biomass and the right most groups decrease.Open circles: Commercial fishing is eliminated and artisanalfishing does not replace the missing effort. Closed circles:Artisanal fishing replaces missing commercial effort. Thebiomasses of all relevant EwE functional groups have been
Fig. 8 – Multispecies catch equilibrium curve for groupers.X-axis shows grouper F; Y-axis shows catch (adult stanzaonly). Surplus production curve is calculated byincrementing the commercial fleet (solid circles) orartisanal fleet (open circles). Commercial fisheries achieve aslightly more efficient use of the stock (though notnecessarily of the assemblage); multi-species MSY is about7% higher using the commercial suite of fishing gears due
pelagic fish category as we see in Fig. 2. Large pelagic fish
combined into these categories.
The commercial gear types we have outlined tend to catcha large proportion of grouper relative to other species; 26%of their total catch comes from the grouper functional groups.The artisanal fisheries are broader. Only 4% of their total catchis composed of groupers. At high levels of grouper fishing mor-tality, there are greater disturbances to the ecosystem made byartisanal fisheries. These result in lower grouper biomass andcatch (Fig. 8) compared to commercial exploitation. The differ-ence in the predicted MSYs is not much (∼7%) considering theerror range of the model. Although, the current exploitationstatus of groupers (F2005) is about 30% of FMSY, catch is already
at 88% of MSY. A small sustainable increase in catch might beachievable if we accept an increased risk of stock collapse anda reduction in the average body weight of fish.Fig. 9 – Ecosystem biomass changes at various levels of fishing mEwE functional groups have been combined into these generic ca2005 levels.
to trophic effects. Vertical lines: dashed (F2005); solid (F0.1);dotted (FMSY).
3.3. (Q3) Restrictions to reef fish net fisheries
Fig. 9 presents some of the ecosystem effects predicted bythe model of restricting net fisheries. Complete closures ofshore gillnet and drift net fisheries would result in an increaseof large reef-associated fish biomass, on the order of 5%. Asmaller increase is predicted for small and medium reef fish.Net fisheries have a relatively large impact on the biomassof pelagic fish. They intercept anchovies, and so we see asimilar surplus production curve in the small and medium
could increase by as much as 8% with a closure of commer-cial net fisheries. However, net fisheries are synergistic withsome invertebrate fisheries—when we remove net fisheries,
ortality due to net fisheries. The biomasses of all relevanttegories. X-axis shows net fishing mortality relative to
e c o l o g i c a l m o d e l l i n g 2 1 4 ( 2 0 0 8 ) 361–374 369
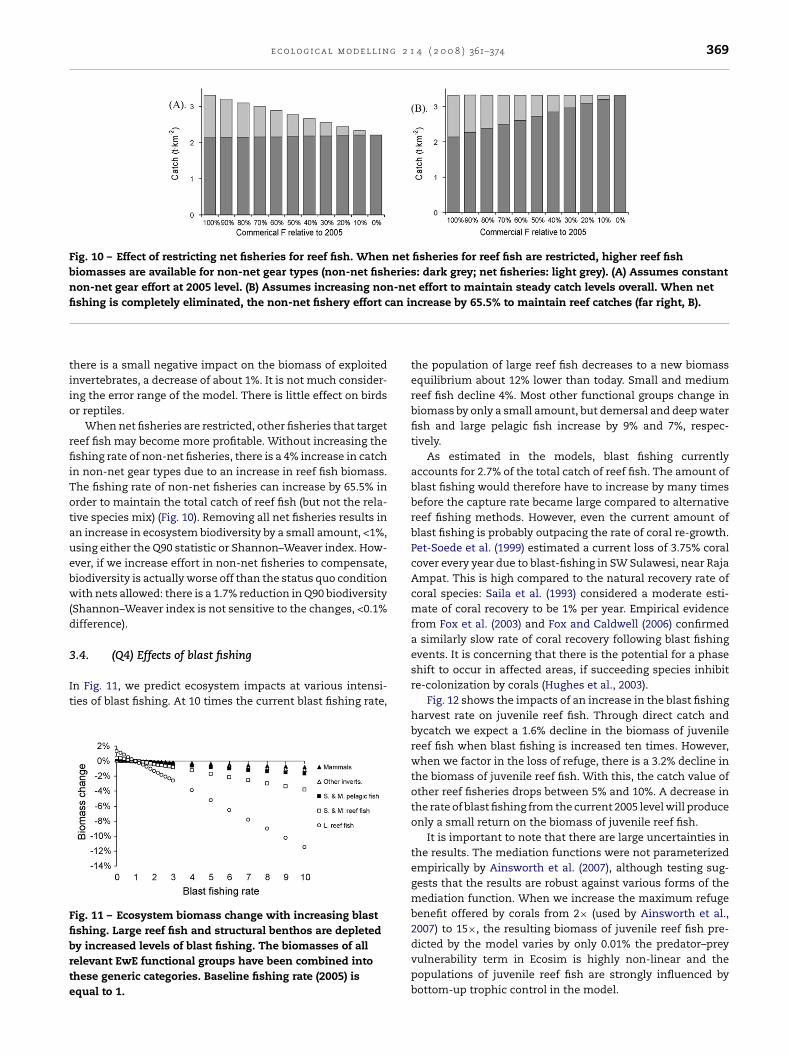
Fig. 10 – Effect of restricting net fisheries for reef fish. When net fisheries for reef fish are restricted, higher reef fishbiomasses are available for non-net gear types (non-net fisheries: dark grey; net fisheries: light grey). (A) Assumes constantnon-net gear effort at 2005 level. (B) Assumes increasing non-net effort to maintain steady catch levels overall. When netfi an in
tiio
rfiiTotauebw(d
3
It
Ffibrte
shing is completely eliminated, the non-net fishery effort c
here is a small negative impact on the biomass of exploitednvertebrates, a decrease of about 1%. It is not much consider-ng the error range of the model. There is little effect on birdsr reptiles.
When net fisheries are restricted, other fisheries that targeteef fish may become more profitable. Without increasing theshing rate of non-net fisheries, there is a 4% increase in catch
n non-net gear types due to an increase in reef fish biomass.he fishing rate of non-net fisheries can increase by 65.5% inrder to maintain the total catch of reef fish (but not the rela-ive species mix) (Fig. 10). Removing all net fisheries results inn increase in ecosystem biodiversity by a small amount, <1%,sing either the Q90 statistic or Shannon–Weaver index. How-ver, if we increase effort in non-net fisheries to compensate,iodiversity is actually worse off than the status quo conditionith nets allowed: there is a 1.7% reduction in Q90 biodiversity
Shannon–Weaver index is not sensitive to the changes, <0.1%ifference).
.4. (Q4) Effects of blast fishing
n Fig. 11, we predict ecosystem impacts at various intensi-ies of blast fishing. At 10 times the current blast fishing rate,
ig. 11 – Ecosystem biomass change with increasing blastshing. Large reef fish and structural benthos are depletedy increased levels of blast fishing. The biomasses of allelevant EwE functional groups have been combined intohese generic categories. Baseline fishing rate (2005) isqual to 1.
crease by 65.5% to maintain reef catches (far right, B).
the population of large reef fish decreases to a new biomassequilibrium about 12% lower than today. Small and mediumreef fish decline 4%. Most other functional groups change inbiomass by only a small amount, but demersal and deep waterfish and large pelagic fish increase by 9% and 7%, respec-tively.
As estimated in the models, blast fishing currentlyaccounts for 2.7% of the total catch of reef fish. The amount ofblast fishing would therefore have to increase by many timesbefore the capture rate became large compared to alternativereef fishing methods. However, even the current amount ofblast fishing is probably outpacing the rate of coral re-growth.Pet-Soede et al. (1999) estimated a current loss of 3.75% coralcover every year due to blast-fishing in SW Sulawesi, near RajaAmpat. This is high compared to the natural recovery rate ofcoral species: Saila et al. (1993) considered a moderate esti-mate of coral recovery to be 1% per year. Empirical evidencefrom Fox et al. (2003) and Fox and Caldwell (2006) confirmeda similarly slow rate of coral recovery following blast fishingevents. It is concerning that there is the potential for a phaseshift to occur in affected areas, if succeeding species inhibitre-colonization by corals (Hughes et al., 2003).
Fig. 12 shows the impacts of an increase in the blast fishingharvest rate on juvenile reef fish. Through direct catch andbycatch we expect a 1.6% decline in the biomass of juvenilereef fish when blast fishing is increased ten times. However,when we factor in the loss of refuge, there is a 3.2% decline inthe biomass of juvenile reef fish. With this, the catch value ofother reef fisheries drops between 5% and 10%. A decrease inthe rate of blast fishing from the current 2005 level will produceonly a small return on the biomass of juvenile reef fish.
It is important to note that there are large uncertainties inthe results. The mediation functions were not parameterizedempirically by Ainsworth et al. (2007), although testing sug-gests that the results are robust against various forms of themediation function. When we increase the maximum refugebenefit offered by corals from 2× (used by Ainsworth et al.,2007) to 15×, the resulting biomass of juvenile reef fish pre-
dicted by the model varies by only 0.01% the predator–preyvulnerability term in Ecosim is highly non-linear and thepopulations of juvenile reef fish are strongly influenced bybottom-up trophic control in the model.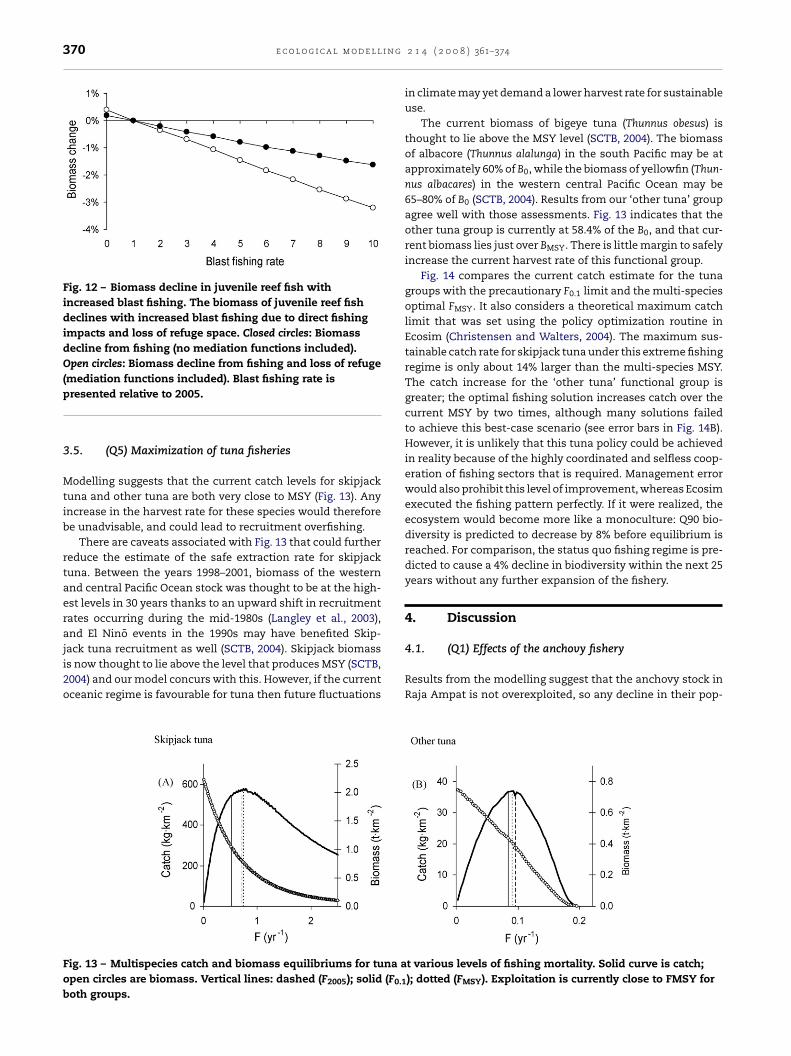
370 e c o l o g i c a l m o d e l l i n g
Fig. 12 – Biomass decline in juvenile reef fish withincreased blast fishing. The biomass of juvenile reef fishdeclines with increased blast fishing due to direct fishingimpacts and loss of refuge space. Closed circles: Biomassdecline from fishing (no mediation functions included).Open circles: Biomass decline from fishing and loss of refuge(mediation functions included). Blast fishing rate is
presented relative to 2005.3.5. (Q5) Maximization of tuna fisheries
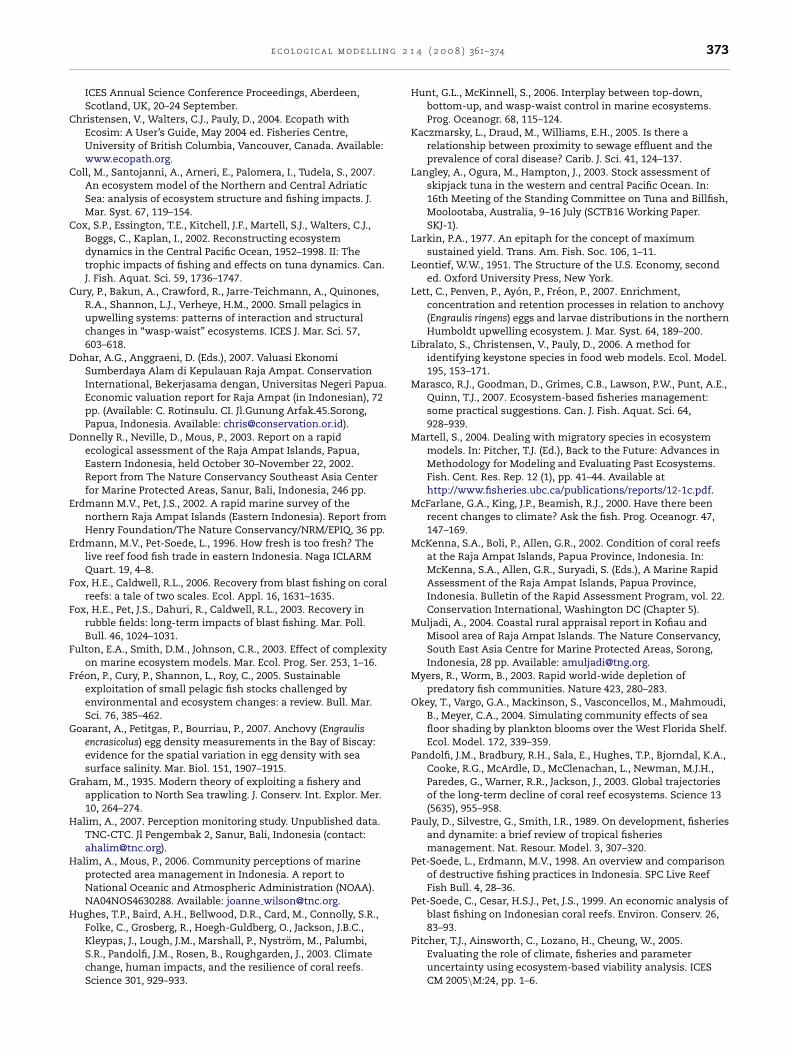
Modelling suggests that the current catch levels for skipjacktuna and other tuna are both very close to MSY (Fig. 13). Anyincrease in the harvest rate for these species would thereforebe unadvisable, and could lead to recruitment overfishing.
There are caveats associated with Fig. 13 that could furtherreduce the estimate of the safe extraction rate for skipjacktuna. Between the years 1998–2001, biomass of the westernand central Pacific Ocean stock was thought to be at the high-est levels in 30 years thanks to an upward shift in recruitmentrates occurring during the mid-1980s (Langley et al., 2003),and El Nino events in the 1990s may have benefited Skip-
jack tuna recruitment as well (SCTB, 2004). Skipjack biomassis now thought to lie above the level that produces MSY (SCTB,2004) and our model concurs with this. However, if the currentoceanic regime is favourable for tuna then future fluctuationsFig. 13 – Multispecies catch and biomass equilibriums for tuna aopen circles are biomass. Vertical lines: dashed (F2005); solid (F0.1
both groups.
2 1 4 ( 2 0 0 8 ) 361–374
in climate may yet demand a lower harvest rate for sustainableuse.
The current biomass of bigeye tuna (Thunnus obesus) isthought to lie above the MSY level (SCTB, 2004). The biomassof albacore (Thunnus alalunga) in the south Pacific may be atapproximately 60% of B0, while the biomass of yellowfin (Thun-nus albacares) in the western central Pacific Ocean may be65–80% of B0 (SCTB, 2004). Results from our ‘other tuna’ groupagree well with those assessments. Fig. 13 indicates that theother tuna group is currently at 58.4% of the B0, and that cur-rent biomass lies just over BMSY. There is little margin to safelyincrease the current harvest rate of this functional group.
Fig. 14 compares the current catch estimate for the tunagroups with the precautionary F0.1 limit and the multi-speciesoptimal FMSY. It also considers a theoretical maximum catchlimit that was set using the policy optimization routine inEcosim (Christensen and Walters, 2004). The maximum sus-tainable catch rate for skipjack tuna under this extreme fishingregime is only about 14% larger than the multi-species MSY.The catch increase for the ‘other tuna’ functional group isgreater; the optimal fishing solution increases catch over thecurrent MSY by two times, although many solutions failedto achieve this best-case scenario (see error bars in Fig. 14B).However, it is unlikely that this tuna policy could be achievedin reality because of the highly coordinated and selfless coop-eration of fishing sectors that is required. Management errorwould also prohibit this level of improvement, whereas Ecosimexecuted the fishing pattern perfectly. If it were realized, theecosystem would become more like a monoculture: Q90 bio-diversity is predicted to decrease by 8% before equilibrium isreached. For comparison, the status quo fishing regime is pre-dicted to cause a 4% decline in biodiversity within the next 25years without any further expansion of the fishery.
4. Discussion
4.1. (Q1) Effects of the anchovy fishery
Results from the modelling suggest that the anchovy stock inRaja Ampat is not overexploited, so any decline in their pop-
t various levels of fishing mortality. Solid curve is catch;); dotted (FMSY). Exploitation is currently close to FMSY for

e c o l o g i c a l m o d e l l i n g 2 1 4 ( 2 0 0 8 ) 361–374 371
Fig. 14 – Tuna catch expected under various fishing regimes. Current catch represents estimated total extractions for year2005. F0.1 is the level of fishing mortality at which the slope of the yield-per-recruit curve is 10% of the slope at the origin,F0. FMSY is the fishing mortality that will maximize sustainable yield. Ecosystem limit refers to a hypothetical ecosystemoptimized to deliver maximum sustainable tuna catch (e.g., competitors and predators removed; prey groups increased).Error bars show the range of solutions determined by the optimization facility in Ecosim (95% confidence intervals); theu itera
uosctscse(s
who2ddpgpstpt
EthlpofiswpAt
pper error bar represents the best solution, however, most
lation noted by fishers or researchers could be short-termr localized to inshore areas. However, the equilibrium analy-is that we performed assumes constant ecosystem carryingapacity and climate conditions, so the estimates of exploita-ion status are most appropriately viewed as a best-casecenario. Any further increase in the anchovy exploitation rateould be cause for concern because of the variable nature ofmall pelagic stocks, for example, due to temperature (Freont al., 2005), salinity (Goarant et al., 2007) or current patternsLett et al., 2007), and the fact that (more valuable) piscivorouspecies directly rely on the anchovy population.
Anchovies may provide an important conduit throughhich primary and secondary production is channelled toigher trophic levels. We know this to be true of forage fish inther ecosystems (e.g., Cury et al., 2000; Hunt and McKinnell,006) so anchovies can have a controlling influence on systemynamics (Libralato et al., 2006; Coll et al., 2007). Anchovy alsoominate the forage fish assemblage in Raja Ampat (Erdmann,ersonal communication, 2006). The results of this study sug-est they are an important link, especially to large pelagiciscivores and bird populations. From a single-species per-pective, we may wish to pursue a fishing policy for anchovyhat would increase the catch rate closer to MSY, but such aolicy would ignore potential ecosystem services offered byhis functional group.
Anchovy are only moderately exploited in Raja Ampat.liminating the fishery for them would cause their biomasso increase close to the unexploited level, B0, which is 11%igher than the current stock size (Fig. 2). There will be neg-
igible changes in the biomass of predators like birds andelagic fish, but there may be a beneficial stabilizing effectn fisheries for more valuable large pelagic fish. If a limitedshery is allowed, at or below current exploitation rates, thetock will remain safe from recruitment overfishing and it
ill be more resilient to climate variation than under a FMSYolicy. The multi-species optimal fishing effort lies near F0.1.n increase in fishing effort beyond this amount will reduce
otal income from pelagic resources; a large increase (e.g., 2×)
tions find a lower value (bar graph shows average).
would cause a noticeable decline in bird and piscivore popu-lations.
4.2. (Q2) Restricting commercial fisheries on groupers
If commercial fisheries on groupers were restricted, moreresource would be available for artisanal fishers. However, arti-sanal fisheries are greater in scale; they catch almost six timesas much as commercial fisheries so the relative increase incatch for the artisanal fleet would be modest. With commercialfisheries removed, groupers increase in biomass and systembiodiversity improves. However, any ecological benefit fromclosing commercial fisheries is lost if artisanal fisheries wereto increase to compensate for the missing effort. There are dif-ferences in the way that commercial and artisanal gear typesinteract with the ecosystem in terms of trophic effects, butthe differences only become noticeable at high (and unsafe)exploitation rates.
If we completely removed commercial fisheries forgroupers, and did not replace the missing effort, total catch ofgroupers would be reduced about 14%, and the stocks wouldassume an equilibrium biomass 37% higher than the statusquo prediction. We did not detect any significant differencein the food-web or biodiversity impacts of commercial ver-sus artisanal gear types. We did not consider the toxicologicaleffects of cyanide fishing.
4.3. (Q3) Restrictions to reef fish net fisheries
Restricting net fisheries on coral reefs might be a viablemanagement option to protect inshore reef fish stocks, espe-cially in areas near villages where locals could participatein monitoring and enforcement. Results from our study sug-gest there would be an economic incentive for them to do so.
Restricting net fisheries has the potential to increase catchin both pelagic fisheries and artisanal reef fisheries. Biodiver-sity might improve if we restrict net fisheries, but if effort isincreased in other sectors to compensate for missing catch,
i n g
r
p.
372 e c o l o g i c a l m o d e l l
biodiversity could be worse off than under status quo condi-tions.
4.4. (Q4) Effects of blast fishing
Blast fishing is an indiscriminate catching method, but unlikethe hooks, nets and traps used in artisanal fisheries, muchof the catch goes unutilized. Other commercial reef fisheries,which are pursued mainly by divers, are relatively clean unlesscyanide is involved. They focus on a small number of speciesand produce little or no bycatch. Blast fishing has more seri-ous potential to impact the ecosystem, and in unpredictableways through the compounding effects of removals, untar-geted mortality and destruction of refuge space. Injured fishmay also suffer increased predation mortality; this effect wasnot captured in the model.
Nevertheless, the results of this study highlight the indi-rect ecological and economic value of preserving coral reefs.As blast fishing increases, the loss of refuge space can hinderjuvenile reef fish populations as severely as direct mortalityfrom the fishery itself. It is difficult to judge how widespreadthe fishery is in Raja Ampat, but the level of fishing effortin the model is not sufficient to provoke a major responsein the food web even when increased by several times. Thestructural damage to corals, however, is more concerning thantrophic effects because the slow re-growth rate of corals makesany damage cumulative. Even under status quo conditions,the destruction rate of coral habitat could be greater than thereplacement rate. In terms of ecosystem functioning, the lossof refuge space incurred so far in Raja Ampat from blast fish-ing has probably had a minor effect on reef fish populationscompared to exploitation by legitimate fisheries. Nevertheless,even a small amount of blast fishing will eventually hin-der alternative development options like ecotourism in RajaAmpat.
4.5. (Q5) Maximization of tuna fisheries
Our results suggest that it is not advisable to permit any fur-ther increases in the catch for skipjack tuna or other tuna. Themodels predict that both groups are fully exploited, so anyincrease would result in recruitment overfishing and reducestock production. Unfortunately, our model has a limitedability to represent stock dynamics of these highly migra-tory species. Mortality sources from fishing or environmentalstressors occurring outside of the Raja Ampat system are notexplicitly accounted for in the model. However, it is unwar-ranted and possibly dangerous to assume that Raja Ampat’stuna populations are subject to fewer pressures in other partsof their range (Myers and Worm, 2003).
5. Conclusions
Despite being seriously data poor by developed-nations stan-dards, the targeted acquisition of key field data for a tuned
ecosystem simulation model has enabled Raja Ampat stake-holders to evaluate the likely ecosystem-wide effects of fivehigh priority issues that are part of an implementation strat-egy for ecosystem-based fishery management.2 1 4 ( 2 0 0 8 ) 361–374
Acknowledgements
We acknowledge our partners in Indonesia, especially MarkErdmann and Chris Rotinsulu (Conservation International),Peter Mous (COREMAP II), Joanna Wilson, Mohammed Bar-mawi and Dewa Gede Raka Wiadnya (The Nature ConservancyCoral Triangle Centre). We also thank Kai Lee and KristinSherwood (Packard Foundation), Lida Pet-Soede, Jos Pet andother researchers at TNC, CI and WWF for their valuable inputand discussion on the models and the research questions.We thank Megan Bailey for her contribution to the anchovyanalysis and we acknowledge Becky Rahawarin (Kepala DinasPerikanan dan Kelautan, Raja Ampat) for helpful discussions.This study was funded by a grant from the David and LucillePackard Foundation.
e f e r e n c e s
Ainsworth, C., 2006. Strategic ecosystem restoration in NorthernBritish Columbia. Ph.D. Thesis. Resource Management andEnvironmental Studies. University of British Columbia, p. 422.
Ainsworth, C., Pitcher, T.J., 2005. Modifying Kempton’s speciesdiversity index for use with ecosystem simulation models.Ecol. Indication 6, 623–630.
Ainsworth, C.H., Varkey, D., Pitcher, T.J., 2007. Ecosystemsimulation models for the Bird’s Head Seascape, Papua, fittedto data. In: Pitcher, T.J., Ainsworth C.H., Bailey, M. (Eds.),Ecological and Economic Analyses of Marine Ecosystems inthe Birds Head Seascape, Papua, Indonesia. Fish. Cent. Res.Rep. 15 (5), pp. 6–172. Available:http://www.fisheries.ubc.ca/publications/reports/report15 5.ph
Ainsworth, C.H., Varkey, D., Pitcher, T.J., 2008. Marine ecosystemdynamic models of Raja Ampat, Indonesia supportingecosystem based fisheries management. In: Bailey, M., Pitcher,T.J. (Eds.), Raja Ampat II. Fish. Cent. Res. Rep. 16 (1), p. 113.
Amarumollo, J., Farid, M., 2002. Exploitation of marine resourceson the Raja Ampat Islands, Papua Province, Indonesia. In:McKenna, S.A., Allen, G.R., Suryadi, S. (Eds.), A Marine RapidAssessment of the Raja Ampat Islands, Papua Province,Indonesia. Bulletin of the Rapid Assessment Program, vol. 22.Conservation International, Washington DC (Chapter 6).
Bailey, M., 2007. Economic analysis of unregulated and illegalfishing in Raja Ampat, Indonesia. Masters Thesis. ResourceManagement and Environmental Studies. University of BritishColumbia, Vancouver, 101 pp.
Bailey, M., Rotinsulu, C., Sumaila, U.R., 2008. The migrantanchovy fishery in Kabui Bay, Raja Ampat, Indonesia: catch,profitability and income distribution. Mar. Policy 32, 483–488.
Beamish, R.J., 1995. Climate Change and Northern FishPopulations. National Research Council, Ottawa, Ont., Canada,p. 739.
Chassot, E., Melin, F., LePape, O., Gascuel, D., 2007. Bottom-upcontrol regulates fisheries production at the scale ofeco-regions in European seas. Mar. Ecol. Prog. Ser. 343, 45–55.
Chesher, R.H., 1969. Destruction of Pacific Corals by the Sea StarAcanthaster planci. Science 165, 280–283.
Christensen, V., Pauly, D., 1992. ECOPATH II—a software forbalancing steady-state models and calculating networkcharacteristics. Ecol. Model. 61, 169–185.
Christensen, V., Walters, C.J., 2004. Trade-offs in ecosystem-scaleoptimization of fisheries management policies. Bull. Mar. Sci.74, 549–562.
Christensen, V., Walters, C.J., 2005. Using ecosystem modeling forfisheries management: where are we? ICES CM. 2005/M:19. In:
g 2 1
C
C
C
C
D
D
E
E
F
F
F
F
G
G
H
H
H
e c o l o g i c a l m o d e l l i n
ICES Annual Science Conference Proceedings, Aberdeen,Scotland, UK, 20–24 September.
hristensen, V., Walters, C.J., Pauly, D., 2004. Ecopath withEcosim: A User’s Guide, May 2004 ed. Fisheries Centre,University of British Columbia, Vancouver, Canada. Available:www.ecopath.org.
oll, M., Santojanni, A., Arneri, E., Palomera, I., Tudela, S., 2007.An ecosystem model of the Northern and Central AdriaticSea: analysis of ecosystem structure and fishing impacts. J.Mar. Syst. 67, 119–154.
ox, S.P., Essington, T.E., Kitchell, J.F., Martell, S.J., Walters, C.J.,Boggs, C., Kaplan, I., 2002. Reconstructing ecosystemdynamics in the Central Pacific Ocean, 1952–1998. II: Thetrophic impacts of fishing and effects on tuna dynamics. Can.J. Fish. Aquat. Sci. 59, 1736–1747.
ury, P., Bakun, A., Crawford, R., Jarre-Teichmann, A., Quinones,R.A., Shannon, L.J., Verheye, H.M., 2000. Small pelagics inupwelling systems: patterns of interaction and structuralchanges in “wasp-waist” ecosystems. ICES J. Mar. Sci. 57,603–618.
ohar, A.G., Anggraeni, D. (Eds.), 2007. Valuasi EkonomiSumberdaya Alam di Kepulauan Raja Ampat. ConservationInternational, Bekerjasama dengan, Universitas Negeri Papua.Economic valuation report for Raja Ampat (in Indonesian), 72pp. (Available: C. Rotinsulu. CI. Jl.Gunung Arfak.45.Sorong,Papua, Indonesia. Available: [email protected]).
onnelly R., Neville, D., Mous, P., 2003. Report on a rapidecological assessment of the Raja Ampat Islands, Papua,Eastern Indonesia, held October 30–November 22, 2002.Report from The Nature Conservancy Southeast Asia Centerfor Marine Protected Areas, Sanur, Bali, Indonesia, 246 pp.
rdmann M.V., Pet, J.S., 2002. A rapid marine survey of thenorthern Raja Ampat Islands (Eastern Indonesia). Report fromHenry Foundation/The Nature Conservancy/NRM/EPIQ, 36 pp.
rdmann, M.V., Pet-Soede, L., 1996. How fresh is too fresh? Thelive reef food fish trade in eastern Indonesia. Naga ICLARMQuart. 19, 4–8.
ox, H.E., Caldwell, R.L., 2006. Recovery from blast fishing on coralreefs: a tale of two scales. Ecol. Appl. 16, 1631–1635.
ox, H.E., Pet, J.S., Dahuri, R., Caldwell, R.L., 2003. Recovery inrubble fields: long-term impacts of blast fishing. Mar. Poll.Bull. 46, 1024–1031.
ulton, E.A., Smith, D.M., Johnson, C.R., 2003. Effect of complexityon marine ecosystem models. Mar. Ecol. Prog. Ser. 253, 1–16.
reon, P., Cury, P., Shannon, L., Roy, C., 2005. Sustainableexploitation of small pelagic fish stocks challenged byenvironmental and ecosystem changes: a review. Bull. Mar.Sci. 76, 385–462.
oarant, A., Petitgas, P., Bourriau, P., 2007. Anchovy (Engraulisencrasicolus) egg density measurements in the Bay of Biscay:evidence for the spatial variation in egg density with seasurface salinity. Mar. Biol. 151, 1907–1915.
raham, M., 1935. Modern theory of exploiting a fishery andapplication to North Sea trawling. J. Conserv. Int. Explor. Mer.10, 264–274.
alim, A., 2007. Perception monitoring study. Unpublished data.TNC-CTC. Jl Pengembak 2, Sanur, Bali, Indonesia (contact:[email protected]).
alim, A., Mous, P., 2006. Community perceptions of marineprotected area management in Indonesia. A report toNational Oceanic and Atmospheric Administration (NOAA).NA04NOS4630288. Available: joanne [email protected].
ughes, T.P., Baird, A.H., Bellwood, D.R., Card, M., Connolly, S.R.,Folke, C., Grosberg, R., Hoegh-Guldberg, O., Jackson, J.B.C.,
Kleypas, J., Lough, J.M., Marshall, P., Nystrom, M., Palumbi,S.R., Pandolfi, J.M., Rosen, B., Roughgarden, J., 2003. Climatechange, human impacts, and the resilience of coral reefs.Science 301, 929–933.4 ( 2 0 0 8 ) 361–374 373
Hunt, G.L., McKinnell, S., 2006. Interplay between top-down,bottom-up, and wasp-waist control in marine ecosystems.Prog. Oceanogr. 68, 115–124.
Kaczmarsky, L., Draud, M., Williams, E.H., 2005. Is there arelationship between proximity to sewage effluent and theprevalence of coral disease? Carib. J. Sci. 41, 124–137.
Langley, A., Ogura, M., Hampton, J., 2003. Stock assessment ofskipjack tuna in the western and central Pacific Ocean. In:16th Meeting of the Standing Committee on Tuna and Billfish,Moolootaba, Australia, 9–16 July (SCTB16 Working Paper.SKJ-1).
Larkin, P.A., 1977. An epitaph for the concept of maximumsustained yield. Trans. Am. Fish. Soc. 106, 1–11.
Leontief, W.W., 1951. The Structure of the U.S. Economy, seconded. Oxford University Press, New York.
Lett, C., Penven, P., Ayon, P., Freon, P., 2007. Enrichment,concentration and retention processes in relation to anchovy(Engraulis ringens) eggs and larvae distributions in the northernHumboldt upwelling ecosystem. J. Mar. Syst. 64, 189–200.
Libralato, S., Christensen, V., Pauly, D., 2006. A method foridentifying keystone species in food web models. Ecol. Model.195, 153–171.
Marasco, R.J., Goodman, D., Grimes, C.B., Lawson, P.W., Punt, A.E.,Quinn, T.J., 2007. Ecosystem-based fisheries management:some practical suggestions. Can. J. Fish. Aquat. Sci. 64,928–939.
Martell, S., 2004. Dealing with migratory species in ecosystemmodels. In: Pitcher, T.J. (Ed.), Back to the Future: Advances inMethodology for Modeling and Evaluating Past Ecosystems.Fish. Cent. Res. Rep. 12 (1), pp. 41–44. Available athttp://www.fisheries.ubc.ca/publications/reports/12-1c.pdf.
McFarlane, G.A., King, J.P., Beamish, R.J., 2000. Have there beenrecent changes to climate? Ask the fish. Prog. Oceanogr. 47,147–169.
McKenna, S.A., Boli, P., Allen, G.R., 2002. Condition of coral reefsat the Raja Ampat Islands, Papua Province, Indonesia. In:McKenna, S.A., Allen, G.R., Suryadi, S. (Eds.), A Marine RapidAssessment of the Raja Ampat Islands, Papua Province,Indonesia. Bulletin of the Rapid Assessment Program, vol. 22.Conservation International, Washington DC (Chapter 5).
Muljadi, A., 2004. Coastal rural appraisal report in Kofiau andMisool area of Raja Ampat Islands. The Nature Conservancy,South East Asia Centre for Marine Protected Areas, Sorong,Indonesia, 28 pp. Available: [email protected].
Myers, R., Worm, B., 2003. Rapid world-wide depletion ofpredatory fish communities. Nature 423, 280–283.
Okey, T., Vargo, G.A., Mackinson, S., Vasconcellos, M., Mahmoudi,B., Meyer, C.A., 2004. Simulating community effects of seafloor shading by plankton blooms over the West Florida Shelf.Ecol. Model. 172, 339–359.
Pandolfi, J.M., Bradbury, R.H., Sala, E., Hughes, T.P., Bjorndal, K.A.,Cooke, R.G., McArdle, D., McClenachan, L., Newman, M.J.H.,Paredes, G., Warner, R.R., Jackson, J., 2003. Global trajectoriesof the long-term decline of coral reef ecosystems. Science 13(5635), 955–958.
Pauly, D., Silvestre, G., Smith, I.R., 1989. On development, fisheriesand dynamite: a brief review of tropical fisheriesmanagement. Nat. Resour. Model. 3, 307–320.
Pet-Soede, L., Erdmann, M.V., 1998. An overview and comparisonof destructive fishing practices in Indonesia. SPC Live ReefFish Bull. 4, 28–36.
Pet-Soede, C., Cesar, H.S.J., Pet, J.S., 1999. An economic analysis ofblast fishing on Indonesian coral reefs. Environ. Conserv. 26,83–93.
Pitcher, T.J., Ainsworth, C., Lozano, H., Cheung, W., 2005.Evaluating the role of climate, fisheries and parameteruncertainty using ecosystem-based viability analysis. ICESCM 2005\M:24, pp. 1–6.

i n g
374 e c o l o g i c a l m o d e l lPlaganyi, E.E., 2007. Models for an ecosystem approach tofisheries. FAO Fisheries 899 Technical Paper No. 477. FAO,Rome, 108 pp.
Plaganyi, E.E., Butterworth, D.S., 2004. A critical look at whatEcopath with Ecosim can and cannot achieve in practicalfisheries management. Afr. J. Mar. Sci. 26, 261–287.
Punt, A.E., Smith, A.D.M., 2001. The gospel of maximumsustainable yield in fisheries management: birth, crucifixionand reincarnation. In: Reynolds, J.D., Mace, G.M., Redford, K.R.,Robinson, J.R. (Eds.), Conservation of Exploited Species.Cambridge University Press, UK, pp. 41–66.
Purwaka, T.H., Sunoto, 2002. Coastal resources management inIndonesia: legal and institutional aspects. In: Torell, M.,Salamanca, A.M. (Eds.), Institutional Issues and Perspectives
in the Management of Fisheries and Coastal Resources inSoutheast Asia: The World Fish Centre Technical Report 60.ICLARM, Manila, Philippines, pp. 60–90.Russell, E.S., 1931. Some theoretical considerations on theoverfishing problem. ICES J. Mar. Sci. 6, 3–20.
2 1 4 ( 2 0 0 8 ) 361–374
Saila, S.B., Kocic, V.Lj., McManus, J.W., 1993. Modelling the effectsof destructive fishing practices on tropical coral reefs. Mar.Ecol. Prog. Ser. 94, 51–60.
Sea Around Us (SAU), 2006. A global database on marine fisheriesand ecosystems. World Wide Web site www.seaaroundus.org.Fisheries Centre, University British Columbia, Vancouver,British Columbia, Canada (visited 10 December 2006).
Shannon, C.E., Weaver, W., 1949. The Mathematical Theory ofCommunication. University of Illinois Press, Urbana, IL,p. 117.
Standing Committee on Tuna and Billfish (SCTB), 2004.Seventeenth Meeting of the Standing Committeee on Tunaand Billfish. Available: http://www.spc.org.nc/OceanFish/Html/SCTB/SCTB17/SCTB17 Final Report.pdf.
Ulanowicz, R.E., Puccia, C.J., 1990. Mixed trophic impacts inecosystems. Coenoses 5, 7–16.
Walters, C., Christensen, V., Pauly, D., 1997. Structuring dynamicmodels of exploited ecosystems from trophic mass-balanceassessments. Rev. Fish Biol. Fish. 7, 139–172.