Modified HDL: Biological and physiopathological consequences
Upload
independentCategory
view
3download
0
This article is available online at http://www.jlr.org Journal of Lipid Research Volume 53, 2012 1163
Copyright © 2012 by the American Society for Biochemistry and Molecular Biology, Inc.
A higher incidence of coronary artery disease (CAD) is associated with a lower level of HDL-cholesterol ( 1, 2 ), which is determined by multiple environmental and genetic factors. In the past few years, new therapeutic approaches have focused on fi nding ways to increase HDL ( 3, 4 ). To date, however, only a few environmental interventions, such as diet and exercise, have been successful in raising HDL level ( 5 ), whereas drug therapy development is still ongoing and has targeted only a limited number of proteins such as CETP ( 3, 4 ). In the search for a potential drug target to raise HDL and decrease CAD, the identifi cation of new genes involved in HDL determination is essential.
The genetic basis of HDL-cholesterol variation has been widely studied in various animal models. In humans, recent genome-wide association studies (GWAS) have identifi ed known HDL genes such as LIPG and CETP in addition to new genes such as GALNT2 ( 6 ). These known genes, however, ex-plain only a small proportion of the total variation, indicating that additional genes are yet to be discovered. Mouse models are a powerful strategy for identifying such genes. A large overlap exists among species for quantitative trait loci (QTL) and genes involved in lipid metabolism ( 7 ). Many study methodologies are similar between human and mouse, but mouse studies offer advantages by capitalizing on genomics tools that are not available and practical for studies of human populations. To date, our laboratory and those of others have identifi ed over 35 mouse HDL QTL (as reviewed in Wang et al., Refs. 7, 8 ). In addition, we and others have developed bioinformatics tools to narrow the QTL interval to just a few candidate genes ( 9, 10 ). Application of these tools has led to the discovery of single genes underlying QTL for HDL and
Abstract A higher incidence of coronary artery disease is associated with a lower level of HDL-cholesterol. We searched for genetic loci infl uencing HDL-cholesterol in F2 mice from a cross between MRL/MpJ and SM/J mice. Quantitative trait loci (QTL) mapping revealed one signifi -cant HDL QTL ( Apoa2 locus), four suggestive QTL on chromosomes 10, 11, 13, and 18 and four additional QTL on chromosomes 1 proximal, 3, 4, and 7 after adjusting HDL for the strong Apoa2 locus. A novel nonsynonymous polymorphism supports Lipg as the QTL gene for the chro-mosome 18 QTL, and a difference in Abca1 expression in liver tissue supports it as the QTL gene for the chromo-some 4 QTL. Using weighted gene co-expression network analysis, we identifi ed a module that after adjustment for Apoa2 , correlated with HDL, was genetically determined by a QTL on chromosome 11, and overlapped with the HDL QTL. A combination of bioinformatics tools and systems genetics helped identify several candidate genes for both the chromosome 11 HDL and module QTL based on dif-ferential expression between the parental strains, cis regu-lation of expression, and causality modeling. We conclude that integrating systems genetics to a more- traditional genetics approach improves the power of complex trait gene identifi cation. —Leduc, M. S., R. H. Blair, R. A. Verdugo, S-W. Tsaih, K. Walsh, G. A. Churchill, and B. Paigen. Using bio-informatics and systems genetics to dissect HDL-cholesterol genetics in an MRL/MpJ × SM/J intercross. J. Lipid Res . 2012. 53: 1163–1175.
Supplementary key words high-density lipoprotein cholesterol • gene suppression • genomics
This study was funded by National Institutes of Health Grants HL-077796 and HL-081162 (B.P.) and GM-070683 (G.A.C.), American Heart Association post-doctoral Fellowship 09POST2040006 (M.S.L.), National Heart, Lung, and Blood Institute NSRA Fellowship 1F32HL095240 (R.H.B.), and National Cancer Institute Core Grant CA034196 to The Jackson Laboratory. Its contents are solely the responsibility of the authors and do not necessarily represent the offi cial views of the National Institutes of Health or other granting agencies.
Manuscript received 28 February 2012 and in revised form 10 April 2012.
Published, JLR Papers in Press, April 11, 2012 DOI 10.1194/jlr.M025833
Using bioinformatics and systems genetics to dissect HDL-cholesterol genetics in an MRL/MpJ × SM/J intercross
Magalie S. Leduc , 1, * , † Rachael Hageman Blair , * , § Ricardo A. Verdugo , * Shirng-Wern Tsaih , ** Kenneth Walsh , * Gary A. Churchill , * and Beverly Paigen *
The Jackson Laboratory ,* Bar Harbor, ME ; Texas Biomedical Research Institute , † San Antonio, TX ; State University of New York at Buffalo , § Buffalo, NY ; and Human and Molecular Genetics Center,** Medical College of Wisconsin , Milwaukee, WI
Abbreviations: CAD, coronary artery disease; CGD, Center for Genome Dynamic; eQTL, expression QTL; LOD, logarithm of the odds; QTL, quantitative trait loci; WGCNA, weighted gene co-expression network analysis.
1 To whom correspondence should be addressed. e-mail: [email protected]
The online version of this article (available at http://www.jlr.org) contains supplementary data in the form of two fi gures and six tables.
at INS
ER
M, on M
ay 20, 2012w
ww
.jlr.orgD
ownloaded from
.html http://www.jlr.org/content/suppl/2012/04/11/jlr.M025833.DC1Supplemental Material can be found at:

1164 Journal of Lipid Research Volume 53, 2012
has been validated in-house for use in mice. The system is cali-brated prior to weekly measurements, and controls are run on a weekly basis.
Genotyping Mice were tail-tipped at 10 days of age. The DNA extraction
and genotyping has previously been described ( 14 ). Briefl y, DNA was isolated using phenol-chloroform and genotyped for 259 markers using the Illumina platform and custom sequencing. Genetic and physical positions were determined using the newly calculated map available on the Center for Genome Dynamic (CGD) website hosted at the Jackson Laboratory, which gather numerous analytical tools and large-scale datasets used to ana-lyzed the mammalian genome ( 15 ).
Microarray Microarrays were processed as described previously ( 13, 14 )
using Mouse Gene 1.0 ST microarray (1M) (Affymetrix; Santa Clara, CA). RNA extracted from F2 mouse livers was hybridized onto the array. The R language/environment version 2.7.2 for data analyses was used to process the results, and affy V1.20.0 and preprocessCore V1.6 packages from Bioconductor were used to perform quality control and quantile normalization ( 16 ). The transcript analysis was performed with a custom CDF fi le ( 17 ) for Ensembl transcripts (ENST package V.11, 37,264 probesets) from the BrainArray (University of Michigan) website. Redun-dant probesets in the CDF fi le were removed, which produced a dataset with 34,406 probesets (or transcripts) for following analy-ses. Transcript levels from the microarray results were used to assess the difference in expression between the parental strains at each candidate gene locus, and for expression QTL and correla-tion in the F2 mice as described below. Microarrays are available at the Gene Expression Omnibus (GEO accession: GSE25322).
QTL analysis Linkage analysis was performed using R/qtl for HDL and all
34,406 transcripts in 282 F2 mice (v1.09-43) ( 18 ). A three-step analysis was applied. First, QTL analysis was investigated by adding sex as an additive covariate. Second, sex was added as an interac-tive covariate. The difference between the interactive and additive models is a test for sex-specifi c QTL: if the logarithm of the odds (LOD) difference between both models is higher than 2, it indi-cates that the QTL may be specifi c to males or females. Third, epistatic effects or interacting QTL were examined using the pairscan function. In addition, if the presence of two QTL on the same chromosome was suspected, two models were compared: a model with one QTL against a model with both QTL. If the LOD difference between both models was higher than 2, it indicated the presence of two QTL on the same chromosome. On chromosome 1, a high LOD score was found due to the Apoa2 locus. Therefore, a similar QTL analysis for each model was performed after add-ing the closest single nucleotide polymorphism (SNP) to Apoa2 (rs13476248) as a covariate. We renamed the phenotype HDL Apoa2 , HDL level adjusted for the Apoa2 locus. The Bayesian estimation of the 95% confi dence interval was used. All suggestive and signifi -cant QTL were included in a combined multi-locus model, and the proportion of the variation explained by each QTL was deter-mined through regression analysis. For the transcripts, QTL analysis was performed using the Haley Knott method with a 2 cM interval and sex as an additive covariate. Any gene that had a transcript with a suggestive LOD score within 20 cM of the gene location was con-sidered cis-regulated. Finally, QTL analysis in males and females was performed separately, on HDL (with and without adjustment for the Apoa2 locus) and on the transcripts. Thresholds for signifi cant ( P < 0.05) and suggestive ( P < 0.63) LOD scores were based on 1,000 permutations of the observed data for the autosomes, 17,940
other complex traits. However, the addition of systems ge-netic approaches allows for identifi cation of a group of genes that infl uences a complex trait as a group, not individually, and that usually represents a functional and biological pro-cess that infl uences the trait ( 11, 12 ).
We recently reported the results of the MRL/MpJxSM/J (MRLxSM) cross for triglycerides ( 13 ) and showed how our bioinformatics tool, in addition to genome-wide expression analysis and causality modeling, represents a powerful strat-egy for identifying candidate genes for QTL. Here, we report the results of our QTL analysis between inbred mouse strains MRL and SM for HDL-cholesterol level. We identifi ed several HDL QTL, and we applied our bioinformatics tool to add molecular evidence for the known genes Abca1 and Lipg and narrow the additional QTL to just a few candidate genes based either on the presence of nonsynonymous coding poly-morphisms segregating between the parental strains or ex-pression differences between the parental strains. In addition, we took advantage of the availability of the expression level of the transcripts in the F2 mice to 1 ) improve the QTL gene identifi cation by leveraging expression QTL (eQTL) and correlation, and 2 ) apply the weighted gene co-expression network analysis (WGCNA). WGCNA allowed us to identify gene modules of tightly connected and correlated genes that are themselves correlated with HDL-cholesterol ( 11, 12 ). The identifi cation of the underlying genetics of these mod-ules adds a new dimension in the identifi cation of genes regulating HDL-cholesterol at the genome-wide level and helped identify several candidate genes for the chromosome 11 HDL QTL through the combined use of bioinformatics and systems genetics.
MATERIALS AND METHODS
Mice MRL/MpJ (MRL) and SM/J (SM) mice were obtained from the
Jackson Laboratory (Bar Harbor, ME) and mated to produce F1 mice (by intercrossing MRL females with SM males) and recipro-cal F1 (RF1) mice (by intercrossing SM females with MRL males). Two hundred eighty-two F2 mice were produced by brother-sister mating of F1 mice. All mice were bred and housed in a climate-controlled pathogen-free facility at the Jackson Laboratory with a 12:12 h light-dark cycle. F1, RF1, and F2 males and females were weaned at 21 days and fed chow diet (LabDiet® 5K52, PMI Nutri-tional International; Bentwood, MO). Mice were euthanized at 13 weeks of age, and livers were collected as previously described ( 14 ). All experiments were approved by the Jackson Laboratory Animal Care and Use Committee.
HDL measurements Blood samples were obtained from 8-week-old mice fasted for
4 h prior to retro-orbital bleeding. Blood was collected with EDTA, and plasma was isolated by centrifugation within 2 h of the bleed. The serum was frozen at � 20°C for 1 week until mea-sured. HDL-cholesterol was measured using a synchron CX Delta System (Beckman Coulter; Fullerton, CA). The chemical method fi rst allows for the separation of HDL particles from non-HDL particles using detergents. The HDL particles are then solubilized, and the cholesterol reacts to the cholesterol esterase, cholesterol oxidase, and chromogens. The change in absorbance, measured at 560 nm, represents the H 2 O 2 released in these reactions, which is proportionate to the amount of HDL in the sample. The method
at INS
ER
M, on M
ay 20, 2012w
ww
.jlr.orgD
ownloaded from
.html http://www.jlr.org/content/suppl/2012/04/11/jlr.M025833.DC1Supplemental Material can be found at:
Candidate genes for HDL 1165
were not affected by an imprinted gene, a gene located on the X chromosome, or mitochondrial DNA.
Identifi cation of genomic loci underlying HDL levels in the F2 mice
Figure 1 and supplementary Fig. I represent the genome-wide scans for HDL, and Table 2 indicates positions of the QTL with a 95% confi dence interval, LOD scores for the relevant model, the closest marker, the high allele strain at the locus, and the mode of inheritance. The allele effect plots at each QTL are provided in supplemen-tary Fig. II. We identifi ed four main-effect HDL QTL: one each on [email protected] ( Hdlq15 ), [email protected], [email protected] ( Hdlq81 ), and [email protected] ( Fig. 1A and Table 2 ). For the QTL on chromosomes 1, 11, and 18, mice homozygous for the MRL allele had higher HDL levels, in an additive manner, compared with mice ho-mozygous for the SM allele (see supplementary Fig. II). On chromosome 10, mice homozygous for the MRL and SM alleles did not differ in HDL, but heterozygous mice had higher HDL than did MRL and SM homozygous mice (see supplementary Fig. II). We identifi ed a female-specifi c QTL on [email protected] (see supplementary Figs. I, II): females showed a free model of inheritance, with MRL and SM homozygous females carrying higher HDL com-pared with heterozygous females; males showed no such pattern. We performed pairscan analysis and identifi ed one QTL interacting with the chromosome 1 locus ( Hdlq15 ) on [email protected] ( Hdlq80 ). MRL mice had higher HDL compared with SM mice, but the mode of inheritance was dependent on the genotype of the chromosome1 locus ( Hdlq15 ): we observed a dominant, recessive, or additive mode of inheritance of the MRL allele if the mice were homozygous for the MRL allele, homozygous for the SM allele, or heterozygous, respectively (see sup-plementary Fig. II). The highest LOD score was ob-served for [email protected], corresponding to the apoA-II (Apoa2) locus. Wang et al. ( 25 ) previously identifi ed Apoa2 as the QTL gene for several crosses ( 10 ), and we expected an HDL QTL in this region based on the MRL and SM haplotype. Because the unusually strong effect of the Apoa2 locus on HDL level in this cross may mask other QTL, we adjusted the HDL level for the Apoa2 locus and
permutations for the X chromosome for HDL, and 10,000 permu-tations for the transcripts ( 19 ). The genotypes and phenotypes are publically available at the CGD website.
Bioinformatic approach Our bioinformatic approach has previously been described
( 9, 10 ). Briefl y, the list of genes located under each QTL was downloaded from BioMart. First, using the CGD imputed SNP database, each gene was searched for a nonsynonymous coding polymorphism that segregated between MRL and SM that was characterized as being “damaging” using SIFT ( 20 ). Second, a search was made for genes that showed evidence of a differential expression between MRL and SM and for which the expression was 1 ) cis -regulated, 2 ) signifi cantly different between MRL and SM in males or females, and 3 ) correlated with HDL Apoa2 . Any genes that were located under a QTL of interest (phenotype and module) and were based on differential gene expression were sub-ject to causal analysis using conditional genome scans as described previously ( 13, 21, 22 ). In this analysis, we use the conditional LOD score as a formal measure of conditional independence. Specifi -cally, for a phenotype, Y1, with a QTL, Q, a gene expression trait, T1, is used as a covariate in the QTL mapping. A decrease in the LOD score for a QTL of interest below the suggestive level after conditioning is evidence of a causal relationship.
Weighted gene co-expression network WGCNA was performed on expression results from the liver
from the 282 F2 mice using the WGCNA package implemented in R ( 12 ). If a gene had more than one probe set, the transcript with the highest connectivity (K int ) was selected, resulting in 22,120 tran-scripts representing unique genes. Due to the high number of tran-scripts, a blockwise approach was implemented in the WGCNA package where the genes were fi rst divided into sets of genes. Within each block, pairwise correlations were calculated and the adjacency matrix was calculated by raising each pairwise correlation to the power of the soft threshold � . To reach a minimum power of 0.85, � was determined to be equal to 2 in the F2 population and males only, and 3 in females only. The weighted topological over-lap matrix was then calculated and cut using the dynamic cutting tree to identify modules of highly correlated transcripts. The maxi-mum number of transcripts was set to 2,000 per block, the minimum number of genes per module was set to 100, and the minimum height for merging modules was set to 0.2. The module eigengenes derived from the program were tested for correlation with HDL and HDL Apoa2 ( 23 ). Gene onlology was used to identify common functional pathways between genes in the signifi cant modules.
Statistical analysis Parental strains, F1, RF1, and F2 mice were compared with
ANOVA for females and males separately (JMP 7.0; The SAS insti-tute, Cary, NC). The data were transformed using a Van Der Waerden normal score ( 24 ). Correlation between the transcript level and the phenotype (HDL Apoa2 ) was calculated using Pearson correlation in R.
RESULTS
HDL cholesterol characteristics of the parental strains, F1, RF1, and F2 mice
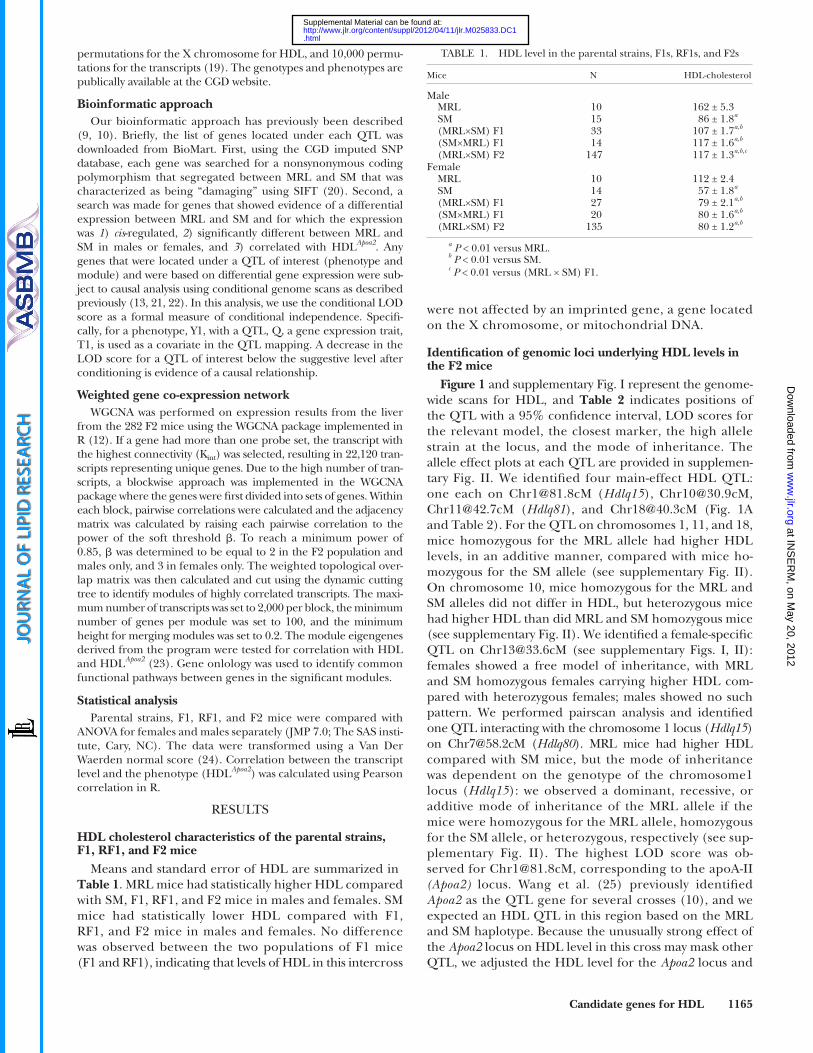
Means and standard error of HDL are summarized in Table 1 . MRL mice had statistically higher HDL compared with SM, F1, RF1, and F2 mice in males and females. SM mice had statistically lower HDL compared with F1, RF1, and F2 mice in males and females. No difference was observed between the two populations of F1 mice (F1 and RF1), indicating that levels of HDL in this intercross
TABLE 1. HDL level in the parental strains, F1s, RF1s, and F2s
Mice N HDL-cholesterol
Male MRL 10 162 ± 5.3 SM 15 86 ± 1.8 a (MRL×SM) F1 33 107 ± 1.7 a,b (SM×MRL) F1 14 117 ± 1.6 a,b (MRL×SM) F2 147 117 ± 1.3 a,b,c Female MRL 10 112 ± 2.4 SM 14 57 ± 1.8 a (MRL×SM) F1 27 79 ± 2.1 a,b (SM×MRL) F1 20 80 ± 1.6 a,b (MRL×SM) F2 135 80 ± 1.2 a,b
a P < 0.01 versus MRL. b P < 0.01 versus SM. c P < 0.01 versus (MRL × SM) F1.
at INS
ER
M, on M
ay 20, 2012w
ww
.jlr.orgD
ownloaded from
.html http://www.jlr.org/content/suppl/2012/04/11/jlr.M025833.DC1Supplemental Material can be found at:

1166 Journal of Lipid Research Volume 53, 2012
but could not confi rm this assumption ( � LOD < 2). We also performed QTL analysis in males and females separately ( Fig. 1B, C ) and, except for the chromosome 7 QTL, were able to confi rm all signifi cant QTL in at least one sex. The original peak at 31.1 cM was shifted to 22.1 cM in females and to 37.9 cM in males ( Table 2 and Fig. 1 ), indicating that multiple sex-specifi c QTL may be present in this region of chromosome 7. The low resolution of an F2 cross does not allow the separation and precise identifi cation of these QTL. Additional suggestive QTL were identifi ed in the sex-specifi c analysis but were not pursued, due to the low LOD score and low number of mice in this type of analysis. Over-all, in the combined sex analysis, we were able to explain 63.7% of the variation in HDL: sex explained 47.3% of the variation, and genetics explained 16.4% ( Table 3 ). Because of the large sex effect, we investigated males and females separately; the proportion of genetic variation explained by the QTL was increased to 49.9% and 59.5% for HDL in males and females, respectively ( Table 3 ).
Genomic dissection of the HDL QTL based on bioinformatics
We searched for candidate genes located under each signifi cant QTL on chromosomes 4, 7, 11, and 18 that either 1 ) carried a nonsynonymous coding polymorphism segregating between MRL and SM that was predicted to be damaging (structural or functional molecular evidence), or 2 ) exhibited expression that was signifi cantly different between MRL and SM, was cis -regulated, and that corre-lated with HDL Apoa2 (expression molecular evidence) in males and females. None of the QTL found in the entire 282 F2 cohort were also found at the signifi cance level in males or females separately ( Fig. 1 ). Therefore, the search was based on the entire cohort of 282 F2 mice. The list of candidate genes for each QTL is indicated in supplemen-tary Table I. Based on these bioinformatic data, we identi-fi ed 27, 112, 87, and 21 candidate genes from 449, 1,502, 744, and 198 genes located under the QTL on chromo-somes 4, 7, 11, and 18, respectively ( Fig. 2 and supple-mentary Table I). Additionally, for each gene showing an expression difference, we performed conditional linkage to estimate whether the expression was likely to be respon-sible for the QTL. Based on causality only, we reduced the number of candidate genes to 7, 3, 25, and 1 for chromo-somes 4, 7, 11, and 18, respectively ( Fig. 2 and supplemen-tary Table II). While none of the genes located under the HDL QTL on chromosomes 7 and 11 were known HDL genes, two of the QTL on chromosomes 4 and 18 harbor well-known HDL genes: Abca1 and Lipg , respectively.
Abca1 has been identifi ed as the QTL gene in four other crosses by our laboratory, based on a difference in expres-sion or a nonsynonymous coding polymorphism ( 8 ). Rese-quencing verifi ed that the damaging polymorphism did not segregate between MRL and SM (data not shown). Abca1 was shown to be cis -regulated (eQTL on Chr [email protected] cM, LOD = 4.1) and was differentially expressed between MRL and SM ( � 1.6 and � 1.7-fold change between MRL vs. SM, P = 0.003 and P = 0.001 in males and females, respectively) ( Fig. 3 and supplementary Table I). However, the expression
renamed this phenotype HDL Apoa2 . We used the closest marker (rs13476248), located at 79.3 cM, as an additive covariate in addition to sex ( Fig. 1 ). We identifi ed four ad-ditional QTL on [email protected], Chr3@23cM, Chr4@20cM ( Hdlq78 ), and [email protected] ( Hdlq79 ). The chromosome 11 and chromosome 18 loci ( Hdlq81 and Hdlq82 ) are located close to the previously identifi ed HDL QTL (within 2 cM) and are likely to be the same QTL. Two QTL found in the fi rst analysis before conditioning on Apoa2 were not detected in this analysis: the female-specifi c QTL on chromosome 13 and the QTL on chromosome 10. We did not identify any QTL interaction because of the low number of mice with each genotype combination ( Apoa2 combined with two inter-active QTL). We also suspected two QTL on chromosome 7,
Fig. 1. Genome-wide scan for HDL level in 282 F2 mice. Analysis was performed with sex as an additive covariate on HDL level (A) (solid line). Because of the high LOD score on chromosome 1, we adjusted the HDL for the chromosome 1 ( Apoa2 ) locus by adding the closest SNP to Apoa2 (rs13476248) as a covariate (dotted line). The results using sex as an interactive covariate are provided in supplementary Fig. I. QTL analysis was also performed in males (n = 147) (B) and females (n = 135) (C) separately for HDL (solid line) and HDL adjusted or the Apoa2 locus (dotted line). For each model, data were permuted 1,000 times to determine the genome-wide level of signifi cance. The threshold of signifi cance for chro-mosome X was determined with 17,940 permutations. The dashed line represents the threshold of ( P = 0.05) and the dot-dashed line represents the threshold for suggestive QTL ( P = 0.63).
at INS
ER
M, on M
ay 20, 2012w
ww
.jlr.orgD
ownloaded from
.html http://www.jlr.org/content/suppl/2012/04/11/jlr.M025833.DC1Supplemental Material can be found at:

Candidate genes for HDL 1167
responsible for the HDL and TG QTL in the NZB×NZW/LacJ (NZW) cross on a high-fat diet ( 27 ). Ppargc1b knock-out mice show no difference in HDL when fed a chow diet. Because the MRL×SM F2 mice were fed chow ( 28 ), we consider Ppargc1b to be an unlikely QTL gene for this cross. Lipg is located at 75 Mb on chromosome 18, and a change in expression is thought to be responsible for the QTL of three crosses (B6xD2, NZB/BINJxSM/J [NZBxSM], B6xC3H) ( 26 ). Because of the known role of Lipg in HDL regulation and its close location to the MRL×SM chro-mosome 18 QTL, we investigated whether it could be responsible for our QTL. We investigated the microarray results, but did not fi nd a signifi cant difference in expression between MRL and SM or any eQTL for Lipg (see supplemen-tary Table I). However, we identifi ed a nonsynonymous coding polymorphism (V118I) through resequencing of the coding regions ( Fig. 3 ). This polymorphism is highly
of Abca1 was not found to be causal of the chromosome 4 HDL QTL (see supplementary Table II), and the expres-sion of Abca1 only correlated with HDL Apoa2 in females ( r = 0.24, P = 0.005), not in the entire F2 population (see supplementary Table I). Therefore, while we found some evidence for Abca1 as a candidate gene for the chromosome 4 HDL QTL, we suspect that other genes located on chromosome 4 proximal are yet to be identi-fi ed, as indicated in supplementary Table I.
On chromosome 18, eight crosses have previously iden-tifi ed an HDL QTL on distal chromosome 18 ( 26 ). Two well-known lipid genes are present in this region: Ppargc1b (peroxisome proliferative activated receptor � , coactivator 1 � ) and Lipg (lipase, endothelial). Ppargc1b , located at 61.5 Mb, carries an amino acid change (D575N) ( Fig. 2 and supplementary Table I). The polymorphism is pre-dicted to be tolerated (SIFT) and is hypothesized to be
TABLE 2. Genome-wide QTL for HDL in the 282 MRL/MpJ × SM/J F2 mice
QTL a ChromosomePeak (cM)(95% CI) b Peak (Mb)(95% CI) b
LOD score (adjusted
LOD) c Closest marker
High strain; mode of
inheritance Sex d Overlapping QTL e
— 1 f 53.6 (25.6–77.6) 124.5 (47.2–172.8) ns (2.5) rs13476086 MRL, Dom MF New Hdlq15 1 g 81.6 (76.6–83.6) 177.6 (170.5–181.8) 31.3 (ns) rs13476248 MRL, Add MF, M, F Apoa2 ( 25 )— 3 f 32.6 (2.0–76.8) 71.3 (3.8–151.2) ns (2.2) rs6351657 MRL, Add MF New— 4 h 6.6 (2–32.7) 15.2 (3.5–59.6) 2.4 (2.8) rs13477566 SM, Rec F C57BL/6J × NOD/ShiLtJ i Hdlq78 4 f 20.0 (2.0–31.2) 38.6 (3.5–58.3) ns ( 3.8 ) rs3702229 SM, Add MF, M DBA/2J × CAST/EiJ ( 46 )
CAST/EiJ × 129S1/ SvImJ ( 47 )
— 5 h 89.1 (38–89.1) 149.8 (71.9–149.8) 2.7 (ns) rs3710365 MRL, Dom M New— 6 h 25.4 (15.5–62.4) 52 (36–127.5) ns (2.7) rs3696518 MRL, SM,
DomF NZB/BINJ × SM/J ( 35 )
B6 x NOD/ShiLtJ i Hdlq79 7 f 31.1 (14.1–62.1) 56.3 (27.0–124.1) ns ( 4.6 ) rs3663313 MRL, Add MF, F New Hdlq80 7 j 58.2 (na) 118.6 (ns) ns rs3711721 — MF C57BL/6J × NOD/ShiLtJ i — 9 h 72.2 (16.8–72.2) 120.9 (31.1–120.9) ns (2.2) rs13480455 MRL, Add M New— 10 fg 30.9 (10.9–40.9) 60.0 (23.4–82.6) 2.5 (ns) rs13480652 Het, — MF, M New Hdlq81 11 fg 43.7 (34.7-55.7) 71.7 (56.9–90.6) 2.4 (4.1 ) rs3024185 MRL, Dom MF, F C57BL/6J × C3H/HeJ ( 48 )— 13 h 33.6 (25.3–49.3) 63.8 (49.6–96.0) 3.8 (ns) rs13481811 MRL/SM, —
(Female)MF, F C57BL/6J.C-H25c x
BALB/cJ ( 49 )— 14 h 18.9 (10.3–32.9) 31.5 (20.5–62.1) 3.3 (3.4) rs13482172 SM, Add F SM/J × A/J ( 50 ) Hdlq82 18 fg 42.3 (32.3–54.0) 68.6 (58.3–81.0) 3.5 ( 4.4) rs29559992 MRL, Dom MF, M NZB/BINJ × NZW/LacJ ( 51 )
C57BL/6J × C3H ( 48 ) C57BL/6J × DBA/2J ( 52 )
— 19 h 50.6 (5–50.6) 55.1 (6.5–55.1) 2.6 (ns) rs3654713 MRL, Dom F
Chr, chromosome; CI, confi dence interval; ns, nonsignifi cant; Het, heterozygotes; M, males; F, females; MF, males + females. a HDL QTL were named following the recommendations of MGI ( 53 ). b 95% CI. Genome-wide signifi cance levels were determined by permuting the observed data 1,000 times. CI was calculated with the Bayesian
method. In the combined sex analysis, for the autosomes, the signifi cant and suggestive thresholds were 3.6 and 2.2, respectively. For the X chromosome, the signifi cant and suggestive thresholds were 3.4 and 2.0, respectively. In the sex-specifi c analysis, for the autosomes, the signifi cant and suggestive thresholds were 3.6 and 2.2, respectively in males and females. For the X chromosome, the signifi cant and suggestive thresholds were 2.7 and 1.4, respectively, in males and 2.8 and 1.5, respectively, in females. When the QTL was identifi ed in both males and females (MF) and in one sex only (sex-specifi c QTL), we only report the location of the peak and 95% CI in the males + females population.
c LOD scores were calculated with sex as an additive covariate in the males + females (MF) analysis except for the QTL on chromosome 13, where sex was added as an interactive covariate. HDL was further adjusted for the Apoa2 locus on chromosome 1 by adding rs13476248 as an additive covariate. The LOD scores in parentheses indicate the LOD score after the Apoa2 locus adjustment. Bold indicates signifi cant QTL.
d QTL analysis was run in males (M) and females (F) separately. MF indicates that the QTL was found in the entire F2 population using sex as an additive or interactive covariate. If the peak of the QTL in the combined sex analysis was also observed in the sex-specifi c analysis, the sex in which the QTL was found is indicated.
e Overlapping QTL: Peaks within 10 Mb of the MRL×SM peak were selected. The high HDL allele is indicated in bold. f HDL QTL after adjustment of HDL with the Apoa2 locus on chromosome 1 by adding rs13476248 as an additive covariate. Sex was added as
an additive covariate in the males + females population. g HDL QTL prior to adjustment of HDL with the Apoa2 locus on chromosome 1. Sex was added as an additive covariate in the males + females
population. h Sex-specifi c QTL. QTL identifi ed by either adding sex as an additive and interactive covariate in the males + females population or by QTL
analysis in males or females only. i Su et al., unpublished data. j Interactive QTL.
at INS
ER
M, on M
ay 20, 2012w
ww
.jlr.orgD
ownloaded from
.html http://www.jlr.org/content/suppl/2012/04/11/jlr.M025833.DC1Supplemental Material can be found at:

1168 Journal of Lipid Research Volume 53, 2012
with HDL Apoa2 ( P < 0.05) ( Table 4 ). The brown module in the F2 population was composed of 770 genes; 528 of these were common to the male yellow module and 227 were common to the female pink module (see supple-mentary Tables III, IV). We investigated the functionality of the module correlated with HDL Apoa2 using Gene Ontology ( Table 5 ). The F2 brown, male yellow, male salmon, and female pink modules were enriched for genes related to the immune system with P Bonferoni between 5.03 × 10 � 10 and 2.74 × 10 � 45 ( Table 5 ). In females, the royal blue module was enriched with genes involved in sterol and lipid biosynthetic process with P Bonferonni be-tween 2.07 × 10 � 18 and 3.82 × 10 � 23 . In males, the dark-green module was enriched with genes involved in the FA biosynthetic process ( P Bonferoni = 0.006) and the light-green module was enriched with genes involved in cell adhesion ( P Bonferoni = 2.7 × 10 � 8 ).
Genomic dissection of the HDL-related module QTL and identifi cation of candidate genes for the module and the chromosome 11 HDL QTL
We investigated the underlying genetics of the modules correlated with HDL Apoa2 in the F2 mice and in males and fe-males only by performing a QTL analysis using the module eigengene as the phenotype ( Table 6 ). We identifi ed a sig-nifi cant QTL on chromosome 11 for which the confi dence interval overlaps between the brown module in males and females (Chr [email protected] cM, LOD = 9.0), the yellow module in males (Chr [email protected] cM, LOD = 5.1), and the pink module in females (Chr [email protected], LOD = 6.9) ( Fig. 4 ). The QTL plot indicates multiple peaks on chromosome 11, with one common overlapping peak at about 45 cM ( Fig. 4 ). In males only, we also identifi ed two signifi cant QTL on Chr [email protected] cM (LOD = 5.3) and Chr [email protected] cM (LOD = 5.7) for the
conserved and has not been reported previously ( Fig. 3 ). V118I is also estimated to be damaging (using Polyphen and SIFT). The isoleucine is specifi c to the SM strain, whereas all the other strains involved in a cross that showed an HDL QTL on chromosome 18 carry a valine ( Fig. 3 ). Therefore, we hypothesize that this polymorphism is responsible for the chromosome 18 HDL QTL from the MRL×SM cross in addition to the HDL QTL from the NZB×SM and LG×SM crosses ( 26, 29 ). Further in vitro experiments will be nec-essary to validate the functionality of the polymorphism.
WGCNA We performed gene co-expression network analysis on
22,120 transcripts from the liver microarray in the 282 F2 mice, males only and females only ( 12 ). Each transcript represented a unique gene and was selected based on high connectivity if a gene was represented by more than one transcript on the microarray. We identifi ed 14, 23, and 20 co-expression modules in the F2, male, and female cohorts respectively ( Table 4 ). The higher numbers of modules in the male- and female-only populations may be explained by the lower numbers of mice compared with the entire F2 population. Each module varied in size from 185 to 5,059 genes in the F2 mice, from 123 to 6,354 in males, and from 122 to 5,112 in females. We identifi ed 8,562, 7,446, and 8,266 genes that did not cluster in any modules in the F2, male, and female cohorts, respectively. We then examined the correlation between the eigengene of the module with HDL and HDL Apoa2 . We identifi ed two modules in the entire cohort (brown) that negatively and signifi -cantly correlated with HDL Apoa2 ( r = � 0.18, P = 0.002) ( Table 4 ). We also identifi ed four modules in males (dark-green, light-green, salmon, and yellow) and two modules in females (pink and royal blue) that correlated
TABLE 3. Regression ANOVA for HDL in the F2 mice
Sex a Chromosome (cM) b df % Variance c F P
M+F Sex 1 47.3 648.6 <2.0 × 10 � 16 Chr1@54cM 2 0.8 5.6 4.2 × 10 � 3 [email protected] 2 10.9 74.8 <2.0 × 10 � 16 [email protected] 2 0.9 6.5 1.7 × 10 � 4 [email protected] 2 1.4 9.9 6.9 × 10 � 6 [email protected] 2 0.9 6.5 1.7 × 10 � 3 [email protected] 2 0.8 5.8 3.2 × 10 � 3 [email protected] 2 0.7 5.2 1.0 × 10 � 3 Total 15 63.7
M [email protected] 2 33.5 49.0 <2.0 × 10 � 16 [email protected] 2 3.5 5.1 7.2 × 10 � 3 [email protected] 2 5.2 7.5 7.8 × 10 � 4 [email protected] 2 4.2 6.1 2.8 × 10 � 3 [email protected] 2 3.5 5.1 7.0 × 10 � 3 Total 8 49.9
F [email protected] 2 42.2 75.4 <2.0 × 10 � 16 [email protected] 2 4.2 7.5 8.1 × 10 � 4 [email protected] 2 4.3 7.7 6.9 × 10 � 4 [email protected] 2 4.5 8.0 5.4 × 10 � 4 [email protected] 2 4.2 7.5 8.6 × 10 � 4 Total 12 59.4
a Regression analysis was performed in the entire F2 population ( n = 282) using sex as an additive covariate or in males and females separately.
b Sex-specifi c positions were used in the regression analysis for males and females only as provided on the CGD website.
c All QTL and interactive QTL were fi tted into a model for HDL. Any QTL that did not reach the threshold of 0.001 were removed.
at INS
ER
M, on M
ay 20, 2012w
ww
.jlr.orgD
ownloaded from
.html http://www.jlr.org/content/suppl/2012/04/11/jlr.M025833.DC1Supplemental Material can be found at:

Candidate genes for HDL 1169
that 1 ) the brown module is genetically determined by a major overlapping QTL on chromosome 11, also found in males (yellow module) and females (pink module) ( Fig. 4 ), 2 ) their module eigengenes are signifi cantly
dark-green module, and one signifi cant QTL on Chr 17@16 cM (LOD = 5) for the salmon module ( Table 4 ). No sig-nifi cant QTL was identifi ed for the light-green module in males and the royal-blue module in females. Considering
Fig. 2. Genomic dissection of the signifi cant HDL QTL adjusted for Apoa2 using our bioinformatics tool. Panels show the QTL plots for chromosomes 4 (A), 7 (B), 11 (C), and 18 (D) for HDL (solid line) and HDL Apoa2 (dotted line). Each 95% confi dence interval is indicated with a thick black line. Using bioinformat-ics, we reduced the confi dence interval to a few genes for each QTL based on the presence of molecular evidence indicated below each QTL plot: either a nonsynonymous coding polymorphism between MRL and SM (upper line) or a differential expression of a gene between the strains (gene differentially expressed between MRL and SM, gene expression cis -regulated and correlated with HDL Apoa2 ) (lower line). Each gene is indicated at its physical location by a vertical line; the total number of genes is indicated as well. Each star indicates a gene for which the expression was found to be causal to the QTL; the total number of “causal” genes is indicated in parentheses. Some of these stars overlap due to the close proximity of the genes and the scale of the fi gure.
Fig. 3. Lipg amino acid sequence alignment. The sequences were obtained from the University of Califor-nia at Santa Cruz website. The novel polymorphism is indicated in bold.
at INS
ER
M, on M
ay 20, 2012w
ww
.jlr.orgD
ownloaded from
.html http://www.jlr.org/content/suppl/2012/04/11/jlr.M025833.DC1Supplemental Material can be found at:

1170 Journal of Lipid Research Volume 53, 2012
TA
BL
E 4
. W
GC
NA
usi
ng
22,1
20 tr
ansc
ript
s in
the
282
F2 m
ice,
mal
es a
nd
fem
ales
sep
arat
ely
Mal
es +
fem
ales
Mal
esFe
mal
es
Mod
ule a
No.
gen
esC
orre
lati
on b R
, P
Mod
ule a
No.
gen
esC
orre
lati
on R
, P
Mod
ule a
No.
gen
esC
orre
lati
on R
, P
HD
LH
DL
apoa
2 H
DL
HD
L ap
oa2
HD
LH
DL
apoa
2
Pin
k40
40.
073
(0.2
)0.
019
(0.8
)Tu
rquo
ise
6,35
40.
11 (
0.2)
0.04
9 (0
.6)
Yello
w48
90.
12 (
0.2)
0.08
1 (0
.3)
Bro
wn
770
� 0.
62 (
0.3)
-0.1
8 (0
.002
) B
row
n80
80.
056
(0.5
) �
0.02
1 (0
.8)
Bla
ck35
80.
02 (
0.8)
0.12
(0.
2)R
ed46
10.
036
(0.6
) �
0.06
6 (0
.3)
Gre
en-y
ello
w31
50.
02 (
0.8)
� 0.
053
(0.5
)G
rey6
015
20.
022
(0.8
)0.
093
(0.3
)B
lue
3,84
9 �
0.04
(0.
5)0.
025
(0.7
)B
lack
399
� 0.
069
(0.4
) �
0.13
(0.
1)M
agen
ta33
70.
08 (
0.4)
0.04
6 (0
.6)
Salm
on18
5 �
0.00
3 (1
)0.
017
(0.8
)M
idn
igh
t blu
e27
0 �
0.08
7 (0
.3)
� 0.
07 (
0.4)
Blu
e3,
351
0.03
5 (0
.7)
0.06
4 (0
.5)
Mag
enta
368
0.04
2 (0
.5)
� 0.
046
(0.4
)C
yan
278
� 0.
13 (
0.1)
� 0.
099
(0.2
)G
reen
452
0.02
7 (0
.8)
0.07
9 (0
.4)
Bla
ck40
7 �
0.05
4 (0
.4)
� 0.
078
(0.2
)Pi
nk
399
� 0.
14 (
0.1)
� 0.
068
(0.4
)M
idn
igh
t blu
e23
10.
075
(0.4
) �
0.03
6 (0
.7)
Gre
en-y
ello
w23
1 �
0.02
1 (0
.7)
� 0.
029
(0.6
)D
ark-
red
123
� 0.
01 (
0.9)
0.07
6 (0
.4)
Gre
en-y
ello
w30
50.
053
(0.5
) �
0.11
(0.
2)G
reen
591
0.05
3 (0
.4)
� 0.
006
(0.9
)M
agen
ta36
50.
12 (
0.1)
0.00
(1)
Pin
k34
0 �
0.05
9 (0
.5)
-0.2
6 (0
.003
) Tu
rquo
ise
5,05
90.
045
(0.4
)0.
011
(0.8
)D
ark-
gree
n10
90.
031
(0.7
) 0.
28 (
5.0E
� 4 )
Bro
wn
533
� 0.
015
(0.9
) �
0.00
3 (0
.7)
Yello
w69
60.
037
(0.5
) �
0.13
(0.
8)Ta
n30
50.
065
(0.4
)0.
092
(0.3
)C
yan
262
� 0.
031
(0.7
) �
0.01
1 (0
.9)
Purp
le34
50.
014
(0.8
) �
0.01
(0.
9)R
oyal
blu
e13
80.
023
(0.8
)0.
15 (
0.06
)L
igh
t-yel
low
152
0.05
8 (0
.5)
� 0.
043
(0.6
)Ta
n19
20.
001
(1)
� 0.
06 (
0.3)
Red
418
0.00
7 (0
.9)
0.11
(0.
2)L
igh
t-gre
en15
2 �
0.00
7 (0
.9)
� 0.
033
(0.7
)B
lue
1,76
0 �
0.07
8 (0
.3)
0.02
8 (0
.7)
Tan
270
0.11
(0.
2)0.
022
(0.8
)G
reen
443
� 0.
12 (
0.1)
� 0.
063
(0.4
)Tu
rquo
ise
5,11
2 �
0.03
6 (0
.7)
� 0.
059
(0.5
)D
ark-
turq
uois
e10
00.
054
(0.5
)0.
037
(0.7
)R
ed44
60.
018
(0.8
)0.
0054
(1)
Gre
y60
177
� 0.
089
(0.3
) �
0.11
(0.
2)Sa
lmon
264
0.04
3 (0
.6)
0.06
2 (0
.5)
Lig
ht-c
yan
239
� 0.
062
(0.5
)0.
031
(0.7
)R
oyal
blu
e12
20.
099
(0.3
) 0.
17 (
0.05
) L
igh
t-yel
low
147
� 0.
18 (
0.04
) �
0.11
(0.
2)L
igh
t-cya
n20
2 �
0.07
5 (0
.4)
� 0.
025
(0.8
)Pu
rple
358
0.09
(0.
3)0.
029
(0.7
)Pu
rple
324
� 0.
022
(0.8
)0.
054
(0.5
)L
igh
t-gre
en15
8 �
0.09
6 (0
.2)
-0.1
7 (0
.04)
Sa
lmon
299
� 0.
062
(0.5
) -0
.23
(0.0
06)
Yello
w71
2 �
0.1
(0.2
) -0
.19
(0.0
2)
a Mod
ules
iden
tifi
ed u
sin
g th
e W
GC
NA
usi
ng
the
22,1
20 t
ran
scri
pts.
If
mor
e th
an o
ne
tran
scri
pt r
epre
sen
ted
a ge
ne,
th
e tr
ansc
ript
wit
h t
he
hig
hes
t co
nn
ecti
vity
in t
he
282
F2 m
ice
data
set
was
ch
osen
. Eac
h m
odul
e w
as a
ssig
ned
a c
olor
. b C
orre
lati
on b
etw
een
the
eige
nge
nes
of e
ach
mod
ule
and
HD
L a
nd
HD
L A
poa2
( 12
). S
ign
ifi ca
nt c
orre
lati
ons
are
indi
cate
d in
bol
d. T
he
gen
es th
at d
o n
ot c
lust
er w
ith
an
y m
odul
es a
re a
ssig
ned
to
the
gray
mod
ule,
wh
ich
is n
ot r
epre
sen
ted
her
e.
at INS
ER
M, on M
ay 20, 2012w
ww
.jlr.orgD
ownloaded from
.html http://www.jlr.org/content/suppl/2012/04/11/jlr.M025833.DC1Supplemental Material can be found at:

Candidate genes for HDL 1171
ily), Fbxo39 (F-box protein 39), and Slfn5 (schlafen 5). Although none of these genes were found to be causal for the chromosome 11 HDL Apoa2 QTL, our criteria are strin-gent, and thus we cannot exclude the possibility that one of the candidate genes is responsible for both the HDL Apoa2 QTL and the brown mQTL. Additionally, we searched for candidate genes for the mQTL found in males (yellow) and females (pink) separately based on conditional genome scans (see supplementary Table VI). We identifi ed fi ve genes that were also found to be causal to the chromosome 11 HDL Apoa2 QTL in males or females: Mpdu1 (mannose-P-dolichol utilization defect 1), Rnasek (RNase, RNase K), Fbxo39 (F-box protein 39) in males, and Ulk2 (Unc-51 like kinase 2 ( C. elegans )) and Gltpd2 (glycolipid transfer protein
correlated with HDL Apoa2 ( Table 4 ), and 3 ) this major mod-ule QTL overlaps with a signifi cant HDL Apoa2 QTL ( Table 5 ), we used conditional genome scans to investigate the genes located under the chromosome 11 QTL as potential ma-jor players in HDL metabolism. For the chromosome 11 HDL Apoa2 QTL, we had originally identifi ed 25 candidate genes based on conditional analysis ( Fig. 2 , Table 7 and supplementary Table I). Among the 770 genes from the brown module, 34 were located in the 95% confi dence inter-val of the chromosome 11 brown mQTL (see supplementary Table V). By conditioning the expression of the 34 tran-scripts on the eigengene, we identifi ed three genes for which the expression was “causative” of the brown mQTL on chro-mosome 11 ( Table 7 ): Igrm (immunity-related GTPase fam-
TABLE 5. Gene Ontology results of the modules correlated with HDL Apoa2
Modules GO reference a GO functions annotationTerm
ontology b Number of molecules Enrichment
2.30E-22Bonferoni P Males and FemalesBrown GO:0002376 Immune system process BP 129 3.04E-49 2.74E-45
GO:0006955 Immune response BP 80 1.06E-34 9.51E-31GO:0002682 Regulation of immune
system processBP 63 2.97E-29 2.68E-25
GO:0006952 Defense response BP 73 1.61E-27 1.45E-23GO:0001775 Cell activation BP 58 2.19E-23 1.97E-19
MalesDark-green GO:0006633 FA biosynthetic process BP 7 6.83E-07 0.006
GO:0006631 FA metabolic process BP 9 7.90E-07 0.007Light-green GO:0005576 Extracellular region CC 1527 1.81E-26 1.63E-22
GO:0031012 Extracellular matrix CC 282 2.91E-26 2.62E-22GO:0005578 Proteinaceous extracellular
matrixCC 262 5.90E-26 5.32E-22
GO:0044421 Extracellular region part CC 625 7.99E-25 7.21E-21GO:0007155 Cell adhesion BP 551 2.99E-12 2.70E-08
Salmon GO:0002376 Immune system process BP 43 5.58E-14 5.03E-10GO:0019882 Antigen processing and
presentationBP 13 6.58E-14 5.93E-10
GO:0048002 Antigen processing and presentation of peptide antigen
BP 11 1.53E-13 1.38E-09
GO:0050776 Regulation of immune response
BP 21 6.92E-13 6.24E-09
GO:0002682 Regulation of immune system process
BP 26 7.51E-13 6.77E-09
Yellow GO:0002376 Immune system process BP 745 1.00E-34 9.01E-31GO:0006955 Immune response BP 403 2.15E-23 1.94E-19GO:0009897 External side of plasma
membraneCC 148 1.67E-17 1.51E-13
GO:0001775 Cell activation BP 318 1.99E-17 1.79E-13GO:0009986 Cell surface CC 226 2.21E-16 2.00E-12
FemalesPink GO:0002376 Immune system process BP 68 2.50E-30 2.25E-26
GO:0048002 Antigen processing and presentation of peptide antigen
BP 18 1.33E-25 1.20E-21
GO:0006955 Immune response BP 46 1.42E-24 1.28E-20GO:0019882 Antigen processing and
presentationBP 20 3.81E-24 3.44E-20
GO:0019884 Antigen processing and presentation of exogenous antigen
BP 14 1.29E-18 1.16E-14
Royal blue GO:0016126 Sterol biosynthetic process BP 16 4.24E-27 3.82E-23GO:0008610 Lipid biosynthetic process BP 27 1.50E-24 1.35E-20GO:0016125 Sterol metabolic process BP 18 9.72E-24 8.76E-20GO:0006694 Steroid biosynthetic process BP 17 1.53E-22 1.38E-18GO:0006695 Cholesterol biosynthetic process BP 13 2.30E-22 2.07E-18
a Bioconductor was used to identify common functions among the genes from the brown module in the F2 mice. Only the top fi ve GO functional annotations are indicated here.
b BP, biological process; CC, Cellular Component.
at INS
ER
M, on M
ay 20, 2012w
ww
.jlr.orgD
ownloaded from
.html http://www.jlr.org/content/suppl/2012/04/11/jlr.M025833.DC1Supplemental Material can be found at:

1172 Journal of Lipid Research Volume 53, 2012
parental strains, and that are cis -regulated, correlate with HDL, and are likely to be causal to the QTL.
By choosing two strains with highly different levels of HDL-cholesterol, we ensured that we would identify the most-important regulator of HDL-cholesterol between these two strains, but we could not predict the number of QTL we would identify. We expected a QTL on distal chromosome 1 for HDL-cholesterol, inasmuch as MRL and SM differ in their haplotype at the locus ( 25 ). However, the LOD score was un-usually strong. The adjustment of HDL with the Apoa2 locus allowed us to identify additional QTL that may have been masked by the chromosome 1 QTL. This approach con-fi rmed the suggestive QTL found in the analysis before con-ditioning (chromosomes 11 and 18) and identifi ed additional QTL on chromosomes 3 and 4. While the QTL on chromo-somes 11 and 18 were found both before and after adjust-ment for Apoa2 , however, the chromosome 10 QTL and the female-specifi c QTL on chromosome 13 were not replicated after the adjustment. We hypothesize that the lower nonsig-nifi cant LOD score after adjustment for Apoa2 may refl ect an interaction between the Apoa2 locus and the chromosome 10 QTL and between the Apoa2 locus and the chromosome 13 QTL. This interaction would not have been statistically de-tectable prior to adjustment because of the strong LOD score at the Apoa2 locus. In addition, a strong QTL may indicate the presence of more than one QTL gene. Recently, Lawson et al. ( 30 ) reported the results of an F16 generation between LG/J (LG) and SM/J. LG is closely related to MRL. In this report, two different QTL were identifi ed on chromosome 1 at 173.1 and 179.1 Mb for total cholesterol. While the fi rst QTL at 173.1 Mb is likely to be due to the Apoa2 gene, the authors identifi ed several candidate genes for the second QTL. The resolution of our cross (F2) does not allow us to separate these two possible QTL on chromosome 1, but the large LOD score may be an indication of more than one QTL gene at this locus. In fact, we identifi ed Fh1 at 177.5 Mb as a candidate gene for the dark-green HDL-related module in males. This gene had previously been identifi ed as a candidate gene in an NZB/BINJ × SM cross based on differ-ential gene expression and protein abundance between the parental strains ( 31 ) and could be an additional candidate gene for the chromosome 1 HDL QTL.
As previously shown in our study on triglycerides using the same mouse F2 cross ( 13 ), the identifi cation of a causal QTL gene is based on a bioinformatic approach that con-siders the molecular basis of a QTL to be a differential
domain containing 2) in females (see supplementary Table VI). Finally, we identifi ed two candidate genes for the chromosome 1 dark-green mQTL ( Fh1 , fumarate hydratase 1 and Degs1 , degenerative spermatocyte homolog 1 ( Droso-phila )) and two genes for the chromosome 17 salmon mQTL ( Slc37a1 , solute carrier family 37 (glycerol-3-phosphate trans-porter), member and H2-T23 , histocompatibility 2, T region locus 23) in males (see supplementary Table VI). None of these genes are known to be involved in HDL metabolism.
DISCUSSION
In this study, we performed QTL mapping for HDL us-ing an intercross between two strains with highly different HDL levels, MRL and SM. We identifi ed eight new QTL on chromosomes 1 (middle), 3, 4, 7 (proximal), 10, 11, 13, and 18, and confi rmed two QTL on chromosomes 1 (distal) and 7 (distal). We then applied our bioinformatic tool to identify candidate genes located under the stron-gest QTL on chromosomes 4, 7, 11, and 18. We specifi cally searched for genes that either carry a nonsynonymous coding polymorphism or differ in expression between the
Fig. 4. Chromosome 11 QTL plot for HDL Apoa2 and mQTL plots for the brown (males and females), yellow (males), and pink (fe-males) modules. chromosome 11 QTL for HDL Apoa2 level and the brown mQTL in 282 F2 mice are indicated in solid and dotted lines, respectively. chromosome 11 mQTL for the yellow module in males and the pink module in females are indicated by the dashed-dotted and dashed lines, respectively. QTL analysis is described in Fig.1 . The confi dence interval of the HDL Apoa2 is indicated by a thick black line.
TABLE 6. Module QTL (mQTL) correlated with HDL Apoa2
Sex Modules mQTL a peak (95% CI) (cM) LOD
Males + females Brown Chr [email protected] (26.8–57.8) 9.0Males Dark-green Chr [email protected] (68.6–88.6) 5.3
Chr [email protected] (30.6–52.6) 5.7Light-green None nsSalmon Chr [email protected] (7.9–23.9) 4.3Yellow Chr [email protected] (16.8–57.8) 5.1
Females Pink Chr [email protected] cM (26.8–57.8) 6.9Royal blue None ns
a For the modules signifi cantly correlated with HDL Apoa2 , QTL analysis was run using the module eigengene as the phenotype. Signifi cant mQTL (LOD > 3.7 for males + females and males only; LOD > 3.6 for females only) are reported here with the 95% confi dence interval and the LOD score.
at INS
ER
M, on M
ay 20, 2012w
ww
.jlr.orgD
ownloaded from
.html http://www.jlr.org/content/suppl/2012/04/11/jlr.M025833.DC1Supplemental Material can be found at:

Candidate genes for HDL 1173
By combining traditional genetics approaches and system genetics, we were able to add evidence to candidate genes for the chromosome 11 HDL QTL based on expression differ-ences between the parental strains and causality of not only the HDL QTL but also the HDL-related module QTL. Causal analysis leverages the natural variation that occurs within the segregating populations and the unidirectional relationship between genotype and phenotype. Analysis of this type is widely used to sort out the relationships between complex traits, using QTL as a causal anchor ( 37 ). Conditional ge-nome scans are a convenient test for causality within the QTL mapping framework ( 22 ). We adopted the genome-wide signifi cance threshold for the causality test, which is strin-gent. A large drop in LOD score upon conditioning should be viewed as suggestive of a causal relationship.
In our study, we identifi ed a module correlated with HDL and enriched for genes involved in infl ammatory response. Proteomics studies have previously identifi ed proteins involved in infl ammation, such as complement activation proteins, on HDL particles ( 38 ). Among their functions, HDL particles have the capacity to inhibit the adhesion of monocytes to the endothelium and express anti-infl ammatory properties (as reviewed in Ref. 39 ).
expression of a gene or a nonsynonymous coding poly-morphism segregating between the parental strains ( 25, 32 ). With this approach, we confi rmed known candidate genes. For instance, the HDL QTL on chromosome 18 has been identifi ed in multiple mouse crosses ( 26 ); in addi-tion, it is located in orthologous regions in baboons and humans ( 33, 34 ). A difference in expression in Lipg ex-plained the chromosome 18 HDL QTL in at least three mouse crosses (B6×D2, NZB×SM, B6×C3H) ( 26 ). How-ever, we identifi ed a novel nonsynonymous coding poly-morphism that is probably responsible for the chromosome 18 QTL in the MRL×SM cross as well as the differences between the SM×NZB ( 35 ) and LG×SM crosses ( 30 ). In addition, although our approach is a powerful way to iden-tify potential QTL candidate genes, our study refl ects the complexity of the identifi cation of QTL genes. The ge-nomic dissection of QTL is usually based on the examina-tion of SNP and gene expression databases ( 36 ) and relies on the accuracy of the comprehensive public databases. In our study, this type of straightforward examination would have missed the novel polymorphism. Therefore, while our approach is powerful, its success requires careful inter-pretation of the results of the bioinformatics tools.
TABLE 7. Conditional linkage analysis for the HDL QTL and module QTL on chromosome 11
Gene a Pos. (Mb)
HDL Apoa2 QTL a,b eQTL c,d Brown mQTL a,b eQTL c,d
LOD LOD a,d,j, b Loc.(cM) LOD LOD a,d,j, c LOD LOD adj b Loc.(cM) LOD LOD adj c
Irgm 48.7 4.1 na na na na 9.0 1.5 [email protected] 11.4 2.7 Snap47 59.2 1.1 [email protected] 75.7 72.8 na na na na Flcn 25.6 2.7 11@39 12.4 10.9 na na na na Atpaf2 60.2 1.8 [email protected] 43.5 41.3 na na na na Llgl1 60.5 1.6 [email protected] 37.5 35.1 na na na na Flii 60.5 2.1 [email protected] 53.9 51.9 na na na na Smcr7 60.5 1.2 [email protected] 41 38.3 na na na na Smcr8 60.6 1.6 [email protected] 22.3 19.9 na na na na Shmt1 60.6 2 [email protected] 34.3 32.3 na na na na Ulk2 61.6 1.6 [email protected] 74.3 71.8 na na na na 2310004I24Rik 66.9 1.9 [email protected] 26.5 24.3 na na na na Rpl26 68.7 2.1 [email protected] 62.2 60.2 na na na na Chd3 69.2 0.9 [email protected] 56.5 53.3 na na na na Sat2 69.4 0.8 [email protected] 42.1 38.7 na na na na Mpdu1 69.5 2 [email protected] 26.3 24.1 na na na na Asgr1 69.9 2 [email protected] 20.1 18 na na na na Asgr2 69.9 0.5 [email protected] 60.4 56.6 na na na na Rnasek 70.1 1.8 [email protected] 44.8 42.5 na na na na Med11 70.3 1.9 [email protected] 19.6 17.4 na na na na Gltpd2 70.3 0.4 [email protected] 62.7 58.5 na na na na C1qbp 70.8 1.6 [email protected] 21.2 18.8 na na na na Dhx33 70.8 2.2 [email protected] 15.2 13.3 na na na na Mis12 70.8 0.9 [email protected] 39.1 35.8 na na na na 6330403K07Rik 70.8 1.5 [email protected] 24 21.4 na na na na Fbxo39 72.1 na na na na 1.3 [email protected] 13 4.8 Slfn5 82.7 na na na na 1.7 [email protected] 11.2 3.4 Scpep1 88.8 1.8 [email protected] 54.5 52.3 na na na na Gm15698 88.8 1.9 [email protected] 25.3 23.2 na na na na Tom1l1 90.5 1.9 [email protected] 30.2 28.2 na na na na
a Conditional genome scans were performed in the F2 population for HDL Apoa2 on the chromosome 11 HDL QTL and the brown module eigengene in the F2 population. To be considered causal, the LOD score of the candidate gene had to be reduced below the suggestive level (LOD < 2.2), and the expression QTL LOD score adjusted for the trait must not have been reduced below the suggestive level. Only the genes showing evidence of causality for HDL Apoa2 QTL are reported here, in addition to genes found to be causal for the brown modules. Bold indicates that the gene was also found to be causal in males or females only (see supplementary Table VI).
b Conditional genome scan on HDL Apoa2 in males and females using the expression of the gene as a covariate. na indicates that the gene was not causal of HDL Apoa2 or not present in brown module.
c Conditional genome scan on the gene expression (eQTL) using the phenotypic trait (HDL Apoa2 or brown eigengene) as a covariate. d Apoa2 was used as a covariate in the expression QTL analysis here to allow for comparison. Therefore, the position of the cis eQTL and LOD
score varies slightly compared with the results in supplementary Table I but does not affect the outcome: genes stay cis -expressed after adjustment for Apoa2 .
at INS
ER
M, on M
ay 20, 2012w
ww
.jlr.orgD
ownloaded from
.html http://www.jlr.org/content/suppl/2012/04/11/jlr.M025833.DC1Supplemental Material can be found at:

1174 Journal of Lipid Research Volume 53, 2012
the parental and F2 mice for microarray expression studies as the major tissue for metabolic processes. However, the examination of expression-level differences in the small intestine could have led to additional candidate genes.
To conclude, we identifi ed known and novel QTL for HDL-cholesterol in mice. Although numerous genes had previously been identifi ed for HDL-cholesterol through human and animal studies, we showed that new genes reg-ulating HDL-cholesterol are yet to be discovered. These novel genes are not the usual suspects, inasmuch as they may be related to new functions of HDL-cholesterol parti-cles, adding complexity to gene identifi cation. Still, expres-sion differences, genomic databases, bioinformatics tools, and system genetics approaches allow us to narrow the list of candidate genes and thus facilitate identifi cation of causal genes. Identifying novel genes for HDL-cholesterol will provide new targets for drug development and will help improve treatments for CAD.
Note added in proof The GO analysis for the Royal blue module in Females
was missing from Table 5 in the accepted article online. This information has since been added and appears in the fi nal versions of the article in print and online.
The authors thank Harry Whitmore for his help with mouse husbandry, Joanne Currer for editing the manuscript, and Jesse Hammer for graphical assistance.
REFERENCES
1 . Hopkins , P. N. , and R. R. Williams . 1981 . A survey of 246 suggested coronary risk factors. Atherosclerosis . 40 : 1 – 52 .
2 . Castelli , W. P. , J. T. Doyle , T. Gordon , C. G. Hames , M. C. Hjortland , S. B. Hulley , A. Kagan , and W. J. Zukel . 1977 . HDL cholesterol and other lipids in coronary heart disease. The cooperative lipoprotein phenotyping study. Circulation . 55 : 767 – 772 .
3 . Barter , P. J. , M. Caulfi eld , M. Eriksson , S. M. Grundy , J. J. Kastelein , M. Komajda , J. Lopez-Sendon , L. Mosca , J. C. Tardif , D. D. Waters , et al . 2007 . Effects of torcetrapib in patients at high risk for coro-nary events. N. Engl. J. Med. 357 : 2109 – 2122 .
4 . Melnikova , I. 2005 . Raising HDL cholesterol. Nat. Rev. Drug Discov. 4 : 185 – 186 .
5 . Williams , P. T. 1997 . Interactive effects of exercise, alcohol, and veg-etarian diet on coronary artery disease risk factors in 9242 runners: the National Runners’ Health Study. Am. J. Clin. Nutr. 66 : 1197 – 1206 .
6 . Teslovich , T. M. , K. Musunuru , A. V. Smith , A. C. Edmondson , I. M. Stylianou , M. Koseki , J. P. Pirruccello , S. Ripatti , D. I. Chasman , C. J. Willer , et al . 2010 . Biological, clinical and population relevance of 95 loci for blood lipids. Nature . 466 : 707 – 713 .
7 . Wang , X. , and B. Paigen . 2005 . Genetics of variation in HDL cho-lesterol in humans and mice. Circ. Res. 96 : 27 – 42 .
8 . Leduc , M. S. , M. Lyons , K. Darvishi , K. Walsh , S. Sheehan , S. Amend , A. Cox , M. Orho-Melander , S. Kathiresan , B. Paigen , et al . 2011 . The mouse QTL map helps interpret human genome-wide associa-tion studies for HDL cholesterol. J. Lipid Res. 52 : 1139 – 1149 .
9 . Burgess-Herbert , S. L. , A. Cox , S. W. Tsaih , and B. Paigen . 2008 . Practical applications of the bioinformatics toolbox for narrowing quantitative trait loci. Genetics . 180 : 2227 – 2235 .
10 . DiPetrillo , K. , X. Wang , I. M. Stylianou , and B. Paigen . 2005 . Bioinformatics toolbox for narrowing rodent quantitative trait loci. Trends Genet. 21 : 683 – 692 .
11 . Langfelder , P. , L. W. Castellani , Z. Zhou , E. Paul , R. Davis , E. E. Schadt , A. J. Lusis , S. Horvath , and M. Mehrabian . 2012 . A systems genetic analysis of high density lipoprotein metabolism and network preserva-tion across mouse models. Biochim. Biophys. Acta . 1821 : 435 – 447 .
These anti-infl ammatory properties are known to be pro-portionate to HDL concentration and affect the TLR4-mediated infl ammatory response of macrophages ( 40 ). At the genetic level, associations between genetic polymor-phisms in genes involved in an infl ammatory pathway (such as TNF � ) and HDL concentration have been ob-served previously ( 41 ). Here, we found that the eigengene of the brown module was negatively correlated with the expression of infl ammatory genes, which corroborates a previous fi nding: Park et al. ( 42 ) showed that HDL down-regulates the expression of VCAM-1 in endothelial cells triggered by TNF � . These results show how HDL particles are capable of modulating infl ammation response genes. How infl ammatory genes could affect HDL-cholesterol level is yet to be determined. However, no direction of causality between the module eigengene and HDL-cholesterol level was identifi ed in our study. Therefore, we hypothesize that one of the candidate genes on chromosome 11 affects HDL-cholesterol level, which in turn affects infl ammatory gene expression, leading to the identifi cation of a module enriched for infl ammatory response genes, which also correlated with HDL-cholesterol level.
With the exception of Abca1 and Lipg , none of the candi-date genes are known to play a role in HDL metabolism or were identifi ed in recent human genome-wide association analysis for HDL-cholesterol ( 6 ). This latter fi nding may indi-cate a difference in the genetics of HDL metabolism between mice and humans. However, our group has previously shown that genes regulating HDL-cholesterol are often concordant between mice and humans ( 7, 8 ). Mouse intercrosses allow for the identifi cation of QTL due to a specifi c strain’s poly-morphisms that have an effect strong enough to be detect-able in the F2 population studied. In addition, system genetics approaches allow for the identifi cation of genes with small effects on the phenotype but that may produce larger effects when taken together as a module. Combining both ap-proaches, our study allowed for the identifi cation of genes that may have been undetectable by human genome-wide as-sociation analysis due to their small effect or lack of func-tional polymorphisms in human populations. These genes could in fact explain part of the unexplained inter-individual variation often observed in human genome-wide association analysis. Among the candidate genes on chromosome 11, Atpaf2 (ATP synthase mitochondrial F1 complex assembly factor 2) was identifi ed in a human GWAS for gallstone disease, a phenotype related to cholesterol metabolism, with a polymorphism at a statistically marginal level ( P < 10 � 3 , ranked = 203) within 10 Kb of the gene ( 43 ). The gene encodes for a factor involved in the assembly of F(1) compo-nent of the mitochondrial ATP synthase. The � chain of ATP synthase has been shown to bind to apoA-1 and to induce the internalization of HDL particles ( 44 ), which makes Atpaf2 a major candidate gene for the chromosome 11 HDL QTL. The direct or indirect link between Atpaf2 and infl ammation is yet to be determined.
Finally, HDL particles are mainly synthesized in the liver and the small intestine ( 45 ). Because our overall intercross study included not only HDL-cholesterol but also other complex traits ( 13, 14 ), we elected to collect the livers in
at INS
ER
M, on M
ay 20, 2012w
ww
.jlr.orgD
ownloaded from
.html http://www.jlr.org/content/suppl/2012/04/11/jlr.M025833.DC1Supplemental Material can be found at:

Candidate genes for HDL 1175
12 . Langfelder , P. , and S. Horvath . 2008 . WGCNA: an R package for weighted correlation network analysis. BMC Bioinformatics . 9 : 559 .
13 . Leduc , M. S. , R. S. Hageman , R. A. Verdugo , S. W. Tsaih , K. Walsh , G. A. Churchill , and B. Paigen . 2011 . Integration of QTL and bioin-formatic tools to identify candidate genes for triglycerides in mice. J. Lipid Res. 52 : 1672 – 1682 .
14 . Leduc , M. S. , R. S. Hageman , Q. Meng , R. A. Verdugo , S. W. Tsaih , G. A. Churchill , B. Paigen , and R. Yuan . 2010 . Identifi cation of genetic determinants of IGF-1 levels and longevity among mouse inbred strains. Aging Cell . 9 : 823 – 836 .
15 . Cox , A. , C. L. Ackert-Bicknell , B. L. Dumont , Y. Ding , J. T. Bell , G. A. Brockmann , J. E. Wergedal , C. Bult , B. Paigen , J. Flint , et al . 2009 . A new standard genetic map for the laboratory mouse. Genetics . 182 : 1335 – 1344 .
16 . Bolstad , B. M. , R. A. Irizarry , M. Astrand , and T. P. Speed . 2003 . A comparison of normalization methods for high density oligo-nucleotide array data based on variance and bias. Bioinformatics . 19 : 185 – 193 .
17 . Dai , M. , P. Wang , A. D. Boyd , G. Kostov , B. Athey , E. G. Jones , W. E. Bunney , R. M. Myers , T. P. Speed , H. Akil , et al . 2005 . Evolving gene/transcript defi nitions signifi cantly alter the interpretation of GeneChip data. Nucleic Acids Res. 33 : e175 .
18 . Broman , K. W. , H. Wu , S. Sen , and G. A. Churchill . 2003 . R/qtl: QTL mapping in experimental crosses. Bioinformatics . 19 : 889 – 890 .
19 . Broman , K. W. , S. Sen , S. E. Owens , A. Manichaikul , E. M. Southard-Smith , and G. A. Churchill . 2006 . The X chromosome in quantita-tive trait locus mapping. Genetics . 174 : 2151 – 2158 .
20 . Ng , P. C. , and S. Henikoff . 2001 . Predicting deleterious amino acid substitutions. Genome Res. 11 : 863 – 874 .
21 . Li , R. , S. W. Tsaih , K. Shockley , I. M. Stylianou , J. Wergedal , B. Paigen , and G. A. Churchill . 2006 . Structural model analysis of mul-tiple quantitative traits. PLoS Genet. 2 : e114 .
22 . Neto , E. , M. Keller , A. Attie , and B. Yandell . 2010 . Causal graphical models in systems genetics: a unifi ed framework for joint inference of causal network and genetic architecture for correlated pheno-types. Ann. Appl. Stat. 4 : 320 – 339 .
23 . Langfelder , P. , and S. Horvath . 2007 . Eigengene networks for studying the relationships between co-expression modules. BMC Syst. Biol. 1 : 54 .
24 . Lehmann , E. 1975 . Nonparametrics: Statistical Methods Based on Ranks. Holden-Day, San Francisco.
25 . Wang , X. , R. Korstanje , D. Higgins , and B. Paigen . 2004 . Haplotype analysis in multiple crosses to identify a QTL gene. Genome Res. 14 : 1767 – 1772 .
26 . Su , Z. , N. Ishimori , Y. Chen , E. H. Leiter , G. A. Churchill , B. Paigen , and I. M. Stylianou . 2009 . Four additional mouse crosses improve the lipid QTL landscape and identify Lipg as a QTL gene. J. Lipid Res. 50 : 2083 – 2094 .
27 . Su , Z. , S. W. Tsaih , J. Szatkiewicz , Y. Shen , and B. Paigen . 2008 . Candidate genes for plasma triglyceride, FFA, and glucose revealed from an intercross between inbred mouse strains NZB/B1NJ and NZW/LacJ. J. Lipid Res. 49 : 1500 – 1510 .
28 . Lelliott , C. J. , G. Medina-Gomez , N. Petrovic , A. Kis , H. M. Feldmann , M. Bjursell , N. Parker , K. Curtis , M. Campbell , P. Hu , et al . 2006 . Ablation of PGC-1beta results in defective mitochon-drial activity, thermogenesis, hepatic function, and cardiac perfor-mance. PLoS Biol. 4 : e369 .
29 . Lawson , H. A. , A. Lee , G. L. Fawcett , B. Wang , L. S. Pletscher , T. J. Maxwell , T. H. Ehrich , J. P. Kenney-Hunt , J. B. Wolf , C. F. Semenkovich , et al . 2011 . The importance of context to the genetic architecture of diabetes-related traits is revealed in a genome-wide scan of a LG/J x SM/J murine model. Mamm. Genome . 22 : 197 – 208 .
30 . Lawson , H. A. , K. M. Zelle , G. L. Fawcett , B. Wang , L. S. Pletscher , T. J. Maxwell , T. H. Ehrich , J. P. Kenney-Hunt , J. B. Wolf , C. F. Semenkovich , et al . 2010 . Genetic, epigenetic, and gene-by-diet in-teraction effects underlie variation in serum lipids in a LG/JxSM/J murine model. J. Lipid Res. 51 : 2976 – 2984 .
31 . Stylianou , I. M. , J. P. Affourtit , K. R. Shockley , R. Y. Wilpan , F. A. Abdi , S. Bhardwaj , J. Rollins , G. A. Churchill , and B. Paigen . 2008 . Applying gene expression, proteomics and single-nucleotide polymorphism analysis for complex trait gene identifi cation. Genetics . 178 : 1795 – 1805 .
32 . Suto , J. 2005 . Apolipoprotein gene polymorphisms as cause of cho-lesterol QTLs in mice. J. Vet. Med. Sci. 67 : 583 – 589 .
33 . Rainwater , D. L. , L. A. Cox , J. Rogers , J. L. VandeBerg , and M. C. Mahaney . 2009 . Localization of multiple pleiotropic genes for lipo-protein metabolism in baboons. J. Lipid Res. 50 : 1420 – 1428 .
34 . Kullo , I. J. , S. T. Turner , E. Boerwinkle , S. L. Kardia , and M. de Andrade . 2005 . A novel quantitative trait locus on chromosome 1
with pleiotropic effects on HDL-cholesterol and LDL particle size in hypertensive sibships. Am. J. Hypertens. 18 : 1084 – 1090 .
35 . Korstanje , R. , R. Li , T. Howard , P. Kelmenson , J. Marshall , B. Paigen , and G. Churchill . 2004 . Infl uence of sex and diet on quan-titative trait loci for HDL cholesterol levels in an SM/J by NZB/BlNJ intercross population. J. Lipid Res. 45 : 881 – 888 .
36 . Shockley , K. R. , D. Witmer , S. L. Burgess-Herbert , B. Paigen , and G. A. Churchill . 2009 . Effects of atherogenic diet on hepatic gene expression across mouse strains. Physiol. Genomics . 39 : 172 – 182 .
37 . Rockman , M. V. 2008 . Reverse engineering the genotype-pheno-type map with natural genetic variation. Nature . 456 : 738 – 744 .
38 . Vaisar , T. , S. Pennathur , P. S. Green , S. A. Gharib , A. N. Hoofnagle , M. C. Cheung , J. Byun , S. Vuletic , S. Kassim , P. Singh , et al . 2007 . Shotgun proteomics implicates protease inhibition and comple-ment activation in the antiinfl ammatory properties of HDL. J. Clin. Invest. 117 : 746 – 756 .
39 . Barter , P. J. , S. Nicholls , K. A. Rye , G. M. Anantharamaiah , M. Navab , and A. M. Fogelman . 2004 . Antiinfl ammatory properties of HDL. Circ. Res. 95 : 764 – 772 .
40 . Yvan-Charvet , L. , J. Kling , T. Pagler , H. Li , B. Hubbard , T. Fisher , C. P. Sparrow , A. K. Taggart , and A. R. Tall . 2010 . Cholesterol effl ux potential and antiinfl ammatory properties of high-density lipopro-tein after treatment with niacin or anacetrapib. Arterioscler. Thromb. Vasc. Biol. 30 : 1430 – 1438 .
41 . Arora , P. , B. Garcia-Bailo , Z. Dastani , D. Brenner , A. Villegas , S. Malik , T. D. Spector , B. Richards , A. El-Sohemy , M. Karmali , et al . 2011 . Genetic polymorphisms of innate immunity-related infl am-matory pathways and their association with factors related to type 2 diabetes. BMC Med. Genet. 12 : 95 .
42 . Park , S. H. , J. H. Park , J. S. Kang , and Y. H. Kang . 2003 . Involvement of transcription factors in plasma HDL protection against TNF-alpha-induced vascular cell adhesion molecule-1 expression. Int. J. Biochem. Cell Biol. 35 : 168 – 182 .
43 . Buch , S. , C. Schafmayer , H. Volzke , C. Becker , A. Franke , H. von Eller-Eberstein , C. Kluck , I. Bassmann , M. Brosch , F. Lammert , et al . 2007 . A genome-wide association scan identifi es the hepatic cholesterol transporter ABCG8 as a susceptibility factor for human gallstone disease. Nat. Genet. 39 : 995 – 999 .
44 . Martinez , L. O. , S. Jacquet , J. P. Esteve , C. Rolland , E. Cabezon , E. Champagne , T. Pineau , V. Georgeaud , J. E. Walker , F. Terce , et al . 2003 . Ectopic beta-chain of ATP synthase is an apolipoprotein A-I receptor in hepatic HDL endocytosis. Nature . 421 : 75 – 79 .
45 . Brunham , L. R. , J. K. Kruit , J. Iqbal , C. Fievet , J. M. Timmins , T. D. Pape , B. A. Coburn , N. Bissada , B. Staels , A. K. Groen , et al . 2006 . Intestinal ABCA1 directly contributes to HDL biogenesis in vivo. J. Clin. Invest. 116 : 1052 – 1062 .
46 . Lyons , M. A. , H. Wittenburg , R. Li , K. A. Walsh , G. A. Churchill , M. C. Carey , and B. Paigen . 2003 . Quantitative trait loci that de-termine lipoprotein cholesterol levels in DBA/2J and CAST/Ei in-bred mice. J. Lipid Res. 44 : 953 – 967 .
47 . Lyons , M. A. , H. Wittenburg , R. Li , K. A. Walsh , R. Korstanje , G. A. Churchill , M. C. Carey , and B. Paigen . 2004 . Quantitative trait loci that determine lipoprotein cholesterol levels in an intercross of 129S1/SvImJ and CAST/Ei inbred mice. Physiol. Genomics . 17 : 60 – 68 .
48 . Su , Z. , X. Wang , S. W. Tsaih , A. Zhang , A. Cox , S. Sheehan , and B. Paigen . 2009 . Genetic basis of HDL variation in 129/SvImJ and C57BL/6J mice: importance of testing candidate genes in targeted mutant mice. J. Lipid Res. 50 : 116 – 125 .
49 . Welch , C. L. , S. Bretschger , P. Z. Wen , M. Mehrabian , N. Latib , J. Fruchart-Najib , J. C. Fruchart , C. Myrick , and A. J. Lusis . 2004 . Novel QTLs for HDL levels identifi ed in mice by controlling for Apoa2 allelic effects: confi rmation of a chromosome 6 locus in a congenic strain. Physiol. Genomics . 17 : 48 – 59 .
50 . Anunciado , R. V. , M. Nishimura , M. Mori , A. Ishikawa , S. Tanaka , F. Horio , T. Ohno , and T. Namikawa . 2003 . Quantitative trait locus analysis of serum insulin, triglyceride, total cholesterol and phos-pholipid levels in the (SM/J x A/J)F2 mice. Exp. Anim. 52 : 37 – 42 .
51 . Su , Z. , A. Cox , Y. Shen , I. M. Stylianou , and B. Paigen . 2009 . Farp2 and Stk25 are candidate genes for the HDL cholesterol locus on mouse chromosome 1. Arterioscler. Thromb. Vasc. Biol. 29 : 107 – 113 .
52 . Mehrabian , M. , L. W. Castellani , P. Z. Wen , J. Wong , T. Rithaporn , S. Y. Hama , G. P. Hough , D. Johnson , J. J. Albers , G. A. Mottino , et al . 2000 . Genetic control of HDL levels and composition in an interspe-cifi c mouse cross (CAST/Ei x C57BL/6J). J. Lipid Res. 41 : 1936 – 1946 .
53 . Maltais , L. J. , J. A. Blake , T. Chu , C. M. Lutz , J. T. Eppig , and I. Jackson . 2002 . Rules and guidelines for mouse gene, allele, and mu-tation nomenclature: a condensed version. Genomics . 79 : 471 – 474 .
at INS
ER
M, on M
ay 20, 2012w
ww
.jlr.orgD
ownloaded from
.html http://www.jlr.org/content/suppl/2012/04/11/jlr.M025833.DC1Supplemental Material can be found at:
Copyright © 2022 FDOKUMEN