Using aquatic macrophyte community indices to define the ecological status of European lakes
12
Using aquatic macrophyte community indices to define the ecological status of European lakes W. Ellis Penning Bernard Dudley Marit Mjelde Seppo Hellsten Jenica Hanganu Agnieszka Kolada Marcel van den Berg Sandra Poikane Geoff Phillips Nigel Willby Frauke Ecke Published online: 18 April 2008 Ó Springer Science+Business Media B.V. 2008 Abstract Defining the overall ecological status of lakes according to the Water Framework Directive (WFD) is to be partially based on the species composition of the aquatic macrophyte community. We tested three assessment methods to define the ecological status of the macrophyte community in response to a eutrophication pressure as reflected by total phosphorus concentrations in lake water. An absolute species richness, a trophic index (TI) and a lake trophic ranking (LTR) method were tested at Europe-wide, regional and national scales as well as by alkalinity category, using data from 1,147 lakes from 12 European states. Total phosphorus data were used to represent the trophic status of individual samples and were plotted against the calculated TI and LTR values. Additionally, the LTR method was tested in some individual lakes with a relatively long time series of monitoring data. The TI correlated well with total P in the Northern European lake types, whereas the relationship in the Central European lake types was less clear. The relationship between total P and light extinction is often very good in the Northern European lake types compared to the Central Euro- pean lake types. This can be one of the reasons for a better agreement between the indices and eutrophica- tion pressure in the Northern European lake types. The W. E. Penning (&) Deltares, P.O. Box 177, 2600 MH Delft, The Netherlands e-mail: [email protected] W. E. Penning NIOO-CL, P.O. Box 1299, 3600 BG Maarssen, The Netherlands B. Dudley CEH, Edinburgh, Bush Estate, Penicuik EH26 0QB, UK M. Mjelde NIVA, Gaustadalle ´en 21, 0349 Oslo, Norway S. Hellsten SYKE, University of Oulu, P.O. Box 413, 90014 Oulu, Finland J. Hanganu DDNI, Tulcea, Romania A. Kolada Institute for Environmental Protection, Warszawa, Poland M. van den Berg Rijkswaterstaat RIZA, P.O. Box 17, 8200 AA Lelystad, The Netherlands S. Poikane Joint Research Centre, 21020 Ispra, Italy G. Phillips Environment Agency for England and Wales, Reading RG1 8DQ, UK N. Willby University of Stirling, Stirling FK9 4LA, UK F. Ecke Lulea ˚ University of Technology, 971 87 Lulea ˚, Sweden 123 Aquat Ecol (2008) 42:253–264 DOI 10.1007/s10452-008-9183-x
Transcript of Using aquatic macrophyte community indices to define the ecological status of European lakes
Using aquatic macrophyte community indices to definethe ecological status of European lakes
W. Ellis Penning Æ Bernard Dudley Æ Marit Mjelde Æ Seppo Hellsten ÆJenica Hanganu Æ Agnieszka Kolada Æ Marcel van den Berg Æ Sandra Poikane ÆGeoff Phillips Æ Nigel Willby Æ Frauke Ecke
Published online: 18 April 2008
� Springer Science+Business Media B.V. 2008
Abstract Defining the overall ecological status of
lakes according to the Water Framework Directive
(WFD) is to be partially based on the species
composition of the aquatic macrophyte community.
We tested three assessment methods to define the
ecological status of the macrophyte community in
response to a eutrophication pressure as reflected by
total phosphorus concentrations in lake water. An
absolute species richness, a trophic index (TI) and a
lake trophic ranking (LTR) method were tested at
Europe-wide, regional and national scales as well as
by alkalinity category, using data from 1,147 lakes
from 12 European states. Total phosphorus data were
used to represent the trophic status of individual
samples and were plotted against the calculated TI and
LTR values. Additionally, the LTR method was tested
in some individual lakes with a relatively long time
series of monitoring data. The TI correlated well with
total P in the Northern European lake types, whereas
the relationship in the Central European lake types
was less clear. The relationship between total P and
light extinction is often very good in the Northern
European lake types compared to the Central Euro-
pean lake types. This can be one of the reasons for a
better agreement between the indices and eutrophica-
tion pressure in the Northern European lake types. The
W. E. Penning (&)
Deltares, P.O. Box 177, 2600 MH Delft, The Netherlands
e-mail: [email protected]
W. E. Penning
NIOO-CL, P.O. Box 1299, 3600 BG Maarssen,
The Netherlands
B. Dudley
CEH, Edinburgh, Bush Estate, Penicuik EH26 0QB, UK
M. Mjelde
NIVA, Gaustadalleen 21, 0349 Oslo, Norway
S. Hellsten
SYKE, University of Oulu, P.O. Box 413, 90014 Oulu,
Finland
J. Hanganu
DDNI, Tulcea, Romania
A. Kolada
Institute for Environmental Protection, Warszawa, Poland
M. van den Berg
Rijkswaterstaat RIZA, P.O. Box 17, 8200 AA Lelystad,
The Netherlands
S. Poikane
Joint Research Centre, 21020 Ispra, Italy
G. Phillips
Environment Agency for England and Wales,
Reading RG1 8DQ, UK
N. Willby
University of Stirling, Stirling FK9 4LA, UK
F. Ecke
Lulea University of Technology,
971 87 Lulea, Sweden
123
Aquat Ecol (2008) 42:253–264
DOI 10.1007/s10452-008-9183-x
response of individual lakes to changes in the abiotic
environment was sometimes represented incorrectly
by the indices used, which is a cause of concern for the
use of single indices in status assessments in practice.
Keywords Aquatic vegetation � Ecological quality �EU Water Framework Directive � Intercalibration �REBECCA � Status assessment
Introduction
The Water Framework Directive (WFD) uses aquatic
macrophyte species composition and abundance as a
biological quality element throughout Europe.
According to the directive, similar lake types should
have a similar macrophyte community composition if
they have similar ecological status. Assessment
methods based on this community structure should
be formulated to describe the overall ecological status
of the water body and to report on improvements
where measures have been implemented (European
Union 2000). The WFD emphasizes the importance
of species composition and abundance, but gives
relative freedom for selection of assessment methods.
In principle, a status assessment of macrophytes is
based on deviation from its type-specific reference
community. Indices may provide a means for quan-
tifying this deviation from reference conditions. The
use of indices is also relevant for large and non-
homogeneous datasets, such as those used in this
study, which do not allow the use of models based on
community structures.
Most of the currently suggested status assessment
methods for macrophyte communities in accordance
with WFD requirements focus on applications in
rivers and streams across Europe (O’Hare et al.
2006). For lake macrophyte communities, there are
not many assessment methods published and harmo-
nized in Europe that are in line with the WFD
requirements. Birk et al. (2006) concluded that for
lowland streams the current proposed methods for
assessing macrophytes of four individual member
states did not respond comparably, despite the use of
one harmonized type of monitoring method. They
conclude that further intercalibration is required for
better understanding of status assessment using these
methods.
Many European member states are currently
undertaking efforts to create status assessment meth-
ods for lakes based on a.o. macrophyte communities,
of which some are already available. The countries
which have developed these methods are: Germany
(Stelzer et al. 2005; Schaumburg et al. 2004),
Denmark (Søndergaard et al. 2005), the Netherlands
(Van den Berg 2004), Belgium (Leyssen et al. 2005),
Sweden (Ecke 2007), Finland (Leka et al. 2007), the
UK (Willby et al. 2006) and Ireland (Free et al. 2006).
The German method uses an index based on the
relative abundances of ‘sensitive’, ‘tolerant’ and
‘indifferent’ species. The Dutch, Danish and Belgian
approaches are multimetric, using various aspects of
the macrophyte community to describe the status of the
macrophytes to a generalized ‘ecosystem disturbance’.
For example, the Dutch method uses abundance and
percentage of lake area covered by various growth
forms. There is a composition index for submerged
macrophytes and one for helophytes, although the
latter is under discussion. The Danish approach
includes a maximum-growth-depth index, and the
presence or absence of exotic species. The Irish index
is also based on a multimetric approach combining
several existing and developed indices (Free et al.
2006), while a preliminary approach in Norway uses
similar methods to those in Germany (Mjelde, unpubl).
The Swedish index is calculated as the weighted
average of the indicator values (along the phosphorus
gradient) of all species present in a lake using the niche
breadth of the species along the phosphorus gradient as
weighting factor (Ecke 2007). The UK approach
(Willby et al. 2006) describes species as responding
positively (impact species) or negatively (reference
species) to eutrophication pressure, and defines a Lake
Trophic Rank score as an average of the scores of all
species found in a single lake, weighted by abundance.
This paper describes and compares three selected
indices for assessment of the aquatic macrophyte
species community status on European, regional and
local scale. These are: (1) the total species richness; (2)
relative abundance of positive and negative species,
based on a modified German approach; and (3) the
suggested UK approach called the ‘LEAFPACS
method’ (Willby et al. 2006). The indices differ
specifically in their level of complexity, ranging from
the very simple, total species richness to the rather
complex lake trophic ranking (LTR). We examine the
effect of classification decisions (as described in
254 Aquat Ecol (2008) 42:253–264
123
Penning et al., this issue) on resultant ecological
quality indices for individual lakes and groups of lakes.
Also, the applicability of both TI and LTR to represent
temporal developments within a single lake is assessed
to address the usability of these indices for water
management in view of the WFD requirements.
Methods
Data on macrophyte abundance and water quality were
collected for as many European countries as possible,
as described in detail in Penning et al. (2008, this
issue). Macrophyte data were gathered at species level
and the main water quality parameters collected were
total phosphorus (total P), chlorophyll a and Secchi
depth. Lake typological information, specifically lake
size, average depth, colour, alkalinity and altitude was
also collected for most lakes, and the lake types were
identified according to the method of the intercalibra-
tion processes (Heiskanen et al. 2004) with some
minor adjustments in alkalinity classes. This resulted
in four main subsets of the database: for the Northern
and Central Geographic Intercalibration Groups
(N-GIG and C-GIG) two alkalinity types were distin-
guished: High ([1 meq l-1) and Moderate/Low
(0.05–1 meq l-1) alkalinity. Low and moderate alka-
linity types were grouped after initial data analyses
that showed these two types to be overlapping in
cluster analyses of macrophyte communities (reported
in Lyche Solheim 2006). Additional subsets were
created for countries with sufficient amount of sam-
pling points ([ 20) per alkalinity type (Norway,
Finland and Latvia). From all 1,442 lakes available
in the database, data from 1,147 lakes were used, as the
remaining lakes either had too few species per lake
(\4), unclear information on water quality parameters
or species composition or lacked sufficient descriptive
data. For further description of the database used in
this work see Moe et al. (2008, this issue).
The three indices used were: (1). total species
richness; (2). a trophic index (TI) based on sensitive
and tolerant species; and (3) a LTR index.
Species richness
The simplest index available for lake macrophyte
community status assessment is species richness.
Species richness was examined across the gradient of
total P for the entire dataset using total number of
species recorded (S).
Trophic indices (TI) based on sensitive and
tolerant species
The trophic indices subtract the number or abundance
of tolerant species from the number or abundance of
sensitive species either based on the count of species
using presence/absence data (Eq. 1), or based on
relative abundance of different classes (Eq. 2):
TIC ¼NS � NT
N� 100; ð1Þ
where NS is the number of Sensitive species found in
the lake, NT is the number of Tolerant species and N
is the total number of species, including Indifferent
species.
TIA ¼
PNS
i¼1
Ai �PNT
j¼1
Aj
PN
k¼1
Ak
� 100; ð2Þ
where A is a measure of abundance.
TIA (Eq. 2) is similar to the index used for German
lakes by Stelzer et al. (2005).
Both indices include all aquatic macrophyte life
form groups (isoetids, elodeids, nymphaeids, lemnids
and charids) and produce a number between +100 and
-100 (+100 when all species are defined as Sensitive
and -100 when all species are Tolerant) for an
individual lake. Many database subsets in the
REBECCA database lacked abundance data so that
only TIC (Eq. 1) could be used on those occasions.
Lake trophic ranking index (LTR)
Similar to the TI, the index suggested by the LEAF
PACS project combines species-level values into a
whole lake index. The LTR Index is a by-product of
the LEAFPACS method of classifying species into
eutrophication response classes (see Penning et al.
2008, this issue, for details). The LTR in this report is
the same as the Lake Macrophyte Nutrient Index,
mentioned in Willby et al. (2006). The Lake Trophic
Rank method calculates a trophic rank for a species,
which is then converted to a trophic rank for a single
lake based solely on the species composition. The
LTR should thus respond to a change in macrophyte
Aquat Ecol (2008) 42:253–264 255
123
community caused by a change in eutrophication
pressure. The LTR was calculated for the four main
lake types identified within the REBECCA dataset.
Strictly speaking, the LTR of a lake should be
calculated using the weighted (by abundance) aver-
ages of the species trophic ranks, of the species
occurring in the lake. However, in the REBECCA
dataset, abundance data have often been lacking or
are not comparable due to differences in monitoring
methods. Therefore, we have calculated the LTR as
simply the average of the trophic ranks of the species
occurring in the lake. The LTR included here is
expected to have more precision than indices based
on very few response classes.
Results
Species richness
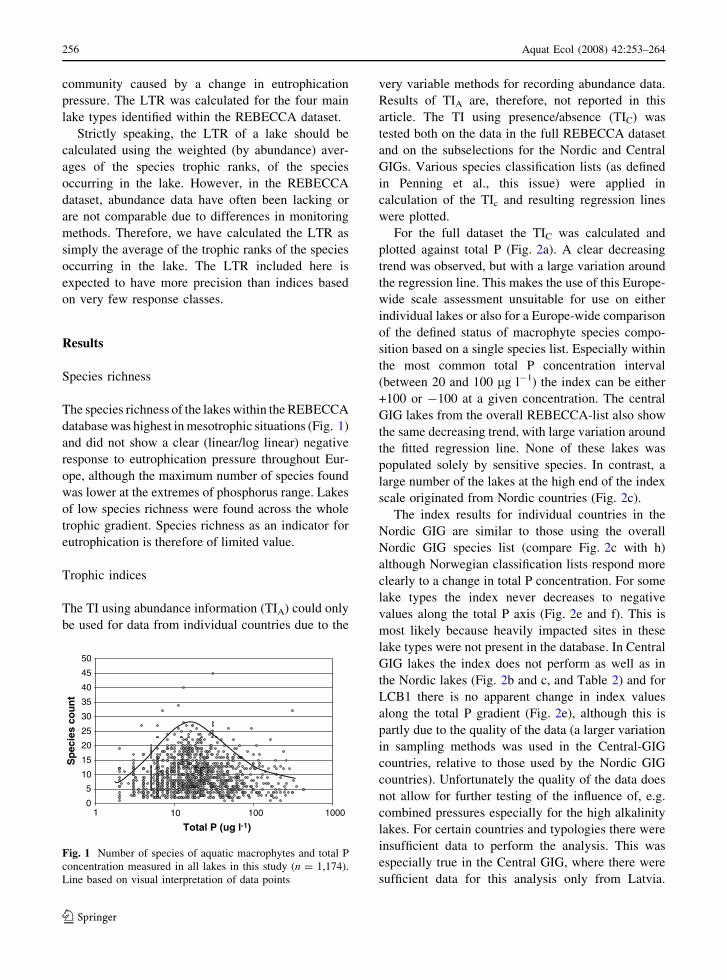
The species richness of the lakes within the REBECCA
database was highest in mesotrophic situations (Fig. 1)
and did not show a clear (linear/log linear) negative
response to eutrophication pressure throughout Eur-
ope, although the maximum number of species found
was lower at the extremes of phosphorus range. Lakes
of low species richness were found across the whole
trophic gradient. Species richness as an indicator for
eutrophication is therefore of limited value.
Trophic indices
The TI using abundance information (TIA) could only
be used for data from individual countries due to the
very variable methods for recording abundance data.
Results of TIA are, therefore, not reported in this
article. The TI using presence/absence (TIC) was
tested both on the data in the full REBECCA dataset
and on the subselections for the Nordic and Central
GIGs. Various species classification lists (as defined
in Penning et al., this issue) were applied in
calculation of the TIc and resulting regression lines
were plotted.
For the full dataset the TIC was calculated and
plotted against total P (Fig. 2a). A clear decreasing
trend was observed, but with a large variation around
the regression line. This makes the use of this Europe-
wide scale assessment unsuitable for use on either
individual lakes or also for a Europe-wide comparison
of the defined status of macrophyte species compo-
sition based on a single species list. Especially within
the most common total P concentration interval
(between 20 and 100 lg l-1) the index can be either
+100 or -100 at a given concentration. The central
GIG lakes from the overall REBECCA-list also show
the same decreasing trend, with large variation around
the fitted regression line. None of these lakes was
populated solely by sensitive species. In contrast, a
large number of the lakes at the high end of the index
scale originated from Nordic countries (Fig. 2c).
The index results for individual countries in the
Nordic GIG are similar to those using the overall
Nordic GIG species list (compare Fig. 2c with h)
although Norwegian classification lists respond more
clearly to a change in total P concentration. For some
lake types the index never decreases to negative
values along the total P axis (Fig. 2e and f). This is
most likely because heavily impacted sites in these
lake types were not present in the database. In Central
GIG lakes the index does not perform as well as in
the Nordic lakes (Fig. 2b and c, and Table 2) and for
LCB1 there is no apparent change in index values
along the total P gradient (Fig. 2e), although this is
partly due to the quality of the data (a larger variation
in sampling methods was used in the Central-GIG
countries, relative to those used by the Nordic GIG
countries). Unfortunately the quality of the data does
not allow for further testing of the influence of, e.g.
combined pressures especially for the high alkalinity
lakes. For certain countries and typologies there were
insufficient data to perform the analysis. This was
especially true in the Central GIG, where there were
sufficient data for this analysis only from Latvia.
1 10 100 10000
5
10
15
20
25
30
35
40
45
50
Sp
ecie
s co
un
t
Total P (ug l-1)
Fig. 1 Number of species of aquatic macrophytes and total P
concentration measured in all lakes in this study (n = 1,174).
Line based on visual interpretation of data points
256 Aquat Ecol (2008) 42:253–264
123
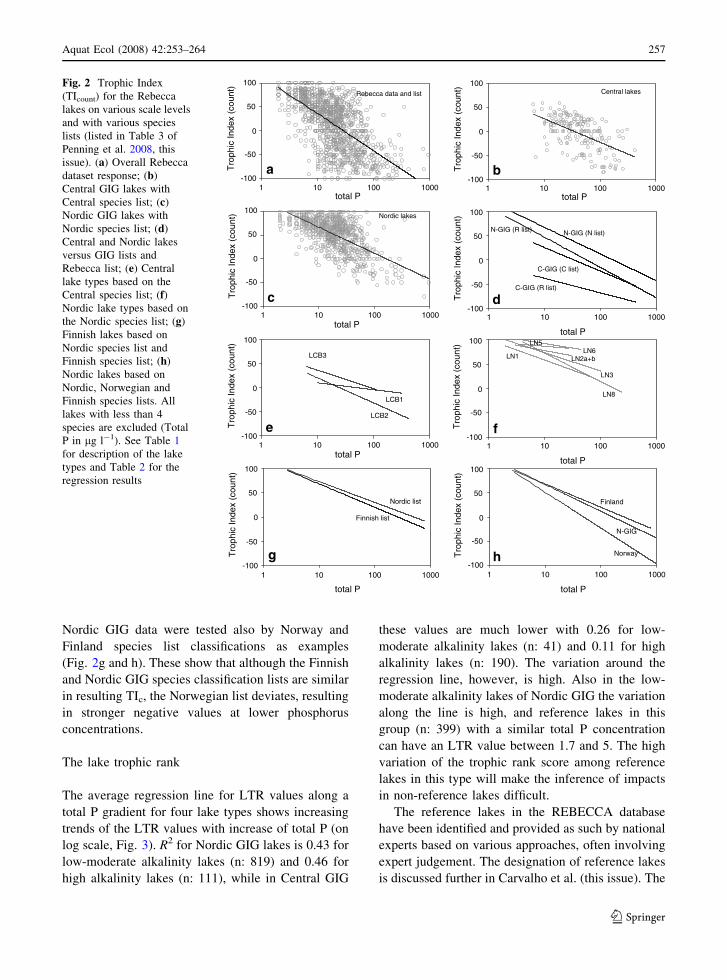
Nordic GIG data were tested also by Norway and
Finland species list classifications as examples
(Fig. 2g and h). These show that although the Finnish
and Nordic GIG species classification lists are similar
in resulting TIc, the Norwegian list deviates, resulting
in stronger negative values at lower phosphorus
concentrations.
The lake trophic rank
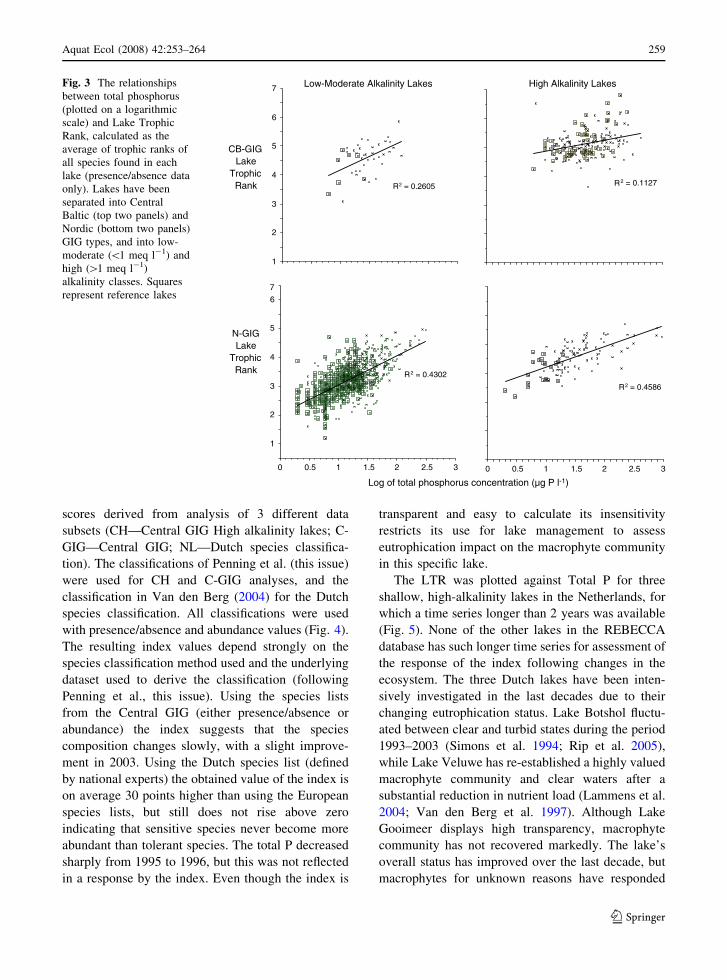
The average regression line for LTR values along a
total P gradient for four lake types shows increasing
trends of the LTR values with increase of total P (on
log scale, Fig. 3). R2 for Nordic GIG lakes is 0.43 for
low-moderate alkalinity lakes (n: 819) and 0.46 for
high alkalinity lakes (n: 111), while in Central GIG
these values are much lower with 0.26 for low-
moderate alkalinity lakes (n: 41) and 0.11 for high
alkalinity lakes (n: 190). The variation around the
regression line, however, is high. Also in the low-
moderate alkalinity lakes of Nordic GIG the variation
along the line is high, and reference lakes in this
group (n: 399) with a similar total P concentration
can have an LTR value between 1.7 and 5. The high
variation of the trophic rank score among reference
lakes in this type will make the inference of impacts
in non-reference lakes difficult.
The reference lakes in the REBECCA database
have been identified and provided as such by national
experts based on various approaches, often involving
expert judgement. The designation of reference lakes
is discussed further in Carvalho et al. (this issue). The
-100
-50
0
50
100
1 10 100 1000total P
Tro
phic
Inde
x (c
ount
)
a
Rebecca data and list Central lakes
b
1 10 100 1000total P
Nordic lakes
c
N-GIG (N list)
C-GIG (C list)
C-GIG (R list)
N-GIG (R list)
d
LCB1
LCB2
LCB3
1 10 100 1000total P
e
LN1 LN2a+b
LN3
LN5LN6
LN8
f
Finnish list
Nordic list
1 10 100 1000
total P
g
N-GIG
Finland
Norwayh
-100
-50
0
50
100
Tro
phic
Inde
x (c
ount
)
-100
-50
0
50
100
Tro
phic
Inde
x (c
ount
)
-100
-50
0
50
100
Tro
phic
Inde
x (c
ount
)
1 10 100 1000
total P
1 10 100 1000
total P
1 10 100 1000
total P
-100
-50
0
50
100
Tro
phic
Inde
x (c
ount
)
-100
-50
0
50
100
Tro
phic
Inde
x (c
ount
)
-100
-50
0
50
100
Tro
phic
Inde
x (c
ount
)
-100
-50
0
50
100
Tro
phic
Inde
x (c
ount
)
1 10 100 1000total P
Fig. 2 Trophic Index
(TIcount) for the Rebecca
lakes on various scale levels
and with various species
lists (listed in Table 3 of
Penning et al. 2008, this
issue). (a) Overall Rebecca
dataset response; (b)
Central GIG lakes with
Central species list; (c)
Nordic GIG lakes with
Nordic species list; (d)
Central and Nordic lakes
versus GIG lists and
Rebecca list; (e) Central
lake types based on the
Central species list; (f)Nordic lake types based on
the Nordic species list; (g)
Finnish lakes based on
Nordic species list and
Finnish species list; (h)
Nordic lakes based on
Nordic, Norwegian and
Finnish species lists. All
lakes with less than 4
species are excluded (Total
P in lg l-1). See Table 1
for description of the lake
types and Table 2 for the
regression results
Aquat Ecol (2008) 42:253–264 257
123

reference lakes in the low-moderate alkalinity lakes
and the Nordic high alkalinity lakes were found at
lower total P concentrations, at the lower end of the
regression line. In contrast, in the high alkalinity
central GIG lakes the reference lakes are scattered
throughout the plot. This means that the index will
not show deviation from the perceived reference
condition, as reference condition does not seem to be
related solely to trophic status in these lakes.
Applying indices for individual lakes
The TIC was tested on time-series data from Lake
Veluwe, the Netherlands, using six different species
Table 1 Description of the
intercalibration lake types
as used in Fig. 2
a Size and depth categories
are merged in our
macrophyte analysis
Lake
types
Region Lake area
(km2a)
Mean
depthaAlkalinity
(meq/l)
Calcium
(mg Ca/l)
Colour
(mg Pt/l)
Northern GIG
LN2a + b Lowland [5 3–15 0.05–0.2 1–4 \30
LN5 Boreal [5 3–15 0.05–0.2 1–4 \30
LN3 Lowland \5 3–15 0.05–0.2 1–4 30–90
LN6 Boreal \5 3–15 0.05–0.2 1–4 30–90
LN1 Lowland \5 3–15 0.2–1 4–20 \30
LN4 Boreal \5 3–15 0.2–1 4–20 \30
LN8 Lowland [5 3–15 0.2–1 4–20 30–90
Central GIG
L-CB1 Lowland – 3–15 [1 [20 \30
L-CB2 Lowland – \3 [1 [20 \30
L-CB3 Lowland – \15 0.2–1 4–20 \30
Table 2 Linear regressions
for Fig. 2
R-list: the overall
REBECCA species
classification list for the
whole dataset; N-list: the
species classification list for
N-GIG; C-list: the species
classification list for C-GIG
Figure no Graph Equation R2 N
2a Rebecca y = -33.752Ln(x) + 113.75 0.3981 1,294
2b Central lakes y = -21.179Ln(x) + 74.21 0.3091 231
2c Nordic lakes y = -23.994Ln(x) + 122.67 0.4327 932
2d N-GIG (Rebecca list) y = -27.269Ln(x) + 109.83 0.3954 932
N-GIG (Nordic list) y = -23.994Ln(x) + 122.67 0.4327 932
C-GIG (Rebecca list) y = -13.093Ln(x) -7.9753 0.1927 231
C-GIG (Central list) y = -21.179Ln(x) + 74.21 0.3091 231
2e LCB1 y = -6.232Ln(x) + 24.921 0.0543 72
LCB2 y = -22.631Ln(x) + 72.857 0.3078 120
LCB3 y = -16.65Ln(x) + 75.239 0.2912 39
2f LN1 y = -18.098Ln(x) + 100.22 0.3047 57
LN2a + b y = -9.4927Ln(x) + 99.833 0.07267 63
LN3 y = -16.486Ln(x) + 111.62 0.2343 143
LN5 y = -4.0267Ln(x) + 96 0.091 14
LN6 y = -8.1338Ln(x) + 111.15 0.1395 29
LN8 y = -25.498Ln(x) + 131.57 0.4361 92
2g Nordic list y = -18.574Ln(x) + 116.11 0.3019 399
Finnish list y = -21.003Ln(x) + 117.16 0.3449 417
2h N-GIG (Nordic list) y = -23.994Ln(x) + 122.67 0.4327 932
Finland (Finnish list) y = -21.003Ln(x) + 117.16 0.3449 417
Norway (Norwegian list) y = -32.283Ln(x) + 125.83 0.6945 234
258 Aquat Ecol (2008) 42:253–264
123
scores derived from analysis of 3 different data
subsets (CH—Central GIG High alkalinity lakes; C-
GIG—Central GIG; NL—Dutch species classifica-
tion). The classifications of Penning et al. (this issue)
were used for CH and C-GIG analyses, and the
classification in Van den Berg (2004) for the Dutch
species classification. All classifications were used
with presence/absence and abundance values (Fig. 4).
The resulting index values depend strongly on the
species classification method used and the underlying
dataset used to derive the classification (following
Penning et al., this issue). Using the species lists
from the Central GIG (either presence/absence or
abundance) the index suggests that the species
composition changes slowly, with a slight improve-
ment in 2003. Using the Dutch species list (defined
by national experts) the obtained value of the index is
on average 30 points higher than using the European
species lists, but still does not rise above zero
indicating that sensitive species never become more
abundant than tolerant species. The total P decreased
sharply from 1995 to 1996, but this was not reflected
in a response by the index. Even though the index is
transparent and easy to calculate its insensitivity
restricts its use for lake management to assess
eutrophication impact on the macrophyte community
in this specific lake.
The LTR was plotted against Total P for three
shallow, high-alkalinity lakes in the Netherlands, for
which a time series longer than 2 years was available
(Fig. 5). None of the other lakes in the REBECCA
database has such longer time series for assessment of
the response of the index following changes in the
ecosystem. The three Dutch lakes have been inten-
sively investigated in the last decades due to their
changing eutrophication status. Lake Botshol fluctu-
ated between clear and turbid states during the period
1993–2003 (Simons et al. 1994; Rip et al. 2005),
while Lake Veluwe has re-established a highly valued
macrophyte community and clear waters after a
substantial reduction in nutrient load (Lammens et al.
2004; Van den Berg et al. 1997). Although Lake
Gooimeer displays high transparency, macrophyte
community has not recovered markedly. The lake’s
overall status has improved over the last decade, but
macrophytes for unknown reasons have responded
High Alkalinity Lakes Low-Moderate Alkalinity Lakes
CB-GIG Lake
Trophic Rank
R2 = 0.4302
1
0
2
3
4
5
6
7
R2 = 0.4586
R2 = 0.2605
1
2
3
4
5
6
7
N-GIG Lake
Trophic Rank
Log of total phosphorus concentration (µg P l-1)
R2 = 0.1127
0.5 1 1.5 2 2.5 3 0 0.5 1 1.5 2 2.5 3
Fig. 3 The relationships
between total phosphorus
(plotted on a logarithmic
scale) and Lake Trophic
Rank, calculated as the
average of trophic ranks of
all species found in each
lake (presence/absence data
only). Lakes have been
separated into Central
Baltic (top two panels) and
Nordic (bottom two panels)
GIG types, and into low-
moderate (\1 meq l-1) and
high ([1 meq l-1)
alkalinity classes. Squares
represent reference lakes
Aquat Ecol (2008) 42:253–264 259
123

only gradually to this improvement (pers. comm. R.
Portielje, RIZA, NL).
The response of the LTR in Botshol follows the
changes in total P, while in Lakes Veluwe and
Gooimeer, the decrease in total P is not reflected by
changes in the LTR. In fact, the LTR remains stably
higher in these lakes after the decrease of TP than it
was before. Improvements in total cover and maxi-
mum growing depth may give more precise additional
information to describe the positive changes in
macrophyte communities over time as observed in
the field.
The trophic indices were also examined to deter-
mine whether there was a relationship between
classification with the use of species presence com-
pared to abundance for different lake types in Norway
(Fig. 6). The Vansjø-Hobøl is a large lowland
catchment influenced by intensive agriculture, forest
and sewage, with varying eutrophication problems in
the interconnected lakes in the catchment. The eight
-100
-80
-60
-40
-20
0
20
40
60
80
100
1992 1993 1994 1995 1996 1997 1998 1999 2000 2001 2002 2003
Years
TI-
valu
e
0
20
40
60
80
100
120
tota
l P (
ug
l-1 )
TI(C) CHTI (C) C-GIGTI(C) NLTI(A) CHTI(A) C-GIGTI(A) NLtotal P
Fig. 4 Trophic Index (TI) results of Lake Veluwe (NL) from
1992 to 2003 using three different species scores derived from
analysis of three different data subsets (CH—Central GIG High
alkalinity lakes; C-GIG—Central GIG; NL—Dutch species
classification (Penning et al., this issue for CH and C-GIG) and
Van den Berg 2004 for NL). Trophic Index was calculated both
using presence/absence TI(C) and abundance TI(A) (in which
abundance was defined on a 1–3 scale according to ECO-
FRAME method, Moss et al. 2003)
0
20
40
60
80
100
120
140
160
180
4.4
4.6
4.8
5
5.2
5.4
5.6
5.8TP
LTR
Veluwemeer
198719
8819
8919
9019
9119
9219
9319
9419
9519
9619
9719
9819
9920
0020
0120
0220
0319
9819
9920
0020
0119
8719
8819
8919
9619
9719
9819
9920
0020
01
LTR
Tota
l pho
spho
rus
(µg
l-1)
Botshol Gooimeer
Fig. 5 Changes in measured total phosphorus and derived
LTR over multiple years, for three shallow, high alkalinity
Dutch lakes: Botshol, Gooimeer and Veluwemeer (see Rip
et al. 2005; Ibelings et al. 2007 for lake descriptions). Total
phosphorus values are growth-season averages and LTR has
been calculated using weighted averages of species trophic
rank, with originally supplied abundance data (ECOFRAME
scale, Moss et al. 2003)
260 Aquat Ecol (2008) 42:253–264
123

lakes in the catchment represent a large gradient in
eutrophication pressures, from the oligotrophic lake
Bindingsvatn in the upper part of the catchment to the
impacted lake Vanemfjorden in the lowest part. The
resulting values for the trophic indices correspond
well to earlier assessments based on other parameters
(Mjelde 2005a). Gjeving is a small catchment close to
the coast and influenced by acidification. None of the
four lakes has eutrophication pressure and the
phytoplankton and water chemistry data clearly show
oligotrophic conditions. The high index values cor-
respond well to the general understanding of the
trophic status of the lakes, for example, total phos-
phorus values vary between 3 and 10 lg P l-1, with
Litjenn as the most P-rich lake (Hindar et al. 2005).
Discussion
There are many indices available that describe
community characteristics of aquatic macrophytes.
Birk et al. (2006) tested some 70 different indices and
concluded that various groups of methods can be
identified that follow similar concepts. We therefore
selected only three indices for further testing of
community response to a eutrophication pressure:
species richness, an index based on the relative
abundance of tolerant and sensitive species (TI) and
the LTR index.
The species richness along the phosphorus gradient
for the used dataset is in line with the unimodal
response curve or ‘hump-back model’ of diversity
(Grime 1979). Eutrophication in oligotrophic lakes
thus can be shown by an increase in number of species,
while eutrophication in natural mesotrophic lakes
shows a decrease in species richness. Murphy (2002),
Rørslett (1991) and Mjelde (1997) obtained similar
results for various studies in Scandinavia. As species
richness in this dataset shows no clear (linear/log
linear) negative response to eutrophication pressure
throughout Europe, its value as index is limited for
status assessment to meet WFD requirements.
The indices based on the relative abundance of
sensitive and tolerant species assume that the abun-
dance of sensitive species decreases while the tolerant
species increase with increasing eutrophication. How-
ever, most of the tolerant species seem to require a
certain threshold level of alkalinity. For instance, in
Norwegian low-moderate alkalinity lakes 65% of the
species are classified as sensitive, while 18% are
classified as tolerant. Few of the tolerant species seem
to appear in lakes with alkalinity\0.2 meq l-1, i.e. the
low alkalinity lakes have very few tolerant species. In
such lakes, the TIC seems to remain high, compared to
other lake types, even at eutrophic conditions.
The TIC appears valid in situations where eutro-
phication is known to be the dominant pressure on the
system. The index shows a decreasing trend with an
increase of total phosphorus. This is partly because
species sensitivity and tolerance have also been set
based on their occurrence along a phosphorus gradi-
ent, but this is true for all indices based on sensitive
vs. tolerant species. Variation around the average
response can be due to unknown disturbance and
geographical factors as well as environmental vari-
ables other than trophic state that control species
distributions.
In general, trophic indices based on sensitive and
tolerant species cannot be used for lakes with very
few or zero species, as also mentioned by
-100
-50
0
50
100
-100 -50 0 50 100
TIA
TIC
Bindingsvatn
Våg
Langen
StorefjordenVanemfjorden
Mjær
SæbyvannetBjørnerødvann
-100
-50
0
50
100
-100 -50 0 50 100
TIA
TIC
Gulspettvatn
StørdalsvatnHofsdalsvatn
Litjenn
a
b
Fig. 6 Relationship between the calculated Trophic Index
using abundance data TI(a) on the x-axis and Trophic Index
using presence/absence data TI (c) on the y-axis. Results for
Norwegian lakes with lakes of 2 specific catchments high-
lighted in red. (a) Eutrophic lakes in Vansjø-Hobøl catchment,
(b) oligo-mesotrophic lakes in Gjeving catchment. Redrawn
from Mjelde (2005b)
Aquat Ecol (2008) 42:253–264 261
123
Schaumburg et al. (2004). This implies that such
indices always have to be supported by other metrics,
such as the extent of macrophyte coverage (%) of the
shallow zones or maximum colonization depth,
especially when discussing hypertrophic conditions,
where absence of specific macrophyte species, such
as large isoetids or charophytes, or the dominance of
a specific tolerant species is to be expected.
The TI based on only presence or absence (TIC)
will not reflect changes in relative abundance of
species, as might be expected when, in response to
eutrophication pressure, the abundance of sensitive
species declines relative to that of their tolerant
competitors. In this situation some specimens of
sensitive species may survive in impacted lakes with
a higher trophic status, but will no longer exist in
large stands. An index using change in abundance, as
TIA, is, therefore, preferred. Comparison between
these two indices has been tested for the Norwegian
lakes (Fig. 6) and, contrary to expectations, the
regression with total P was better for TIC than for
TIA in this comparison (r2 = 0.69 for TIC and
r2 = 0.56 for TIA).
For moderate-low alkalinity lakes in the Northern
GIG both TIC and TIA displayed a good relationship
between macrophyte community composition and a
eutrophication gradient. Central GIG macrophyte
communities showed a limited response to total P.
This might be due to the fact that macrophytes are
known not to respond immediately to changes in
water chemistry, but only after a period of time
changes in community structure can be observed
(Jeppesen et al. 2005). Many of the Central GIG lakes
have been undergoing changes in trophic status in the
past decades due to land use practices and are
currently starting recovery. This phenomenon is
poorly reflected in our dataset, as for most lakes it
lacks the time series needed to analyse changes over
time. Also, other effects, such as the effects of lake
morphometry on eutrophication characteristics (Gen-
kai-Kato and Carpenter 2005; Hakanson 2005) and
the responses of macrophytes to light limitation by
factors other than eutrophication, could be important
(Barko et al. 1991). This could not be verified with
the available data of this project as information on
morphometry, suspended solids and water colour
were not available. The maximum depth of occur-
rence of macrophytes as a response to eutrophication
pressure is suggested for use to define boundaries for
status assessment (Phillips and Van den Berg 2007)
which is in line with findings of, for example,
Middleboe and Markager (1997). At present maxi-
mum depth of macrophyte occurrence is seldom
monitored, and lack of data is the largest problem in
assessing this method on a Europe-wide scale.
Although limited, the examples of individual lakes
show that the use of TI and LTR indices does not
necessarily correctly represent the ecological
response of lakes; therefore, care needs to be taken
if such indices are used to define the lake’s status.
The use of multimetric approaches has been sug-
gested by various individual EU member states, e.g.
the Netherlands (Van der Molen et al. 2004),
Denmark (Søndergaard et al. 2005), Belgium (Leys-
sen et al. 2005) and Ireland (Free et al. 2006). All
these approaches incorporate multiple aspects of the
macrophyte community, such as abundance, percent-
age cover of different growth forms (e.g. charids,
nymphaeids etc.), exotic species, maximum depth of
occurrence, etc. Unfortunately the REBECCA dataset
was not suitable to assess these multimetric methods
Europe-wide. In addition, data on only a limited
number of environmental variables were available:
total P, Secchi depth and Chlorophyll-a concentra-
tion. We tested the multimetric approach currently
used in Ireland on a small group of lakes in Norway
and found these to respond as expected (see Lyche
Solheim 2006 for results).
Currently, eutrophication is considered the main
pressure for lakes, but hydromorphological pressures
and combined (toxic, hydromorphological and eutro-
phication) pressures are also likely to be important
and require more research. At present, Europe-wide
data on hydromorphological pressures are scarce,
which hampers the attempts to optimize pressure-
impact relationships and to assess ecological quality
status boundaries for macrophytes as required by the
WFD.
Harmonizing sampling methods and types of
information collected for both macrophytes and sup-
porting environmental variables on a GIG/Europe
wide scale is necessary for Europe-wide assessments
and intercalibration. For example, maximum depth of
occurrence, sediment typology, humic content and
light attenuation should also be considered in macro-
phyte surveys. Other important factors are considered
to be suspended solids, light attenuation related to the
depth at the sampling location, internal and external
262 Aquat Ecol (2008) 42:253–264
123
loading, shoreline slope and wind fetch. With these, an
accurate assessment of the influence of pressures in the
context of other important environmental factors in an
individual lake becomes feasible.
Conclusions
Changes in macrophyte communities due to eutrophi-
cation can be quantified using indices, such as the TI
and the LTR index. Especially in lakes known to be
only exposed to eutrophication pressure, such as is
often the case in the Nordic GIG lakes, the macro-
phyte community changes are reflected in the
resulting indices values. However, various aspects of
these indices need to be considered, when translating
the results to a judgement on the ecological status of a
lake system: the selected database and method used
for classification of species as sensitive and tolerant
may influence the exact index value, and cause large
the variability around the average response. The
uncertainty derived from this variability indicates that
the result of the single index alone is not always
sufficient to understand and predict how a lake
macrophyte community changes along the eutrophi-
cation pressure gradient. Combing the results of the
eutrophication indices with additional environmental
variables and other macrophyte community charac-
teristics may help in enhancing the accuracy of status
assessment as required for the WFD.
Acknowledgements REBECCA was funded by the
European Commission under the 6th Framework Program,
Contract No.: SSP1-CT-2003-502158—REBECCA. The
authors thank all intercalibration representatives who
contributed to the realization of the database and the
formulation of ideas and concepts during discussions in
REBECCA and GIG meetings: Laszlo Toth (JRC), Deirdre
Tierney (IE). We are grateful to data suppliers for their
willingness to supply data for the REBECCA dataset of
European macrophyte data: Heikki Toivonen (SYKE, Finland),
Tapio Rintanen (Finland), Helle Maemets (Centre for
Limnology, Estonia), Luc DeNeijs (Institute of Nature
Conservation, Belgium), Vaida Olsauskyte (Lithuanian
Environmental Protection Agency, Lithuania), Hanna Soszka
(Institute of Environmental Protection, Poland), Arie Naber
(Institute for Inland Water Management and Waste Water
Treatment, the Netherlands), Gary Free (EPA, Ireland). Gary
Free (EPA, Ireland) and Eddy Lammens (Institute for Inland
Water Management and Waste Water Treatment, the
Netherlands) provided valuable comments to earlier versions
of this manuscript.
References
Barko JW, Gunnison D, Carpenter R (1991) Sediment interac-
tions with submersed macrophyte growth and community
dynamics. Aquat Bot 41:41–65
Birk S, Korte T, Hering D (2006) Intercalibration of assess-
ment methods for macrophytes in lowland streams: direct
comparison and analysis of common metrics. Hydrobio-
logia 566:417–430
Ecke F (2007) Bedomningsgrunder for makrofyter i sjoar –
Bakgrundsrapport (in Swedish). Lulea University of
Technology, Department of Chemical Engineering and
Geosciences, Research Report 2007:17, 35 pp
European Union (2000) Directive 2000/60/EC of the European
Parliament and of the Council of 23 October 2000
establishing a framework for Communities in the field of
water policy, Official Journal of the European Commu-
nities, L 327/1, 22.12.2000
Free G, Little R, Tierney D, Donnelly K, Caroni R (2006) A
reference based typology and ecological assessment system
for Irish lakes—preliminary investigations. Environmental
Protection Agency, Wexford. www.epa.ie
Genkai-Kato M, Carpenter SR (2005) Eutrophication due to
phosphorus recycling in relation to lake morphometry,
temperature and macrophytes. Ecology 86:210–219
Grime JP (1979) Plant strategies and vegetation processes.
Wiley, New York
Hakanson L (2005) The importance of lake morphometry and
catchment characteristics in limnology––ranking based on
statistical analysis. Hydrobiologia 541:117–137
Heiskanen AS, Van der Bund WJ, Cardoso AC, Noges P
(2004) Towards good ecological status of surface waters
in Europe—interpretation and harmonisation of the con-
cept. Water Sci Technol 49(7):169–177
Hindar A, Moy F, Bækken T, Mjelde M, Nilsen JP, Kroglund T
(2005) Forvaltning av mindre vassdrag i lys av Van-
nrammedirektivet – Gjevingevassdraget i Tvedestrand.
NIVA-rapport lnr. 5041-2005
Ibelings BW, Portielje R, Lammens EHHR, Noordhuis R, Van
den Berg MS, Joosse W, Meijer ML (2007) Resilience of
alternative stable states during the recovery of shallow
lakes from eutrophication: Lake Veluwe as a case study.
Ecosystems 10(1):4–16
Jeppesen E, Søndergaard M, Jensen JP, Havens KE et al (2005)
Lake responses to reduced nutrient loading—an analysis
of contemporary long-term data from 35 case studies.
Freshw Biol 50:1747–1777
Lammens EHRR, Van Nes EH, Meijer ML, Van den Berg MS
(2004) Effects of commercial fishery on the bream pop-
ulation and the expansion of Chara aspera in Lake
Veluwe. Ecol Modell 177:233–244
Leka J, Toivonen H, Leikola N, Hellsten S (2007) Makrofyytit
Suomen jarvien ekologisen tilan ilmentajina. Valtakunn-
allisen makrofyyttiaineiston kaytto ekologisen tila-
luokittelun kehittamisessa. Suomen ymparistokeskuksen
raportteja 2007. 42 p. + app
Leyssen A, Adriaens P, Denys L, Packet J, Schneiders A, Van
Looy K, Vanhecke L (2005) Toepassing van verschillende
biologische beoordelingssystemen op Vlaamse potentiele
interkalibratielocaties overeenkomstig de Europese
Aquat Ecol (2008) 42:253–264 263
123
Kaderrichtlijn Water – Partim ‘Macrofyten’. Rapport van
het Instituut voor Natuurbehoud IN.R. 2005.05 in opd-
racht van VMM, Brussel
Lyche Solheim A (ed) (2006) Dose–response relationships
between biological and chemical elements in different lake
types. REBECCA report D11. (www.rbm-toolbox.net/
docstore/docs/3.1713.D11.pdf)
Middleboe AL, Markager S (1997) Depth limits and minimum
light requirements of freshwater macrophytes. Freshw
Biol 37:553–568
Mjelde M (1997) Virkninger av forurensning pa biologisk
mangfold: Vann og vassdrag i by- og tettstedsnære om-
rader. Vannvegetasjon i innsjøer - effekter av eutrofiering.
En kunnskapsstatus. Norsk institutt forvannforskning.
NIVA-rapport 3755-97 (in Norwegian)
Mjelde M (2005a) Vansjø-Hobøl-vassdraget. Økologisk status
for vannvegetasjon i 2004. NIVA-rapport lnr. 5036-2005
(in Norwegian)
Mjelde M (2005b) EU Water Framework Directive: ecological
status assessment. Aquatic Macrophytes. NIVA Project
Facts. September 2005
Mjelde M (2007) Macrophytes and eutrophication in lakes
(unpublished document)
Moe SJ, Dudley B, Ptacnik R (2008) REBECCA databases:
experiences from compilation and analyses of monitoring
data from 5,000 lakes in 20 European countries. Aquat
Ecol. doi:10.1007/s10452-008-9190-y
Moss B, Stephen D, Alvarez C, Becares E, Van der Bund W,
Collings SE et al (2003) The determination of ecological
status in shallow lakes––a tested system (ECOFRAME) for
implementation of the European Water Framework Direc-
tive. Aquatic Conserv Mar Freshw Ecosyst 13:507–549
Murphy KJ (2002) Plant communities and plant diversity in
softwater lakes of northern Europe. Aquat Bot 73(4):287–
324
O’Hare MT, Baattrup-Pedersen A, Nijboer R, Szoszkiewicz K,
Teresa Ferreira T (2006) Macrophyte communities of
European streams with altered physical habitat. Hydrobi-
ologia 566:197–210
Penning WE, Mjelde M, Dudley B, Hellsten S, Hanganu J,
Kolada A, Van den Berg M, Poikane S, Phillips G, Willby
N, Ecke F (2008) Classifying aquatic macrophytes as
indicators of eutrophication in European lakes. Aquat
Ecol. doi:10.1007/s10452-008-9182-y
Phillips G, Van den Berg M (2007) CGIG Milestone 6 report
Rip WJ, Ouboter M, van Nes EH, Beltman B (2005) Oscilla-
tion of a shallow lake ecosystem upon reduction in
external phosphorus load. Archiv fur Hydrobiologie
164:387–409
Rørslett B (1991) Principal determinants of aquatic macrophyte
richness in northern European lakes. Aquat Bot 39:173–
193
Schaumburg J, Schranz C, Hofmann G, Stelzer D, Schneider S,
Schmedtje U (2004) Macrophytes and phytobenthos as
indicators of ecological status in German lakes—a con-
tribution to the implementation of the Water Framework
Directive. Limnologica 34:302–314
Simons J, Ohm M, Daalder R, Boers P, Rip W (1994) Resto-
ration of Botshol (The Netherlands) by reduction of
external nutrient load: recovery of a characean commu-
nity, dominated by Chara connivens. Hydrobiologia 275/
276:243–253
Søndergaard M, Jeppesen E, Peder JJ, Lildal SA (2005) Water
Framework Directive: ecological classification of Danish
lakes. J Appl Ecol 42(4):616–629 Aug
Stelzer D, Schneider S, Melzer A (2005) Macrophyte based
assessment of lakes—a contribution to the implementation
of the European Water Framework Directive in Germany.
Int Rev Hydrobiol 90(2):223–237
Van den Berg MS (2004) Achtergrondrapportage referenties en
maatlatten waterflora. Rapportage van de expertgroepen
macrofyten en fytoplankton. STOWA report
Van den Berg MS, Coops H, Meijer ML, Scheffer M, Simons J
(1997) Clear water associated with a dense Chara vege-
tation in the shallow and turbid Lake Veluwemeer. The
Netherlands
Van der Molen DT, Latour P, Stronkhorst J, Van der Wal B
(2004) Ecologische referenties en maatlatten voor de
Kaderrichtlijn Water. H2O 6:10–12
Willby N, Pitt J, Phillips G (2006) Summary of approach used
in LEAFPACS for defining ecological quality of rivers
and lakes using macrophyte composition. Draft Report
January 2006
264 Aquat Ecol (2008) 42:253–264
123