Updated common bio-physical criteria to define natural ...
76
HAL Id: hal-02807751 https://hal.inrae.fr/hal-02807751 Submitted on 6 Jun 2020 HAL is a multi-disciplinary open access archive for the deposit and dissemination of sci- entific research documents, whether they are pub- lished or not. The documents may come from teaching and research institutions in France or abroad, or from public or private research centers. L’archive ouverte pluridisciplinaire HAL, est destinée au dépôt et à la diffusion de documents scientifiques de niveau recherche, publiés ou non, émanant des établissements d’enseignement et de recherche français ou étrangers, des laboratoires publics ou privés. Updated common bio-physical criteria to define natural constraints for agriculture in Europe Jos van Orshoven, J.M. Terres, Tibor Tóth, Robert Jones, Christine Le Bas, Freddy Nachtergaele, David Rossiter, Jos van Orshoven, Rogier Schulte, Harrij van Velthuizen To cite this version: Jos van Orshoven, J.M. Terres, Tibor Tóth, Robert Jones, Christine Le Bas, et al.. Updated common bio-physical criteria to define natural constraints for agriculture in Europe: Definition and scientific justification for the common biophysical criteria : technical factsheets. 2012. hal-02807751
-
Upload
khangminh22 -
Category
Documents
-
view
2 -
download
0
Transcript of Updated common bio-physical criteria to define natural ...
HAL Id: hal-02807751https://hal.inrae.fr/hal-02807751
Submitted on 6 Jun 2020
HAL is a multi-disciplinary open accessarchive for the deposit and dissemination of sci-entific research documents, whether they are pub-lished or not. The documents may come fromteaching and research institutions in France orabroad, or from public or private research centers.
L’archive ouverte pluridisciplinaire HAL, estdestinée au dépôt et à la diffusion de documentsscientifiques de niveau recherche, publiés ou non,émanant des établissements d’enseignement et derecherche français ou étrangers, des laboratoirespublics ou privés.
Updated common bio-physical criteria to define naturalconstraints for agriculture in Europe
Jos van Orshoven, J.M. Terres, Tibor Tóth, Robert Jones, Christine Le Bas,Freddy Nachtergaele, David Rossiter, Jos van Orshoven, Rogier Schulte,
Harrij van Velthuizen
To cite this version:Jos van Orshoven, J.M. Terres, Tibor Tóth, Robert Jones, Christine Le Bas, et al.. Updated commonbio-physical criteria to define natural constraints for agriculture in Europe: Definition and scientificjustification for the common biophysical criteria : technical factsheets. 2012. �hal-02807751�
Updated common bio-physical criteria to definenatural constraints for agriculture in Europe
Definition and scientific justification for the common biophysical criteria
Editors: Jos Van Orshoven, Jean-Michel Terres, Tibor Tóth
Contributors: Robert Jones, Christine Le-Bas, Freddy Nachtergaele, David Rossiter, Jos Van Orshoven, Rogier Schulte, Harrij van Velthuizen
EUR 25203 EN - 2012

Updated common bio-physical criteria to define natural constraints for agriculture in Europe
Definition and scientific justification for the common biophysical criteria; Technical Factsheets
Editors: Jos Van Orshoven1, Jean-Michel Terres2, Tibor Tóth2
Contributors: Robert Jones3, Christine Le-Bas4, Freddy Nachtergaele5, David Rossiter6, Jos Van Orshoven1, Rogier Schulte7, Harrij van Velthuizen8
1 Department of Earth and Environmental Sciences, Katholieke Universiteit Leuven, Belgium 2 Rural, Water and Ecosystems Unit, Institute for Environment and Sustainability, Joint Research Centre of the European Commission, Ispra, Italy 3 Cranfield University, United Kingdom 4 Institut National de la Recherche Agronomique, Orleans, France 5 Food and Agriculture Organisation of the United Nations, Rome, Italy 6 International Institute for Geo-Information Science and Earth Observation, Enschede, the Netherlands 7 Teagasc Environment Research Centre, co Wexford - Ireland 8 International Institute for Applied Systems Analysis, Laxenburg, Austria
EUR 25203 EN - 2012
4
The mission of the Institute for Environment and Sustainability is to provide scientific-technical support to the European Union’s Policies for the protection and sustainable development of the European and global environment. European Commission Joint Research Centre Institute for Environment and Sustainability Contact information Address: JM Terres, Joint Research Centre Institute for Environment and Sustainability Tel.: +39 0332 78 5254 Fax: +39 0332 78 5230 http://ies.jrc.ec.europa.eu/ http://www.jrc.ec.europa.eu/ Legal Notice Neither the European Commission nor any person acting on behalf of the Commission is responsible for the use which might be made of this publication.
Europe Direct is a service to help you find answers to your questions about the European Union
Freephone number (*):
00 800 6 7 8 9 10 11
(*) Certain mobile telephone operators do not allow access to 00 800 numbers or these calls may be billed.
A great deal of additional information on the European Union is available on the Internet. It can be accessed through the Europa server http://europa.eu/ JRC68682 EUR 25203 EN ISBN 978-92-79-23066-0 ISSN 1831-9424 doi : 10.2788/91182 Luxembourg: Office for Official Publications of the European Communities © European Communities, 2012 Reproduction is authorised provided the source is acknowledged Cover photograph: Courtesy of M Siitonen Printed in Italy

5

6

7
8
Foreword This work is part of the technical support provided by the Joint Research Centre – Institute for Environment and Sustainability (JRC –IES) to the Directorate General for Agriculture and Rural Development (DG AGRI). The purpose of this document is to provide the scientific background information and agronomic rationale for criteria identifying natural significant constraints to agriculture. The guiding objectives for identifying the current set of criteria stemmed from Council Regulation (EC) No 1698/2005 which referred to areas affected by natural handicaps1, notably low soil productivity or poor climate conditions". These provisions only concerned areas facing natural handicaps other than mountain and other than areas with specific handicaps (i.e "intermediate LFA or LFA under article 19). While the initiative of this report is clearly motivated by policy requirements mentioned just above, the content of this document is the outcome of a group of independent experts from various national and international organisations, whose contributions have been coordinated by the JRC. Therefore, the information contained in the factsheets presented later in this report, are a mere description of a scientifically robust description of soil and climate restrictions to agriculture in a European context.
These factsheets are the outcome of a scientific working group and can not prejudge the content of the new regulation and the final political decision on the criteria to be used for the delimitation of natural constraints to agriculture in the European Union. This report is based on a full range of scientific information:
• An extensive literature review made by JRC scientists on "agricultural land evaluation methods" used in different part of the world, together with a critical analysis of their respective aims, advantages and limitations.
• Several expert meetings held in 2006, 2007 and 2008 by the Joint Research Centre in Ispra (Italy) with a panel of more than 15 experts from various scientific organisations and a subset of experts contributing to this report, several representatives of DG Agriculture and Rural Development and several scientists from the Joint Research Centre.
• The review by a panel of soil, climate and agronomic (national and international) experts of land evaluation methods in order to identify a set of criteria supporting the delineation of areas with natural constraints, also called “intermediate Less Favoured Areas” for agriculture in EU27.
• Findings of the testing of an initial set of criteria as agreed by the Council (Council Conclusions adopted on 22 June 2009). The simulations of biophysical criteria made by MS with their own datasets has led to an assessment of the applicability of the criteria. More than hundred technical bilateral meetings with MS representatives and MS technical experts have provided feedbacks from MS simulations exercise; this knowledge has been taken into account in the updating of the initial set of criteria.
This report includes: background information to the Less Favoured Areas (objectives of the project and context); an abstract / executive summary of the report; an introduction; a
1 Despite Council Regulation (EC) No 1698/2005 refers to "natural handicaps", the terminology "Less Favoured Areas" will be utilised in this report as it is more widely used and for a longer time by practitioners.
9
problem statement describing the boundaries conditions of the exercise; materials and methods followed; results in term of adopted statements and findings; conclusions; and references. For each criterion proposed by the panel of experts, the agronomic rationale, the definition, the scientific background, the assessment, the values for severe threshold, the conclusions and some references are provided as factsheets in the annexes. This scientific information is aimed to be a base for Member States to simulate the bio-physical criteria, whose aim is to identify areas facing natural (soil and climate) constraints to agriculture.
Acknowledgements
This work results from the compilation made by J Van Orshoven, JM Terres and T Tóth from contributions provided by a panel of experts (Robert Jones, Christine Le-Bas, Freddy Nachtergaele, David Rossiter, Rogier Schulte, J Van Orshoven and Harrij van Velthuizen). In addition, others experts have been contacted on an ad-hoc basis to provide inputs and advices on specific points. There were: F Bouraoui and R Gommes (JRC), G Fischer and E Teixeira (IIASA), R Fealy (Teagasc). Thank you to all of them to have dedicated some of their limited available time to the provision of scientific inputs and edition of factsheets. The panel of experts have themselves relied on studies carried-out by colleagues as well as previous literature and references which shall be acknowledged. Many thanks to Ase Eliasson who initiated the scientific network and whose scientific reports have been used in this work.
10
Contents Abstract / Executive summary ................................................................................................. 11 1 Policy background ........................................................................................................... 12
1.1 Objectives of the LFA scheme .................................................................................. 12 1.2 Categories .................................................................................................................. 12
2 Support activity from the Joint Research Centre (JRC) ................................................... 14 2.1 New definition for areas facing natural constraints – DG AGRI mandate ............... 14 2.2 Source of information - working procedures ............................................................ 14 2.3 Technical framework ................................................................................................. 14
3 Problem statement ............................................................................................................ 16 3.1 Materials and methods .............................................................................................. 17 3.2 Results ....................................................................................................................... 17
4 Discussion ........................................................................................................................ 20 5 Conclusions ...................................................................................................................... 21 6 References ........................................................................................................................ 23 7 Annexes: Factsheets of the proposed criteria ................................................................... 26
Criterion 1 “Low temperature” ........................................................................................ 28 Criterion 2 “Dryness - Too dry conditions” ..................................................................... 32 Criterion 3 “Limited soil drainage” ................................................................................. 36 Criterion 4 “Unfavourable Soil Texture and Stoniness” .................................................. 46 Criterion 5 “Shallow Rooting Depth” .............................................................................. 52 Criterion 6 “Poor Chemical Properties” .......................................................................... 56 Criterion 6.1 “Soil salinity” ............................................................................................. 56 Criterion 6 “Poor Chemical Properties” .......................................................................... 60 Criterion 6.2 “Soil Sodicity” ............................................................................................ 60 Criterion 6 “Poor Chemical Properties” .......................................................................... 64 Criterion 6.3 “Soil acidity” .............................................................................................. 64 Criterion 7 ”Steep Slope”................................................................................................. 68

11
Abstract / Executive summary A panel of soil, climate and land evaluation experts reviewed a set of land evaluation methods in order to elaborate an approach which can support the identification of natural constraints to agriculture in the EU27. The driver for this exercise is Article 50.3 of EC-Regulation 1698/2005 calling for the revision of the existing system based on criteria related to low soil productivity and poor climate conditions for agriculture and the consequent Communication from the Commission: "Towards a better targeting of the aid to farmers in areas with natural handicaps" of 21 Apr. 2011. The FAO’s agricultural problem land approach was selected and adjusted to come forward with the policy requirement. The FAO approach was deemed appropriate because it is not crop-specific and for its simple assumptions regarding the mutual interaction of land characteristics on the overall suitability of the land, making it applicable for a territory as large and diverse as the EU27. Two climatic and four soil criteria were retained and complemented by one integrated soil-climate criterion (Excess soil moisture – Field Capacity duration), with slope as the sole topographic criterion. For each criterion a critical limit was defined dividing the criterion range into two categories: not limiting and severely limiting for agriculture. The criteria and the associated critical limits or threshold values have been tested by Member States of the European Union. Feedbacks and suggestions from Member States simulations have been taken into account to update the initial list of bio-physical criteria so that the applicability is ensured in EU27. Therefore, they can be used in Member States to discriminate land with biophysical constraints to agricultural production on the basis that soil and climate data have sufficient spatial and semantic details. This document provides the scientific and agronomic rationale for bio-physical criteria identifying natural constraints (soil and climate) to agriculture in EU27.
12
1 Policy background
1.1 Objectives of the LFA scheme Certain rural areas are classified as Less Favoured Areas (LFA) because conditions for farming are more difficult due to natural constraints, which increase production costs and reduce agricultural opportunities. The aid for the LFA in the European Union (EU) dates back to 1975 and has since then undergone several reforms from addressing rural depopulation towards increased focus of maintaining certain agricultural land use and environmental protection. In addition, over time Member States have been offered increased flexibility of the implementation of the measure, i.e. Member States were responsible for changing the LFA classified, which has resulted in regional differences on how the measure is applied within the Member States. European Rural Development Policy is currently governed by Council Regulation (EC) No 1698/2005. Council Regulation (EC) No 1257/1999 was repealed as of 1 January 2007 with the exception of certain provisions concerning the delimitation of areas with natural handicaps other than mountain. Indeed, provisions made in Council Regulation 1698/2005 for the delimitation of areas others than mountain have not come into force since the act of Council required by Article 94 has not been enacted. Hence, articles 50(3), 50(4) second indent of Council Regulation (EC) No 1698/2005 are not in force and the regulation still governing the delimitation of the LFA measure is still Council Regulation (EC) No. 1257/1999. However, the revision of the delimitation is now foreseen to be made in the next programming period (2014-2020), following the same policy rationale as in Regulation (EC) No 1698/2005: i.e. designation of areas facing natural constraints, namely the presence of low soil productivity and poor climate conditions affecting agricultural activity.
1.2 Categories There are three categories classified as LFA. Each category covers a specific cluster of natural or specific handicaps in Europe in which the continuation of agricultural land use is threatened. • Mountain areas – are characterised as those areas handicapped by a short growing
season because of a high altitude, or by steep slopes, or by a combination of the two at a lower altitude. Areas north of 62nd parallel are also considered as mountain areas due to the shortened growing period. • Intermediate LFA – are those areas affected by significant natural handicaps, notably a
lowsoil productivity or poor climate conditions and where maintaining extensive farming activity is important for the management of the land • Areas affected by specific handicaps - are areas where farming should be continued in
order to conserve or improve the environment, maintain the countryside, and preserve the tourist potential of the areas, or in order to protect the coastline.

13
14
2 Support activity from the Joint Research Centre (JRC)
2.1 New definition for areas facing natural constraints – DG AGRI mandate
In 2006, DG Agriculture and Rural Development and the JRC agreed on a joint technical activity to support the identification of possible criteria for the designation of the “Intermediate LFAs”.
The JRC has provided technical support by defining a series of Soil and Climate criteria for defining agricultural areas which are less favourable for agriculture in Europe.
The boundary conditions as specified by DG Agriculture and Rural Development clearly mentioned:
• The classification relates to areas that have natural handicaps to agriculture and not to how the land is managed (e.g. irrigation or drainage);
• Criteria have to apply to agricultural activity in general, not to specific production/crops, so as to avoid any production related support. They implicitly refer to conventional agriculture;
• The criteria concern the area designation and not the LFA scheme as whole (no eligibility rules, no payment calculation at this stage);
• Criteria have to be adapted for pan-European assessment. They have to provide a common framework and cover the whole range of European bio-physical conditions;
• Criteria must be clear, simple, robust, easily understandable and fit for policy use.
2.2 Source of information - working procedures The project started with an intensive search of information related to similar topics, in particular:
• Previous research projects: crop modelling, land quality evaluation, agro-meteorological zoning;
• Compilation from scientific literature; • Network of experts in the field of land quality assessments, soil, climate,
environment, agriculture. Ad-hoc expert meetings at JRC; • Consultation with international organisations, research institutes and universities:
Cranfield University, Food and Agriculture Organisation (FAO), International Institute for Applied Systems Analysis (IIASA), Institut National de la Recherche Agronomique (INRA), Katholieke Universitet Leuven (KUL), International Institute for Geo-Information Science and Earth Observation (ITC), Teagasc Agriculture and food development authority;
• An ad-hoc consultancy was organised by JRC with top European experts, specialist in agro-meteorology (soil and climate issues in agriculture);
• Technical bilateral meetings with MS authority and their respective experts.
2.3 Technical framework Soil, climate and terrain are the major determinants of land suitability for agricultural use. Every crop type has a set of requirements with regards to soil and climate. To yield a harvest, a crop needs sufficient physical stability, sufficient but not too much heat and photo-synthetically active radiation, oxygen, water and nutrients, in the absence of toxic substances or damaging impacts from storms or pests.
15
The fact that crop requirements for stability, heat, radiation, oxygen, water, nutrients and absence of toxins and damaging agents must be met by the conditions or ‘services’, supplied by the prevailing soil and climate, is the basis for the science and practice of physical land evaluation (FAO 1976; Bouma 1989; van Diepen et al., 1991).
For keeping the method simple, robust and transparent, a restricted selection of elementary soil, climate and terrain characteristics is made which are judged to be most pertinent for distinguishing land according to its suitability for the generic agricultural activity, and the interaction of the selected land characteristics on the growth of crops is accounted for by one additional characteristic, the excess soil moisture (based on a mass balance model). The reasons for choosing the modified “FAO Problem Land approach” rather than a more elaborated Land Quality approach (a part from its simplicity) can be explained by the objectives pursued i.e. to identify areas with constraints to agriculture and not to identify all necessary conditions to reach optimal production for each kind of crop. Also, the work has been focussed on the common criteria, their definition and thresholds for indicating biophysical constraints to agriculture; the application of criteria would be done in a different stage by Member States using their national / regional datasets.
16
3 Problem statement Regulation (EC) 1698/2005 provides for supports to farmers in areas with handicaps. Article 50.3 (a) of the same regulation defines the so-called “Intermediate Less Favoured Areas (iLFA)”1 as areas “affected by significant natural handicaps, notably a low soil productivity or poor climate conditions and where maintaining extensive farming activity is important for the management of the land”. This document refers to a possible common approach that could be used for assessing and defining natural constraints for agriculture in the EU27.
There are several issues which make this apparent simple endeavour more challenging:
1. Agriculture in Europe encompasses a wide range of crops. Requirements for services from soil and climate are mostly crop dependant. In its original and revised frameworks for land evaluation, FAO (1976; 2007) highlighted the difficulty to assess detailed suitability maps for agriculture as such. In line with the framework, suitability maps would have to be created for all individual crops or cropping systems present in the EU, then combined and interpreted. As a result it would be very complex to present one single suitability map encompassing the huge variety of crops and their possible combination in a territory as large and diverse as EU27.
2. Many soil and climate characteristics co-determine suitability and mutually interact.
Many elementary soil and climate characteristics affect the behaviour of crops and they do so in multiple ways (Thomasson and Jones, 1989). For example, soil depth is not only a measure of the volume which is available for growing roots, hence creating stability, but also co-determines the capacity to supply water and nutrients. In addition, many of the characteristics can interact. In general, the presence of a clayey layer limiting root development reduces suitability, but the presence of such layer at medium depth may be beneficial for sandy soils to create a perched water table that can compensate for the low water storage capacity of these soils. In order to overcome the potentially complex problem of matching multiple and interacting land characteristics (LC) with crop requirements, FAO (FAO 1976) introduced the concept of Land Quality (LQ). A LQ is defined as a combination of land characteristics which acts upon the suitability of the land for a given use (an agronomic function). A typical example of a land quality is “Water supply capacity”. This LQ is determined by soil characteristics such as depth, granulometry, bulk density, stoniness and by climatic characteristics such as amount and regime of precipitation and evaporative demand. The definition and quantification of all relevant LQs and their matching with the requirements of the multitude of crops is however beyond the scope of most land evaluation exercises covering large zones like EU27.
3. Delimitation of zones is conditioned by available data. Soil and climate characteristics are land attributes which typically show gradual change over space. For example, average temperature gradually decreases with increasing elevation, and average winter temperature increases with decreasing distance from the sea, while the opposite is often true for summer conditions. One consequence is that measurements of soil 1 The areas concerned are called 'Intermediate LFAs' to be distinguished from mountain LFAs and from LFAs with specific handicaps'
17
characteristics or climate features (however to a lesser extend) are valid only for the measurement location (soil sample locations, meteo-stations). In order to define land units and delimit zones, the point observations must be interpolated using specific techniques. These may be mathematical equations or based on expert-judgement. Soil maps are routinely created by an expert-based approach, by which soil polygons are delineated with the point observations as reference marks and landscape features providing the spatial basis for interpolation. The amount and density of data and the semantic detail available from the point observations determine the spatial and semantic resolution of the results that can be obtained. Few available point data, with few characteristics recorded with little detail, can only give rise to coarsely delineated areas. Climatic data are often interpolated in a mathematical way. The assumption of gradual change of the climate characteristics between the available measurement locations is however often not exactly in line with reality since also elevation, slope and orientation of slope i.e. co-determine climatic values (Ragg et al., 1988).
As a consequence, the problem of defining and delimiting land areas with low soil productivity and poor climate conditions can be resolved into 2 sub-problems:
• What are the soil and climate characteristics or qualities having a major and sufficiently independent contribution to the suitability of land for agriculture in a European perspective? How can these characteristics or qualities be assessed?
• What are the threshold values or critical scores for these characteristics or qualities to distinguish soils with low productivity from other soils and climates with poor conditions for agriculture from other climates?
3.1 Materials and methods In order to address the stated objectives, a panel of soil, climate and land evaluation experts was established by the EC’s Directorate General Joint Research Centre (JRC). Between May 2006 and June 2011, this panel met, on several occasions, with representatives of EC’s DG Agriculture and Rural Development and JRC. Regular communications had also taken place on specific criterion, definitions, thresholds or proposal of new criteria following development and feedbacks from Member States simulations.
The starting point for the expert panel was a review of possible land evaluation methods including the Land Capability Classification (Klingebiel and Montgomery, 1961), Framework for Land Evaluation (FAO, 1976; 2007), Agro-Ecological Zoning (FAO, 1978; 1996; Fischer et al., 2002), Agricultural Problem Land Approach (FAO, 1990 and Nachtergaele, 2006), Expert System for Constraints to Agricultural Production in Europe - ESCAPE (Le Bas et al., 2001; 2002).
A JRC Scientific and Technical Report (European Commission, 2007) and several working documents were produced to summarize progress made and recommendations provided.
3.2 Results With the aim of supporting the designation and delimitation of “Intermediate Less Favoured Areas”, based on a set of simple, harmonized and EU-wide applicable soil and climate set of criteria, the expert panel reached a consensus on an approach according to the following statements:
18
• No crop specificity. Suitability was considered for a European conventional, mechanised, family unit of adapted grain crops or adapted grasses for hay or silage;
• Suitability assessment is based on a limited selection of soil and climate characteristics complemented with one topographic characteristic (Table 1), in line with the agricultural problem-land approach (FAO, 1990; Nachtergaele, 2006). A restricted selection of elementary soil and climate characteristics is made which are judged to be most pertinent for distinguishing land according to its suitability for the generic agricultural activity, and the interaction between soil and climate characteristics on the growth of crops is accounted for by a water mass balance calculation (to determine excess soil moisture). The reasons for choosing the modified “Problem Land approach” rather than a more elaborated Land Quality approach (apart from its simplicity) can be explained by the objectives pursued i.e. to identify areas with constraints to agriculture and not to identify all necessary conditions to reach optimal production for each type of crop;
• Characteristics are either not limiting, or severely limiting. A critical limit is proposed to classify the value of each of the selected individual characteristics into 2 sub-ranges (Table 1). Below the severe threshold value, the characteristic is judged not to be sufficiently limiting to be considered as a handicap for agriculture. Above the severe threshold, characteristics are considered to present a biophysical handicap to agriculture, however without making agriculture impossible;
• Criteria are combined according to the agronomic law of the minimum (Liebig’s law). After classification in one of the 2 sub-ranges, characteristics can be used as diagnostic criteria to identify areas with constraints to agriculture. The guiding principle for combining the criteria is the law of the minimum. As soon as one of the considered criteria is rated as ‘severely limiting’, the corresponding land is judged to present severe limitations for agricultural production;
• Climate-related criteria are treated in a probabilistic way. In order to account for between-year variability of temperature accumulation, precipitation amount, evaporative demand and for the soil water balance; those characteristics are classified as either not limiting or severely limiting in a probabilistic approach. A characteristic is classified as being severely limiting if the probability of exceedance of the severe limit is more than 20% of the total number of years;
19
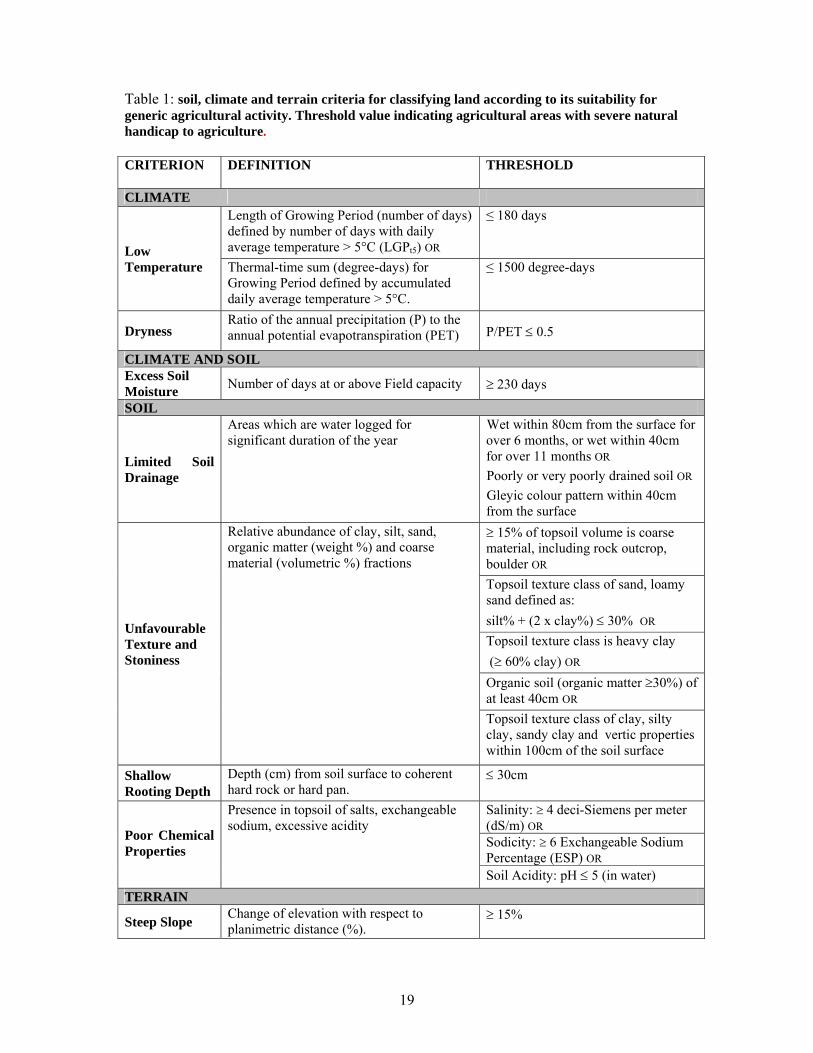
Table 1: soil, climate and terrain criteria for classifying land according to its suitability for generic agricultural activity. Threshold value indicating agricultural areas with severe natural handicap to agriculture. CRITERION
DEFINITION
THRESHOLD
CLIMATE
Low Temperature
Length of Growing Period (number of days) defined by number of days with daily average temperature > 5°C (LGPt5) OR
≤ 180 days
Thermal-time sum (degree-days) for Growing Period defined by accumulated daily average temperature > 5°C.
≤ 1500 degree-days
Dryness Ratio of the annual precipitation (P) to the annual potential evapotranspiration (PET) P/PET ≤ 0.5
CLIMATE AND SOIL Excess Soil Moisture Number of days at or above Field capacity ≥ 230 days
SOIL
Limited Soil Drainage
Areas which are water logged for significant duration of the year
Wet within 80cm from the surface for over 6 months, or wet within 40cm for over 11 months OR Poorly or very poorly drained soil OR Gleyic colour pattern within 40cm from the surface
Unfavourable Texture and Stoniness
Relative abundance of clay, silt, sand, organic matter (weight %) and coarse material (volumetric %) fractions
≥ 15% of topsoil volume is coarse material, including rock outcrop, boulder OR Topsoil texture class of sand, loamy sand defined as: silt% + (2 x clay%) ≤ 30% OR Topsoil texture class is heavy clay (≥ 60% clay) OR Organic soil (organic matter ≥30%) of at least 40cm OR Topsoil texture class of clay, silty clay, sandy clay and vertic properties within 100cm of the soil surface
Shallow Rooting Depth
Depth (cm) from soil surface to coherent hard rock or hard pan.
≤ 30cm
Poor Chemical Properties
Presence in topsoil of salts, exchangeable sodium, excessive acidity
Salinity: ≥ 4 deci-Siemens per meter (dS/m) ORSodicity: ≥ 6 Exchangeable Sodium Percentage (ESP) OR Soil Acidity: pH ≤ 5 (in water)
TERRAIN
Steep Slope Change of elevation with respect to planimetric distance (%).
≥ 15%
20
4 Discussion The method presented here is mostly in-line with FAO’s agricultural problem land approach (FAO, 1990; Nachtergaele, 2006). However, the difference with the FAO approach is that the list of criteria to identify natural constraints to agriculture:
• Does include an integrated soil-climate criterion such as the water-mass balance calculation;
• Does include a probabilistic approach for dealing with climate-related criteria;
• Does merge the soil characteristic ‘Heavy clay’ into the ‘Soil texture and stoniness’ criterion (as a sub-criterion).
The assumption of mutual independency of the characteristics and the application of the law of the minimum is common to both.
The climatic criteria pertain to the need for sufficient heat for crop development and avoidance of too dry conditions.
The soil drainage criterion is selected based on the need for sufficient but not too much water being available. This being depicted either directly through soil hydraulic characteristics, either through soil moisture conditions modelling; the later expressing the fundamental interaction between soil and climate to depict excess soil moisture content.
Texture, stoniness and rooting depth are selected for their influence on nutrient availability, available water capacity, and plant stability.
The three chemical soil characteristics refer to the required absence of toxic agents and to suitable acidic soil conditions.
Finally, slope has been retained as the sole topographic criterion for its decisive impact on farming opportunities and the potential use of agricultural machinery.
Given the generalized nature of this exercise, the “Problem land approach” was selected for its simplicity, robustness, transparency, ability to identify areas with natural constraints (rather than estimating agronomic potential) and was adapted to be non crop-specific.
Detailed review of others land suitability assessment methods has been made with the following conclusions:
• The Land Capability system (Klingebiel and Montgomery 1961) has been developed for farm planning purposes assuming an implicit hierarchy of desirability of crops rather than for regional assessments;
• The Land Quality (LQ) approach as prescribed by the FAO framework for land evaluation (FAO 1976) was not adhered to for its explicit crop specificity and the complexity of identifying and assessing the LQs.
• The ESCAPE system (Le Bas et al. 2001 and 2002) starts from similar elementary land characteristics as the “Problem land approach” to provide suitability assessment;
21
however it adds the combinations of characteristics in a crop-specific matching exercise.
• The Agro-ecological zone approach (FAO 1978; 1996) has provided the concepts of length of growing period and the probability-based approach for climate-related characteristics. These have been adopted for the adjustment of the methodology proposed here.
The application of the ‘law of the minimum’ to the criteria, together with associated threshold values, is a simple but consistent way of categorizing areas for which the selected characteristics have been observed, measured or estimated with a compatible semantic resolution, as areas with significant soil and climatic constraints to agriculture.
Changing climate is a reality in Europe (IPCC, 2007). Zones for which current climate and combined soil-climate conditions justify their designation as constrained to agriculture, may no longer match the criteria in the future (time horizon 2050 and beyond) and vice versa. However, the set of diagnostic soil and climate criteria presented, with critical limits, remains valid. Application of the criteria to updated climatic data, or to “likely” data as derived from climate change scenarios, will help to estimate future changes to the extent of the natural constraints to agriculture and to revise boundaries accordingly.
5 Conclusions A panel of experts in physical land evaluation has proposed a set of soil and climate characteristics, with associated critical limits to identify natural constraints to agriculture. The initial list of criteria has been refined according to findings of Member States experiencing and testing the criteria using their national/regional datasets.
The set of criteria are in-line with an extension of FAO’s agricultural ‘Problem land’ approach, while the threshold values have been derived from and justified by state-of-the-art scientific knowledge and expert peer-review.
The results can be used to effectively delimit the two types of land characteristics for agriculture on condition that reliable base data (observations, measurements or estimates) are available with a sufficient spatial and semantic resolution. The amount and density of point observations, the spatial resolution of area estimates and the semantic resolution of all data do inevitably have a decisive influence on the spatial and semantic quality of the final agricultural land evaluation.

22
23
6 References Bouma, 1989. Land qualities in space and time. Proceedings of a symposium on ‘Land
qualities in space and time’, organized by the International Society of Soil Science (eds. J. Bouma and A.K. Bregt), Wageningen, the Netherlands, August 22-26, 1988: 3-13.
Eliasson, Å.,Terres J.-M. and Bamps, C., 2006. Land quality assessment for the definition of the EU Less favoured Areas focusing on natural constraints, proceedings from expert meeting 16th-17th May 2006, JRC, Iispra, Italy. JRC technical Note.
Eliasson, Å. , 2007. Review of Land Evaluation Methods for Quantifying Natural Constraints to Agriculture, The Institute for Environment and Sustainability, Joint Research Centre, Ispra. Italy. EUR 22923 EN-2007.
Eliasson, Å.,Terres J.-M. and Bamps, C., 2007. Common Biophysical Criteria for Defining Areas which are Less Favourable for Agriculture in Europe, Proceedings from the Expert Meeting 19-20th of April, 2007. The Institute for Environment and Sustainability, Joint Research Centre, Ispra, Italy, EUR 22923 EN-2007.
European Commission, 2007. EUR 22735 – Joint Research Centre – Institute for Environment and Sustainability. Common biophysical criteria for defining areas which are less favourable for agriculture in Europe. Proceedings from the expert meeting 19-20th of April, 2007, The Institute for Environment and Sustainability, Joint Research Centre, Ispra, Italy. Eliasson A., Terres J.M. and Bamps C.. (eds.), 2007. JRC scientific and technical reports. Office for official publications of the European Communities. Luxembourg: 80 pp. Scientific and Technical Research series – ISSN 1018-5593.
FAO, 1976. A framework for land evaluation. Soils Bulletin 32, Rome, Italy.
FAO, 1978. Report on the Agro-Ecological Zones Project. World Soil Resources. Report 48, FAO, Rome, Italy.
FAO, 1990. Problem soils of Asia and the Pacific. RAPA Report 1990/6. FAO/RAPA Bangkok. 283 pp.
FAO, 1996. Agro-ecological Zoning, Guidelines, FAO soils bulletin 73, Rome, Italy. 78 pp.
FAO, 2007. Land evaluation: towards a revised framework. Land and Water Discussion Paper 6. Food and Agriculture Organisation of the United Nations: 107 p. http://www.fao.org/nr/lman/docs/lman_070601_en.pdf.
Fischer, G., H. van Velthuizen, M. Shah and F.O. Nachtergaele, 2002. Global Agro-ecological Assessment for Agriculture in the 21st Century: Methodology and Results. Research Report RR-02-02. International Institute for Applied Systems Analysis, Laxenburg, Austria. pp 119 + CD-ROM.
IEEP, Institute for European Environment Policy (2006a) An Evaluation of the Less Favoured Area Measure in the 25 Member States of the European union, a report prepared by the, Institute for European Environmental Policy, for DG agriculture, November 2006. http://ec.europa.eu/agriculture/eval/reports/lfa/full_text_en.pdf
IEEP, Institute for European Environment Policy (2006b) (2006) Implementation of Articles 18, 19, 20 and 16 of Regulation (EC) no. 1257/1999 in the 25 Member States of the European Union, Report Report prepared by the, Institute of European Environmental Policy, for DG Agriculture, August 2006, http://ec.europa.eu/agriculture/eval/reports/lfa/full_annex_en.pdf
24
IPCC, 2007. Climate change 2007: Climate change impacts, adaptation and vulnerability. Summary for policymakers. http://www.ipcc.ch/ .
Jones, R.J.A. and A.J. Thomasson, 1987. A computer-oriented system to evaluate the suitability of European land for common arable crops. In: Agriculture: Simulation models for cropping systems in relation to water management. 165-181. Office for Official Publications of the European Communities, Luxembourg, EUR 10869 EN.
King, D., J. Daroussin and R. Tavernier, 1994. Development of a soil geographical database from the soil map of the European Communities. Catena, 21, 37–56.
King, D., R.J.A. Jones and A.J. Thomasson (eds), 1995. European Land Information Systems for Agro-environmental Monitoring. Office for Official Publications of the European Communities, Luxembourg, EUR 16232 EN, 285pp.
Klingebiel, A.A., and Montgomery, P.H., 1961. Land-Capability Classification. Agricultural Handbook 210, Soil Conservation Service. U.S. Govt. Printing Office, Washington, D.C. 21 p.
Lambert, J.J, Daroussin, J., Eimberck, M., Le Bas, C., Jamagne, M., King D., Montanarella, L.; Soil Geographical Database for Eurasia & The Mediterranean: Instructions Guide for Elaboration at scale 1:1,000,000 version 4.0. (http://eusoils.jrc.ec.europa.eu/esdb_archive/eusoils_docs/esb_rr/n08_GuideEurDBv40111202.pdf)
Le Bas, C., L. Boulonne and D. King, 2001. Expert system for Constraints to agricultural production in Europe, Rapport final. INRA and European Soil Bureau. (in French).
Le Bas, C., L. Boulonne, D. King and L. Montanarella, 2002. A Tool for assessing land suitability for Europe. INRA and European Soil Bureau. 17th world congress of Soil Science, 14-21 of August 2002, Bangkok, Thailand, Symp. 48, 256: 1-11.
Nachtergaele, F., 2006. The FAO Problem Land approach adapted to EU conditions. Presentation at the expert meeting “Land quality assessment for the definition of the EU Less Favoured Areas focusing on natural constraints. Ispra, Italy, 16-17-May-2006.
Ragg, J.M., R.J.A. Jones and M.E. Proctor, 1988. The refinement and representation of spatial data in an information system using statistical and DBMS procedures, and trend surface analysis. Geologisches Jahrbuch. A104, 295-308. Hannover.
Ray, D., 2001. Ecological Site Classification Decision Support System V1.7. Forestry Commission - Edinburgh.
Soil Survey Division Staff, 1993. Soil survey manual. United States Department of Agriculture Handbook No. 18. Washington, DC: US Department of Agriculture.
Thomasson, A.J. and R.J.A. Jones, 1989. Land evaluation at regional scale. In: ‘Land qualities in space and time’, (J. Bouma and A.K. Bregt (eds.), Proceedings of a symposium on ‘Land qualities in space and time’, organized by the International Society of Soil Science (IUSS), Pudoc, Wageningen, the Netherlands, 231-240.
Van Diepen, C.A., Van Keulen, H., Wolf, J. and Berkhout, J.A.A., 1991. Land evaluation: from intuition to quantification. In: B.A. Stewart (Editor), Advances In Soil Science. Springer, New York, pp. 139-204.
Vossen, P. and Meyer-Roux, J. 1995. Crop monitoring and yield forecasting activities of the MARS Project. In: European Land Information Systems for Agro-environmental Monitoring. D. King, R.J.A. Jones and A.J. Thomasson (eds.). EUR 16232 EN, p.11-29. Office for Official Publications of the European Communities, Luxembourg

25
26
7 Annexes: Factsheets of the proposed criteria

27
28
Criterion 1 “Low temperature” Authors: Guenther Fischer, Edmar Teixeira and Harrij van Velthuizen, IIASA, Laxenburg, Austria,
Edited by: Jos Van Orshoven (K.U.Leuven, Leuven, Belgium) and Jean-Michel Terres (JRC, Ispra, Italy),
Agronomic importance
Low temperatures limit crop growth and development through the impact on important physiological processes such as photosynthesis and leaf appearance. Land in which thermal-time accumulation is systematically not sufficient for crops to complete the production cycle is unfavorable for agriculture.
Definition
Low temperature is defined as the condition in which crop performance or survival is compromised by temperatures during the growing period which are insufficient for optimal growth and development of crops.
In the context of less favourable areas for agriculture in Europe, low temperature is a characteristic of land for which thermal-time accumulation during the growing period is insufficient for plants to complete the production cycle.
Scientific background
Agricultural crops are able to grow and develop only within well defined ranges of temperature (Porter and Gawith, 1999). The most common agricultural crops in Europe are (i) "C3" crops adapted to cool temperatures ranging from 5-30oC (e.g. wheat, potato), (ii) "C3" crops adapted to warm temperatures ranging from 15-35oC (e.g. soybean, rice) and (iii) "C4" crops adapted to moderately warm temperatures ranging from 10-35oC (e.g. maize, sorghum) (FAO, 1978-81). These climatic thresholds are mostly explained by the impact of temperature on enzymatic activities that regulate the rates of important plant physiological processes, such as photosynthesis and leaf appearance (Bonhomme, 2000). Growth rates and yields are maximized when crops are grown near the species-specific optimal temperature (Topt) but gradually decrease at lower temperatures until the base temperature (Tb) is reached, at which no development occurs. Similarly, at temperatures higher than Topt, development rates decline until a critical temperature (Tcrit), near lethal levels (Hodges, 1991). Negligible growth occurs for most agricultural crops at temperatures below 5oC or above 35-40oC (Porter and Semenov, 2005). When crops are grown under lower than optimal temperatures, yields can be reduced by various mechanisms (Porter and Gawith, 1999) including: limited light interception (e.g. due to slow leaf area expansion), inefficient conversion of intercepted light into biomass (i.e. reduced photosynthesis rates), or direct damage to plant tissues caused by early or late frosts.
To successfully complete the growth cycle and fully attain their yield potential at harvest, crops have to be able to reach full canopy expansion and pass through specific phenological stages such as germination, flowering and maturity (Hodges, 1991). The rate of progress
29
towards each of these phenological stages is largely regulated by temperature (Jamieson et al., 1995; Bonhomme, 2000). This explains why the length of the growth cycle of crops is variable when expressed in ‘days’ from emergence to maturity but conservative when expressed in ‘thermal-time’ (degree-days, oCd) (Hodges, 1991). Specific thermal-time accumulations are needed for the completion of each phenological stage, until crops complete an entire production cycle.
Length of growing period or thermal-time accumulation requirements can be used to characterize land areas with temperature limitations.
Assessment
To assess low temperature as a land characteristic, the concepts of length of temperature growing period (LGPt, days) or thermal-time sums (TSb, degree days, oCd) can be used:
• Either, the length of the temperature growing period (LGPt5), i.e. the number of days with daily average temperatures (Tavg) above 5oC is calculated for each year. The LGPt5 characterizes the days in which temperatures are conducive to crop growth; or
• The thermal-time sums (TSb), above a base temperature (Tb) of 5oC, are calculated by accumulating daily the difference between Tavg and Tb.
Finally, calculated values of LGPt5 and TSb are compared with reference thresholds for severe limiting conditions.
For this calculation, it is recommended to use data-sets with daily average temperature (Tavg).
Values for severe threshold
Temperature thresholds and thermal requirements for plant development vary among crop species and cultivars (Hodges, 1991). For European conditions, thermal-time sum requirements can be used as a reference to delimit thresholds for the development of agricultural crops.
In general, optimal thermal-time requirement for most agricultural crops is above a TS5 of 1500oCd (Boons-Prins et al. 1993). A TS5 of 1200oCd coincides with the most northern distribution of cereal crops in Europe. Below this TS5 threshold of 1200oCd, crops cannot grow because of very marginal thermal-time accumulation and increased risk of early and late frosts (Fischer G. et al. 2008 forthcoming).
Therefore, severely limiting low temperature is said to occur if TS5 is less than 1500oCd (Tb=5oC) or LGP t5 is less than 180 days.
As a refinement for the computation, the start of the growing period can be defined from the fifth day when 5 consecutive days fulfil the condition of having daily average temperature (Tavg) above 5oC. Conversely, the end of the period will occur on the fifth day when at least 5 consecutive days will have their average daily temperature below 5oC.
In order to take account of between year variability of meteorological conditions, a probabilistic approach is required. It is proposed to use the 80% / 20% probability exeedance / non exceedance approach, i.e. if in 7 or more years out of 30, the threshold value for severe low temperature condition is not reached, the land is classified as being under severe low temperature limitation.

30
A time series of daily meteorological data preferably over 30 (or more) recent years is required to assess the probability of exceedance.
Final remarks and conclusions
Low temperatures have an important impact on crop yield by limiting plant growth and development processes. Land areas where thermal-time sums are insufficient for crops to complete their production cycle are considered unfavorable for agriculture. This can be evaluated by using thresholds of thermal-time requirement.
References
Bonhomme, R. (2000). "Bases and limits to using "degree-day" units." European Journal of Agronomy 13(1): 1-10.
Boons-Prins, E. R., G. H. J. Koning, C. A. van Diepen and F. W. T. Penning de Vries (1993). Crop specific simulation parameters for yield forecasting across the European Community. Simulations Reports CABO-TT no. 32, Joint Research Centre.
FAO (1978-81). Crop adaptability inventory. In: Report on the Agro-ecological Zones Project. World Soil Resources Report 48. FAO, Rome, Italy.
Fischer G., Nachtergaele F., Prieler S., van Velthuizen H.T., Verelst L. and Wiberg D. (2008 forthcoming). Global Agro-ecological Zones Assessment (GAEZ 2007). IIASA, Laxenburg, Austria and FAO, Rome, Italy.
Hodges, H. (1991). Predicting crop phenology. Boston, U.S.A., CRC Press.
Jamieson, P. D., I. R. Brooking, J. R. Porter and D. R. Wilson (1995). "Prediction of leaf appearance in wheat: a question of temperature." Field Crops Research 41(1): 35-44.
Porter, J. and M. Semenov (2005). "Crop responses to climatic variation." Philosophical Transactions of the Royal Society B: Biological Sciences 360(1463): 2021-2035.
Porter, J. R. and M. Gawith (1999). "Temperatures and the growth and development of wheat: a review." European Journal of Agronomy 10(1): 23-36.

31
32
Criterion 2 “Dryness - Too dry conditions” Author: Tibor Tóth (Joint Research Centre, Italy)
Contributor: René Gommes (Joint Research Centre, Italy), (ex FAO, Italy)
Edited by: JM Terres (Joint Research Centre, Italy)
Agronomic Importance
Crop growth is affected by water stress (which is defined as the lack of available water), and the resulting periods of drought cause yield reduction. Indeed, availability of water is considered to be a critical parameter for crop production and animal husbandry. Plants adsorb water with their roots from the soil, where water availability closely follows weather conditions. While temporary drought occurrences can be spatially and temporally very variable, predominantly dry agricultural areas can be delineated by the deficit of water availability compared to water demand.
Although agriculture has adapted and has developed in dry zones, dry conditions impose however severe restriction on cropping opportunities and on yield.
Definition Too dry condition is “a natural permanent imbalance in the water availability consisting of low annual precipitation and a high annual evaporative demand, resulting in overall low soil water content and low carrying capacity of the ecosystems” according to Pereira (2009). Dryness indices are indicators, which measure (i.e. express numerically) the severity of water stress at a location. The main use of the dryness indices is to delineate areas affected by water stress according to different severity levels.
The UNEP Aridity Index (AI UNEP) is the ratio of the annual precipitation to the annual potential evapotranspiration, both expressed in the same units. AI UNEP =P/PET Where P is the total annual precipitation and PET is the total annual potential evapotranspiration (using the Penman-Monteith methodology in relation to a living grass reference crop (Allen et al, 1998)).
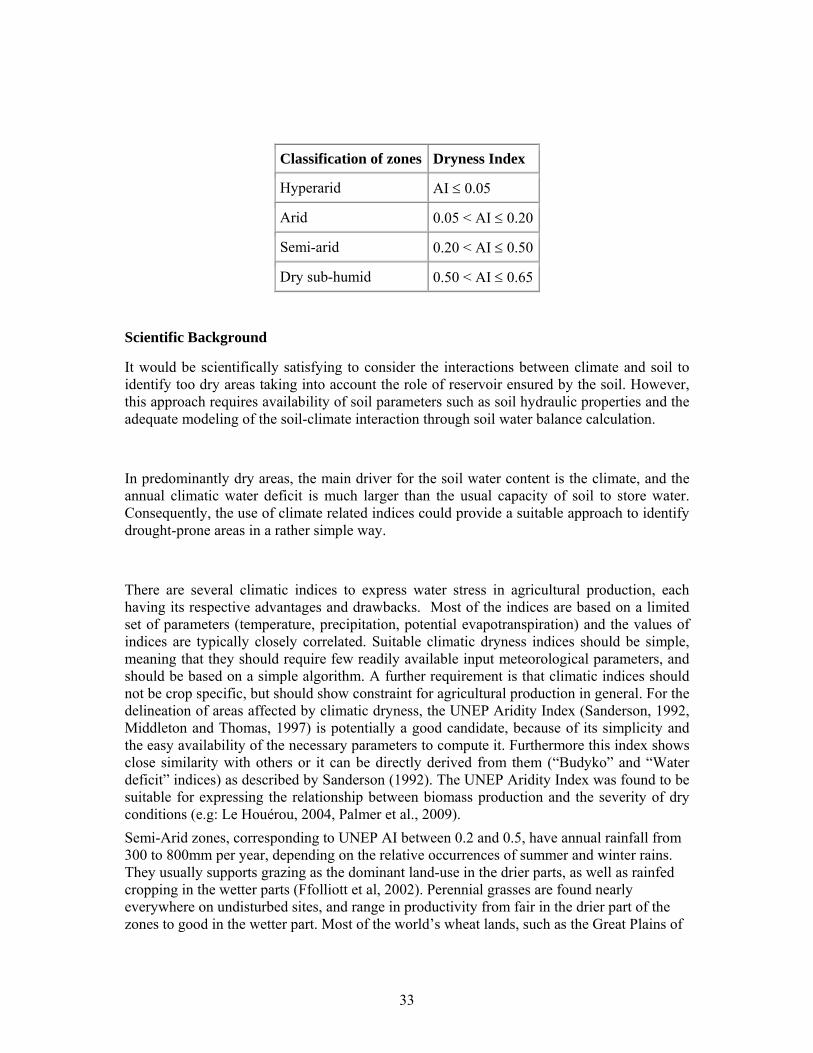
Although, as an indicator, the climatic index values can be directly compared between locations, there are specific ranges denoting distinct zones according to the permanent water stress. The following table shows the threshold values of the different zones in increasing severity of dryness as suggested by the UNEP (Middleton and Thomas, 1997).
33
Classification of zones Dryness Index
Hyperarid AI ≤ 0.05
Arid 0.05 < AI ≤ 0.20
Semi-arid 0.20 < AI ≤ 0.50
Dry sub-humid 0.50 < AI ≤ 0.65
Scientific Background
It would be scientifically satisfying to consider the interactions between climate and soil to identify too dry areas taking into account the role of reservoir ensured by the soil. However, this approach requires availability of soil parameters such as soil hydraulic properties and the adequate modeling of the soil-climate interaction through soil water balance calculation.
In predominantly dry areas, the main driver for the soil water content is the climate, and the annual climatic water deficit is much larger than the usual capacity of soil to store water. Consequently, the use of climate related indices could provide a suitable approach to identify drought-prone areas in a rather simple way.
There are several climatic indices to express water stress in agricultural production, each having its respective advantages and drawbacks. Most of the indices are based on a limited set of parameters (temperature, precipitation, potential evapotranspiration) and the values of indices are typically closely correlated. Suitable climatic dryness indices should be simple, meaning that they should require few readily available input meteorological parameters, and should be based on a simple algorithm. A further requirement is that climatic indices should not be crop specific, but should show constraint for agricultural production in general. For the delineation of areas affected by climatic dryness, the UNEP Aridity Index (Sanderson, 1992, Middleton and Thomas, 1997) is potentially a good candidate, because of its simplicity and the easy availability of the necessary parameters to compute it. Furthermore this index shows close similarity with others or it can be directly derived from them (“Budyko” and “Water deficit” indices) as described by Sanderson (1992). The UNEP Aridity Index was found to be suitable for expressing the relationship between biomass production and the severity of dry conditions (e.g: Le Houérou, 2004, Palmer et al., 2009). Semi-Arid zones, corresponding to UNEP AI between 0.2 and 0.5, have annual rainfall from 300 to 800mm per year, depending on the relative occurrences of summer and winter rains. They usually supports grazing as the dominant land-use in the drier parts, as well as rainfed cropping in the wetter parts (Ffolliott et al, 2002). Perennial grasses are found nearly everywhere on undisturbed sites, and range in productivity from fair in the drier part of the zones to good in the wetter part. Most of the world’s wheat lands, such as the Great Plains of
34
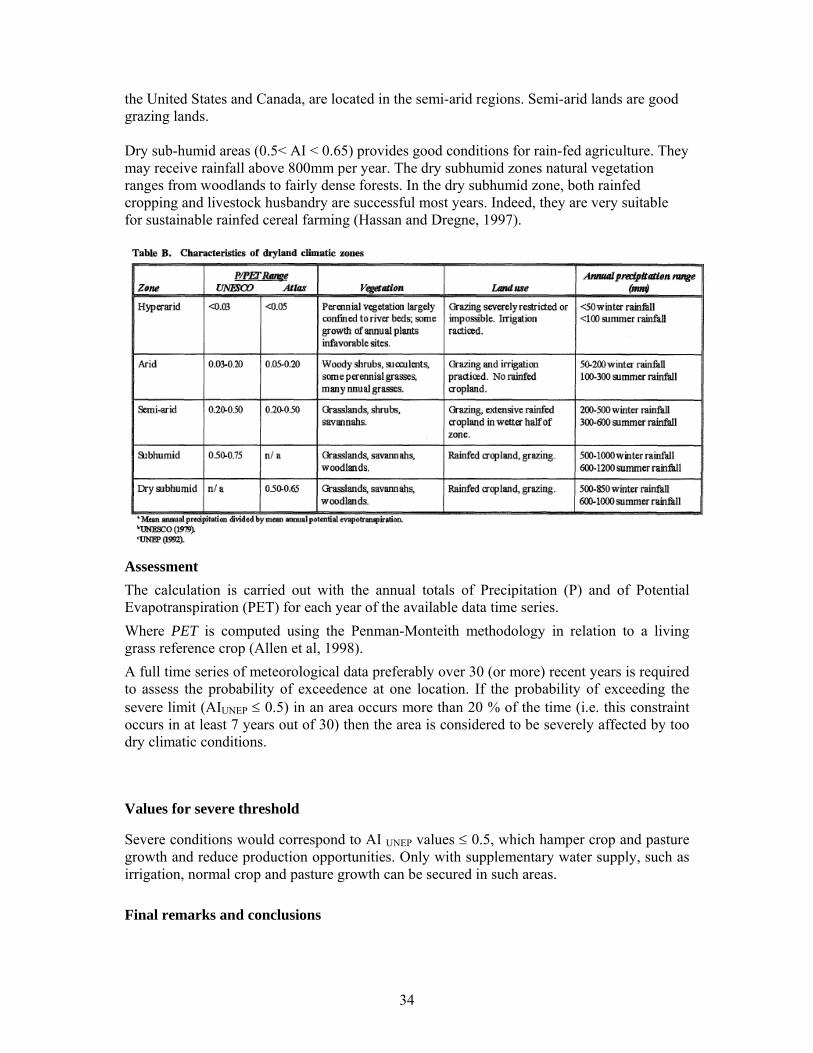
the United States and Canada, are located in the semi-arid regions. Semi-arid lands are good grazing lands. Dry sub-humid areas (0.5< AI < 0.65) provides good conditions for rain-fed agriculture. They may receive rainfall above 800mm per year. The dry subhumid zones natural vegetation ranges from woodlands to fairly dense forests. In the dry subhumid zone, both rainfed cropping and livestock husbandry are successful most years. Indeed, they are very suitable for sustainable rainfed cereal farming (Hassan and Dregne, 1997).
Assessment The calculation is carried out with the annual totals of Precipitation (P) and of Potential Evapotranspiration (PET) for each year of the available data time series. Where PET is computed using the Penman-Monteith methodology in relation to a living grass reference crop (Allen et al, 1998). A full time series of meteorological data preferably over 30 (or more) recent years is required to assess the probability of exceedence at one location. If the probability of exceeding the severe limit (AIUNEP ≤ 0.5) in an area occurs more than 20 % of the time (i.e. this constraint occurs in at least 7 years out of 30) then the area is considered to be severely affected by too dry climatic conditions.
Values for severe threshold
Severe conditions would correspond to AI UNEP values ≤ 0.5, which hamper crop and pasture growth and reduce production opportunities. Only with supplementary water supply, such as irrigation, normal crop and pasture growth can be secured in such areas. Final remarks and conclusions
35
The UNEP dryness index indicates, (i.e. express numerically) the severity of water stress at a location and allows to delineate areas affected by water stress according to different severity levels, while being simple to compute and not related to specific crops. References
Allen, R. G., Pereira, L. S., Raes, D., Smith, M., 1998. “Crop evapotranspiration:
Ffolliott, P., Dawson, J. O., Fisher, J. T., Moshe, I., Fulbright, T. E., Al Musa, A., Carter Johnson, W., Verburg, P. 2002. Arid Lands Newsletter: No. 52, November/December 2002 Special issue: Selected papers from the IALC Conference: Assessing Capabilities of Soil and Water Resources in Drylands.
Guidelines for computing crop requirements.” Irrigation and Drainage Paper No. 56, FAO, Rome, Italy.
Hassan H; Dregne H.G., 1997. Natural Habitats and Ecosystems Management in Drylands – Environment Department papers, paper no. 51. Toward environmentally and socially sustainable development – The World Bank
Le Houérou, H. N., 2004. An Agro-Bioclimatic Classification of Arid and Semiarid Lands in the Isoclimatic Mediterranean Zones. Arid Land Research and Management 18: 301–346.
Middleton, N. J., Thomas D., 1997. World Atlas of Desertification. UNEP, Arnold, London. UK.
Palmer, A. R. , Fuentes, S., Taylor, D., Macinnis-Ng, C., Zeppel, M., Yunusa I., and Eamus, D., 2009. Towards a spatial understanding of water use of several landcover classes: an examination of relationships amongst pre-dawn leaf water potential, vegetation water use, aridity and MODIS LAI. Ecohydrology 3:1-10.
Pereira, L. S., Cordery, I. and Iacovides, I., 2009, Coping with Water Scarcity with water scarcity, Addressing the challenges, Springer, Dordrecht, The Netherlands
Sanderson, M., (Ed.), 1992. UNESCO Sourcebook in Climatology for Hydrologists and Water Resource Engineers. UNESCO, Paris.
Vlachos, E., James, L.D., 1983. Drought Impacts. In: V. Yevjevich, L. V. Cunha, E. Vlachos (Eds.) Coping With Droughts. Water Resources Publications, Littleton, CO, pp. 44-73.
36
Criterion 3 “Limited soil drainage” Author: David Rossiter (ITC, Enschede, the Netherlands)
Contributor: Bob Jones (Cranfield University, United Kingdom)
Edited by: Jos Van Orshoven (K.U.Leuven, Leuven, Belgium), Jean-Michel Terres and Tibor Tóth (JRC, Ispra, Italy)
Agronomic importance
Poor drainage reduces the space for the gaseous phase, in particular gaseous oxygen, in the rooting zone. It increases the incidence and severity of soil-borne pathogens and makes tillage impossible. A main additional effect of water-saturated soil on agriculture is to make the land inaccessible. Coastal flooding with brackish water can result in the same damage as salts in the soil.
Definition
Soil drainage refers to the maintenance of the gaseous phase in soil pores by removal (or non-addition) of water. In the FAO Guidelines for Land Evaluation (Rainfed agriculture) (FAO, 1983) it is referred to as LQ4 “Oxygen availability to roots (drainage)”.
A soil has internal drainage, i.e. the facility for removing excess water by gravity, and external drainage, i.e. the amount of water removed (or not added) by its position in the landscape with respect to contributing overland areas (runoff) or groundwater.
Scientific background
Surplus water in the rooting zone is normally the result of a high ground water table, following periods of heavy precipitation or flooding, for example during the wet winters characteristic of north west Europe, or a perched water table resulting from surplus water in the upper layer of the soil stagnating above a very slowly permeable or impermeable subsoil horizon. The latter type of soil water regime is quite common in the lowlands of England.
The main effect of poor drainage is to reduce the space for the gaseous phase, in particular gaseous oxygen, in the rooting zone. Crops suffer severely when their roots are deprived of gaseous oxygen. The notable exception is rice. The length of time without oxygen that causes severe damage varies among species.
A second effect is to increase the incidence and severity of soil-borne pathogens such as Pithium spp. fungi and root rotting bacteria such as Erwinia spp.
A third effect is to make tillage impossible, because machinery becomes bogged down or the soil structure is easily destroyed if tilled when too wet.
A fourth effect is to reduced the length of the grazing season for grassland farms (Fitzgerald et al., 2008) as pasture growth will be reduced and moreover access by animals to excessively wet grassland will be limited to avoid damaging soil structure for several months / years.
37
A main effect of water-saturated soil on agriculture is to make the land inaccessible, thus tillage and harvesting are impossible. All the effects of poorly drained soils also, their severity, depend on the duration of the saturated status. Excess water must either evaporate or drain (internally) through the soil or runoff as overland flow. Water draining internally carries nutrients (e.g. nitrates) and sometimes pollutants, which can seep into the ground water. Coastal flooding with brackish water can damage the soil, turning it saline.
Surface water from very high or perched water tables, must be allowed to thoroughly dry before the soil is trafficked or worked. In practice, this condition may not be fully realized. Any subsequent traffic and tillage commonly will degrade the soil, leading to compaction, massive structures and surface crusting.
Assessment
Ideally, drainage status is determined by monitoring wells (Daniels et al., 1971) or measurements of the soil redox potential. However this is impractical except at research sites. Therefore soil morphology is commonly used to assess drainage. These morphological indicators have been related to actual drainage status by research.
Drainage can be described as a natural drainage class that refers to the frequency and duration of wet periods under conditions similar to those under which the soil developed (i.e. ignoring any artificial drainage). In the USDA-NRCS system (Soil Survey Division Staff 1993), there is no distinction made between internal and external drainage, so that soil drainage is determined by a combination of the internal saturated hydraulic conductivity, water table level, additional water from seepage, water gained or lost by runoff, evapotranspiration and rainfall.
Relevant classes from Soil Survey Division Staff (1993) are:
- “Somewhat poorly drained. Water is removed slowly so that the soil is wet at a shallow depth for significant periods during the growing season. The occurrence of internal free water commonly is shallow to moderately deep and transitory to permanent. Wetness markedly restricts the growth of mesophytic crops, unless artificial drainage is provided. The soils commonly have one or more of the following characteristics: low or very low saturated hydraulic conductivity, a high water table, additional water from seepage, or nearly continuous rainfall.”
- “Poorly drained: Water is removed so slowly that the soil is wet at shallow depths periodically during the growing season or remains wet for long periods. The occurrence of internal free water is shallow or very shallow and common or persistent. Free water is commonly at or near the surface long enough during the growing season so that most mesophytic crops cannot be grown, unless the soil is artificially drained. The soil, however, is not continuously wet directly below plow-depth. Free water at shallow depth is usually present. This water table is commonly the result of low or very low saturated hydraulic conductivity of nearly continuous rainfall, or of a combination of these.
- “Very poorly drained. Water is removed from the soil so slowly that free water remains at or very near the ground surface during much of the growing season. The occurrence of internal free water is very shallow and persistent or permanent. Unless the soil is artificially drained, most mesophytic crops cannot be grown. The soils are commonly level or depressed and frequently ponded. If rainfall is high or nearly continuous, slope gradients may be greater.”

38
Drainage status is also reflected in many soil classification systems. The USDA Soil Taxonomy (Soil Survey Staff 1999, 2003) describes the soil moisture regime for each soil individual as part of the soil family name. These are defined by the ground water level and the seasonal presence or absence of water held at tensions less than 1500 kPa in the defined moisture control section, under a crop or vegetation typical for the soil. The aquic moisture regime is a reducing regime in a soil that is virtually free of dissolved oxygen because it is saturated by water during some period when biological activity is possible. This is reflected in the soil morphology.
The World Reference Base (IUSS Working Group WRB 2006) does use the concept of soil moisture regimes per se, but defines several soil properties directly related to poor drainage, namely gleyic and stagnic features based on soil colour variations. Dominance of reductimorphic features is identified in the soil pit/profile wall by “Gleyic colour pattern” according to WRB, 2006. These features are used to define Reference Groups (Gleysols and Stagnosols). Other reference groups are associated with poor internal drainage: the Planosols, Solonetz and Vertisols.
Drainage classes may be inferred from soil classification or directly from soil morphology by national experts; however there is not always a direct relation between a taxonomic class (e.g. Gleysols) and actual drainage conditions; this is always an inference.
Alternatively, the excess soil moisture condition can be assessed from modelling time series of soil moisture balance, resulting in a duration of the water content at field capacity (or above). This is described in the Factsheet of the Common Biophysical criterion 3 bis "Excess Soil Moisture condition". In this respect, both criteria are closely linked.
Values for severe threshold
These thresholds identify land areas that are waterlogged for significant periods during the normal growing season and thus affect normal farming operations or crop yields. The severe threshold is designed to identify soils on which farming operations for adapted crops are possible, but with severe yield reductions due to late planting or poor tillage, crop damage by transient anoxic conditions or plant pathogens resulting from poor drainage, or a substantial risk of crop damage.
Therefore, soil drainage is said to be severely limiting if with regard to drainage the soil is classified as:
• wet within 80cm (from the surface) for over 6 months, or wet within 40cm for over 11 months; OR
• classified as poorly drained (soils are commonly wet for considerable periods - ground water table commonly within 40cm from the surface, or classified as very poorly drained (wet at shallow depths for long periods - ground water table is commonly within 15cm from the surface; OR
• the soil has Gleyic colour pattern within 40cm from the surface;
Final remarks and conclusions
Soil drainage (oxygen status) is a major constraint to agriculture, generally requiring expensive technical adaptations (artificial drainage, ditching, pumping, flood control); in that
39
sense areas with these limitations can be considered ‘less favoured’ for agriculture. Such areas are often best left to seasonal pasture, specialty crops, or nature.
Given severe constraint, poorly-drained soils can support only shallow-rooted crops, and only for limited periods, with a small window for tillage, growth and harvesting, without artificial drainage.
In many areas of Europe with natural drainage problems, soils have been artificially drained, often for centuries. If these drainage works are considered now part of the landscape, the drained soil units should be evaluated as if they were better drained than without the installed drainage systems. Normally artificial drainage systems improve the drainage class by at least one class.
References
Daniels RB, Gamble EE, Nelson LA, 1971. Relations between soil morphology and water-table levels on a dissected North Carolina Coastal Plain surface. Soil Science Society of America Proceedings, 35, 781-784.
FAO, 1983. Guidelines: land evaluation for rainfed agriculture. Soils Bulletin 52. Rome, Italy: Food and Agriculture Organization of the United Nations.
FAO-IUSS-ISRIC, 2006. World reference base for soil resources 2006 (2nd ed.). World Soil Resources Report 103, 128pp. Rome: FAO.
Fitzgerald, J. B., A. J. Brereton and N. M. Holden. 2008. Simulation of the influence of poor soil drainage on grass-based dairy production systems in Ireland. Grass and Forage Science, 63, 380–389.
Soil Survey Division Staff, 1993. Soil survey manual. United States Department of Agriculture Handbook No. 18. Washington, DC: US Department of Agriculture.
Soil Survey Staff, 1999. Soil taxonomy: a basic system of soil classification for making and interpreting soil surveys (2nd ed.). Agricultural Handbook 436. Washington, DC: US Department of Agriculture Soil Conservation Service.
Soil Survey Staff, 2003. Keys to Soil Taxonomy (9th ed.). Washington, DC: US Government Printing Office.
40
Criterion 3 bis "Excess Soil Moisture Condition" Contributors: Bob Jones (Cranfield University, United Kingdom); R Schulte, R Fealy (Teagasc, Ireland); F Bouraoui (Joint Research Centre, Italy)
Editor: JM Terres, T Tóth (Joint Research Centre, Italy)
Agronomic importance
Soil moisture condition is an important interface between agriculture and the environment. The reduction or lack of gaseous phase in soil (water-saturated soils) has adverse effects on crop growth (through reducing rooting conditions) and / or soil strength (workability, trafficability) (Earl, 1997). Consequently, temporal patterns in soil moisture conditions are an influential driver for land management. When soil are very wet, productivity is significantly reduced because nutrient uptake is low or even stopped (Keane, 2001), or photosynthesis is largely reduced (Laidlaw, 2009). In addition, soils with excess soil moisture are prone to soil compaction if trafficked or worked under unsuitable conditions (Herbin et al, 2011), leading to soil structure damages which can affect crop production for several years. Moreover, excessive soil moisture conditions severely restrict farming opportunities (in terms of choice of crops to be managed) and the length of the grazing season for grassland farms (Fitzgerald et al., 2008). Appropriate grazing or farming operations are possible only at times when soils are at field capacity or drier, and therefore, farming opportunities of agricultural holdings may be restricted in areas with long periods and/or frequent occurrences of excess soil moisture conditions (Shalloo et al., 2004). Definition
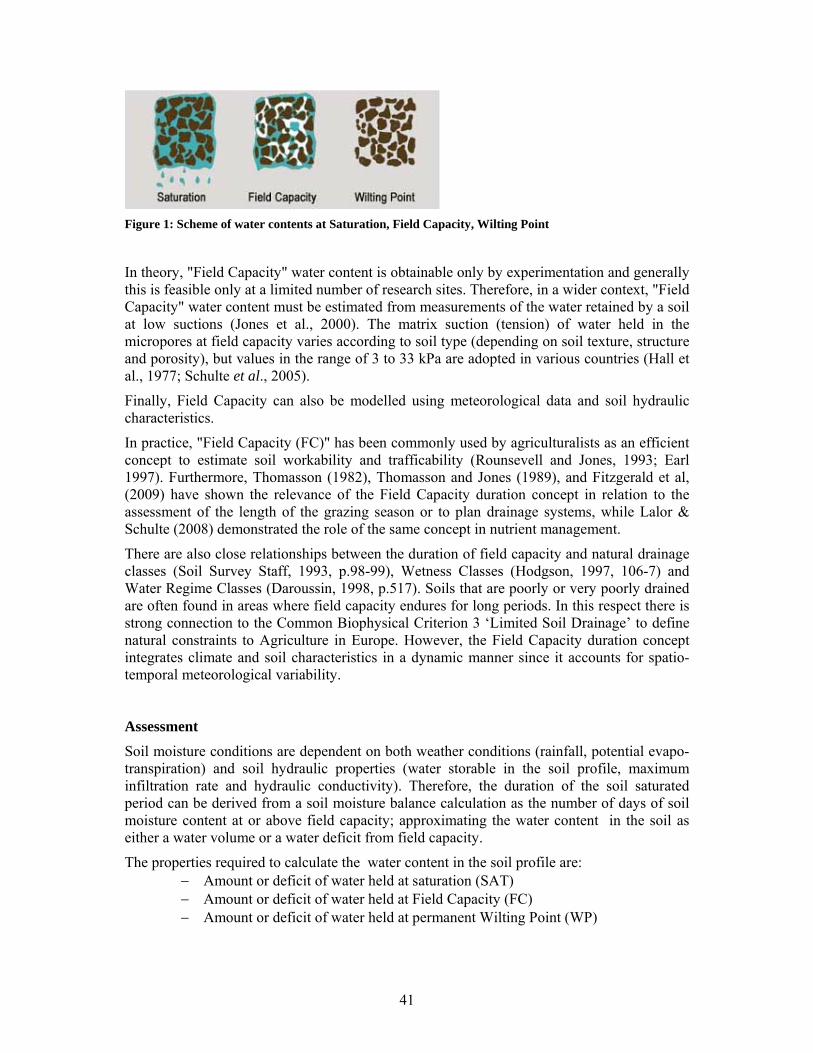
Excess soil moisture is the condition when the water content in the soil exceeds field capacity. The "Field Capacity" is defined as the maximum amount of water that a soil can retain solely under the force of gravity, and is effectively the condition of "zero soil moisture deficit". The "Excess Soil Moisture Condition" is defined as the duration (measured in days) when soil moisture contents are at or larger than field capacity ("wet season"). In agricultural areas of north-western Europe, the "field capacity period" generally starts in the autumn whilst this period commonly ends in spring, although this is subject to geographical and inter-annual variability. Scientific background
When a soil becomes saturated with water, downward percolation (internal drainage) will occur (provided the soil is sufficiently permeable). When downward percolation effectively ceases, the soil is said to be at field capacity (Brady, 1984). In this situation, water will have moved out of the macropores (>50μm) which become filled with air, whilst mesopores (2-50μm) remain water-filled and able to supply plants with the moisture to sustain plant growth.
41
Figure 1: Scheme of water contents at Saturation, Field Capacity, Wilting Point
In theory, "Field Capacity" water content is obtainable only by experimentation and generally this is feasible only at a limited number of research sites. Therefore, in a wider context, "Field Capacity" water content must be estimated from measurements of the water retained by a soil at low suctions (Jones et al., 2000). The matrix suction (tension) of water held in the micropores at field capacity varies according to soil type (depending on soil texture, structure and porosity), but values in the range of 3 to 33 kPa are adopted in various countries (Hall et al., 1977; Schulte et al., 2005).
Finally, Field Capacity can also be modelled using meteorological data and soil hydraulic characteristics.
In practice, "Field Capacity (FC)" has been commonly used by agriculturalists as an efficient concept to estimate soil workability and trafficability (Rounsevell and Jones, 1993; Earl 1997). Furthermore, Thomasson (1982), Thomasson and Jones (1989), and Fitzgerald et al, (2009) have shown the relevance of the Field Capacity duration concept in relation to the assessment of the length of the grazing season or to plan drainage systems, while Lalor & Schulte (2008) demonstrated the role of the same concept in nutrient management.
There are also close relationships between the duration of field capacity and natural drainage classes (Soil Survey Staff, 1993, p.98-99), Wetness Classes (Hodgson, 1997, 106-7) and Water Regime Classes (Daroussin, 1998, p.517). Soils that are poorly or very poorly drained are often found in areas where field capacity endures for long periods. In this respect there is strong connection to the Common Biophysical Criterion 3 ‘Limited Soil Drainage’ to define natural constraints to Agriculture in Europe. However, the Field Capacity duration concept integrates climate and soil characteristics in a dynamic manner since it accounts for spatio-temporal meteorological variability. Assessment
Soil moisture conditions are dependent on both weather conditions (rainfall, potential evapo-transpiration) and soil hydraulic properties (water storable in the soil profile, maximum infiltration rate and hydraulic conductivity). Therefore, the duration of the soil saturated period can be derived from a soil moisture balance calculation as the number of days of soil moisture content at or above field capacity; approximating the water content in the soil as either a water volume or a water deficit from field capacity.
The properties required to calculate the water content in the soil profile are: − Amount or deficit of water held at saturation (SAT) − Amount or deficit of water held at Field Capacity (FC) − Amount or deficit of water held at permanent Wilting Point (WP)
42
Duration of the soil saturated period can be assessed with a classical water mass-balance model with a daily time step, calculating soil moisture status from the cumulative balance of precipitation and soil water removal through evapo-transpiration and percolation, taking into account of antecedent soil moisture conditions.
Percolation occurs when soil moisture content exceeds FC. The rate of percolation depends on the amount of water in excess of field capacity. Travel time of percolating water through the soil matrix is regulated by the hydraulic conductivity. This conductivity varies from near zero when the soil is at field capacity to a maximum value when the soil is at saturation.
In the presence of a high water table, no percolation may occur, resulting in longer periods of soil water conditions above field capacity.
It is generally accepted that any extra water added above water content at saturation will be lost by run-off.
The Potential Evapo-Transpiration (PET) should be calculated using the Penman-Monteith methodology in relation to a living grass reference crop (Allen et al, 1998). Value for severe threshold
The wettest parts of north-west Europe can experience more than 300 days above field capacity, whereas the drier parts of Europe are likely to experience less than 50 days above field capacity.
Recent studies by Shalloo (2004, 2009) and Kinsella et al. (2010) show that excessive soil moisture conditions affect economic sustainability of livestock farming when the grazing season is limited to a number of days ranging around 125 to 145 (equivalent to 240 to 220 "Field Capacity" days). These findings are consistent with Fitzgerald et al. (2008), which suggest that herbage availability is restricted in scenarios in which the 80 percentile Field Capacity Period exceeds 223 days.
Furthermore, a preliminary study evaluating the spatio-temporal impacts of soil moisture conditions on agricultural practices (Schulte et al., 2006) found that a similar range of thresholds broadly corresponds to the limit beyond which arable crops are not feasible anymore and therefore expresses a loss of cropping opportunities for farmers. Jones and Thomasson (1993) suggest that intensive agricultural systems (for crops and livestock) begin to be adversely affected when average duration of field capacity exceeds 200 days while the effect of wetness on agricultural operations will become very severe when duration of field capacity exceeds 250 days.
Therefore:
Soil moisture is said to be severely too wet when the number of days with soil moisture at or above Field capacity is ≥ 230 days.
[The start of the period with soil moisture content at or above field capacity (surplus) can be defined on the fifth day when 5 consecutive days fulfil the condition. Conversely, the end of the period will occur on the fifth day when at least 5 consecutive days have their soil moisture content below field capacity (deficit).]
43
In order to account for between-year variability of soil moisture conditions (meteorological driver), it is suggested to follow a probabilistic approach: An area is classified as being severely handicapped if the probability of exceeding the severe annual limit is more than 20 % of the number of years in the time series (i.e. constraint occurs at least in 7 years out of 30).
A time series of daily meteorological data preferably over 30 years (or more) recent years is required to assess the probability of exceedance. Final remarks and conclusions
For assessment of the excess soil moisture condition in soils, the duration of the soil water content at field capacity (or above) calculated from meteorological data and soil properties is considered to be more suitable than (i) average rainfall alone because the suggested method does consider the evaporative component; and more suitable also than (ii) the straightforward "Climatic water balance" because soil profile characteristics are taken into account and therefore soil variations are reflected; however this necessitates detailed characteristics soil data and computation of soil moisture balance. References
Allen, R. G., Pereira, L. S., Raes, D., and Smith, M.,1998. “Crop evapotranspiration: Guidelines for computing crop requirements.” Irrigation and Drainage Paper No. 56, FAO, Rome, Italy. Brady N.C., 1984. The Nature and Properties of Soils, 9th edition - p.97. Macmillan, New York. Daroussin, J., 1998. Attribute coding: Database dictionary of the Soil Geographical Database of Europe at 1;1,000,000 scale. In: Heineke, H.J., Eckelmann, W., Thomasson, A.J., Jones, R.J.A., Montanarella, L. and Buckley, B. (eds). Land Information Systems: Developments for planning the sustainable use of land resources. European Soil Bureau Research Report No.4, EUR 17729 EN, Office for Official Publications of the European Communities, Luxembourg, 546pp. Earl R., 1997. Prediction of trafficability and workability from soil moisture deficit. Soil and Tillage Research 40:155-168. Fitzgerald J.B. et al., 2008. Simulation of the influence of poor soil drainage on grass-based dairy production systems in Ireland. Grass and Forage Science, 63, 380–389 Fitzgerald J.B. et al., 2009. Assessment of the adaptation potential of grass-based dairy systems to climate change in Ireland - The maximised production scenario. Agricultural and forest meteorology, 149, (2009) 244 – 255 Hall D. G. M., Reeve, M. J.: Thomasson, A. J. & Wright, V. F., 1977. Water retention, porosity and density of field soils. Soil Survey Technical Monograph No.9, 75pp. Herbin T. et al, 2011. The effects of dairy cow weight on selected soil physical properties indicative of compaction. Soil Use and Management, March 2011, 27, 36–44.
44
Hodgson, J.M.,1997. Soil survey field handbook. Soil Survey Technical Monograph No.5, Harpenden, UK, 116pp. Jones, R.J.A. and Thomasson, A.J., 1993. Effects of soil-climate-system interactions on the sustainability of land use: a European perspective. In Kimble, J.M. Utilization of Soil Survey Information for Sustainable Land Use. Proceedings of the Eighth International Soil Management Workshop. May, 1993, 39-52. USDA Soil Conservation Service, National Soil Survey. Jones R.J.A., Zdruli P. and Montanarella L., 2000. The estimation of drought risk in Europe from soil and climatic data. In: Drought and Drought Mitigation in Europe. J.V. Vogt and F. Somma (eds.): 133-146. Kluwer Academic Publishers. the Netherlands. Keane T., 2001. Agro-meteorological data – types and sources. In 'Agro-meteorological modelling – Principles, data and applications' (cd. N.M. Holden), Agmet, Dublin, 254 pages. Kinsella A., Laepple D., Moran B. and Hennessy T., 2010. Benefits of extending the grazing season. TResearch 5(4):30-31. Teagasc, Carlow, Ireland. Laidlaw, 2009: The effect of soil moisture content on leafextension rate and yield of perennial ryegrass. Irish Journal of Agricultural and Food Research 48: 1–20, 2009 Lalor S. T. J. and Schulte R. P. O., 2008. Low-ammonia-emission application methods can increase the opportunity for application of cattle slurry to grassland in spring in Ireland. Grass and Forage Science, 63, 531–544 Pistocchi A., Bouraoui F., Bitelli M., 2008. A simplified parameterization of the monthly topsoil water budget. Water Resources Research, vol. 44, W12440. Rounsevell M.D.A and Jones R.J.A., 1993. A soil and agroclimatic model for estimating machinery workdays: Part I - The basic model and climatic sensitivity. Soil & Tillage Research, 26, 179-191. Schulte R.P.O. Diamond J., Finkele K., Holden N.M. and Brereton A.J., 2005. Predicting the soil moisture conditions of Irish grasslands. Irish Journal of Agricultural and Food Research 44:95-110. Schulte R.P.O., Richards K., Daly K., Kurz I., McDonald E.J. and Holden N.M., 2006. Agriculture, meteorology and water quality in Ireland: a regional evaluation of pressures and pathways of nutrient loss to water. Biology & Environment 106B, 117-134. Shalloo L., 2009. Abatement measure: Increasing the length of the grazing season on dairy farms. Submission to Department of Agriculture, Fisheries and Food, Dublin, October 2009. Shalloo L., Dillon P., O’Loughlin J., Rath M. and Wallace M., 2004. Comparison of a pasture-based system of milk production on a high rainfall, heavy-clay soil with that on a lower rainfall, free-draining soil. Grass and Forage Science 59:157-168
45
Soil Survey Staff, 1993. Soil survey manual. United States Department of Agriculture Handbook No. 18. Washington, DC: US Department of Agriculture, 437pp. Smith L.P. and Trafford B.D., 1976. Climate and Drainage. Technical Bulletin No. 34, Ministry of Agriculture, Fisheries and Food, London, 119pp. Thomasson, A.J.,1982. Soil and climatic aspects of workability and trafficability. Proceedings of the 9th Conference of the International Soil Tillage Research Organization, Osijek, Yugoslavia, 1982, 551-7. Thomasson, A.J. and Jones, R.J.A., 1989. Mapping soil trafficability in the UK by computer. In: Agriculture: Computerization of land use data, (eds R.J.A. Jones and B. Biagi), 97-109. Office for Official Publications of the European Communities, Luxembourg, EUR 11151 EN. Van-Orshoven J., Terres J-M. and Eliasson A. (eds), 2008. Common bio-physical criteria to define natural constraints for agriculture in Europe. Definition and scientific justification for the common criteria. JRC Scientific and Technical Reports, EUR 23412 EN, 61pp.
46
Criterion 4 “Unfavourable Soil Texture and Stoniness” Author: David Rossiter, ITC, Enschede, the Netherlands
Contributor: Bob Jones, Cranfield University, United Kingdom
Edited by: Jos Van Orshoven (K.U.Leuven, Leuven, Belgium), Jean-Michel Terres and Tibor Tóth (JRC, Ispra, Italy)
Agronomic importance
Soil texture is directly related to water-holding capacity and nutrient supply. Texture affects workability (ease of tillage), water infiltration, runoff, and movement within the soil (both down and up).
Definition
The texture of a soil refers to the relative proportions of different-sized soil particles in the bulk soil. It is more correctly called the particle-size distribution. Conventionally it is divided into two parts: coarse fragments > 2 mm effective diameter, and the fine soil. Both parts are further subdivided. Commonly-used classifications are from the USDA-NRCS (Soil Survey Division Staff 1993) and the FAO (FAO 2006).
Another definition of soil texture is the feel or perceived resistance to various manipulations of loose soil samples in the field. This perception is mostly controlled by particle-size distribution, as well as the type of clay, the amount of organic matter (mostly in surface horizons) and the presence of calcium carbonate. The difficulty with this definition is the subjective field determination, using descriptive keys (e.g. Table 25 in FAO 2006), although experienced field scientists generally agree with each other and can estimate the clay and silt contents with considerable accuracy (Hodgson et al., 1976).
Scientific background
Soil texture is a soil characteristic which plays an important role in many land qualities (LQ). In the FAO Guidelines for Land Evaluation (Rainfed agriculture) (FAO 1983) it is important in LQ3 “Moisture availability”, LQ4 “Oxygen availability to roots”, LQ5 “Nutrient availability”, LQ6 “Nutrient retention”, LQ7 “Rooting conditions”, LQ16 “Soil workability”, LQ24 “Erosion hazard” and can play a role in several others. It is quite difficult to isolate the effects of soil texture without reference to these land qualities.
Soil texture is directly related to water-holding capacity and nutrient supply. Soil colloids (clays) hold almost all the nutrients supplied by the mineral soil, whether the products of weathering or as added fertilizers or manures. Pores hold water hygroscopically at different tensions against plant extraction and gravity; the size of pores is directly related to the particle-size distribution. Texture controls soil structure, affecting workability or ease of cultivation (Thomasson and Jones, 1989), water infiltration, runoff, and movement within the soil (both down and up); although the type of clay mineral also has an important effect.
The silt and very fine sand fraction is associated with a high susceptibility to accelerated water and wind erosion (Hudson 1995). Soils with high proportions of these fractions require intensive soil conservation practices.
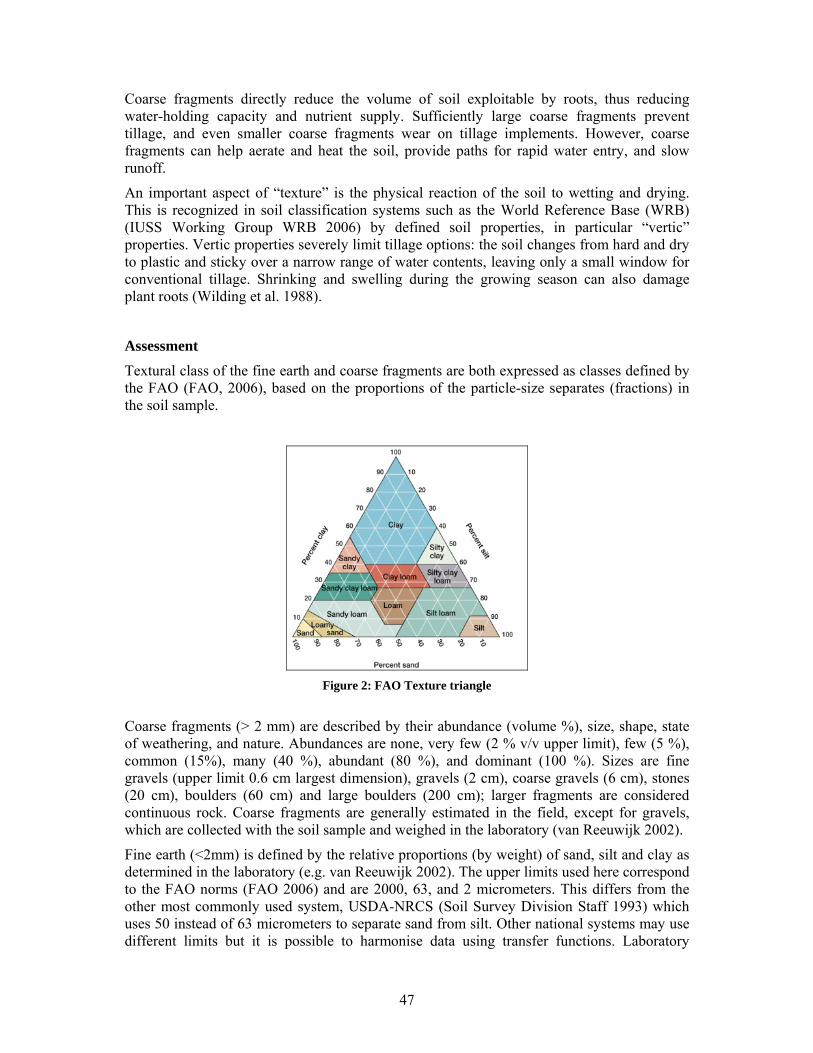
47
Coarse fragments directly reduce the volume of soil exploitable by roots, thus reducing water-holding capacity and nutrient supply. Sufficiently large coarse fragments prevent tillage, and even smaller coarse fragments wear on tillage implements. However, coarse fragments can help aerate and heat the soil, provide paths for rapid water entry, and slow runoff.
An important aspect of “texture” is the physical reaction of the soil to wetting and drying. This is recognized in soil classification systems such as the World Reference Base (WRB) (IUSS Working Group WRB 2006) by defined soil properties, in particular “vertic” properties. Vertic properties severely limit tillage options: the soil changes from hard and dry to plastic and sticky over a narrow range of water contents, leaving only a small window for conventional tillage. Shrinking and swelling during the growing season can also damage plant roots (Wilding et al. 1988).
Assessment
Textural class of the fine earth and coarse fragments are both expressed as classes defined by the FAO (FAO, 2006), based on the proportions of the particle-size separates (fractions) in the soil sample.
Figure 2: FAO Texture triangle
Coarse fragments (> 2 mm) are described by their abundance (volume %), size, shape, state of weathering, and nature. Abundances are none, very few (2 % v/v upper limit), few (5 %), common (15%), many (40 %), abundant (80 %), and dominant (100 %). Sizes are fine gravels (upper limit 0.6 cm largest dimension), gravels (2 cm), coarse gravels (6 cm), stones (20 cm), boulders (60 cm) and large boulders (200 cm); larger fragments are considered continuous rock. Coarse fragments are generally estimated in the field, except for gravels, which are collected with the soil sample and weighed in the laboratory (van Reeuwijk 2002).
Fine earth (<2mm) is defined by the relative proportions (by weight) of sand, silt and clay as determined in the laboratory (e.g. van Reeuwijk 2002). The upper limits used here correspond to the FAO norms (FAO 2006) and are 2000, 63, and 2 micrometers. This differs from the other most commonly used system, USDA-NRCS (Soil Survey Division Staff 1993) which uses 50 instead of 63 micrometers to separate sand from silt. Other national systems may use different limits but it is possible to harmonise data using transfer functions. Laboratory
48
methods, while apparently objective, are subject to relatively wide discrepancies even among certified laboratories (van Reeuwijk 1984).
Vertic properties are defined by the WRB (IUSS Working Group WRB 2006) as having either (1) ≥ 30% clay throughout a thickness of at least 15 cm and one or both of the following: (a) slickensides or wedge-shaped aggregates; or (b) cracks ≥ 1 cm wide that open and close periodically; or (2) a coefficient of linear expansion (COLE) of 0.06 or more averaged over depth of 100 cm from the soil surface. Cracks and slickensides are observed in the field; COLE is measured in the laboratory (Dane et al. 2002).
Values for severe and very severe threshold
Over 40% coarse fragments reduce water-holding capacity by at least 40%, exacerbating seasonal droughts in most European climates. In addition, coarse fragments damage tillage equipment whereas rock outcrops and boulders prevent tillage altogether. Sand has very limited water-holding capacity, due to the large pores, and almost no nutrient holding or supplying capacity such that normal fertilization practices have limited efficiency. Heavy clays are difficult to cultivate and, although the available water capacity is neither large nor small, the water is held at large suctions (high tension) making it difficult for plant roots to extract it. Most clay soils also have very slow permeability so that excess water ponds on the soil surface after even moderate rains rather than draining downwards through the soil profile. Silts are very susceptible to water and wind erosion and difficult to protect against these processes of soil loss. Vertic properties limit tillage options and may result in direct physical damage to plant roots on wetting and drying.
Therefore soil texture is said to be severely limiting if any of following conditions are met:
• Volume of coarse fragments of any kind in topsoil is 15% or more, including rock outcrops, boulders or large boulders; or
• Dominant texture class (fine earth particle < 2mm) of topsoil is:
o sand, loamy sand (defined as Silt% + 2xClay% ≤ 30%); or
o heavy clay (≥ 60% clay); or
• organic soil1 as defined with organic matter (≥30%) of 40 cm or more, either extending down from the surface or taken cumulatively within the upper 80 cm of the soil (histic horizon, FAO Problem Soils Database, http://www.fao.org/AG/AGL/agll/prosoil.hist.htm); or
• Topsoil texture class of clay, silty clay, sandy clay, combined with presence of soil layer with vertic properties within 100 cm of the soil surface as defined by the WRB (FAO-IUSS-ISRIC, 2006).
NB: Originally, the texture class values for severe handicap were stricter (coarse or medium sand, loamy coarse sand). However, simulations made by Member States returned that, in a majority of cases, the information on sand fractions necessary to assess the handicap was not available in their texture nomenclatures. It was therefore suggested to use a simpler texture
1 Organic soils are very fragile ecosystems and improper management can drastically affect them (mineralization of organic matter). Moreover, they act as organic carbon pools and play an important role in carbon sequestration; therefore they should be properly treated, preferably left in their natural condition.
49
classification system, available in most Member States, less strict than the original threshold but still identifying natural handicaps to agriculture.
Final remarks and conclusions
Soil texture is a major determinant of soil suitability for any land use, as evidenced in its influence on many land qualities. The textures selected for the thresholds ensure that areas so identified are indeed less favourable for conventional agriculture, while their identification is possible with data available in most Member States soil databases.
It should be recognized that texture interacts strongly with water holding capacity (available water capacity of the soil) and climate, such that soil moisture deficits are often associated with textural limitations. Stony or coarse-textured soils in cool, cloudy climates with regular small rain showers may suffer moisture deficits; conversely, loamy soils in hot, cloudless conditions with widely-spaced and irregular rainfall may show strong water deficit. Additionally, effective rooting depth interacts directly with texture limitations to determine the available water capacity of the soil. A water-balance model incorporating actual rainfall and potential evapotranspiration and available water capacity of the soil may provide an objective basis for the estimation of water deficits.
Different types of clay minerals, having similar particle size, have greatly different nutrient-holding capacity. Soil structure (aggregation of the fines) can have a large effect on effective pore-size distribution and hence water-holding capacity. Organic matter can supply nutrients and hold water. All of these affect the tilt of the soil.
References
Dane JH, Topp GC, Campbell GS (2002): Methods of soil analysis. Part 4, Physical methods. Madison, Wis.: Soil Science Society of America.
FAO (1983): Guidelines: land evaluation for rainfed agriculture. Soils Bulletin 52. Rome, Italy: Food and Agriculture Organization of the United Nations.
FAO (2006): Guidelines for soil profile description (4th ed.). Rome: Food and Agriculture Organization of the United Nations.
IUSS Working Group WRB (2006): World reference base for soil resources 2006 (2nd ed.). World Soil Resources Report 103. Rome: FAO.
Hodgson, J.M., Hollis, J.M., Jones, R.J.A. and Palmer, R.C. (1976). A comparison of field estimates and laboratory analyses of the silt and clay contents of some west Midland soils. J. Soil Sci. 27. 411-19.
Hudson N (1995): Soil conservation (3rd ed.). Ames, IA: Iowa State University Press.
Soil Survey Division Staff (1993): Soil survey manual. United States Department of Agriculture Handbook No. 18. Washington, DC: US Department of Agriculture.
Thomasson, A.J.and Jones, R.J.A. (1989). Land evaluation at regional scale. In: Land qualities in space and time (eds. J. Bouma and A.K. Bregt). 231-240, Pudoc, Wageningen NL.
van Reeuwijk LP (1984): Laboratory Methods and Data Exchange Program for Soil Characterization. A report on the pilot round. Part I: CEC and texture. ISRIC Technical Paper 6. Wageningen: ISRIC.
50
van Reeuwijk LP (Ed.) (2002): Procedures for soil analysis (6th ed.). Wageningen: ISRIC.
Wilding LP, Puentes R, Texas A & M University System., United States. Soil Management Support Services. (1988): Vertisols : their distribution, properties, classification, and management. College Station, TX: Texas A&M University Printing Center.

51
52
Criterion 5 “Shallow Rooting Depth” Author:David Rossiter, ITC, Enschede, the Netherlands
Contributor:Bob Jones, Cranfield University, United Kingdom
Editors:Jos Van Orshoven (K.U.Leuven, Leuven, Belgium), Jean-Michel Terres and Tibor Tóth (JRC, Ispra, Italy)
Agronomic importance
Roots grow into the soil to provide a physical anchor for the plant, and to extract soil-bound water and nutrients. For annual grain crops and grasses, the anchoring function does not require great depth (except for tall varieties of maize); the first 10cm or so provide enough stability. However, water is rapidly exhausted from shallow depths by the growing plant. Potential evapotranspiration rates of 1 to 4 mm water per day, combined with a typical available water capacity of 150 mm water per vertical meter of soil profile, imply that water will soon be exhausted in shallow soils.
Rooting depth is generally constrained by coherent hard rock or hardpans (dense soil layers).
Physical limitations to rooting depth are also impediments to normal tillage, such that if plant roots cannot grow easily, it is unlikely that the plough can cut easily into the soil. Standard tillage depth is 15 to 25 cm.
Definition
Rooting depth is the maximum depth from the soil surface to where most of the plant roots can extend during a growing season. In the FAO Guidelines for Land Evaluation (Rainfed agriculture) (FAO 1983) it is referred to as LQ7 “Rooting conditions …. for the development of an effective root system”. In the current definition, we restrict ourselves to the soil characteristic “rooting depth”, defined both by the effective soil depth above any barrier to root extension, excluding impediments to root extension as such compact (massive) structure.
Scientific background
Provided there is no barrier to root extension, in the form of hard rock or a cemented (pan) layer, most crop plants roots extend to depths in the range 60cm to 1.2m, although in some cases rooting can be deeper, for example sugar beet 140cm (Hall et al., 1977; Jones et al., 2000). Some perennial plants, particularly in arid areas, can exploit the soil to much greater depths (5-10m), usually to extract water.
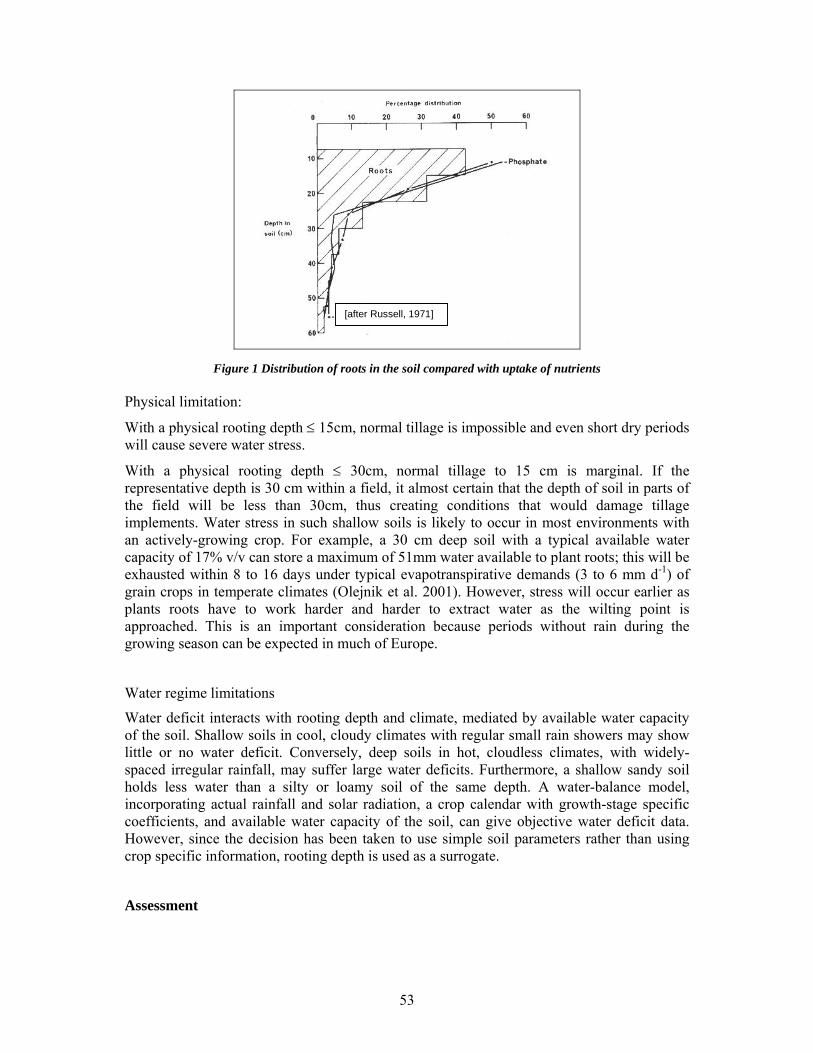
53
Figure 1 Distribution of roots in the soil compared with uptake of nutrients Physical limitation:
With a physical rooting depth ≤ 15cm, normal tillage is impossible and even short dry periods will cause severe water stress.
With a physical rooting depth ≤ 30cm, normal tillage to 15 cm is marginal. If the representative depth is 30 cm within a field, it almost certain that the depth of soil in parts of the field will be less than 30cm, thus creating conditions that would damage tillage implements. Water stress in such shallow soils is likely to occur in most environments with an actively-growing crop. For example, a 30 cm deep soil with a typical available water capacity of 17% v/v can store a maximum of 51mm water available to plant roots; this will be exhausted within 8 to 16 days under typical evapotranspirative demands (3 to 6 mm d-1) of grain crops in temperate climates (Olejnik et al. 2001). However, stress will occur earlier as plants roots have to work harder and harder to extract water as the wilting point is approached. This is an important consideration because periods without rain during the growing season can be expected in much of Europe.
Water regime limitations
Water deficit interacts with rooting depth and climate, mediated by available water capacity of the soil. Shallow soils in cool, cloudy climates with regular small rain showers may show little or no water deficit. Conversely, deep soils in hot, cloudless climates, with widely-spaced irregular rainfall, may suffer large water deficits. Furthermore, a shallow sandy soil holds less water than a silty or loamy soil of the same depth. A water-balance model, incorporating actual rainfall and solar radiation, a crop calendar with growth-stage specific coefficients, and available water capacity of the soil, can give objective water deficit data. However, since the decision has been taken to use simple soil parameters rather than using crop specific information, rooting depth is used as a surrogate.
Assessment
[after Russell, 1971]
54
During routine field survey, rooting depth is typically assessed by augering. The observed depths are then interpolated with reference to the landscape structure to produce rooting depth estimates for land areas or map units.
Values for severe and very severe threshold
- Severe: Physical rooting depth: ≤ 30cm
Final remarks and conclusions
Shallow rooting depth is a serious constraint for conventional agriculture, adversely affecting crop growth (nutrient and water are limiting) and restricting tillage operations necessary to cultivate the soil. Therefore, shallow soils can certainly be considered ‘less favoured’ for conventional agriculture.
A rooting depth of ≤ 30cm is severely limiting to crop growth. Even deeper soils may have severe or root development problems due to massive or platy structure, vertic properties, and chemical environment. So not all soils without this limitation as here evaluated have in fact satisfactory rooting conditions.
References
ESB Scientific Committee, 2001. Georeferenced soil database for Europe: Manual of Procedures (European Soil Bureau Resarch Report 5; EUR 18092 EN ). Ispra, Italy: European Soil Bureau.
FAO, 1983. Guidelines: land evaluation for rainfed agriculture. Soils Bulletin 52. Rome, Italy: Food and Agriculture Organization of the United Nations.
Hall, D.G.M., Reeve, M.J., Thomasson, A.J., Wright, V.F., 1977. Water retention, porosity and density of field soils. Soil Survey Technical Monograph No. 9, Harpenden, UK, 75pp.
Jones, R.J.A., Zdruli, P. and Montanarella, L. (2000). The estimation of drought risk in Europe from soil and climatic data. In: Drought and Drought Mitigation in Europe. J.V. Vogt and F. Somma (eds.): 133-146. Kluwer Academic Publishers. the Netherlands.
Olejnik J, Eulenstein F, Kedziora A, Werner A, 2001. Evaluation of a water balance model using data for bare soil and crop surfaces in Middle Europe. Agricultural and Forest Meteorology, 106(2), 105-116.
Russell, R.S. (1971). Root systems and nutrition. In: Potential Crop Production, P.E. Waring and J.P. Cooper (eds), p.101-116. Heinemann Educational Books, London.

55
56
Criterion 6 “Poor Chemical Properties” Criterion 6.1 “Soil salinity” Author: Freddy Nachtergaele, FAO, Rome, Italy
Contributor: Bob Jones, Cranfield University, United Kingdom
Editors:Jos Van Orshoven (K.U.Leuven, Leuven, Belgium), Jean-Michel Terres and Tibor Tóth (JRC, Ispra, Italy)
Agronomic importance
With regard to agriculture, the consequences of soil salinity include:
- Significant losses of productivity, with some land entirely out of production. With increasing soil salinity, plants always find it more difficult to extract water from the altered soils. Most normal crop and pasture plants are not highly salt-tolerant and will eventually die out under saline conditions;
- Damaged soil structure and increasing content of toxic substances that may be limiting to plant growth;
- More serious soil erosion, both by wind and by water, due to worsening soil structure and reducing vegetation cover.
Definition
Salinity is the presence of soluble salt in the land surface, in soil or rocks, or dissolved in water in rivers or groundwater. Salinity can develop naturally, but where human intervention has disturbed natural ecosystems, the movement of salt into rivers and onto land has been accelerated. Soil salinity refers to the total amount of soluble salt in soil.
In the context of less favourable areas for agriculture in Europe, soil salinity is a characteristic of land for which the total amount of soluble salt in soil is too high for plants to perform or survive.
Scientific background
Soil salinity may impact on agriculture, water quality, public infrastructure and urban households and on biodiversity and the environment.
Dryland salinity occurs where there is removal or loss of native vegetation, and its replacement with crops and pastures that have shallower roots. This results in more water reaching the groundwater system. The groundwater rises to near the surface in low-lying areas. It carries dissolved salts from the soil and bedrock material through which it travels. As saline groundwater comes close to the soil surface (within 2m), salt enters the plant root zone. Even where the groundwater does not bring much salt with it, the waterlogging of the plant root zone alone can damage or kill vegetation.
As soil salinity levels increase, plants extract water less easily from soil, aggravating water stress conditions. High soil salinity can also cause nutrient imbalances, result in the
57
accumulation of elements toxic to plants, and reduce water infiltration if the level of one salt element -sodium- is high.
There is a large amount of literature on crop responses to salinity levels and extensive research has been undertaken, particularly in dryland countries (USA and Australia). A selected list of references is given below.
Assessment
Soil salinity is determined by measuring the electrical conductivity of a solution extracted from a water-saturated soil paste. Salinity is abbreviated as ECe (Electrical Conductivity of the extract) with units of deci-siemens per meter (dS/m).
Values for severe and very severe threshold
Salinity tolerance is influenced by many plant, soil, and environmental factors and their interrelationships. Generally, fruits, vegetables, and ornamentals are more salt sensitive than forage or field crops. In addition, certain varieties, cultivars, or root stalks may tolerate higher salt levels than others. Plants are more sensitive to high salinity during seedling stages, immediately after transplanting, and when subject to other (e.g., disease, insect, nutrient) stresses. A general response list is given in Table 1.
Table 1. General guidelines for plant response to soil salinity.
Salinity (ECe, dS/m) Plant response
0 to 2 2 to 4 4 to 8
8 to 16 above 16
mostly negligible growth of sensitive plants may be restricted growth of many plants is restricted only tolerant plants grow satisfactorily only a few, very tolerant plants grow satisfactorily
Although crop response to soil salinity is crop specific, overall there are good arguments to accept that:
- Levels over 4dS/m in topsoil severely affect many plants (while levels over 16dS/m very severely affect many plants so that land characterized by such salinity levels are excluded for most agricultural uses).
Final remarks and conclusions
Although excessive soil salinity in the EU is constrained to zones in Hungary, Romania and Spain, its effects are very real and have to take into consideration for land assessment.
References (not cited)
Agricultural Salinity Assessment and Management. 1990 K.K. Tanji, Editor, American Society of Civil Engineers, New York, N.Y.
58
Diagnosis and improvement of saline and alkali soils. 1954. USDA (Handbook 60).
Brinkman, R., 1980. Saline and sodic soils. In: Land reclamation and water management, p. 62-68. International Institute for Land Reclamation and Improvement (ILRI), Wageningen, The Netherlands.
FAO, 1988: Salt-affected soils and their management, Soil Bulletin # 39. FAO, Rome
FAO, 1999: Soil salinity assessment- methods and interpretation of electrical conductivity measurements. FAO Irrigation and Drainage paper # 57. FAO, Rome.
Proceedings Trans-National Meeting, (1997). Salinity as a Factor for Agricultural Productivity in the Mediterranean Basin. INRC-ONR-CIHEAM publication. Naples.
Richards, L. A. (1954). Diagnosis and improvement of Saline and Alkali Soils. US Dept. Agric. Handbook No. 60. USDA. Washington, D. C.
Szabolcs, I. (Ed.) (1971). European Solonetz Soils and Their Reclamation. Akadémiai Kiadó. Budapest.
Szabolcs, I. (1974). Salt- Affected Soils in Europe. Martinus Nijhoff - the Hague and RISSAC - Budapest.

59
60
Criterion 6 “Poor Chemical Properties” Criterion 6.2 “Soil Sodicity”
Author:Freddy Nachtergael,( FAO, Rome, Italy)
Editors:Jos Van Orshoven (K.U.Leuven, Leuven, Belgium), Jean-Michel Terres and Tibor Tóth (JRC, Ispra, Italy)
Agronomic importance
Soil sodicity has two main effects on soils and indirectly on its agricultural capacity to produce. Note that sodicity effects are often indirect as they affect vital soil properties rather than crop growth itself.
1. Sodic soils are prone to waterlogging. Sodicity at the soil surface results in soil crusting and decreased hydraulic conductivity and available rooting depth. Consequently soils become prone to water logging. If sodicity occurs below the root zones of plants, its effect on crop productivity may be less apparent, but it can still cause significant problems. For example, in a high rainfall area on sloping land, subsurface water will flow over the sodic layer and be lost in lateral drainage. On flatter land, the sodic layer may not permit water to drain, leading to waterlogging at the surface.
2. Sodic soils erode easily. Sodic topsoils in dry regions are subject to dust storms. Sodic soils on sloping land are also subject to water erosion, which means that important fertile topsoil is lost from agricultural land. When water flows in channels or rivulets, soil is washed away along these lines forming furrows called rills. In some cases, even larger channels of soil removal, called gullies, develop. In other situations where only the subsoil is sodic on sloping land, subsurface water flowing over this sodic layer will create tunnels, leaving cavities that eventually collapse to form gullies.
3. General effects. In Australia sodicity is estimated to costs agriculture as much as $2 billion each year in lost production. And its impacts extend to water catchments, infrastructure facilities and the environment. Run-off from sodic soils carries clay particles into waterways and reservoirs causing water turbidity, or cloudiness. The effects of turbidity, and its removal, are very costly for industrial and domestic water users. Turbidity also causes environmental problems in rivers and wetlands. In addition, run-off from sodic soils is more likely to carry higher levels of nitrogen and phosphate into waterways and reservoirs. These are the nutrients that contribute to algal blooms, another significant environmental problem.
Definition
Sodicity refers to the presence of a high proportion of adsorbed sodium in the clay fraction of soils. Sodic soils are normally characterized by a dense, strongly structured, clay illuviation horizon that has a high proportion of adsorbed sodium ions.
In the context of less favorable areas for agriculture in Europe, soil sodicity is a characteristic of land for which the proportion of adsorbed sodium in the soil clay fraction is too high for plants to perform or survive.
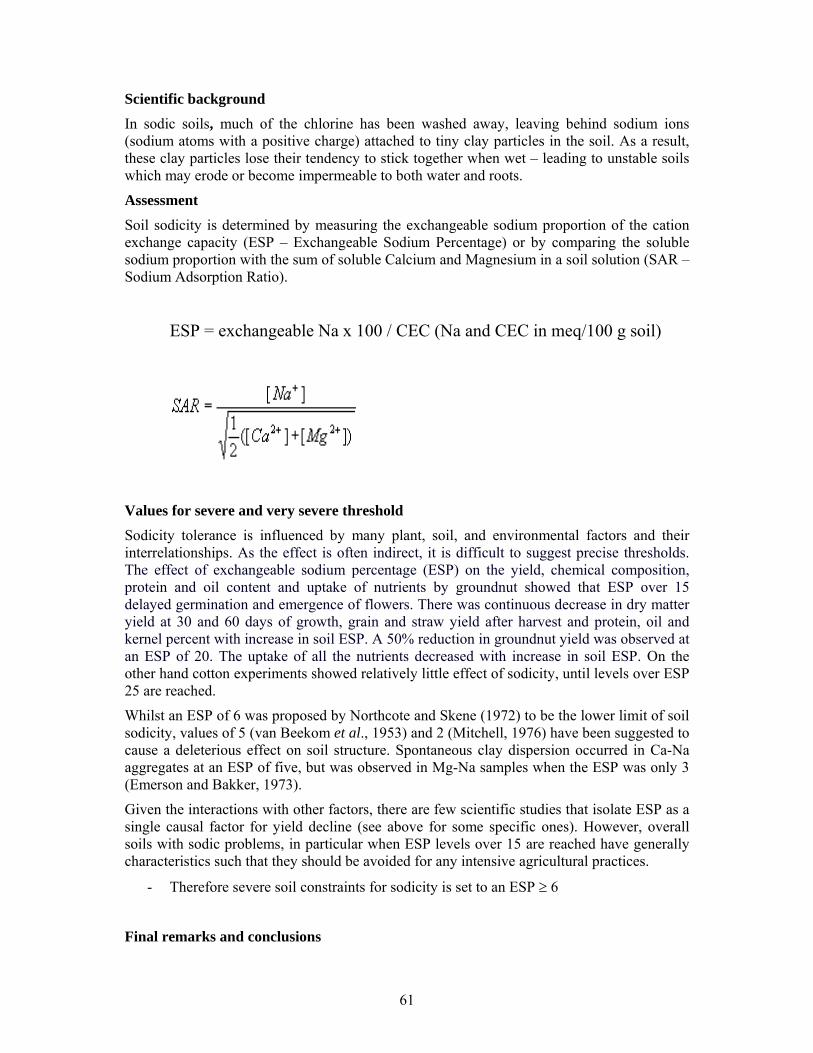
61
Scientific background
In sodic soils, much of the chlorine has been washed away, leaving behind sodium ions (sodium atoms with a positive charge) attached to tiny clay particles in the soil. As a result, these clay particles lose their tendency to stick together when wet – leading to unstable soils which may erode or become impermeable to both water and roots.
Assessment
Soil sodicity is determined by measuring the exchangeable sodium proportion of the cation exchange capacity (ESP – Exchangeable Sodium Percentage) or by comparing the soluble sodium proportion with the sum of soluble Calcium and Magnesium in a soil solution (SAR – Sodium Adsorption Ratio).
ESP = exchangeable Na x 100 / CEC (Na and CEC in meq/100 g soil)
Values for severe and very severe threshold
Sodicity tolerance is influenced by many plant, soil, and environmental factors and their interrelationships. As the effect is often indirect, it is difficult to suggest precise thresholds. The effect of exchangeable sodium percentage (ESP) on the yield, chemical composition, protein and oil content and uptake of nutrients by groundnut showed that ESP over 15 delayed germination and emergence of flowers. There was continuous decrease in dry matter yield at 30 and 60 days of growth, grain and straw yield after harvest and protein, oil and kernel percent with increase in soil ESP. A 50% reduction in groundnut yield was observed at an ESP of 20. The uptake of all the nutrients decreased with increase in soil ESP. On the other hand cotton experiments showed relatively little effect of sodicity, until levels over ESP 25 are reached.
Whilst an ESP of 6 was proposed by Northcote and Skene (1972) to be the lower limit of soil sodicity, values of 5 (van Beekom et al., 1953) and 2 (Mitchell, 1976) have been suggested to cause a deleterious effect on soil structure. Spontaneous clay dispersion occurred in Ca-Na aggregates at an ESP of five, but was observed in Mg-Na samples when the ESP was only 3 (Emerson and Bakker, 1973).
Given the interactions with other factors, there are few scientific studies that isolate ESP as a single causal factor for yield decline (see above for some specific ones). However, overall soils with sodic problems, in particular when ESP levels over 15 are reached have generally characteristics such that they should be avoided for any intensive agricultural practices.
- Therefore severe soil constraints for sodicity is set to an ESP ≥ 6
Final remarks and conclusions
62
Although excessive soil salinity in the EU is constrained to zones in Hungary, Romania and Spain, its effects are very real and have to taken into consideration for land assessment.
References (cited and not cited)
Emerson, W.W. and Bakker, A.C., 1973: The comparative effects of exchangeable calcium, magnesium, and sodium on some physical properties of red-brown earth subsoils. II. The spontaneous dispersion of aggregates in water. Australian Journal of Soil Research 11, 151-157.
Leeper, G.W. and Uren, N.C., 1993: `Soil Science: an introduction'. (Fifth Edition). Melbourne University Press, Carlton.
Mitchell, J.K., 1976: `Fundamentals of soil behaviour'. John Wiley and Sons Inc., New York.
Northcote, K.H. and Skene, J.K.M., 1972: `Australian soils with saline and sodic properties'. CSIRO Australia, Division of Soils Soil Publication No. 27.
Quirk, J.P., 2001: The significance of the threshold and turbidity concentrations in relation to sodicity and microstructure. Australian Journal of Soil Research 39, 1185-1217.
Rengasamy, P. and Churchman, G.J., 1999: Cation exchange capacity, exchangeable cations and sodicity. In Peverill, K.I., Sparrow, L.A. and Reuter, D.J., (eds) `Soil Analysis: an Interpretation Manual'. CSIRO Publishing, Collingwood, 147-157.
Rengasamy, P. and Sumner, M.E., 1998: Processes involved in sodic behaviour. In Sumner, M.E. and Naidu, R., (eds) `Sodic soils - distribution, properties, management and environmental consequences'. Oxford University Press, New York, 35-50.
Sumner, M.E., 1993: Sodic soils: new perspectives. Australian Journal of Soil Research 31, 683-750.
Sumner, M.E., Rengasamy, P. and Naidu, R. 1998: Sodic soils: a reappraisal. In Sumner, M.E. and Naidu, R. (eds) `Sodic Soils - Distribution, Properties, Management and Environmental Consequences'. Oxford University Press, New York, 3-17.
van Beekom, C.W.C., van den Berg, C., de Boer, Th.A., van der Molen, W.H., Verhoeven, B., Westerhof, J.J., Zuur, A.J., 1953: Reclaiming land flooded with salt water. Netherlands Journal of Agricultural Science 1, 153-163 and 225-244.

63
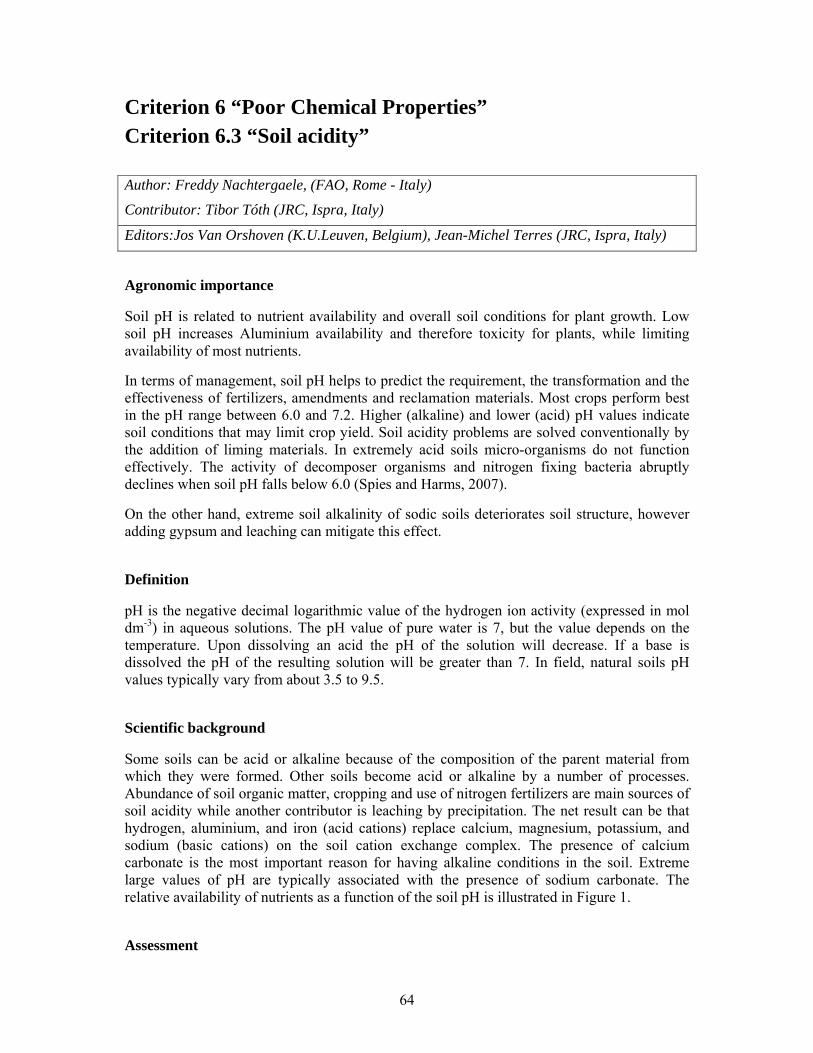
64
Criterion 6 “Poor Chemical Properties” Criterion 6.3 “Soil acidity” Author: Freddy Nachtergaele, (FAO, Rome - Italy)
Contributor: Tibor Tóth (JRC, Ispra, Italy)
Editors:Jos Van Orshoven (K.U.Leuven, Belgium), Jean-Michel Terres (JRC, Ispra, Italy)
Agronomic importance
Soil pH is related to nutrient availability and overall soil conditions for plant growth. Low soil pH increases Aluminium availability and therefore toxicity for plants, while limiting availability of most nutrients.
In terms of management, soil pH helps to predict the requirement, the transformation and the effectiveness of fertilizers, amendments and reclamation materials. Most crops perform best in the pH range between 6.0 and 7.2. Higher (alkaline) and lower (acid) pH values indicate soil conditions that may limit crop yield. Soil acidity problems are solved conventionally by the addition of liming materials. In extremely acid soils micro-organisms do not function effectively. The activity of decomposer organisms and nitrogen fixing bacteria abruptly declines when soil pH falls below 6.0 (Spies and Harms, 2007).
On the other hand, extreme soil alkalinity of sodic soils deteriorates soil structure, however adding gypsum and leaching can mitigate this effect.
Definition
pH is the negative decimal logarithmic value of the hydrogen ion activity (expressed in mol dm-3) in aqueous solutions. The pH value of pure water is 7, but the value depends on the temperature. Upon dissolving an acid the pH of the solution will decrease. If a base is dissolved the pH of the resulting solution will be greater than 7. In field, natural soils pH values typically vary from about 3.5 to 9.5.
Scientific background
Some soils can be acid or alkaline because of the composition of the parent material from which they were formed. Other soils become acid or alkaline by a number of processes. Abundance of soil organic matter, cropping and use of nitrogen fertilizers are main sources of soil acidity while another contributor is leaching by precipitation. The net result can be that hydrogen, aluminium, and iron (acid cations) replace calcium, magnesium, potassium, and sodium (basic cations) on the soil cation exchange complex. The presence of calcium carbonate is the most important reason for having alkaline conditions in the soil. Extreme large values of pH are typically associated with the presence of sodium carbonate. The relative availability of nutrients as a function of the soil pH is illustrated in Figure 1.
Assessment
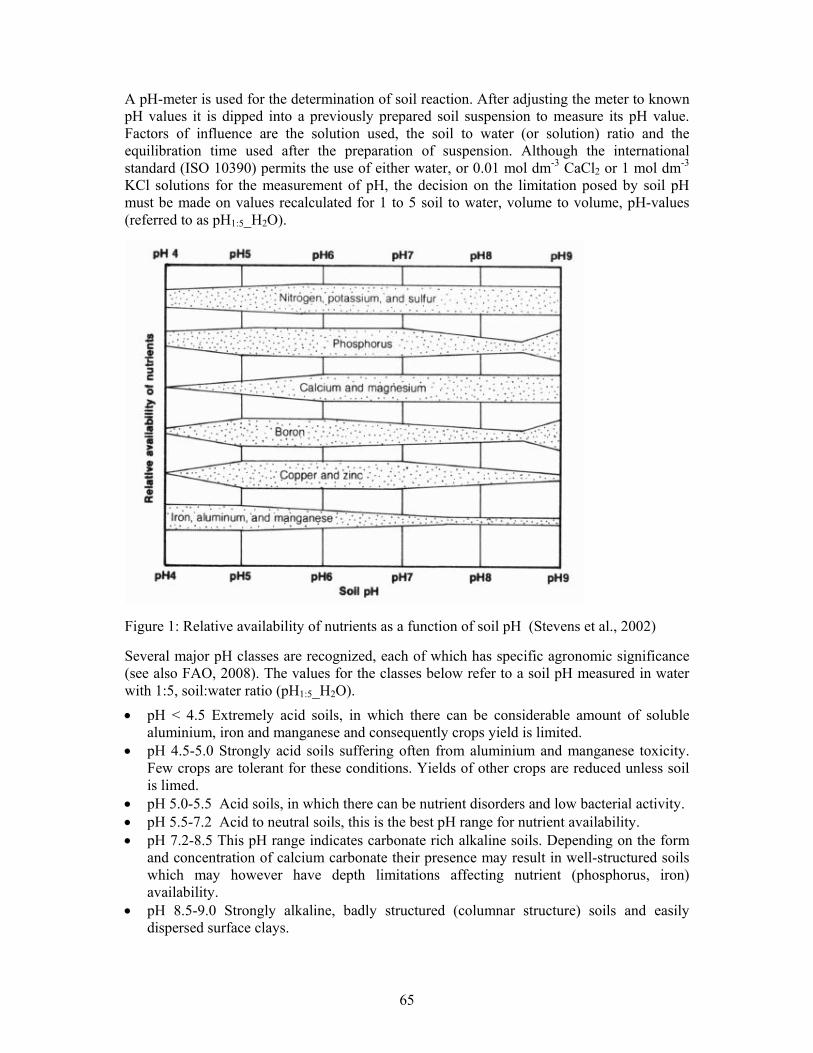
65
A pH-meter is used for the determination of soil reaction. After adjusting the meter to known pH values it is dipped into a previously prepared soil suspension to measure its pH value. Factors of influence are the solution used, the soil to water (or solution) ratio and the equilibration time used after the preparation of suspension. Although the international standard (ISO 10390) permits the use of either water, or 0.01 mol dm-3 CaCl2 or 1 mol dm-3 KCl solutions for the measurement of pH, the decision on the limitation posed by soil pH must be made on values recalculated for 1 to 5 soil to water, volume to volume, pH-values (referred to as pH1:5_H2O).
Figure 1: Relative availability of nutrients as a function of soil pH (Stevens et al., 2002)
Several major pH classes are recognized, each of which has specific agronomic significance (see also FAO, 2008). The values for the classes below refer to a soil pH measured in water with 1:5, soil:water ratio (pH1:5_H2O). • pH < 4.5 Extremely acid soils, in which there can be considerable amount of soluble
aluminium, iron and manganese and consequently crops yield is limited. • pH 4.5-5.0 Strongly acid soils suffering often from aluminium and manganese toxicity.
Few crops are tolerant for these conditions. Yields of other crops are reduced unless soil is limed.
• pH 5.0-5.5 Acid soils, in which there can be nutrient disorders and low bacterial activity. • pH 5.5-7.2 Acid to neutral soils, this is the best pH range for nutrient availability. • pH 7.2-8.5 This pH range indicates carbonate rich alkaline soils. Depending on the form
and concentration of calcium carbonate their presence may result in well-structured soils which may however have depth limitations affecting nutrient (phosphorus, iron) availability.
• pH 8.5-9.0 Strongly alkaline, badly structured (columnar structure) soils and easily dispersed surface clays.
66
• pH > 9.0 Very strongly alkaline, typically highly sodic soils with toxic levels of sodium carbonate and bad structure.
Values for severe threshold of soil acidity
Severe conditions would correspond to topsoil with pH-values less than 5.0, severely impeding crop growth and impacting negatively nutrients availability.
Final remarks and conclusions
Based on the type and concentration of solution, the measured soil pH-values can vary. According to experience pH-values measured in suspensions prepared with 0.1-1 mol dm-3 solutions (referred to as pH_KCl, or pH_CaCl2), can be 0.5-1.5 unit lower than those measured in aqueous suspensions (referred to as pH_H2O) (Bohn et al., 1989). The above thresholds are based on pH values measured at 1:5 soil to water ratio.
High soil pH is typical in sodic soils only. Since the factsheet “Soil Sodicity” has a threshold for these, it was not necessary to indicate a pH threshold for them.
References
Bohn, H.L., B.L. McNeal, and G.A. O’Connor. 1989. Soil chemistry. 2nd ed. John Wiley & Sons, New York. FAO/IIASA/ISRIC/ISS-CAS/JRC, 2008. Harmonized World Soil Database (version 1.0). FAO, Rome, Italy and IIASA, Laxenburg, Austria. ISO 10390:2005. Soil quality-Determination of pH Spies, C. D. and C. L. Harms. 2007. Soil Acidity and Liming of Indiana Soils AY-267 RR 6/88. Department of Agronomy, Purdue University. Purdue University. Cooperative Extension Service. West Lafayette. Stevens, G., P. Motavalli, P. Scharl, M. Nathan, D Dunn. 2002. Crop nutrient deficiencies and toxicities. MU Extension. University of Missouri-Columbia. IPM1016

67
68
Criterion 7 ”Steep Slope” Compiled by: Freddy Nachtergael,(FAO, Italy)
Edited by: Jos Van Orshoven,(K.U.Leuven, Belgium) Jean-Michel Terres (JRC, Ispra, Italy)
Agronomic importance
Slope as such has little or no direct influence on the yield of crops. However the steeper the slope the more difficult it becomes to manage the land and the less opportunities have farmers to grow crops. In particular mechanisation is hampered while access to land and all agricultural operations become more time consuming. Steeper slopes are also associated with shallower soils in general (Leptosols, Regosols), with less water retention capacity due to gravity and with a higher risk for soil degradation (erosion) and landslides.
Definition
Slope is the angle the soil surface makes with the horizontal. It can be expressed in degrees or as a percentage (45 degrees = 100 percent). The form of the slope may be important and influence the moisture status of the underlying soils, as happens in concave or convex slopes. A particular important characteristic for agriculture is the aspect (direction of exposure) of the slope that may result in significant higher temperatures on south-exposed slopes as compared to northern exposed ones (in the northern hemisphere).
Scientific background
Slope is frequently used as a criterion to assess capability and suitability of land for agriculture. In the British land capability classification, slope is recognized to have a marked effect on mechanical farming as follows in Table 1:
Table 1: slope classes according to Bibby and Mackney, 1969. Slope (degrees)
Slope (percent)
Slope class Problems
0-3 0-5,2 Gently sloping None
3-7 5,2-12,3 Moderately sloping
Difficulties with weeders, precision seeders and some mechanised root crop harvesters
7-11 12,3-19,4 Strongly sloping
Use of combine harvester restricted
11-15 19,4-26,8
Moderately steep
Limit of use of combine harvester and of two way ploughing (depending of field configuration)
15-25 26,8-46,6
Steep Not suitable for arable crops, with slopes over 20° being difficult to plough, lime or fertilise
>25 >46,6 Very steep Mass movement occurs, animal tracks across slope appear and mechanisation impossible without specialised equipment
69
Klingebiel and Montgomery (1966) distinguish four classes: 0-2%, 2-6%, 6-12% and >12%. For sugar beet and potato crops, Sys et al. (1991) distinguish between 5 classes (0-2%, 2-4%, 4-8%, 8-16% and >16%) where the 5th one is considered to make land unsuitable for these crops. For wheat production, the classes are 0-2%, 2-8%, 8-12%, 12-16% and >16%. Again the >16% class is considered to be unsuitable. However, medium to low intensive pastures are the advisable land uses and still possible on steeper slopes.
Assessment
Several instruments have been developed over time to determine the angle of the land. Topography has been estimated through photogrammetry techniques. Most national cartographic institutes have Digital Elevation Model (DEM) with a horizontal resolution of 10-20m or below. A particular recent development is the availability of radar and satellite obtained elevation measurements with a high resolution. For a given location, the estimation of the slope will be affected by the resolution of the DEM (coarse resolution DEM will under-estimate the real slope).
Slope can be determined by algorithms from neighbouring altitude data. The resulting ‘local’ slopes must be registered for each grid and their respective areas, above the threshold value, sum-up to be applicable as an indicator of land suitability.
Values for severe threshold
From the above, it can be stated that slopes above 15% start to pose problems for mechanized cultivation, specific equipment may start to be required.
Final remarks and conclusions
Slope of land clearly affects its suitability for agricultural production; mainly through the restrictions steeper slopes impose on mechanization of crop management and on their vulnerability to soil erosion. Terracing is a way of overcoming the slope restrictions but is at the expense of important investments and has in addition to cope with limitation due to soil depth. Furthermore, steep slopes will accelerated water erosion if the land is not managed appropriately.
References
Bibby, J. and D. Mackney, 1969. Land use capability classification. Soil survey technical monograph No 1.
Klingebiel A.A. and P.H. Montgomery, 1966. Agricultural handbook 210, USDA, Washington, USA.
Sys, C., E. Van Ranst and J. Debaveye, 1991. Land evaluation Parts I and II: Principles in land evaluation and crop production calculations. Agricultural publications No 7. Training Centre for postgraduate soil scientists, Rijksuniversiteit Gent, Belgium.

70

71
72
European Commission EUR 25203 EN – Joint Research Centre – Institute for Environment and Sustainability Title: Updated common bio-physical criteria to define natural constraints for agriculture in Europe. Definition and scientific justification for the common criteria; Technical Factsheets Author(s): Jos Van Orshoven, Jean-Michel Terres, T Tóth Luxembourg: Office for Official Publications of the European Communities 2012 – 75 pp. – 21 x 29.7 cm EUR – Scientific and Technical Research series – ISSN 1831-9424 (online) ISBN 978-92-79-23066-0 doi 10.2788/91182 Abstract A panel of soil, climate and land evaluation experts reviewed a set of land evaluation methods in order to elaborate an approach which can support the identification of natural constraints to agriculture in the EU27. The driver for this exercise is Article 50.3 of EC-Regulation 1698/2005 calling for the revision of the existing system based on criteria related to low soil productivity and poor climate conditions for agriculture and the consequent Communication from the Commission: "Towards a better targeting of the aid to farmers in areas with natural handicaps" of 21 Apr. 2011. The FAO’s agricultural problem land approach was selected and adjusted to come forward with the policy requirement. The FAO approach was deemed appropriate because it is not crop-specific and for its simple assumptions regarding the mutual interaction of land characteristics on the overall suitability of the land, making it applicable for a territory as large and diverse as the EU27. Two climatic and four soil criteria were retained and complemented by one integrated soil-climate criterion (Excess soil moisture – Field Capacity duration), with slope as the sole topographic criterion. For each criterion a critical limit was defined dividing the criterion range into two categories: not limiting and severely limiting for agriculture. The criteria and the associated critical limits or threshold values have been tested by Member States of the European Union. Feedbacks and suggestions from Member States simulations have been taken into account to update the initial list of bio-physical criteria so that the applicability is ensured in EU27. Therefore, they can be used in Member States to discriminate land with biophysical constraints to agricultural production on the basis that soil and climate data have sufficient spatial and semantic details. This document provides the scientific and agronomic rationale for bio-physical criteria identifying natural constraints (soil and climate) to agriculture in EU27.


How to obtain EU publications
Our priced publications are available from EU Bookshop (http://bookshop.europa.eu), where you can place an order with the sales agent of your choice. The Publications Office has a worldwide network of sales agents. You can obtain their contact details by sending a fax to (352) 29 29-42758.
The mission of the JRC is to provide customer-driven scientific and technical support for the conception, development, implementation and monitoring of EU policies. As a service of the European Commission, the JRC functions as a reference centre of science and technology for the Union. Close to the policy-making process, it serves the common interest of the Member States, while being independent of special interests, whether private or national.
LB
-NA
-25203-EN-N


![[Updated Constantly] - ITExamAnswers.net](https://static.fdokumen.com/doc/165x107/631602506ebca169bd0b61e0/updated-constantly-itexamanswersnet.jpg)