Define - Six Sigma Fundamentals - Global Edulink
37
Define Phase Six Sigma Fundamentals
-
Upload
khangminh22 -
Category
Documents
-
view
2 -
download
0
Transcript of Define - Six Sigma Fundamentals - Global Edulink
Define PhaseSix Sigma Fundamentals

2
Six Sigma Fundamentals
Voice of the Customer
Cost of Poor Quality
Process Maps
Process Metrics
Six Sigma Fundamentals
Selecting Projects
Elements of Waste
Understanding Six Sigma
Wrap Up & Action Items
3
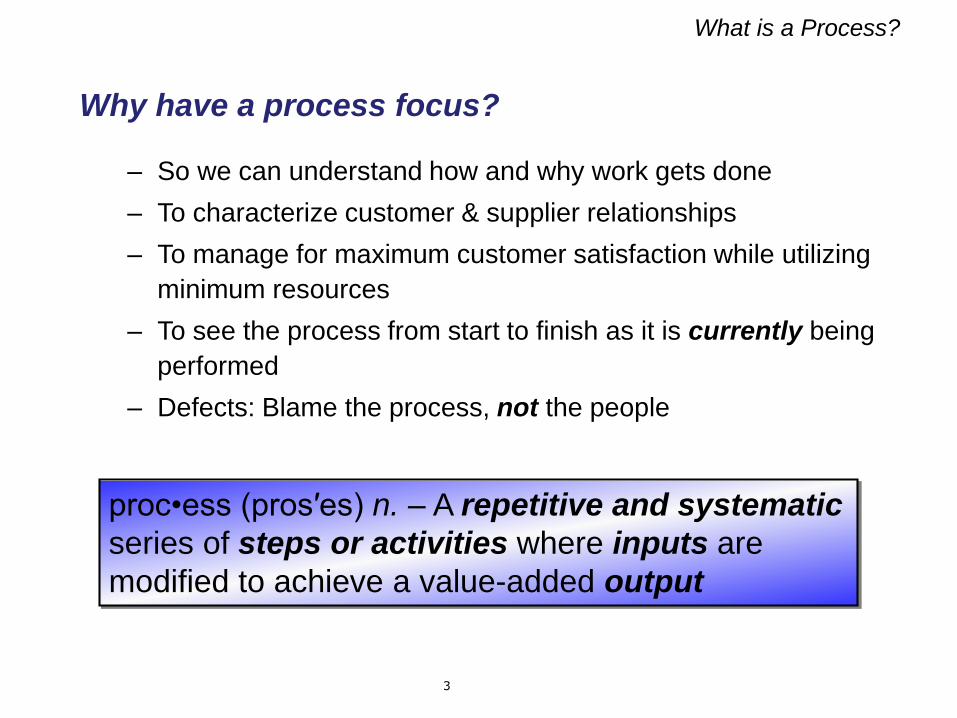
What is a Process?
Why have a process focus?
– So we can understand how and why work gets done
– To characterize customer & supplier relationships
– To manage for maximum customer satisfaction while utilizing
minimum resources
– To see the process from start to finish as it is currently being
performed
– Defects: Blame the process, not the people
proc•ess (pros′es) n. – A repetitive and systematic
series of steps or activities where inputs are
modified to achieve a value-added output

4
Examples of Processes
• Injection molding
• Decanting solutions
• Filling vial/bottles
• Crushing ore
• Refining oil
• Turning screws
• Building custom homes
• Paving roads
• Changing a tire
• Recruiting staff
• Processing invoices
• Conducting research
• Opening accounts
• Reconciling accounts
• Filling out a timesheet
• Distributing mail
• Backing up files
• Issuing purchase orders
We go through processes every day. Below are some examples of
those processes. Can you think of other processes within your
daily environment?
5
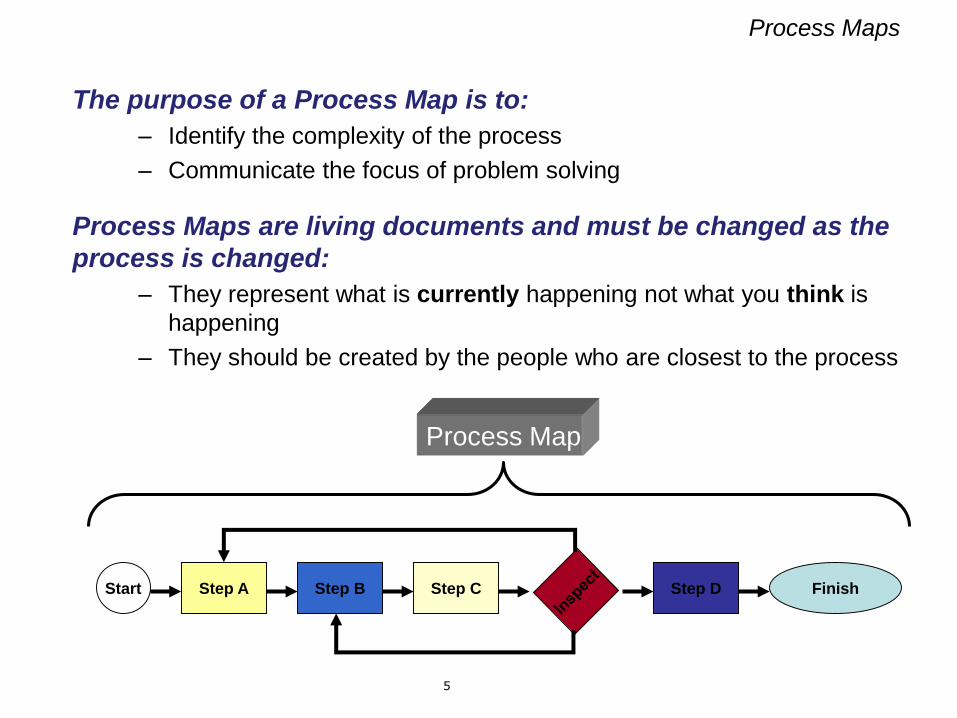
Process Maps
The purpose of a Process Map is to:
– Identify the complexity of the process
– Communicate the focus of problem solving
Process Maps are living documents and must be changed as the
process is changed:
– They represent what is currently happening not what you think is
happening
– They should be created by the people who are closest to the process
Step AStart FinishStep B Step C Step D
Process Map

6
Process Map Symbols
Standard symbols for Process Mapping: (available in Microsoft Office™, Visio™, iGrafx™ , SigmaFlow™ and other products)
A RECTANGLE indicates an
activity. Statements within
the rectangle should begin
with a verb
A DIAMOND signifies a decision
point. Only two paths emerge from
a decision point: No and Yes
An ELLIPSE shows the start
and end of the process
A PARALLELOGRAM shows
that there are data
An ARROW shows the
connection and direction
of flow
1A CIRCLE WITH A LETTER OR
NUMBER INSIDE symbolizes the continuation of a flowchart to another page
7
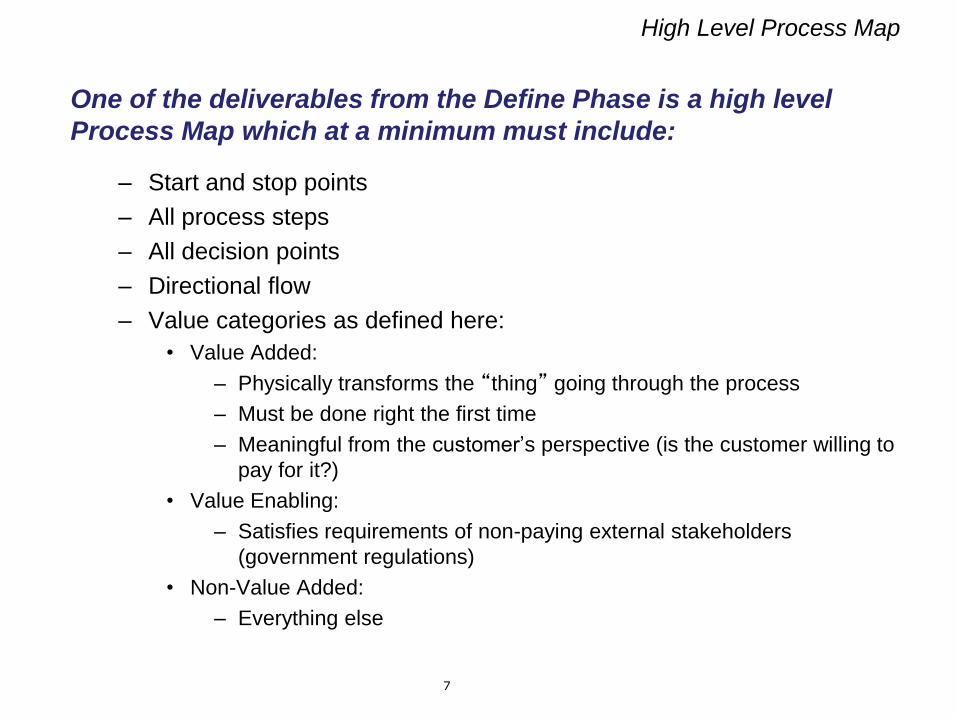
High Level Process Map
One of the deliverables from the Define Phase is a high level
Process Map which at a minimum must include:
– Start and stop points
– All process steps
– All decision points
– Directional flow
– Value categories as defined here:
• Value Added:
– Physically transforms the “thing” going through the process
– Must be done right the first time
– Meaningful from the customer’s perspective (is the customer willing to
pay for it?)
• Value Enabling:
– Satisfies requirements of non-paying external stakeholders
(government regulations)
• Non-Value Added:
– Everything else

8
Process Map for a Call Center
START
LOGON TO PC &
APPLICATIONS
SCHEDULED
PHONE TIME?
LOGON
TO PHONE
CALL or
WALK-IN?
PHONE DATA
CAPTURE BEGINS
DETERMINE WHO
IS INQUIRING
ACCESS CASE TOOL
CASE TOOL
RECORD?
Y
N
A
Z
CALL
WALK-IN
DETERMINE NATURE
OF CALL & CONFIRM
UNDERSTANDING
Y
NC
B
D PHONE
TIME
Y
N
Z
B
C
REVIEW CASE
TOOL HISTORY &
TAKE NOTES
PUT ON HOLD,
REFER TO
REFERENCES
IMMEDIATE
RESPONSE
AVAILABLE?
Y
N
TRANSFER
APPROPRIATE?
Y
N
TRANSFER
CALL
ANSWER?Y
N
QUERY INTERNAL
HRSC SME(S)
ANSWER?Y
N
OFF HOLD AND
ARRANGE CALL
BACK PHONE DATA
ENDS
PROVIDE
RESPONSE
PHONE&
NOTE
DATA ENDS
D
ADD TO
RESEARCH
LIST
Z
LOGOFF PHONE, CHECK
MAIL,E-MAIL,VOICE MAIL
SCHEDULED
PHONE TIME?
N
Y
A
E
EXAMINE NEXT NOTE
OR RESEARCH ITEM
ACCESS CASE TOOL
ENTER APPROPRIATE
SSAN (#,9s,0s)
IF EMP DATA NOT
POPULATED, ENTER
OLD
CASE
Y
N
UPDATE ENTRIES
INCL OPEN DATE/TIME
CREATE A CASE
INCL CASE TYPE
DATE/TIME, &
NEEDED BY
AUTO
ROUTE
YROUTE
CASE
CLOSED
N
Y
N
CLOSE CASE
W/
DATE/TIMEE
TAKE ACTION
or
DO RESEARCH
F
GO TO
F or E
DEPENDING ON
CASEF
E
NEXT
9
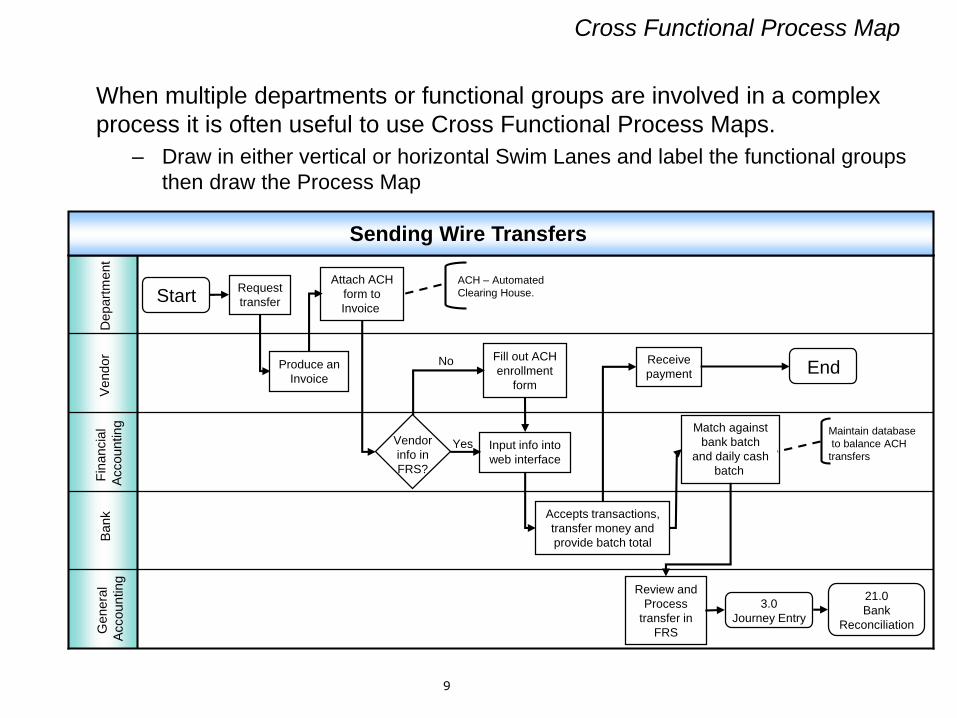
Cross Functional Process Map
When multiple departments or functional groups are involved in a complex
process it is often useful to use Cross Functional Process Maps.
– Draw in either vertical or horizontal Swim Lanes and label the functional groups
then draw the Process Map
Genera
l
Accounting
Bank
Fin
ancia
l
Accounting
Vendor
Depart
ment
StartRequest
transfer
Attach ACH
form to
Invoice
Produce an
Invoice
Fill out ACH
enrollment
form
Receive
payment End
Vendor
info in
FRS?
Input info into
web interface
Match against
bank batch
and daily cash
batch
Accepts transactions,
transfer money and
provide batch total
Review and
Process
transfer in
FRS
3.0
Journey Entry
21.0
Bank
Reconciliation
Maintain database
to balance ACH
transfers
ACH – Automated
Clearing House.
No
Yes
Sending Wire Transfers
10
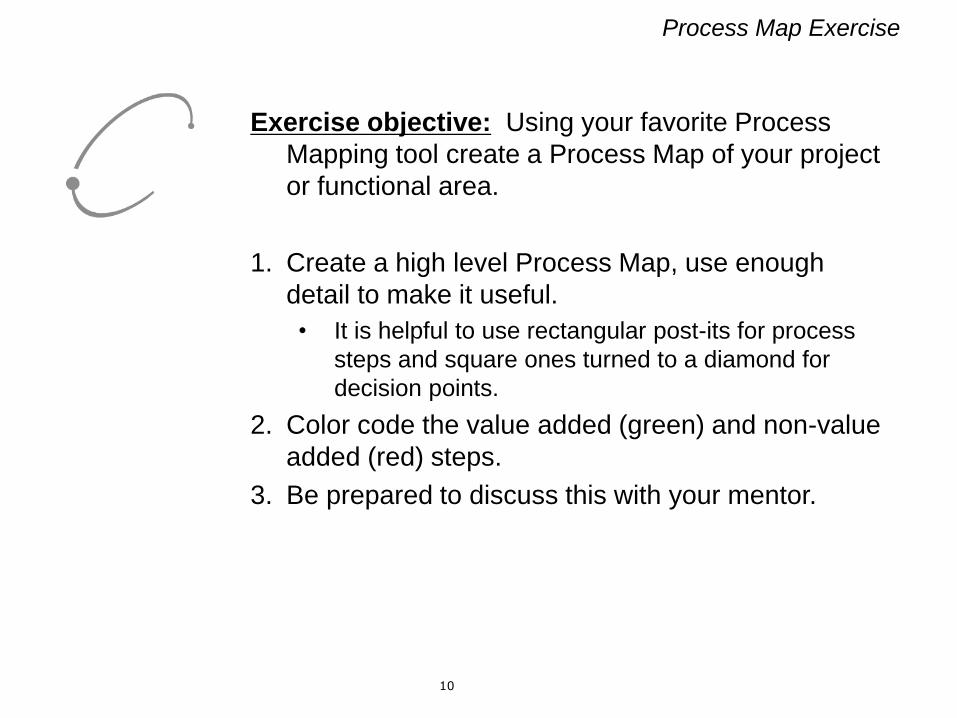
Process Map Exercise
Exercise objective: Using your favorite Process
Mapping tool create a Process Map of your project
or functional area.
1. Create a high level Process Map, use enough
detail to make it useful.
• It is helpful to use rectangular post-its for process
steps and square ones turned to a diamond for
decision points.
2. Color code the value added (green) and non-value
added (red) steps.
3. Be prepared to discuss this with your mentor.
11
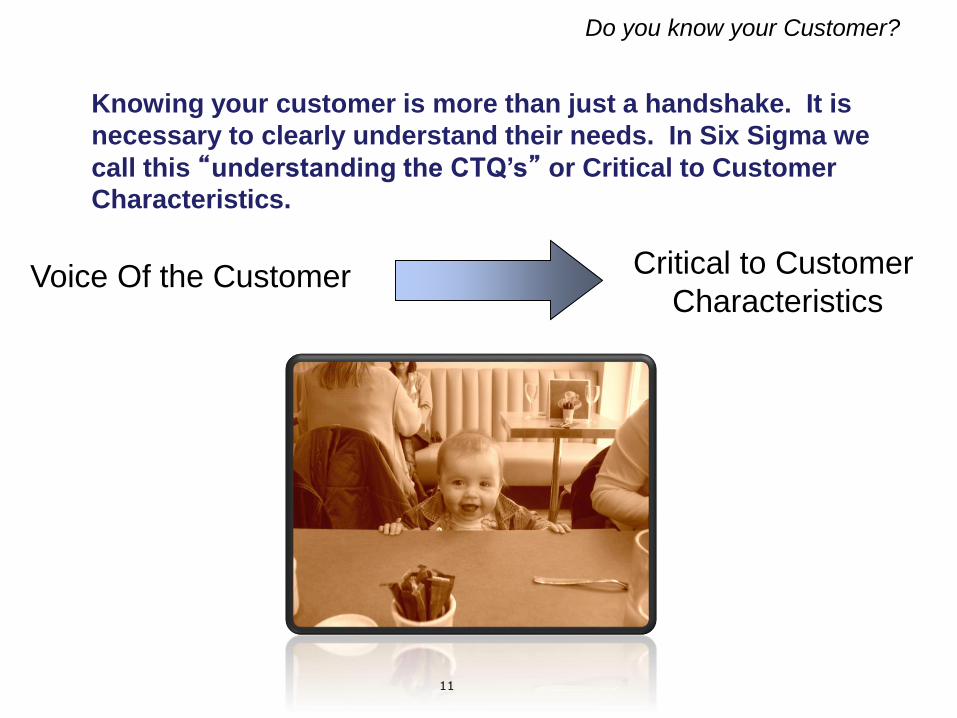
Do you know your Customer?
Knowing your customer is more than just a handshake. It is
necessary to clearly understand their needs. In Six Sigma we
call this “understanding the CTQ’s” or Critical to Customer
Characteristics.
Voice Of the Customer Critical to Customer
Characteristics
12
Voice of the Customer
Voice of the Customer or VOC seems obvious; after all, we all know what the customer wants. Or do we??
The customer’s perspective has to be foremost in the mind of the Six Sigma Belt throughout the project cycle.
1. Features• Does the process provide what the customers expect and need?
• How do you know?
2. Integrity• Is the relationship with the customer centered on trust?
• How do you know?
3. Delivery• Does the process meet the customer’s time frame?
• How do you know?
4. Expense• Does the customer perceive value for cost?
• How do you know?
13
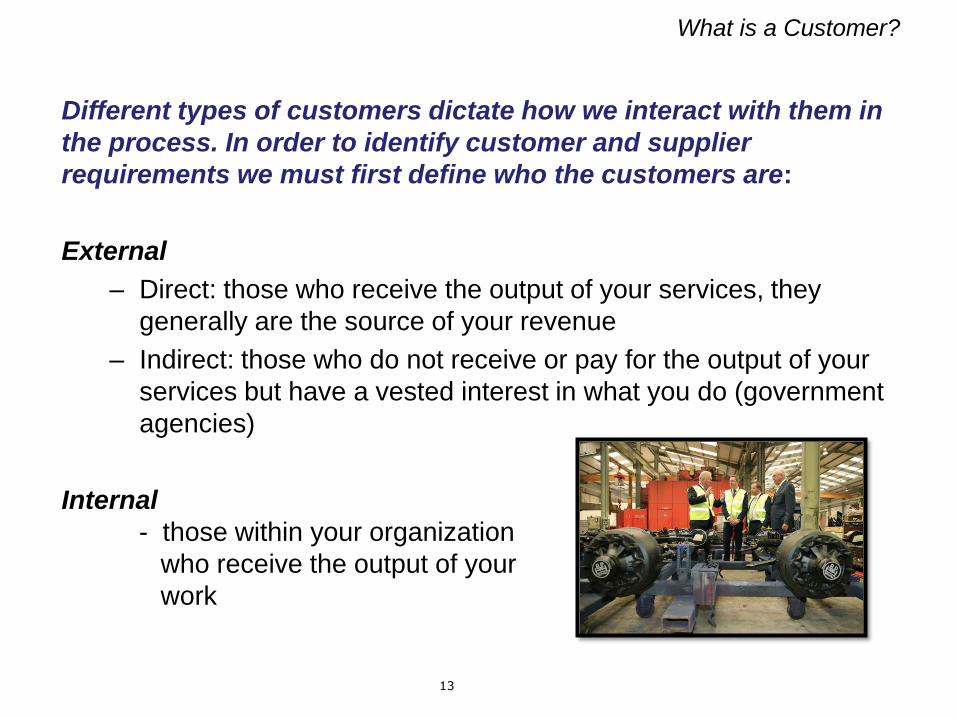
What is a Customer?
Different types of customers dictate how we interact with them in
the process. In order to identify customer and supplier
requirements we must first define who the customers are:
External
– Direct: those who receive the output of your services, they
generally are the source of your revenue
– Indirect: those who do not receive or pay for the output of your
services but have a vested interest in what you do (government
agencies)
Internal
- those within your organization
who receive the output of your
work
14
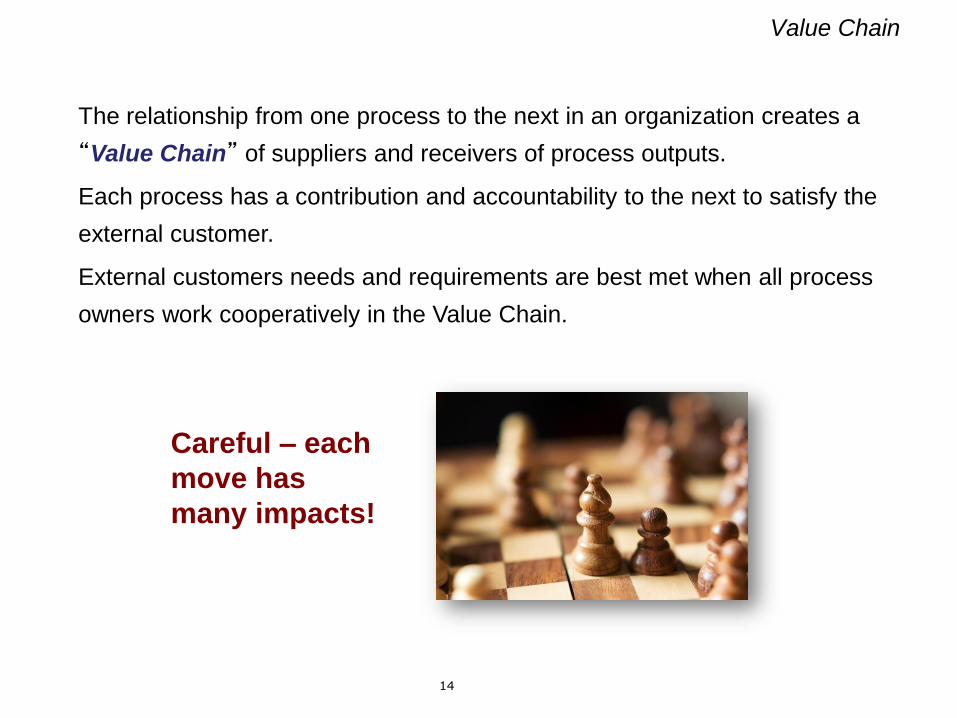
Value Chain
The relationship from one process to the next in an organization creates a
“Value Chain” of suppliers and receivers of process outputs.
Each process has a contribution and accountability to the next to satisfy the
external customer.
External customers needs and requirements are best met when all process
owners work cooperatively in the Value Chain.
Careful – each
move has
many impacts!

15
What is a CTQ?
Critical to Quality (CTQ’s) are measures we use to capture VOC
properly. (also referred to in some literature as CTC’s – Critical to
Customer)
CTQ’s can be vague and difficult to define.
– The customer may identify a requirement that is difficult to measure
directly so it will be necessary to break down what is meant by the
customer into identifiable and measurable terms
Product:
• Performance
• Features
• Conformance
• Timeliness
• Reliability
• Serviceability
• Durability
• Aesthetics
• Reputation
• Completeness
Service:
• Competence
• Reliability
• Accuracy
• Timeliness
• Responsiveness
• Access
• Courtesy
• Communication
• Credibility
• Security
• Understanding

16
Developing CTQ’s
Step 1
Step 2
Step 3
Capture VOC
• Review existing performance
• Determine gaps in what you need to know
• Select tools that provide data on gaps
• Collect data on the gaps
Validate CTQ’s
• Translate VOC to CTQ’s
• Prioritize the CTQ’s
• Set Specified Requirements
• Confirm CTQ’s with customer
Identify Customers
• Listing
• Segmentation
• Prioritization
17
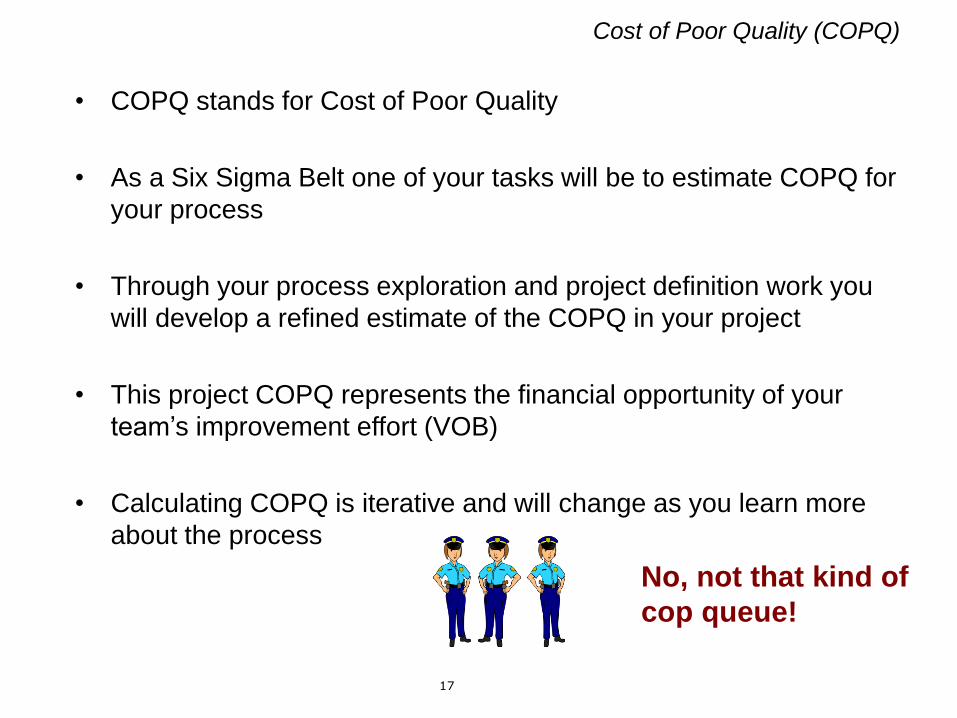
Cost of Poor Quality (COPQ)
• COPQ stands for Cost of Poor Quality
• As a Six Sigma Belt one of your tasks will be to estimate COPQ for
your process
• Through your process exploration and project definition work you
will develop a refined estimate of the COPQ in your project
• This project COPQ represents the financial opportunity of your
team’s improvement effort (VOB)
• Calculating COPQ is iterative and will change as you learn more
about the process
No, not that kind of
cop queue!
18
The Essence of COPQ
• The concepts of traditional Quality Cost are the foundation for
COPQ.
– External, Internal, Prevention, Appraisal
• A significant portion of COPQ from any defect comes from effects
that are difficult to quantify and must be estimated.
• COPQ helps us understand the financial impact of problems created
by defects.
• COPQ is a symptom, not a defect
– Projects fix defects with the intent of improving symptoms.
19
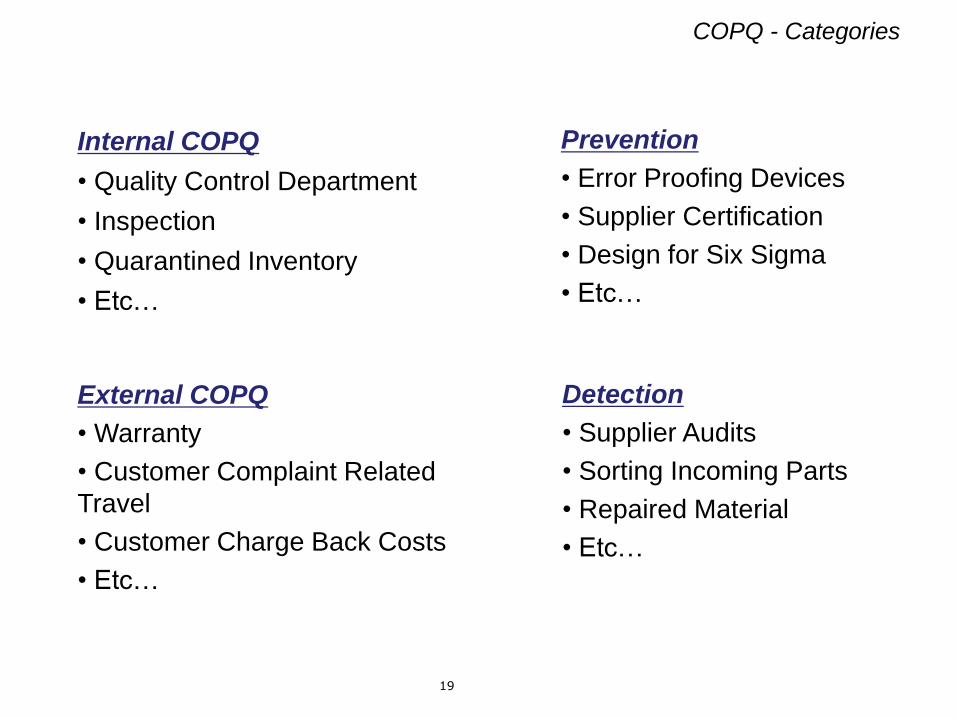
COPQ - Categories
External COPQ
• Warranty
• Customer Complaint Related
Travel
• Customer Charge Back Costs
• Etc…
Prevention
• Error Proofing Devices
• Supplier Certification
• Design for Six Sigma
• Etc…
Detection
• Supplier Audits
• Sorting Incoming Parts
• Repaired Material
• Etc…
Internal COPQ
• Quality Control Department
• Inspection
• Quarantined Inventory
• Etc…

20
COPQ - Iceberg
Rework
InspectionWarranty
Rejects
Lost sales
Late delivery
Engineering change orders
Long cycle times
Expediting costs
Excess inventory
Hidden Costs(Soft Costs)
Visible Costs(Hard Costs)
Lost Customer Loyalty
More set-ups
Time value of money
Working Capital allocations
Excessive Material
Orders/Planning
Recode
(less obvious)
21
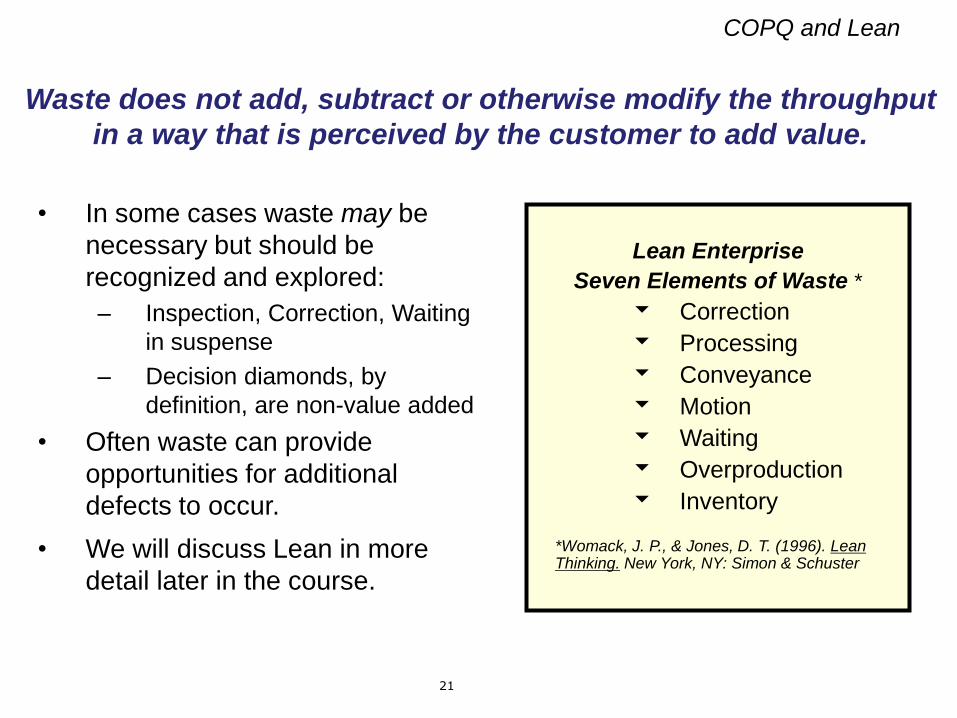
COPQ and Lean
Lean Enterprise
Seven Elements of Waste *
Correction
Processing
Conveyance
Motion
Waiting
Overproduction
Inventory
Waste does not add, subtract or otherwise modify the throughput
in a way that is perceived by the customer to add value.
• In some cases waste may be
necessary but should be
recognized and explored:
– Inspection, Correction, Waiting
in suspense
– Decision diamonds, by
definition, are non-value added
• Often waste can provide
opportunities for additional
defects to occur.
• We will discuss Lean in more
detail later in the course.
*Womack, J. P., & Jones, D. T. (1996). Lean Thinking. New York, NY: Simon & Schuster
22
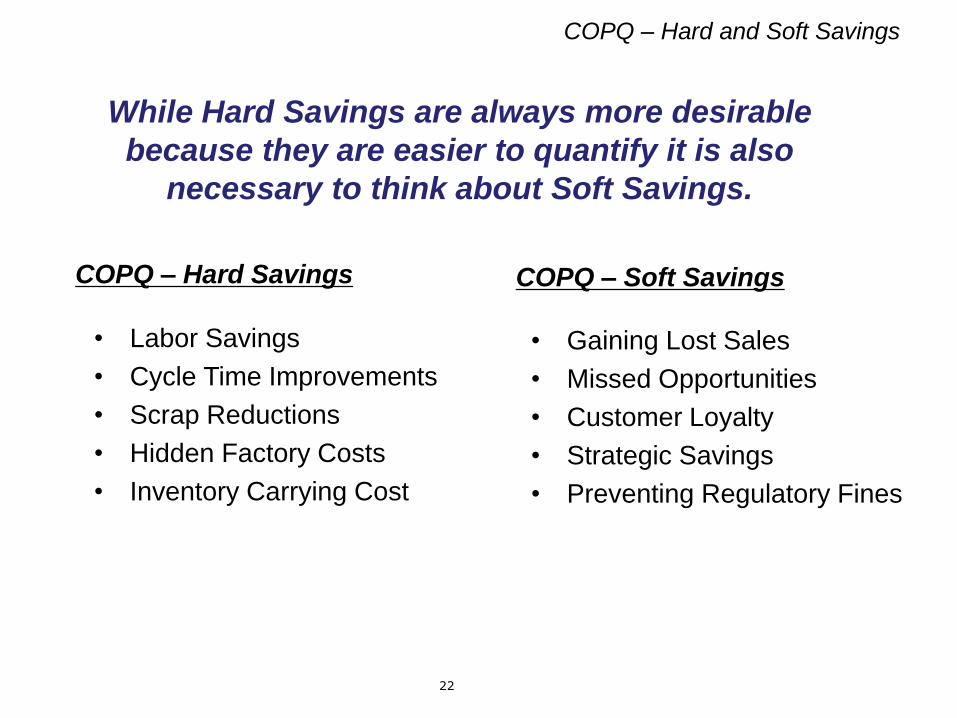
COPQ – Hard and Soft Savings
• Labor Savings
• Cycle Time Improvements
• Scrap Reductions
• Hidden Factory Costs
• Inventory Carrying Cost
COPQ – Soft Savings
• Gaining Lost Sales
• Missed Opportunities
• Customer Loyalty
• Strategic Savings
• Preventing Regulatory Fines
COPQ – Hard Savings
While Hard Savings are always more desirable
because they are easier to quantify it is also
necessary to think about Soft Savings.
23
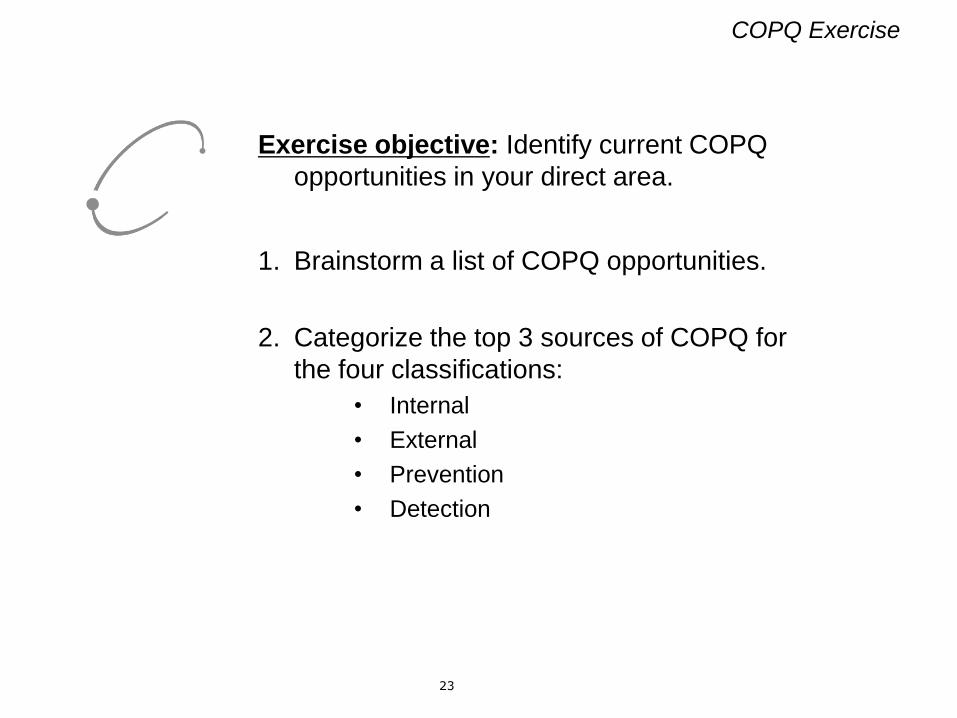
COPQ Exercise
Exercise objective: Identify current COPQ
opportunities in your direct area.
1. Brainstorm a list of COPQ opportunities.
2. Categorize the top 3 sources of COPQ for
the four classifications:
• Internal
• External
• Prevention
• Detection
24
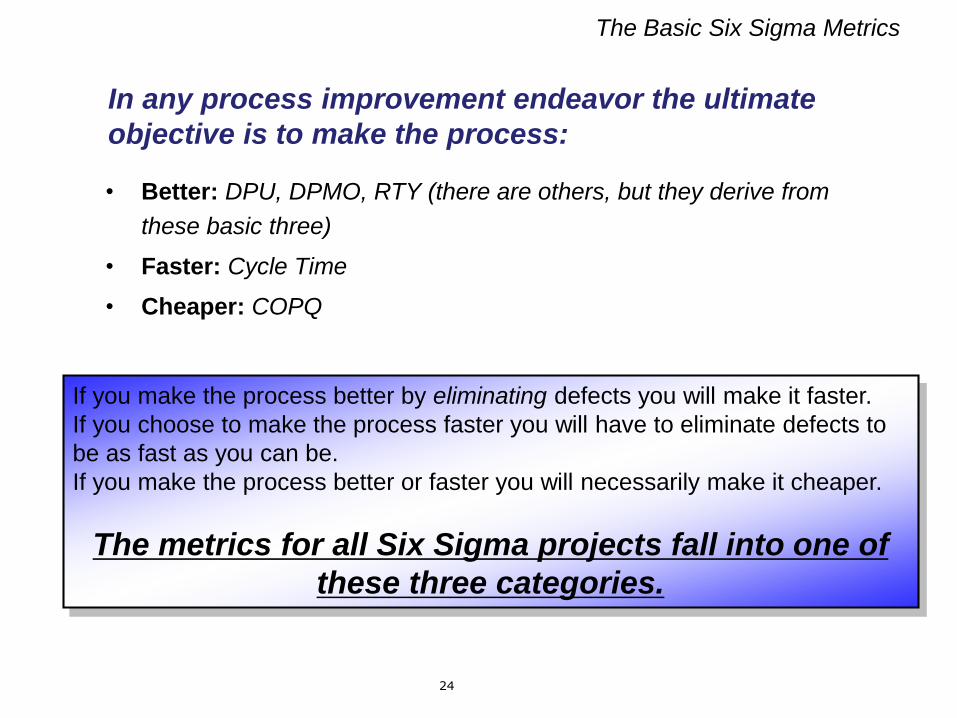
The Basic Six Sigma Metrics
• Better: DPU, DPMO, RTY (there are others, but they derive from
these basic three)
• Faster: Cycle Time
• Cheaper: COPQ
In any process improvement endeavor the ultimate
objective is to make the process:
If you make the process better by eliminating defects you will make it faster.
If you choose to make the process faster you will have to eliminate defects to
be as fast as you can be.
If you make the process better or faster you will necessarily make it cheaper.
The metrics for all Six Sigma projects fall into one of
these three categories.
25
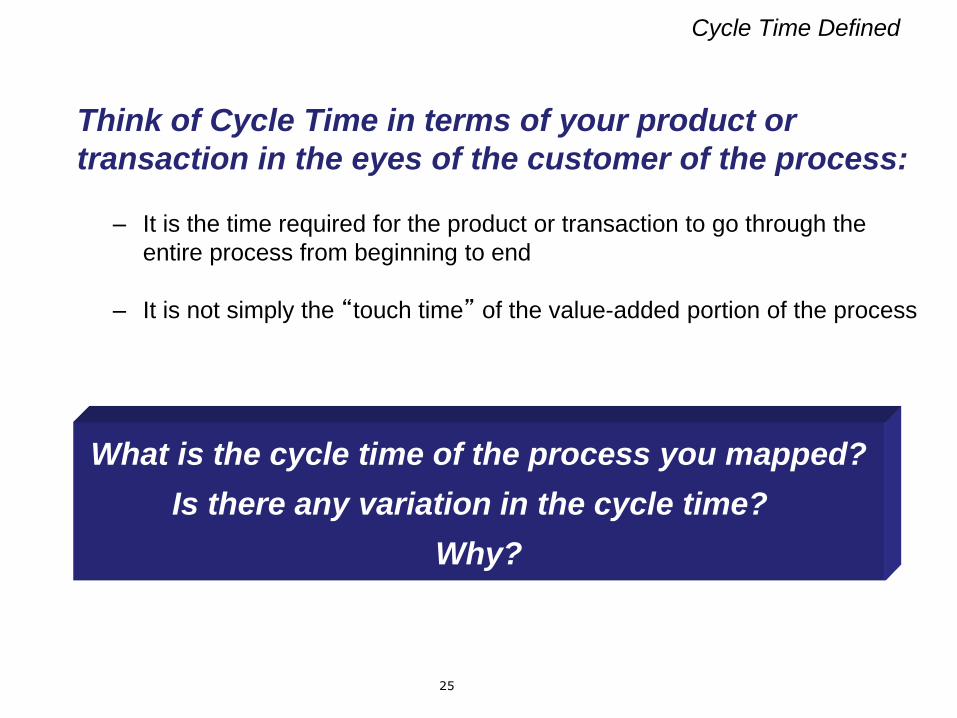
Cycle Time Defined
Think of Cycle Time in terms of your product or
transaction in the eyes of the customer of the process:
– It is the time required for the product or transaction to go through the
entire process from beginning to end
– It is not simply the “touch time” of the value-added portion of the process
What is the cycle time of the process you mapped?
Is there any variation in the cycle time?
Why?
26
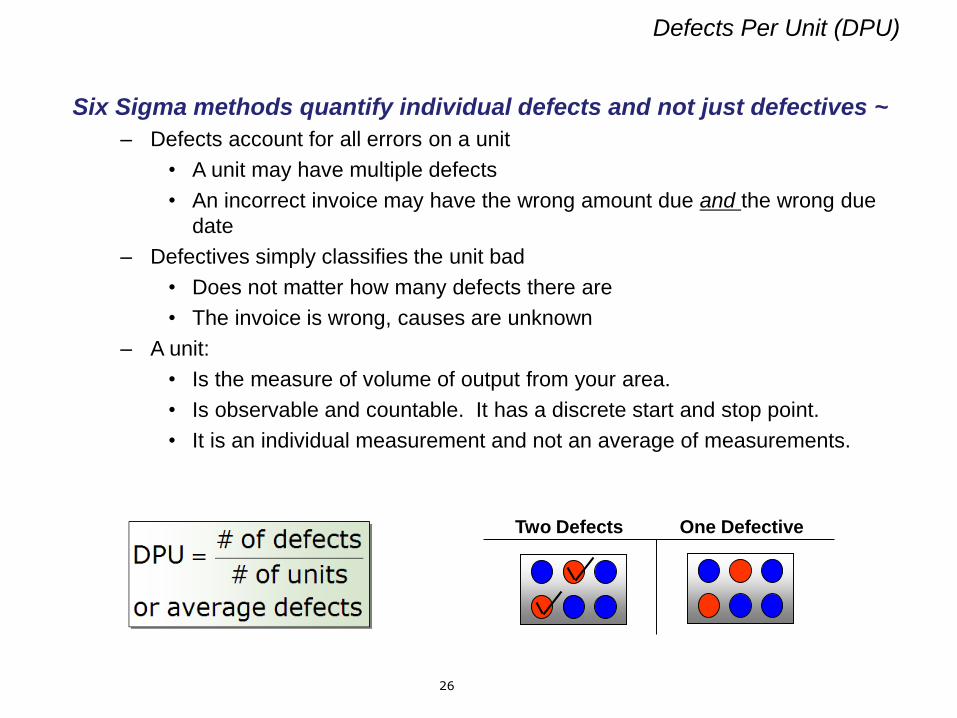
Defects Per Unit (DPU)
Six Sigma methods quantify individual defects and not just defectives ~
– Defects account for all errors on a unit
• A unit may have multiple defects
• An incorrect invoice may have the wrong amount due and the wrong due
date
– Defectives simply classifies the unit bad
• Does not matter how many defects there are
• The invoice is wrong, causes are unknown
– A unit:
• Is the measure of volume of output from your area.
• Is observable and countable. It has a discrete start and stop point.
• It is an individual measurement and not an average of measurements.
Two Defects One Defective
27
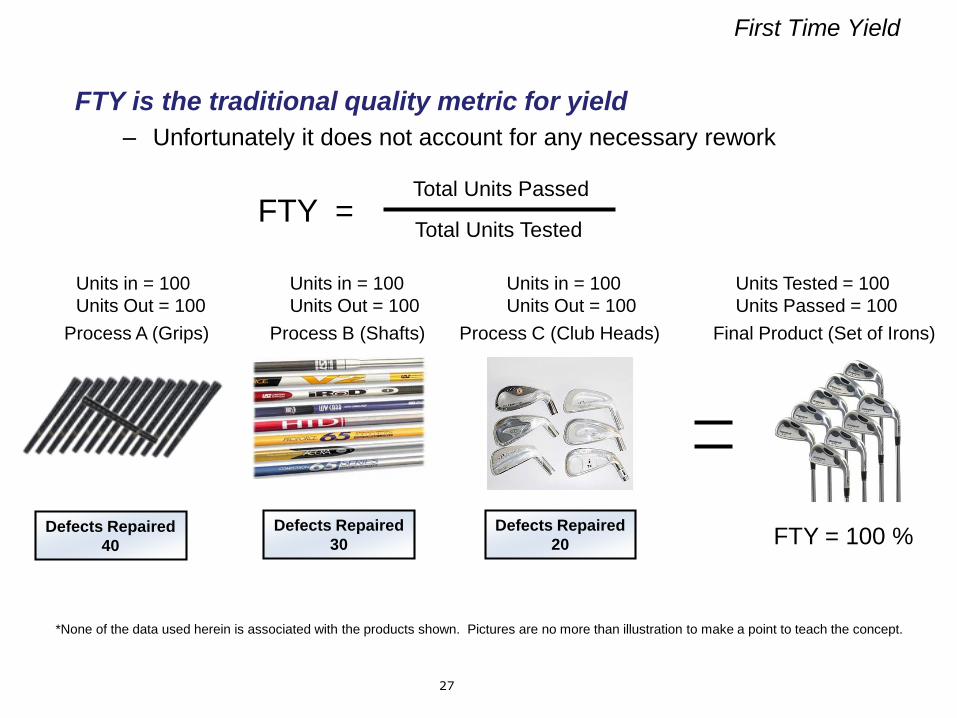
First Time Yield
FTY is the traditional quality metric for yield
– Unfortunately it does not account for any necessary rework
FTY =Total Units Passed
Total Units Tested
Units in = 100
Units Out = 100
Units in = 100
Units Out = 100
Units in = 100
Units Out = 100
Units Tested = 100
Units Passed = 100
FTY = 100 %
Process A (Grips) Process B (Shafts) Process C (Club Heads) Final Product (Set of Irons)
Defects Repaired
40
Defects Repaired
30
Defects Repaired
20
*None of the data used herein is associated with the products shown. Pictures are no more than illustration to make a point to teach the concept.

28
Rolled Throughput Yield
RTY is a more appropriate metric for problem solving
– It accounts for losses due to rework steps
RTY = X1 * X2 * X3
Units in = 100
Units W/O Rework = 60
RTY = 0.6
Units in = 100
Units W/O Rework = 70
RTY = 0.7
Units in = 100
Units W/O Rework = 80
RTY = 0.8
Units Passed = 34
Units Tested = 100
RTY = 33.6 %
Process A (Grips) Process B (Shafts) Process C (Club Heads) Final Product (Set of Irons)
Defects Repaired
40
Defects Repaired
30
Defects Repaired
20
*None of the data used herein is associated with the products shown. Pictures are no more than illustration to make a point to teach the concept.
29
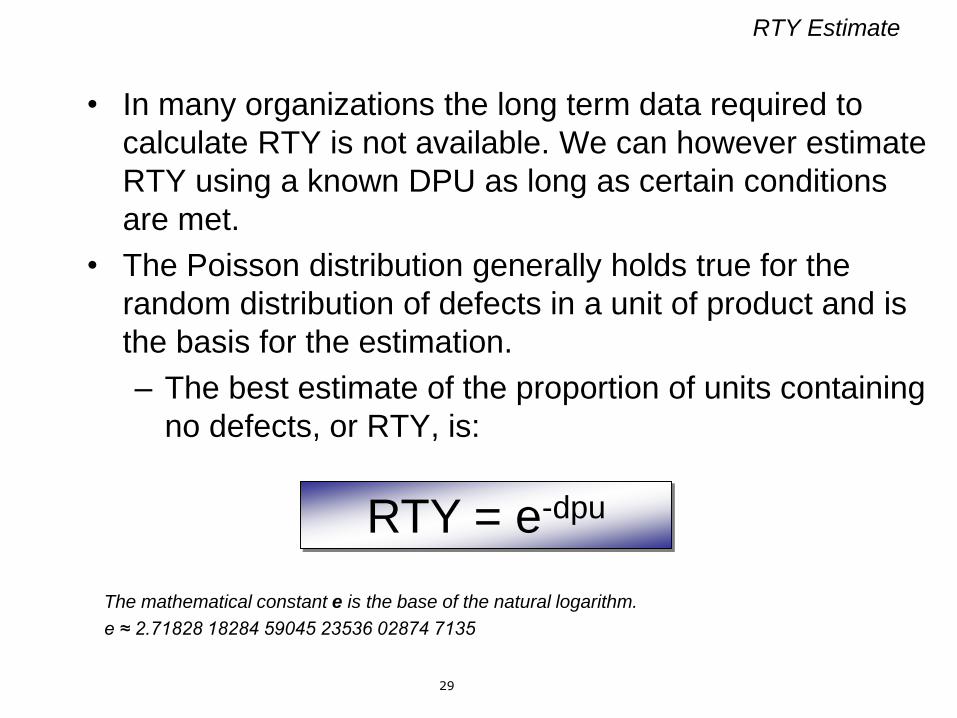
RTY Estimate
• In many organizations the long term data required to
calculate RTY is not available. We can however estimate
RTY using a known DPU as long as certain conditions
are met.
• The Poisson distribution generally holds true for the
random distribution of defects in a unit of product and is
the basis for the estimation.
– The best estimate of the proportion of units containing
no defects, or RTY, is:
RTY = e-dpu
The mathematical constant e is the base of the natural logarithm.
e ≈ 2.71828 18284 59045 23536 02874 7135
30
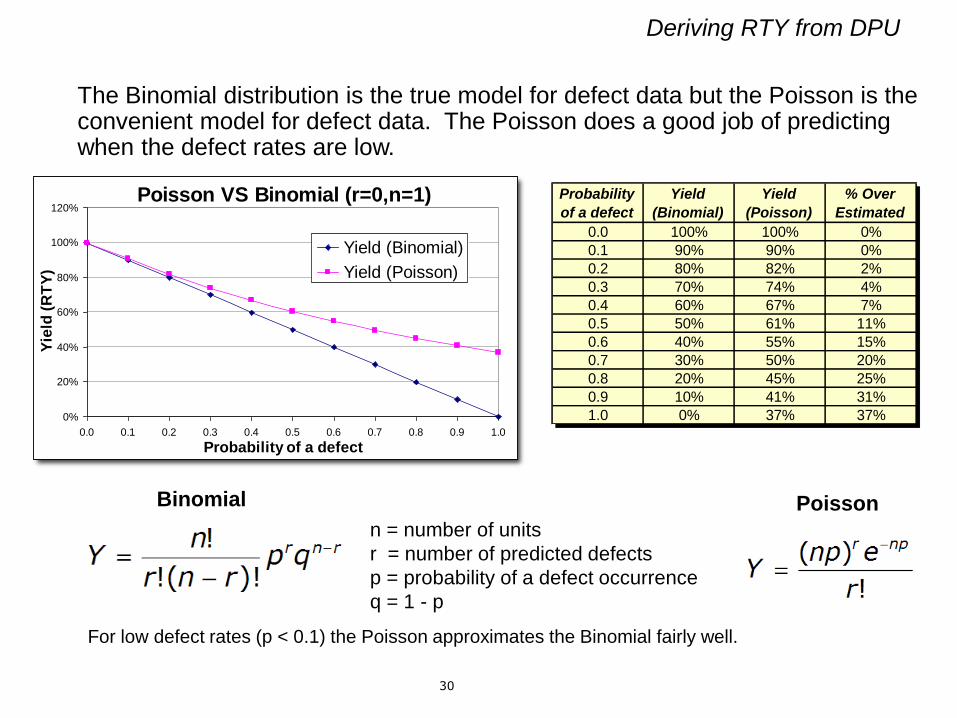
Deriving RTY from DPU
The Binomial distribution is the true model for defect data but the Poisson is the convenient model for defect data. The Poisson does a good job of predicting when the defect rates are low.
n = number of units
r = number of predicted defects
p = probability of a defect occurrence
q = 1 - p
Poisson VS Binomial (r=0,n=1)
0%
20%
40%
60%
80%
100%
120%
0.0 0.1 0.2 0.3 0.4 0.5 0.6 0.7 0.8 0.9 1.0
Probability of a defect
Yie
ld (
RT
Y)
Yield (Binomial)
Yield (Poisson)
For low defect rates (p < 0.1) the Poisson approximates the Binomial fairly well.
Binomial Poisson
Probability
of a defect
Yield
(Binomial)
Yield
(Poisson)
% Over
Estimated
0.0 100% 100% 0%
0.1 90% 90% 0%
0.2 80% 82% 2%
0.3 70% 74% 4%
0.4 60% 67% 7%
0.5 50% 61% 11%
0.6 40% 55% 15%
0.7 30% 50% 20%
0.8 20% 45% 25%
0.9 10% 41% 31%
1.0 0% 37% 37%
31
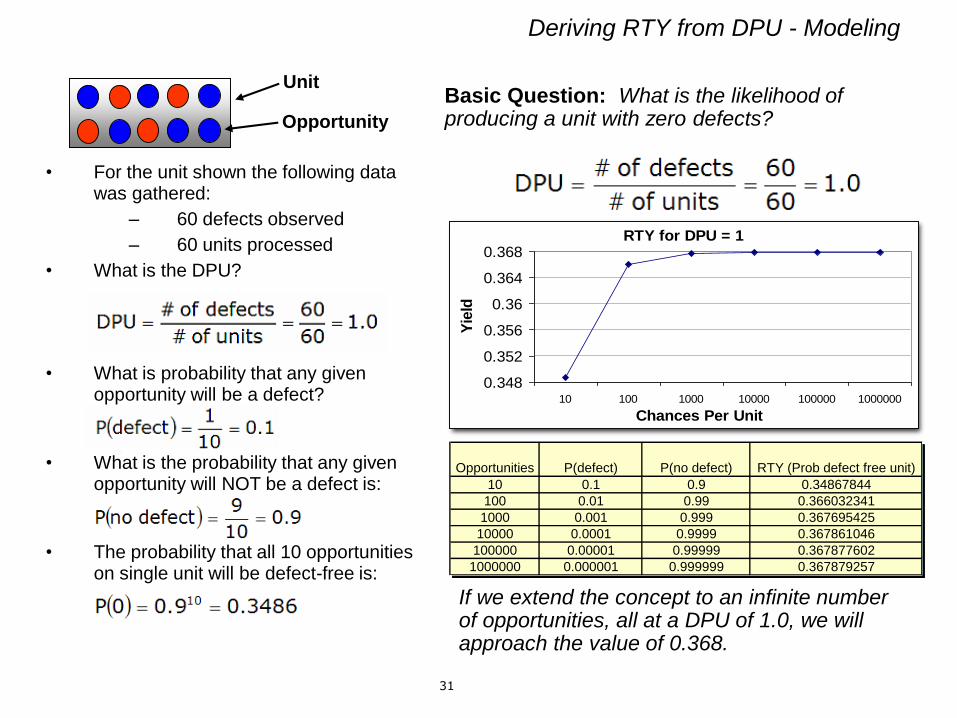
Deriving RTY from DPU - Modeling
• For the unit shown the following data was gathered:
– 60 defects observed
– 60 units processed
• What is the DPU?
• What is probability that any given opportunity will be a defect?
• What is the probability that any given opportunity will NOT be a defect is:
• The probability that all 10 opportunities on single unit will be defect-free is:
RTY for DPU = 1
0.348
0.352
0.356
0.36
0.364
0.368
10 100 1000 10000 100000 1000000
Chances Per Unit
Yie
ld
Basic Question: What is the likelihood of producing a unit with zero defects?
Unit
Opportunity
Opportunities P(defect) P(no defect) RTY (Prob defect free unit)
10 0.1 0.9 0.34867844
100 0.01 0.99 0.366032341
1000 0.001 0.999 0.367695425
10000 0.0001 0.9999 0.367861046
100000 0.00001 0.99999 0.367877602
1000000 0.000001 0.999999 0.367879257
If we extend the concept to an infinite number of opportunities, all at a DPU of 1.0, we will approach the value of 0.368.
32
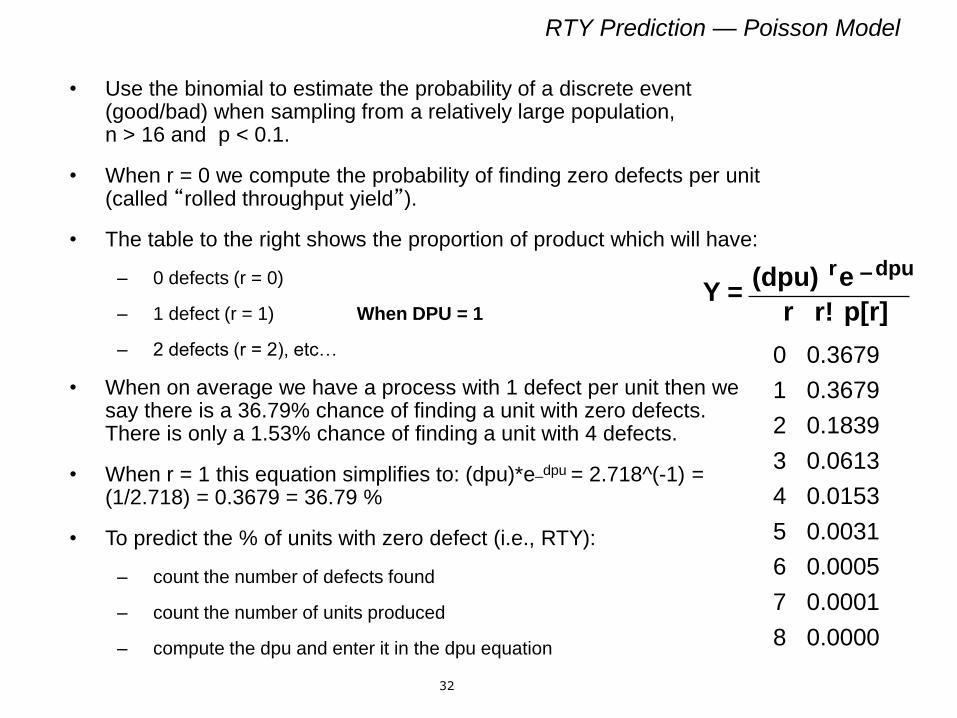
RTY Prediction — Poisson Model
• Use the binomial to estimate the probability of a discrete event (good/bad) when sampling from a relatively large population, n > 16 and p < 0.1.
• When r = 0 we compute the probability of finding zero defects per unit (called “rolled throughput yield”).
• The table to the right shows the proportion of product which will have:
– 0 defects (r = 0)
– 1 defect (r = 1) When DPU = 1
– 2 defects (r = 2), etc…
• When on average we have a process with 1 defect per unit then we say there is a 36.79% chance of finding a unit with zero defects. There is only a 1.53% chance of finding a unit with 4 defects.
• When r = 1 this equation simplifies to: (dpu)*e_dpu = 2.718^(-1) = (1/2.718) = 0.3679 = 36.79 %
• To predict the % of units with zero defect (i.e., RTY):
– count the number of defects found
– count the number of units produced
– compute the dpu and enter it in the dpu equation
0 0.3679
1 0.3679
2 0.1839
3 0.0613
4 0.0153
5 0.0031
6 0.0005
7 0.0001
8 0.0000
r p[r]Y =
(dpu) re – dpu
r!
33
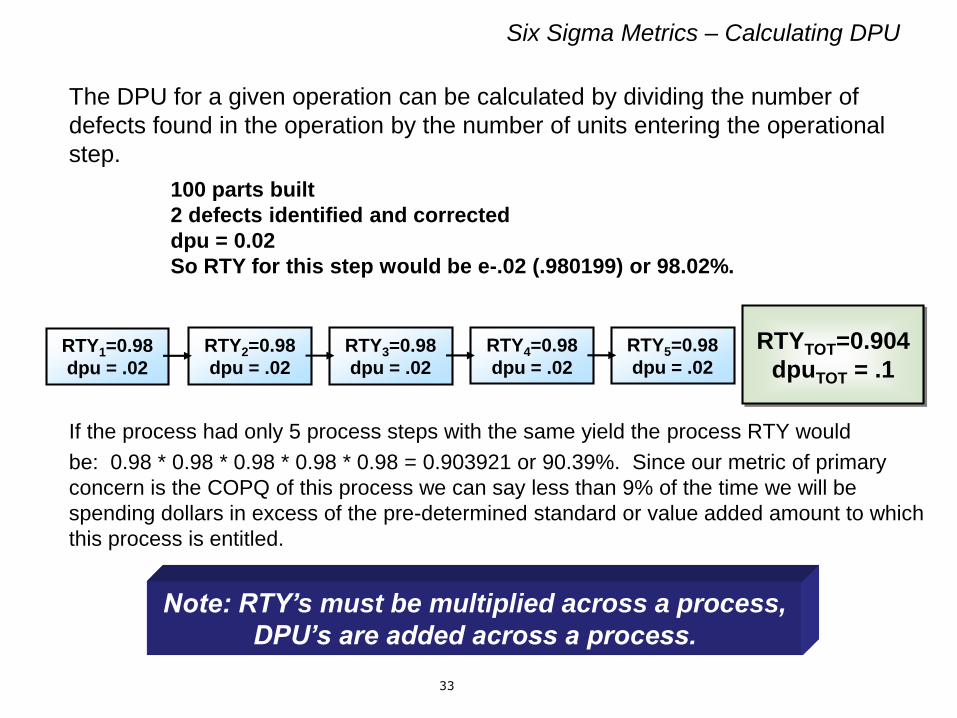
Six Sigma Metrics – Calculating DPU
The DPU for a given operation can be calculated by dividing the number of
defects found in the operation by the number of units entering the operational
step.
If the process had only 5 process steps with the same yield the process RTY would
be: 0.98 * 0.98 * 0.98 * 0.98 * 0.98 = 0.903921 or 90.39%. Since our metric of primary
concern is the COPQ of this process we can say less than 9% of the time we will be
spending dollars in excess of the pre-determined standard or value added amount to which
this process is entitled.
RTY1=0.98
dpu = .02
RTY2=0.98
dpu = .02
RTY3=0.98
dpu = .02
RTY4=0.98
dpu = .02
RTY5=0.98
dpu = .02
RTYTOT=0.904
dpuTOT = .1
100 parts built
2 defects identified and corrected
dpu = 0.02
So RTY for this step would be e-.02 (.980199) or 98.02%.
Note: RTY’s must be multiplied across a process,
DPU’s are added across a process.

34
Focusing our Effort – FTY vs. RTY
Assume we are creating two products in our
organization that use similar processes.
FTY = 80%
FTY = 80%
How do you know what to work on?
Product A
Product B
*None of the data used herein is associated with the products shown. Pictures are no more than illustration to make a point to teach the concept.
35
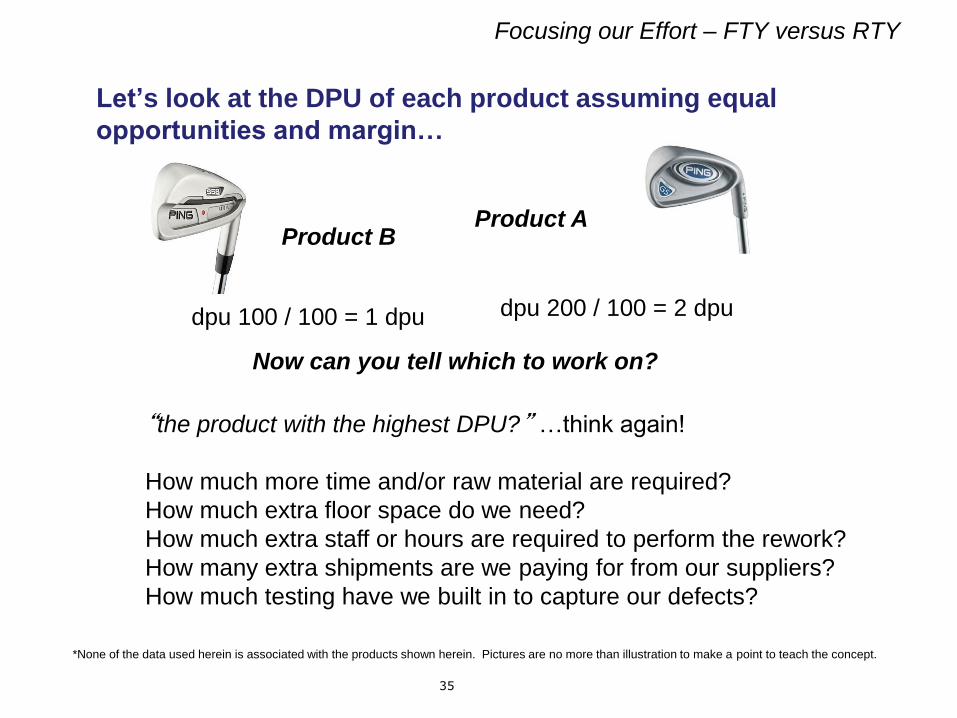
Focusing our Effort – FTY versus RTY
Let’s look at the DPU of each product assuming equal
opportunities and margin…
Product AProduct B
dpu 200 / 100 = 2 dpudpu 100 / 100 = 1 dpu
Now can you tell which to work on?
“the product with the highest DPU?” …think again!
How much more time and/or raw material are required?
How much extra floor space do we need?
How much extra staff or hours are required to perform the rework?
How many extra shipments are we paying for from our suppliers?
How much testing have we built in to capture our defects?
*None of the data used herein is associated with the products shown herein. Pictures are no more than illustration to make a point to teach the concept.
36
Summary
At this point you should be able to:
• Describe what is meant by “Process Focus”
• Generate a High Level Process Map
• Describe the importance of VOC, VOB and VOE, and CTQ’s
• Explain COPQ
• Describe the Basic Six Sigma metrics
• Explain the difference between FTY and RTY
• Explain how to calculate “Defects per Unit” DPU
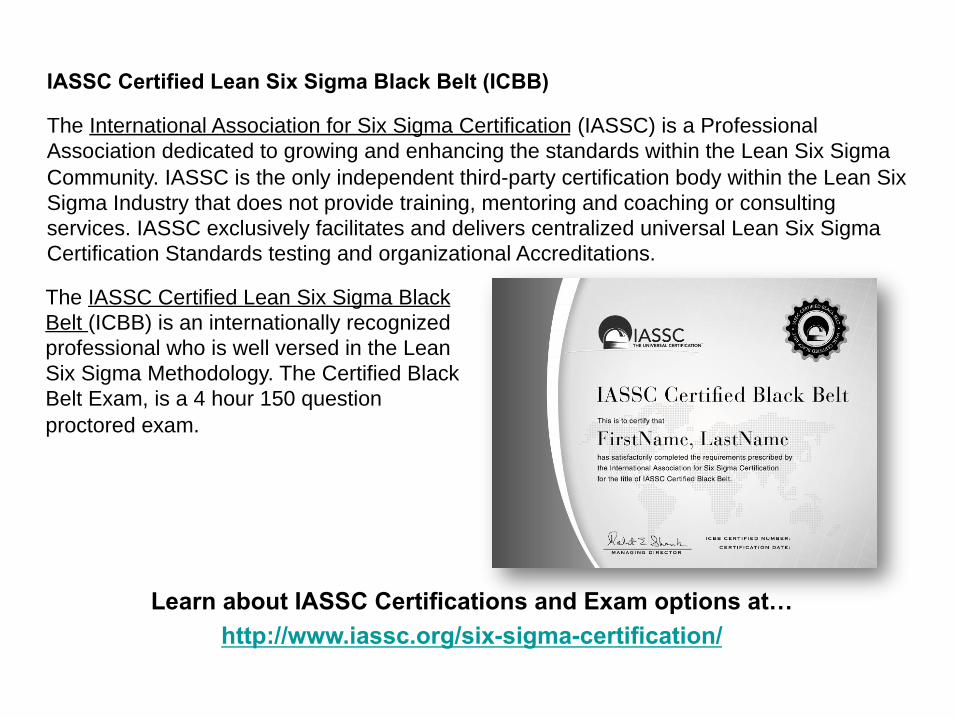
Learn about IASSC Certifications and Exam options at…
http://www.iassc.org/six-sigma-certification/
IASSC Certified Lean Six Sigma Black Belt (ICBB)
The International Association for Six Sigma Certification (IASSC) is a Professional
Association dedicated to growing and enhancing the standards within the Lean Six Sigma
Community. IASSC is the only independent third-party certification body within the Lean Six
Sigma Industry that does not provide training, mentoring and coaching or consulting
services. IASSC exclusively facilitates and delivers centralized universal Lean Six Sigma
Certification Standards testing and organizational Accreditations.
The IASSC Certified Lean Six Sigma Black
Belt (ICBB) is an internationally recognized
professional who is well versed in the Lean
Six Sigma Methodology. The Certified Black
Belt Exam, is a 4 hour 150 question
proctored exam.