USING ACCOUNTABILITY RESULTS TO GUIDE ... - CT.gov
67
USING ACCOUNTABILITY RESULTS TO GUIDE IMPROVEMENT March 2016 Revised February 2017 This guide provides detailed information and resources related to every indicator in Connecticut’s Next Generation accountability system. Each indicator includes the rationale for its inclusion and the methodology used. Additionally, to inform local improvement efforts, the guide offers links to resources, research, and evidence-based strategies.
-
Upload
khangminh22 -
Category
Documents
-
view
0 -
download
0
Transcript of USING ACCOUNTABILITY RESULTS TO GUIDE ... - CT.gov

USING ACCOUNTABILITY RESULTS TO
GUIDE IMPROVEMENT
March 2016 Revised February 2017
This guide provides detailed information and resources related to every indicator in Connecticutrsquos Next Generation accountability system Each indicator includes the rationale for its inclusion and the methodology used Additionally to inform local improvement efforts the guide offers links to resources research and evidence-based strategies
Connecticut State Department of Education Using Accountability Results to Guide Improvement March 2016 Revised February 2017
Page 2 of 67
Change Log
Section Page Number Change
Indicator 1 8 Inserted a reference to a new appendix Connecticut Assessment and Accountability Reporting of ldquoRecently Arrivedrdquo English Learners (ELs)
Indicator 2 9-10 Updated planned approach to reflect implementation in December 2016
Indicators 1 and 2 10-16 Updated resources
Indicators 1 and 2 16 Contact information updated
Indicator 3 17-18 Updated resources
Indicator 3 18 Contact information updated
Indicator 4 19 Updated statistics in indicator rationale
Indicator 4 21-23 Introduction to resources featuring the new section of the CSDE website dedicated to addressing chronic absenteeism Updated resources
Indicator 5 25 Seven categories changed to seventeen in indicator description
Indicator 5 25 Description of indicator updated to address Grade 12 students receiving transition only services
Indicator 6 27 Added Redesigned SAT benchmark scores that meet CCR expectations
Indicators 5 and 6 28-29 Resources updated
Indicators 5 and 6 29 Contact information updated
Indicator 7 30 Indicator description updated
Indicator 7 31-33 Resources updated
Indicator 7 33 Contact information updated
Indicators 8 and 9 35 Updated graduation rate table with 2013 data
Indicators 8 and 9 36-38 Resources updated
Indicators 8 and 9 39 Contact information updated
Indicator 10 41 Resources updated
Indicator 11 43 Added high school flexibility granted in April 2016
Indicator 11 44-45 Resources updated
Indicator 11 45 Contact information updated
Indicator 12 46 Updated methodology with course coding specificity
Indicator 12 47-48 Resources updated
Indicator 12 48 Contact information updated
Appendix 49-50 File preparation details updated
Appendix 50-53 Participation and Achievement Inclusion Rules updated
Connecticut State Department of Education Using Accountability Results to Guide Improvement March 2016 Revised February 2017
Page 3 of 67
Appendix 56 and 58 An SAT index calculation example was added as well as Table 5 showing highest and lowest obtainable scores for SAT
Appendix 59-63 Inserted 2015-16 report and updated explanation
Appendix 64 Added Connecticut Assessment and Accountability Reporting of ldquoRecently Arrivedrdquo English Learners (ELs)
Appendix 65 Added Assigning School Categories
Appendix 66-67 Added Identifying Schools of Distinction 2015-16
Connecticut State Department of Education Using Accountability Results to Guide Improvement March 2016 Revised February 2017
Page 4 of 67
Table of Contents Introduction 5
Indicator 1 Academic Achievement (Status) 6
Indicator 2 Academic Growth (Longitudinal) 9
Resources for improving student achievement in ELA Mathematics and science 10
Indicator 3 Participation Rate 17
Resources for Ensuring Assessment Participation Across the School Community 17
Indicator 4 Chronic Absenteeism 19
Resources for Improving Attendance 21
Indicator 5 Preparation for Postsecondary and Career Readiness ndash Coursework 25
Indicator 6 Preparation for Postsecondary and Career Readiness - Exams 27
Resources to Prepare Students for Postsecondary Success 28
Indicator 7 Graduation - On-Track in 9th Grade 30
Resources for Keeping Students On-Track to Graduation 31
Indicator 8 Graduation ndash Four Year Adjusted Cohort Graduation Rate ndash All Students 34
Indicator 9 Graduation ndash Six Year Adjusted Cohort Graduation Rate ndash High Needs 35
Resources for Reducing Dropout and Increasing Graduation 36
Indicator 10 Postsecondary Entrance Rate ndash All Students 40
Resources for Improving postsecondary Entrance 41
Indicator 11 Physical Fitness 43
Resources for Improving Physical Fitness 44
Indicator 12 Arts Access 46
Resources for Improving Access to the Arts 47
Appendices 49
Performance Index Calculation Rules 49
Performance Index Methodology 54
How to Read 2015-16 Accountability Reports 59
Connecticut Assessment and Accountability Reporting of ldquoRecently Arrivedrdquo English Learners (ELs) 64
Assigning School Categories 65
Identifying Schools of Distinction 2015-16 66
Connecticut State Department of Education Using Accountability Results to Guide Improvement March 2016 Revised February 2017
Page 5 of 67
INTRODUCTION
A student is more than a test score in the same way a school or district is more than the aggregate of the results from state tests Focusing on a broader set of indicators
Provides a more complete picture of a school or district
Guards against narrowing of the curriculum to the tested subjects
Expands ownership of accountability to more staff and
Allows schools to demonstrate progress on ldquooutcome pre-cursorsrdquo Herersquos a high level summary of the changes that have been made to the accountability system
bull Several new indicators including some focused on college- and career-readiness and others on arts and physical fitness to draw attention to the delivery of a well-rounded education have been added
bull The model gives greater emphasis to academic growth on state tests than academic achievement The historical focus on lsquoachievement onlyrsquo failed to acknowledge schools that may have low performing students but made significant strides last year to improve their performance and close the achievement gap
bull Some metrics were refined (eg the calculation of the performance index)
bull Subgroup metrics are more impactful and actionable
bull The school classification methodology was adjusted to better represent overall school
performance target interventions and support and refrain from ldquolabelsrdquo The CSDE has worked collaboratively with districtschool leaders consulted with statenational experts and sought ongoing input from a variety of stakeholders to revamp its accountability system for schools and districts The CSDE is most appreciative for their feedback and ideas This model represents our best efforts at the present time to expand the model without adding new data collectionreporting burden to districts As this model is implemented the CSDE will continue to work collaboratively with stakeholders and analyze data to refine and improve this model Lastly the CSDE encourages leaders to view accountability results not as a ldquogotchardquo but as a tool to guide and track improvement efforts This guide emanates from that sincere belief It provides detailed information and resources related to every indicator It includes the rationale for its inclusion and the methodology used also to inform local improvement efforts the guide offers links to resources research and evidence-based strategies
Connecticut State Department of Education Using Accountability Results to Guide Improvement March 2016 Revised February 2017
Page 6 of 67
INDICATOR 1 ACADEMIC ACHIEVEMENT (STATUS)
Indicator
Weight
Year 1 Years 2 and 3
Subject Performance Index (0-100) in ELA Math and Science
All Students
Students in High Needs Subgroup
300 300
150 150
Points for schools where longitudinal academic growth (Indicator 2) cannot be evaluated (eg 9-12 high schools) will retain Year 1 point values for years 2 and 3
Description (What) This indicator will produce performance indices for English Language ArtsLiteracy (ELA) and Mathematics based on results from the Smarter Balanced assessments for Grades 3-8 SAT for Grade 11 beginning in 2015-16 the Connecticut Alternate Assessments (CTAA) in all available tested grades (ie 3 through 8 and 11) in the districtschool Science index scores will be generated based on results from the Connecticut Mastery Test (CMT) assessments and the Connecticut Academic Performance Test (CAPT) assessments (both the standard form and Skills Checklist) in all available tested grades (ie 5 8 and 10) in the districtschool This indicator weights tested subjects equally Rationale (Why) The academic achievement indicator provides the most current status of achievement of the students in a school or district Applicability (Who) The achievement status indicator is applicable to all schools and districts with at least one tested grade (ie grades 3 through 8 10 or 11) InputFeedback The overall notion of a Performance Index that recognizes student performance across the continuum (not just lsquoproficientrsquo and lsquonot proficientrsquo) has been well received However in extensive conversations with local practitioners three important issues emerged with Connecticutrsquos prior approach to the index First though the index was an enhancement to the AYP approach of looking solely at lsquoproficientrsquo and lsquonot proficientrsquo it still did not capture improvement within performance levels Furthermore with Smarter Balanced assessments offering four achievement levels as opposed to five in the CMTCAPT assessments practitioners are concerned that the index will fail to capture differences in performance within the wide achievement levels Second the interpretable and actionable value of an overall index score that averages all the tested subjects was questioned Practitioners generally prefer subject-specific indices
Connecticut State Department of Education Using Accountability Results to Guide Improvement March 2016 Revised February 2017
Page 7 of 67
Lastly practitioners asked why advanced performance couldnrsquot garner additional points in the index especially if the Statersquos expected level of achievement was below that level For example in the Smarter Balanced assessment level 3 of 4 is considered on-track for college and career readiness while level 4 is an explicit standard that truly represents an ldquoadvancedrdquo level of performance Methodology (How) The detailed performance index calculation rules and methodology for converting scale scores to index scores for each assessment are included in the appendix Points will be prorated based on the percentage of the ultimate target (75) achieved Subject-specific index scores will be generated and reported for the following groups as long as the minimum subgroup N of at least 20 students is reached
All students
All raceethnicities
Gender
Eligibility for Free- or Reduced-Price Meals
English learners (EL)mdashFor Indicator 1 of the accountability system this group includes students currently identified as EL and all students who were formerly identified as an EL any time in the two previous school years
Students with Disabilities (SWD)mdashFor Indicator 1 of the accountability system this group includes students currently identified as SWD and all students who were formerly identified as SWD any time in the two previous school years
High Needs supergroupmdash (ie a student belongs to at least one of the following ESEA subgroups ndash Eligible for Free- or Reduced-Price Meals English learners or Students with Disabilities)
Though index scores will be reported for all student subgroups the High Needs supergroup will be the subgroup used in accountability calculations This will hold more schools accountable for the subgroup performance of many more students Lowering subgroup N size from 40 to 20 in the first iteration of ESEA Flexibility made many subgroups visible across Connecticut utilizing the High Needs group will further increase the number of schools and the number of students in those individual subgroups that are held accountable for subgroup performance and achievement gap determinations Connecticut has been granted permission to exempt ldquorecently arrivedrdquo ELs in grades 3 through 8 who have attended schools in the United States for less than two years from the academic achievement (status) measure in the Statersquos accountability system for both ELA and mathematics Instead Connecticut will include student growth of ldquorecently arrivedrdquo ELs from the first to the second year in both ELA and mathematics in school and district accountability calculations in the studentrsquos second year This requires that all ldquorecently arrivedrdquo ELs test in all
Connecticut State Department of Education Using Accountability Results to Guide Improvement March 2016 Revised February 2017
Page 8 of 67
content areas annually Assessment scores for ELs who have attended US schools for more than two years will be used in the achievement status and growth measures of the accountability system For more information about how data for ldquorecently arrivedrdquo ELs are handled in assessment and accountability reporting please see the Appendix Data Source State assessment data files and Public School Information System (PSIS) for student demographic (eg raceethnicity gender) and program (EL FRPL disability) data Achievement Gap A districtschool is identified as having an achievement gap if the size of its index score gap between the High Needs subgroup and the Non-High Needs group (or the ultimate achievement target of 75 if thatrsquos lower) is a significant outlier ie at least one standard deviation greater than the statewide gap in any subject area
Connecticut State Department of Education Using Accountability Results to Guide Improvement March 2016 Revised February 2017
Page 9 of 67
INDICATOR 2 ACADEMIC GROWTH (LONGITUDINAL)
Indicator Max Points
Year 1 Years 2 and 3
Average percentage of growth target achieved by students in grades 4 through 8 (frac12 SB-ELA frac12 SB Math) bull All Students bull Students in High Needs Subgroup
NA NA
200 200
Description (What) In Connecticut the Smarter Balanced (SB) Assessment in English Language ArtsLiteracy (ELA) and Mathematics are used for measuring student achievement growth In spring 2015 Connecticut students took the SB ELA and Mathematics in grades 3-8 In both subjects the test scores are vertically scaled across grades and facilitate tracking student growth within the same subject across grades despite differences in test content and difficulty Each vertical scale ranges from 2000-3000 score points By subtracting a studentrsquos current score (eg a grade 5 score of 2400 in Mathematics) from the studentrsquos previous score in the same subject (eg a grade 4 score of 2300 in Mathematics) a teacher or administrator can assess the individual studentrsquos growth in Mathematics performance over a one year period (a growth of 100 points in this example) Teachers and administrators can use achievement growth information with other academic information about students to plan for student instruction The CSDE used the vertical scale to create a growth model based on the expectation that all students in grades 4 through 8 should demonstrate growth each year in ELA and Mathematics Ambitious yet achievable growth targets were established in ELA and Mathematics for all students entering grades 4 through 8 to reach in that year To learn more about Connecticutrsquos growth model and how student growth targets were established see Developing Connecticutrsquos Growth Model for the Smarter Balanced Summative Assessments in English Language Arts (ELA) and Mathematics There are two metrics generated from the growth model The percentage of students meeting or exceeding their growth targets is reported as the ldquoGrowth Raterdquo Growth rate is not part of the Next Generation accountability system The measure used for accountability purposes is the ldquoAverage Percentage of Target Achievedrdquo (APTA) To calculate the APTA for a school or district every studentrsquos growth in vertical scale score points is evaluated against the studentrsquos assigned growth target Students can meet anywhere from 0 of the growth target to 110 of the growth target yielding 0-110 points toward the
Connecticut State Department of Education Using Accountability Results to Guide Improvement March 2016 Revised February 2017
Page 10 of 67
schoolrsquos Indicator 2 values in the accountability system The schoolrsquos APTA is an average of the percentage of growth target achieved across all students Rationale (Why) The vertical scale enables the evaluation of growth achieved by the same kids over time A districtschool wonrsquot be deemed successful on this metric simply because it enrolls students who are historically high performing Success on this metric is earned by helping all students whether low or high performing to achieve adequate growth from one year to the next Applicability (Who) The academic growth indicator is applicable to all districts and schools with at least one grade between 4 and 8 inclusive InputFeedback Practitioners have long awaited the inclusion of academic growth as an indicator in districtschool accountability They are generally more supportive of using academic growth than achievement status to evaluate the effectiveness of a districtschool Methodology (How) Points each will be earned for the All Students group and the High Needs Subgroup based on the average percentage of growth target achieved across all students in the group While students may earn 0-110 points based on the percentage of target achieved the maximum value for schools and districts is 100 points Weighting the High Needs subgroup separately in addition to the All Students group rightly over-weights subgroup growth The ultimate target for this indicator is 100 Similar to Indicator 1 (Academic AchievementmdashStatus) a school or district must have at least 20 matched students in order to be eligible to earn any points for Indicator 2 (Academic Growth) If a school or district has at least 20 matched students for any of the four growth indicators (ie ELA-All Students ELA-High Needs Math-All Students Math-High Needs) then the maximum possible points for all of the Academic Achievement indicators (indicator 1) for all subjects for that school or district will be 50 points If a school or district has no reportable growth data the maximum possible points for all of the Academic Achievement indicators (indicator 1) for all subjects for that school or district will be 100 points Data Source State assessment data files and Public School Information System (PSIS) for student demographic (eg raceethnicity gender) and program (EL FRPL disability) data
RESOURCES FOR IMPROVING STUDENT ACHIEVEMENT IN ELA
MATHEMATICS AND SCIENCE
CURRICULUM (content of learning by lesson unit course or full year)
1 Standards Alignment of the English Language Arts and Mathematics Curriculum and
Instruction
Connecticut State Department of Education Using Accountability Results to Guide Improvement March 2016 Revised February 2017
Page 11 of 67
CT Core Standards for English Language Arts and Mathematics
httpctcorestandardsorgpage_id=5181
CT English Language Proficiency (CELP) Standards
wwwctgovsdeenglishlearners
Lesson Planning Plan with the Common Core in Mind
httpachievethecoreorglesson-planning-tool
Curriculum Designers Home Page on CTCoreStandardsorg website
httpctcorestandardsorgpage_id=5181
EQuIP (Educators Evaluating the Quality of Instructional Products) Rubric a tool
designed to identify high-quality materials aligned to the Common Core State
Standards (CCSS) httpwwwachieveorgEQuIP
Instructional Materials Evaluation Tool
httpachievethecoreorgpage1946instructional-materials-evaluation-tool
Strengthening Lessons for the Common Core (video)
httpswwwteachingchannelorgvideosbetter-common-core-lessons-equip
District Common Core Implementation Self-Assessment
httpwwwachieveorgpublicationscommon-core-state-standards-
implementation-rubric-and-self-assessment-tool
Models Samples and Exemplars of Curriculum Units and Lessons (rated by CSDE)
httpctcorestandardsorgpage_id=475
Basal Alignment Project (Achieve the Core)
httpachievethecoreorgpage751bap-project-page
What I Use in my Classroom (Achieve the Core)
httpachievethecoreorgpage2882what-i-use-in-my-
classroomutm_source=Core20Advocate20Resource20Doc_atc_emailamputm_m
edium=emailamputm_campaign=Schusterman20List20Email
2 Next Generation Science Standards (NGSS) Resources
NGSS Content Crosswalk Report shows content similarities and differences between NGSS and Connecticuts 2004 science standards
STEM Practice Briefs - Brief essays each focused on a specific issue authored and reviewed by teachers and researchers Each Practice Brief leverages practitionersrsquo expertise and research findings to support the teaching and learning transformations called for in the NGSS
Tools for Ambitious Science Teaching - Strategies and tools for designing learning experiences that engage all students in meaningful forms of science learning
Classroom Sample Tasks (Introduction and Overview) (View and Download Tasks) The Classroom Sample Tasks blend content practices and concepts from both the NGSS and the Common Core State Standards Teachers across the disciplines have
Connecticut State Department of Education Using Accountability Results to Guide Improvement March 2016 Revised February 2017
Page 12 of 67
collaborated to write sample tasks which are the result of a vision of integrating science engineering and mathematics for classroom use
National Science Teachers Association NGSS Resources - web seminars articles from peer-reviewed journals NSTA Press books short courses and face-to-face conference lectures and workshops all designed to build an understanding of the NRC Framework and NGSS
NSTA Archived Webinars - NGSS Science and Engineering Practices
EQuIP Rubric for Evaluation NGSS Quality of Science Lessons and Units - The Educators Evaluating the Quality of Instructional Products (EQuIP) Rubric for science provides criteria by which to measure the alignment and overall quality of lessons and units with respect to the Next Generation Science Standards (NGSS)
3 CT Core Standards Professional Learning Resources for Educators
Connecticut Professional Learning Online Modules for ELA and mathematics There are resources for supporting all students as well as resources targeted toward students with disabilities and English learners (CSDE) httpsurveyspcguscoms3CT-Links
Self-paced online courses developed as part of Math and Science Partnership (MSP) grants httpctcorestandardsorgpage_id=13853
Education and Teacher Training Courses (Edx) httpswwwedxorgcoursesearch_query=education
Specific Learning DisabilityDyslexia httpwwwctsercorgindexphpdyslexiadyslexia-professional-learning
4 CT Standards For All Subject Areas
CSDE Website httpwwwsdectgov
CT Core Standards Website httpctcorestandardsorg
CT English Language Proficiency (CELP) Standards wwwctgovsdeenglishlearners
5 Parent and Community Resources for CT Core Standards including translated materials
in five languages httpctcorestandardsorgpage_id=32
INSTRUCTION (how the curriculum will be taught) 1 Tier 1 ndash Core Instruction
CSDE English Learner Resources wwwctgovsdeenglishlearners
CSDE Special Education Resources
httpwwwsdectgovsdecwpviewaspa=2678ampQ=320730
Connecticut State Department of Education Using Accountability Results to Guide Improvement March 2016 Revised February 2017
Page 13 of 67
Principal ldquoLook Forrdquo Guide to Classroom CT Core Standards implementation
httpwwwsdectgovsdelibsdepdfbacktoschoolccss_principal_look_fors_flipb
ookpdf
ReadConn A K-3 Reading System of Professional Development
httpsurveyspcguscoms3READCONN-Registration
2 Tier 1 Reading Instructional Resources
CSDE Early Literacy httpwwwsdectgovsdecwpviewaspa=2618ampq=320888
CSDE Menu of Grade K-3 Reading Assessments
httpwwwsdectgovsdecwpviewaspa=2618ampq=320866
International Reading Association httpwwwliteracyworldwideorg
Research-Based Literacy Instruction and Assessment for Children in PK-12 (Florida
Center for Reading Research) httpwwwfcrrorgfor-educators
Selecting a Scientifically-Based Core Curriculum for Tier 1
httpwwwrtinetworkorglearnresearchselectingcorecurriculum-tier1
LD Online httpwwwldonlineorg A leading website on learning disabilities
learning disorders and differences Parents and teachers of learning disabled
children will find authoritative guidance on attention deficit disorder ADD ADHD
dyslexia dysgraphia dyscalculia dysnomia reading difficulties speech and related
disorders
Foorman B R amp Siegel A (Eds) (1986) Acquisition of reading skills Cultural
constraints and cognitive universals Mahwah NJ Lawrence Erlbaum
Moats LC amp Foorman BR (in press) Literacy achievement in the primary grades
in high poverty schools Lessons learned from a five-year research program In SB
Neuman (ed) Literacy achievement for young children from poverty Baltimore
Brookes Publishing Co
Dyslexia Research Education amp Advocacy httpeidaorg
Spear-Swerling L (2014) The Power of RTI and Reading Profiles A Blueprint for
Solving Reading Problems This text explains why RTI is todays best approach for
preventing reading difficulties--and how research on reading profiles can enhance
the power of RTI For practitioners the book provides a complete evidence-based
blueprint for using RTI and reading profiles in tandem to plan effective core literacy
instruction and help struggling readers in Grades K-6 whether they have disabilities
or issues related to experience (eg ELLs children from poverty backgrounds)
3 Reading Instructional Resources and Materials
Leveled Articles Differentiation Ideas and Curriculum Ladders (For the Teachers)
httpwwwfortheteachersorg
Leveled Text Units and Lessons (ReadWorks) httpwwwreadworksorg
Connecticut State Department of Education Using Accountability Results to Guide Improvement March 2016 Revised February 2017
Page 14 of 67
Leveled Articles and Text Sets (NewsELA) wwwnewselacom
Fiction and Nonfiction Texts (Commonlit) httpwwwcommonlitorg
Primary Source Resources (Library of Congress) httpwwwlocgovteachers
Primary Source Resources and Museum Collections (Smithsonian Education)
httpwwwsmithsonianeducationorgeducators
Reading Rockets httpwwwreadingrocketsorg
CSDE Family Literacy Resources
httpwwwsdectgovsdecwpviewaspa=2678ampq=320764
4 Tier 1 Writing Instructional Resources
Graham S amp Harris K A Path to Better Writing Evidence-Based Practices in the
Classroom The Reading Teacher JanuaryFebruary 2016 (Vol 69 4 p 359-365)
httponlinelibrarywileycomdoi101002trtr1432abstract
In Common Effective Writing (Achieve the Core)
httpachievethecoreorgpage507in-common-effective-writing-for-all-students
ODELL Literacy (ODELL) httpodelleducationcomliteracy-curriculum
Writing for Understanding Common Core Resources for Teachers (The Vermont
Writing Collaborative) httpvermontwritingcollaborativeorgResourceshtml
Pros and Cons of Controversial Issues (ProCon) httpwwwproconorg
NY Times Debatable Topics (NY Times) httpwwwnytimescomroomfordebate
5 Tier 1 Mathematics Instructional Resources
Curriculum alignment Interactive Coherence Map (Achieve the Core)
httpachievethecoreorgpage1118coherence-map
Curriculum resourcesrich tasks Mathematics Assessment Project
httpmapmathshellorg (Secondary)
Illustrative Mathematics httpswwwillustrativemathematicsorg
Illuminations (NCTM) httpsilluminationsnctmorg
Achieve the Core httpachievethecoreorgabout-us
Student mathematics practice - Khan Academy httpswwwkhanacademyorg
IXL httpswwwixlcom
Bridging Practices among Connecticut Mathematics Educators httpbridgeseducationuconnedu
Connecticut Model Curriculum for High School httpctcorestandardsorgpage_id=1025
Connecticut State Department of Education Using Accountability Results to Guide Improvement March 2016 Revised February 2017
Page 15 of 67
6 Tier 1 Science Instructional Resources
Tools for Ambitious Science Teaching (University of Washington)
httpambitiousscienceteachingorgget-started
Tweed A (2009) Designing Effective Science Instruction What Works in Science
Classrooms Arlington VA NSTA Press
Rothstein D and Santana L (2011) Make Just One Change Teach Students to Ask
Their Own Questions Cambridge MA Harvard Press
Zwiers J and Crawford M (2011) Academic Conversations Portland ME
Stenhouse Publications
Fathman A and Crowthers D (2009) Science for English Language
Learners Arlington VA NSTA Press
NGSS Evidence Statements (Executive Summary) (Introduction and
Overview) (Grades K-5) (Grades 6-8) (Grades 9-12) NGSS Evidence Statements
provide educators with additional detail on what students should know and be able
to do These Evidence Statements are statements of observable and measureable
components that if met will satisfy NGSS performance expectations
NGSS Appendices - 13 essays detailing elements of the NGSS based upon the recommendations in the Framework for K-12 Science Education (National Research Council 2012)
7 Tier 1 - Reaching ALL learners
Culturally Responsive Teaching httpceedareducationufleduwp-
contentuploads201408culturally-responsivepdf
CSDE English Learner Resources wwwctgovsdeenglishlearners
CSDE Special Education Resources
httpwwwsdectgovsdecwpviewaspa=2678ampQ=320730
Universal Design for Learning httpctcorestandardsorgpage_id=7773
Differentiation Protocols and Other Resources (EL Education)
httpcommoncoresuccesseleducationorgresources
Leveled Articles Differentiation Ideas and Curriculum Ladders (For the Teachers)
httpwwwfortheteachersorg
Leveled Text Units and Lessons (ReadWorks) httpwwwreadworksorg
Leveled Articles and Text Sets (NewsELA) wwwnewselacom
Fiction and Nonfiction Texts (Commonlit) httpwwwcommonlitorg
Teacher practices NCTMrsquos Principles to Actions Ensuring Mathematical Success for
All httpwwwnctmorgPtA
Connecticut State Department of Education Using Accountability Results to Guide Improvement March 2016 Revised February 2017
Page 16 of 67
8 Tier 2 and 3 Intervention ndash Supplemental and Intensive Instruction and Supports
CSDE Framework for RTI
httpwwwsdectgovsdelibsdepdfpressroomSRBI_fullpdf
RTI Action Network httpwwwrtinetworkorg
Center on Response to Intervention httpwwwrti4successorg
Scientific Research-Based Interventions for English Language Learners
A Handbook to Accompany Connecticuts Framework for RTI
httpwwwsdectgovsdelibsdepdfcurriculumbilingualel_admin_resource_ha
ndbookpdf
Where can I get more information
QUESTIONS CSDE CONTACTS
Best Practices and Resources for Improving ELA Curriculum and Instruction
Melissa Hickey Phone 860-713-6680 Email MelissaHickeyctgov
Best Practices and Resources for Improving Mathematics Curriculum and Instruction
Jennifer Michalek Phone 860-713-6557 Email jennifermichalekctgov
Best Practices and Resources for Improving Science Curriculum and Instruction
Ronald Michaels Phone 860-713-6851 Email ronaldmichaelsctgov
Best Practices and Resources for Supporting English Learners
Megan Alubicki Flick Phone 860-713-6786 Email meganalubickictgov and Joe Di Garbo Phone 860-713-6863 Email joedigarboctgov
Academic Growth Calculations Renee Savoie Phone 860-713-6858 Email reneesavoiectgov
Connecticut State Department of Education Using Accountability Results to Guide Improvement March 2016 Revised February 2017
Page 17 of 67
INDICATOR 3 PARTICIPATION RATE
Description (What) This indicator will evaluate participation rates on all assessments for ELA Mathematics and Science for All Students group and the High Needs supergroup Rationale (Why) High participation rates for all students across subgroups is critical if accountability reports are to be representative of all students The validity of conclusions one can derive from assessment results is partly dependent on the percentage of students who participated in the assessment For example one cannot make generalizations about a schoolrsquos performance if a large number of eligible students did not participate in the test Additionally without high participation rates fair comparisons across schools and years cannot be made Applicability (Who) This indicator is applicable to all schools and districts with at least one tested grade (ie grades 3 through 8 10 or 11) Methodology Every school and district is expected to meetexceed the 95 participation rate standard for the All Students group and the High Needs group in all the tested subjects If a school that would otherwise have been classified in Category 1 or 2 has a participation rate that is less than 95 for either the All Students group or the High Needs group in any tested subject it will be classified into the next lower category Data Source State assessment data files and Public School Information System (PSIS) for student demographic (eg raceethnicity gender) and program (EL FRPL disability) data
RESOURCES FOR ENSURING ASSESSMENT PARTICIPATION
ACROSS THE SCHOOL COMMUNITY
The key to ensuring high participation rates lies in communication with teachers students and families Everyone needs to know what to expect in terms of content the delivery system and time demands while also understanding how results will be used Throughout communication it is essential to maintain perspective School and district leaders must strike a balance between communicating the importance and value of assessment data while not creating undue anxiety about a single summative test score In a 180-day school year the state assessment is a very small component of the instructional program lasting less than eight hours across all content areas for the average student taking mathematics English language artsliteracy and science assessments CSDE has provided Communication Tools for the Smarter Balanced assessments httpwwwsdectgovsdecwpviewaspa=2748ampq=336294 Connecticut SAT resources which include a template letter to parents as well as frequently asked questions is available at httpwwwsdectgovsdecwpviewaspa=2748ampq=335780
Connecticut State Department of Education Using Accountability Results to Guide Improvement March 2016 Revised February 2017
Page 18 of 67
The National PTA has created a range of free online resources that can be customized for local use to help parents understand the purpose and stakes associated with state assessments including Smarter Balanced The organization effectively describes the relationship between content standards for local curricula and the summative assessment through a variety of short videos and parent guides In an effort to encourage schools to sponsor informational events for families the National PTA has created a Parent Assessment Event Toolkit The toolkit includes a facilitatorrsquos guide presentation templates anticipated questions suggested take-home tools for parents in Spanish and English and sample announcements To access the toolkit and other resources visit httpwwwptaorgadvocacycontentcfmItemNumber=4311ampnavItemNumber=4610 Achieve the Core offers resources you can use to speak to parents and community members about the new standards The site offers guides documents and parent videos httpachievethecoreorgpage2736talking-with-parents
Where can I get more information
QUESTIONS CSDE CONTACTS
Strategies for Ensuring Assessment Participation Abe Krisst Phone 860-713-6894 Email abekrisstctgov
Rate Calculations Diane Murphy Phone 860-713-6891 Email dianemurphyctgov
Connecticut State Department of Education Using Accountability Results to Guide Improvement March 2016 Revised February 2017
Page 19 of 67
INDICATOR 4 CHRONIC ABSENTEEISM
Indicator Max Points ndash All Years
Percentage of students chronically absent bull All Students bull Students in High Needs Subgroup
50 50
Description (What) A districtschoolsubgroup chronic absenteeism rate is the percentage of students missing ten percent or greater of the total number of days enrolled in the school year for any reason It includes both excused and unexcused absences For example children who are enrolled for the full school year (eg 180 days) become chronically absent if they miss at least 18 days of school for any reason Because aggregate schooldistrict-wide attendance rates can mask the extent of individual absenteeism chronic absenteeism is a better indicator of student attendance
Rationale (Why) Students need to attend school daily to succeed and data must guide local efforts to improve student attendance In 2015-16 96 of all students statewide were chronically absent Great disparities exist in chronic absenteeism rates among student subgroups For example the 2015-16 chronic absenteeism rate for students eligible for free lunch (177) was more than three times that of their peers who were not eligible for lunch subsidies (53) In the same year 181 of students with disabilities were chronically absent while 83 of their non-disabled peers were identified as chronically absent Regardless of subgroup membership national reportsresearch as well as state level data analyses highlight the association of chronic absenteeism to student academic achievement and high school graduation
Applicability (Who) The chronic absenteeism indicator is applicable to all districts and schools with at least one grade between K and 12 inclusive InputFeedback This indicator has gained increasing acceptance statewide Many districts and schools have begun to track and monitor chronic absenteeism voluntarily The Connecticut legislature has established a Strategic Action Group around this issue that is serving as a centralizing force for disseminating promising new practices promoting communication and collaboration among critical state agency and community-based partners and reporting to the legislature on statewide progress The CSDErsquos districtschool turnaround initiatives (Alliance District program and Commissionerrsquos Network) incorporate chronic absenteeism as an important indicator Methodology (How) Points will be earned for the All Students group and the High Needs subgroup based on the percentage of students who are chronically absent It is important to weight subgroup absenteeism rates separately because disparities in chronic absenteeism rates
Connecticut State Department of Education Using Accountability Results to Guide Improvement March 2016 Revised February 2017
Page 20 of 67
among student subgroups exist in a vast majority of districtsschools throughout the state The CSDErsquos expectation is that no districtschool will have a chronic absenteeism rate that is greater than 5 therefore full points will be awarded if the chronic absenteeism rate is 5 or lower Conversely no points will be awarded if the chronic absenteeism rate is 30 or greater To recognize incremental improvement in the reduction of chronic absenteeism rates between 30 and 5 will be awarded proportional points
The following formula is used to convert the chronic absenteeism rate into points
(30 minus 119862ℎ119903119900119899119894119888 119860119887119904119890119899119905119890119890119894119904119898 119877119886119905119890)
25 119909 50
For example a school with an ldquoall studentsrdquo chronic absenteeism rate of 15 would earn 30 of the possible 50 points for the ldquoall studentsrdquo component of Indicator 4 The calculation is as follows
(30 minus 15)
25 119909 50
= 15
25 119909 50 =
3
5 119909 50 = 30 119901119900119894119899119905119904
Connecticut State Department of Education Using Accountability Results to Guide Improvement March 2016 Revised February 2017
Page 21 of 67
Data Source June PSIS
RESOURCES FOR IMPROVING ATTENDANCE
Connecticut State Department of Education staff have assembled a collection of timely and relevant resources focused on understanding potential causes of chronic absenteeism the impact of loss instructional time and practical approaches to ensuring that students are attending school ready to learn To access the resources visit the CSDE website and click on the Chronic Absenteeism link on the homepage Other resources include
The Governorrsquos Prevention Partnership (GPP) supports schools and businesses as well as community and faith-based organizations in ensuring that children are in safe quality mentoring relationships Quality mentoring programs can be an effective intervention for reducing chronic absenteeism The staff at GPP can provide technical assistance and support to districts and schools to establish quality mentoring programs httpwwwpreventionworksctorgwhatmentoring
Guidelines for Implementation of the Definitions of Excused and Unexcused Absences and Best Practices for Absence Prevention and Intervention Connecticut State Department of Education httpwwwsdectgovsdelibsdepdfpublicationsguidelines_excused_and_unexcused_absencespdf
CSDE Family and Community Engagement Resources httpwwwsdectgovsdetaxonomyv4_taxonomyaspDLN=45424ampsdeNav=|45424|ampsdePNavCtr=|45493|45493
Connecticutrsquos Medical Home Initiative for Children and Youth with Special Health Care Needs (CYSHCN) Students identified with special health care needs may have or are at increased risk for a chronic physical developmental behavioral or emotional condition and require health and related services beyond that required for children in general Assistance for the family and the student is available by contacting CYSHCN httpwwwctgovdphcwpviewaspa=3138ampQ=387702ampPM=1
Collaborative Approaches to Reducing Absenteeism among K-12 Students Policy Fact Sheet John W Gardner Center for Youth and Communities This policy brief provides suggestions for engaging and collaborating with diverse stakeholders to reduce truancy and chronic absenteeism Examples of community wide attendance campaigns are provided John W Gardner Center for Youth and Their Communities (2012 April) httpjgcstanfordeduresourcespolicy_fact_sheetsAbsence_Interventions_PFSpdf
Connecticut State Department of Education Using Accountability Results to Guide Improvement March 2016 Revised February 2017
Page 22 of 67
2016 Chronic Absenteeism Report The Chief Education Office (CEdO) commissioned this report on chronic absenteeism in Oregon schools to better understand the problem in general to specifically hear from students and families most likely to be chronically absent and to present recommendations for the State of Oregon and local communities The report contains helpful information about issues related to chronic absenteeism among students with disabilities httpeducationoregongovportfolio2016-chronic-absenteeism-report-2
Get Schooled httpjgcstanfordeduresourcespolicy_fact_sheetsAbsence_Interventions_PFSpdf The organization uses a digital platform gamification and a recipe it calls lsquosizzle and substancersquo to inspire and engage students Students set up personal accounts and have access to important information and motivation to attend school httpsgetschooledcomdashboardq=attendance
The National Mentoring Partnerships provides resources for implementing a mentor program and research-based evidence of the power of mentoring on improving absenteeism improving attitudes toward school and likelihood of enrolling in college httpwwwmentoringorg
Attendance Works is a national and state initiative that promotes awareness of the important role that school attendance plays in achieving academic success The Director of Attendance Works Hedy Chang and Johns Hopkins researcher Robert Balfanz are considered two of the nationrsquos experts on absenteeism and strategies that work In collaboration with partners they have published many reports that include success stories from schools around the country The three titles below are examples of materials available through wwwattendanceworksorg
o Balfanz Robert and Byrnes Vaughan (2013) Meeting the Challenge of
Combating Chronic Absenteeism Everyone Graduates Center Johns Hopkins University School of Education This report examines the impact of New York City Mayor Michael Bloombergrsquos task force on truancy chronic absenteeism and school engagement a program that spanned 2010 to 2013 and reached more than 60000 students in NYC public schools The study found that students who missed at least 20 days of school per year mdash the definition of chronic absenteeism mdash had lower grades and were more likely to drop out than students with better attendance Yet the researchers also found these effects of absenteeism are reversible with the help of mentors incentive programs and awareness campaigns httpwwwattendanceworksorgwordpresswp-contentuploads201401NYC-Chronic-Absenteeism-Impact-Report-Nov-2013pdf
Connecticut State Department of Education Using Accountability Results to Guide Improvement March 2016 Revised February 2017
Page 23 of 67
o Balfanz Robert and Byrnes Vaughan (2012) The Importance of Being in School A Report on Absenteeism in the Nationrsquos Public Schools Johns Hopkins University Center for Social Organization of Schools This report analyzes data on chronic absenteeism at the state level to begin the process of mapping its extent and characteristics Although currently only a handful of states collect data on chronic absenteeism results from a sample of states suggest that an estimated 10-15 of students in the US are chronically absent each year The report also highlights some promising practices among cities school districts and nonprofits to combat chronic absenteeism The authors offer policy recommendations on tracking and reporting chronic absence data and evidence-based interventions httpnewevery1graduatesorgwp-contentuploads201205FINALChronicAbsenteeismReport_May16pdf
o Ginsburg Alan Phyllis Jordan and Hedy Chang (2014) Absences Add Up How
School Attendance Influences Student Success Attendance Works August 2014 This state-by-state analysis of national testing data demonstrates that students who miss more school than their peers consistently score lower on standardized tests a result that holds true at every age in every demographic group and in every state and city tested The analysis is based on the results of the 2013 National Assessment of Educational Progress (NAEP) It compares attendance rates and NAEP scores for every state and for 21 large urban areas httpwwwattendanceworksorgwordpresswp-contentuploads201409Absenses-Add-Up_September-3rd-2014pdf
Attendance Works has developed a range of resources specific to grades served (ie elementary middle secondary) and aligned to five important strategies designed to improve attendance recognizing good and improved attendance engaging students and parents monitoring attendance data and practice providing personalized early outreach and developing programmatic responses to barriers A few examples include o Leading Attendance A Toolkit for Principals
httpwwwattendanceworksorgtoolsschoolsprincipals
o Teaching Attendance Everyday Strategies to Help Teachers Improve Attendance and Raise Achievement
httpwwwattendanceworksorgtoolsschoolsteaching-attendance-toolkit
o Bringing Attendance Home Engaging Parents in Preventing Chronic Absence httpwwwattendanceworksorgtoolsfor-parentsbringing-attendance-home-toolkit
o Relationships Matter A Toolkit for An Elementary Success Mentor Attendance Initiative
httpwwwattendanceworksorgtoolsfor-school-districtselemsuccessmentortoolkit
Connecticut State Department of Education Using Accountability Results to Guide Improvement March 2016 Revised February 2017
Page 24 of 67
Where can I get more information
QUESTIONS CSDE CONTACTS
Resources Strategies and Best Practices Kari Sullivan Phone 860-807-2041 Email karisullivanctgov
Data Collection and Reporting Marquelle Middleton Phone 860-713-6877 Email marquellemiddletonctgov
Connecticut State Department of Education Using Accountability Results to Guide Improvement March 2016 Revised February 2017
Page 25 of 67
INDICATOR 5 PREPARATION FOR POSTSECONDARY AND
CAREER READINESS ndash COURSEWORK
Indicator Max Points ndash All Years
Percentage of students in grades 11 amp 12 participating in at least one of the following during high school Two courses in APIBdual enrollment or Two courses in one of seventeen CTE categories or Two workplace experience ldquocoursesrdquo in any area
50
Description (What) This is an access metric It evaluates whether students in grades 11 and 12 have participated in coursework during high school that prepares them for success in college andor careers In recognition of the diverse pathways of our students credit is awarded if students pursue traditional college-preparatory courses (eg Advanced Placement International Baccalaureate) career-technical education courses or workplace experienceinternship opportunities Students in Grade 12 include students with disabilities who are 18 to 21 years of age and are receiving transition only services These students are engaged in workplace experience and will contribute positively to a schoolrsquos Indicator 5 calculation Rationale (Why) Students cannot be expected to demonstrate success in college and careers if they arenrsquot receiving the requisite preparation Applicability (Who) This indicator is applicable to all districts and schools that offer grades 11 andor 12 InputFeedback The primary feedback to this indicator has been that the system should be inclusive to recognize opportunities beyond APIB that may be offered by districts For example many districts have partnerships with in-state collegesuniversities (eg UCONNrsquos Early College Experience program) that enable students to take college courses in high school and earn both high school and college credit In response to this suggestion the CSDE modified its data collection to begin collecting information about dual enrollment courses Methodology (How) Points will be awarded to the All Students group based on the percentage of 11th and 12th graders who meet the specified coursework participation thresholds Points will be prorated based on the percentage of the ultimate target (75) achieved
Connecticut State Department of Education Using Accountability Results to Guide Improvement March 2016 Revised February 2017
Page 26 of 67
Calculation Steps
1 Start with June Collection to determine 11th and 12th graders and their facility1codes Pull in certified TCS records from Fall of Years 2011 2012 2013 and 2014 for SASIDs with the same facility1code as in PSIS June Collection
2 APIB courses are flagged by the NCES course name Dual enrollment courses are
flagged by having a dual enrollment code The APIBDual Enrollment flags are all summed by SASID and facility1code SASID and facility1code combinations whose flags sum to gt=2 receive credit for Indicator 5
a NCES Course Names and Codes can be viewed under the ldquoSecondary School Course Classification Systemrdquo Header on the TCS help site httpwwwcsdestatectuspublictcsdownloadsasp
b More information regarding Dual Enrollment Codes are available on page 15-16 of the TCS User Guide httpwwwcsdestatectuspublictcsdownloadsasp
3 Workplace Experience courses are flagged by the NCES course name The Workplace
Experience flags are summed by SASID and facility1code SASID and facility1code combinations whose flags sum to gt=2 receive credit for Indicator 5
a NCES Course Names and Codes can be viewed under the ldquoSecondary School Course Classification Systemrdquo Header on the TCS help site httpwwwcsdestatectuspublictcsdownloadsasp
b In addition students with disabilities who are receiving transition services only (18-21 years of age) and engaged in Workplace Experience as indicated by exception code 02 will also be included as having met this indicator
4 CTE courses are identified into 1 or more cluster by NCES There are 17 clusters Each
cluster has a unique flag Each unique CTE flag is summed by SASID and facility1code If the sum of the unique CTE flag is gt=2 in any cluster then the student receives credit for Indicator 5
a Career Technical Education Course Codes amp Clusters can be viewed under the ldquoSecondary School Course Classification Systemrdquo Header on the TCS help site httpwwwcsdestatectuspublictcsdownloadsasp
5 The unique count of SASIDs and facility1codes receiving credit for Indicator 5 is summed
by facility1code to determine the school-level numerator for indicator 5
6 Students identified as meeting Indicator 5 in any of steps 2-4 are summed by their reporting district to determine the district-level numerator for indicator 5
Data Source June PSIS (to establish 11th and 12th graders) and Teacher Course Student (for course participation)
Connecticut State Department of Education Using Accountability Results to Guide Improvement March 2016 Revised February 2017
Page 27 of 67
INDICATOR 6 PREPARATION FOR POSTSECONDARY AND
CAREER READINESS - EXAMS
Indicator Max Points ndash All Years
Percentage of students in grades 11 amp 12 achieving CCR benchmark on at least one of the following Smarter Balanced 11th or SAT or ACT or AP or IB
50
Description (What) This metric evaluates whether students in grades 11 and 12 have attained benchmark scores on at least one of the most prevalent collegecareer readiness exams Rationale (Why) In addition to looking at ldquoaccessrdquo (ie indicator 5) it is also important to evaluate ldquoperformancerdquo In recognition of the exam options available to students this metric recognizes attainment of the benchmark score in any of those options Applicability (Who) This indicator is applicable to all districts and schools that offer grades 11 andor 12 InputFeedback As with coursework the primary feedback to this indicator has been that the system should be inclusive and recognize that students may demonstrate collegecareer readiness through different exam options Methodology (How) Points will be awarded to the All Students group based on the percentage of 11th and 12th graders who meet the following benchmark scores on the respective exams
Grade 11 Smarter Balanced ndash Level 3 or higher on both ELA and Math or
SAT (until January 2016) ndash composite score of 1550 or higher on the old SAT or
SAT (effective March 2016) ndash Evidence-Based Reading and Writing score of at least 480 and a Math score of at least 530 on the Redesigned SAT or
ACT ndash meeting benchmark on 3 of 4 exams (benchmark varies based on subject) or
AP ndash 3 or higher on an AP exam or
IB ndash 4 or higher on an IB exam Points will be prorated based on the percentage of the ultimate target (75) achieved Data Source June PSIS (to establish 11th and 12th graders) SATAP from College Board ACT from ACT Inc IB from International Baccalaureate Organization and Smarter Balanced from state assessment data files
Connecticut State Department of Education Using Accountability Results to Guide Improvement March 2016 Revised February 2017
Page 28 of 67
RESOURCES TO PREPARE STUDENTS FOR POSTSECONDARY
SUCCESS
This accountability system values increasing student access to rigorous coursework while striking a balance with outcomes based on a variety of nationally recognized assessments Research shows that students who enroll in challenging coursework in high school are more likely to graduate and are better positioned for success in college (Achieve 2015) It acknowledges that challenging coursework can take many forms including dual enrollment CTE coursework and workplace experience Teachers and school counselors play a critical role in helping students to select appropriate coursework to meet student needs and provide an appropriate level of challenge Schools that administer the PSAT to all students also have access to the College Boardrsquos AP Potential tool AP Potential is a free web-based tool that allows schools to identify all students with a high probability of success in an AP course based on PSAT performance In 2013-14 the Connecticut State Department of Education began the practice of annually notifying students who demonstrate AP potential and encouraging them to consider enrolling in challenging courses such as AP dual enrollment or IB courses The AP Potential tool provides school personnel with another resource that can be used to remove barriers and invite more students of all backgrounds to participate in college-aligned coursework Additional information about the tool and guidelines for proper use are available here httpsappotentialcollegeboardorgappwelcomedo Increasingly districts are realizing the value of high-quality CTE programs of study Research shows a strong positive relationship between participation in CTE and other measures of academic achievement Additionally the applied nature of CTE is appealing to students keeping them motivated and engaged in their learning The National Association of State Directors of Career Technical Education Consortium (NASDCTEc) has collected information about program designs that work in different community types throughout the country To review ldquoeffective modelsrdquo visit httpcareertechorgpapers-effective-models
Career Technical Education Programs Engaging and rigorous career-technical
education programs that focus on providing industry certifications and dual credit
opportunities for CTE completers For more information and resources for quality
career-technical programs in high school see
CSDE CTE webpage
httpwwwsdectgovsdecwpviewaspa=2678ampq=320802
CSDE CT Core Standards website CTE page
httpctcorestandardsorgpage_id=1336
Association for Career and Technical Education The National Research
Center for Career and Technical Education at SREB httpwwwnrccteorg
Connecticut State Department of Education Using Accountability Results to Guide Improvement March 2016 Revised February 2017
Page 29 of 67
Southern Regional Education Boardrsquos High Schools that Work and Advanced Careers httpwwwsreborgpage1608Advanced_Careerhtml
Where can I get more information
QUESTIONS CSDE CONTACTS
Resources Strategies and Best Practices related to College Board products including PSAT SAT and AP
Michelle Rosado Phone 860-713-6748 Email michellerosadoctgov
Resources Strategies and Best Practices for CTE and Dual Enrollment
Suzanne Loud Phone 860-713-6748 Email suzanneloudctgov
Resources Strategies and Best Practices for Work-Based Learning
Harold Mackin Phone 860-713-6779 Email haroldmackinctgov
Resources Strategies and Best Practices for Supporting Students with Disabilities Receiving Transition Only Services
Patricia Anderson Phone 860-713-6923 Email patriciaandersonctgov
Data Collection and Reporting for Coursework (Indicator 5)
Keryn Felder Phone 860-713-6833 Email kerynfelderctgov
Data Collection and Reporting for Exams (Indicator 6) Charles Martie Phone 860-713-6809 Email charlesmartiectgov
Connecticut State Department of Education Using Accountability Results to Guide Improvement March 2016 Revised February 2017
Page 30 of 67
INDICATOR 7 GRADUATION - ON-TRACK IN 9TH GRADE
Indicator Max Points ndash All Years
Percentage of 9th graders earning at least five full-year credits in the year and no more than one failing grade in English Mathematics Science or Social Studies
50
Description (What) For 2014-15 and 2015-16 this indicator calculates the percentage of 9th graders earning at least five full-year credits in the year In the future CSDE will consider adding the criteria that there be no more than one failing grade in English Mathematics Science or Social Studies in the school year Rationale (Why) Ninth grade is a critical year The University of Chicagorsquos Consortium on Chicago School Research ldquoidentifies students as on-track if they earn at least five full-year course credits and no more than one semester F in a core course in their first year of high school On-track students are more than three and one-half times more likely to graduate from high school in four years than off-track students The indicator is a more accurate predictor of graduation than studentsrsquo previous achievement test scores or their background characteristicsrdquo Applicability (Who) This indicator is applicable to all districts and schools that offer grade 9 It will also be applied to districtsschools where grade 8 is the terminal grade in order to serve as an indicator of how well the middle school is preparing students for success in the first year of high school InputFeedback Some questioned if the five credits in grade 9 represents being on-track since the total credits required to graduate in many high schools exceed the state minimum of 20 Others suggested course passage instead of credit accumulation Some administrators of K-8 schools districts were also concerned that this metric was holding them accountable for student success in an educational system outside their own Methodology (How) The total number of students in 9th grade who earn at least five full year credits is expressed as a percentage of all 9th graders The ultimate target for this indicator is 94 (same as that for the four-year cohort graduation rate) Points will be prorated based on the percentage of the ultimate target achieved Data Source June PSIS (to establish current year 9th graders and prior year 8th graders) and Teacher Course Student (for credit data)
Connecticut State Department of Education Using Accountability Results to Guide Improvement March 2016 Revised February 2017
Page 31 of 67
RESOURCES FOR KEEPING STUDENTS ON-TRACK TO GRADUATION
The on-track definition used by the University of Chicagorsquos Consortium on Chicago School Research has been adopted and customized in districts across the nation State accountability system indicators are always lagging indicators but at the local level districts and schools have the opportunity to track and respond to relevant data quickly before serious problems emerge and on-time graduation for a student is compromised The Consortium in partnership with the Network for College Success have conducted extensive research about the importance of Grade 9 and identified factors that predict the likelihood of graduation The on-track rate in Chicago Public Schools has risen from 57 percent for the Class of 2008 to 84 percent for the Class of 2018 The To amp Through Project website includes videos recorded webinars and targeted reports focused on helping first-generation college students and high needs stay on-track to graduation All resources can be accessed here httpstoandthroughuchicagoedu With an increased focus on student success in Grade 9 many high schools have developed early warning systems (EWS) to identify at-risk students The National High School Center funded through a grant from the US Department of Education developed a free online EWS tool using Excel that can be downloaded and customized to meet a schoolrsquos needs Using timely and accurate local data school personnel can identify patterns and address potential problems proactively In addition to the EWS designed for high schools there is a middle school tool available Both resources and supporting documentation are available through the College and Career Readiness Center at American Institutes for Research here httpwwwearlywarningsystemsorgtools-supports While this indicator focuses on credits and grades earned by a student the on-track indicator is closely linked to Indicator 4 Chronic Absenteeism The Chicago research and the EWS tools acknowledge the importance of attendance in Grade 8 and Grade 9 as predictors of success in high school and recommend monitoring attendance and other ldquowarning signalsrdquo students provide to us as part of a comprehensive approach to keeping students on-track
The Everyone Graduates Center a research program of Johns Hopkins University is committed to studying the dropout problem by identifying barriers and developing tools and models that states communities districts and schools can use to support all students through high school graduation Visit the Analytics section of their website to learn more about identifying students who are sending ldquowarning signalsrdquo and improving data-based decision making and actions httpnewevery1graduatesorganalyticson-and-off-track-indicators
Evidence Based Resources for Keeping Students on Track to Graduation George Washington University Center for Equity and Excellence in Education (January 2012)
Connecticut State Department of Education Using Accountability Results to Guide Improvement March 2016 Revised February 2017
Page 32 of 67
Provides resources for school wide targeted and intensive interventions designed to address attendance behavior and course failure httpwwwdoevirginiagovsupportschool_improvementtitle11003_gresourcesevidence_based_resourcespdf
MTSS is an evidence-based framework that uses data-based problem-solving to integrate academic and behavioral instruction and intervention The integrated instruction and intervention is delivered to students in varying intensities (multiple tiers) based on student need MTSS addresses the needs of the whole child to remove non-academic barriers to academic achievement and ensure that students achieve their full potential To learn more about MTSS visit httpwwwrtinetworkorgessentialtieredinstructiontier1accurate-decision-making-within-a-multi-tier-system-of-supports-critical-areas-in-tier-1
National Mentoring Partnerships provides resources for implementing a mentor program and research-based evidence of the power of mentoring on reducing absenteeism improving attitudes toward school preventing the start of risk-taking behavior and increasing the likelihood of enrolling in college httpwwwmentoringorg
o The Governorrsquos Prevention Partnership Youth Mentoring Program Through a
partnership with MENTORNational Mentoring Partnership this Connecticut program partners with schools businesses community and faith-based organizations to ensure that children are involved in safe quality mentoring relationships httpwwwpreventionworksctorgwhatmentoringintroductionhtml
Poliner Rachel A and Lieber Carol Miller (2004) The Advisory Guide Designing and Implementing Effective Advisory Programs in Secondary Schools Educators for Social Responsibility ISBN-10 0942349016 How to design and implement an advisory program focused on building community and promoting academic success social-emotional learning and postsecondary planning
Career-Themed Smaller Learning Communities Nonprofit organizations can assist schools by providing research-based best practices including but not limited to
Southern Regional Education Boardrsquos High Schools That Work Making Middle Grades Work and Technology Centers that Work
Regional Educational Laboratory Program httpsiesedgovnceeedlabs
Northeast College and Career Readiness Research Alliance httpwwwrelneiorgresearch-alliancescollege-and-career-readinesshtml
National Career Academies Network
Connecticut State Department of Education Using Accountability Results to Guide Improvement March 2016 Revised February 2017
Page 33 of 67
Talent Development Secondary
httpwwwtdschoolsorg
Buck Institute for Education Engaging students in authentic project-based learning Assists teachers in developing engaging project-based learning and assisting schools in creating a project-based learning school-wide effort httpbieorg
Connecticutrsquos Guidelines for Mastery-Based Learning httpwwwsdectgovsdelibsdepdfmblmastery_based_learning_guidelinespdf
The Collaborative for Academic Social and Emotional Learning (CASEL) advances the practice of promoting integrated academic social and emotional learning for all children in preschool through high school httpwwwcaselorg
Career Technical Education Programs Engaging and rigorous career-technical education programs that focus on providing industry certifications and dual credit opportunities for CTE completers For more information and resources for quality career-technical programs in high school see
CSDE CTE webpage httpwwwsdectgovsdecwpviewaspa=2678ampq=320802
CSDE CT Core Standards website CTE page httpctcorestandardsorgpage_id=1336
Association for Career and Technical Education The National Research Center for Career and Technical Education at SREB httpwwwnrccteorg
Southern Regional Education Boardrsquos High Schools that Work and Advanced Careers httpwwwsreborgpage1608Advanced_Careerhtml
Practice Guide Dropout Prevention Institute of Education Sciences (IES) (September 2008) This guide provides recommendations that focus on reducing high school dropout rates httpwwwiesedgovnceewwcpdfpractice_guidesdp_pg_090308pdf
Where can I get more information
QUESTIONS CSDE CONTACTS
Resources Strategies and Best Practices Kimberly Traverso Phone 860-807-2057 Email kimberlytraversoctgov
Data Collection and Reporting Keryn Felder Phone 860-713-6833 Email kerynfelderctgov
Connecticut State Department of Education Using Accountability Results to Guide Improvement March 2016 Revised February 2017
Page 34 of 67
INDICATOR 8 GRADUATION ndash FOUR YEAR ADJUSTED COHORT
GRADUATION RATE ndash ALL STUDENTS
Indicator Max Points ndash All Years
Percentage of first time 9th graders who graduate with a regular high school diploma in four years or less ndash All Students
100
Description (What) The four year adjusted cohort graduation rate represents the percentage of first time 9th graders who graduate with a regular high school diploma in four years or less It is based on the nationally consistent method defined in 34 CFR sect 20019 (73 FR 64508 (Oct 29 2008)) Rationale (Why) Graduating from high school is an important milestone in a studentrsquos education The inclusion of the specific four-year adjusted cohort graduation rate is a requirement of ESEA Flexibility Applicability (Who) This indicator is applicable to all districts and schools that offer at least one grade between 9 and 12 inclusive InputFeedback Among all the indicators in the accountability model this is one that continues to irk many districtschool leaders While a vast majority of students do graduate in four years practitioners adamantly (and one might say rightly) contend that some students (eg English learners who newly arrive in the country in middlehigh school low income students who may need to work part-time to support their family some students with disabilites) benefit from having an extra year or two to complete high school consequently they claim it is unfair that these non-graduates are counted as a ldquofailurerdquo in the four-year rate which has become the ldquode-facto graduation raterdquo Methodology (How) The four-year adjusted cohort graduation rate is based on the nationally consistent method as defined in 34 CFR sect 20019 (73 FR 64508 (Oct 29 2008)) The ultimate target for all students remains at 94 Districtsschools can earn up to 100 points based on the pro-rated percentage of the ultimate target (94) achieved by All Students For example a school with a graduation rate of 846 (ie 90 of the ultimate target of 94) will earn 90 out of 100 points Data Source PSIS Registration and Collection
Connecticut State Department of Education Using Accountability Results to Guide Improvement March 2016 Revised February 2017
Page 35 of 67
INDICATOR 9 GRADUATION ndash SIX YEAR ADJUSTED COHORT
GRADUATION RATE ndash HIGH NEEDS
Indicator Max Points ndash All Years
Percentage of first time 9th graders who graduate with a regular high school diploma in six years or less ndash High Needs Subgroup
100
Description (What) The six-year adjusted cohort graduation rate represents the percentage of first time 9th graders who graduate with a regular high school diploma in six years or less It is based on the nationally consistent method defined in 34 CFR sect 20019 (73 FR 64508 (Oct 29 2008)) Rationale (Why) For a variety of reasons some students (eg English learners who newly arrive in the country in middlehigh school low income students who may need to work part-time to support their family student with disabilities who need additional ldquotransition only servicesrdquo to facilitate the transition from school to adult life) benefit from having an extra year or two to complete high school Unlike in the four-year rate the graduation accomplishment of these students can be counted as a success in the six year rate The results below for the 2012 cohort illustrate why the six-year is a more fair and complete reflection of the successes of all students and subgroups
Four- Five- and Six-year Graduation Rates for the 2013 Graduation Cohort
Category 4-Year Rate
5-Year Rate
6-year Rate
All Students 855 879 887
English Learner 638 710 723
Special Education 647 710 754
Eligible for Free Meals 686 733 744
High Needs 724 770 786
Male 824 857 866
Female 887 904 909
Hispanic 702 746 758
Indian or Alaska Native 818 848 848
Asian 932 956 961
Black 757 799 808
Hawaiian or Pacific Islander 890 903 918
White 914 929 935
Two or More Races 823 862 876
Connecticut State Department of Education Using Accountability Results to Guide Improvement March 2016 Revised February 2017
Page 36 of 67
Applicability (Who) This indicator is applicable to all districts and schools that offer grade 12
InputFeedback The six-year rate elicits a very different reaction from that of the four-year rate This extended graduation rate is viewed very favorably by all constituents and stakeholders Methodology (How) The six-year adjusted cohort graduation rate is based on the nationally consistent method as defined in 34 CFR sect 20019 (73 FR 64508 (Oct 29 2008)) The ultimate target for all students and subgroups remains at 94 Districtsschools can earn up to 100 points based on the pro-rated percentage of the ultimate target (94) achieved by High Needs students For example a school with a six-year graduation rate of 846 (ie 90 of the ultimate target of 94) will earn 90 out of 100 points Data Source PSIS Registration and Collection Graduation Rate Gap A districtschool is identified as having a graduation rate gap if the size of its six-year graduation rate gap between the High Needs subgroup and the Non-High Needs group (or 94 if thatrsquos lower) is at least one standard deviation greater than the statewide gap
RESOURCES FOR REDUCING DROPOUT AND INCREASING
GRADUATION
The Governorrsquos Prevention Partnership Youth Mentoring Program Through a partnership with MENTORNational Mentoring Partnership this programs partners with schools businesses community and faith-based organizations to ensure that children are involved in safe quality mentoring relationships httpwwwpreventionworksctorgwhatmentoringintroductionhtml
Project GRAD partners with communities interested in creating a rigorous college-bound culture for their students It targets schools serving economically disadvantaged students with the aim of increasing high school graduation and college entrance rates httpwwwprojectgradorg
GradNation For those working to increase high school graduation rates GradNation provides data insight and analysis information about effective and promising practices plus opportunities to connect and learn from one another httpgradnationamericaspromiseorgreports-resources
The National Dropout Prevention CenterNetwork (NDPCN) Since 1986 the NDPCN has served as a clearinghouse on issues related to dropout prevention and offered strategies designed to increase the graduation rate in Americarsquos schools The
Connecticut State Department of Education Using Accountability Results to Guide Improvement March 2016 Revised February 2017
Page 37 of 67
organization is a well-established national resource for sharing solutions for student success httpdropoutpreventionorgeffective-strategies httpdropoutpreventionorgresources
The National Mentoring Partnerships provides resources or implementing a mentor program and research-based evidence of the power of mentoring on improving absenteeism improving attitudes toward school and likelihood of enrolling in college Resources include tips for starting and mentoring program and elements of effective practices for mentoring httpwwwmentoringorg
Poliner Rachel A and Lieber Carol Miller (2004) The Advisory Guide Designing and Implementing Effective Advisory Programs in Secondary Schools Educators for Social Responsibility ISBN-10 0942349016 How to design and implement an advisory program focused on building community and promoting academic success social-emotional learning and postsecondary planning
Career-Themed Smaller Learning Communities Nonprofit organizations can assist schools by providing research-based best practices including but not limited to
Southern Regional Education Boardrsquos High Schools That Work Making Middle Grades Work and Technology Centers that Work
Regional Educational Laboratory Program httpsiesedgovnceeedlabs
Northeast College and Career Readiness Research Alliance httpwwwrelneiorgresearch-alliancescollege-and-career-readinesshtml
National Career Academies Network Talent Development Secondary httpwwwtdschoolsorg
The Buck Institute for Education Engaging students in authentic project-based learning is the leading expert in assisting teachers in developing engaging project-based learning and assisting schools in creating a project-based learning school-wide effort httpbieorg
The Everyone Graduates Center a research program of Johns Hopkins University is committed to studying the dropout problem by identifying barriers and developing tools and models that states communities districts and schools can use to support all students through high school graduation The organizationrsquos website httpnewevery1graduatesorg has a section devoted to sharing what is working across the country This Tools and Models section has information organized in six sections Early Warning and Response Systems Comprehensive Whole-School Reform Models New School Designs Innovations in Curriculum and Instruction School Family and Community Partnerships and Pathways to College and Career The Everyone
Connecticut State Department of Education Using Accountability Results to Guide Improvement March 2016 Revised February 2017
Page 38 of 67
Graduates Center recognizes that students are on a path to graduation well before high school so there are resources designed for use in the middle grades as well
Pathways to Education (httpswwwpathwaystoeducationca) is a community-based program with a variety of locations throughout Canada The Pathways model is a coordinated partnership that includes schools government community partners volunteers and the commitment of students and their families Pathways was founded in 2001 and since that time has demonstrated impressive results in reducing dropouts among economically-disadvantaged students and providing support to ensure successful post-secondary transitions
The National Dropout Prevention Center for Students with Disabilities (NDPC-SD) at Clemson University was established in 2004 by the Office of Special Education Programs (OSEP) The Centerrsquos website (httpwwwndpc-sdorg) includes links to content selected for specific audiences including districts parents and students The resources include strategies for carefully tracking key factors that serve as early warning signs of a problem as well as evidence-based dropout prevention measures
The California Dropout Research Project (CDRP) has been conducting research designed to inform policymakers educators and the general public about the dropout issue for nearly a decade (httpwwwcdrpucsbedu) Given the percentage of California students who are English learners the CDRP delves deeper into the risks for this group of students and suggests reforms that show promise in this report httpwwwcdrpucsbeduresearchreport19pdfc
The Transition Bill of Rights for Parents of Students Receiving Special Education Services describes the criteria necessary for students with disabilities to access ldquotransition onlyrdquo services upon completion of academic requirements for graduation
Connecticut State Department of Education Using Accountability Results to Guide Improvement March 2016 Revised February 2017
Page 39 of 67
Where can I get more information
QUESTIONS CSDE CONTACTS
Resources Strategies and Best Practices for School Counselors to use in supporting all students
Kimberly Traverso Phone 860-807-2057 Email kimberlytraversoctgov
Resources Strategies and Best Practices for Supporting Students with Disabilities
Patricia Anderson Phone 860-713-6923 Email patriciaandersonctgov
Resources Strategies and Best Practices for Supporting English Learners
Megan Alubicki Flick Phone 860-713-6786 Email meganalubickictgov and Joe Di Garbo Phone 860-713-6863 Email joedigarboctgov
Data Collection Rate Calculations and Reporting Francis Apaloo Phone 860-713-6832 Email francisapalooctgov
Connecticut State Department of Education Using Accountability Results to Guide Improvement March 2016 Revised February 2017
Page 40 of 67
INDICATOR 10 POSTSECONDARY ENTRANCE RATE ndash ALL
STUDENTS
Indicator Max Points ndash All Years
Percentage of graduating class who enrolled in a 2 or 4-year postsecondary institution any time during the first year after high school graduation
100
Description (What) This rate is the percentage of all students in a graduating class who enrolled in a 2 or 4-year postsecondary institution any time during the first year after high school graduation Rationale (Why) In addition to evaluating the extent of preparation for collegecareer it is important to also evaluate attainment of that outcome Applicability (Who) This indicator is applicable to all districts and schools that offer grade 12 InputFeedback Some practitioners are supportive of this indicator because it encourages school staff to extend their efforts beyond the school building to support student success Others are less supportive because they consider this indicator as being shaped more by factors beyond the influence of school staff (eg personal choice family economics) some of these objectors are amenable to its inclusion so long as it is not weighted too heavily and the ultimate target is reasonable The CSDE has heard from the field and acknowledges data limitations associated with this indicator Currently the Department does not have access to information about important post-secondary outcomes for students including but not limited to evidence of full-time employment immediately following graduation entry into the military enrollment in private occupational schools and transition to apprenticeships Methodology (How) Points will be awarded based on the percentage of All Students from the graduating class who enter a 2 or 4-year postsecondary institution any time during the first year after high school graduation Points will be prorated based on the percentage of the ultimate target (75) achieved Data Source PSIS and National Student Clearinghouse
Connecticut State Department of Education Using Accountability Results to Guide Improvement March 2016 Revised February 2017
Page 41 of 67
RESOURCES FOR IMPROVING POSTSECONDARY ENTRANCE
In September 2015 the White House released an annual report referencing ldquosummer meltrdquo This phrase is used to describe what happens to students who are accepted to college but during the months between high school graduation and the first day of college classes the student does not complete tasks necessary to begin school (eg course enrollment forms) According to the report 20 to 30 percent of high school graduates in urban communities who intend to attend college following graduation do not enroll
Major cities across the country have been exploring different ways of supporting their students from graduation to college entrance for many years The uAspire organization focuses on college affordability and assisting students with developing a plan to pay for college one of the most formidable barriers to college enrollment uAspire has served Boston-area students for three decades and expanded nationally ten years ago Information about services provided to students families and practitioners can be found on their website httpswwwuaspireorg The College Access Program (DC-CAP) a non-profit organization in Washington DC partners with all schools in the District and is available to all students DC-CAP reports that the percentage of students enrolling in college was 30 percent in 1999 and increased dramatically to 62 percent in 2014 DC-CAP attributes this improvement to comprehensive supports for students and their families leading up to and beyond graduation To find out more about DC-CAP and strategies used with students and families visit httpwwwdccaporg
The Strategic Data Projectrsquos Summer Melt Handbook provides users with a range of different approaches to effectively measure and develop systems to combat summer melt and improve college enrollment The handbook acknowledges that school districts have different resources available so the suggested interventions range from well-developed partnerships with community organizations to simple digital outreach customized and targeted to students and their families The handbook includes a variety of case studies to showcase the impact of different strategies and provides practical resources including sample templates used for tracking and outreach The handbook and related research are available here httpsdpceprharvardedusummer-melt-handbook
Achieve is an independent nonpartisan nonprofit education reform organization strongly committed to ensuring all students graduate from high school ldquocollege and career readyrdquo or in other words fully prepared academically for any and all opportunities they choose to pursue To achieve this goal states need a coherent and aligned policy framework anchored in the goal of graduating all students ready for credit-bearing college-level coursework and the 21st-century workplace The policy framework must at a minimum include college- and career-ready standards graduation requirements assessments and data and accountability systems and have strong alignment with policies set in the postsecondary and economic development sectors
Where can I get more information
Connecticut State Department of Education Using Accountability Results to Guide Improvement March 2016 Revised February 2017
Page 42 of 67
QUESTIONS CSDE CONTACTS
Resources Strategies and Best Practices Kimberly Traverso Phone 860-807-2057 Email kimberlytraversoctgov
Data Collection and Reporting Charles Martie Phone 860-713-6809 Email charlesmartiectgov
Connecticut State Department of Education Using Accountability Results to Guide Improvement March 2016 Revised February 2017
Page 43 of 67
INDICATOR 11 PHYSICAL FITNESS
Indicator Max Points ndash All Years
Percentage of students meetingexceeding the ldquoHealth Fitness Zone Standardrdquo in all four areas of the CT Physical Fitness Assessment
50
Description (What) The Third Generation CT Physical Fitness Assessment (CTPFA) is focused on health-related fitness The program mirrors options in the Presidentrsquos Challenge Physical Fitness Program and FitnessGramActivityGram The assessment includes four health-related physical fitness tests designed to assess muscular strength and endurance flexibility and cardiovascular fitness Criterion-referenced standards associated with good health are used rather than normative standards Since the early 1990rsquos the assessment has been administered to all students in grades 4 6 8 and 10 Effective 2016-17 high schools were granted flexibility (explained below) allowing the assessment to be administered in other grades
Rationale (Why) The Connecticut State Board of Education is committed to the physical development of Connecticutrsquos students and focused on outcomes and specific performance objectives that evidence attainment of that goal Applicability (Who) This indicator is applicable to all districts and schools that offer grades 4 6 8 or 10 InputFeedback Though cardiovascular fitness has been shown to correlate with improved academic performance stakeholders accept a metric that looks at standard-attainment in all four assessment areas because the focus is healthfitness Some stakeholders wondered if this area was weighted too heavily High schools requested flexibility from the requirement to test Grade 10 students In April 2016 CSDE announced the following increased flexibility to high schools regarding the administration and reporting of the Connecticut Physical Fitness Assessment results
Effective 2016-17 the expectation is that high school(s) must administer the physical fitness assessment at least once to every student anytime during Grades 9 through 12
The administration of the assessment does not necessarily need to be tied to student participation in a physical fitness class
High schools may also use summer school physical fitness courses as an opportunity to administer the assessment
For accountability purposes the CSDE will continue to use the Grade 10 enrollment numbers to calculate the estimated participation rate
Connecticut State Department of Education Using Accountability Results to Guide Improvement March 2016 Revised February 2017
Page 44 of 67
Methodology (How) To account for variation in estimated participation rates the following participation rate multipliers are established
If the estimated participation rate is at least 90 the multiplier is 1 This standard was achieved by approximately 82 of all schools in 2014-15
If the estimated participation rate is at least 70 but less than 90 the multiplier is 05 (approximately 11 of schools)
If the estimated participation rate is at least 50 but less than 70 the multiplier is 025 (approximately 3 of schools)
If the estimated participation rate is less than 50 no points will be awarded for this indicator
The ultimate target for the percentage of All Students meetingexceeding the ldquoHealth Fitness Zone Standardrdquo in all four areas of the CT Physical Fitness Assessment for a school or district is set at 75
Points will be prorated based on the percentage of the ultimate target achieved as adjusted by the participation rate multiplier Two examples are included below
Example 1 An elementary school has a 92 estimated participation rate and the percentage of those tested meeting the ldquoHealth Fitness Zone Standardrdquo in all four areas is 76 This school earns all 50 eligible points
Example 2 An elementary school has a 55 estimated participation rate and the percentage of those tested meeting the ldquoHealth Fitness Zone Standardrdquo in all four areas is 80 This school earns 125 of 50 eligible points
Data Source ED165 (fitness data) and June PSIS (enrollment)
RESOURCES FOR IMPROVING PHYSICAL FITNESS
Instructional Framework for fitness education in physical education (SHAPE America) httpwwwshapeamericaorgpublicationsresourcesteachingtoolsfitness_ed_resourcescfm
Healthy and Balanced Living Curriculum Framework for Physical Education (CSDE) httpwwwsdectgovsdeLIBsdePDFdepsstudentHealthyampBalancedLivingpdf
Guidelines for a Coordinated Approach to School Health (Section 3 Physical Education) httpwwwsdectgovsdeLIBsdePDFdepsstudentGuidelines_CSHpdf
Monitoring Student Fitness Levels (Centers for Disease Control and Prevention) httpwwwcdcgovhealthyschoolsphysicalactivitypdf2014_09_12_14-249482-nihiser-collectingfitnessdata-final-508web_tag508_2pdf
Connecticut State Department of Education Using Accountability Results to Guide Improvement March 2016 Revised February 2017
Page 45 of 67
Linking Health to Achievement (Centers for Disease Control and Prevention) o httpswwwcdcgovHealthyYouthhealth_and_academics o httpswwwcdcgovhealthyyouthhealth_and_academicspdfhealth-
academic-achievementpdf
Teachers Toolbox Home (SHAPE America) httpwwwshapeamericaorgpublicationsresourcesteachingtoolsteachertoolbox
Letrsquos Move Active Schools wwwletsmoveschoolsorg
Where can I get more information
QUESTIONS CSDE CONTACTS
Resources Strategies and Best Practices Bonnie Edmondson Phone 860-807-2055 Email bonnieedmondsonctgov
Data Collection and Reporting Raymond Martin Phone 860-713-6876 Email raymondmartinctgov
Connecticut State Department of Education Using Accountability Results to Guide Improvement March 2016 Revised February 2017
Page 46 of 67
INDICATOR 12 ARTS ACCESS
Indicator Max Points ndash All Years
Percentage of students in grade 9 through 12 participating in at least one dance theater music or visual arts course in the school year
50
Description (What) This is an ldquoaccessrdquo metric that evaluates the extent to which students in high school participate in at least one arts course in the school year in dance theatre music or the visual arts Rationale (Why) The Connecticut State Board of Education believes every student needs and deserves a high-quality education in the arts including dance music theater and the visual arts The arts are an integral component of the comprehensive curriculum provided to all Connecticut students at every grade Applicability (Who) This indicator is applicable to all districts and schools that offer any grade between 9 and 12 inclusive InputFeedback Traditionally access to the arts has been measured through instructional hours offered Districtschool administrators indicate that self-reported arts instructional hours are not comparable across schools With the availability now of course-level data the extent to which students avail of arts opportunities can be empirically known and compared across districtsschools The CSDE has heard from the field that students are engaged in important arts-related activities that are not captured through this indicator The Department acknowledges that many students participate in school- or community-based art programs and activities outside of the school day At this time there is not a way to capture that information in this system Additionally stakeholders have requested that the definition of arts coursework be expanded to courses that incorporate the use of technology including computer-aided design For now this system will remain focused on dance theater music and the visual arts but consideration will be given to expanding how this indicator is defined in future years Methodology (How) Points can be earned for the percentage of All Students in grades 9 through 12 who enroll in at least one ldquoFine and Performing Artsrdquo course during the school year A complete list of NCES Course Names and Codes along with a corresponding subject (eg ldquoFine and Performing Artsrdquo) can be viewed under the ldquoSecondary School Course Classification Systemrdquo header on the TCS help site httpwwwcsdestatectuspublictcsdownloadsasp Points will be prorated based on the percentage of the ultimate target achieved
Connecticut State Department of Education Using Accountability Results to Guide Improvement March 2016 Revised February 2017
Page 47 of 67
Data Source June PSIS (to establish current year 9th through 12th graders) and Teacher Course Student (for course participation data)
RESOURCES FOR IMPROVING ACCESS TO THE ARTS
Why is arts access important A project of the Arts Education Partnership ArtsEdSearch compiles and summarizes high quality research studies and explores implications for educational policy and practice ArtsEdSearch is a rich resource for districts seeking to bolster their arts programming Below is the organizationrsquos summary for arts access research
Research suggests that access to arts education provides an academic advantage to students Students in schools with extensive and broad offerings in the arts not only are able to learn the artsmdasha core academic subjectmdashbut also do better on state and district standardized tests and are provided with more opportunities to achieve and succeed than students in schools lacking robust arts programs Arts-rich schools graduate higher percentages of students who in turn are more likely to complete college and to be socially active in their communities in adulthood Studies also find that in arts-rich schoolsmdashparticularly schools that offer both discipline-based arts classes and integrated arts instructionmdashstudents are more engaged and teachers are more effective Policymakers concerned with educational equity should consider access to rich arts education programming a significant factor in a high-quality education for all students See more at httpwwwartsedsearchorgstudentspolicy-implications
What can districts do to improve arts access From Snapshot Arts Access in US Schools and the Arts Education Partnership - Provide a wider variety of arts courses at all levels particularly high school (including
theatre dance andor media arts) - Provide a higher level frequency of instruction at all levels - Provide comprehensive standards-based instruction aligned vertically throughout the
district with classes taught by certified teachers - Engage the arts as a part of high quality support and professional learning programs for the
entire educator workforce and - Increase opportunities to engage the community in student art performances or projects
1 Standards
CT Arts Standards httpwwwsdectgovsdecwpviewaspa=2618ampq=320834
National Core Arts Standards httpnationalartsstandardsorg
Connecticut State Department of Education Using Accountability Results to Guide Improvement March 2016 Revised February 2017
Page 48 of 67
Position Statement on the Implementation of the Connecticut Arts Standards
httpwwwsdectgovsdelibsdepdfboardArtsStandardspdf
2 Arts Integration
CT HOT Schools httpwwwctgovcctcwpviewaspa=2212ampq=293712
Project Zero at Harvard httpwwwpzharvardedu
Dance and Science integrated plan httpwwwedutopiaorgpdfsstwedutopia-
stw-bates-artsintegration-lessonplanvelocityaccel-presentapdf
Mathematics and Art httpmasongmuedu~jsuh4math20masterpiecepdf
Kennedy Center resources for teaching in through and about the arts -
httpartsedgekennedy-centerorgeducatorsaspx
Arts and Social studies connections - httpwwwctsocialstudiesorg
Other resources of note
KCAEEN Arts Education Advocacy Toolkit httpwwwkennedy-centerorgeducationkcaaenresourcesArtsEducationAdvocacyToolkitpdf
Music Education httpwwwnammfoundationorgsupport-music
Visual Arts Education httpwwwarteducatorsorgadvocacy
Theatre Education httpschooltheatreorgadvocacy
Dance Education httpndeoorgcontentaspxpage_id=22ampclub_id=893257ampmodule_id=55775
Where can I get more information
QUESTIONS CSDE CONTACTS
Resources Strategies and Best Practices Melissa Hickey Phone 860-713-6680 Email melissahickeyctgov
Data Collection and Reporting Keryn Felder Phone 860-713-6833 Email kerynfelderctgov
Connecticut State Department of Education Using Accountability Results to Guide Improvement March 2016 Revised February 2017
Page 49 of 67
APPENDICES
PERFORMANCE INDEX CALCULATION RULES
Overview Subject-level indices are calculated at the student- subgroup- school- and district-levels To calculate an index a studentrsquos score in each subject on the Smarter Balanced Assessment (SB) SAT CT Alternate Assessment (CTAA) Connecticut Mastery Test (CMT) Connecticut Academic Performance Test (CAPT) or the CMTCAPT Skills Checklist must first be transformed into an index score Detailed information regarding the calculation of each test specific score can be found in the section titled ldquoCalculating the Performance Indexrdquo Student Individual Performance Indices (IPIs) are derived for each subject Math English Language Arts (ELA) and Science School Performance Indices (SPIs) are calculated by averaging all of a given schoolrsquos valid and non-excluded Student IPIs for the applicable subject Only students enrolled in the school on October 1st of the testing year are included in SPI calculations District Performance Indices (DPIs) are calculated by averaging all of a given districtrsquos valid and non-excluded Student IPIs for the applicable subject Note that students who are enrolled in lsquoProgramsrsquo or are outplaced are included in a given Public School Information System (PSIS) ldquoReporting Districtrsquosrdquo DPI Only students enrolled in the district on October 1st of the testing year are included in DPI calculations Participation Rates are calculated by dividing the number of students who attempted andor completed the assessment by the total number of students who should have been administered the subject-level assessment Details regarding whether students were participants or non-participants is contained in the section titled ldquoParticipation and Achievement Inclusion Rulesrdquo
File Preparation All demographic data included in the assessment files were extracted from the CSDE frozen PSIS Registration File on the last day of the testing window Only students in grades 3 through 8 and grade 11 are included in calculations for the standard and alternate ELA and mathematics assessments Only students in grades 5 8 and 10 are included in calculations for the standard and alternate science assessments
English Learners (EL) and Students with Disabilities (SWD) ldquoFlexrdquo Groups
Connecticut State Department of Education Using Accountability Results to Guide Improvement March 2016 Revised February 2017
Page 50 of 67
As part of the Elementary and Secondary Education Act (ESEA) students who do not belong to the EL or SWD subgroups at the time of testing but who had been members of the EL or SWD subgroup any time up to two years prior are included in the EL flexibility andor SWD flexibility subgroups used for Indicator 1 calculations The previous subgroup status is determined using the EL and SWD PSIS Collection variables from the October January and June collections of the current and two prior school years
The completion of a Learner Characteristics Inventory (LCI) is required for participation in any alternate assessment Any CTAA student record or CMTCAPT Skills Checklist Science record without a completed LCI was invalidated These students were included as non-participants on the standard assessment In cases where a standard assessment record existed for a student with a completed LCI the standard assessment record was invalidated and the student was included as a non-participant on the alternate assessment(s)
Participation and Achievement Inclusion Rules Accountability reporting requires a series of decision rules that specify whether a student is included in performance index and participation rate calculations The tables on the following pages provide a comprehensive list of the assessment status rules used for accountability calculations for all summative assessments
Connecticut State Department of Education Using Accountability Results to Guide Improvement March 2016 Revised February 2017
Page 51 of 67
Smarter Balanced Assessment Data File Rules
Assessment Test Status Attempted
Flag
Participation Numerator
(Total Tested)
Participation Denominator
(Total Students)
Accountability Achievement
Smarter Balanced
ELA
Completed
Y
Yes P Yes Yes SS
Expired Yes P Yes Yes SS
Invalidated Yes P Yes exclude
Completed
P
No NP Yes exclude
Expired Yes P Yes Yes LOSS
Invalidated Yes P Yes exclude
Invalidated lt gt
Yes P Yes exclude
lt gt No NP Yes exclude
Smarter Balanced
MATH
Completed (cs ss)
Y
Yes P Yes Yes SS
Expired (ec ee) Yes P Yes Yes SS
Expired (ei) Yes P Yes exclude
Invalidated (ii) Yes P Yes exclude
Completed (ci)
P
Yes P Yes exclude
Expired (ec ee er ei) Yes P Yes Yes LOSS
Invalidated (ii) Yes P Yes exclude
Completed (csi)
N
Yes P Yes exclude
Expired (en) No NP Yes exclude
Invalidated (ii) Not Applicable
Pending (cn) No NP Yes exclude
Pending (cr) Yes P Yes exclude
Invalidated (ii) lt gt
Yes P Yes exclude
lt gt No NP Yes exclude
Legend c = Completed test submitted to be scored e = Expired test not submitted i = Invalidated Pending = Does not occur in test engine One part of test was never started OR was reset
(Math amp CAPT Science only 2016) r = Reset reset after started Temporary test segment status only (typically due to lack of appropriate
accommodations being set in TIDE) n = No Activity Test segment status only Never startedlogged into displays as blank s = Scored Completed test
Connecticut State Department of Education Using Accountability Results to Guide Improvement March 2016 Revised February 2017
Page 52 of 67
Connecticut Mastery Test (CMT) Science and Connecticut Academic Performance Test (CAPT) Science Data File Rules
Assessment Test Status Attempted
Flag
Participation Numerator
(Total Tested)
Participation Denominator
(Total Students)
Accountability Achievement
CMT Science
Completed
Y
Yes P Yes Yes SS
Expired Yes P Yes Yes SS
Invalidated Yes P Yes exclude
Expired P
Yes P Yes Yes LOSS
Invalidated Yes P Yes exclude
Completed
X
Yes P Yes Yes LOSS
Completed No NP Yes exclude
Invalidated Yes P Yes exclude
Invalidated lt gt
Yes P Yes exclude
lt gt No NP Yes exclude
CAPT Science
Completed
Y
Yes P Yes Yes SS
Expired Yes P Yes Yes SS
Expired (ei) Yes P Yes exclude
Invalidated (ii) Yes P Yes exclude
Pending (cr) Not Applicable
Completed
P
Yes P Yes exclude
Expired (ec ee er ei)
Yes P Yes Yes LOSS
Invalidated (ii) Yes P Yes exclude
Pending (cr) Not Applicable
Completed
X
Yes P Yes Yes LOSS
Completed No NP Yes exclude
Invalidated Yes P Yes exclude
Invalidated lt gt
Yes P Yes exclude
lt gt No NP Yes exclude
Legend c = Completed test submitted to be scored e = Expired test not submitted i = Invalidated Pending = Does not occur in test engine One part of test was never started OR was reset
(Math amp CAPT Science only 2016) r = Reset reset after started Temporary test segment status only (typically due to lack of appropriate
accommodations being set in TIDE)
Connecticut State Department of Education Using Accountability Results to Guide Improvement March 2016 Revised February 2017
Page 53 of 67
Connecticut Alternate Assessment (CTAA) Data File Rules
Test Status Attempted
Flag
Participation Numerator
(Total Tested)
Participation Denominator
(Total Students)
Accountability Achievement
Completed
Y
Yes P Yes Yes SS
Expired Yes P Yes Yes SS
Invalidated Yes P Yes exclude
Completed
P
Not Applicable
Expired Yes P Yes Yes LOSS
Invalidated Yes P Yes exclude
lt gt lt gt No NP Yes exclude
CMTCAPT Skills Checklist Science Data File Rules
Test Status Attempted
Flag
Participation Numerator
(Total Tested)
Participation Denominator
(Total Students)
Accountability Achievement
Completed
Y
Yes P Yes Yes SS
Expired Yes P Yes Yes SS
Invalidated Yes P Yes exclude
Completed
N
Not Applicable
Expired No NP Yes exclude
Invalidated No NP Yes exclude
Invalidated lt gt
Yes P Yes exclude
lt gt No NP Yes exclude
SAT Data File Rules
Number of Subject-Level Test Items
Answered
Attempted-ness
SAT Student
Participated Indicator =
Y
Participation Numerator
(Total Tested)
Participation Denominator
(Total Students)
Accountability Achievement
gt=1 Y Y
Yes P Yes Yes SS
0 P Yes P Yes LOSS
lt gt lt gt N No NP Yes exclude
lt gt lt gt lt gt No NP Yes exclude
Connecticut State Department of Education Using Accountability Results to Guide Improvement March 2016 Revised February 2017
Page 54 of 67
PERFORMANCE INDEX METHODOLOGY
Background Connecticut first implemented a performance index for school and district accountability purposes in 2012 The performance index was calculated by converting Connecticut Mastery Test (CMT) and Connecticut Academic Performance Test (CAPT) achievement levels to a scale of 0 to 100 This approach recognized and valued improvement in student achievement at all performance levels not just from lsquonot proficientrsquo to lsquoproficientrsquo It raised expectations by setting the target that all students perform at the higher lsquogoalrsquo level versus the lsquoproficientrsquo level While practitioners were generally pleased with this index they wondered if using scale scores to calculate the index instead of achievement levels would yield an even more precise measure of student achievement Consequently Connecticut State Department of Education (CSDE) staff consulted with faculty from the University of Connecticut to explore this possibility This paper outlines the specific methodology for converting scale scores for the various state assessments into Connecticutrsquos performance index
Scale Scores Improve Index Calculations Individual student results from the English language arts (ELA) Mathematics and Science assessments are reported in terms of scale scores and achievement levels Achievement levels are used as a way of categorizing student performance in a content area The levels represent broad groupings of performance that are developed based on the judgment of content experts Operationally the levels are used as a starting point in discussing a studentrsquos test scores Achievement levels are derived from underlying scale scores The underlying scale or ruler provides a more continuous measure of student performance such that one student with a significantly greater scale score than another student in the same achievement level can be said to be performing higher For district- and school-level accountability Connecticut uses student scale scores not achievement levels to calculate performance index scores in ELA Mathematics and Science This new approach to performance index calculation acknowledges that the assessments were not developed to solely classify students into broad achievement levels On the contrary they were developed to provide a more precise measure of student performance This approach of mapping scale scores instead of achievement levels to index values is consistent with the position paper released by the Smarter Balanced Assessment Consortium wherein they assert that
ldquohellipthey [achievement levels] will be less precise than scale scores for describing student gains over time or changes in achievement gaps among groups since they do not reveal changes of student scores within the bands defined by the achievement levels Furthermore there is not a critical shift in student knowledge or understanding that
Connecticut State Department of Education Using Accountability Results to Guide Improvement March 2016 Revised February 2017
Page 55 of 67
occurs at a single cut score point Thus the achievement levels should be understood as representing approximations of levels at which students demonstrate mastery of a set of concepts and skills and the scale scores just above and below an achievement level as within a general band of performancerdquo
The new index calculation will be more sensitive to changes in student performance over time and will provide an improved assessment of aggregate growth of students at the subgroup school and district levels The new calculation moves the performance index to a 0-110 scale Important considerations in defining the index are that it allows for (a) a comparison of schools and districts not only within a year but also across years and (b) bonus points to be assigned for the highest performing students (100-110) To meet these requirements the individual student index will be set to zero if a student obtains the lowest obtainable scale score (LOSS) for the studentrsquos grade and 110 if the student obtains the highest obtainable scale score (HOSS) Although the highest index value at the school district and subgroup level is 100 giving scores ranging from 100 to 110 to students who are the highest performing will have the effect of rewarding these schools and districts by weighting these scores additionally in the computation of the new performance index Further information is provided in Tables 1-5 including the lowest and highest obtainable scores for all state assessments (Smarter Balanced ELA and Mathematics CMT and CAPT Science CMT and CAPT Science Skills Checklists Connecticut Alternate Assessments (CTAA) ELA and Mathematics and SAT Evidence-based Reading and Writing and Mathematics)
Calculating the Performance Index The formula used to convert student scale scores (Smarter Balanced CTAA CMTCAPT Science CMTCAPT Science Skills Checklists and SAT) to an index value is presented below The approach for converting CMTCAPT Skills Checklist Science scores is the same however highest and lowest obtainable raw scores (HORS and LORS) are used in place of scale scores
119816119847119837119838119857 =119930119940119938119949119942 119930119940119952119955119942 minus 119923119926119930119930
119929119938119951119944119942lowast 120783120783120782
The following examples use information from Tables 1-5 to convert student scores to index values If a Grade 3 student earns a vertical scale score of 2400 on the ELA portion of the Smarter Balanced assessment the index value for this score is 618 The calculation is performed as follows
119816119847119837119838119857 =120784120786120782120782 minus 120784120783120783120786
120787120782120791lowast 120783120783120782 = 120788120783 120790
Connecticut State Department of Education Using Accountability Results to Guide Improvement March 2016 Revised February 2017
Page 56 of 67
If a Grade 8 student earns a scale score of 1276 on the Math portion of the CTAA assessment the index value for this score is 929 The calculation is performed as follows
119816119847119837119838119857 =120783120784120789120788 minus 120783120784120782120782
120791120782lowast 120783120783120782 = 120791120784 120791
If a Grade 5 student earns a scale score of 200 on the CMT Science assessment the index value for this score is 367 The calculation is performed as follows
119816119847119837119838119857 =120784120782120782 minus 120783120782120782
120785120782120782lowast 120783120783120782 = 120785120788 120789
If a Grade 10 student earns a raw score of 40 on the CAPT Skills Checklist Science the index
value for this score is 733 The calculation is performed as follows
119816119847119837119838119857 =120786120782 minus 120782
120788120782lowast 120783120783120782 = 120789120785 120785
Finally when a Grade 11 student earns a Mathematics scale score of 590 on the SAT the index
value for the score is 715 The calculation is performed as follows
119816119847119837119838119857 =120787120791120782 minus 120784120782120782
120788120782120782lowast 120783120783120782 = 120789120783 120787
Highest and Lowest Obtainable Scores and Range Tables Table 1
Smarter Balanced ELA and Mathematics
Highest (HOSS) and Lowest (LOSS) Obtainable Scale Scores and Range
Subject Grade LOSS HOSS RANGE Subject Grade LOSS HOSS RANGE
ELA
3 2114 2623 509
MATH
3 2189 2621 432
4 2131 2663 532 4 2204 2659 455
5 2201 2701 500 5 2219 2700 481
6 2210 2724 514 6 2235 2748 513
7 2258 2745 487 7 2250 2778 528
8 2288 2769 481 8 2265 2802 537
Connecticut State Department of Education Using Accountability Results to Guide Improvement March 2016 Revised February 2017
Page 57 of 67
Table 2 Connecticut Alternate Assessment (CTAA) ELA and Mathematics Highest (HOSS) and Lowest (LOSS) Obtainable Scale Scores and Range
Subject Grade LOSS HOSS RANGE
ELA amp
MATH
3 1200 1290 90
4 1200 1290 90
5 1200 1290 90
6 1200 1290 90
7 1200 1290 90
8 1200 1290 90
HS 1200 1290 90
Table 3
Connecticut Mastery Test (CMT) and Connecticut Academic Performance Test (CAPT) Science Highest (HOSS) and Lowest (LOSS) Obtainable Scale Scores and Range
Grade LOSS HOSS RANGE
5 100 400 300
8 100 400 300
HS 100 400 300
Table 4 Connecticut Mastery Test (CMT) and Connecticut Academic Performance Test (CAPT) Science Skills Checklist Highest (HORS) and Lowest (LORS) Obtainable Raw Scores and Range
Grade LORS HORS RANGE
5 0 60 60
8 0 48 48
HS 0 60 60
Connecticut State Department of Education Using Accountability Results to Guide Improvement March 2016 Revised February 2017
Page 58 of 67
Table 5 SAT Evidence-based Reading and Writing and Mathematics Highest (HOSS) and Lowest (LOSS) Obtainable Scale Scores and Range
LOSS HOSS RANGE
Evidence-Based Reading and Writing 200 800 600
Mathematics 200 800 600
HOW TO READ 2015-16 ACCOUNTABILITY REPORTS
The sample report below shows a districtrsquos performance on all indicators reported for the 2015-16 school year To support appropriate interpretation a brief explanation for every column heading is provided below the table
No Every indicator in the system is assigned a number When an indicator has subcomponents (eg All Students High Needs Students) a lettering system is used alongside the number
Indicator This column provides a brief explanation of what is being measured A full explanation of every indicator is included in the main section of this document (Using Accountability Results to Guide Improvement)
Connecticut State Department of Education Using Accountability Results to Guide Improvement March 2016 Revised February 2017
Page 60 of 67
IndexRate All components of indicator 1 are reported as performance indices All other indicators are reported as rates (ie percentages) The values presented in this column are the performance indices and rates earned by this district on the associated indicators
Target This value is the ultimate target established for all schools and districts statewide
Points Earned This value represents the points earned on the relevant indicator for the district In every case points are prorated based on the districtrsquos actual performance (ie index or rate) as compared to the target The rules used for prorating points for each of the indicators are explained in the main section of this document
Max Points This value is the maximum number of points possible on the associated indicator
Points Earned By indicator this column shows the percentage of the ldquomax pointsrdquo earned by this district
State Avg IndexRate The values presented in this column are the performance indices (Indicator 1) and rates earned by this district on the associated indicators
Many schools have one or more indicators that cannot be measured In these cases school reports will display ldquoNArdquo in the IndexRate field and there will be 0 in the Points Earned Max Points and Points Earned cells for those indicators The overall Accountability Index (in the district example above 776) is the percentage of total possible points earned on all available indicators Using the 2015-16 results all schools are classified into one of five categories The school-level Accountability Index is the primary factor used to determine placement with additional consideration given to participation rates achievement gaps and graduation rate gaps Note that the table above does not include Indicator 3 which is the participation rate for every subject for All Students and the High Needs group Participation data are reported in a separate table within the report
Connecticut State Department of Education Using Accountability Results to Guide Improvement March 2016 Revised February 2017
Page 61 of 67
The gap table below shows the ELA Math and Science index scores for High Needs students and Non-High Needs students in this district The size of the gap in index score points is reported and that difference is compared to the average gap across all districts statewide If the districtrsquos gap is more than one standard deviation beyond the state gap mean then the district is reported as having an ldquooutlier gaprdquo In the example below the size of the gaps in ELA Math and Science are all less than the standard used to identify outliers The same approach is used at the school level with the size of the gap compared to the average gap across all schools statewide Graduation rate gaps are determined in the same way The graduation rate gap is based on the difference in 6-year graduation rates for High Needs and Non-High Needs students As shown in the table below this district has a gap that is less than the standard used to identify graduation rate gap outliers While there are no points associated with the gap measures these data are used when placing schools in one of five categories Additionally schools are not eligible to be a School of Distinction if reports indicate that the school has an achievement gap or graduation rate gap this is considered an outlier
Connecticut State Department of Education Using Accountability Results to Guide Improvement March 2016 Revised February 2017
Page 62 of 67
The participation rate table below includes all of the data for Indicator 3 The expectation for all tested subjects across all tests (ie Smarter Balanced CTAA CMTCAPT Science CMTCAPT Skills Checklist Science and SAT) for All Students and High Needs students is at least 95 Any rate less than 95 means that the district or school did not meet participation requirements There are no points associated with Indicator 3 but like the gap indicators these data are used when placing schools in one of five categories Additionally schools are not eligible to be a School of Distinction if reports indicate that the school has not met participation requirements
Connecticut State Department of Education Using Accountability Results to Guide Improvement March 2016 Revised February 2017
Page 63 of 67
The bar chart below provides an at-a-glance view of the percentage of points earned on every indicator The bar at the top of the graphic is the Accountability Index representing the percentage of total possible points earned on all available indicators Please note that the subject-specific index scores are measured against a target of 75 The percentage of points earned is based on what percentage of the target is met Therefore the subject-specific percentages presented below are not index values Additionally it may be helpful for those sharing these reports to provide audiences with district or school context regarding how many students are represented in the All Students group and how many students are members of the High Needs group
Connecticut State Department of Education Using Accountability Results to Guide Improvement March 2016 Revised February 2017
Page 64 of 67
CONNECTICUT ASSESSMENT AND ACCOUNTABILITY REPORTING OF ldquoRECENTLY ARRIVEDrdquo
ENGLISH LEARNERS (ELS)
2014-15 School Year 2015-16 School Year and Beyond
Recently Arrived EL Definition
An EL enrolled for the first time in a US school for fewer than 12 calendar months at the time of testing
An EL enrolled for the first time in a US school for fewer than 24 calendar months at the time of testing
Assessment Participation Requirements
Recently arrived ELs MUST participate in mathematics and science and MAY be excused (ie exempt) from the English Language Arts (ELA) assessment
All ELs including all recently arrived ELs must participate in all assessments This includes mathematics ELA and science as well as the English language proficiency assessment
Assessment Reporting (typically in the summer months)
When 2014-15 results were released in September 2015 recently arrived ELs who may have taken ELA were not included in the results However when the agencyrsquos new portal EdSight is fully implemented recently arrived ELs will be included in all assessment results for schools and districts per federal law
Federal law requires that all ELs be included in assessment reporting regardless of time in a US school
Accountability ReportingmdashAchievement Status
Recently arrived ELs were not included in any of the Achievement Status (Indicator 1) calculations
Scores earned by recently arrived ELs are not included in Achievement Status (Indicator 1) calculations
Accountability ReportingmdashAchievement Growth
Measuring growth is not possible based only on 2014-15 data because this was the first administration of the operational Smarter Balanced assessment
Recently arrived ELs who have participated in two Smarter Balanced administrations are included in growth calculations (Indicator 2)
Accountability ReportingmdashParticipation Rates
Recently arrived ELs are not included in ELA participation rates because their participation was not a requirement However they are included in math and science rates
All students are included in participation rate calculations for all subjects
Note regarding EL subgroup reporting When reviewing accountability reports and exploring subgroup results for English learners in particular keep in mind the ldquoEL Flexrdquo group for accountability EL Flex includes students who were formerly identified as an EL Specifically any student who is not an EL at the time of testing but who had been a member of the EL subgroup in any time up to two years previous are included in the EL flexibility subgroup For Indicator 1 calculations this means that previous subgroup status is determined by using the EL PSIS collection variable from October January and June of the current and two prior school years If the student was identified as EL in any of those collections the student is included as an EL in Indicator 1 calculations
ASSIGNING SCHOOL CATEGORIES
As required under Connecticut General Statutes Section 10-223e Connecticut has implemented a five category school classification system In 2015-16 CSDE identified schools in Category 4 and Category 5 Category 4 schools were newly identified Turnaround and Focus Schools and Category 5 schools were Turnaround and Focus schools that had not exited since initial identification in 2012 For a full explanation of the Turnaround and Focus School designations made in 2015-16 please see Schools Identified for Targeted Intervention and Support (Turnaround and Focus) In 2016-17 CSDE is not making any changes to Category 4 and 5 schools but is identifying all other schools as Category 1 Category 2 or Category 3 To begin the school classification process the following schools must be removed from the data file
Unified School District 1
Detention Centers and
Schools with 100 or fewer possible points The next step is to identify every school as either elementarymiddle or high school Any school that serves Grade 9 or above is a high school All other schools are considered elementarymiddle for this purpose Elementarymiddle and high schools are sorted separately from highest to lowest based on the Accountability Index
Schools in the top quartile based on the Accountability Index are preliminarily placed in Category 1
Schools in the middle two quartiles are preliminarily placed in Category 2
Schools in the bottom quartile based on the Accountability Index are placed in Category 3
Further review of Category 1 and Category 2 schools is necessary Any Category 1 or Category 2 school is lowered a category if one or more of the following are true
ndash an outlier achievement gap in ELA Math or Science ndash an outlier graduation rate gap based on the six-year graduation rate or ndash an assessment participation rate below 95 in any subject for All Students or
High Needs students
Finally schools that were identified as Category 4 and 5 schools in March 2016 maintain their category assignment regardless of their quartile position
Connecticut State Department of Education Using Accountability Results to Guide Improvement March 2016 Revised February 2017
Page 66 of 67
IDENTIFYING SCHOOLS OF DISTINCTION 2015-16
Annually the CSDE identifies a group of schools as Schools of Distinction based on a variety of factors In 2015-16 the identification centered on overall performance growth and change in overall performance from 2014-15 to 2015-16 The guidelines for each distinction type are included below HIGHEST PERFORMING Elementarymiddle and high schools are evaluated separately for the Highest Performing distinction For each school type the full list of Category 1-5 schools is sorted based on the Accountability Index from highest to lowest The top 10 become eligible for distinction status However all eligible schools must NOT have any of the following if the school is to be named a School of Distinction
bull an outlier achievement gap based on the difference in index scores between the High Needs subgroup and the non-High Needs group in ELA Math or Science
bull an outlier graduation rate gap based on the six-year graduation rate difference between the High Needs subgroup and the Non-High Needs group
bull an assessment participation rate below 95 for the All Students group or the High Needs subgroup in Math ELA or Science or
bull Category 4 or 5 status HIGHEST GROWTH Schools with Indicator 2 (academic growth) values are evaluated separately from schools without Indicator 2 For schools with Indicator 2 values there are two distinction types Highest Growth for All Students and Highest Growth for High Needs Students In both cases (All Students and High Needs) the percentage of possible points earned across ELA and Mathematics must be calculated separately for All Students and High Needs students respectively Schools are then sorted based on the percentage of possible points earned from highest to lowest
ndash All Students Schools in the top 10 of percentage of possible points earned across indicator 2 (academic growth) for the All Students group are eligible for a highest growth distinction
ndash High Needs Students Schools in the top 10 of percentage of possible points earned across indicator 2 (academic growth) for the High Needs students group are eligible for a highest growth distinction
The schools flagged as eligible for one or more distinctions in the highest growth category must NOT have any of the following if the school is to be named a School of Distinction
Connecticut State Department of Education Using Accountability Results to Guide Improvement March 2016 Revised February 2017
Page 67 of 67
bull an outlier achievement gap based on the difference in index scores between the High Needs subgroup and the non-High Needs group in ELA Math or Science
bull an outlier graduation rate gap based on the six-year graduation rate difference between the High Needs subgroup and the Non-High Needs group
bull an assessment participation rate in 2014-15 or 2015-16 below 95 for the All Students group or the High Needs subgroup in Math ELA or Science or
bull Category 4 or 5 status
Schools without Indicator 2 (academic growth) are eligible for distinction in the ldquoGreatest Improversrdquo category These schools have shown the greatest percentage improvement in their Accountability Index Percentage improvement is calculated for every school by subtracting the 2014-15 Accountability Index from the 2015-16 Accountability Index and dividing the difference by the 2014-15 Accountability Index Then every school is sorted from highest to lowest based on the percentage improvement in Accountability Index
ndash Greatest Improvers Schools in the top 10 of percentage improvement in
Accountability Index are eligible for the Greatest Improver distinction The schools flagged as eligible for this distinction category must NOT have any of the following if the school is to be named a School of Distinction
bull an outlier achievement gap in 2014-15 or 2015-16 based on the difference in index scores between the High Needs subgroup and the non-High Needs group in ELA Math or Science
bull an outlier graduation rate gap in 2014-15 (2012 cohort) or 2015-16 (2013 cohort) based on the six-year graduation rate difference between the High Needs subgroup and the Non-High Needs group
bull an assessment participation rate in 2014-15 or 2015-16 below 95 for the All Students group or the High Needs subgroup in Math ELA or Science or
bull Category 4 or 5 status

Connecticut State Department of Education Using Accountability Results to Guide Improvement March 2016 Revised February 2017
Page 18 of 67
The National PTA has created a range of free online resources that can be customized for local use to help parents understand the purpose and stakes associated with state assessments including Smarter Balanced The organization effectively describes the relationship between content standards for local curricula and the summative assessment through a variety of short videos and parent guides In an effort to encourage schools to sponsor informational events for families the National PTA has created a Parent Assessment Event Toolkit The toolkit includes a facilitatorrsquos guide presentation templates anticipated questions suggested take-home tools for parents in Spanish and English and sample announcements To access the toolkit and other resources visit httpwwwptaorgadvocacycontentcfmItemNumber=4311ampnavItemNumber=4610 Achieve the Core offers resources you can use to speak to parents and community members about the new standards The site offers guides documents and parent videos httpachievethecoreorgpage2736talking-with-parents
Where can I get more information
QUESTIONS CSDE CONTACTS
Strategies for Ensuring Assessment Participation Abe Krisst Phone 860-713-6894 Email abekrisstctgov
Rate Calculations Diane Murphy Phone 860-713-6891 Email dianemurphyctgov
Connecticut State Department of Education Using Accountability Results to Guide Improvement March 2016 Revised February 2017
Page 19 of 67
INDICATOR 4 CHRONIC ABSENTEEISM
Indicator Max Points ndash All Years
Percentage of students chronically absent bull All Students bull Students in High Needs Subgroup
50 50
Description (What) A districtschoolsubgroup chronic absenteeism rate is the percentage of students missing ten percent or greater of the total number of days enrolled in the school year for any reason It includes both excused and unexcused absences For example children who are enrolled for the full school year (eg 180 days) become chronically absent if they miss at least 18 days of school for any reason Because aggregate schooldistrict-wide attendance rates can mask the extent of individual absenteeism chronic absenteeism is a better indicator of student attendance
Rationale (Why) Students need to attend school daily to succeed and data must guide local efforts to improve student attendance In 2015-16 96 of all students statewide were chronically absent Great disparities exist in chronic absenteeism rates among student subgroups For example the 2015-16 chronic absenteeism rate for students eligible for free lunch (177) was more than three times that of their peers who were not eligible for lunch subsidies (53) In the same year 181 of students with disabilities were chronically absent while 83 of their non-disabled peers were identified as chronically absent Regardless of subgroup membership national reportsresearch as well as state level data analyses highlight the association of chronic absenteeism to student academic achievement and high school graduation
Applicability (Who) The chronic absenteeism indicator is applicable to all districts and schools with at least one grade between K and 12 inclusive InputFeedback This indicator has gained increasing acceptance statewide Many districts and schools have begun to track and monitor chronic absenteeism voluntarily The Connecticut legislature has established a Strategic Action Group around this issue that is serving as a centralizing force for disseminating promising new practices promoting communication and collaboration among critical state agency and community-based partners and reporting to the legislature on statewide progress The CSDErsquos districtschool turnaround initiatives (Alliance District program and Commissionerrsquos Network) incorporate chronic absenteeism as an important indicator Methodology (How) Points will be earned for the All Students group and the High Needs subgroup based on the percentage of students who are chronically absent It is important to weight subgroup absenteeism rates separately because disparities in chronic absenteeism rates
Connecticut State Department of Education Using Accountability Results to Guide Improvement March 2016 Revised February 2017
Page 20 of 67
among student subgroups exist in a vast majority of districtsschools throughout the state The CSDErsquos expectation is that no districtschool will have a chronic absenteeism rate that is greater than 5 therefore full points will be awarded if the chronic absenteeism rate is 5 or lower Conversely no points will be awarded if the chronic absenteeism rate is 30 or greater To recognize incremental improvement in the reduction of chronic absenteeism rates between 30 and 5 will be awarded proportional points
The following formula is used to convert the chronic absenteeism rate into points
(30 minus 119862ℎ119903119900119899119894119888 119860119887119904119890119899119905119890119890119894119904119898 119877119886119905119890)
25 119909 50
For example a school with an ldquoall studentsrdquo chronic absenteeism rate of 15 would earn 30 of the possible 50 points for the ldquoall studentsrdquo component of Indicator 4 The calculation is as follows
(30 minus 15)
25 119909 50
= 15
25 119909 50 =
3
5 119909 50 = 30 119901119900119894119899119905119904
Connecticut State Department of Education Using Accountability Results to Guide Improvement March 2016 Revised February 2017
Page 21 of 67
Data Source June PSIS
RESOURCES FOR IMPROVING ATTENDANCE
Connecticut State Department of Education staff have assembled a collection of timely and relevant resources focused on understanding potential causes of chronic absenteeism the impact of loss instructional time and practical approaches to ensuring that students are attending school ready to learn To access the resources visit the CSDE website and click on the Chronic Absenteeism link on the homepage Other resources include
The Governorrsquos Prevention Partnership (GPP) supports schools and businesses as well as community and faith-based organizations in ensuring that children are in safe quality mentoring relationships Quality mentoring programs can be an effective intervention for reducing chronic absenteeism The staff at GPP can provide technical assistance and support to districts and schools to establish quality mentoring programs httpwwwpreventionworksctorgwhatmentoring
Guidelines for Implementation of the Definitions of Excused and Unexcused Absences and Best Practices for Absence Prevention and Intervention Connecticut State Department of Education httpwwwsdectgovsdelibsdepdfpublicationsguidelines_excused_and_unexcused_absencespdf
CSDE Family and Community Engagement Resources httpwwwsdectgovsdetaxonomyv4_taxonomyaspDLN=45424ampsdeNav=|45424|ampsdePNavCtr=|45493|45493
Connecticutrsquos Medical Home Initiative for Children and Youth with Special Health Care Needs (CYSHCN) Students identified with special health care needs may have or are at increased risk for a chronic physical developmental behavioral or emotional condition and require health and related services beyond that required for children in general Assistance for the family and the student is available by contacting CYSHCN httpwwwctgovdphcwpviewaspa=3138ampQ=387702ampPM=1
Collaborative Approaches to Reducing Absenteeism among K-12 Students Policy Fact Sheet John W Gardner Center for Youth and Communities This policy brief provides suggestions for engaging and collaborating with diverse stakeholders to reduce truancy and chronic absenteeism Examples of community wide attendance campaigns are provided John W Gardner Center for Youth and Their Communities (2012 April) httpjgcstanfordeduresourcespolicy_fact_sheetsAbsence_Interventions_PFSpdf
Connecticut State Department of Education Using Accountability Results to Guide Improvement March 2016 Revised February 2017
Page 22 of 67
2016 Chronic Absenteeism Report The Chief Education Office (CEdO) commissioned this report on chronic absenteeism in Oregon schools to better understand the problem in general to specifically hear from students and families most likely to be chronically absent and to present recommendations for the State of Oregon and local communities The report contains helpful information about issues related to chronic absenteeism among students with disabilities httpeducationoregongovportfolio2016-chronic-absenteeism-report-2
Get Schooled httpjgcstanfordeduresourcespolicy_fact_sheetsAbsence_Interventions_PFSpdf The organization uses a digital platform gamification and a recipe it calls lsquosizzle and substancersquo to inspire and engage students Students set up personal accounts and have access to important information and motivation to attend school httpsgetschooledcomdashboardq=attendance
The National Mentoring Partnerships provides resources for implementing a mentor program and research-based evidence of the power of mentoring on improving absenteeism improving attitudes toward school and likelihood of enrolling in college httpwwwmentoringorg
Attendance Works is a national and state initiative that promotes awareness of the important role that school attendance plays in achieving academic success The Director of Attendance Works Hedy Chang and Johns Hopkins researcher Robert Balfanz are considered two of the nationrsquos experts on absenteeism and strategies that work In collaboration with partners they have published many reports that include success stories from schools around the country The three titles below are examples of materials available through wwwattendanceworksorg
o Balfanz Robert and Byrnes Vaughan (2013) Meeting the Challenge of
Combating Chronic Absenteeism Everyone Graduates Center Johns Hopkins University School of Education This report examines the impact of New York City Mayor Michael Bloombergrsquos task force on truancy chronic absenteeism and school engagement a program that spanned 2010 to 2013 and reached more than 60000 students in NYC public schools The study found that students who missed at least 20 days of school per year mdash the definition of chronic absenteeism mdash had lower grades and were more likely to drop out than students with better attendance Yet the researchers also found these effects of absenteeism are reversible with the help of mentors incentive programs and awareness campaigns httpwwwattendanceworksorgwordpresswp-contentuploads201401NYC-Chronic-Absenteeism-Impact-Report-Nov-2013pdf
Connecticut State Department of Education Using Accountability Results to Guide Improvement March 2016 Revised February 2017
Page 23 of 67
o Balfanz Robert and Byrnes Vaughan (2012) The Importance of Being in School A Report on Absenteeism in the Nationrsquos Public Schools Johns Hopkins University Center for Social Organization of Schools This report analyzes data on chronic absenteeism at the state level to begin the process of mapping its extent and characteristics Although currently only a handful of states collect data on chronic absenteeism results from a sample of states suggest that an estimated 10-15 of students in the US are chronically absent each year The report also highlights some promising practices among cities school districts and nonprofits to combat chronic absenteeism The authors offer policy recommendations on tracking and reporting chronic absence data and evidence-based interventions httpnewevery1graduatesorgwp-contentuploads201205FINALChronicAbsenteeismReport_May16pdf
o Ginsburg Alan Phyllis Jordan and Hedy Chang (2014) Absences Add Up How
School Attendance Influences Student Success Attendance Works August 2014 This state-by-state analysis of national testing data demonstrates that students who miss more school than their peers consistently score lower on standardized tests a result that holds true at every age in every demographic group and in every state and city tested The analysis is based on the results of the 2013 National Assessment of Educational Progress (NAEP) It compares attendance rates and NAEP scores for every state and for 21 large urban areas httpwwwattendanceworksorgwordpresswp-contentuploads201409Absenses-Add-Up_September-3rd-2014pdf
Attendance Works has developed a range of resources specific to grades served (ie elementary middle secondary) and aligned to five important strategies designed to improve attendance recognizing good and improved attendance engaging students and parents monitoring attendance data and practice providing personalized early outreach and developing programmatic responses to barriers A few examples include o Leading Attendance A Toolkit for Principals
httpwwwattendanceworksorgtoolsschoolsprincipals
o Teaching Attendance Everyday Strategies to Help Teachers Improve Attendance and Raise Achievement
httpwwwattendanceworksorgtoolsschoolsteaching-attendance-toolkit
o Bringing Attendance Home Engaging Parents in Preventing Chronic Absence httpwwwattendanceworksorgtoolsfor-parentsbringing-attendance-home-toolkit
o Relationships Matter A Toolkit for An Elementary Success Mentor Attendance Initiative
httpwwwattendanceworksorgtoolsfor-school-districtselemsuccessmentortoolkit
Connecticut State Department of Education Using Accountability Results to Guide Improvement March 2016 Revised February 2017
Page 24 of 67
Where can I get more information
QUESTIONS CSDE CONTACTS
Resources Strategies and Best Practices Kari Sullivan Phone 860-807-2041 Email karisullivanctgov
Data Collection and Reporting Marquelle Middleton Phone 860-713-6877 Email marquellemiddletonctgov
Connecticut State Department of Education Using Accountability Results to Guide Improvement March 2016 Revised February 2017
Page 25 of 67
INDICATOR 5 PREPARATION FOR POSTSECONDARY AND
CAREER READINESS ndash COURSEWORK
Indicator Max Points ndash All Years
Percentage of students in grades 11 amp 12 participating in at least one of the following during high school Two courses in APIBdual enrollment or Two courses in one of seventeen CTE categories or Two workplace experience ldquocoursesrdquo in any area
50
Description (What) This is an access metric It evaluates whether students in grades 11 and 12 have participated in coursework during high school that prepares them for success in college andor careers In recognition of the diverse pathways of our students credit is awarded if students pursue traditional college-preparatory courses (eg Advanced Placement International Baccalaureate) career-technical education courses or workplace experienceinternship opportunities Students in Grade 12 include students with disabilities who are 18 to 21 years of age and are receiving transition only services These students are engaged in workplace experience and will contribute positively to a schoolrsquos Indicator 5 calculation Rationale (Why) Students cannot be expected to demonstrate success in college and careers if they arenrsquot receiving the requisite preparation Applicability (Who) This indicator is applicable to all districts and schools that offer grades 11 andor 12 InputFeedback The primary feedback to this indicator has been that the system should be inclusive to recognize opportunities beyond APIB that may be offered by districts For example many districts have partnerships with in-state collegesuniversities (eg UCONNrsquos Early College Experience program) that enable students to take college courses in high school and earn both high school and college credit In response to this suggestion the CSDE modified its data collection to begin collecting information about dual enrollment courses Methodology (How) Points will be awarded to the All Students group based on the percentage of 11th and 12th graders who meet the specified coursework participation thresholds Points will be prorated based on the percentage of the ultimate target (75) achieved
Connecticut State Department of Education Using Accountability Results to Guide Improvement March 2016 Revised February 2017
Page 26 of 67
Calculation Steps
1 Start with June Collection to determine 11th and 12th graders and their facility1codes Pull in certified TCS records from Fall of Years 2011 2012 2013 and 2014 for SASIDs with the same facility1code as in PSIS June Collection
2 APIB courses are flagged by the NCES course name Dual enrollment courses are
flagged by having a dual enrollment code The APIBDual Enrollment flags are all summed by SASID and facility1code SASID and facility1code combinations whose flags sum to gt=2 receive credit for Indicator 5
a NCES Course Names and Codes can be viewed under the ldquoSecondary School Course Classification Systemrdquo Header on the TCS help site httpwwwcsdestatectuspublictcsdownloadsasp
b More information regarding Dual Enrollment Codes are available on page 15-16 of the TCS User Guide httpwwwcsdestatectuspublictcsdownloadsasp
3 Workplace Experience courses are flagged by the NCES course name The Workplace
Experience flags are summed by SASID and facility1code SASID and facility1code combinations whose flags sum to gt=2 receive credit for Indicator 5
a NCES Course Names and Codes can be viewed under the ldquoSecondary School Course Classification Systemrdquo Header on the TCS help site httpwwwcsdestatectuspublictcsdownloadsasp
b In addition students with disabilities who are receiving transition services only (18-21 years of age) and engaged in Workplace Experience as indicated by exception code 02 will also be included as having met this indicator
4 CTE courses are identified into 1 or more cluster by NCES There are 17 clusters Each
cluster has a unique flag Each unique CTE flag is summed by SASID and facility1code If the sum of the unique CTE flag is gt=2 in any cluster then the student receives credit for Indicator 5
a Career Technical Education Course Codes amp Clusters can be viewed under the ldquoSecondary School Course Classification Systemrdquo Header on the TCS help site httpwwwcsdestatectuspublictcsdownloadsasp
5 The unique count of SASIDs and facility1codes receiving credit for Indicator 5 is summed
by facility1code to determine the school-level numerator for indicator 5
6 Students identified as meeting Indicator 5 in any of steps 2-4 are summed by their reporting district to determine the district-level numerator for indicator 5
Data Source June PSIS (to establish 11th and 12th graders) and Teacher Course Student (for course participation)
Connecticut State Department of Education Using Accountability Results to Guide Improvement March 2016 Revised February 2017
Page 27 of 67
INDICATOR 6 PREPARATION FOR POSTSECONDARY AND
CAREER READINESS - EXAMS
Indicator Max Points ndash All Years
Percentage of students in grades 11 amp 12 achieving CCR benchmark on at least one of the following Smarter Balanced 11th or SAT or ACT or AP or IB
50
Description (What) This metric evaluates whether students in grades 11 and 12 have attained benchmark scores on at least one of the most prevalent collegecareer readiness exams Rationale (Why) In addition to looking at ldquoaccessrdquo (ie indicator 5) it is also important to evaluate ldquoperformancerdquo In recognition of the exam options available to students this metric recognizes attainment of the benchmark score in any of those options Applicability (Who) This indicator is applicable to all districts and schools that offer grades 11 andor 12 InputFeedback As with coursework the primary feedback to this indicator has been that the system should be inclusive and recognize that students may demonstrate collegecareer readiness through different exam options Methodology (How) Points will be awarded to the All Students group based on the percentage of 11th and 12th graders who meet the following benchmark scores on the respective exams
Grade 11 Smarter Balanced ndash Level 3 or higher on both ELA and Math or
SAT (until January 2016) ndash composite score of 1550 or higher on the old SAT or
SAT (effective March 2016) ndash Evidence-Based Reading and Writing score of at least 480 and a Math score of at least 530 on the Redesigned SAT or
ACT ndash meeting benchmark on 3 of 4 exams (benchmark varies based on subject) or
AP ndash 3 or higher on an AP exam or
IB ndash 4 or higher on an IB exam Points will be prorated based on the percentage of the ultimate target (75) achieved Data Source June PSIS (to establish 11th and 12th graders) SATAP from College Board ACT from ACT Inc IB from International Baccalaureate Organization and Smarter Balanced from state assessment data files
Connecticut State Department of Education Using Accountability Results to Guide Improvement March 2016 Revised February 2017
Page 28 of 67
RESOURCES TO PREPARE STUDENTS FOR POSTSECONDARY
SUCCESS
This accountability system values increasing student access to rigorous coursework while striking a balance with outcomes based on a variety of nationally recognized assessments Research shows that students who enroll in challenging coursework in high school are more likely to graduate and are better positioned for success in college (Achieve 2015) It acknowledges that challenging coursework can take many forms including dual enrollment CTE coursework and workplace experience Teachers and school counselors play a critical role in helping students to select appropriate coursework to meet student needs and provide an appropriate level of challenge Schools that administer the PSAT to all students also have access to the College Boardrsquos AP Potential tool AP Potential is a free web-based tool that allows schools to identify all students with a high probability of success in an AP course based on PSAT performance In 2013-14 the Connecticut State Department of Education began the practice of annually notifying students who demonstrate AP potential and encouraging them to consider enrolling in challenging courses such as AP dual enrollment or IB courses The AP Potential tool provides school personnel with another resource that can be used to remove barriers and invite more students of all backgrounds to participate in college-aligned coursework Additional information about the tool and guidelines for proper use are available here httpsappotentialcollegeboardorgappwelcomedo Increasingly districts are realizing the value of high-quality CTE programs of study Research shows a strong positive relationship between participation in CTE and other measures of academic achievement Additionally the applied nature of CTE is appealing to students keeping them motivated and engaged in their learning The National Association of State Directors of Career Technical Education Consortium (NASDCTEc) has collected information about program designs that work in different community types throughout the country To review ldquoeffective modelsrdquo visit httpcareertechorgpapers-effective-models
Career Technical Education Programs Engaging and rigorous career-technical
education programs that focus on providing industry certifications and dual credit
opportunities for CTE completers For more information and resources for quality
career-technical programs in high school see
CSDE CTE webpage
httpwwwsdectgovsdecwpviewaspa=2678ampq=320802
CSDE CT Core Standards website CTE page
httpctcorestandardsorgpage_id=1336
Association for Career and Technical Education The National Research
Center for Career and Technical Education at SREB httpwwwnrccteorg
Connecticut State Department of Education Using Accountability Results to Guide Improvement March 2016 Revised February 2017
Page 29 of 67
Southern Regional Education Boardrsquos High Schools that Work and Advanced Careers httpwwwsreborgpage1608Advanced_Careerhtml
Where can I get more information
QUESTIONS CSDE CONTACTS
Resources Strategies and Best Practices related to College Board products including PSAT SAT and AP
Michelle Rosado Phone 860-713-6748 Email michellerosadoctgov
Resources Strategies and Best Practices for CTE and Dual Enrollment
Suzanne Loud Phone 860-713-6748 Email suzanneloudctgov
Resources Strategies and Best Practices for Work-Based Learning
Harold Mackin Phone 860-713-6779 Email haroldmackinctgov
Resources Strategies and Best Practices for Supporting Students with Disabilities Receiving Transition Only Services
Patricia Anderson Phone 860-713-6923 Email patriciaandersonctgov
Data Collection and Reporting for Coursework (Indicator 5)
Keryn Felder Phone 860-713-6833 Email kerynfelderctgov
Data Collection and Reporting for Exams (Indicator 6) Charles Martie Phone 860-713-6809 Email charlesmartiectgov
Connecticut State Department of Education Using Accountability Results to Guide Improvement March 2016 Revised February 2017
Page 30 of 67
INDICATOR 7 GRADUATION - ON-TRACK IN 9TH GRADE
Indicator Max Points ndash All Years
Percentage of 9th graders earning at least five full-year credits in the year and no more than one failing grade in English Mathematics Science or Social Studies
50
Description (What) For 2014-15 and 2015-16 this indicator calculates the percentage of 9th graders earning at least five full-year credits in the year In the future CSDE will consider adding the criteria that there be no more than one failing grade in English Mathematics Science or Social Studies in the school year Rationale (Why) Ninth grade is a critical year The University of Chicagorsquos Consortium on Chicago School Research ldquoidentifies students as on-track if they earn at least five full-year course credits and no more than one semester F in a core course in their first year of high school On-track students are more than three and one-half times more likely to graduate from high school in four years than off-track students The indicator is a more accurate predictor of graduation than studentsrsquo previous achievement test scores or their background characteristicsrdquo Applicability (Who) This indicator is applicable to all districts and schools that offer grade 9 It will also be applied to districtsschools where grade 8 is the terminal grade in order to serve as an indicator of how well the middle school is preparing students for success in the first year of high school InputFeedback Some questioned if the five credits in grade 9 represents being on-track since the total credits required to graduate in many high schools exceed the state minimum of 20 Others suggested course passage instead of credit accumulation Some administrators of K-8 schools districts were also concerned that this metric was holding them accountable for student success in an educational system outside their own Methodology (How) The total number of students in 9th grade who earn at least five full year credits is expressed as a percentage of all 9th graders The ultimate target for this indicator is 94 (same as that for the four-year cohort graduation rate) Points will be prorated based on the percentage of the ultimate target achieved Data Source June PSIS (to establish current year 9th graders and prior year 8th graders) and Teacher Course Student (for credit data)
Connecticut State Department of Education Using Accountability Results to Guide Improvement March 2016 Revised February 2017
Page 31 of 67
RESOURCES FOR KEEPING STUDENTS ON-TRACK TO GRADUATION
The on-track definition used by the University of Chicagorsquos Consortium on Chicago School Research has been adopted and customized in districts across the nation State accountability system indicators are always lagging indicators but at the local level districts and schools have the opportunity to track and respond to relevant data quickly before serious problems emerge and on-time graduation for a student is compromised The Consortium in partnership with the Network for College Success have conducted extensive research about the importance of Grade 9 and identified factors that predict the likelihood of graduation The on-track rate in Chicago Public Schools has risen from 57 percent for the Class of 2008 to 84 percent for the Class of 2018 The To amp Through Project website includes videos recorded webinars and targeted reports focused on helping first-generation college students and high needs stay on-track to graduation All resources can be accessed here httpstoandthroughuchicagoedu With an increased focus on student success in Grade 9 many high schools have developed early warning systems (EWS) to identify at-risk students The National High School Center funded through a grant from the US Department of Education developed a free online EWS tool using Excel that can be downloaded and customized to meet a schoolrsquos needs Using timely and accurate local data school personnel can identify patterns and address potential problems proactively In addition to the EWS designed for high schools there is a middle school tool available Both resources and supporting documentation are available through the College and Career Readiness Center at American Institutes for Research here httpwwwearlywarningsystemsorgtools-supports While this indicator focuses on credits and grades earned by a student the on-track indicator is closely linked to Indicator 4 Chronic Absenteeism The Chicago research and the EWS tools acknowledge the importance of attendance in Grade 8 and Grade 9 as predictors of success in high school and recommend monitoring attendance and other ldquowarning signalsrdquo students provide to us as part of a comprehensive approach to keeping students on-track
The Everyone Graduates Center a research program of Johns Hopkins University is committed to studying the dropout problem by identifying barriers and developing tools and models that states communities districts and schools can use to support all students through high school graduation Visit the Analytics section of their website to learn more about identifying students who are sending ldquowarning signalsrdquo and improving data-based decision making and actions httpnewevery1graduatesorganalyticson-and-off-track-indicators
Evidence Based Resources for Keeping Students on Track to Graduation George Washington University Center for Equity and Excellence in Education (January 2012)
Connecticut State Department of Education Using Accountability Results to Guide Improvement March 2016 Revised February 2017
Page 32 of 67
Provides resources for school wide targeted and intensive interventions designed to address attendance behavior and course failure httpwwwdoevirginiagovsupportschool_improvementtitle11003_gresourcesevidence_based_resourcespdf
MTSS is an evidence-based framework that uses data-based problem-solving to integrate academic and behavioral instruction and intervention The integrated instruction and intervention is delivered to students in varying intensities (multiple tiers) based on student need MTSS addresses the needs of the whole child to remove non-academic barriers to academic achievement and ensure that students achieve their full potential To learn more about MTSS visit httpwwwrtinetworkorgessentialtieredinstructiontier1accurate-decision-making-within-a-multi-tier-system-of-supports-critical-areas-in-tier-1
National Mentoring Partnerships provides resources for implementing a mentor program and research-based evidence of the power of mentoring on reducing absenteeism improving attitudes toward school preventing the start of risk-taking behavior and increasing the likelihood of enrolling in college httpwwwmentoringorg
o The Governorrsquos Prevention Partnership Youth Mentoring Program Through a
partnership with MENTORNational Mentoring Partnership this Connecticut program partners with schools businesses community and faith-based organizations to ensure that children are involved in safe quality mentoring relationships httpwwwpreventionworksctorgwhatmentoringintroductionhtml
Poliner Rachel A and Lieber Carol Miller (2004) The Advisory Guide Designing and Implementing Effective Advisory Programs in Secondary Schools Educators for Social Responsibility ISBN-10 0942349016 How to design and implement an advisory program focused on building community and promoting academic success social-emotional learning and postsecondary planning
Career-Themed Smaller Learning Communities Nonprofit organizations can assist schools by providing research-based best practices including but not limited to
Southern Regional Education Boardrsquos High Schools That Work Making Middle Grades Work and Technology Centers that Work
Regional Educational Laboratory Program httpsiesedgovnceeedlabs
Northeast College and Career Readiness Research Alliance httpwwwrelneiorgresearch-alliancescollege-and-career-readinesshtml
National Career Academies Network
Connecticut State Department of Education Using Accountability Results to Guide Improvement March 2016 Revised February 2017
Page 33 of 67
Talent Development Secondary
httpwwwtdschoolsorg
Buck Institute for Education Engaging students in authentic project-based learning Assists teachers in developing engaging project-based learning and assisting schools in creating a project-based learning school-wide effort httpbieorg
Connecticutrsquos Guidelines for Mastery-Based Learning httpwwwsdectgovsdelibsdepdfmblmastery_based_learning_guidelinespdf
The Collaborative for Academic Social and Emotional Learning (CASEL) advances the practice of promoting integrated academic social and emotional learning for all children in preschool through high school httpwwwcaselorg
Career Technical Education Programs Engaging and rigorous career-technical education programs that focus on providing industry certifications and dual credit opportunities for CTE completers For more information and resources for quality career-technical programs in high school see
CSDE CTE webpage httpwwwsdectgovsdecwpviewaspa=2678ampq=320802
CSDE CT Core Standards website CTE page httpctcorestandardsorgpage_id=1336
Association for Career and Technical Education The National Research Center for Career and Technical Education at SREB httpwwwnrccteorg
Southern Regional Education Boardrsquos High Schools that Work and Advanced Careers httpwwwsreborgpage1608Advanced_Careerhtml
Practice Guide Dropout Prevention Institute of Education Sciences (IES) (September 2008) This guide provides recommendations that focus on reducing high school dropout rates httpwwwiesedgovnceewwcpdfpractice_guidesdp_pg_090308pdf
Where can I get more information
QUESTIONS CSDE CONTACTS
Resources Strategies and Best Practices Kimberly Traverso Phone 860-807-2057 Email kimberlytraversoctgov
Data Collection and Reporting Keryn Felder Phone 860-713-6833 Email kerynfelderctgov
Connecticut State Department of Education Using Accountability Results to Guide Improvement March 2016 Revised February 2017
Page 34 of 67
INDICATOR 8 GRADUATION ndash FOUR YEAR ADJUSTED COHORT
GRADUATION RATE ndash ALL STUDENTS
Indicator Max Points ndash All Years
Percentage of first time 9th graders who graduate with a regular high school diploma in four years or less ndash All Students
100
Description (What) The four year adjusted cohort graduation rate represents the percentage of first time 9th graders who graduate with a regular high school diploma in four years or less It is based on the nationally consistent method defined in 34 CFR sect 20019 (73 FR 64508 (Oct 29 2008)) Rationale (Why) Graduating from high school is an important milestone in a studentrsquos education The inclusion of the specific four-year adjusted cohort graduation rate is a requirement of ESEA Flexibility Applicability (Who) This indicator is applicable to all districts and schools that offer at least one grade between 9 and 12 inclusive InputFeedback Among all the indicators in the accountability model this is one that continues to irk many districtschool leaders While a vast majority of students do graduate in four years practitioners adamantly (and one might say rightly) contend that some students (eg English learners who newly arrive in the country in middlehigh school low income students who may need to work part-time to support their family some students with disabilites) benefit from having an extra year or two to complete high school consequently they claim it is unfair that these non-graduates are counted as a ldquofailurerdquo in the four-year rate which has become the ldquode-facto graduation raterdquo Methodology (How) The four-year adjusted cohort graduation rate is based on the nationally consistent method as defined in 34 CFR sect 20019 (73 FR 64508 (Oct 29 2008)) The ultimate target for all students remains at 94 Districtsschools can earn up to 100 points based on the pro-rated percentage of the ultimate target (94) achieved by All Students For example a school with a graduation rate of 846 (ie 90 of the ultimate target of 94) will earn 90 out of 100 points Data Source PSIS Registration and Collection
Connecticut State Department of Education Using Accountability Results to Guide Improvement March 2016 Revised February 2017
Page 35 of 67
INDICATOR 9 GRADUATION ndash SIX YEAR ADJUSTED COHORT
GRADUATION RATE ndash HIGH NEEDS
Indicator Max Points ndash All Years
Percentage of first time 9th graders who graduate with a regular high school diploma in six years or less ndash High Needs Subgroup
100
Description (What) The six-year adjusted cohort graduation rate represents the percentage of first time 9th graders who graduate with a regular high school diploma in six years or less It is based on the nationally consistent method defined in 34 CFR sect 20019 (73 FR 64508 (Oct 29 2008)) Rationale (Why) For a variety of reasons some students (eg English learners who newly arrive in the country in middlehigh school low income students who may need to work part-time to support their family student with disabilities who need additional ldquotransition only servicesrdquo to facilitate the transition from school to adult life) benefit from having an extra year or two to complete high school Unlike in the four-year rate the graduation accomplishment of these students can be counted as a success in the six year rate The results below for the 2012 cohort illustrate why the six-year is a more fair and complete reflection of the successes of all students and subgroups
Four- Five- and Six-year Graduation Rates for the 2013 Graduation Cohort
Category 4-Year Rate
5-Year Rate
6-year Rate
All Students 855 879 887
English Learner 638 710 723
Special Education 647 710 754
Eligible for Free Meals 686 733 744
High Needs 724 770 786
Male 824 857 866
Female 887 904 909
Hispanic 702 746 758
Indian or Alaska Native 818 848 848
Asian 932 956 961
Black 757 799 808
Hawaiian or Pacific Islander 890 903 918
White 914 929 935
Two or More Races 823 862 876
Connecticut State Department of Education Using Accountability Results to Guide Improvement March 2016 Revised February 2017
Page 36 of 67
Applicability (Who) This indicator is applicable to all districts and schools that offer grade 12
InputFeedback The six-year rate elicits a very different reaction from that of the four-year rate This extended graduation rate is viewed very favorably by all constituents and stakeholders Methodology (How) The six-year adjusted cohort graduation rate is based on the nationally consistent method as defined in 34 CFR sect 20019 (73 FR 64508 (Oct 29 2008)) The ultimate target for all students and subgroups remains at 94 Districtsschools can earn up to 100 points based on the pro-rated percentage of the ultimate target (94) achieved by High Needs students For example a school with a six-year graduation rate of 846 (ie 90 of the ultimate target of 94) will earn 90 out of 100 points Data Source PSIS Registration and Collection Graduation Rate Gap A districtschool is identified as having a graduation rate gap if the size of its six-year graduation rate gap between the High Needs subgroup and the Non-High Needs group (or 94 if thatrsquos lower) is at least one standard deviation greater than the statewide gap
RESOURCES FOR REDUCING DROPOUT AND INCREASING
GRADUATION
The Governorrsquos Prevention Partnership Youth Mentoring Program Through a partnership with MENTORNational Mentoring Partnership this programs partners with schools businesses community and faith-based organizations to ensure that children are involved in safe quality mentoring relationships httpwwwpreventionworksctorgwhatmentoringintroductionhtml
Project GRAD partners with communities interested in creating a rigorous college-bound culture for their students It targets schools serving economically disadvantaged students with the aim of increasing high school graduation and college entrance rates httpwwwprojectgradorg
GradNation For those working to increase high school graduation rates GradNation provides data insight and analysis information about effective and promising practices plus opportunities to connect and learn from one another httpgradnationamericaspromiseorgreports-resources
The National Dropout Prevention CenterNetwork (NDPCN) Since 1986 the NDPCN has served as a clearinghouse on issues related to dropout prevention and offered strategies designed to increase the graduation rate in Americarsquos schools The
Connecticut State Department of Education Using Accountability Results to Guide Improvement March 2016 Revised February 2017
Page 37 of 67
organization is a well-established national resource for sharing solutions for student success httpdropoutpreventionorgeffective-strategies httpdropoutpreventionorgresources
The National Mentoring Partnerships provides resources or implementing a mentor program and research-based evidence of the power of mentoring on improving absenteeism improving attitudes toward school and likelihood of enrolling in college Resources include tips for starting and mentoring program and elements of effective practices for mentoring httpwwwmentoringorg
Poliner Rachel A and Lieber Carol Miller (2004) The Advisory Guide Designing and Implementing Effective Advisory Programs in Secondary Schools Educators for Social Responsibility ISBN-10 0942349016 How to design and implement an advisory program focused on building community and promoting academic success social-emotional learning and postsecondary planning
Career-Themed Smaller Learning Communities Nonprofit organizations can assist schools by providing research-based best practices including but not limited to
Southern Regional Education Boardrsquos High Schools That Work Making Middle Grades Work and Technology Centers that Work
Regional Educational Laboratory Program httpsiesedgovnceeedlabs
Northeast College and Career Readiness Research Alliance httpwwwrelneiorgresearch-alliancescollege-and-career-readinesshtml
National Career Academies Network Talent Development Secondary httpwwwtdschoolsorg
The Buck Institute for Education Engaging students in authentic project-based learning is the leading expert in assisting teachers in developing engaging project-based learning and assisting schools in creating a project-based learning school-wide effort httpbieorg
The Everyone Graduates Center a research program of Johns Hopkins University is committed to studying the dropout problem by identifying barriers and developing tools and models that states communities districts and schools can use to support all students through high school graduation The organizationrsquos website httpnewevery1graduatesorg has a section devoted to sharing what is working across the country This Tools and Models section has information organized in six sections Early Warning and Response Systems Comprehensive Whole-School Reform Models New School Designs Innovations in Curriculum and Instruction School Family and Community Partnerships and Pathways to College and Career The Everyone
Connecticut State Department of Education Using Accountability Results to Guide Improvement March 2016 Revised February 2017
Page 38 of 67
Graduates Center recognizes that students are on a path to graduation well before high school so there are resources designed for use in the middle grades as well
Pathways to Education (httpswwwpathwaystoeducationca) is a community-based program with a variety of locations throughout Canada The Pathways model is a coordinated partnership that includes schools government community partners volunteers and the commitment of students and their families Pathways was founded in 2001 and since that time has demonstrated impressive results in reducing dropouts among economically-disadvantaged students and providing support to ensure successful post-secondary transitions
The National Dropout Prevention Center for Students with Disabilities (NDPC-SD) at Clemson University was established in 2004 by the Office of Special Education Programs (OSEP) The Centerrsquos website (httpwwwndpc-sdorg) includes links to content selected for specific audiences including districts parents and students The resources include strategies for carefully tracking key factors that serve as early warning signs of a problem as well as evidence-based dropout prevention measures
The California Dropout Research Project (CDRP) has been conducting research designed to inform policymakers educators and the general public about the dropout issue for nearly a decade (httpwwwcdrpucsbedu) Given the percentage of California students who are English learners the CDRP delves deeper into the risks for this group of students and suggests reforms that show promise in this report httpwwwcdrpucsbeduresearchreport19pdfc
The Transition Bill of Rights for Parents of Students Receiving Special Education Services describes the criteria necessary for students with disabilities to access ldquotransition onlyrdquo services upon completion of academic requirements for graduation
Connecticut State Department of Education Using Accountability Results to Guide Improvement March 2016 Revised February 2017
Page 39 of 67
Where can I get more information
QUESTIONS CSDE CONTACTS
Resources Strategies and Best Practices for School Counselors to use in supporting all students
Kimberly Traverso Phone 860-807-2057 Email kimberlytraversoctgov
Resources Strategies and Best Practices for Supporting Students with Disabilities
Patricia Anderson Phone 860-713-6923 Email patriciaandersonctgov
Resources Strategies and Best Practices for Supporting English Learners
Megan Alubicki Flick Phone 860-713-6786 Email meganalubickictgov and Joe Di Garbo Phone 860-713-6863 Email joedigarboctgov
Data Collection Rate Calculations and Reporting Francis Apaloo Phone 860-713-6832 Email francisapalooctgov
Connecticut State Department of Education Using Accountability Results to Guide Improvement March 2016 Revised February 2017
Page 40 of 67
INDICATOR 10 POSTSECONDARY ENTRANCE RATE ndash ALL
STUDENTS
Indicator Max Points ndash All Years
Percentage of graduating class who enrolled in a 2 or 4-year postsecondary institution any time during the first year after high school graduation
100
Description (What) This rate is the percentage of all students in a graduating class who enrolled in a 2 or 4-year postsecondary institution any time during the first year after high school graduation Rationale (Why) In addition to evaluating the extent of preparation for collegecareer it is important to also evaluate attainment of that outcome Applicability (Who) This indicator is applicable to all districts and schools that offer grade 12 InputFeedback Some practitioners are supportive of this indicator because it encourages school staff to extend their efforts beyond the school building to support student success Others are less supportive because they consider this indicator as being shaped more by factors beyond the influence of school staff (eg personal choice family economics) some of these objectors are amenable to its inclusion so long as it is not weighted too heavily and the ultimate target is reasonable The CSDE has heard from the field and acknowledges data limitations associated with this indicator Currently the Department does not have access to information about important post-secondary outcomes for students including but not limited to evidence of full-time employment immediately following graduation entry into the military enrollment in private occupational schools and transition to apprenticeships Methodology (How) Points will be awarded based on the percentage of All Students from the graduating class who enter a 2 or 4-year postsecondary institution any time during the first year after high school graduation Points will be prorated based on the percentage of the ultimate target (75) achieved Data Source PSIS and National Student Clearinghouse
Connecticut State Department of Education Using Accountability Results to Guide Improvement March 2016 Revised February 2017
Page 41 of 67
RESOURCES FOR IMPROVING POSTSECONDARY ENTRANCE
In September 2015 the White House released an annual report referencing ldquosummer meltrdquo This phrase is used to describe what happens to students who are accepted to college but during the months between high school graduation and the first day of college classes the student does not complete tasks necessary to begin school (eg course enrollment forms) According to the report 20 to 30 percent of high school graduates in urban communities who intend to attend college following graduation do not enroll
Major cities across the country have been exploring different ways of supporting their students from graduation to college entrance for many years The uAspire organization focuses on college affordability and assisting students with developing a plan to pay for college one of the most formidable barriers to college enrollment uAspire has served Boston-area students for three decades and expanded nationally ten years ago Information about services provided to students families and practitioners can be found on their website httpswwwuaspireorg The College Access Program (DC-CAP) a non-profit organization in Washington DC partners with all schools in the District and is available to all students DC-CAP reports that the percentage of students enrolling in college was 30 percent in 1999 and increased dramatically to 62 percent in 2014 DC-CAP attributes this improvement to comprehensive supports for students and their families leading up to and beyond graduation To find out more about DC-CAP and strategies used with students and families visit httpwwwdccaporg
The Strategic Data Projectrsquos Summer Melt Handbook provides users with a range of different approaches to effectively measure and develop systems to combat summer melt and improve college enrollment The handbook acknowledges that school districts have different resources available so the suggested interventions range from well-developed partnerships with community organizations to simple digital outreach customized and targeted to students and their families The handbook includes a variety of case studies to showcase the impact of different strategies and provides practical resources including sample templates used for tracking and outreach The handbook and related research are available here httpsdpceprharvardedusummer-melt-handbook
Achieve is an independent nonpartisan nonprofit education reform organization strongly committed to ensuring all students graduate from high school ldquocollege and career readyrdquo or in other words fully prepared academically for any and all opportunities they choose to pursue To achieve this goal states need a coherent and aligned policy framework anchored in the goal of graduating all students ready for credit-bearing college-level coursework and the 21st-century workplace The policy framework must at a minimum include college- and career-ready standards graduation requirements assessments and data and accountability systems and have strong alignment with policies set in the postsecondary and economic development sectors
Where can I get more information
Connecticut State Department of Education Using Accountability Results to Guide Improvement March 2016 Revised February 2017
Page 42 of 67
QUESTIONS CSDE CONTACTS
Resources Strategies and Best Practices Kimberly Traverso Phone 860-807-2057 Email kimberlytraversoctgov
Data Collection and Reporting Charles Martie Phone 860-713-6809 Email charlesmartiectgov
Connecticut State Department of Education Using Accountability Results to Guide Improvement March 2016 Revised February 2017
Page 43 of 67
INDICATOR 11 PHYSICAL FITNESS
Indicator Max Points ndash All Years
Percentage of students meetingexceeding the ldquoHealth Fitness Zone Standardrdquo in all four areas of the CT Physical Fitness Assessment
50
Description (What) The Third Generation CT Physical Fitness Assessment (CTPFA) is focused on health-related fitness The program mirrors options in the Presidentrsquos Challenge Physical Fitness Program and FitnessGramActivityGram The assessment includes four health-related physical fitness tests designed to assess muscular strength and endurance flexibility and cardiovascular fitness Criterion-referenced standards associated with good health are used rather than normative standards Since the early 1990rsquos the assessment has been administered to all students in grades 4 6 8 and 10 Effective 2016-17 high schools were granted flexibility (explained below) allowing the assessment to be administered in other grades
Rationale (Why) The Connecticut State Board of Education is committed to the physical development of Connecticutrsquos students and focused on outcomes and specific performance objectives that evidence attainment of that goal Applicability (Who) This indicator is applicable to all districts and schools that offer grades 4 6 8 or 10 InputFeedback Though cardiovascular fitness has been shown to correlate with improved academic performance stakeholders accept a metric that looks at standard-attainment in all four assessment areas because the focus is healthfitness Some stakeholders wondered if this area was weighted too heavily High schools requested flexibility from the requirement to test Grade 10 students In April 2016 CSDE announced the following increased flexibility to high schools regarding the administration and reporting of the Connecticut Physical Fitness Assessment results
Effective 2016-17 the expectation is that high school(s) must administer the physical fitness assessment at least once to every student anytime during Grades 9 through 12
The administration of the assessment does not necessarily need to be tied to student participation in a physical fitness class
High schools may also use summer school physical fitness courses as an opportunity to administer the assessment
For accountability purposes the CSDE will continue to use the Grade 10 enrollment numbers to calculate the estimated participation rate
Connecticut State Department of Education Using Accountability Results to Guide Improvement March 2016 Revised February 2017
Page 44 of 67
Methodology (How) To account for variation in estimated participation rates the following participation rate multipliers are established
If the estimated participation rate is at least 90 the multiplier is 1 This standard was achieved by approximately 82 of all schools in 2014-15
If the estimated participation rate is at least 70 but less than 90 the multiplier is 05 (approximately 11 of schools)
If the estimated participation rate is at least 50 but less than 70 the multiplier is 025 (approximately 3 of schools)
If the estimated participation rate is less than 50 no points will be awarded for this indicator
The ultimate target for the percentage of All Students meetingexceeding the ldquoHealth Fitness Zone Standardrdquo in all four areas of the CT Physical Fitness Assessment for a school or district is set at 75
Points will be prorated based on the percentage of the ultimate target achieved as adjusted by the participation rate multiplier Two examples are included below
Example 1 An elementary school has a 92 estimated participation rate and the percentage of those tested meeting the ldquoHealth Fitness Zone Standardrdquo in all four areas is 76 This school earns all 50 eligible points
Example 2 An elementary school has a 55 estimated participation rate and the percentage of those tested meeting the ldquoHealth Fitness Zone Standardrdquo in all four areas is 80 This school earns 125 of 50 eligible points
Data Source ED165 (fitness data) and June PSIS (enrollment)
RESOURCES FOR IMPROVING PHYSICAL FITNESS
Instructional Framework for fitness education in physical education (SHAPE America) httpwwwshapeamericaorgpublicationsresourcesteachingtoolsfitness_ed_resourcescfm
Healthy and Balanced Living Curriculum Framework for Physical Education (CSDE) httpwwwsdectgovsdeLIBsdePDFdepsstudentHealthyampBalancedLivingpdf
Guidelines for a Coordinated Approach to School Health (Section 3 Physical Education) httpwwwsdectgovsdeLIBsdePDFdepsstudentGuidelines_CSHpdf
Monitoring Student Fitness Levels (Centers for Disease Control and Prevention) httpwwwcdcgovhealthyschoolsphysicalactivitypdf2014_09_12_14-249482-nihiser-collectingfitnessdata-final-508web_tag508_2pdf
Connecticut State Department of Education Using Accountability Results to Guide Improvement March 2016 Revised February 2017
Page 45 of 67
Linking Health to Achievement (Centers for Disease Control and Prevention) o httpswwwcdcgovHealthyYouthhealth_and_academics o httpswwwcdcgovhealthyyouthhealth_and_academicspdfhealth-
academic-achievementpdf
Teachers Toolbox Home (SHAPE America) httpwwwshapeamericaorgpublicationsresourcesteachingtoolsteachertoolbox
Letrsquos Move Active Schools wwwletsmoveschoolsorg
Where can I get more information
QUESTIONS CSDE CONTACTS
Resources Strategies and Best Practices Bonnie Edmondson Phone 860-807-2055 Email bonnieedmondsonctgov
Data Collection and Reporting Raymond Martin Phone 860-713-6876 Email raymondmartinctgov
Connecticut State Department of Education Using Accountability Results to Guide Improvement March 2016 Revised February 2017
Page 46 of 67
INDICATOR 12 ARTS ACCESS
Indicator Max Points ndash All Years
Percentage of students in grade 9 through 12 participating in at least one dance theater music or visual arts course in the school year
50
Description (What) This is an ldquoaccessrdquo metric that evaluates the extent to which students in high school participate in at least one arts course in the school year in dance theatre music or the visual arts Rationale (Why) The Connecticut State Board of Education believes every student needs and deserves a high-quality education in the arts including dance music theater and the visual arts The arts are an integral component of the comprehensive curriculum provided to all Connecticut students at every grade Applicability (Who) This indicator is applicable to all districts and schools that offer any grade between 9 and 12 inclusive InputFeedback Traditionally access to the arts has been measured through instructional hours offered Districtschool administrators indicate that self-reported arts instructional hours are not comparable across schools With the availability now of course-level data the extent to which students avail of arts opportunities can be empirically known and compared across districtsschools The CSDE has heard from the field that students are engaged in important arts-related activities that are not captured through this indicator The Department acknowledges that many students participate in school- or community-based art programs and activities outside of the school day At this time there is not a way to capture that information in this system Additionally stakeholders have requested that the definition of arts coursework be expanded to courses that incorporate the use of technology including computer-aided design For now this system will remain focused on dance theater music and the visual arts but consideration will be given to expanding how this indicator is defined in future years Methodology (How) Points can be earned for the percentage of All Students in grades 9 through 12 who enroll in at least one ldquoFine and Performing Artsrdquo course during the school year A complete list of NCES Course Names and Codes along with a corresponding subject (eg ldquoFine and Performing Artsrdquo) can be viewed under the ldquoSecondary School Course Classification Systemrdquo header on the TCS help site httpwwwcsdestatectuspublictcsdownloadsasp Points will be prorated based on the percentage of the ultimate target achieved
Connecticut State Department of Education Using Accountability Results to Guide Improvement March 2016 Revised February 2017
Page 47 of 67
Data Source June PSIS (to establish current year 9th through 12th graders) and Teacher Course Student (for course participation data)
RESOURCES FOR IMPROVING ACCESS TO THE ARTS
Why is arts access important A project of the Arts Education Partnership ArtsEdSearch compiles and summarizes high quality research studies and explores implications for educational policy and practice ArtsEdSearch is a rich resource for districts seeking to bolster their arts programming Below is the organizationrsquos summary for arts access research
Research suggests that access to arts education provides an academic advantage to students Students in schools with extensive and broad offerings in the arts not only are able to learn the artsmdasha core academic subjectmdashbut also do better on state and district standardized tests and are provided with more opportunities to achieve and succeed than students in schools lacking robust arts programs Arts-rich schools graduate higher percentages of students who in turn are more likely to complete college and to be socially active in their communities in adulthood Studies also find that in arts-rich schoolsmdashparticularly schools that offer both discipline-based arts classes and integrated arts instructionmdashstudents are more engaged and teachers are more effective Policymakers concerned with educational equity should consider access to rich arts education programming a significant factor in a high-quality education for all students See more at httpwwwartsedsearchorgstudentspolicy-implications
What can districts do to improve arts access From Snapshot Arts Access in US Schools and the Arts Education Partnership - Provide a wider variety of arts courses at all levels particularly high school (including
theatre dance andor media arts) - Provide a higher level frequency of instruction at all levels - Provide comprehensive standards-based instruction aligned vertically throughout the
district with classes taught by certified teachers - Engage the arts as a part of high quality support and professional learning programs for the
entire educator workforce and - Increase opportunities to engage the community in student art performances or projects
1 Standards
CT Arts Standards httpwwwsdectgovsdecwpviewaspa=2618ampq=320834
National Core Arts Standards httpnationalartsstandardsorg
Connecticut State Department of Education Using Accountability Results to Guide Improvement March 2016 Revised February 2017
Page 48 of 67
Position Statement on the Implementation of the Connecticut Arts Standards
httpwwwsdectgovsdelibsdepdfboardArtsStandardspdf
2 Arts Integration
CT HOT Schools httpwwwctgovcctcwpviewaspa=2212ampq=293712
Project Zero at Harvard httpwwwpzharvardedu
Dance and Science integrated plan httpwwwedutopiaorgpdfsstwedutopia-
stw-bates-artsintegration-lessonplanvelocityaccel-presentapdf
Mathematics and Art httpmasongmuedu~jsuh4math20masterpiecepdf
Kennedy Center resources for teaching in through and about the arts -
httpartsedgekennedy-centerorgeducatorsaspx
Arts and Social studies connections - httpwwwctsocialstudiesorg
Other resources of note
KCAEEN Arts Education Advocacy Toolkit httpwwwkennedy-centerorgeducationkcaaenresourcesArtsEducationAdvocacyToolkitpdf
Music Education httpwwwnammfoundationorgsupport-music
Visual Arts Education httpwwwarteducatorsorgadvocacy
Theatre Education httpschooltheatreorgadvocacy
Dance Education httpndeoorgcontentaspxpage_id=22ampclub_id=893257ampmodule_id=55775
Where can I get more information
QUESTIONS CSDE CONTACTS
Resources Strategies and Best Practices Melissa Hickey Phone 860-713-6680 Email melissahickeyctgov
Data Collection and Reporting Keryn Felder Phone 860-713-6833 Email kerynfelderctgov
Connecticut State Department of Education Using Accountability Results to Guide Improvement March 2016 Revised February 2017
Page 49 of 67
APPENDICES
PERFORMANCE INDEX CALCULATION RULES
Overview Subject-level indices are calculated at the student- subgroup- school- and district-levels To calculate an index a studentrsquos score in each subject on the Smarter Balanced Assessment (SB) SAT CT Alternate Assessment (CTAA) Connecticut Mastery Test (CMT) Connecticut Academic Performance Test (CAPT) or the CMTCAPT Skills Checklist must first be transformed into an index score Detailed information regarding the calculation of each test specific score can be found in the section titled ldquoCalculating the Performance Indexrdquo Student Individual Performance Indices (IPIs) are derived for each subject Math English Language Arts (ELA) and Science School Performance Indices (SPIs) are calculated by averaging all of a given schoolrsquos valid and non-excluded Student IPIs for the applicable subject Only students enrolled in the school on October 1st of the testing year are included in SPI calculations District Performance Indices (DPIs) are calculated by averaging all of a given districtrsquos valid and non-excluded Student IPIs for the applicable subject Note that students who are enrolled in lsquoProgramsrsquo or are outplaced are included in a given Public School Information System (PSIS) ldquoReporting Districtrsquosrdquo DPI Only students enrolled in the district on October 1st of the testing year are included in DPI calculations Participation Rates are calculated by dividing the number of students who attempted andor completed the assessment by the total number of students who should have been administered the subject-level assessment Details regarding whether students were participants or non-participants is contained in the section titled ldquoParticipation and Achievement Inclusion Rulesrdquo
File Preparation All demographic data included in the assessment files were extracted from the CSDE frozen PSIS Registration File on the last day of the testing window Only students in grades 3 through 8 and grade 11 are included in calculations for the standard and alternate ELA and mathematics assessments Only students in grades 5 8 and 10 are included in calculations for the standard and alternate science assessments
English Learners (EL) and Students with Disabilities (SWD) ldquoFlexrdquo Groups
Connecticut State Department of Education Using Accountability Results to Guide Improvement March 2016 Revised February 2017
Page 50 of 67
As part of the Elementary and Secondary Education Act (ESEA) students who do not belong to the EL or SWD subgroups at the time of testing but who had been members of the EL or SWD subgroup any time up to two years prior are included in the EL flexibility andor SWD flexibility subgroups used for Indicator 1 calculations The previous subgroup status is determined using the EL and SWD PSIS Collection variables from the October January and June collections of the current and two prior school years
The completion of a Learner Characteristics Inventory (LCI) is required for participation in any alternate assessment Any CTAA student record or CMTCAPT Skills Checklist Science record without a completed LCI was invalidated These students were included as non-participants on the standard assessment In cases where a standard assessment record existed for a student with a completed LCI the standard assessment record was invalidated and the student was included as a non-participant on the alternate assessment(s)
Participation and Achievement Inclusion Rules Accountability reporting requires a series of decision rules that specify whether a student is included in performance index and participation rate calculations The tables on the following pages provide a comprehensive list of the assessment status rules used for accountability calculations for all summative assessments
Connecticut State Department of Education Using Accountability Results to Guide Improvement March 2016 Revised February 2017
Page 51 of 67
Smarter Balanced Assessment Data File Rules
Assessment Test Status Attempted
Flag
Participation Numerator
(Total Tested)
Participation Denominator
(Total Students)
Accountability Achievement
Smarter Balanced
ELA
Completed
Y
Yes P Yes Yes SS
Expired Yes P Yes Yes SS
Invalidated Yes P Yes exclude
Completed
P
No NP Yes exclude
Expired Yes P Yes Yes LOSS
Invalidated Yes P Yes exclude
Invalidated lt gt
Yes P Yes exclude
lt gt No NP Yes exclude
Smarter Balanced
MATH
Completed (cs ss)
Y
Yes P Yes Yes SS
Expired (ec ee) Yes P Yes Yes SS
Expired (ei) Yes P Yes exclude
Invalidated (ii) Yes P Yes exclude
Completed (ci)
P
Yes P Yes exclude
Expired (ec ee er ei) Yes P Yes Yes LOSS
Invalidated (ii) Yes P Yes exclude
Completed (csi)
N
Yes P Yes exclude
Expired (en) No NP Yes exclude
Invalidated (ii) Not Applicable
Pending (cn) No NP Yes exclude
Pending (cr) Yes P Yes exclude
Invalidated (ii) lt gt
Yes P Yes exclude
lt gt No NP Yes exclude
Legend c = Completed test submitted to be scored e = Expired test not submitted i = Invalidated Pending = Does not occur in test engine One part of test was never started OR was reset
(Math amp CAPT Science only 2016) r = Reset reset after started Temporary test segment status only (typically due to lack of appropriate
accommodations being set in TIDE) n = No Activity Test segment status only Never startedlogged into displays as blank s = Scored Completed test
Connecticut State Department of Education Using Accountability Results to Guide Improvement March 2016 Revised February 2017
Page 52 of 67
Connecticut Mastery Test (CMT) Science and Connecticut Academic Performance Test (CAPT) Science Data File Rules
Assessment Test Status Attempted
Flag
Participation Numerator
(Total Tested)
Participation Denominator
(Total Students)
Accountability Achievement
CMT Science
Completed
Y
Yes P Yes Yes SS
Expired Yes P Yes Yes SS
Invalidated Yes P Yes exclude
Expired P
Yes P Yes Yes LOSS
Invalidated Yes P Yes exclude
Completed
X
Yes P Yes Yes LOSS
Completed No NP Yes exclude
Invalidated Yes P Yes exclude
Invalidated lt gt
Yes P Yes exclude
lt gt No NP Yes exclude
CAPT Science
Completed
Y
Yes P Yes Yes SS
Expired Yes P Yes Yes SS
Expired (ei) Yes P Yes exclude
Invalidated (ii) Yes P Yes exclude
Pending (cr) Not Applicable
Completed
P
Yes P Yes exclude
Expired (ec ee er ei)
Yes P Yes Yes LOSS
Invalidated (ii) Yes P Yes exclude
Pending (cr) Not Applicable
Completed
X
Yes P Yes Yes LOSS
Completed No NP Yes exclude
Invalidated Yes P Yes exclude
Invalidated lt gt
Yes P Yes exclude
lt gt No NP Yes exclude
Legend c = Completed test submitted to be scored e = Expired test not submitted i = Invalidated Pending = Does not occur in test engine One part of test was never started OR was reset
(Math amp CAPT Science only 2016) r = Reset reset after started Temporary test segment status only (typically due to lack of appropriate
accommodations being set in TIDE)
Connecticut State Department of Education Using Accountability Results to Guide Improvement March 2016 Revised February 2017
Page 53 of 67
Connecticut Alternate Assessment (CTAA) Data File Rules
Test Status Attempted
Flag
Participation Numerator
(Total Tested)
Participation Denominator
(Total Students)
Accountability Achievement
Completed
Y
Yes P Yes Yes SS
Expired Yes P Yes Yes SS
Invalidated Yes P Yes exclude
Completed
P
Not Applicable
Expired Yes P Yes Yes LOSS
Invalidated Yes P Yes exclude
lt gt lt gt No NP Yes exclude
CMTCAPT Skills Checklist Science Data File Rules
Test Status Attempted
Flag
Participation Numerator
(Total Tested)
Participation Denominator
(Total Students)
Accountability Achievement
Completed
Y
Yes P Yes Yes SS
Expired Yes P Yes Yes SS
Invalidated Yes P Yes exclude
Completed
N
Not Applicable
Expired No NP Yes exclude
Invalidated No NP Yes exclude
Invalidated lt gt
Yes P Yes exclude
lt gt No NP Yes exclude
SAT Data File Rules
Number of Subject-Level Test Items
Answered
Attempted-ness
SAT Student
Participated Indicator =
Y
Participation Numerator
(Total Tested)
Participation Denominator
(Total Students)
Accountability Achievement
gt=1 Y Y
Yes P Yes Yes SS
0 P Yes P Yes LOSS
lt gt lt gt N No NP Yes exclude
lt gt lt gt lt gt No NP Yes exclude
Connecticut State Department of Education Using Accountability Results to Guide Improvement March 2016 Revised February 2017
Page 54 of 67
PERFORMANCE INDEX METHODOLOGY
Background Connecticut first implemented a performance index for school and district accountability purposes in 2012 The performance index was calculated by converting Connecticut Mastery Test (CMT) and Connecticut Academic Performance Test (CAPT) achievement levels to a scale of 0 to 100 This approach recognized and valued improvement in student achievement at all performance levels not just from lsquonot proficientrsquo to lsquoproficientrsquo It raised expectations by setting the target that all students perform at the higher lsquogoalrsquo level versus the lsquoproficientrsquo level While practitioners were generally pleased with this index they wondered if using scale scores to calculate the index instead of achievement levels would yield an even more precise measure of student achievement Consequently Connecticut State Department of Education (CSDE) staff consulted with faculty from the University of Connecticut to explore this possibility This paper outlines the specific methodology for converting scale scores for the various state assessments into Connecticutrsquos performance index
Scale Scores Improve Index Calculations Individual student results from the English language arts (ELA) Mathematics and Science assessments are reported in terms of scale scores and achievement levels Achievement levels are used as a way of categorizing student performance in a content area The levels represent broad groupings of performance that are developed based on the judgment of content experts Operationally the levels are used as a starting point in discussing a studentrsquos test scores Achievement levels are derived from underlying scale scores The underlying scale or ruler provides a more continuous measure of student performance such that one student with a significantly greater scale score than another student in the same achievement level can be said to be performing higher For district- and school-level accountability Connecticut uses student scale scores not achievement levels to calculate performance index scores in ELA Mathematics and Science This new approach to performance index calculation acknowledges that the assessments were not developed to solely classify students into broad achievement levels On the contrary they were developed to provide a more precise measure of student performance This approach of mapping scale scores instead of achievement levels to index values is consistent with the position paper released by the Smarter Balanced Assessment Consortium wherein they assert that
ldquohellipthey [achievement levels] will be less precise than scale scores for describing student gains over time or changes in achievement gaps among groups since they do not reveal changes of student scores within the bands defined by the achievement levels Furthermore there is not a critical shift in student knowledge or understanding that
Connecticut State Department of Education Using Accountability Results to Guide Improvement March 2016 Revised February 2017
Page 55 of 67
occurs at a single cut score point Thus the achievement levels should be understood as representing approximations of levels at which students demonstrate mastery of a set of concepts and skills and the scale scores just above and below an achievement level as within a general band of performancerdquo
The new index calculation will be more sensitive to changes in student performance over time and will provide an improved assessment of aggregate growth of students at the subgroup school and district levels The new calculation moves the performance index to a 0-110 scale Important considerations in defining the index are that it allows for (a) a comparison of schools and districts not only within a year but also across years and (b) bonus points to be assigned for the highest performing students (100-110) To meet these requirements the individual student index will be set to zero if a student obtains the lowest obtainable scale score (LOSS) for the studentrsquos grade and 110 if the student obtains the highest obtainable scale score (HOSS) Although the highest index value at the school district and subgroup level is 100 giving scores ranging from 100 to 110 to students who are the highest performing will have the effect of rewarding these schools and districts by weighting these scores additionally in the computation of the new performance index Further information is provided in Tables 1-5 including the lowest and highest obtainable scores for all state assessments (Smarter Balanced ELA and Mathematics CMT and CAPT Science CMT and CAPT Science Skills Checklists Connecticut Alternate Assessments (CTAA) ELA and Mathematics and SAT Evidence-based Reading and Writing and Mathematics)
Calculating the Performance Index The formula used to convert student scale scores (Smarter Balanced CTAA CMTCAPT Science CMTCAPT Science Skills Checklists and SAT) to an index value is presented below The approach for converting CMTCAPT Skills Checklist Science scores is the same however highest and lowest obtainable raw scores (HORS and LORS) are used in place of scale scores
119816119847119837119838119857 =119930119940119938119949119942 119930119940119952119955119942 minus 119923119926119930119930
119929119938119951119944119942lowast 120783120783120782
The following examples use information from Tables 1-5 to convert student scores to index values If a Grade 3 student earns a vertical scale score of 2400 on the ELA portion of the Smarter Balanced assessment the index value for this score is 618 The calculation is performed as follows
119816119847119837119838119857 =120784120786120782120782 minus 120784120783120783120786
120787120782120791lowast 120783120783120782 = 120788120783 120790
Connecticut State Department of Education Using Accountability Results to Guide Improvement March 2016 Revised February 2017
Page 56 of 67
If a Grade 8 student earns a scale score of 1276 on the Math portion of the CTAA assessment the index value for this score is 929 The calculation is performed as follows
119816119847119837119838119857 =120783120784120789120788 minus 120783120784120782120782
120791120782lowast 120783120783120782 = 120791120784 120791
If a Grade 5 student earns a scale score of 200 on the CMT Science assessment the index value for this score is 367 The calculation is performed as follows
119816119847119837119838119857 =120784120782120782 minus 120783120782120782
120785120782120782lowast 120783120783120782 = 120785120788 120789
If a Grade 10 student earns a raw score of 40 on the CAPT Skills Checklist Science the index
value for this score is 733 The calculation is performed as follows
119816119847119837119838119857 =120786120782 minus 120782
120788120782lowast 120783120783120782 = 120789120785 120785
Finally when a Grade 11 student earns a Mathematics scale score of 590 on the SAT the index
value for the score is 715 The calculation is performed as follows
119816119847119837119838119857 =120787120791120782 minus 120784120782120782
120788120782120782lowast 120783120783120782 = 120789120783 120787
Highest and Lowest Obtainable Scores and Range Tables Table 1
Smarter Balanced ELA and Mathematics
Highest (HOSS) and Lowest (LOSS) Obtainable Scale Scores and Range
Subject Grade LOSS HOSS RANGE Subject Grade LOSS HOSS RANGE
ELA
3 2114 2623 509
MATH
3 2189 2621 432
4 2131 2663 532 4 2204 2659 455
5 2201 2701 500 5 2219 2700 481
6 2210 2724 514 6 2235 2748 513
7 2258 2745 487 7 2250 2778 528
8 2288 2769 481 8 2265 2802 537
Connecticut State Department of Education Using Accountability Results to Guide Improvement March 2016 Revised February 2017
Page 57 of 67
Table 2 Connecticut Alternate Assessment (CTAA) ELA and Mathematics Highest (HOSS) and Lowest (LOSS) Obtainable Scale Scores and Range
Subject Grade LOSS HOSS RANGE
ELA amp
MATH
3 1200 1290 90
4 1200 1290 90
5 1200 1290 90
6 1200 1290 90
7 1200 1290 90
8 1200 1290 90
HS 1200 1290 90
Table 3
Connecticut Mastery Test (CMT) and Connecticut Academic Performance Test (CAPT) Science Highest (HOSS) and Lowest (LOSS) Obtainable Scale Scores and Range
Grade LOSS HOSS RANGE
5 100 400 300
8 100 400 300
HS 100 400 300
Table 4 Connecticut Mastery Test (CMT) and Connecticut Academic Performance Test (CAPT) Science Skills Checklist Highest (HORS) and Lowest (LORS) Obtainable Raw Scores and Range
Grade LORS HORS RANGE
5 0 60 60
8 0 48 48
HS 0 60 60
Connecticut State Department of Education Using Accountability Results to Guide Improvement March 2016 Revised February 2017
Page 58 of 67
Table 5 SAT Evidence-based Reading and Writing and Mathematics Highest (HOSS) and Lowest (LOSS) Obtainable Scale Scores and Range
LOSS HOSS RANGE
Evidence-Based Reading and Writing 200 800 600
Mathematics 200 800 600
HOW TO READ 2015-16 ACCOUNTABILITY REPORTS
The sample report below shows a districtrsquos performance on all indicators reported for the 2015-16 school year To support appropriate interpretation a brief explanation for every column heading is provided below the table
No Every indicator in the system is assigned a number When an indicator has subcomponents (eg All Students High Needs Students) a lettering system is used alongside the number
Indicator This column provides a brief explanation of what is being measured A full explanation of every indicator is included in the main section of this document (Using Accountability Results to Guide Improvement)
Connecticut State Department of Education Using Accountability Results to Guide Improvement March 2016 Revised February 2017
Page 60 of 67
IndexRate All components of indicator 1 are reported as performance indices All other indicators are reported as rates (ie percentages) The values presented in this column are the performance indices and rates earned by this district on the associated indicators
Target This value is the ultimate target established for all schools and districts statewide
Points Earned This value represents the points earned on the relevant indicator for the district In every case points are prorated based on the districtrsquos actual performance (ie index or rate) as compared to the target The rules used for prorating points for each of the indicators are explained in the main section of this document
Max Points This value is the maximum number of points possible on the associated indicator
Points Earned By indicator this column shows the percentage of the ldquomax pointsrdquo earned by this district
State Avg IndexRate The values presented in this column are the performance indices (Indicator 1) and rates earned by this district on the associated indicators
Many schools have one or more indicators that cannot be measured In these cases school reports will display ldquoNArdquo in the IndexRate field and there will be 0 in the Points Earned Max Points and Points Earned cells for those indicators The overall Accountability Index (in the district example above 776) is the percentage of total possible points earned on all available indicators Using the 2015-16 results all schools are classified into one of five categories The school-level Accountability Index is the primary factor used to determine placement with additional consideration given to participation rates achievement gaps and graduation rate gaps Note that the table above does not include Indicator 3 which is the participation rate for every subject for All Students and the High Needs group Participation data are reported in a separate table within the report
Connecticut State Department of Education Using Accountability Results to Guide Improvement March 2016 Revised February 2017
Page 61 of 67
The gap table below shows the ELA Math and Science index scores for High Needs students and Non-High Needs students in this district The size of the gap in index score points is reported and that difference is compared to the average gap across all districts statewide If the districtrsquos gap is more than one standard deviation beyond the state gap mean then the district is reported as having an ldquooutlier gaprdquo In the example below the size of the gaps in ELA Math and Science are all less than the standard used to identify outliers The same approach is used at the school level with the size of the gap compared to the average gap across all schools statewide Graduation rate gaps are determined in the same way The graduation rate gap is based on the difference in 6-year graduation rates for High Needs and Non-High Needs students As shown in the table below this district has a gap that is less than the standard used to identify graduation rate gap outliers While there are no points associated with the gap measures these data are used when placing schools in one of five categories Additionally schools are not eligible to be a School of Distinction if reports indicate that the school has an achievement gap or graduation rate gap this is considered an outlier
Connecticut State Department of Education Using Accountability Results to Guide Improvement March 2016 Revised February 2017
Page 62 of 67
The participation rate table below includes all of the data for Indicator 3 The expectation for all tested subjects across all tests (ie Smarter Balanced CTAA CMTCAPT Science CMTCAPT Skills Checklist Science and SAT) for All Students and High Needs students is at least 95 Any rate less than 95 means that the district or school did not meet participation requirements There are no points associated with Indicator 3 but like the gap indicators these data are used when placing schools in one of five categories Additionally schools are not eligible to be a School of Distinction if reports indicate that the school has not met participation requirements
Connecticut State Department of Education Using Accountability Results to Guide Improvement March 2016 Revised February 2017
Page 63 of 67
The bar chart below provides an at-a-glance view of the percentage of points earned on every indicator The bar at the top of the graphic is the Accountability Index representing the percentage of total possible points earned on all available indicators Please note that the subject-specific index scores are measured against a target of 75 The percentage of points earned is based on what percentage of the target is met Therefore the subject-specific percentages presented below are not index values Additionally it may be helpful for those sharing these reports to provide audiences with district or school context regarding how many students are represented in the All Students group and how many students are members of the High Needs group
Connecticut State Department of Education Using Accountability Results to Guide Improvement March 2016 Revised February 2017
Page 64 of 67
CONNECTICUT ASSESSMENT AND ACCOUNTABILITY REPORTING OF ldquoRECENTLY ARRIVEDrdquo
ENGLISH LEARNERS (ELS)
2014-15 School Year 2015-16 School Year and Beyond
Recently Arrived EL Definition
An EL enrolled for the first time in a US school for fewer than 12 calendar months at the time of testing
An EL enrolled for the first time in a US school for fewer than 24 calendar months at the time of testing
Assessment Participation Requirements
Recently arrived ELs MUST participate in mathematics and science and MAY be excused (ie exempt) from the English Language Arts (ELA) assessment
All ELs including all recently arrived ELs must participate in all assessments This includes mathematics ELA and science as well as the English language proficiency assessment
Assessment Reporting (typically in the summer months)
When 2014-15 results were released in September 2015 recently arrived ELs who may have taken ELA were not included in the results However when the agencyrsquos new portal EdSight is fully implemented recently arrived ELs will be included in all assessment results for schools and districts per federal law
Federal law requires that all ELs be included in assessment reporting regardless of time in a US school
Accountability ReportingmdashAchievement Status
Recently arrived ELs were not included in any of the Achievement Status (Indicator 1) calculations
Scores earned by recently arrived ELs are not included in Achievement Status (Indicator 1) calculations
Accountability ReportingmdashAchievement Growth
Measuring growth is not possible based only on 2014-15 data because this was the first administration of the operational Smarter Balanced assessment
Recently arrived ELs who have participated in two Smarter Balanced administrations are included in growth calculations (Indicator 2)
Accountability ReportingmdashParticipation Rates
Recently arrived ELs are not included in ELA participation rates because their participation was not a requirement However they are included in math and science rates
All students are included in participation rate calculations for all subjects
Note regarding EL subgroup reporting When reviewing accountability reports and exploring subgroup results for English learners in particular keep in mind the ldquoEL Flexrdquo group for accountability EL Flex includes students who were formerly identified as an EL Specifically any student who is not an EL at the time of testing but who had been a member of the EL subgroup in any time up to two years previous are included in the EL flexibility subgroup For Indicator 1 calculations this means that previous subgroup status is determined by using the EL PSIS collection variable from October January and June of the current and two prior school years If the student was identified as EL in any of those collections the student is included as an EL in Indicator 1 calculations
ASSIGNING SCHOOL CATEGORIES
As required under Connecticut General Statutes Section 10-223e Connecticut has implemented a five category school classification system In 2015-16 CSDE identified schools in Category 4 and Category 5 Category 4 schools were newly identified Turnaround and Focus Schools and Category 5 schools were Turnaround and Focus schools that had not exited since initial identification in 2012 For a full explanation of the Turnaround and Focus School designations made in 2015-16 please see Schools Identified for Targeted Intervention and Support (Turnaround and Focus) In 2016-17 CSDE is not making any changes to Category 4 and 5 schools but is identifying all other schools as Category 1 Category 2 or Category 3 To begin the school classification process the following schools must be removed from the data file
Unified School District 1
Detention Centers and
Schools with 100 or fewer possible points The next step is to identify every school as either elementarymiddle or high school Any school that serves Grade 9 or above is a high school All other schools are considered elementarymiddle for this purpose Elementarymiddle and high schools are sorted separately from highest to lowest based on the Accountability Index
Schools in the top quartile based on the Accountability Index are preliminarily placed in Category 1
Schools in the middle two quartiles are preliminarily placed in Category 2
Schools in the bottom quartile based on the Accountability Index are placed in Category 3
Further review of Category 1 and Category 2 schools is necessary Any Category 1 or Category 2 school is lowered a category if one or more of the following are true
ndash an outlier achievement gap in ELA Math or Science ndash an outlier graduation rate gap based on the six-year graduation rate or ndash an assessment participation rate below 95 in any subject for All Students or
High Needs students
Finally schools that were identified as Category 4 and 5 schools in March 2016 maintain their category assignment regardless of their quartile position
Connecticut State Department of Education Using Accountability Results to Guide Improvement March 2016 Revised February 2017
Page 66 of 67
IDENTIFYING SCHOOLS OF DISTINCTION 2015-16
Annually the CSDE identifies a group of schools as Schools of Distinction based on a variety of factors In 2015-16 the identification centered on overall performance growth and change in overall performance from 2014-15 to 2015-16 The guidelines for each distinction type are included below HIGHEST PERFORMING Elementarymiddle and high schools are evaluated separately for the Highest Performing distinction For each school type the full list of Category 1-5 schools is sorted based on the Accountability Index from highest to lowest The top 10 become eligible for distinction status However all eligible schools must NOT have any of the following if the school is to be named a School of Distinction
bull an outlier achievement gap based on the difference in index scores between the High Needs subgroup and the non-High Needs group in ELA Math or Science
bull an outlier graduation rate gap based on the six-year graduation rate difference between the High Needs subgroup and the Non-High Needs group
bull an assessment participation rate below 95 for the All Students group or the High Needs subgroup in Math ELA or Science or
bull Category 4 or 5 status HIGHEST GROWTH Schools with Indicator 2 (academic growth) values are evaluated separately from schools without Indicator 2 For schools with Indicator 2 values there are two distinction types Highest Growth for All Students and Highest Growth for High Needs Students In both cases (All Students and High Needs) the percentage of possible points earned across ELA and Mathematics must be calculated separately for All Students and High Needs students respectively Schools are then sorted based on the percentage of possible points earned from highest to lowest
ndash All Students Schools in the top 10 of percentage of possible points earned across indicator 2 (academic growth) for the All Students group are eligible for a highest growth distinction
ndash High Needs Students Schools in the top 10 of percentage of possible points earned across indicator 2 (academic growth) for the High Needs students group are eligible for a highest growth distinction
The schools flagged as eligible for one or more distinctions in the highest growth category must NOT have any of the following if the school is to be named a School of Distinction
Connecticut State Department of Education Using Accountability Results to Guide Improvement March 2016 Revised February 2017
Page 67 of 67
bull an outlier achievement gap based on the difference in index scores between the High Needs subgroup and the non-High Needs group in ELA Math or Science
bull an outlier graduation rate gap based on the six-year graduation rate difference between the High Needs subgroup and the Non-High Needs group
bull an assessment participation rate in 2014-15 or 2015-16 below 95 for the All Students group or the High Needs subgroup in Math ELA or Science or
bull Category 4 or 5 status
Schools without Indicator 2 (academic growth) are eligible for distinction in the ldquoGreatest Improversrdquo category These schools have shown the greatest percentage improvement in their Accountability Index Percentage improvement is calculated for every school by subtracting the 2014-15 Accountability Index from the 2015-16 Accountability Index and dividing the difference by the 2014-15 Accountability Index Then every school is sorted from highest to lowest based on the percentage improvement in Accountability Index
ndash Greatest Improvers Schools in the top 10 of percentage improvement in
Accountability Index are eligible for the Greatest Improver distinction The schools flagged as eligible for this distinction category must NOT have any of the following if the school is to be named a School of Distinction
bull an outlier achievement gap in 2014-15 or 2015-16 based on the difference in index scores between the High Needs subgroup and the non-High Needs group in ELA Math or Science
bull an outlier graduation rate gap in 2014-15 (2012 cohort) or 2015-16 (2013 cohort) based on the six-year graduation rate difference between the High Needs subgroup and the Non-High Needs group
bull an assessment participation rate in 2014-15 or 2015-16 below 95 for the All Students group or the High Needs subgroup in Math ELA or Science or
bull Category 4 or 5 status
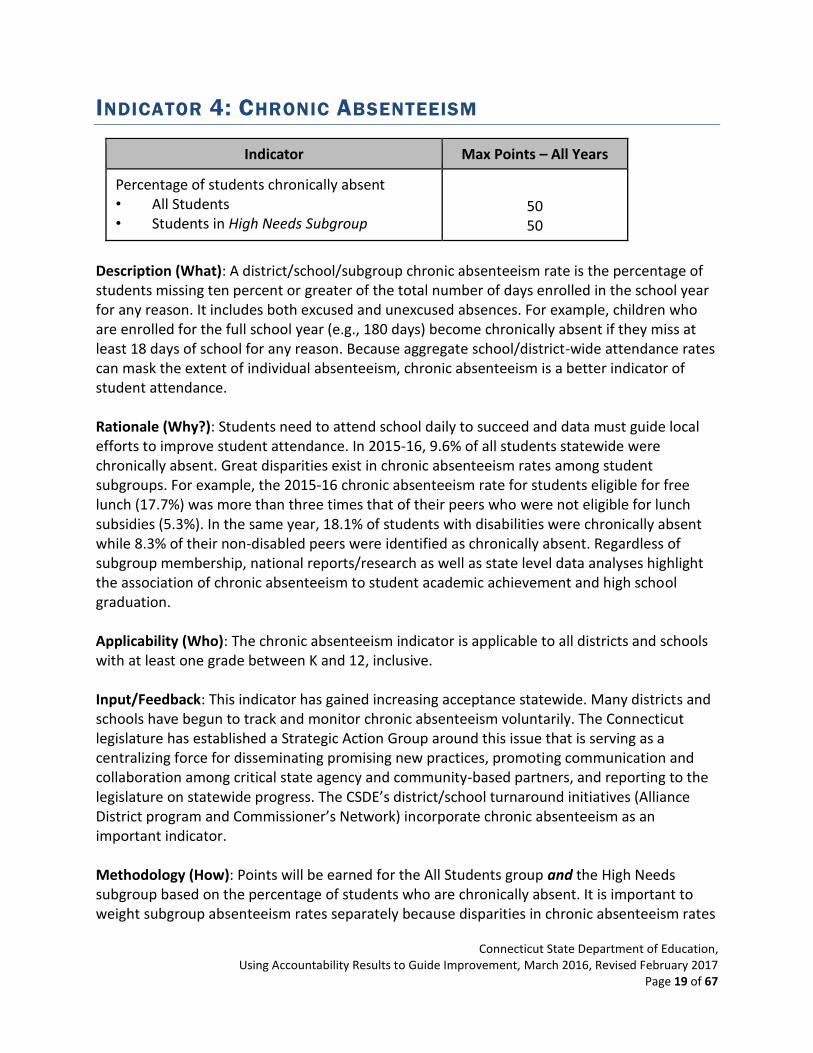
Connecticut State Department of Education Using Accountability Results to Guide Improvement March 2016 Revised February 2017
Page 58 of 67
Table 5 SAT Evidence-based Reading and Writing and Mathematics Highest (HOSS) and Lowest (LOSS) Obtainable Scale Scores and Range
LOSS HOSS RANGE
Evidence-Based Reading and Writing 200 800 600
Mathematics 200 800 600
HOW TO READ 2015-16 ACCOUNTABILITY REPORTS
The sample report below shows a districtrsquos performance on all indicators reported for the 2015-16 school year To support appropriate interpretation a brief explanation for every column heading is provided below the table
No Every indicator in the system is assigned a number When an indicator has subcomponents (eg All Students High Needs Students) a lettering system is used alongside the number
Indicator This column provides a brief explanation of what is being measured A full explanation of every indicator is included in the main section of this document (Using Accountability Results to Guide Improvement)
Connecticut State Department of Education Using Accountability Results to Guide Improvement March 2016 Revised February 2017
Page 60 of 67
IndexRate All components of indicator 1 are reported as performance indices All other indicators are reported as rates (ie percentages) The values presented in this column are the performance indices and rates earned by this district on the associated indicators
Target This value is the ultimate target established for all schools and districts statewide
Points Earned This value represents the points earned on the relevant indicator for the district In every case points are prorated based on the districtrsquos actual performance (ie index or rate) as compared to the target The rules used for prorating points for each of the indicators are explained in the main section of this document
Max Points This value is the maximum number of points possible on the associated indicator
Points Earned By indicator this column shows the percentage of the ldquomax pointsrdquo earned by this district
State Avg IndexRate The values presented in this column are the performance indices (Indicator 1) and rates earned by this district on the associated indicators
Many schools have one or more indicators that cannot be measured In these cases school reports will display ldquoNArdquo in the IndexRate field and there will be 0 in the Points Earned Max Points and Points Earned cells for those indicators The overall Accountability Index (in the district example above 776) is the percentage of total possible points earned on all available indicators Using the 2015-16 results all schools are classified into one of five categories The school-level Accountability Index is the primary factor used to determine placement with additional consideration given to participation rates achievement gaps and graduation rate gaps Note that the table above does not include Indicator 3 which is the participation rate for every subject for All Students and the High Needs group Participation data are reported in a separate table within the report
Connecticut State Department of Education Using Accountability Results to Guide Improvement March 2016 Revised February 2017
Page 61 of 67
The gap table below shows the ELA Math and Science index scores for High Needs students and Non-High Needs students in this district The size of the gap in index score points is reported and that difference is compared to the average gap across all districts statewide If the districtrsquos gap is more than one standard deviation beyond the state gap mean then the district is reported as having an ldquooutlier gaprdquo In the example below the size of the gaps in ELA Math and Science are all less than the standard used to identify outliers The same approach is used at the school level with the size of the gap compared to the average gap across all schools statewide Graduation rate gaps are determined in the same way The graduation rate gap is based on the difference in 6-year graduation rates for High Needs and Non-High Needs students As shown in the table below this district has a gap that is less than the standard used to identify graduation rate gap outliers While there are no points associated with the gap measures these data are used when placing schools in one of five categories Additionally schools are not eligible to be a School of Distinction if reports indicate that the school has an achievement gap or graduation rate gap this is considered an outlier
Connecticut State Department of Education Using Accountability Results to Guide Improvement March 2016 Revised February 2017
Page 62 of 67
The participation rate table below includes all of the data for Indicator 3 The expectation for all tested subjects across all tests (ie Smarter Balanced CTAA CMTCAPT Science CMTCAPT Skills Checklist Science and SAT) for All Students and High Needs students is at least 95 Any rate less than 95 means that the district or school did not meet participation requirements There are no points associated with Indicator 3 but like the gap indicators these data are used when placing schools in one of five categories Additionally schools are not eligible to be a School of Distinction if reports indicate that the school has not met participation requirements
Connecticut State Department of Education Using Accountability Results to Guide Improvement March 2016 Revised February 2017
Page 63 of 67
The bar chart below provides an at-a-glance view of the percentage of points earned on every indicator The bar at the top of the graphic is the Accountability Index representing the percentage of total possible points earned on all available indicators Please note that the subject-specific index scores are measured against a target of 75 The percentage of points earned is based on what percentage of the target is met Therefore the subject-specific percentages presented below are not index values Additionally it may be helpful for those sharing these reports to provide audiences with district or school context regarding how many students are represented in the All Students group and how many students are members of the High Needs group
Connecticut State Department of Education Using Accountability Results to Guide Improvement March 2016 Revised February 2017
Page 64 of 67
CONNECTICUT ASSESSMENT AND ACCOUNTABILITY REPORTING OF ldquoRECENTLY ARRIVEDrdquo
ENGLISH LEARNERS (ELS)
2014-15 School Year 2015-16 School Year and Beyond
Recently Arrived EL Definition
An EL enrolled for the first time in a US school for fewer than 12 calendar months at the time of testing
An EL enrolled for the first time in a US school for fewer than 24 calendar months at the time of testing
Assessment Participation Requirements
Recently arrived ELs MUST participate in mathematics and science and MAY be excused (ie exempt) from the English Language Arts (ELA) assessment
All ELs including all recently arrived ELs must participate in all assessments This includes mathematics ELA and science as well as the English language proficiency assessment
Assessment Reporting (typically in the summer months)
When 2014-15 results were released in September 2015 recently arrived ELs who may have taken ELA were not included in the results However when the agencyrsquos new portal EdSight is fully implemented recently arrived ELs will be included in all assessment results for schools and districts per federal law
Federal law requires that all ELs be included in assessment reporting regardless of time in a US school
Accountability ReportingmdashAchievement Status
Recently arrived ELs were not included in any of the Achievement Status (Indicator 1) calculations
Scores earned by recently arrived ELs are not included in Achievement Status (Indicator 1) calculations
Accountability ReportingmdashAchievement Growth
Measuring growth is not possible based only on 2014-15 data because this was the first administration of the operational Smarter Balanced assessment
Recently arrived ELs who have participated in two Smarter Balanced administrations are included in growth calculations (Indicator 2)
Accountability ReportingmdashParticipation Rates
Recently arrived ELs are not included in ELA participation rates because their participation was not a requirement However they are included in math and science rates
All students are included in participation rate calculations for all subjects
Note regarding EL subgroup reporting When reviewing accountability reports and exploring subgroup results for English learners in particular keep in mind the ldquoEL Flexrdquo group for accountability EL Flex includes students who were formerly identified as an EL Specifically any student who is not an EL at the time of testing but who had been a member of the EL subgroup in any time up to two years previous are included in the EL flexibility subgroup For Indicator 1 calculations this means that previous subgroup status is determined by using the EL PSIS collection variable from October January and June of the current and two prior school years If the student was identified as EL in any of those collections the student is included as an EL in Indicator 1 calculations
ASSIGNING SCHOOL CATEGORIES
As required under Connecticut General Statutes Section 10-223e Connecticut has implemented a five category school classification system In 2015-16 CSDE identified schools in Category 4 and Category 5 Category 4 schools were newly identified Turnaround and Focus Schools and Category 5 schools were Turnaround and Focus schools that had not exited since initial identification in 2012 For a full explanation of the Turnaround and Focus School designations made in 2015-16 please see Schools Identified for Targeted Intervention and Support (Turnaround and Focus) In 2016-17 CSDE is not making any changes to Category 4 and 5 schools but is identifying all other schools as Category 1 Category 2 or Category 3 To begin the school classification process the following schools must be removed from the data file
Unified School District 1
Detention Centers and
Schools with 100 or fewer possible points The next step is to identify every school as either elementarymiddle or high school Any school that serves Grade 9 or above is a high school All other schools are considered elementarymiddle for this purpose Elementarymiddle and high schools are sorted separately from highest to lowest based on the Accountability Index
Schools in the top quartile based on the Accountability Index are preliminarily placed in Category 1
Schools in the middle two quartiles are preliminarily placed in Category 2
Schools in the bottom quartile based on the Accountability Index are placed in Category 3
Further review of Category 1 and Category 2 schools is necessary Any Category 1 or Category 2 school is lowered a category if one or more of the following are true
ndash an outlier achievement gap in ELA Math or Science ndash an outlier graduation rate gap based on the six-year graduation rate or ndash an assessment participation rate below 95 in any subject for All Students or
High Needs students
Finally schools that were identified as Category 4 and 5 schools in March 2016 maintain their category assignment regardless of their quartile position
Connecticut State Department of Education Using Accountability Results to Guide Improvement March 2016 Revised February 2017
Page 66 of 67
IDENTIFYING SCHOOLS OF DISTINCTION 2015-16
Annually the CSDE identifies a group of schools as Schools of Distinction based on a variety of factors In 2015-16 the identification centered on overall performance growth and change in overall performance from 2014-15 to 2015-16 The guidelines for each distinction type are included below HIGHEST PERFORMING Elementarymiddle and high schools are evaluated separately for the Highest Performing distinction For each school type the full list of Category 1-5 schools is sorted based on the Accountability Index from highest to lowest The top 10 become eligible for distinction status However all eligible schools must NOT have any of the following if the school is to be named a School of Distinction
bull an outlier achievement gap based on the difference in index scores between the High Needs subgroup and the non-High Needs group in ELA Math or Science
bull an outlier graduation rate gap based on the six-year graduation rate difference between the High Needs subgroup and the Non-High Needs group
bull an assessment participation rate below 95 for the All Students group or the High Needs subgroup in Math ELA or Science or
bull Category 4 or 5 status HIGHEST GROWTH Schools with Indicator 2 (academic growth) values are evaluated separately from schools without Indicator 2 For schools with Indicator 2 values there are two distinction types Highest Growth for All Students and Highest Growth for High Needs Students In both cases (All Students and High Needs) the percentage of possible points earned across ELA and Mathematics must be calculated separately for All Students and High Needs students respectively Schools are then sorted based on the percentage of possible points earned from highest to lowest
ndash All Students Schools in the top 10 of percentage of possible points earned across indicator 2 (academic growth) for the All Students group are eligible for a highest growth distinction
ndash High Needs Students Schools in the top 10 of percentage of possible points earned across indicator 2 (academic growth) for the High Needs students group are eligible for a highest growth distinction
The schools flagged as eligible for one or more distinctions in the highest growth category must NOT have any of the following if the school is to be named a School of Distinction
Connecticut State Department of Education Using Accountability Results to Guide Improvement March 2016 Revised February 2017
Page 67 of 67
bull an outlier achievement gap based on the difference in index scores between the High Needs subgroup and the non-High Needs group in ELA Math or Science
bull an outlier graduation rate gap based on the six-year graduation rate difference between the High Needs subgroup and the Non-High Needs group
bull an assessment participation rate in 2014-15 or 2015-16 below 95 for the All Students group or the High Needs subgroup in Math ELA or Science or
bull Category 4 or 5 status
Schools without Indicator 2 (academic growth) are eligible for distinction in the ldquoGreatest Improversrdquo category These schools have shown the greatest percentage improvement in their Accountability Index Percentage improvement is calculated for every school by subtracting the 2014-15 Accountability Index from the 2015-16 Accountability Index and dividing the difference by the 2014-15 Accountability Index Then every school is sorted from highest to lowest based on the percentage improvement in Accountability Index
ndash Greatest Improvers Schools in the top 10 of percentage improvement in
Accountability Index are eligible for the Greatest Improver distinction The schools flagged as eligible for this distinction category must NOT have any of the following if the school is to be named a School of Distinction
bull an outlier achievement gap in 2014-15 or 2015-16 based on the difference in index scores between the High Needs subgroup and the non-High Needs group in ELA Math or Science
bull an outlier graduation rate gap in 2014-15 (2012 cohort) or 2015-16 (2013 cohort) based on the six-year graduation rate difference between the High Needs subgroup and the Non-High Needs group
bull an assessment participation rate in 2014-15 or 2015-16 below 95 for the All Students group or the High Needs subgroup in Math ELA or Science or
bull Category 4 or 5 status

Connecticut State Department of Education Using Accountability Results to Guide Improvement March 2016 Revised February 2017
Page 64 of 67
CONNECTICUT ASSESSMENT AND ACCOUNTABILITY REPORTING OF ldquoRECENTLY ARRIVEDrdquo
ENGLISH LEARNERS (ELS)
2014-15 School Year 2015-16 School Year and Beyond
Recently Arrived EL Definition
An EL enrolled for the first time in a US school for fewer than 12 calendar months at the time of testing
An EL enrolled for the first time in a US school for fewer than 24 calendar months at the time of testing
Assessment Participation Requirements
Recently arrived ELs MUST participate in mathematics and science and MAY be excused (ie exempt) from the English Language Arts (ELA) assessment
All ELs including all recently arrived ELs must participate in all assessments This includes mathematics ELA and science as well as the English language proficiency assessment
Assessment Reporting (typically in the summer months)
When 2014-15 results were released in September 2015 recently arrived ELs who may have taken ELA were not included in the results However when the agencyrsquos new portal EdSight is fully implemented recently arrived ELs will be included in all assessment results for schools and districts per federal law
Federal law requires that all ELs be included in assessment reporting regardless of time in a US school
Accountability ReportingmdashAchievement Status
Recently arrived ELs were not included in any of the Achievement Status (Indicator 1) calculations
Scores earned by recently arrived ELs are not included in Achievement Status (Indicator 1) calculations
Accountability ReportingmdashAchievement Growth
Measuring growth is not possible based only on 2014-15 data because this was the first administration of the operational Smarter Balanced assessment
Recently arrived ELs who have participated in two Smarter Balanced administrations are included in growth calculations (Indicator 2)
Accountability ReportingmdashParticipation Rates
Recently arrived ELs are not included in ELA participation rates because their participation was not a requirement However they are included in math and science rates
All students are included in participation rate calculations for all subjects
Note regarding EL subgroup reporting When reviewing accountability reports and exploring subgroup results for English learners in particular keep in mind the ldquoEL Flexrdquo group for accountability EL Flex includes students who were formerly identified as an EL Specifically any student who is not an EL at the time of testing but who had been a member of the EL subgroup in any time up to two years previous are included in the EL flexibility subgroup For Indicator 1 calculations this means that previous subgroup status is determined by using the EL PSIS collection variable from October January and June of the current and two prior school years If the student was identified as EL in any of those collections the student is included as an EL in Indicator 1 calculations
ASSIGNING SCHOOL CATEGORIES
As required under Connecticut General Statutes Section 10-223e Connecticut has implemented a five category school classification system In 2015-16 CSDE identified schools in Category 4 and Category 5 Category 4 schools were newly identified Turnaround and Focus Schools and Category 5 schools were Turnaround and Focus schools that had not exited since initial identification in 2012 For a full explanation of the Turnaround and Focus School designations made in 2015-16 please see Schools Identified for Targeted Intervention and Support (Turnaround and Focus) In 2016-17 CSDE is not making any changes to Category 4 and 5 schools but is identifying all other schools as Category 1 Category 2 or Category 3 To begin the school classification process the following schools must be removed from the data file
Unified School District 1
Detention Centers and
Schools with 100 or fewer possible points The next step is to identify every school as either elementarymiddle or high school Any school that serves Grade 9 or above is a high school All other schools are considered elementarymiddle for this purpose Elementarymiddle and high schools are sorted separately from highest to lowest based on the Accountability Index
Schools in the top quartile based on the Accountability Index are preliminarily placed in Category 1
Schools in the middle two quartiles are preliminarily placed in Category 2
Schools in the bottom quartile based on the Accountability Index are placed in Category 3
Further review of Category 1 and Category 2 schools is necessary Any Category 1 or Category 2 school is lowered a category if one or more of the following are true
ndash an outlier achievement gap in ELA Math or Science ndash an outlier graduation rate gap based on the six-year graduation rate or ndash an assessment participation rate below 95 in any subject for All Students or
High Needs students
Finally schools that were identified as Category 4 and 5 schools in March 2016 maintain their category assignment regardless of their quartile position
Connecticut State Department of Education Using Accountability Results to Guide Improvement March 2016 Revised February 2017
Page 66 of 67
IDENTIFYING SCHOOLS OF DISTINCTION 2015-16
Annually the CSDE identifies a group of schools as Schools of Distinction based on a variety of factors In 2015-16 the identification centered on overall performance growth and change in overall performance from 2014-15 to 2015-16 The guidelines for each distinction type are included below HIGHEST PERFORMING Elementarymiddle and high schools are evaluated separately for the Highest Performing distinction For each school type the full list of Category 1-5 schools is sorted based on the Accountability Index from highest to lowest The top 10 become eligible for distinction status However all eligible schools must NOT have any of the following if the school is to be named a School of Distinction
bull an outlier achievement gap based on the difference in index scores between the High Needs subgroup and the non-High Needs group in ELA Math or Science
bull an outlier graduation rate gap based on the six-year graduation rate difference between the High Needs subgroup and the Non-High Needs group
bull an assessment participation rate below 95 for the All Students group or the High Needs subgroup in Math ELA or Science or
bull Category 4 or 5 status HIGHEST GROWTH Schools with Indicator 2 (academic growth) values are evaluated separately from schools without Indicator 2 For schools with Indicator 2 values there are two distinction types Highest Growth for All Students and Highest Growth for High Needs Students In both cases (All Students and High Needs) the percentage of possible points earned across ELA and Mathematics must be calculated separately for All Students and High Needs students respectively Schools are then sorted based on the percentage of possible points earned from highest to lowest
ndash All Students Schools in the top 10 of percentage of possible points earned across indicator 2 (academic growth) for the All Students group are eligible for a highest growth distinction
ndash High Needs Students Schools in the top 10 of percentage of possible points earned across indicator 2 (academic growth) for the High Needs students group are eligible for a highest growth distinction
The schools flagged as eligible for one or more distinctions in the highest growth category must NOT have any of the following if the school is to be named a School of Distinction
Connecticut State Department of Education Using Accountability Results to Guide Improvement March 2016 Revised February 2017
Page 67 of 67
bull an outlier achievement gap based on the difference in index scores between the High Needs subgroup and the non-High Needs group in ELA Math or Science
bull an outlier graduation rate gap based on the six-year graduation rate difference between the High Needs subgroup and the Non-High Needs group
bull an assessment participation rate in 2014-15 or 2015-16 below 95 for the All Students group or the High Needs subgroup in Math ELA or Science or
bull Category 4 or 5 status
Schools without Indicator 2 (academic growth) are eligible for distinction in the ldquoGreatest Improversrdquo category These schools have shown the greatest percentage improvement in their Accountability Index Percentage improvement is calculated for every school by subtracting the 2014-15 Accountability Index from the 2015-16 Accountability Index and dividing the difference by the 2014-15 Accountability Index Then every school is sorted from highest to lowest based on the percentage improvement in Accountability Index
ndash Greatest Improvers Schools in the top 10 of percentage improvement in
Accountability Index are eligible for the Greatest Improver distinction The schools flagged as eligible for this distinction category must NOT have any of the following if the school is to be named a School of Distinction
bull an outlier achievement gap in 2014-15 or 2015-16 based on the difference in index scores between the High Needs subgroup and the non-High Needs group in ELA Math or Science
bull an outlier graduation rate gap in 2014-15 (2012 cohort) or 2015-16 (2013 cohort) based on the six-year graduation rate difference between the High Needs subgroup and the Non-High Needs group
bull an assessment participation rate in 2014-15 or 2015-16 below 95 for the All Students group or the High Needs subgroup in Math ELA or Science or
bull Category 4 or 5 status

Connecticut State Department of Education Using Accountability Results to Guide Improvement March 2016 Revised February 2017
Page 67 of 67
bull an outlier achievement gap based on the difference in index scores between the High Needs subgroup and the non-High Needs group in ELA Math or Science
bull an outlier graduation rate gap based on the six-year graduation rate difference between the High Needs subgroup and the Non-High Needs group
bull an assessment participation rate in 2014-15 or 2015-16 below 95 for the All Students group or the High Needs subgroup in Math ELA or Science or
bull Category 4 or 5 status
Schools without Indicator 2 (academic growth) are eligible for distinction in the ldquoGreatest Improversrdquo category These schools have shown the greatest percentage improvement in their Accountability Index Percentage improvement is calculated for every school by subtracting the 2014-15 Accountability Index from the 2015-16 Accountability Index and dividing the difference by the 2014-15 Accountability Index Then every school is sorted from highest to lowest based on the percentage improvement in Accountability Index
ndash Greatest Improvers Schools in the top 10 of percentage improvement in
Accountability Index are eligible for the Greatest Improver distinction The schools flagged as eligible for this distinction category must NOT have any of the following if the school is to be named a School of Distinction
bull an outlier achievement gap in 2014-15 or 2015-16 based on the difference in index scores between the High Needs subgroup and the non-High Needs group in ELA Math or Science
bull an outlier graduation rate gap in 2014-15 (2012 cohort) or 2015-16 (2013 cohort) based on the six-year graduation rate difference between the High Needs subgroup and the Non-High Needs group
bull an assessment participation rate in 2014-15 or 2015-16 below 95 for the All Students group or the High Needs subgroup in Math ELA or Science or
bull Category 4 or 5 status