Theories of Homicide Victimization - CT.gov
16
Connecticut Department of Public Health - Keeping Connecticut Healthy The Connecticut Violent Death Reporting System and Homicide Victimology in Connecticut 2015 to 2021* Presented by Michael Makowski, MPH October 15, 2021 Injury and Violence Surveillance Unit Community, Family Health and Prevention Section Connecticut Department of Public Health
-
Upload
khangminh22 -
Category
Documents
-
view
0 -
download
0
Transcript of Theories of Homicide Victimization - CT.gov

Connecticut Department of Public Health - Keeping Connecticut Healthy
The Connecticut Violent Death Reporting System and Homicide Victimology in
Connecticut 2015 to 2021*
Presented by Michael Makowski, MPH October 15, 2021
Injury and Violence Surveillance UnitCommunity, Family Health and Prevention Section
Connecticut Department of Public Health

Connecticut Department of Public Health - Keeping Connecticut Healthy
CTVDRS Data about Homicide Victims
The Connecticut Violent Death Reporting System (CTVDRS) collects data about the victims of homicide; limited information about perpetrator
• Data sources: LE reports, Supplementary Homicide Reports, Family Violence ( DESPP), OCME investigation, autopsy and toxicology data
• Data collection began in 2015
* Data from Connecticut Violent Death Reporting System (CTVDRS) 2015 to September 30 th, 2021

Connecticut Department of Public Health - Keeping Connecticut Healthy
Homicide Rates In Connecticut 2015 to Present
• 2020 and 2021 data is preliminary* Rates are provisional, currently using 2019 population data for CT
• As September 30,2021 there were 131 homicides2015 2016 2017 2018 2019 2020 2021
Number of Homicides 129 87 124 97 122 157 131
Crude Homicide Rates 3.59 2.43 3.46 2.72 3.42 4.40 3.70
0.00
0.50
1.00
1.50
2.00
2.50
3.00
3.50
4.00
4.50
5.00
0
20
40
60
80
100
120
140
160
180
Rat
e o
f H
om
icid
e in
CT
per
10
0,0
00
po
p.
Nu
mb
er o
f H
om
iides
per
Yea
r
Crude Homicide Rates and Numbers for CT 2015 to 2021
Number of Homicides Crude Homicide Rates

Connecticut Department of Public Health - Keeping Connecticut Healthy
Comparison of Homicide Rates Pre-Pandemic (2015 to 2019) to Pandemic (2020) by Race/Ethnicity
Comparison of Homicide Rates Pre-Pandemic (2015 to 2019)to Pandemic (2020) by Race/EthnicityRace/Ethnicity Average
Number
Homicides
(2015 to
2019)
Crude Rate
*2015-2019
Crude
Rate*2020
Number of
Homicides
2020
Rate
Difference
2015 to 2019
Compared to
2020
Non-Hispanic
Black
51 14.0 20.6 76 + 47%
Non-Hispanic
White
33 1.40 1.40 33 No change
Hispanic 27 4.60 7.82 47 + 70 %
*per 100,000 CT population
14.0
1.37
0.05
4.60
0 2 4 6 8 10 12 14 16
Non-Hispanic Black
Non-Hispanic White
Non-Hispanic, Other*
Hispanic
Rate of Homicides by Race and Ethnicity per 100,000 Population, CT 2015-2019

Connecticut Department of Public Health - Keeping Connecticut Healthy
Homicide 2015 to 2019
437
73
49
Homicides By Sex, CT 2015 - 2019
Male Homicide Female Homicide (non-IPV)
Female IPV Homicide

Connecticut Department of Public Health - Keeping Connecticut Healthy
CTVDRS Data Lethal Means 2015 to 2021
Years Weapon Type Number of
Homicides by
Weapon Type
Total Number of
Homicides for 2015 to
2019
Rate Weapon Death
per 100 Homicides
Pre-Pandemic
(2015to 2019)
Firearm 343 559 61.3
Sharp Force
Injury (Stabbing)
69 559 12.3
Pandemic2020 Firearm 108 157 68.7
Sharp Force
Injury (Stabbing)
31 157 19.7
2021 Firearm 96 131 73.2Sharp Force
Injury (Stabbing)
13 131 9.9

Connecticut Department of Public Health - Keeping Connecticut Healthy
Circumstances of Homicide/ Possible Areas for Intervention
• For 2015 to 2019 homicide circumstances were known for 80% (N=452)of the cases ( LE and OCME reports)
• Gang* or groups involvement: rate 9 per 100 homicides
* Defined by law enforcement as organized gangs as Bloods, Crips and Latin Kings
Circumstances Number of
Occurrences
Rate per 100
Homicides
Disputes/Arguments 167 36.9
Commission of a
Crime:
Assault 132 29.2
Robbery 63 13.9
Drug Trade 48 10.6
Drug Involvement 86 19.0
Substance Use in Homicides 2015 to 2021Rate of Positive Drug Results from Blood at the Time of Autopsy
2015 to 2019 (N= Number of Homicides (559))
Drug Number of Positives
Rate per 100 Homicides
Marijuana 150 52.0
Alcohol 66 22.9
Cocaine 48 16.6
Opiates 42 14.5
Benzodiazepines 12 4.5
Drug Number of
Positives
Rate per 100
Homicides
Marijuana 171 30.5
Alcohol 135 24.1
Opiates 66 11.8
Cocaine 56 10.1
Benzodiazepines 41 7.3
Rate of Positive Drug Results from Blood at the Time of Autopsy
2020 to 2021 (N= Number of Homicides (288))

Connecticut Department of Public Health - Keeping Connecticut Healthy
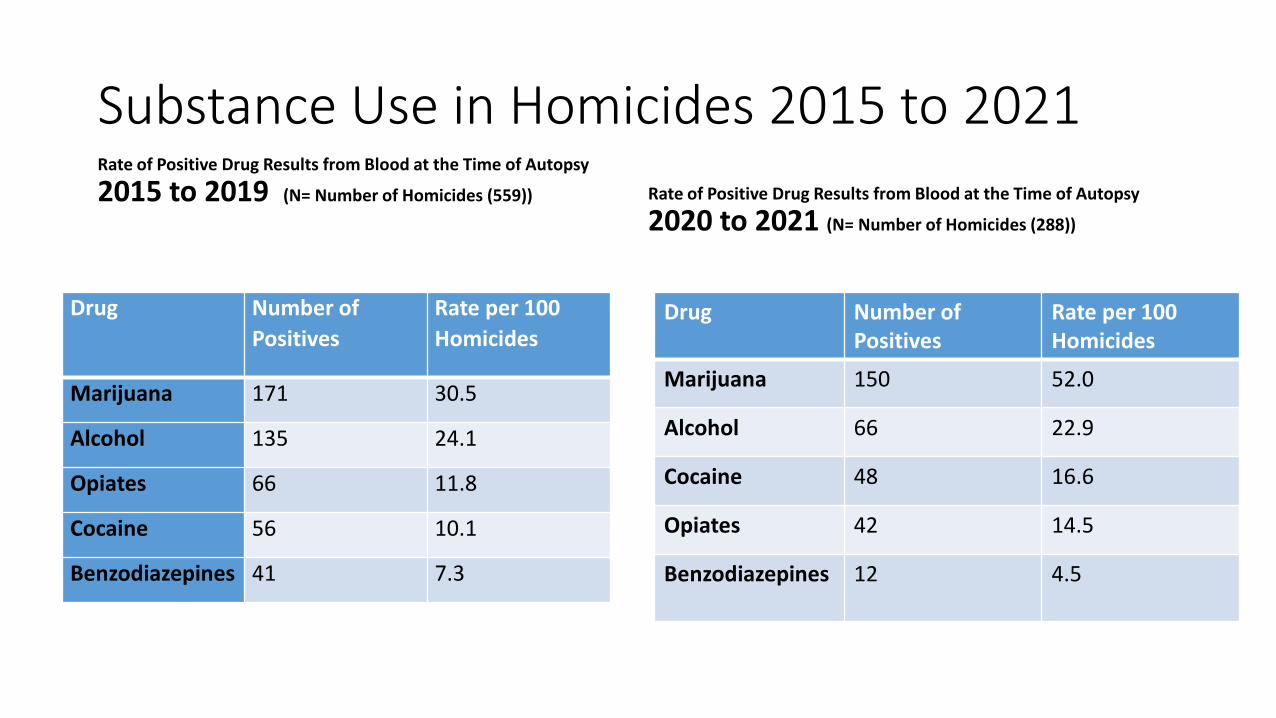
Substance Use in Homicides by Race/Ethnicity
Number of Positive Marijuana Results by Race by Year * Rate of Positive Marijuana Results at the Time of Autopsy by Race per 100 Homicides
* Note: Rates calculated from counts less than 20 should be interpreted with caution
due to the variability of small numbers resulting in low reliability of rates
2018 2019 2020 2021
Black NH 19 27 44 49
Hispanic 7 6 25 14
White NH 3 7 10 7
Other NH (
Asian, Native
American,
Pacific
Islander)
0 1 0 1
Number of
Homicides
97 122 157 131
2018 2019 2020 2021
Black NH 19.5 22.1 28 37.4
Hispanic 7.2 4.9 15.9 6.8
White NH 3.1 5.7 6.3 1.7
19.522.1
28
37.4
7.24.9
15.9
6.83.1
5.7
6.3
1.7
0
5
10
15
20
25
30
35
40
Rat
e o
f P
osi
tive
Mar
ijuan
a Te
st p
er 1
00
Ho
mic
ides
in
CT
Year
Comparision Of Positive Marijuana Rate for Homicide Victims by Race
Black NH Hispanic White NH

Connecticut Department of Public Health - Keeping Connecticut Healthy
Substance Use in Homicides by Race/Ethnicity
Number of Alcohol Results (BAC ≥ .08 )by Race by Year * Rate of Alcohol Results (BAC ≥ .08 ) by Race per 100 Homicides
*note: Rates calculated from counts less than 20 should be interpreted with caution
due to the variability of small numbers resulting in low reliability of rates
2018 2019 2020 2021
Black NH 7 12 19 10
Hispanic 6 6 12 5
White NH 13 15 14 6
Other NH (
Asian,
Native
American,
Pacific
Islander)
0 0 0 0
Number of
Homicides
97 122 157 116
2018 2019 2020 2021
Hispanic 6.1 4.9 7.6 3.8
Black NH 7.2 9.8 12.1 7.6
White NH 13.4 12.2 8.9 4.5
Other NH(Asian,NativeAmerican)
0 0 0 0
02468
10121416
Rate of BAC Greater Than Equal To .08 in Blood of Homicide Victims per 100 Homicides
Rate of BAC≥ .08 Results in Blood of Homicide Victims at the Time Autopsy per 100 Homicides
by Race
Hispanic Black NH White NH Other NH(Asian,Native American)

Connecticut Department of Public Health - Keeping Connecticut Healthy
Substance Use in Homicides by Race/Ethnicity
Number of Positive Opiate Results *
* Note: Rates calculated from counts less than 20 should be interpreted with caution
due to the variability of small numbers resulting in low reliability of rates
2018 2019 2020 2021
Black NH 4 5 8 9
Hispanic 3 4 7 2
White NH 8 13 8 8
Other NH (
Asian,
Native
American,
Pacific
Islander)
0 0 0 0
Number of
Homicides
97 122 157 116
2018 2019 2020 2021
Hispanic 3 3.2 4.4 1.5
Black NH 4.1 4.1 5.1 6.8
White NH 8.2 10.6 5.1 6.1
Other NH(Asian,NativeAmerican)
0 0 0 0
02468
1012
Rate of Positive Opiate Results per 100 Homicides
Rate of Opiate Positive Results in Blood of Homicide Victims at the Time of Autopsy per 100
Homicides by Race
Hispanic Black NH White NH Other NH(Asian,Native American)

Connecticut Department of Public Health - Keeping Connecticut Healthy
Substance Use in Homicides by Race/Ethnicity
Number of Positive Cocaine Results *
* Note: Rates calculated from counts less than 20 should be interpreted with caution
due to the variability of small numbers resulting in low reliability of rates
2018 2019 2020 2021
Black NH 6 3 7 6
Hispanic 6 6 10 4
White NH 7 13 12 9
Other NH (
Asian,
Native
American,
Pacific
Islander)
0 0 0 0
Number of
Homicides
97 122 157 116
2018 2019 2020 2021
Hispanic 6 4.9 6.3 3
Black NH 6 2.4 4.4 4.5
White NH 7 10.6 7.6 6.8
Other NH(Asian,NativeAmerican)
0 0 0 0
02468
1012
Rate of Positive Cocaine Results per 100 Homicides
Rates of Cocaine Positive Results in Blood of Homicide Victims at Time of Autopsy per 100
Homicides by Race
Hispanic Black NH White NH Other NH(Asian,Native American)

Connecticut Department of Public Health - Keeping Connecticut Healthy
Substance Use in Homicides by Race/Ethnicity
Number of Positive Benzodiazepine Results *
* Note: Rates calculated from counts less than 20 should be interpreted with caution
due to the variability of small numbers resulting in low reliability of rates
2018 2019 2020 2021
Black NH 2 4 0 2
Hispanic 3 3 3 0
White NH 9 8 5 2
Other NH (
Asian,
Native
American,
Pacific
Islander)
0 0 0 0
Number of
Homicides
97 122 157 116
2018 2019 2020 2021
Hispanic 3 2.4 1.9 0
Black NH 2 3.2 0 1.5
White NH 9 6.5 3.1 1.5
Other NH(Asian,NativeAmerican)
0 0 0 0
0123456789
10
Rate of Positive Benzodiazepines Results per 100 Homicides
Rates of Benzodiazepine Results in Blood of Homicide Victims at Time of Autopsy per 100 Homicide by Race
Hispanic Black NH White NH Other NH(Asian,Native American)

Connecticut Department of Public Health - Keeping Connecticut Healthy
Theories of Homicide Victimization
A. Subculture of Violence: theme of violence that make up the life-style, the socialization process, interpersonal relationships of individuals living in similar conditions; not necessary to use violence to solve problems, but have greater exposure, susceptibility to violent victimization; retaliation a major theme
B. Informal Social Control: a form of self-help “ the expression of a grievance by unilateral aggression such as personal violence”; used by people of lower social status who have reduced access to formal control institutions-police; offenders may use crime as a means of retaliation or censure when they cannot or will not seek police help

Connecticut Department of Public Health - Keeping Connecticut Healthy
C. Lifestyle- an individual’s lifestyle influences their exposure tohigh-risk situations, placing them as a potential target forvictimization
1. history of alcohol, and drug misuse2. gang membership3. criminal history ( incarceration, arrests)4. routine activities- convergence of space and time of motivated
offenders, and suitable targetsAll three theories share a common theme: the convergence ofvulnerable people, risky people and risky places
Theories of Homicide Victimization

Connecticut Department of Public Health - Keeping Connecticut Healthy
The Connecticut Homicide Victimology
Questions?
Contact:Susan Logan, MS, MPH; Supervising [email protected]
Mike Makowski, MPH; [email protected]
Main office phone: 860-509-8251