BrM523UserManualpdf.pdf - CT.gov
510
-
Upload
khangminh22 -
Category
Documents
-
view
0 -
download
0
Transcript of BrM523UserManualpdf.pdf - CT.gov


Table of ContentsRevision History 6
Getting Started 7What is AASHTOWare Bridge Management? 8Documentation Guide 9
System Basics 10Logging In 11BrM Navigation 12User Profile 14Message Containers 15
Bridges 16View List 17Manage Layouts 23Manage Filters 26Edit Filter 26Edit SQL 29
New Inspection 31Suff Rate 33Validate 35Create Structure 37Copy Structure 39Remove Struct 40Manage Bridge Groups 41Bridge Groups 41Bridge Group Details 43Add/Remove Roadways 44Setup Bridge Groups 46
Mapping 47Reports 49Generate 50Register 54
Tunnels 57Tunnel List 58Tunnel Inspection 60Tunnel Inventory 62New Tunnel Inspection 64
Admin 65Security 66Users 67Groups 71Roles 74

Permissions 81Databases 83Reports 85Password Rules 86
General Config 87Parameters 87Options 90Export Options 97Data Dict. 98Checked Out Bridges 100Logging 101Standard 102Agency 111Visual Form Editor 121Page Export 136Equation Editor 138Set Editor 143Validation Editor 145
Mapping 148Sync Mapping 148Map Options 149
Modeling Config 150Element Specifications 150Element-Child Linking 154Project Categories 155Deterioration Profiles 157Deterioration Modeling 159Elements 162Assessment 165Benefit Groups 167Actions Defs 173Cost Index 177Network Policies 178Advanced Formulas 184Utility 186Weights Profile 189NBI Deterioration Models 191NBI Conversion Profiles 193Preservation and Replacement Policy 196LCCA Policy Rules 198LCCA Assign Policies 202Subdivision Profiles 203Executive Summary 205
Tunnels 208
Asset Element Definitions 208Asset Element-Child Linking 211
Inspection 212Condition 213Appraisal 226Inventory 235Admin 235Design 240Roads 244Agency Bridge Items 251
Schedule 253Work 258Work Candidates 258Project Information 263
Multimedia 265Assessments 270Element Condition Ratings 275
Gateway 276Export 277Import 279Check Out 280Check In 281Override 282Tunnels 284Import/Export 284
Analysis 286Work Candidates 287Bridge Analysis 287Reverse Calculation 293Needs List 298Comparison Groups 299
Utility Value 303LCCA 304
Projects 309Project List 310Manage Layouts 314Manage Filters 317Edit Filter 317Edit SQL 320
Create/Edit Project 322Query 322Summary 325Analysis 328Management 330

Upload Project 334Combine Projects 336Split Project 337Manage Funding 339Funding List 339Create/Edit Funding Sources 340
Programs 343Program List 344Create-Edit Programs 346Assign Projects 351Performance Measures 353Funding Allocation 357Program Planning 361Program Results 364Executive Summary 369Create-Edit Scenarios 371Scenario Explorer 372
Appendix A 374User Group Training 375
Appendix B 437Scour Mitigation Program 438Inspection Data 438Utility 439Deterioration 443Network Policies 449Lifecycle 460Funding Sources 461Segments 462Programs 463Program Results 469Scenario Setup 473
Appendix C 478Preservation Program 479Element Data 479Utility 482Deterioration 486Network Policies 488Lifecycle & Funding Sources 493Funding Sources 494Segments 495Programs 496Program Results 500Scenario Setup 504

Change Date Description
- 6 -
Revision History

Getting Started- The Getting Started section of the manualprovides an overview of the AASHTOWareBridge Management software and its availabledocumentation.
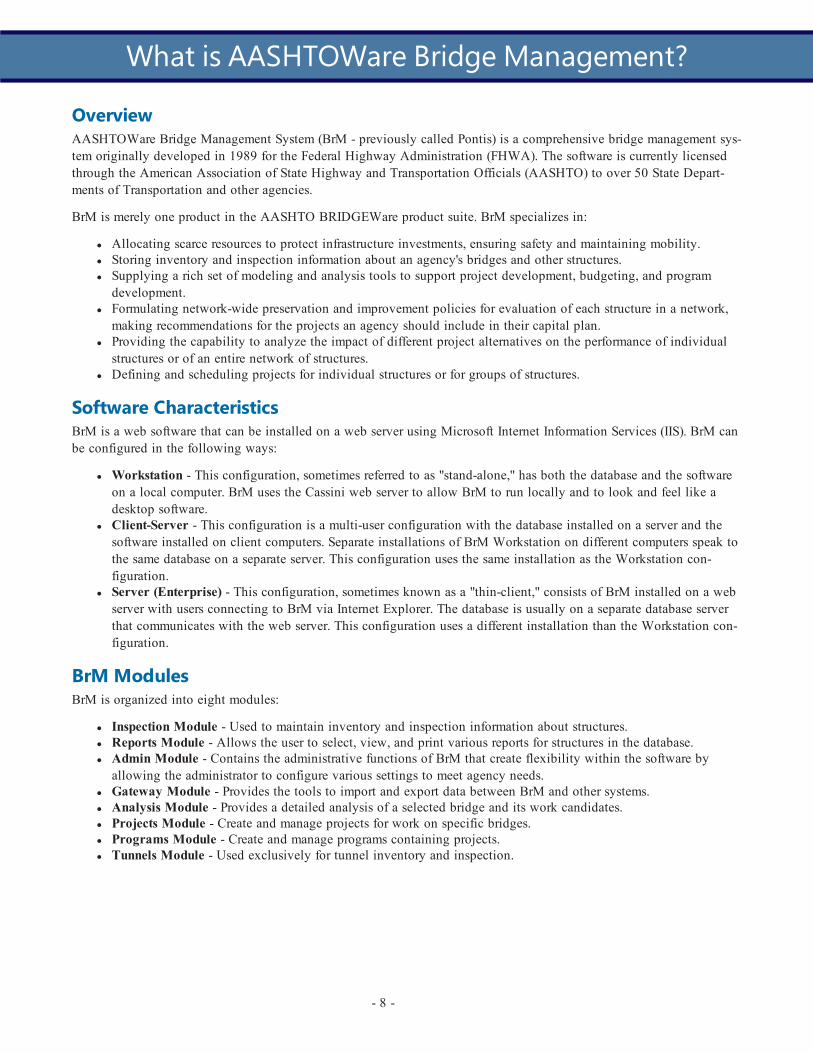
OverviewAASHTOWare Bridge Management System (BrM - previously called Pontis) is a comprehensive bridge management sys-tem originally developed in 1989 for the Federal Highway Administration (FHWA). The software is currently licensedthrough the American Association of State Highway and Transportation Officials (AASHTO) to over 50 State Depart-ments of Transportation and other agencies.
BrM is merely one product in the AASHTO BRIDGEWare product suite. BrM specializes in:
l Allocating scarce resources to protect infrastructure investments, ensuring safety and maintaining mobility.l Storing inventory and inspection information about an agency's bridges and other structures.l Supplying a rich set of modeling and analysis tools to support project development, budgeting, and programdevelopment.
l Formulating network-wide preservation and improvement policies for evaluation of each structure in a network,making recommendations for the projects an agency should include in their capital plan.
l Providing the capability to analyze the impact of different project alternatives on the performance of individualstructures or of an entire network of structures.
l Defining and scheduling projects for individual structures or for groups of structures.
Software CharacteristicsBrM is a web software that can be installed on a web server using Microsoft Internet Information Services (IIS). BrM canbe configured in the following ways:
l Workstation - This configuration, sometimes referred to as "stand-alone," has both the database and the softwareon a local computer. BrM uses the Cassini web server to allow BrM to run locally and to look and feel like adesktop software.
l Client-Server - This configuration is a multi-user configuration with the database installed on a server and thesoftware installed on client computers. Separate installations of BrM Workstation on different computers speak tothe same database on a separate server. This configuration uses the same installation as the Workstation con-figuration.
l Server (Enterprise) - This configuration, sometimes known as a "thin-client," consists of BrM installed on a webserver with users connecting to BrM via Internet Explorer. The database is usually on a separate database serverthat communicates with the web server. This configuration uses a different installation than the Workstation con-figuration.
BrM ModulesBrM is organized into eight modules:
l Inspection Module - Used to maintain inventory and inspection information about structures.l Reports Module - Allows the user to select, view, and print various reports for structures in the database.l Admin Module - Contains the administrative functions of BrM that create flexibility within the software byallowing the administrator to configure various settings to meet agency needs.
l Gateway Module - Provides the tools to import and export data between BrM and other systems.l Analysis Module - Provides a detailed analysis of a selected bridge and its work candidates.l Projects Module - Create and manage projects for work on specific bridges.l Programs Module - Create and manage programs containing projects.l Tunnels Module - Used exclusively for tunnel inventory and inspection.
- 8 -
What is AASHTOWare Bridge Management?

BrM documentation consists of this user manual, an installation guide, the online help system, and examples documents.
l User Manual - The BrM User Manual provides instructions on using each of the BrM tasks. It is intended toserve as a self-contained reference for most BrM users.
l Installation Guide - The BrM Installation Guide provides instructions on installing the BrM system and properlysetting up the server.
l Online Help System - The BrM Online Help System includes the same material as the BrM User Manual but it is
accessible through the software for easy access to necessary information. Clicking on a page's icon withinthe application will send the user directly to that page's help section.
l Examples Documents - The BrM Examples documents provide real-world examples to help users understand howto use specific tasks in BrM and how multiple tasks work together to accomplish specific goals.
- 9 -
Documentation Guide

System Basics- The System Basics section of the manualdescribes the process of logging in to BrM andexplains BrM's layout and navigation.
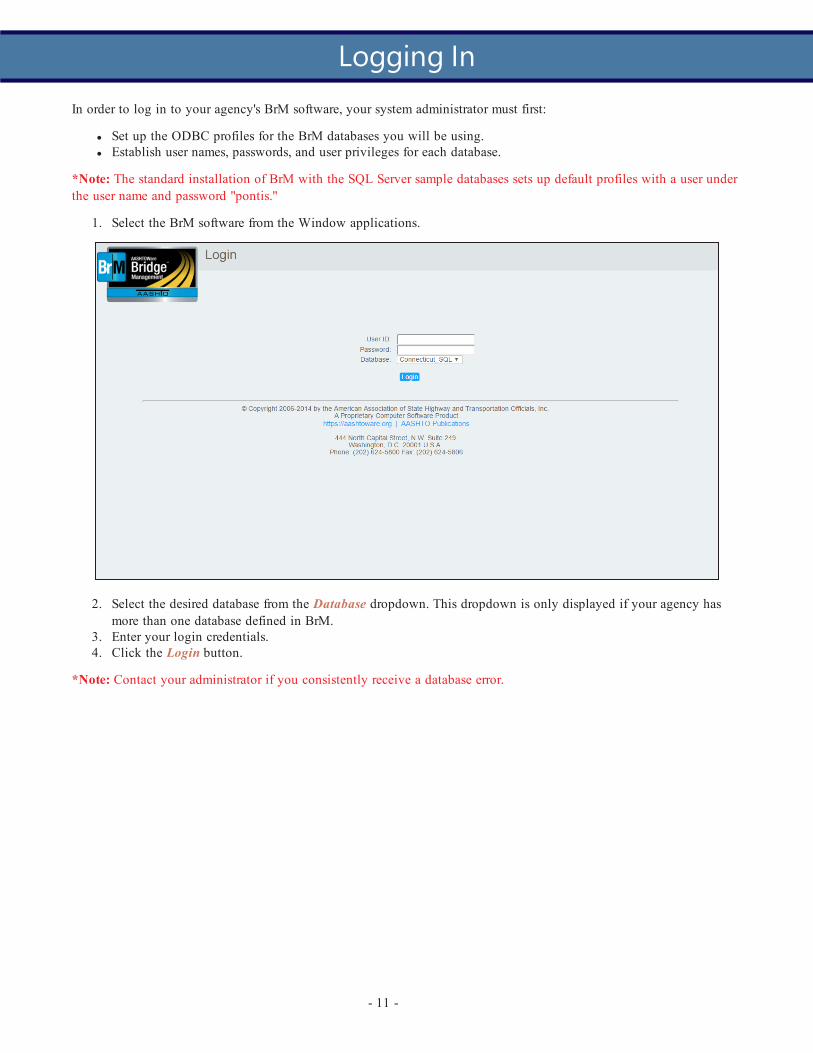
In order to log in to your agency's BrM software, your system administrator must first:
l Set up the ODBC profiles for the BrM databases you will be using.l Establish user names, passwords, and user privileges for each database.
*Note: The standard installation of BrM with the SQL Server sample databases sets up default profiles with a user underthe user name and password "pontis."
1. Select the BrM software from the Window applications.
2. Select the desired database from the Database dropdown. This dropdown is only displayed if your agency hasmore than one database defined in BrM.
3. Enter your login credentials.4. Click the Login button.
*Note: Contact your administrator if you consistently receive a database error.
- 11 -
Logging In

While each page within the software is different, the basic format the user will see is always the same. On any givenpage, the user will see the BrM header, footer, tabs, tasks, groupings, and controls.
BrM Navigation
Object Description
Header
The header contains the AASHTOWare BrM logo(click to return to the Bridge List), displays the cur-rent user and database, and has buttons to take theuser to the home page (Bridge List), the help system,account information, or to log the user out of the soft-ware.
The top of each page also contains a "breadcrumb"representation of exactly which page the user is cur-rently on and the path to get there, such as Inspec-tion > Inventory > Roads.
Some tasks will also contain headers specific to thecontent of the page.
Footer
The footer displays the current version of BrM and the build date and time for the latest version.
Most tasks also contain a footer with page controls such as save, cancel, delete, etc.
Tab
The tab is the main module that houses tasks, groups,and controls. The standard software contains 8 tabsthat run vertically along the left of the software:Bridges, Reports, Admin, Inspection, Gateway, Ana-lysis, Projects, and Programs.
- 12 -
BrM Navigation

BrM Navigation
Object Description
Task
The tasks make up the menu options for each of thetabs. The tasks run vertically along the left side ofthe software. Tasks can contain subtasks which arelisted underneath the tasks and only visible when thetask is selected or expanded.
Grouping
The groupings are the sectioned-off parts of each of the task pages. The groupings typically have dis-play names and their content is often wrapped in a grey outline.
ControlThe controls are the fields within the groups: checkboxes, text fields, radio buttons, etc.
- 13 -

After clicking on the user name in the header to reveal the header options, select the User Profile link to open the UserProfile page:
To change the login password, select the Change Password button to reveal additional controls:
By default, all BrM passwords must contain at least 5 characters. When new password restrictions have been set by theadministrator on the Admin > Security > Password Rules subtask, the rules will be different.
When the desired changes have been made, click the Apply button to save them.
To reject the changes, click the Cancel button.
- 14 -
User Profile

Message containers are a new feature in BrM version 5.2.3 that display important save, error, or informational messageson specific pages throughout the software. Message containers will typically appear on a page after changes have beenmade and saved, a save has been attempted, or a required item is not currently completed.
The green message container will appear from the header if the page was saved successfully:
If the page does not save successfully or there is some other message the user needs to see, a message container willappear from the footer:
- 15 -
Message Containers

Bridges- The Bridges section of the manual addresseseach of the tasks in BrM's Bridges tab. TheBridges tab contains several options to managethe structures within the database.

The Bridges > View List task serves as the BrM homepage. The View List task is a complete list of all of the bridges inthe system that can be filtered and customized in various ways and allows for the selection of bridges prior to performingother actions in the system.
Selecting a BridgeThe View List task's main function is bridge selection. Most functions in BrM require a bridge to be selected, and theView List task is the main location for this action.
There are two different ways to select a single bridge on the bridge grid:
1. Checkbox Select - Clicking the checkbox of the desired bridge will select it.2. Highlight Select - When hovering the mouse's cursor over a bridge in the bridge grid, the bridge's row will be
highlighted blue. Clicking anywhere on that row will darken and solidify that highlight and select the bridge,checking its box. The highlight select differentiates itself from the checkbox select because it reveals an inspec-tion summary for the highlight selected bridge:
- 17 -
View List

*Note: Regardless of how a bridge is selected, all selected bridges will remain selected until unselected. This is import-ant because many of the functions in BrM take into account all of the currently selected bridges. Users must ensure thatbefore they perform an action, such as generating a report, only the desired bridges are selected.
Highlighted Bridge ImagesWhen a bridge is highlighted, the Context dropdown in the Images grouping can be used to determine which images todisplay. Selecting "Bridge Level" will display the images that have been added to the bridge, not a specific inspection.Selecting a specific inspection will display only the images for that inspection.
Highlighted Bridge Inspection SummaryWhen a bridge is highlighted, the Inspection Summary grouping will display information about the selected bridge'smost recent inspection. The various tabs - Condition, Load Rating, Inventory, Roadway On, and Schedule - can be selec-ted to view inspection information.
FilterDue to the vast size of some users' systems, filters are necessary to sort and locate bridges based on specified criteria. Fil-ters are created on the Bridges > Manage Filters and Projects > Manage Filters tasks.
There are two main ways to filter bridges:
1. Filter Dropdown - The Filter dropdown lists all of the relevant filters that have been created and edited on theManage Filters task. By default, BrM comes with a set of various filters (labeled "BrM" in the dropdown), butnew filters can be created. When a filter is selected from the dropdown, the bridge grid will automatically updatewith the filtered bridges.
- 18 -

2. Quick Filters - Each column in the Bridge List has a quick filter that enables the user to filter the grid based on a
condition. The user types into the Quick Filter textbox and then clicks the symbol to select a condition.Once the condition is selected, the grid will automatically be updated with the filtered bridges.
*Note: By default, filling in the Quick Filter textbox and then pressing Enter on the keyboard will automaticallymake use of the "Contains" quick filter condition.
The following table explains the various selectable quick filter conditions:
Quick Filter Conditions
Condition Description
NoFilter No filter is applied - filter controls are cleared.
Contains Returns results that contain the entered value.Same as: dataField LIKE '%value%'
DoesNotContain Returns results that do not contain the entered value.Same as dataField NOT LIKE '%value%'
StartsWith Returns results that start with the entered value.Same as: dataField LIKE 'value%'
EndsWith Returns results that end with the entered value.Same as: dataField LIKE '%value'
EqualTo Returns results that exactly match the entered value.Same as: dataField = value
NotEqualTo Returns results that do not exactly match the entered value.Same as: dataField != value
GreaterThan Returns results with a value greater than the entered value.Same as: dataField > value
LessThan Returns results with a value less than the entered value.Same as: dataField < value
GreaterThanOrEqualTo Returns results with a value greater than or exactly matching the entered value.
- 19 -
Quick Filter Conditions
Condition Description
Same as: dataField >= value
LessThanOrEqualTo Returns results with a value less than or exactly matching the entered value.Same as: dataField <= value
Between
Returns results with a value that falls between the two entered values.Same as: value1 <= dataField <= value2*Note: Value1 and value2 should be separated by a space when entered into the quickfilter.
NotBetween
Returns results with a value that does not fall between the two entered values.Same as: dataField <= value1 & dataField >= value2*Note: Value1 and value2 should be separated by a space when entered into the quickfilter.
IsEmpty Returns results where the specific field is empty.Same as: dataField = ''
NotIsEmpty Returns results where the specific field is not empty.Same as: dataField != ''
IsNull Returns only null values.
NotIsNull Returns only non-null values.
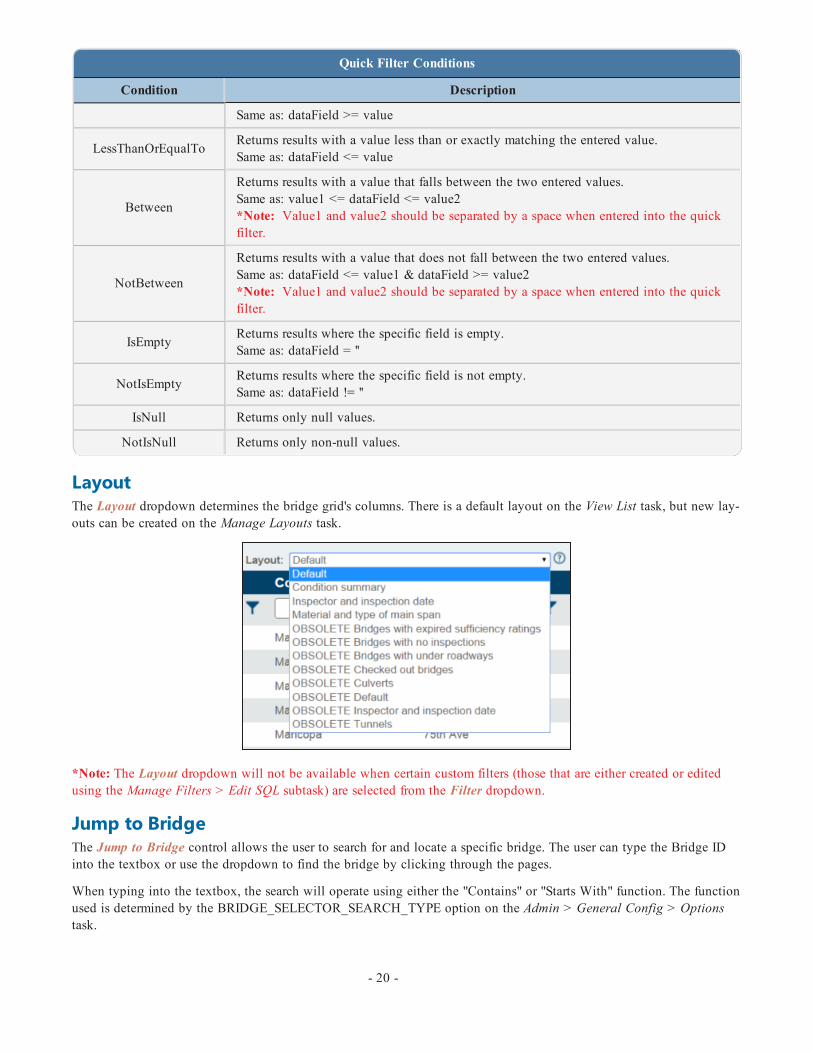
LayoutThe Layout dropdown determines the bridge grid's columns. There is a default layout on the View List task, but new lay-outs can be created on the Manage Layouts task.
*Note: The Layout dropdown will not be available when certain custom filters (those that are either created or editedusing the Manage Filters > Edit SQL subtask) are selected from the Filter dropdown.
Jump to BridgeThe Jump to Bridge control allows the user to search for and locate a specific bridge. The user can type the Bridge IDinto the textbox or use the dropdown to find the bridge by clicking through the pages.
When typing into the textbox, the search will operate using either the "Contains" or "Starts With" function. The functionused is determined by the BRIDGE_SELECTOR_SEARCH_TYPE option on the Admin > General Config > Optionstask.
- 20 -

When the bridge is selected, it will be highlighted and selected.
Export OptionsThere are three export options located at the top left corner of the bridge grid: Adobe Acrobat Portable DocumentFormat (PDF), Microsoft Excel Spreadsheet (XLS), and Google Keyhole Markup Language (KML). If one or morebridges are selected, only the information from the selected bridges will export. If no bridges are selected, all of thebridges in the current filter will be exported.
Side Menu OptionsThe side menu for a certain Tab > Task will typically contain subtasks, but for the Bridge > View List task the sidemenu contains various options that perform actions.
- 21 -

View List Options
Option Description
SelectAll Selects all of the bridges within the current filter.
UnselectAll Unselects all of the bridges currently selected.
SelectPage
Selects all bridges on the current page, regardless of how manybridges are in the current filter.
Example: If there are 30 bridges in the current filter but only 10bridges per page, only the 10 bridges shown on the current pagewill be selected.
UnselectPage
Unselects all bridges on the current page, regardless of how manybridges are in the current filter.
ToggleJust
Selected
Toggles between showing all of the bridges in the current filter toshowing only the bridges that have been selected.
Example: If a user has 4 bridges selected, clicking Toggle JustSelected will display only the 4 selected bridges, regardless of thetotal number of bridges in the filter.
ApplyGrid Set-tings
The column headings of the bridge grid can be arranged in anyorder. The user can click and hold then drag and drop the columnheadings into any order desired. If the column headings order ischanged and the user wants to permanently save it, Apply GridSettings can be selected.
ResetGrid Set-tings
As discussed above, the grid's column headings order can bechanged. If the column headings order is changed and the userwants to revert back to the default column heading order, ResetGrid Settings can be selected.
PrintableView
The Printable View option opens a new web page with a print-able view of all of the bridges in the current filter.
- 22 -
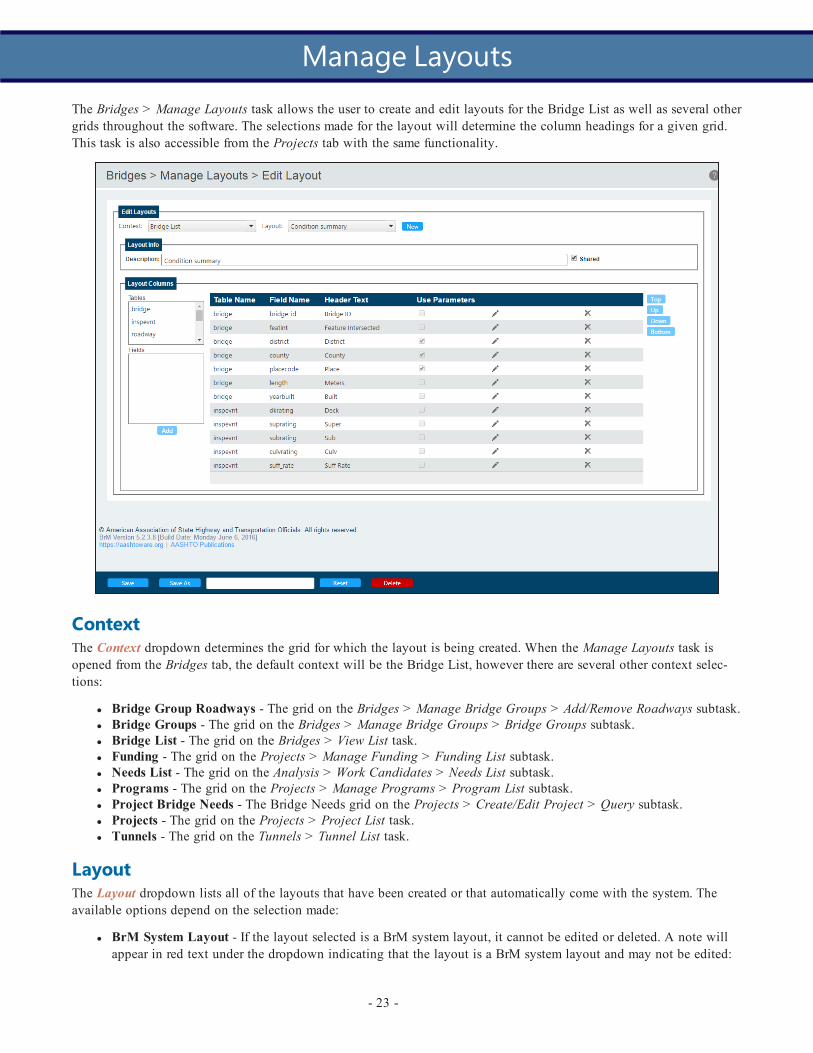
The Bridges > Manage Layouts task allows the user to create and edit layouts for the Bridge List as well as several othergrids throughout the software. The selections made for the layout will determine the column headings for a given grid.This task is also accessible from the Projects tab with the same functionality.
ContextThe Context dropdown determines the grid for which the layout is being created. When the Manage Layouts task isopened from the Bridges tab, the default context will be the Bridge List, however there are several other context selec-tions:
l Bridge Group Roadways - The grid on the Bridges > Manage Bridge Groups > Add/Remove Roadways subtask.l Bridge Groups - The grid on the Bridges > Manage Bridge Groups > Bridge Groups subtask.l Bridge List - The grid on the Bridges > View List task.l Funding - The grid on the Projects > Manage Funding > Funding List subtask.l Needs List - The grid on the Analysis > Work Candidates > Needs List subtask.l Programs - The grid on the Projects > Manage Programs > Program List subtask.l Project Bridge Needs - The Bridge Needs grid on the Projects > Create/Edit Project > Query subtask.l Projects - The grid on the Projects > Project List task.l Tunnels - The grid on the Tunnels > Tunnel List task.
LayoutThe Layout dropdown lists all of the layouts that have been created or that automatically come with the system. Theavailable options depend on the selection made:
l BrM System Layout - If the layout selected is a BrM system layout, it cannot be edited or deleted. A note willappear in red text under the dropdown indicating that the layout is a BrM system layout and may not be edited:
- 23 -
Manage Layouts
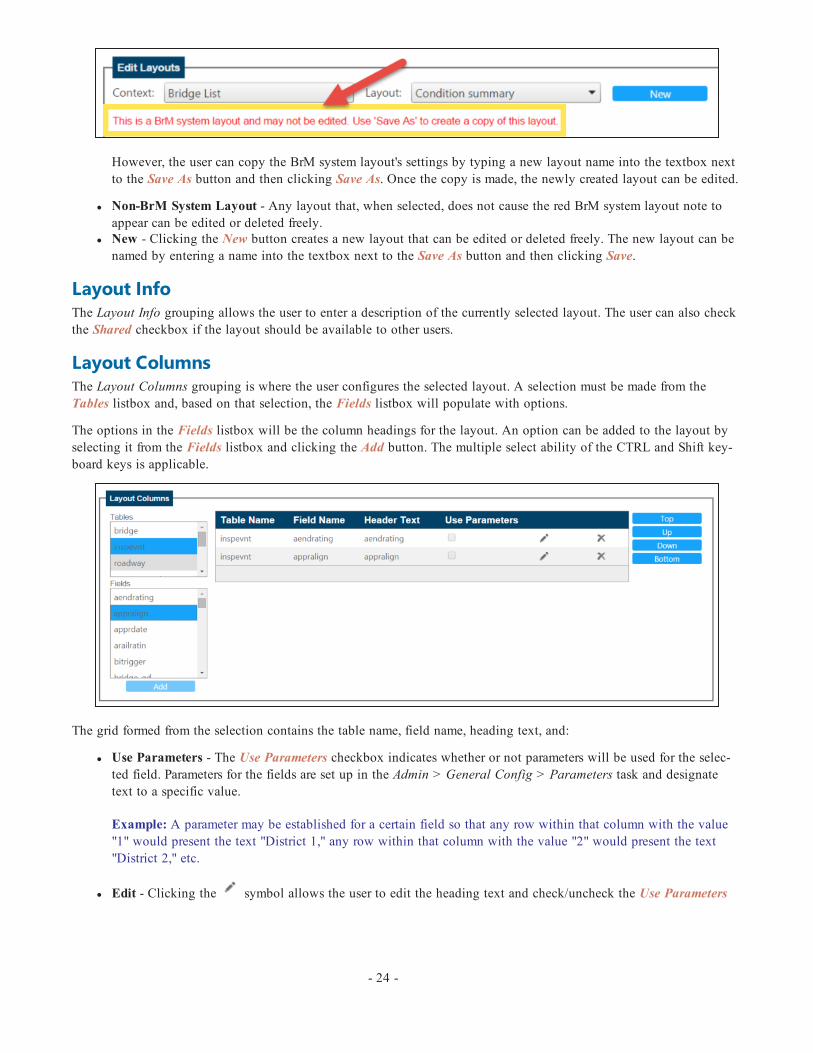
However, the user can copy the BrM system layout's settings by typing a new layout name into the textbox nextto the Save As button and then clicking Save As. Once the copy is made, the newly created layout can be edited.
l Non-BrM System Layout - Any layout that, when selected, does not cause the red BrM system layout note toappear can be edited or deleted freely.
l New - Clicking the New button creates a new layout that can be edited or deleted freely. The new layout can benamed by entering a name into the textbox next to the Save As button and then clicking Save.
Layout InfoThe Layout Info grouping allows the user to enter a description of the currently selected layout. The user can also checkthe Shared checkbox if the layout should be available to other users.
Layout ColumnsThe Layout Columns grouping is where the user configures the selected layout. A selection must be made from theTables listbox and, based on that selection, the Fields listbox will populate with options.
The options in the Fields listbox will be the column headings for the layout. An option can be added to the layout byselecting it from the Fields listbox and clicking the Add button. The multiple select ability of the CTRL and Shift key-board keys is applicable.
The grid formed from the selection contains the table name, field name, heading text, and:
l Use Parameters - The Use Parameters checkbox indicates whether or not parameters will be used for the selec-ted field. Parameters for the fields are set up in the Admin > General Config > Parameters task and designatetext to a specific value.
Example: A parameter may be established for a certain field so that any row within that column with the value"1" would present the text "District 1," any row within that column with the value "2" would present the text"District 2," etc.
l Edit - Clicking the symbol allows the user to edit the heading text and check/uncheck the Use Parameters
- 24 -

checkbox. To save the changes, click the symbol. To cancel changes, click the symbol.l Delete - Clicking the symbol deletes the field from the layout.
The buttons to the right of the table - Top, Up, Down, Bottom - control the positioning of the fields in the layout.Because tables read left to right, the top field in the layout corresponds to the leftmost column of the table. Once an itemis selected, The Top and Bottom buttons move it to the top and bottom of the layout grid, respectively. The Up andDown buttons move the selected item up and down by one increment, respectively.
Manage Layouts Page Controls
The Save button saves the current layout.
The Save As button acts as a copier and copies the current layout's settings into a new layout that uses the name enteredinto the textbox next to the Save As button.
The Reset button resets any changes that were made to the current layout back to the last save.
The Delete button deletes the current layout.
- 25 -

The Bridges > Manage Filters task allows the user to create and edit filters for the Bridge List as well as several othergrids throughout the software. The selections made for the filter will determine the bridges listed in the Bridge List uponfilter use. This task is also accessible from the Projects tab with the same functionality.
Edit FilterThe Bridges > Manage Filters > Edit Filter subtask uses the BrM interface to create and edit filters for various gridswithin the system.
ContextThe Context dropdown determines the grid for which the filter is being created. When the Manage Filters task is openedfrom the Bridges tab, the default context will be the Bridge List, however there are several other context selections:
l Bridge Group Roadways - The grid on the Bridges > Manage Bridge Groups > Add/Remove Roadways subtask.l Bridge Groups - The grid on the Bridges > Manage Bridge Groups > Bridge Groups subtask.l Bridge List - The grid on the Bridges > View List task.l Funding - The grid on the Projects > Manage Funding > Funding List subtask.l Needs List - The grid on the Analysis > Work Candidates > Needs List subtask.l Programs - The grid on the Projects > Manage Programs > Program List subtask.l Projects - The grid on the Projects > Project List task.l Tunnels - The grid on the Tunnels > Tunnel List task.
FilterThe Filter dropdown lists all of the filters that have been created or that automatically come with the system. The con-text must be selected before the filter because the context determines what filters are available. Below are the filter
- 26 -
Manage Filters

options:
l BrM System Filter - If the filter selected is a BrM system filter, it cannot be edited or deleted. A note will appearin red text under the dropdown indicating that the filter is a BrM system filter and may not be edited:
However, the user can copy the BrM system filter's settings by typing a new filter name into the textbox next tothe Save As button and then clicking Save As. Once the copy is made, the newly created filter can be edited.
l Customized Filter- Any filter created by the user can be edited or deleted freely.l New - Clicking the New button creates a new filter that can be edited or deleted freely. The new filter can benamed by entering a name into the textbox next to the Save As button and then clicking Save.
Filter InfoThe Filter Info grouping allows the user to enter a description of the currently selected filter. The user can also check theShared checkbox if the filter should be available to other users.
If the Access Filter checkbox is checked, the admin can use the current filter as an access filter for specified roles, dis-playing that filter as the users' default filter for the applicable context.
CriteriaThe Criteria grouping is where the user configures the selected filter. A selection must be made from the Tables listboxand, based on that selection, the Fields listbox will populate with options.
Options can be added to the filter by selecting it from the Fields listbox and clicking the Add Criteria button. Multipleoptions can be added at once by holding down the CTRL key while selecting all of the desired options, then clickingthe Add Criteria button.
- 27 -

Each field added to the filter will have additional options that must be determined.
Clicking the Clear button will clear the filter of all fields that have been added. Clicking the Delete Selected button willclear the filter of only the fields that have the Delete checkbox checked.
Edit Filter Page Controls
The Save button saves the current filter.
The Save As button copies the current filter's settings into a new filter that uses the name entered into the textbox nextto the Save As button.
The Reset button resets any changes that were made to the current filter back to the last save.
The Delete button deletes the current filter.
- 28 -

Edit SQLThe Bridges > Manage Filters > Edit SQL subtask does not use the BrM interface to create and edit filters. It requiresthe user to write the SQL manually to create a custom filter.
There are several aspects that differentiate the filters in the Edit SQL subtask from the filters in the Edit Filter subtask:
1. The SQL filters must be written manually.2. The SQL filters can only be edited within the Edit SQL subtask. They will not show up in the Filter dropdown
of the Edit Filter subtask.3. When an SQL filter is used on a page that has alternate layouts via a Layout dropdown, such as the Bridge List,
the Layout dropdown will not be visible.
Select ContextThe Context dropdown determines the grid for which the filter is being created. When the Manage Filters task is openedfrom the Bridges tab, the default context will be the Bridge List, however there are several other context selections:
l Bridge Group Roadways - The grid on the Bridges > Manage Bridge Groups > Add/Remove Roadways subtask.l Bridge Groups - The grid on the Bridges > Manage Bridge Groups > Bridge Groups subtask.l Bridge List - The grid on the Bridges > View List task.l Funding - The grid on the Projects > Manage Funding > Funding List subtask.l Needs List - The grid on the Analysis > Work Candidates > Needs List subtask.l Programs - The grid on the Projects > Manage Programs > Program List subtask.l Projects - The grid on the Projects > Project List task.l Tunnels - The grid on the Tunnels > Tunnel List task.
Select FilterThe Filter dropdown lists all of the filters that have been created or that automatically come with the system. The con-text must be selected before the filter because the context determines what filters are available.
- 29 -
SQL InfoThe SQL Info grouping allows the user to enter a description of the currently selected filter. The user can also check theShared checkbox if the filter should be available to other users.
SQL StatementThe user can use the large textbox to enter the SQL for the custom filter.
Important things to note:
1. The correct use of key_ within the statement is to use double quotes - "key_" - and this column will not actuallydisplay when the filter is run.
2. Use the identifying table name in the statement. For example, write "BRIDGE.BRIDGE_GD" not "BRIDGE_GD."
3. Beginning with version 5.2.2, GUIDs took the place of primary keys. Filters written prior to version 5.2.2 shouldbe reviewed for compliance.
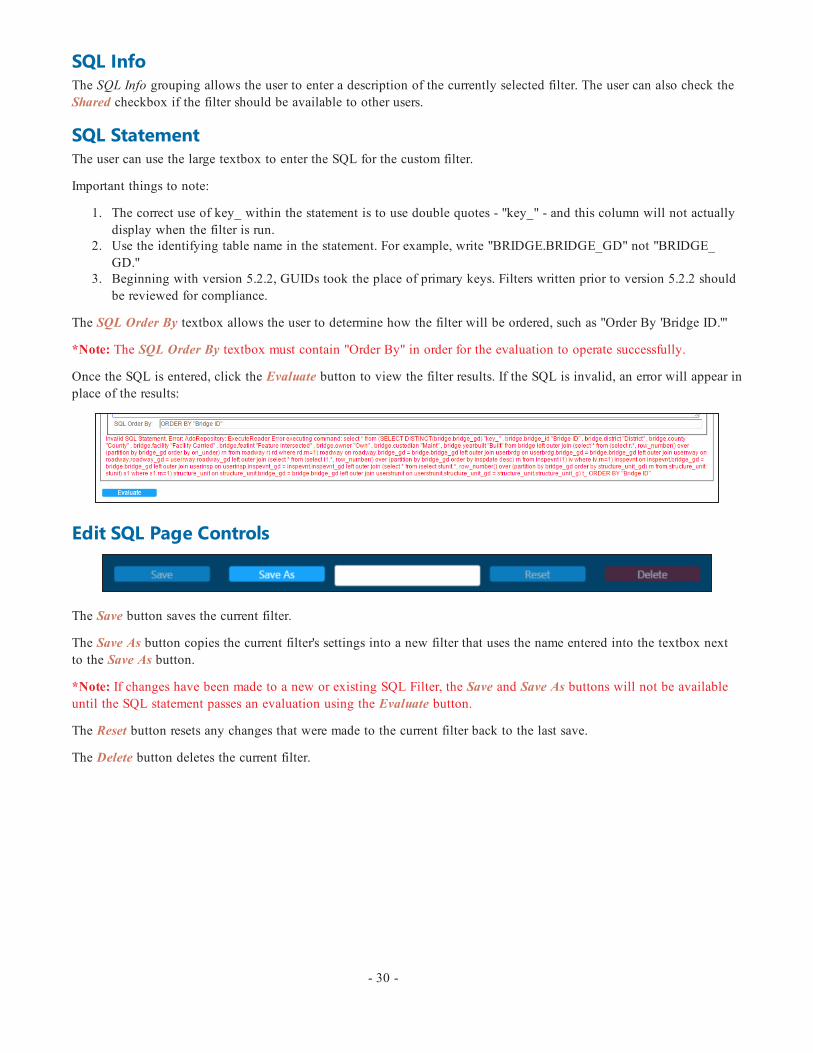
The SQL Order By textbox allows the user to determine how the filter will be ordered, such as "Order By 'Bridge ID.'"
*Note: The SQL Order By textbox must contain "Order By" in order for the evaluation to operate successfully.
Once the SQL is entered, click the Evaluate button to view the filter results. If the SQL is invalid, an error will appear inplace of the results:
Edit SQL Page Controls
The Save button saves the current filter.
The Save As button copies the current filter's settings into a new filter that uses the name entered into the textbox nextto the Save As button.
*Note: If changes have been made to a new or existing SQL Filter, the Save and Save As buttons will not be availableuntil the SQL statement passes an evaluation using the Evaluate button.
The Reset button resets any changes that were made to the current filter back to the last save.
The Delete button deletes the current filter.
- 30 -

The Bridges > New Inspection task allows the user to enter basic information for a new inspection of the currently selec-ted bridge. If more than one bridge is selected on the Bridge List, the new inspection will be for the bridge selected mostrecently unless one of the bridges is highlighted.
Create New InspectionInspection DateThe Inspection Date field defaults to the current date. To change the date, enter a new date in the MM/DD/YYYY
format or click the symbol and select a date.
Primary TypeThe Primary Type dropdown lists the primary type of inspection that will be performed. If a previous inspection was per-formed on the selected bridge, the primary type will automatically populate with the option used in the previous inspec-tion but can be changed if desired.
InspectorThe Inspector dropdown will default to the current user. This can be changed, however the users available in the drop-down will depend on user roles and permissions.
Entered ByThe Entered By dropdown will default to the current user. This can be changed, however the users available in the drop-down will depend on user roles and permissions.
Engineer of RecordThe user can enter an engineer in the Engineer of Record textbox for internal use. This is an optional field.
- 31 -
New Inspection

If the textbox is left blank, the field will be populated with the engineer of record from the previous inspection on thenext page. If the previous inspection did not have an Engineer of Record listed or if no previous inspection exists, thefield will be blank on the Inspection > Schedule task.
Types of Inspection PerformedThe user should check the boxes of the inspections that were performed on the bridge on the selected inspection date.The selected inspections will be assigned the selected inspection date on the Inspection > Schedule task. If necessary,this information can be edited later on the Inspection > Schedule task.
New Inspection Page ControlsClick the Create button to create the new inspection and automatically be taken to the Inspection > Schedule task tocontinue filling out the inspection information.
Click the Cancel button to cancel the new inspection and return to the Bridges > View List task.
_______________________________________________________________________
Inspection > New Inspection Control Information
Control Name TableName
ColumnName Notes
Bridge inspevnt bridge_gd The ID of the bridge being inspected.
InspectionDate inspevnt inspdate The date the new inspection is created. By default, this will be
the current date.
Primary Type inspevnt insptype The primary type of inspection being performed.
Inspector inspevnt inspusrguid The user performing the inspection.
Entered By inspevnt entered_by_gd The user that enters the inspection into the system.
Engineer ofRecord inspevnt engineer_of_
record The engineer of record for the inspection.
Types of Inspection Performed Grouping
Routine inspevnt nbinspdone Checked if a routine inspection was performed.
Element inspevnt elinspdone Checked if an element inspection was performed.
Fracture Crit-ical inspevnt fcinspdone Checked if a fracture critical inspection was performed.
Underwater inspevnt uwinspdone Checked if an underwater inspection was performed.
Other Special inspevnt osinspdone Checked if an other special inspection was performed.
- 32 -

The Bridges > Suff Rate task is used to view and calculate bridge sufficiency ratings.
Sufficiency Rating ResultsWhen the Bridges > Suff Rate task is selected, the sufficiency rating of all of the bridges currently selected on theBridge List is calculated and displayed. If no bridges are selected, a bridge must be selected from the dropdown beforethe Suff Rate task can be viewed.
The Sufficiency Rating grid reveals the bridges' previous ratings and the newly calculated ratings based on the mostrecent inspection. Yellow highlights in the Sufficiency Rating grid columns reveal changes that have occurred between abridge's previous and currently calculated ratings.
Sufficiency Rating Page Controls
Accept ChangesClick the Show Changed button to show only the bridges with changes between the previous and currently calculatedratings. To accept the currently calculated ratings, check the Accept checkboxes for the desired bridges or use the SelectPage button to select an entire page of bridges.
Once the desired bridges are selected from the grid, click the Accept button to accept the changes and return to theBridge List. To accept all of the changes (with or without their Accept checkboxes checked), click the Accept All but-ton.
Sufficiency Rating ControlsUse the Print Ratings button to print the Sufficiency Rating grid.
Click the Cancel button to return to the Bridges > View List task.
- 33 -
Suff Rate

_______________________________________________________________________
Bridges > Suff Rate Control Information
ControlName
TableName Column Name Notes
Brkey inspevnt brkey One of the structure identifiers used in BrM.
InspectionDate inspevnt inspdate The bridge's most recent inspection date.
StructureRating inspevnt strrating
NBI Item 67: This is the structural evaluation rating of the bridge.This item is calculated by the specifications used in the NBI Cod-ing Guide.
DeckGeometry inspevnt deckgeom
NBI Item 68: The overall rating for deck geometry includes twoevaluations: the curb-to-curb or face-to-face of rail bridge widthand the minimum vertical clearance over the bridge roadway.When an individual table lists several deck geometry rating codesfor the same roadway width under a specific ADT, the lower codeis used.
UnderClearance inspevnt underclr NBI Item 69: This is the underclearance of the bridge. This item
is calculated by the specifications used in the NBI Coding Guide.
Suff Prefix inspevnt suff_prefix The sufficiency rating prefix.
Suff Rating inspevnt suff_rate The sufficiency rating of the structure.
SD/FOStatus inspevnt nbi_rating The NBI rating (structurally deficient/functionally obsolete
status).
- 34 -

The Bridges > Validate task is used to validate the accuracy and acceptability of many of the values recorded for a spe-cific bridge.
Validate BridgesThe Bridges > Validate task will display all of the bridges currently selected on the Bridge List. If no bridges are selec-ted, a bridge must be selected from the dropdown before the Validate task can be viewed.
To validate only the bridges currently selected, click the Validate Selected Bridges button. To validate all bridges in thedatabase, click the Validate All Bridges button.
*Note: Validating bridges can take an extended period of time depending on the amount of bridges. Validating an entiresystem of bridges will likely take 5+ minutes to complete.
Click the Cancel button to return to the Bridge List.
Validation ResultsOnce the bridges are validated, the NBI and NBE validation results can be viewed. Use the NBI Results and NBE Res-ults tabs to switch back and forth.
- 35 -
Validate

To view the validation results, click the checkboxes of the desired bridges in the selected grid (all checkboxes will bechecked initially). Any errors for the selected bridge(s) will be revealed in the Validation Results grid.
SeverityOnce the selected bridges are validated, the results will be labeled as "Fatal" or "Warning."
The buttons for each severity level can be used to filter the validation results.
Export Results
Use the symbols to create a PDF or XLS of the current grid.
- 36 -

The Bridges > Create Structure task is used to create a new bridge in the system.
Create Structure GroupingsWhen completing the Create Struct task, it is recommended that the NBI items (fields containing red numbers in par-enthesis - "(002)") be filled out. However, these items are not mandatory to save the new structure. If not filled out, thefields can completed later using the Inspection > Inventory task.
Structural IdentificationThe Structural Identification grouping contains the only mandatory controls on the task. Trying to save or proceedwithout entering an NBI Structure No., BRKEY, and/or Agency Bridge ID will activate an error message. By default, thetext that is entered into the NBI Structure No textbox will populate in the BRKEY and Agency Bridge ID textboxes. Itis recommended that the BRKEY be the same as the NBI Structure No. to ensure that NBI data imports correctly.
l NBI Structure No. - Required by FHWA to be a unique bridge identifier that remains constant over time.l BRKEY - Field that links the bridge table with other related tables for roadways, structure units, inspections, etc.l Agency Bridge ID - The ID shown on the default Bridge List and standard BrM reports.
Location and AdministrationWhile not mandatory for the page, the structure's name, location, length, and other details can be added.
SpansThe bridge's span information does not need to be included to save the page or proceed, but as with the location andadministration information it is recommended that the span information NBI items be included.
- 37 -
Create Structure

InspectionThe setup for a new inspection can be established in the Inspection grouping, but the structure's elements will still needto be added on the Inspection > Condition task.
Create Structure Page Controls
The Save button saves the new structure and sends the user back to the Bridges > View List task. The Initial Inspectionbutton saves the new structure and sends the user to the Inspection > Condition task where the structure's elements canbe added.
The Build Several Structures At Once checkbox ensures that once the current new structure is saved, the Create Structtask will refresh instead of sending the user to the Bridges > View List task.
- 38 -
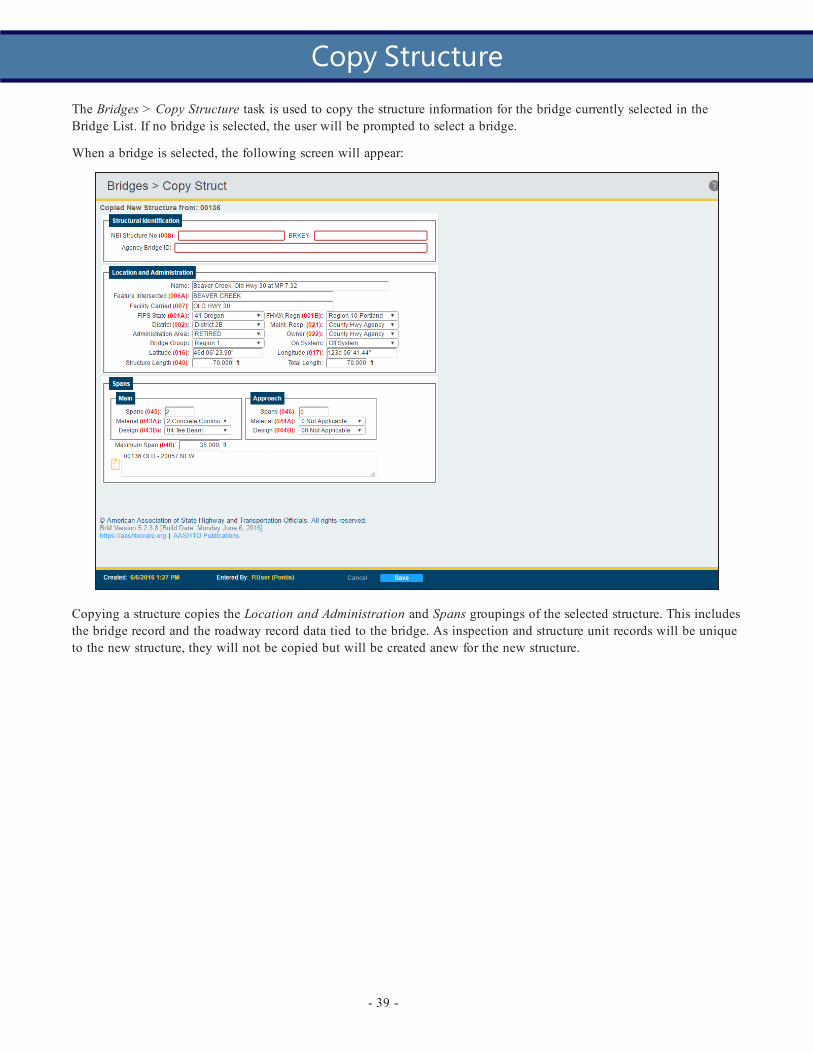
The Bridges > Copy Structure task is used to copy the structure information for the bridge currently selected in theBridge List. If no bridge is selected, the user will be prompted to select a bridge.
When a bridge is selected, the following screen will appear:
Copying a structure copies the Location and Administration and Spans groupings of the selected structure. This includesthe bridge record and the roadway record data tied to the bridge. As inspection and structure unit records will be uniqueto the new structure, they will not be copied but will be created anew for the new structure.
- 39 -
Copy Structure

The Bridges > Remove Struct task is used to remove all bridges currently selected in the Bridge List from the system.Once removed, the structures will no longer be available for new inspection reports, analysis, etc.
When the Remove button is clicked a warning message will appear. If OK is clicked on the warning message, all bridgesshown in the Selected Bridges grid will be removed.
Click the Cancel button to return to the Bridge List.
- 40 -
Remove Struct
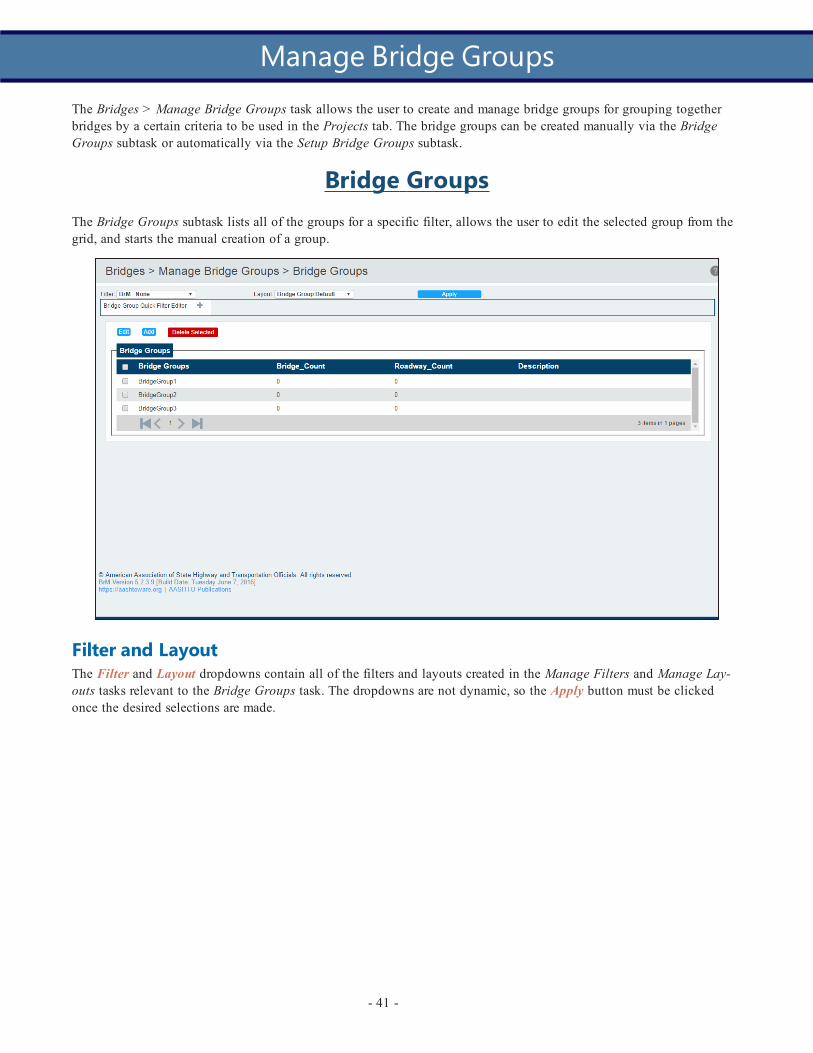
The Bridges > Manage Bridge Groups task allows the user to create and manage bridge groups for grouping togetherbridges by a certain criteria to be used in the Projects tab. The bridge groups can be created manually via the BridgeGroups subtask or automatically via the Setup Bridge Groups subtask.
Bridge GroupsThe Bridge Groups subtask lists all of the groups for a specific filter, allows the user to edit the selected group from thegrid, and starts the manual creation of a group.
Filter and LayoutThe Filter and Layout dropdowns contain all of the filters and layouts created in the Manage Filters and Manage Lay-outs tasks relevant to the Bridge Groups task. The dropdowns are not dynamic, so the Apply button must be clickedonce the desired selections are made.
- 41 -
Manage Bridge Groups
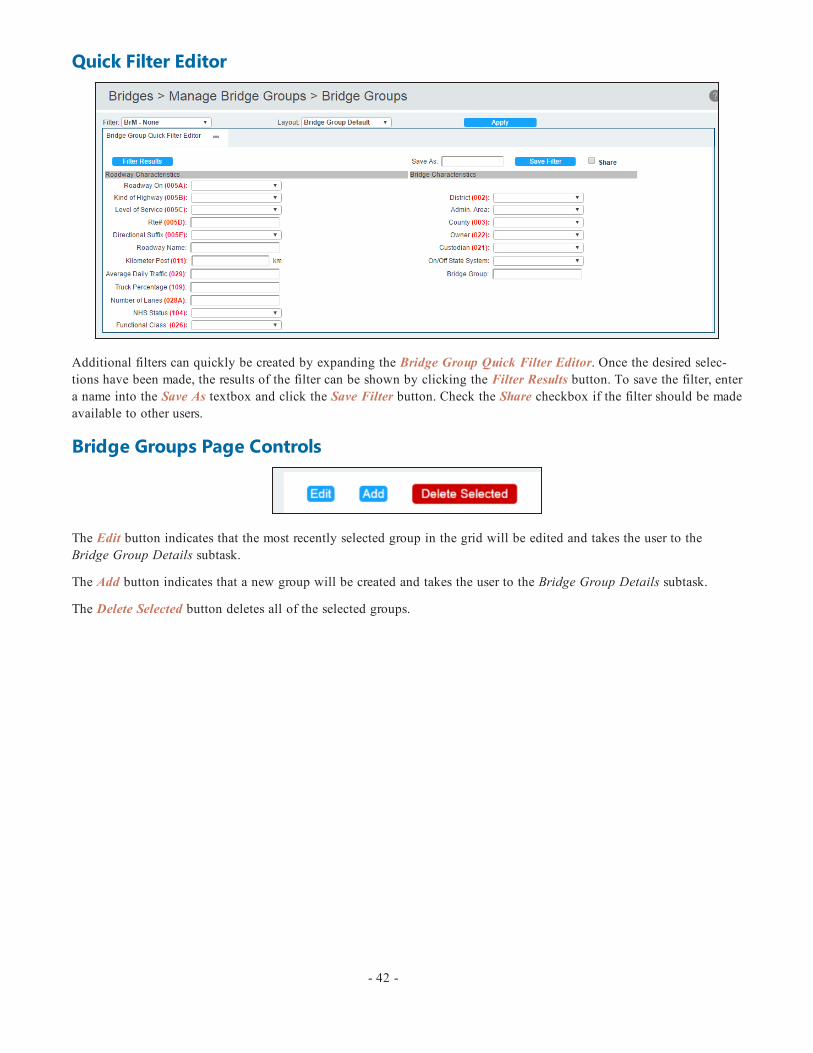
Quick Filter Editor
Additional filters can quickly be created by expanding the Bridge Group Quick Filter Editor. Once the desired selec-tions have been made, the results of the filter can be shown by clicking the Filter Results button. To save the filter, entera name into the Save As textbox and click the Save Filter button. Check the Share checkbox if the filter should be madeavailable to other users.
Bridge Groups Page Controls
The Edit button indicates that the most recently selected group in the grid will be edited and takes the user to theBridge Group Details subtask.
The Add button indicates that a new group will be created and takes the user to the Bridge Group Details subtask.
The Delete Selected button deletes all of the selected groups.
- 42 -

Bridge Group DetailsThe Bridge Group Details subtask allows the user to view the details of a specific group and make changes.
Bridge GroupThe Bridge Group grouping contains the name and notes for the group currently selected in the Group Name dropdown.The name of the group can be changed at any time by typing a new name into the Name textbox and clicking Save.
A new group can be created from the Bridge Group Details subtask by selecting "Add new group..." from the GroupName dropdown, entering a name into the Name textbox, and clicking Save.
The Duplicate button makes a copy of whatever group is currently selected in the Group Name dropdown and adds a "_dp" to its name.
Example: If a group named "BrM" was duplicated, the duplicate would be named "BrM_dp."
Bridge Group DetailsThe Bridge Group Details grouping lists all of the roadways for the currently selected group. The Add/Remove Road-ways button takes the user to the Add/Remove Roadways subtask to manage the roadways for the currently selectedgroup.
- 43 -

Add/Remove RoadwaysThe Add/Remove Roadways subtask allows the user to add and/or remove roadways from the currently selected group. Anew group can also be created from this page.
Filter and LayoutSimilar to the Bridge Analysis Groups subtask, the Add/Remove Roadways subtask has Filter and Layout dropdownsthat contain all of the filters and layouts created in the Manage Filters and Manage Layouts tasks relevant to the Add/Re-move Roadways subtask. The dropdowns are not dynamic, so the Apply button must be clicked once the desired selec-tions are made.
Quick Filter Editor
- 44 -

Additional filters can quickly be created by expanding the Roadway Quick Filter Editor. Once the desired selectionshave been made, the results of the filter can be shown by clicking the Filter Results button. To save the filter, enter aname into the Save As textbox and click the Save Filter button. Check the Share checkbox if the filter should be madeavailable to other users.
Update RoadwaysRoadways can be added to or removed from the currently selected group by checking/unchecking the checkbox of thedesired bridges in the grid and then clicking the Update Roadways button. The group can be changed by using the drop-down to the left of the Update Roadways button. A new group can be added by entering a name in the textbox to theright of the Add New Group button, then clicking Add New Group.
- 45 -

Setup Bridge GroupsUnlike the 3-task combination of the Bridge Groups, Bridge Group Details, and Add/Remove Roadways subtasks tomanually create groups, the Setup Bridge Groups subtask uses filter selections to automatically generate groups.
All Roadway FiltersThe All Roadway Filters grouping lists all of the filters that can be used to create a group. The selected filters will filterthe system's entire list of bridges. When the desired filter selections have been made, enter a name into the textbox to theleft of the Start Grouping button, then click Start Grouping. Every possible version of the selected filters will be createdas a group.
Example: If an agency containing 10 districts selects the District filter, 10 new groups will be created.
*Note: The max number of groups that can be created at one time from the Setup Bridge Groups subtask is 250.
Bridge GroupsThe Bridge Groups grouping lists all of the current groups and their bridge counts, roadway counts, and descriptions.
- 46 -

The Bridges > Mapping task allows users to view the positioning of selected bridges in Google Maps as well as mapselected bridges that are currently unmapped.
*Note: Google Maps is a product of Google and therefore BrM cannot control potential browser issues with its use.
*Note: No more than 100 bridges can be mapped at a time. If more than 100 bridges are selected, the following messagewill appear:
Mapped BridgesAll selected bridges with an established latitude and longitude (the values were entered on the Bridges > Create Structor Inspection > Inventory tasks) or that have previously been mapped will be indicated with a red pin on the map. Click-ing on the pin will activate a box with the structure's identifying information and a split view of the map and the struc-ture's street view:
- 47 -
Mapping
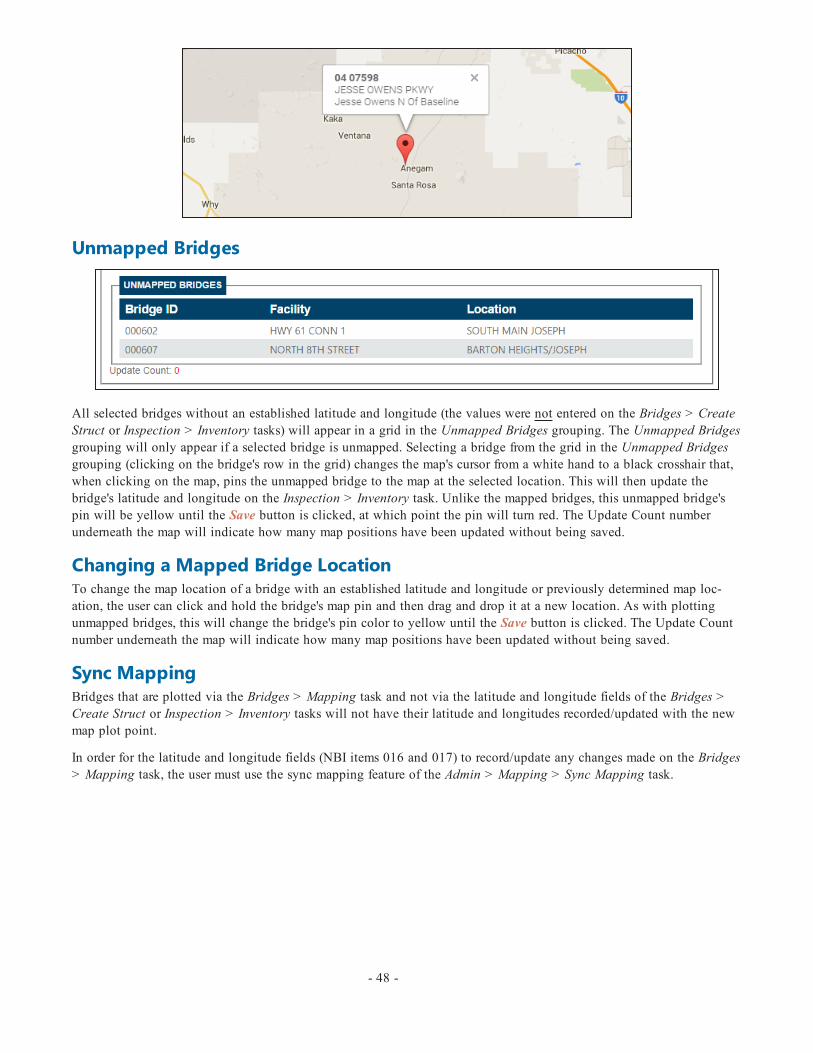
Unmapped Bridges
All selected bridges without an established latitude and longitude (the values were not entered on the Bridges > CreateStruct or Inspection > Inventory tasks) will appear in a grid in the Unmapped Bridges grouping. The Unmapped Bridgesgrouping will only appear if a selected bridge is unmapped. Selecting a bridge from the grid in the Unmapped Bridgesgrouping (clicking on the bridge's row in the grid) changes the map's cursor from a white hand to a black crosshair that,when clicking on the map, pins the unmapped bridge to the map at the selected location. This will then update thebridge's latitude and longitude on the Inspection > Inventory task. Unlike the mapped bridges, this unmapped bridge'spin will be yellow until the Save button is clicked, at which point the pin will turn red. The Update Count numberunderneath the map will indicate how many map positions have been updated without being saved.
Changing a Mapped Bridge LocationTo change the map location of a bridge with an established latitude and longitude or previously determined map loc-ation, the user can click and hold the bridge's map pin and then drag and drop it at a new location. As with plottingunmapped bridges, this will change the bridge's pin color to yellow until the Save button is clicked. The Update Countnumber underneath the map will indicate how many map positions have been updated without being saved.
Sync MappingBridges that are plotted via the Bridges > Mapping task and not via the latitude and longitude fields of the Bridges >Create Struct or Inspection > Inventory tasks will not have their latitude and longitudes recorded/updated with the newmap plot point.
In order for the latitude and longitude fields (NBI items 016 and 017) to record/update any changes made on the Bridges> Mapping task, the user must use the sync mapping feature of the Admin > Mapping > Sync Mapping task.
- 48 -

Reports- The Reports section of the manual addresseseach of the tasks in BrM's Reports tab. TheReports tab allows the user to select, view, andprint various reports for all or selectedstructures in the database.
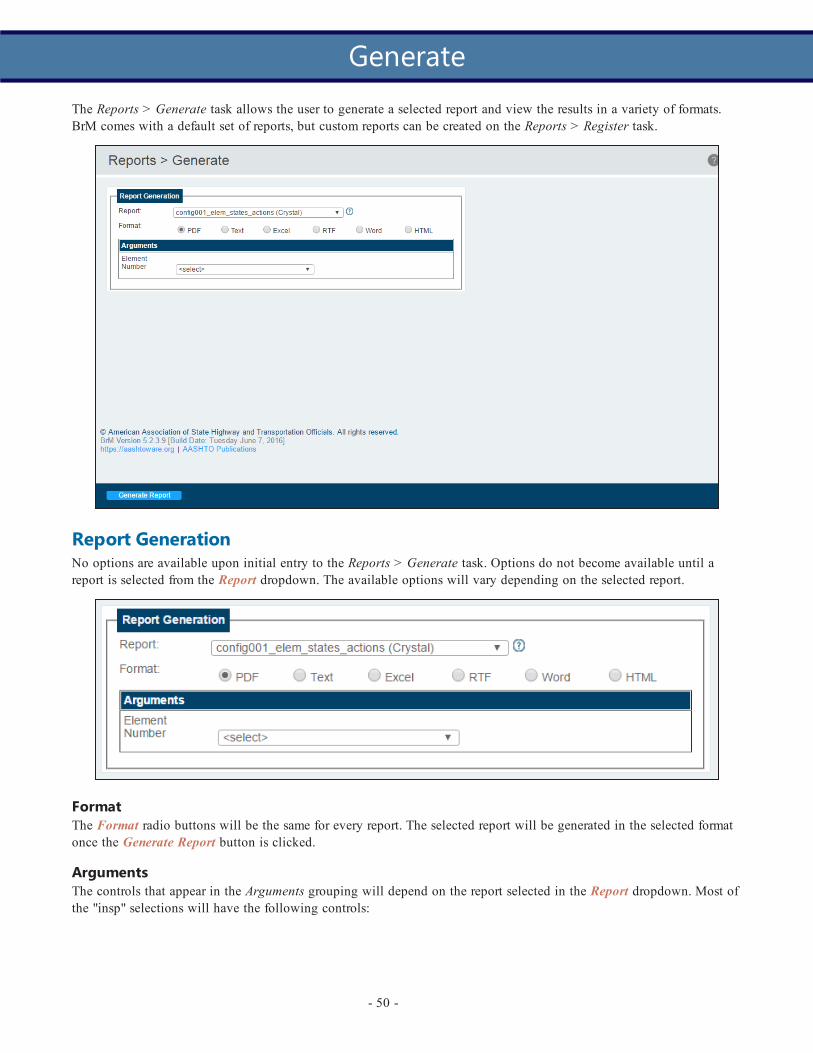
The Reports > Generate task allows the user to generate a selected report and view the results in a variety of formats.BrM comes with a default set of reports, but custom reports can be created on the Reports > Register task.
Report GenerationNo options are available upon initial entry to the Reports > Generate task. Options do not become available until areport is selected from the Report dropdown. The available options will vary depending on the selected report.
FormatThe Format radio buttons will be the same for every report. The selected report will be generated in the selected formatonce the Generate Report button is clicked.
ArgumentsThe controls that appear in the Arguments grouping will depend on the report selected in the Report dropdown. Most ofthe "insp" selections will have the following controls:
- 50 -
Generate
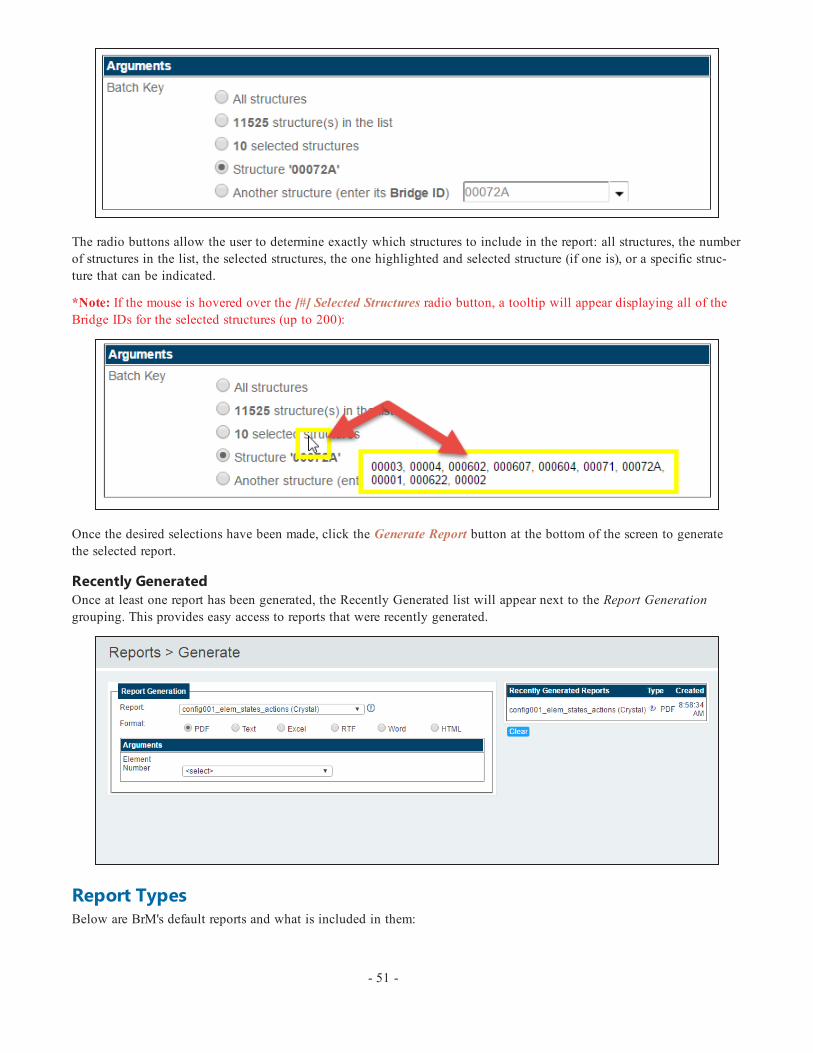
The radio buttons allow the user to determine exactly which structures to include in the report: all structures, the numberof structures in the list, the selected structures, the one highlighted and selected structure (if one is), or a specific struc-ture that can be indicated.
*Note: If the mouse is hovered over the [#] Selected Structures radio button, a tooltip will appear displaying all of theBridge IDs for the selected structures (up to 200):
Once the desired selections have been made, click the Generate Report button at the bottom of the screen to generatethe selected report.
Recently GeneratedOnce at least one report has been generated, the Recently Generated list will appear next to the Report Generationgrouping. This provides easy access to reports that were recently generated.
Report TypesBelow are BrM's default reports and what is included in them:
- 51 -
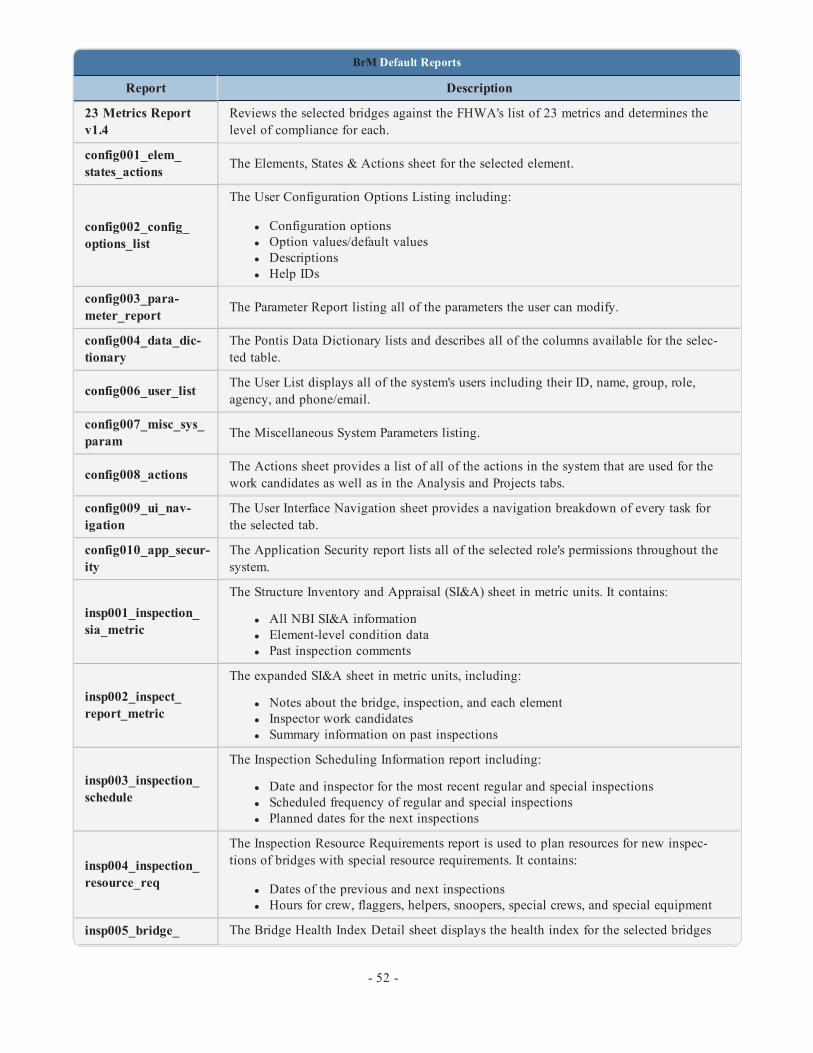
BrM Default Reports
Report Description
23 Metrics Reportv1.4
Reviews the selected bridges against the FHWA's list of 23 metrics and determines thelevel of compliance for each.
config001_elem_states_actions The Elements, States & Actions sheet for the selected element.
config002_config_options_list
The User Configuration Options Listing including:
l Configuration optionsl Option values/default valuesl Descriptionsl Help IDs
config003_para-meter_report The Parameter Report listing all of the parameters the user can modify.
config004_data_dic-tionary
The Pontis Data Dictionary lists and describes all of the columns available for the selec-ted table.
config006_user_list The User List displays all of the system's users including their ID, name, group, role,agency, and phone/email.
config007_misc_sys_param The Miscellaneous System Parameters listing.
config008_actions The Actions sheet provides a list of all of the actions in the system that are used for thework candidates as well as in the Analysis and Projects tabs.
config009_ui_nav-igation
The User Interface Navigation sheet provides a navigation breakdown of every task forthe selected tab.
config010_app_secur-ity
The Application Security report lists all of the selected role's permissions throughout thesystem.
insp001_inspection_sia_metric
The Structure Inventory and Appraisal (SI&A) sheet in metric units. It contains:
l All NBI SI&A informationl Element-level condition datal Past inspection comments
insp002_inspect_report_metric
The expanded SI&A sheet in metric units, including:
l Notes about the bridge, inspection, and each elementl Inspector work candidatesl Summary information on past inspections
insp003_inspection_schedule
The Inspection Scheduling Information report including:
l Date and inspector for the most recent regular and special inspectionsl Scheduled frequency of regular and special inspectionsl Planned dates for the next inspections
insp004_inspection_resource_req
The Inspection Resource Requirements report is used to plan resources for new inspec-tions of bridges with special resource requirements. It contains:
l Dates of the previous and next inspectionsl Hours for crew, flaggers, helpers, snoopers, special crews, and special equipment
insp005_bridge_ The Bridge Health Index Detail sheet displays the health index for the selected bridges
- 52 -

BrM Default Reports
Report Description
health_index_det and provides detailed information about the element condition distributions used to cal-culate the health index.
insp006_network_elem_sum
The Network Element Summary Distribution report in metric showing the network-widedistribution of elements by environment and condition state.
insp007_inspection_sia_english The English unit version of insp001_sia_metric.
insp008_inspect_report_english The English unit version of insp002_inspect_report_metric.
insp009_network_elem_sum_english The English unit version of insp006_network_elem_sum.
insp010_bridge_con-dition_summary
The Bridge Condition Summary report includes the facility carried, last inspection date,SD/FO status, sufficiency rating, and NBI condition ratings for deck, superstructure, sub-structure, culvert, and channel.
insp011_inspect_report_metric
Contains the same data as "insp002_inspect_report_metric" but the element inspectionnotes do not have their own grid. Instead, they sit below each element in the ElementInspection grid.
insp012_inspection_sia_english Contains only SI&A information and element condition state data in English units.
insp014_inspect_report_english
The expanded SI&A sheet in English units, including:
l Notes about the bridge, inspection, and each elementl Inspector work candidatesl Summary information on past inspections
insp015_inspect_report_metric
Contains the same data as "insp002_inspect_report_metric" as well as a section with anyphotographs attached to the selected bridge(s).
insp016_inspect_report_english The English unit version of "insp015_inspect_report_metric."
insp017_inspect_ele-ment_report_english Contains only a grid for element condition state data in English units.
insp018_inspection_sia_eng (Crystal)
Similar to the insp016_inspect_report_english report but additionally allows the user toselect a specific inspection report if only one structure is selected.
Tunnel report v1 Contain the inventory, inspection, and element data from the last inspection of the selec-ted tunnels.
- 53 -

The Reports > Register task allows the user to create, edit, and delete the reports that will be generated on the Reports >Generate task.
BrM uses Crystal Reports as its reporting engine. BrM 5.2.3 is using Crystal Reports 2013. This allows users to run anyof the predefined reports that come packaged with BrM or the flexibility to write their own custom reports to suit theirneeds. All BrM licensees are entitled to one (1) developer license of Crystal Reports. If you wish to receive your CrystalReports developer license, please send a request to [email protected].
The available options will depend on the report selected, but the basics are the same for the registration of all reports.The following information will describe the creation of a new report, but the process of editing an existing report is verysimilar.
*Note: As of version 5.2.2, BrM utilizes globally unique identifiers (GUIDs) in place of many of the keys in the data-base, such as the INSPKEY. For non-GUID versions of the BRIDGE, INSPEVNT, PON_ELEM_INSP, ROADWAY, orSTRUCTUNIT tables, use the View tables within the database. The View tables are read-only non-GUID tables that rep-licate and display the information as it would have existed prior to the switch to GUIDs.
To create a new report, click the New Report button:
- 54 -
Register
Add RPT FileThe Add RPT File grouping is used to upload new RPT files. The RPT files are Crystal Reports files that serve as the lay-out for the report.
To upload an RPT file, click the Choose File button and locate the file. Once the file has been selected, click theUpload File button to add the RPT file to the system. If the selected file is not valid, an error message will appear:
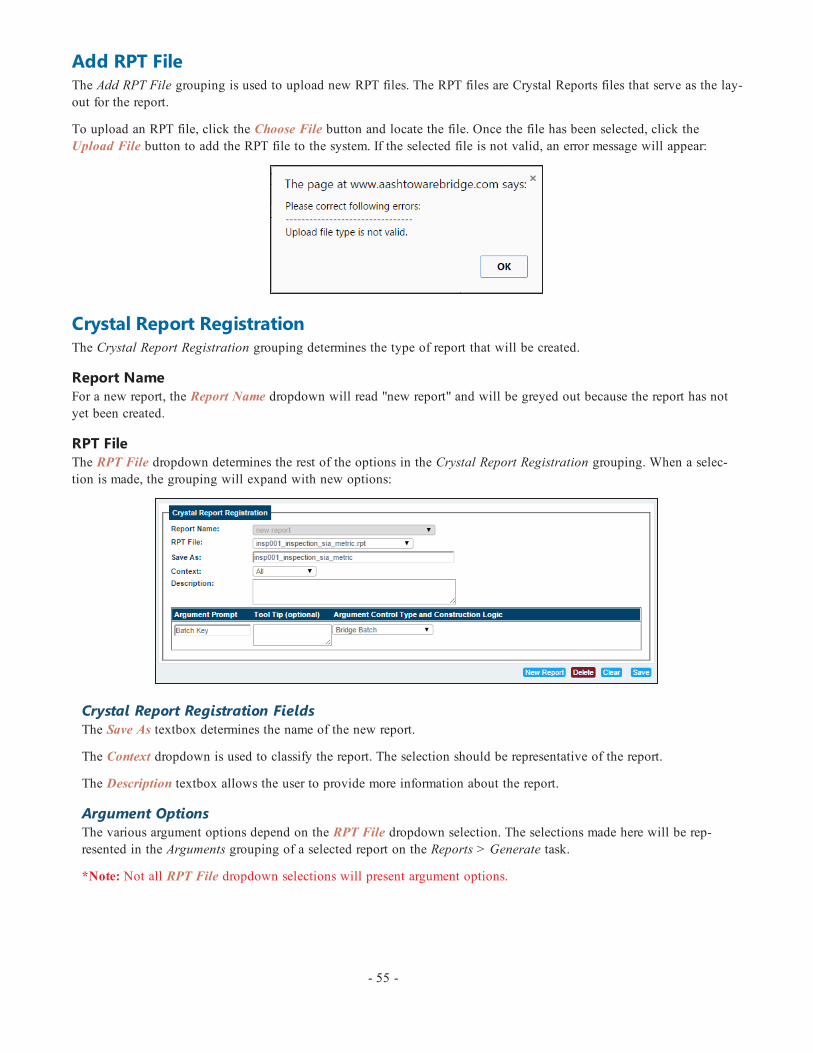
Crystal Report RegistrationThe Crystal Report Registration grouping determines the type of report that will be created.
Report NameFor a new report, the Report Name dropdown will read "new report" and will be greyed out because the report has notyet been created.
RPT FileThe RPT File dropdown determines the rest of the options in the Crystal Report Registration grouping. When a selec-tion is made, the grouping will expand with new options:
Crystal Report Registration FieldsThe Save As textbox determines the name of the new report.
The Context dropdown is used to classify the report. The selection should be representative of the report.
The Description textbox allows the user to provide more information about the report.
Argument OptionsThe various argument options depend on the RPT File dropdown selection. The selections made here will be rep-resented in the Arguments grouping of a selected report on the Reports > Generate task.
*Note: Not all RPT File dropdown selections will present argument options.
- 55 -

Argument PromptThe Argument Prompt textbox is represented as a heading/identifier in the Arguments grouping of a selected reporton the Reports > Generate task, and therefore should be indicative of the selections the user must make in the Argu-ments grouping.
Example:When the user must select the batch of bridges to include in the report, the Argument Prompt textbox typ-ically reads "Batch Key."
Tool Tip (Optional)The Tool Tip textbox is an optional field for entering helpful information about the selections being made in theArguments grouping of a selected report on the Reports > Generate task. When the user hovers their mouse over theoptions, a message box will appear with the tip.
Example:When the user must select the batch of bridges to include in the report, hovering their mouse over theoptions could reveal a message such as "Choose the batch of bridges to include in the report."
Argument Control Type and Construction LogicThe options for the Argument Control Type and Construction Logic grouping are dependent upon the RPT File drop-down selection. These selections determine what options will be available to the user in the Arguments grouping of aselected report on the Reports > Generate task.
Register Page Controls
The New Report button creates a new report to be registered.
The Delete button deletes the currently selected report.
The Clear button clears any changes that have been made since a report's last save and takes the user back to the initialpage of the Reports > Register task.
The Save button saves any changes that have been made to the currently selected report.
- 56 -

Tunnels- The Tunnels section of the manual addresseseach of the tasks in BrM's Tunnels tab. TheTunnels tab contains several options to managethe tunnels within the database.
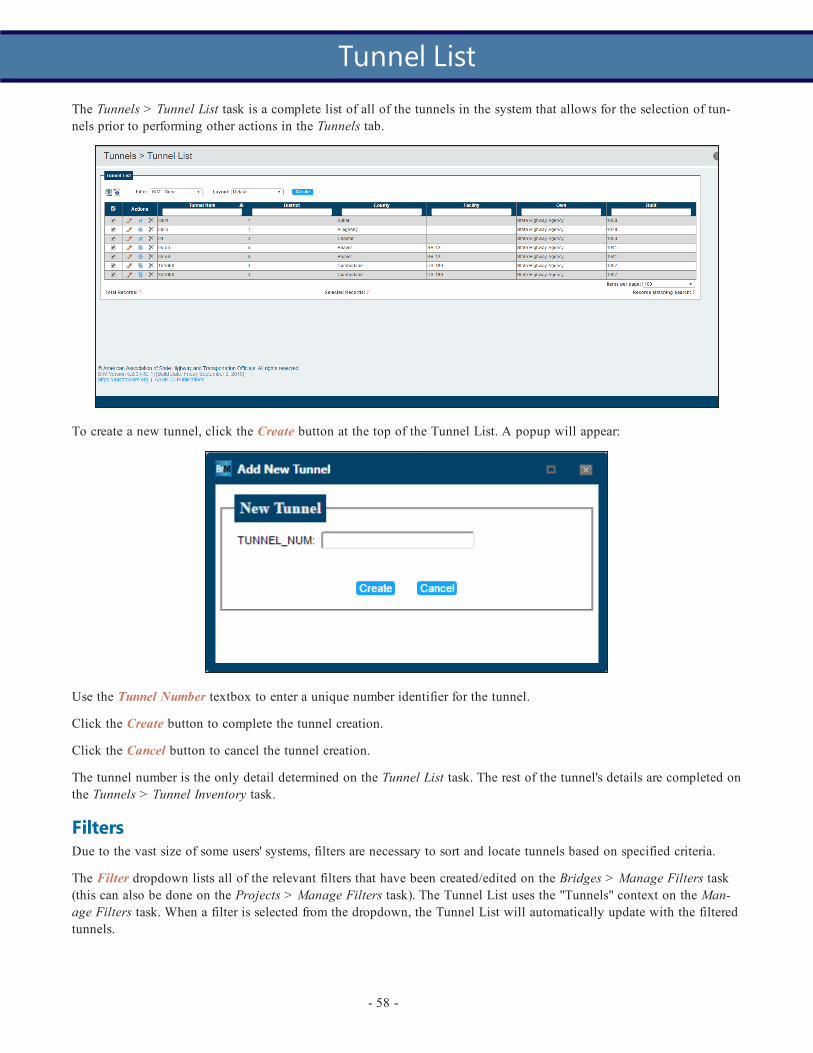
The Tunnels > Tunnel List task is a complete list of all of the tunnels in the system that allows for the selection of tun-nels prior to performing other actions in the Tunnels tab.
To create a new tunnel, click the Create button at the top of the Tunnel List. A popup will appear:
Use the Tunnel Number textbox to enter a unique number identifier for the tunnel.
Click the Create button to complete the tunnel creation.
Click the Cancel button to cancel the tunnel creation.
The tunnel number is the only detail determined on the Tunnel List task. The rest of the tunnel's details are completed onthe Tunnels > Tunnel Inventory task.
FiltersDue to the vast size of some users' systems, filters are necessary to sort and locate tunnels based on specified criteria.
The Filter dropdown lists all of the relevant filters that have been created/edited on the Bridges > Manage Filters task(this can also be done on the Projects > Manage Filters task). The Tunnel List uses the "Tunnels" context on the Man-age Filters task. When a filter is selected from the dropdown, the Tunnel List will automatically update with the filteredtunnels.
- 58 -
Tunnel List

LayoutThe Layout dropdown determines the Tunnel List's columns. There is a default layout on the Tunnel List task, but newlayouts can be created on the Bridges > Manage Layouts task (this can also be done on the Projects > Manage Layoutstask). The Tunnel List uses the "Tunnels" context on the Manage Layouts task.
Export OptionsThere are two export options located at the top left corner of the Tunnel List: XLS and KML. If one or more tunnels areselected, only the information from the selected tunnels will export. If no tunnels are selected, all of the tunnels in thecurrent filter will be exported.
Selecting TunnelsTo select a tunnel, check the box in the Tunnel List for the desired tunnel. Multiple tunnels can be selected at once, butthe last selected tunnel will be the one displayed when navigating to the other Tunnels tasks.
Tunnel List ControlsWithin the Tunnel List are controls to edit, copy, and delete tunnels.
The icon takes the user to the Tunnels > Tunnel Inventory page to edit the details of the tunnel.
The icon makes a copy of the tunnel and all of its details. A popup will appear so that the user can give the copy aunique number identifier.
The icon deletes the tunnel.
- 59 -
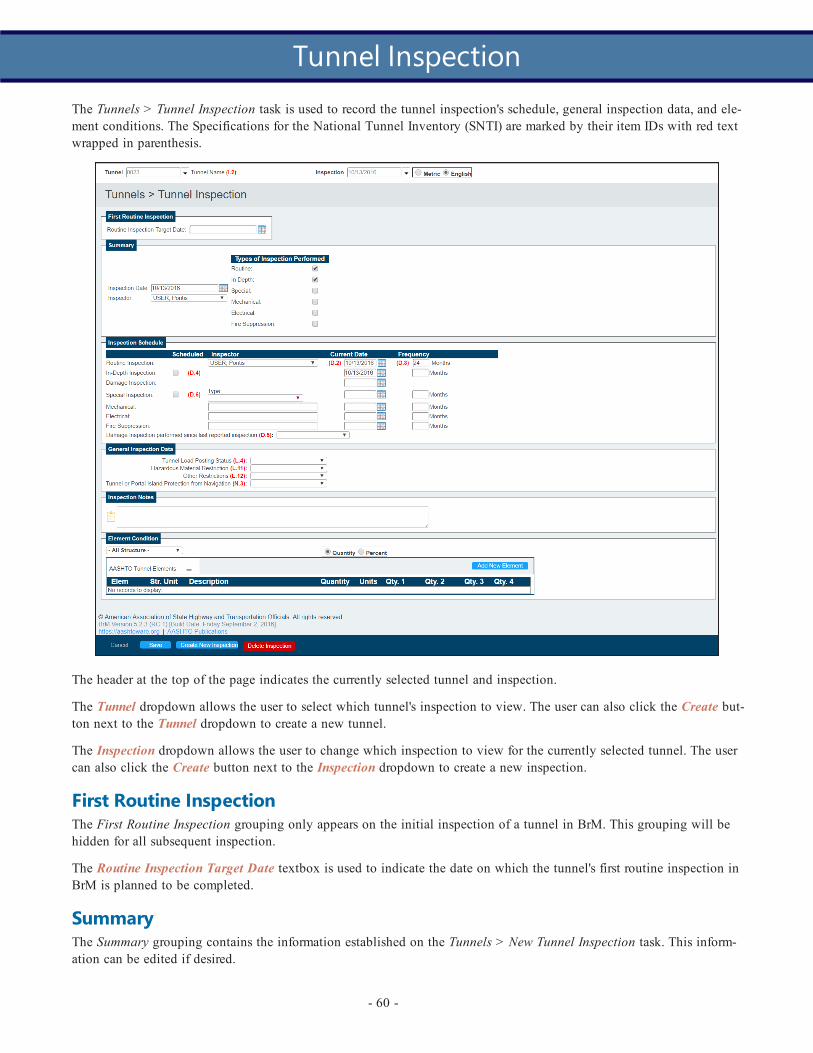
The Tunnels > Tunnel Inspection task is used to record the tunnel inspection's schedule, general inspection data, and ele-ment conditions. The Specifications for the National Tunnel Inventory (SNTI) are marked by their item IDs with red textwrapped in parenthesis.
The header at the top of the page indicates the currently selected tunnel and inspection.
The Tunnel dropdown allows the user to select which tunnel's inspection to view. The user can also click the Create but-ton next to the Tunnel dropdown to create a new tunnel.
The Inspection dropdown allows the user to change which inspection to view for the currently selected tunnel. The usercan also click the Create button next to the Inspection dropdown to create a new inspection.
First Routine InspectionThe First Routine Inspection grouping only appears on the initial inspection of a tunnel in BrM. This grouping will behidden for all subsequent inspection.
The Routine Inspection Target Date textbox is used to indicate the date on which the tunnel's first routine inspection inBrM is planned to be completed.
SummaryThe Summary grouping contains the information established on the Tunnels > New Tunnel Inspection task. This inform-ation can be edited if desired.
- 60 -
Tunnel Inspection

Inspection ScheduleThe Inspection Schedule grouping contains information about the various inspection for the tunnel.
The Scheduled checkboxes indicate a specific SNTI that must be recorded. The NTI requires that the user indicatewhether an in-depth and/or special inspection is scheduled. The Special Inspection dropdown can be configured usingthe pon_tunnel_insp.SPECIAL_TYPE option in the Admin > General Config > Parameters task.
The Inspector dropdown/textboxes indicate the person who performed the specific inspection type. Mechanical, elec-trical, and fire suppression inspection types contain textboxes rather than dropdowns because these inspections are nottypically done by BrM users but still need to be recorded.
The Current Date textbox displays the date of the most recent inspection for the selected tunnel based on type of inspec-tion. This can be the inspection that is currently being performed or the last inspection that was performed, all dependingon whether or not the inspection type is selected for the current inspection.
The Frequency textbox is used to determine the number of months between inspections based on type of inspection. Theroutine inspection will default to 24 months.
The Damage Inspection dropdown is an SNTI option necessary to indicate whether a damage inspection was performedsince the last recorded inspection.
General Inspection DataThe General Inspection Data grouping contains general SNTI information specific to the current inspection.
Element ConditionThe Element Conditions grouping is used to select which elements will be included in the inspection and then determ-ine the condition states of each element.
This grouping works almost exactly like the Inspection > Condition task's Element Conditions grouping. For in-depthinformation about the controls, read the Inspection > Condition section of the user manual.
Tunnel Inspection Page Controls
The Save button saves the changes made to the current inspection.
The Create New Inspection button creates a new inspection for the selected tunnel and takes the user to the Tunnels >New Tunnel Inspection task.
The Cancel button cancels the changes made to the current inspection and returns the user to the Tunnels > Tunnel Listtask.
The Delete Inspection button deletes the current inspection for the selected tunnel.
- 61 -

The Tunnels > Tunnel Inventory task contains all of the specific details for the selected tunnel as well as its structureunits.
The Tunnel dropdown in the header allows the user to select which tunnel's details to edit.
The top portion of the task has several groupings to indicate the tunnel's location, age, route information, and more.
Structure UnitsThe Structure Units grouping allows the user to create/modify the selected tunnel's structure units. Structure units aregroups of structures typically based on structural design and material. It is not necessary to have multiple structure units,but it can be helpful for inspections.
Click the Add New button to create a new structure unit:
- 62 -
Tunnel Inventory

The Key textbox is a simplified identifier for the structure unit that's displayed in the Str. Unit column of the Elementsgrid on the Tunnel Inspection task.
The Structure Unit Name textbox is used to indicate the name of the structure unit and should include specific inform-ation that clearly explains which area of the tunnel it covers.
The Default checkbox determines the default structure unit selected when a new element is added to a tunnel inspectionon the Tunnels > Tunnel Inspection task. Only one structure unit can be the default.
The Active checkbox determines whether or not the structure unit is active and available to be utilized on the Tunnels >Tunnel Inspection task.
Tunnel Inventory Page ControlThe Save button saves the changes made on the Tunnels > Tunnel Inventory task.
The Save & Close button saves the changes made on the Tunnels > Tunnel Inventory task and returns the user to the Tun-nels > Tunnel List task.
The Cancel button cancels the changes made on the Tunnels > Tunnel Inventory task and returns the user to the Tunnels> Tunnel List task.
- 63 -

The Tunnels > New Tunnel Inspection task is used to create a new inspection for the selected tunnel. This page is onlyaccessible by selecting the Create New Inspection button on the Tunnels > Tunnel Inspection task.
The Team Leader dropdown defaults to the current user but can be changed.
The Inspection Date textbox defaults to the current date but can be changed.
The Types of Inspection Performed grouping contains checkboxes to indicate specifically which inspection types will beperformed during the newly created inspection.
New Tunnel Inspection Page ControlsThe Create button creates a new inspection based on the selections made on the page and sends the user to the Tunnels> Tunnel Inspection task.
The Cancel button cancels the new inspection creation and returns the user to the Tunnels > Tunnel List task.
- 64 -
New Tunnel Inspection

Admin- The Admin section of the manual addresseseach of the tasks in BrM's Admin tab. TheAdmin tab contains the administrative functionsof BrM that create flexibility within thesoftware by allowing the administrator toconfigure various settings to meet agencyneeds.

The Admin > Security task allows the admin to set up the system's security structure. The admin can create and editusers, user groups, and user roles, as well as determine basic permissions for user roles, manage database setups, anddetermine user role report access.
BrM User Security
Security Component Description
UserEvery person who uses BrM will have a user account to log in to the software using auser name and password. The user account is then tied to groups and roles to determ-ine what a user can see and do within BrM.
Group
A user's group determines which structures are visible and accessible to the user inthe system.
Example: If a user works on bridges in district 1 and the admin only wants them tosee district 1 structures, the user will be assigned to a group with an access filter thatonly permits access to district 1 structures.
Role
A user's role is typically designed around that person's function within their agency.Separate roles usually exist for inspectors, planners, admins, etc. The role determines auser's module access and permissions within each module.
Example: If a user is an inspector, that user will mostly likely be assigned to aninspector role that grants both read and write access to the Inspection tab. However,that inspector role will probably be limited to read-only access for the Analysis tab.
- 66 -
Security
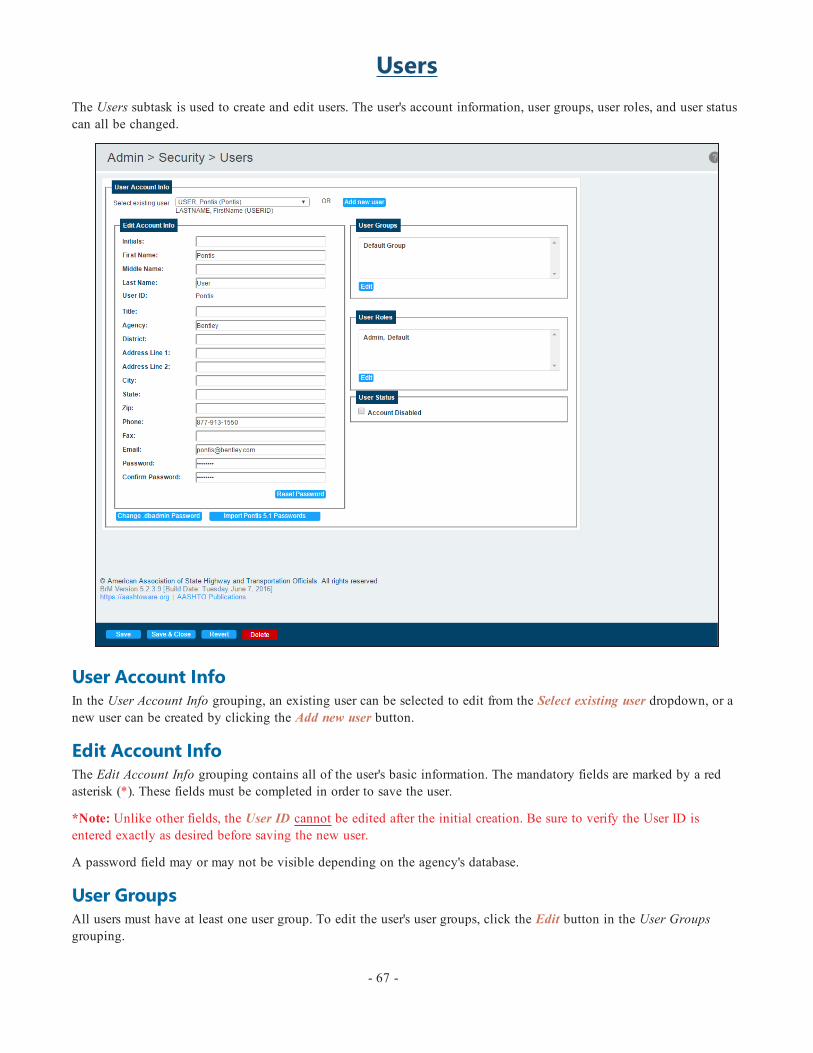
UsersThe Users subtask is used to create and edit users. The user's account information, user groups, user roles, and user statuscan all be changed.
User Account InfoIn the User Account Info grouping, an existing user can be selected to edit from the Select existing user dropdown, or anew user can be created by clicking the Add new user button.
Edit Account InfoThe Edit Account Info grouping contains all of the user's basic information. The mandatory fields are marked by a redasterisk (*). These fields must be completed in order to save the user.
*Note: Unlike other fields, the User ID cannot be edited after the initial creation. Be sure to verify the User ID isentered exactly as desired before saving the new user.
A password field may or may not be visible depending on the agency's database.
User GroupsAll users must have at least one user group. To edit the user's user groups, click the Edit button in the User Groupsgrouping.
- 67 -

The user's current user groups are on the left in the Members Groups list, and the other existing user groups that the useris not a part of are on the right in the Non-Member Groups list.
To move one or more user groups from one list to the other, select all of the desired user groups and then click the rightor left arrow - - to move the selections to the desired list.
The Unselect All buttons below each list can be used to unselect all user groups currently selected.
Users - User Groups - Page ControlsThe Save button saves the changes that have been made to the user's user groups and keeps the user on the page.
The Save and Close button saves the changes that have been made to the user's user groups and exits back to the Userssubtask.
The Cancel button cancels the changes that have been made to the user's user groups and exits back to the Users sub-task.
User RolesAll users must have at least one user role. To edit the user's user roles, click the Edit button in the User Roles grouping.
- 68 -

The user's current user roles are on the left in the Members Roles list, and the other existing user roles that the user is nota part of are on the right in the Non-Member Roles list.
To move one or more user roles from one list to the other, select all of the desired user roles and then click the right orleft arrow - - to move the selections to the desired list.
The Unselect All buttons below each list can be used to unselect all user roles currently selected.
Users - User Roles - Page ControlsThe Save button saves the changes that have been made to the user's user roles and keeps the user on the page.
The Save and Close button saves the changes that have been made to the user's user roles and exits back to the Userssubtask.
The Cancel button cancels the changes that have been made to the user's user roles and exits back to the Users subtask.
User StatusThe User Status grouping contains the Account Disabled checkbox that determines whether or not an account is access-ible. If the box is checked, the currently selected user will not be able to log in to BrM.
Disabled user accounts are greyed out in the Select Existing User dropdown in the User Account Info grouping.
Change .dbadmin PasswordThe .dbadmin account controls the database. Clicking the Change .dbadmin Password button will allow the admin tochange the .dbadmin password.
- 69 -

It is recommended that the .dbadmin password be changed from the initial password to ensure system security.
Import Pontis 5.1 PasswordsThe Import Pontis 5.1 Passwords button allows the admin to import passwords from the previous version of BrM. Bydefault, migrating to a new system resets all passwords.
Click the Import Pontis 5.1 Passwords button to proceed to the following page:
Click the Choose File button to locate the file containing the old passwords, then click the Import button.
Click the Close button to return to the Admin > Security > Users subtask.
Users Page Controls
The Save button saves the changes to the selected user.
The Save and Close button saves the changes to the selected user and returns the admin to the Bridges > View List task.
The Revert button cancels any unsaved changes to the selected user.
The Delete button deletes the selected user from the system. However, this is not a permanent deletion from the database.This marks the user as "inactive" in the Pon_App_Users database table.
- 70 -

GroupsThe Groups subtask is used to create and edit groups. The admin can control the access filters for each group and theusers within each group. The access filters created on the Manage Filters task determine to which structures the users inthe group have access. Only the structures that meet the criteria established in the group's access filters will be visibleand accessible to the users in the group.
Existing and New User GroupsThe Select Existing Group dropdown allows for the selection of an existing user group.
The Add New Group button creates a new user group.
Group Bridge Access FiltersThe Group Bridge Access Filters grouping determines the access filters for the selected user group. Clicking the Edit but-ton takes the admin to the following page:
- 71 -

The user group's current access filters are on the left in the Members Filters list, and the other existing access filters areon the right in the Non-Member Filters list.
To move one or more access filters from one list to the other, select all of the desired access filters and then click theright or left arrow - - to move the selections to the desired list.
The Unselect All buttons below each list can be used to unselect all access filters currently selected for that list.
Groups - Access Filters - Save and Cancel ControlsThe Save button saves the changes that have been made to the user group's access filters and keeps the user on the page.
The Save and Close button saves the changes that have been made to the user group's access filters and exits back to theGroups subtask.
The Cancel button cancels the changes that have been made to the user group's access filters and exits back to theGroups subtask.
Modify User Group MembershipThe Modify User Group Membership grouping controls which users belong to the selected user group.
The Edit Group Name textbox is used to update the name of the existing user group or to name the new user group.User group names that are greyed out in the textbox cannot be edited.
The user group's current users are on the left in the Users in Group list, and the other existing users not in the user groupare on the right in the Users Not in Group list.
To move one or more users from one list to the other, select all of the desired users and then click the right or left arrow -- to move the selections to the desired list.
The Unselect All buttons below each list can be used to unselect all users currently selected for that list.
Groups Page Controls
- 72 -

The Save button saves the changes made to the selected user group.
The Revert button cancels any unsaved changes made to the selected user group.
The Delete Group button deletes the selected user group from the system.
*Note: User groups can only be deleted if they do not contain users. Attempting to delete a user group that containsusers will prompt the following message:
"Group cannot be deleted. Please remove all users from the group first."
- 73 -

RolesThe Roles subtask is used to create and edit user roles and determine which users will be in each role. Once the roles arecreated, the Admin > Security > Permissions subtask and the Navigation and Field Security tasks can be used to estab-lish the role's access and permissions within the system.
BrM comes with default roles available to the user with varying degrees of security permissions and access. Those rolesinclude:
l Default - The lowest access level of all default roles. Users in this role have read-only access to only the Bridgeand Inspection tabs.
l Basic - This role grants users access to the Bridge, Reports, Inspection, and Gateway tabs in a limited capacity.They can view inspections, run reports, export data, and make changes to NBI fields, but cannot create newinspections or modify element data in existing inspections.
l Analysis - This role is for users working on the analytical side of BrM. Users assigned to this role have access tothe Bridge and Analysis tabs in BrM and read-only access to Inspection tab.
l Advanced - This role grants access to all non-admin functionality. This role removes access to the Admin tab andadmin functions (such as filter and layout creation). This is the role an average user entering inspection datawould be assigned to in BrM.
l Admin - Top level user access role. Users in this role have access to every page and function in BrM. This is theonly role with access to the Admin tab.
l AdminAnalysis - A planner role that has read-only access to the Inspection tab, full access to the Analysis, Pro-jects, and Programs tabs, and access to modify certain Admin tasks.
The following table displays the default BrM roles and the access to each task in the system:
*Note: "X" indicates full access to the task. "RO" indicates read-only access to the task.
- 74 -

BrM Default Roles and Permissions
Default Basic Analysis Advanced Admin AdminAnalysis
Bridges
View List X X RO X X X
Manage Layouts X
Manage Filters > Edit Fil-ter X
Manage Filters > EditSQL X
New Inspection X X
Suff Rate X X X
Validate X X X
Create Struct X X
Copy Struct X X
Remove Struct X X
Manage Bridge Groups >Bridge Groups X X
Manage Bridge Groups >Bridge Group Details X
Manage Bridge Groups -Add/Remove Roadways X
Manage Bridge Groups >Setup Bridge Groups X
Mapping X
Reports
Generate X X X X
Register X X X
Tunnels
Tunnel ListBy default, all roles have full access to the Tunnels tasks. The admin can establish per-missions for the tasks on the Admin > Security > Permissions subtask.Tunnel Inspection
Tunnel Inventory
Admin
Security > Users X
Security > Groups X
Security > Roles X
Security > Permissions X
Security > Databases X
- 75 -

BrM Default Roles and Permissions
Default Basic Analysis Advanced Admin AdminAnalysis
Security > Reports X
Security > PasswordRules X
General Config > Para-meters X
General Config >Options X X
General Config > ExportOptions X X
General Config > DataDict X X
General Config >Checked Out Bridges X X
General Config > Log-ging X X
General Config > Stand-ard X X
General Config > Agency X X
General Config > VisualForm Editor X X
General Config > PageExport X
General Config > Equa-tion Editor X
General Config > SetEditor X
General Config > Val-idation Editor X
Mapping > Sync Map-ping X X
Mapping > Map Options X
Modeling Config > Ele-ment Spec X X
Modeling Config > Ele-ment-Child Linking X
Modeling Config > Pro-ject Categories X
Modeling Config >Deterioration Profiles X
- 76 -

BrM Default Roles and Permissions
Default Basic Analysis Advanced Admin AdminAnalysis
Modeling Config > Ele-ments X X
Modeling Config >Assessment X X
Modeling Config > Bene-fit Groups X X
Modeling Config >Action Defs X X
Modeling Config > CostIndex X X
Modeling Config > Net-work Policies X X
Modeling Config >Advanced Formulas X X
Modeling Config > Util-ity X X
Modeling Config >Weights Profile X X
Modeling Config > Sub-division Profiles X X
Modeling Config > Exec-utive Summary X X
Modeling Config > NBIDeterioration Models X X
Modeling Config > NBIConversion Profiles X X
Modeling Config > Pre-servation and Replace-ment Policy
X X
Modeling Config >LCCA Policy Rules X X
Modeling Config >LCCA Assign Policies X X
Tunnels > Asset ElementDefinitions X X
Tunnels > Asset Element-Child Linking X X
Inspection
Condition RO RO X X X RO
- 77 -

BrM Default Roles and Permissions
Default Basic Analysis Advanced Admin AdminAnalysis
Appraisal RO RO X X X RO
Inventory > Admin RO RO X X X RO
Inventory > Design RO RO X X X RO
Inventory > Roads RO RO X X X RO
Inventory > AgencyItems RO RO X X X RO
Schedule RO RO X X X RO
Work > Work Candidates RO RO X X X RO
Work > Project Inform-ation RO RO X X X RO
Multimedia RO RO X X X RO
Assessments RO RO X X X RO
Element Condition Rat-ings RO RO X X X RO
Gateway
Export X X X X
Import X X X X
Check Out X X X
Check In X X X
Override X X X
Analysis
Work Candidates >Bridge Analysis X X X
Work Candidates >Reverse Calculation X X X
Work Candidates >Needs List X X X
Work Candidates > Com-parison Groups X X X
Utility Value X X X
LCCA X X
Projects
Project List X X
Manage Layouts X X
Manage Filters > Edit Fil-ter X X
- 78 -

BrM Default Roles and Permissions
Default Basic Analysis Advanced Admin AdminAnalysis
Manage Filters > EditSQL X X
Create/Edit Project >Query X X
Create/Edit Project > Sum-mary X X
Create/Edit Project > Ana-lysis X X
Create/Edit Project >Management X X
Upload Project X X
Combine Projects X X
Split Project X X
Manage Funding > Fund-ing List X X
Manage Funding >Create/Edit FundingSources
X X
Programs
Program List X X
Create/Edit Programs X X
Assign Projects X X
Performance Measures X X
Funding Allocation X X
Program Planning X X
Program Results X X
Executive Summary X X
Create/Edit Scenarios X X
Scenario Explorer X X
Existing and New User RolesThe Select Existing Role dropdown allows for the selection of an existing user role.
The Add New Role button creates a new user role.
A role can also be copied using the Copy Role button. This creates a copy of the currently selected role and adds all ofthe selected role's users to the copy.
- 79 -

Modify User Role MembershipThe Modify User Role Membership grouping controls which users belong to the selected user role.
The Role Name textbox is used to update the name of the existing user role or to name the new user role. User rolenames that are greyed out in the textbox cannot be edited.
The user role's current users are on the left in the Users in Role list, and the other existing users not in the user role areon the right in the Users Not in Role list.
To move one or more users from one list to the other, select all of the desired users and then click the right or left arrow -- to move the selections to the desired list.
The Unselect All buttons below each list can be used to unselect all users currently selected for that list.
Roles Page Controls
The Save button saves the changes made to the selected user role.
The Revert button cancels any unsaved changes made to the selected user role.
The Delete Role button deletes the selected user role from the system.
- 80 -

PermissionsThe Permissions subtask allows the admin to determine the basic site permissions for user roles, including permissionsrelated to bridges, tunnels, elements, and inspections.
Modify Role PermissionsTo modify the permissions granted to each user role, click the Modify Role Permissions button to be taken to the fol-lowing page:
- 81 -

Choose the desired user role from the Select Existing Role dropdown.
The user role's current permissions are on the left in the Permissions Granted list, and the other available permissions areon the right in the Permissions Not Granted list.
To move one or more permissions from one list to the other, select all of the desired permissions and then click the rightor left arrow - - to move the selections to the desired list.
The Unselect All buttons below each list can be used to unselect all permissions currently selected for that list.
Permissions Page ControlsThe Save button saves the changes to the selected user role.
The Save and Close button saves the changes to the selected user role and returns the admin to the Admin > Permissionstask.
The Cancel button cancels any changes made to the selected user role and returns the admin to the Admin > Permissionstask.
- 82 -
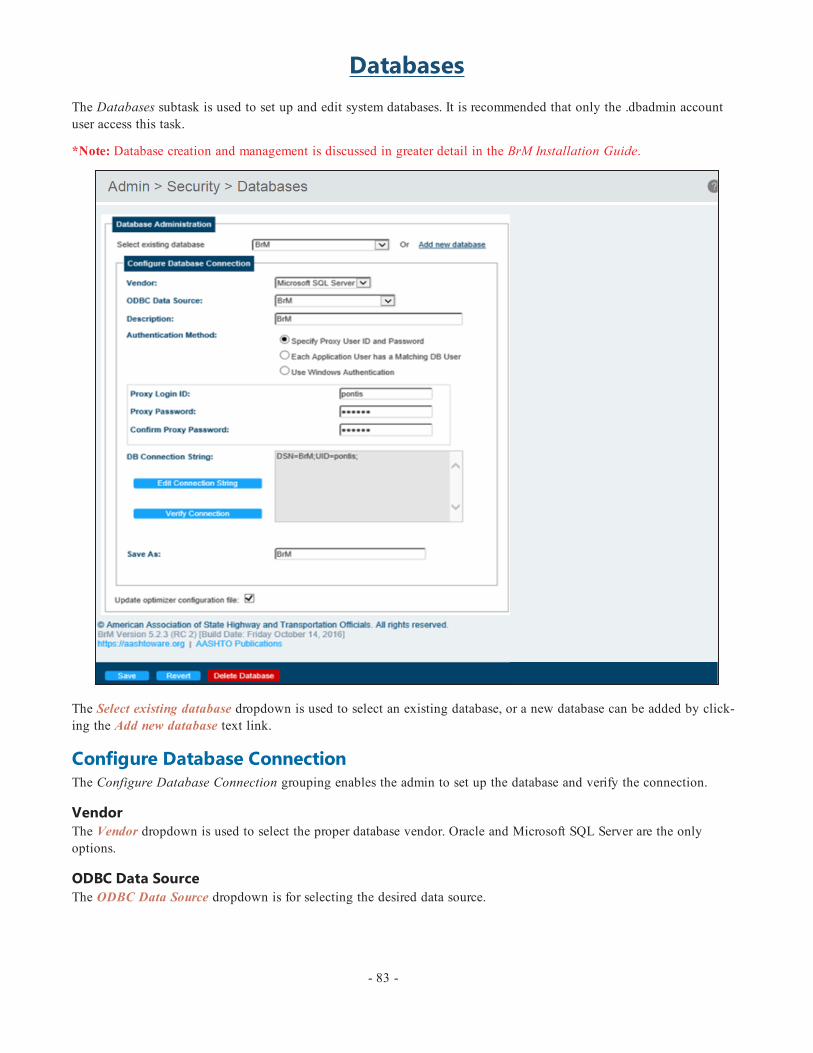
DatabasesThe Databases subtask is used to set up and edit system databases. It is recommended that only the .dbadmin accountuser access this task.
*Note: Database creation and management is discussed in greater detail in the BrM Installation Guide.
The Select existing database dropdown is used to select an existing database, or a new database can be added by click-ing the Add new database text link.
Configure Database ConnectionThe Configure Database Connection grouping enables the admin to set up the database and verify the connection.
VendorThe Vendor dropdown is used to select the proper database vendor. Oracle and Microsoft SQL Server are the onlyoptions.
ODBC Data SourceThe ODBC Data Source dropdown is for selecting the desired data source.
- 83 -
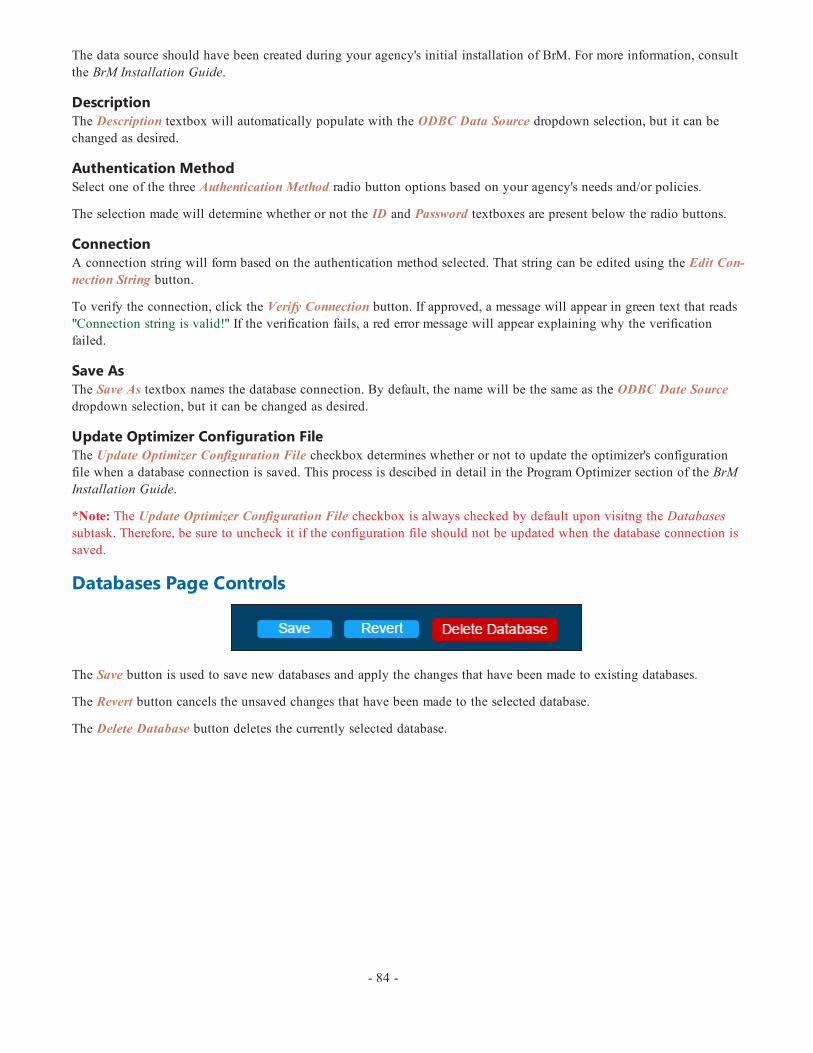
The data source should have been created during your agency's initial installation of BrM. For more information, consultthe BrM Installation Guide.
DescriptionThe Description textbox will automatically populate with the ODBC Data Source dropdown selection, but it can bechanged as desired.
Authentication MethodSelect one of the three Authentication Method radio button options based on your agency's needs and/or policies.
The selection made will determine whether or not the ID and Password textboxes are present below the radio buttons.
ConnectionA connection string will form based on the authentication method selected. That string can be edited using the Edit Con-nection String button.
To verify the connection, click the Verify Connection button. If approved, a message will appear in green text that reads"Connection string is valid!" If the verification fails, a red error message will appear explaining why the verificationfailed.
Save AsThe Save As textbox names the database connection. By default, the name will be the same as the ODBC Date Sourcedropdown selection, but it can be changed as desired.
Update Optimizer Configuration FileThe Update Optimizer Configuration File checkbox determines whether or not to update the optimizer's configurationfile when a database connection is saved. This process is descibed in detail in the Program Optimizer section of the BrMInstallation Guide.
*Note: The Update Optimizer Configuration File checkbox is always checked by default upon visitng the Databasessubtask. Therefore, be sure to uncheck it if the configuration file should not be updated when the database connection issaved.
Databases Page Controls
The Save button is used to save new databases and apply the changes that have been made to existing databases.
The Revert button cancels the unsaved changes that have been made to the selected database.
The Delete Database button deletes the currently selected database.
- 84 -

ReportsThe Reports subtask is used to determine which reports are visible for each user role.
Report SecurityUse the Roles listbox to select the role to be edited.
The Reports Hidden For Role list displays the reports that the role cannot see. The Reports Visible For Role list dis-plays the reports that the role can view.
To move one or more reports from one list to the other, select all of the desired reports and then click the single right or
left arrow - - to move the selections to the desired list.
To move all of the reports from one list to the other, click the double right or left arrow - - to move all of thereports to the desired list.
*Note: Regardless of the reports made available to a specific role, only the bridges available to a user based on theirgroups' access will appear in the reports.
Reports Page ControlsThe Save button saves the changes made to the report security for the selected role.
- 85 -

Password RulesThe Password Rules subtask is used to set the complexity rules for an agency's BrM login passwords.
The Enable Password Complexity Rules checkbox applies the password rules to the system's users. If left unchecked, thecheckboxes in the Password Validation Rules grouping will be read-only and the default password rule - minimum of 5characters - will take effect.
Password Validation RulesUse the Required checkbox to determine which of the settings are required for user passwords, then determine the spe-cifics of those settings using the Minimum textbox.
If the password expiration window (in days) is being utilized, all users will have different expiration dates depending onwhen their user accounts were created. To align all of the user accounts to have a "Password Last Updated" date of thecurrent date, click the Reset the Password Expiration Window for All Users.
Click Save to ensure that the updated settings take effect.
- 86 -

ParametersThe Admin > General Config > Parameters task allows the admin to manipulate the values for the various controlsthroughout the system including dropdowns, grids, and other data-bound value controls. The admin can also add newparameters from this task.
ParametersThe Parameters grouping lists all of the controls available to be manipulated. The combination of the Table Name andField Name columns determines where the parameter is located within the system.
If tooltips are enabled, a control's table and field name can be found throughout the software by hovering the mouse overthe desired control and viewing the Table & Column Name line.
Example: In the following screenshot, the mouse is hovering over the District field on the Bridges > Create Struct taskand the Table & Column Name line can be seen:
- 87 -
General Config

The Table & Column Name line corresponds to the Table Name and Field Name columns within the Parameters group-ing of the Admin > General Config > Parameters task.
Add New ParameterTo add a new parameter, fill in the Table Name and Field Name textboxes and click the Add New Parameter button.
*Note: In order for a new parameter to be added, the Table Name and Field Name must already exist in the Admin >General Config > Data Dict. task.
Parameter Values and LabelsThe Parameter Values and Labels grouping lists the values and their labels and descriptions for the selected parameter.
The Value field is the number or key that appears in the field called by the Field Name. The Short Label field is whatwill be visible to the user when making a selection from the control. The Description field is used mainly as an explan-ation of the value.
DeleteThe symbol deletes the value. If a value is deleted, it will no longer appear in the parameter control where it is loc-ated in the system.
*Note: For previous selections of the deleted value, the value will contain "(FIX PARAM VALUES)" to indicate that itwas previously selected but is no longer defined.
Example: If the inspevnt.dkrating value "6 - Satisfactory" is deleted, all previous inspection reports that had a deck rat-ing of "6 - Satisfactory" will read as "6 (FIX PARAM VALUES)." For all future inspections, the deck rating of "6 - Sat-isfactory" will not be present.
isActiveThe isActive checkbox is similar to deleting a value, but deactivating a value is not permanent and can be changed backat any time.
If the isActive checkbox is checked, the value will be visible in the parameter control where it is located in the system. Ifthe isActive checkbox is unchecked, the value will no longer appear in the parameter control.
*Note: For previous selections of the deactivated value, the value will be greyed out and contain "[Inactive]" to indicatethat it was previously selected but is no longer active.
- 88 -

Example: If the inspevnt.dkrating value "6 - Satisfactory" is deleted, all previous inspection reports that had a deck rat-ing of "6 - Satisfactory" will read as "6 - Satisfactory [Inactive]." For all future inspections, the deck rating of "6 - Sat-isfactory" will not be present.
Parameters Page ControlsThe Save button saves all of the changes that have been made on the Admin > General Config > Parameters task.Changes can be made to multiple parameters before the Save button is clicked and all of the changes will be saved.
- 89 -

OptionsThe Admin > General Config > Options task allows the admin to configure various options throughout BrM.
OptionsThe Options grouping contains the Options list with all of the configuration options. To select an option, click the
desired icon.
Configuration OptionThe Configuration Option grouping contains the information and configurable values for the option selected from theOptions list. The Options table at the end of this section provides an explanation of each of the available options.
- 90 -

Restore Defaults
The Restore Defaults grouping contains the Restore Defaults button that can perform two functions based on the radiobutton selected:
l If the Fixup Existing Options In-Place radio button is selected, clicking the Restore Defaults button will restoreany Option Value text fields that have been left blank back to their default value.
l If the Replace All Options radio button is selected, clicking the Restore Defaults button will restore all optionsback to their default values.
Options Page ControlsClick the Save button to save the changes made to the selected option.
Description of Options
Options
Option Description Default Value
BRIDGEGRIDCONTIN-UOUSSCROLLING
Distinguishes the Bridge List as either a pagingor scrolling list.
If "True," all of the structures in the Bridge Listwill be viewable in one continuous scroll. If"False," only a certain number of structures willbe viewable per page of the Bridge List.
False
CALCIMPACTVALUE Determines the calculation used for the impactvalue of assessments.
1 / (1 + 0.00223732 * e- 1 * (1.16588 * loge(roadway.BYPASSLEN* roadway.ADTTOTAL* .00000006))) * 100
COLLAPSEMENUONLOAD Determines if the tab menu bar is collapsed bydefault upon logging in to the system. False
COPYINSPECTIONNOTES
Determines if the inspection notes from theINSPVNT and ELEMINSP tables will be copied.
If "Yes" is selected, a structure's old inspectionnotes will be copied over to the new inspection.
Yes
CRYSTAL_REPORT_DIR Determines the location on the user's computerwhere the Crystal Reports files are saved.
~/pontismodules/crystal_reports/
DEFAULT_ALL_STRUCTSDetermines the default setting of the Structuredropdown on the Inspection > Condition task. True
- 91 -

Options
Option Description Default Value
If "True" is selected, the dropdown will default to"All Structures."
DEFAULT_SCENARIO This was used in older versions of BrM but is nolonger used in version 5.2.3.
DEFAULTINSPSTAT
Determines the default status of the structure. It isused for new structures created in the inspectionmodule (not by file import).
The value pulls from the "inspevnt.inspstat" para-meter in the Admin > General Config > Para-meters task. A value of "1" indicates that thesufficiency rating needs to be recalculated.
1
DEFAULTREGION
Determines the default region for newly createdstructures.
The value pulls from the "bridge.fhwa_regn" para-meter in the Admin > General Config > Para-meters task.
-1
DEFAULTSTATE The option selected will be the default state fornewly created structures. -1
DEFBRINSPFREQ Determines the default NBI inspection frequency(in months) for scheduling future inspections. 24
DEFFCINSPFREQDetermines the default fracture critical inspectionfrequency (in months) for scheduling futureinspections.
24
DEFOSINSPFREQDetermines the default other/special inspectionfrequency (in months) for scheduling futureinspections.
24
DEFSTRUNITKEY
Determines the default structure unit key. Mustbe an integer. Keys will increment by one fromthis starting number for additional structure unitson a bridge.
1
DEFSTRUNITTYPE
Determines the default structure unit used when anew structure is created. Once created, the struc-ture unit can be changed on the Inspection >Inventory > Design subtask, if desired.
The value pulls from the "structure_unit.strunit-type" parameter in the Admin > General Config> Parameters task.
M
DEFUWINSPFREQDetermines the default underwater inspection fre-quency (in months) for scheduling future inspec-tions.
24
DISCRATE This was used in older versions of BrM but is no
- 92 -

Options
Option Description Default Value
longer used in version 5.2.3.
DISTRICTNUMBER
Determines the default district for new structures.
The value pulls from the "bridge.district" para-meter in the Admin > General Config > Para-meters task.
-1
ELEMENT_CALC_LAST
Used to override default functionality of cal-culating last element insp date. To override, entera SQL statement that returns a date. To substitutevalues from current report to be used in SQL state-ment use $ColumnName.
Last_insp
ELEMENTMANUALPATH Determines the file path for the element manualsin the application. ~/elemguidemanuals/
ELEMINSPDEFAULTENVDetermines the default environment value (1through 4) when adding a new element on theInspection > Condition task.
1
ELEMINSPGRIDEXPANDALL
Determines how the element inspection grid isdisplayed on the Inspection > Condition task.
If "True" is selected, all of the elements in thegrid will be expanded to reveal their protectivesystems and defects. If "False" is selected, onlythe parent elements will be shown and will needto be expanded to reveal the protective systemand defect child elements.
False
EXPORT_BUFFER
Determines the amount of memory that BrM useswhile exporting via the Gateway > Export task.The amount will determine the speed of theexport (in MB).
10
EXPORT_NBI_008_PAD_LEFT Determines whether or not NBI item 08 is leftpadded for NBI/NBE exports. False
GATEWAY_USE_SYNC
Determines whether or not to include a "_sync"file in the Gateway > Export task that allows anagency to export/import between multiple data-bases (same version on different com-puters/environments).
Selecting "Y" will include the "_sync" file inexports, selecting "N" will exclude the "_sync"file.
Y
GOOGLE_MAPS_CLIENT_ID
If an agency has purchased their own license forGoogle Maps it can be entered here. The defaultOption Value of -1 will use a Client ID sharedby all BrM users. A Client ID can be acquiredfrom Google. If the Client ID specified is not
-1
- 93 -

Options
Option Description Default Value
valid Google will disable Maps.
IMPORTCHUNKSIZE
Determines the amount of memory that BrM useswhile importing via the Gateway > Import task.The amount will determine the speed of theimport.
20000
INSPECTIONOUTOFDATE
BrM issues a warning if the user attempts to setan inspection date that is X amount of days priorto the current date.
X = the value entered into the Option Value text-box (in days).
90
INSPEVNT_INSPSTAT_-LOCK_KEY
Determines whether an inspection can be lockedor not. Locked
INSPTABLE1
Determines whether or not the inspevnt table inthe database contains inspection data.
This would be changed if an agency is not usingthe default, out of the box inspevnt table.
Inspevnt
INSPTABLE2
Defines whether or not the userinsp table in thedatabase contains inspection data.
This would be changed if an agency is not usingthe default, out of the box userinsp table.
Userinsp
INSPUSERDFLT
Determines the default user inspection report.This report is selected in the report selection fieldwhen the user views the user reports from theInspection Module.
Insp003_inspection_schedule
JUMP_TO_BRIDGE_-SEARCH_TYPE
Determines the type of search used by the Jumpto Bridge control on the Bridge List when text isentered.
"Contains" checks all bridges to find those thatcontain what was typed into the Jump to Bridgecontrol.
"Starts With" checks all bridges to find those thatstart with what was typed into the Jump toBridge control and is therefore a more limitingoption than "Contains."
Contains
LOADTASKONTABCLICK Determines if the default task for a tab will beloaded upon clicking the tab in the tab menu bar. True
LOGCALCULATIONS Determines whether or not to log intermediate suf-ficiency rating and NBI-translator calculations. N
MAXBRIDGEGROUPS Determines the maximum number of bridge 250
- 94 -

Options
Option Description Default Value
groups that a user may generate at one time onthe Bridges > Manage Bridge Analysis Groupstask.
The larger the number, the more likely that itmay cause performance issues on the SetupBridge Analysis Groups subtask.
MAXMRRACTIONS Determines the maximum number of actionsallowed for each state of an element. 4
MULTISERVER This was used in older versions of BrM but is nolonger used in version 5.2.3.
MULTISERVER5
Specifies the root directory path to multimediadocuments on the server. Specify either a qual-ified http address (i.e. http://server/virtualdir) oras relative to the webserver using tilda (~) as aplaceholder for the root directory of the web site.
C:\
NBI_CALC_LAST
Used to override default functionality of cal-culating last NBI date. To override, enter a SQLstatement that returns a date. To substitute valuesfrom current report to be used in SQL statementuse $ColumnName.
Last_insp
OTHER_SPECIAL_CALC_LAST
Used to override default functionality of cal-culating last OS date. To override, enter a SQLstatement that returns a date. To substantiate val-ues from current report to be used in SQL state-ment use $ColumnName.
Last_insp
PON_UNITSThe application-wide unit of measurement forBrM. It is "metric" by default, but "English" canbe selected.
Metric
PON5_APP_LOGGING_-LEVEL
Determines the amount of log detail to be writtenin the logs.
0 = Turned off - nothing will be logged1 = Only Fatal messages logged2 = Fatal and Error messages logged3 = Fatal, Error, and Warning messages logged4 = Fatal, Error, Warning, and Info messageslogged5 = All messages - Fatal, Error, Warning, Info,and Debug - logged
5
PON5_DEFAULT_SHOW_QUANTITY
Determines whether the Element Conditions gridon the Inspection > Condition task will defaultto displaying element conditions as quantities orpercentages.
N
- 95 -

Options
Option Description Default Value
Selecting "Y" is for quantity, and selecting "N" isfor percentage.
PROJECTGRIDCONTINOUS-SCROLLING
Distinguishes the Project List as either a pagingor scrolling list.
If "True," all of the structures in the Project Listwill be viewable in one continuous scroll. If"False," only a certain number of structures willbe viewable per page of the Project List.
False
SYNC_BRIDGEWARE
Determines the database's ability to sync withBrD and BrR.
Selecting "Y" allows this sync, selecting "N" pre-vents it.
N
TEMP_FILE_AGE_IN_-DAYS
Defines how many days a file will stay in thetemporary folder before it is deleted. 30
TOOLTIPDELAY
Determines the time (in seconds) before a tooltipwill appear when the mouse cursor is hoveringover an item.
"0" will display the tooltip immediately. "-1" willdisable tooltips.
0
UPDATEKEYINPLACEDetermines whether or not changes to the valueof a primary key can be made without using aninsert/delete on the affected row.
Yes
WARNONEDITFORCHECKED-OUTBRIDGE
Determines whether or not a warning messagewill be displayed if a user tries to edit a checkedout bridge. This also controls whether or not thechecked out bridge symbol will appear in theInspection module header.
N
XTRNBRDGTABLE Defines the user bridge table. userbrdg
XTRNBRDGTABLEKEY Defines the key in the user bridge table. bridge_gd
XTRNINSPTABLE Defines the user roadway table. userinsp
XTRNINSPTABLEKEY Defines the key in the user inspection table. inspevnt_gd
XTRNRWAYTABLE Defines the user roadway table. userrway
XTRNRWAYTABLEKEY Defines the key in the user roadway table. roadway_gd
XTRNSTRUNITTABLE Defines the structure unit table. userstrunit
XTRNSTRUNITTABLEKEY Defines the key in the structure unit table. structure_unit_gd
- 96 -

Export OptionsThe Admin > General Config > Export Options task allows the admin to control the various options for the exports thatare performed on the Gateway > Export task.
Export OptionsThe Export Options grouping contains the Export Data dropdown with all of the export options. When a selection ismade from the dropdown, the list will update with the tables that are included in the selected export option.
The Sequence field determines the order in which the information will be presented in the export.
The Include checkbox determines whether or not the table will be included in the export. The icon is used to deletea table from the export option, but the default tables included in each of the export options cannot be deleted and will
not have icons. Only additional tables not in the default export can be deleted. However, default tables do not neces-sarily need to be included in the export because the Include checkbox can be unchecked.
Add TableThe Add Table grouping contains the Add Table button and dropdown. This control adds the selected table to the exportoption currently selected in the Export Data dropdown.
*Note: Altering preset exports is only recommended for experienced admins due to possible foreign key violations dur-ing the import. There are no restrictions built-in to the software to prevent invalid key combinations.
Export Options Page ControlsClick the Save button to save the changes made to the selected export option.
- 97 -

Data Dict.The Admin > General Config > Data Dict task allows the admin to modify various rules for the columns of all of thetables in the database.
*Note: Modifying a table's column rules is only recommended for experienced administrators due to the major changesthat can occur in the system.
The Select Table Name grouping contains a list of all of the tables in the system. Select a table to modify its columns'rules.
Select a Column NameThe Select a Column Name dropdown contains all of the columns in the currently selected table. Selecting a columnwill present that column's rules in the Edit Details grouping.
Edit DetailsThe Edit Details grouping contains all of the rules for the selected column.
Column Rules
Field Name Description
Col Alias The alias of the selected column. This does not change the column name.
V2 Convert The .Net data type.
Data Type The SQL data type.
Width The available field length for storage and display.
Decimal Places The maximum number of decimal places - if applicable.
- 98 -

Column Rules
Field Name Description
Allow Nulls Y or N - Indicates whether nulls (field left blank) are allowed.
Unique Key Y or N - Indicates whether or not the field must be unique.
Position The column's position in the database.
NBI Code The NBI code or "-1" if not applicable.
Val Type Indicates whether there will be a range (such as 1-9) or list of values (such as steel bridge,wood bridge, concrete bridge, etc.) for the field.
Val Attr1 If there is a range, this is the minimum value permitted.
Val Attr2 If there is a range, this is the maximum value permitted.
Sys. Field Indicates whether the field is a default system field or a custom agency field.
Sys. Default The default entry for the column if nulls aren't allowed and the column is left blank.
Key Attr1 Y or N - Indicates whether or not the column is a primary key.
Unique Field Gives the field a distinct alias.
Help ID This was used in older versions of BrM but is no longer used in version 5.2.3.
Pair Code The metric/English unit conversion factor.
ConversionRules Defines the rule used to perform metric/English conversions.
SNotes Short notes limited to 255 characters.
Include on Cus-tom Forms
If checked, the column will be available for custom forms on the Admin > Navigation & FieldSecurity task.
Notes Notes limited to 3999 characters.
Add/Refresh TableThe Admin > General Config > Data Dict. task does not update automatically, therefore the Add/Refresh Table group-ing is used to update the data dictionary with new tables or table updates.
To add a new table, enter the table's name into the textbox and then click the Add/Refresh button.
To update an existing table, select the table from the Select Table Name grouping and click the Add/Refresh button.
Data Dict. Page ControlsChanges can be made to multiple tables and columns before saving. All changes will be saved as long as the Save but-ton is clicked before exiting the Admin > General Config > Data Dict. task.
- 99 -

Checked Out BridgesThe Admin > General Config > Checked Out Bridges task allows the admin to view and remove the bridges that havebeen checked out on the Gateway > Check Out task.
All of the bridges listed in the Checked Out Bridges grid can be considered to be in a locked state. Changes can still bemade to those bridges in the software, but those changes must then be approved when the bridge is checked in on theGateway > Check In task. This can help to ensure that no unwanted changes are made.
*Note: If WARNONEDITFORCHECKEDOUTBRIDGE is set to "Y" on the Admin > General Config > Options task:
When entering the Inspection module with a checked out bridge selected, a popup message will notify the user of the
bridge's status and a symbol will appear next to the bridge's ID in the Inspection module header.
Ioflag columnThe Ioflag column indicates whether or not that particular entry of the bridge is in a checked out or checked in state.Rather than automatically be removed when a bridge is checked back in, the checked out entry remains until removed. Achecked out bridge will have an Ioflag value of "O". A checked in bridge will have an Ioflag value of "I."
As long as the PDI is retained for each entry, the bridge can be reverted back to the state it was in for any entry.
Atrigger columnThe Atrigger column indicates whether or not the bridge has been modified since it was checked out. The original checkout of the bridge will have an Atrigger value of "0." If the bridge is modified while checked out, the grid will auto-matically create another entry for the bridge with an Atrigger value of "1." This indicates the bridge has been modified.
Checked Out Bridges ControlsThe Remove button removes the selected bridges from the Checked Out Bridges grid. This is meant to be used in caseswhere the user wants to remove the read-only status of the checked out bridge without having to check it back in.
The Cancel button returns the user to the Bridges > View List task.
- 100 -

LoggingThe Admin > General Config > Logging task allows the admin to generate logs to investigate errors, bugs, etc. that aredifficult to understand or reproduce.
Logger SettingsThe Turn Logging On checkbox determines whether or not the system will create a log while in use. In some cases,unchecking the box to turn logging off may improve the software's performance, however there will no longer be logsavailable for use in examining issues within the software.
The Max # of Backup Files textbox determines the maximum number of backup logs that are kept on file before the old-est is deleted.
Logging LevelsThe Logging Level checkboxes determine what information will be included in the logs. The levels move from least crit-ical - Debug - to most critical - Fatal. When a level is checked, all levels more critical than the selected level will auto-matically be checked to ensure that the most important information is included in the logs. Similarly, when a level isunchecked, all levels less critical than the unchecked level will automatically be unchecked.
Example: If the Warn checkbox is checked, the Error and Fatal checkboxes will automatically be checked becausethey are more critical than - Warn.
Logging Page ControlsThe Apply button saves any of the changes that have been made to the logger settings.
As the message below the Apply button indicates, clicking the Apply button will cause the server to restart and log theadmin out of the software.
The View Log File dropdown and button are used to select a log file and view it. The dropdown will include the currentlog file as well as all of the existing back up files.
- 101 -

StandardThe Admin > General Config > Standard task allows the admin to modify the navigation and security options for thetabs, tasks, groupings, and controls within the out-of-the-box version of BrM. Limits have been placed on the editing pos-sibilities to maintain the core of the software.
Selecting the Navigation radio button allows the admin to make changes to the way the software looks and operates.
Selecting the Security radio button allows the admin to make changes to the visibility and access that each role has tothe objects.
*Note: In some cases, the Navigation radio button will not be accessible. This is to ensure that the core of the softwareis maintained.
NavigationWhen Navigation is selected, an object must also be selected. The selection will determine what options will be avail-able to modify. The selectable objects are: Tabs, Tasks, Groups, and Controls.
TabsWhen Tabs is selected, the available groupings will be Tab Name and [Tab] Properties.
- 102 -

Tab NameThe Tab Name grouping is used to select the tab navigation to modify.
[Tab] PropertiesThe [Tab] Properties grouping is used to modify the navigation details of the selected tab.
l Label: The name of the tab cannot be changed for internal database purposes, but the Label textbox allows theadmin to change the name that the users see.
l Order: Determines what order the tab will appear in on the tab bar, with the top-most tab being "1."l Visible: Determines if the tab is visible or hidden.l Read Only: Determines whether or not everything contained in the tab will be read only.l Tool Tip: The text entered into the Tool Tip textbox will be shown when the user hovers the mouse over theselected tab.
TasksWhen Tasks is selected, the available groupings will be Task Name and [Task] Properties. The admin will also have toselect a tab in the Select grouping.
- 103 -
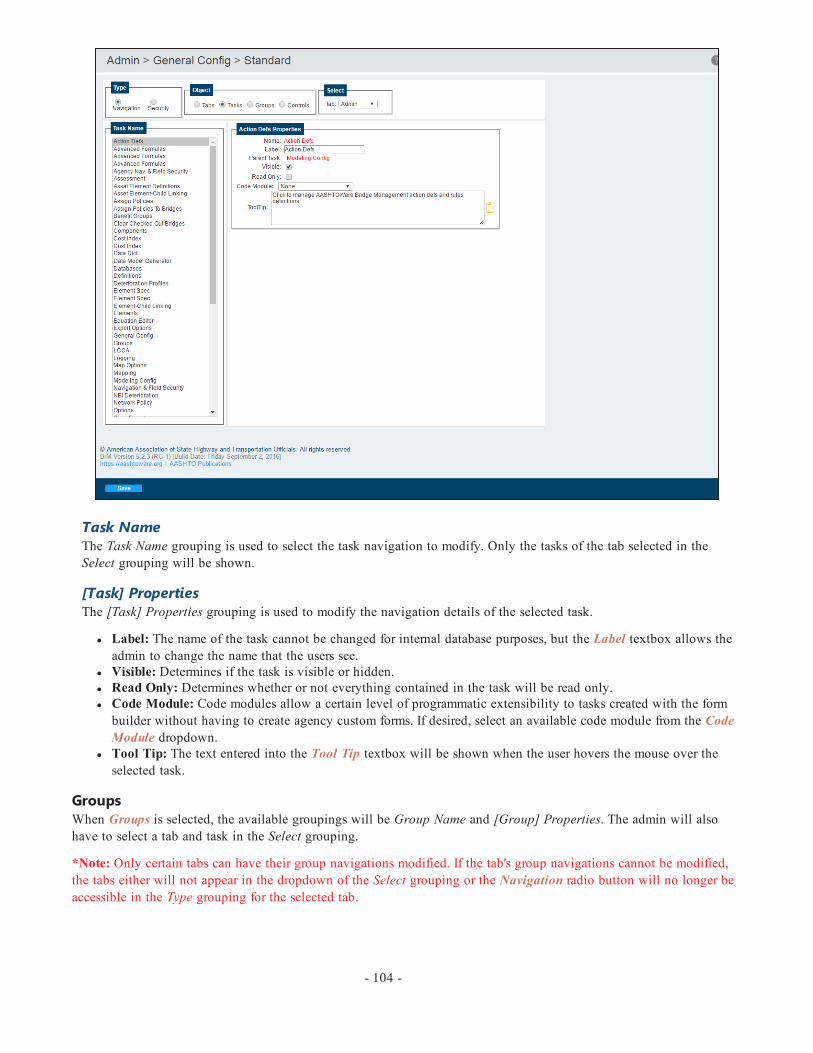
Task NameThe Task Name grouping is used to select the task navigation to modify. Only the tasks of the tab selected in theSelect grouping will be shown.
[Task] PropertiesThe [Task] Properties grouping is used to modify the navigation details of the selected task.
l Label: The name of the task cannot be changed for internal database purposes, but the Label textbox allows theadmin to change the name that the users see.
l Visible: Determines if the task is visible or hidden.l Read Only: Determines whether or not everything contained in the task will be read only.l Code Module: Code modules allow a certain level of programmatic extensibility to tasks created with the formbuilder without having to create agency custom forms. If desired, select an available code module from the CodeModule dropdown.
l Tool Tip: The text entered into the Tool Tip textbox will be shown when the user hovers the mouse over theselected task.
GroupsWhen Groups is selected, the available groupings will be Group Name and [Group] Properties. The admin will alsohave to select a tab and task in the Select grouping.
*Note: Only certain tabs can have their group navigations modified. If the tab's group navigations cannot be modified,the tabs either will not appear in the dropdown of the Select grouping or the Navigation radio button will no longer beaccessible in the Type grouping for the selected tab.
- 104 -
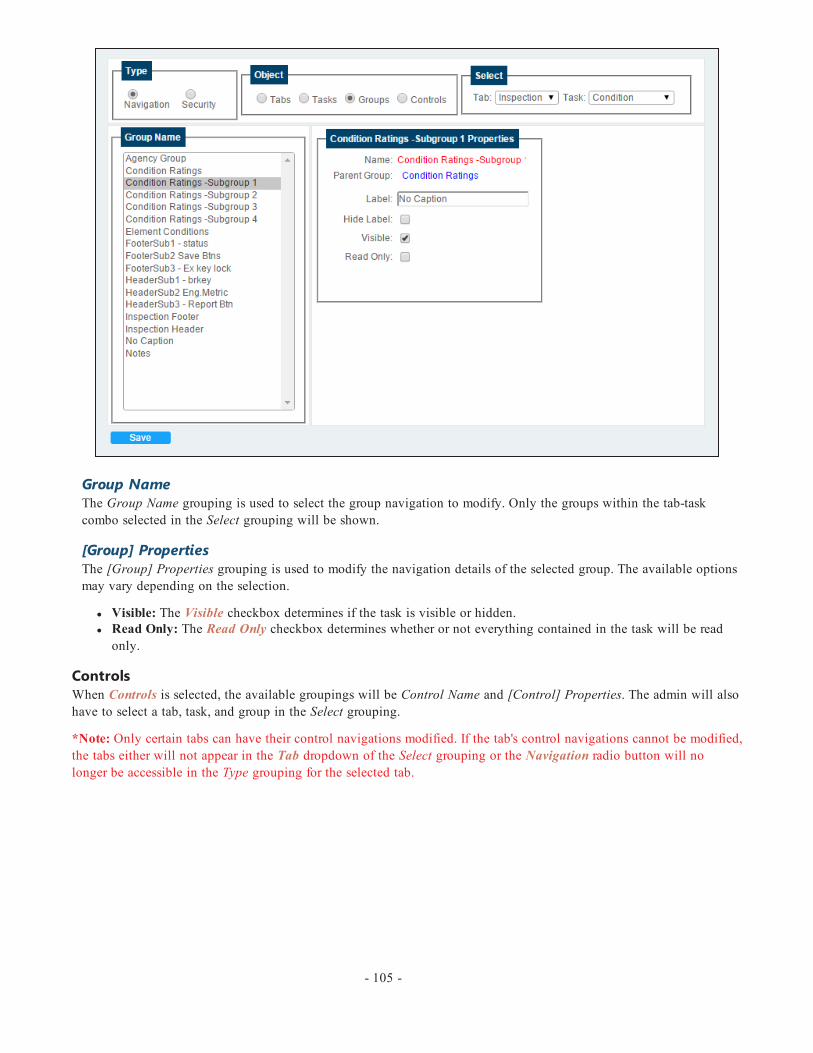
Group NameThe Group Name grouping is used to select the group navigation to modify. Only the groups within the tab-taskcombo selected in the Select grouping will be shown.
[Group] PropertiesThe [Group] Properties grouping is used to modify the navigation details of the selected group. The available optionsmay vary depending on the selection.
l Visible: The Visible checkbox determines if the task is visible or hidden.l Read Only: The Read Only checkbox determines whether or not everything contained in the task will be readonly.
ControlsWhen Controls is selected, the available groupings will be Control Name and [Control] Properties. The admin will alsohave to select a tab, task, and group in the Select grouping.
*Note: Only certain tabs can have their control navigations modified. If the tab's control navigations cannot be modified,the tabs either will not appear in the Tab dropdown of the Select grouping or the Navigation radio button will nolonger be accessible in the Type grouping for the selected tab.
- 105 -

Control NameThe Control Name grouping is used to select the control navigation to modify. Only the controls within the tab/task/-group combo selected in the Select grouping will be shown.
[Control] PropertiesThe [Control] Properties grouping is used to modify the navigation details of the selected control. The availableoptions may vary depending on the selection.
l Label: The name of the task cannot be changed for internal database purposes, but the Label textbox allows theadmin to change the name that the users see.
l Visible: The Visible checkbox determines if the task is visible or hidden.l Read Only: The Read Only checkbox determines whether or not everything contained in the task will be readonly.
l Height in Rows: The value selected in the Height in Rows dropdown determines the size of the control.l Tool Tip: The text entered into the Tool Tip textbox will be shown when the user hovers the mouse over theselected task.
SecurityWhen Security is selected, an object must also be selected. The selection will determine what options will be availableto modify. The selectable objects are: Tabs, Tasks, Groups, and Controls.
Regardless of the object selected, the Roles grouping will always be present. A role must be selected and then that role'ssecurity will be determined for the selected object.
TabsWhen Tabs is selected, role security for tabs can be determined.
- 106 -
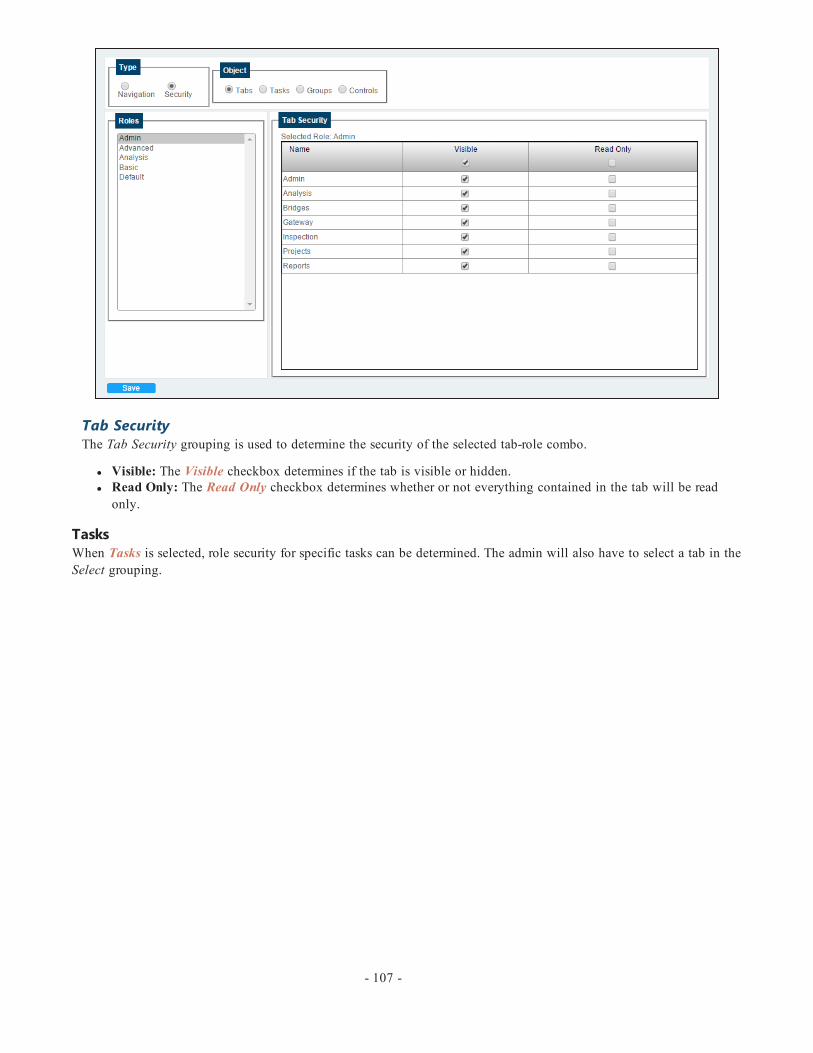
Tab SecurityThe Tab Security grouping is used to determine the security of the selected tab-role combo.
l Visible: The Visible checkbox determines if the tab is visible or hidden.l Read Only: The Read Only checkbox determines whether or not everything contained in the tab will be readonly.
TasksWhen Tasks is selected, role security for specific tasks can be determined. The admin will also have to select a tab in theSelect grouping.
- 107 -
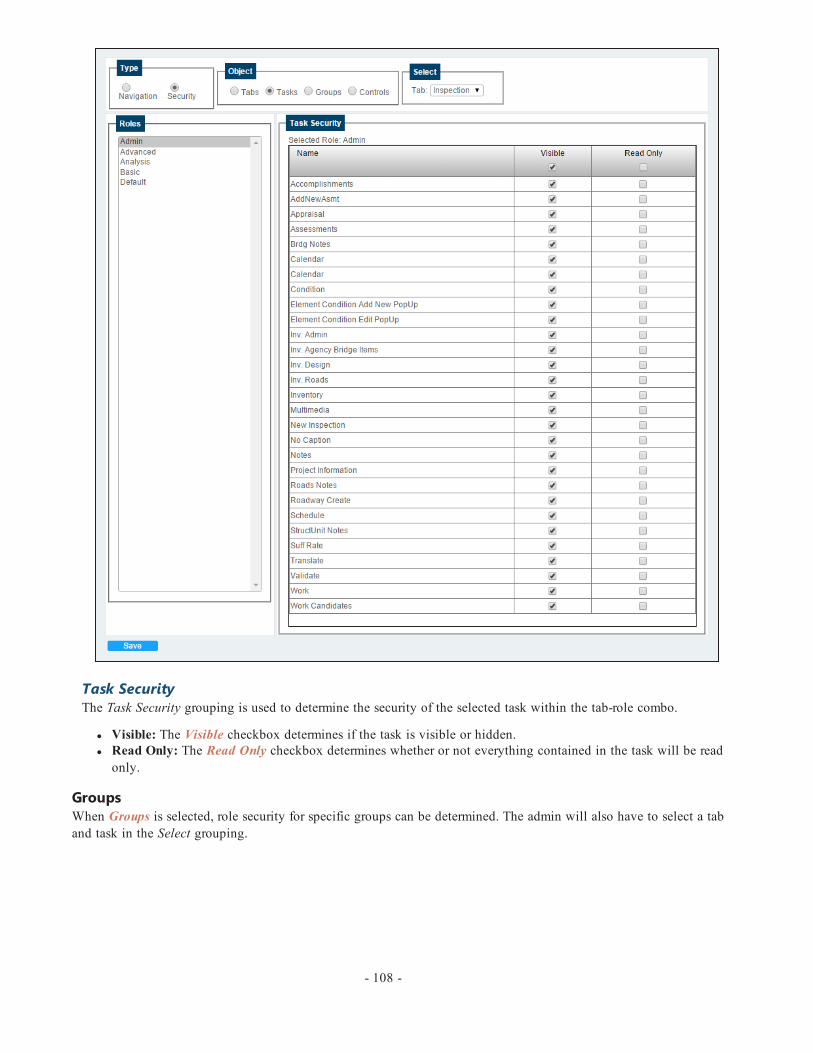
Task SecurityThe Task Security grouping is used to determine the security of the selected task within the tab-role combo.
l Visible: The Visible checkbox determines if the task is visible or hidden.l Read Only: The Read Only checkbox determines whether or not everything contained in the task will be readonly.
GroupsWhen Groups is selected, role security for specific groups can be determined. The admin will also have to select a taband task in the Select grouping.
- 108 -

Group SecurityThe Group Security grouping is used to determine the security of the selected group within the task-tab-role combo.
l Visible: The Visible checkbox determines if the group is visible or hidden.l Read Only: The Read Only checkbox determines whether or not everything contained in the group will be readonly.
ControlsWhen Controls is selected, role security for specific controls can be determined. The admin will also have to select a tab,task, and group in the Select grouping.
- 109 -

Control SecurityThe Control Security grouping is used to determine the security of the selected control within the group-task-tab-rolecombo.
l Visible: The Visible checkbox determines if the control is visible or hidden.l Read Only: The Read Only checkbox determines whether or not the control will be read only.
Standard Page ControlsClick the Save button to save the changes made to the navigation and field security.
- 110 -

AgencyThe Admin > General Config > Agency task allows the admin to create and edit custom agency tabs and tasks. BrM ver-sion 5.2.3 now allows administrators to visually create and edit custom agency tabs and tasks using the Visual FormEditor, but the Agency task can still be used if desired.
Selecting the Navigation radio button from the Type grouping allows the admin to make changes to the way the soft-ware looks and operates.
Selecting the Security radio button from the Type grouping allows the admin to make changes to the visibility andaccess that each role has to the objects.
NavigationWhen Navigation is selected, an object must also be selected. The selection will determine what options will be avail-able to modify. The selectable objects are: Tabs, Tasks, Groups, and Controls.
TabsWhen Tabs is selected, the available groupings will be Add New Tab, Tab Name, and [Tab] Properties.
- 111 -

Add New TabIf no custom agency tabs exist or to create an additional custom agency tab, type the name of the new tab into the TabName textbox and click the Add New & Save button.
Tab NameThe Tab Name grouping is used to select the tab navigation to modify.
[Tab] PropertiesThe [Tab] Properties grouping is used to modify the navigation details of the selected tab.
l Label: The name of the tab cannot be changed for internal database purposes, but the Label textbox allows theadmin to change the name that the users see.
l Order: Determines what order the tab will appear in on the tab bar, with the top-most tab being "1."l Visible: Determines if the tab is visible or hidden.l Read Only: Determines whether or not everything contained in the tab will be read only.l Tool Tip: The text entered into the Tool Tip textbox will be shown when the user hovers the mouse over theselected tab.
Click the Save button to save the changes made to the tab properties.
TasksWhen Tasks is selected, the available groupings will be Add New Task, Task Name and [Task] Properties. The adminwill also have to select a tab in the Select grouping.
- 112 -
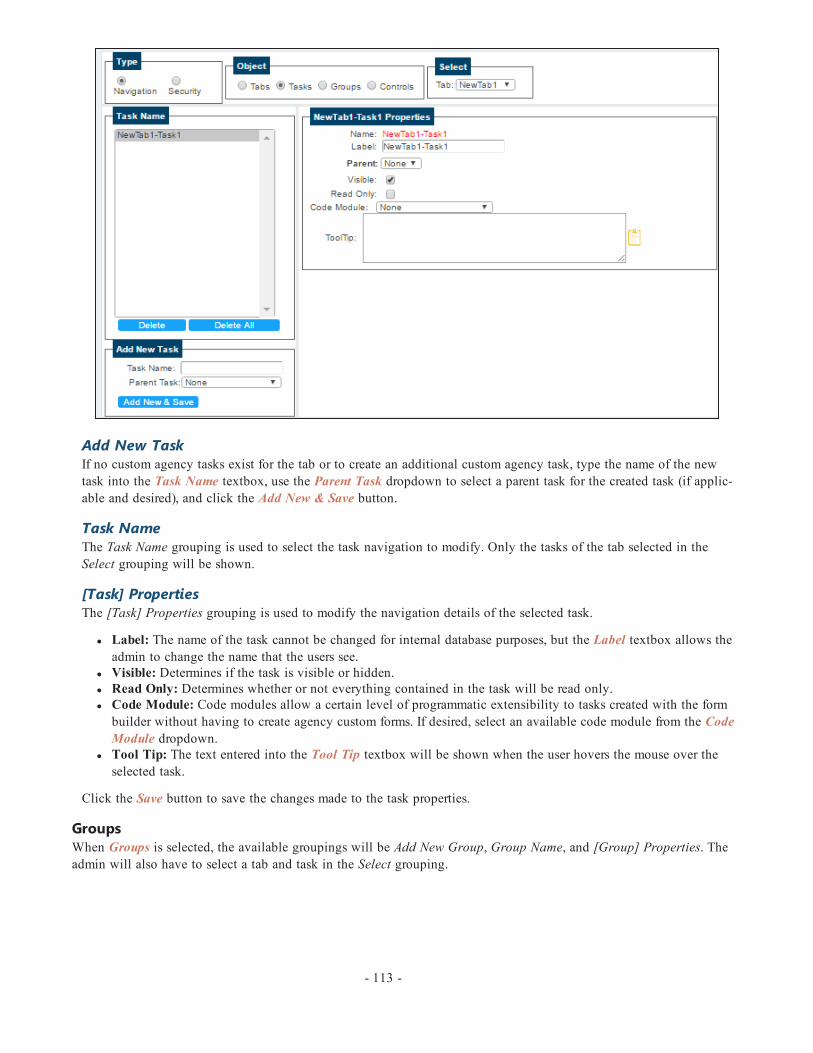
Add New TaskIf no custom agency tasks exist for the tab or to create an additional custom agency task, type the name of the newtask into the Task Name textbox, use the Parent Task dropdown to select a parent task for the created task (if applic-able and desired), and click the Add New & Save button.
Task NameThe Task Name grouping is used to select the task navigation to modify. Only the tasks of the tab selected in theSelect grouping will be shown.
[Task] PropertiesThe [Task] Properties grouping is used to modify the navigation details of the selected task.
l Label: The name of the task cannot be changed for internal database purposes, but the Label textbox allows theadmin to change the name that the users see.
l Visible: Determines if the task is visible or hidden.l Read Only: Determines whether or not everything contained in the task will be read only.l Code Module: Code modules allow a certain level of programmatic extensibility to tasks created with the formbuilder without having to create agency custom forms. If desired, select an available code module from the CodeModule dropdown.
l Tool Tip: The text entered into the Tool Tip textbox will be shown when the user hovers the mouse over theselected task.
Click the Save button to save the changes made to the task properties.
GroupsWhen Groups is selected, the available groupings will be Add New Group, Group Name, and [Group] Properties. Theadmin will also have to select a tab and task in the Select grouping.
- 113 -

Add New GroupIf no custom agency groupings exist for the tab and task combo or to create an additional custom agency grouping, theAdd New Group grouping can be used.
Use the Group Name textbox to enter the name of the grouping.
The Parent Group dropdown is used to nest the created grouping inside an existing grouping within the task.
The Group Type dropdown determines what type of grouping is being created. In most cases, newly created groupingswill use the "Content Group" group type.
The Desktop URL dropdown is used to select a custom control to be included in the grouping.
Click the Add New & Save button once the desired selections have been made.
Group NameThe Group Name grouping is used to select the group navigation to modify. Only the groups within the tab-taskcombo selected in the Select grouping will be shown.
[Group] PropertiesThe [Group] Properties grouping is used to modify the navigation details of the selected group. The available optionsmay very depending on the selection.
[Group] Properties
Control Description
Label The text that appears within the grouping label on the form.
Hide Label If checked, all of the controls within the grouping remain contained but are no longersurrounded by an outline with a label.
- 114 -

[Group] Properties
Control Description
Visible Determines if the grouping is visible or hidden.
Read Only Determines whether or not everything contained in the grouping will be read only.
Span Across If checked, the grouping will span across the entire page. If unchecked, the groupingwill only span as far as the controls inside require.
Collapsible If checked, the grouping's label changes and adds a minimize symbol so that it can becollapsed.
Horizontal Alignment Determines how the grouping will be horizontally aligned.
Vertical Alignment Determines how the grouping will be vertically aligned.
Repeat Direction Indicates whether the items in the grouping will repeat horizontally or vertically.
Repeat Count Used to repeat the items in the grouping the entered number of times in the selecteddirection. This is a method used to help organize the grouping a specific way.
SkinID A pre-defined style applied to the grouping.
HeightDetermines the height of the grouping. If not set, the grouping will conform to theoverall height of its inner controls. The dropdown is used to select the units for theheight.
WidthDetermines the width of the grouping. If not set, the grouping will conform to theoverall width of its inner controls (except for the main grouping, which spans thewidth of the page). The dropdown is used to select the units for the width.
Cell Spacing Determines the space between the groupings on the form.
Cell Padding Determines the space between the controls in the grouping.
Click the Save button to save the changes made to the group properties.
ControlsWhen Controls is selected, the available groupings will be Add New Control, Control Name, and [Control] Properties.The admin will also have to select a tab, task, and group in the Select grouping.
- 115 -
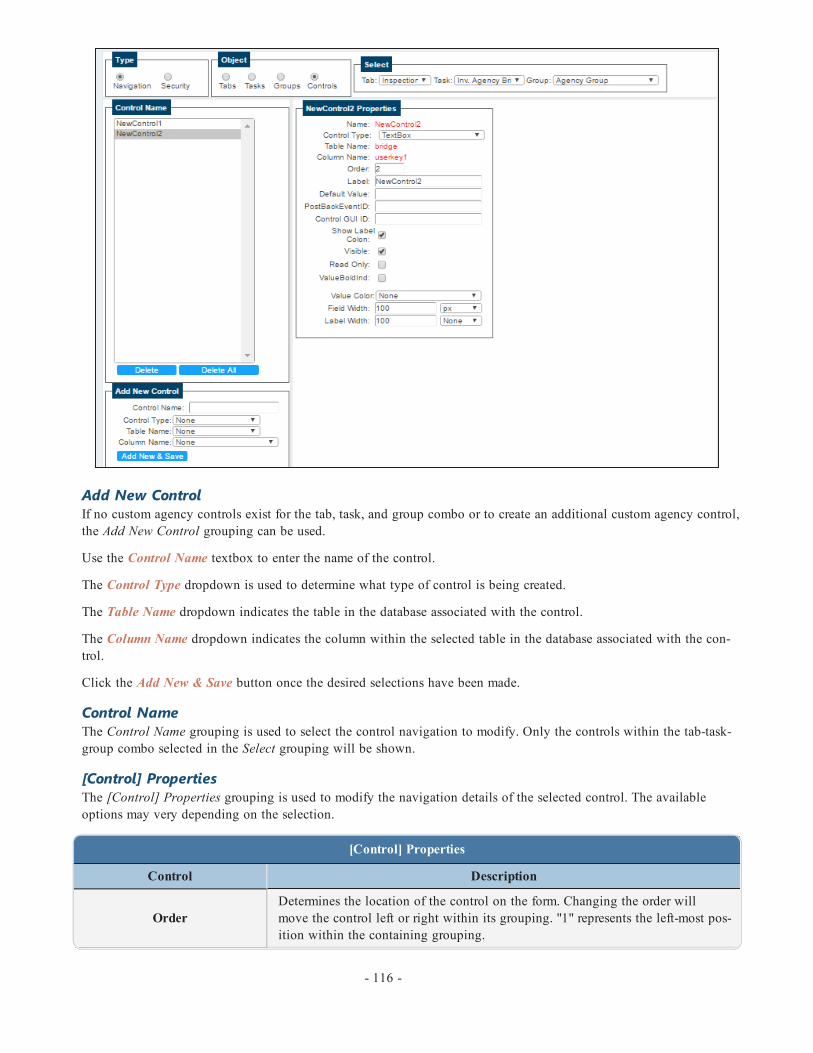
Add New ControlIf no custom agency controls exist for the tab, task, and group combo or to create an additional custom agency control,the Add New Control grouping can be used.
Use the Control Name textbox to enter the name of the control.
The Control Type dropdown is used to determine what type of control is being created.
The Table Name dropdown indicates the table in the database associated with the control.
The Column Name dropdown indicates the column within the selected table in the database associated with the con-trol.
Click the Add New & Save button once the desired selections have been made.
Control NameThe Control Name grouping is used to select the control navigation to modify. Only the controls within the tab-task-group combo selected in the Select grouping will be shown.
[Control] PropertiesThe [Control] Properties grouping is used to modify the navigation details of the selected control. The availableoptions may very depending on the selection.
[Control] Properties
Control Description
OrderDetermines the location of the control on the form. Changing the order willmove the control left or right within its grouping. "1" represents the left-most pos-ition within the containing grouping.
- 116 -

[Control] Properties
Control Description
Label The label that sits to the left of the control and indicates its purpose.
Postback Event ID Used in custom code modules. Identifies the control when a postback event isoccurring.
Control GUI ID Used in custom code modules. The name used to search for the control in a cus-tom code module.
Show Label Colon Determines whether or not to include the colon ":" between the label and the con-trol.
Visible Determines if the control is visible or hidden.
Read Only Determines whether or not the control will be read only.
ValueBoldInd If checked, the value within the control will be bold.
Text Alignment Determines how the text of the control is aligned.
Value Color Determines the color of the control's value.
Field Width Determines the width of the field. The dropdown is used to select the units forthe field width.
Label Width Determines the width of the label. The dropdown is used to select the units forthe label width.
Click the Save button to save the changes made to the control properties.
SecurityWhen Security is selected, an object must also be selected. The selection will determine what options will be availableto modify. The selectable objects are: Tabs, Tasks, Groups, and Controls.
Regardless of the object selected, the Roles grouping will always be present. A role must be selected and then that role'ssecurity will be determined for the selected object.
TabsWhen Tabs is selected, role security for tabs can be determined.
- 117 -

Tab SecurityThe Tab Security grouping is used to determine the security of the selected tab-role combo.
l Visible: The Visible checkbox determines if the tab is visible or hidden.l Read Only: The Read Only checkbox determines whether or not everything contained in the tab will be readonly.
TasksWhen Tasks is selected, role security for specific tasks can be determined. The admin will also have to select a tab in theSelect grouping.
Task SecurityThe Task Security grouping is used to determine the security of the selected task within the tab-role combo.
- 118 -
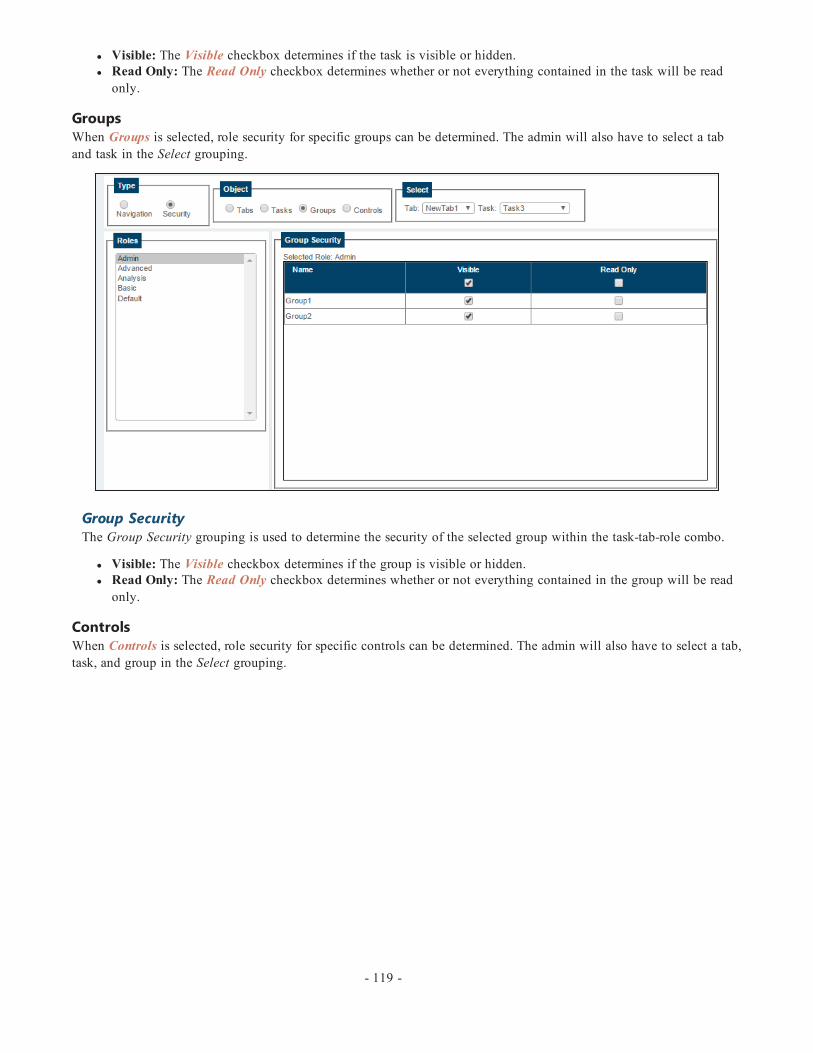
l Visible: The Visible checkbox determines if the task is visible or hidden.l Read Only: The Read Only checkbox determines whether or not everything contained in the task will be readonly.
GroupsWhen Groups is selected, role security for specific groups can be determined. The admin will also have to select a taband task in the Select grouping.
Group SecurityThe Group Security grouping is used to determine the security of the selected group within the task-tab-role combo.
l Visible: The Visible checkbox determines if the group is visible or hidden.l Read Only: The Read Only checkbox determines whether or not everything contained in the group will be readonly.
ControlsWhen Controls is selected, role security for specific controls can be determined. The admin will also have to select a tab,task, and group in the Select grouping.
- 119 -
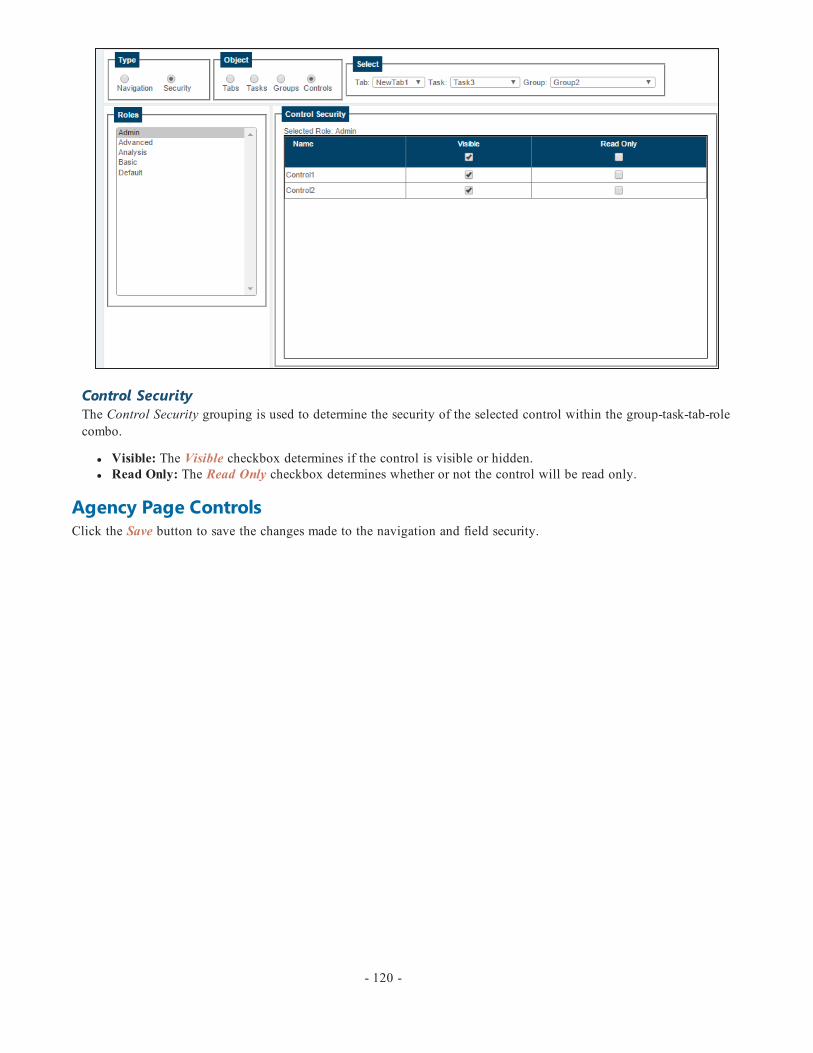
Control SecurityThe Control Security grouping is used to determine the security of the selected control within the group-task-tab-rolecombo.
l Visible: The Visible checkbox determines if the control is visible or hidden.l Read Only: The Read Only checkbox determines whether or not the control will be read only.
Agency Page ControlsClick the Save button to save the changes made to the navigation and field security.
- 120 -
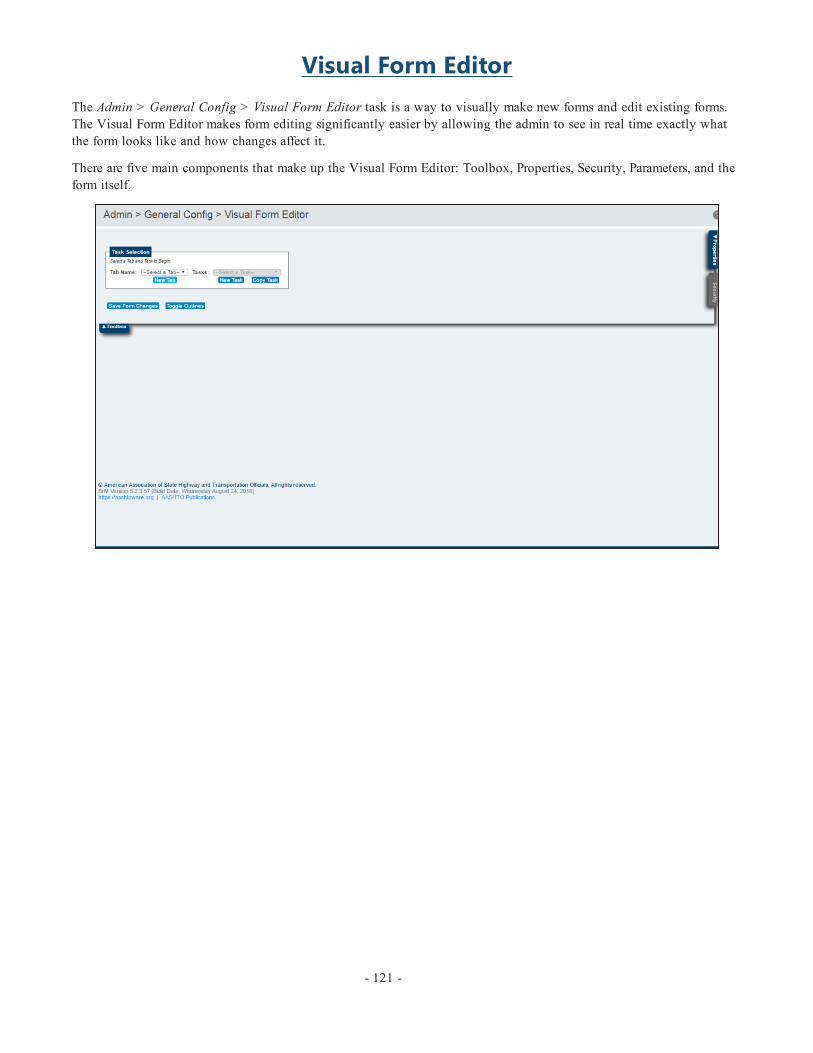
Visual Form EditorThe Admin > General Config > Visual Form Editor task is a way to visually make new forms and edit existing forms.The Visual Form Editor makes form editing significantly easier by allowing the admin to see in real time exactly whatthe form looks like and how changes affect it.
There are five main components that make up the Visual Form Editor: Toolbox, Properties, Security, Parameters, and theform itself.
- 121 -

ToolboxThe Toolbox tab is used to determine which form to edit and contains all of the available controls for the form.
*Note: BrM version 5.2.3 only allows existing tasks within the Inspection, Projects, and Programs modules to be edited.In addition, the standard forms for those modules cannot currently be edited. For instance, to make a change to theInspection > Condition task, the task must be copied and then changes can be made to the copied version of the form.
Task SelectionThe Task Selection grouping allows the admin to select which form to edit within the software using the Tab Name andTasks dropdowns.
New TabTo create an entirely new tab, click the New Tab button:
The Name textbox is the label used to display the new tab in the tab/task menu panel on the left side of the software
*Note: The Label textbox is not currently utilized in BrM version 5.2.3.
Use the Visible checkbox to determine whether the new tab will be visible.
- 122 -
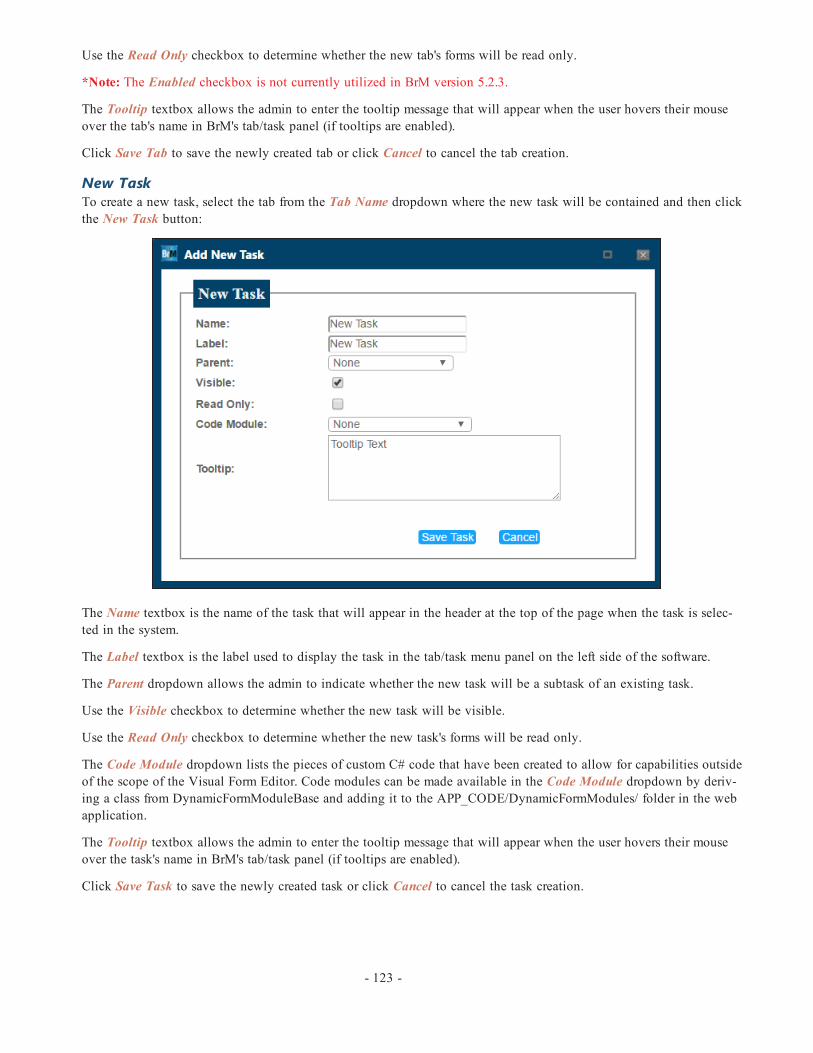
Use the Read Only checkbox to determine whether the new tab's forms will be read only.
*Note: The Enabled checkbox is not currently utilized in BrM version 5.2.3.
The Tooltip textbox allows the admin to enter the tooltip message that will appear when the user hovers their mouseover the tab's name in BrM's tab/task panel (if tooltips are enabled).
Click Save Tab to save the newly created tab or click Cancel to cancel the tab creation.
New TaskTo create a new task, select the tab from the Tab Name dropdown where the new task will be contained and then clickthe New Task button:
The Name textbox is the name of the task that will appear in the header at the top of the page when the task is selec-ted in the system.
The Label textbox is the label used to display the task in the tab/task menu panel on the left side of the software.
The Parent dropdown allows the admin to indicate whether the new task will be a subtask of an existing task.
Use the Visible checkbox to determine whether the new task will be visible.
Use the Read Only checkbox to determine whether the new task's forms will be read only.
The Code Module dropdown lists the pieces of custom C# code that have been created to allow for capabilities outsideof the scope of the Visual Form Editor. Code modules can be made available in the Code Module dropdown by deriv-ing a class from DynamicFormModuleBase and adding it to the APP_CODE/DynamicFormModules/ folder in the webapplication.
The Tooltip textbox allows the admin to enter the tooltip message that will appear when the user hovers their mouseover the task's name in BrM's tab/task panel (if tooltips are enabled).
Click Save Task to save the newly created task or click Cancel to cancel the task creation.
- 123 -

Copy TaskAnother way of creating a new task is to copy an existing task. To copy a task, select the desired tab and task from theTab Name and Tasks dropdowns. The task that is selected will be copied when the Copy Task button is clicked:
The Tab dropdown indicates in which tab the newly copied task will exist. The copied task does not have to have thesame tab as the original task.
The Name textbox is the name of the task that will appear in the header at the top of the page when the task is selec-ted in the system.
The Label textbox is the label used to display the task in the tab/task menu panel on the left side of the software.
The Parent dropdown allows the admin to indicate whether the copied task will be a subtask of an existing task.
Use the Visible checkbox to determine whether the new task will be visible.
Use the Read Only checkbox to determine whether the new task's forms will be read only.
The Code Module dropdown lists the pieces of custom C# code that have been created to allow for capabilities outsideof the scope of the Visual Form Editor. Code modules can be made available in the Code Module dropdown by deriv-ing a class from DynamicFormModuleBase and adding it to the APP_CODE/DynamicFormModules/ folder in the webapplication.
The Tooltip textbox allows the admin to enter the tooltip message that will appear when the user hovers their mouseover the task's name in BrM's tab/task panel (if tooltips are enabled).
Click Save Task to save the newly created task or click Cancel to cancel the task creation.
Form ElementsThe Form Elements grouping contains all of the controls and elements that the admin can add to a form.
- 124 -

To add an element, first select the location on the form where the element will be placed. To do so, click the Toggle Out-lines button within the Toolbox component. This will display blue outlines around each of the available areas in theform:
A new, empty form will look like the above screenshot with a header box, body box, and footer box. Copies of existingtasks will have much more complex outlines with boxes nested within other boxes:
- 125 -

Using the blue outlines, click within the area that the control will be placed. This will highlight that area blue. Then,select the desired control from the Form Elements grouping and click the Add Element button to add the element to theselected location on the form.
- 126 -

PropertiesEvery item on the form, be it a single control or an entire grouping, has properties that can be edited in the Propertiestab. The Properties tab can also edit the properties of the overall tab and task/subtask selected.
Tab and Task PropertiesBefore an individual item is selected from the form, the Properties tab will populate with the properties for the selectedtab and task/subtask:
Selected Tab Properties
The Name textbox is the label used to display the tab in the tab/task menu panel on the left side of the software
*Note: The Label textbox is not currently utilized in BrM version 5.2.3.
Use the Visible checkbox to determine whether the tab will be visible.
Use the Read Only checkbox to determine whether the tab's forms will be read only.
*Note: The Enabled checkbox is not currently utilized in BrM version 5.2.3.
The Tooltip textbox allows the admin to enter the tooltip message that will appear when the user hovers their mouseover the tab's name in BrM's tab/task panel (if tooltips are enabled).
Click Save Tab to save the changes to the tab's properties.
Click Delete Tab to delete the tab.
*Note: The Delete Tab button will not be functional for standard tabs. Only custom tabs can be deleted.
- 127 -

Selected Task Properties
The Name textbox is the name of the task that will appear in the header at the top of the page when the task is selec-ted in the system.
The Label textbox is the label used to display the task in the tab/task menu panel on the left side of the software.
The Parent dropdown allows the admin to indicate whether the task is a subtask of another existing task within thetab.
Use the Visible checkbox to determine whether the task will be visible.
Use the Read Only checkbox to determine whether the task's forms will be read only.
The Code Module dropdown lists the pieces of custom C# code that have been created to allow for capabilities outsideof the scope of the Visual Form Editor. Code modules can be made available in the Code Module dropdown by deriv-ing a class from DynamicFormModuleBase and adding it to the APP_CODE/DynamicFormModules/ folder in the webapplication.
The Tooltip textbox allows the admin to enter the tooltip message that will appear when the user hovers their mouseover the task's name in BrM's tab/task panel (if tooltips are enabled).
Click Save Task to save the changes to the task's properties.
Click Copy Task to make a copy of the currently selected task.
Click Delete Task to delete the task.
*Note: The Delete Task button will not be functional for standard tasks. Only custom tasks can be deleted.
Group PropertiesWhen a grouping within the form is selected, the grouping's properties can be edited:
- 128 -

Controls for Selected Group Properties
Control Description
Name The name of the grouping. This is not the grouping's label.
Group Type Determines what type of grouping is being created. In most cases, newly createdgroupings will use the "Content Group" group type.
Desktop URL Used to select a custom control to be included in the grouping.
Label The text that appears within the grouping label on the form.
Hide Label If checked, all of the controls within the grouping remain contained but are no longersurrounded by an outline with a label.
Visible
If unchecked, the entire grouping will not be visible on the form. Invisible items onthe form have the following appearance in the Visual Form Editor:
Read Only If checked, the entire grouping will be read only on the form. Read-only items on theform have the following appearance in the Visual Form Editor:
- 129 -

Controls for Selected Group Properties
Control Description
Span Across If checked, the grouping will span across the entire page. If unchecked, the groupingwill only span as far as the controls inside require.
Collapsible
If checked, the grouping's label changes and adds a minimize symbol so that it can becollapsed:
Order
Determines the location of the grouping on the form. If it is the main grouping (thebody of the form), changing the order will not change the location. However, if it is agrouping within a grouping, changing the order will move it up or down within themain grouping. "1" represents the top of the main grouping.
Horizontal Alignment Determines how the grouping will be horizontally aligned.
Vertical Alignment Determines how the grouping will be vertically aligned.
Repeat Direction Indicates whether the items in the grouping will repeat horizontally or vertically.
Repeat Count Used to repeat the items in the grouping the entered number of times in the selecteddirection. This is a method used to help organize the grouping a specific way.
HeightDetermines the height of the grouping. If not set, the grouping will conform to theoverall height of its inner controls. The dropdown is used to select the units for theheight.
WidthDetermines the width of the grouping. If not set, the grouping will conform to theoverall width of its inner controls (except for the main grouping, which spans thewidth of the page). The dropdown is used to select the units for the width.
Cell Spacing Determines the space between the groupings on the form.
Cell Padding Determines the space between the controls in the grouping.
Skin A pre-defined style applied to the grouping.
Delete Group Deletes the selected group from the form.
Control PropertiesWhen a control within the form is selected, the control's properties can be edited:
- 130 -
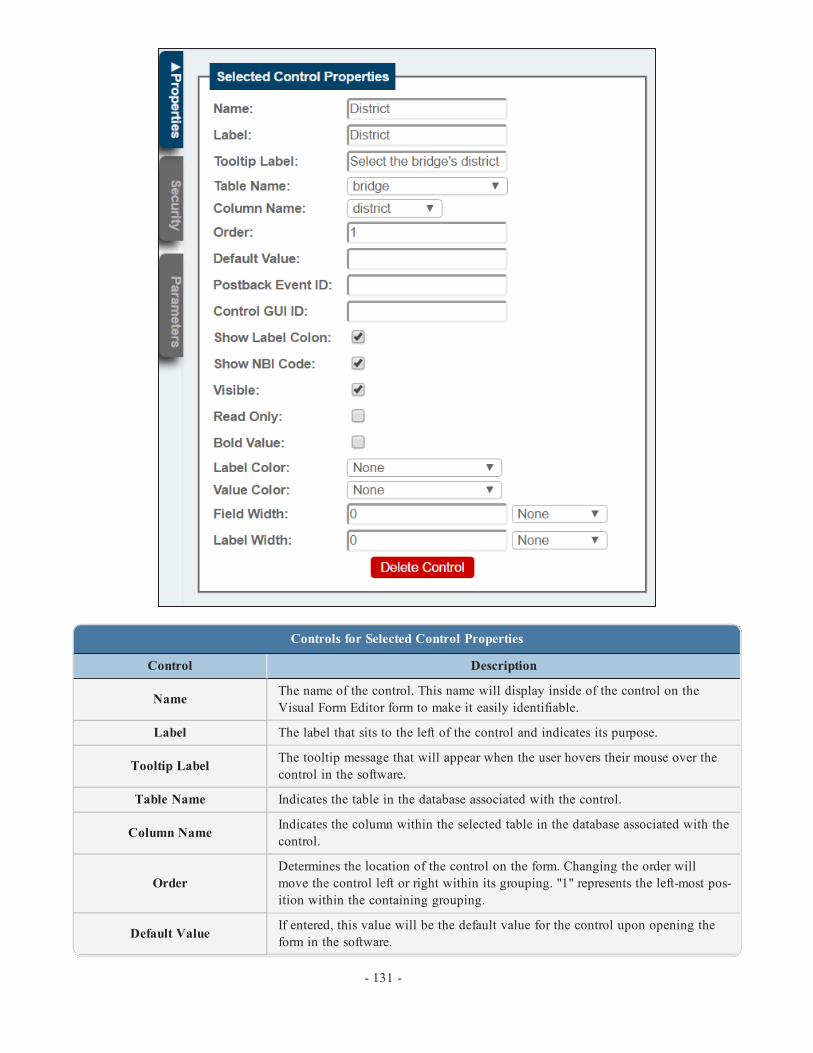
Controls for Selected Control Properties
Control Description
Name The name of the control. This name will display inside of the control on theVisual Form Editor form to make it easily identifiable.
Label The label that sits to the left of the control and indicates its purpose.
Tooltip Label The tooltip message that will appear when the user hovers their mouse over thecontrol in the software.
Table Name Indicates the table in the database associated with the control.
Column Name Indicates the column within the selected table in the database associated with thecontrol.
OrderDetermines the location of the control on the form. Changing the order willmove the control left or right within its grouping. "1" represents the left-most pos-ition within the containing grouping.
Default Value If entered, this value will be the default value for the control upon opening theform in the software.
- 131 -

Controls for Selected Control Properties
Control Description
Postback Event ID Used in custom code modules. Identifies the control when a postback event isoccurring.
Control GUI ID Used in custom code modules. The name used to search for the control in a cus-tom code module.
Show Label Colon Determines whether or not to include the colon ":" between the label and the con-trol.
Show NBI Code
Determines whether or not to show the NBI code (in red parenthesis) next to thecontrol's label.
*Note: If the control is not an NBI field, this checkbox has no function and noNBI code will be displayed regardless of whether the checkbox is checked.
Visible
If unchecked, the entire grouping will not be visible on the form. Invisible itemson the form have the following appearance in the Visual Form Editor:
Read-Only
If checked, the entire grouping will be read only on the form. Read-only items onthe form have the following appearance in the Visual Form Editor:
Bold Value If checked, the value within the control will be bold.
Label Color Determines the color of the control's label.
Value Color Determines the color of the control's value.
Field Width Determines the width of the field. The dropdown is used to select the units forthe field width.
Label Width Determines the width of the label. The dropdown is used to select the units forthe label width.
Delete Control Deletes the selected control from the form.
- 132 -

SecurityThe Security tab allows the admin to specify the role-based security for the tab, task, grouping, or control. Each role inthe system (including non-default roles) can have its security set for each item.
Tab and Task SecurityThe tab and task security is available when first selecting a form in the Visual Form Editor or when no specific item isselected on the form. If an item is selected on the form, such as a dropdown control, simply clicking on that item willunselect it and allow the tab and task security to be edited.
If the Visible checkbox is unchecked for a role, users of that role will not be able to see the tab and/or task.
If the Read Only checkbox is checked for a role, users of that role will not be able to make changes to any of the inform-ation in the tab or task.
Group SecurityWhen a grouping is selected on the form, the grouping's security can be edited in the Security tab.
- 133 -

If the Visible checkbox is unchecked for a role, users of that role will not be able to see the grouping or anything withinit when accessing the form.
If the Read Only checkbox is checked for a role, users of that role will not be able to make changes to any of the inform-ation in the grouping.
Control SecurityWhen a control is selected on the form, the control's security can be edited in the Security tab.
If the Visible checkbox is unchecked for a role, users of that role will not be able to see the control when accessing theform.
If the Read Only checkbox is checked for a role, users of that role will not be able to make changes to the control.
- 134 -
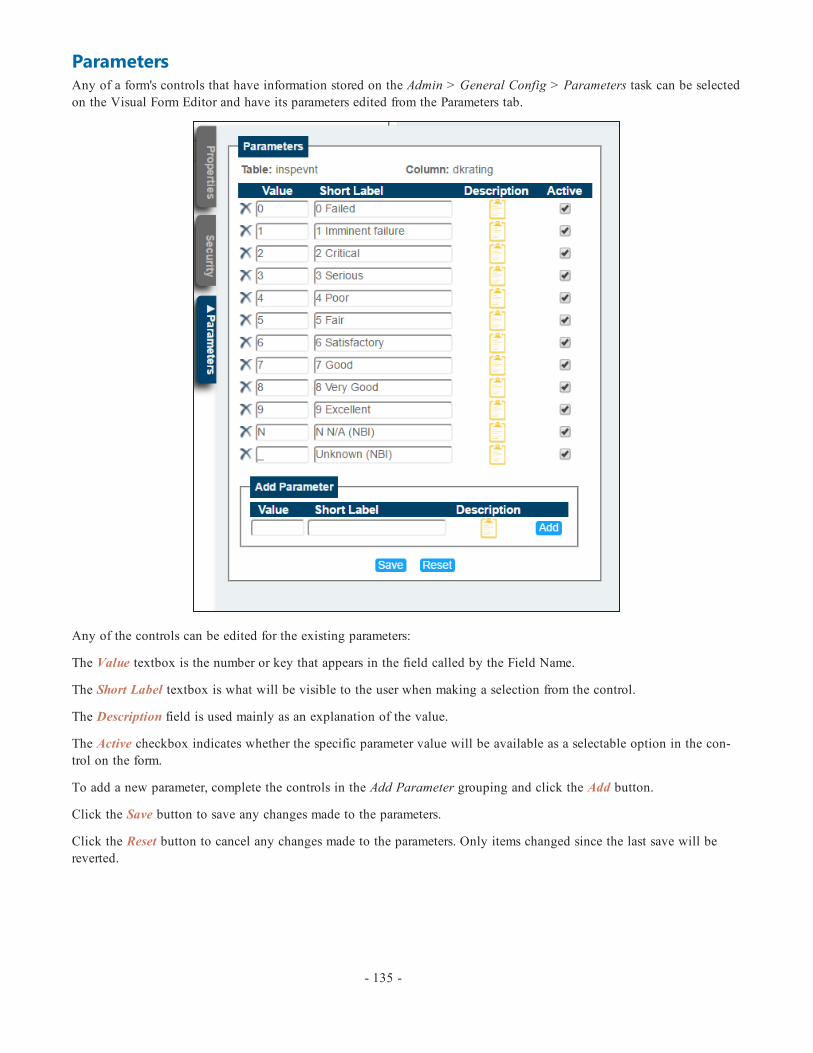
ParametersAny of a form's controls that have information stored on the Admin > General Config > Parameters task can be selectedon the Visual Form Editor and have its parameters edited from the Parameters tab.
Any of the controls can be edited for the existing parameters:
The Value textbox is the number or key that appears in the field called by the Field Name.
The Short Label textbox is what will be visible to the user when making a selection from the control.
The Description field is used mainly as an explanation of the value.
The Active checkbox indicates whether the specific parameter value will be available as a selectable option in the con-trol on the form.
To add a new parameter, complete the controls in the Add Parameter grouping and click the Add button.
Click the Save button to save any changes made to the parameters.
Click the Reset button to cancel any changes made to the parameters. Only items changed since the last save will bereverted.
- 135 -

Page ExportThe Admin > General Config > Page Export task is used to import/export certain components of the BrM software. Thisallows agencies to share items they've created amongst each other, including custom filters, layouts, and forms.
The available components come from the following database tables:
l Filters: Pon_Filtersl Layouts: Pon_Layoutsl Forms: Various Pon_Nav tables
Import Component PackageTo import a component package, click the Select button in the Import grouping to locate the .JSON file within the com-puter's files. Once the file is located, click the Import File button in the footer to import the selected file. Once imported,the new components should be present in their various locations in the software.
Export Component PackageTo export a component package, use the Context dropdown in the Export grouping to switch between "Filters," "Lay-outs," and "Navigation." All custom filters, layouts, and forms will appear in the list to be selected.
- 136 -

Check the boxes of all of the desired components to include, then click the Export Selected button. This will create a.JSON file that can then be shared with other agencies.
- 137 -
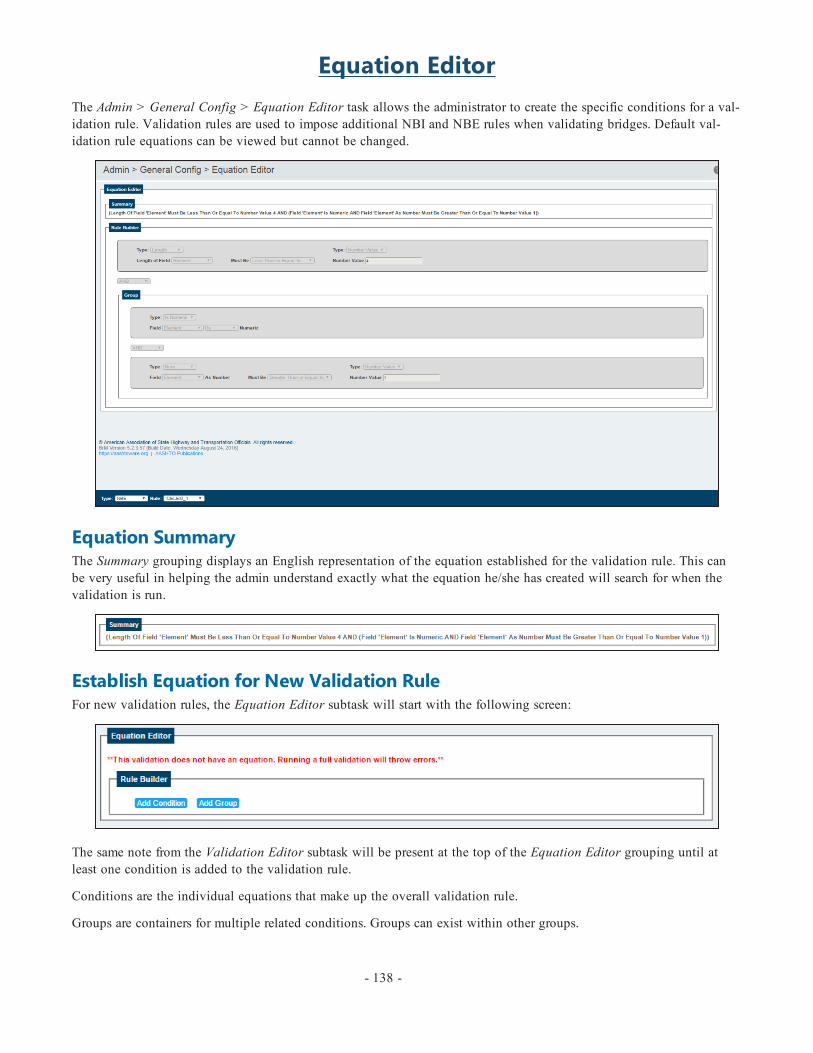
Equation EditorThe Admin > General Config > Equation Editor task allows the administrator to create the specific conditions for a val-idation rule. Validation rules are used to impose additional NBI and NBE rules when validating bridges. Default val-idation rule equations can be viewed but cannot be changed.
Equation SummaryThe Summary grouping displays an English representation of the equation established for the validation rule. This canbe very useful in helping the admin understand exactly what the equation he/she has created will search for when thevalidation is run.
Establish Equation for New Validation RuleFor new validation rules, the Equation Editor subtask will start with the following screen:
The same note from the Validation Editor subtask will be present at the top of the Equation Editor grouping until atleast one condition is added to the validation rule.
Conditions are the individual equations that make up the overall validation rule.
Groups are containers for multiple related conditions. Groups can exist within other groups.
- 138 -

Click the Add Condition button to begin creating the validation rule's equation. Click the Add Group button if morethan one condition will be grouped together. The following screenshot displays a lone condition and conditions withina group.
Use the Type dropdown to establish the type of equation:
Type Description
Is Null Equations indicating whether or not the condition has a value.
Is Numeric Equations indicating whether or not the condition is a numerical value.
In Set Equations indicating whether or not the condition's value exists within theboundaries of a specific set. The set is established on the Set Editor subtask.
Num Equations indicating specific rules for numerical values, including greaterthan, less than, equal to, etc.
Length Equations comparing the length (in characters) of two fields.
Min Equations comparing the minimum value between two fields with anotherfield.
The available controls will be dependent on the selection made from the Type dropdown. The following screenshotsindicate the possibilities:
- 139 -

*Note: Fields that have been established as numeric only will not appear in the Field dropdown. Users cannot enter any-thing other than a numerical value in those fields, therefore no numerical validation check is needed on those fields.
When multiple conditions are added to the equation, whether inside a group or not, the equation conditions operateunder an "And/Or" system. This means that equation conditions can work in tandem with each other or as alternatives toeach other, but it cannot be a mixture. Once a selection is made from the And/Or dropdown, all other conditions addedwill operate under the same selection. The only exception is that individual groups of conditions can have a differentselection than the overall equation. The following screenshots display the possibilities:
- 140 -
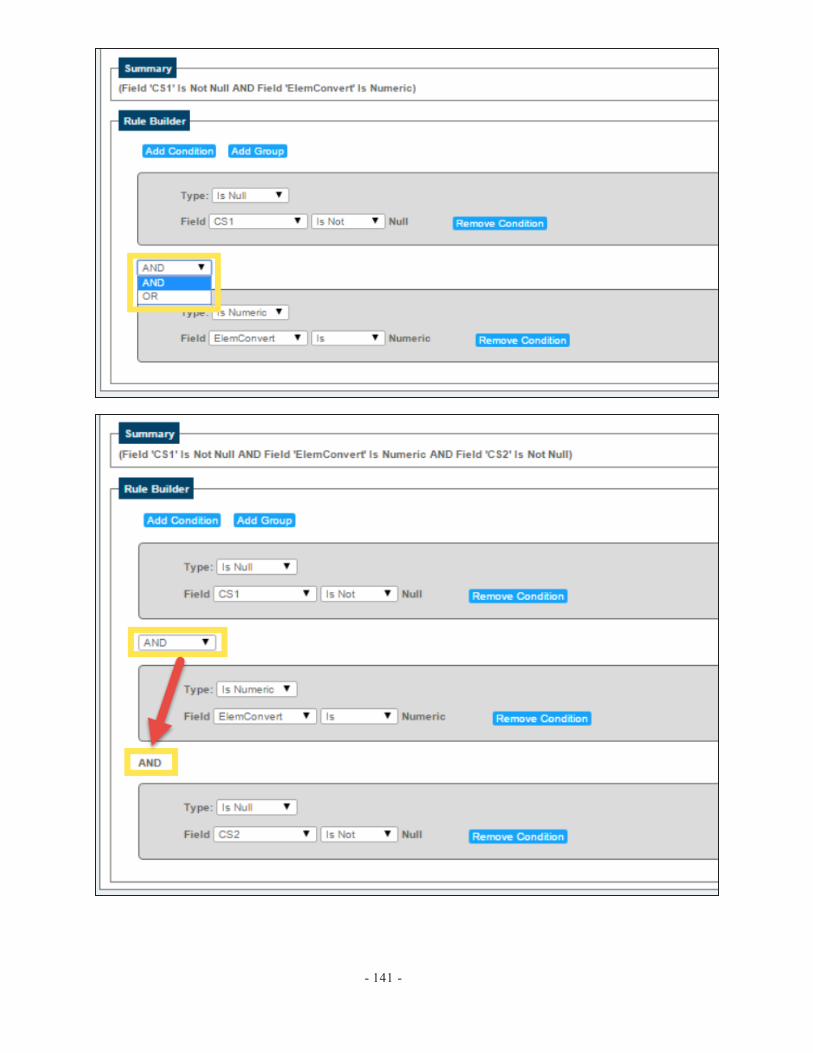
- 141 -
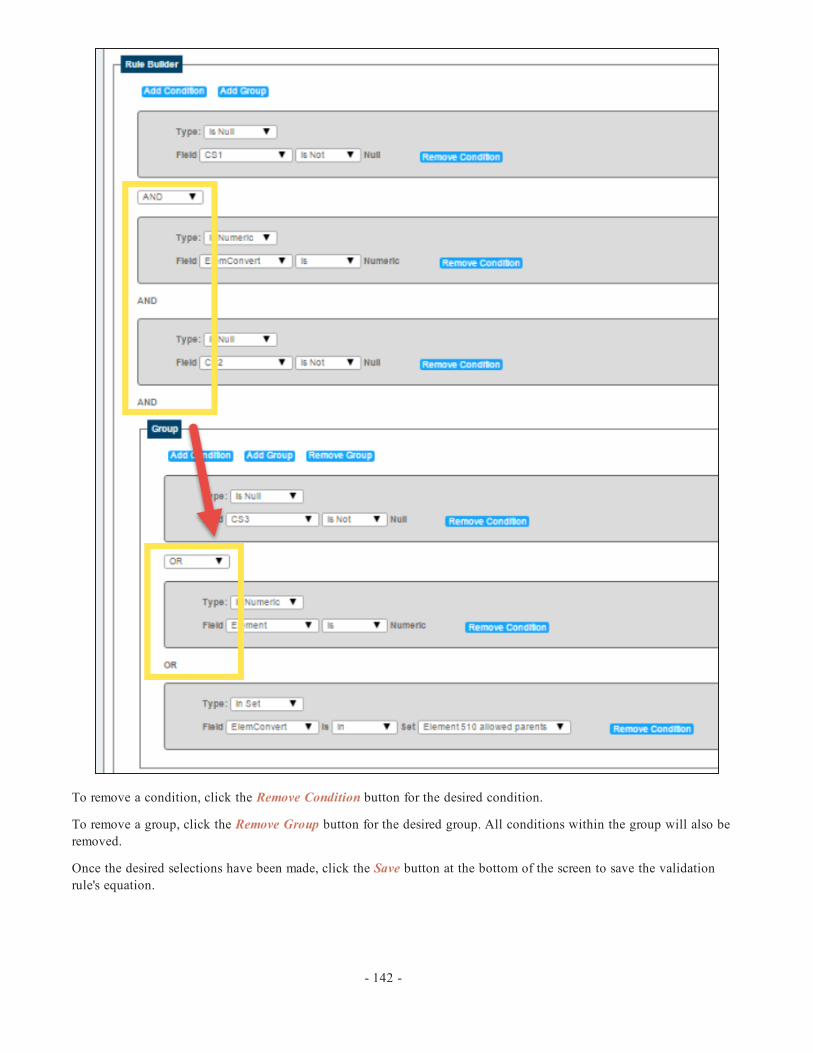
To remove a condition, click the Remove Condition button for the desired condition.
To remove a group, click the Remove Group button for the desired group. All conditions within the group will also beremoved.
Once the desired selections have been made, click the Save button at the bottom of the screen to save the validationrule's equation.
- 142 -

Set EditorThe Admin > General Config > Set Editor task allows the admin to create sets of values to be used in the validationequations on the Equation Editor task. When the "In Set" type is selected for a condition on the Equation Editor task,the admin can then establish a validation that checks whether or not a value matches one of the values included in theset.
Create a New SetTo create a new set, select "NBI" or "NBE" from the Type dropdown and then click the Add Set button.
- 143 -

To create a new set based on a copy of an existing set, click the icon for the desired set and then click the Copy but-ton.
Use the Set Name textbox to provide a name for the set. This is the name that will be displayed when selecting a set onthe Equation Editor subtask.
Click the Add Set Value button as many times as desired to generate new entries for the set:
Enter the desired values into the new textboxes, or click the icon next to an entry to delete it.
To remove all of the entries from the set, click the Clear button.
When the desired entries have been added to the set, click the Save button at the bottom of the page to save the set.
- 144 -

Validation EditorThe Admin > General Config > Validation Editor task is used to create and/or modify the basic information for a val-idation rule as well as determine its dependency rules. Validation rules are used to impose additional NBI and NBE ruleswhen validating bridges. The default rules cannot be changed, deleted, or disabled.
If an existing validation rule is selected, the Summary grouping will be visible. The Summary grouping displays an Eng-lish representation of the equation established for the validation rule.
Create New Validation RuleTo create a new validation rule, click the Create New button in the footer at the bottom of the screen.
- 145 -

Validation DetailsThe Validation Details grouping allows the admin to establish the basic information for the validation rule.
The Name textbox determines the name for the validation rule that will be used when selecting the rule later.
The Type dropdown is used to indicate whether the rule is for NBI or NBE elements.
The Severity dropdown determines at what level of severity the rule will return results.
CheckboxesThe Enabled checkbox determines whether or not the validation rule is active. The validation process will only checkthe rule if the Enabled checkbox is checked.
The Include in Results checkbox determines whether the validation results will display the currently selected rule's fail-ures after a validation is performed on the Bridges > Validation task. If left unchecked, a structure can fail the val-idation rule but the result will not be displayed on the Bridges > Validation.
Use the Description and Notes textboxes to provide additional information on the validation rule. The Description text-box is a mandatory entry because it is the message that displays on the Bridges > Validation task if the validation rule isfailed.
Validation DependenciesThe Validation Dependencies grouping allows the admin to select rules for which the currently selected rule is depend-ent. By establishing dependencies, admins can greatly reduce the time necessary to perform a validation.
Example: If the validation rule being established only deals with numerical values, a dependency could be added thatchecks whether the value is numeric before running the selected validation rule. If the dependency rule passes, the selec-ted validation rule will run. If it fails, the selected validation rule will not run. The establishment of a dependency likethis could save significant time for large validations.
Use the Dependency dropdown to select a rule, then click the Add Dependency button.
- 146 -

Use the Run Selected If dropdown to determine how the currently selected rule will be dependent on the dependency:
Ruling Description
Passes The validation rule will run if the structure passes the dependency's rule.
Fails The validation rule will run if the structure fails the dependency's rule.
Doesn't RunThe validation rule will run if the dependency's rule does not run. This would mostlikely occur if the dependency validation rule has its own dependencies that causeit not to run.
Passes or Doesn't Run The validation rule will run if the structure passes the dependency's rule or thedependency's rule does not run.
Fails or Doesn't Run The validation rule will run if the structure fails the dependency's rule or thedependency's rule does not run.
To delete the dependency from the validation rule, click the icon for the desired dependency.
Validation Editor Page ControlsFor validation rules being newly created:
l Click the Save button to save the new validation rule.l Click the Cancel button to cancel the creation of the new validation rule.
Once the new validation rule has been saved, the following note will display at the top of the grouping:
At least one condition must be applied to the validation rule on the Equation Editor subtask in order for the validationrule to run properly.
For existing validation rules:
l Use the Type dropdown to determine whether the validation rule being selected is for NBI or NBE items.l The Create New button is used to create a new validation rule.l Click the Copy>> button to copy the selected validation rule. This will reveal the Copy Name textbox. Enter aname and click the Copy button to complete the copy, or click the << button to cancel the copy.
- 147 -

Sync MappingThe Admin > Mapping > Sync Mapping task allows the admin to sync the unmatched official and geographic inform-ation systems (GIS) coordinates of selected bridges. If the official and GIS coordinates of a bridge are unmatched, it istypically because the bridge's map pin has been moved from its official location.
Official Coordinates: The official latitude and longitude of the structure as indicated when the structure was created onthe Bridges > Create Struct task, Bridges > Copy Struct task, or imported through the Gateway tab.
GIS Coordinates: The latitude and longitude of the structure's pin location on the Bridges > Mapping task.
Compound RangeThe Compound Range dropdown is used to determine which bridges will be displayed in the grid. It compares the offi-cial and GIS coordinates based on the selection made in the Compound Range dropdown. The selected compound rangeis the allowed difference between the official and GIS coordinates.
Example: If a bridge's official latitude is 100.005, and the GIS latitude is 100, the difference is .005. If the selected com-pound range is .001, the bridge will appear in the grid. If the selected compound range is .01 or .1, the bridge will notappear because the difference between the official and GIS latitude is less than the selected compound range.
The more decimal places selected in the compound range, the more bridges that will appear in the grid. However, thesesmall differences are typically unrecognizable on the GIS map.
Sync and Revert ControlsThe Sync button changes the official coordinates to match the GIS coordinates. This might need to be done if the officialcoordinates were never entered or were entered incorrectly.
The Revert button changes the GIS coordinates to match the official coordinates. This might need to be done if the GISpin on the Bridges > Mapping task was moved from its official location.
- 148 -
Mapping

Map OptionsThe Admin > Mapping > Map Options task allows the admin to determine what information will be displayed when auser selects a structure's map pin when viewing a map:
Click the symbol to add a new option:
Use the Table Name and Column Name dropdowns to select the field.
Check the Use Parameters checkbox if the marker should display information pulled from the Admin > General Config> Parameters task for the selected table-column. Otherwise the marker will simply use the value in the database.
The Display Order textbox is used to determine where in the map pin's information box the field information will be dis-played. "1" will be the topmost setting for the information.
Click the symbol to complete the addition of the new map option.
Click either the or symbol to cancel the addition of the new map option.
*Note: Up to 10 map options can be added. Once 10 are added, the admin will be unable to make new additions untilan existing option is deleted.
Existing map options can be edited by clicking the symbol or deleted by clicking the symbol.
Click the Save button in the footer to accept the changes made on the page.
Click the Cancel button in the footer to cancel the changes made on the page.
- 149 -

Element SpecificationsThe Admin > Modeling Config > Element Specifications task is used to create elements and define the specifications forexisting elements.
ElementsThe Elements grouping contains the Element list. In order to view and edit an element's specifications, it must be selec-
ted from the Element list. To select an element, click the symbol. The selected element's information will then appearin the Element Specifications grouping.
The National Bridge Elements (NBEs) determined by the Federal Highway Administration (FHWA) are mandatory in thesystem and cannot be deleted. Much of the basic information and classifications of the NBEs will also be read only forall users.
If the element has an next to the in the Element list, the element is not an NBE and can be edited and deletedfreely.
Create or Copy ElementThe Create Element button creates a new element with blank specifications that must be completed.
The Copy Element button creates a copy of the currently selected element with matching specifications other than theElement Key, Short Name, and Long Name.
By default, the element key progresses in sequential order. Therefore, if the Element List's last element has an elementkey of 1000, a newly created or copied element will have an element key of 1001. The key can be changed once cre-ated, but only one element key is permitted per number.
- 150 -
Modeling Config
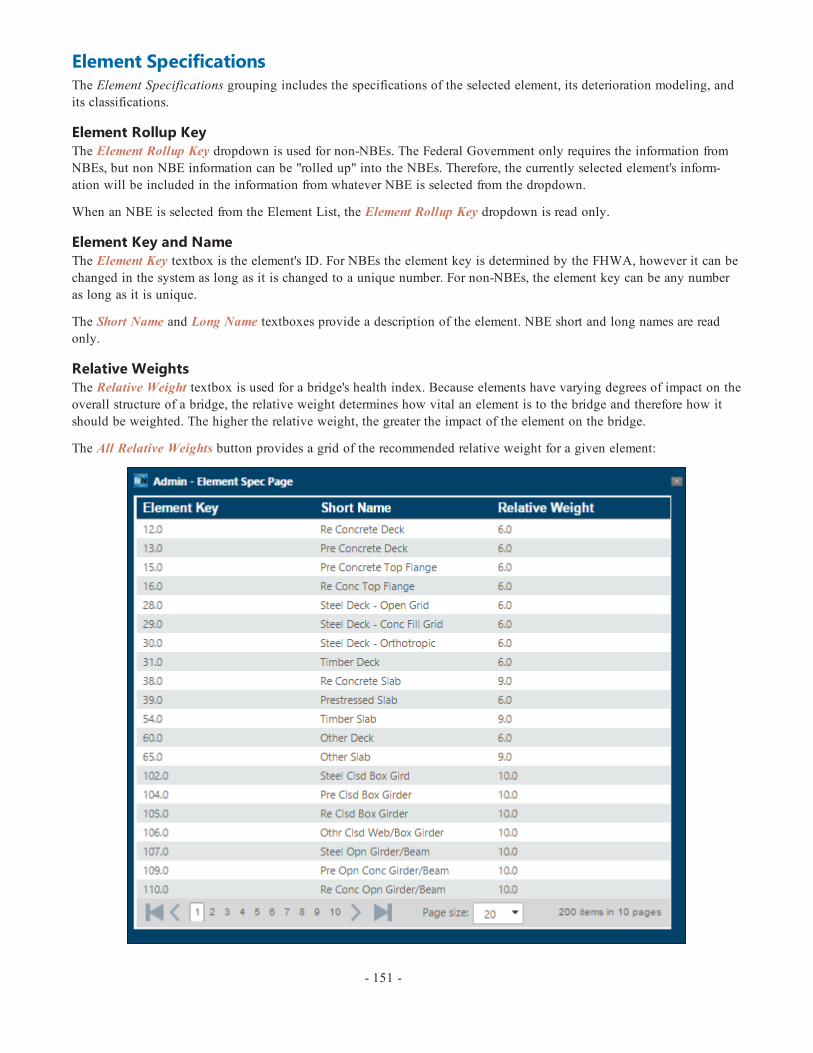
Element SpecificationsThe Element Specifications grouping includes the specifications of the selected element, its deterioration modeling, andits classifications.
Element Rollup KeyThe Element Rollup Key dropdown is used for non-NBEs. The Federal Government only requires the information fromNBEs, but non NBE information can be "rolled up" into the NBEs. Therefore, the currently selected element's inform-ation will be included in the information from whatever NBE is selected from the dropdown.
When an NBE is selected from the Element List, the Element Rollup Key dropdown is read only.
Element Key and NameThe Element Key textbox is the element's ID. For NBEs the element key is determined by the FHWA, however it can bechanged in the system as long as it is changed to a unique number. For non-NBEs, the element key can be any numberas long as it is unique.
The Short Name and Long Name textboxes provide a description of the element. NBE short and long names are readonly.
Relative WeightsThe Relative Weight textbox is used for a bridge's health index. Because elements have varying degrees of impact on theoverall structure of a bridge, the relative weight determines how vital an element is to the bridge and therefore how itshould be weighted. The higher the relative weight, the greater the impact of the element on the bridge.
The All Relative Weights button provides a grid of the recommended relative weight for a given element:
- 151 -

The NBI Relative Weight textbox is used in conjunction with the NBI converter on the Inspection > Condition task. Itdetermines how the selected element is weighted in the average when an NBI converter profile is used.
UnitsThe Units dropdown determines how the element is measured. NBE units are read only.
NotesThe Notes textbox can be used to enter a description of the element. This is particularly useful when creating new ele-ments that may not be universally recognized by their short and long names.
ManualA PDF can be added for any element to provide more information. To add a PDF, click the Choose File button and loc-ate the desired file. Once selected, click the Upload button to add the PDF to the element.
*Note:When upgrading to a new version of BrM, previously uploaded custom agency element manuals will be lost dur-ing the uninstall of the old version. In order to ensure the manuals are maintained and added into the new version, theElemGuideManuals subdirectory must be copied prior to uninstalling the old version. Then, after installing the new ver-sion, the ElemGuideManuals subdirectory can be returned to its folder location.When completing this process, onlycopy over the custom agency element files. The new install of BrM will contain the latest manuals for the standardelements.
Defect and Protective SystemThe Defect and Protective System checkboxes are used to indicate whether or not the selected element is a defect or aprotective system.
If the Defect checkbox is selected, the Condition State Definitions grouping will appear below the Classifications group-ing.
The Condition State Definitions grouping allows the admin to specify the name and description of the 4 condition statelevels.
Primary Defect*Note: BrM 5.2.3 does not currently utilize the Primary Defect dropdown. This control's functionality may be imple-mented in future versions of the software. If used, it would help the system determine the rate of an element's deteri-oration.
Health Index Coefficient
The Health Index Coefficient grouping allows the admin to change the weight of the condition states to better representthe selected element's deterioration. By default, the health index coefficient uses the following equation:
- 152 -

yi is the forecasted percentage of element e in state i
CS1 is always equal to "1" in the equation, so the CS1 textbox is read only. CS4 is always equal to 0 (therefore notshown in the equation), so the CS4 textbox is read only.
The CS2 and CS3 textboxes can be changed from their default values to any value between "1" and "0."
Deterioration ModelingDue to its complexity, an extended user manual section has been created to explain deterioration modeling at length.This portion can be found at the Admin > Modeling Config > Deterioration Modeling section of the BrM User Manual.
However, if a defect is selected, there is only one available control:
If the Exclude Defect from Deterioration checkbox is checked, the selected defect will not be included in the deteri-oration modeling on the Analysis tab.
ClassificationsThe Classifications grouping is used to classify the selected element. Only non-default elements can have their clas-sifications edited.
Use the Category, Material, and Type dropdowns to classify the element.
Element Spec Page ControlsClick the Save button to save the changes made to the selected element.
Click the Revert button to cancel the changes made to the selected element.
- 153 -

Element-Child LinkingThe Admin > Modeling Config > Element-Child Linking task is used to link elements, defects, and protective systems.The elements must be linked together in order to be used together throughout the software on pages such as the Inspec-tion > Condition task.
By default, links have been established based on the AASHTO Manual for Bridge Element Inspection. Additional linksfor the existing elements as well as links for custom elements must be performed by the admin.
Assigning Element RelationshipsThe Assign dropdown is the key to the element relationships. When a selection is made using the Assign dropdown, thelinks are for that type of element only.
Elements can have:
l Protective Systems (children)l Defects (children)
Protective Systems can have:
l Elements (parents)l Defects (children)
Defects can have:
l Elements (parents)l Protective Systems (parents)
Element-Child Linking Page ControlsClick the Save button to save the changes made to the assigned element.
- 154 -

Project CategoriesThe Admin > Modeling Config > Project Categories task is used to create project categories for use in the Projects tab.Project categories are linked to specific actions, filters, and layouts that help the users identify bridges with variousneeds. There are six project categories by default: Bridge Rail, Deck Work, Joint Seals, Paint, Scour Work, and Struc-turally Deficient NHS Bridges. However, these categories can be modified and additional categories can be created.
*Note: Project categories are not mandatory, as "No Category" is a selectable option on the Projects > Create/Edit Pro-ject > Query subtask, but they are recommended to help the user narrow down search results to specific needs.
Project Category SelectionTo choose a project category to manage, select one from the Project Category listbox or create a new one by typing aname into the textbox next to the Add New Project Category button and then click the button.
To set the selected category as the default category, click the Set as Default Category checkbox. This determines whichproject category will be the default selection in the Project Category dropdown on the Projects > Create/Edit Project >Query, Summary, and Management subtasks.
Default Filter and LayoutUse the Default Filter and Default Layout dropdowns to select the project category's default filter and layout. These set-tings will be used on the Create/Edit Project task of the Projects module.
*Note: In order for filters and layouts to appear in the above dropdowns, the following must be true:
Filters - The filter's context on the Manage Filters task must be set to "Bridge List" and the filter must be set to "Shared."
Layouts - The layout's context on the Manage Layouts task must be set to "Project Bridge Needs" and the layout must beset to "Shared."
Related ActionsThe Related Actions grid shows all of the actions that can be associated with the selected project category.
- 155 -
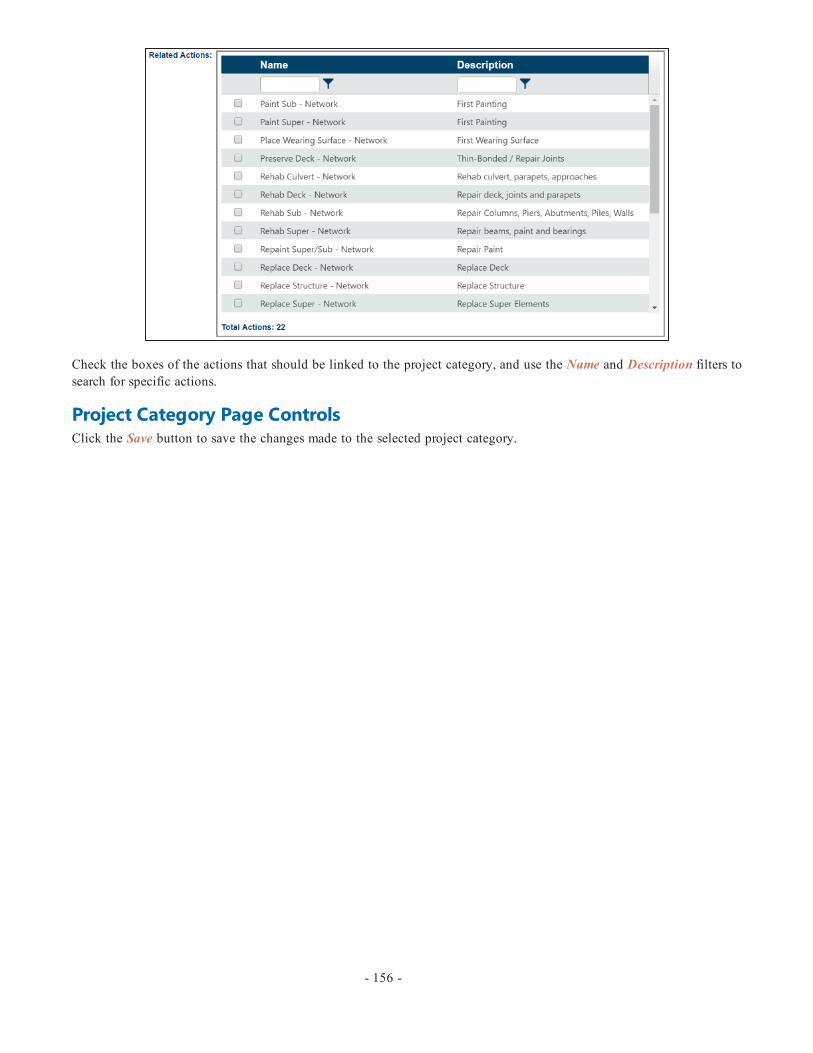
Check the boxes of the actions that should be linked to the project category, and use the Name and Description filters tosearch for specific actions.
Project Category Page ControlsClick the Save button to save the changes made to the selected project category.
- 156 -
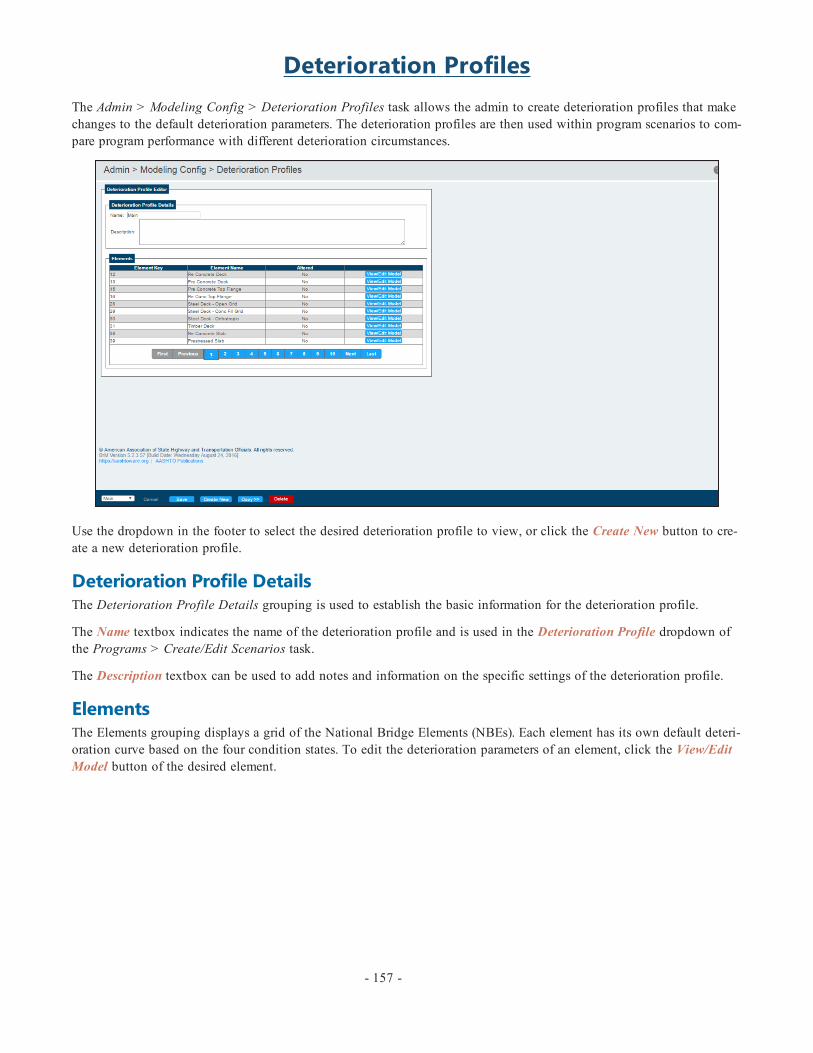
Deterioration ProfilesThe Admin > Modeling Config > Deterioration Profiles task allows the admin to create deterioration profiles that makechanges to the default deterioration parameters. The deterioration profiles are then used within program scenarios to com-pare program performance with different deterioration circumstances.
Use the dropdown in the footer to select the desired deterioration profile to view, or click the Create New button to cre-ate a new deterioration profile.
Deterioration Profile DetailsThe Deterioration Profile Details grouping is used to establish the basic information for the deterioration profile.
The Name textbox indicates the name of the deterioration profile and is used in the Deterioration Profile dropdown ofthe Programs > Create/Edit Scenarios task.
The Description textbox can be used to add notes and information on the specific settings of the deterioration profile.
ElementsThe Elements grouping displays a grid of the National Bridge Elements (NBEs). Each element has its own default deteri-oration curve based on the four condition states. To edit the deterioration parameters of an element, click the View/EditModel button of the desired element.
- 157 -

The Model Parameters and Element Assumptions groupings can be used to modify the deterioration parameters of theselected element. For more information on how to make changes to the deterioration parameters, read the DeteriorationModeling section of the user manual that directly follows this section.
Once a change has been made and the admin returns to the main Deterioration Profiles page, that element's line will bered in the grid and the Altered column will read "Yes."
To revert the parameter changes back to the default settings, click the (Use Default) link in the Altered column for thedesired element.
Deterioration Profile Page Controls
The dropdown allows the user to select an existing deterioration profile to view and edit.
The Save button saves the changes made to the selected deterioration profile.
The Create New button creates a new deterioration profile.
The Copy>> button copies the selected deterioration profile. This will reveal the Copy Name textbox. Enter a name andclick the Copy button to complete the copy, or click the << button to cancel the copy.
The Delete button deletes the selected deterioration profile.
- 158 -

Deterioration ModelingBridge deterioration modeling is designed to forecast the future conditions of bridges and aid the user in developingoptimal actions to take on the bridge in a given period of time.
The element deterioration models are managed on the Admin > Modeling Config > Element Spec task. BrM includes thedefault model definitions for the standard AASHTOWare Bridge Elements. The parameters for the elements can be mod-ified and the parameters for new elements can be specified, but all elements (excluding defect elements) must have adeterioration model defined.
Modify Element's Deterioration Model ParametersTo modify an element's deterioration model parameters, select an element from the element list to reveal the selected ele-ment's parameters.
The parameters can then be modified using the controls in the Model Parameters grouping or by using the element'sdeterioration model graphs:
l Use the Model Parameters grouping:1. Median Years in CS1, CS2, CS3 - The median number of years in which a unit of element stays respect-
ively in state 1, state 2, and state 3.
- 159 -

2. Shaping Parameter - Specifies how quickly an element begins to deteriorate.3. Formula - Additional formula defined on the Admin > Modeling Config >Advanced Formula subtask.
*Note: If a protective system is the selected element, the Protection Factors grouping will appear within the Deteri-oration Modeling grouping.
The protection factors model the effect that the protective system has on the deterioration of a base element.
The Max. Protection Parameter textbox indicates the factor by which the protective system effects the transition state ofthe base element.
Example: If the Max. Protection Parameter textbox is set to "2," the transition times from one condition state to thenext for the base element will be doubled. However, the max. protection parameter only applies when the protective sys-tem is in perfect condition. As the protective system deteriorates, so does its influence on the transition times of the baseelement.
Once the protective system is no longer in perfect condition and cannot utilize the max. protection parameter, the CS1through CS4 textboxes indicate the effectiveness of the protective system on the base element when the protective sys-tem is in that condition state. The CS1 and CS4 textboxes are read-only controls and will always be set to "1" and "0"respectively.
OR
l Use the element's deterioration model graph page:1. Select View Graphs to proceed to the following page:
- 160 -
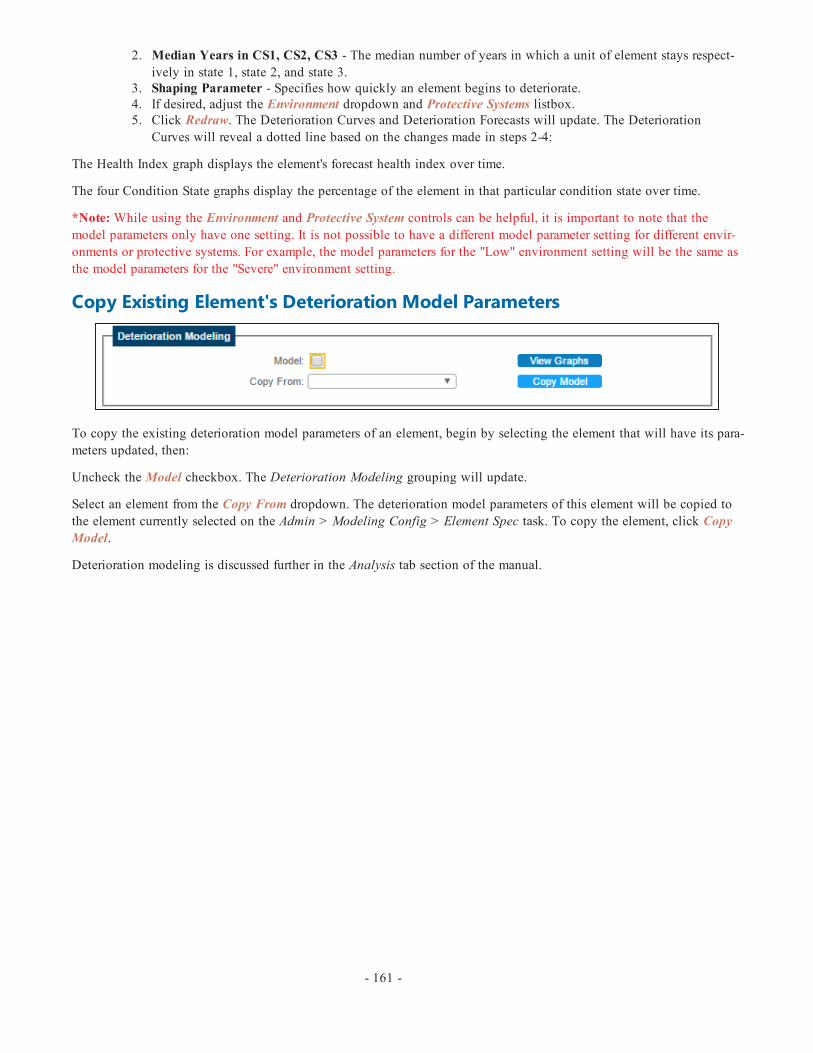
2. Median Years in CS1, CS2, CS3 - The median number of years in which a unit of element stays respect-ively in state 1, state 2, and state 3.
3. Shaping Parameter - Specifies how quickly an element begins to deteriorate.4. If desired, adjust the Environment dropdown and Protective Systems listbox.5. Click Redraw. The Deterioration Curves and Deterioration Forecasts will update. The Deterioration
Curves will reveal a dotted line based on the changes made in steps 2-4:
The Health Index graph displays the element's forecast health index over time.
The four Condition State graphs display the percentage of the element in that particular condition state over time.
*Note:While using the Environment and Protective System controls can be helpful, it is important to note that themodel parameters only have one setting. It is not possible to have a different model parameter setting for different envir-onments or protective systems. For example, the model parameters for the "Low" environment setting will be the same asthe model parameters for the "Severe" environment setting.
Copy Existing Element's Deterioration Model Parameters
To copy the existing deterioration model parameters of an element, begin by selecting the element that will have its para-meters updated, then:
Uncheck the Model checkbox. The Deterioration Modeling grouping will update.
Select an element from the Copy From dropdown. The deterioration model parameters of this element will be copied tothe element currently selected on the Admin > Modeling Config > Element Spec task. To copy the element, click CopyModel.
Deterioration modeling is discussed further in the Analysis tab section of the manual.
- 161 -

ElementsThe Admin > Modeling Config > Elements task is used to manage the environments, materials, categories, and types forelements.
EnvironmentsThe environments in the Environments grouping are used primarily for deterioration modeling because the environmentcan play a large role in a bridge's deterioration. New environment levels cannot be added, but the Name and Factor text-boxes can be changed.
The Factor textboxes indicate the impact that the environment will have on the deterioration of the elements of abridge. The transition times of an element are multiplied by the environment factor, therefore a beneficial environmentshould have a value greater than 1 and the factors should regress in order all the way to a severe environment whichshould have a value less than 1.
MaterialsThe materials in the Element Materials grouping are used to classify the elements. No new materials can be added, butthe names of the materials can be changed in the Name textboxes and the order in which they appear can be changed inthe Sort textboxes.
CategoriesThe categories in the Element Categories grouping are used to classify the elements. New categories can be added byclicking the Add New button. The names of the categories can be changed in the Name textboxes and the order inwhich they appear can be changed in the Sort textboxes.
Categories can be deleted using the symbol as long as they are not being used by an element definition or elementtype. If at least one element definition or type is using the category, a message will appear when the mouse is hovered
over the symbol:
- 162 -

However, admins who do not wish to remove the element definitions and element types associated with the element cat-egory can instead reassign those definitions and types to a different category. The category can then be deleted withouthaving to delete the definitions and types.
TypesThe types in the Element Types grouping are used to classify the elements. The Category dropdown determines the cat-egory to which the type belongs. The names of the types can be changed in the Name textboxes and the order in whichthey appear can be changed in the Sort textboxes. New types can be added by clicking the Add New button.
Types can be deleted using the symbol as long as no element is currently classified as that type. If at least one ele-
ment is classified as that type, a message will appear when the mouse is hovered over the symbol:
- 163 -
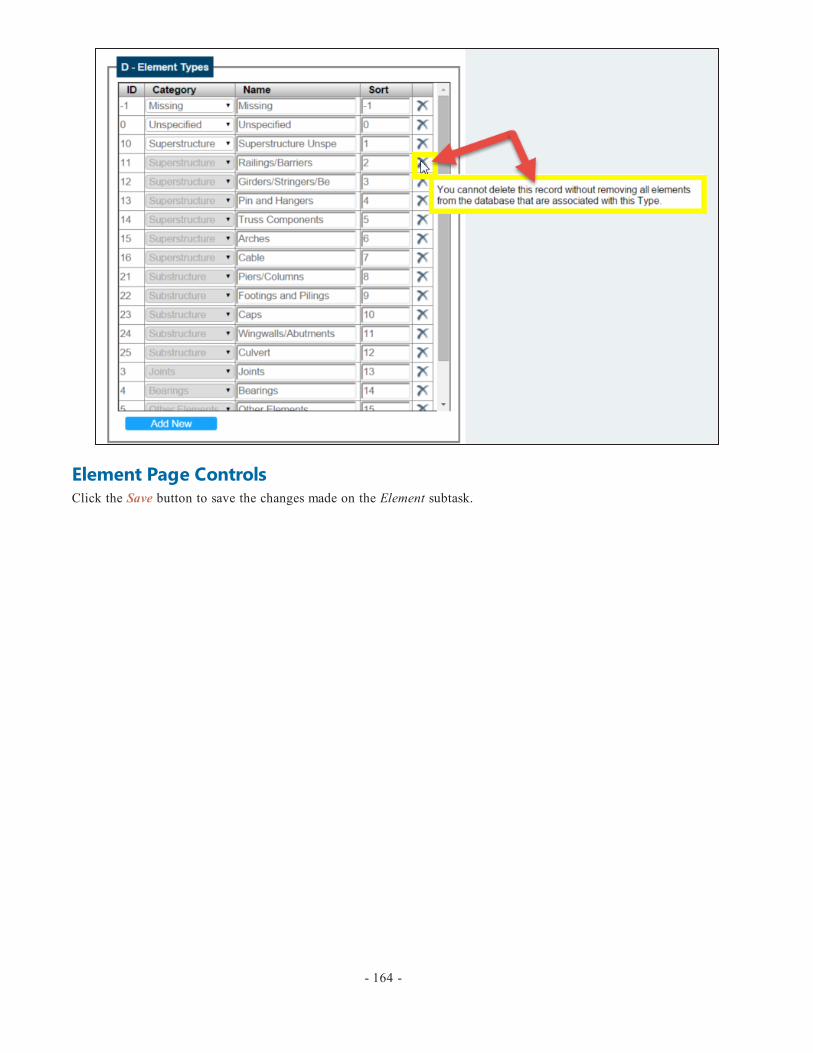
Element Page ControlsClick the Save button to save the changes made on the Element subtask.
- 164 -

AssessmentThe Admin > Modeling Config > Assessment subtask is used to define risk assessment types and their impact on abridge.
To begin, select an assessment from the Assessment listbox or click the Add New Assessment Definition button.
Assessment DetailsCandidate ID and LabelThe Candidate ID and Label textboxes are used as name and description fields, respectively.
Auto Generation and Manual GenerationThe Auto Generation and Manual Generation dropdowns determine how an assessment is recorded for an inspection.
The Auto Generation dropdown allows the admin to have an assessment created automatically upon inspection creation,set based upon the calendar, or turned off with the "Not automatic" setting.
The Manual Generation dropdown allows users to create their own assessments on the Inspection > Assessments task orcan be turned off with the "Not allowed" setting.
CheckingThe Checking dropdown determines whether or not a review of the assessment is required.
IntervalThe Interval textbox works directly with the Auto Generation dropdown when it is set to "Calendar" to determine theinterval (in months) that new assessments will be generated.
Edit FormulaThe Edit Formula button allows the admin to edit the formula used to determine the final risk value for the assessment.
- 165 -

Likelihood, Consequence, and Final Risk GroupingsThe default assessment formula multiplies the Likelihood and Consequence to Structure entries to determine the FinalRisk Value on the Inspection > Assessments task.
The admin can set the maximum and minimum values for each based on agency standards. The set values will be reflec-ted in the Risk Assessment Value grid on the Inspection > Assessments task:
Once on the Inspection > Assessment task, each of the numbered boxes on the Risk Assessment Value grid can be selec-ted to indicate the values for the Likelihood, Consequence to Structure, and Final Risk Value fields.
Assessment Page ControlsClick the Save button to save the changes for the selected assessment.
Click the Delete button underneath the Assessment listbox to delete the selected assessment.
- 166 -

Benefit GroupsThe Admin > Modeling Config > Benefit Groups task is used to determine the impact of a specific action or actions on astructure. This is shown through an action's effects on elements, specific fields, and risk assessments.
Benefit Groups
The Benefit Groups grouping displays the groups for specific actions. Clicking on a benefit group will select it. A new
benefit group can be created by clicking the icon at the top of the Benefit Groups grid.
The Linked Actions column of the Benefit Groups grid is determined by the linking of the benefit groups to actions onthe Admin > Modeling Config > Action Defs subtask.
The icon allows the user to change the name and description of the selected benefit group.
Click the icon to accept the changes or the icon to cancel the changes.
- 167 -
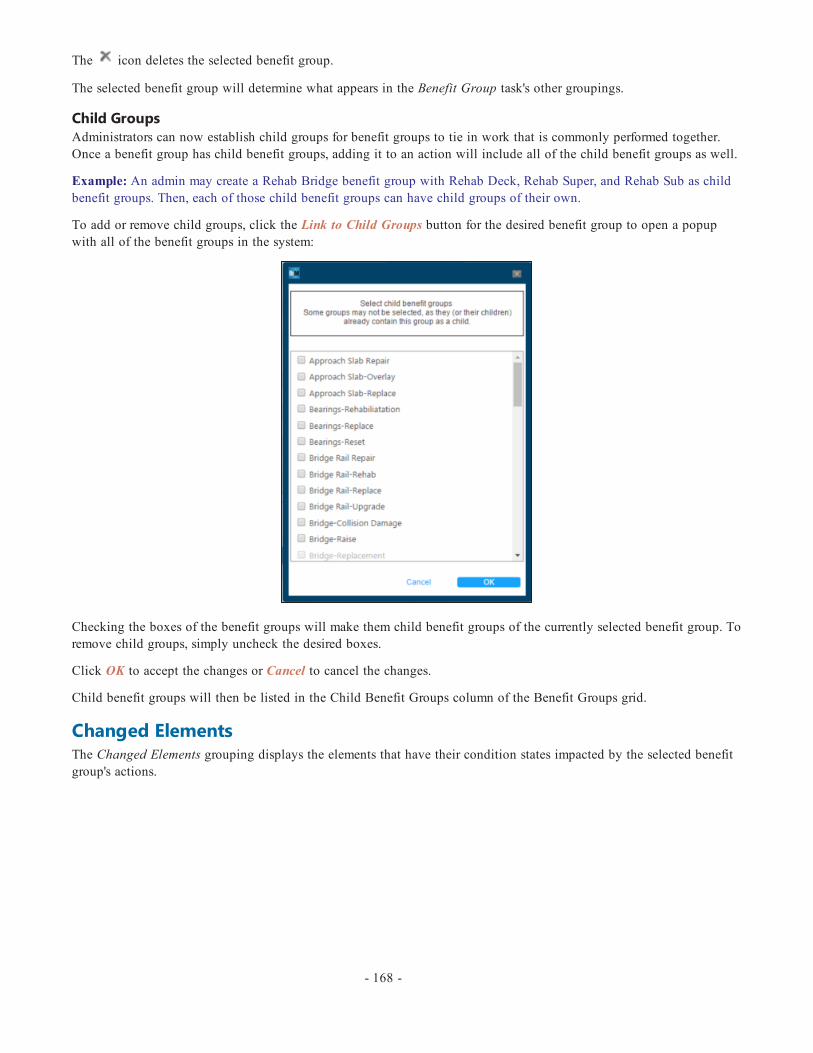
The icon deletes the selected benefit group.
The selected benefit group will determine what appears in the Benefit Group task's other groupings.
Child GroupsAdministrators can now establish child groups for benefit groups to tie in work that is commonly performed together.Once a benefit group has child benefit groups, adding it to an action will include all of the child benefit groups as well.
Example: An admin may create a Rehab Bridge benefit group with Rehab Deck, Rehab Super, and Rehab Sub as childbenefit groups. Then, each of those child benefit groups can have child groups of their own.
To add or remove child groups, click the Link to Child Groups button for the desired benefit group to open a popupwith all of the benefit groups in the system:
Checking the boxes of the benefit groups will make them child benefit groups of the currently selected benefit group. Toremove child groups, simply uncheck the desired boxes.
Click OK to accept the changes or Cancel to cancel the changes.
Child benefit groups will then be listed in the Child Benefit Groups column of the Benefit Groups grid.
Changed ElementsThe Changed Elements grouping displays the elements that have their condition states impacted by the selected benefitgroup's actions.
- 168 -

A new record can be added by clicking the icon at the top of the Changed Elements grid.
The purpose of the Changed Elements grouping is to determine what effect the benefit group's actions will have on the
selected element. Clicking the icon allows the admin to indicate how the actions will improve the element's con-dition state.
Parent and grandparent combinations can be added using the Parent and Grandparent column dropdowns. These allowthe admin to be specific about exactly how a benefit is applied.
Example: There is an element with a protective system applied. That protective system has a defect. Therefore, the grand-parent > parent > child relationship would be element > protective system > defect. A benefit group can impact a spe-cific part of that relationship without impacting the rest. So, perhaps a benefit group removes or improves the defect onthe protective system without affecting any other part of the bridge.
To declare the impact the benefit group's actions have on the element, first use the Origin State dropdown to set the ori-ginal condition state, then change the percentages in the CS1, CS2, CS3, and CS4 column textboxes to add up to 100%.
Example: An element with an origin state of CS3 might change to 100% CS1 after being repaired by the benefit group'sactions.
Click the icon to accept the changes or the icon to cancel the changes.
The icon deletes the selected element from the selected benefit group.
Removed ElementsThe Removed Elements grouping displays the elements that are fully removed by the selected benefit group's actions.
*Note: Benefit groups that perform replacement actions automatically remove defects, therefore those benefit groups donot need to include defects in the Removed Elements grouping.
- 169 -

A new removed element can be added by clicking the icon at the top of the Removed Elements grid. The Element,Parent, and Grandparent dropdowns allow the admin to select specifically which element is being removed.
Clicking the icon allows the admin to edit the Element, Parent, and Grandparent dropdowns of existing entries.
Click the icon to accept the changes or the icon to cancel the changes.
The icon deletes the selected removed element from the selected benefit group.
Replaced ElementsThe Replaced Elements grouping displays the existing elements and protective systems that are replaced by new ele-ments and protective systems as a result of the selected benefit group's actions.
A new replaced element can be added by clicking the icon at the top of the Replaced Element grid. The Orig. Ele-ment and Orig. Parent dropdowns are used to determine which element or protective system will be replaced. The NewElement dropdown determines which new element or protective system will take the place of the old one.
Clicking the icon allows the admin to edit the Orig. Element, Orig. Parent, and New Element dropdowns of exist-ing entries.
Click the icon to accept the changes or the icon to cancel the changes.
The icon deletes the selected replaced element from the selected benefit group.
*Note: Element replacement is only applicable to elements and protective systems.
Created Protective SystemsThe Created Protective Systems grouping displays the protective systems that are added as a result of the selected benefitgroup's actions.
- 170 -

A new created protective system can be added by clicking the icon at the top of the Created Protective Systems grid.The Element and Parent dropdowns are used to determine which protective system will be added to which element. ThePercent Coverage textbox determines how much of the element the new protective system covers.
Clicking the icon allows the admin to edit the Element and Parent dropdowns and Percent Coverage textbox ofexisting entries.
Click the icon to accept the changes or the icon to cancel the changes.
The icon deletes the selected created protective system from the selected benefit group.
Fields
The Fields grouping displays the fields that are impacted by the selected benefit group's actions. A new field can be
added by clicking the at the top of the Fields grid.
The Fields grouping contains specific columns of specific tables within the system that are changing due to the action.
Clicking the icon allows the admin to indicate how the action will change the field's value or increment. The Valuetextbox is used if the admin wants to specify the exact number the field will change to because of the action. The Incre-ment textbox is used if the admin wants to specify how much of an increase or decrease will occur to the number in thefield. Only one option - Value or Increment - can be used for one field.
*Note: To locate a specific table or column name, use the tooltips feature and hover the mouse over the desired locationin the system to discover the table and column name.
Click the icon to accept the changes or the icon to cancel the changes.
The icon deletes the selected field from the selected benefit group.
- 171 -

Risks
The Risks grouping displays the risk assessments that are impacted by the selected benefit group's actions. A new assess-
ment benefit can be added by clicking the at the top of the Risks grid.
Clicking the icon allows the admin to indicate how the action will change the assessment's risk level. The Valuetextbox is used if the admin wants to specify the exact risk level the assessment will change to because of the actions.The Increment textbox is used if the admin wants to specify how much of an increase or decrease will occur to the risklevel of the assessment. Only one option - Value or Increment - can be used for one assessment.
*Note: As shown in the grouping title, use negative values to reduce risks.
Click the icon to accept the changes or the icon to cancel the changes.
The icon deletes the selected assessment from the selected benefit group.
Benefit Groups Page ControlsClick the Save button to save the changes for the selected benefit group.
Click the Copy Group button to make a copy of the selected benefit group. The copy will include all of the elements,risks, and fields for the benefit group, but it will not include the child group links.
- 172 -
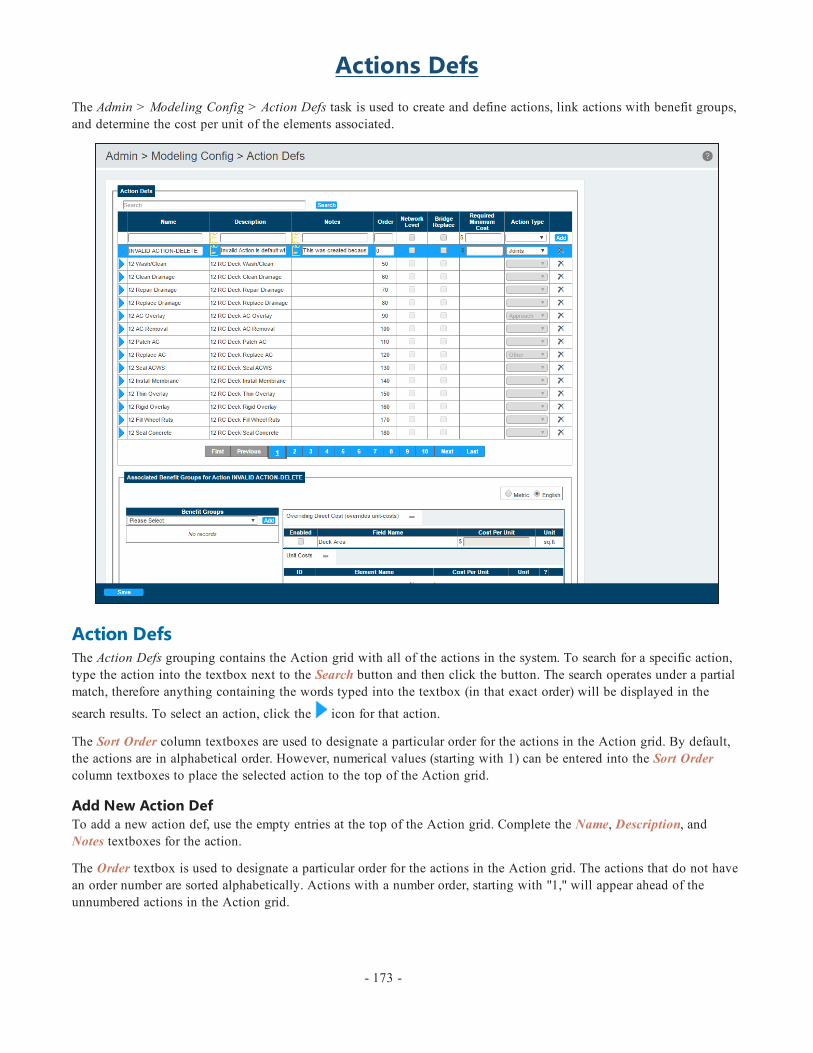
Actions DefsThe Admin > Modeling Config > Action Defs task is used to create and define actions, link actions with benefit groups,and determine the cost per unit of the elements associated.
Action DefsThe Action Defs grouping contains the Action grid with all of the actions in the system. To search for a specific action,type the action into the textbox next to the Search button and then click the button. The search operates under a partialmatch, therefore anything containing the words typed into the textbox (in that exact order) will be displayed in the
search results. To select an action, click the icon for that action.
The Sort Order column textboxes are used to designate a particular order for the actions in the Action grid. By default,the actions are in alphabetical order. However, numerical values (starting with 1) can be entered into the Sort Ordercolumn textboxes to place the selected action to the top of the Action grid.
Add New Action DefTo add a new action def, use the empty entries at the top of the Action grid. Complete the Name, Description, andNotes textboxes for the action.
The Order textbox is used to designate a particular order for the actions in the Action grid. The actions that do not havean order number are sorted alphabetically. Actions with a number order, starting with "1," will appear ahead of theunnumbered actions in the Action grid.
- 173 -
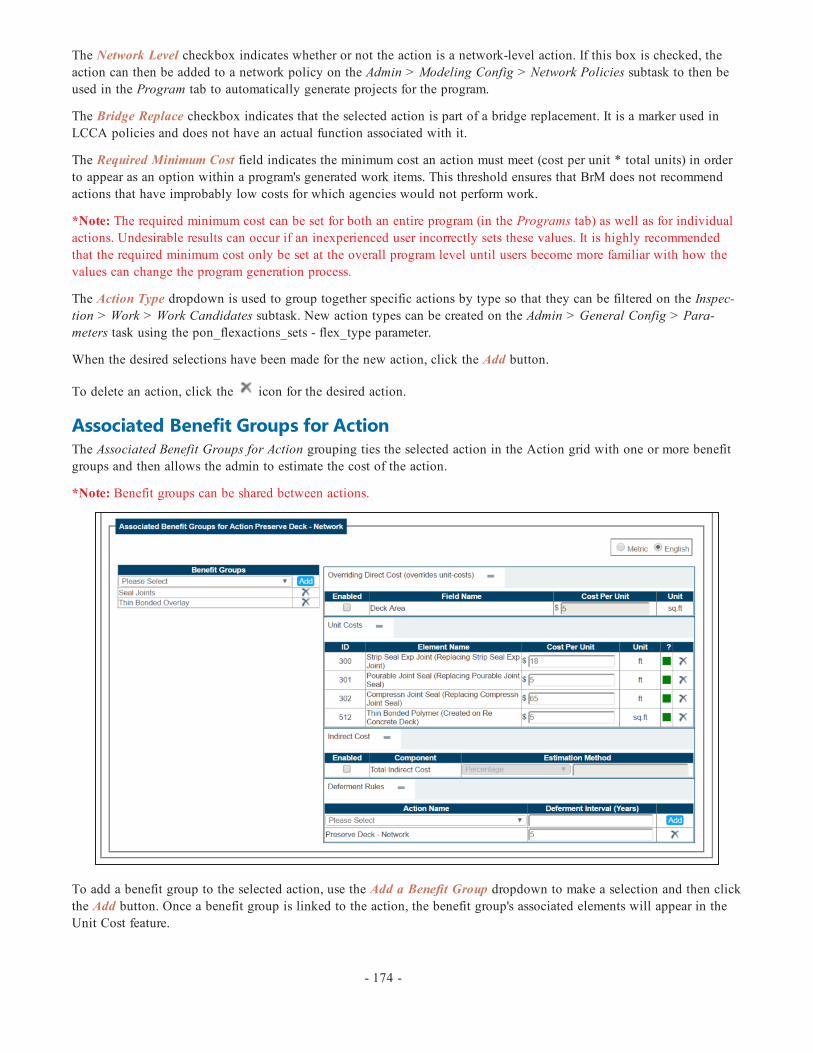
The Network Level checkbox indicates whether or not the action is a network-level action. If this box is checked, theaction can then be added to a network policy on the Admin > Modeling Config > Network Policies subtask to then beused in the Program tab to automatically generate projects for the program.
The Bridge Replace checkbox indicates that the selected action is part of a bridge replacement. It is a marker used inLCCA policies and does not have an actual function associated with it.
The Required Minimum Cost field indicates the minimum cost an action must meet (cost per unit * total units) in orderto appear as an option within a program's generated work items. This threshold ensures that BrM does not recommendactions that have improbably low costs for which agencies would not perform work.
*Note: The required minimum cost can be set for both an entire program (in the Programs tab) as well as for individualactions. Undesirable results can occur if an inexperienced user incorrectly sets these values. It is highly recommendedthat the required minimum cost only be set at the overall program level until users become more familiar with how thevalues can change the program generation process.
The Action Type dropdown is used to group together specific actions by type so that they can be filtered on the Inspec-tion > Work > Work Candidates subtask. New action types can be created on the Admin > General Config > Para-meters task using the pon_flexactions_sets - flex_type parameter.
When the desired selections have been made for the new action, click the Add button.
To delete an action, click the icon for the desired action.
Associated Benefit Groups for ActionThe Associated Benefit Groups for Action grouping ties the selected action in the Action grid with one or more benefitgroups and then allows the admin to estimate the cost of the action.
*Note: Benefit groups can be shared between actions.
To add a benefit group to the selected action, use the Add a Benefit Group dropdown to make a selection and then clickthe Add button. Once a benefit group is linked to the action, the benefit group's associated elements will appear in theUnit Cost feature.
- 174 -

To remove a benefit group from the action, click the icon for the desired benefit group.
*Note: If changes have been made to a benefit group on the Admin > Modeling Config > Benefit Groups subtask afterthe benefit group has been added to the action, those changes will be reflected. The benefit group does NOT need to beremoved and re-added to the action in order for those changes to be present.
Before making changes to the various cost sections, use the radio buttons in the top right corner of the Associated Bene-fit Groups for Action grouping to determine whether units will be in "Metric" or "English."
Overriding Direct CostThe Overriding Direct Cost feature allows the admin to override unit costs by basing the overall direct cost of the actionoff of deck area square footage.
To use the Overriding Direct Cost feature, check the Enable checkbox. This will make the Overriding Direct Cost's CostPer Unit textbox available for a cost per unit to be entered. This feature will then override the information entered intothe Unit Costs feature.
Unit CostsThe Unit Costs feature is used to estimate an action's direct cost based on the cost per unit of the associated benefitgroup's elements.
All of the elements tied to the benefit groups that have been linked to the action will appear in the Unit Costs feature.Use the Cost Per Unit textbox to add an element's cost. The unit cost is calculated based on the portion of an elementthat changes due to the action, not the entire size of the element.
Example: 200 square feet of a 500 square foot deck is in CS3 and will be repaired. The other 300 square feet are in CS1.If the cost per unit of the deck is $100, the direct cost would calculate to be $20,000, not $50,000, because only therepaired portion factors into the calculation.
The ? column will contain a green box - - for elements tied to one of the action's benefit groups. However, when abenefit group is deleted from the action, the elements from that benefit group remain in the Cost Per Unit grid and the ?
column box turns red - - for those elements. The red box indicates that the element is still tied to the action but is nolonger tied to a benefit group.
To remove an element from the action, click the icon for the desired element.
- 175 -

*Note: An element can be removed from the action even if that element's benefit group is still associated with theaction. Deleting the element from the action does not remove the element's tie to the benefit group on the Admin >Modeling Config > Benefit Groups subtask.
Indirect CostThe Indirect Cost feature allows the admin to estimate an indirect cost in addition to the direct cost. The indirect cost isbased on a percentage of the direct cost or a custom agency formula.
To use the Indirect Cost feature, check the Enable checkbox. This will make the dropdown available to select "Per-centage," "Flat Indirect Cost," or a custom agency formula. The custom agency formulas are created on the Admin >Modeling Config > Advanced Formulas task using the "IndirectCostFormula" context.
If "Percent" is selected from the dropdown, use the textbox to enter a value. This value will be a percentage of the directcost.
If "Flat Indirect Cost" is selected from the dropdown, use the textbox to enter a flat cost for the action. This ensures thatbenefit groups that change a field instead of an element, such as changing the deck NBI rating, will still have a costreflected in the analysis.
Example: If the direct cost is $10,000 and the admin enters "25" as the indirect cost percentage value, the indirect costwill be 25% of $10,000 = $2,500.
If a custom agency formula is chosen from the dropdown, the textbox will become read only and display the formulabeing used.
Deferment RulesThe Deferment Rules feature allows the admin to establish rules that defer specific actions for a period of time based onthe application of the current action.
Use the Action Name dropdown to select an action to defer. Once an action is selected, use the Deferment Interval text-box to enter a value (in years) of how long the action will be deferred after the application of the current action. Whenthe desired selections have been made, click the Add button to add the deferment rule.
To remove a deferment rule from the action, click the icon for the desired deferment rule.
Action Defs Page ControlsClick the Save button to save the changes made to the selected action. Multiple actions can have their details changedprior to saving.
- 176 -

Cost IndexThe Admin > Modeling Config > Cost Index task allows the admin to normalize all future costs to a base year to adjustfor inflation, material costs, etc. Each cost index created is tied to a specific year and its value represents how costs areexpected to change in that year. The cost index value is typically a projection of the cost of specific materials an agencyneeds for bridge construction.
The cost indexes established can then be used on the Analysis > LCCA task to ensure inflation is taken into accountthroughout the life-cycle cost analysis.
However, agencies do not need to use the cost index. The analysis includes an option for a flat 4% inflation that can beused in place of the cost index.
Select a year from the Effective Year dropdown and then use the Value textbox to enter the desired value for that year.
Once the information is entered, select the Add button to add the cost index.
To delete a cost index, click the icon next to the cost index.
Select the Save button at the bottom of the screen to save the new cost indexes.
- 177 -
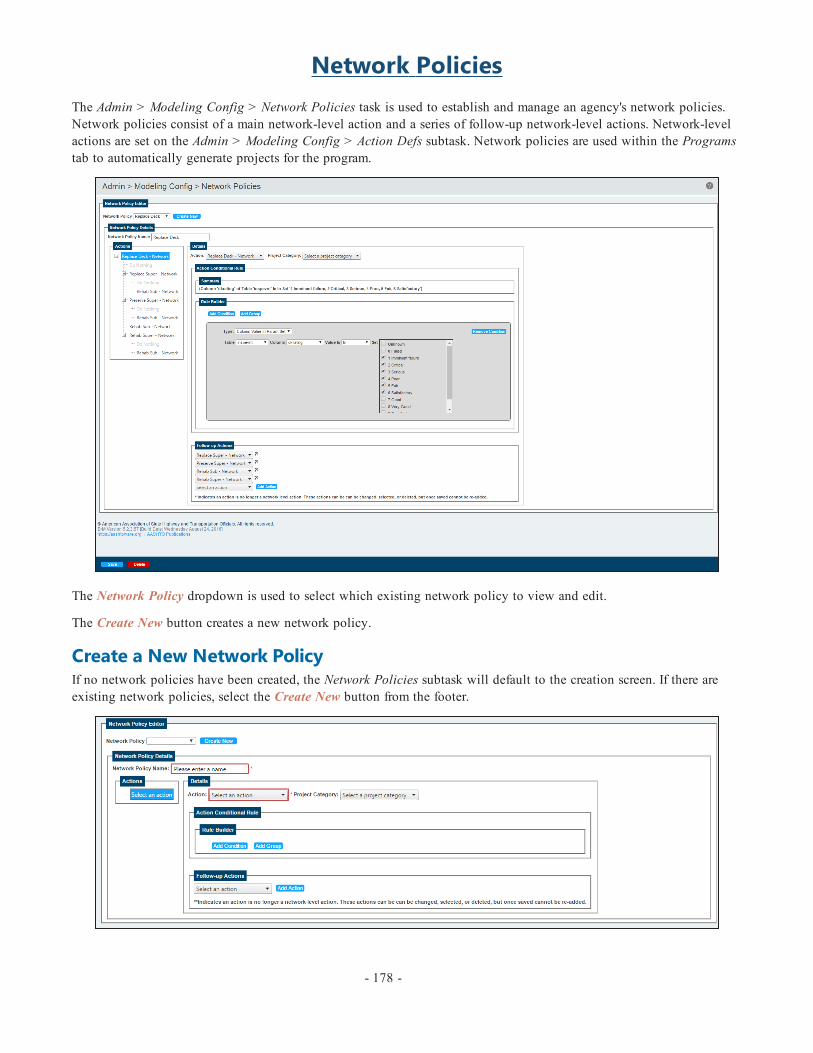
Network PoliciesThe Admin > Modeling Config > Network Policies task is used to establish and manage an agency's network policies.Network policies consist of a main network-level action and a series of follow-up network-level actions. Network-levelactions are set on the Admin > Modeling Config > Action Defs subtask. Network policies are used within the Programstab to automatically generate projects for the program.
The Network Policy dropdown is used to select which existing network policy to view and edit.
The Create New button creates a new network policy.
Create a New Network PolicyIf no network policies have been created, the Network Policies subtask will default to the creation screen. If there areexisting network policies, select the Create New button from the footer.
- 178 -

Use the Policy Name textbox to name the network policy. This will be used in the Network Policies grouping of the Pro-grams > Create/Edit Programs task.
ActionsThe Actions grouping contains a tree that displays the network policy's main action and the follow-up actions nestedwithin. When it reads "Select an action," no main network-level action has been chosen yet. This must be done in theDetails grouping.
Actions can be nested up to three levels deep, meaning the main action can have follow-up actions nested within, andthose follow-up actions can have their own follow-up actions nested within.
Use the +/- icons in the tree to expand/minimize the various actions in the tree. To view and edit the selections for a spe-cific action within the tree, select the action. That action's nesting information will appear in the Details grouping andcan be edited.
DetailsThe Details grouping is used to assign the main network-level action and follow-up network-level actions to the net-work policy.
The Action dropdown is for the action currently selected in the Actions grouping. When creating a new network policy,this control will be for the main action because no actions will yet be present to select in the Actions grouping. Onlyactions that have been designated as network-level actions on the Admin > Modeling Config > Action Defs subtask willappear in the dropdown list. Once an action is selected and the network policy is saved, the action will appear in theActions grouping.
The Project Category dropdown allows the admin to link the specific action to a project category. This ensures thatwhen a program is optimized, each project included in the program can have a project category.
Action Conditional RuleThe Action Conditional Rule grouping is used to build the rule that determines whether or not the selected action willbe activated.
- 179 -

The Add Condition button adds a condition to the rule. The Add Group button groups together multiple conditions.The following screenshots displays a lone condition and conditions within a group:
- 180 -

Use the Type dropdown to establish the type of condition:
l Column Value in Param Set - The table column's value is compared to a set of possible values.l Column Value - The table column's value is compared to one value.
When multiple conditions are added to the rule, whether inside a group or not, the conditions operate under an"And/Or" system. This means that conditions can work in tandem with each other or as alternatives to each other, butit cannot be a mixture. Once a selection is made from the And/Or dropdown, all other conditions added will operateunder the same selection. The only exception is that individual groups of conditions can have a different selection thanthe overall policy rule. The following screenshots display these concepts:
- 181 -

The Remove Condition button removes the condition from the rule.
The Remove Group button removes the group, and all conditions within, from the rule.
- 182 -

Follow-Up ActionsThe Follow-up Actions dropdown allows the admin to add follow-up actions to the action currently selected in theActions grouping.
Again, when creating a new network policy, this control will be for the main action's follow-up actions because noactions will yet be present to select in the Actions grouping. Only actions that have been designated as network-levelactions on the Admin > Modeling Config > Action Defs subtask will appear in the dropdown list. Once an action isselected, click the Add Action button next to the dropdown to nest the selected follow-up action into the main action
in the Actions grouping. To delete a follow-up action, click the next to the action.
*Note: The note at the bottom of the Follow-up Actions grouping states that network-level actions that have since losttheir network-level permission (this would be removed on the Admin > Modeling Config > Action Defs subtask) willbe marked with a "**." Therefore, if the action is removed and the network policy is saved, that cannot be re-added tothe policy unless the network-level permissions are granted again.
Network Policies Page ControlsThe Save button saves any changes made to the selected network policy.
The Delete button deletes the selected network policy.
- 183 -

Advanced FormulasThe Admin > Modeling Config > Advanced Formulas task allows the admin to create and/or modify formulas used forvarious calculations, including: utility, deterioration modeling, protective systems, and more.
Select Formula/ContextThe Select Formula/Context grouping is used to determine which existing formula will be modified or where the newformula will be utilized.
The Context dropdown distinguishes where the formula will be used:
l Deterioration - The formula will be used for the deterioration modeling calculations. These formulas are select-able on the Admin > Modeling Config > Element Spec task. These formulas are for additional effects and do notoverride the default deterioration model formulas.
l ProtSystem - The formula will be used for the protective systems calculations. These formulas are automatic andtherefore not selectable. These formulas estimate the overall protective factor of an element's protective systems.
l Custom - The formula will be used for the utility scaling calculations on the Admin > Modeling Config > Utilitytask.
l IndirectCostFormula - The formula will be used for the indirect cost calculation on the Admin > Modeling Con-fig > Action Defs subtask.
l LCCA - The formula will be used for the LCCA user cost calculation on the Admin > Modeling Config > Pre-servation and Replacement Policy subtask.
l UtilBaseValue - The formula will be used for estimating the base values of utility criteria on the Admin > Model-ing Config > Utility task.
l StructureWeights - The formula will be used for determining structure weights for programs on the Programs >Create/Edit Programs task.
The Formula dropdown is dependent upon the selection made in the Context dropdown. The selected context's formulaswill appear in the Formula dropdown, as well as a "<New Formula>" option for the Deterioration and Custom contexts.New formulas cannot be created for the ProtSystem context.
- 184 -
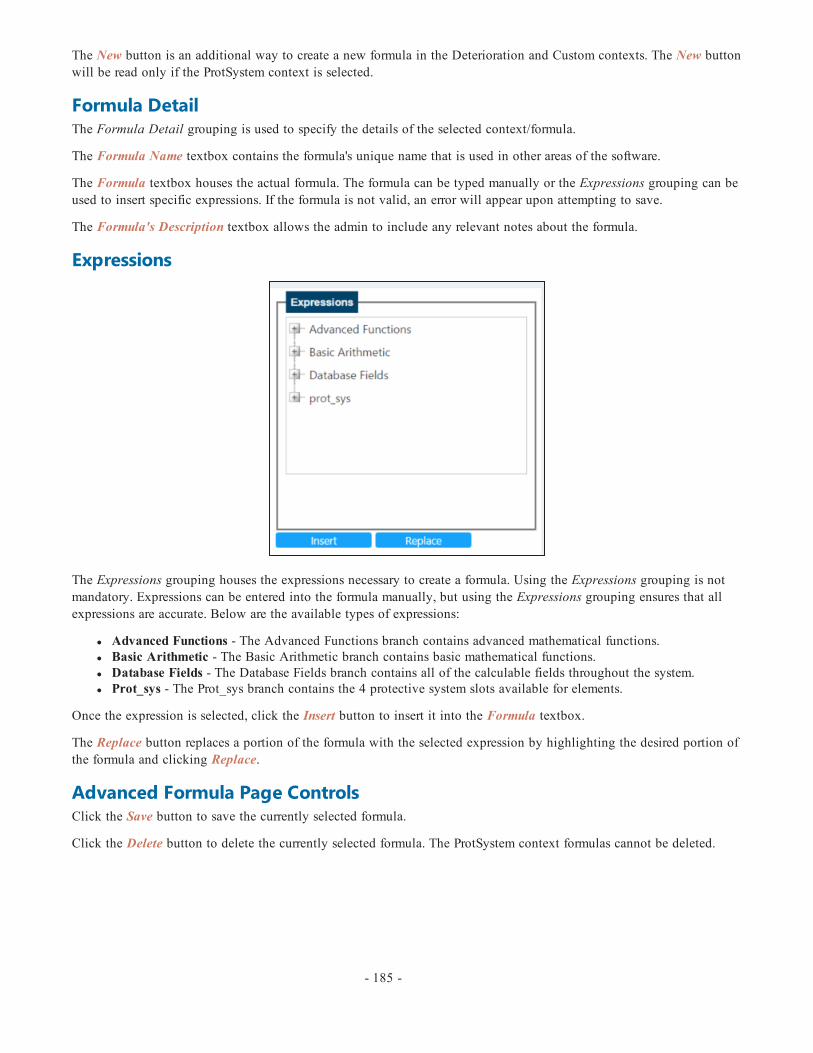
The New button is an additional way to create a new formula in the Deterioration and Custom contexts. The New buttonwill be read only if the ProtSystem context is selected.
Formula DetailThe Formula Detail grouping is used to specify the details of the selected context/formula.
The Formula Name textbox contains the formula's unique name that is used in other areas of the software.
The Formula textbox houses the actual formula. The formula can be typed manually or the Expressions grouping can beused to insert specific expressions. If the formula is not valid, an error will appear upon attempting to save.
The Formula's Description textbox allows the admin to include any relevant notes about the formula.
Expressions
The Expressions grouping houses the expressions necessary to create a formula. Using the Expressions grouping is notmandatory. Expressions can be entered into the formula manually, but using the Expressions grouping ensures that allexpressions are accurate. Below are the available types of expressions:
l Advanced Functions - The Advanced Functions branch contains advanced mathematical functions.l Basic Arithmetic - The Basic Arithmetic branch contains basic mathematical functions.l Database Fields - The Database Fields branch contains all of the calculable fields throughout the system.l Prot_sys - The Prot_sys branch contains the 4 protective system slots available for elements.
Once the expression is selected, click the Insert button to insert it into the Formula textbox.
The Replace button replaces a portion of the formula with the selected expression by highlighting the desired portion ofthe formula and clicking Replace.
Advanced Formula Page ControlsClick the Save button to save the currently selected formula.
Click the Delete button to delete the currently selected formula. The ProtSystem context formulas cannot be deleted.
- 185 -
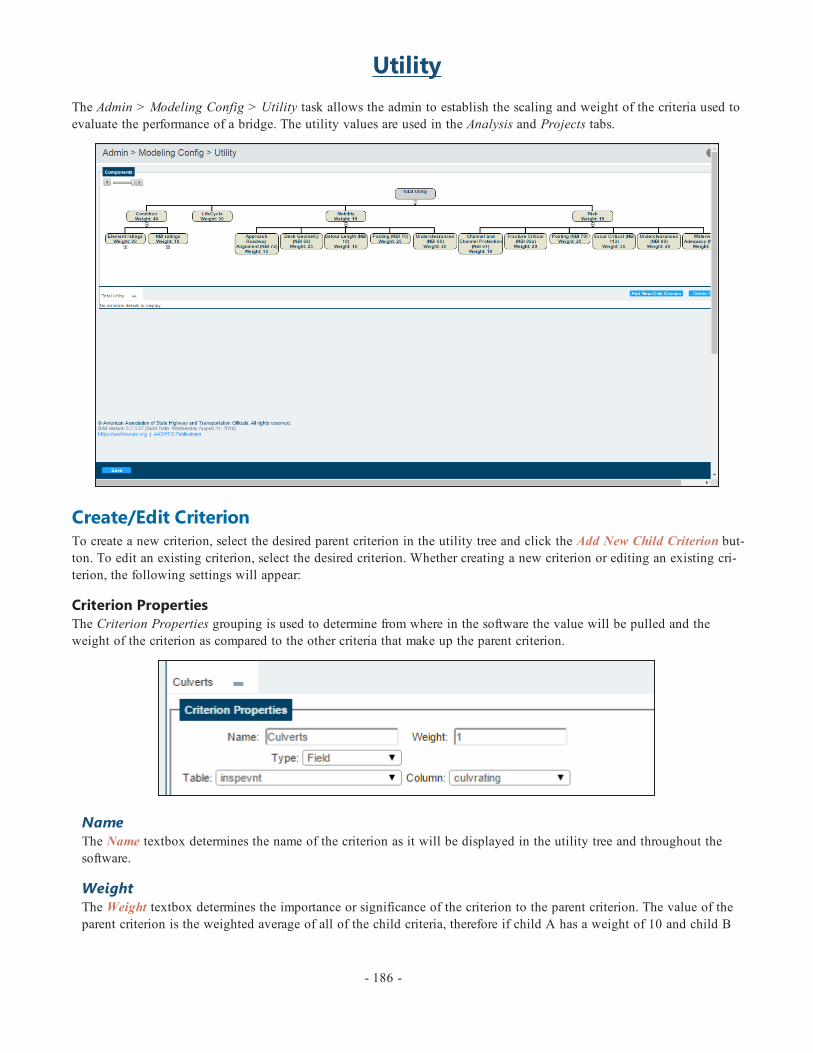
UtilityThe Admin > Modeling Config > Utility task allows the admin to establish the scaling and weight of the criteria used toevaluate the performance of a bridge. The utility values are used in the Analysis and Projects tabs.
Create/Edit CriterionTo create a new criterion, select the desired parent criterion in the utility tree and click the Add New Child Criterion but-ton. To edit an existing criterion, select the desired criterion. Whether creating a new criterion or editing an existing cri-terion, the following settings will appear:
Criterion PropertiesThe Criterion Properties grouping is used to determine from where in the software the value will be pulled and theweight of the criterion as compared to the other criteria that make up the parent criterion.
NameThe Name textbox determines the name of the criterion as it will be displayed in the utility tree and throughout thesoftware.
WeightThe Weight textbox determines the importance or significance of the criterion to the parent criterion. The value of theparent criterion is the weighted average of all of the child criteria, therefore if child A has a weight of 10 and child B
- 186 -

has a weight of 1, child A will have a much greater impact on the parent criterion's value.
TypeThe Type dropdown determines from where the base value of the criterion will come. The type can be a field, assess-ment, element, or element group. Additional controls will appear on the page based on which type is selected.
ScalingThe Scaling grouping is used to determine how the criterion will be scaled. The different types of criteria that can beadded to the utility tree have various rating systems. For instance, NBI condition ratings are 0-9, whereas element ratingsare 0-100.
The Scaling grouping uses either the scaling graph or a selected formula to map all of the criteria within a node to asingle scale. Therefore, when all of the nodes meet to make-up the Total Utility node, they will be on the same scale.
Scaling GraphTo use the Scaling Graph, select it from the Formula dropdown.
The Criterion Rating Range grouping determines the original minimum and maximum ratings for the criterion. Newpoints can be added by either clicking on the desired location of the graph or clicking the New Point button and enter-ing the desired values into the table.
If the selected type is "Field," there will also be an additional button - Calc Criterion Range - that provides a recom-mended scale breakdown based on the minimum and maximum rating range.
FormulaTo use a formula, select the desired formula from the Formula dropdown. Administrators can create custom formulason the Admin > Modeling Config > Advanced Formulas task.
- 187 -
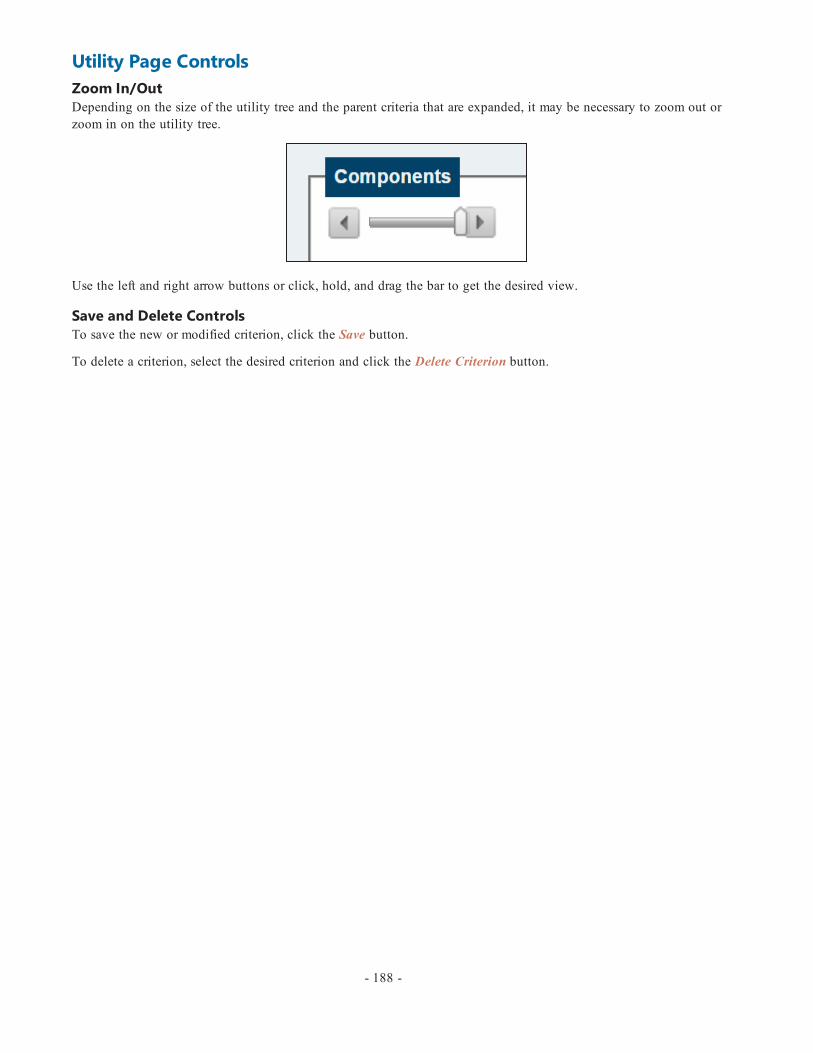
Utility Page ControlsZoom In/OutDepending on the size of the utility tree and the parent criteria that are expanded, it may be necessary to zoom out orzoom in on the utility tree.
Use the left and right arrow buttons or click, hold, and drag the bar to get the desired view.
Save and Delete ControlsTo save the new or modified criterion, click the Save button.
To delete a criterion, select the desired criterion and click the Delete Criterion button.
- 188 -

Weights ProfileThe Admin > Modeling Config > Weights Profile task is used to create new utility profiles. The profiles allow the adminto override the default utility weights determined on the Admin > Modeling Config > Utility task.
ProfilesTo create a new weights profile, select the Create New button.
If desired, use the Name textbox to establish a unique name for the weights profile.
Utility ComponentsThe Utility Components grouping contains a tree view with contents identical to the Admin > Modeling Config > Util-ity task's graphic display. When an item in the tree is selected, the Criterion's Details grouping will appear:
- 189 -

Criterion's DetailsThe Override Weight textbox allows the admin to change the weight of the selected criterion. Once changed, the dis-played "Override Sibling Total Weight" value and the override weight's percentage will change to display the updatedinformation.
The change in a criterion's utility weight will be used on the Programs > Create/Edit Program task. When a program isassigned a utility weights profile, that profile aids the optimization process in determining which projects to assign tothe program.
The Reset to Default button resets the changed value back to the default value from the Admin > Modeling Config >Utility task. The value can be reset at any time, even after the new value has been saved.
Weights Profile Page Controls
Click Create to create a new weights profile.
Click Save to save the changes made to the currently selected weights profile.
Click Cancel to cancel any changes made to the selected weights profile and refresh the page.
Click Delete to delete the selected weights profile.
- 190 -
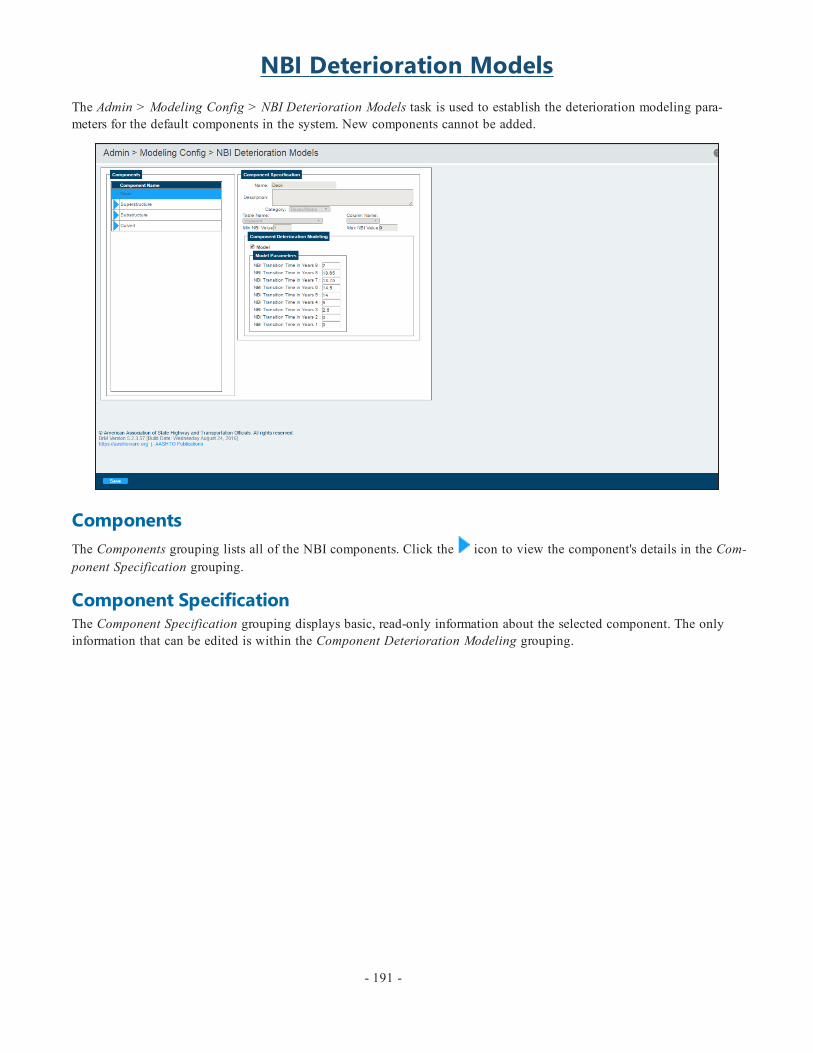
NBI Deterioration ModelsThe Admin > Modeling Config > NBI Deterioration Models task is used to establish the deterioration modeling para-meters for the default components in the system. New components cannot be added.
ComponentsThe Components grouping lists all of the NBI components. Click the icon to view the component's details in the Com-ponent Specification grouping.
Component SpecificationThe Component Specification grouping displays basic, read-only information about the selected component. The onlyinformation that can be edited is within the Component Deterioration Modeling grouping.
- 191 -

Component Deterioration Modeling
The Model checkbox indicates whether deterioration modeling is enabled for the selected component. If checked, thedeterioration modeling will reflect the transition times shown in the Model Parameters grouping. If unchecked, the trans-ition times will not be applied to the component and therefore its deterioration will not be modeled.
The Model Parameters grouping is used to determine the NBI transition time (in years) from one NBI rating to the next.
Example: If NBI transition time 9 is set to 2, the selected component is expected to deteriorate from NBI rating 9 to NBIrating 8 in 2 years.
The Save button at the bottom of the page saves the changes made to the entire subtask. Saving is not required inbetween switching NBI components.
- 192 -

NBI Conversion ProfilesThe Admin > Modeling Config > NBI Conversion Profiles task is used to create and modify the NBI profiles that canthen be used on the Inspection > Condition task. By default, BrM comes with the FHWA Profile that uses the FHWA'srecommended condition state upper limits.
NBI ProfilesThe NBI Profiles grouping lists all of the NBI profiles. Click the icon to view the profile’s details in the ProfileDetails grouping.
To create a new profile, click the Create New button at the bottom of the page.
Profile DetailsThe Profile Details grouping allows the admin to determine the upper condition state limits of each NBI rating for theoverall profile (generic) or individual components.
- 193 -

The Name textbox names the profile and will be the name visible in the NBI Converter Profile dropdown on the Inspec-tion > Condition task.
The Profile Enabled checkbox determines whether the NBI profile selected is enabled and available to select in the NBIConverter Profile on the Inspection > Condition task.
[Component] Upper LimitsThe Upper Limits grouping is used to established the maximum condition state percentages allowed for each NBI value.The tabs above the grouping indicate which component's upper limits are being modified.
*Note: Only the default components have tabs. No user-added components will have a tab.
*Note: The FHWA Profile cannot be edited and does not contain upper limits for the specific components.
The Generic tab applies the upper limits to all of the components in the profile. However, each individual componentcan override the generic upper limits if the component's tab is selected and its Group Enabled checkbox is checked.
The Method of CS Averaging dropdown determines how the component's elements will be condensed into a single NBIvalue. The options are:
l Group by Measurement Unit Type - Groups together all of the component's elements and averages their quant-ities in each condition state, then averages those unit averages into a single component average to be convertedto an NBI value.
*Note: This selection ensures that an element with a very large quantity does not overshadow and have moreinfluence than an element with a low quantity.
l Element Weighting - Averages all of the elements in a component and weights them by element weight, thenuses that value for the NBI value conversion.
- 194 -

To establish upper limits, use the Enabled checkbox within the grid to determine which NBI values (1-9) will be avail-able. If the Enabled checkbox is not checked, the component(s) will not be able to achieve that value when the NBI con-verter is run on the Inspection > Condition task.
The values entered into the CS1% through CS4% columns for each NBI value indicate the maximum percentage that canexist for that NBI value in that condition state before the grade drops down to the next NBI value.
Example: Assume the following generic upper limits are being used for all components:
In order for a bridge's component to receive an NBI rating of 8, it must be 100% in CS1. Similarly, in order for a bridge'scomponent to receive an NBI rating of 3, it must be 100% in CS4.
If a bridge contains Element 12 - Re Concrete Deck with 85% in CS1 and 15% in CS2, the deck component will receivean NBI rating of 7. This is because CS1 is not 100%, so the bridge cannot receive a rating of 8. CS2 is within the 20%maximum, so the bridge cannot receive a rating of 6. Therefore, the bridge receives a rating of 7.
As the bridge deteriorates, Element 12's condition becomes 70% CS1, 25% CS2, and 5% CS3. CS2 is now over the 20%maximum, so the bridge cannot receive a rating of 7. CS3 is at the 5% maximum but not over it, so the bridge cannotreceive a rating of 5. Therefore, the new rating for the bridge's deck component is 6.
Conversion Profiles Page Controls
The Create New button creates a new NBI profile.
The Save button saves the changes made to the entire subtask. Saving is not required in between switching NBI profiles.
The Delete button deletes the selected NBI profile. The Delete button is not present when default NBI profiles are selec-ted because they cannot be deleted.
The Copy button makes a copy of the currently selected NBI profile and all of its details.
- 195 -

Preservation and Replacement PolicyThe Admin > Modeling Config > Preservation and Replacement Policy task is used to create the life-cycle cost analysis(LCCA) policies and add rules to them. These policies are used by the LCCA to determine preservation actions.
The Create New button creates a new policy.
The Policy dropdown is used to select an existing policy to edit.
The Copy>> button copies the selected policy. This will reveal the Copy Name textbox. Enter a name and click theCopy button to complete the copy, or click the << button to cancel the copy.
Create New PolicyClick the Create New button to create a new policy:
Policy DetailsThe Policy Details grouping allows the admin to establish the basic information for the policy.
The Name textbox determines the name for the policy that will be used when attaching the policy to a bridge.
- 196 -
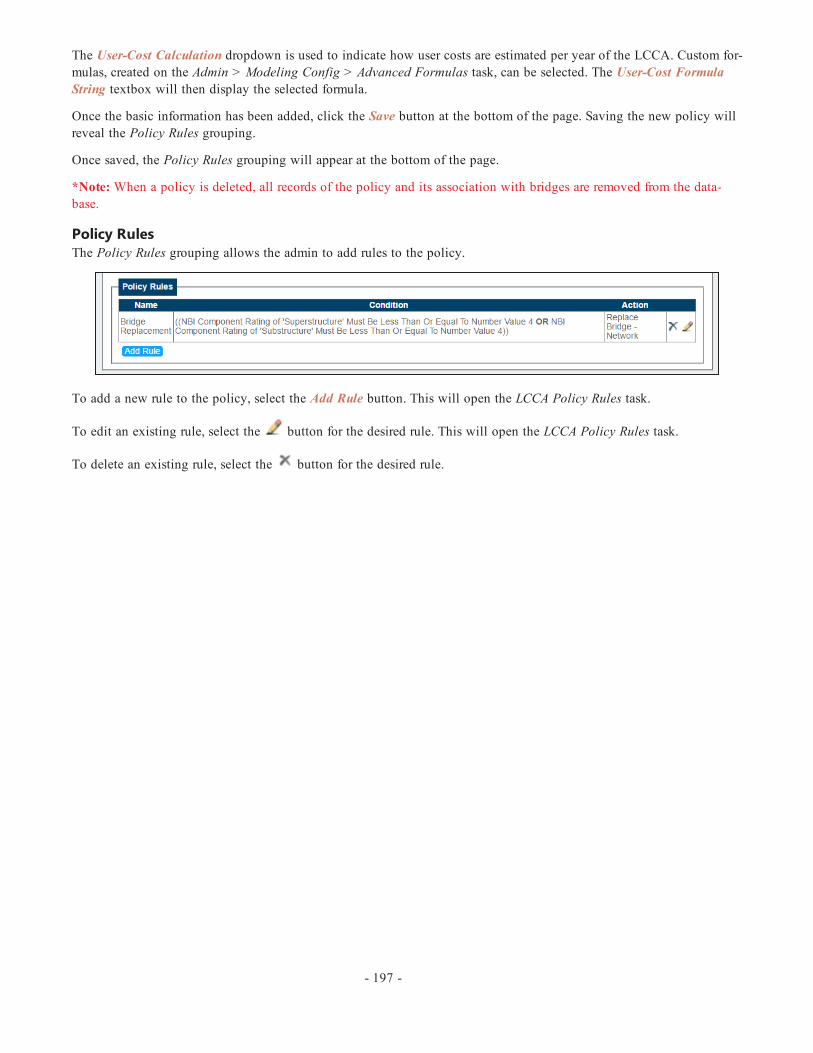
The User-Cost Calculation dropdown is used to indicate how user costs are estimated per year of the LCCA. Custom for-mulas, created on the Admin > Modeling Config > Advanced Formulas task, can be selected. The User-Cost FormulaString textbox will then display the selected formula.
Once the basic information has been added, click the Save button at the bottom of the page. Saving the new policy willreveal the Policy Rules grouping.
Once saved, the Policy Rules grouping will appear at the bottom of the page.
*Note:When a policy is deleted, all records of the policy and its association with bridges are removed from the data-base.
Policy RulesThe Policy Rules grouping allows the admin to add rules to the policy.
To add a new rule to the policy, select the Add Rule button. This will open the LCCA Policy Rules task.
To edit an existing rule, select the button for the desired rule. This will open the LCCA Policy Rules task.
To delete an existing rule, select the button for the desired rule.
- 197 -

LCCA Policy RulesThe Admin > Modeling Config > LCCA Policy Rules task is very similar to the Equation Editor task. The specific con-ditions for the LCCA policy rule are established here.
The Policy and Rule dropdowns are used to select which policy rule to edit.
The Create New button creates a new policy.
Rule DetailsIn the Rule Details grouping, use the Name textbox to name the new rule.
The Resulting Action dropdown determines what action will take effect if the conditions established in the Rule Buildergrouping are met during the LCCA process.
Example: The admin may select "Replace" as the resulting action and establish an element health index condition: 12 -Re Concrete Deck must be Equal To value "1" in the rule builder.
So, when the policy is linked to a bridge and that bridge has an LCCA performed, the LCCA will replace the deck anytime the deck's health index reaches "1."
Rule SummaryThe Summary grouping displays an English representation of the rule. This can be useful in helping the admin under-stand exactly what criteria are established in the rule.
Establish New Policy RuleConditions are the individual rules that make up the overall policy rule.
Groups are containers for multiple related conditions. Groups can exist within other groups.
Click the Add Condition button to begin creating the policy rule. Click the Add Group button if more than one con-dition will be grouped together. The following screenshots display a lone condition and conditions within a group.
- 198 -

Use the Type dropdown to establish the equation to use for the rule:
Type Description
Is Null Equations indicating whether or not the condition has a value.
Bridge HealthIndex Equations indicating the value of the bridge health index.
Element HealthIndex Equations indicating the value of the element health index.
Category HealthIndex Equations indicating the value of the category health index.
Material HealthIndex Equations indicating the value of the material health index.
Type Health Index Equations indicating the value of the type health index.
NBI ComponentRating Equations indicating the value of the NBI component rating.
Repeat (in years) Equations indicating the repeat frequency.
Element ConditionState Equations indicating the value of a percentage of an element condition state.
The available controls will be dependent on the selection made from the Type dropdown. The following screenshotsindicate the control possibilities based on the selection made in the Type dropdown:
*Note: Screenshots for Type dropdown selections - "Category Health Index," "Material Health Index," "Type HealthIndex," and "NBI Component Rating" - have been excluded because the controls (not the selections within the controls)are identical to "Element Health Index."
- 199 -
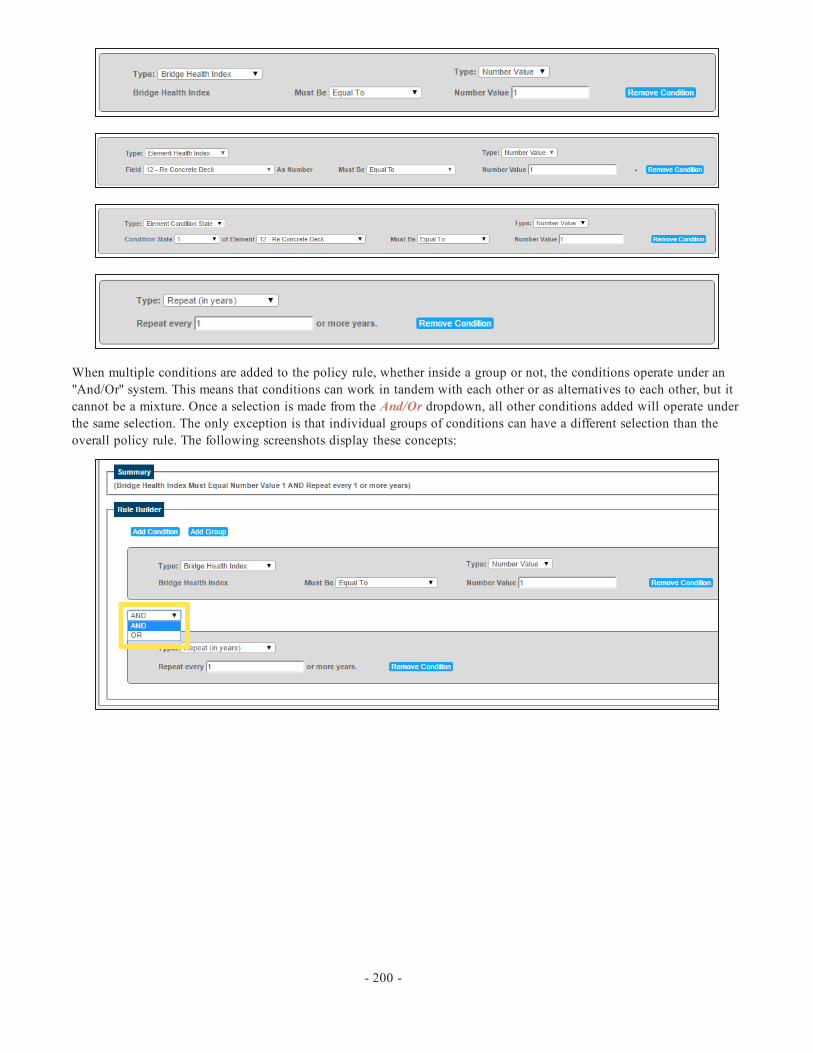
When multiple conditions are added to the policy rule, whether inside a group or not, the conditions operate under an"And/Or" system. This means that conditions can work in tandem with each other or as alternatives to each other, but itcannot be a mixture. Once a selection is made from the And/Or dropdown, all other conditions added will operate underthe same selection. The only exception is that individual groups of conditions can have a different selection than theoverall policy rule. The following screenshots display these concepts:
- 200 -

To remove a condition, click the Remove Condition button for the desired condition.
To remove a group, click the Remove Group button for the desired group. All conditions within the group will also beremoved.
Policy Rule Page ControlsOnce the desired selections have been made, click the Save button at the bottom of the screen to save the policy rule.
Click the Delete button to delete the selected policy rule.
- 201 -

LCCA Assign PoliciesThe Admin > Modeling Config > LCCA Assign Policies task allows the admin to attach the LCCA policies to bridgesand/or components within the system. This link can then be analyzed on the Analysis > LCCA task.
Only bridges that are currently selected on the Bridge List will appear in the grid. If no bridges are present in the grid,no bridges are selected on the Bridge List.
There are multiple ways of assigning policies to the bridges and components:
1. Each bridge row in the grid has a Policy dropdown for each of the policy columns in the grid. Each of thebridge's Policy dropdowns can be used to determine what policy will be used for the overall bridge or specificcomponent.
*Note: Any policy can be selected for any component. For example, the Deck Policy does not have to beassigned to the Deck Component column.
2. Check the boxes of all of the bridges in the grid that will have the same policy for a specific column, then selectthat policy from the Column Header Policy dropdown for the desired column. Click the Assign to Selected but-ton to link all of the selected bridges to the selected policy for that column.
3. If all of the bridges in the grid will have the same policy for a specific column, select that policy from theColumn Header Policy dropdown for the desired column and click the Assign to All button to link all of thebridges in the grid to the selected policy for that column.
Use the Save button at the bottom of the page to save any changes to the assignments.
- 202 -

Subdivision ProfilesThe Admin > Modeling Config > Subdivision Profiles task is used to create and define subdivision profiles that can beused on the Programs > Create/Edit Programs task. A subdivision profile is a list of database fields that are used to sub-divide a program into segments. Throughout the Program tab, program segments can have their own performance con-straints and optimization run separate from the rest of the program.
Use the Subdivision Profile dropdown to switch between the existing subdivision profiles.
Select the Create New button to create a new subdivision profile:
Subdivision Profile DetailsUse the Name textbox to provide a unique name for the subdivision profile. This is the name that will appear in the Sub-division Profile dropdown on the Programs > Create/Edit Programs task.
- 203 -

*Note:When a subdivision profile is linked to a program on the Programs > Create/Edit Programs task, it will becomeread-only on the Admin > Modeling Config > Subdivision Profiles subtask. Only subdivision profiles not currentlylinked to a program can be edited.
Mapped FieldsThe Mapped Fields grouping allows the admin to add up to five fields to the subdivision profile. Locate the desiredfield using the Table and Field dropdowns, then click the Add button to add the field to the subdivision profile.
The field will then appear in the Mapped Fields grid. It can be removed by clicking the field's symbol.
*Note: If five fields have been mapped to the subdivision profile, the Table and Field dropdowns and the Add buttonwill disappear and will not return unless one of the five currently mapped fields is deleted from the subdivision profile.
Subdivision Profile Page ControlsUse the Save button to save the changes made to the selected subdivision profile.
Use the Delete button to delete the selected subdivision profile.
*Note: The Save and Delete controls become unavailable if the selected subdivision profile is mapped to a program.
- 204 -
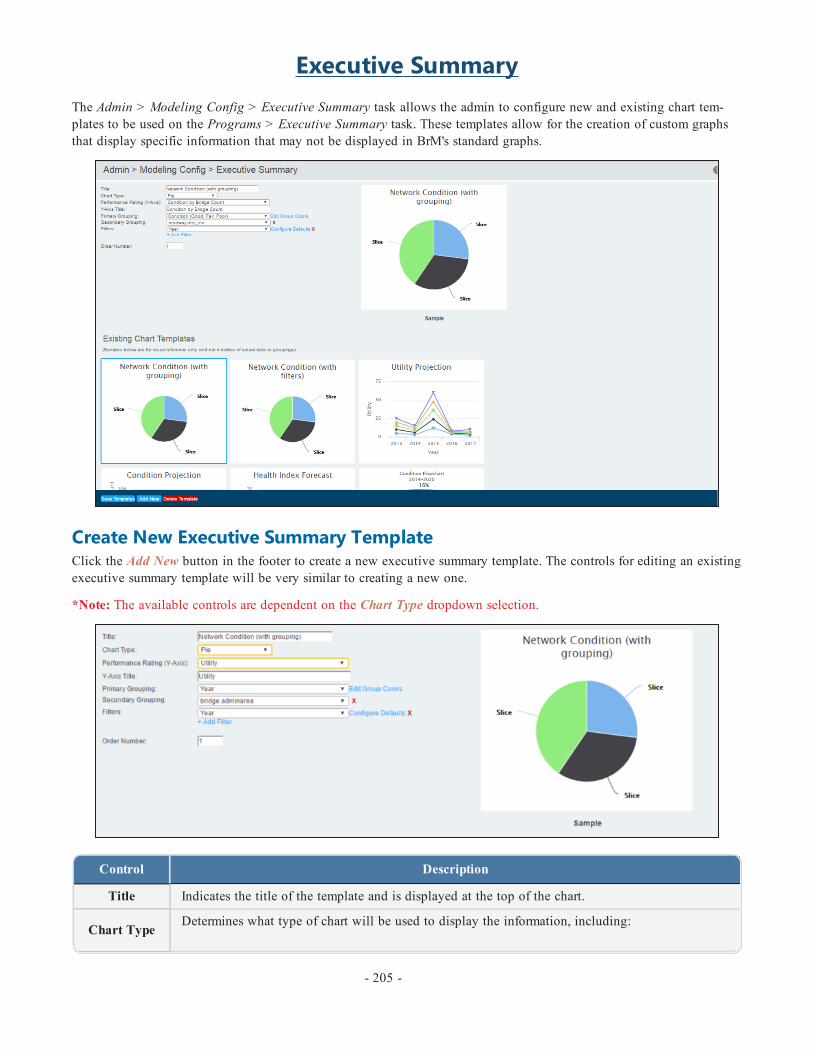
Executive SummaryThe Admin > Modeling Config > Executive Summary task allows the admin to configure new and existing chart tem-plates to be used on the Programs > Executive Summary task. These templates allow for the creation of custom graphsthat display specific information that may not be displayed in BrM's standard graphs.
Create New Executive Summary TemplateClick the Add New button in the footer to create a new executive summary template. The controls for editing an existingexecutive summary template will be very similar to creating a new one.
*Note: The available controls are dependent on the Chart Type dropdown selection.
Control Description
Title Indicates the title of the template and is displayed at the top of the chart.
Chart TypeDetermines what type of chart will be used to display the information, including:
- 205 -

Control Description
Bar, Column, Line, Pie, Stacked Column, Condition Flowchart
PerformanceRating (Y-
Axis)Determines the performance rating on the Y-axis that will be plotted against the X-axis.
Y-Axis Title The title displayed on the Y-axis.
X-Axis Field Determines the field on the X-axis that will be plotted against the Y-axis. The available fields aredependent upon the Y-axis selection.
X-Axis Title The title displayed on the X-axis.
Groupings
Groupings are applicable to bar, column, line and pie graphs. They separate the data into segmentsbased on a database field.
Example: On a line graph, the roadway.NHS_IND field grouping would have a line for NHSbridges and a line for non-NHS bridges.
The individual items within the grouping can then have their colors set using the Edit Group Col-ors link.
*Note: Pie charts allow for a secondary grouping to be included.
Filters
Filters are the specific pools of data used for the templates. They are the parameters that can beused to change what information the user sees on the graph. For example, a common filter will be"Year."
*Note: Multiple filters can be added for each chart type.
Order Num-ber Determines where the template appears in the list of selectable executive summary templates.
While creating a new template is always an option, BrM has six default Executive Summary templates that can be used,including:
Executive Summary Default Templates
Title Type Y-Axis X-Axis PrimaryGrouping
SecondaryGrouping Filter
NetworkCondition(with group-ing)
PieConditionby BridgeCount
N/A Condition roadway.nhs_ind Year
NetworkCondition(with filters)
PieConditionby BridgeCount
N/A Condition None Year, road-way.nhs_ind
Utility Pro-jection Line Utility Year roadway.nhs N/A None
Condition Pro-jection
StackedColumn
Conditionby BridgeCount
Year N/A N/A None
Health Index Column Health roadway.nhs_ Year N/A None
- 206 -
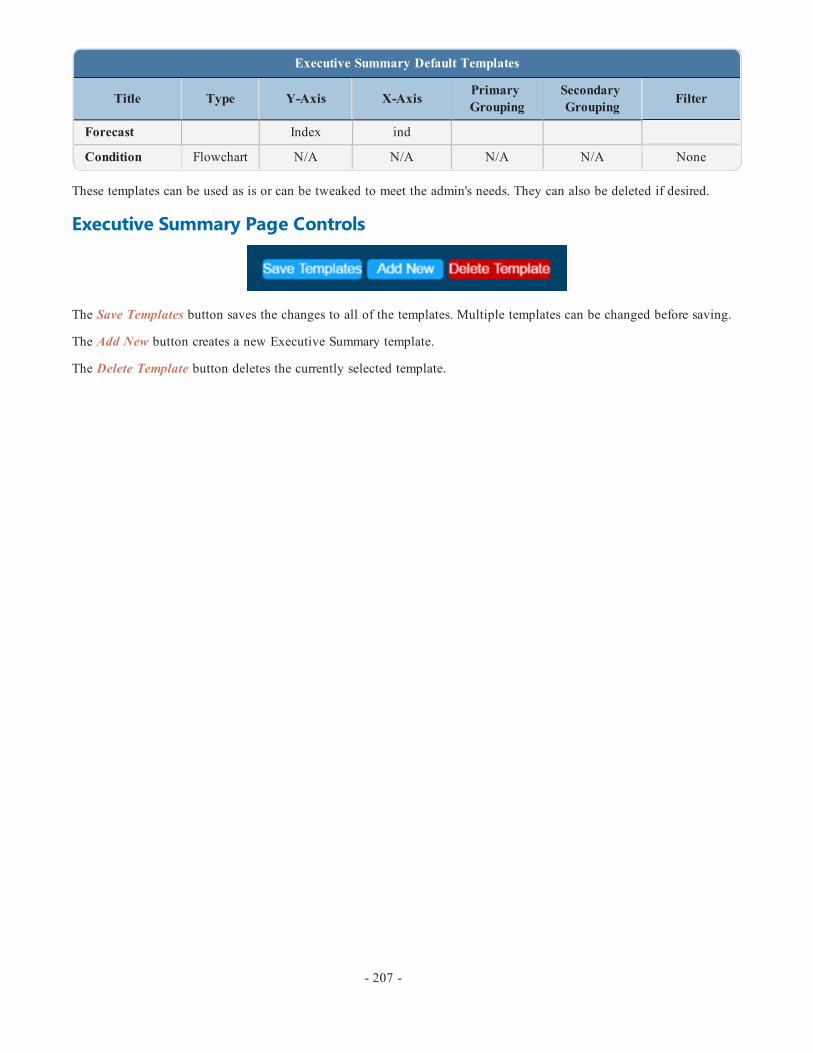
Executive Summary Default Templates
Title Type Y-Axis X-Axis PrimaryGrouping
SecondaryGrouping Filter
Forecast Index ind
Condition Flowchart N/A N/A N/A N/A None
These templates can be used as is or can be tweaked to meet the admin's needs. They can also be deleted if desired.
Executive Summary Page Controls
The Save Templates button saves the changes to all of the templates. Multiple templates can be changed before saving.
The Add New button creates a new Executive Summary template.
The Delete Template button deletes the currently selected template.
- 207 -

Asset Element DefinitionsThe Admin > Tunnels > Asset Element Definitions task is used to create tunnel elements and define the specifications forexisting tunnel elements.
ElementsThe Elements grouping contains the Element list. In order to view and edit an element's specifications, it must be selec-
ted from the Element list. To select an element, click the symbol. The selected element's information will then appearin the Element Details grouping.
The Filter dropdown can be used to filter the Element list based on a specific tunnel element category.
Elements that have been marked as National Tunnel Inspection Standards (NTIS) elements in the Element Details group-ing cannot be edited or deleted unless the NTIS element status is removed.
If the element has an next to the in the Element list, the element is not an NTIS element and can be edited anddeleted freely.
Create or Copy ElementThe Create New button creates a new element with blank specifications that must be completed.
The Copy>> button creates a copy of the currently selected element with matching specifications other than the ElementKey, Short Name, and Long Name. Clicking the Copy>> button reveals the Copy Name textbox. Enter a name and clickthe Copy button to complete the copy, or click the << button to cancel the copy.
By default, the ID column (element key) progresses in sequential order. Therefore, if the element list's last element has anelement key of 1000, a newly created or copied element will have an element key of 1001. The key can be changedonce created, but only one element key is permitted per number.
- 208 -
Tunnels

Element DetailsThe Element Details grouping includes the specifications of the selected element and allows the admin to add referencemanuals to the element.
Element Rollup KeyThe Element Rollup Key dropdown is used for non-NTIS elements. Information for non-NTIS elements can be "rolledup" into the NTIS elements. Therefore, the currently selected element's information will be included in the reports of theNTIS element selected from the dropdown.
When an NTIS element is selected from the Element list, the Element Rollup Key dropdown is read only.
Element Key and NameThe Element Key textbox is the element's ID. The element can be any number as long as it is unique.
The Short Name and Long Name textboxes provide a description of the element. NTIS element short and long namescannot be edited and are greyed out and inaccessible.
NotesThe Notes textbox can be used to enter a description of the element. This is particularly useful when creating new ele-ments that may not be universally recognized by their short and long names.
UnitsThe Units dropdown determines how the element is measured. NTIS element units are read only.
ManualA PDF can be added to any element as reference material for the users. To add a PDF, click the Choose File button andlocate the desired file. Once selected, click the Upload button to add the PDF to the element.
*Note:When upgrading to a new version of BrM, previously uploaded custom agency element manuals will be lost dur-ing the uninstall of the old version. In order to ensure the manuals are maintained and added into the new version, theElemGuideManuals subdirectory must be copied prior to uninstalling the old version. Then, after installing the new ver-sion, the ElemGuideManuals subdirectory can be returned to its folder location.When completing this process, onlycopy over the custom agency element files. The new install of BrM will contain the latest manuals for the standardelements.
ClassificationsThe Classifications grouping is used to classify the selected element. The classifications of NTIS elements cannot beedited.
- 209 -

Use the Category, Material, and Type dropdowns to classify the element.
Element Spec Page ControlsClick the Save button to save the changes made to the selected element.
Click the Revert button to cancel the changes made to the selected element.
- 210 -

Asset Element-Child LinkingThe Admin > Tunnels > Asset Element-Child Linking task is used to link tunnel elements, defects, and protective sys-tems. The elements must be linked together in order to be used together throughout the software.
Assigning Element RelationshipsThe Assign dropdown is the key to the element relationships. When a selection is made using the Assign dropdown, thelinks are for that type of element only.
Elements can have:
l Protective Systems (children)l Defects (children)
Protective Systems can have:
l Elements (parents)l Defects (children)
Defects can have:
l Elements (parents)l Protective Systems (parents)
Asset Element-Child Linking Page ControlsClick the Save button to save the changes made to the assigned element.
- 211 -
Inspection- The Inspection section of the manualaddresses each of the tasks in BrM's Inspectiontab. The Inspection tab allows for the creationand management of inspections, workcandidates, assessments, and more for aselected structure.

The Inspection > Condition task allows the user to manage both the NBI condition ratings and the individual elementconditions for a specific inspection report.
The Bridge dropdown allows the user to select a bridge to be inspected.
The Inspection dropdown allows the user to select the inspection to be modified.
The Metric/English radio buttons switch between metric and English units on the page.
Condition RatingsThe Condition Ratings grouping is used to determine the NBI condition ratings, perform a validation of the selectedbridge, and calculate the bridge's sufficiency rating.
There are two ways of setting the bridge's NBI condition ratings. One is to manually complete each of the NBI sub-mission item (NBI numbers are in red parentheses) dropdowns - Deck, Superstructure, Substructure, etc. The othermethod is to use the NBI Converter Profile as discussed below.
- 213 -
Condition

ValidateThe Validate button takes the user to the Bridges > Validate task to find FHWA discrepancies with the selected bridge.
Sufficiency RatingThe Calculate SR button takes the user to the Bridges > Suff Rate task to calculate the selected bridge's sufficiency rat-ing.
NBI Converter ProfileAn alternative option to the user manually determining the NBI component ratings is to use the NBI Converter Profiledropdown to estimate the NBI component ratings based on the bridge's element ratings. The NBI Converter Profile drop-down uses the NBI profiles created on the Admin > Modeling Config > NBI Conversion Profiles subtask. Once a selec-tion is made, click the Calculate NBI button to view the results of the calculation:
The table shows the original NBI component ratings (the current ratings) and the converted NBI component ratings. Toaccept the conversion of any of the NBI components, select the desired components' checkboxes and then click theAccept button. To cancel and not accept any of the conversions, click the Cancel button.
*Note: The NBI Converter Profile dropdown and Calculate NBI button are unavailable when the inspection status islocked, under review, or archived.
Element ConditionsThe Element Conditions grouping is used to select which elements will be included in the inspection and then determ-ine the condition states of each element.
- 214 -

Structure UnitThe Structure Unit dropdown is used to select which structure unit's elements to view in the Bridge Elements grid. If"All Structures" is selected, the elements from all of the structure units will be visible in the grid. If a specific structureunit is selected, only that structure unit's elements will be visible.
*Note: If an element is expected to be visible in the Bridge Elements grid but is not, the element may have beenassigned the wrong structure unit. View the Bridge Elements grid with the other structure units selected to find the ele-ment in question, select it, and then click the Edit Element button to change its structure unit.
Show Last CoRe InspectionThe Show Last CoRe Insp button allows the user to view the last inspection for the selected bridge that used the CoReinspection that contained a five quantity condition state rating. If an inspection is available, it will appear in a pop-upwindow and be read-only.
AASHTO Bridge Elements gridThe Bridge Elements grid contains all of the elements included in the inspection of the selected bridge (filtered based onstructure type with the Select Structure Unit dropdown). For a new structure that has not had a previous inspection therewill be no pre-existing elements and all of the desired elements will need to be added. For structures that have pre-exist-ing inspections, the information from the most recent inspection will automatically be loaded into the new inspection.
- 215 -
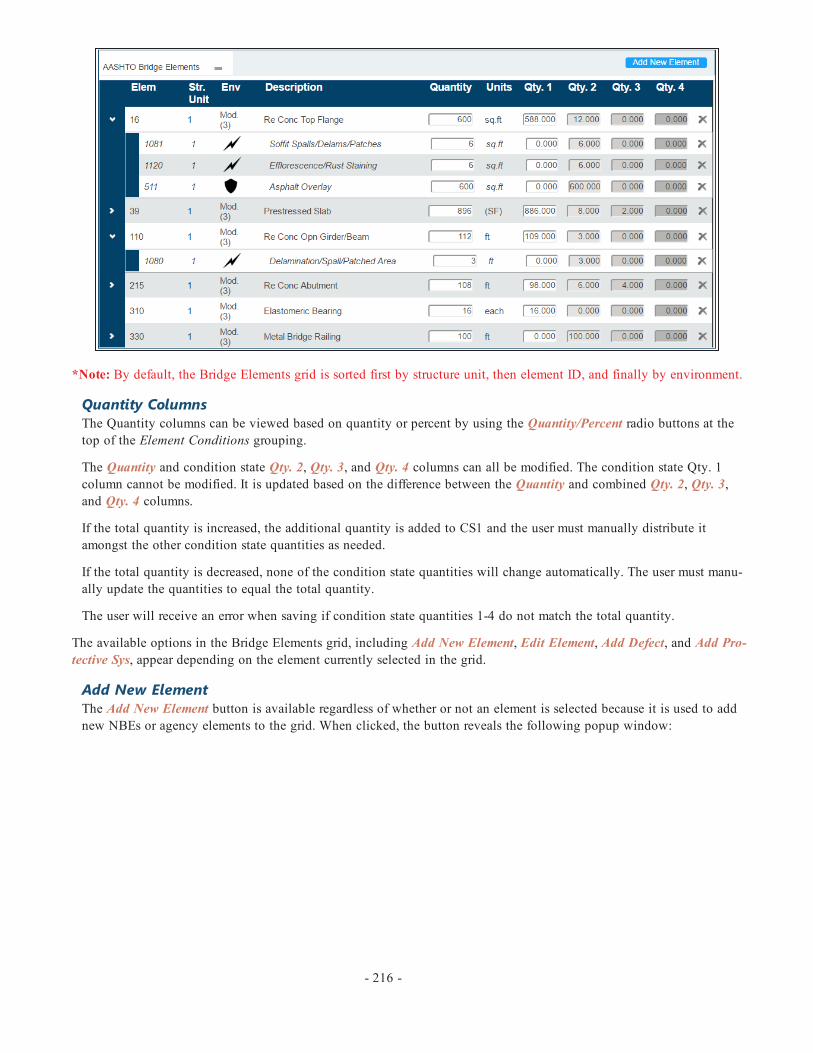
*Note: By default, the Bridge Elements grid is sorted first by structure unit, then element ID, and finally by environment.
Quantity ColumnsThe Quantity columns can be viewed based on quantity or percent by using the Quantity/Percent radio buttons at thetop of the Element Conditions grouping.
The Quantity and condition state Qty. 2, Qty. 3, and Qty. 4 columns can all be modified. The condition state Qty. 1column cannot be modified. It is updated based on the difference between the Quantity and combined Qty. 2, Qty. 3,and Qty. 4 columns.
If the total quantity is increased, the additional quantity is added to CS1 and the user must manually distribute itamongst the other condition state quantities as needed.
If the total quantity is decreased, none of the condition state quantities will change automatically. The user must manu-ally update the quantities to equal the total quantity.
The user will receive an error when saving if condition state quantities 1-4 do not match the total quantity.
The available options in the Bridge Elements grid, including Add New Element, Edit Element, Add Defect, and Add Pro-tective Sys, appear depending on the element currently selected in the grid.
Add New ElementThe Add New Element button is available regardless of whether or not an element is selected because it is used to addnew NBEs or agency elements to the grid. When clicked, the button reveals the following popup window:
- 216 -

Complete the Element ID, Structure Unit, and Environment dropdown selections.
*Note:When adding a new element, the Structure Unit dropdown will always default to the agency's default structureunit regardless of what structure unit is selected for the Bridge Elements grid on the Inspection > Condition main page.If the user is expecting the new element to appear in the Bridge Elements grid for the selected structure unit, they mustensure that the selection in the Structure Unit dropdown matches what is selected for the Bridge Elements grid.
QuantityThe Quantity field determines the total quantity of the element. This can be changed in the Bridge Elements gridonce the element is added.
Add and Cancel ControlsClick Add to add the element to the Bridge Elements grid.
Click Cancel to cancel the element addition and return to the Bridge Elements grid.
Edit ElementThe Edit Element button is available when an element is selected, including defects and protective systems. Click theEdit Element button to reveal the same popup as the Add New Element button:
- 217 -

The only field that cannot be edited is the Element ID dropdown.
If the Structure Unit dropdown is changed, the element will no longer appear in the Bridge Elements grid for the selec-ted structure unit (unless "All Structures" is selected).
If the parent element is selected and either the structure unit or the environment is changed, the parent element willremain linked with its relative defect and protective system elements to ensure that the child elements are not orphanedby the change.
If the defect or protective system is selected and the either the structure unit or environment is changed, an error willappear and the change will not be applied. The only way to avoid this error is for the selected structure unit and envir-onment to match an existing applicable parent element, at which point the Parent Element dropdown will reappearand the change can be applied. However, this change would not be recommended unless it was preconceived.
Add Defect and Protective SystemThe Add Defect and Add Protective Sys buttons become available when an element is selected. The Add Defect buttonis also available when a protective system is selected.
When clicked, the buttons reveal the same popup as the Add New Element and Edit Element buttons:
- 218 -

Complete the Element ID, Structure Unit, and Environment dropdown selections.
*Note: Only elements that have been linked to the currently selected element in the Admin > Modeling Config > Ele-ment-Child Linking subtask will appear in the Element ID dropdown.
Once a selection is made in the Element ID dropdown, the Parent Element and Grandparent Element (if applicable)dropdowns will appear above it. The currently selected element will be the parent element, but this can be changed.
*Note: Only certain elements will appear in the Parent Element dropdown. In order for an element to appear in theParent Element dropdown, it must meet the following criteria (the same rules apply for the grandparent > parent rela-tionship):
1. The parent element must be linked to the defect or protective system (as applicable) selected in the Element IDdropdown in the Admin > Modeling Config > Element-Child Linking subtask.
2. The parent element must exist under the selected structure unit.3. The parent element must exist under the selected environment.
If the desired element does not meet all three qualifications, it will not appear in the Parent Element dropdown.
The remaining selections operate in the same way as the Add New Element button.
- 219 -

Highlighted OrphanA highlighted orphan is a protective system or defect that is displayed in the Bridge Elements grid but is not con-nected to a specific element:
Highlighted orphans can occur for various reasons. The most common scenarios that cause highlighted orphans will belisted below. When attempting to resolve a highlighted orphan, users can select the orphan from the grid and click theEdit Element button to reveal the message container with an error explaining why the defect/protective system is ahighlighted orphan:
1. Lack of element-child link - A highlighted orphan can occur if the defect/protective system is not linked to the ele-ment on the Admin > Modeling Config > Element-Child Linking task. The admin should be notified of this issue sothat they can fix the link.
2. Correct element, incorrect defect/protective system - If after selecting the highlighted orphan and clicking the EditElement button the user sees that the element-child link contains the correct element but the incorrect defect/protectivesystem, the user can use the Element ID dropdown to select the correct defect/protective system. All of the selectionsin the dropdown, aside from the incorrect orphan, are linked to the element and can be selected to remove the high-lighted orphan status.
- 220 -
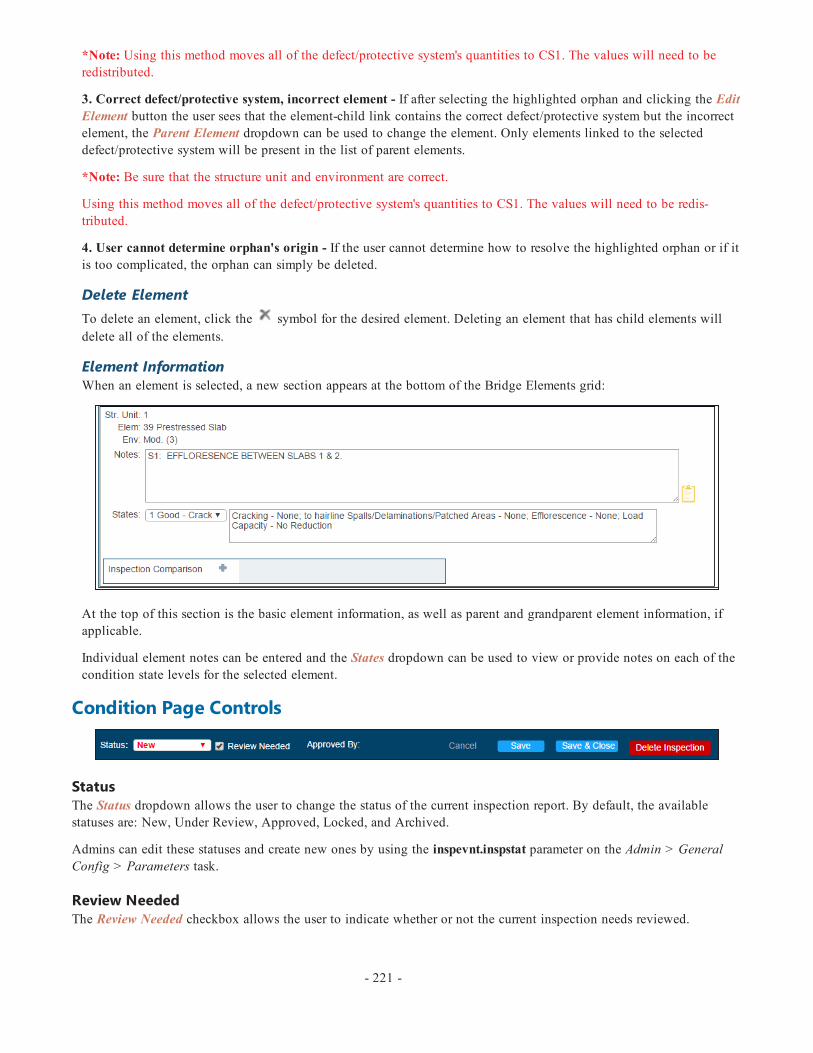
*Note: Using this method moves all of the defect/protective system's quantities to CS1. The values will need to beredistributed.
3. Correct defect/protective system, incorrect element - If after selecting the highlighted orphan and clicking the EditElement button the user sees that the element-child link contains the correct defect/protective system but the incorrectelement, the Parent Element dropdown can be used to change the element. Only elements linked to the selecteddefect/protective system will be present in the list of parent elements.
*Note: Be sure that the structure unit and environment are correct.
Using this method moves all of the defect/protective system's quantities to CS1. The values will need to be redis-tributed.
4. User cannot determine orphan's origin - If the user cannot determine how to resolve the highlighted orphan or if itis too complicated, the orphan can simply be deleted.
Delete ElementTo delete an element, click the symbol for the desired element. Deleting an element that has child elements willdelete all of the elements.
Element InformationWhen an element is selected, a new section appears at the bottom of the Bridge Elements grid:
At the top of this section is the basic element information, as well as parent and grandparent element information, ifapplicable.
Individual element notes can be entered and the States dropdown can be used to view or provide notes on each of thecondition state levels for the selected element.
Condition Page Controls
StatusThe Status dropdown allows the user to change the status of the current inspection report. By default, the availablestatuses are: New, Under Review, Approved, Locked, and Archived.
Admins can edit these statuses and create new ones by using the inspevnt.inspstat parameter on the Admin > GeneralConfig > Parameters task.
Review NeededThe Review Needed checkbox allows the user to indicate whether or not the current inspection needs reviewed.
- 221 -
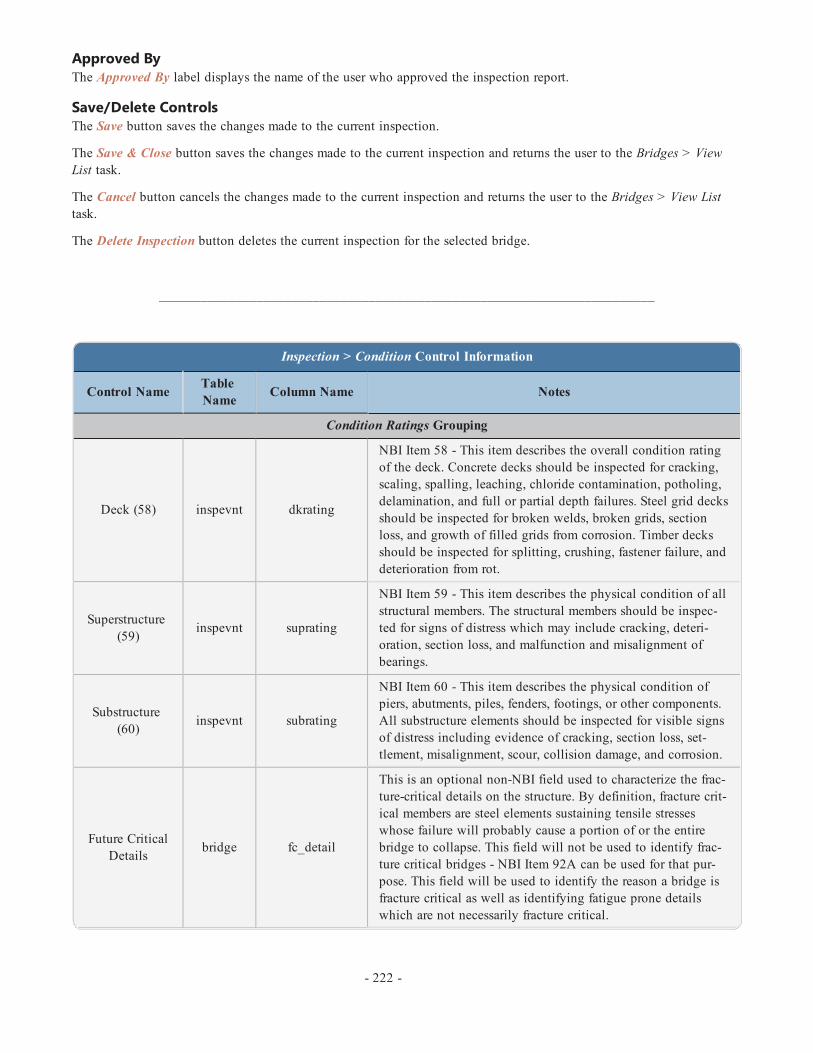
Approved ByThe Approved By label displays the name of the user who approved the inspection report.
Save/Delete ControlsThe Save button saves the changes made to the current inspection.
The Save & Close button saves the changes made to the current inspection and returns the user to the Bridges > ViewList task.
The Cancel button cancels the changes made to the current inspection and returns the user to the Bridges > View Listtask.
The Delete Inspection button deletes the current inspection for the selected bridge.
_______________________________________________________________________
Inspection > Condition Control Information
Control Name TableName Column Name Notes
Condition Ratings Grouping
Deck (58) inspevnt dkrating
NBI Item 58 - This item describes the overall condition ratingof the deck. Concrete decks should be inspected for cracking,scaling, spalling, leaching, chloride contamination, potholing,delamination, and full or partial depth failures. Steel grid decksshould be inspected for broken welds, broken grids, sectionloss, and growth of filled grids from corrosion. Timber decksshould be inspected for splitting, crushing, fastener failure, anddeterioration from rot.
Superstructure(59) inspevnt suprating
NBI Item 59 - This item describes the physical condition of allstructural members. The structural members should be inspec-ted for signs of distress which may include cracking, deteri-oration, section loss, and malfunction and misalignment ofbearings.
Substructure(60) inspevnt subrating
NBI Item 60 - This item describes the physical condition ofpiers, abutments, piles, fenders, footings, or other components.All substructure elements should be inspected for visible signsof distress including evidence of cracking, section loss, set-tlement, misalignment, scour, collision damage, and corrosion.
Future CriticalDetails bridge fc_detail
This is an optional non-NBI field used to characterize the frac-ture-critical details on the structure. By definition, fracture crit-ical members are steel elements sustaining tensile stresseswhose failure will probably cause a portion of or the entirebridge to collapse. This field will not be used to identify frac-ture critical bridges - NBI Item 92A can be used for that pur-pose. This field will be used to identify the reason a bridge isfracture critical as well as identifying fatigue prone detailswhich are not necessarily fracture critical.
- 222 -

Inspection > Condition Control Information
Control Name TableName Column Name Notes
Channel (61) inspevnt chanrating
NBI Item 61 - This item describes the physical conditions asso-ciated with the flow of water through the bridge such as streamstability and the condition of the channel, riprap, slope pro-tection, or stream control devices including spur dikes.
Culvert (62) inspevnt culvrating
NBI Item 62 - This item evaluates alignment, settlement, joints,structural condition, scour, and other items associated with cul-verts. The rating code is intended to be overall condition eval-uation of the culvert. Integral wingwalls to first construction orexpansion joint shall be included in evaluation. NBI Items 58,59, and 60 shall be coded N for all culverts.
Waterway (71) inspevnt wateradeqNBI Item 71 - This item appraises the waterway opening withrespect to passage of flow through the bridge. Site conditionsmay warrant somewhat higher or lower ratings.
UnrepairedSpalls inspevnt deckdistr The actual distressed deck area in square meters. Non-NBI
field.
Bridge Elements Grid
QuantityPON_ELEM_INSP
ELEM_QUANTITY The total quantity of the selected element.
Qty. 1PON_ELEM_INSP
ELEM_QTYSTATE1
The quantity of the selected element that is in condition state1.
Qty. 2PON_ELEM_INSP
ELEM_QTYSTATE2
The quantity of the selected element that is in condition state2.
Qty. 3PON_ELEM_INSP
ELEM_QTYSTATE3
The quantity of the selected element that is in condition state3.
Qty. 4PON_ELEM_INSP
ELEM_QTYSTATE4
The quantity of the selected element that is in condition state4.
Pct. 1PON_ELEM_INSP
ELEM_PCTSTATE1
The percentage of the selected element that is in conditionstate 1.
Pct. 2PON_ELEM_INSP
ELEM_PCTSTATE2
The percentage of the selected element that is in conditionstate 2.
Pct. 3PON_ELEM_INSP
ELEM_PCTSTATE3
The percentage of the selected element that is in conditionstate 3.
Pct. 4PON_ELEM_
ELEM_PCTSTATE4
The percentage of the selected element that is in conditionstate 4.
- 223 -

Inspection > Condition Control Information
Control Name TableName Column Name Notes
INSP
Add Element Popup
GrandparentElement
PON_ELEM_INSP
PARENT_PON_ELEM_INSP_GD
The grandparent element exists when there is an element witha protective system and that protective system has a defect.Therefore, element > protective system > defect.
*Note:While the grandparent is shown, there is no longer adatabase field for it. So, in the element > protective system >defect family, the grandparent only exists in the database asthe parent of the protective system and not as the grandparentof the defect.
Parent ElementPON_ELEM_INSP
PARENT_PON_ELEM_INSP_GD
The parent element can be either an element with a protectivesystem or defect, or a protective system in the element > pro-tective system > defect hierarchy.
Element IDPON_ELEM_INSP
PON_ELEM_DEFS_GD The element currently selected.
Structure UnitPON_ELEM_INSP
STRUCTURE_UNIT_GD
Determines to which structure unit within the bridge that theelement belongs.
EnvironmentPON_ELEM_INSP
PON_ENVT_DEFS_GD The environment in which the element exists.
Quantity/CountPON_ELEM_INSP
ELEM_QUANTITY The size/amount of the element.
ElementDescription
PON_ELEM_INSP
ELEM_NOTES A description or notes about the element.
Inspection Notes Grouping
Insp LevelNotes inspevnt notes Notes for the current inspection.
Inspection Header
Bridge bridge bridge_id The agency bridge identification number that is used toidentify structures on most screens and reports.
Facility Carried bridge facility NBI Item 7: The facility carried by the structure.
Inspection DateSelection inspevnt inspkey The inspection key. A unique identifier for the inspections on
a particular structure that includes the date of the inspection.
Type inspevnt insptype The primary type of inspection performed.
Inspection Footer
- 224 -
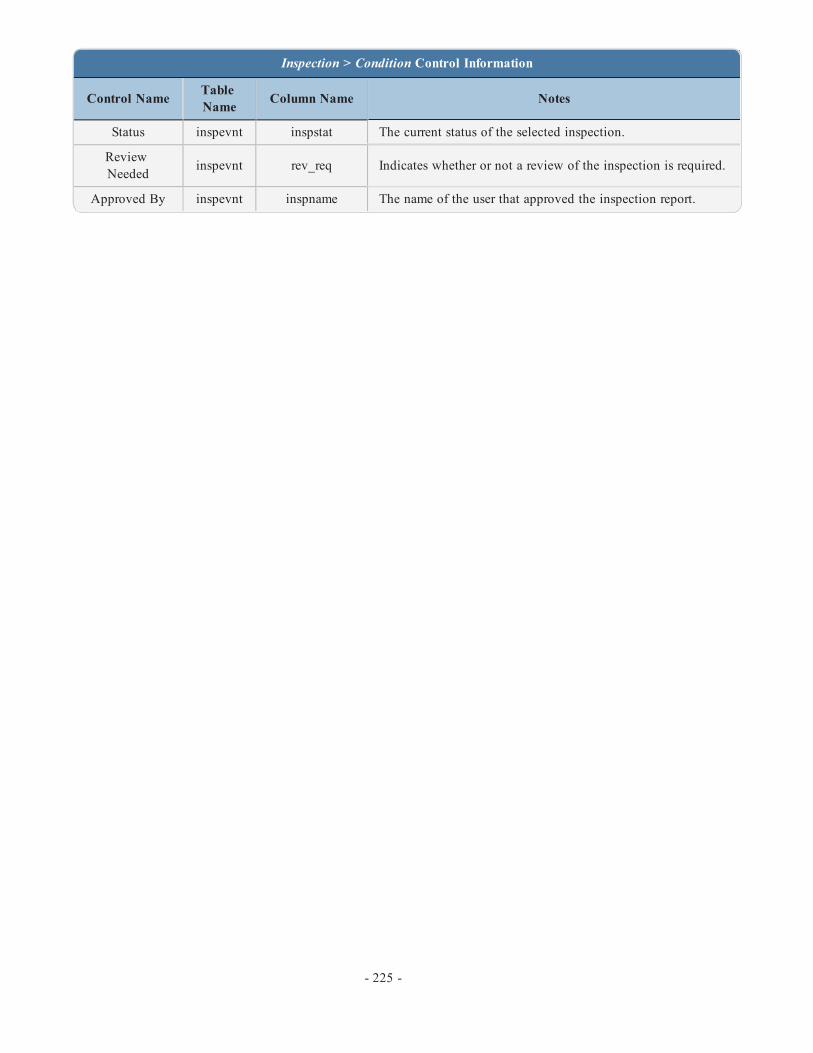
Inspection > Condition Control Information
Control Name TableName Column Name Notes
Status inspevnt inspstat The current status of the selected inspection.
ReviewNeeded inspevnt rev_req Indicates whether or not a review of the inspection is required.
Approved By inspevnt inspname The name of the user that approved the inspection report.
- 225 -
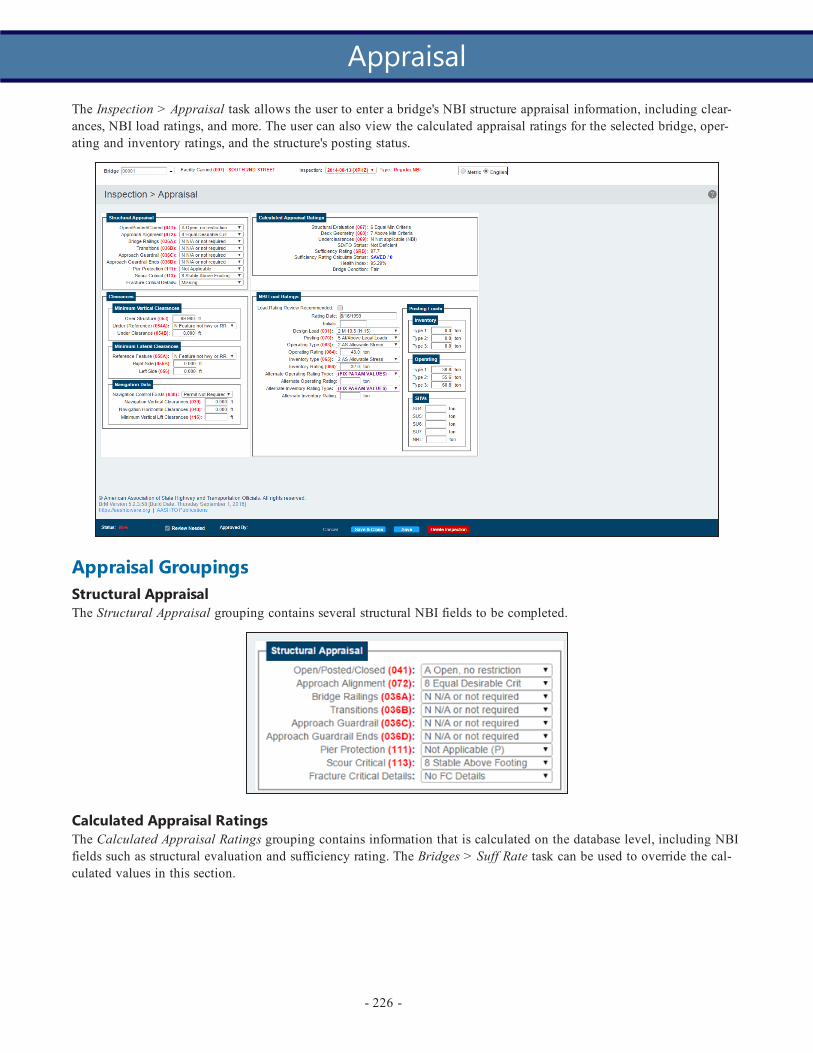
The Inspection > Appraisal task allows the user to enter a bridge's NBI structure appraisal information, including clear-ances, NBI load ratings, and more. The user can also view the calculated appraisal ratings for the selected bridge, oper-ating and inventory ratings, and the structure's posting status.
Appraisal GroupingsStructural AppraisalThe Structural Appraisal grouping contains several structural NBI fields to be completed.
Calculated Appraisal RatingsThe Calculated Appraisal Ratings grouping contains information that is calculated on the database level, including NBIfields such as structural evaluation and sufficiency rating. The Bridges > Suff Rate task can be used to override the cal-culated values in this section.
- 226 -
Appraisal

The Bridge Condition rating has been added to the Calculated Appraisal Ratings grouping in BrM version 5.2.3. Thisdisplays a bridge status of Good/Fair/Poor and stores it in the database at inspevnt.bridge_condition. This status isdetermined by the lowest rating of the NBI condition ratings for deck, superstructure, substructure, and culvert. Thestatus is as follows:
l Good - 9, 8, 7l Fair - 6, 5l Poor - 4, 3, 2, 1
Example: An inspection is completed with the following values:
Deck: 7Superstructure: 6Substructure: 5Culvert : Null
Because substructure is the lowest NBI condition rating, it will be used to determine the Good/Fair/Poor status. With "5"as its rating, the bridge status will be set to Fair.
ClearancesThe Clearances grouping contains vertical and lateral clearances and navigation data NBI fields to be completed.
NBI Load RatingsThe NBI Load Ratings grouping contains load rating NBI fields and alternate fields to be completed.
- 227 -

*Note: In previous versions of BrM, the Rating Date textbox value defaulted to the structure's creation date. This nolonger occurs in BrM version 5.2.3. Instead, the field is left blank upon creation of a new structure.
Appraisal Page Controls
The Save button saves the changes made to the selected bridge's appraisal page.
The Save & Close button saves the changes made to the selected bridge's appraisal page and returns the user to theBridges > View List task.
The Cancel button cancels the changes made to the selected bridge's appraisal page and returns the user to the Bridges >View List task.
The Delete Inspection button deletes the current inspection for the selected bridge.
_______________________________________________________________________
Inspection >Appraisal Control Information
Control Name TableName
ColumnName Notes
Structural Appraisal Grouping
Open/Posted/Closed inspevnt oppostcl
NBI Item 41: This item provides information about the actualoperational status of a structure. The field review could showthat a structure is posted, but Item 70 - Bridge Posting mayindicate that posting is not required. This is possible and accept-able coding since Item 70 is based on the operating stress leveland the governing agency's posting procedures may specify post-ing at some stress level less than the operating rating.
- 228 -

Inspection >Appraisal Control Information
Control Name TableName
ColumnName Notes
Approach Align-ment inspevnt appralign
NBI Item 72: This item identifies those bridges which do notfunction properly or adequately due to the alignment of theapproaches. It is not intended that the approach roadway align-ment be compared to current standards but rather to the existinghighway alignment. This concept differs from other appraisalevaluations. The establishment of set criteria to be used at allbridge sites is not appropriate for this item. The basic criteria ishow the alignment of the roadway approaches to the bridgerelate to the general highway alignment for the section of high-way the bridge is on.
Bridge Railings inspevnt railrating
NBI Item 36A: Bridge railings should be evaluated using thecurrent AASHTO Standard Specifications for Highway Bridges,which calls for railings to meet specific geometric criteria and toresist specified static loads without exceeding the allowablestresses in their elements.
Transitions inspevnt transratin
NBI Item 36B: The transition from approach guardrail to bridgerailing requires that the approach guardrail be firmly attached tothe bridge railing. It also requires that the approach guardrail begradually stiffened as it comes closer to the bridge railing. Theends of curbs and safety walks need to be gradually tapered outor shielded. The data collected shall apply only to the route onthe bridge. Collision damage or deterioration of the elements arenot considered when coding this item.
Approach Guardrail inspevnt arailratin
NBI Item 36C: The structural adequacy and compatibility ofapproach guardrail with transition designs should be determ-ined. Rarely does the need for a barrier stop at the end of abridge. Acceptable guardrail design suggestions are contained inthe AASHTO Roadside Design Guide and subsequent FHWAor AASHTO guidelines. The data collected shall apply only tothe route on the bridge. Collision damage or deterioration of theelements are not considered when coding this item.
Approach GuardrailEnds inspevnt aendrating
NBI Item 36D: As with guardrail ends in general, the ends ofapproach guardrails to bridges should be flared, buried, madebreakaway, or shielded. Design treatment of guardrail ends isgiven in the AASHTO Roadside Design Guide. The data col-lected shall apply only to the route on the bridge. Collision dam-age or deterioration of the elements are not considered whencoding this item.
Pier Protection inspevnt pierprot NBI Item 111: Code the whether pier protection is present andthe status of the protection.
Scour Critical inspevnt scrourcrit
NBI Item 113: Identify current status of bridge regarding vul-nerability to scour. Scour analyses to be made by hydraul-ic/geotechnical/structural engineers. A scour critical bridge isone with abutment or pier foundations which are rated asunstable due to observed scour at bridge site or scour potential
- 229 -
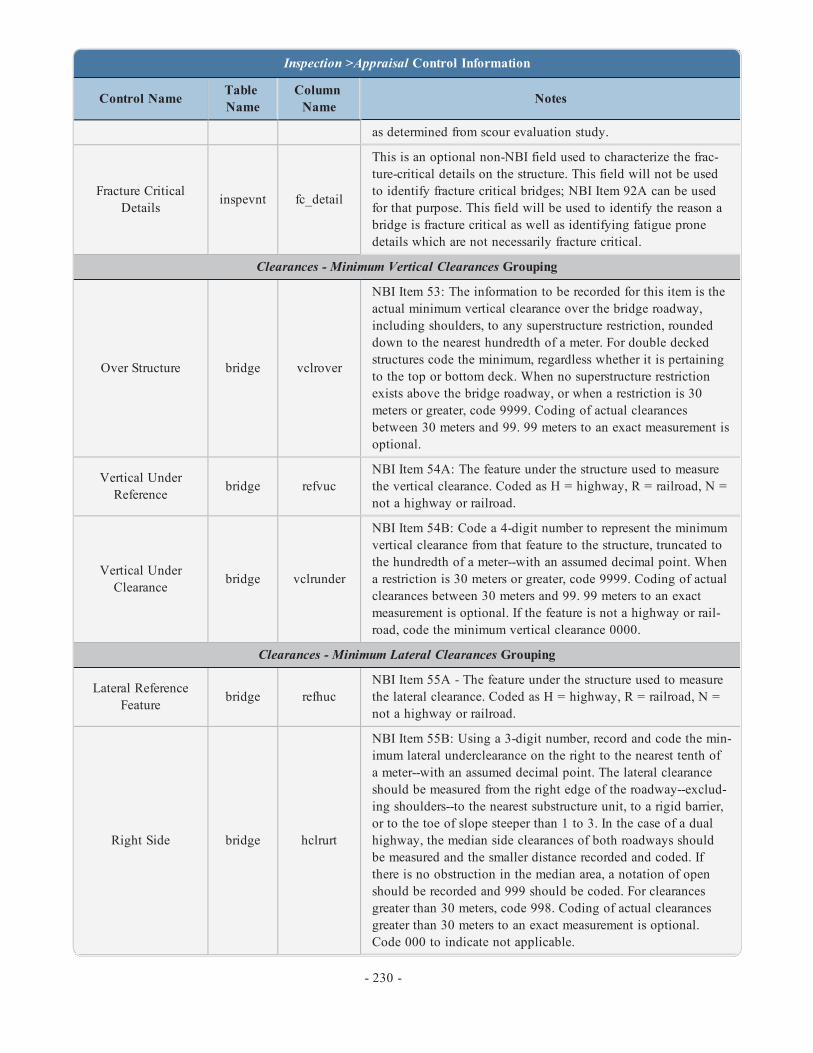
Inspection >Appraisal Control Information
Control Name TableName
ColumnName Notes
as determined from scour evaluation study.
Fracture CriticalDetails inspevnt fc_detail
This is an optional non-NBI field used to characterize the frac-ture-critical details on the structure. This field will not be usedto identify fracture critical bridges; NBI Item 92A can be usedfor that purpose. This field will be used to identify the reason abridge is fracture critical as well as identifying fatigue pronedetails which are not necessarily fracture critical.
Clearances - Minimum Vertical Clearances Grouping
Over Structure bridge vclrover
NBI Item 53: The information to be recorded for this item is theactual minimum vertical clearance over the bridge roadway,including shoulders, to any superstructure restriction, roundeddown to the nearest hundredth of a meter. For double deckedstructures code the minimum, regardless whether it is pertainingto the top or bottom deck. When no superstructure restrictionexists above the bridge roadway, or when a restriction is 30meters or greater, code 9999. Coding of actual clearancesbetween 30 meters and 99. 99 meters to an exact measurement isoptional.
Vertical UnderReference bridge refvuc
NBI Item 54A: The feature under the structure used to measurethe vertical clearance. Coded as H = highway, R = railroad, N =not a highway or railroad.
Vertical UnderClearance bridge vclrunder
NBI Item 54B: Code a 4-digit number to represent the minimumvertical clearance from that feature to the structure, truncated tothe hundredth of a meter--with an assumed decimal point. Whena restriction is 30 meters or greater, code 9999. Coding of actualclearances between 30 meters and 99. 99 meters to an exactmeasurement is optional. If the feature is not a highway or rail-road, code the minimum vertical clearance 0000.
Clearances - Minimum Lateral Clearances Grouping
Lateral ReferenceFeature bridge refhuc
NBI Item 55A - The feature under the structure used to measurethe lateral clearance. Coded as H = highway, R = railroad, N =not a highway or railroad.
Right Side bridge hclrurt
NBI Item 55B: Using a 3-digit number, record and code the min-imum lateral underclearance on the right to the nearest tenth ofa meter--with an assumed decimal point. The lateral clearanceshould be measured from the right edge of the roadway--exclud-ing shoulders--to the nearest substructure unit, to a rigid barrier,or to the toe of slope steeper than 1 to 3. In the case of a dualhighway, the median side clearances of both roadways shouldbe measured and the smaller distance recorded and coded. Ifthere is no obstruction in the median area, a notation of openshould be recorded and 999 should be coded. For clearancesgreater than 30 meters, code 998. Coding of actual clearancesgreater than 30 meters to an exact measurement is optional.Code 000 to indicate not applicable.
- 230 -

Inspection >Appraisal Control Information
Control Name TableName
ColumnName Notes
Left Side bridge hclrult
NBI Item 56: Using a 3-digit number, record and code the min-imum lateral underclearance on the left--median side for dividedhighways--to the nearest tenth of a meter--with an assumeddecimal point. The lateral clearance should be measured fromthe left edge of the roadway--excluding shoulders--to the nearestsubstructure unit, to a rigid barrier, or to the toe of slope steeperthan 1 to 3. In the case of a dual highway, the median side clear-ances of both roadways should be measured and the smaller dis-tance recorded and coded. If there is no obstruction in themedian area, a notation of open should be recorded and 999should be coded. For clearances greater than 30 meters, code998. Coding of actual clearances greater than 30 meters to anexact measurement is optional. Code 000 to indicate not applic-able.
Navigation Data Grouping
Navigation ControlExists bridge navcntrol NBI Item 38: Indicates whether or not a bridge permit is neces-
sary for navigation, if applicable.
Navigation VerticalClearances bridge navvc NBI Item 39: If navigation of the waterway requires a permit,
this is the minimum vertical clearance of the navigation.
Navigation Hori-zontal Clearances bridge navhc NBI Item 40: If navigation of the waterway requires a permit,
this is the minimum horizontal clearance of the navigation.
Navigation VerticalLift Clearances bridge lftbrnavcl NBI Item 116: The minimum vertical lift clearance for the lift
bridge in the dropped/closed position.
Calculated Appraisal Ratings Grouping
Structural Evalu-ation inspevnt strrating
NBI Item 67: This is the structural evaluation rating of thebridge. This item is calculated by the specifications used in theNBI Coding Guide.
Deck Geometry inspevnt deckgeom
NBI Item 68: The overall rating for deck geometry includes twoevaluations: the curb-to-curb or face-to-face of rail bridge widthand the minimum vertical clearance over the bridge roadway.When an individual table lists several deck geometry ratingcodes for the same roadway width under a specific ADT, thelower code is used.
Underclearances inspevnt underclrNBI Item 69: This is the underclearance of the bridge. This itemis calculated by the specifications used in the NBI CodingGuide.
SD/FO Status inspevnt nbi_rating The NBI rating (structurally deficient/functionally obsoletestatus).
Sufficiency Rating inspevnt suff_rate The calculated sufficiency rating of the bridge.
SRCS bridge srstatus Indicates whether the sufficiency rating is current or needsupdated.
Health Index The health index is a calculated value that comes from database
- 231 -

Inspection >Appraisal Control Information
Control Name TableName
ColumnName Notes
view: v_hix.hix.
NBI Load Ratings Grouping
Load RatingReview Recom-
mendedbridge req_op_rat This control indicates whether review of the load ratings is
recommended.
Rating Date bridge ratingdate The date the load rating calculation was made. Non-NBI field.
Initials bridge rater_ini The initials of the load rater/engineer responsible for performingthe load rating. Non-NBI field.
Design Load bridge designloadNBI Item 31: Use the codes below to indicate the live load forwhich the structure was designed. The numerical value of therailroad loading should be recorded on the form.
Posting bridge posting
NBI Item 70: The National Bridge Inspection Standards requirethe posting of load limits only if the maximum legal load con-figurations in the state exceeds the load permitted under theoperating rating. If the load capacity at the operating rating issuch that posting is required, this item shall be coded 4 or less.If no posting is required at the operating rating, this item shallbe coded 5.
Operating Type bridge ortypeNBI Item 63: Use one of the codes below to indicate whichload rating method was used to determine the Operating Ratingcoded in Item 64 for this structure.
Operating Rating bridge orload
NBI Item 64: This capacity rating, referred to as the operatingrating, will result in the absolute maximum permissible loadlevel to which the structure may be subjected for the vehicletype used in the rating. Code the operating rating as a 3-digitnumber to represent the total mass in metric tons of the entirevehicle measured to the nearest tenth of a metric ton--with anassumed decimal point. It should be emphasized that only MSloading shall be used to determine the operating rating.
Inventory Type bridge irtypeNBI Item 65: Use one of the codes below to indicate whichload rating method was used to determine the Inventory Ratingcoded in Item 66 for this structure.
Inventory Rating bridge irload
NBI Item 66: This capacity rating, referred to as the inventoryrating, will result in a load level which can safely utilize anexisting structure for an indefinite period of time. Only the MSloading shall be used to determine the inventory rating. Codethe Inventory Rating as a 3-digit number to represent the totalmass in metric tons of the entire vehicle measured to the nearesttenth of a metric ton--with an assumed decimal point. Code 999for a structure under sufficient fill such that, according toAASHTO design, the live load is insignificant in the structureload capacity.
Alternate Operating bridge altormeth The alternate operating rating method. Optional non-NBI field
- 232 -
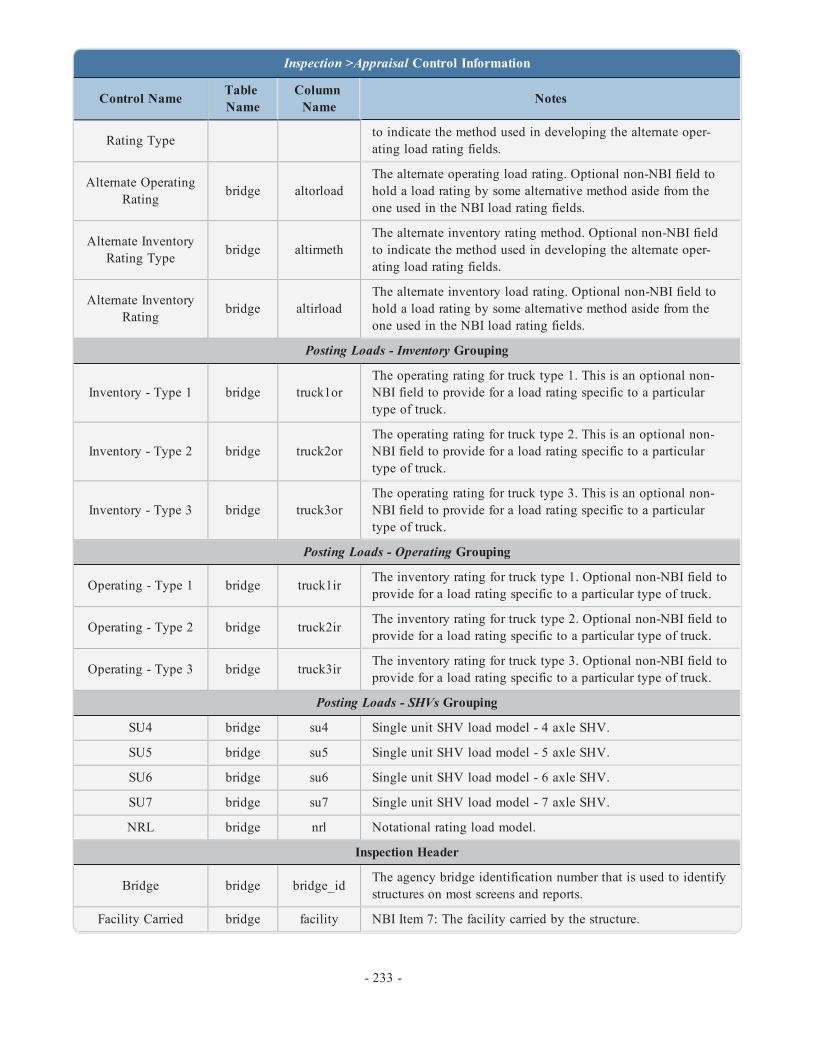
Inspection >Appraisal Control Information
Control Name TableName
ColumnName Notes
Rating Type to indicate the method used in developing the alternate oper-ating load rating fields.
Alternate OperatingRating bridge altorload
The alternate operating load rating. Optional non-NBI field tohold a load rating by some alternative method aside from theone used in the NBI load rating fields.
Alternate InventoryRating Type bridge altirmeth
The alternate inventory rating method. Optional non-NBI fieldto indicate the method used in developing the alternate oper-ating load rating fields.
Alternate InventoryRating bridge altirload
The alternate inventory load rating. Optional non-NBI field tohold a load rating by some alternative method aside from theone used in the NBI load rating fields.
Posting Loads - Inventory Grouping
Inventory - Type 1 bridge truck1orThe operating rating for truck type 1. This is an optional non-NBI field to provide for a load rating specific to a particulartype of truck.
Inventory - Type 2 bridge truck2orThe operating rating for truck type 2. This is an optional non-NBI field to provide for a load rating specific to a particulartype of truck.
Inventory - Type 3 bridge truck3orThe operating rating for truck type 3. This is an optional non-NBI field to provide for a load rating specific to a particulartype of truck.
Posting Loads - Operating Grouping
Operating - Type 1 bridge truck1ir The inventory rating for truck type 1. Optional non-NBI field toprovide for a load rating specific to a particular type of truck.
Operating - Type 2 bridge truck2ir The inventory rating for truck type 2. Optional non-NBI field toprovide for a load rating specific to a particular type of truck.
Operating - Type 3 bridge truck3ir The inventory rating for truck type 3. Optional non-NBI field toprovide for a load rating specific to a particular type of truck.
Posting Loads - SHVs Grouping
SU4 bridge su4 Single unit SHV load model - 4 axle SHV.
SU5 bridge su5 Single unit SHV load model - 5 axle SHV.
SU6 bridge su6 Single unit SHV load model - 6 axle SHV.
SU7 bridge su7 Single unit SHV load model - 7 axle SHV.
NRL bridge nrl Notational rating load model.
Inspection Header
Bridge bridge bridge_id The agency bridge identification number that is used to identifystructures on most screens and reports.
Facility Carried bridge facility NBI Item 7: The facility carried by the structure.
- 233 -

Inspection >Appraisal Control Information
Control Name TableName
ColumnName Notes
Inspection DateSelection inspevnt inspkey The inspection key. A unique identifier for the inspections on a
particular structure that includes the date of the inspection.
Type inspevnt insptype The primary type of inspection performed.
Inspection Footer
Status inspevnt inspstat The current status of the selected inspection.
Review Needed inspevnt rev_req Indicates whether or not a review of the inspection is required.
Approved By inspevnt inspname The name of the user that approved the inspection report.
- 234 -

The Inspection > Inventory task allows the user to modify a bridge's information through four subtasks: Admin, Design,Roads, and Agency Items.
*Note: User permissions may limit the fields available to be modified.
AdminThe Inspection > Inventory > Admin subtask is used to modify a bridge's structure identification, location, age and ser-vice, and more.
Admin Page GroupingsLocationThe Location grouping determines the location details of the selected bridge, including the latitude and longitude valuesused in BrM's matching features.
ProgrammingThe Programming grouping contains the sufficiency rating calculation status for the selected bridge. The SR CalculateStatus dropdown sets the status.
Age and ServiceThe Age and Service grouping provides information about the age of the bridge and how it is used.
OperationThe Operation grouping is used to indicate who owns the bridge and who is responsible for the maintenance of thebridge.
Classification InformationThe Classification Information grouping contains information about the how the structure is classified.
- 235 -
Inventory

Admin Page ControlsIf changes have been made to the subtask, those changes must be saved before leaving the current page in order for thechanges to be maintained.
The Save button saves the changes made on the current subtask.
The Save & Close button saves the changes made on the current subtask and returns the user to the Bridges > View Listtask.
The Cancel button cancels the changes made on the current subtask and returns the user to the Bridges > View List task.
The Delete Inspection button deletes the current inspection for the selected bridge.
_______________________________________________________________________
Inspection > Inventory > Admin Control Information
Control Name TableName
ColumnName Notes
Structural Identification Grouping
Agency Bridge ID bridge bridge_id Agency bridge identification number. Used to identify struc-tures on most screens and reports.
NBI Structure No. bridge struct_num
NBI Item 8 - The NBI structure number. Note that regardlessof whether Item 8 is mapped only to struct_num or also toadditional fields, if a user changes the value stored andexports then imports an NBI file, the result may be the cre-ation of a new brkey.
Brkey bridge brkey The bridge key. One of the structure identifiers in BrM.
Name bridge strucname The agency's structure name. Non-NBI field.
Location Grouping
FIPS State bridge fips_state NBI Item 1A - The state the structure is located within.
FHWA Region bridge fhwa_regn NBI Item 1B - The region the structure is located within.
District bridge district
NBI Item 2 - The highway agency district in which thebridge is located. Existing district numbers shall be usedwhere districts are identified by number. Where districts areidentified by name, a code number shall be assigned basedon an alphabetical or organizational listing of the districts.
County bridge county NBI Item 3 - The county the structure is located within.
City/Town/Placecode bridge placecode NBI Item 4 - The city, town, township, village, or othercensus-designated place the structure is located within.
Feature Intersected bridge featintNBI Item 6 - This item contains a description of the featuresintersected by the structure and a critical facility indicator.
- 236 -

Inspection > Inventory > Admin Control Information
Control Name TableName
ColumnName Notes
When Item 5A indicates an under record, this item describesthe inventory route and/or features under the structure.
Facility Carried bridge facilityNBI Item 7 - The facility being carried by the structure shallbe recorded and coded. In all situations this item describesthe use on the structure.
Location bridge location
NBI Item 9 - This item contains a narrative description ofthe bridge location. It is recommended that the location bekeyed to a distinguishable feature on an official highwaydepartment map such as road junctions and topographicalfeatures.
Latitude bridge latitude
NBI Item 16 - For bridges on STRAHNET and STRAHNETConnector highways and on the NHS, record and code thelatitude of each in degrees, minutes and seconds to thenearest hundredth of a second--with an assumed decimalpoint. The point of the coordinate may be the beginning ofthe bridge in the direction of the inventory or any other con-sistent point of reference on the bridge which is compatiblewith the LRS.
Longitude bridge longitude
NBI Item 17 - For bridges on STRAHNET and STRAHNETConnector highways and on the NHS, record and code thelongitude of each in degrees, minutes and seconds to thenearest hundredth of a second--with an assumed decimalpoint. The point of the coordinate may be the beginning ofthe bridge in the direction of the inventory or any other con-sistent point of reference on the bridge which is compatiblewith the LRS.
Border State bridge nstatecode
NBI Item 98AA - The neighboring state of the structure. Forthe special case of a structure on the border with Canada orMexico, code the State code "CAN" or "MEX" respectively.If structure is not on a border, leave blank.
Share% bridge bb_pct
NBI Item 98B - It is for specifying the percent responsibilityfor improvements to the existing structure when it is on aborder with a neighboring state. Code it with the percentageof total deck area of the existing bridge that the neighboringstate is responsible for funding.
Border FHWARegion bridge n_fhwa_reg
NBI Item 98AB - Indicate the FHWA region of the neigh-boring state. For the special case of a structure on the borderwith Canada or Mexico, leave blank.
Border Struct No. bridge bb_brdgeid
NBI Item 99 - Code the neighboring state's 15-digit NBIstructure number for any structure noted in Item 98. Thisnumber must match exactly the neighboring state's sub-mitted NBI structure number. The entire 15-digit field mustbe accounted for including zeros and blank spaces whetherthey are leading, trailing, or embedded in the 15-digit field.If Item 98 is blank, this item is blank.
- 237 -

Inspection > Inventory > Admin Control Information
Control Name TableName
ColumnName Notes
Programming Grouping
SR Calculate Status bridge srstatus
Tracks whether sufficiency rating (SR) needs to be recal-culated. This field is set to 1 when a new roadway or inspec-tion is created (and in response to other circumstances thatmay trigger a need to recalculate SR), and set to 0 when SRis recalculated.
Age and Service Grouping
Year Built bridge yearbuilt
NBI Item 27 - Record and code the year of construction ofthe structure. Code all 4 digits of the year in which con-struction of the structure was completed. If the year built isunknown, provide a best estimate.
Year Reconstruct bridge yearrecon
NBI Item 106 - Record and code the year of most recentreconstruction of the structure. Code all 4 digits of the latestyear in which reconstruction of the structure was completed.If there has been no reconstruction code 0000.
Type of Service On bridge servtypon NBI Item 42A - Indicates the type of service on the bridge.
Under bridge servtypund NBI Item 42B - Indicates the type of service under thebridge.
Lane Under bridge sumlanes NBI Item 28B - The sum of the number of lanes under thestructure.
Operation Grouping
Maintenance Resp. bridge custodian NBI Item 21 - The name of the agency responsible for themaintenance of the structure.
Owner bridge owner NBI Item 22 - The name of the owner of the structure.
Agency Admin Area bridge adminarea This is used in subsetting and sorting of bridge data as aconvenience feature. Non-NBI field.
On/Off Agency Sys-tem bridge on_off_sys
Specifies whether the structure is on or off the agency sys-tem. Typically based on the value for either structure own-ership (NBI Item 22) or custodian (NBI Item 21). Used fordetermining applicable policies and costs, and for reportingresults.
Bridge Group bridge bridgegroupAgency-defined group for the bridge. Intended for use ingrouping together bridges for inspection purposes. Non-NBIfield.
Classification Information Grouping
NBIS Bridge Length bridge nbislenNBI Item 112 - Indicate whether this structure meets orexceeds the minimum length specified to be designated as abridge by NBI standards.
Parallel Structure bridge paralstrucNBI Item 101 - Code this item to indicate situations whereseparate structures carry the inventory route in opposite dir-ections of travel over the same feature.
- 238 -
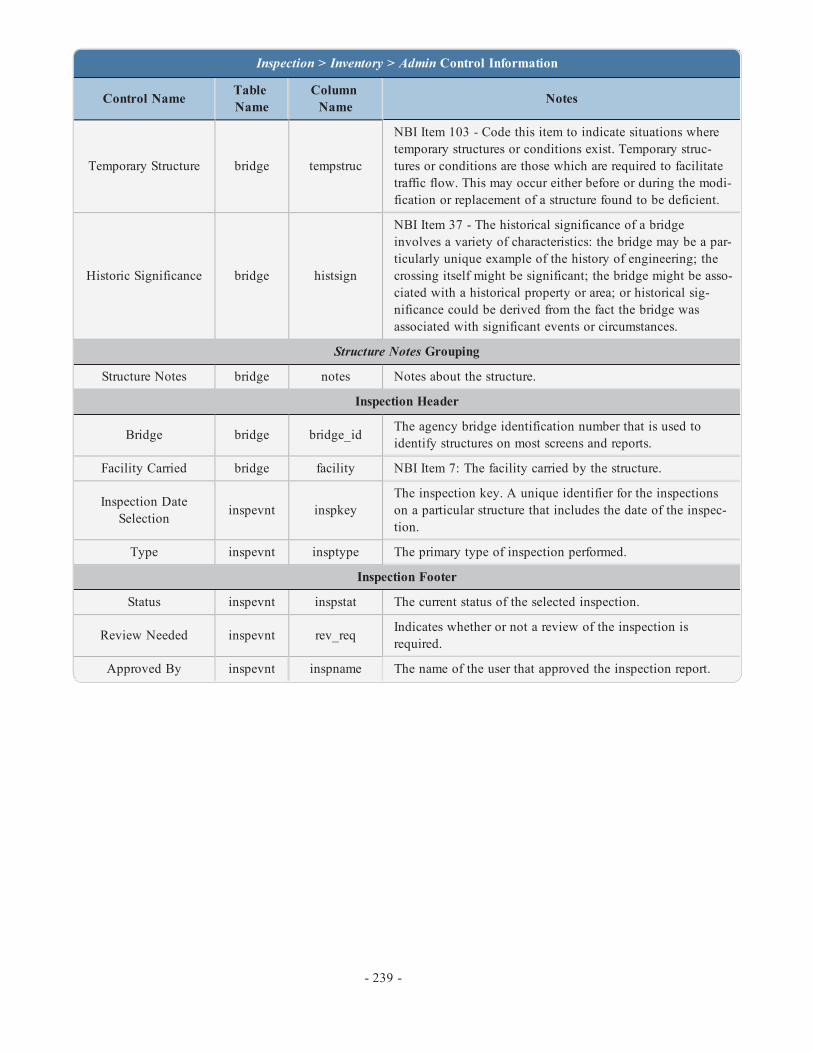
Inspection > Inventory > Admin Control Information
Control Name TableName
ColumnName Notes
Temporary Structure bridge tempstruc
NBI Item 103 - Code this item to indicate situations wheretemporary structures or conditions exist. Temporary struc-tures or conditions are those which are required to facilitatetraffic flow. This may occur either before or during the modi-fication or replacement of a structure found to be deficient.
Historic Significance bridge histsign
NBI Item 37 - The historical significance of a bridgeinvolves a variety of characteristics: the bridge may be a par-ticularly unique example of the history of engineering; thecrossing itself might be significant; the bridge might be asso-ciated with a historical property or area; or historical sig-nificance could be derived from the fact the bridge wasassociated with significant events or circumstances.
Structure Notes Grouping
Structure Notes bridge notes Notes about the structure.
Inspection Header
Bridge bridge bridge_id The agency bridge identification number that is used toidentify structures on most screens and reports.
Facility Carried bridge facility NBI Item 7: The facility carried by the structure.
Inspection DateSelection inspevnt inspkey
The inspection key. A unique identifier for the inspectionson a particular structure that includes the date of the inspec-tion.
Type inspevnt insptype The primary type of inspection performed.
Inspection Footer
Status inspevnt inspstat The current status of the selected inspection.
Review Needed inspevnt rev_req Indicates whether or not a review of the inspection isrequired.
Approved By inspevnt inspname The name of the user that approved the inspection report.
- 239 -

DesignThe Inspection > Inventory > Design subtask is used to modify a bridge's deck, span, length, and more. New structureunits can also be created on this page.
Structure UnitsThe Structure Units grouping allows the user to create/modify structure units. Structure units are groups of structures typ-ically based on structural design and material. It is not necessary to have multiple structure units, but it can be helpfulfor inspections.
Click the Add New button to create a new structure unit.
l Type: The structure unit type options can be defined in the Admin > General Config > Parameters task.l Default: Only one structure unit may be the default. When a structure unit is the default, it will be the defaultstructure unit selected when a new element is added to a bridge inspection on the Inspection > Condition task.
- 240 -
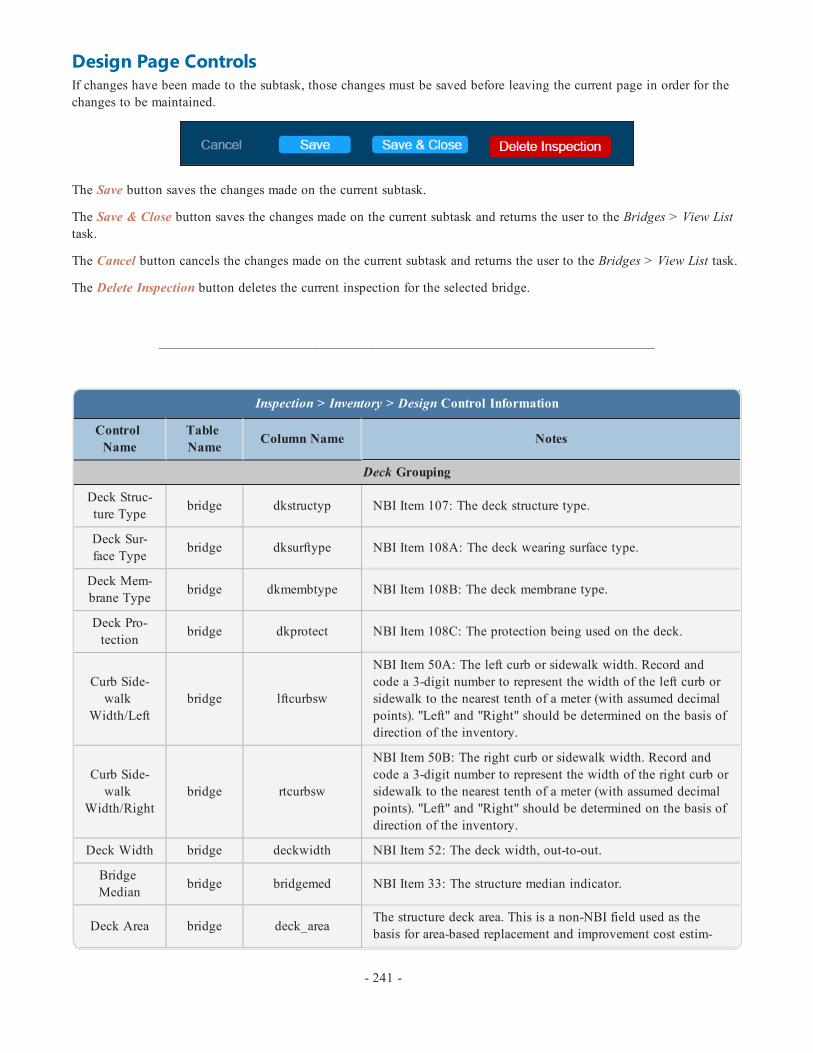
Design Page ControlsIf changes have been made to the subtask, those changes must be saved before leaving the current page in order for thechanges to be maintained.
The Save button saves the changes made on the current subtask.
The Save & Close button saves the changes made on the current subtask and returns the user to the Bridges > View Listtask.
The Cancel button cancels the changes made on the current subtask and returns the user to the Bridges > View List task.
The Delete Inspection button deletes the current inspection for the selected bridge.
_______________________________________________________________________
Inspection > Inventory > Design Control Information
ControlName
TableName Column Name Notes
Deck Grouping
Deck Struc-ture Type bridge dkstructyp NBI Item 107: The deck structure type.
Deck Sur-face Type bridge dksurftype NBI Item 108A: The deck wearing surface type.
Deck Mem-brane Type bridge dkmembtype NBI Item 108B: The deck membrane type.
Deck Pro-tection bridge dkprotect NBI Item 108C: The protection being used on the deck.
Curb Side-walk
Width/Leftbridge lftcurbsw
NBI Item 50A: The left curb or sidewalk width. Record andcode a 3-digit number to represent the width of the left curb orsidewalk to the nearest tenth of a meter (with assumed decimalpoints). "Left" and "Right" should be determined on the basis ofdirection of the inventory.
Curb Side-walk
Width/Rightbridge rtcurbsw
NBI Item 50B: The right curb or sidewalk width. Record andcode a 3-digit number to represent the width of the right curb orsidewalk to the nearest tenth of a meter (with assumed decimalpoints). "Left" and "Right" should be determined on the basis ofdirection of the inventory.
Deck Width bridge deckwidth NBI Item 52: The deck width, out-to-out.
BridgeMedian bridge bridgemed NBI Item 33: The structure median indicator.
Deck Area bridge deck_areaThe structure deck area. This is a non-NBI field used as thebasis for area-based replacement and improvement cost estim-
- 241 -
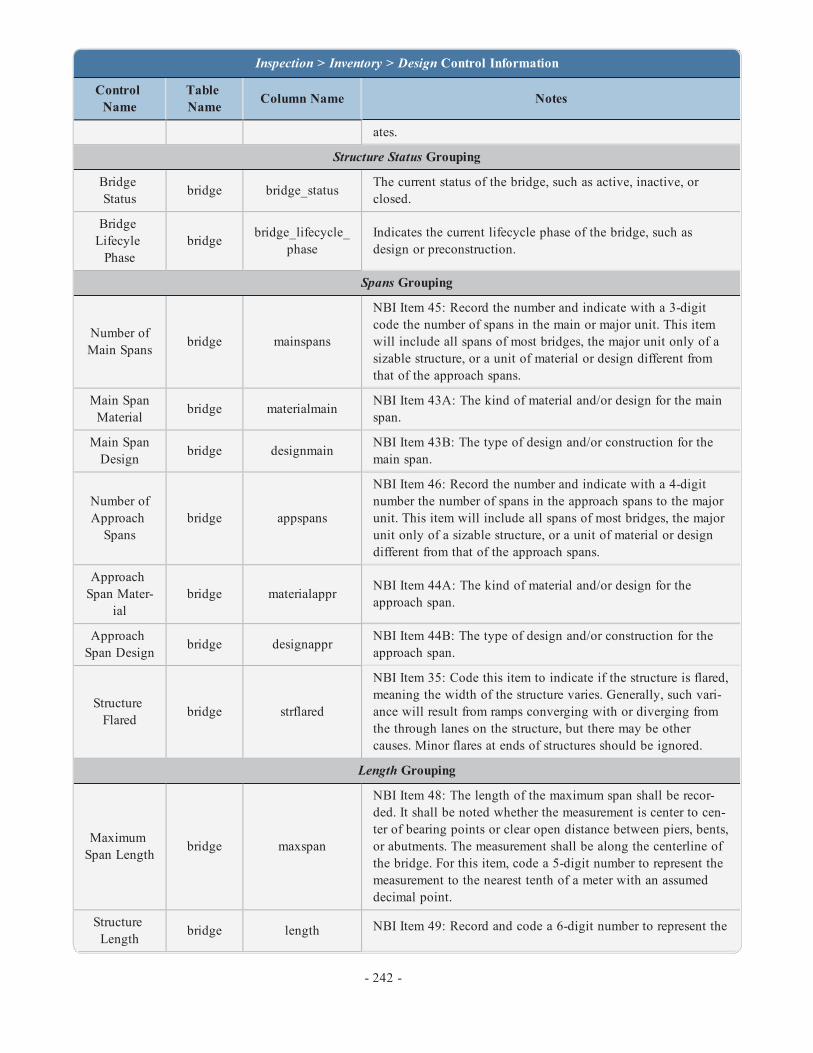
Inspection > Inventory > Design Control Information
ControlName
TableName Column Name Notes
ates.
Structure Status Grouping
BridgeStatus bridge bridge_status The current status of the bridge, such as active, inactive, or
closed.
BridgeLifecylePhase
bridge bridge_lifecycle_phase
Indicates the current lifecycle phase of the bridge, such asdesign or preconstruction.
Spans Grouping
Number ofMain Spans bridge mainspans
NBI Item 45: Record the number and indicate with a 3-digitcode the number of spans in the main or major unit. This itemwill include all spans of most bridges, the major unit only of asizable structure, or a unit of material or design different fromthat of the approach spans.
Main SpanMaterial bridge materialmain NBI Item 43A: The kind of material and/or design for the main
span.
Main SpanDesign bridge designmain NBI Item 43B: The type of design and/or construction for the
main span.
Number ofApproachSpans
bridge appspans
NBI Item 46: Record the number and indicate with a 4-digitnumber the number of spans in the approach spans to the majorunit. This item will include all spans of most bridges, the majorunit only of a sizable structure, or a unit of material or designdifferent from that of the approach spans.
ApproachSpan Mater-
ialbridge materialappr NBI Item 44A: The kind of material and/or design for the
approach span.
ApproachSpan Design bridge designappr NBI Item 44B: The type of design and/or construction for the
approach span.
StructureFlared bridge strflared
NBI Item 35: Code this item to indicate if the structure is flared,meaning the width of the structure varies. Generally, such vari-ance will result from ramps converging with or diverging fromthe through lanes on the structure, but there may be othercauses. Minor flares at ends of structures should be ignored.
Length Grouping
MaximumSpan Length bridge maxspan
NBI Item 48: The length of the maximum span shall be recor-ded. It shall be noted whether the measurement is center to cen-ter of bearing points or clear open distance between piers, bents,or abutments. The measurement shall be along the centerline ofthe bridge. For this item, code a 5-digit number to represent themeasurement to the nearest tenth of a meter with an assumeddecimal point.
StructureLength bridge length NBI Item 49: Record and code a 6-digit number to represent the
- 242 -

Inspection > Inventory > Design Control Information
ControlName
TableName Column Name Notes
length of the structure to the nearest tenth of a meter--with anassumed decimal point. This shall be the length of roadway thatis supported on the bridge structure. The length should be meas-ured back to back of backwalls of abutments or from pavingnotch to paving notch. Culvert lengths should be measuredalong the center line of roadway regardless of their depth belowgrade. Measurement should be made between inside faces ofexterior walls. Tunnel length should be measured along thecenterline of the roadway.
TotalLength bridge tot_length The total length of the structure, including approach roadways.
It is always greater than or equal to the structure length.
Structure Units Grouping
Key structure_unit strunitkey The structure unit's primary identifier.
Unit structure_unit strunitlabel A secondary identifier for the structure unit.
Type structure_unit strunittype The type of structure unit (main, approach, etc.).
Default Unit structure_unit defaultflag
Default flag that indicates whether or not this is the defaultstructure unit for the structure. If it is the default, then new ele-ments are assigned to this unit.
Description structure_unit strunitdescription A description of the structure unit.
Inspection Header
Bridge bridge bridge_id The agency bridge identification number that is used to identifystructures on most screens and reports.
Facility Car-ried bridge facility NBI Item 7: The facility carried by the structure.
InspectionDate Selec-
tioninspevnt inspkey The inspection key. A unique identifier for the inspections on a
particular structure that includes the date of the inspection.
Type inspevnt insptype The primary type of inspection performed.
Inspection Footer
Status inspevnt inspstat The current status of the selected inspection.
ReviewNeeded inspevnt rev_req Indicates whether or not a review of the inspection is required.
ApprovedBy inspevnt inspname The name of the user that approved the inspection report.
- 243 -

RoadsThe Inspection > Inventory > Roads subtask is used to modify the information for roadways on or under the structureincluding classification data, traffic, clearance, and more.
Adding RecordsTo add an "On" or "Under" structure record, select the Create button.
*Note: The option to add an "On" structure record will only be available if the roadway information that was auto-matically generated when the structure was created was deleted at some point on the Inspection > Inventory > Roadssubtask.
- 244 -
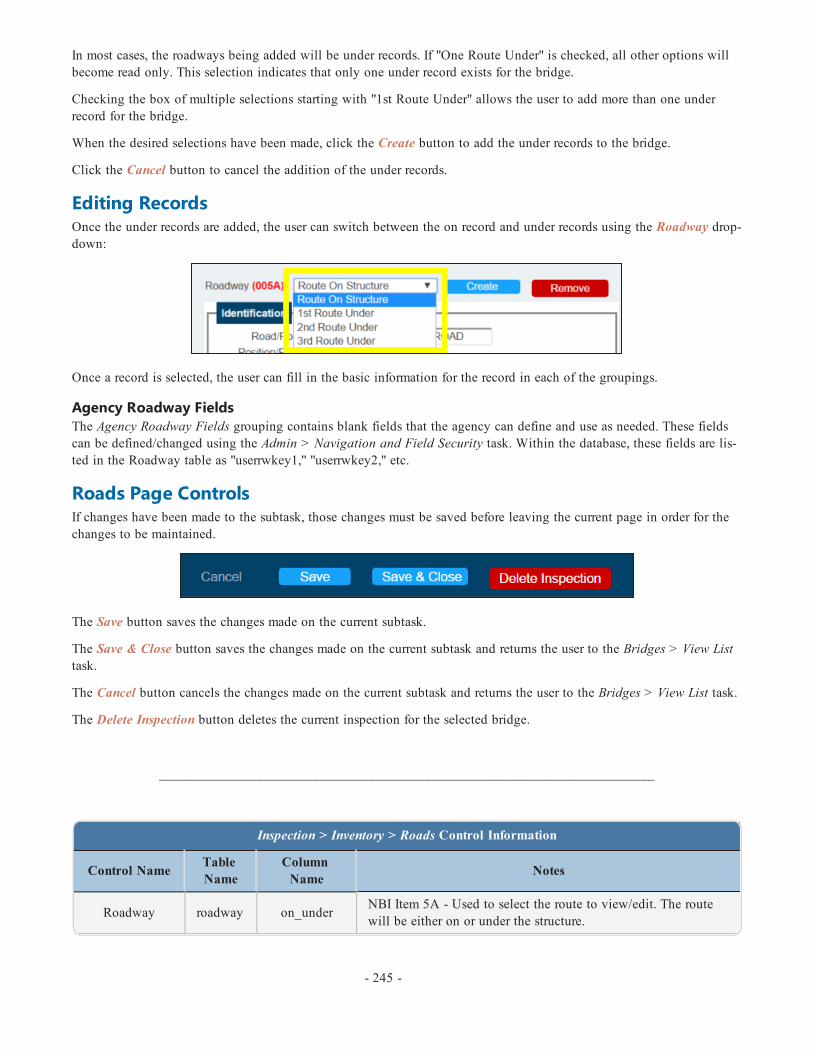
In most cases, the roadways being added will be under records. If "One Route Under" is checked, all other options willbecome read only. This selection indicates that only one under record exists for the bridge.
Checking the box of multiple selections starting with "1st Route Under" allows the user to add more than one underrecord for the bridge.
When the desired selections have been made, click the Create button to add the under records to the bridge.
Click the Cancel button to cancel the addition of the under records.
Editing RecordsOnce the under records are added, the user can switch between the on record and under records using the Roadway drop-down:
Once a record is selected, the user can fill in the basic information for the record in each of the groupings.
Agency Roadway FieldsThe Agency Roadway Fields grouping contains blank fields that the agency can define and use as needed. These fieldscan be defined/changed using the Admin > Navigation and Field Security task. Within the database, these fields are lis-ted in the Roadway table as "userrwkey1," "userrwkey2," etc.
Roads Page ControlsIf changes have been made to the subtask, those changes must be saved before leaving the current page in order for thechanges to be maintained.
The Save button saves the changes made on the current subtask.
The Save & Close button saves the changes made on the current subtask and returns the user to the Bridges > View Listtask.
The Cancel button cancels the changes made on the current subtask and returns the user to the Bridges > View List task.
The Delete Inspection button deletes the current inspection for the selected bridge.
_______________________________________________________________________
Inspection > Inventory > Roads Control Information
Control Name TableName
ColumnName Notes
Roadway roadway on_under NBI Item 5A - Used to select the route to view/edit. The routewill be either on or under the structure.
- 245 -

Inspection > Inventory > Roads Control Information
Control Name TableName
ColumnName Notes
Identification Grouping
Road/RouteName roadway roadway_
name Non-NBI field indicating the name of the roadway.
Position/Prefix roadway on_under NBI Item 5A - Indicates whether the route is on or under thestructure.
Kind Hwy (Rt.Prefix) roadway kind_hwy NBI Item 5B - Identify the route signing prefix for the inventory
route.
Desig. LevelService roadway levl_srvc NBI Item 5C - Identify the designated level of service for the
inventory route.
Rte# roadway routenum
NBI Item 5D - Code the route number of the inventory route inthe next 5 positions. If concurrent routes are of the same hier-archy level, denoted by the route signing prefix, the lowestnumbered route shall be coded. Code 00000 for bridges on roadswithout route numbers.
Suffix roadway dirsuffix NBI Item 5E - Code the directional suffix to the route number ofthe inventory route when it is part of the route number.
Critical Facility roadway crit_feat NBI Item 6B - Critical Facility Indicator will no longer becoded.
Traffic Grouping
Lanes roadway lanes NBI Item 28A - Indicate the number of lanes on the structure.
Medians roadway num_median Indicates the number of medians on the structure.
Speed roadway road_speed Indicates the speed limit of the roadway.
ADT Class roadway adtclass The traffic volume class of the roadway.
Recent ADT roadway adttotal
NBI Item 29 - Code a 6-digit number that shows the averagedaily traffic (ADT) volume for the inventory route identified inItem 5. The ADT coded should be the most recent ADT countsavailable. Included in this item are the trucks referred to in Item109. If the bridge is closed, code the actual ADT from before theclosure occurred.
Year roadway adtyear NBI Item 30 - Record the year represented by the ADT in Item29. Code all four digits of the year.
Truck% roadway truckpct
NBI Item 109 - Code a 2-digit percentage that shows the per-centage of Item 29 that is truck traffic. Do not include vans,pickup trucks, and other light delivery trucks in this percentage.If this information is not available, an estimate which representsthe average percentage for the category of road carried by thebridge may be used.
Future ADT roadway adtfuture
NBI Item 114 - Code for all bridges the forecasted average dailytraffic (ADT) for the inventory route identified in Item 5. Thisshall be projected at least 17 years but no more than 22 yearsfrom the year of inspection. The intent is to provide a basis for a
- 246 -

Inspection > Inventory > Roads Control Information
Control Name TableName
ColumnName Notes
20-year forecast. This item may be updated anytime, but must beupdated when the forecast falls below the 17-year limit.
Future Year roadway adtfutyear
NBI Item 115 - Record and code the year represented by thefuture ADT in Item 114. The projected year of future ADT shallbe at least 17 years but no more than 22 years from the year ofinspection.
Highway Network & Service Classification Grouping
Kilometer/MilePoint roadway kmpost
NBI Item 11 - The linear referencing system (LRS) mile-point/kilometer point is used to establish the location of thebridge on the Base Highway Network--see Item 12. The kilo-meter point coded in this item directly relates to Item 13. Thisitem must be coded for all structures located on or overpassingthe Base Highway Network. Code a 7-digit number to representthe LRS kilometer point distance in kilometers to the nearestthousandth with an assumed decimal point.
National BaseNet roadway onbasenet
NBI Item 12 - This item is to be coded for all records in theinventory. The Base Highway Network includes the throughlane - mainline - portions of the NHS, rural/urban principal arter-ial system, and rural minor arterial system. Ramps, frontage roads,and other roadways are not included in the Base Network. Forthe inventory route identified in Item 5, indicate whether theinventory route is on the Base Highway Network or not on thatnetwork.
LRS InventoryRte roadway lrsinvrt
NBI Item 13A - If Item 12 has been coded 1, the information tobe recorded for this item is inventory route for the State's linearreferencing system (LRS). If Item 12 has been coded 0, this entireitem should be left blank.
Sub# roadway subrtnum
NBI Item 13B - The subroute number is a number that uniquelyidentifies portions of an inventory route section where duplicatekilometer points occur. These subroute numbers, if they exist, areidentified in the State's HPMS-LRS records. If there is no sub-route number, code 00 in this segment.
Toll Facility roadway tollfacNBI Item 20 - The toll status of the structure is indicated by thisitem. Interstate toll segments under Secretarial Agreement shallbe identified separately.
FunctionalClass roadway funcclass NBI Item 26 - Indicates the functional classification of the road-
way.
Traffic Dir-ection roadway trafficdir NBI Item 102 - Code the direction of traffic of the inventory
route identified in Item 5.
Alternate Classifications Grouping
Defense High-way roadway defhwy
NBI Item 100 - This item shall be coded for all records in theinventory. For the purposes of this item, the STRAHNET Con-nectors are considered included in the term STRAHNET.
- 247 -

Inspection > Inventory > Roads Control Information
Control Name TableName
ColumnName Notes
Nat. Hwy Sys-tem roadway nhs_ind
NBI Item 104 - This item is to be coded for all records in theinventory. For the inventory route identified in Item 5, indicatewhether the inventory route is on the NHS or not.
Fed. LandsHwy roadway fedlandhwy
NBI Item 105 - Structures owned by State and local jurisdictionson roads which lead to and traverse through federal lands some-times require special coded unique identification because theyare eligible to receive funding from the Federal Lands HighwayProgram.
Nat. Truck Net-work roadway trucknet
NBI Item 110 - The national network for trucks includes most ofthe Interstate System and those portions of Federal-Aid highwaysidentified in the Code of Federal Regulations--23 CFR 658. Thenational network for trucks is available for use by commercialmotor vehicles of the dimensions and configurations described inthese regulations.
School Bus Rte roadway school_bus School bus route indicator. This flag should be set to 1 if theroadway is on a designated school bus route.
Transit Rte roadway transit_rt Transit bus route indicator. This flag should be set to 1 if theroadway is on a designated transit bus route.
Emergency Rte roadway crit_travCritical travel route indicator. This flag should be set to 1 if theroadway is on a designated critical travel route (e.g., designatedfor use during emergency evacuations).
NBI Rte roadway nbi_rw_flag Specifies whether the roadway should be included in NBI fileexports.
Clearances Grouping
Vertical Clear-ance roadway vclrinv
NBI Item 10 - Code the minimum vertical clearance over theinventory route identified in Item 5, whether the route is on thestructure or under the structure. For structures having multipleopenings, clearance for each opening shall be recorded, but onlythe greatest of the minimum clearances for the two or more open-ings shall be coded regardless of the direction of travel. Thiswould be the practical maximum clearance. When no restrictionexists or when the restriction is 30 meters or greater, code 9999.
HorizontalClearance roadway hclrinv
NBI Item 47 - The total horizontal clearance for the inventoryroute identified in Item 5 should be measured and recorded. Theclearance should be the available clearance measured betweenthe restrictive features and shoulders. When the restriction is 100meters or greater, code 999. The purpose of this item is to givethe largest available clearance for the movement of wide loads.Flush and mountable medians are not considered to be restric-tions.
Widths Grouping
Approach Road roadway aroadwidthNBI Item 32 - Code a 4-digit number to represent the normalwidth of usable roadway approaching the structure measured to
- 248 -

Inspection > Inventory > Roads Control Information
Control Name TableName
ColumnName Notes
the nearest tenth of a meter. Usable roadway width will includethe width of traffic lanes and the widths of shoulders. For struc-tures with medians of any type and double-decked structures,this item should be coded as the sum of the usable roadwaywidths for the approach roadways. When there is a variationbetween the approaches at either end of the structure, record andcode the most restrictive of the approach conditions.
Roadway roadway roadwidth NBI Item 51 - Represents the most restrictive minimum distancebetween curbs or rails on the structure roadway.
Detours Grouping
Length roadway bypasslen
NBI Item 19 - Indicate the actual length to the nearest kilometerof the detour length. The detour length should represent the totaladditional travel for a vehicle which would result from closingof the bridge.
Speed roadway det_speed The speed limit for detouring vehicles.
Accidents Grouping
Count roadway acc_count Average annual accident count for the roadway.
Rate roadway acc_rateAccident rate in number of accidents per 100m VMT. Currentlynot used, but future safety management system interfaces couldprovide this information and lead to improved user cost models.
Roadway Notes Grouping
Roadway Notes roadway notes Roadway notes.
Agency Roadway Fields Grouping
Agency Road-way Field 1 roadway userrwkey1 Agency-defined field 1.
Agency Road-way Field 2 roadway userrwkey2 Agency-defined field 2.
Agency Road-way Field 3 roadway userrwkey3 Agency-defined field 3.
Agency Road-way Field 4 roadway userrwkey4 Agency-defined field 4.
Agency Road-way Field 5 roadway userrwkey5 Agency-defined field 5.
Inspection Header
Bridge bridge bridge_id The agency bridge identification number that is used to identifystructures on most screens and reports.
Facility Carried bridge facility NBI Item 7: The facility carried by the structure.
Inspection DateSelection inspevnt inspkey The inspection key. A unique identifier for the inspections on a
particular structure that includes the date of the inspection.
- 249 -

Inspection > Inventory > Roads Control Information
Control Name TableName
ColumnName Notes
Type inspevnt insptype The primary type of inspection performed.
Inspection Footer
Status inspevnt inspstat The current status of the selected inspection.
Review Needed inspevnt rev_req Indicates whether or not a review of the inspection is required.
Approved By inspevnt inspname The name of the user that approved the inspection report.
- 250 -

Agency Bridge ItemsThe Inspection > Inventory > Agency Bridge Items subtask is an entire page of blank fields that the agency can defineand use for any purpose.
Agency Bridge Items Page ControlsIf changes have been made to the subtask, those changes must be saved before leaving the current page in order for thechanges to be maintained.
The Save button saves the changes made on the current subtask.
The Save & Close button saves the changes made on the current subtask and returns the user to the Bridges > View Listtask.
The Cancel button cancels the changes made on the current subtask and returns the user to the Bridges > View List task.
_______________________________________________________________________
Inspection > Inventory > Agency Items Control Information
Control Name TableName
ColumnName Notes
Agency BridgeItem (1 through
15)bridge
userkey1(replace "1"with 2-15)
This field is available for agencies to define and use for anypurpose.
- 251 -

Inspection > Inventory > Agency Items Control Information
Control Name TableName
ColumnName Notes
Created On bridge createdatetime The date and time the original record was made on the form.
Created By bridge createuserkey The user who made the original record.
Last Updated bridge modtime The date and time of the last update to the record on the form.
Updated By bridge userkey The user who made the last update to the record.
Inspection Header
Bridge bridge bridge_id The agency bridge identification number that is used toidentify structures on most screens and reports.
Facility Carried bridge facility NBI Item 7: The facility carried by the structure.
Inspection DateSelection inspevnt inspkey The inspection key. A unique identifier for the inspections on
a particular structure that includes the date of the inspection.
Type inspevnt insptype The primary type of inspection performed.
Inspection Footer
Status inspevnt inspstat The current status of the selected inspection.
Review Needed inspevnt rev_req Indicates whether or not a review of the inspection is required.
Approved By inspevnt inspname The name of the user that approved the inspection report.
- 252 -

The Inspection > Schedule task allows the user to schedule the upcoming inspections for the selected bridge.
*Note: The Inspection > Schedule task has changed from previous versions of BrM. In the past, the Current Date text-boxes displayed the previous inspection date, not the date of the inspection that was just performed/is being performed.In BrM 5.2.3, the Current Date textboxes display the inspection that was just performed/is being performed, thereforemaking it easier to utilize the Current Date and Frequency textboxes to calculate the Next Date inspection.
SummaryThe Summary grouping contains the information that was entered when the new inspection was created. All of theinformation in the Summary grouping can be modified except for the read-only checkboxes in the Types of InspectionPerformed grouping.
ScheduleThe Schedule grouping is used to determine the selected bridge's upcoming inspection schedules based on inspectiontype.
RequiredCheck the Required checkboxes of the inspections that are required for the selected bridge. Routine and element inspec-tions are required NBI inspections and therefore do not have checkboxes.
Current DateThe Current Date textbox displays the date of the most recent inspection for the selected bridge based on type of inspec-
tion. The date can be entered manually or the icon can be used to select a date. Inspection types that have not beenperformed on the selected bridge will default to "01/01/1901."
- 253 -
Schedule

*Note: As stated earlier, BrM 5.2.3's Current Date textboxes display the inspection that was just performed/is being per-formed.
If the inspection that was just performed/is being performed does not include all of the inspection types, those inspectiontypes' Current Date textboxes will populate with their most recent inspection, if applicable.
FrequencyThe Frequency textbox is used to determine the number of months between inspections based on type of inspection.
Next DateThe Next Date textbox displays the calculated next inspection date based on the Current Date and Frequency inform-
ation. If the calculated date is not the desired date, the date can be entered manually or the icon can be used toselect a date.
Inspection ResourcesThe Inspection Resources grouping is used to indicate the next inspector for the bridge, the bridge group, and the crewhours necessary to complete the inspection.
Schedule Page Controls
The Save button saves the changes made to the schedule.
The Save & Close button saves the changes made to the schedule and returns the user to the Bridges > View List task.
The Cancel button cancels the changes made to the schedule and returns the user to the Bridges > View List task.
The Delete Inspection button deletes the current inspection for the selected bridge.
_______________________________________________________________________
Inspection > Schedule Control Information
ControlName
TableName Column Name Notes
Summary Grouping
DateEntered inspevnt date_entered The date the record was entered.
InspectionDate inspevnt inspdate The date of the inspection.
Inspector inspevnt inspusrguid The user that performed the inspection.
PrimaryType inspevnt insptype Indicates the primary type of inspection that was performed.
InspectionGroup inspevnt inspectcontrolid An agency-defined group for the bridge inspection. Intended for use
in grouping together inspections. Non-NBI field.
- 254 -

Inspection > Schedule Control Information
ControlName
TableName Column Name Notes
Entered By inspevnt entered_by_gd The user that entered the inspection into the system.
Engineer ofRecord inspevnt engineer_of_
record The engineer of record for the inspection.
Types of Inspection Performed Grouping
Routine inspevnt nbinspdone Checked if a routine inspection was performed.
Element inspevnt elinspdone Checked if an element inspection was performed.
FractureCritical inspevnt fcinspdone Checked if a fracture critical inspection was performed.
Underwater inspevnt uwinspdone Checked if an underwater inspection was performed.
Other Spe-cial inspevnt osinspdone Checked if an other special inspection was performed.
Schedule Grouping
RoutineCurrentDate
inspevnt lastinspNBI Item 90: Record the month and year that the last routineinspection of the structure was performed. This inspection date maybe different from those recorded in Item 93.
RoutineFrequency inspevnt brinspfreq NBI Item 91: The routine inspection frequency (in months).
RoutineNext Date inspevnt nextinsp The date of the next scheduled routine inspection. This will auto-
matically populate based on the current date and frequency.
ElementCurrentDate
inspevnt elinspdate Record the month and year that the last element inspection of thestructure was performed.
ElementFrequency inspevnt elinspfreq The element inspection frequency (in months).
ElementNext Date inspevnt elnextdate The date of the next scheduled element inspection. This will auto-
matically populate based on the current date and frequency.
FCRequired inspevnt fcinspreq Specifies whether fracture critical inspections are required for the
structure.
FC CurrentDate inspevnt fclastinsp
NBI Item 93A: Record the month and year that the last fracture crit-ical inspection of the structure was performed. This inspection datemay be different from that recorded in Item 90.
FC Fre-quency inspevnt fcinspfreq NBI Item 92AB: The fracture critical inspection frequency (in
months).
FC NextDate inspevnt fcnextdate The date of the next scheduled fracture critical inspection. This will
automatically populate based on the current date and frequency.
UWRequired inspevnt uwinspreq Specifies whether underwater inspections are required for the struc-
ture.
UW Cur-rent Date inspevnt uwlastinsp
NBI Item 93B: Record the month and year that the last underwaterinspection of the structure was performed. This inspection date may
- 255 -

Inspection > Schedule Control Information
ControlName
TableName Column Name Notes
be different from that recorded in Item 90.
UW Fre-quency inspevnt uwinspfreq NBI Item 92AB: The underwater inspection frequency (in months).
UW NextDate inspevnt uwnextdate The date of the next scheduled underwater inspection. This will
automatically populate based on the current date and frequency.
OSRequired inspevnt osinspreq Specifies whether other special inspections are required for the struc-
ture.
OS CurrentDate inspevnt oslastinsp
NBI Item 93C: Record the month and year that the last other spe-cial inspection of the structure was performed. This inspection datemay be different from that recorded in Item 90.
OS Fre-quency inspevnt osinspfreq NBI Item 92AB: The other special inspection frequency (in
months).
OS NextDate inspevnt osnextdate The date of the next scheduled other special inspection. This will
automatically populate based on the current date and frequency.
Inspection Resources Grouping
NextInspector bridge nextinspid
Non-NBI field maintained by the system by default. BrM auto-matically fills in this field by copying the user key of the persondoing the current inspection. An inspector may change this assign-ment if desired.
BridgeGroup bridge bridgegroup An agency-defined group for the bridge. Intended for use in group-
ing together bridges for inspection purposes. Non-NBI field.
CrewHours bridge crewhrs The number of crew hours required for a regular inspection for the
structure.
FlaggerHours bridge flaggerhrs The number of flagger hours required for a regular inspection for
the structure.
HelperHours bridge helperhrs The number of helper hours required for a regular inspection for the
structure.
SnooperHours bridge snooperhrs The number of snooper hours required for a regular inspection for
the structure.
SpecialCrewHours
bridge spcrewhrs The number of special crew hours required for a regular inspectionfor the structure.
SpecialEquipment
Hoursbridge spequiphrs The number of special equipment hours required for a regular
inspection for the structure.
Schedule Notes Grouping
InspectionScheduleNotes
inspevnt schedule_notes Notes relating to the current inspection's scheduling.
- 256 -

Inspection > Schedule Control Information
ControlName
TableName Column Name Notes
Inspection Header
Bridge bridge bridge_id The agency bridge identification number that is used to identifystructures on most screens and reports.
FacilityCarried bridge facility NBI Item 7: The facility carried by the structure.
InspectionDate Selec-
tioninspevnt inspkey The inspection key. A unique identifier for the inspections on a par-
ticular structure that includes the date of the inspection.
Type inspevnt insptype The primary type of inspection performed.
Inspection Footer
Status inspevnt inspstat The current status of the selected inspection.
ReviewNeeded inspevnt rev_req Indicates whether or not a review of the inspection is required.
ApprovedBy inspevnt inspname The name of the user that approved the inspection report.
- 257 -

The Inspection > Work task allows the user to set up and track work candidates for the selected bridge. The work can-didates can then be viewed and utilized in the Analysis and Projects tabs.
Work CandidatesThe Inspection > Work > Work Candidates subtask is used to create work candidates for the selected bridge.
The Work Candidates grid displays all of the work candidates that have been entered for the selected bridge. The ShowAll and Show Open radio buttons toggle between showing all of the bridge's work candidates and only the work can-didates that have not been completed. The Source dropdown allows the user to filter the Work Candidaes grid based onthe source of the work candidate.
*Note: The Work Candidates grid was not sortable in previous versions of BrM, but version 5.2.3 allows the user to sortthe grid by clicking on any of the grid columns.
Selecting a work candidate from the grid by clicking the icon will reveal the Type of Work grouping where the spe-cifications for the work candidate can be changed.
Click the icon to delete the work candidate.
To add a new work candidate for the selected bridge, click the Add New button.
Type of WorkThe Type of Work grouping is used to determine the details for the selected or new work candidate.
- 258 -
Work
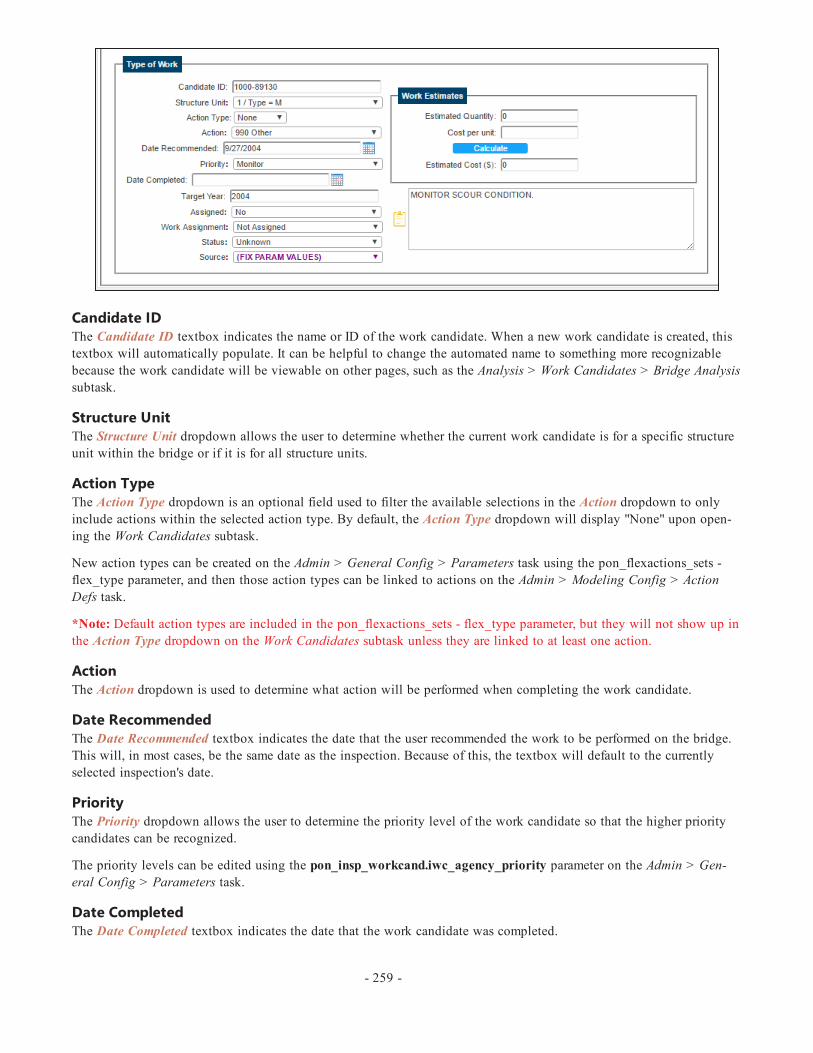
Candidate IDThe Candidate ID textbox indicates the name or ID of the work candidate. When a new work candidate is created, thistextbox will automatically populate. It can be helpful to change the automated name to something more recognizablebecause the work candidate will be viewable on other pages, such as the Analysis > Work Candidates > Bridge Analysissubtask.
Structure UnitThe Structure Unit dropdown allows the user to determine whether the current work candidate is for a specific structureunit within the bridge or if it is for all structure units.
Action TypeThe Action Type dropdown is an optional field used to filter the available selections in the Action dropdown to onlyinclude actions within the selected action type. By default, the Action Type dropdown will display "None" upon open-ing the Work Candidates subtask.
New action types can be created on the Admin > General Config > Parameters task using the pon_flexactions_sets -flex_type parameter, and then those action types can be linked to actions on the Admin > Modeling Config > ActionDefs task.
*Note: Default action types are included in the pon_flexactions_sets - flex_type parameter, but they will not show up inthe Action Type dropdown on the Work Candidates subtask unless they are linked to at least one action.
ActionThe Action dropdown is used to determine what action will be performed when completing the work candidate.
Date RecommendedThe Date Recommended textbox indicates the date that the user recommended the work to be performed on the bridge.This will, in most cases, be the same date as the inspection. Because of this, the textbox will default to the currentlyselected inspection's date.
PriorityThe Priority dropdown allows the user to determine the priority level of the work candidate so that the higher prioritycandidates can be recognized.
The priority levels can be edited using the pon_insp_workcand.iwc_agency_priority parameter on the Admin > Gen-eral Config > Parameters task.
Date CompletedThe Date Completed textbox indicates the date that the work candidate was completed.
- 259 -

*Note: If a work candidate has been completed, the Date Completed textbox must be filled out in order for the work can-didate not to show up in the Work Candidates grid when the Show Open radio button is selected.
Target YearThe Target Year textbox is used to indicate the year in which the work candidate is planned to be completed.
AssignedThe Assigned dropdown is used to indicate the status of the work candidate by selecting whether or not the work hasbeen assigned.
Work AssignmentThe Work Assignment dropdown allows the user to select whether the work will be completed by the agency or by acontractor.
StatusThe Status dropdown is used to determine the current status of the work candidate.
The statuses can be edited using the pon_insp_workcand.iwc_status parameter on the Admin > General Config > Para-meters task.
SourceThe Source dropdown is used to indicate the source of the work candidate or who requested it.
The sources can be edited using the pon_insp_workcand.source parameter on the Admin > General Config > Para-meters task. The default entry for the field will be the default parameter value.
Work EstimatesThe Work Estimates grouping is used to estimate the cost of the work. The estimate can be calculated by completing theEstimated Quantity and Cost Per Unit textboxes, then clicking the Calculate button. This calculated total will thenappear in the Estimated Cost textbox.
*Note: In previous versions of BrM, the Cost Per Unit textbox did not allow for decimals to be entered. This had thepotential to create significant miscalculations for very large estimated quantities. The ability to add decimals has beenincluded in version 5.2.3 to help ensure more accurate calculations.
While the calculation can be used, the Estimated Cost textbox can also be modified without a calculation.
Work Candidate Page Controls
The Save button saves the changes made to the work candidates.
The Save & Close button saves the changes made to the work candidates and returns the user to the Bridges > View Listtask.
The Cancel button cancels the changes made to the work candidates and returns the user to the Bridges > View List task.
The Delete Inspection button deletes the current inspection for the selected bridge.
________________________________________________________________
- 260 -

Inspection > Work > Work Candidates Control Information
Control Name TableName
ColumnName Notes
Type of Work Grouping
Candidate ID pon_insp_workcand
iwc_work-cand_name The name/ID of the work candidate.
Structure Unit pon_insp_workcand
structure_unit_gd
The structure unit of the selected structure relevant to thework candidate. "AllStrUnits" can be selected if the workcandidate applies to the entire structure.
Action pon_insp_workcand
pon_flex-actions_sets_
gdIndicates the action associated with the work candidate.
Date Recom-mended
pon_insp_workcand
iwc_work_rec_date By default, the date that the user creates the work candidate.
Priority pon_insp_workcand
iwc_agency_priority Used to determine the priority level of the work candidate.
Date Completed pon_insp_workcand
iwc_work-comp_date The date that the work candidate was completed.
Target Year pon_insp_workcand
iwc_target_year
The year in which the work candidate is planned to be com-pleted.
Assigned pon_insp_workcand iwc_assigned Determines whether or not the work candidate has been
assigned.
Work Assign-ment
pon_insp_workcand
iwc_work_assigned Determines to whom the work candidate will be assigned.
Status pon_insp_workcand iwc_status Determines the current status of the work candidate.
Source pon_insp_workcand source Indicates the source of the work candidate.
Notes pon_insp_workcand iwc_notes Notes for the work candidate.
Work Estimates Grouping
Estimated Quant-ity
pon_insp_workcand iwc_est_qty The estimated quantity of units needed to perform the work.
Cost Per Unit pon_insp_workcand
iwc_cost_per_unit The estimated cost per unit of performing the work.
Estimated Cost pon_insp_workcand iwc_est_cost The entered or calculated estimated cost to complete the
work candidate.
Inspection Header
Bridge bridge bridge_id The agency bridge identification number that is used toidentify structures on most screens and reports.
Facility Carried bridge facility NBI Item 7: The facility carried by the structure.
Inspection Date inspevnt inspkey The inspection key. A unique identifier for the inspections
- 261 -

Inspection > Work > Work Candidates Control Information
Control Name TableName
ColumnName Notes
Selection on a particular structure that includes the date of the inspec-tion.
Type inspevnt insptype The primary type of inspection performed.
Inspection Footer
Status inspevnt inspstat The current status of the selected inspection.
Review Needed inspevnt rev_req Indicates whether or not a review of the inspection isrequired.
Approved By inspevnt inspname The name of the user that approved the inspection report.
- 262 -
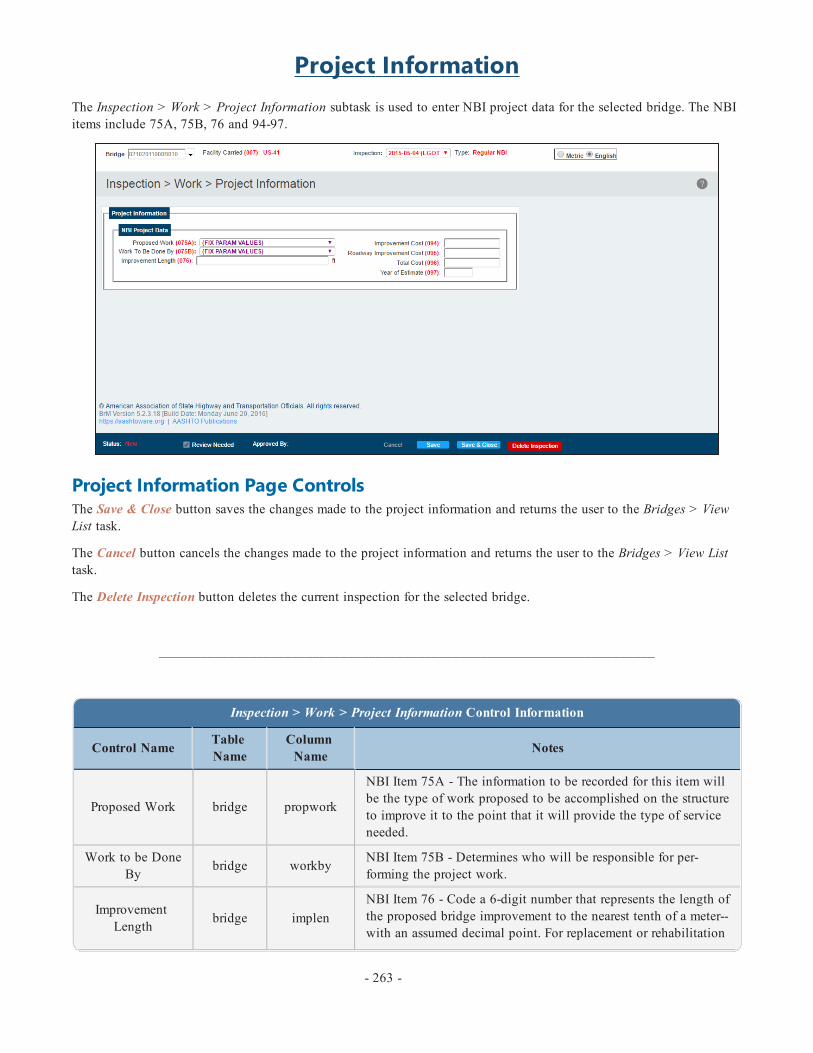
Project InformationThe Inspection > Work > Project Information subtask is used to enter NBI project data for the selected bridge. The NBIitems include 75A, 75B, 76 and 94-97.
Project Information Page ControlsThe Save & Close button saves the changes made to the project information and returns the user to the Bridges > ViewList task.
The Cancel button cancels the changes made to the project information and returns the user to the Bridges > View Listtask.
The Delete Inspection button deletes the current inspection for the selected bridge.
_______________________________________________________________________
Inspection > Work > Project Information Control Information
Control Name TableName
ColumnName Notes
Proposed Work bridge propwork
NBI Item 75A - The information to be recorded for this item willbe the type of work proposed to be accomplished on the structureto improve it to the point that it will provide the type of serviceneeded.
Work to be DoneBy bridge workby NBI Item 75B - Determines who will be responsible for per-
forming the project work.
ImprovementLength bridge implen
NBI Item 76 - Code a 6-digit number that represents the length ofthe proposed bridge improvement to the nearest tenth of a meter--with an assumed decimal point. For replacement or rehabilitation
- 263 -

Inspection > Work > Project Information Control Information
Control Name TableName
ColumnName Notes
of the entire bridge, the length should be back to back of back-walls of abutments or from pavement notch to pavement notch.For replacement or rehabilitation of only part of the structure, usethe length of the portion to be improved.
ImprovementCost bridge nbiimpcost
NBI Item 94 - The estimated cost of the proposed bridge or majorstructure improvements in dollars. This cost shall include onlybridge construction costs, excluding roadway, right of way,detour, demolition, preliminary engineering, etc.
RoadwayImprovement
Costbridge nbirwcost
NBI Item 95 - The cost of the proposed roadway improvement indollars. This shall include only roadway construction costs,excluding bridge, right-of-way, detour, extensive roadway realign-ment costs, preliminary engineering, etc.
Total Cost bridge nbitotcost
NBI Item 96 - The total project cost in dollars, including incid-ental costs not included in Items 94 and 95. This item shouldinclude all costs normally associated with the proposed bridgeimprovement project. The Total Project Cost will therefore usu-ally be greater than the sum of Items 94 and 95. Do not use thisitem for coding maintenance costs.
Year of Estimate bridge nbiyrcost NBI Item 97 - Record and code the year that the costs of workestimated in Items 94, 95, and 96 were based upon.
Inspection Header
Bridge bridge bridge_id The agency bridge identification number that is used to identifystructures on most screens and reports.
Facility Carried bridge facility NBI Item 7: The facility carried by the structure.
Inspection DateSelection inspevnt inspkey The inspection key. A unique identifier for the inspections on a
particular structure that includes the date of the inspection.
Type inspevnt insptype The primary type of inspection performed.
Inspection Footer
Status inspevnt inspstat The current status of the selected inspection.
Review Needed inspevnt rev_req Indicates whether or not a review of the inspection is required.
Approved By inspevnt inspname The name of the user that approved the inspection report.
- 264 -

The Inspection > Multimedia task allows the user to upload any file type to the selected bridge or bridge inspection.There are no restrictions on the type of file that can be uploaded.
Multimedia GridThe Multimedia grid contains all of the files that have been uploaded for the selected bridge or inspection report -determined by the Context dropdown.
ContextThe Context dropdown has two purposes:
1. It toggles the Multimedia grid between displaying the overarching files for the selected bridge and files that arespecifically for the bridge's currently selected inspection report.
2. It determines the purpose of newly uploaded files. If "BRIDGE" is selected in the dropdown, uploading a new filewill be for the bridge overall. If "INSPECTION" is selected in the dropdown, uploading a new file will be for thebridge's currently selected inspection report only.
Root DirectoryThe root directory is the server location for the multimedia files and is displayed next to the Context dropdown.
- 265 -
Multimedia

Grid Description
Agency TypeThe Agency Type dropdown is used to indicate the type of file. The available options can be modified on the Admin >General Config > Parameters task.
Report FlagThe Report Flag checkbox is currently used only for agency customizations to the database.
Sort OrderThe Sort Order textbox determines the order in which the files are listed. If there are images, the first image in the gridwill appear as the first image when the bridge is highlighted on the Bridge List.
LocationThe Location textbox determines the file's location on the server and can be modified.
Agency ItemsThe Agency Item textboxes are agency specific fields to be used as desired.
UnlinkThe icon unlinks the file from the bridge or inspection report. However, it does not delete the file from the server.
NotesThe Notes grouping can be used to enter notes for the selected file.
Document InformationThe Document Information grouping is hidden until a file is selected from the Multimedia grid. It displays details aboutthe file including the file name, location, size, and more.
For image files, an image preview will be displayed. If the file name cannot be found at the file location, an "Image notfound" notice will appear in place of the image preview.
- 266 -
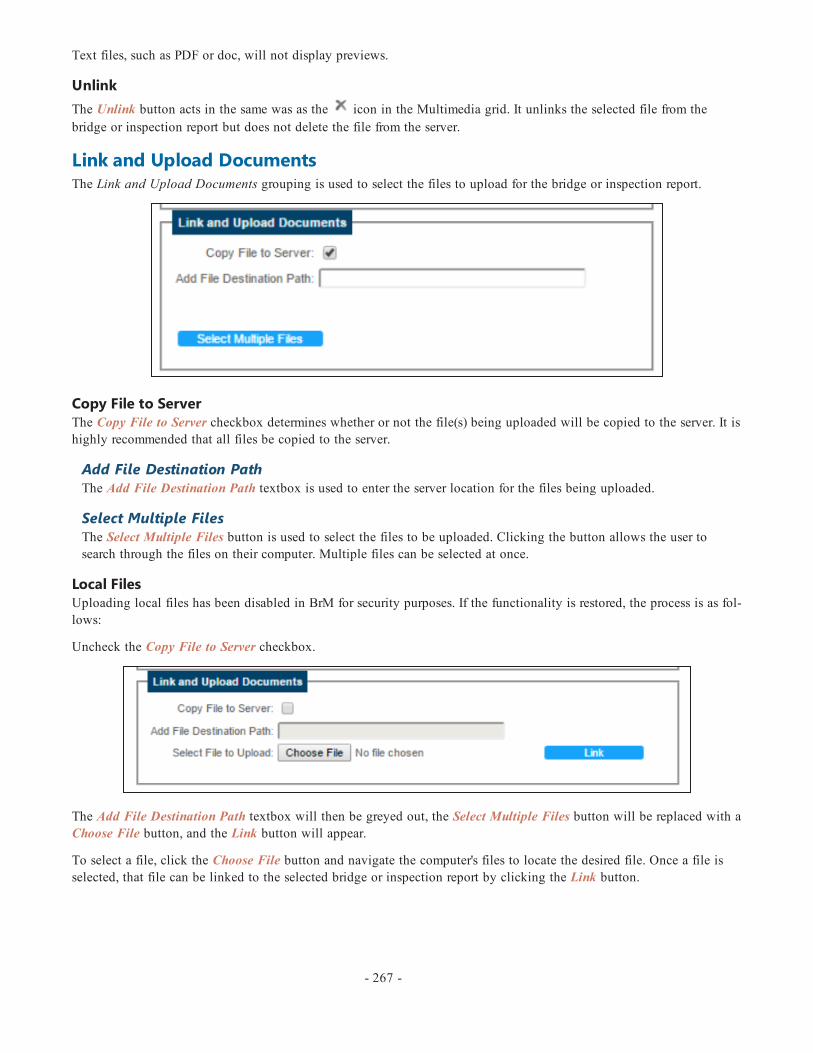
Text files, such as PDF or doc, will not display previews.
UnlinkThe Unlink button acts in the same was as the icon in the Multimedia grid. It unlinks the selected file from thebridge or inspection report but does not delete the file from the server.
Link and Upload DocumentsThe Link and Upload Documents grouping is used to select the files to upload for the bridge or inspection report.
Copy File to ServerThe Copy File to Server checkbox determines whether or not the file(s) being uploaded will be copied to the server. It ishighly recommended that all files be copied to the server.
Add File Destination PathThe Add File Destination Path textbox is used to enter the server location for the files being uploaded.
Select Multiple FilesThe Select Multiple Files button is used to select the files to be uploaded. Clicking the button allows the user tosearch through the files on their computer. Multiple files can be selected at once.
Local FilesUploading local files has been disabled in BrM for security purposes. If the functionality is restored, the process is as fol-lows:
Uncheck the Copy File to Server checkbox.
The Add File Destination Path textbox will then be greyed out, the Select Multiple Files button will be replaced with aChoose File button, and the Link button will appear.
To select a file, click the Choose File button and navigate the computer's files to locate the desired file. Once a file isselected, that file can be linked to the selected bridge or inspection report by clicking the Link button.
- 267 -
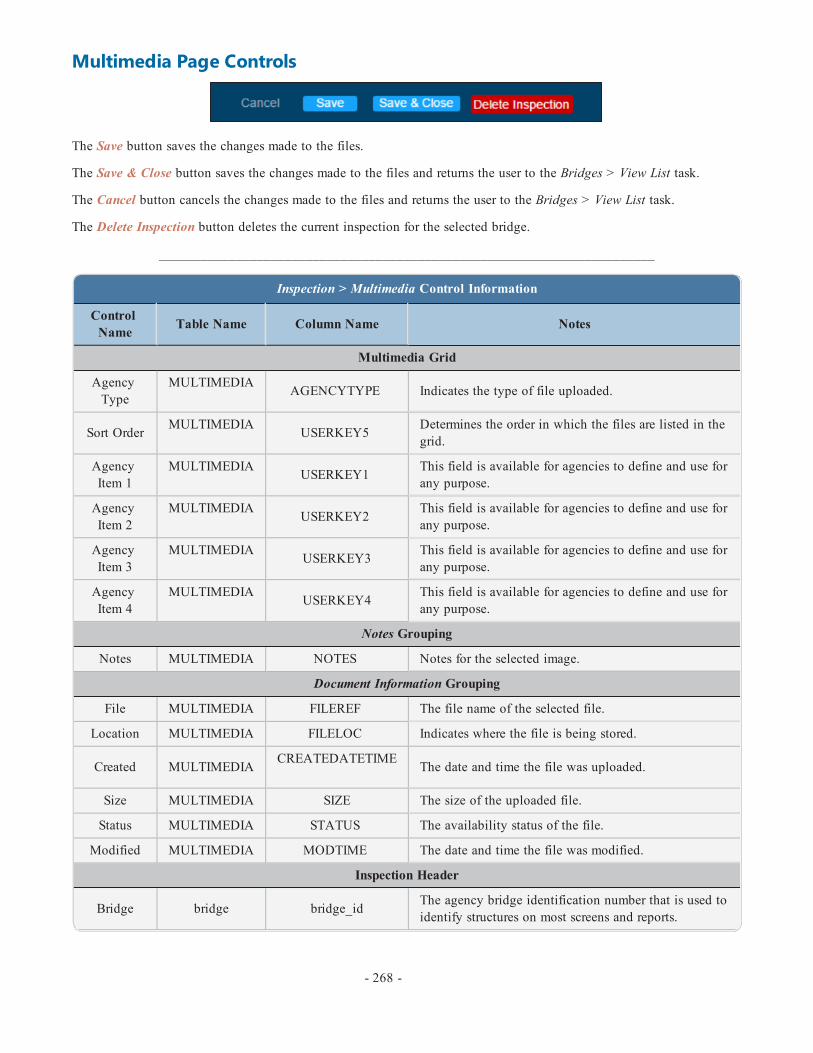
Multimedia Page Controls
The Save button saves the changes made to the files.
The Save & Close button saves the changes made to the files and returns the user to the Bridges > View List task.
The Cancel button cancels the changes made to the files and returns the user to the Bridges > View List task.
The Delete Inspection button deletes the current inspection for the selected bridge.
_______________________________________________________________________
Inspection > Multimedia Control Information
ControlName Table Name Column Name Notes
Multimedia Grid
AgencyType
MULTIMEDIA AGENCYTYPE Indicates the type of file uploaded.
Sort Order MULTIMEDIA USERKEY5 Determines the order in which the files are listed in thegrid.
AgencyItem 1
MULTIMEDIA USERKEY1 This field is available for agencies to define and use forany purpose.
AgencyItem 2
MULTIMEDIA USERKEY2 This field is available for agencies to define and use forany purpose.
AgencyItem 3
MULTIMEDIA USERKEY3 This field is available for agencies to define and use forany purpose.
AgencyItem 4
MULTIMEDIA USERKEY4 This field is available for agencies to define and use forany purpose.
Notes Grouping
Notes MULTIMEDIA NOTES Notes for the selected image.
Document Information Grouping
File MULTIMEDIA FILEREF The file name of the selected file.
Location MULTIMEDIA FILELOC Indicates where the file is being stored.
Created MULTIMEDIA CREATEDATETIME The date and time the file was uploaded.
Size MULTIMEDIA SIZE The size of the uploaded file.
Status MULTIMEDIA STATUS The availability status of the file.
Modified MULTIMEDIA MODTIME The date and time the file was modified.
Inspection Header
Bridge bridge bridge_id The agency bridge identification number that is used toidentify structures on most screens and reports.
- 268 -

Inspection > Multimedia Control Information
ControlName Table Name Column Name Notes
FacilityCarried bridge facility
NBI Item 7: The facility being carried by the structureshall be recorded and coded. In all situations this itemdescribes the use on the structure.
InspectionDate Selec-
tioninspevnt inspkey
The inspection key. A unique identifier for the inspec-tions on a particular structure that includes the date ofthe inspection.
Type inspevnt insptype The primary type of inspection performed.
Inspection Footer
Status inspevnt inspstat The current status of the selected inspection.
ReviewNeeded inspevnt rev_req Indicates whether or not a review of the inspection is
required.
ApprovedBy inspevnt inspname The name of the user that approved the inspection
report.
- 269 -

The Inspection > Assessments task allows the user to create risk assessments for the selected bridge.
Identified RisksThe Identified Risks grouping contains a grid with all of the risks that have been identified for the selected bridge.
Add New AssessmentTo add a new assessment, click the Add New Assessment button. The following popup will appear:
Assessment TypeSelect the desired risk assessment from the Assessment Type dropdown.
- 270 -
Assessments
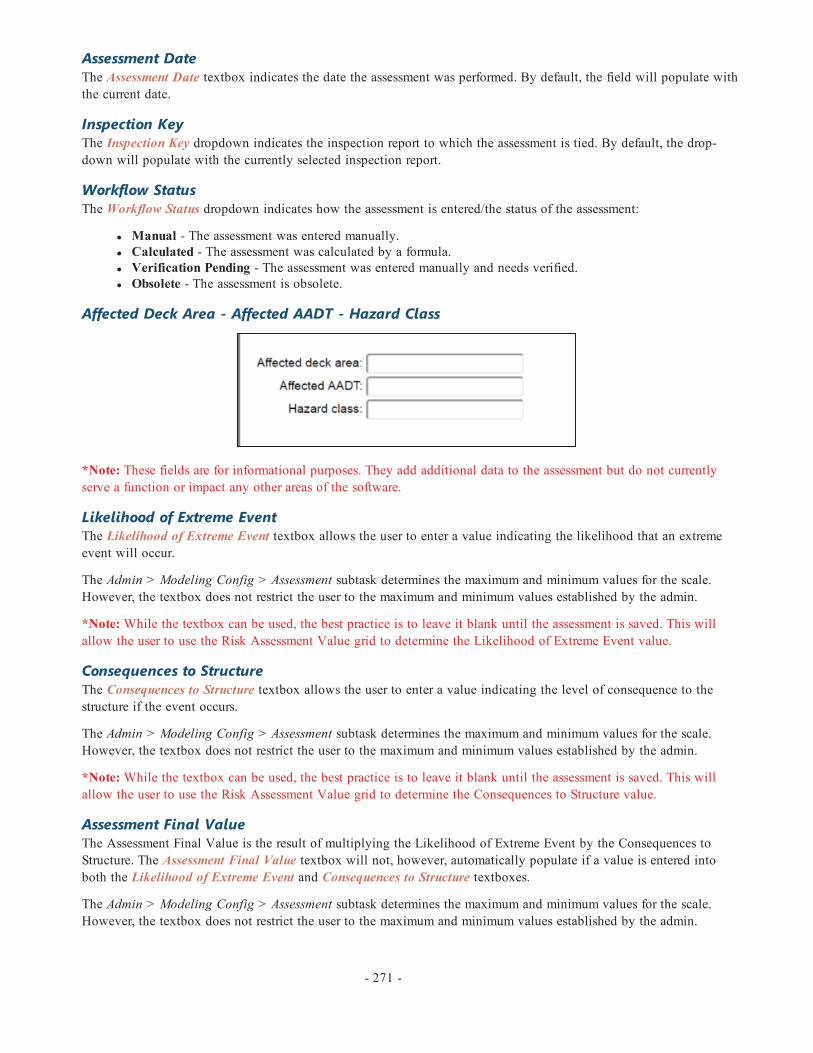
Assessment DateThe Assessment Date textbox indicates the date the assessment was performed. By default, the field will populate withthe current date.
Inspection KeyThe Inspection Key dropdown indicates the inspection report to which the assessment is tied. By default, the drop-down will populate with the currently selected inspection report.
Workflow StatusThe Workflow Status dropdown indicates how the assessment is entered/the status of the assessment:
l Manual - The assessment was entered manually.l Calculated - The assessment was calculated by a formula.l Verification Pending - The assessment was entered manually and needs verified.l Obsolete - The assessment is obsolete.
Affected Deck Area - Affected AADT - Hazard Class
*Note: These fields are for informational purposes. They add additional data to the assessment but do not currentlyserve a function or impact any other areas of the software.
Likelihood of Extreme EventThe Likelihood of Extreme Event textbox allows the user to enter a value indicating the likelihood that an extremeevent will occur.
The Admin > Modeling Config > Assessment subtask determines the maximum and minimum values for the scale.However, the textbox does not restrict the user to the maximum and minimum values established by the admin.
*Note:While the textbox can be used, the best practice is to leave it blank until the assessment is saved. This willallow the user to use the Risk Assessment Value grid to determine the Likelihood of Extreme Event value.
Consequences to StructureThe Consequences to Structure textbox allows the user to enter a value indicating the level of consequence to thestructure if the event occurs.
The Admin > Modeling Config > Assessment subtask determines the maximum and minimum values for the scale.However, the textbox does not restrict the user to the maximum and minimum values established by the admin.
*Note:While the textbox can be used, the best practice is to leave it blank until the assessment is saved. This willallow the user to use the Risk Assessment Value grid to determine the Consequences to Structure value.
Assessment Final ValueThe Assessment Final Value is the result of multiplying the Likelihood of Extreme Event by the Consequences toStructure. The Assessment Final Value textbox will not, however, automatically populate if a value is entered intoboth the Likelihood of Extreme Event and Consequences to Structure textboxes.
The Admin > Modeling Config > Assessment subtask determines the maximum and minimum values for the scale.However, the textbox does not restrict the user to the maximum and minimum values established by the admin.
- 271 -

*Note:While the textbox can be used, the best practice is to leave it blank until the assessment is saved. This willallow the user to use the Risk Assessment Value grid to select the Likelihood of Extreme Event and Consequences toStructure values, which will automatically calculate the Assessment Final Value.
Next Assessment DateThe Next Assessment Date textbox indicates the date the next assessment is scheduled to be performed.
Save/CancelClick the Save button to add the new assessment. This will take the user to the main page where they can use the RiskAssessment Value grid.
Click the Cancel button to cancel the addition of the new assessment.
Delete AssessmentTo delete an assessment, select it from the grid in the Identified Risks grouping and click the Delete button.
Risk DetailsThe Risk Details grouping reveals all of the assessment's details once it is created. It contains all of the same fields as theAdd New Assessment popup, but allows the user to utilize the Risk Assessment Value grid to complete the calculation.
Risk Assessment ValueThe Risk Assessment Value grid can be used to calculate the assessment's final value by determining the Likelihood ofHazard and Consequences of Hazard then locating and selecting where they meet on the grid.
This selection will automatically populate the Likelihood of Hazard, Consequences to Structure, and Assessment FinalValue textboxes below the grid.
Risk DetailsAll of the risk details are the same as those entered in the popup window when adding a new assessment. These detailscan all be changed.
- 272 -

For the Affected Deck Area textbox, using the Metric and English radio buttons at the top of the page will convert theentered value to square meters or square feet.
The only additional control is the Description textbox to be used for entering notes for the assessment.
SaveTo save any changes made to the assessment, click the Save button.
_______________________________________________________________________
Inspection > Assessments Control Information
ControlName
TableName
ColumnName Notes
Risk Details Grouping
VulnerabilityType
pon_defs_assessment asmtdefkey The type of risk assessment being performed.
AssessmentDate
pon_assessment asmtdate
The date of the assessment. The database can store the entire his-tory of assessments on the bridge, but only the most recent isused in the analysis.
AssessmentKey/Date inspevnt inspdate The key and date for the inspection the assessment is attached to.
WorkflowStatus
pon_assessment
workflow_status
The workflow status of the assessment. Currently an information-only field.Verified - Entered or checked manually.Calculated - Record was calculated by a formula.Verification Pending - A manual check is pending (required butnot completed).Obsolete - The assessment is obsolete.
AffectedDeck Area
pon_assessment
affected_deck_area
The percent of deck area affected. This allows for hazards toaffect only a portion of the structure. Currently an information-only field.
AffectedAADT
pon_assessment affected_aadt
The percent of AADT exposed to the hazard. Allows for hazardsto affect only a portion of traffic flow. Currently an information-only field.
Hazard class pon_assessment hazard_class The classification of the structure into hazard zones or classes for
the type of risk assessment represented.
Likelihood ofHazard
pon_assessment likelihood
A quantitative estimate or score for the likelihood of an extremeevent. Display and editing are governed by pon_defs_assess-ment.flag_likelihood.
Consequencesto Structure
pon_assessment consequences
A quantitative estimate or score for the consequences to the struc-ture of an extreme event. Display and editing are governed bypon_defs_assessment.flag_consq.
AssessmentFinal Value
pon_assessment asmt_value
A quantitative estimate or score for the overall assessment. Dis-play and editing are governed by pon_defs_assessment.flag_value.
- 273 -

Inspection > Assessments Control Information
ControlName
TableName
ColumnName Notes
Next Assess-ment Date
pon_assessment
next_asmt_date
The date when the next assessment is to be undertaken. Currentlyan information-only field.
Description pon_assessment description A description of the assessment.
Inspection Header
Bridge bridge bridge_id The agency bridge identification number that is used to identifystructures on most screens and reports.
Facility Car-ried bridge facility NBI Item 7: The facility carried by the structure.
- 274 -

The Inspection > Element Condition Ratings task displays a read-only history of both the NBI ratings and element con-ditions for the selected bridge. Users can utilize this page to view how a bridge's NBI ratings or element conditions havechanged over time.
- 275 -
Element Condition Ratings

Gateway- The Gateway section of the manual addresseseach of the tasks in BrM's Gateway tab. TheGateway tab provides the tools to import andexport data between BrM and other systems.

The Gateway > Export task allows the user to export the data determined on the Admin > General Config > ExportOptions task to various export files.
Export ControlsSelected BridgesThe Selected Bridges grid displays all of the bridges currently selected on the Bridge List. It is only visible when at leastone bridge is selected.
Export What?The Export What? dropdown is used to pick the type of export file that will be created. The options include: XML,non-compressed XML, PDI, custom PDI, a metric NBI file, and an NBE file.
The inputs for the NBI and NBE files are set, therefore the Include: dropdown is read only for those exports because noselection needs to be made from it.
If the NBE file is selected, a new option will appear in the Export Which Bridges? grouping.
- 277 -
Export
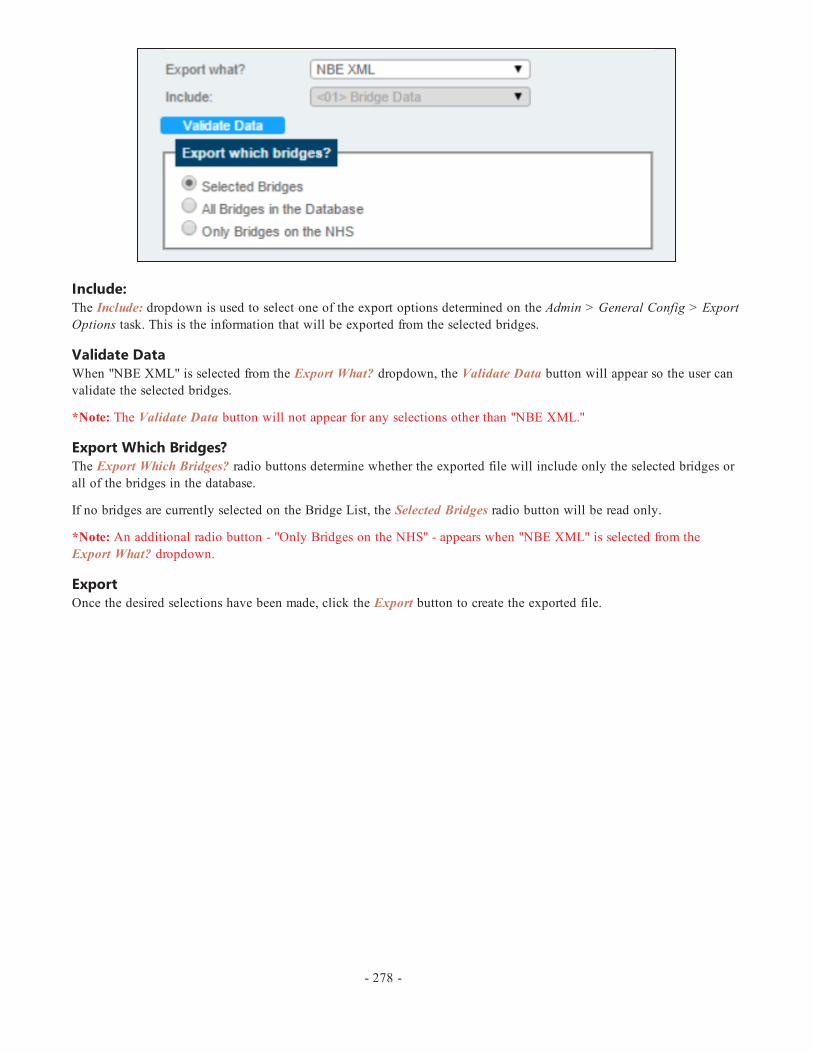
Include:The Include: dropdown is used to select one of the export options determined on the Admin > General Config > ExportOptions task. This is the information that will be exported from the selected bridges.
Validate DataWhen "NBE XML" is selected from the Export What? dropdown, the Validate Data button will appear so the user canvalidate the selected bridges.
*Note: The Validate Data button will not appear for any selections other than "NBE XML."
Export Which Bridges?The Export Which Bridges? radio buttons determine whether the exported file will include only the selected bridges orall of the bridges in the database.
If no bridges are currently selected on the Bridge List, the Selected Bridges radio button will be read only.
*Note: An additional radio button - "Only Bridges on the NHS" - appears when "NBE XML" is selected from theExport What? dropdown.
ExportOnce the desired selections have been made, click the Export button to create the exported file.
- 278 -

The Gateway > Import task allows the user to import various file types to the database.
Import ControlsImport What?The Import what? dropdown allows the user to choose the type of file that will be imported. The options include PDI,NBI, and XML files.
Input File:The Input File: field displays the file that has been selected. To select a file, click the Select button and locate thedesired file.
OptionsThe Options grouping contains the options available for the import of an NBI File. It will be read only for PDI andXML files.
The Update Only checkbox will update the database based on the imported NBI file.
The Create New Inspections checkbox will create new inspections based on the imported NBI file.
The Import UOM radio buttons allow the user to choose which units to use for the import.
ImportOnce the desired selections have been made, click the Import button to import the selected file.
- 279 -
Import

The Gateway > Check Out task allows the user to check out bridges from the system. Checking out a bridge can bethought of as locking the bridge. It does not mean that updates cannot be made to the bridge once it's checked out, butrather that any updates made will have to be accepted once the bridge is checked back in.
Check Out ControlsSelected BridgesThe Selected Bridges grouping displays all of the bridges currently selected on the Bridge List. It is only visible when atleast one bridge is selected.
Check Out What?The Check Out What? dropdown is used to determine the file type that will be created with the check out.
Include:The Include: dropdown is used to determine what information about the selected bridges will be checked out for the PDIfile. This option is read only for custom PDI files.
Check Out Which Bridges?The Check Out Which Bridges? radio buttons determine which bridges will be checked out. If no bridges are currentlyselected on the Bridge List, the Selected Bridges radio button will be read only.
Check OutOnce the desired selections have been made, click the Check Out button to check out the selected bridges.
*Note: The following will occur if WARNONEDITFORCHECKEDOUTBRIDGE is set to "Y" on the Admin > GeneralConfig > Options task:
When entering the Inspection module with a checked out bridge selected, a popup message will notify the user of the
bridge's status and a symbol will appear next to the bridge's ID in the Inspection module header.
- 280 -
Check Out
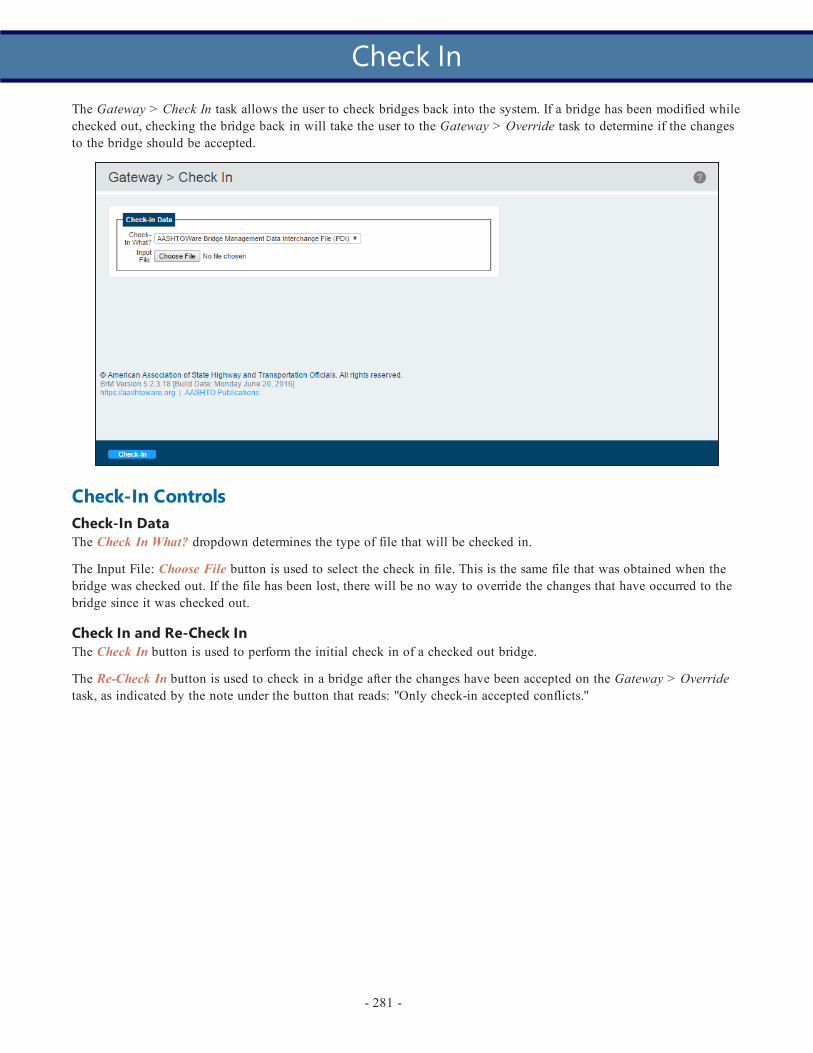
The Gateway > Check In task allows the user to check bridges back into the system. If a bridge has been modified whilechecked out, checking the bridge back in will take the user to the Gateway > Override task to determine if the changesto the bridge should be accepted.
Check-In ControlsCheck-In DataThe Check In What? dropdown determines the type of file that will be checked in.
The Input File: Choose File button is used to select the check in file. This is the same file that was obtained when thebridge was checked out. If the file has been lost, there will be no way to override the changes that have occurred to thebridge since it was checked out.
Check In and Re-Check InThe Check In button is used to perform the initial check in of a checked out bridge.
The Re-Check In button is used to check in a bridge after the changes have been accepted on the Gateway > Overridetask, as indicated by the note under the button that reads: "Only check-in accepted conflicts."
- 281 -
Check In

The Gateway > Override task allows the user to decide whether or not to accept the changes that have been made to abridge since it's been checked out.
Override ControlsPDI SelectionUse the PDI dropdown to select the PDI to view. The name of the PDI will match that of the PDI that was checked in.
DisplayUse the Display radio buttons to show either all of the rows or only the rows with changes that have been unaccepted.The table will indicate if there is nothing to display for the selected radio button.
Delete All RowsThe Delete All Rows for this PDI File button will delete all of the displayed rows in the list for the selected radio but-ton.
l If the Delete button is clicked when the All Rows radio button is selected, all of the rows within the All Rowslist will be transferred to the Unaccepted Rows list.
l If the Delete button is clicked when the Unaccepted Rows radio button is selected, all of the rows within theUnaccepted Rows list will be deleted.
If there are no more rows listed in both the All Rows list and the Unaccepted Rows list, the PDI will automatically beremoved from the Gateway > Override task.
- 282 -
Override

Accept, Accept All, and CloseThe Accept button accepts all of the checked rows for the selected PDI. The changes that occurred to the bridge whilechecked out will be made permanent when the bridge is re-checked in to the system on the Gateway > Check In task.
The Accept All button accepts all of the displayed rows, regardless of check status, for the selected PDI. The changesthat occurred to the bridge while checked out will be made permanent when the bridge is re-checked in to the system onthe Gateway > Check In task.
Selecting the Cancel button cancels the currently selected PDI's changes (prior to being accepted) and returns the user tothe All Rows list of the first PDI listed in the PDI dropdown.
- 283 -

Import/ExportThe Gateway > Tunnels > Import/Export task allows the user to import and export tunnel data as well as to create newasset types.
Tunnel Import/ExportThe Mode dropdown determines whether the user will be importing/exporting tunnel data or whether they intend towork with new asset types.
For tunnel data using "NTIS XML":
ImportThe Import grouping is used to import a file from the user's computer to the system. The import will accept XLS andXML files.
The XLS import option is meant mainly to simplify an agency's initial tunnel inventory import by allowing them to usethe tunnel inventory data XLS file that was distributed to agencies in 2015.
The XML import option is for importing the generated XML file after it has been exported and needs imported to the sys-tem again.
To import a file, click the Choose File button to locate the desired file from the computer and then click the Import but-ton.
ExportThe Export grouping is used to export National Tunnel Inventory (NTI) data from the system into an XML file.
To export a file, begin by choosing which files to export using the Export dropdown. If "Selected Tunnels" is selected,only the tunnels selected on the Tunnels > Tunnel List task will be included in the data export.
Click the Export button to create the XML file.
- 284 -
Tunnels

Mode: Multi-Asset XMLThe "Multi-Asset XML" selection in the Mode dropdown exists for users to create new asset types in the system.
However, creating a new asset type requires more than performing an import. Outside of this task, the user must createnew database tables and web forms to support the new asset type.
There are two types of multi-asset import/export to select:
l Definition - This is the blueprint for the asset type that determines what data will be collected.l Data - This is the actual data for the asset type.
*Note: Additional information will be provided on this topic as the scope of its abilities expand.
- 285 -

Analysis- The Analysis section of the manual addresseseach of the tasks in BrM's Analysis tab. TheAnalysis tab allows for an in-depth view of astructure's current condition and how it will bechanged through deterioration and workcandidates.

The Analysis > Work Candidates task allows the user to analyze a bridge's deterioration and utility values before andafter work candidates are performed.
Bridge AnalysisThe Analysis > Work Candidates > Bridge Analysis subtask analyzes the effect of work candidates on the selectedbridge. Only work candidates that have been added to the selected bridge on the Inspection > Work > Work Candidatessubtask can be used on the Bridge Analysis subtask.
Bridge SummaryThe top portion of the Bridge Analysis subtask contains a summary of the selected bridge including descriptive inform-ation, the scaled performance, sufficiency, conditions, and recently completed work.
UtilityThe Utility grouping allows the user to change the utility weights profile used in the bridge analysis. Utility weights arecreated and edited on the Admin > Modeling Config > Weights Profile. The utility weights profiles can change both theperformance of the overall bridge and the performance of the work candidates.
- 287 -
Work Candidates

Use the Utility Profile dropdown to select the desired utility weights profile for the bridge analysis.
NBI ModelingThe Bridge Analysis task can estimate the bridge's future NBI component ratings. The NBI Modeling grouping allows theuser to select how that estimate will be determined, either using an NBI converter profile or component level deteri-oration.
The NBI Deterioration Method dropdown allows the user to model the NBI component deterioration in two differentways:
l NBI Converter - This option allows the user to select an NBI converter profile (created on the Admin > Model-ing Config > NBI Conversion Profiles task) to forecast the element ratings.
l Component-Level Deterioration - This option uses the component-level deterioration models established on theAdmin > Modeling Config > NBI Deterioration Models subtask.
The difference between the two NBI deterioration method types can be viewed in the Deterioration Charts and Effectson Each Utility Criterion groupings.
Work Candidates GridThe Work Candidates grid contains all of the work candidates that have been added to the selected bridge. In order forwork candidates to appear on the Bridge Analysis subtask, the following steps must be taken on other pages throughoutthe software:
1. Add a benefit group via Admin > Modeling Config > Benefit Group.2. Link the benefit group to specific actions via Admin > Modeling Config > Action Defs.3. Add work candidates and assign them to actions for a specific bridge via Inspection > Work > Work Candidates.
The Work Candidates grid shows the bridge's base utility and current values for utility, condition, mobility, and riskwith the difference between the current and predicted values shown in parenthesis. It also reveals the estimated cost tocomplete the work candidate, the estimated benefit of the action for the cost, the year targeted to complete the work can-didate, and the interval (in years) to repeat the work candidate.
The only editable fields in the Work Candidates grid are the Cost, Target Year, and Repeat Interval textboxes:
- 288 -

l Cost - The estimated cost of completing the work candidate.l Target Year - The year in which the work candidate is planned to be completed.l Repeat Interval - The recommended interval of time for repeating the work candidate in the future.
Checking the Select checkbox for one or more candidates in the grid updates the Effects on Each Element, DeteriorationCharts, Effects on Each Utility Criterion, and Deterioration Results groupings. The groupings will update each time awork candidate is selected/unselected.
Add to New ProjectThe Add to New Project button can be used to create a new project by checking the desired work candidates from thegrid and then clicking the button. This will take the user to the Projects > Create/Edit Project task. Projects are a wayfor agencies to organize and plan related work on specific bridges.
Add New GroupThe Add New Group button can be used to create a new work candidate comparison group or add work candidates to anexisting work candidate comparison group by checking the desired work candidates from the grid and then clicking thebutton. Work candidate groups are used to group together work candidates that represent a work plan and then comparethe different work plans for the selected bridge. With one or more work candidates selected, clicking the Add NewGroup button will reveal the following popup:
To add the selected work candidates to an existing comparison group, select the comparison group from the Work Can-didate Group dropdown, then click the Save button.
To create a new comparison group, leave "Create a new group" selected and use the Save New Group As textbox toname the new comparison group, then click the Save button.
The work candidate comparison groups can then be compared on the Analysis > Work Candidates > ComparisonGroups subtask.
Deterioration ChartsThe Deterioration Charts grouping contains bridge and element graphs that display the deterioration modeling with andwithout the selected work candidates.
- 289 -

Each graph will have two curves:
l Red - The original deteriorationl Blue - The deterioration with the selected work candidates being performed at the designated intervals
Depending on the effect of the work candidate and the interval at which it is being performed, the blue curve shoulddeteriorate at a slower rate than the red curve and should have periodic spikes of improvement. Clicking on the name ofthe curve within the key - Work or Original - will remove that curve from the graph until the name is clicked again.
Effects on Each ElementThe Effects on Each Element grouping contains a grid that displays the effects of the selected work candidates on indi-vidual elements. The grid uses a color-coded system to display the elements' current conditions and then the effect of theselected work candidates on them.
l Green - Condition State 1l Yellow - Condition State 2l Orange - Condition State 3l Red - Condition State 4
Checking the Show Changed checkbox updates the grid to show only the elements that have changed due to the workcandidates.
- 290 -

Elements with a ">" next to them can be expanded to reveal the protective systems and defects associated with them.Selecting an element or protective system will display the expected deterioration of the element in the Element graph inthe Deterioration Charts grouping. Defects are not currently incorporated into deterioration calculations.
Effects on Each Utility CriterionThe Effects on Each Utility Criterion grouping contains a grid that displays the effect the selected work candidates haveon the bridge's utility criteria. The Before WC and After WC columns allow the user to compare the before and aftereffects of the work candidate. The hierarchy displayed under Total Utility is determined by the criteria entered in theAdmin > Modeling Config > Utility task.
Checking the Show Changed checkbox updates the grid to show only the criteria that have changed due to the work can-didates.
Deterioration ResultsThe Deterioration Results grouping contains a grid to compliment the Deterioration Charts grouping by providing thedeterioration values for every point on the deterioration chart.
- 291 -

The calculated values are shown through the following columns:
l Original H.I - The original health indexl Work H.I. - The health index after the performance of the selected work candidatesl H.I. Diff. - The difference between the work and original health index
Bridge Analysis Page ControlsEven though the Bridge Analysis subtask is primarily for viewing purposes, the Save, Save & Close, and Cancel buttonsexist because the Cost, Target Year, and Repeat Interval textboxes can be edited in the Work Candidates grid.
Clicking the Save button saves the changes made to the above-mentioned fields.
Clicking the Save & Close button saves the changes made to the above-mentioned fields and takes the user to the Pro-jects > Project List task.
Clicking the Cancel button cancels the changes made to the above-mentioned fields and takes the user to the Projects >Project List task.
- 292 -

Reverse CalculationThe Analysis > Work Candidates > Reverse Calculation subtask provides nearly the same functionality as the BridgeAnalysis subtask but operates differently. The Bridge Analysis subtask analyzes only the work candidates that have beenadded to the selected bridge, while the Reverse Calculation subtask analyzes all of the possible actions that will pos-itively affect the performance of the selected bridge based on its components and elements.
Bridge SummaryThe top portion of the Reverse Calculation subtask contains a summary of the selected bridge including descriptiveinformation, the scaled performance, sufficiency, conditions, and recently completed work.
NBI ModelingThe Reverse Calculation task can estimate the bridge's future NBI component ratings. The NBI Modeling groupingallows the user to select how that estimate will be determined, either using an NBI converter profile or component leveldeterioration.
- 293 -

The NBI Deterioration Method dropdown allows the user to model the NBI component deterioration in two differentways:
l NBI Converter - This option allows the user to select an NBI converter profile (created on the Admin > Model-ing Config > NBI Conversion Profiles task) to forecast the element ratings.
l Component-Level Deterioration - This option uses the component-level deterioration models established on theAdmin > Modeling Config > NBI Deterioration Models subtask.
The difference between the two NBI deterioration method types can be viewed in the Deterioration Charts and Effectson Each Utility Criterion groupings.
Actions Existing for Selected BridgeThe Actions Existing for Selected Bridge grid displays all of the actions that will positively affect the performance of theselected bridge based on its components and elements.
Checking the Show All Defined Actions checkbox will reveal all actions relevant to the bridge regardless of whether ornot the action will have a positive impact.
The Actions Existing for Selected Bridge grid shows the bridge's base utility and current values for utility, condition,mobility, and risk with the difference between the current and predicted values shown in parenthesis. It also reveals theestimated cost to complete the action, the estimated benefit of the action for the cost, the year targeted to complete theaction, and the interval (in years) to repeat the action.
The only editable fields in the Actions Existing for Selected Bridge grid are the Cost, Target Year, and Repeat Intervaltextboxes:
l Cost - The estimated cost of completing the action.l Target Year - The year in which the action is planned to be completed.l Repeat Interval - The recommended interval of time for repeating the action in the future.
Checking the Select checkbox for one or more action in the grid updates the Effects on Each Element, DeteriorationCharts, Effects on Each Utility Criterion, and Deterioration Results groupings. The groupings will update each time anaction is selected/unselected.
Add to New ProjectThe Add to New Project button can be used to create a new project by checking the desired actions from the grid andthen clicking the button. This will take the user to the Projects > Create/Edit Project task. Projects are a way for agen-cies to organize and plan related work on specific bridges.
- 294 -

Deterioration ChartsThe Deterioration Charts grouping contains bridge and element graphs that display the deterioration modeling with andwithout the selected actions.
Each graph will have two curves:
l Red - The original deteriorationl Blue - The deterioration with the actions being performed at the designated intervals
Depending on the effect of the action and the interval at which it is being performed, the blue curve should deteriorateat a slower rate than the red curve and should have periodic spikes of improvement. Clicking on the name of the curvewithin the key - Work or Original - will remove that curve from the graph until the name is clicked again.
Effects on Each ElementThe Effects on Each Element grouping contains a grid that displays the effects of the selected actions on individual ele-ments. The grid uses a color-coded system to display the elements' current conditions and then the effect of the selectedactions on them.
l Green - Condition State 1l Yellow - Condition State 2l Orange - Condition State 3l Red - Condition State 4
- 295 -
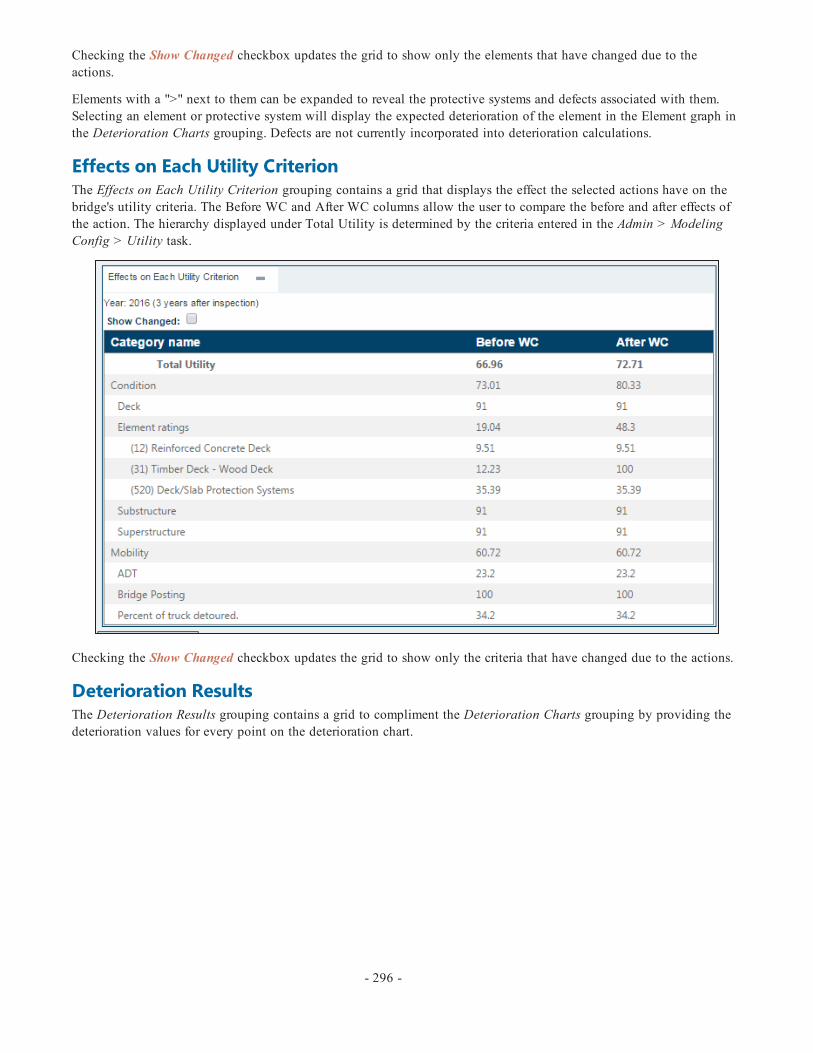
Checking the Show Changed checkbox updates the grid to show only the elements that have changed due to theactions.
Elements with a ">" next to them can be expanded to reveal the protective systems and defects associated with them.Selecting an element or protective system will display the expected deterioration of the element in the Element graph inthe Deterioration Charts grouping. Defects are not currently incorporated into deterioration calculations.
Effects on Each Utility CriterionThe Effects on Each Utility Criterion grouping contains a grid that displays the effect the selected actions have on thebridge's utility criteria. The Before WC and After WC columns allow the user to compare the before and after effects ofthe action. The hierarchy displayed under Total Utility is determined by the criteria entered in the Admin > ModelingConfig > Utility task.
Checking the Show Changed checkbox updates the grid to show only the criteria that have changed due to the actions.
Deterioration ResultsThe Deterioration Results grouping contains a grid to compliment the Deterioration Charts grouping by providing thedeterioration values for every point on the deterioration chart.
- 296 -

The calculated values are shown through the following columns:
l Original H.I - The original health indexl Work H.I. - The health index after the performance of the selected actionsl H.I. Diff. - The difference between the work and original health index
Reverse Calculation Page ControlsEven though the Reverse Calculation subtask is primarily for viewing purposes, the Save, Save & Close, and Cancel but-tons exist because the Cost, Target Year, and Repeat Interval textboxes can be edited in the actions grid.
Clicking the Save button saves the changes made to the above-mentioned fields.
Clicking the Save & Close button saves the changes made to the above-mentioned fields and takes the user to the Pro-jects > Project List task.
Clicking the Cancel button cancels the changes made to the above-mentioned fields and takes the user to the Projects >Project List task.
- 297 -

Needs ListThe Analysis > Work Candidates > Needs List subtask is used to view and filter the work candidates in the database.
Filter and LayoutThe Filter and Layout dropdowns determine which work candidates will be displayed and the information that will beincluded. Filters can be created using the "Needs List" context on the Manage Filters task. Layouts can be created usingthe "Needs List" context on the Manage Layouts task. Filters can also be created using the Work Candidates Quick Fil-ter below the dropdowns.
When the desired selections have been made, click the Apply button to update the grid.
Work Candidates Quick FilterThe Work Candidates Quick Filter allows the user to create custom filters for the grid by entering specific information.
The Filter Results button allows the user to view the filtered results before saving to ensure the desired selections havebeen made. Once satisfied, enter a name into the Save As textbox and click the Save button to save the filter. If the filtershould be made available for other users, check the Share checkbox before saving.
Work Candidates Information GridThe Work Candidates Information grid will display the applied filter and layout. Depending on the filter, the grid willcontain all of the work candidates in the database.
The Delete button for each work candidate listed allows the user to delete the work candidate from the database.
- 298 -
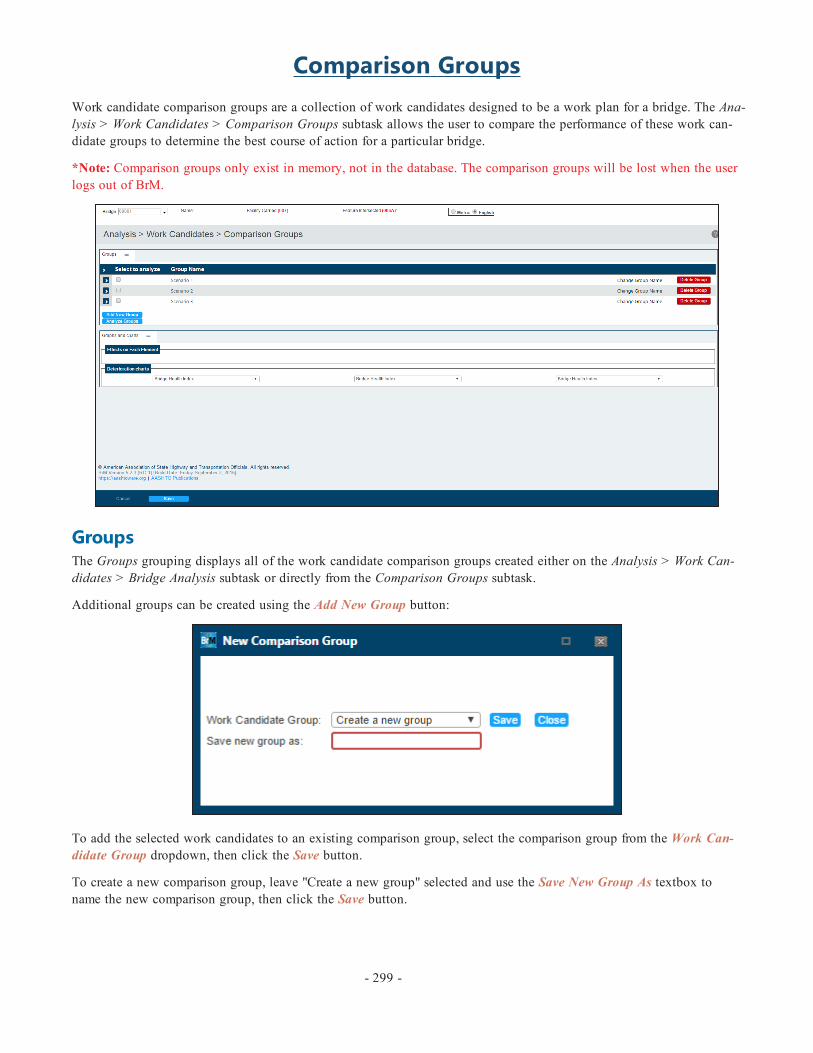
Comparison GroupsWork candidate comparison groups are a collection of work candidates designed to be a work plan for a bridge. The Ana-lysis > Work Candidates > Comparison Groups subtask allows the user to compare the performance of these work can-didate groups to determine the best course of action for a particular bridge.
*Note: Comparison groups only exist in memory, not in the database. The comparison groups will be lost when the userlogs out of BrM.
GroupsThe Groups grouping displays all of the work candidate comparison groups created either on the Analysis > Work Can-didates > Bridge Analysis subtask or directly from the Comparison Groups subtask.
Additional groups can be created using the Add New Group button:
To add the selected work candidates to an existing comparison group, select the comparison group from the Work Can-didate Group dropdown, then click the Save button.
To create a new comparison group, leave "Create a new group" selected and use the Save New Group As textbox toname the new comparison group, then click the Save button.
- 299 -

To edit an existing comparison group, click the icon to expand the comparison group to display all of the availablework candidates for the selected bridge:
Use the work candidates' checkboxes to select/unselect work candidates for the expanded comparison group. The Cost,Target Year, and Repeat Interval textboxes can be edited if desired.
Once ready to analyze, check the boxes of the comparison groups to analyze and click the Analyze Groups button.
*Note: Only three groups can be analyzed at a time.
Graphs and ChartsThe Graphs and Charts grouping contains various tools to compare the selected comparison groups.
Effects on Each ElementThe Effects on Each Element grouping contains a grid that displays the effects of the comparison groups on individualelements. The grid uses a color-coded system to display the elements' current conditions and then the effect of the work.
l Green - Condition State 1l Yellow - Condition State 2l Orange - Condition State 3l Red - Condition State 4
- 300 -
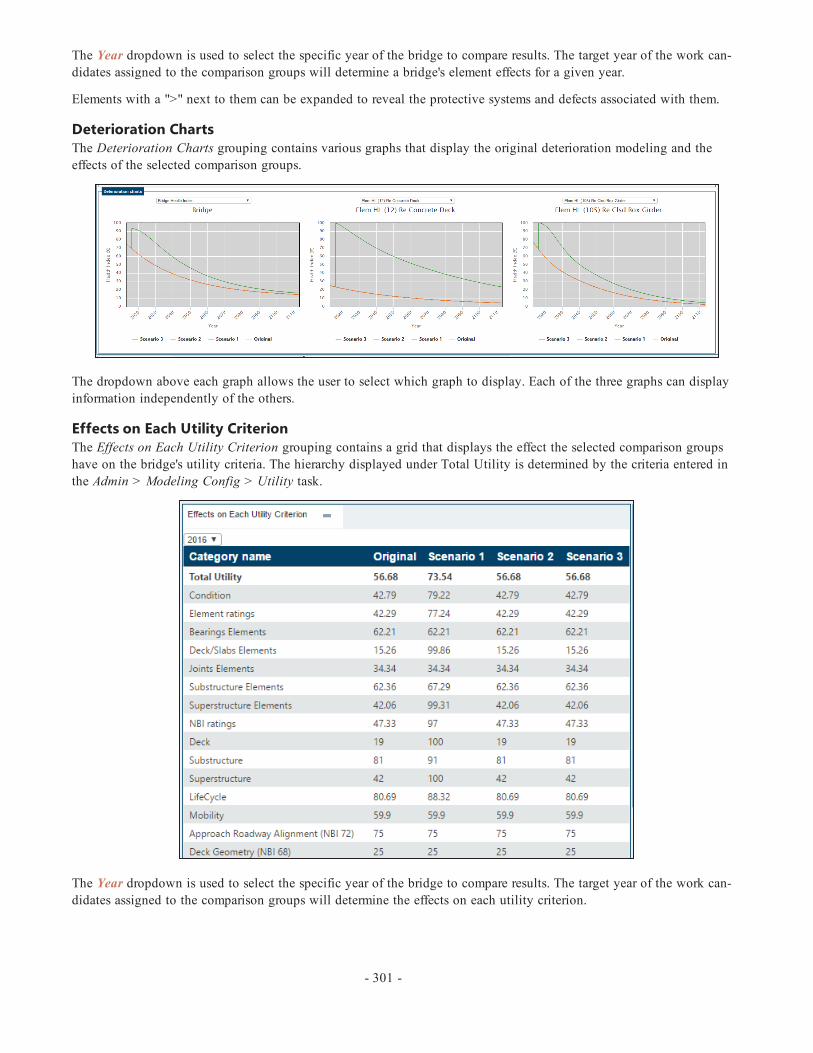
The Year dropdown is used to select the specific year of the bridge to compare results. The target year of the work can-didates assigned to the comparison groups will determine a bridge's element effects for a given year.
Elements with a ">" next to them can be expanded to reveal the protective systems and defects associated with them.
Deterioration ChartsThe Deterioration Charts grouping contains various graphs that display the original deterioration modeling and theeffects of the selected comparison groups.
The dropdown above each graph allows the user to select which graph to display. Each of the three graphs can displayinformation independently of the others.
Effects on Each Utility CriterionThe Effects on Each Utility Criterion grouping contains a grid that displays the effect the selected comparison groupshave on the bridge's utility criteria. The hierarchy displayed under Total Utility is determined by the criteria entered inthe Admin > Modeling Config > Utility task.
The Year dropdown is used to select the specific year of the bridge to compare results. The target year of the work can-didates assigned to the comparison groups will determine the effects on each utility criterion.
- 301 -

Deterioration ResultsThe Deterioration Results grouping contains a grid to compliment the health index graph in the Deterioration Chartsgrouping by providing the deterioration values for every point on the deterioration chart.
Comparison Group Page ControlsClicking the Save button saves the changes made to the comparison groups.
*Note: Comparison groups are only saved during the user's current session. The comparison groups will be lost when theuser logs out of BrM.
Clicking the Cancel button cancels the changes made to the comparison groups.
- 302 -

The Analysis > Utility Value task allows the user to view the selected bridge's utility value and provides a breakdown ofthe criteria from the Admin > Modeling Config > Utility task.
- 303 -
Utility Value
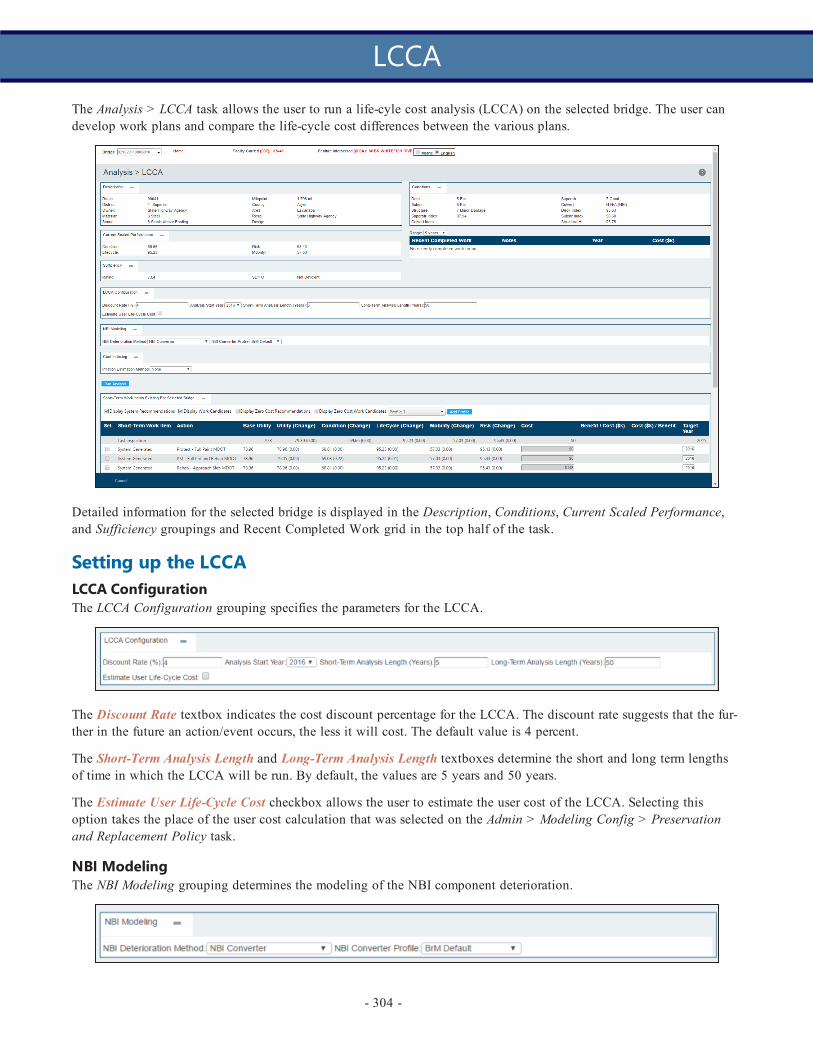
The Analysis > LCCA task allows the user to run a life-cyle cost analysis (LCCA) on the selected bridge. The user candevelop work plans and compare the life-cycle cost differences between the various plans.
Detailed information for the selected bridge is displayed in the Description, Conditions, Current Scaled Performance,and Sufficiency groupings and Recent Completed Work grid in the top half of the task.
Setting up the LCCALCCA ConfigurationThe LCCA Configuration grouping specifies the parameters for the LCCA.
The Discount Rate textbox indicates the cost discount percentage for the LCCA. The discount rate suggests that the fur-ther in the future an action/event occurs, the less it will cost. The default value is 4 percent.
The Short-Term Analysis Length and Long-Term Analysis Length textboxes determine the short and long term lengthsof time in which the LCCA will be run. By default, the values are 5 years and 50 years.
The Estimate User Life-Cycle Cost checkbox allows the user to estimate the user cost of the LCCA. Selecting thisoption takes the place of the user cost calculation that was selected on the Admin > Modeling Config > Preservationand Replacement Policy task.
NBI ModelingThe NBI Modeling grouping determines the modeling of the NBI component deterioration.
- 304 -
LCCA

The NBI Deterioration Method dropdown allows the user to model the NBI component deterioration in two differentways:
l NBI Converter - This option allows the user to select an NBI converter profile (created on the Admin > Model-ing Config > NBI Conversion Profiles task) to forecast the element ratings.
l Component-Level Deterioration - This option uses the component-level deterioration models established on theAdmin > Modeling Config > NBI Deterioration Models task.
Cost IndexingThe Cost Indexing grouping allows the user to determine how future inflation rates will be modeled.
The Inflation Estimation Method dropdown has three options to choose:
l None - Future inflation rates will be ignored so that future costs are not inflated.l Cost Indexing - Future costs will be inflated based on the specifications set on the Admin > Modeling Config >Cost Index task.
l Fixed Inflation Rate - Future costs will be inflated based on a fixed inflation rate. When selected, the InflationRate textbox will appear to allow the user to enter the fixed inflation rate percentage.
Short-TermWork ItemsLong-term work items will be determined by the LCCA automatically using the preservation and replacement policiesassigned to the bridge through the LCCA tasks in the Admin tab. Short-term work items, on the other hand, can be addedby the user by selecting them from the grid.
The Display System Recommendations checkbox will show all work recommendations that will positively affect thebridge regardless of whether a work candidate exists for the action.
The Display Work Candidates checkbox will show the work candidates that have been created for the selected bridge.
The Display Zero Cost Recommendations checkbox will recommend possible actions based on the bridge's elements.
The Display Zero Cost Work Candidates checkbox will show the work candidates created for the selected bridge thatdo not have a cost associated.
*Note: If multiple checkboxes are selected, their effects will be combined.
The Profile dropdown and Add Profile button are used if the user wants to compare LCCA results with different workcandidates selected.
*Note: The Cost field within the grid cannot be edited for system generated work items.
If desired, the user can create a new project with the bridge's selected work candidates by clicking the Add to New Pro-ject button.
*Note:While short-term work items typically span 0-20 years in planning, there is no restriction on how far out theshort-term work items can be planned.
Running the LCCAOnce the desired selection have been made to set up the LCCA, click the Run Analysis button to run the analysis andview the results.
- 305 -

LCCA Activity ProfileThe LCCA Activity Profile grouping lists all of the actions (both user-selected and automatically generated) applied tothe bridge throughout the analysis period and is sorted by the order the actions occur. For each action, the grid displaysimportant information such as the original estimated cost of the action, the net present value (NPV) cost of the action,and the bridge's health index before and after the action.
The rows after the action listings contain summaries of the LCCA:
l Remaining Life - The number of years remaining from the end of the analysis to the next replacement of thebridge.
l Residual Value - The economic value of the bridge's remaining service life.l Agency Life-Cycle Cost - The sum of the NPVs of the actions applied in the analysis minus the residual netvalue.
l User Life-Cycle Cost - The sum of all user net costs throughout the analysis.l Life-Cycle Cost - The final result of the analysis: the sum of the agency and user life-cycle costs.
ChartsThe Charts grouping contains bridge and element graphs that provide a visual display of various information related tothe analysis. Only two graphs can be displayed at a time, but the dropdown in the top left corner of the grouping con-tains more graph selections.
- 306 -

Each graph will have two curves:
l Red - The original deteriorationl Blue - The deterioration with the work candidates being performed at the designated intervals
Effects on Each ElementThe Effects on Each Element grouping contains a grid that displays the starting and ending conditions of the elements inthe LCCA process. The grid uses a color-coded system to display the elements' conditions:
l Green - Condition State 1l Yellow - Condition State 2l Orange - Condition State 3l Red - Condition State 4
The Year dropdown is used to select the specific year of the bridge to view results. The target year of the work can-didates assigned to the bridge will determine a bridge's element effects for a given year.
- 307 -

Elements with a ">" next to them can be expanded to reveal the protective systems and defects associated with them.Selecting an element or protective system will display the expected deterioration of the element in the Element graph inthe Charts grouping. Defects are not currently incorporated into deterioration calculations.
Effects on Each Utility CriterionThe Effects on Each Utility Criterion grouping contains a grid that displays the starting and ending conditions of thebridge's utility criteria in the LCCA process.
The hierarchy displayed under Total Utility is determined by the criteria entered in the Admin > Utility task.
The Year dropdown is used to select the specific year of the bridge to view results. The target year of the work can-didates assigned to the bridge will determine a bridge's utility for a given year.
Deterioration ResultsThe Deterioration Results grouping contains a grid to compliment the health index graph in the Charts grouping byproviding the deterioration values for every point on the graph.
- 308 -
Projects- The Projects section of the manual addresseseach of the tasks in BrM's Projects tab. TheProjects tab allows for the creation andmanagement of agency projects.
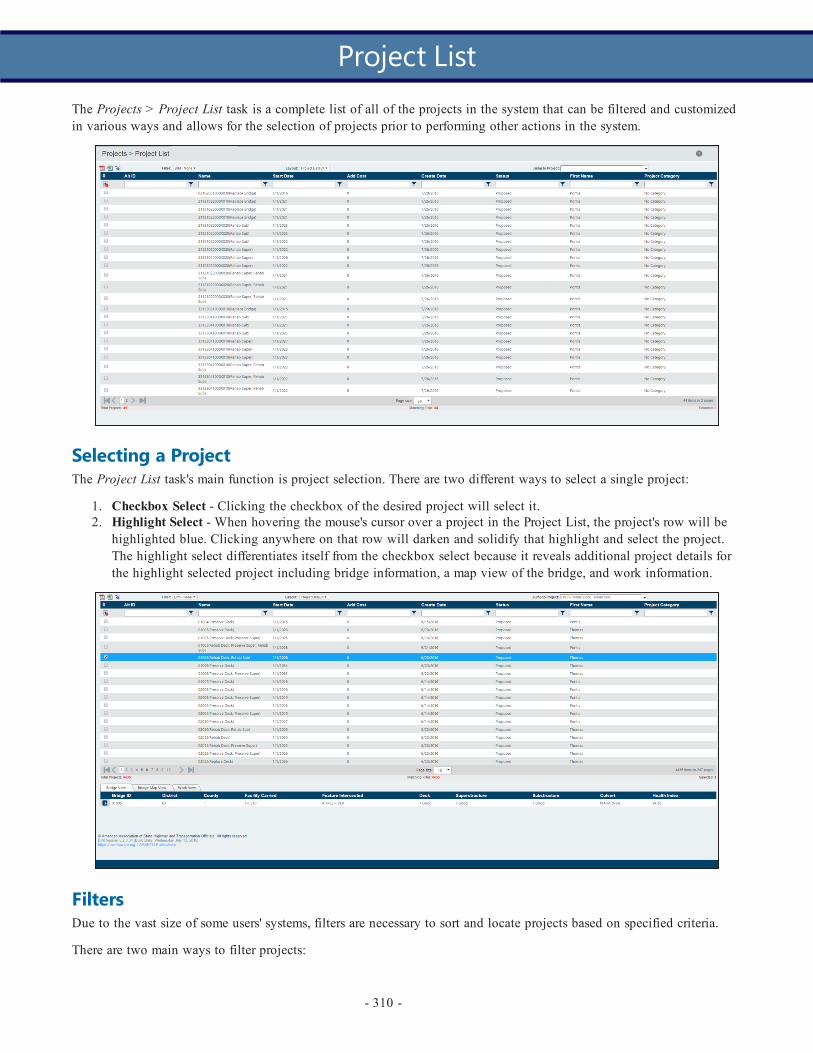
The Projects > Project List task is a complete list of all of the projects in the system that can be filtered and customizedin various ways and allows for the selection of projects prior to performing other actions in the system.
Selecting a ProjectThe Project List task's main function is project selection. There are two different ways to select a single project:
1. Checkbox Select - Clicking the checkbox of the desired project will select it.2. Highlight Select - When hovering the mouse's cursor over a project in the Project List, the project's row will be
highlighted blue. Clicking anywhere on that row will darken and solidify that highlight and select the project.The highlight select differentiates itself from the checkbox select because it reveals additional project details forthe highlight selected project including bridge information, a map view of the bridge, and work information.
FiltersDue to the vast size of some users' systems, filters are necessary to sort and locate projects based on specified criteria.
There are two main ways to filter projects:
- 310 -
Project List
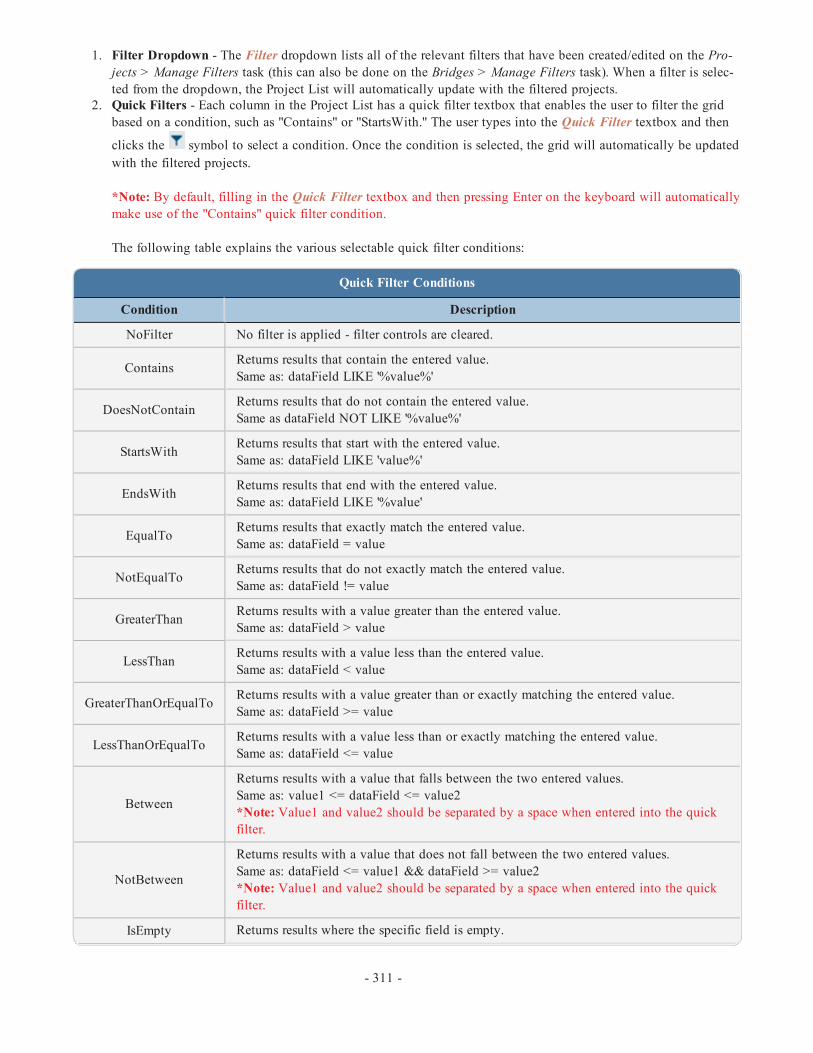
1. Filter Dropdown - The Filter dropdown lists all of the relevant filters that have been created/edited on the Pro-jects > Manage Filters task (this can also be done on the Bridges > Manage Filters task). When a filter is selec-ted from the dropdown, the Project List will automatically update with the filtered projects.
2. Quick Filters - Each column in the Project List has a quick filter textbox that enables the user to filter the gridbased on a condition, such as "Contains" or "StartsWith." The user types into the Quick Filter textbox and then
clicks the symbol to select a condition. Once the condition is selected, the grid will automatically be updatedwith the filtered projects.
*Note: By default, filling in the Quick Filter textbox and then pressing Enter on the keyboard will automaticallymake use of the "Contains" quick filter condition.
The following table explains the various selectable quick filter conditions:
Quick Filter Conditions
Condition Description
NoFilter No filter is applied - filter controls are cleared.
Contains Returns results that contain the entered value.Same as: dataField LIKE '%value%'
DoesNotContain Returns results that do not contain the entered value.Same as dataField NOT LIKE '%value%'
StartsWith Returns results that start with the entered value.Same as: dataField LIKE 'value%'
EndsWith Returns results that end with the entered value.Same as: dataField LIKE '%value'
EqualTo Returns results that exactly match the entered value.Same as: dataField = value
NotEqualTo Returns results that do not exactly match the entered value.Same as: dataField != value
GreaterThan Returns results with a value greater than the entered value.Same as: dataField > value
LessThan Returns results with a value less than the entered value.Same as: dataField < value
GreaterThanOrEqualTo Returns results with a value greater than or exactly matching the entered value.Same as: dataField >= value
LessThanOrEqualTo Returns results with a value less than or exactly matching the entered value.Same as: dataField <= value
Between
Returns results with a value that falls between the two entered values.Same as: value1 <= dataField <= value2*Note: Value1 and value2 should be separated by a space when entered into the quickfilter.
NotBetween
Returns results with a value that does not fall between the two entered values.Same as: dataField <= value1 && dataField >= value2*Note: Value1 and value2 should be separated by a space when entered into the quickfilter.
IsEmpty Returns results where the specific field is empty.
- 311 -

Quick Filter Conditions
Condition Description
Same as: dataField = ''
NotIsEmpty Returns results where the specific field is not empty.Same as: dataField != ''
IsNull Returns only null values.
NotIsNull Returns only non-null values.
LayoutThe Layout dropdown determines the Project List's columns. There is a default layout on the Project List task, but newlayouts can be created on the Projects > Manage Layouts task (this can also be done on the Bridges > Manage Layoutstask).
Jump to ProjectThe Jump to Project textbox/dropdown allows the user to search for and locate a specific project. The user can type theproject name into the textbox or use the dropdown to find the project by clicking through the pages. When the project isselected, it will be highlight selected.
Export OptionsThere are three export options located at the top left corner of the Project List: PDF, XLS, and KML. If one or more pro-jects are selected, only the information from the selected projects will export. If no projects are selected, all of the pro-jects in the current filter will be exported.
Side Menu OptionsThe side menu for a certain Tab > Task will typically contain subtasks, but for the Projects >Project List task the sidemenu contains various options that perform actions.
View List Options
Option Description
SelectAll Selects all of the projects within the current filter.
UnselectAll Unselects all of the projects currently selected.
SelectPage
Selects all projects on the current page, regardless of how many projectsare in the current filter.Example: If there are 25 projects in the current filter but only 10 pro-jects per page, only the 10 projects shown on the current page will beselected.
UnselectPage
Unselects all projects on the current page, regardless of how many pro-jects are selected in the current filter.
- 312 -

View List Options
Option Description
ToggleJust
Selected
Toggles between showing all of the projects in the current filter toshowing only the projects that have been selected.Example: If a user has 5 projects selected, clicking Toggle Just Selec-ted will display only the 5 selected projects, regardless of the total num-ber of projects in the filter.
ResetGrid Set-tings
The column headings of the Project List can be arranged in any order.The user can click and hold then drag and drop the column headingsinto any order desired. If the user wants to revert back to the defaultcolumn heading order, Reset Grid Settings can be selected to reset thelayout.
- 313 -
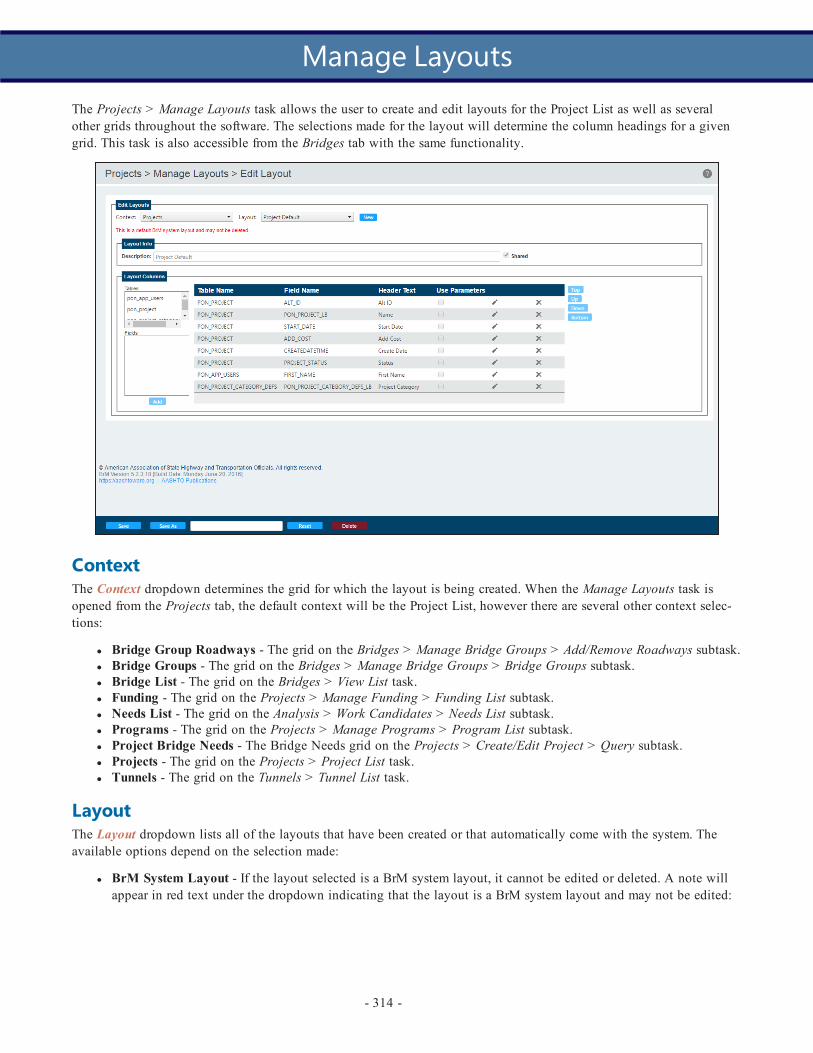
The Projects > Manage Layouts task allows the user to create and edit layouts for the Project List as well as severalother grids throughout the software. The selections made for the layout will determine the column headings for a givengrid. This task is also accessible from the Bridges tab with the same functionality.
ContextThe Context dropdown determines the grid for which the layout is being created. When the Manage Layouts task isopened from the Projects tab, the default context will be the Project List, however there are several other context selec-tions:
l Bridge Group Roadways - The grid on the Bridges > Manage Bridge Groups > Add/Remove Roadways subtask.l Bridge Groups - The grid on the Bridges > Manage Bridge Groups > Bridge Groups subtask.l Bridge List - The grid on the Bridges > View List task.l Funding - The grid on the Projects > Manage Funding > Funding List subtask.l Needs List - The grid on the Analysis > Work Candidates > Needs List subtask.l Programs - The grid on the Projects > Manage Programs > Program List subtask.l Project Bridge Needs - The Bridge Needs grid on the Projects > Create/Edit Project > Query subtask.l Projects - The grid on the Projects > Project List task.l Tunnels - The grid on the Tunnels > Tunnel List task.
LayoutThe Layout dropdown lists all of the layouts that have been created or that automatically come with the system. Theavailable options depend on the selection made:
l BrM System Layout - If the layout selected is a BrM system layout, it cannot be edited or deleted. A note willappear in red text under the dropdown indicating that the layout is a BrM system layout and may not be edited:
- 314 -
Manage Layouts
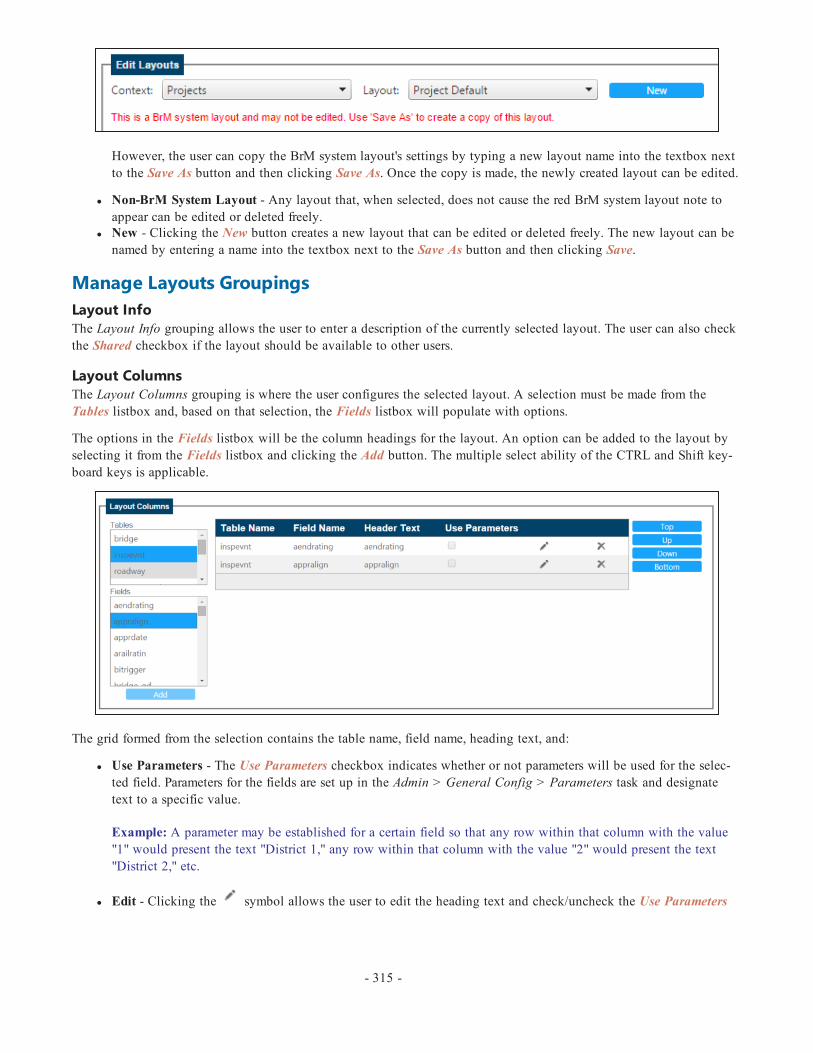
However, the user can copy the BrM system layout's settings by typing a new layout name into the textbox nextto the Save As button and then clicking Save As. Once the copy is made, the newly created layout can be edited.
l Non-BrM System Layout - Any layout that, when selected, does not cause the red BrM system layout note toappear can be edited or deleted freely.
l New - Clicking the New button creates a new layout that can be edited or deleted freely. The new layout can benamed by entering a name into the textbox next to the Save As button and then clicking Save.
Manage Layouts GroupingsLayout InfoThe Layout Info grouping allows the user to enter a description of the currently selected layout. The user can also checkthe Shared checkbox if the layout should be available to other users.
Layout ColumnsThe Layout Columns grouping is where the user configures the selected layout. A selection must be made from theTables listbox and, based on that selection, the Fields listbox will populate with options.
The options in the Fields listbox will be the column headings for the layout. An option can be added to the layout byselecting it from the Fields listbox and clicking the Add button. The multiple select ability of the CTRL and Shift key-board keys is applicable.
The grid formed from the selection contains the table name, field name, heading text, and:
l Use Parameters - The Use Parameters checkbox indicates whether or not parameters will be used for the selec-ted field. Parameters for the fields are set up in the Admin > General Config > Parameters task and designatetext to a specific value.
Example: A parameter may be established for a certain field so that any row within that column with the value"1" would present the text "District 1," any row within that column with the value "2" would present the text"District 2," etc.
l Edit - Clicking the symbol allows the user to edit the heading text and check/uncheck the Use Parameters
- 315 -

checkbox. To save the changes, click the . To cancel changes, click the symbol.l Delete - Clicking the symbol deletes the field from the layout.
The buttons to the right of the table - Top, Up, Down, Bottom - control the positioning of the fields in the layout.Because tables read left to right, the top field in the layout corresponds to the leftmost column of the table. Once an itemis selected, The Top and Bottom buttons move it to the top and bottom of the layout grid, respectively. The Up andDown buttons move the selected item up and down by one increment, respectively.
Manage Layouts Page Controls
The Save button saves the current layout.
The Save As button acts as a copier and copies the current layout's settings into a new layout that uses the name enteredinto the textbox next to the Save As button.
The Reset button resets any changes that were made to the current layout back to the last save.
The Delete button deletes the current layout.
- 316 -

The Projects > Manage Filters task allows the user to create and edit filters for the Project List as well as several othergrids throughout the software. The selections made for the filter will determine the projects listed in the Project Listupon filter use. This task is also accessible from the Bridges tab with the same functionality.
Edit FilterThe Projects > Manage Filters > Edit Filter subtask uses the BrM interface to create and edit filters for various gridswithin the system.
ContextThe Context dropdown determines the grid for which the filter is being created. When the Manage Filters task is openedfrom the Projects tab, the default context will be the Project List, however there are several other context selections:
l Bridge Analysis Group Roadways - The grid on the Bridges > Manage Bridge Analysis Groups > Add/RemoveRoadways subtask.
l Bridge Analysis Groups - The grid on the Bridges > Manage Bridge Analysis Groups > Bridge Analysis Groupssubtask.
l Bridge List - The grid on the Bridges > View List task.l Funding - The grid on the Projects > Manage Funding > Funding List subtask.l Needs List - The grid on the Analysis > Work Candidates > Needs List subtask.l Programs - The grid on the Projects > Manage Programs > Program List subtask.l Projects - The grid on the Projects > Project List task.l Tunnels - The grid on the Tunnels > Tunnel List task.
FilterThe Filter dropdown lists all of the filters that have been created or that automatically come with the system. The con-text must be selected before the filter because the context determines what filters are available. Below are the filter
- 317 -
Manage Filters

options:
l BrM System Filter - If the filter selected is a BrM system filter, it cannot be edited or deleted. A note will appearin red text under the dropdown indicating that the filter is a BrM system filter and may not be edited:
However, the user can copy the BrM system filter's settings by typing a new filter name into the textbox next tothe Save As button and then clicking Save As. Once the copy is made, the newly created filter can be edited.
l Customized Filter- Any filter created by the user can be edited or deleted freely.l New - Clicking the New button creates a new filter that can be edited or deleted freely. The new filter can benamed by entering a name into the textbox next to the Save As button and then clicking Save.
Filter InfoThe Filter Info grouping allows the user to enter a description of the currently selected filter. The user can also check theShared checkbox if the filter should be available to other users.
If the Access Filter checkbox is checked, the admin can use the current filter as an access filter for specified roles, dis-playing that filter as the users' default filter for the applicable context.
CriteriaThe Criteria grouping is where the user configures the selected filter. A selection must be made from the Tables listboxand, based on that selection, the Fields listbox will populate with options.
Options can be added to the filter by selecting it from the Fields listbox and clicking the Add Criteria button. Multipleoptions can be added at once by holding down the CTRL key while selecting all of the desired options, then clickingthe Add Criteria button.
- 318 -

Each field added to the filter will have additional options that must be determined.
Clicking the Clear button will clear the filter of all fields that have been added. Clicking the Delete Selected button willclear the filter of only the fields that have the Delete checkbox checked.
Edit Filter Page Controls
The Save button saves the current filter.
The Save As button copies the current filter's settings into a new filter that uses the name entered into the textbox nextto the Save As button.
The Reset button resets any changes that were made to the current filter back to the last save.
The Delete button deletes the current filter.
- 319 -

Edit SQLThe Projects > Manage Filters > Edit SQL subtask does not use the BrM interface to create and edit filters. It requiresthe user to write the SQL manually to create a custom filter.
There are several aspects that differentiate the filters in the Edit SQL subtask from the filters in the Edit Filter subtask:
1. The SQL filters must be written manually.2. The SQL filters can only be edited within the Edit SQL subtask. They will not show up in the Filter dropdown
of the Edit Filter subtask.3. When an SQL filter is used on a page that has alternate layouts via a Layout dropdown, such as the Bridge List,
the Layout dropdown will not be visible.
Select ContextThe Context dropdown determines the grid for which the filter is being created. When the Manage Filters task is openedfrom the Bridges tab, the default context will be the Bridge List, however there are several other context selections:
l Bridge Group Roadways - The grid on the Bridges > Manage Bridge Groups > Add/Remove Roadways subtask.l Bridge Groups - The grid on the Bridges > Manage Bridge Groups > Bridge Groups subtask.l Bridge List - The grid on the Bridges > View List task.l Funding - The grid on the Projects > Manage Funding > Funding List subtask.l Needs List - The grid on the Analysis > Work Candidates > Needs List subtask.l Programs - The grid on the Projects > Manage Programs > Program List subtask.l Projects - The grid on the Projects > Project List task.l Tunnels - The grid on the Tunnels > Tunnel List task.
Select FilterThe Filter dropdown lists all of the filters that have been created or that automatically come with the system. The con-text must be selected before the filter because the context determines what filters are available.
- 320 -

SQL InfoThe SQL Info grouping allows the user to enter a description of the currently selected filter. The user can also check theShared checkbox if the filter should be available to other users.
SQL StatementThe user can use the large textbox to enter the SQL for the custom filter.
The SQL Order By textbox allows the user to determine how the filter will be ordered, such as "ORDER BY 'BridgeID.'"
Once the SQL is entered, click the Evaluate button to view the filter results. If the SQL is invalid, an error will appear inplace of the results:
Edit SQL Page Controls
The Save button saves the current filter.
The Save As button copies the current filter's settings into a new filter that uses the name entered into the textbox nextto the Save As button.
*Note: If changes have been made to a new or existing SQL Filter, the Save and Save As buttons will not be availableuntil the SQL statement passes an evaluation using the Evaluate button.
The Reset button resets any changes that were made to the current filter back to the last save.
The Delete button deletes the current filter.
- 321 -

The Projects > Create/Edit Project task allows the user to create a new project or edit an existing project. There are foursubtasks: Query, Summary, Analysis, and Management.
QueryThe Projects > Create/Edit Project > Query subtask is used to determine which bridges will be added to the project andwhat work will be performed on those bridges.
Selected ProjectIf a project is currently selected, the Selected Project dropdown will show that project's name. A different project can beselected from the dropdown if desired. To create a new project, click the Create New button.
*Note: This dropdown is available on all four subtasks.
If no project is currently selected, the Selected Project dropdown will default to "*** New Project ***" and the CreateNew button will not be present. An existing project can be selected from the dropdown if desired.
BridgesThe Bridges grouping contains a Bridge View and Bridge Map View of all of the bridges in the database.
- 322 -
Create/Edit Project

The Project Category, Filter, and Bridge Analysis Group dropdowns all work to filter the grid/map of bridges based onthe selections. Additional filters can be created for the Filter dropdown on the Projects > Manage Filters task (or theBridges > Manage Filters task). The quick filters can also be used to filter the grid. To cancel the current quick filters,
click the icon next to the Bridge Map View tab.
Filter 1 to 100 BridgesIf the grid/map contains more than 100 bridges, a message will appear in the top right corner of the Bridges grouping:
When a bridge is selected from the grid/map, a new grouping called Bridge Needs appears below the Bridges grouping.This grouping allows the user to select which work will be performed for the selected bridge. Normally, only onebridge's needs can be selected at a time. However, if 100 bridges or less are filtered in the grid/map, the message in thetop right corner is replaced by the Display Needs for All Bridges in Filter checkbox. If checked, the Bridge Needs group-ing will display work that can be added for all of the selected bridges.
Bridge NeedsWhen a bridge is selected or all bridges in the filter are selected with the Display Needs for All Bridges in Filter check-box, the Bridge Needs grouping will appear beneath the Bridges grouping and allow the user to select work for thebridge(s).
LayoutAdditional layouts can be created for the Layout dropdown on the Projects > Manage Layouts task (or the Bridges >Manage Layouts task).
- 323 -

CheckboxesThe Display Category Actions Only checkbox will show the work candidates that have been created for the selectedbridge that are associated with the category selected in the Project Category dropdown, as well as recommendations ofpossible actions based on the category selected in the Project Category dropdown.
The Display Work Candidates Only checkbox will show only the work candidates that have been created for the selec-ted bridge.
The Display Zero Cost Recommendations checkbox will recommend possible actions based on the bridge's elements.
The Display Zero Cost Work Candidates checkbox will show only the work candidates created for the selected bridgethat do not have a cost associated.
*Note: If multiple checkboxes are selected, their effects will be combined.
Select the desired actions/work candidates from the grid and click the Add to Project button to add the bridge's selec-tions to the current project.
Selected Bridges and WorkThe Selected Bridges and Work grouping displays all of the bridges that have been added to the project and reveals abreakdown of exactly what actions will be performed on the bridges for the project.
Query Page ControlsThe Save button saves the changes made to the selected project.
The Save and Close button saves the changes made to the selected project and returns the user to the Projects > ProjectList task.
The Cancel button cancels the changes made to the selected project and refreshes the page.
_______________________________________________________________________
Projects > Create/Edit Project > Query Control Information
ControlName
TableName Column Name Notes
ProjectName
PON_PROJECT PON_PROJECT_LB The name of the project being created.
ProjectCategory
PON_PROJECT
PON_PROJECT_CATEGORY_DEFS_GD
The project category of the project that then filters thelist of bridges available to add.
- 324 -
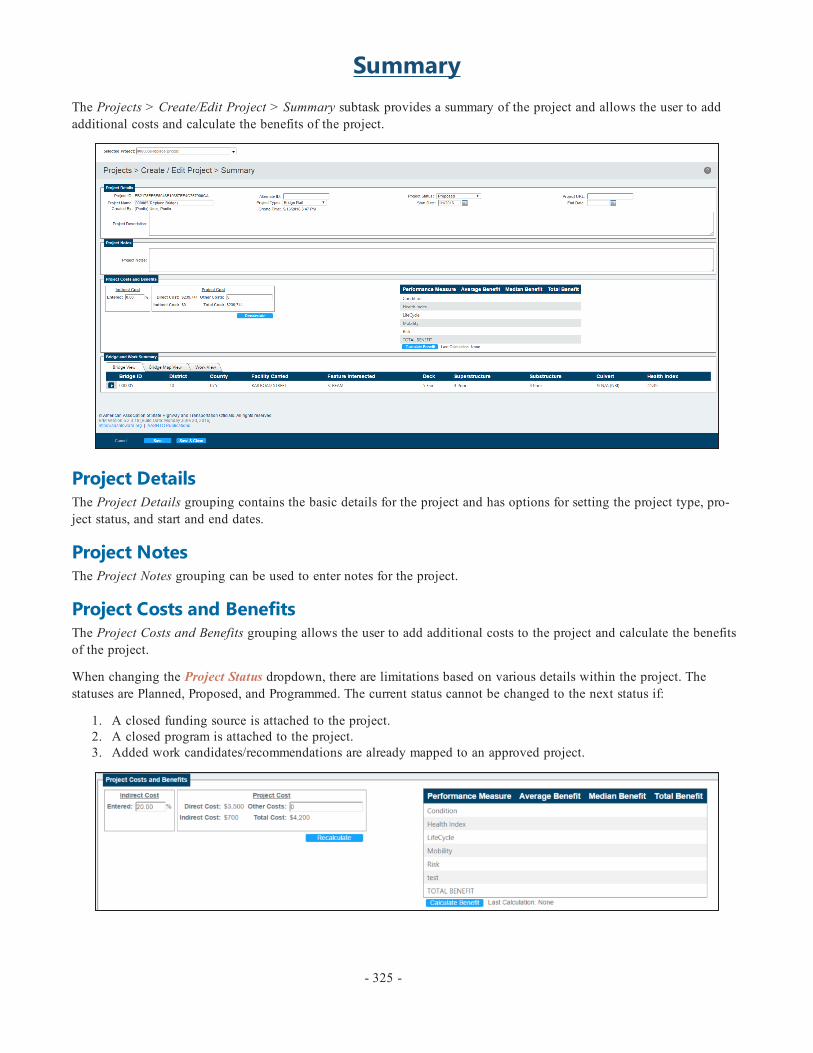
SummaryThe Projects > Create/Edit Project > Summary subtask provides a summary of the project and allows the user to addadditional costs and calculate the benefits of the project.
Project DetailsThe Project Details grouping contains the basic details for the project and has options for setting the project type, pro-ject status, and start and end dates.
Project NotesThe Project Notes grouping can be used to enter notes for the project.
Project Costs and BenefitsThe Project Costs and Benefits grouping allows the user to add additional costs to the project and calculate the benefitsof the project.
When changing the Project Status dropdown, there are limitations based on various details within the project. Thestatuses are Planned, Proposed, and Programmed. The current status cannot be changed to the next status if:
1. A closed funding source is attached to the project.2. A closed program is attached to the project.3. Added work candidates/recommendations are already mapped to an approved project.
- 325 -
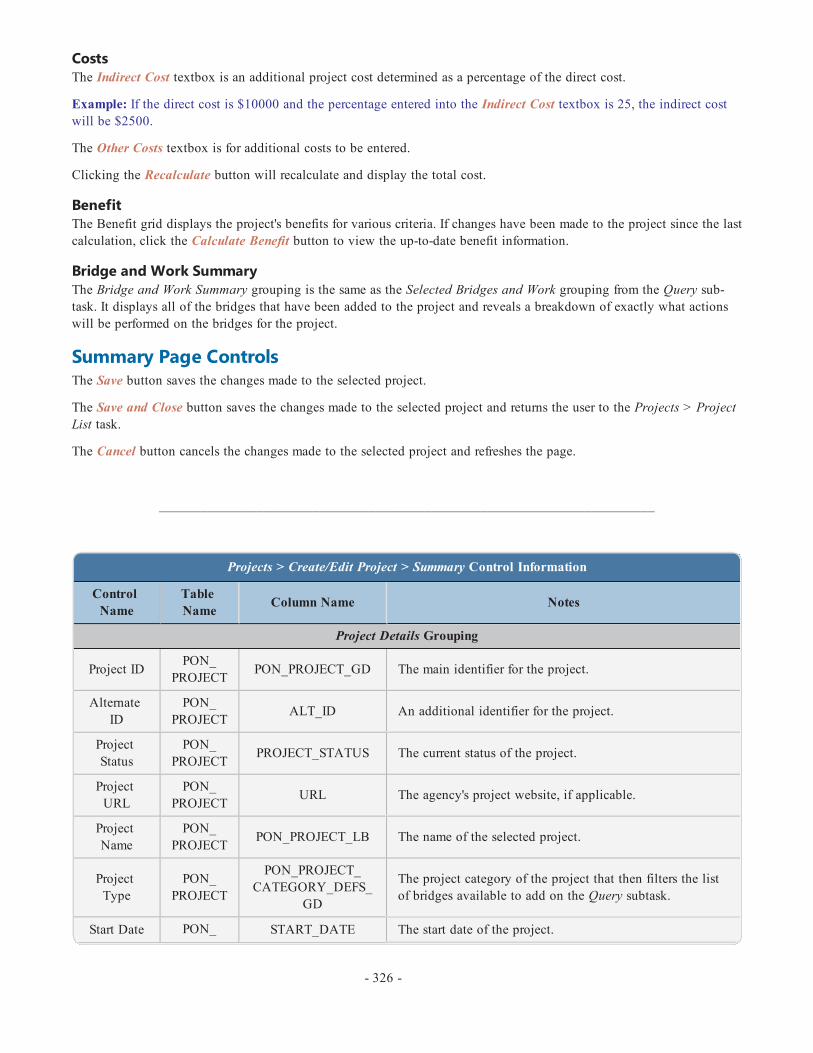
CostsThe Indirect Cost textbox is an additional project cost determined as a percentage of the direct cost.
Example: If the direct cost is $10000 and the percentage entered into the Indirect Cost textbox is 25, the indirect costwill be $2500.
The Other Costs textbox is for additional costs to be entered.
Clicking the Recalculate button will recalculate and display the total cost.
BenefitThe Benefit grid displays the project's benefits for various criteria. If changes have been made to the project since the lastcalculation, click the Calculate Benefit button to view the up-to-date benefit information.
Bridge and Work SummaryThe Bridge and Work Summary grouping is the same as the Selected Bridges and Work grouping from the Query sub-task. It displays all of the bridges that have been added to the project and reveals a breakdown of exactly what actionswill be performed on the bridges for the project.
Summary Page ControlsThe Save button saves the changes made to the selected project.
The Save and Close button saves the changes made to the selected project and returns the user to the Projects > ProjectList task.
The Cancel button cancels the changes made to the selected project and refreshes the page.
_______________________________________________________________________
Projects > Create/Edit Project > Summary Control Information
ControlName
TableName Column Name Notes
Project Details Grouping
Project ID PON_PROJECT PON_PROJECT_GD The main identifier for the project.
AlternateID
PON_PROJECT ALT_ID An additional identifier for the project.
ProjectStatus
PON_PROJECT PROJECT_STATUS The current status of the project.
ProjectURL
PON_PROJECT URL The agency's project website, if applicable.
ProjectName
PON_PROJECT PON_PROJECT_LB The name of the selected project.
ProjectType
PON_PROJECT
PON_PROJECT_CATEGORY_DEFS_
GD
The project category of the project that then filters the listof bridges available to add on the Query subtask.
Start Date PON_ START_DATE The start date of the project.
- 326 -
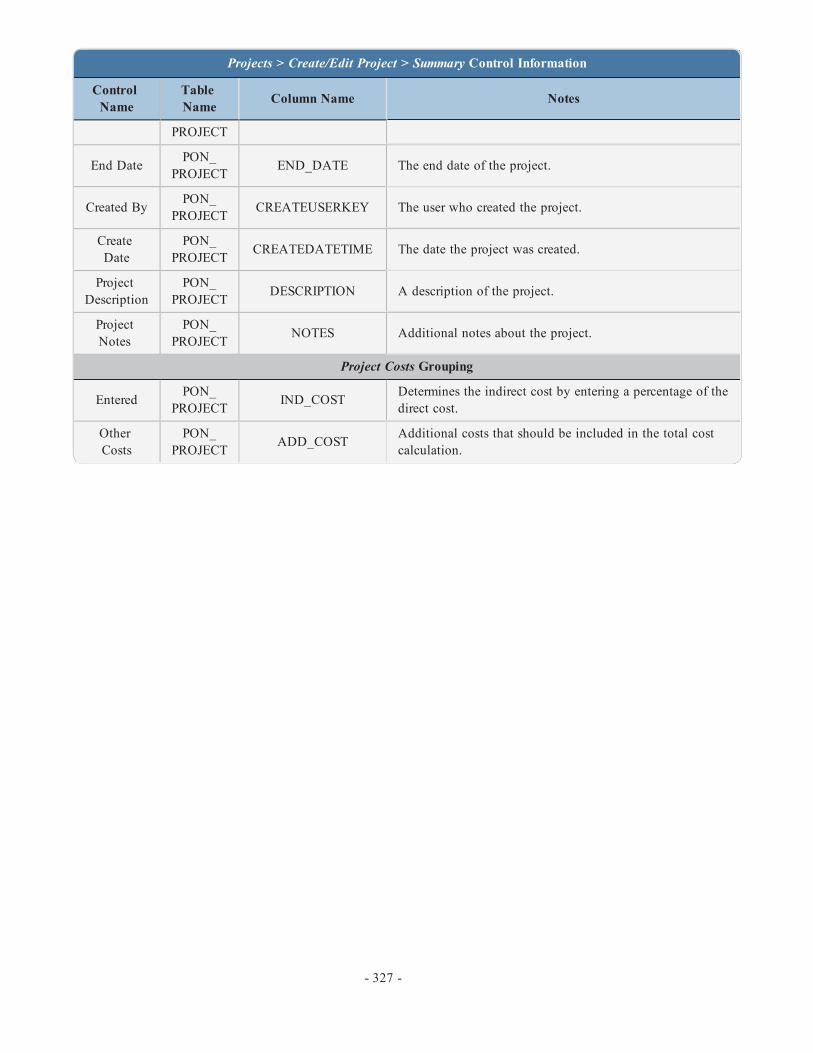
Projects > Create/Edit Project > Summary Control Information
ControlName
TableName Column Name Notes
PROJECT
End Date PON_PROJECT END_DATE The end date of the project.
Created By PON_PROJECT CREATEUSERKEY The user who created the project.
CreateDate
PON_PROJECT CREATEDATETIME The date the project was created.
ProjectDescription
PON_PROJECT DESCRIPTION A description of the project.
ProjectNotes
PON_PROJECT NOTES Additional notes about the project.
Project Costs Grouping
Entered PON_PROJECT IND_COST Determines the indirect cost by entering a percentage of the
direct cost.
OtherCosts
PON_PROJECT ADD_COST Additional costs that should be included in the total cost
calculation.
- 327 -
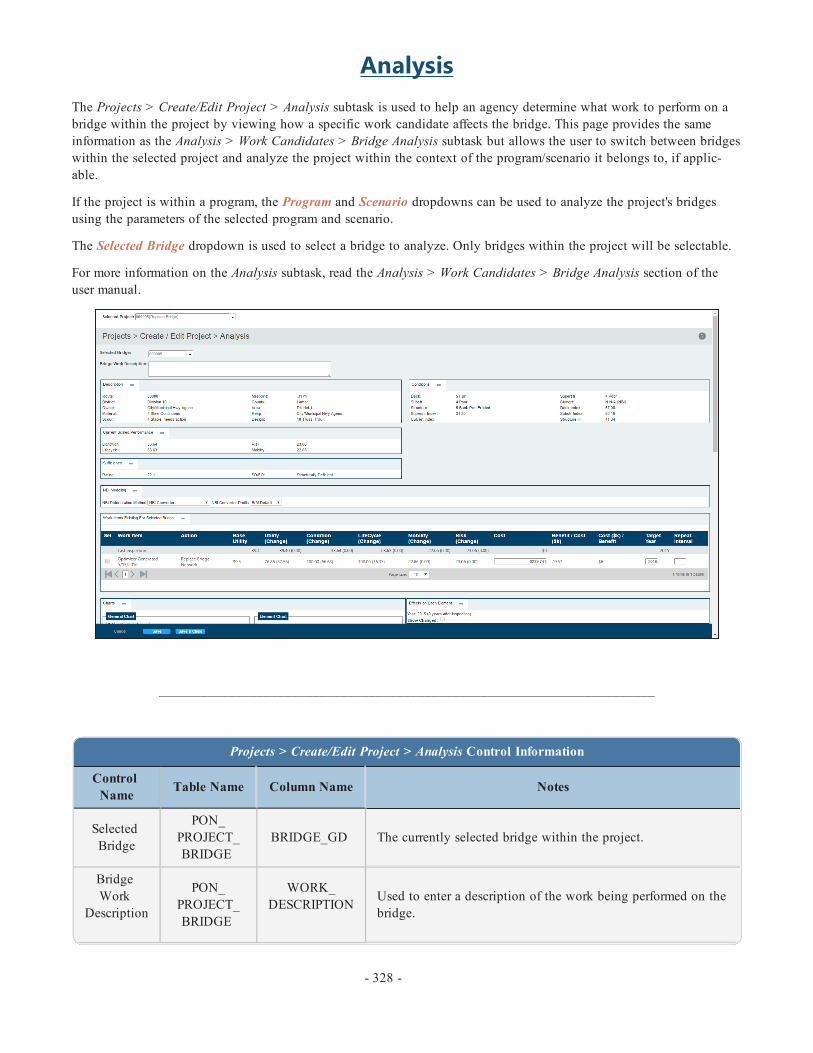
AnalysisThe Projects > Create/Edit Project > Analysis subtask is used to help an agency determine what work to perform on abridge within the project by viewing how a specific work candidate affects the bridge. This page provides the sameinformation as the Analysis > Work Candidates > Bridge Analysis subtask but allows the user to switch between bridgeswithin the selected project and analyze the project within the context of the program/scenario it belongs to, if applic-able.
If the project is within a program, the Program and Scenario dropdowns can be used to analyze the project's bridgesusing the parameters of the selected program and scenario.
The Selected Bridge dropdown is used to select a bridge to analyze. Only bridges within the project will be selectable.
For more information on the Analysis subtask, read the Analysis > Work Candidates > Bridge Analysis section of theuser manual.
_______________________________________________________________________
Projects > Create/Edit Project > Analysis Control Information
ControlName Table Name Column Name Notes
SelectedBridge
PON_PROJECT_BRIDGE
BRIDGE_GD The currently selected bridge within the project.
BridgeWork
Description
PON_PROJECT_BRIDGE
WORK_DESCRIPTION Used to enter a description of the work being performed on the
bridge.
- 328 -
Projects > Create/Edit Project > Analysis Control Information
ControlName Table Name Column Name Notes
Work ItemCost
PON_PROJECT_WORKITEM EST_COST
Determines the cost of the work item for the selected bridgewithin the project. This control is found in the Work ItemsExisting for Selected Bridge grouping on the page.
Work ItemTargetYear
PON_PROJECT_WORKITEM
TARGET_YEAR
The target year for the selected bridge's work item to be com-pleted. This control is found in the Work Items Existing forSelected Bridge grouping on the page.
Work ItemRepeatInterval
PON_PROJECT_WORKITEM
REPEAT_INTERVAL
The interval of time in which to repeat the work item for theselected bridge. This control is found in the Work Items Exist-ing for Selected Bridge grouping on the page.
- 329 -

ManagementThe Projects > Create/Edit Project > Management subtask contains some of the same information as the Summary sub-task but also allows the user to add programs, funding sources, and milestones.
Project DetailsThe Project Details grouping is the same as on the Summary subtask. It contains the basic details for the project and hasoptions for setting the project type, project status, and start and end dates.
Project CostThe Project Cost grouping contains the same cost information and controls as the Project Cost and Benefits grouping onthe Summary subtask. For more information on this grouping, review the Projects > Create/Edit Project > Summary sec-tion of the user manual.
ProgramsThe Programs grouping is used to add the selected project to one or more programs.
*Note: The Programs grouping is not available for projects in the "Planned" status.
Click the Add New button to reveal the following popup:
The Program dropdown determines to which program the project will be added.
- 330 -

The Scenario dropdown determines to which scenario the project will be added.
The Target Year dropdown indicates which year within the select program's time range the selected project is expectedto be completed.
The Frozen checkboxes determine whether the project will be frozen to the program and/or year, respectively. If the pro-ject is frozen to a program, the optimizer will never remove it from that program even if the optimizer determines it to beineffective for the program. If the project is frozen to the selected target year, it will never be changed to a different yearin the program optimizer meaning it cannot be selected to be completed in a different year.
Click the Add New button to add the project to the selected program.
Click the Cancel button to cancel the project-program link.
Funding SourcesThe Funding Sources grouping is used to add one or more funding sources to the selected project. Funding sources arecreated on the Projects > Manage Funding task.
Click the Add New button to reveal a popup with the available funding sources:
To add a funding source to the project, click the icon.
Once the funding source is added to the project, its specific information can be entered.
The Target Date dropdown indicates when the funding is expected to be available.
The Amount textbox indicates the expected amount of funding.
To remove a funding source from the project, click the icon for the desired funding source.
MilestonesThe Milestones grouping is used to set milestones for the project.
- 331 -

Click the Add New button to add a milestone to the project.
The milestones are only used on the Management subtask and the controls are agency defined.
Management Page ControlsThe Save button saves the changes made to the selected project.
The Save and Close button saves the changes made to the selected project and returns the user to the Projects > ProjectList task.
The Cancel button cancels the changes made to the selected project and refreshes the page.
_______________________________________________________________________
Projects > Create/Edit Project > Management Control Information
ControlName Table Name Column Name Notes
Project Details Grouping
Project ID PON_PROJECT PON_PROJECT_GD The main identifier for the project.
AlternateID
PON_PROJECT ALT_ID An additional identifier for the project.
CreateTime
PON_PROJECT CREATEDATETIME The date the project was created.
ProjectURL
PON_PROJECT URL The agency's URL for the project.
ProjectName
PON_PROJECT PON_PROJECT_LB The name of the selected project.
ProjectType
PON_PROJECT
PON_PROJECT_CATEGORY_DEFS_
GD
The project category of the project that then filters thelist of bridges available to add on the Query subtask.
Start Date PON_PROJECT START_DATE The start date of the project.
End Date PON_PROJECT END_DATE The end date of the project.
Created By PON_PROJECT CREATEUSERKEY The user who created the project.
ProjectDescription
PON_PROJECT DESCRIPTION A description of the project.
- 332 -

Projects > Create/Edit Project > Management Control Information
ControlName Table Name Column Name Notes
Project Costs Grouping
Entered PON_PROJECT IND_COST Determines the indirect cost by entering a percentage
of the direct cost.
OtherCosts
PON_PROJECT ADD_COST Additional costs that should be included in the total
cost calculation.
Programs Grouping
Freeze toProgram
PON_PROJECT
FROZEN_PROGRAM_GD Freezes the project to the selected program.
Freeze toYear
PON_PROJECT FROZEN_YEAR Freezes the project to the target year.
Funding Sources Grouping
TargetDate
PON_PROJECT_FUNDING
TARGET_DATE The date the funds from the selected funding source areexpected to be available.
AmountPON_
PROJECT_FUNDING
AMOUNT The amount of funding from the selected fundingsource.
NotesPON_
PROJECT_FUNDING
NOTES Notes about the selected funding source.
Milestones Grouping
NamePON_
PROJECT_MILESTONE
PON_PROJECT_MILESTONE_LB
The name of the milestone. Indicates the standing ofthe project.
StatusPON_
PROJECT_MILESTONE
MILESTONE_STATUS The status of the selected milestone.
OriginalDate
PON_PROJECT_
MILESTONEORIGINAL_DATE The original date the milestone was to be reached.
RevisedDate
PON_PROJECT_
MILESTONEREVISED_DATE The revised date for the milestone.
NotesPON_
PROJECT_MILESTONE
NOTES Notes about the selected milestone.
- 333 -

The Projects > Upload Project task allows the user to use the XML project template to upload a project.
Using the XML TemplateTo use the XML project template, right click on the Blank XML Template link and save the file. Once saved, open thefile and edit the fields:
*Note: Template entries must match database information exactly in order for the template to function correctly.
When the template is complete, ensure the Import File Type dropdown is set to "BrM External Project File (XML)" andclick the Select button to locate the newly created template file.
- 334 -
Upload Project

OptionsDetermine how the import file will be used by selecting either the Update Existing Project or Add as New Project radiobutton. If the Update Existing Project radio button is selected, use the Update Existing Project dropdown to determinewhich project will be updated.
UploadingWhen the file has been selected and the desired options made, click the Import button to import the file. To clear all ofthe selections made on the Upload Project task and refresh the page, click Cancel.
Upload InformationThe Upload Information grouping informs the user of the import file's upload status. Messages will notify the user of thesuccess or failure of the upload:
- 335 -

The Projects > Combine Projects task allows the user to combine two or more projects into one.
Stipulations:
1. At least two projects must be selected from the Project List. If less than two projects are selected, the followingmessage will appear when the Combine Projects task is selected.
2. In order to combine projects, the selected projects must have the same status. Also, only projects with a "Planned"or "Proposed" status can be combined.
Combining the ProjectsAll of the projects that will be combined are listed in the Selected Projects grid. To combine the projects, enter a namefor the new combined project in the Combined Project Name textbox and click the Combine button.
When the projects are combined, the user will be taken to the Project List. The new combined project will be present onthe grid and the old singular projects will be deleted.
The Cancel button cancels the combining of the projects and returns the user to the Projects > Project List task.
- 336 -
Combine Projects

The Projects > Split Project task is used to split the selected project into two projects by creating a new split projectthat takes one or more of the work items from the selected project. Only projects with a "Planned" or "Proposed" statuscan be split.
*Note: In order to split a project, the selected project must have at least one work item associated with a bridge.
*Note: It is not possible to select bridges (which would include all of the work items for that bridge within the project).If all of the work items related to a specific bridge are to be moved by splitting the project, each work item must be selec-ted individually.
Select a ProjectIf a project is highlight selected in the Project List, that project will be displayed as the project to be split. If no projectis highlight selected, a project must be selected from the Project to Split dropdown.
Bridges and Work ItemsThe grid will populate with the bridges that have been added to the project and can be expanded to reveal the workitems for the bridges.
- 337 -
Split Project

Check the Work Item checkboxes of all of the work items that should be moved to the split project.
Splitting the ProjectWhen all of the desired work items have been selected, enter a name for the new split project in the Split Project Nametextbox and click the Split button.
Click the Cancel button to cancel the selections and return to the Project List.
- 338 -

The Projects > Manage Funding task allows the user to view and create/edit funding sources. Funding sources can thenbe added to projects and programs.
Funding ListThe Projects > Manage Funding > Funding List subtask is a grid containing all of the funding sources. It operates inthe same way as the Project List and Bridge List.
Filters and layouts can be created on the Manage Filters and Manage Layouts tasks, and funding sources can be deleted
by clicking the icon for the desired funding source in the Funding List.
The major difference for the Funding List subtask compared to the Bridge List and Project List is that selecting a fundingsource from the grid takes the user directly to the Create/Edit Funding Sources subtask.
- 339 -
Manage Funding

Create/Edit Funding SourcesThe Projects > Manage Funding > Create/Edit Funding Sources subtask controls all of the settings for new or selectedfunding sources.
Use the Selected Funding dropdown to change the currently selected funding source or click the Add New button to adda new funding source.
Funding Source DetailsThe Funding Source Details grouping is used to determine all of the basic information for the funding source.
The most important control in the grouping is the Funding Source Status dropdown. There are three funding sourcestatus stages: Planned, Active, and Closed. The funding source must be in at least the "Active" status in order for otherusers to view the funding source.
Funding Source NotesThe Funding Source Notes grouping can be used to enter notes for the funding source.
Funding Source TargetsThe Funding Source Targets grouping allows for the creation of funding source targets. Funding source targets are usedwhen funding is added to a project or program. This allows projects and programs to add the same funding source morethan once because the target dates are different.
- 340 -
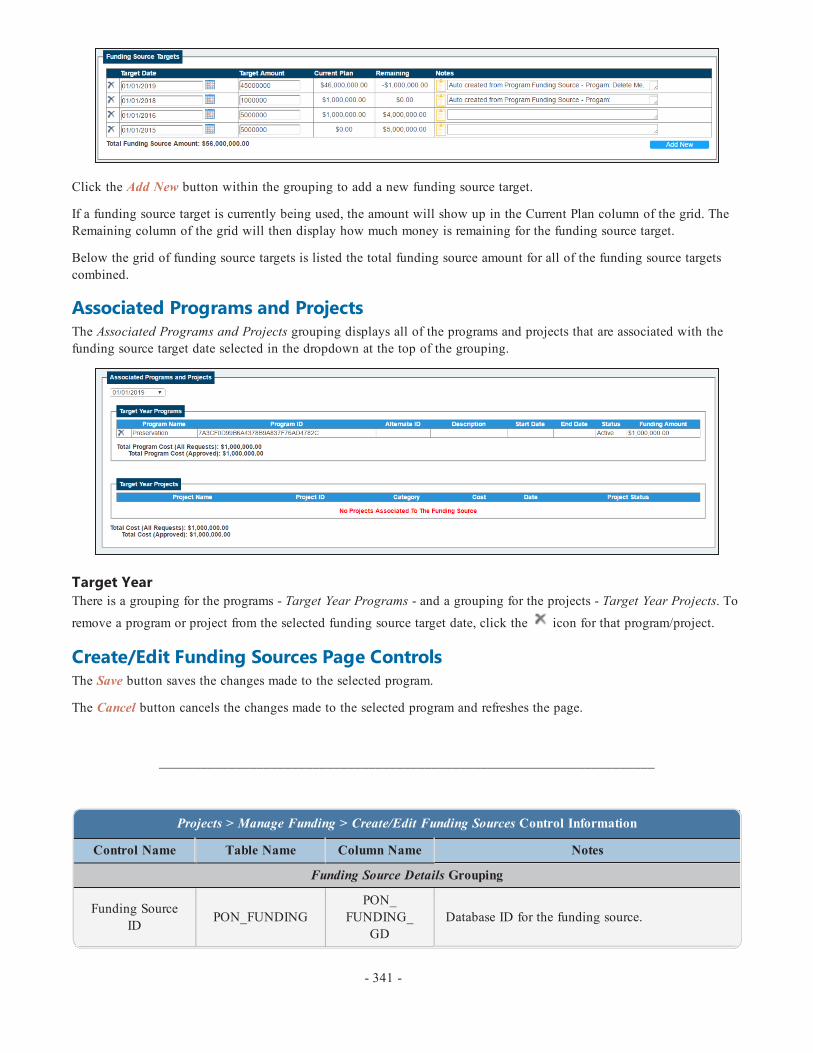
Click the Add New button within the grouping to add a new funding source target.
If a funding source target is currently being used, the amount will show up in the Current Plan column of the grid. TheRemaining column of the grid will then display how much money is remaining for the funding source target.
Below the grid of funding source targets is listed the total funding source amount for all of the funding source targetscombined.
Associated Programs and ProjectsThe Associated Programs and Projects grouping displays all of the programs and projects that are associated with thefunding source target date selected in the dropdown at the top of the grouping.
Target YearThere is a grouping for the programs - Target Year Programs - and a grouping for the projects - Target Year Projects. To
remove a program or project from the selected funding source target date, click the icon for that program/project.
Create/Edit Funding Sources Page ControlsThe Save button saves the changes made to the selected program.
The Cancel button cancels the changes made to the selected program and refreshes the page.
_______________________________________________________________________
Projects > Manage Funding > Create/Edit Funding Sources Control Information
Control Name Table Name Column Name Notes
Funding Source Details Grouping
Funding SourceID PON_FUNDING
PON_FUNDING_
GDDatabase ID for the funding source.
- 341 -
Projects > Manage Funding > Create/Edit Funding Sources Control Information
Control Name Table Name Column Name Notes
Funding SourceStatus PON_FUNDING FUNDING_
STATUS The current status of the funding source.
Funding SourceURL PON_FUNDING URL The agency's URL for the funding source.
Funding SourceName PON_FUNDING PON_
FUNDING_LB The name of the funding source.
Funding SourceType PON_FUNDING FUNDING_
TYPEThe type of funding or from where the fundingcomes.
Funding SourceDescription PON_FUNDING DESCRIPTION A description of the funding source.
Funding SourcesNotes PON_FUNDING NOTES Additional notes about the funding source.
Funding Source Targets Grouping
Target Date PON_FUNDING_TARGETS
TARGET_DATE
The date the funds from selected funding sourceare expected to be available.
Target Amount PON_FUNDING_TARGETS AMOUNT The amount of funding from the selected funding
source.
Notes PON_FUNDING_TARGETS NOTES Notes about the selected funding source.
- 342 -

Programs- The Programs section of the manual addresseseach of the tasks in BrM's Programs tab. ThePrograms tab allows for the creation and man-agement of agency programs.

The Programs > Program List task is a complete list of all of the programs in the system that can be filtered and cus-tomized in various ways and allows for the selection of programs prior to performing other actions in the system.
Selecting a ProgramThe Program List task's main function is program selection. To select a program, simply click on that program's rowwithin the list. The major difference for the Program List compared to the Bridge List and Project List is that selecting aprogram from the grid takes the user directly to the Create/Edit Program task.
FiltersDue to the vast size of some users' systems, filters are necessary to sort and locate programs based on specified criteria.
There are two main ways to filter programs:
1. Filter Dropdown - The Filter dropdown lists all of the relevant filters that have been created/edited on the Man-age Filters task (found in both the Bridges and Projects tabs). When a filter is selected from the dropdown, theProgram List will automatically update with the filtered programs.
2. Quick Filters - Each column in the Program List has a quick filter textbox that enables the user to filter the gridbased on a condition, such as "Contains" or "StartsWith." The user types into the Quick Filter textbox and then
clicks the symbol to select a condition. Once the condition is selected, the grid will automatically be updatedwith the filtered programs.
*Note: By default, filling in the Quick Filter textbox and then pressing Enter on the keyboard will automaticallymake use of the "Contains" quick filter condition.
The following table explains the various selectable quick filter conditions:
Quick Filter Conditions
Condition Description
NoFilter No filter is applied - filter controls are cleared.
Contains Returns results that contain the entered value.Same as: dataField LIKE '%value%'
DoesNotContain Returns results that do not contain the entered value.Same as dataField NOT LIKE '%value%'
StartsWith Returns results that start with the entered value.Same as: dataField LIKE 'value%'
- 344 -
Program List

Quick Filter Conditions
Condition Description
EndsWith Returns results that end with the entered value.Same as: dataField LIKE '%value'
EqualTo Returns results that exactly match the entered value.Same as: dataField = value
NotEqualTo Returns results that do not exactly match the entered value.Same as: dataField != value
GreaterThan Returns results with a value greater than the entered value.Same as: dataField > value
LessThan Returns results with a value less than the entered value.Same as: dataField < value
GreaterThanOrEqualTo Returns results with a value greater than or exactly matching the entered value.Same as: dataField >= value
LessThanOrEqualTo Returns results with a value less than or exactly matching the entered value.Same as: dataField <= value
Between
Returns results with a value that falls between the two entered values.Same as: value1 <= dataField <= value2*Note: Value1 and value2 should be separated by a space when entered into the quickfilter.
NotBetween
Returns results with a value that does not fall between the two entered values.Same as: dataField <= value1 && dataField >= value2*Note: Value1 and value2 should be separated by a space when entered into the quickfilter.
IsEmpty Returns results where the specific field is empty.Same as: dataField = ''
NotIsEmpty Returns results where the specific field is not empty.Same as: dataField != ''
IsNull Returns only null values.
NotIsNull Returns only non-null values.
LayoutThe Layout dropdown determines the Program List's columns. There is a default layout on the Program List task, butnew layouts can be created on the Manage Layouts task (found in both the Bridges and Projects tabs).
Jump to ProgramThe Jump to Program textbox/dropdown allows the user to search for and locate a specific program. The user can typethe program name into the textbox or use the dropdown to find the program by clicking through the pages. When theprogram is selected from the Jump to Program textbox/dropdown, the user will automatically be taken to theCreate/Edit Programs task.
Export OptionsThere are two export options located at the top left corner of the Program List: PDF and XLS. The export options willexport all of the programs currently shown in the list.
- 345 -

The Programs > Create/Edit Program task is used to create or edit a program. A program is a collection of specific pro-jects with specific constraints (budget, performance, etc.) that operates for a predetermined period of time.
Program DetailsThe Program Details grouping contains the basic information that defines the program.
Program Details Fields
Field Description
ProgramAlternate
IDAn alternative ID to make the program easily identifiable.
ProgramStatus Determines the status of the program: Planned, Active, or Closed.
ProgramStart Year The year that the program will begin.
ProgramName The main identifier for the program.
ProgramURL The agency website for the program, if applicable.
ProgramEnd Year The year that the program will end.
ProgramObjectives
Indicates the specific objective of the program. This is an agency defined field that can be set usingthe pon_program - program_objective setting on the Admin > General Config > Parameters task.
Structure Determines the priority and importance of bridges in the same network using a formula established
- 346 -
Create-Edit Programs

Program Details Fields
Field Description
WeightsFormula on the Admin > Modeling Config > Advanced Formulas task.
RequiredMinimum
Cost
The minimum cost of a program's work. This threshold ensures that BrM does not recommend pro-grams that have improbably low costs for which agencies would not perform work.
*Note: The minimum cost applies to each individual project generated for the program, not the sumof all of the projects.
Bridge Fil-ter
Determines which bridges are available to be added to the program. Bridge filters can be created onthe Manage Filters tasks. Only filters with an "Inspection" context will appear in the dropdown.
*Note: The "Share" feature of filters is ignored for this dropdown. All filters with the "Inspection"context, regardless of share status, will appear in the dropdown.
ProgramDescription An overall description of the program and what it entails.
ProgramNotes Notes related to the program.
Configuration DataThe Configuration Data grouping allows the user to establish the program's configuration data for the LCCA.
The NBI Deterioration Method dropdown determines whether the program's deterioration method will use a specificNBI converter profile or component level deterioration. If "NBIConverter" is chosen, the NBI Converter Profile drop-down will be available to select a specific NBI converter profile that was created on the Admin > Modeling Config >NBI Conversion Profiles task.
The Long-Term Analysis Period textbox determines the length of time in years for the LCCA. The default value is 50years.
The Discount Rate textbox indicates the cost discount percentage for the LCCA. The discount rate suggests that the fur-ther in the future an action/event occurs, the less it will cost. The default value is 4 percent.
The Inflation Estimation Method dropdown allows the user to determine if inflation will be considered for the programand, if so, which method will be used:
l None - No inflation used.l Undefined - Currently undefined rate.l CostIndexing - Uses the inflation rates established on the Admin > Modeling Config > Cost Index task.l FixedInflationRate - Causes the Inflation Rate textbox to appear to allow the user to enter a fixed inflation per-centage rate.
*Note:When viewing results it must be remembered that discount rate and inflation rate directly oppose each other. Forinstance, a discount rate of 4 percent and a fixed inflation rate of 4 percent will end up causing the rate to stay the same.
- 347 -

At the end of the LCCA, the system estimates the remaining value of the bridge. The Residual HiX Approximationcheckbox determines whether that estimation will be simple or complex. If checked, the simplified residual estimation isused and the remaining value of the bridge is estimated based on the bridge's health index at the end of the LCCA. Ifunchecked, the complex residual estimation is used and the simulation continues until bridge replacement.
*Note: The Residual HiX Approximation checkbox is checked by default. It is less accurate than the complex method,but it is significantly faster.
Network PoliciesThe Network Policies grouping allows the user to determine which network policies will be included in the program.Network policies determine which projects are automatically generated for the program during optimization based on theactions included in the network policy.
To move one or more network policies from one list to the other, select all of the desired network policies and then clickthe right or left arrow - - to move the selections to the desired list.
Utility Weights ProfileThe Utility Profile dropdown is used to select a utility weights profile for the program. Utility weights profiles are cre-ated on the Admin > Modeling Config > Weights Profile task and are used to override aspects of the default utilityweights in the system.
When a utility weight profile is selected, the Utility Profile's Weights grouping will appear:
The utility tree displays the default utility weights and to what weight they have changed.
Example: If the Condition utility reads "Condition (31->50), the default weight was 31 and the utility weights profilehas changed it to 50.
- 348 -

Clicking the Create/Edit Utility Profile button will open the Admin > Modeling Config > Weights Profile task so thatthe utility weights profiles can be created/edited.
Subdivision ProfileThe Subdivision Profile dropdown is used to select a subdivision profile for the program. The subdivision profiles are cre-ated on the Admin > Modeling Config > Subdivision Profiles task and determine how the program will be subdividedbased on a specific table and field name within the database. For instance, a subdivision profile could subdivide the pro-gram by district.
When a subdivision profile is selected, the Subdivision Profile Segments and Filter Segments groupings will appear:
The Subdivision Profile Segments grouping displays the table and field names subdividing the program. Clicking theCreate/Edit Subdivision Profile button will open the Admin > Modeling Config > Subdivision Profiles task so that thesubdivision profiles can be created/edited.
The Filter Segments grouping allows the user to create filters based on selections from the available subdivision seg-ments. The user can use each segment's dropdown to make a selection, then click the Add button. The results will thenbe displayed in a grid.
Example: If the selected subdivision profile uses inspevnt.dkrating as a segment, the filter segments available to add willbe values 0-9 because the deck rating must be a value between 0-9. The program will then only include bridges thatmeet those filter segments.
Click the icon to delete a filter segment. If the user deletes a filter segment that has data tied to it, the user willreceive a popup notification when trying to save the changes to the program:
Create/Edit Programs Page Controls
Use the Program dropdown to select an existing program to edit.
- 349 -

Click the Create New button to create a new program.
Click the Copy>> button to create a copy of the selected program. This will reveal the Copy Name textbox and the OnlyCopy Frozen checkbox.
If the Only Copy Frozen checkbox is checked, the new program will only include projects that are frozen to the copiedprogram.
When the desired selections are made and a name is entered into the Copy Name textbox, click the Copy button to com-plete the copy or click the << button to cancel the copy.
Click the Save button to save changes to the selected program.
Click the Delete button to delete the selected program.
_______________________________________________________________________
Programs > Create/Edit Program Control Information
ControlName
TableName Column Name Notes
ProgramAlternate
ID
PON_PROGRAM ALT_ID An alternative ID to make the program easily identifiable.
ProgramStart Date
PON_PROGRAM START_DATE The year that the program will begin.
ProgramName
PON_PROGRAM
PON_PROGRAM_
GDThe main identifier for the program.
ProgramStatus
PON_PROGRAM
PROGRAM_STATUS
Determines the status of the program: Planned, Active, orClosed.
ProgramEnd Date
PON_PROGRAM END_DATE The year that the program will end.
ProgramObjective
PON_PROGRAM
PROGRAM_OBJECTIVE
Indicates the objective of the program. This is an agency definedfield that can be set using the pon_program - program_objectivesetting on the Admin > General Config > Parameters task.
ProgramURL
PON_PROGRAM URL The agency website for the program, if applicable.
ProgramDescription
PON_PROGRAM DESCRIPTION An overall description of the program and what it entails.
ProgramNotes
PON_PROGRAM NOTES Notes related to the program.
- 350 -
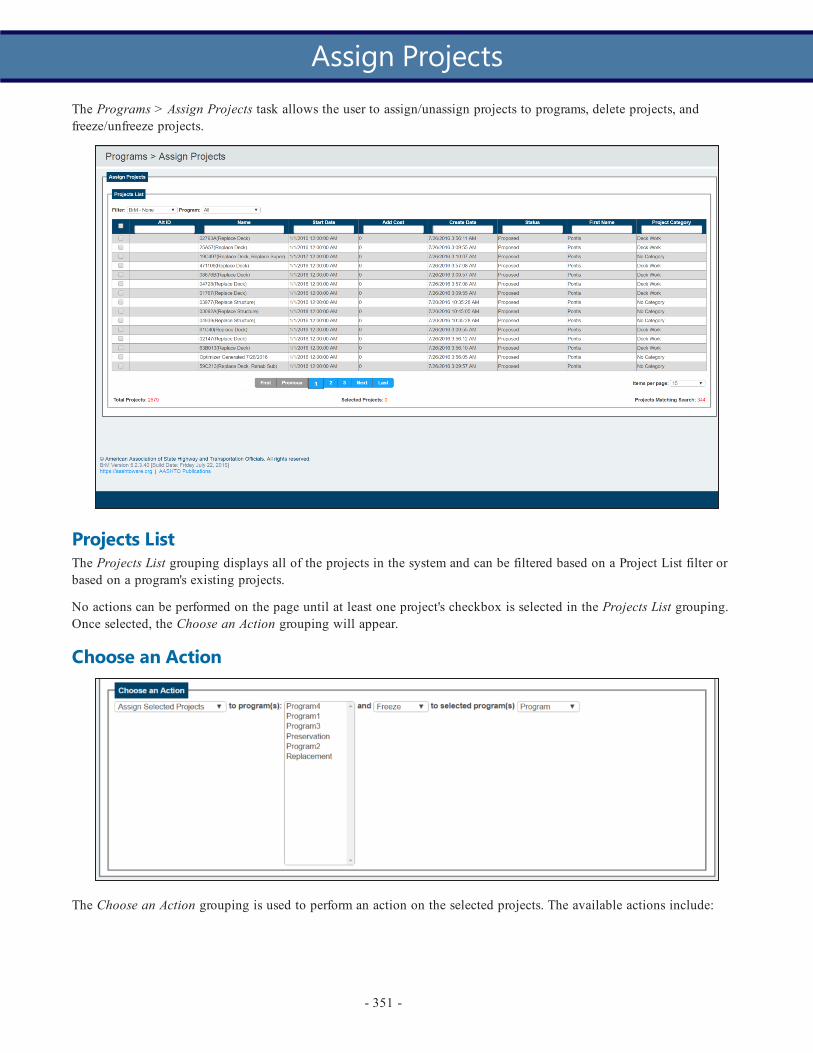
The Programs > Assign Projects task allows the user to assign/unassign projects to programs, delete projects, andfreeze/unfreeze projects.
Projects ListThe Projects List grouping displays all of the projects in the system and can be filtered based on a Project List filter orbased on a program's existing projects.
No actions can be performed on the page until at least one project's checkbox is selected in the Projects List grouping.Once selected, the Choose an Action grouping will appear.
Choose an Action
The Choose an Action grouping is used to perform an action on the selected projects. The available actions include:
- 351 -
Assign Projects
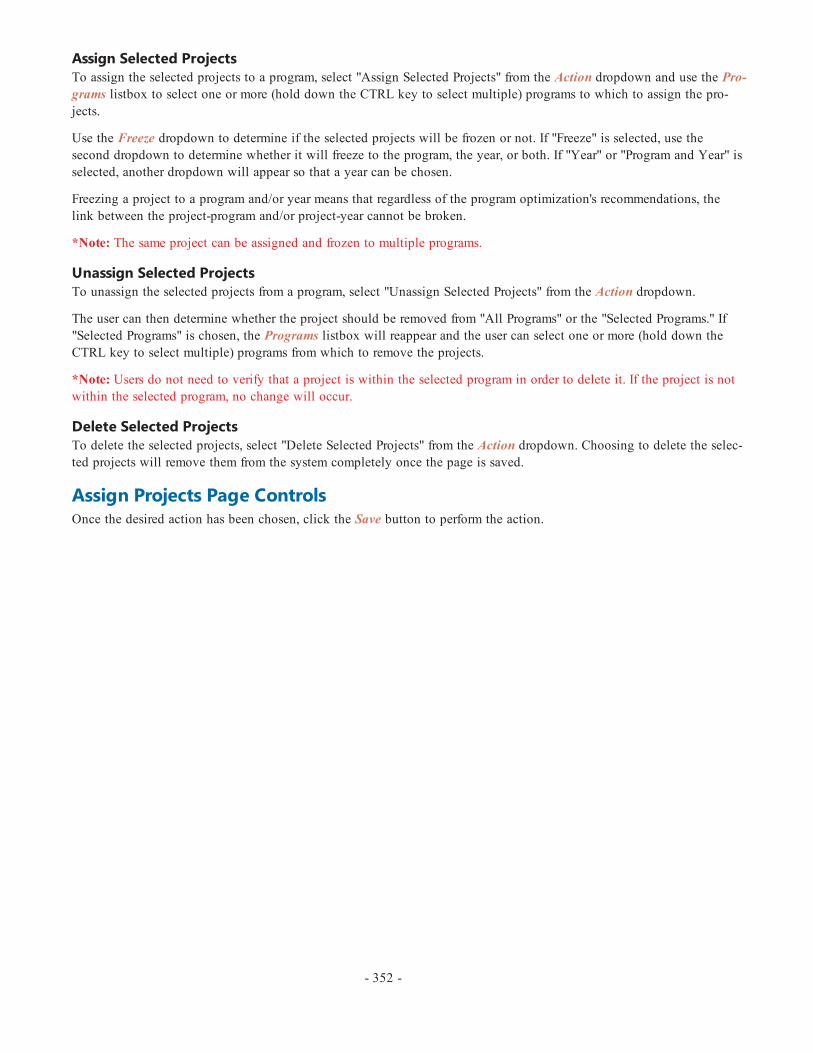
Assign Selected ProjectsTo assign the selected projects to a program, select "Assign Selected Projects" from the Action dropdown and use the Pro-grams listbox to select one or more (hold down the CTRL key to select multiple) programs to which to assign the pro-jects.
Use the Freeze dropdown to determine if the selected projects will be frozen or not. If "Freeze" is selected, use thesecond dropdown to determine whether it will freeze to the program, the year, or both. If "Year" or "Program and Year" isselected, another dropdown will appear so that a year can be chosen.
Freezing a project to a program and/or year means that regardless of the program optimization's recommendations, thelink between the project-program and/or project-year cannot be broken.
*Note: The same project can be assigned and frozen to multiple programs.
Unassign Selected ProjectsTo unassign the selected projects from a program, select "Unassign Selected Projects" from the Action dropdown.
The user can then determine whether the project should be removed from "All Programs" or the "Selected Programs." If"Selected Programs" is chosen, the Programs listbox will reappear and the user can select one or more (hold down theCTRL key to select multiple) programs from which to remove the projects.
*Note: Users do not need to verify that a project is within the selected program in order to delete it. If the project is notwithin the selected program, no change will occur.
Delete Selected ProjectsTo delete the selected projects, select "Delete Selected Projects" from the Action dropdown. Choosing to delete the selec-ted projects will remove them from the system completely once the page is saved.
Assign Projects Page ControlsOnce the desired action has been chosen, click the Save button to perform the action.
- 352 -

The Programs > Performance Measures task is used to include additional performance measures (utility value is auto-matically included in program optimization) to the selected program. The performance measures are used to evaluate theselected program.
The Program dropdown is used to select the program for which the performance measures are being established.
The Scenario dropdown is used to select the scenario of the selected program for which the performance measures arebeing established.
Select Performance MeasuresThe Select Performance Measures grouping allows the user to determine which performance measures to use on the selec-ted program.
To add a performance measure, click the Add New Record symbol - - to make the Performance Measures dropdownappear.
The available performance measures are:
Performance Measures
Measure Description
Pct. Good (Count-Based)
The percentage of bridges included in the program analysis with anoverall NBI rating greater than or equal to 7.*Note: This is count-based, meaning the size of the bridge is NOTconsidered. With this method, a 1000 ft. bridge is equal to a 100 ft.bridge. It's a 1:1 ratio.
Pct. Good (Surface-Based)
The percentage of deck area of bridges included in the program ana-lysis with an overall NBI rating greater than or equal to 7.*Note: This is surface-based, meaning the size of the bridge IS con-sidered. With this method, a 1000 ft. bridge affects the overall per-
- 353 -
Performance Measures
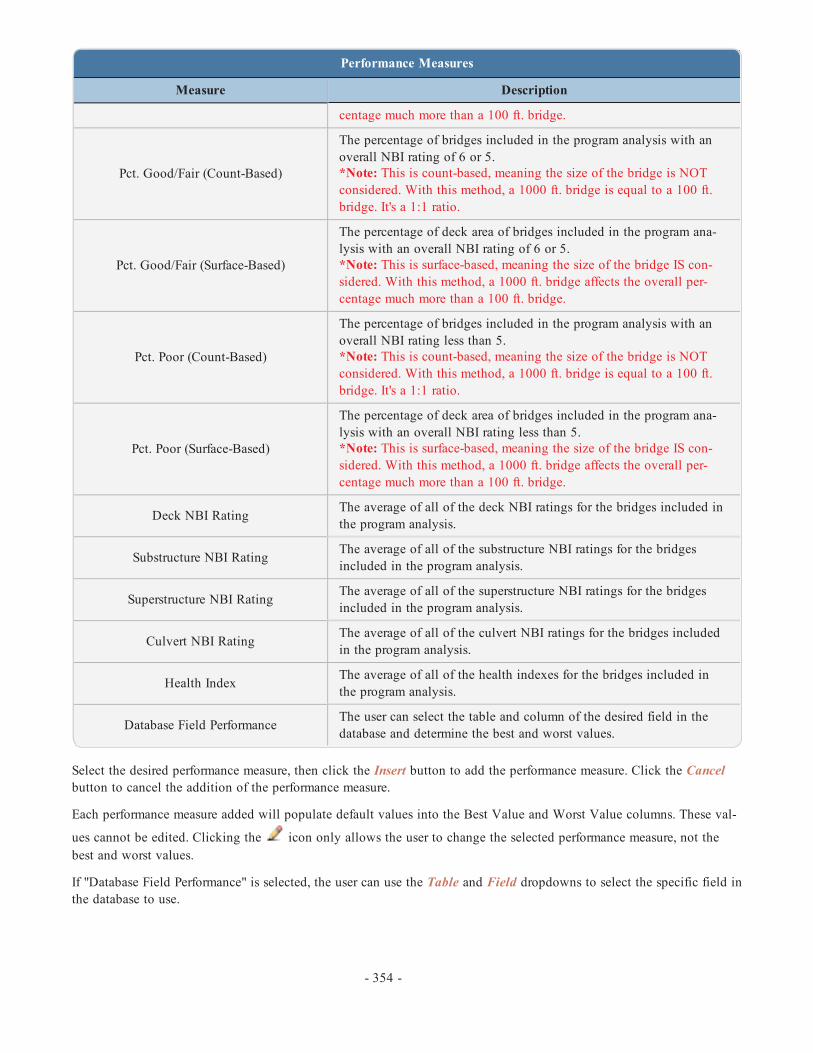
Performance Measures
Measure Description
centage much more than a 100 ft. bridge.
Pct. Good/Fair (Count-Based)
The percentage of bridges included in the program analysis with anoverall NBI rating of 6 or 5.*Note: This is count-based, meaning the size of the bridge is NOTconsidered. With this method, a 1000 ft. bridge is equal to a 100 ft.bridge. It's a 1:1 ratio.
Pct. Good/Fair (Surface-Based)
The percentage of deck area of bridges included in the program ana-lysis with an overall NBI rating of 6 or 5.*Note: This is surface-based, meaning the size of the bridge IS con-sidered. With this method, a 1000 ft. bridge affects the overall per-centage much more than a 100 ft. bridge.
Pct. Poor (Count-Based)
The percentage of bridges included in the program analysis with anoverall NBI rating less than 5.*Note: This is count-based, meaning the size of the bridge is NOTconsidered. With this method, a 1000 ft. bridge is equal to a 100 ft.bridge. It's a 1:1 ratio.
Pct. Poor (Surface-Based)
The percentage of deck area of bridges included in the program ana-lysis with an overall NBI rating less than 5.*Note: This is surface-based, meaning the size of the bridge IS con-sidered. With this method, a 1000 ft. bridge affects the overall per-centage much more than a 100 ft. bridge.
Deck NBI Rating The average of all of the deck NBI ratings for the bridges included inthe program analysis.
Substructure NBI Rating The average of all of the substructure NBI ratings for the bridgesincluded in the program analysis.
Superstructure NBI Rating The average of all of the superstructure NBI ratings for the bridgesincluded in the program analysis.
Culvert NBI Rating The average of all of the culvert NBI ratings for the bridges includedin the program analysis.
Health Index The average of all of the health indexes for the bridges included inthe program analysis.
Database Field Performance The user can select the table and column of the desired field in thedatabase and determine the best and worst values.
Select the desired performance measure, then click the Insert button to add the performance measure. Click the Cancelbutton to cancel the addition of the performance measure.
Each performance measure added will populate default values into the Best Value and Worst Value columns. These val-
ues cannot be edited. Clicking the icon only allows the user to change the selected performance measure, not thebest and worst values.
If "Database Field Performance" is selected, the user can use the Table and Field dropdowns to select the specific field inthe database to use.
- 354 -

Unlike the other performance measures, the database field selections don't have default best and worst values. The BestValue and Worst Value textboxes allow the user to determine what those values will be. The minimum and maximumvalues in the database are listed below the textboxes to aid the user in determining the values. These are the only per-
formance measure values that can be edited using the icon.
The performance measure can be edited using the Edit link or deleted using the symbol.
Performance Constraints by SegmentThe Performance Constraints by Segment grouping allows the user to specify constraints (if desired) on the performancemeasures added in the Select Performance Measures grouping. The constraints are separated by the selected program'ssegments which are set in the Subdivision Profile grouping on the Programs > Create/Edit Programs task.
*Note: If no program segments exist, the grid will not be displayed and a link to the Create/Edit Programs task will beavailable so that the user can create segments from the Subdivision Profiles grouping.
The performance constraints are used to further specify the optimization process. In addition to maximizing utility, theoptimization will attempt to adhere to the specified performance (and budget) constraints.
The available constraints, depending on the type of performance measure, are:
- 355 -
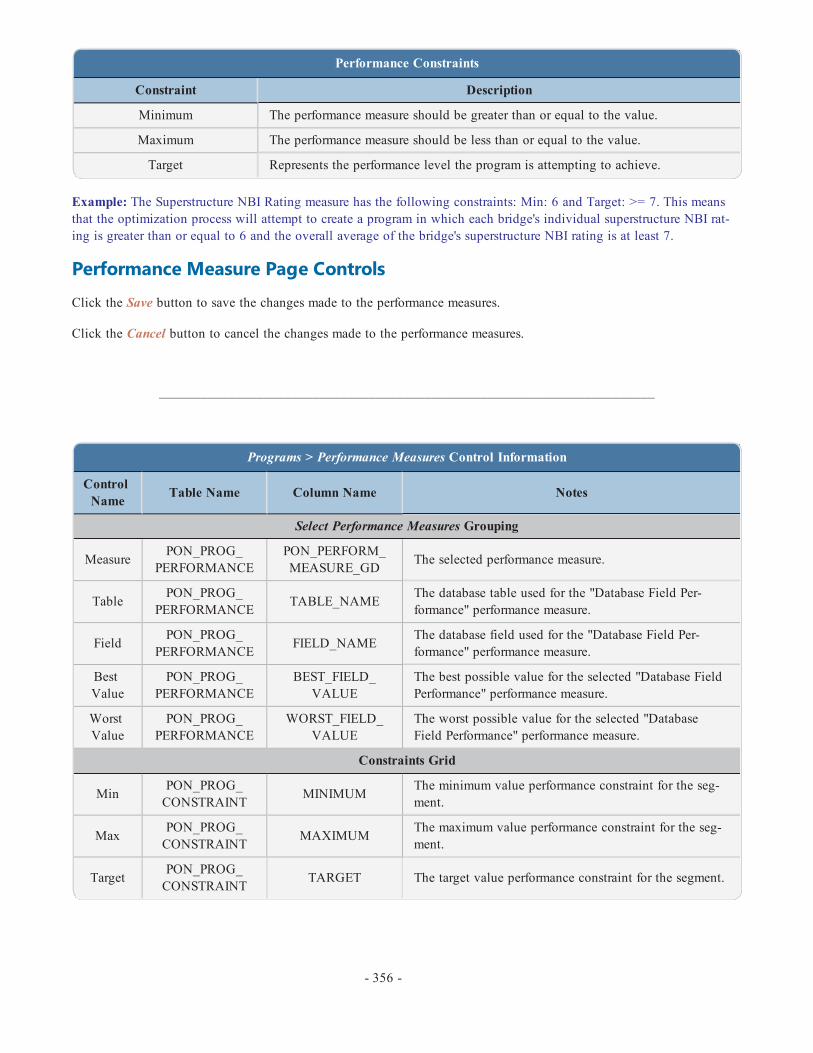
Performance Constraints
Constraint Description
Minimum The performance measure should be greater than or equal to the value.
Maximum The performance measure should be less than or equal to the value.
Target Represents the performance level the program is attempting to achieve.
Example: The Superstructure NBI Rating measure has the following constraints: Min: 6 and Target: >= 7. This meansthat the optimization process will attempt to create a program in which each bridge's individual superstructure NBI rat-ing is greater than or equal to 6 and the overall average of the bridge's superstructure NBI rating is at least 7.
Performance Measure Page ControlsClick the Save button to save the changes made to the performance measures.
Click the Cancel button to cancel the changes made to the performance measures.
_______________________________________________________________________
Programs > Performance Measures Control Information
ControlName Table Name Column Name Notes
Select Performance Measures Grouping
Measure PON_PROG_PERFORMANCE
PON_PERFORM_MEASURE_GD The selected performance measure.
Table PON_PROG_PERFORMANCE TABLE_NAME The database table used for the "Database Field Per-
formance" performance measure.
Field PON_PROG_PERFORMANCE FIELD_NAME The database field used for the "Database Field Per-
formance" performance measure.
BestValue
PON_PROG_PERFORMANCE
BEST_FIELD_VALUE
The best possible value for the selected "Database FieldPerformance" performance measure.
WorstValue
PON_PROG_PERFORMANCE
WORST_FIELD_VALUE
The worst possible value for the selected "DatabaseField Performance" performance measure.
Constraints Grid
Min PON_PROG_CONSTRAINT MINIMUM The minimum value performance constraint for the seg-
ment.
Max PON_PROG_CONSTRAINT MAXIMUM The maximum value performance constraint for the seg-
ment.
Target PON_PROG_CONSTRAINT TARGET The target value performance constraint for the segment.
- 356 -

The Funding Allocation task is used to specify the selected program's funding sources and amounts as well as to dis-tribute the funds between the program's segments.
Use the Program and Scenario dropdowns to determine for which programs to allocate funding.
Funding AllocationThe Funding Allocation grouping displays the program's funding sources and the amounts from each source.
To add a new funding source, click the Add New button.
The Funding Source dropdown determines from where the funding comes. To create new funding sources, use the Pro-jects > Manage Funding > Create/Edit Funding Sources subtask.
The Amount textbox is used to indicate the amount of funds allocated to the program from the source.
The Date dropdown indicates the date that the selected funding source's funds were allocated. The funding source datesare determined on the Projects > Manage Funding > Create/Edit Funding Sources subtask.
To delete a funding source from the program, click that funding source's symbol.
- 357 -
Funding Allocation
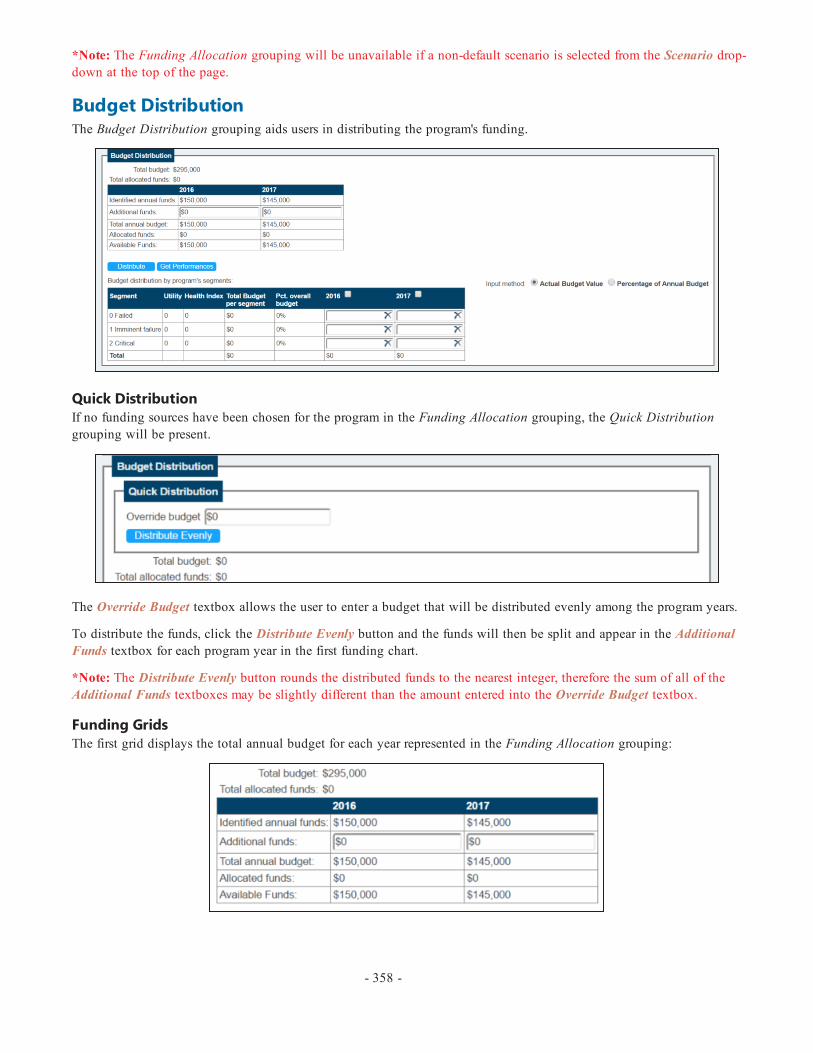
*Note: The Funding Allocation grouping will be unavailable if a non-default scenario is selected from the Scenario drop-down at the top of the page.
Budget DistributionThe Budget Distribution grouping aids users in distributing the program's funding.
Quick DistributionIf no funding sources have been chosen for the program in the Funding Allocation grouping, the Quick Distributiongrouping will be present.
The Override Budget textbox allows the user to enter a budget that will be distributed evenly among the program years.
To distribute the funds, click the Distribute Evenly button and the funds will then be split and appear in the AdditionalFunds textbox for each program year in the first funding chart.
*Note: The Distribute Evenly button rounds the distributed funds to the nearest integer, therefore the sum of all of theAdditional Funds textboxes may be slightly different than the amount entered into the Override Budget textbox.
Funding GridsThe first grid displays the total annual budget for each year represented in the Funding Allocation grouping:
- 358 -
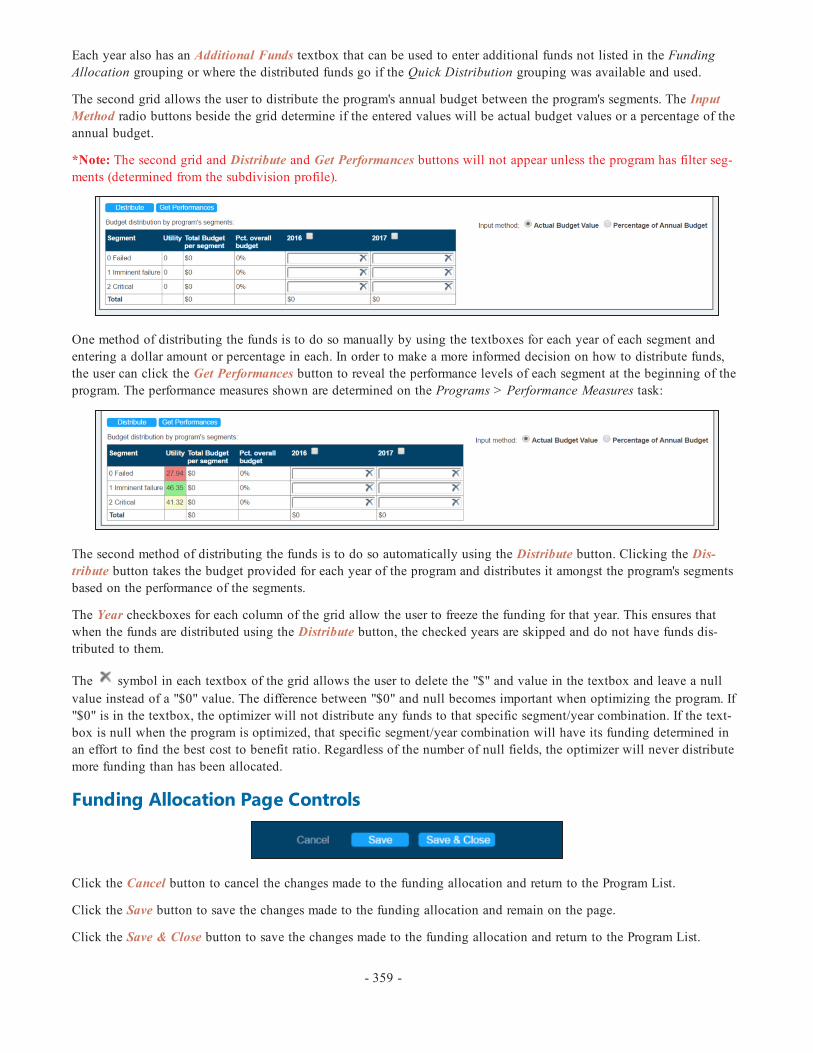
Each year also has an Additional Funds textbox that can be used to enter additional funds not listed in the FundingAllocation grouping or where the distributed funds go if the Quick Distribution grouping was available and used.
The second grid allows the user to distribute the program's annual budget between the program's segments. The InputMethod radio buttons beside the grid determine if the entered values will be actual budget values or a percentage of theannual budget.
*Note: The second grid and Distribute and Get Performances buttons will not appear unless the program has filter seg-ments (determined from the subdivision profile).
One method of distributing the funds is to do so manually by using the textboxes for each year of each segment andentering a dollar amount or percentage in each. In order to make a more informed decision on how to distribute funds,the user can click the Get Performances button to reveal the performance levels of each segment at the beginning of theprogram. The performance measures shown are determined on the Programs > Performance Measures task:
The second method of distributing the funds is to do so automatically using the Distribute button. Clicking the Dis-tribute button takes the budget provided for each year of the program and distributes it amongst the program's segmentsbased on the performance of the segments.
The Year checkboxes for each column of the grid allow the user to freeze the funding for that year. This ensures thatwhen the funds are distributed using the Distribute button, the checked years are skipped and do not have funds dis-tributed to them.
The symbol in each textbox of the grid allows the user to delete the "$" and value in the textbox and leave a nullvalue instead of a "$0" value. The difference between "$0" and null becomes important when optimizing the program. If"$0" is in the textbox, the optimizer will not distribute any funds to that specific segment/year combination. If the text-box is null when the program is optimized, that specific segment/year combination will have its funding determined inan effort to find the best cost to benefit ratio. Regardless of the number of null fields, the optimizer will never distributemore funding than has been allocated.
Funding Allocation Page Controls
Click the Cancel button to cancel the changes made to the funding allocation and return to the Program List.
Click the Save button to save the changes made to the funding allocation and remain on the page.
Click the Save & Close button to save the changes made to the funding allocation and return to the Program List.
- 359 -
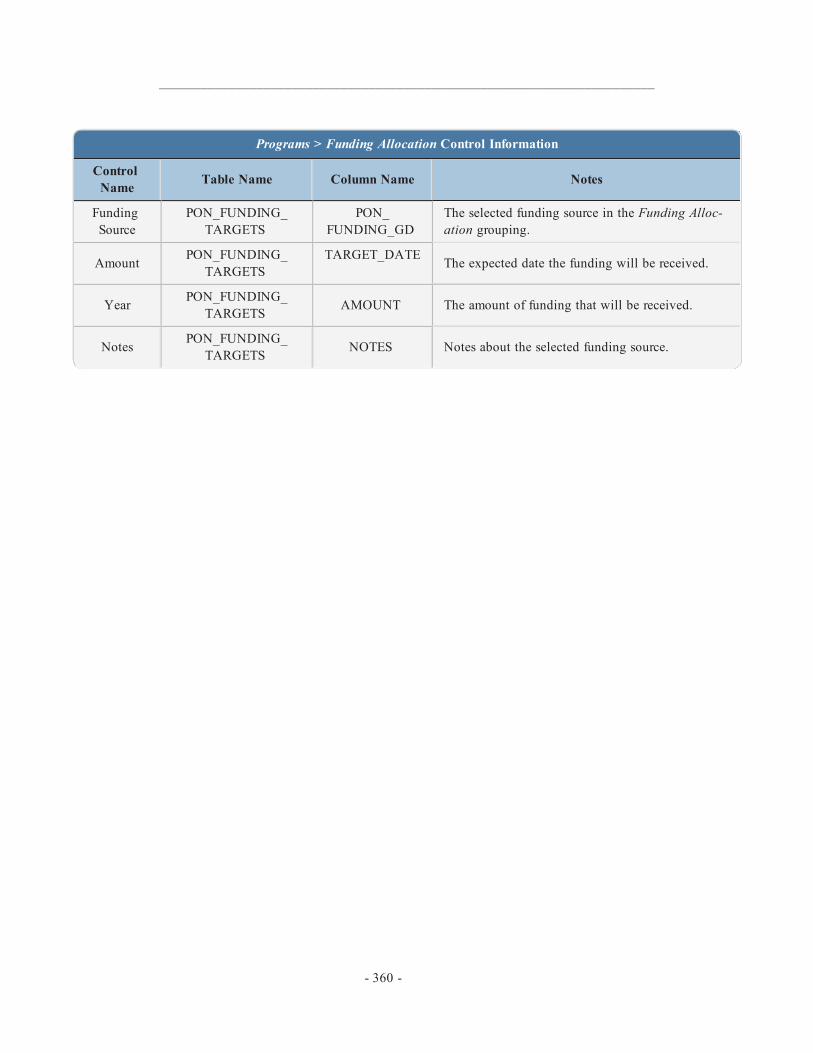
_______________________________________________________________________
Programs > Funding Allocation Control Information
ControlName Table Name Column Name Notes
FundingSource
PON_FUNDING_TARGETS
PON_FUNDING_GD
The selected funding source in the Funding Alloc-ation grouping.
Amount PON_FUNDING_TARGETS
TARGET_DATE The expected date the funding will be received.
Year PON_FUNDING_TARGETS AMOUNT The amount of funding that will be received.
Notes PON_FUNDING_TARGETS NOTES Notes about the selected funding source.
- 360 -

The Programs > Program Planning task is used to run the optimization process for the selected program and assign andmanage the projects within the program.
As its name suggests, the purpose of the program optimizer is to develop optimal programs. The optimizer conducts abenefit cost analysis on a pool of project alternatives and then selects a set of projects that best meet the program's goalsunder its specified constraints. The pool of project alternatives includes the following projects:
a. Automatic projects generated from network policies.b. Projects generated from open work candidates.c. Projects manually assigned to the program.
The current optimization algorithm can consider only manual projects that affect a single bridge. Manual projects affect-ing multiple bridges will not be considered as alternatives for optimization.
The optimization will run on a separate executable from the web application. Specifically, a Windows Service is respons-ible for running the program optimization.
While the optimization is running, users can monitor the status of the optimization on this page. Once the optimizationis completed, users can view all of the projects assigned to the program by the optimization process.
Only one optimization process can be run for a given database. While the optimization is running for a program, userscannot start the optimization on other programs.
The status of the optimization process is stored in PON_PROG_OPTIMIZATION. A new record is created in this tablewhen users start running the optimization process for a program. The record contains the configuration parameters determ-ined by users. The service continuously polls this table to check if a new optimization process is started. Once detectinga new entry, the executable retrieves the parameters provided by users and then runs the process under the given para-meters.
Optimize ProgramThe Optimize Program grouping is used to run the optimization process for the selected program/scenario combination.
The Program dropdown is used to select the program for which the optimization will be performed.
The Scenario dropdown is used to select the scenario of the selected program for which the optimization will be per-formed.
The Optimization Method dropdown determines what method the optimization process will use:
- 361 -
Program Planning
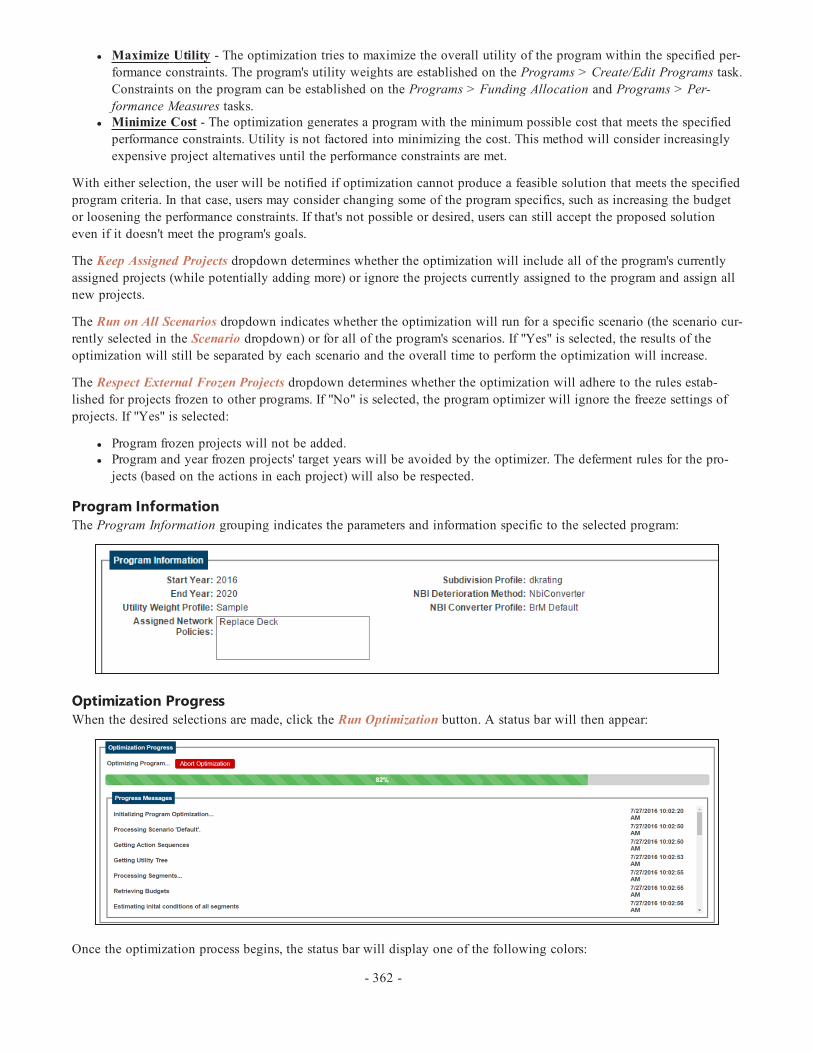
l Maximize Utility - The optimization tries to maximize the overall utility of the program within the specified per-formance constraints. The program's utility weights are established on the Programs > Create/Edit Programs task.Constraints on the program can be established on the Programs > Funding Allocation and Programs > Per-formance Measures tasks.
l Minimize Cost - The optimization generates a program with the minimum possible cost that meets the specifiedperformance constraints. Utility is not factored into minimizing the cost. This method will consider increasinglyexpensive project alternatives until the performance constraints are met.
With either selection, the user will be notified if optimization cannot produce a feasible solution that meets the specifiedprogram criteria. In that case, users may consider changing some of the program specifics, such as increasing the budgetor loosening the performance constraints. If that's not possible or desired, users can still accept the proposed solutioneven if it doesn't meet the program's goals.
The Keep Assigned Projects dropdown determines whether the optimization will include all of the program's currentlyassigned projects (while potentially adding more) or ignore the projects currently assigned to the program and assign allnew projects.
The Run on All Scenarios dropdown indicates whether the optimization will run for a specific scenario (the scenario cur-rently selected in the Scenario dropdown) or for all of the program's scenarios. If "Yes" is selected, the results of theoptimization will still be separated by each scenario and the overall time to perform the optimization will increase.
The Respect External Frozen Projects dropdown determines whether the optimization will adhere to the rules estab-lished for projects frozen to other programs. If "No" is selected, the program optimizer will ignore the freeze settings ofprojects. If "Yes" is selected:
l Program frozen projects will not be added.l Program and year frozen projects' target years will be avoided by the optimizer. The deferment rules for the pro-jects (based on the actions in each project) will also be respected.
Program InformationThe Program Information grouping indicates the parameters and information specific to the selected program:
Optimization ProgressWhen the desired selections are made, click the Run Optimization button. A status bar will then appear:
Once the optimization process begins, the status bar will display one of the following colors:
- 362 -

l Green with moving lines: the optimization is processingl Solid green: the optimization is completel Red: the optimization failed or was aborted
The optimization processing time will vary depending on various factors including the size of the network, number ofprojects, number of constraints, and more. As stated earlier, only one program optimization can be run at a time. Userscan view other areas of the software while the optimization runs.
Once the optimization begins, the Run Optimization button will change to the Abort Optimization button and the Pro-gress Messages grouping will appear to display the progress of the optimization. If for any reason the optimization needsto be stopped prior to completion, click the Abort Optimization button.
Once the optimization is complete, the Assigned Projects grouping will update:
Assigned ProjectsPrior to running the program optimization, the Assigned Projects grouping displays the projects that have been manuallyassigned to the program on the Programs > Assign Projects task. Once the optimization is run, the Assigned Projectsgrouping updates with the projects automatically generated by the optimization (the old projects will remain if "Yes"was selected from the Keep Assigned Projects dropdown.)
The Assigned Projects grouping displays the basic information for each project, including cost, utility, year, and status.The Segment and Year dropdowns allow the user to filter the assigned projects based on the program segment they relate
to or the year they've been assigned, respectively. Clicking the icon for a specific project will open the Projects >Create/Edit Project > Management subtask for that project. From there the project can be removed from the program, ifdesired.
- 363 -

The Programs > Program Results task displays the performance results of the selected program and scenario. The chartsevaluate the program based on the performance measures set on the Programs > Performance Measures task.
Future Performance by SegmentThe Future Performance by Segment chart compares the performance of each program segment in a given year:
- 364 -
Program Results

The Legend indicates the various points on the chart: Program Start, Target, and Program Final. The Edit Parameters but-ton allows the user to select which performance measure and year to display:
Click the Apply button to accept the parameter change.
Click the Cancel button to cancel the parameter change.
Benefit Cost FrontierThe Benefit Cost Frontier chart displays the maximum utility level the selected program segment can achieve in the selec-ted year for a certain level of funding.
- 365 -

The Legend indicates the single point on the chart: Current. This is the current position of the program in the overallbenefit cost frontier.
The Edit Parameters button allows the user to select which program segment and year to display:
Click the Apply button to accept the parameter change.
Click the Cancel button to cancel the parameter change.
Future Performance by YearThe Future Performance by Year chart displays how the program's performance changes throughout the years of the pro-gram.
- 366 -

The blue line indicates the selected program segment's performance for the selected performance measure over the span ofthe program. The red line indicates the target value (if available) for the segment and performance measure selection.
The Edit Parameters button allows the user to select which performance measure and program segment to display:
Click the Apply button to accept the parameter change.
Click the Cancel button to cancel the parameter change.
Effects on Utility CriteriaThe Effects on Utility Criteria chart displays the estimated utility of the selected program segment throughout the spanof the program.
- 367 -

The Condition, LifeCycle, Mobility, and Risk utility values are each displayed and color coded.
The Edit Parameters button allows the user to select which program segment to display:
Click the Apply button to accept the parameter change.
Click the Cancel button to cancel the parameter change.
Program Results Page ControlsThe Re-evaluate Program button re-evaluates the projects that are within the selected program without re-optimizing theprogram. This ensures that the program's projects don't change, but any updates made to the individual projects or theirwork candidates are represented in the graphs.
The icon found on each chart displays a popped out, magnified version of the chart for easier viewing.
The icon found on each chart open a menu of options that allows the user to print the chart, download it in variousformats, or open a data table to more easily view the specific data points on the chart.
- 368 -

The Programs > Executive Summary task displays high-level visual charts specific to the selected program and scenario.These are performance charts that can be used by executives as overviews to various programs in an effort to choosewhich programs to implement and how to fund them.
All of the charts will populate upon opening the task. If they do not populate or need updated, click the Re-evaluateProgram button in the footer.
The displayed charts are determined by the administrator using the Admin > Modeling Config > Executive Summarytask. Contact the administrator to request a new chart.
Some charts may indicate that there is no data to display given the current program and scenario selected combined withthe parameters selected for each chart. The program and scenario can be changed in the header. To change the parametersof a given chart, click the chart's Edit Parameters button, if applicable. A popup will appear to allow the user to changethe parameters of the chart:
Once the desired selections have been made, click the Apply button to accept the parameter change.
- 369 -
Executive Summary

Click the Cancel button to cancel the parameter change.
*Note: Not all charts will have the same parameters. The type and selectability of the parameters is dependent on the spe-cifics of the chart.
Executive Summary Page ControlsThe Re-evaluate Program button re-evaluates the projects that are within the selected program without re-optimizing theprogram. This ensures that the program's projects don't change, but any updates made to the individual projects or theirwork candidates are represented in the graphs.
The icon found on each chart displays a popped out, magnified version of the chart for easier viewing.
The icon found on each chart open a menu of options that allows the user to print the chart, download it in variousformats, or open a data table to more easily view the specific data points on the chart.
- 370 -
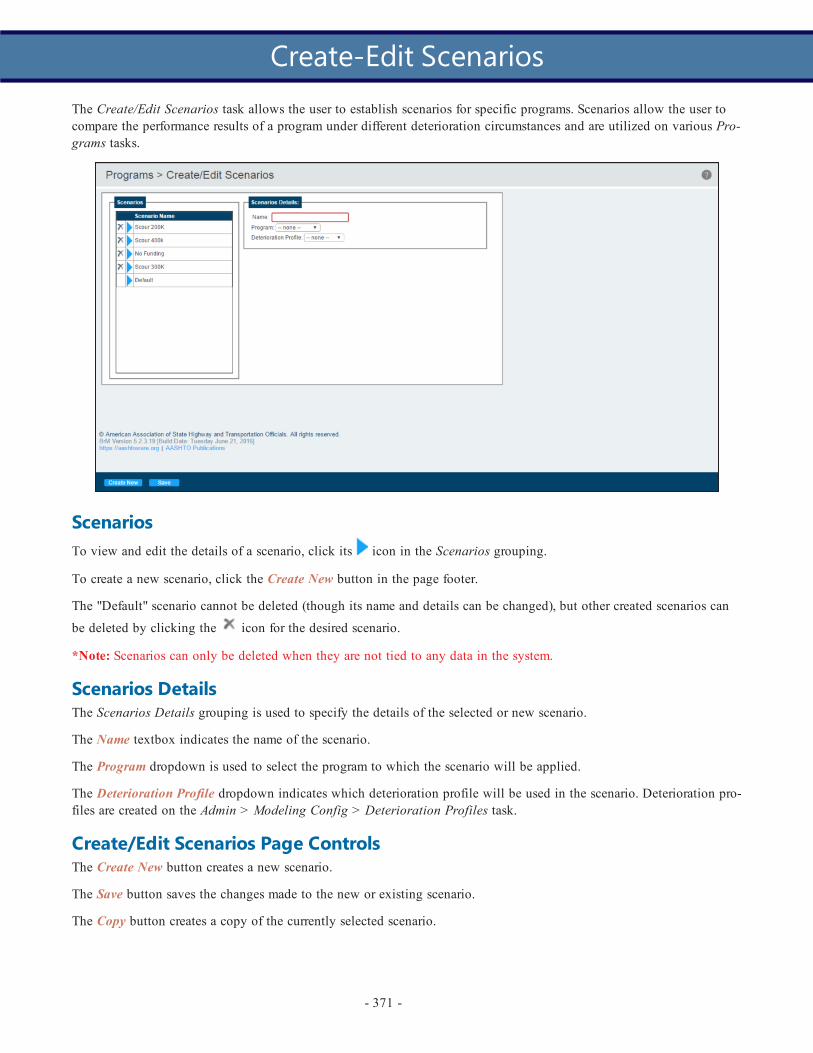
The Create/Edit Scenarios task allows the user to establish scenarios for specific programs. Scenarios allow the user tocompare the performance results of a program under different deterioration circumstances and are utilized on various Pro-grams tasks.
ScenariosTo view and edit the details of a scenario, click its icon in the Scenarios grouping.
To create a new scenario, click the Create New button in the page footer.
The "Default" scenario cannot be deleted (though its name and details can be changed), but other created scenarios can
be deleted by clicking the icon for the desired scenario.
*Note: Scenarios can only be deleted when they are not tied to any data in the system.
Scenarios DetailsThe Scenarios Details grouping is used to specify the details of the selected or new scenario.
The Name textbox indicates the name of the scenario.
The Program dropdown is used to select the program to which the scenario will be applied.
The Deterioration Profile dropdown indicates which deterioration profile will be used in the scenario. Deterioration pro-files are created on the Admin > Modeling Config > Deterioration Profiles task.
Create/Edit Scenarios Page ControlsThe Create New button creates a new scenario.
The Save button saves the changes made to the new or existing scenario.
The Copy button creates a copy of the currently selected scenario.
- 371 -
Create-Edit Scenarios

The Programs > Scenario Explorer task is used to visually compare the performance of a program's various scenarios.Scenarios within a program can differ based on funding, distribution of funding, performance measures, and deteriorationmodels.
Use the Program dropdown in the header to select which program's scenarios to compare. Once selected, click the Applybutton to generate the graph.
ParametersThe graph results are dependent upon the parameters selected. The parameters available to examine are dependent uponthe selected program's performance measures that have been assigned on the Programs > Performance Measures task andthe subdivision profile filter segments determined on the Programs > Create/Edit Programs task.
To specify the graph's parameters, click the Edit Parameters button:
- 372 -
Scenario Explorer

The Performance section lists all of the available performance measures. Only one performance measure can be selected.
The Segments section lists all of the available filter segments. Multiple filter segments can be selected.
Click the Apply button to accept the selections and apply them to the graph.
Click the Cancel button to cancel the selections.
Viewing the GraphThe graph will display results based on the parameter selections. However, it does not automatically update. If, forinstance, the specifics of the scenario or performance measure were changed, the graph will need regenerated.
The footer of the page will notify the user of the last time an estimation was done for the selected program:
The Re-evaluate Program button re-evaluates the projects that are within the selected program without re-optimizing theprogram. This ensures that the program's projects don't change, but any updates made to the individual projects or theirwork candidates are represented in the graph.
*Note: The estimation can take a long time to run depending on the specifics of the program.
Click the button to view the printing and downloading options for the graph.
- 373 -

Appendix A- A BrM 5.2.3 User Group PowerPoint trainingthat outlines the new features of the softwareand how they work together.

This walkthrough was orginially a PowerPoint presentation. It has been included here so that users may continue to bene-fit from it.
Before we start, let’s make sure you have my contact info.
- 375 -
User Group Training

This walkthrough will discuss the 5.2.3 User Interface, the Visual Forms Editor, optimization, and the ScenarioExplorer.
5.2.3 User Interface
We’ll begin with the new user interface. Nothing has changed about the login screen.
- 376 -

First things to notice:
• The nice blue interface.
• Tabs, tasks, and subtasks run down the left side of the application.
Click on the top left, where your name is, to change your password or to log out.
- 377 -

The new Admin menu.
We will get into more of the screens as we continue with the rest of the training.
Visual Forms Editor
Now let’s talk about the Visual Forms Editor. If you ever tried to create your own screens in 5.2.1 or 5.2.2, I think youwill find the new editor to be a great improvement.
- 378 -

The new visual forms editor is WYSIWYG (“What you see is what you get.”)
You can see the effects of your options right away.
In the menu on the top, you can select the page you wish to edit (or create new pages).
Then from that toolbox you can add groups (the organizational boxes), buttons and fields.
In the menu on the side, you can configure the properties of the control or group you have selected (like attaching thedata to a field of your userbrdg table, for example).
- 379 -

You can also access the security settings from the same menu.
Here you can set this control to read-only for inspectors, or totally hidden.
The only thing you can’t do from this screen is parameter overrides (where you use the parameter set of one control onanother control).
- 380 -

And if you prefer, there’s still the old way of doing things.
And another hint…
- 381 -
Optimization
Now let’s get started on the optimization example.
A little perspective.
The first phase of the 5.2.1 overhaul to BrM focused primarily on inspection and work candidates.
- 382 -

In 5.2.2, we added the ability to create and track projects.
Finally, in 5.2.3, we’ve added the parts needed to help the software make recommendations for a new program or to com-plete one you’ve already started.
These are the pieces we will discuss in the rest of this training.
- 383 -

First, we will begin discussing: Inspection Data.
The objective of optimization is to create a data-driven program. So Inspection Data really is the foundation.
You will need data for your decisions to be based on.
If you want detailed cost data and element deterioration, then you will need element inspection data.
If you want to perform beam-end repairs when more than 3 beam ends are CS4, you will need Beam-Ends as an AgencyDefined Element (ADE).
- 384 -

Also note the Validate button. This has been available since 5.2.2, but you can press this button to run a submittalcheck on this structure’s inspection data.
There is also the Calculate NBI button.
Included in inspection data are the risk assessments. For many of you, this may be your first time seeing the risk assess-ment screen.
- 385 -

The risk, expressed as a %, is arrived at by multiplying the likelihood of a hazard occurring and the consequence if thehazard does.
Risk categories and properties can be edited on the Admin > Modeling Config > Assessment task.
Let’s also talk about Work Candidates.
Different agencies use work candidates in different ways.
- 386 -
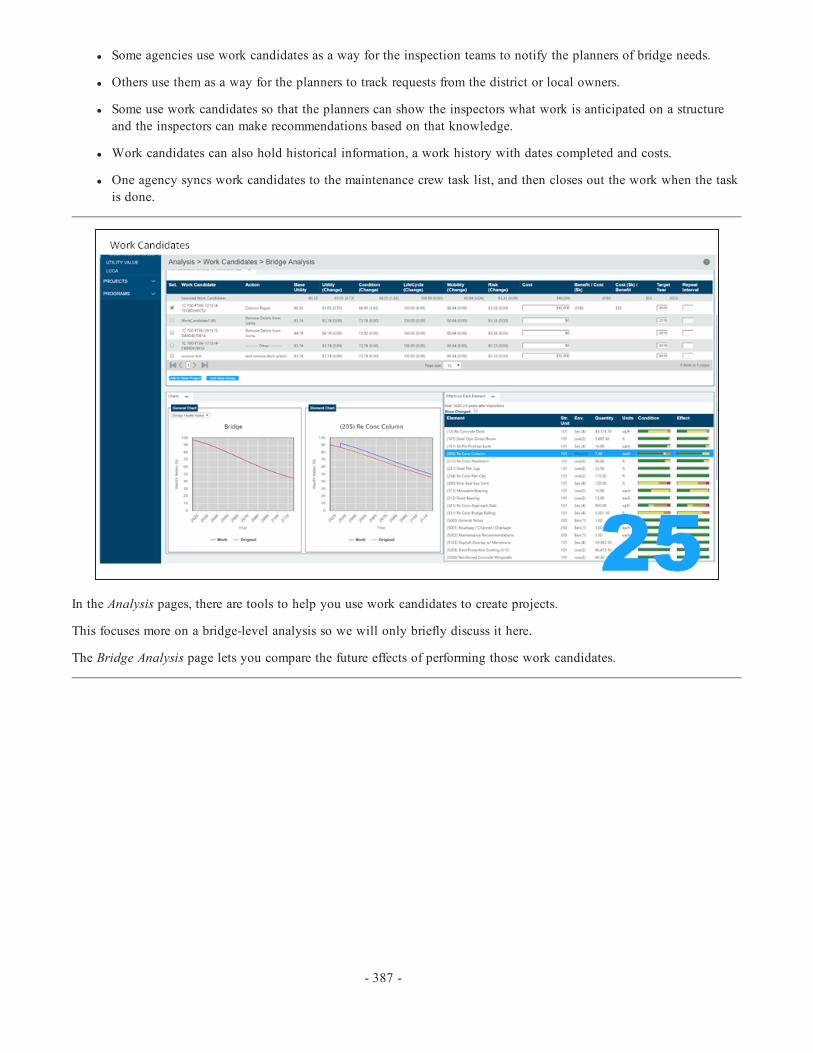
l Some agencies use work candidates as a way for the inspection teams to notify the planners of bridge needs.
l Others use them as a way for the planners to track requests from the district or local owners.
l Some use work candidates so that the planners can show the inspectors what work is anticipated on a structureand the inspectors can make recommendations based on that knowledge.
l Work candidates can also hold historical information, a work history with dates completed and costs.
l One agency syncs work candidates to the maintenance crew task list, and then closes out the work when the taskis done.
In the Analysis pages, there are tools to help you use work candidates to create projects.
This focuses more on a bridge-level analysis so we will only briefly discuss it here.
The Bridge Analysis page lets you compare the future effects of performing those work candidates.
- 387 -

The Needs List lets you filter down bridges in the same area or on the same route which need similar work.
For example, if you are putting together a paint program, you can find all the bridges which have an identified paintneed.
Next stop: Utility.
- 388 -
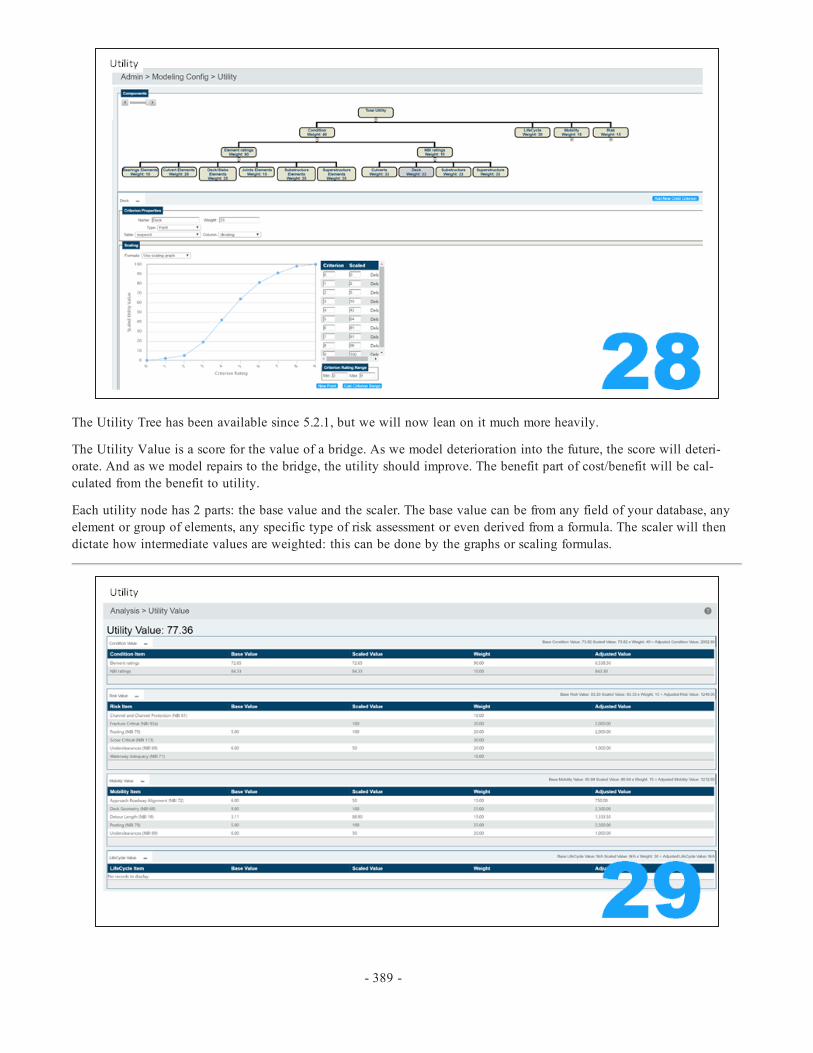
The Utility Tree has been available since 5.2.1, but we will now lean on it much more heavily.
The Utility Value is a score for the value of a bridge. As we model deterioration into the future, the score will deteri-orate. And as we model repairs to the bridge, the utility should improve. The benefit part of cost/benefit will be cal-culated from the benefit to utility.
Each utility node has 2 parts: the base value and the scaler. The base value can be from any field of your database, anyelement or group of elements, any specific type of risk assessment or even derived from a formula. The scaler will thendictate how intermediate values are weighted: this can be done by the graphs or scaling formulas.
- 389 -
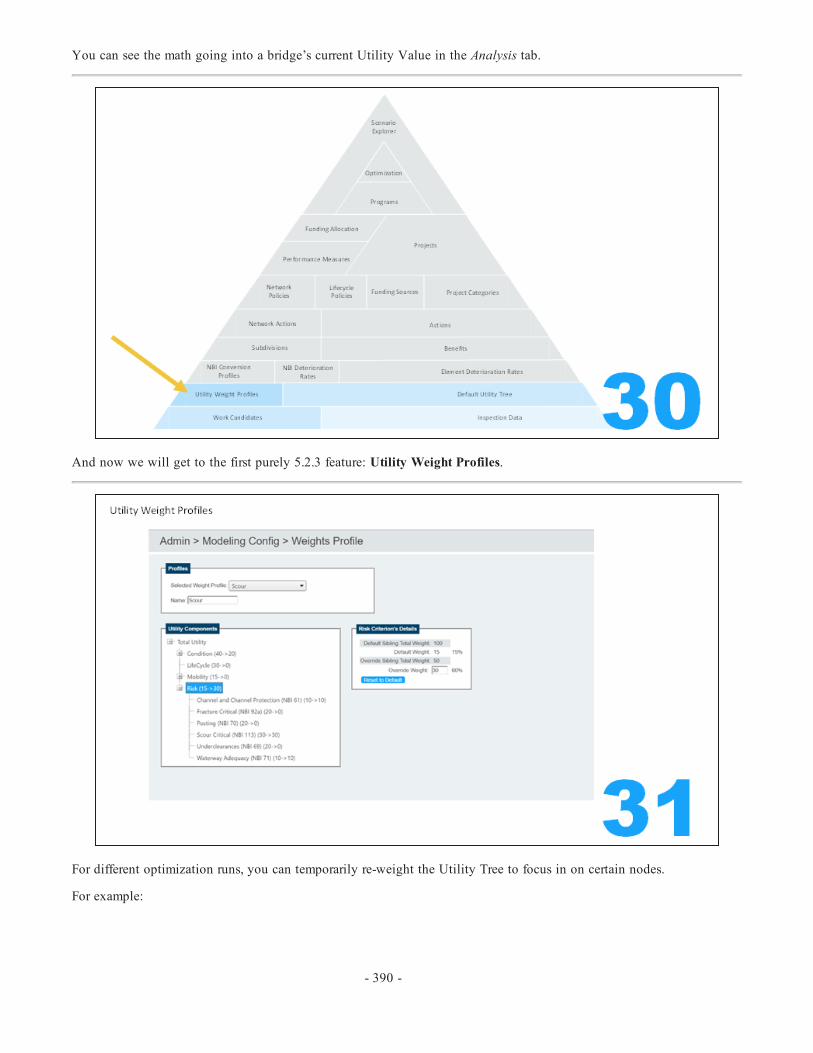
You can see the math going into a bridge’s current Utility Value in the Analysis tab.
And now we will get to the first purely 5.2.3 feature: Utility Weight Profiles.
For different optimization runs, you can temporarily re-weight the Utility Tree to focus in on certain nodes.
For example:
- 390 -
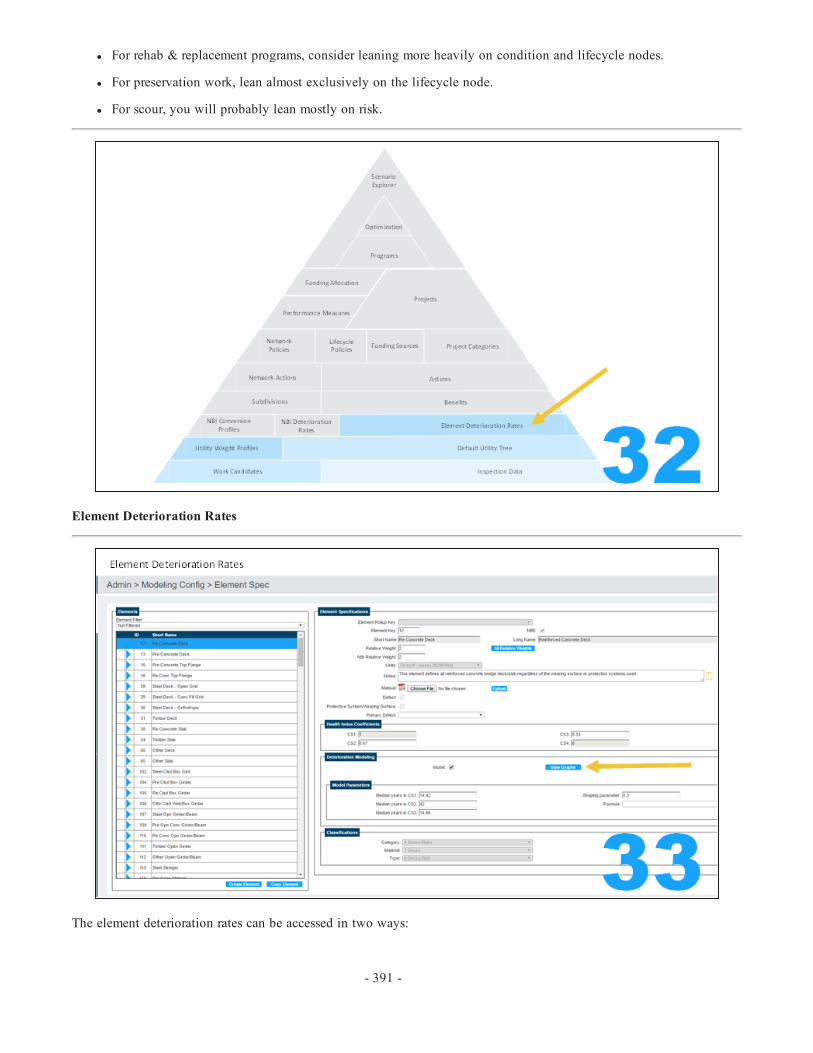
l For rehab & replacement programs, consider leaning more heavily on condition and lifecycle nodes.
l For preservation work, lean almost exclusively on the lifecycle node.
l For scour, you will probably lean mostly on risk.
Element Deterioration Rates
The element deterioration rates can be accessed in two ways:
- 391 -
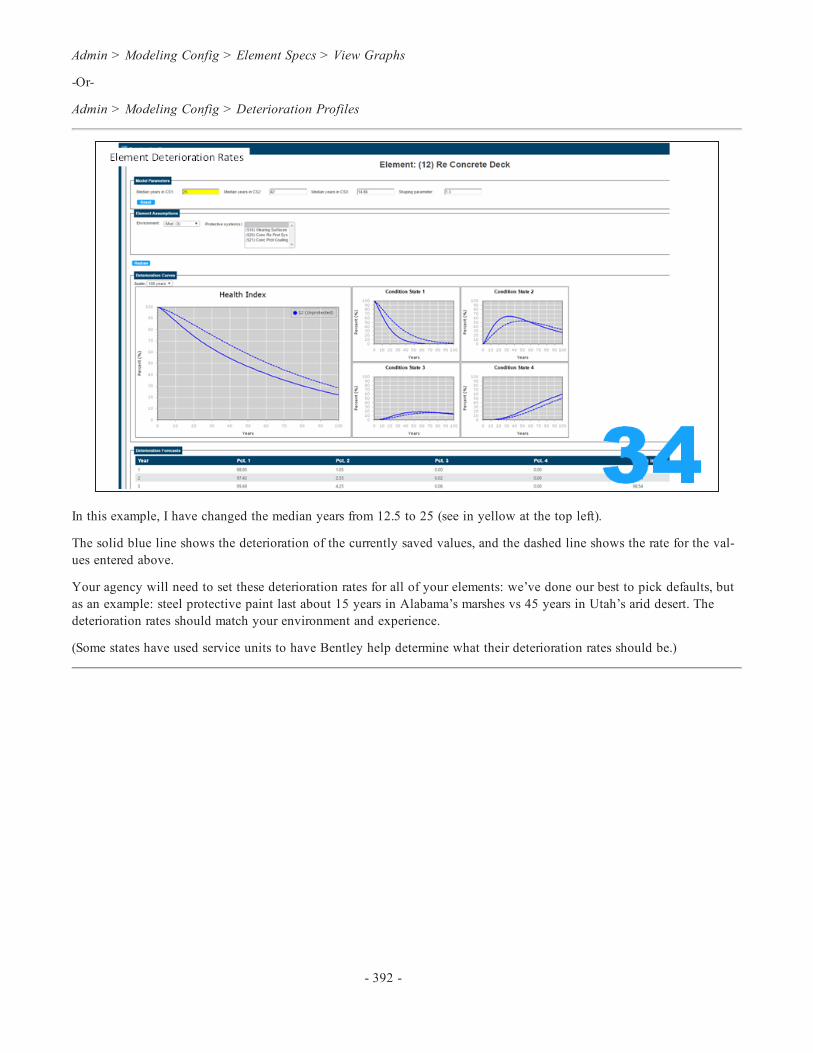
Admin > Modeling Config > Element Specs > View Graphs
-Or-
Admin > Modeling Config > Deterioration Profiles
In this example, I have changed the median years from 12.5 to 25 (see in yellow at the top left).
The solid blue line shows the deterioration of the currently saved values, and the dashed line shows the rate for the val-ues entered above.
Your agency will need to set these deterioration rates for all of your elements: we’ve done our best to pick defaults, butas an example: steel protective paint last about 15 years in Alabama’s marshes vs 45 years in Utah’s arid desert. Thedeterioration rates should match your environment and experience.
(Some states have used service units to have Bentley help determine what their deterioration rates should be.)
- 392 -
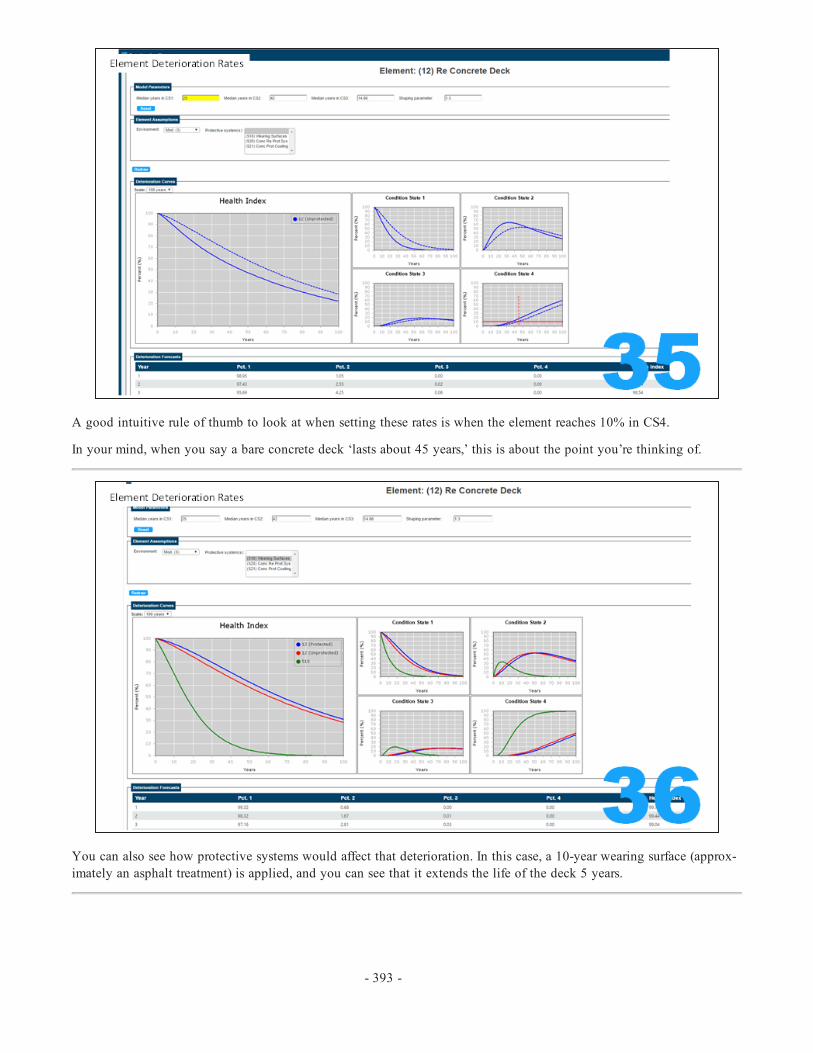
A good intuitive rule of thumb to look at when setting these rates is when the element reaches 10% in CS4.
In your mind, when you say a bare concrete deck ‘lasts about 45 years,’ this is about the point you’re thinking of.
You can also see how protective systems would affect that deterioration. In this case, a 10-year wearing surface (approx-imately an asphalt treatment) is applied, and you can see that it extends the life of the deck 5 years.
- 393 -

NBI Deterioration Rates
At later points in the configuration process, we will set some triggers for actions based on the NBI value. There are twoways to determine those future NBI values: based on the time in condition state (NBI Deterioration) or converting thedeteriorated elements to an approximate NBI value (NBI Conversion).
Here we can set a time in NBI state. The optimizer can use your inspection history to determine how long the bridgedeck has been an NBI of 5, and therefore make a guess as to how long it will remain this way.
If you do not use element inspections on local bridges, you will only be able to use NBI deterioration.
- 394 -

At the bottom of the page, you can pick a filter of bridges and see about how many of those bridges would be “good,fair or poor” based on the values you have set above. This should help you to calibrate these settings.
NBI Conversion Profiles
- 395 -
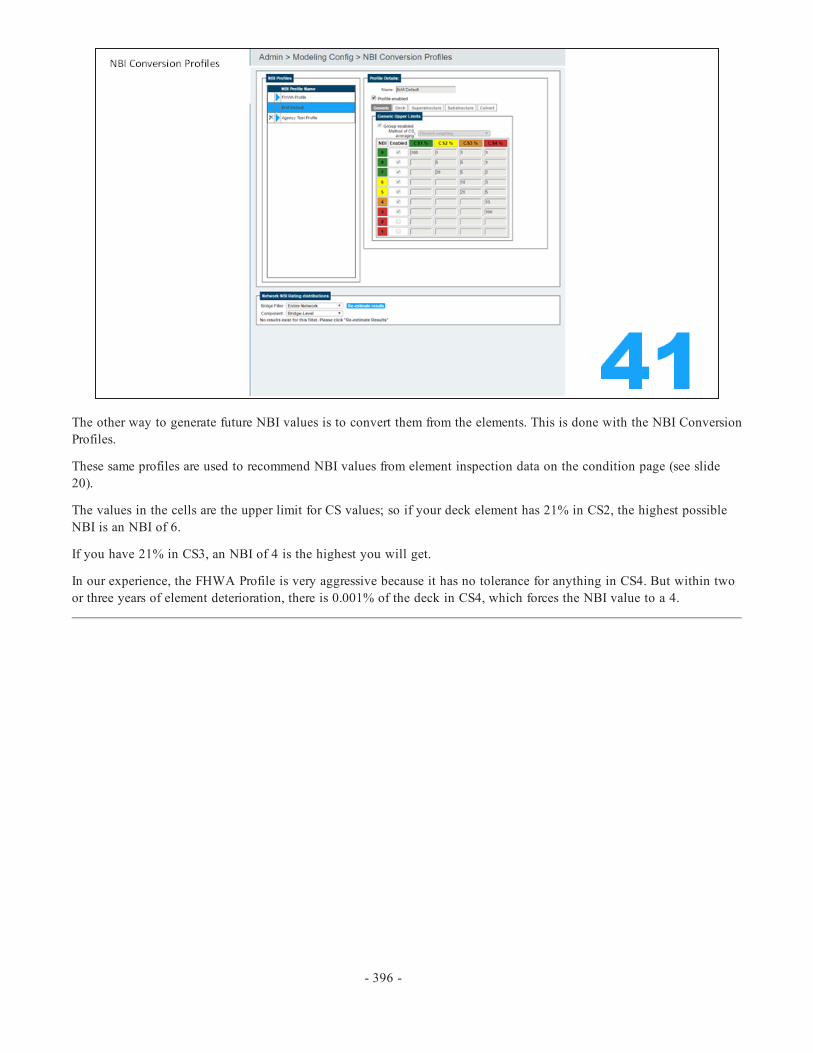
The other way to generate future NBI values is to convert them from the elements. This is done with the NBI ConversionProfiles.
These same profiles are used to recommend NBI values from element inspection data on the condition page (see slide20).
The values in the cells are the upper limit for CS values; so if your deck element has 21% in CS2, the highest possibleNBI is an NBI of 6.
If you have 21% in CS3, an NBI of 4 is the highest you will get.
In our experience, the FHWA Profile is very aggressive because it has no tolerance for anything in CS4. But within twoor three years of element deterioration, there is 0.001% of the deck in CS4, which forces the NBI value to a 4.
- 396 -

There is also a Good / Fair / Poor guide at the bottom, to help you find the appropriate settings for your state.
In testing we came across some states that allow 100% in CS3 to have an NBI of 5, and some which only tolerated 10%in CS3 before dropping to an NBI of 4. These limits will need to be configured to your agency’s practices.
Let’s briefly discuss Subdivisions before moving on to the main pieces of Actions and Benefits.
- 397 -

Subdivisions are used to break the analysis group up into different pieces for tracking results. You will see them play alarger role in the end.
You can create subdivisions based on any database field.
Some common examples would be:
l On and Off the NHS (shown here).
l Subdivision by District
l Subdivision by Owner.
- 398 -
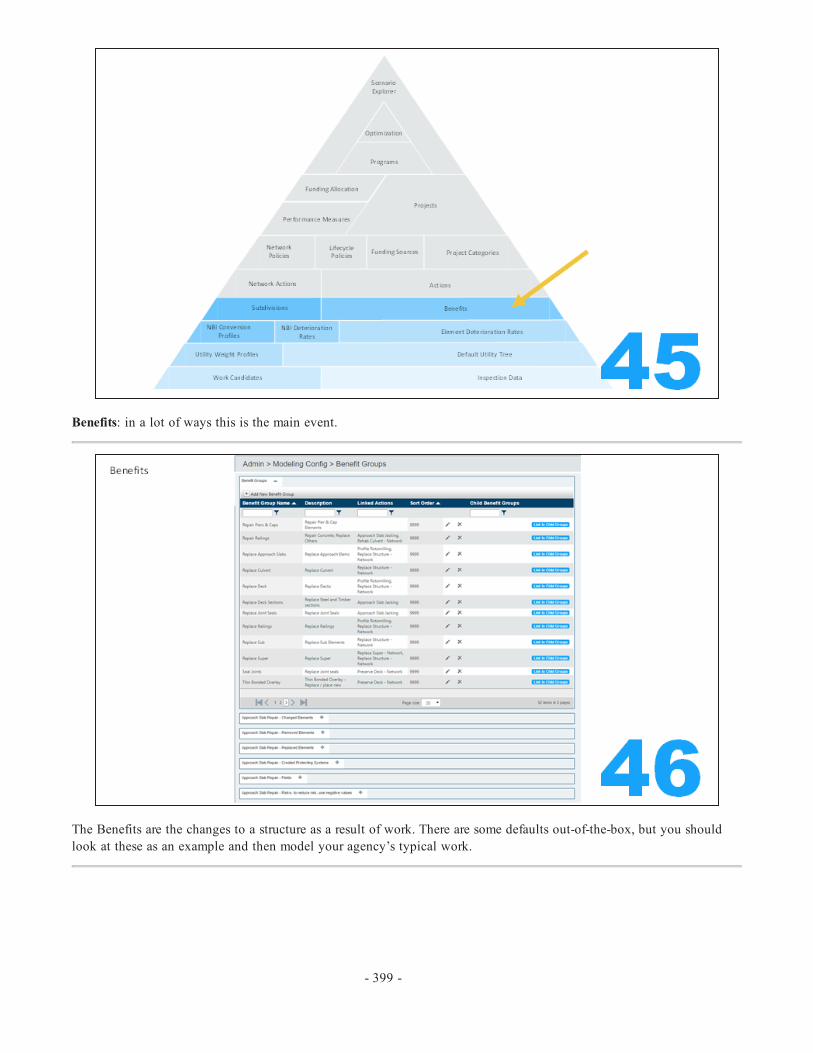
Benefits: in a lot of ways this is the main event.
The Benefits are the changes to a structure as a result of work. There are some defaults out-of-the-box, but you shouldlook at these as an example and then model your agency’s typical work.
- 399 -

A Benefit can be connected to multiple Actions, and an Action can have multiple Benefits. This means you can definesomething like ‘Replace Super’ and use the same benefit for a ‘Replace Super’ Action and as part of a ‘Replace Struc-ture’ Action.
Let's now go through the possible ways to define benefits and talk about the details of each. Some of these have beenadded in 5.2.2 and some in 5.2.3 to better model the kinds of work an agency does to a structure.
- 400 -

The Changed Elements grouping defines a benefit where all or part of an element in a certain condition state is movedto another condition state. The costs will be modeled as $ per unit fixed.
In this example, pothole patching a concrete approach slab moves all of CS3 and CS4 quantities to CS2.
The Removed Elements grouping defines a benefit which removes an element. This can be for record-cleanup and removedefects, or this could be for removing elements like temporary shoring or asphalt overlays to exclude them from furtherdeterioration analysis. The costs will be modeled as $ / total quantity of units.
- 401 -
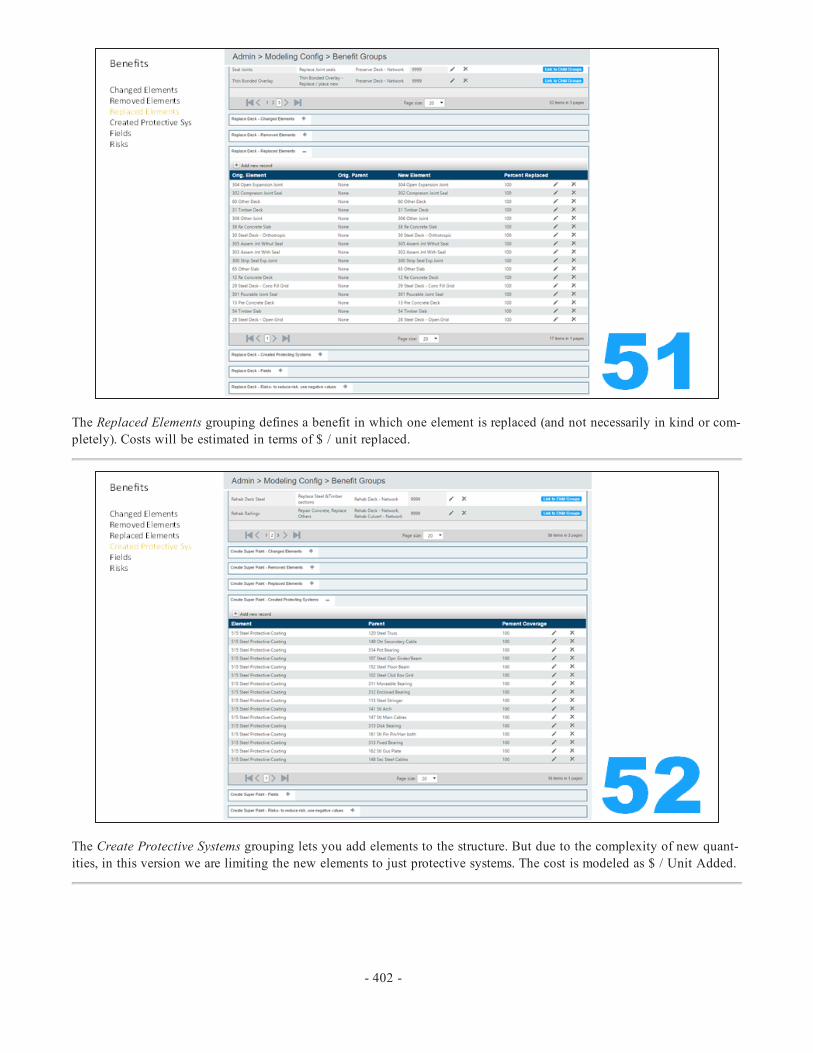
The Replaced Elements grouping defines a benefit in which one element is replaced (and not necessarily in kind or com-pletely). Costs will be estimated in terms of $ / unit replaced.
The Create Protective Systems grouping lets you add elements to the structure. But due to the complexity of new quant-ities, in this version we are limiting the new elements to just protective systems. The cost is modeled as $ / Unit Added.
- 402 -

The Fields grouping lets you model changes to other fields. NBI fields, scour ratings … all tables and columns of bridgedata can be modified. The cost is not modeled by elements, so you will need to use other methods. We will discuss thisin Actions.
The Risk grouping lets you model changes to the risk assessments. Seismic or scour countermeasures can be modeled.There are no direct costs associated with these benefits, we will discuss ways to model costs soon.
- 403 -

Remember: your benefits should affect the Utility nodes. Actions (with their associated benefits) will be weighed interms of their cost to benefit – and the benefit is calculated as the Δ Utility. So it is critical that your benefits affect thenodes present in your utility tree.
Actions: the other side of the coin from Benefits.
- 404 -

There are lots of changes on this screen, and this will impact both the Actions and the Network Actions, with widerimpacts to the rest of the software. First we will focus on the parts at the bottom of the screen.
On the left, this is where you attach the benefits to an action. You can attach multiple benefits to an action (for example,you can re-use a deck replacement benefit as part of a deck replacement action, and a bridge replacement action).
- 405 -
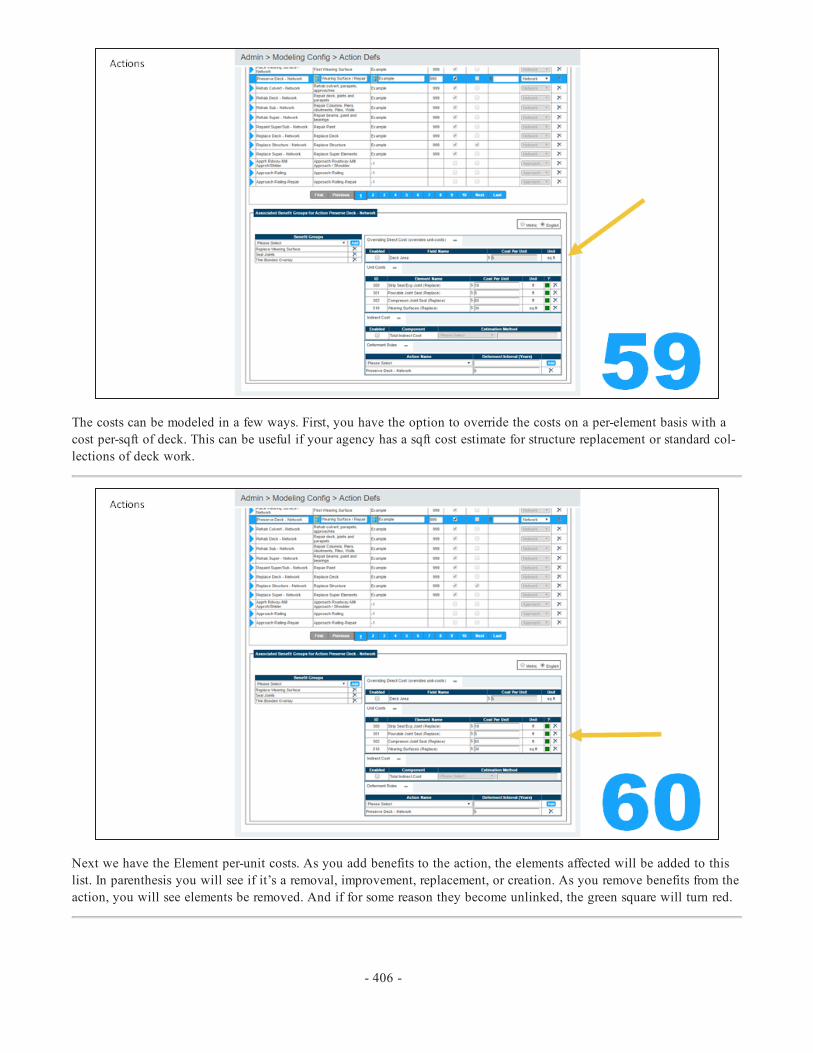
The costs can be modeled in a few ways. First, you have the option to override the costs on a per-element basis with acost per-sqft of deck. This can be useful if your agency has a sqft cost estimate for structure replacement or standard col-lections of deck work.
Next we have the Element per-unit costs. As you add benefits to the action, the elements affected will be added to thislist. In parenthesis you will see if it’s a removal, improvement, replacement, or creation. As you remove benefits from theaction, you will see elements be removed. And if for some reason they become unlinked, the green square will turn red.
- 406 -

You also have the option to add indirect costs, either as a fixed amount or a percentage of the total project. For risk orfield changes, this is probably the best option to reflect costs.
Deferment rules are used primarily by the LCCA modules, and are helpful for modeling how work would actually be per-formed. An action can have deferment effects on many actions, for example replacing the bridge can defer any otheractions for several years.
- 407 -

You have the option to define a minimum cost – which will keep the optimizer from recommending that work until thecost reaches a minimum threshold. We recommend that you keep these thresholds low or nonexistent until you becomefamiliar with the project-thresholds we will discuss later on.
To help you keep your many actions straight (note this example has more than 10 pages of them), an action type hasbeen added, allowing you to filter down your actions to specific types.
- 408 -

Network Actions
To understand the difference between Actions and Network Actions, let’s give you a quick crash course in Modeling.There are two general approaches to network optimization: these are generally referred to as “Top Down” and “BottomUp”.
- 409 -

The fundamental challenge with the bottom up approach is the number of possible combinations of actions. In this case,I listed out the common work items UDOT normally performs, and as you can see, the bridges would be gone longbefore I could arrive at my best answer – unless I was willing to use a supercomputer or make some assumptions.
For the Top-Down approach, using a single average project is probably too simplistic. So instead consider where wechose an action from each of these columns. We define “Preserve Deck” as our generic deck preservation treatment. Thiscalculation can be completed in a more reasonable amount of time.
- 410 -

So Actions which are built to be used for the top-down network analysis can be distinguished from bottom-up (work can-didate) Actions by checking the Network Level box. This will enable this Action to be used in Network Policies (wherewe’re going next).
Network Policies
- 411 -

These are the same 4 generic actions in each category that we were discussing on slide 68. Notice that we can reduce thenumber of combinations (and thus computation time) further by ruling out combinations we would never consider. Wewould never pair a deck rehab or deck preservation with a superstructure replacement. In this example, in my state thereare no substructure preservation treatments we would consider.
The Network Policies allow us to define the combinations of actions to be used in optimization. You can go up to 3levels deep, and there’s no limit to how many treatments you put on each branch of the tree (but remember everythingyou add will add run-time to the analysis). You add branches through the menu at the bottom.
It’s typically good practice to name a tree after the root action, but this is not required.
- 412 -

To limit the numbers of conditions even further, you can add conditions based on any database fields of when this workshould be considered. This way the optimizer does not recommend preservation work on a bridge with a deck rating of3.
Because the optimizer will recommend a lot of projects, you have the option to define a project category that you wouldconsider this work to be in. For example: Preservation, Rehab, Replacement. So you can sort these projects out by cat-egories later.
- 413 -

Project Categories
Speaking of Project Categories, here is where you can define them. Project Categories can help you to both filter projectsin a program by their category and filter out bridges which are candidates for this work in the needs list.
- 414 -

Funding Sources
Since this has been available since 5.2.2, I will only briefly mention funding sources here. Here you can create and editfunding sources, attach projects or programs to them and see how much of the funds have been allocated from eachsource to a project or program. This piece is not necessary for optimization, but some agencies will find it useful.
- 415 -

Lifecycle Policies
The next piece of the optimization logic is going to require some thought on your part: we’re going to be dealing withthe Life Cycle Cost Analysis (LCCA). Life Cycle Cost can be summarized as ‘what is the value of doing the work nowinstead of later?’ And in order for the software to answer that question, it needs to know what the typical ‘later’ scenariowould look like.
For this reason, you need to codify your state’s usual behavior for preservation, rehab, and replacement. You need to setup rules for what actions you would perform and when you would use them.
- 416 -

You then need to specify which structures use which policy. If you only have one policy for all your structures, thiscould be relatively straight forward.
But this also gives you the flexibility to define different policies for State vs. Locally owned bridges, or NHS vs. non-NHS, or differing strategies by District.
Projects
- 417 -
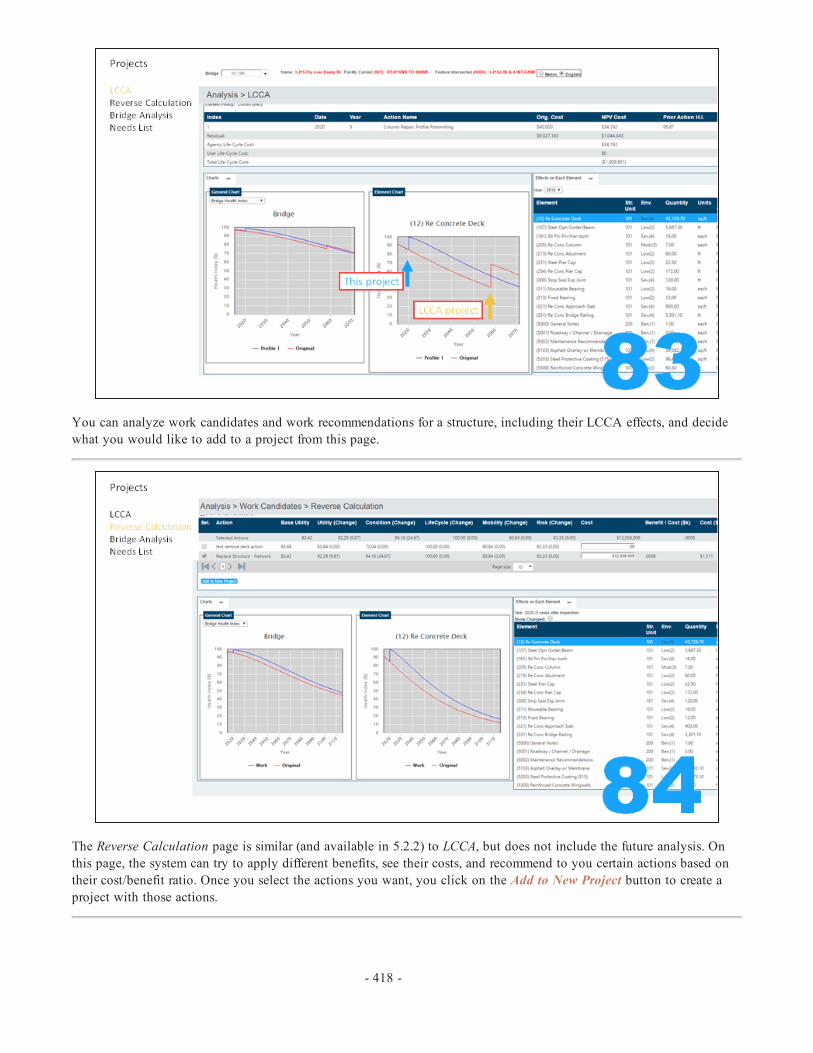
You can analyze work candidates and work recommendations for a structure, including their LCCA effects, and decidewhat you would like to add to a project from this page.
The Reverse Calculation page is similar (and available in 5.2.2) to LCCA, but does not include the future analysis. Onthis page, the system can try to apply different benefits, see their costs, and recommend to you certain actions based ontheir cost/benefit ratio. Once you select the actions you want, you click on the Add to New Project button to create aproject with those actions.
- 418 -

Also previously mentioned, Projects can be made from the Bridge Analysis task: which lets you review the work can-didates which have already been identified for that bridge.
And Projects can be made from the Needs List, where you can filter for work candidates of a similar type across many orall the bridges in your inventory.
- 419 -

On the Projects page, you can also create projects directly, selecting bridges by project category, by name, or by prox-imity on a map. Here you can also merge projects into one or split them up. These tools are also available in 5.2.2.
While not required, you can assign projects to a program. This way the optimizer will work with the projects you havealready defined.
You can choose to:
- 420 -

l Freeze the projects to a program – the optimizer will include your projects as they fit in the cost/benefit rank.
l Freeze to a year: Any programs which respect frozen work will model this project as having been created.
l Freeze to a program and year – the optimizer will model this work as done and find other projects to fill out thebudget (like recommending the rest of your STIP).
Programs: time to start pulling it all together.
- 421 -

We’re going to skip ahead to programs for a minute because this is the order you will use in the software to set up a pro-gram.
Let’s talk about some of the program details first:
You can use any bridge filter from the bridge list to limit the bridges which you will be considering.
You have the option to apply a structure weight formula. There is an example one based on deck areas, but you canwrite a formula based on distance to the legislature, if you’d like.
You will need to set the years of your program on this screen.
And finally, we have here the Required Minimum Cost. We recommend that you start by setting a value in here beforeplaying with action minimums. If you set a threshold of $50k, then projects less than $50k will not be recommended bythe optimizer.
Configuration Data:
The NBI deterioration method is where you will choose if future NBI values should be based off the element deteri-oration plus NBI conversion, or on NBI deterioration curves. If you choose to use the converter, you will need to pickthe conversion profile. Remember, we find the FHWA standard to be very aggressive.
Using the Residual Health Index Approximation can significantly reduce calculation time (in some cases up to 40%) butcomes with a 5% to 10% loss in accuracy for LCCA values.
The Long Term Analysis Period is the single largest influencing factor on the runtimes. How long do you want toinclude in the LCCA calculation. Less than 30 years can give you wildly different answers, and more than 75 years res-ults in almost imperceptible changes in accuracy.
- 422 -

Pick which Network Policies to include in your analysis.
Then connect your Utility Weight Profile.
- 423 -
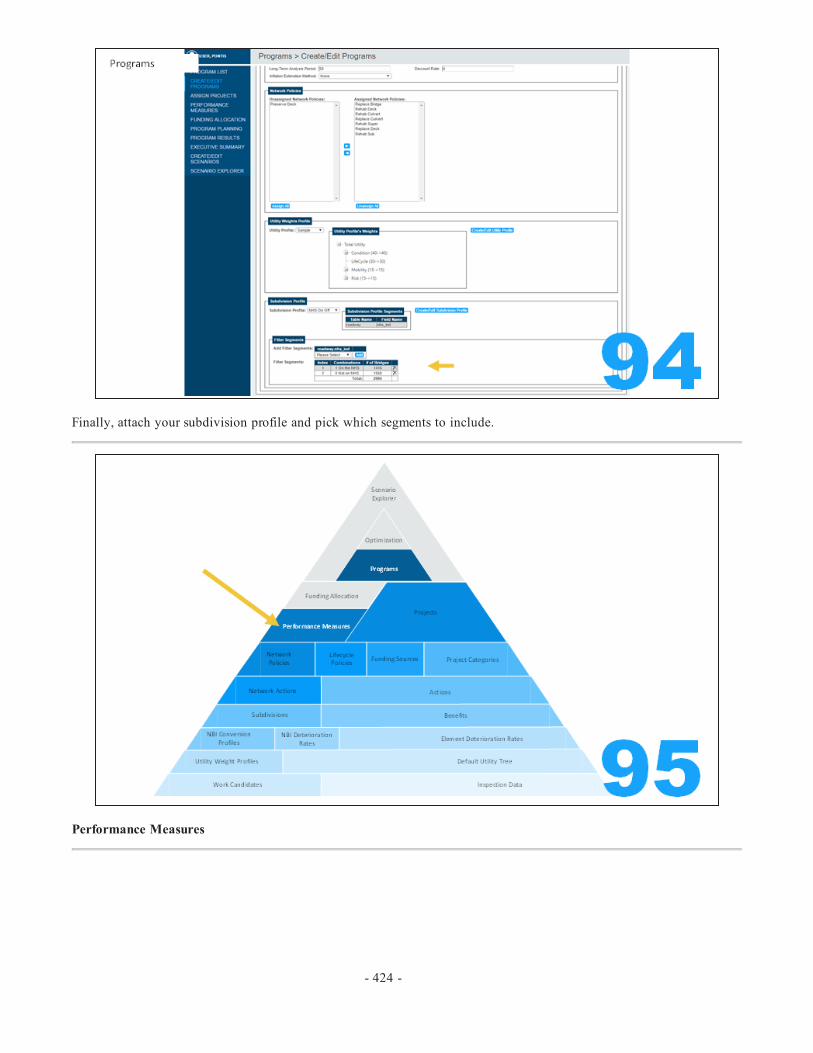
Finally, attach your subdivision profile and pick which segments to include.
Performance Measures
- 424 -
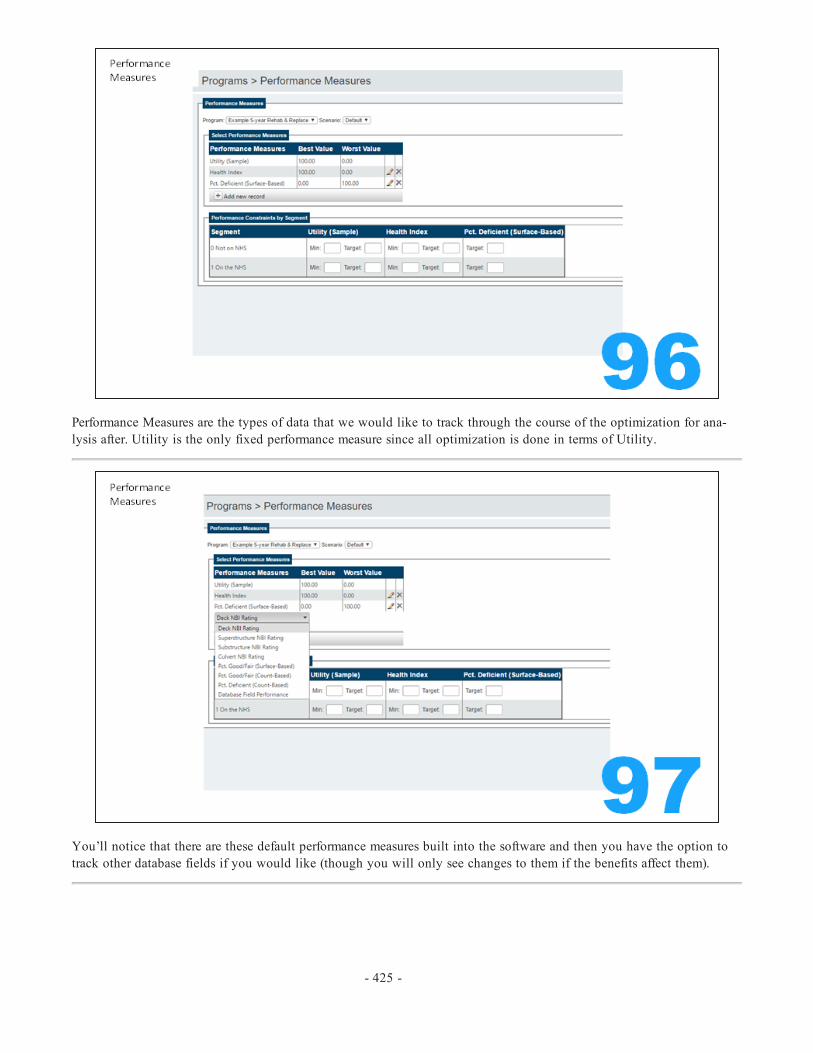
Performance Measures are the types of data that we would like to track through the course of the optimization for ana-lysis after. Utility is the only fixed performance measure since all optimization is done in terms of Utility.
You’ll notice that there are these default performance measures built into the software and then you have the option totrack other database fields if you would like (though you will only see changes to them if the benefits affect them).
- 425 -

You can add targets, which the Optimizer will strive to meet, or you can add minimum thresholds. For example, you cansay ‘don’t return a solution that has a HI less than 50.’
Funding Allocation
- 426 -

You can tie a program’s funding to the funding sources mentioned earlier, though this is not required (and for hypo-thetical programs, probably not recommended).
For quick setups, you can enter an amount and distribute them evenly across all the years.
- 427 -

Or you can enter funds specifically setting a funding each year.
You can also get the current performance of each segment of your subdivision and distribute the funding based on theirinitial performance. In this case, if the non-NHS is further from its targets, it would get more funding.
- 428 -

Optimization
You have arrived at your destination. The Run Optimization button. We will discuss the scenario options in the last sec-tion. Notice also the summary of our previous selections.
- 429 -

Once you click Run Optimization, the process will run in the background on the server. If you log out and come back,the process will still be running. This way it can run for hours, days or (if you go really crazy) weeks without you need-ing to keep the app logged in.
Should you need to abort the process, you can do so with the red Abort Optimization button.
Only one optimization can be run at a time. This is what you would see if you went to a different program, or if youwere another user accessing this page.
- 430 -

Once completed, the projects would be listed below. Notice a few things here:
- As all the low hanging fruit are caught in the first few years, the optimizer recommends more replacements in lateryears, leading to less projects recommended with each year.
- I did not set a minimum project amount, so the optimizer recommended a $62 project. Set a minimum to avoid seeingthese.
The Program Results page has a few fixed graphs to give you information about the performance of your program.
- 431 -
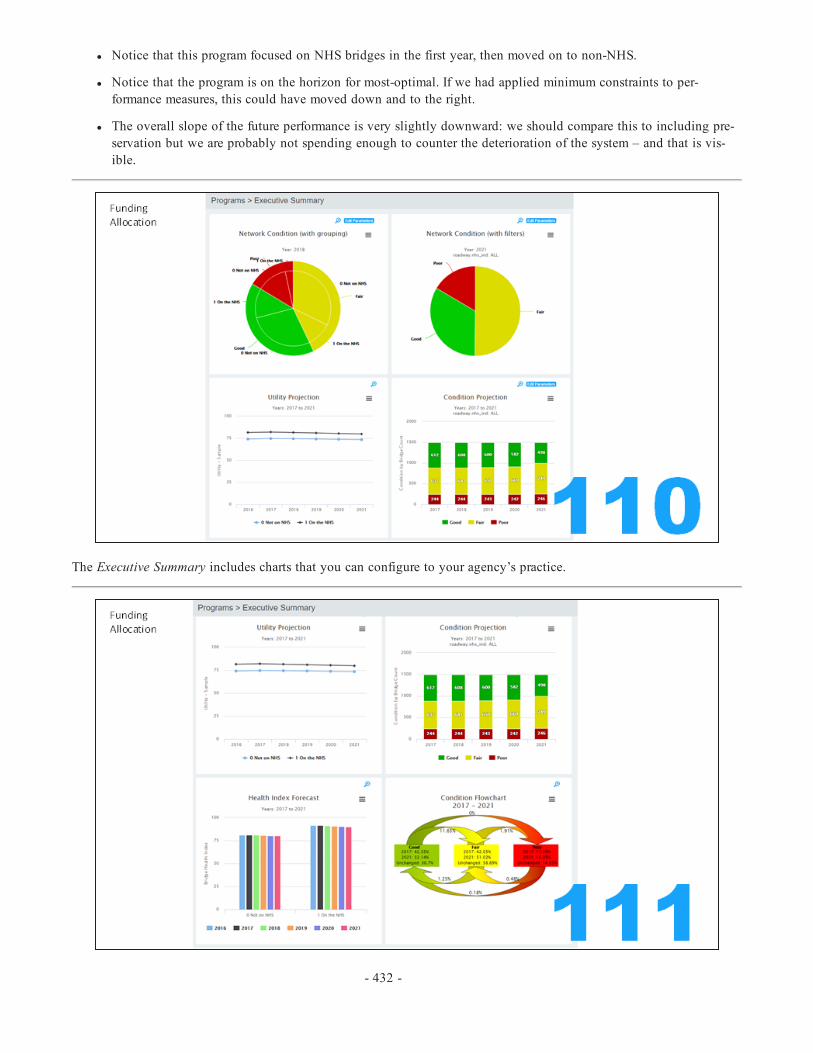
l Notice that this program focused on NHS bridges in the first year, then moved on to non-NHS.
l Notice that the program is on the horizon for most-optimal. If we had applied minimum constraints to per-formance measures, this could have moved down and to the right.
l The overall slope of the future performance is very slightly downward: we should compare this to including pre-servation but we are probably not spending enough to counter the deterioration of the system – and that is vis-ible.
The Executive Summary includes charts that you can configure to your agency’s practice.
- 432 -

Lower on the same page, you can see on the “spider graph” that the percents moving from good to fair or fair to poor arehigher than the program can restore. We’re likely not spending enough on these structures.
Scenario Explorer
So we will create some scenarios where we will look at increased funding levels – for comparison.
- 433 -
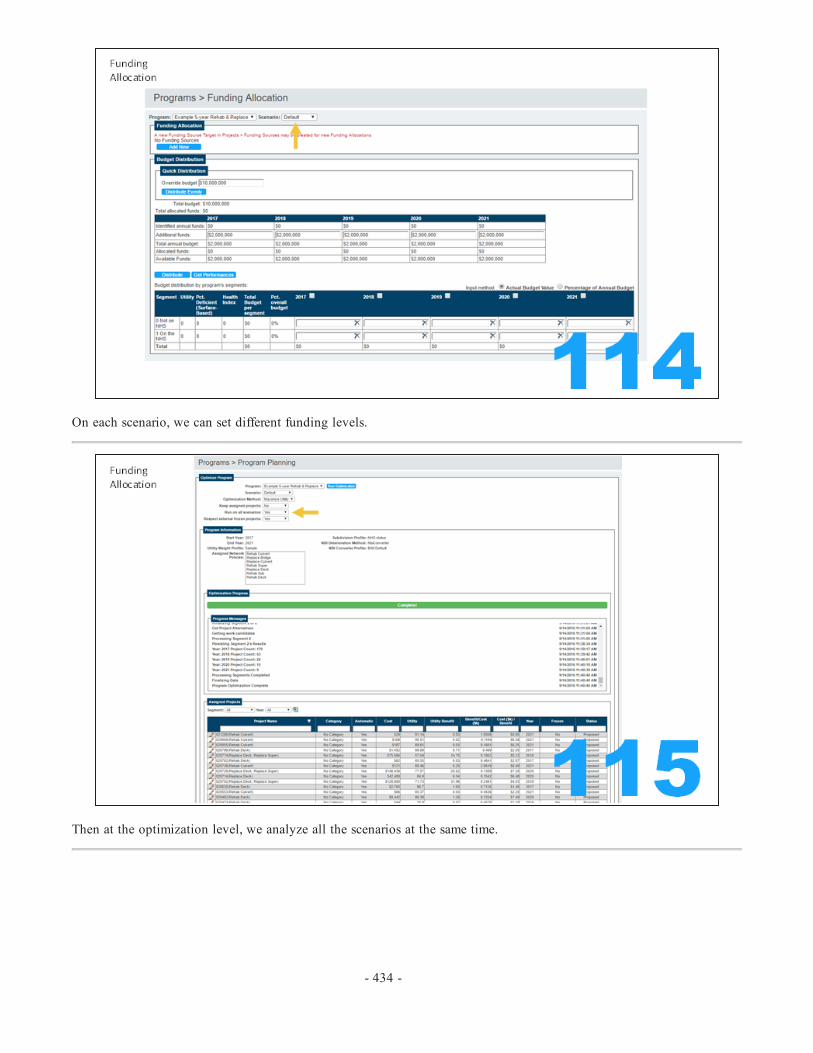
On each scenario, we can set different funding levels.
Then at the optimization level, we analyze all the scenarios at the same time.
- 434 -

Then in the scenario explorer, we can see how each plan fares based on the performance measures we set initially.
In this case, spending $10m would result in an average HI of 81.3 and $60m would accomplish an HI of 85.4.
Your legislature would love to have this level of information.
Looking at our other performance measure: notice how much of a difference the extra money makes in reducing the per-cent of structurally deficient bridges per year.
- 435 -

So this concludes our tour of the features of BrM. The goal has been to create a data-driven process to help you manageyour inventory, giving you the tools to model the decisions you’ve made, the effects those decisions will have, and torecommend some courses of action you should consider.
- 436 -

Appendix B- BrM Basic Use Case Example 1 - ScourMitigation Program

This example will guide you through the steps to configure and run the BrM Program Optimization. It will guide youthrough some features which were released in 5.2.1 and 5.2.2 which influence the optimizer released in 5.2.3.
In this example, we will develop a scour mitigation program for state-owned bridges in a BrM database. This will takeus through all the pages of configuration that your agency will need to consider in order to get realistic and reliable res-ults from the Program Optimizer.
This example assumes that the user has BrM admin rights in order to configure the agency’s policies.
BrM update scripts routinely update or reset example data. This guide will include notes like thisto help you learn how to set up your data in a way that minimizes disruptions during future
updates.
Inspection DataThe BrM Program Optimization is meant to assist states in developing a data-driven program for structure preservation,repair and replacement. Therefore, the first step is data quality.
The more detailed data your agency collects, the more fine-tuned the results will be. For example, if your agency onlycollects NBI data and not element data, your deterioration modeling will be limited to NBI deterioration, NBI-only bene-fit groups, and NBI-only lifecycle calculations.
In this example, scour will be evaluated in terms of the Scour Critical rating (NBI Item 113) and scour assessments. Thebridges being analyzed will need to have NBI Item 113 filled out and/or risk assessments completed for the bridges.
Step 1: Verify that the structures to be programmed have ratings for NBI Item 113 and/or risk assess-ments.
- 438 -
Scour Mitigation Program
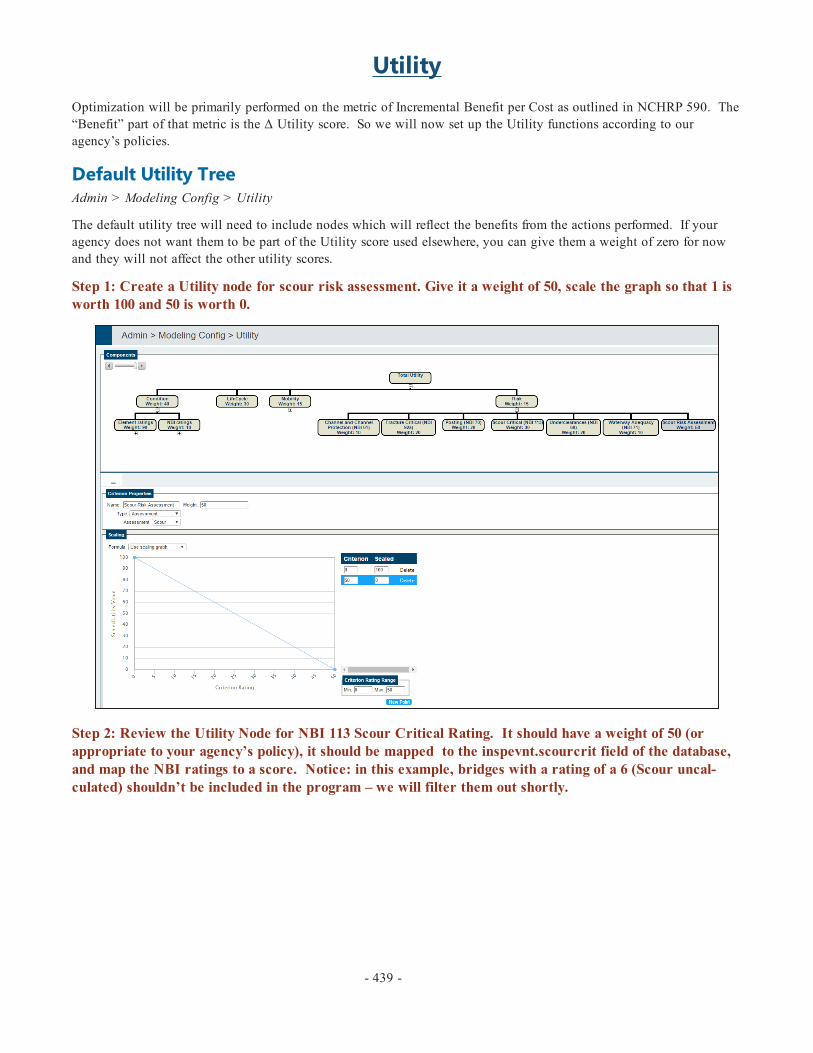
UtilityOptimization will be primarily performed on the metric of Incremental Benefit per Cost as outlined in NCHRP 590. The“Benefit” part of that metric is the Δ Utility score. So we will now set up the Utility functions according to ouragency’s policies.
Default Utility TreeAdmin > Modeling Config > Utility
The default utility tree will need to include nodes which will reflect the benefits from the actions performed. If youragency does not want them to be part of the Utility score used elsewhere, you can give them a weight of zero for nowand they will not affect the other utility scores.
Step 1: Create a Utility node for scour risk assessment. Give it a weight of 50, scale the graph so that 1 isworth 100 and 50 is worth 0.
Step 2: Review the Utility Node for NBI 113 Scour Critical Rating. It should have a weight of 50 (orappropriate to your agency’s policy), it should be mapped to the inspevnt.scourcrit field of the database,and map the NBI ratings to a score. Notice: in this example, bridges with a rating of a 6 (Scour uncal-culated) shouldn’t be included in the program – we will filter them out shortly.
- 439 -
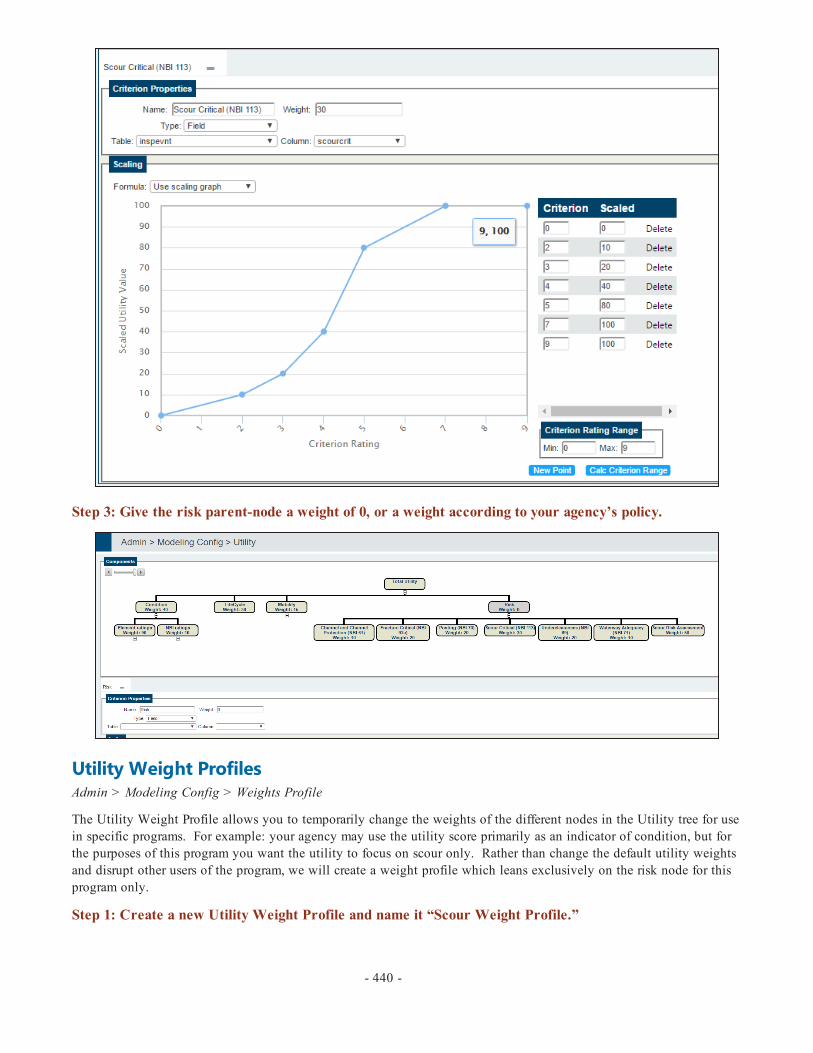
Step 3: Give the risk parent-node a weight of 0, or a weight according to your agency’s policy.
Utility Weight ProfilesAdmin > Modeling Config > Weights Profile
The Utility Weight Profile allows you to temporarily change the weights of the different nodes in the Utility tree for usein specific programs. For example: your agency may use the utility score primarily as an indicator of condition, but forthe purposes of this program you want the utility to focus on scour only. Rather than change the default utility weightsand disrupt other users of the program, we will create a weight profile which leans exclusively on the risk node for thisprogram only.
Step 1: Create a new Utility Weight Profile and name it “Scour Weight Profile.”
- 440 -

Step 2: Re-weight the parent nodes of condition, lifecycle and mobility to 0 and risk to 1. Focus theweights on the Scour Rating (Item 113) and the Scour Risk Assessments.
- 441 -

Step 3: Save the profile.
- 442 -

DeteriorationEven in the dry deserts of southern Utah, bridges deteriorate. And their deterioration rates are different from bridges inthe humid river deltas along the Gulf of Mexico. The default values in BrM are a good average starting point, but youshould plan on spending some time to customize these to the environment of your agency.
The deterioration modeling comes in two forms: element-level deterioration and NBI-rating-level deterioration. Element-level rating analysis the deterioration of the individual elements and can provide more detailed future estimates, like dis-tinguishing between the need to replace pins and hangers vs the need to replace entire beams. NBI-level deterioration ismore generic and may be better suited for bridge-groups which do not have element-level inspection.
In either case, it is a good practice to check the default deterioration rates and adjust them to the deterioration you exper-ience in your inventory.
We should also note that BrM does not currently have the ability to deteriorate other database fields at this time. So forthis example, the scour assessment and scour criticality will not be worsening with time.
Element Deterioration RatesAdmin > Modeling Config > Element Spec
Review the deterioration rates of all the elements in your inventory, including your Agency Defined Elements (ADE’s). ADE’s do not come with a default deterioration value, so you may need to create a deterioration curve either from copy-ing the values of a similar default element or figuring out the deterioration on your own.
A good ‘gut’ check of your deterioration rate is to look at the graph and see when the amount in CS4 passes 10%. Inthis example, Elem 12 Reinforced Concrete Deck crosses the 10% CS4 range at 35 years. This is close to Utah’s exper-ience, but how does it compare to your area?
Step 1: Look over your element deterioration rates to reflect conditions in your agency.
*Note: Some agencies have chosen to use service units to have Bentley analyze their element data and recommend deteri-oration rates for their elements.
- 443 -
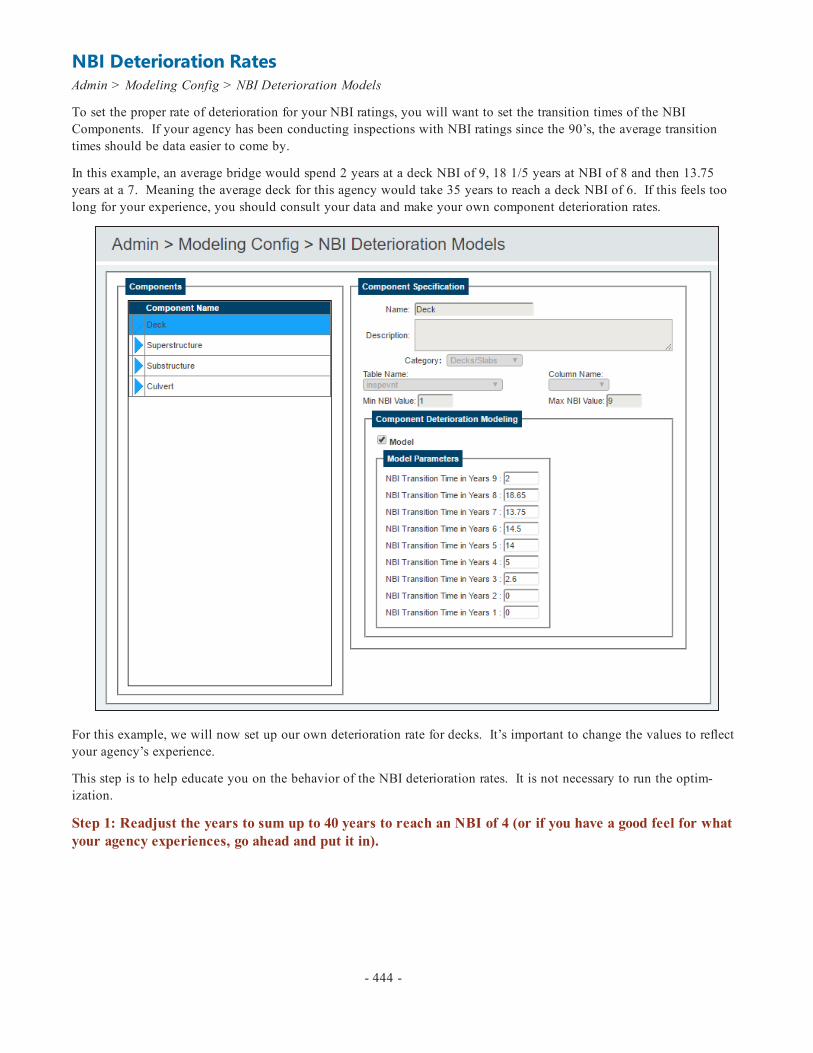
NBI Deterioration RatesAdmin > Modeling Config > NBI Deterioration Models
To set the proper rate of deterioration for your NBI ratings, you will want to set the transition times of the NBIComponents. If your agency has been conducting inspections with NBI ratings since the 90’s, the average transitiontimes should be data easier to come by.
In this example, an average bridge would spend 2 years at a deck NBI of 9, 18 1/5 years at NBI of 8 and then 13.75years at a 7. Meaning the average deck for this agency would take 35 years to reach a deck NBI of 6. If this feels toolong for your experience, you should consult your data and make your own component deterioration rates.
For this example, we will now set up our own deterioration rate for decks. It’s important to change the values to reflectyour agency’s experience.
This step is to help educate you on the behavior of the NBI deterioration rates. It is not necessary to run the optim-ization.
Step 1: Readjust the years to sum up to 40 years to reach an NBI of 4 (or if you have a good feel for whatyour agency experiences, go ahead and put it in).
- 444 -
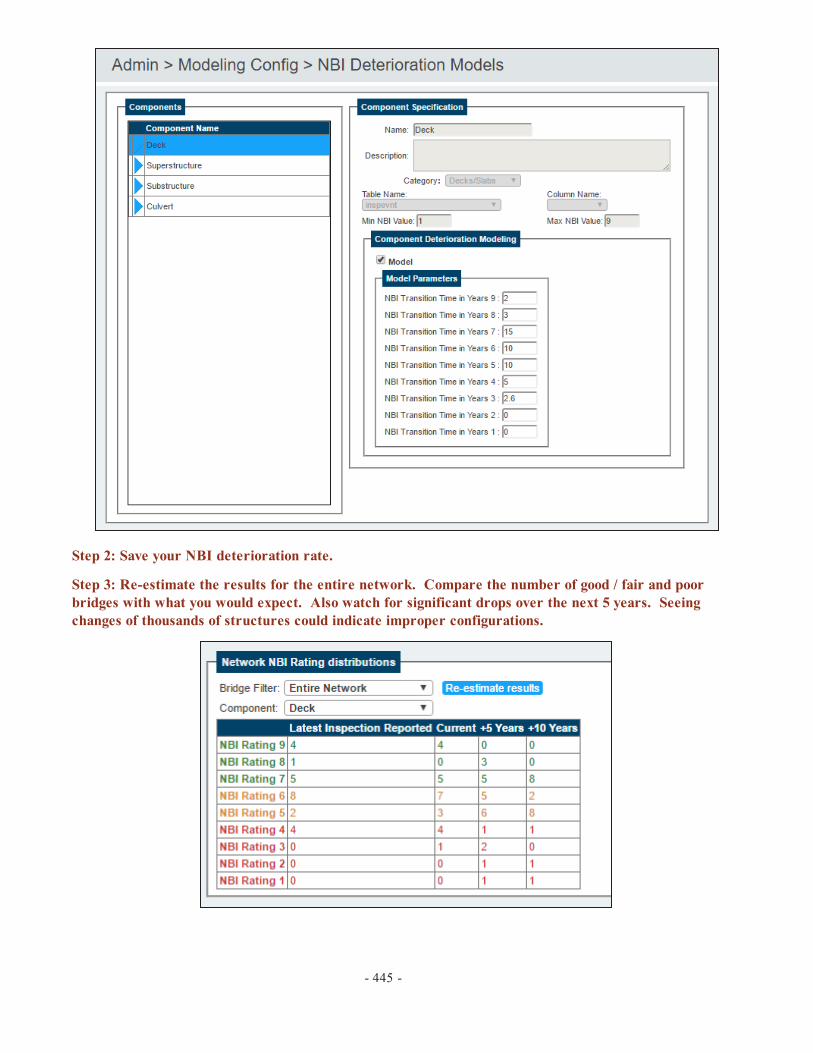
Step 2: Save your NBI deterioration rate.
Step 3: Re-estimate the results for the entire network. Compare the number of good / fair and poorbridges with what you would expect. Also watch for significant drops over the next 5 years. Seeingchanges of thousands of structures could indicate improper configurations.
- 445 -

*Note: Some agencies have chosen to use service units to have Bentley analyze their NBI rating histories to refine theirNBI deterioration curves.
NBI Conversion ProfilesAdmin > Modeling Config > NBI Conversion Profiles
Because it’s sometimes more convenient to do preservation policies in terms of NBI or network policies based on NBIratings, but to use element deterioration. To help the computer convert between the two, we have NBI Conversion Pro-files.
The Profile is a little counter-intuitive to populate, so consider this example of the BrM Default profile:
The value typed in is the ‘upper limit.’ So if I have a deck with 1.1% of its deck area in CS2, it has to have an NBI rat-ing of 8 or lower. If it had 2% in CS3 and 3% in CS4, the more restrictive (in this case the CS4 percentage) will governand give us an NBI of 6 for the deck.
When using these conversion profiles as part of deterioration modeling, you will want to be careful of the smallpercentages. For example, a pristine deck will have 0.001% of its surface area in CS4 after 4 years, and that tiny amountwill take a long time to develop into a sizeable amount. But if you put 0 tolerance for CS4 in the NBI conversion pro-file – it will convert that tiny amount to an NBI of 4. That is why it is recommended to leave the fields blank or with anominal percentage when using them in deterioration curves.
The default NBI profiles (FHWA and BrM Default) also get updated in upgrades, create a copy tokeep your agency ones.
This example is not necessary to run the optimization, but is valuable for learning how the conversion process works.
- 446 -

Step 1: Copy the BrM Default NBI Profile. Name your example ‘Agency Test.’
Step 2: Modify the conversion profile to be more generous on NBI’s of 7 by increasing the CS2 toleranceto 30%.
Step 3: Save your profile.
Step 4: Re-Estimate the “Good / Fair / Poor” distributions. Notice the distribution of the latest inspectionand the Current (deterioration modeled between the inspection dates and today). Large movements couldindicate that you need to reconsider your settings.
- 447 -

- 448 -

Network PoliciesIn this next section, we will define the work that your agency would perform on bridges. There are three principlepieces of this section, the benefits, the actions, the network policies, and the project and program categories. In roughsummary:
The Benefits define for the computer what the effects of your work are, and how it should model the bridge afterthe work is completed.
The Actions define what benefits should be grouped together, and then what costs should be associated with thatwork. There are bridge-level actions, which are intended to be very specific for individual projects and work can-didates, and then there are network-level actions, which are intended to be very generic and high level to reduceoptimization runtime.
The Policies then define what combinations of actions your agency would consider together.
BenefitsAdmin > Modeling Config > Benefit Groups
The benefits should reflect the changes that the bridge will experience with your work. They should affect the variousnodes of your utility tree – if a benefit does not affect your utility score, the software will see no benefit to performingthat work.
In my experience, it is good practice to break up the benefits into many smaller ones so that their definitions can be re-used with many separate actions. For example: repairing concrete parapet to CS2 should be its own benefit, which canthen be associated with network actions like ‘rehabbing a deck’ and ‘rehabbing a culvert,’ and bridge level actions like‘concrete parapet repair.’ A few days’ practice in creating and customizing benefits will help you to see where you canrecycle definitions, which will make maintaining and adjusting the configuration easier.
- 449 -
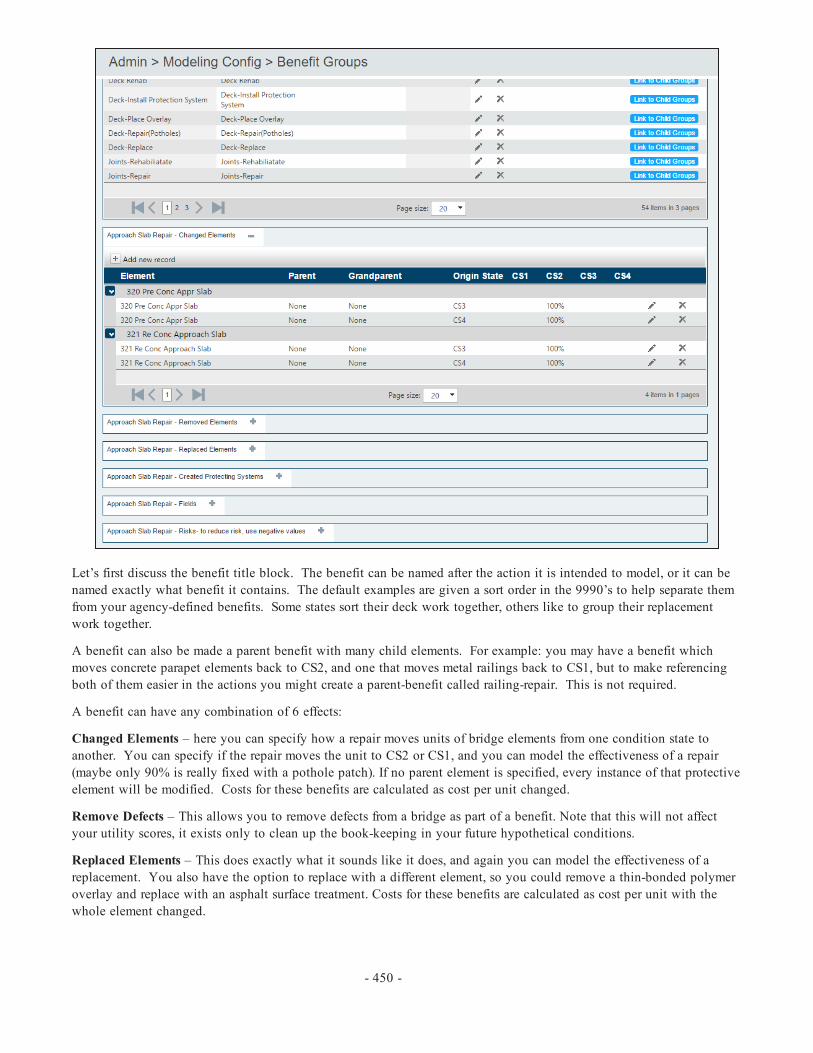
Let’s first discuss the benefit title block. The benefit can be named after the action it is intended to model, or it can benamed exactly what benefit it contains. The default examples are given a sort order in the 9990’s to help separate themfrom your agency-defined benefits. Some states sort their deck work together, others like to group their replacementwork together.
A benefit can also be made a parent benefit with many child elements. For example: you may have a benefit whichmoves concrete parapet elements back to CS2, and one that moves metal railings back to CS1, but to make referencingboth of them easier in the actions you might create a parent-benefit called railing-repair. This is not required.
A benefit can have any combination of 6 effects:
Changed Elements – here you can specify how a repair moves units of bridge elements from one condition state toanother. You can specify if the repair moves the unit to CS2 or CS1, and you can model the effectiveness of a repair(maybe only 90% is really fixed with a pothole patch). If no parent element is specified, every instance of that protectiveelement will be modified. Costs for these benefits are calculated as cost per unit changed.
Remove Defects – This allows you to remove defects from a bridge as part of a benefit. Note that this will not affectyour utility scores, it exists only to clean up the book-keeping in your future hypothetical conditions.
Replaced Elements – This does exactly what it sounds like it does, and again you can model the effectiveness of areplacement. You also have the option to replace with a different element, so you could remove a thin-bonded polymeroverlay and replace with an asphalt surface treatment. Costs for these benefits are calculated as cost per unit with thewhole element changed.
- 450 -

Created Protective Systems – This allows you to add a protective system to a bridge that did not already exist. Again,if a parent is named, it will only add the protective system to that parent element. Cost is per unit of new system, withthe quantity inherited from its parent element.
Change – This is where you can change the values of any numeric database field (NBI ratings for deck, super, sub, cul-vert for example). No direct costs are reflected with these changes at the action level – you will need to make sure theaction includes indirect costs where appropriate. Make sure fields you are changing are reflected in your utility tree. Ifyou decide to increment the improvement, say add 2 to your NBI rating, pay attention that this will only add to numericvalues and not to letters like “N.”
Risk – This is where you can change the assessment risk, either incrementally or to a set value. Like the field changes,no direct costs are reflected with these changes – you will need to include indirect costs for these.
For this example, we will be making 4 actions:
l Repair the scour holel Repair the scour hole and place rip-rapl Repair the scour hole and place ajaxl Repair the scour hole and pave the channel
To model this, we will create benefits which change the scour-critical rating and some which modify the risk.
Step 1: Create a new benefit. Name it “Scour Rating to 4,” and change its sort order to 900, and checkthe “insert” checkbox.
Step 2: Add a record to the Fields portion. The table name is ‘inspevnt’ and the column name is‘scourcrit’. The new value will be ‘4’ and check the insert checkbox. Then save your benefit.
Step 3: Add second benefit, name it “Scour Rating to 7,” and change its sort order to 900, and check the“insert” checkbox. Add a record to the Fields portion. The table name is ‘inspevnt’ and the column nameis ‘scourcrit’. The new value will be ‘7’ and check the insert checkbox. Then save your benefit.
- 451 -

Step 4: Add third benefit, name it “Scour Risk -2,” and change its sort order to 998, and check the“insert” checkbox. Add a record to the Risk portion. The assessment type will be ‘scour’. The incre-ment will be ‘-2’and check the insert checkbox. Then save your benefit.
Step 5: Repeat step 4 twice more, once to reduce the scour risk by 3 and once to reduce it by 4.
- 452 -
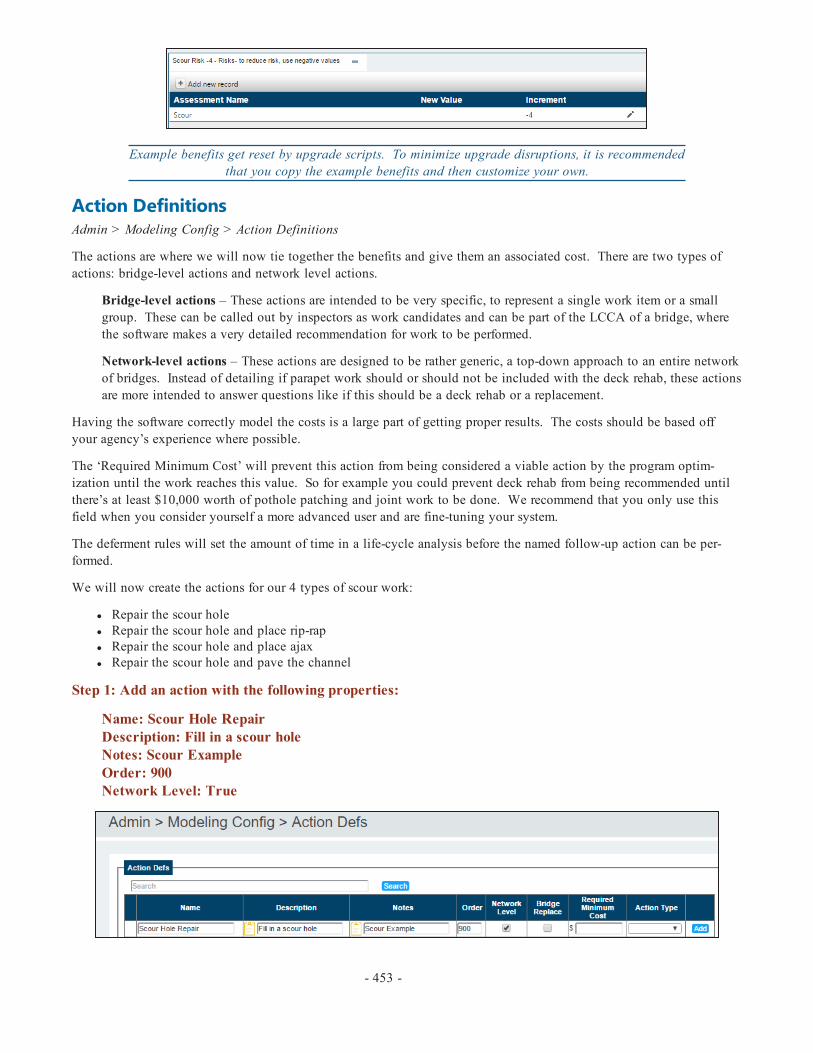
Example benefits get reset by upgrade scripts. To minimize upgrade disruptions, it is recommendedthat you copy the example benefits and then customize your own.
Action DefinitionsAdmin > Modeling Config > Action Definitions
The actions are where we will now tie together the benefits and give them an associated cost. There are two types ofactions: bridge-level actions and network level actions.
Bridge-level actions – These actions are intended to be very specific, to represent a single work item or a smallgroup. These can be called out by inspectors as work candidates and can be part of the LCCA of a bridge, wherethe software makes a very detailed recommendation for work to be performed.
Network-level actions – These actions are designed to be rather generic, a top-down approach to an entire networkof bridges. Instead of detailing if parapet work should or should not be included with the deck rehab, these actionsare more intended to answer questions like if this should be a deck rehab or a replacement.
Having the software correctly model the costs is a large part of getting proper results. The costs should be based offyour agency’s experience where possible.
The ‘Required Minimum Cost’ will prevent this action from being considered a viable action by the program optim-ization until the work reaches this value. So for example you could prevent deck rehab from being recommended untilthere’s at least $10,000 worth of pothole patching and joint work to be done. We recommend that you only use thisfield when you consider yourself a more advanced user and are fine-tuning your system.
The deferment rules will set the amount of time in a life-cycle analysis before the named follow-up action can be per-formed.
We will now create the actions for our 4 types of scour work:
l Repair the scour holel Repair the scour hole and place rip-rapl Repair the scour hole and place ajaxl Repair the scour hole and pave the channel
Step 1: Add an action with the following properties:
Name: Scour Hole RepairDescription: Fill in a scour holeNotes: Scour ExampleOrder: 900Network Level: True
- 453 -

Step 2: Assign the benefit ‘Scour Rating to 4.’ Enable the indirect cost, set the estimation method to flatindirect cost, and give it a cost of $2,000. Save the action.
Step 3: Add an action with the following properties:
Name: Scour – Place RiprapDescription: Place riprap to address scourNotes: Scour ExampleOrder: 900Network Level: True
Step 4: Assign the benefits: ‘Scour Rating to 7’ and ‘Scour Risk -2.’ Enable the indirect cost, set theestimation method to flat indirect cost, and give it a cost of $5,000. Save the action.
- 454 -
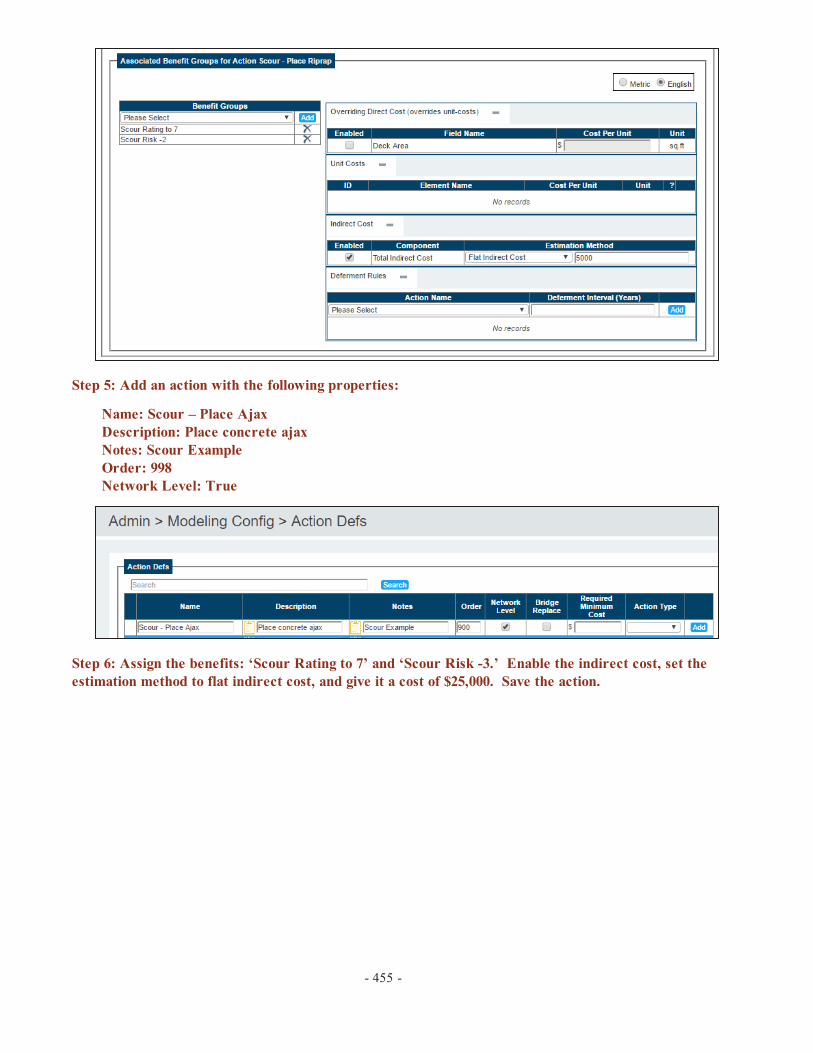
Step 5: Add an action with the following properties:
Name: Scour – Place AjaxDescription: Place concrete ajaxNotes: Scour ExampleOrder: 998Network Level: True
Step 6: Assign the benefits: ‘Scour Rating to 7’ and ‘Scour Risk -3.’ Enable the indirect cost, set theestimation method to flat indirect cost, and give it a cost of $25,000. Save the action.
- 455 -

Step 7: Add an action with the following properties:
Name: Scour – Concrete FloorDescription: Pave the channel floorNotes: Scour ExampleOrder: 998Network Level: True
Step 8: Assign the benefits: ‘Scour Rating to 7’ and ‘Scour Risk -4.’ Enable the indirect cost, set theestimation method to fixed price, and give it a cost of $75,000. Save the action.
- 456 -

Example actions can be reset by update scripts, or updated to improve the quality of the example. This may cause your agency to lose configurations. This is why we recommend that you create
your own for custom configuration.
Network PoliciesAdmin > Modeling Config > Network Policies
The network policies are where we tie the various actions together into possible combinations that we would be willingto consider. Without this piece, the software would have no way of knowing that a superstructure replacement is onlyreally an option if the deck has been removed. This saves you from having to make an action for ‘deck replacement,’another for ‘deck & super replacement,’ and yet another for ‘deck replacement and super rehab’ and so on. With networkpolicies you can make one action for deck replacement, and then define that possible additional actions would be superrehab or replacement.
Crucially, you can also define when a combination is valid. Your agency probably would never consider a super-structure replacement when it has an NBI super rating of 7. To keep the computer from making such outlandish recom-mendations (and to save you the calculation time it would take to consider such a combination), you can add conditionsto say when a combination should be considered.
When designing your network policies, it’s best to think of them in terms of the root action and then the additionalactions. For this example, the scour repair will be our root action, and then the various countermeasures will be possiblefollow-up actions.
You will also notice the Project Category field. By giving your work project categories at this stage, you can filterthrough long lists of optimization recommendations. For example, a wearing surface replacement might be “preservationwork,” but adding pothole patching would move it into a “rehab work” category. Each node of the policy can have adifferent category.
Step 1: Create a new network policy by clicking on the “Create New” button.
Step 2: Name the policy ‘Scour Policy”
Step 3: Set the root action as “Scour Hole Repair,” assign the project category of “Scour Work” and save.
- 457 -
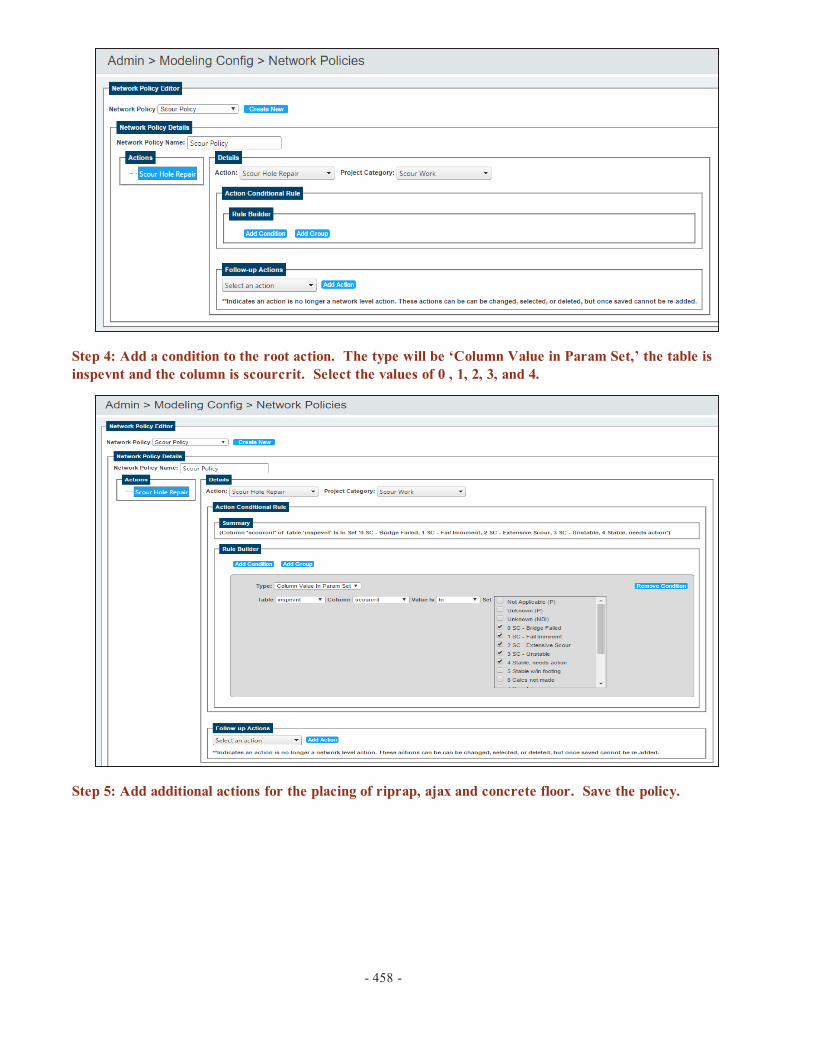
Step 4: Add a condition to the root action. The type will be ‘Column Value in Param Set,’ the table isinspevnt and the column is scourcrit. Select the values of 0 , 1, 2, 3, and 4.
Step 5: Add additional actions for the placing of riprap, ajax and concrete floor. Save the policy.
- 458 -

The example network policies can be updated routinely by BrM update scripts; it is therefore goodpractice to make your own copies of the examples.
- 459 -

LifecycleWhen making decisions about bridge treatments, your primary concern is doing what is right for the bridge now. Butpart of your thinking is also considering what’s the best thing for the future. In the software, that future considerationpart is called the Lifecycle Cost Analysis (LCCA).
In order to assess how a project will alter the future, the software needs to know how you generally treat bridges, and ifyou treat separate groups differently, which approach do you apply to each bridge. The information of how your agencytreats bridges will be described in Lifecycle Policies, and then we will assign those policies to bridges.
Because the scour rating does not deteriorate and the risk does not increase year-upon-year, we will not be creating life-cycle policies as part of this example. If you are interested in trying to model scour deterioration, consider creating ascour Agency Defined Element (ADE), and then including that ADE in your utility tree.
Lifecycle PoliciesAdmin > Modeling Config > LCCA Policy Rules
The lifecycle policies are the part where you tell the software when you would treat a group of elements (like a deckrehab), or when you would replace a structure. Does your agency normally replace a bridge when it gets two NBI rat-ings of 4? This is where you would set up that modeling.
Examples get reset, create your own.
Assign Lifecycle PoliciesAdmin > Modeling Config > LCCA Assign Policies
If your agency replaces non-NHS or local agency bridges at different stages from your NHS bridges, youcan define which policies apply to which structures.
Examples get reset, create your own.
- 460 -

Funding SourcesNext the software needs to know how much money you have, or at least how much you think you will have, so it canrecommend what is the best projects for this year, and which should be held onto until next year. The funding sectioncan also help your planning group identify how much has been allocated, and how much remains to be spent, from eachof your sources.
It’s worth mentioning that only active funding sources can have projects assigned to them.
Create Funding SourcesProjects > Manage Funding > Funding List
BrM has two example funding sources out of the box: a federal and a state fund. Here your agency will likely want tocreate funds for the actual funding, and then separate funds for hypothetical future funding.
So we will now create a funding source for our scour projects.
Step 1: Go to Projects > Manage Funding > Create/Edit Funding Sources. Name the new source “ScourFund” and save it.
Step 2: Change the status to “active.”
Step 3: Add 5 new Funding Source Targets, set their Target Date to September 1st for the next 5 years,and set the target fund amount to $10,000 ($500,000 if you’re not using the sample database). Save theFunding Source.
The example funding sources can be reset by upgrades; we recommend that you delete these orcopy them as you set up your funding.
- 461 -
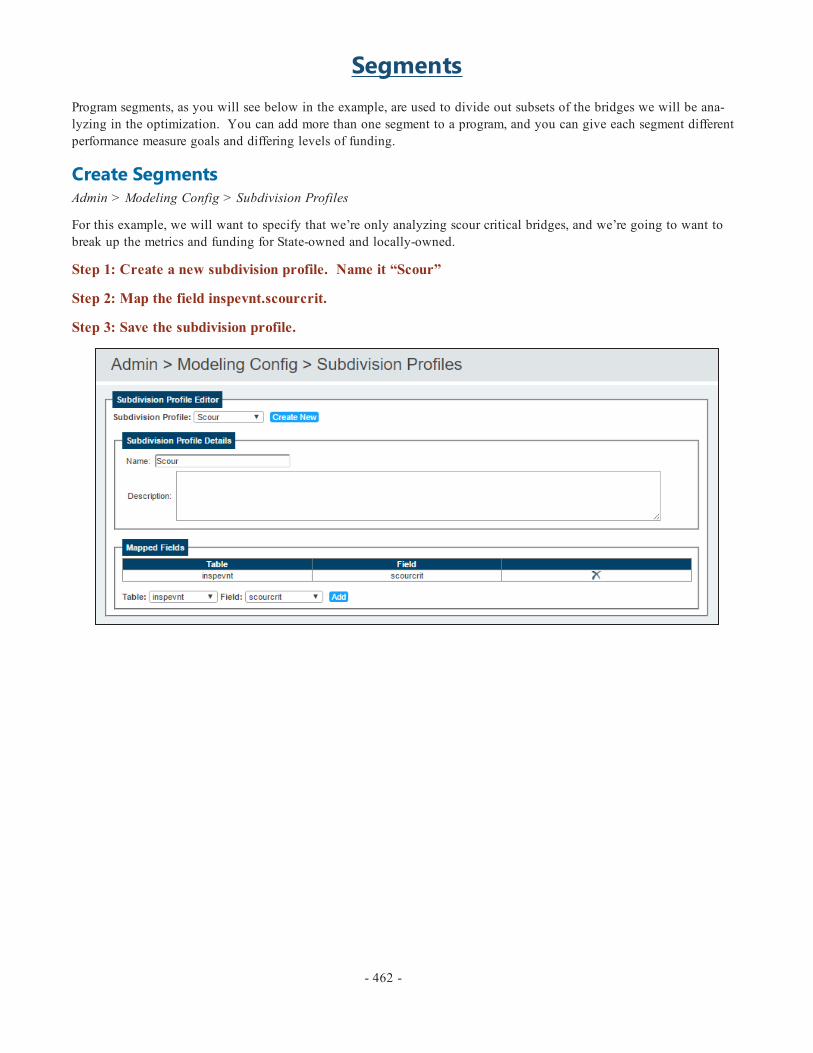
SegmentsProgram segments, as you will see below in the example, are used to divide out subsets of the bridges we will be ana-lyzing in the optimization. You can add more than one segment to a program, and you can give each segment differentperformance measure goals and differing levels of funding.
Create SegmentsAdmin > Modeling Config > Subdivision Profiles
For this example, we will want to specify that we’re only analyzing scour critical bridges, and we’re going to want tobreak up the metrics and funding for State-owned and locally-owned.
Step 1: Create a new subdivision profile. Name it “Scour”
Step 2: Map the field inspevnt.scourcrit.
Step 3: Save the subdivision profile.
- 462 -

ProgramsCongratulations, you are now ready to use the Programs tab. Just a few more pieces to go before we can optimize thescour program, but we will now be dealing with the program itself.
It is highly recommended that for the first few iterations of a program, you limit your optimization to a discrete subset ofstructures, like a single district, where there are enough bridges to exemplify optimization with a realistic fundingamount, but that is small enough to allow several iterations as you check the results and calibrate all of the pieces.
Create ProgramPrograms > Create/Edit Programs
In this example, we have set the actions associated with the Scour Network Policy to use fixed costs, so the RequiredMinimum Cost will not help to achieve more meaningful results. If we were to use actions which incorporate per-ele-ment-unit costs, setting a minimum project cost to the smallest amount of work your agency would consider in a projecthelps eliminate very small projects from the results.
Some agencies have pool-contracts to address very small sums of work and may set this value as low as $2,000. Othersmay not use this contract method and so it is not cost-effective for their agency to bid projects for less than $100,000. Also consider that projects can be combined (manually after the fact) if the bridges are nearby, so perhaps recom-mendations of $50,000 and higher would be more appropriate. Every agency will be unique.
At this stage of defining the program, we also have the ability to filter down our bridges that we will consider based onany of the filters you use on the bridge list.
Step 1: Create a new program. Name it “Scour Example,” set the Program Status to ‘Planned.”
Step 2: Give the program a start-year for the current year, and an end year 5 years from now, matchingour scour funds we set up earlier. Also set the Bridge Filter to the “BrM – Active Status” or youragency’s equivalent.
Step 3: For your NBI estimation, use the NBI Converter and select the BrM Default conversion profile. Select the HiX approximation (to save time), give the Long-Term analysis 50 years.
Step 4: Select the Scour Network Policy we created earlier.
- 463 -
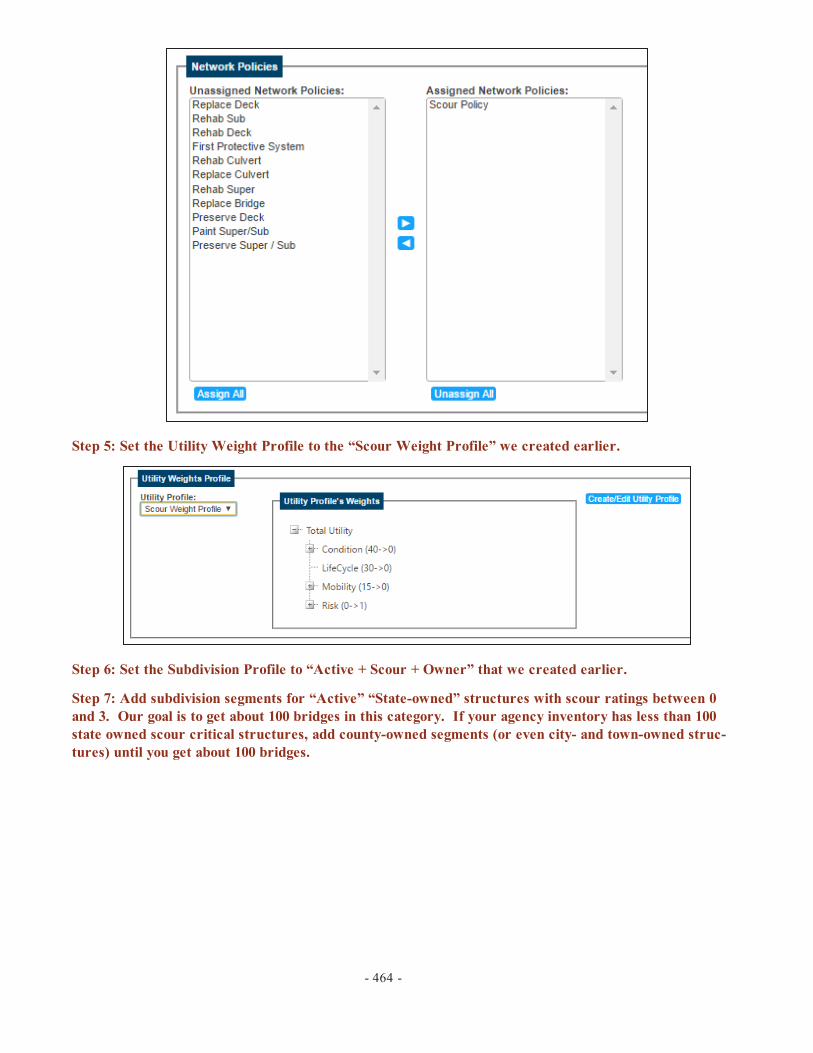
Step 5: Set the Utility Weight Profile to the “Scour Weight Profile” we created earlier.
Step 6: Set the Subdivision Profile to “Active + Scour + Owner” that we created earlier.
Step 7: Add subdivision segments for “Active” “State-owned” structures with scour ratings between 0and 3. Our goal is to get about 100 bridges in this category. If your agency inventory has less than 100state owned scour critical structures, add county-owned segments (or even city- and town-owned struc-tures) until you get about 100 bridges.
- 464 -

Step 8: Delete segments which have 0 bridges. Save the program.
Assign ProjectsPrograms > Assign Projects
If the program you are optimizing already has some projects defined (perhaps you just want it to fill out the remainder ofyour STIP), you can freeze projects to the program. If the year is fixed, freeze them to both the program and the year.
In this example, we will not be working with pre-existing projects.
Assign Performance MeasuresPrograms > Performance Measures
Optimization is done primarily in terms of benefit (Δ Utility) per cost, but the software has the ability to take intoaccount additional goals, or at least measure the effects a program will have on other metrics. The Performance Measuresare how you define those metrics you want to track or try to meet. And the two pieces are exactly that: you define theperformance measures above, and then if there is a constraint that the optimization needs to meet, you can define thatbelow.
For this example, we have limited our utility tree to just return the scour criticality and scour risk – but if we had beenincluding element condition, perhaps we would like to see how the optimized program improved the health index of thesystem. Or how it reduced the % of structurally deficient bridges. To do that, we would add those performance meas-ures here.
To tell the software to attempt to eliminate all structurally deficient bridges with the program (even if it is not the mostoptimal thing to do with our money), you could set a target value of 0 for that performance measure. And you can tell itto use different targets for each segment.
- 465 -

Step 1: Add a new performance measure based on a database field.
Step 2: Set that field to inspevnt and scourcrit.
Step 3: Define the best value for scour ratings is 9 and the worst value is 0.
Step 4: Insert this performance measure.
We will not set targets or minimums at this time.
Funding AllocationPrograms > Funding Allocation
Now we will tie the funds from our Scour Fund to this optimization program.
Then we will have the opportunity to add additional, hypothetical funds to the program. If some projects are alreadyassociated with the program, you would see their funding summed up on the “allocated funds” line.
- 466 -

Finally, we will distribute the funds to the different segments of the program. When you click on “get performances” thesoftware will analyze the current performance of your segments compared to the performance measures you have defined. The results will color-code the different segments.
If you do not specify quantities to a segment, then the funds can be used as needed between the segments. If you definea quantity to a segment, the money will be dedicated for use on that segment and projects on that segment will notexceed the amount allocated. The remaining funds will be used by the unallocated segments.
Step 1: Add 5 funding sources. Set all of them to draw from the Scour Fund, for the amount of $10,000(try $500,000 if you’re not using the sample db) and set the years to be every year of the scour fund weestablished earlier. Save the Funding Allocation.
Step 2: If you would like to model a hypothetical funding surge, type the funds into the Additional Fundsline. For this example, add $10k, $30k, $50k, $100k.
Step 3: Press the button “Get Performances” (This could take more than 10 minutes. Don’t worry, thepage won’t time out.)
We will not distribute the funds at this time because we want the funds to be used on either the Scour ratings of 3 or 4 –wherever they may be used to best effect.
Step 4: Save the funding allocation.
- 467 -
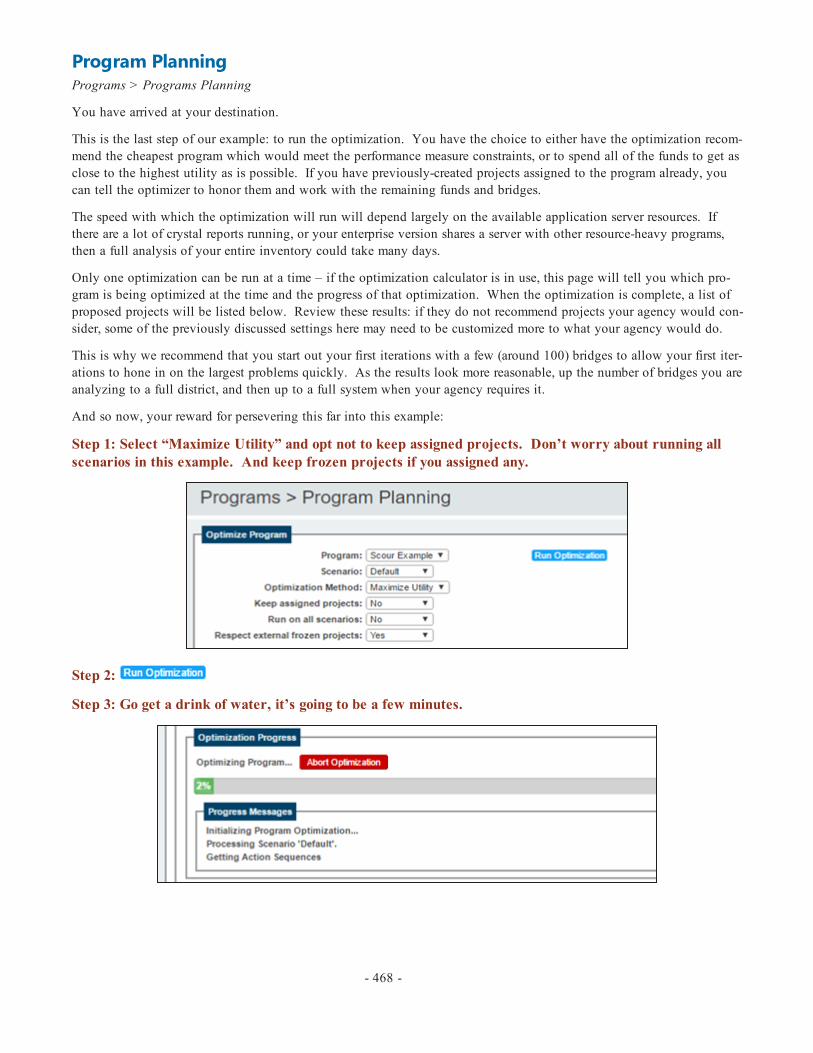
Program PlanningPrograms > Programs Planning
You have arrived at your destination.
This is the last step of our example: to run the optimization. You have the choice to either have the optimization recom-mend the cheapest program which would meet the performance measure constraints, or to spend all of the funds to get asclose to the highest utility as is possible. If you have previously-created projects assigned to the program already, youcan tell the optimizer to honor them and work with the remaining funds and bridges.
The speed with which the optimization will run will depend largely on the available application server resources. Ifthere are a lot of crystal reports running, or your enterprise version shares a server with other resource-heavy programs,then a full analysis of your entire inventory could take many days.
Only one optimization can be run at a time – if the optimization calculator is in use, this page will tell you which pro-gram is being optimized at the time and the progress of that optimization. When the optimization is complete, a list ofproposed projects will be listed below. Review these results: if they do not recommend projects your agency would con-sider, some of the previously discussed settings here may need to be customized more to what your agency would do.
This is why we recommend that you start out your first iterations with a few (around 100) bridges to allow your first iter-ations to hone in on the largest problems quickly. As the results look more reasonable, up the number of bridges you areanalyzing to a full district, and then up to a full system when your agency requires it.
And so now, your reward for persevering this far into this example:
Step 1: Select “Maximize Utility” and opt not to keep assigned projects. Don’t worry about running allscenarios in this example. And keep frozen projects if you assigned any.
Step 2:
Step 3: Go get a drink of water, it’s going to be a few minutes.
- 468 -

Program ResultsAfter your optimization has run, there will be 3 places to see your results: the individual projects returned by the optim-ization, the Program Results task, and the executive summary. Each will give you varying levels of detail for you todrill down into your results.
Returned ProjectsPrograms > Program Planning
Once the optimizer has run, the bottom of the page will populate with the projects selected by the optimizer. You canselect each of these individual projects and look at them in the Projects > Create/Edit Project > Analysis subtask. Thiswill give you the best feedback on what about your program needs to be tweaked.
Program ResultsPrograms > Program Results
In order to get an aggregate view of how the program performs in terms of Utility and the performance measures, the Pro-gram Results task gives a good overview. There are 4 hard-coded graphs on this page:
Performance by Segment: This graph shows you how each segment does toward reaching the performance measures ofyour choice. It shows where your program started and how close it got to the target for each year.
- 469 -
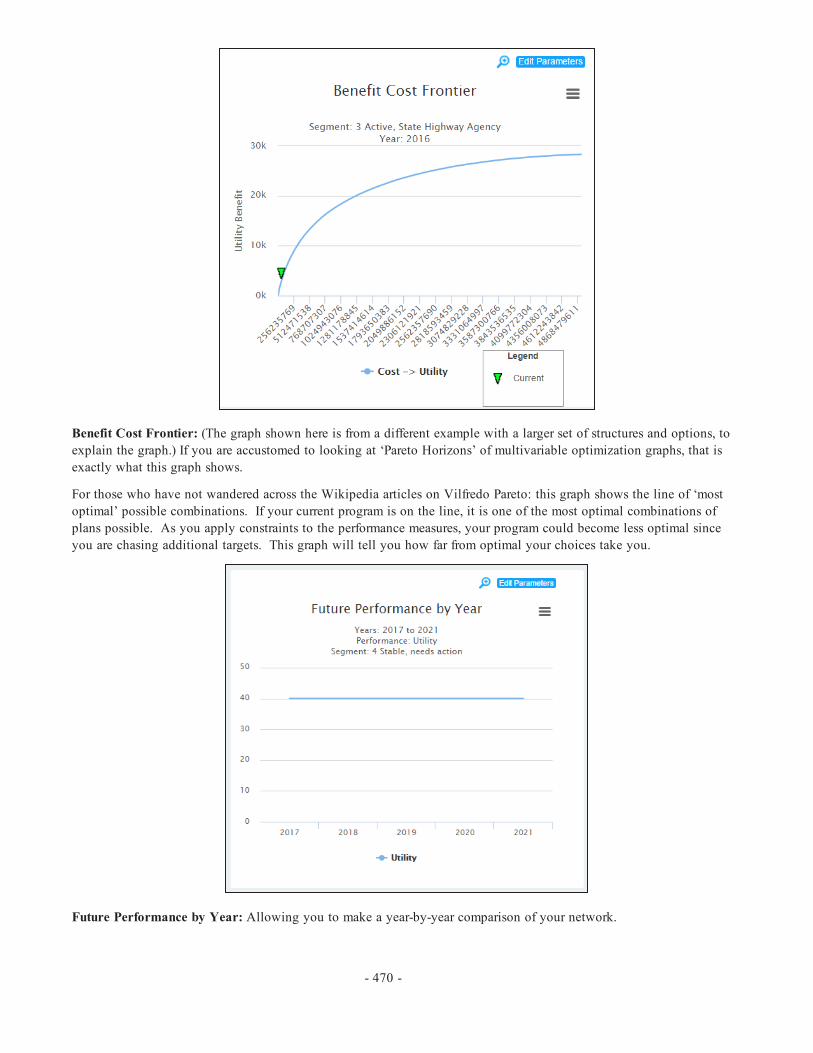
Benefit Cost Frontier: (The graph shown here is from a different example with a larger set of structures and options, toexplain the graph.) If you are accustomed to looking at ‘Pareto Horizons’ of multivariable optimization graphs, that isexactly what this graph shows.
For those who have not wandered across the Wikipedia articles on Vilfredo Pareto: this graph shows the line of ‘mostoptimal’ possible combinations. If your current program is on the line, it is one of the most optimal combinations ofplans possible. As you apply constraints to the performance measures, your program could become less optimal sinceyou are chasing additional targets. This graph will tell you how far from optimal your choices take you.
Future Performance by Year: Allowing you to make a year-by-year comparison of your network.
- 470 -
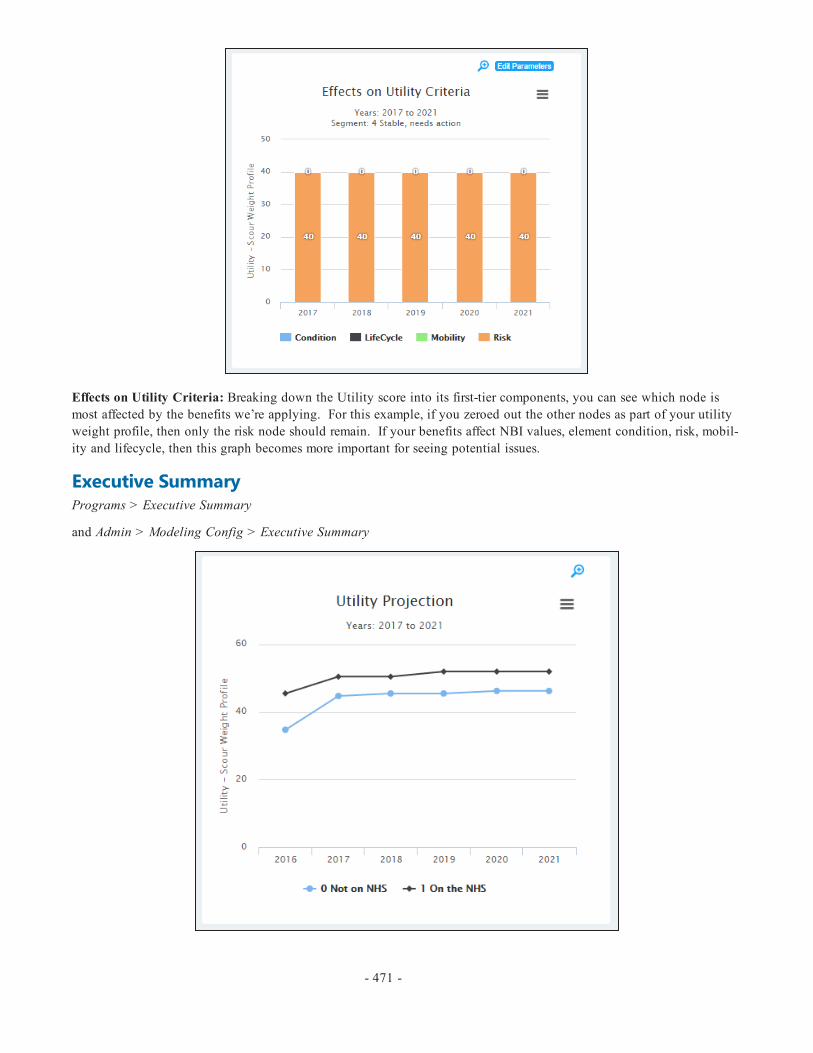
Effects on Utility Criteria: Breaking down the Utility score into its first-tier components, you can see which node ismost affected by the benefits we’re applying. For this example, if you zeroed out the other nodes as part of your utilityweight profile, then only the risk node should remain. If your benefits affect NBI values, element condition, risk, mobil-ity and lifecycle, then this graph becomes more important for seeing potential issues.
Executive SummaryPrograms > Executive Summary
and Admin > Modeling Config > Executive Summary
- 471 -

You also have the ability to create additional graphs to view the projections of your program. On the Admin tab youcan set up these charts, and on the Programs tab you can view them. Your Agency can break the data down by themeasures that are important to you, and color them the way your agency is accustomed to seeing them. Think of thispage as a dynamic infographic page.
We will now demonstrate how to use BrM to run a set of scenarios. In particular, we will demonstrate how more or lessmoney could change your agency’s scour ratings in the future. We will be using the scour program from above with dif-ferent funding scenarios.
- 472 -

Scenario SetupScenarios are essentially the ability to rerun a program optimization with tweaks, allowing you to compare the results. The principle example of this would be to create a graph for your state legislature, demonstrating the cost-to-benefit rela-tionship between your current funding and what you could do with more (or even less) funding. Perhaps removing fund-ing from your organization would significantly increase the need for bridge replacements – in which case BrM can helpyou to provide those answers.
In the first part of the example, we ran the scenario with 6 bridges and $10,000 to $100k / year of funding. Let’s demon-strate what would happen if we ran the same bridges for no funding, $10k, $30k, $50k and $100k each year.
Create/Edit ScenariosPrograms > Create/Edit Scenarios
We’ll begin by creating the scenarios of the scour program.
Step 1: Create a new scenario named “Scour Example No Funding.” Assign it to the Scour Example andsave.
Step 2: Copy the program we just created, renaming it “Scour Example $10k.”
Step 3: Repeat for $30k, $50k and $100k (remember, the surged funding is the default scenario).
- 473 -

For the next sections, we will review the data associated with our program and see some of the options we have for edit-ing our scenarios.
Performance MeasuresPrograms > Performance Measures
Trying to hit additional targets can have an impact on optimization. Say you would like to compare the differencebetween trying to spend your money to reduce the number of structurally deficient bridges vs. preservation work on a lar-ger number of bridges.
On this screen you could define different performance measures for your program for each scenario you want to model.
Funding AllocationPrograms > Funding Allocation
This is where we will make the changes to our funding for each scenario. The funding in the “default” scenario
Step 1: Verify that the “Default” Scenario includes the surge funding from the first part of the example.
- 474 -
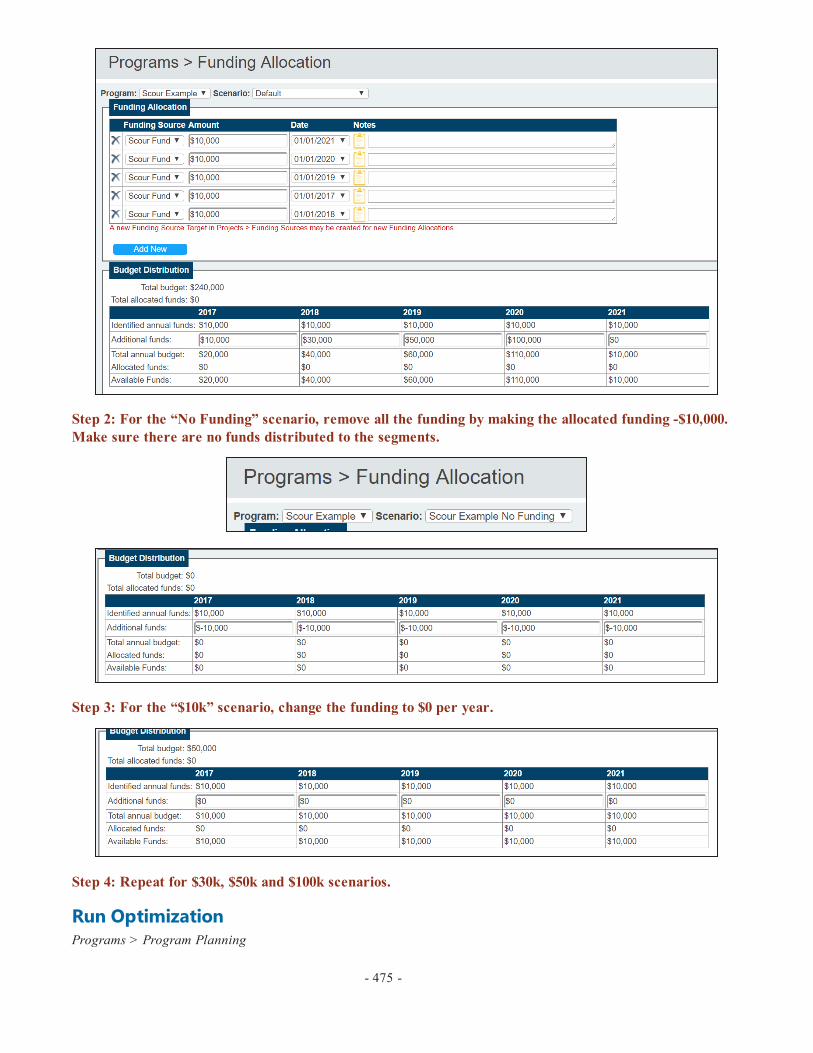
Step 2: For the “No Funding” scenario, remove all the funding by making the allocated funding -$10,000. Make sure there are no funds distributed to the segments.
Step 3: For the “$10k” scenario, change the funding to $0 per year.
Step 4: Repeat for $30k, $50k and $100k scenarios.
Run OptimizationPrograms > Program Planning
- 475 -

We will now run the optimization for the many scenarios. It is possible to run just one scenario if you only want toupdate one of them.
Step 1: Select the Scour Example Program.
Step 2: Select to run all scenarios for the program
Step 3: Run the Optimization – this is going to take a while. Expect it to take around 3x as long as thedefault optimization only.
Step 4: Check that each scenario at the bottom has results, except for the “No Funding” one – we wouldexpect no work on that one.
Begin EstimationPrograms > Scenario Explorer
After the optimization has run, we can now go see the overall results in a single graph on the Scenario Explorer task. Ifwe had run the scenarios with multiple performance measures, we can see how the network performed in regards to eachperformance measure by editing the preferences at the top right.
You should be able to see that depending on how quickly we dedicate funding to our network will change how quicklyour agency meets its goal. This will help your agency choose, or present to politicians who chose, which scenario to fol-low.
- 476 -
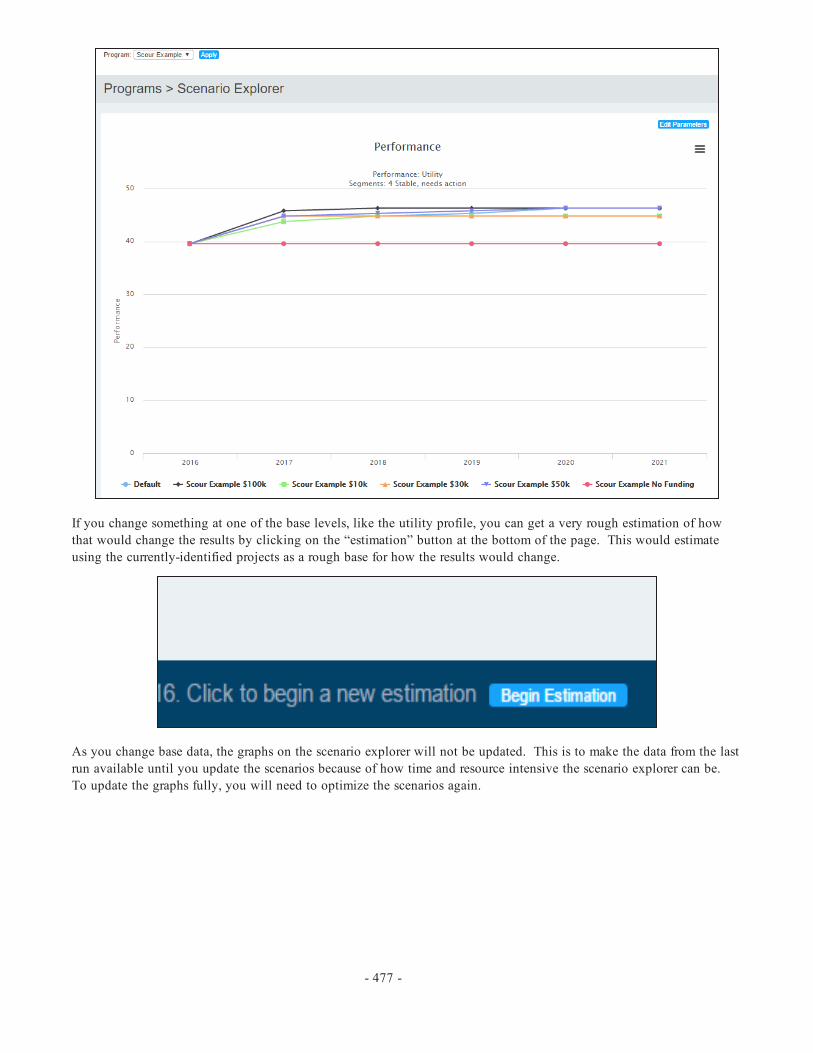
If you change something at one of the base levels, like the utility profile, you can get a very rough estimation of howthat would change the results by clicking on the “estimation” button at the bottom of the page. This would estimateusing the currently-identified projects as a rough base for how the results would change.
As you change base data, the graphs on the scenario explorer will not be updated. This is to make the data from the lastrun available until you update the scenarios because of how time and resource intensive the scenario explorer can be. To update the graphs fully, you will need to optimize the scenarios again.
- 477 -

Appendix C- BrM Use Case Example 2 - PreservationProgram
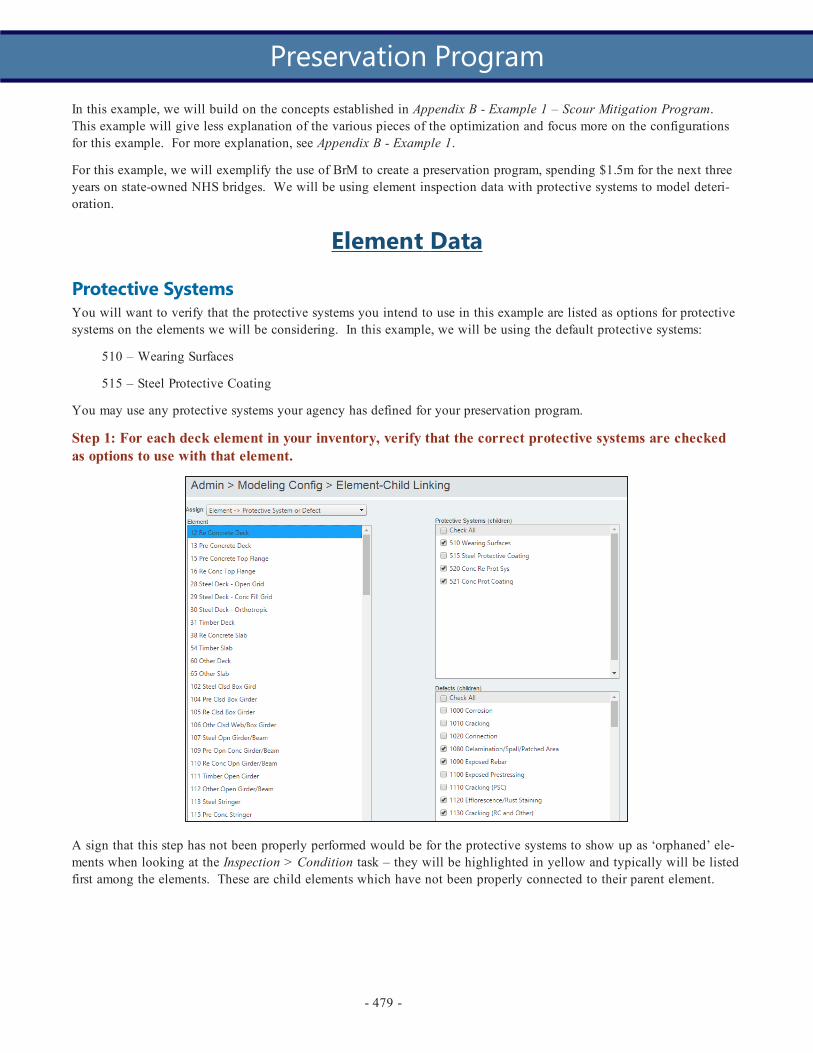
In this example, we will build on the concepts established in Appendix B - Example 1 – Scour Mitigation Program. This example will give less explanation of the various pieces of the optimization and focus more on the configurationsfor this example. For more explanation, see Appendix B - Example 1.
For this example, we will exemplify the use of BrM to create a preservation program, spending $1.5m for the next threeyears on state-owned NHS bridges. We will be using element inspection data with protective systems to model deteri-oration.
Element Data
Protective SystemsYou will want to verify that the protective systems you intend to use in this example are listed as options for protectivesystems on the elements we will be considering. In this example, we will be using the default protective systems:
510 – Wearing Surfaces
515 – Steel Protective Coating
You may use any protective systems your agency has defined for your preservation program.
Step 1: For each deck element in your inventory, verify that the correct protective systems are checkedas options to use with that element.
A sign that this step has not been properly performed would be for the protective systems to show up as ‘orphaned’ ele-ments when looking at the Inspection > Condition task – they will be highlighted in yellow and typically will be listedfirst among the elements. These are child elements which have not been properly connected to their parent element.
- 479 -
Preservation Program

Step 2: Repeat the process for all steel superstructure and substructure elements that you have in yourinventory.
Element CategoriesBecause we are going to use the wearing surfaces heavily in the lifecycle node (which we will discuss in a minute), it isvery handy to make sure that your wearing surface elements are in an element category (and likewise your other pro-tective systems if you have more than just element 515.) So we will create an element category to put our wearing sur-faces in.
Step 1: Verify the existence of the Element Categories called “Wearing Surfaces” and “Steel Protection”.
- 480 -

Step 2: Make sure your wearing surface and protective system elements (510 and 515) are assigned to theappropriate Element Category.
Inspection DataIn this example, we will be using protective systems to model the impact to lifecycle of preservation treatments. There-fore, in order to use this example, the data set you are using needs to include NBE element data. For best results, yourstarting inspection data should also include current protective systems and their conditions.
Step 1: Verify that your state NHS bridges have NBE elements and protective systems reflecting their cur-rent condition.
- 481 -

UtilityBrM optimizes actions on a structure by maximizing the incremental benefit per cost as outlined in the NCHRP Report590. The “incremental benefit” is the change in the utility value achieved by performing an action. How an agencydefines the structure of the utility tree as well as the relative weights and scaling functions will directly impact the incre-mental benefit. Therefore, an agency needs to ensure that the utility and related attributes are setup functions accordingto its policies.
Preservation projects typically have very little to do with improving the condition of a bridge and more to do with keep-ing the condition high over a long time. Therefore, in this program the Lifecycle node will be very important to us. Because the Utility tree can be modified freely by your agency, this node could have been deleted (it wasn’t used in5.2.2 or 5.2.1 – it could have been deleted by your agency at that time).
Utility Tree SetupAs previously mentioned in order for an attribute to affect the utility and provide a ‘benefit’ the utility tree needs toinclude criterion (nodes) which will reflect the benefits from the actions performed. The first level of the utility tree arethe primary criteria to determine the utility value based on the multi-criteria analysis. Subsequent levels of criterion canbe added as sub-criteria or child criterion that affect the primary criteria. The relative weight determines how impacteach criterion has on the overall utility. The higher the relative weight the greater the effect on the change in the utilityvalue. Additionally, the magnitude of the effect of any and all criterion, for a specific objective/goal, can be modified bychanging the relative weights through the Utility Weight Profile. The Utility Weight Profiles will be discussed in fur-ther detail in subsequent sections.
Step 1: Verify that the LifeCycle node exists for your agency. If you have to add such a node, giving it adefault weight of 0 will keep it from affecting other work in your agency.
- 482 -

In addition to relative weights all of the criterion need to be converted to a common 0-100 scale. This is done through ascaling function. This can be done through a function or a scaling graph. For example, Deck/Slab Elements are on a 0-4scale while the Deck component is on a 0-9 scale. In order to combine these criteria that have different scales they needto be converted to a common scale. The following images illustrate the different scaling functions for each criterion.
- 483 -
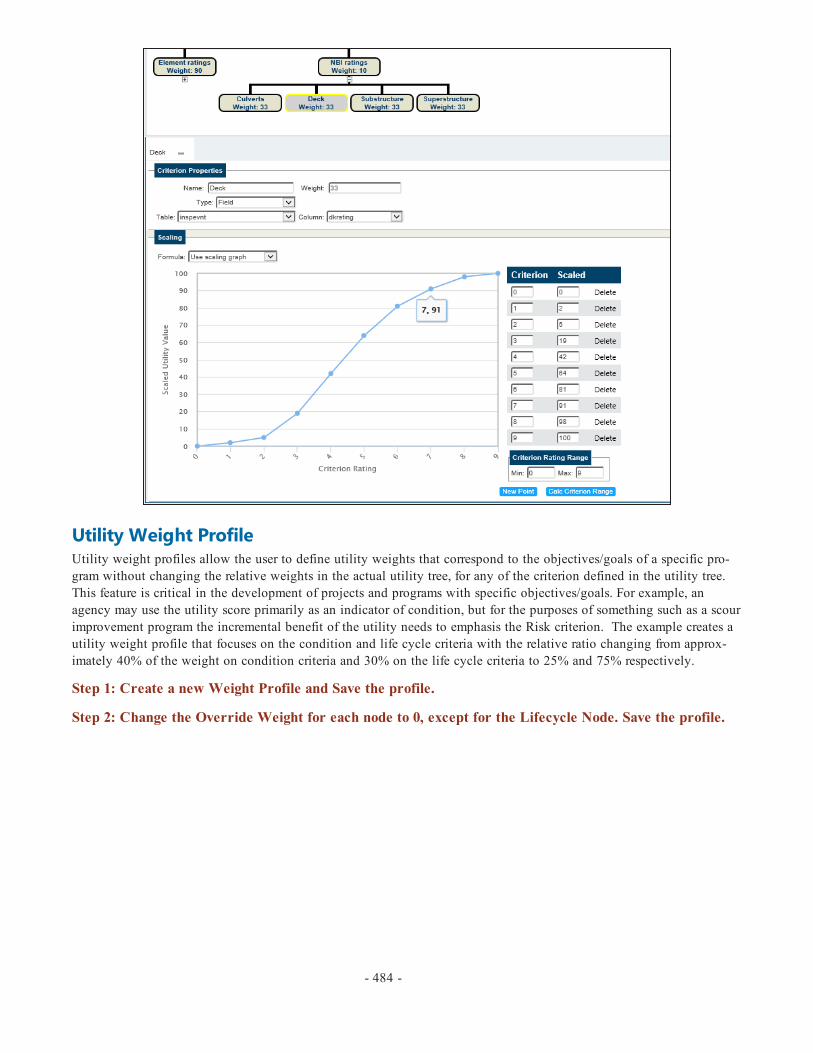
Utility Weight ProfileUtility weight profiles allow the user to define utility weights that correspond to the objectives/goals of a specific pro-gram without changing the relative weights in the actual utility tree, for any of the criterion defined in the utility tree. This feature is critical in the development of projects and programs with specific objectives/goals. For example, anagency may use the utility score primarily as an indicator of condition, but for the purposes of something such as a scourimprovement program the incremental benefit of the utility needs to emphasis the Risk criterion. The example creates autility weight profile that focuses on the condition and life cycle criteria with the relative ratio changing from approx-imately 40% of the weight on condition criteria and 30% on the life cycle criteria to 25% and 75% respectively.
Step 1: Create a new Weight Profile and Save the profile.
Step 2: Change the Override Weight for each node to 0, except for the Lifecycle Node. Save the profile.
- 484 -
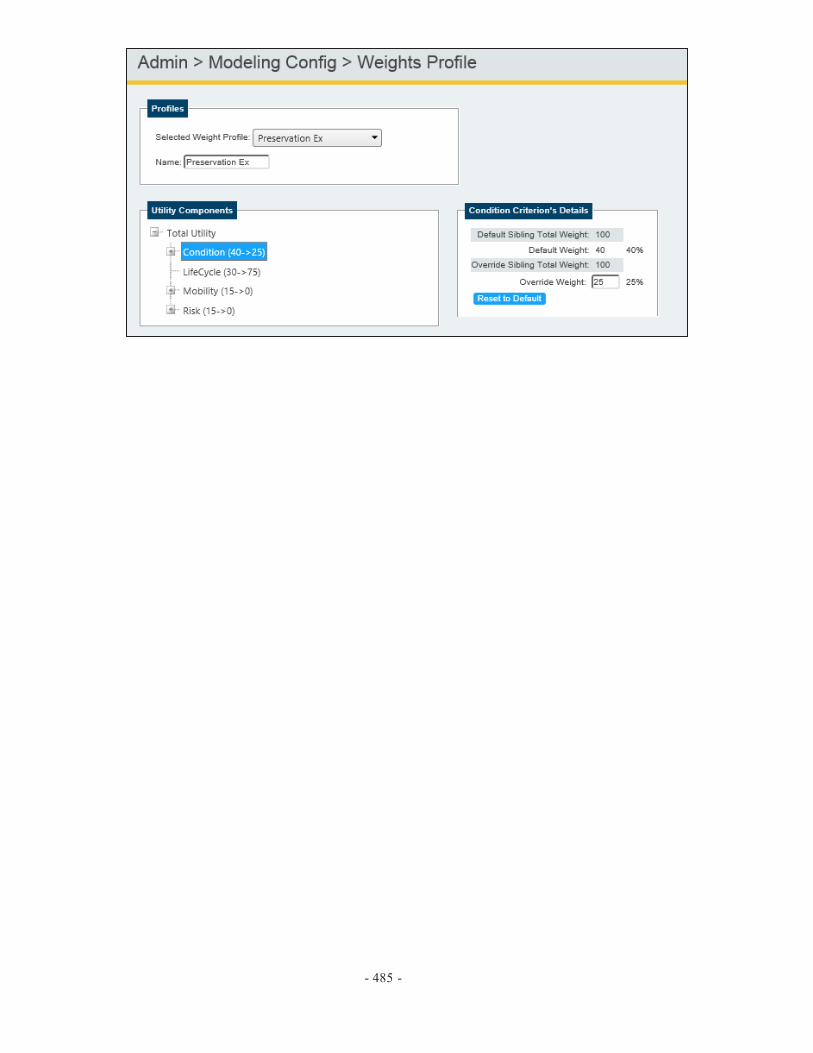
- 485 -

DeteriorationWe will now check that the element deterioration, and the interaction between the protective system and the parent ele-ments closely resembles what you experience in your area.
Since we will be using the element deterioration exclusively, we will not be dealing with NBI deterioration in thisexample nor will we get into details of NBI deterioration rates or NBI Conversion Rates. We will, however, leave theconditional NBI condition on the Network Policy, so it might be worth reviewing the NBI Conversion Rate if you areunfamiliar with it.
Element Deterioration RatesCheck the deterioration rates of your elements. More detail on how to do this is given in Appendix B - Example 1.
Step 1: Evaluate your element deterioration rates.
Protective Coating Deterioration RatesYou will also want to more carefully consider how the protective systems change the standard deterioration rate. Wewill now walk through how to see how your protective system changes the parent element’s rate.
Step 1: Select a protective element and view its deterioration modeling graphs. (Shown here: 510)
Step 2: Under Element Assumptions, select a parent element. Redraw the graphs. (Shown here: 12 – ReConcrete Deck)
- 486 -
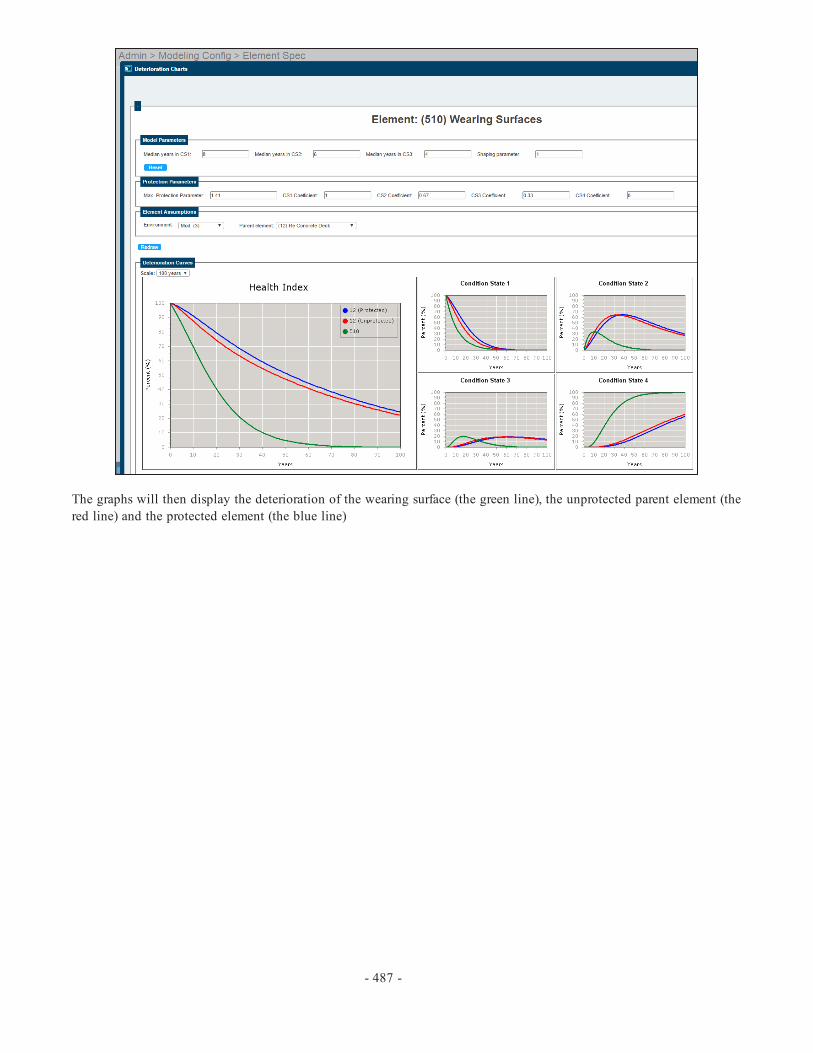
The graphs will then display the deterioration of the wearing surface (the green line), the unprotected parent element (thered line) and the protected element (the blue line)
- 487 -

Network PoliciesFor this example, the work we will want to consider will be creating a preservation program. In particular wearing sur-face on the deck and protective systems for steel elements.
BenefitsStep 1: Review the benefit ‘Wearing Surface Overlay’ (Sort Order: 9999). This should include replacinga wearing surface if it exists or adding a new one if it does not.
Step 2: Review the benefit ‘Seal Joints’ (Sort Order: 9999). It should include a replacement of joint seals.
- 488 -
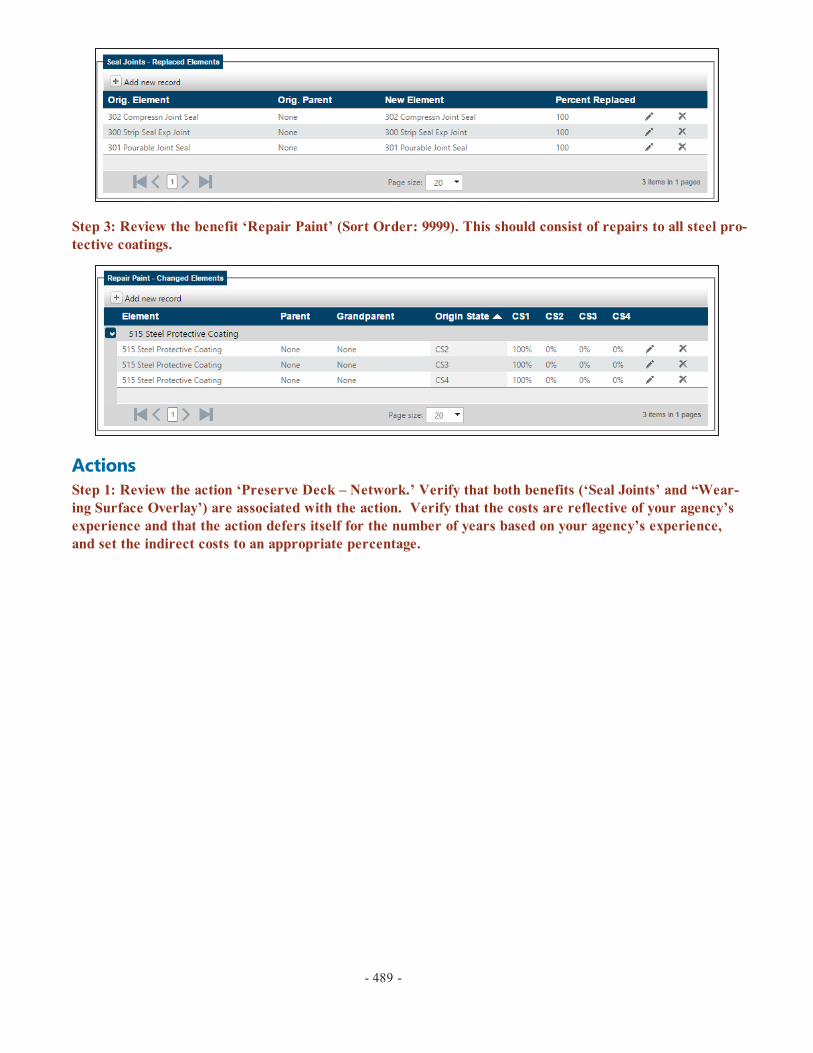
Step 3: Review the benefit ‘Repair Paint’ (Sort Order: 9999). This should consist of repairs to all steel pro-tective coatings.
ActionsStep 1: Review the action ‘Preserve Deck – Network.’ Verify that both benefits (‘Seal Joints’ and “Wear-ing Surface Overlay’) are associated with the action. Verify that the costs are reflective of your agency’sexperience and that the action defers itself for the number of years based on your agency’s experience,and set the indirect costs to an appropriate percentage.
- 489 -

Step 2: Review the action ‘Preserve Super – Network.’ Verify that the benefit ‘Repair Paint’ and‘Replace Paint’ are associated with the action (notice that paint repair will also cover substructure ele-ments that are linked to element 515 because the paint was not specified to any particular parent ele-ments). Verify that the costs are reflective of your agency’s experience and that the action defers itselffor the number of years based on your agency’s experience, and set the indirect costs to an appropriatepercentage.
- 490 -

Network PoliciesStep 1: Review the ‘Preserve Deck’ network policy. Verify that the actions reviewed earlier are ref-erenced here. If your agency would not “preserve” a bridge with a deck NBI of 5, copy this policy andchange your custom one here. (Example policies can be overwritten in update scripts).
- 491 -

- 492 -

Lifecycle & Funding SourcesThis example will lean heavily on the Lifecycle criteria of the utility tree, so it is worth spending some time reviewingthe Life cycle policies to make sure they reflect your agency’s policies. For more details on this, see the Lifecycle sec-tion of Appendix B - Example 1. The LCCA Policy Rules used for this program are as follows.
- 493 -

Funding SourcesNext the software needs to know how much money you have, or at least how much you think you will have, so it canrecommend what are the best projects for this year, and which should be held onto until next year. The funding sectioncan also help your planning group identify how much has been allocated, and how much remains to be spent, from eachof your sources. However, for speed and simplicity’s sake, we will just use the ‘Additional Funds’ section of the Pro-grams > Funding Allocation task in a few steps. If you would like to set up a funding source, refer to Appendix B -Example 1.
- 494 -
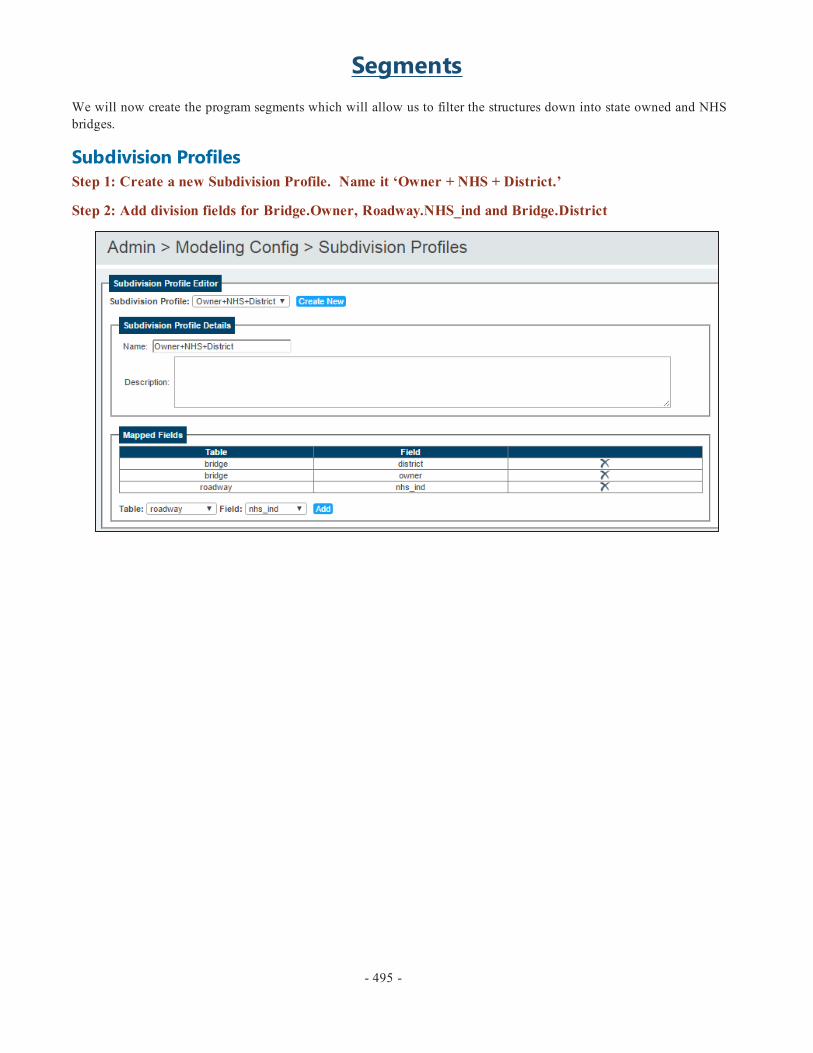
SegmentsWe will now create the program segments which will allow us to filter the structures down into state owned and NHSbridges.
Subdivision ProfilesStep 1: Create a new Subdivision Profile. Name it ‘Owner + NHS + District.’
Step 2: Add division fields for Bridge.Owner, Roadway.NHS_ind and Bridge.District
- 495 -

ProgramsOkay, you are now ready to set up your program.
Create ProgramStep 1: Create a new Program. Name it “Example Preservation Program”
Step 2: Give the start year of this year and the end year two years later (three years total). Save the Pro-gram.
Step 3: Use the NBI Converter Method and choose the BrM Default profile. Check on the HiX Approx-imation, give a long-term analysis period of 50 years, a discount rate of 0%, and an inflation rate of 2%.
Step 4: Select the Preserve Deck network policy.
Step 5: Select your “Preservation Ex” utility weight profile.
Step 6: Select the ‘Network-Wide’ subdivision profile and it will include all 27 bridges of the sampledatabase.
- 496 -

Assign ProjectsIf the program you are optimizing already has some projects defined (perhaps you just want it to fill out the remainder ofyour STIP), you can freeze projects to the program. If the year is fixed, freeze them to both the program and the year.
In this example, we will not be working with pre-existing projects.
Performance MeasuresFor this program, we will add two performance measures to track how effective our work is. We will track the percent ofGood and Fair bridges by both their fraction of surface area and their structure count. We will not set targets or min-imums at this time.
Step 1: Add a new performance measure for ‘Pct. Good/Fair (Surface-Based)’
Step 2: Add a new performance measure for ‘Pct. Good/Fair (Count-Based)’
- 497 -
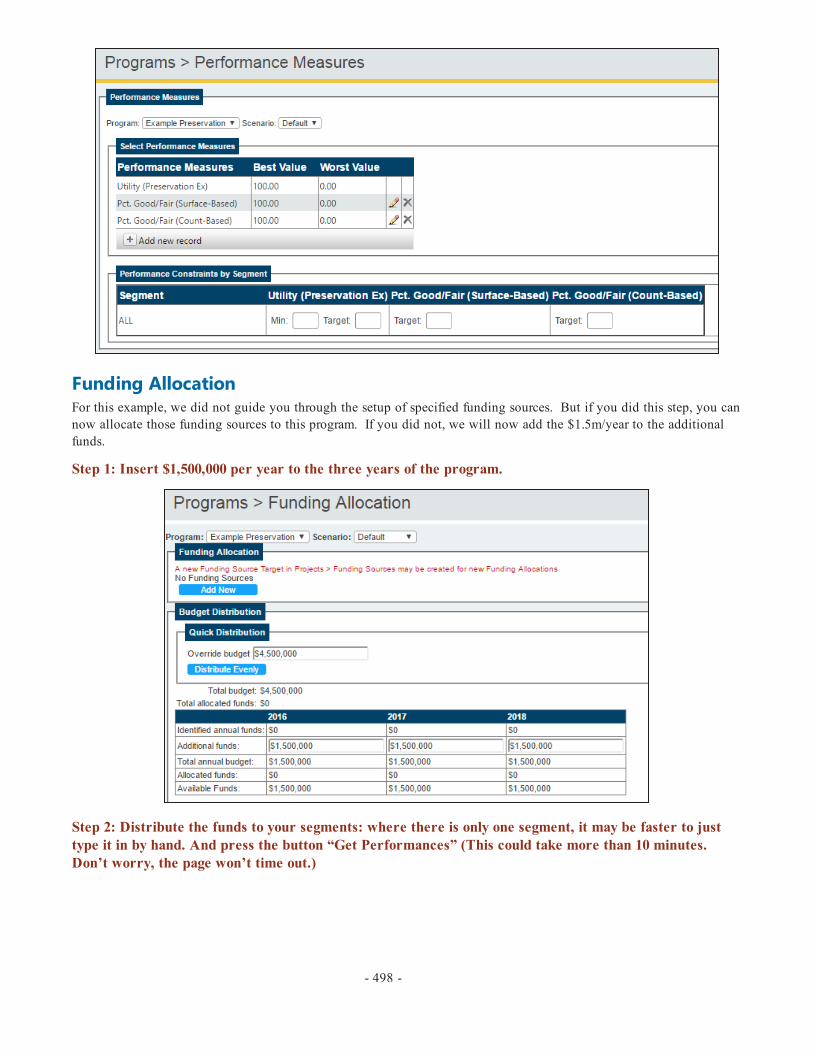
Funding AllocationFor this example, we did not guide you through the setup of specified funding sources. But if you did this step, you cannow allocate those funding sources to this program. If you did not, we will now add the $1.5m/year to the additionalfunds.
Step 1: Insert $1,500,000 per year to the three years of the program.
Step 2: Distribute the funds to your segments: where there is only one segment, it may be faster to justtype it in by hand. And press the button “Get Performances” (This could take more than 10 minutes. Don’t worry, the page won’t time out.)
- 498 -

OptimizationWe are now ready to run the optimization.
Step 1a: Run Optimization.
Step 1b: Good time for a bathroom break.
- 499 -

Program ResultsAfter your optimization has run, there will be three places to see your results: the individual projects returned by theoptimization, the Program Results task, and the Executive Summary task. Each will give you varying levels of detail foryou to drill down into your results.
Returned ProjectsOnce the optimizer has run, the bottom of the page will populate with the projects selected by the optimizer. You canselect each of these individual projects and look at them in the Projects > Create/Edit Project > Analysis subtask. Thiswill give you the best feedback on what about your program needs to be tweaked.
Program ResultsIn order to get an aggregate view of how the program performs in terms of Utility and the performance measures, the Pro-gram Results task gives a good overview. There are 4 hard-coded graphs on this page:
Performance by SegmentThe chart on the top left will show the performance of your segments for each year. If we had set targets for our per-formance measures, it would show us how each segment performed against the target.
Let’s take a look at the data for the different years.
Step 1: mouse over the segment and note the utility performance of the segment.
- 500 -

Step 2: click on “Edit Parameters” and select the next year of the program.
Step 3: Note the hover performance for the next year.
Benefit Cost FrontierThe graph on the top-right is a Pareto Horizon graph. If you are not familiar with Vilfredo Pareto’s work on multi-object-ive optimization, Wikipedia can provide some in-depth information (see the articles both on ‘Multiple-criteria DecisionAnalysis’ and ‘Multi-objective Optimization’ – and be sure to pick up your honorary math degree before leaving).
If you don’t feel like reading that much, here’s the summary version: vertically you have the most utility benefit possibleand horizontally you have how much that would cost (these are the two objectives of our multi-objective analysis). Thehorizon line represents the very most optimal program possible for that funding. As you add performance measure tar-gets or boundary conditions, the software will depart from the very most optimal to try to meet your other criteria. Thedistance between the plan and the line is how far from optimal your proposed program is.
- 501 -

Future Performance by YearIn the bottom left is Future Performance by Year. This graph will show you how your network improves (or decays) byyear. Editing the preferences, you can see different segments or different performance measures. For large networks, thedelta utility can be very small sometimes.
- 502 -
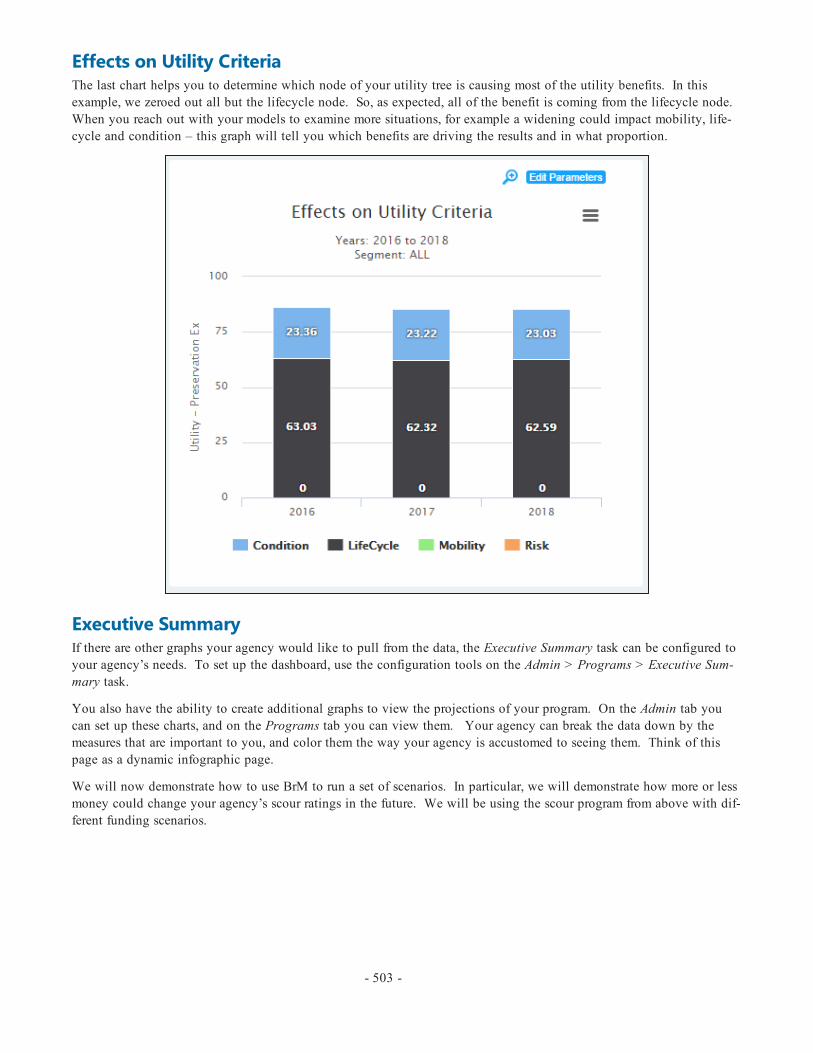
Effects on Utility CriteriaThe last chart helps you to determine which node of your utility tree is causing most of the utility benefits. In thisexample, we zeroed out all but the lifecycle node. So, as expected, all of the benefit is coming from the lifecycle node. When you reach out with your models to examine more situations, for example a widening could impact mobility, life-cycle and condition – this graph will tell you which benefits are driving the results and in what proportion.
Executive SummaryIf there are other graphs your agency would like to pull from the data, the Executive Summary task can be configured toyour agency’s needs. To set up the dashboard, use the configuration tools on the Admin > Programs > Executive Sum-mary task.
You also have the ability to create additional graphs to view the projections of your program. On the Admin tab youcan set up these charts, and on the Programs tab you can view them. Your agency can break the data down by themeasures that are important to you, and color them the way your agency is accustomed to seeing them. Think of thispage as a dynamic infographic page.
We will now demonstrate how to use BrM to run a set of scenarios. In particular, we will demonstrate how more or lessmoney could change your agency’s scour ratings in the future. We will be using the scour program from above with dif-ferent funding scenarios.
- 503 -

Scenario SetupScenarios are essentially the ability to rerun a program optimization with tweaks, allowing you to compare the results. The principle example of this would be to create a graph for your state legislature, demonstrating the cost-to-benefit rela-tionship between your current funding and what you could do with more (or even less) funding. Perhaps removing fund-ing from your organization would significantly increase the need for bridge replacements – in which case BrM can helpyou to provide those answers.
In the first part of the example, we ran the scenario with 27 bridges and $1,500,000/ year of funding. Let’s demonstratewhat would happen if we ran the same bridges for no funding, $500k, and $1m and each year.
Create/Edit ScenariosWe’ll begin by creating the scenarios of the scour program.
Step 1: Create a new scenario named “Preservation Example No Funding.” Assign it to the PreservationExample and save.
Step 2: Copy the program we just created, renaming it “Preservation Example $500k.”
Step 3: Repeat for $1m (remember, the $1.5m per year funding is the default scenario).
- 504 -

For the next sections, we will review the data associated with our program and see some of the options we have for edit-ing our scenarios.
Performance MeasuresTrying to hit additional targets can have an impact on optimization. Say you would like to compare the differencebetween trying to spend your money to reduce the number of structurally deficient bridges vs. preservation work on a lar-ger number of bridges.
On this screen you could define different performance measures for your program for each scenario you want to model.
Funding AllocationThis is where we will make the changes to our funding for each scenario. The funding in the “default” scenario
Step 1: For the “No Funding” scenario, remove all the funding. Make sure there are no funds distributedto the segments.
Step 2: Repeat for $500k and $1m scenarios.
- 505 -

Run OptimizationWe will now run the optimization for the many scenarios. It is possible to run just one scenario if you only want toupdate one of them.
Step 1: Select the Preservation Example Program.
Step 2: Select to run all scenarios for the program
Step 3: Run the Optimization – this is going to take a while. Expect it to take around 3x as long as thedefault optimization only.
Step 4: Check that each scenario at the bottom has results, except for the “No Funding” one – we wouldexpect no work on that one.
Begin EstimationAfter the optimization has run, we can now go see the overall results in a single graph on the Scenario Explorer task. Ifwe had run the scenarios with multiple performance measures, we can see how the network performed in regards to eachperformance measure by editing the preferences at the top right.
You should be able to see that depending on how quickly we dedicate funding to our network will change how quicklyour agency meets its goal. This will help your agency choose, or present to politicians who chose, which scenario to fol-low.
- 506 -

If you change something at one of the base levels, like the utility profile, you can get a very rough estimation of howthat would change the results by clicking on the “estimation” button at the bottom of the page. This would estimateusing the currently-identified projects as a rough base for how the results would change.
As you change base data, the graphs on the scenario explorer will not be updated. This is to make the data from the lastrun available until you update the scenarios because of how time and resource intensive the scenario explorer can be. To update the graphs fully, you will need to optimize the scenarios again. So for example the variation in the previousimage is very small. So by going back to the actions and reducing the costs and the deferment period, as show in the fol-lowing images, the variation in the scenario explorer graph, shown below, become greater because more work can bedone.
- 507 -
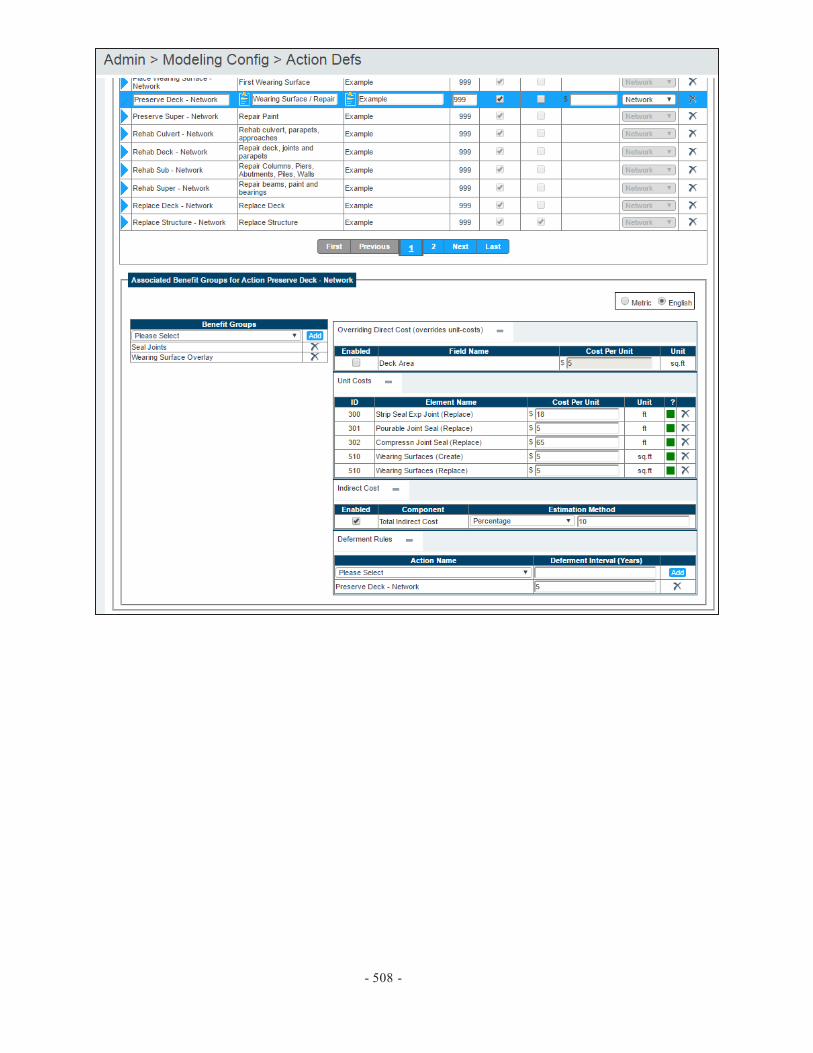
- 508 -

- 509 -

- 510 -