User Manual (English) - Wie-Tec
53
Local Control Software User Manual (English) 9499 230 43311 Issue 2a 001201 Copyright © 2000 Unicam Limited, Registration No. 441506 All rights reserved A Thermo Electron business Thermo Spectronic (Europe, Middle East and Africa) Mercers Row, Cambridge CB5 8HY, UK Tel: +44 (0)1223 446600 Fax: +44 (0)1223 446644 E-mail: [email protected] www.thermospectronic.com Thermo Spectronic (North America and Latin America) 820 Linden Avenue, Rochester, NY 14625, USA Tel: (800) 654-9955 or (716) 248-4000 Fax: (716) 248-4014 E-mail:[email protected] www.thermospectronic.com For Indian Sub-continent, Far East and Australasia Contact Thermo Spectronic (Europe, Middle East and Africa)
-
Upload
khangminh22 -
Category
Documents
-
view
2 -
download
0
Transcript of User Manual (English) - Wie-Tec
Local Control Software
User Manual (English)
9499 230 43311
Issue 2a 001201
Copyright © 2000 Unicam Limited, Registration No. 441506
All rights reserved
A Thermo Electron business
Thermo Spectronic (Europe, Middle East and Africa) Mercers Row, Cambridge CB5 8HY, UK Tel: +44 (0)1223 446600 Fax: +44 (0)1223 446644 E-mail: [email protected] www.thermospectronic.com
Thermo Spectronic (North America and Latin America) 820 Linden Avenue, Rochester, NY 14625, USA Tel: (800) 654-9955 or (716) 248-4000 Fax: (716) 248-4014 E-mail:[email protected] www.thermospectronic.com
For Indian Sub-continent, Far East and Australasia Contact Thermo Spectronic (Europe, Middle East and Africa)
GENERAL
UV Issue 2a (12/2000) 3
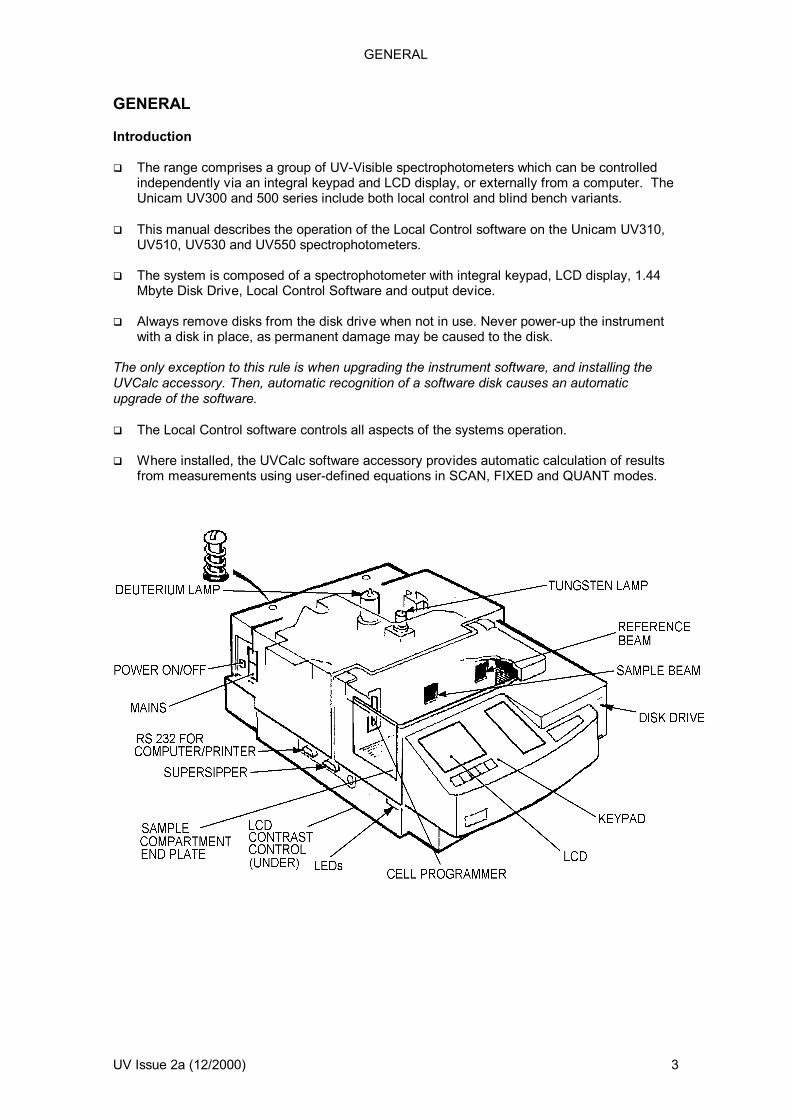
GENERAL Introduction The range comprises a group of UV-Visible spectrophotometers which can be controlled
independently via an integral keypad and LCD display, or externally from a computer. The Unicam UV300 and 500 series include both local control and blind bench variants.
This manual describes the operation of the Local Control software on the Unicam UV310,
UV510, UV530 and UV550 spectrophotometers. The system is composed of a spectrophotometer with integral keypad, LCD display, 1.44
Mbyte Disk Drive, Local Control Software and output device. Always remove disks from the disk drive when not in use. Never power-up the instrument
with a disk in place, as permanent damage may be caused to the disk. The only exception to this rule is when upgrading the instrument software, and installing the UVCalc accessory. Then, automatic recognition of a software disk causes an automatic upgrade of the software. The Local Control software controls all aspects of the systems operation. Where installed, the UVCalc software accessory provides automatic calculation of results
from measurements using user-defined equations in SCAN, FIXED and QUANT modes.

GENERAL
4 UV Issue 2a (12/2000)
User Interface
Key Operation Arrow Keys Highlight menu options, or move track cursor, or move Cell Programmer, depending on page in use. Change display contrast with <> from Home Page. Numerical Keys Enter numbers, minus and decimal point. Function Keys Access and perform system functions. Operation depends on screen in use, and is indicated by labels at bottom of screen. Clear Clears entry leaving field or parameter ready for new entry, clears pop-up, and clears error messages. Enter Enters changes to field or parameter. Run Starts instrument measurement according to current method. Home Returns to Home page. Zero/Base Performs a zero or baseline as appropriate to application. REMOVE THE SAMPLE AND ENSURE THAT BOTH SAMPLE AND REFERENCE BEAMS ARE CLEAR OR CONTAIN THE BASELINE SAMPLES RELEVANT TO THE ANALYSIS BEFORE ZEROING THE INSTRUMENT OR PERFORMING A BASELINE SCAN. Indicator LEDs Lower (green) = ON, upper (red) = STANDBY
-.
8
0
7
C ENTER
HOMEZEROBASE RUN
9
321
65
.
FUNCTION KEYS ON(GREEN)
STANDBY(RED)
CLEARKEY
HOMEKEY
ZERO/BASEKEY
ENTERKEY
RUNKEY
ARROW KEYS
NUMERICAL KEYS
LCD DISPLAY
4
GENERAL
UV Issue 2a (12/2000) 5
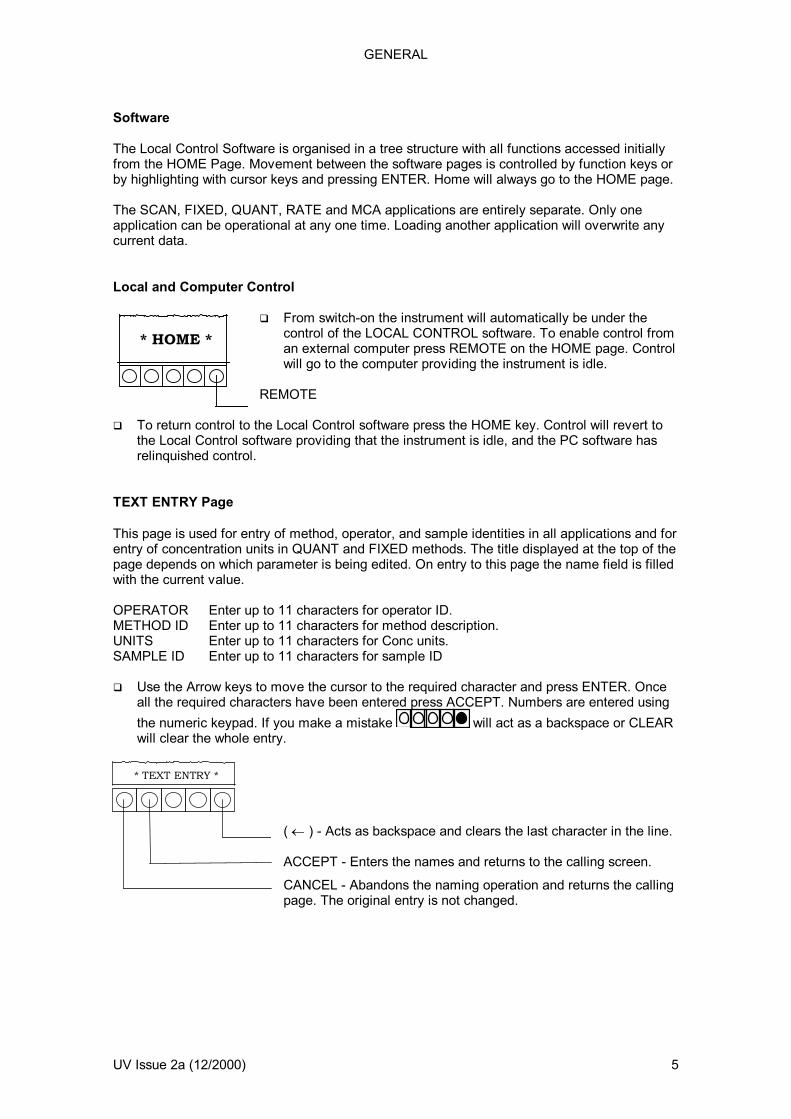
Software The Local Control Software is organised in a tree structure with all functions accessed initially from the HOME Page. Movement between the software pages is controlled by function keys or by highlighting with cursor keys and pressing ENTER. Home will always go to the HOME page. The SCAN, FIXED, QUANT, RATE and MCA applications are entirely separate. Only one application can be operational at any one time. Loading another application will overwrite any current data. Local and Computer Control
From switch-on the instrument will automatically be under the control of the LOCAL CONTROL software. To enable control from an external computer press REMOTE on the HOME page. Control will go to the computer providing the instrument is idle.
REMOTE
To return control to the Local Control software press the HOME key. Control will revert to
the Local Control software providing that the instrument is idle, and the PC software has relinquished control.
TEXT ENTRY Page This page is used for entry of method, operator, and sample identities in all applications and for entry of concentration units in QUANT and FIXED methods. The title displayed at the top of the page depends on which parameter is being edited. On entry to this page the name field is filled with the current value. OPERATOR Enter up to 11 characters for operator ID. METHOD ID Enter up to 11 characters for method description. UNITS Enter up to 11 characters for Conc units. SAMPLE ID Enter up to 11 characters for sample ID Use the Arrow keys to move the cursor to the required character and press ENTER. Once
all the required characters have been entered press ACCEPT. Numbers are entered using the numeric keypad. If you make a mistake will act as a backspace or CLEAR will clear the whole entry.
( ) - Acts as backspace and clears the last character in the line. ACCEPT - Enters the names and returns to the calling screen.
CANCEL - Abandons the naming operation and returns the calling page. The original entry is not changed.
* HOME *
* TEXT ENTRY *

GENERAL
6 UV Issue 2a (12/2000)
SAVE/RENAME This page is used for saving or renaming files from any part of the LOCAL CONTROL software. The page is used to name a file and/or change the ID. On coming to the page the Filename field is ready for editing. Use the Arrow keys to move
the cursor to the required character and press ENTER. Once all the required characters have been entered press ACCEPT. Numbers are entered using the numeric keypad. If you make a mistake will act as a backspace or CLEAR will clear the whole entry.
Filenames are limited to 8 characters. To change the FILE TYPE highlight the field and press ENTER to display the pop-up menu.
Available formats are NORMAL (the native file type of the Local Control Software), CSV (Comma separated variable) and JCAMP-DX (JCAMP data exchange format). Highlight your choice and press ENTER to select.
The ID field will contain the characters entered for the method. To edit the ID highlight the
ID field and press ENTER, change as necessary then press ACCEPT. To select the destination of the file, highlight the DRIVE field. Pressing ENTER will toggle
between LIBRARY and DISK.
( ) - Acts as backspace and clears the last character in the line. ACCEPT/SAVE - Accepts the edited field ready for saving. Only reads ACCEPT if edit is in progress. SAVE - saves file to disk and is not present during an edit. CANCEL - Abandons the naming operation. No files will be changed and the software returns to the calling screen.
* SAVE *
SCAN
UV Issue 2a (12/2000) 7
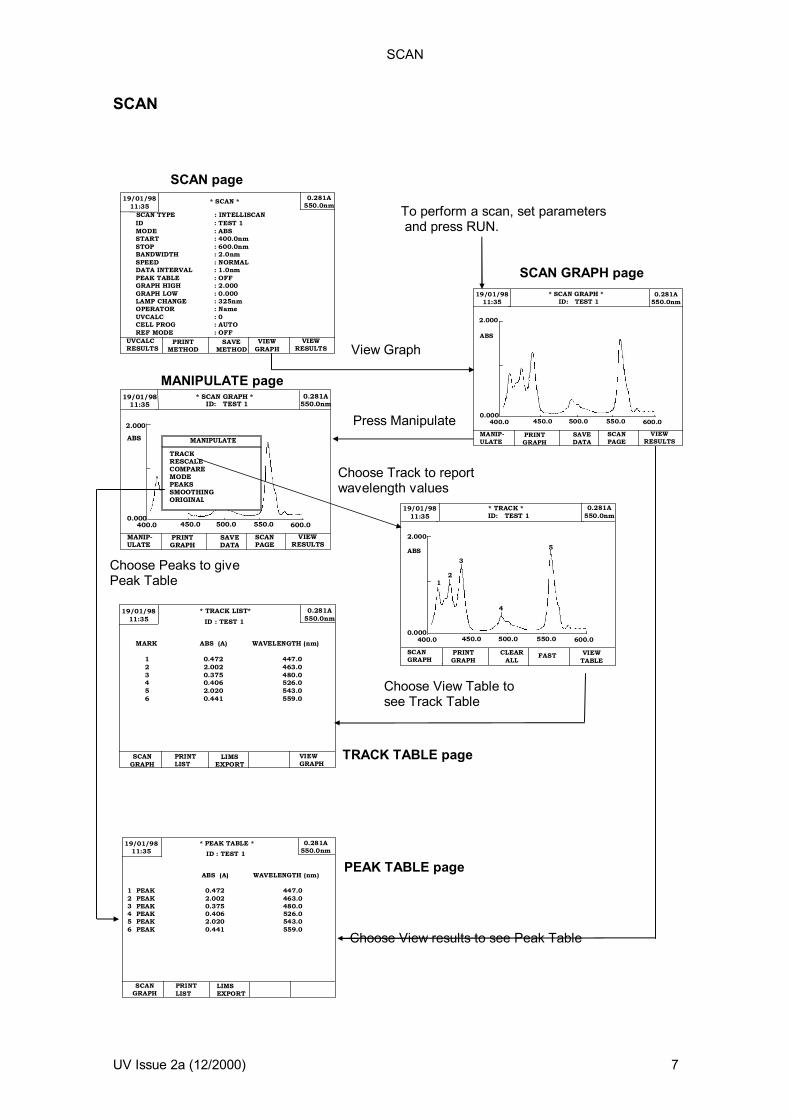
SCAN SCAN page
To perform a scan, set parameters and press RUN. SCAN GRAPH page View Graph
MANIPULATE page
19/01/9811:35
0.281A550.0nm* SCAN *
SCAN TYPE : INTELLISCANID : TEST 1MODE : ABSSTART : 400.0nmSTOP : 600.0nmBANDWIDTH : 2.0nmSPEED : NORMALDATA INTERVAL : 1.0nmPEAK TABLE : OFFGRAPH HIGH : 2.000GRAPH LOW : 0.000LAMP CHANGE : 325nmOPERATOR : NameUVCALC : 0CELL PROG : AUTOREF MODE : OFF
PRINTMETHOD
SAVEMETHOD
VIEWGRAPH
VIEWRESULTS
UVCALCRESULTS
19/01/9811:35
* SCAN GRAPH * 0.281A550.0nm
PRINTGRAPH
SAVEDATA
SCANPAGE
VIEWRESULTS
ID: TEST 1
2.000
ABS
0.000400.0 450.0 500.0 550.0 600.0
MANIP-ULATE
19/01/9811:35
* SCAN GRAPH * 0.281A550.0nm
PRINTGRAPH
SAVEDATA
SCANPAGE
VIEWRESULTS
ID: TEST 1
2.000
ABS
0.000400.0 450.0 500.0 550.0 600.0
MANIP-ULATE
MANIPULATE
TRACKRESCALECOMPAREMODEPEAKSSMOOTHINGORIGINAL
Press Manipulate
Choose Track to report wavelength values
Choose Peaks to give Peak Table
19/01/9811:35
* TRACK * 0.281A550.0nm
PRINTGRAPH
CLEARALL
FAST VIEWTABLE
ID: TEST 1
2.000
ABS
0.000400.0 450.0 500.0 550.0 600.0
SCANGRAPH
12
3
4
5
19/01/9811:35
* TRACK LIST* 0.281A550.0nmID : TEST 1
SCANGRAPH
MARK ABS (A) WAVELENGTH (nm)
1 0.472 447.0 2 2.002 463.0 3 0.375 480.0 4 0.406 526.0 5 2.020 543.0 6 0.441 559.0
PRINTLIST
VIEWGRAPH
LIMSEXPORT
Choose View Table to see Track Table
TRACK TABLE page
19/01/9811:35
* PEAK TABLE * 0.281A550.0nmID : TEST 1
SCANGRAPH
ABS (A) WAVELENGTH (nm)
1 PEAK 0.472 447.02 PEAK 2.002 463.03 PEAK 0.375 480.04 PEAK 0.406 526.05 PEAK 2.020 543.06 PEAK 0.441 559.0
PRINTLIST
LIMSEXPORT
PEAK TABLE page
Choose View results to see Peak Table
SCAN
8 UV Issue 2a (12/2000)
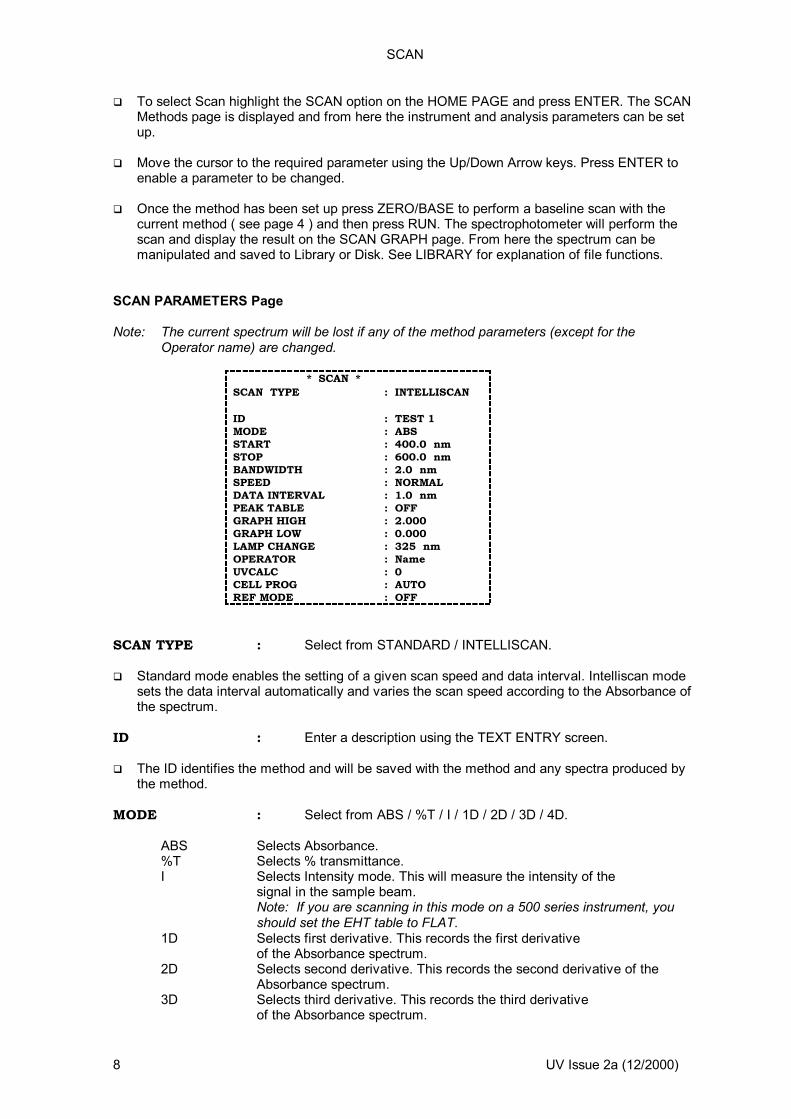
To select Scan highlight the SCAN option on the HOME PAGE and press ENTER. The SCAN Methods page is displayed and from here the instrument and analysis parameters can be set up.
Move the cursor to the required parameter using the Up/Down Arrow keys. Press ENTER to
enable a parameter to be changed. Once the method has been set up press ZERO/BASE to perform a baseline scan with the
current method ( see page 4 ) and then press RUN. The spectrophotometer will perform the scan and display the result on the SCAN GRAPH page. From here the spectrum can be manipulated and saved to Library or Disk. See LIBRARY for explanation of file functions.
SCAN PARAMETERS Page Note: The current spectrum will be lost if any of the method parameters (except for the Operator name) are changed.
* SCAN * SCAN TYPE : INTELLISCAN ID : TEST 1 MODE : ABS START : 400.0 nm STOP : 600.0 nm BANDWIDTH : 2.0 nm SPEED : NORMAL DATA INTERVAL : 1.0 nm PEAK TABLE : OFF GRAPH HIGH : 2.000 GRAPH LOW : 0.000 LAMP CHANGE : 325 nm OPERATOR : Name UVCALC : 0 CELL PROG : AUTO REF MODE : OFF
SCAN TYPE : Select from STANDARD / INTELLISCAN. Standard mode enables the setting of a given scan speed and data interval. Intelliscan mode
sets the data interval automatically and varies the scan speed according to the Absorbance of the spectrum.
ID : Enter a description using the TEXT ENTRY screen. The ID identifies the method and will be saved with the method and any spectra produced by
the method. MODE : Select from ABS / %T / I / 1D / 2D / 3D / 4D. ABS Selects Absorbance. %T Selects % transmittance. I Selects Intensity mode. This will measure the intensity of the signal in the sample beam. Note: If you are scanning in this mode on a 500 series instrument, you
should set the EHT table to FLAT. 1D Selects first derivative. This records the first derivative of the Absorbance spectrum. 2D Selects second derivative. This records the second derivative of the Absorbance spectrum. 3D Selects third derivative. This records the third derivative of the Absorbance spectrum.
SCAN
UV Issue 2a (12/2000) 9
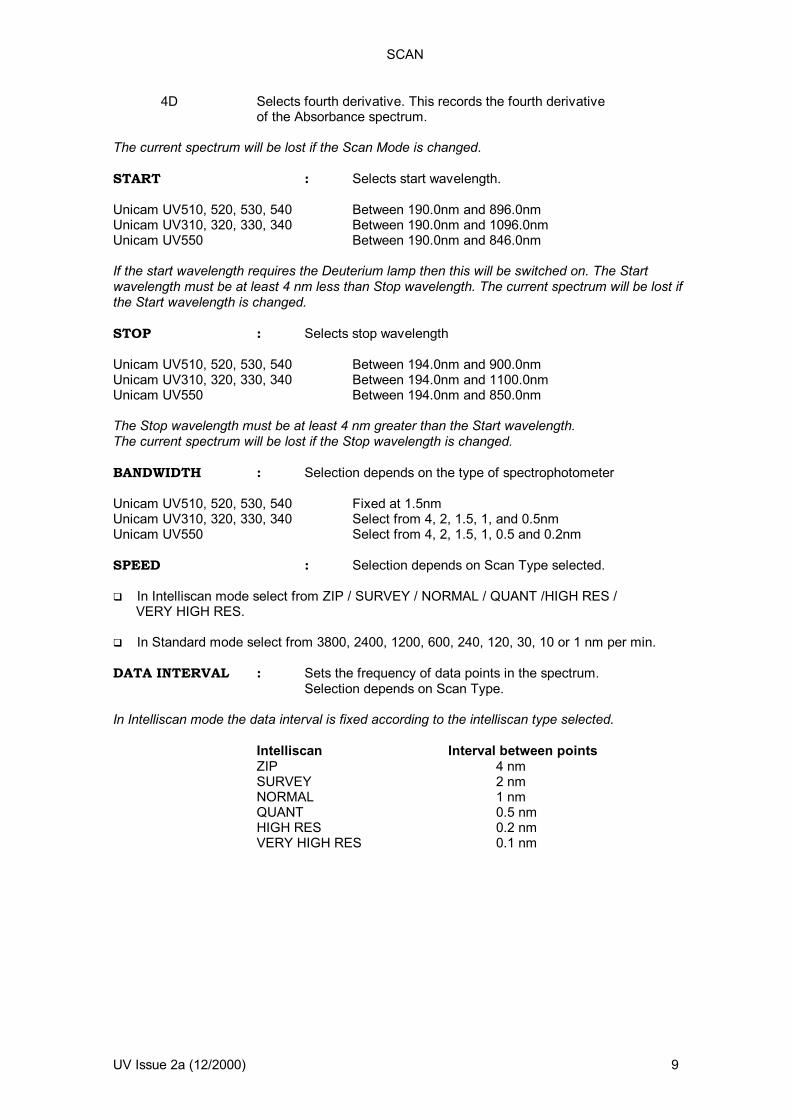
4D Selects fourth derivative. This records the fourth derivative of the Absorbance spectrum. The current spectrum will be lost if the Scan Mode is changed. START : Selects start wavelength. Unicam UV510, 520, 530, 540 Between 190.0nm and 896.0nm Unicam UV310, 320, 330, 340 Between 190.0nm and 1096.0nm Unicam UV550 Between 190.0nm and 846.0nm If the start wavelength requires the Deuterium lamp then this will be switched on. The Start wavelength must be at least 4 nm less than Stop wavelength. The current spectrum will be lost if the Start wavelength is changed. STOP : Selects stop wavelength Unicam UV510, 520, 530, 540 Between 194.0nm and 900.0nm Unicam UV310, 320, 330, 340 Between 194.0nm and 1100.0nm Unicam UV550 Between 194.0nm and 850.0nm The Stop wavelength must be at least 4 nm greater than the Start wavelength. The current spectrum will be lost if the Stop wavelength is changed. BANDWIDTH : Selection depends on the type of spectrophotometer Unicam UV510, 520, 530, 540 Fixed at 1.5nm Unicam UV310, 320, 330, 340 Select from 4, 2, 1.5, 1, and 0.5nm Unicam UV550 Select from 4, 2, 1.5, 1, 0.5 and 0.2nm SPEED : Selection depends on Scan Type selected. In Intelliscan mode select from ZIP / SURVEY / NORMAL / QUANT /HIGH RES / VERY HIGH RES. In Standard mode select from 3800, 2400, 1200, 600, 240, 120, 30, 10 or 1 nm per min. DATA INTERVAL : Sets the frequency of data points in the spectrum. Selection depends on Scan Type. In Intelliscan mode the data interval is fixed according to the intelliscan type selected. Intelliscan Interval between points ZIP 4 nm SURVEY 2 nm NORMAL 1 nm QUANT 0.5 nm HIGH RES 0.2 nm VERY HIGH RES 0.1 nm

SCAN
10 UV Issue 2a (12/2000)
In Standard mode the choice of data interval depends on the scan speed selected. Speeds Data Intervals 3800 4 2400 4, 2 1200 4, 2, 1 600 4, 2, 1, 0.5 240 4, 2, 1, 0.5, 0.2, 0.1 120 4, 2, 1, 0.5, 0.2, 0.1 30 4, 2, 1, 0.5, 0.2, 0.1 10 4, 2, 1, 0.5, 0.2, 0.1 1 4, 2, 1, 0.5, 0.2, 0.1 The current spectrum will be lost if the scan speed is changed. PEAK TABLE : Select from OFF / PEAKS / VALLEYS / PKS & VALLEYS / ZERO CROSS / TRACK / RATIO / CORR. RATIO / PEAK HEIGHT. Note: RATIO, CORR RATIO, and PEAK HEIGHT do not appear on this menu when
UVCalc has been installed. UVCalc can perform these calculations if required, in addition to a wide range of additional data manipulations. See UVCalc Manual.
This selects the type of peak picking done automatically as part of the method. Results are reported on the Peaks Page. Peaks information is stored with any saved spectrum. OFF Sets Peak Table to Off. No peaks information is produced as part of the scan. PEAKS Picks the highest peaks in a spectrum up to a maximum of 10 peaks. VALLEYS Picks the lowest troughs in a spectrum up to a maximum of 10 troughs. PKS & VALLEYS Picks the 5 highest peaks and the 5 lowest valleys. ZERO CROSS Picks all the points where the spectrum crosses zero up to a maximum of 10 crossing points. TRACK This function allows the Absorbance (or other mode) values to be reported at up to 10 user selected wavelengths. To enter the desired wavelengths select PEAK TABLE TRACK then press VIEW GRAPH. You do not have to have a spectrum present on the graph to enter the selected wavelengths. Press MANIPULATE and select TRACK. For each wavelength move the cursor to the desired position press ENTER. Once all the wavelengths have been entered go back to the SCAN METHOD page and save the method. RATIO This function allows the ratio 1to be automatically calculated at the end of the scan. To enter the desired wavelengths select PEAK TABLE and press ENTER then select RATIO. A pop up box appears in which to enter the first wavelength. Enter the desired wavelength and press ENTER. Repeat for the second wavelength. Once all the method parameters have been set save the method. CORR RATIO This function allows the ratio of two wavelengths to be calculated relative to a third wavelength (automatically at the end

SCAN
UV Issue 2a (12/2000) 11
of a scan. To enter the desired wavelengths select PEAK TABLE and press ENTER then select CORR RATIO. A pop up box appears in which to enter the first wavelength. Enter the desired wavelength and press ENTER. Repeat for the second and correction wavelengths.
Once all the method parameters have been set save the method. PEAK HEIGHT This function allows the height of a peak to be calculated relative to a local baseline rather than y = 0. To enter the desired wavelengths select PEAK TABLE and press ENTER then select PEAK HEIGHT. A pop-up box appears in which to enter the wavelengths required. 1 and 3 define the baseline, 2 defines the peak. Once all the parameters have been set, save the method. GRAPH HIGH: Select from range (GRAPH LOW + 0.01) to 6.00. Sets the upper graph limits on the SCAN GRAPH page. GRAPH HIGH must be 0.01 greater than GRAPH LOW. GRAPH LOW : Select from range -0.3 to (GRAPH HIGH- 0.01). Sets the lower graph limits on the SCAN GRAPH page. GRAPH LOW must be 0.01 less than GRAPH HIGH. LAMP CHANGE : Select from 315, 320, 325, 330, 335, 340, D2, W, Hg. Selects the wavelength at which the source is changed between the Tungsten and Deuterium lamps. Selecting D2, W or Hg overrides any changeover and the selected lamp will be used regardless of the wavelength set. THE MERCURY LAMP MUST BE SWITCHED OFF WHENEVER IT IS NOT IN USE OPERATOR : Switches to the TEXT ENTRY screen. The operator name is automatically saved with the method and any spectra produced by the method. Changing the operator name will not cause the current spectrum to be lost. If User Log-on is in operation, the operator name cannot be changed. UVCALC : Appears when the UVCalc software has been installed.
Switches to the UVCALC screen. CELL PROG : Appears when the Cell Programmer is fitted. Switches to the
CELL PROG screen. REF MODE : Appears when the Cell Programmer is fitted. Toggles the status of
the Cell Programmer reference mode.

SCAN
12 UV Issue 2a (12/2000)
SCAN PARAMETERS page function keys
VIEW RESULTS - Switches to the Scan Peak Table screen if any of the peak functions have been performed or the Track Table screen if track has been used. VIEW GRAPH - Switches to the Scan Graph screen. SAVE METHOD - Brings up the Filename Function screen and then saves the method including ID, operator name and track wavelengths if the PEAK TABLE parameter is set to TRACK. PRINT METHOD - Prints the current method parameters on the printer UVCALC RESULTS - Switches to UVCalc results screen if an equation has been entered and results are available. (Only available if UVCalc has been installed.)
SCAN GRAPH Page This page displays spectra and allows them to be manipulated.
VIEW RESULTS - Switches to the PEAK TABLE page.
SCAN PAGE - Returns to the SCAN page.
SAVE DATA - Displays the SAVE screen from where method and data can be saved to disk.
PRINT GRAPH - Provides a hardcopy of the results as shown on screen. MANIPULATE - Displays the Manipulate options.
Pressing RUN starts a scan using the current method. Pressing ZERO/BASE starts a baseline using the current method. (See page 4).
* SCAN *
400.0 600.0500.0

SCAN
UV Issue 2a (12/2000) 13
MANIPULATE OPTIONS
TRACK Reports x and y axis values using the tracking cursor.
RESCALE Changes x and y axis scales automatically or manually. COMPARE Loads reference spectrum for comparison.
MODE Changes mode. Select from %T / ABS / 1D / 2D / 3D / 4D. PEAKS Finds spectral peaks. Select from PEAKS / VALLEYS / PEAKS & VALLEYS/ ZERO CROSS / RATIO / CORR. RATIO / PK HEIGHT. (Ratio, Corr. Ratio and Pk. Height are not available when UVCalc has been installed.) SMOOTHING Applies LOW, MEDIUM or HIGH modified/improved Savitsky-Golay smoothing to the spectrum. ORIGINAL Resets the graph to display the data as originally collected. TRACK To move the vertical cursor across the screen use the Left and Right Arrow keys. The cursor
always moves to a data point regardless of the displayed scales. Pressing ENTER places a marker at the current wavelength. Up to 10 wavelengths can be selected.
TRACK page function keys
Pressing CLEAR will delete markers in turn, highest number first.
The x-axis values are listed on the TRACK table page.
Further markers can be added to the spectrum at any time; however selecting TRACK will cause any previous PEAK TABLE information to be lost.
VIEW TABLE - Switches to the TRACK TABLE page. FAST/SLOW - Toggles between two cursor speeds. In FAST mode the cursor jumps 5% of the graph or to the next data point whichever is the greater. In SLOW mode the cursor jumps to the next data point or the next display pixel whichever is the greater. The function key label shows the next speed ie the opposite to the one selected. CLEAR ALL - Clears all the markers and the TRACK TABLE.
PRINT GRAPH - Provides a hardcopy of the results showing the markers and x and y-axis values.
SCAN GRAPH - Returns to the SCAN GRAPH page.
MANIPULATE TRACK RESCALE COMPARE MODE PEAKS SMOOTHING ORIGINAL
400.0 600.0500.0
SCAN
14 UV Issue 2a (12/2000)
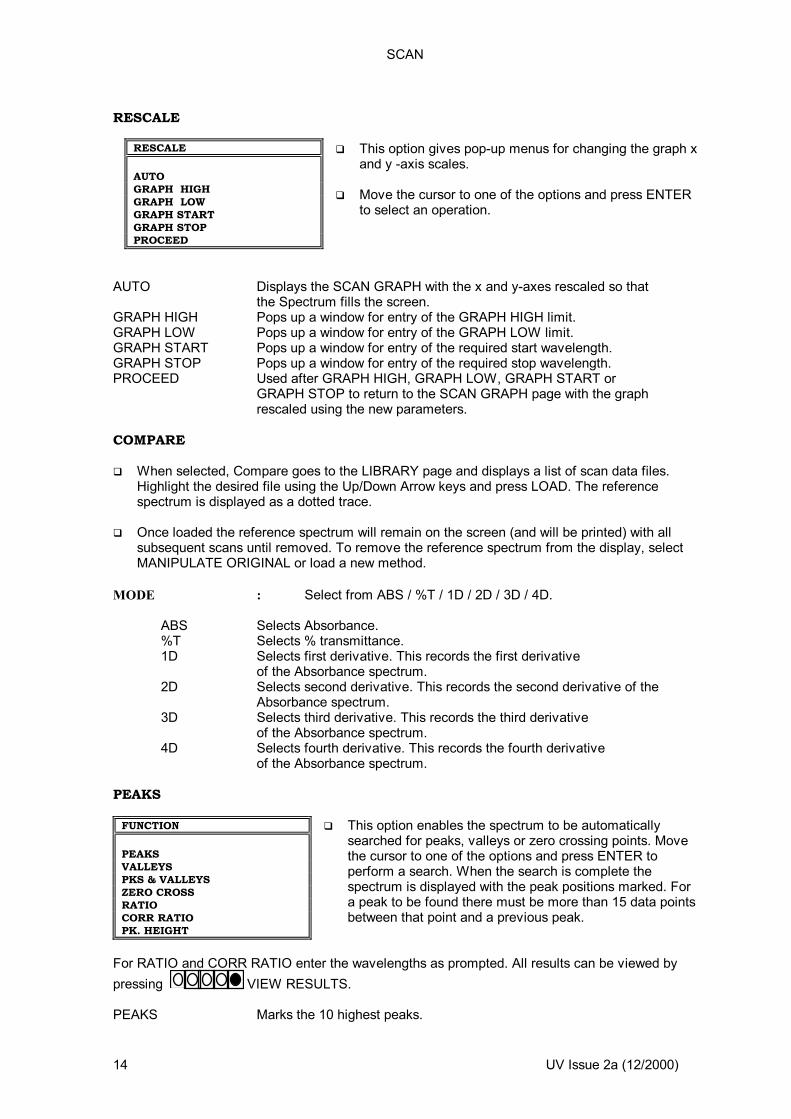
RESCALE
This option gives pop-up menus for changing the graph x
and y -axis scales. Move the cursor to one of the options and press ENTER
to select an operation.
AUTO Displays the SCAN GRAPH with the x and y-axes rescaled so that
the Spectrum fills the screen. GRAPH HIGH Pops up a window for entry of the GRAPH HIGH limit. GRAPH LOW Pops up a window for entry of the GRAPH LOW limit. GRAPH START Pops up a window for entry of the required start wavelength. GRAPH STOP Pops up a window for entry of the required stop wavelength. PROCEED Used after GRAPH HIGH, GRAPH LOW, GRAPH START or
GRAPH STOP to return to the SCAN GRAPH page with the graph rescaled using the new parameters.
COMPARE When selected, Compare goes to the LIBRARY page and displays a list of scan data files.
Highlight the desired file using the Up/Down Arrow keys and press LOAD. The reference spectrum is displayed as a dotted trace.
Once loaded the reference spectrum will remain on the screen (and will be printed) with all
subsequent scans until removed. To remove the reference spectrum from the display, select MANIPULATE ORIGINAL or load a new method.
MODE : Select from ABS / %T / 1D / 2D / 3D / 4D. ABS Selects Absorbance. %T Selects % transmittance. 1D Selects first derivative. This records the first derivative of the Absorbance spectrum. 2D Selects second derivative. This records the second derivative of the Absorbance spectrum. 3D Selects third derivative. This records the third derivative of the Absorbance spectrum. 4D Selects fourth derivative. This records the fourth derivative of the Absorbance spectrum. PEAKS
This option enables the spectrum to be automatically
searched for peaks, valleys or zero crossing points. Move the cursor to one of the options and press ENTER to perform a search. When the search is complete the spectrum is displayed with the peak positions marked. For a peak to be found there must be more than 15 data points between that point and a previous peak.
For RATIO and CORR RATIO enter the wavelengths as prompted. All results can be viewed by pressing VIEW RESULTS. PEAKS Marks the 10 highest peaks.
RESCALE AUTO GRAPH HIGH GRAPH LOW GRAPH START GRAPH STOP PROCEED
FUNCTION PEAKS VALLEYS PKS & VALLEYS ZERO CROSS RATIO CORR RATIO PK. HEIGHT
SCAN
UV Issue 2a (12/2000) 15
VALLEYS Marks the 10 lowest valleys. PKS&VALLEYS Marks the 5 highest peaks and 5 lowest valleys. ZERO CROSS Marks the first 10 zero crossings. RATIO Calculates the ratio 1 CORR RATIO Calculates the ratio ( PK HEIGHT Calculates the peak maximum relative to a local baseline. (Ratio, Corr. Ratio and Pk. Height are not available when UVCalc has been installed.) SMOOTHING This option offers a pop-up menu to choose one of three smoothing algorithms. Choices are
NONE, LOW, MEDIUM and HIGH. A Savitsky-Golay smooth is performed on the data and in each case data points will be lost from either end of the data.
SMOOTHING No of POINTS POINTS LOST AT USED EACH END NONE 0 0 LOW 9 4 MEDIUM 17 8 HIGH 33 16 ORIGINAL This removes any manipulation and displays the spectrum as originally collected and specified
by the scan method. It will also clear any Compare spectrum. TRACK TABLE Page
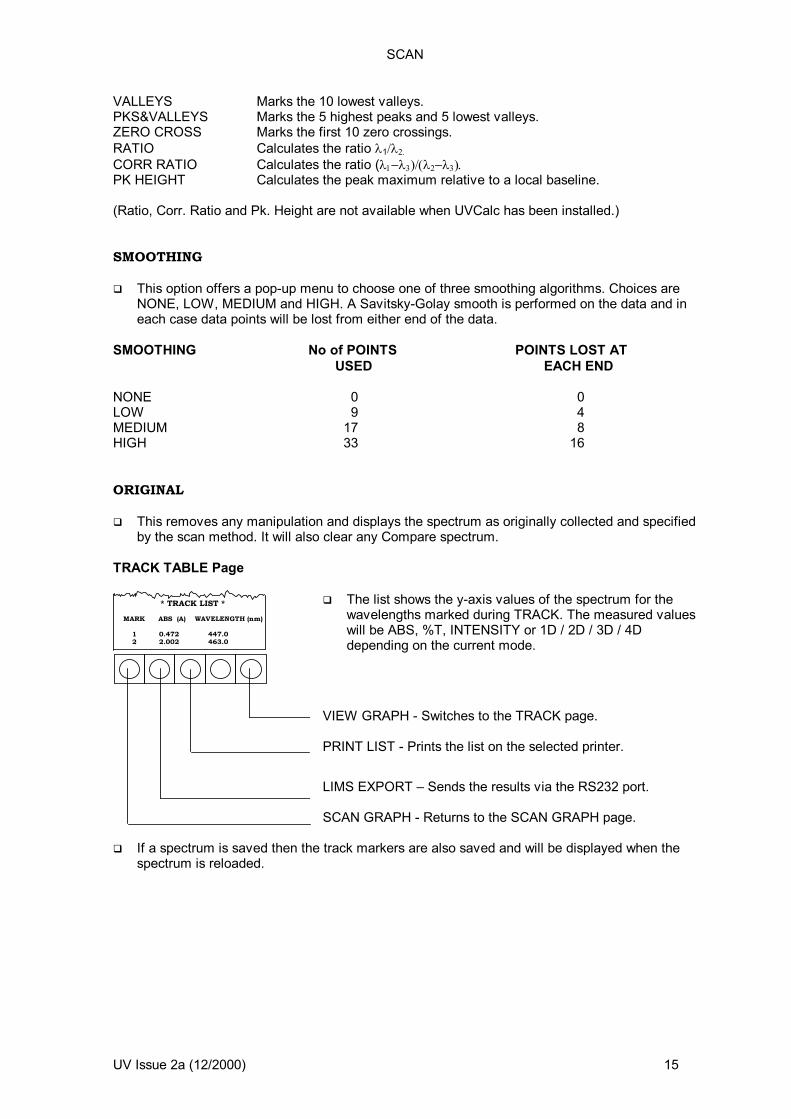
The list shows the y-axis values of the spectrum for the wavelengths marked during TRACK. The measured values will be ABS, %T, INTENSITY or 1D / 2D / 3D / 4D depending on the current mode.
VIEW GRAPH - Switches to the TRACK page. PRINT LIST - Prints the list on the selected printer. LIMS EXPORT – Sends the results via the RS232 port. SCAN GRAPH - Returns to the SCAN GRAPH page.
If a spectrum is saved then the track markers are also saved and will be displayed when the spectrum is reloaded.
MARK ABS (A) WAVELENGTH (nm)
1 0.472 447.0 2 2.002 463.0
* TRACK LIST *
SCAN
16 UV Issue 2a (12/2000)
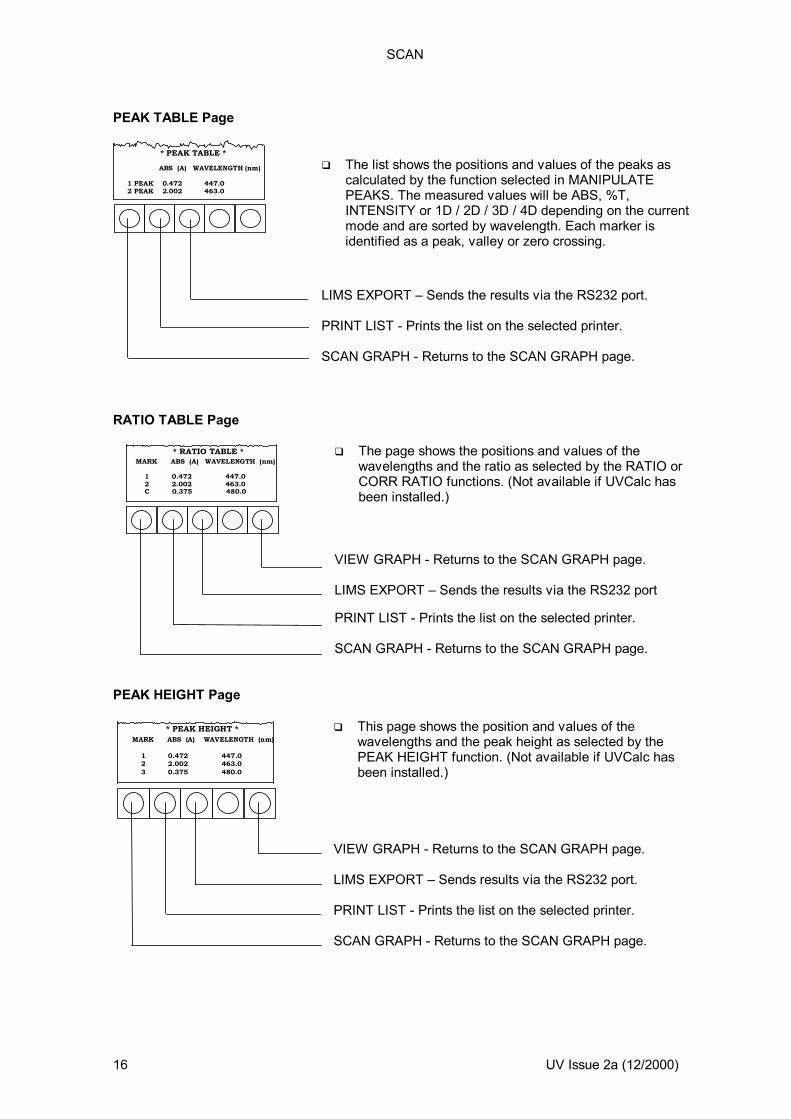
PEAK TABLE Page
The list shows the positions and values of the peaks as
calculated by the function selected in MANIPULATE PEAKS. The measured values will be ABS, %T, INTENSITY or 1D / 2D / 3D / 4D depending on the current mode and are sorted by wavelength. Each marker is identified as a peak, valley or zero crossing.
LIMS EXPORT – Sends the results via the RS232 port. PRINT LIST - Prints the list on the selected printer. SCAN GRAPH - Returns to the SCAN GRAPH page.
RATIO TABLE Page
The page shows the positions and values of the wavelengths and the ratio as selected by the RATIO or CORR RATIO functions. (Not available if UVCalc has been installed.)
VIEW GRAPH - Returns to the SCAN GRAPH page. LIMS EXPORT – Sends the results via the RS232 port PRINT LIST - Prints the list on the selected printer. SCAN GRAPH - Returns to the SCAN GRAPH page.
PEAK HEIGHT Page
This page shows the position and values of the wavelengths and the peak height as selected by the PEAK HEIGHT function. (Not available if UVCalc has been installed.)
VIEW GRAPH - Returns to the SCAN GRAPH page. LIMS EXPORT – Sends results via the RS232 port. PRINT LIST - Prints the list on the selected printer. SCAN GRAPH - Returns to the SCAN GRAPH page.
ABS (A) WAVELENGTH (nm)
1 PEAK 0.472 447.0 2 PEAK 2.002 463.0
* PEAK TABLE *
MARK ABS (A) WAVELENGTH (nm)
1 0.472 447.0 2 2.002 463.0 C 0.375 480.0
* RATIO TABLE *
MARK ABS (A) WAVELENGTH (nm)
1 0.472 447.0 2 2.002 463.0 3 0.375 480.0
* PEAK HEIGHT *

FIXED
UV Issue 2a (12/2000) 17
FIXED FIXED Page
19/01/9811:35
0.281A550.0nm* FIXED*
MODE : ABSID : f1X123 SELECT : SINGLE WAVELENGTH(S) : 550.0nmBANDWIDTHINTEGRATIONDELAY TIMELAMP CHANGEOPERATORCELL PROGREF MODE
PRINTMETHOD
SAVEMETHOD
VIEWRESULTS
SELECT
SINGLE MULTI SERIAL
19/01/9811:35
0.281A550.0nm* FIXED*
MODE : ABS
ID : f1X123 SELECT : SINGLE WAVELENGTH(S) : 550.0nmBANDWIDTH : 2.0nmINTEGRATION : 1sDELAY TIME : 0.00LAMP CHANGE : 325nmOPERATOR : NameUVCALC : 0CELL PROG : AUTOREF MODE : OFF
PRINTMETHOD
SAVEMETHOD
VIEWRESULTS
From FIXED page choose select type
From FIXED page select Mode
Single , no UVCalc 19/01/98
11:350.281A
550.0nm* FIXED* MODE : ABS
ID : f1X123 SELECT : MULTI WAVELENGTH(S) : 550.0nmBANDWIDTHINTEGRATIONDELAY TIMELAMP CHANGEOPERATORCELL PROGREF MODE
PRINTMETHOD
SAVEMETHOD
VIEWRESULTS
ABS%T
MODE
19/01/9811:35
0.281A550.0nm* FIXED*
MODE : ABSID : f1X123 SELECT : SINGLE WAVELENGTH(S) : 550.0nmBANDWIDTHINTEGRATIONDELAY TIMELAMP CHANGEOPERATORCELL PROGREF MODE
PRINTMETHOD
SAVEMETHOD
VIEWRESULTS
ABS%TCONC
MODE
ABS or %T CONC
19/01/9811:35
0.281A550.0nm* FIXED *
MODE : CONC
ID : f1X123WAVELENGTH : 550.0nm SELECT : SINGLE BANDWIDTH : 2.0nmINTEGRATION : 1sDELAY TIME : 0.00LAMP CHANGE : 325nmOPERATOR : NameFACTOR : 1.0000UNITS : g/lCELL PROG : AUTOREF MODE : OFF
PRINTMETHOD
SAVEMETHOD
VIEWRESULTS
19/01/9811:35
78.96%T550.0nm* FIXED*
MODE : %TID : f1X123 SELECT : MULTI WAVELENGTH(S) : 550.0nmBANDWIDTH : 2.0nmINTEGRATION : 1sDELAY TIME : 0.00LAMP CHANGE : 325nmOPERATOR : NameUVCALC : 0CELL PROG : AUTOREF MODE : OFF
PRINTMETHOD
SAVEMETHOD
VIEWRESULTS
For Absorbance or %T measurements set parameters and press Run.
For Concentration measurements enter Factor and Units, set parameters and press Run
19/01/9811:35
0.057A410.0nm* FIXED RESULTS *
PRINTLIST
SAVEDATA
CLEARRESULTS
FIXEDPAGE
WAVELENGTH (nm) ABS
1 1 (550.0) 0.0782 2 (560.0) 0.0443 3 (570.0) 0.0444 4 (575.0) 0.0435 5 (580.0) 0.0446 6 (454.0) 0.6447 7 (536.0) 0.2488 8 (420.0) 0.1529 9 (410.0) 0.057
LIMSEXPORT
19/01/9811:35
89.69%T550.0nm* FIXED RESULTS *
PRINTLIST
SAVEDATA
CLEARRESULTS
FIXEDPAGE
%T %T
1 1 83.63 2 90.35 3 90.39 4 90.33 5 90.30 6 89.73
LIMSEXPORT
19/01/9811:35
0.281A550.0nm* FIXED RESULTS *
PRINTLIST
SAVEDATA
CLEARRESULTS
FIXEDPAGE
ABS CONC g/l
1 0.281 0.21082 0.281 0.21083 0.281 0.21084 0.281 0.21085 0.281 0.2108
LIMSEXPORT

FIXED
18 UV Issue 2a (12/2000)
Instrument and analysis parameters are set up on the FIXED page. Move the cursor to the
required parameter using the Up/Down Arrow keys. Change the parameter by pressing the ENTER key.
Once the method has been set up press ZERO/BASE to zero the instrument for the current
method (See page 4) and press RUN. The spectrophotometer will perform a measurement and display the result on the FIXED RESULTS page.
Once all results have been collected, save the data. FIXED METHOD Page
* FIXED * MODE : ABS ID : SELECT : SINGLE WAVELENGTH(S) : 550.0 nm BANDWIDTH : 2.0 nm INTEGRATION : 1 s DELAY TIME : 00:00 LAMP CHANGE : 325 nm OPERATOR : UVCALC : 0 CELL PROG : AUTO REF MODE : OFF
MODE : Select from ABS / %T / CONC.
ABS Selects Absorbance. %T Selects % transmittance. CONC Selects Concentration mode. (Only available when SINGLE
is selected and not available if UVCalc is installed) CONC allows the result to be automatically multiplied by a factor to give concentration
measurements. If selected two further parameters are added to the method, FACTOR and UNITS.
ID : Enter a description using the TEXT ENTRY screen. The ID identifies the method and will be saved with the method and any results produced
by the method. SELECT : Select from SINGLE /MULTI /SERIAL SINGLE This option is used to measure each sample at a single wavelength which is the same for each sample. MULTI This optionallows each sample to be measured at up to 20 wavelengths, which are the same for each sample. SERIAL This option allows a single wavelength measurement to be made at a different wavelength on up to 9 samples. WAVELENGTH(S) :
SINGLE Use the numeric key pad to enter the required wavelength into the pop-up box. Press ENTER when finished.MULTI Use the up and down arrow keys to move to the wavelength to be entered
or edited and press ENTER to display the edit box. Use the numeric
FIXED
UV Issue 2a (12/2000) 19
keypad to enter the wavelength and press ENTER when finished. The instrument returns to the MULTI screen with the next wavelength in the list highlighted. Up to 20 wavelengths may be entered. When the list is finished press the ACCEPT function key to accept the new list or the CANCEL function key to return to the FIXED METHOD page without changing the wavelength list.
SERIAL Press ENTER to display the edit box for the wavelength to be used for the
first sample. Data entry is as for MULTI above. When the required wavelengths have been entered press ACCEPT to accept the new list, or press CANCEL to return to the FIXED METHOD page leaving the original list unchanged.
Available wavelength ranges depend on the instrument and are as follows: Unicam UV510, 520, 530, 540 190.0nm to 900.0nm Unicam UV310, 320, 330, 340 190.0nm to 1100.0nm Unicam UV550 190.0nm to 850.0nm If the wavelength requires the Deuterium lamp then this will be switched on. The current data will be lost if the wavelength is changed. BANDWIDTH : Selection depends on the type of spectrophotometer Unicam UV510, 520, 530, 540 Fixed at 1.5nm Unicam UV310, 320, 330, 340 Select from 4, 2, 1.5, 1, and 0.5nm Unicam UV550 Select from 4, 2, 1.5, 1, 0.5 and 0.2nm INTEGRATION : Enter integration time in seconds. This sets the integration time for which the result is measured. The current data will be lost if the integration time is changed. DELAY TIME : Set a time in the range 00.05 to 99.59,
using . to separate minutes and seconds. This sets the time between pressing RUN and the start of the measurement. The range is
from 0 to 99 minutes and 59 seconds. LAMP CHANGE : Select from 315, 320, 325, 330, 335, 340, D2, W, Hg. Selects the wavelength at which the source is changed between the Tungsten and Deuterium lamps. Selecting D2, W or Hg overrides any changeover and the selected lamp will be used regardless of the wavelength set. THE MERCURY LAMP MUST BE SWITCHED OFF WHENEVER IT IS NOT IN USE FACTOR : Enter the factor for the concentration. Only available in CONC mode, the factor is used to multiply the absorbance result to produce a concentration result. Changing the factor will not cause current results to be lost. They will be recalculated using the new factor. CONC mode is not available when UVCalc has been installed or when MULTI or SERIAL is selected. UNITS : Enter units for concentration using the TEXT ENTRY page.
FIXED
20 UV Issue 2a (12/2000)
Only available in CONC mode, used to enter the required description of the concentrations up to 11 alphanumeric characters. OPERATOR : Switches to the TEXT ENTRY screen. The operator name is automatically saved with the method and any data produced by the
method. Changing the operator name will not cause any current data to be lost. N.B. If user log-on is in operation, the operator name cannot be changed. UVCALC : Switches to the UVCALC screen (if installed). CELL PROG : Switches to the CELL PROG. screen (if fitted). REF MODE : Toggles the status of the Cell Programmer reference mode
(if fitted). FIXED Method Page Function Keys
VIEW RESULTS - Switches to the FIXED RESULTS page. SAVE METHOD - Brings up the SAVE page from where the method can be saved to Disk.
PRINT METHOD - Prints the current method parameters on the printer.
Pressing RUN starts a fixed measurement using the current method and switches to the
FIXED RESULTS page. Pressing ZERO starts a zero using the current method. Any changes to the WAVELENGTH, BANDWIDTH, INTEGRATION or LAMP CHANGE parameters will invalidate the current results. If AUTOPRINTING is selected ( see SETUP for details ), a change to the MODE parameter will invalidate the current results.
* FIXED *

FIXED
UV Issue 2a (12/2000) 21
FIXED RESULTS Page The layout of the page depends on the Mode and Select in use. SINGLE In ABS or %T modes up to 2 columns of results are displayed per page.In CONC mode a single column of results is displayed on each page. Results accumulate on the same page until it is full. MULTI Two columns of results are displayed per page. Results of each sample always start on a new page. SERIAL One column of results is displayed per page. Results accumulate on the same page until it is full. To move up or down pages of results use the Up/Down arrow keys. Results are numbered sequentially from 1 to 600. Conc values are from 0.0001 to 9999.9.
Any concentration value outside this range is marked "UNDER RANGE" or "OVER RANGE".
CLEAR RESULTS - All results are cleared ready for the start of the next batch.
FIXED PAGE - Returns to the FIXED METHOD page. SAVE DATA - Brings up the SAVE page from where the results can be saved to Disk.
PRINT LIST - Prints the list on the selected printer. LIMS EXPORT – Sends the results via the RS232 port.
Press RUN to take another sample measurement. Press ZERO/BASE to zero the instrument at the wavelength(s) specified in the method. (See page 4).
* FIXED RESULTS* ABS ABS1 0.201 150.2012 0.201 160.201

QUANT
UV Issue 2a (12/2000) 22
QUANT QUANT page
Set parameters as required 19/01/98
11:350.281A
550.0nm* QUANT *
ID :WAVELENGTH : 550.0nmBANDWIDTH : 2.0nmINTEGRATION : 1sSTANDARDS : 3REPLICATES : 1UNITS :CURVE FIT : LINEARLAMP CHANGE : 325nmOPERATOR : NameUVCALC : 0MEASURE STDS : YESCELL PROG : AUTO
PRINTMETHOD
SAVEMETHOD
VIEWRESULTS
CALIB-RATE
VIEWCALIB
STANDARDS ENTRY page
19/01/9811:35
0.281A550.0nm* STANDARDS *
ACCEPTCANCEL
STD1 0.2500 STD11 ---------STD2 ----STD3 ----STD4 -----STD5 -----STD6 -----STD7 -----STD8 -----STD9 -----STD10 --------- STD20 ---------
VALUE
CONC : 0.2500
MINIMUM : 0.0000MAXIMUM : 9999.9000
Fill in standards
19/01/9811:35
0.281A550.0nmID:
ABS
3.000
2.000
1.000
-0.300 0.0000 50.000 100.00
Place std 1.1 in beam and press run
STOP
* QUANT GRAPH *
Calibrate method
QUANT RESULTS page
19/01/9811:35
0.281A550.0nm* QUANT RESULTS *
PRINTRESULTS
SAVEDATA
CLEARRESULTS
QUANTPAGE
LIMSEXPORT
COEFFICIENT : 0.5670
ABS CONC g/ml
1 0.281 2.81002 0.281 2.81003 0.281 2.81004 0.281 2.8100
Press RUN
19/01/9811:35
* QUANT GRAPH * 0.281A550.0nmID: UV123
ABS
3.000
2.000
1.000
-0.300 0.0000 50.000 100.00C g/ml
VIEWRESULTS
COEFFICIENT : 0.9999SAVEMETHOD
PRINTGRAPH
STAND-ARDS
QUANTPAGE
Press Run to run samples.
19/01/9811:35
0.281A550.0nm* STANDARDS *
VIEWCALIB
QUANTPAGE
STD CONC ABSORBANCE
1 0.2500 0.1299 0.12992 0.5000 0.2179 0.21793 0.7500 0.4904 0.49044 1.0000 0.9312 0.93125 1.2500 1.4335 1.43356 1.5000 1.9332 1.9332
COEFFICIENT : 0.9725EQUATION : 0X2 + 1.472X - 0.425
VIEWRESULTS
EDITCURVE
EDITSTD
STANDARDS page (calibrated)

QUANT
UV Issue 2 (09/99) 23
Instrument and analysis parameters are set up on the QUANT page. Move the cursor to the required parameter using the Up/Down Arrow keys. Change the parameter by pressing the ENTER key. Once all results have been collected, save the data. QUANT METHOD Page
* QUANT * ID : WAVELENGTH : 550.0 nm BANDWIDTH : 2.0 nm INTEGRATION : 1 s STANDARDS : 3 REPLICATES : 1 UNITS : CURVE FIT : LINEAR LAMP CHANGE : 325 nm OPERATOR : UVCALC : 0 MEASURE STDS : YES CELL PROG : AUTO REF MODE : OFF
ID : Enter a description using the TEXT ENTRY screen. The ID identifies the method and will be saved with the method and any results produced
by the method. WAVELENGTH : Selection depends on the type of spectrophotometer Unicam UV510, 520, 530, 540 190.0nm to 900.0nm Unicam UV310, 320, 330, 340 190.0nm to 1100.0nm Unicam UV550 190.0nm to 850.0nm If the wavelength requires the Deuterium lamp then this will be switched on. The current data will be lost if the wavelength is changed. BANDWIDTH : Selection depends on the type of spectrophotometer Unicam UV510, 520, 530, 540 Fixed at 1.5nm Unicam UV310, 320, 330, 340 Select from 4, 2, 1.5, 1, and 0.5nm Unicam UV550 Select from 4, 2, 1.5, 1, 0.5 and 0.2nm INTEGRATION : Enter integration time in seconds. This sets the integration time for which the result is measured. The current data will be lost if the integration time is changed. STANDARDS : Brings up the Standards Entry Page Use the up and down arrow keys to move through the list of standards. When the standard to be entered or edited is highlighted, press ENTER to display the Edit pop-up. Use the numeric keys to enter the concentration of the standard and press ENTER when finished. The instrument returns to the Standards Entry page with the highlight on the next standard on the list. Up to 20 standards can be specified. Changing the standards will cause any current data to be lost.
QUANT
UV Issue 2a (12/2000) 24
REPLICATES : Enter number of replicates for each standard. Sets the number of times each standard is measured (maximum 3). Each value obtained is
used in the calibration. UNITS : Enter units for concentration using the TEXT ENTRY page. CURVE FIT : Select from LINEAR / LINEAR TO 0 / QUADRATIC / QUAD
TO 0. Selects the curve fit algorithm used in the calibration.
LINEAR performs a linear calibration. At least two standards are required. LINEAR TO 0 performs a linear calibration forced through zero. QUADRATIC performs a quadratic fit on the data. At least three standards are
required. QUAD TO 0 performs a quadratic fit with the data forced through zero. At least
two standards are required. Changing the curve fit will cause the existing calibration to be recalculated. Any results associated with the previous calibration will be lost. LAMP CHANGE : Select from 315, 320, 325, 330, 335, 340, D2, W, Hg. Selects the wavelength at which the source is changed between the Tungsten and Deuterium lamps. Selecting D2, W or Hg overrides any changeover and the selected lamp will be used regardless of the wavelength set. THE MERCURY LAMP MUST BE SWITCHED OFF WHENEVER IT IS NOT IN USE Any current data will be lost if the lamp changeover wavelength is changed OPERATOR : Switches to the TEXT ENTRY screen. The operator name is automatically saved with the method and any data produced by the method. Changing the operator name will not cause any current data to be lost. If User Log-on is in operation, the operator name cannot be changed. UVCALC : Switches to the UVCALC screen. Only available if UVCalc is installed. See UVCalc Manual. MEASURE STDS : Toggles between YES and NO. When YES, and Standard concentrations have been entered from the Quant Standards
page, pressing Calibrate causes the instrument to prompt the user to put the standard in the beam and press Run to measure, for each Standard in turn.
When NO, pressing Calibrate causes the system to prompt for an absorbance to be
entered manually for each Standard, effectively enabling a calibration originating elsewhere to be entered.
CELL PROG : Switches to the CELL PROG. screen (if fitted). REF MODE : Toggles the status of the Cell Programmer Reference Mode (if fitted).
QUANT
UV Issue 2 (09/99) 25
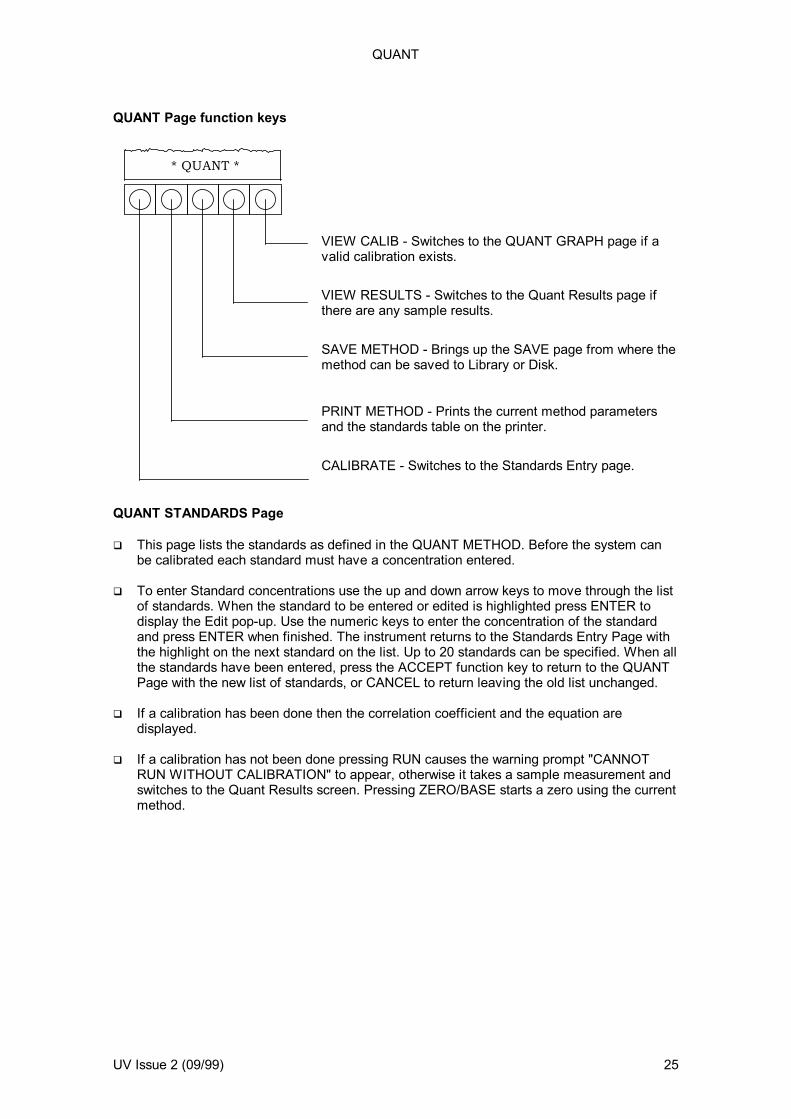
QUANT Page function keys
VIEW CALIB - Switches to the QUANT GRAPH page if a valid calibration exists.
VIEW RESULTS - Switches to the Quant Results page if there are any sample results.
SAVE METHOD - Brings up the SAVE page from where the method can be saved to Library or Disk. PRINT METHOD - Prints the current method parameters and the standards table on the printer.
CALIBRATE - Switches to the Standards Entry page.
QUANT STANDARDS Page This page lists the standards as defined in the QUANT METHOD. Before the system can
be calibrated each standard must have a concentration entered. To enter Standard concentrations use the up and down arrow keys to move through the list
of standards. When the standard to be entered or edited is highlighted press ENTER to display the Edit pop-up. Use the numeric keys to enter the concentration of the standard and press ENTER when finished. The instrument returns to the Standards Entry Page with the highlight on the next standard on the list. Up to 20 standards can be specified. When all the standards have been entered, press the ACCEPT function key to return to the QUANT Page with the new list of standards, or CANCEL to return leaving the old list unchanged.
If a calibration has been done then the correlation coefficient and the equation are
displayed. If a calibration has not been done pressing RUN causes the warning prompt "CANNOT
RUN WITHOUT CALIBRATION" to appear, otherwise it takes a sample measurement and switches to the Quant Results screen. Pressing ZERO/BASE starts a zero using the current method.
* QUANT *
QUANT
UV Issue 2a (12/2000) 26
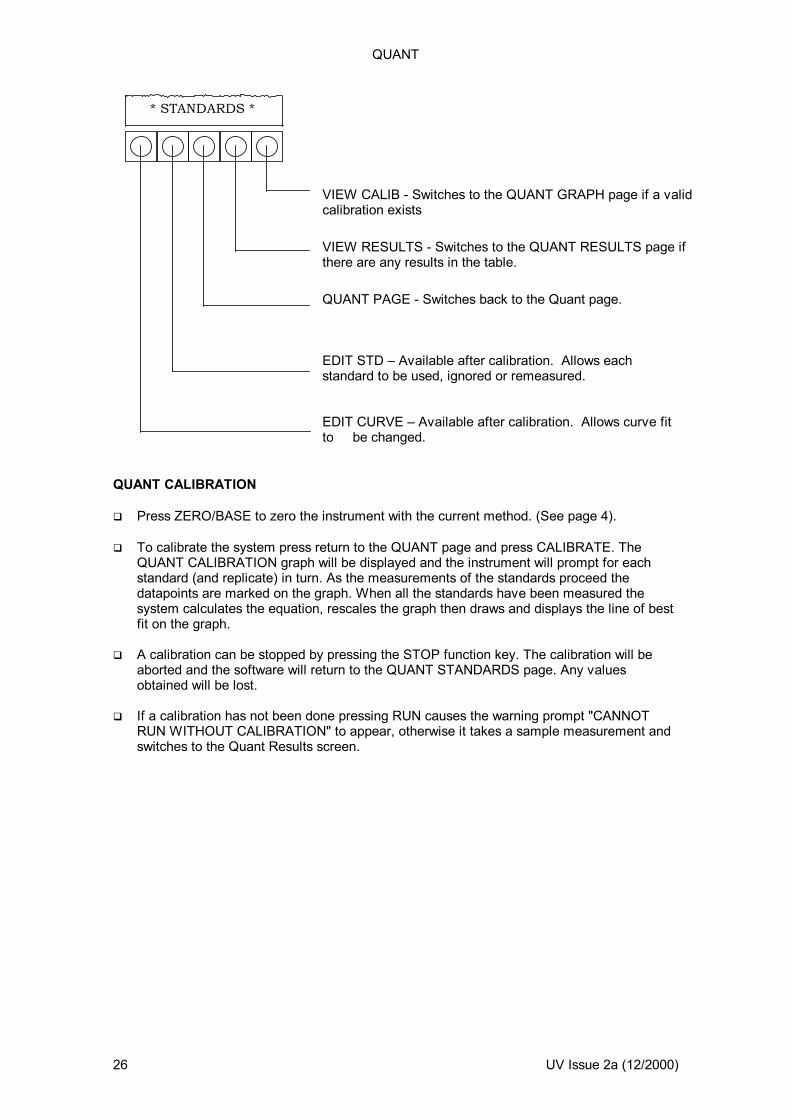
VIEW CALIB - Switches to the QUANT GRAPH page if a valid calibration exists
VIEW RESULTS - Switches to the QUANT RESULTS page if there are any results in the table.
QUANT PAGE - Switches back to the Quant page. EDIT STD – Available after calibration. Allows each standard to be used, ignored or remeasured. EDIT CURVE – Available after calibration. Allows curve fit to be changed.
QUANT CALIBRATION Press ZERO/BASE to zero the instrument with the current method. (See page 4). To calibrate the system press return to the QUANT page and press CALIBRATE. The
QUANT CALIBRATION graph will be displayed and the instrument will prompt for each standard (and replicate) in turn. As the measurements of the standards proceed the datapoints are marked on the graph. When all the standards have been measured the system calculates the equation, rescales the graph then draws and displays the line of best fit on the graph.
A calibration can be stopped by pressing the STOP function key. The calibration will be
aborted and the software will return to the QUANT STANDARDS page. Any values obtained will be lost.
If a calibration has not been done pressing RUN causes the warning prompt "CANNOT
RUN WITHOUT CALIBRATION" to appear, otherwise it takes a sample measurement and switches to the Quant Results screen.
* STANDARDS *
QUANT
UV Issue 2 (09/99) 27
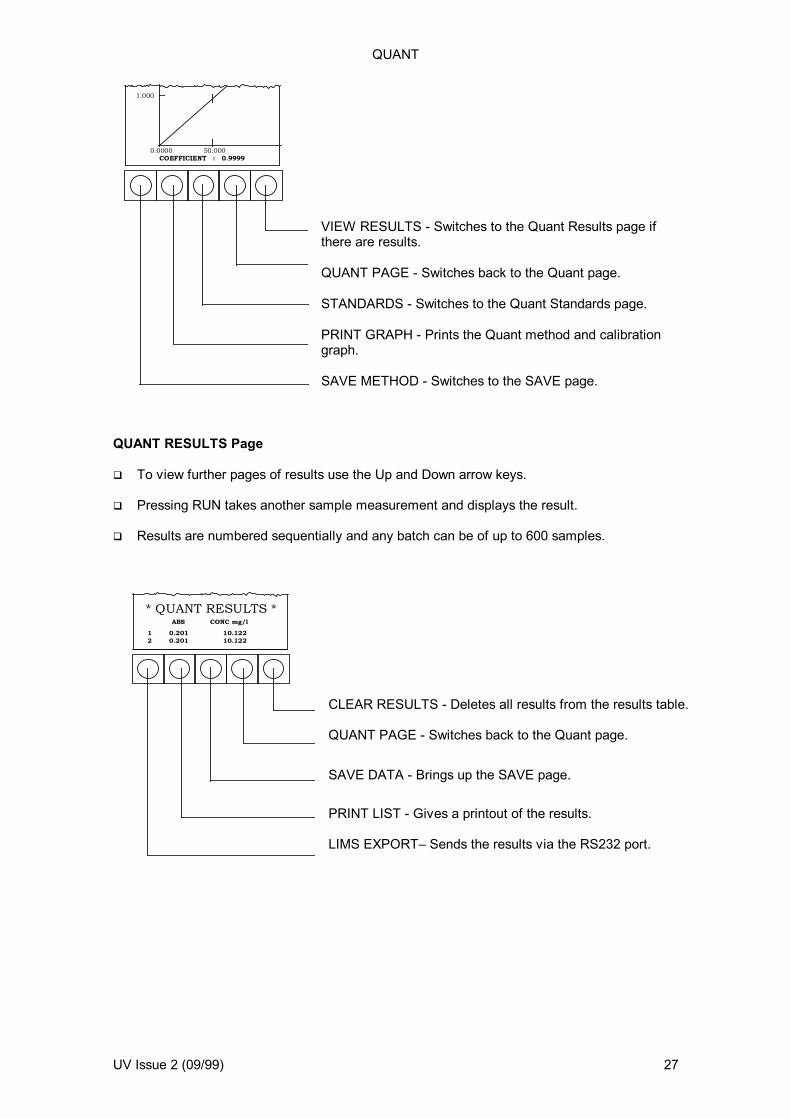
VIEW RESULTS - Switches to the Quant Results page if there are results. QUANT PAGE - Switches back to the Quant page. STANDARDS - Switches to the Quant Standards page. PRINT GRAPH - Prints the Quant method and calibration graph. SAVE METHOD - Switches to the SAVE page.
QUANT RESULTS Page To view further pages of results use the Up and Down arrow keys. Pressing RUN takes another sample measurement and displays the result. Results are numbered sequentially and any batch can be of up to 600 samples.
CLEAR RESULTS - Deletes all results from the results table. QUANT PAGE - Switches back to the Quant page.
SAVE DATA - Brings up the SAVE page.
PRINT LIST - Gives a printout of the results. LIMS EXPORT– Sends the results via the RS232 port.
0.0000 50.000
1.000
COEFFICIENT : 0.9999
* QUANT RESULTS *ABS CONC mg/l
1 0.201 10.1222 0.201 10.122

RATE
UV Issue 2a (12/2000) 28
RATE
19/01/9811:35 * RATE *
ID :WAVELENGTH : 550.0nmBANDWIDTH : 2.0nmMEASURE TIME : 00.30DELAY TIME : 00.00SLOPE : POSITIVERANGE : 0.5FACTOR : 1.000UNITS :LAMP CHANGE : 325nmOPERATOR : NameCELL PROG : AUTO
PRINTMETHOD
SAVEMETHOD
VIEWRESULTS
VIEWGRAPH
19/01/9811:35
* RATE GRAPH * 0.281A550.0nmID: TEST 1
ABS
00.00
VIEWRESULTS
MANIP-ULATE PRINT SAVE
DATARATEPAGE
0.000
0.200
0.400
00.15 00.30
19/01/98
11:35* RATE GRAPH * 0.281A
550.0nmID: TEST 1
ABS
00.00
VIEWRESULTS
MANIP-ULATE PRINT SAVE
DATARATEPAGE
0.000
0.200
0.400
00.15 00.30
MANIPULATE
TRACKSECTIONRESCALESMOOTHINGABS DISPLAYORIGINALANOTHER CELL
Press Run
19/01/9811:35
* RATE RESULTS * 0.281A550.0nmID: TEST 1
PRINT SAVEDATA
VIEWGRAPH
Initial Abs 1.281Final abs 0.567Initial Time 00:00Final Time 00:30A/Min -1.281Activity 4281Corr. Coeff. -0.987Smoothing LOW
RATEPAGE
LIMSEXPORT
19/01/9811:35
* TRACK * 0.281A550.0nmID: TEST 1
ABS
00.00
VIEWRESULTS
RATEGRAPH
CLEARALL FAST
0.000
0.200
0.400
00.15 00.30
> < > <
19/01/9811:35
* RATE RESULTS * 0.281A550.0nmID: TEST 1
PRINT SAVEDATA
VIEWGRAPH
1 2 3 4
Initial Abs 1.281 1.281 1.281 1.281Final abs 0.567 0.567 0.567 0567Initial Time 00:00 00:00 00:00 00:00Final Time 00:30 00:30 00:30 00:30A/Min -1.281 -1.281 -1.281 -1.281Activity 4281 4281 4281 4281Corr. Coeff. -0.987 -0.987 -0.987 -0.987Smoothing LOW
RATEPAGE
LIMSEXPORT

RATE
UV Issue 2a (12/2000) 29
To select Rate highlight the RATE option on the HOME PAGE and press ENTER. The
RATE Methods page is displayed and from here the instrument and analysis parameters can be set up.
Move the cursor to the required parameter using the Up/Down Arrow keys. Press ENTER to
enable a parameter to be changed. Once the method has been set up press RUN. The spectrophotometer will perform the rate
and display the result on the RATE GRAPH page. From here the data can be manipulated and saved to Disk.
RATE PARAMETERS Page Note: The current data will be lost if any of the method parameters (except for the ID,
Slope, Factor, Units and Operator name) are changed.
* RATE *
ID : TEST 1 WAVELENGTH : 340.0 nm BANDWIDTH : 2.0 nm MEASURE TIME : 00:30 DELAY TIME : 00:00 SLOPE : POSITIVE RANGE : 0.5 FACTOR : 1.000 UNITS : I/U LAMP CHANGE : 325 nm OPERATOR : Name CELL PROG : AUTO REF MODE : OFF
ID : Enter a description using the TEXT ENTRY screen. The ID identifies the method and will be saved with the method and any results produced
by the method. WAVELENGTH : Selection depends on the type of spectrophotometer Unicam UV510, 520, 530, 540 190.0nm to 900.0nm Unicam UV310, 320, 330, 340 190.0nm to 1100.0nm Unicam UV550 190.0nm to 850.0nm If a wavelength is selected that requires the Deuterium lamp then this will automatically be
switched on. Any current data will be lost if the wavelength is changed. BANDWIDTH : Selection depends on the type of spectrophotometer Unicam UV510, 520, 530, 540 Fixed at 1.5nm Unicam UV310, 320, 330, 340 Select from 4, 2, 1.5, 1, and 0.5nm Unicam UV550 Select from 4, 2, 1.5, 1, 0.5 and 0.2nm MEASURE TIME : Set a time in the range 00:05 to 99:59. This sets the time over which the sample will be measured. The range is from 5 seconds to
99 minutes and 59 seconds in steps of 1 second.

RATE
UV Issue 2a (12/2000) 30
If the cell programmer is ON then the measurement time sets the time between individual measurements on the first cell (i.e. the time for each cycle).
DELAY TIME : Set a time in the range 00:05 to 99:59. This sets the time between pressing RUN and the start of the measurement. The range is from 0 to 99 minutes and 59 seconds in steps of 1 second. SLOPE : Select from POSITIVE or NEGATIVE. Sets the graph to display positive or negative changes in Absorbance. Choose POSITIVE if
Absorbance increases with time. Choose NEGATIVE if Absorbance decreases with time. RANGE : Set a number in the range 0 to 3A. This sets the graph y-axis. Enter a number slightly larger than the change in Absorbance
expected. FACTOR : Enter the factor for Activity as a number in the range 0.001
to 9999.999. UNITS : Enters the units of Activity using the TEXT ENTRY page. Enters the required description or units of Activity up to 11 alphanumeric characters. LAMP CHANGE : Select from 315, 320, 325, 330, 335, 340, D2, W, Hg. Selects the wavelength at which the source is changed between the Tungsten and
Deuterium lamps. Selecting D2, W or Hg overrides any changeover and the selected lamp will be used regardless of the wavelength set.
THE MERCURY LAMP MUST BE SWITCHED OFF WHENEVER IT IS NOT IN USE OPERATOR : Switches to the TEXT ENTRY screen. The operator name is automatically saved with the method and any data produced by the
method. Changing the operator name will not cause the current data to be lost. If User Log-on is in operation, the operator name cannot be changed. CELL PROG : Switches to the CELL PROG. screen (if fitted). REF MODE : Toggles the status of the Cell Programmer reference mode
(if fitted).

RATE
UV Issue 2a (12/2000) 31
RATE PARAMETERS Page function keys
VIEW RESULTS - Goes to the RATE RESULTS page.
VIEW GRAPH - Goes to the RATE GRAPH page. SAVE METHOD - Brings up the SAVE page from where the method can be saved to Library or Disk.
PRINT METHOD - Prints the current method parameters on the printer.
RATE GRAPH Page
This page displays the RATE curve and allows it to be manipulated.
VIEW RESULTS - Switches to the RATE RESULTS page.
RATE PAGE - Returns to the RATE PARAMETERS page. SAVE DATA - Brings up the SAVE screen from where method and data can be saved to disk. PRINT - Provides a hardcopy of the results i.e. RATE GRAPH and RATE RESULTS. (If a Cell Programmer is fitted see the note below). MANIPULATE - Brings up the Manipulate options.
If more than one rate has been run in parallel using the Cell Programmer then three further
print options are available: ALL OVERLAY, ALL SEQUENTIAL, and ONE RESULT. ALL OVERLAY Prints the results of all cells in the run on one sheet of paper up to a
maximum of 4 results. If more than four results are present then the remainder are printed on a second sheet.
ALL SEQUENTIAL Prints each result in the run on a separate sheet of paper. ONE RESULT Prints the result currently displayed.
* RATE *
00.00 00.3000.15

RATE
UV Issue 2a (12/2000) 32
Pressing RUN starts a measurement using the current method. Pressing ZERO/BASE zeros the instrument using the wavelength specified in the current
method. (See page 4). MANIPULATE TRACK Sets the start and stop time for the rate calculations. SECTION Sets sequential start and stop times to enable rates to be calculated on up to
four sections of the rate curve. RESCALE Changes y-axis scale automatically or manually. SMOOTHING Allows three levels of smoothing to be applied to the Rate Curve. ABS DISPLAY Sets the display of absolute absorbance values or absorbances relative to the first measurement(s) of the run. ORIGINAL Resets the graph to display the data as originally collected. ANOTHER CELL Only present if the Cell Programmer has been used. Enables the
results of another cell from the same run to be displayed. TRACK To move the vertical cursor across the screen use the Left and Right Arrow keys. The
cursor always moves to a data point regardless of the displayed scales. Pressing ENTER places a marker at the current time.
To delete a marker, place the cursor on the marker and press CLEAR. The x-axis values are used to recalculate the rate of change of Absorbance between the
new start and stop times. Results are listed on the RATE RESULTS page. Up to four discrete pairs of cursors can be placed on the graph. Arrows are placed on the cursors and results are displayed on the RATE RESULTS page for those parts of the graph indicated by the arrows. Selecting SECTION will remove the TRACK markers. The minimum interval between TRACK cursors is one second.
MANIPULATE TRACK SECTION RESCALE SMOOTHING ABS DISPLAY ORIGINAL ANOTHER CELL

RATE
UV Issue 2a (12/2000) 33
VIEW RESULTS - Switches to the RATE RESULTS page. FAST/SLOW - Toggles between two cursor speeds. In FAST mode the cursor jumps 5% of the graph or to the next data point whichever is the greater. In SLOW mode the cursor jumps to the next data point or the next display pixel whichever is the greater.The function key label shows the next speed ie the opposite to the one selected. CLEAR ALL - Clears all the markers. RATE GRAPH - Returns to the RATE GRAPH page.
SECTION To move the vertical cursor across the screen use the Left and Right Arrow keys. The
cursor always moves to a data point regardless of the displayed scales. Pressing ENTER places a marker at the current time.
To delete a marker place the cursor on the marker and press CLEAR. Up to five markers can be placed on the graph. Rate results will be reported between markers providing a maximum of four sets of results (Sections). The minimum Section size is one second. Results are listed on the RATE RESULTS page. Selecting TRACK will remove the SECTION markers. RESCALE This option gives a pop-up menu for changing the graph y -axis scale. Move the cursor to one of the options and press ENTER to select an operation. The rescale options depend on whether Absolute or Relative Absorbance has been selected. Absolute Absorbance:
AUTO - Displays the RATE GRAPH with the y-axis rescaled so that the trace fills the screen. GRAPH HIGH, GRAPH LOW – Allow the user to set the upper and lower limits for the RATE GRAPH y-axis.
* TRACK *
RESCALE AUTO GRAPH HIGH GRAPH LOW

RATE
UV Issue 2a (12/2000) 34
Relative Absorbance:
AUTO - Displays the RATE GRAPH with the y-axis rescaled so that the trace fills the screen. RANGE - Allows the user to set the upper y-axis value.
ABS DISPLAY This option enables the RATE GRAPH to be redisplayed with Absolute Absorbance or
Relative Absorbance values. SMOOTHING This option offers a pop-up menu to choose one of three smoothing algorithms. Choices
are NONE, LOW, MEDIUM and HIGH. A moving point average is performed on the data and in each case data points will be lost from either end of the data.
SMOOTHING No of POINTS POINTS LOST AT USED EACH END NONE 0 0 LOW 9 4 MEDIUM 17 8 HIGH 37 18 ORIGINAL This removes any manipulation and displays the rate graph as originally specified by the rate method. ANOTHER CELL If more than one rate has been run in parallel using the Cell Programmer then this function
allows the results from any cell in the run to be selected and displayed. Enter the number of cells you wish to display.
RATE RESULTS Page The Rate Results page displays the Initial and Final Absorbance, Initial and Final Time, the
change in absorbance per minute, calculated Activity, Correlation Coefficient of the best fit line and finally the smoothing parameter used.
If the rate curve has been tracked the Initial and Final Absorbance with the Initial and Final Time will reflect those chosen by the two cursors. Shown below is the Rate Results page after choosing 'SECTION' and the three sets of data represent results calculated for each section. A similar display will be seen with TRACK.
RESCALE AUTO RANGE

RATE
UV Issue 2a (12/2000) 35
VIEW GRAPH - Returns to the RATE GRAPH page. RATE PAGE - Returns to the RATE PARAMETERS page.
SAVE DATA - Brings up the SAVE screen from where method and data can be saved to disk.
PRINT - Provides a hardcopy of the results i.e. RATE GRAPH and RATE RESULTS.
LIMS EXPORT – Sends the results via the RS232 port.
Parallel Rate Measurements using the Cell Programmer The 8 Cell Programmer can be used in conjunction with the RATE software to measure
between 2 and 8 cells in parallel. For the Cell Programmer to be used it must be ON with MODE set to AUTO. The RATE METHOD setup and MANIPULATE functions are exactly the same except that
the MEASURE TIME now sets the time between each cycle, i.e. the length of time between measurements on the first cell. The number of measurements taken on each cell is set by the CELL CYCLES parameter on the cell programmer page. The total time over which the measurements are made is the result of the time between measurements (MEASURE TIME) and the number of measurements (CELL CYCLES). For example an analysis using 4 cells with MEASURE TIME set to 15 seconds and CELL CYCLES set to 20 would give a total measurement time of 5 minutes.
To set up a parallel rate method do the following: Set up the method as normal on the RATE PARAMETERS page. Note that MEASURE TIME specifies the time between each measurement on the first cell. Go to the Cell Programmer page. Press HOME then ACCESSORIES and select CELL
PROG. Set up the cell programmer method as required. Return to the RATE PARAMETERS page, press ZERO/BASE to zero the instrument (if
required) then press RUN. The analysis will proceed with the rate graph for the first cell being drawn on screen. To view the result of any other cell press MANIPULATE on the RATE GRAPH page and
select ANOTHER CELL. The cell number currently displayed is shown to the right of the ID: line.
* RATE RESULTS * 1 2 3
Initial Abs 1.281 0.992 0.662Final Abs 0.992 0.662 0.512Initial Time 00:00 00:10 00:40Final Time 00:10 00:40 01:00 A/Min -1.734 -0.660 -0.450Activity 4281 1630 1111Corr. Coeff. -0.987 -0.995 -0.952Smoothing LOW LOW LOW
RATE
UV Issue 2a (12/2000) 36
To print the results press PRINT on either the RATE GRAPH page or the RATE RESULTS page.
Three further print options are available: ALL OVERLAY, ALL SEQUENTIAL, and ONE RESULT. ALL OVERLAY Prints the results of all cells in the run together in batches of 4. TRACK
and SECTION markers are not included. ALL SEQUENTIAL Prints each result in the run separately. TRACK and SECTION markers
are included. ONE RESULT Prints the result currently displayed. TRACK and SECTION markers
are included.
MCA
UV Issue 2a (12/2000) 37
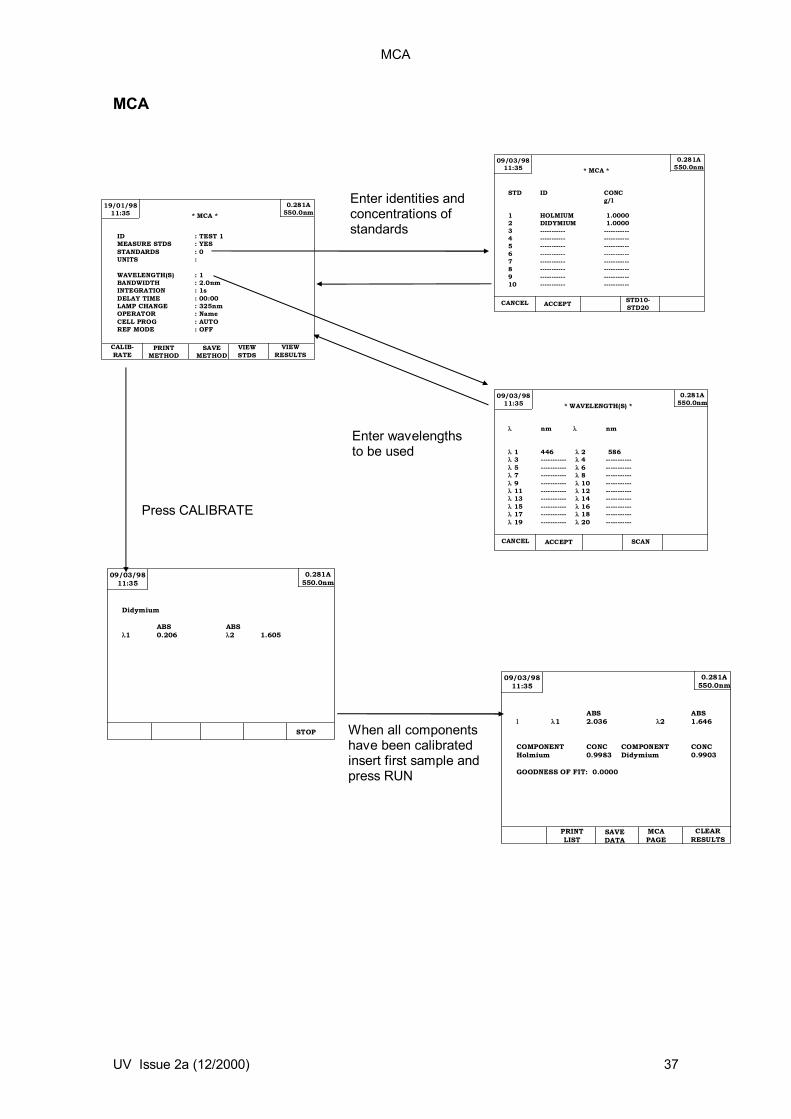
MCA
09/03/9811:35
0.281A550.0nm* MCA *
ACCEPT STD10-STD20
CANCEL
STD ID CONCg/l
1 HOLMIUM 1.00002 DIDYMIUM 1.00003 ----------- -----------4 ----------- -----------5 ----------- -----------6 ----------- -----------7 ----------- -----------8 ----------- -----------9 ----------- -----------10 ----------- -----------
19/01/9811:35
0.281A550.0nm* MCA *
ID : TEST 1MEASURE STDS : YESSTANDARDS : 0UNITS :
WAVELENGTH(S) : 1BANDWIDTH : 2.0nmINTEGRATION : 1sDELAY TIME : 00:00LAMP CHANGE : 325nmOPERATOR : NameCELL PROG : AUTOREF MODE : OFF
PRINTMETHOD
SAVEMETHOD
VIEWSTDS
VIEWRESULTS
CALIB-RATE
Enter identities and concentrations of standards
09/03/9811:35
0.281A550.0nm* WAVELENGTH(S) *
ACCEPT SCANCANCEL
nm nm
1 446 2 586 3 ----------- 4 ----------- 5 ----------- 6 ----------- 7 ----------- 8 ----------- 9 ----------- 10 ----------- 11 ----------- 12 ----------- 13 ----------- 14 ----------- 15 ----------- 16 ----------- 17 ----------- 18 ----------- 19 ----------- 20 -----------
Enter wavelengths to be used
Press CALIBRATE
09/03/9811:35
0.281A550.0nm
Didymium
ABS ABS1 0.206 2 1.605
STOP
09/03/9811:35
0.281A550.0nm
ABS ABS 1 2.036 2 1.646
COMPONENT CONC COMPONENT CONCHolmium 0.9983 Didymium 0.9903
GOODNESS OF FIT: 0.0000
CLEARRESULTS
PRINTLIST
SAVEDATA
MCAPAGE
When all components have been calibrated insert first sample and press RUN
MCA
38 UV Issue 2 (09/99)
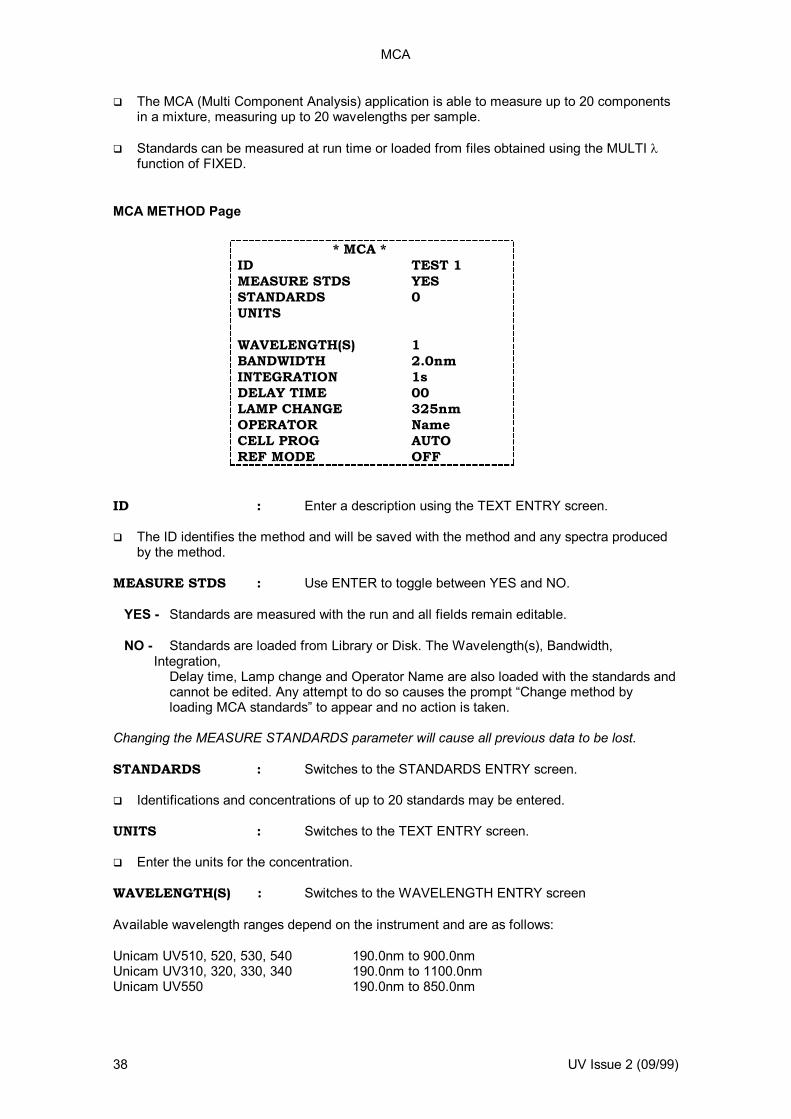
The MCA (Multi Component Analysis) application is able to measure up to 20 components in a mixture, measuring up to 20 wavelengths per sample.
Standards can be measured at run time or loaded from files obtained using the MULTI
function of FIXED. MCA METHOD Page
ID : Enter a description using the TEXT ENTRY screen. The ID identifies the method and will be saved with the method and any spectra produced
by the method. MEASURE STDS : Use ENTER to toggle between YES and NO.
YES - Standards are measured with the run and all fields remain editable. NO - Standards are loaded from Library or Disk. The Wavelength(s), Bandwidth,
Integration, Delay time, Lamp change and Operator Name are also loaded with the standards and
cannot be edited. Any attempt to do so causes the prompt “Change method by loading MCA standards” to appear and no action is taken.
Changing the MEASURE STANDARDS parameter will cause all previous data to be lost.
STANDARDS : Switches to the STANDARDS ENTRY screen. Identifications and concentrations of up to 20 standards may be entered. UNITS : Switches to the TEXT ENTRY screen. Enter the units for the concentration. WAVELENGTH(S) : Switches to the WAVELENGTH ENTRY screen Available wavelength ranges depend on the instrument and are as follows: Unicam UV510, 520, 530, 540 190.0nm to 900.0nm Unicam UV310, 320, 330, 340 190.0nm to 1100.0nm Unicam UV550 190.0nm to 850.0nm
* MCA * ID TEST 1 MEASURE STDS YES STANDARDS 0 UNITS WAVELENGTH(S) 1 BANDWIDTH 2.0nm INTEGRATION 1s DELAY TIME 00 LAMP CHANGE 325nm OPERATOR Name CELL PROG AUTO REF MODE OFF
MCA
UV Issue 2a (12/2000) 39
If the wavelength requires the Deuterium lamp then this will be switched on. The current data will be lost if the wavelength is changed. BANDWIDTH : Selection depends on the type of spectrophotometer Unicam UV510, 520, 530, 540 Fixed at 1.5nm Unicam UV310, 320, 330, 340 Select from 4, 2, 1.5, 1, and 0.5nm Unicam UV550 Select from 4, 2, 1.5, 1, 0.5 and 0.2nm INTEGRATION : Enter integration time in seconds. This sets the integration time for which the result is measured. The minimum is 1s, and the
maximum is 9999s. The current data will be lost if the integration time is changed. DELAY TIME : Set a time in the range 00.00 to 99.59, using . to separate minutes and seconds. The number of seconds must always be entered explicitly. This sets the time between pressing RUN and the start of the measurement. The range is
from 0 to 99 minutes and 59 seconds.This field is only available if UVCalc has been installed.
LAMP CHANGE : Select from 315, 320, 325, 330, 335, 340, D2, W, Hg. Selects the wavelength at which the source is changed between the Tungsten and
Deuterium lamps. Selecting D2, W or Hg overrides any changeover and the selected lamp will be used regardless of the wavelength set.
THE MERCURY LAMP MUST BE SWITCHED OFF WHENEVER IT IS NOT IN USE The current data will be lost if the lamp change parameters are changed. OPERATOR : Switches to the TEXT ENTRY screen. The operator name is automatically saved with the method and any data produced by the
method. Changing the operator name will not cause any current data to be lost. If User Log-on is in operation, the operator name cannot be changed. CELL PROG : Switches to the CELL PROG. screen (if fitted). REF MODE : Toggles the status of the Cell Programmer Reference Mode
(if fitted).
MCA
40 UV Issue 2 (09/99)
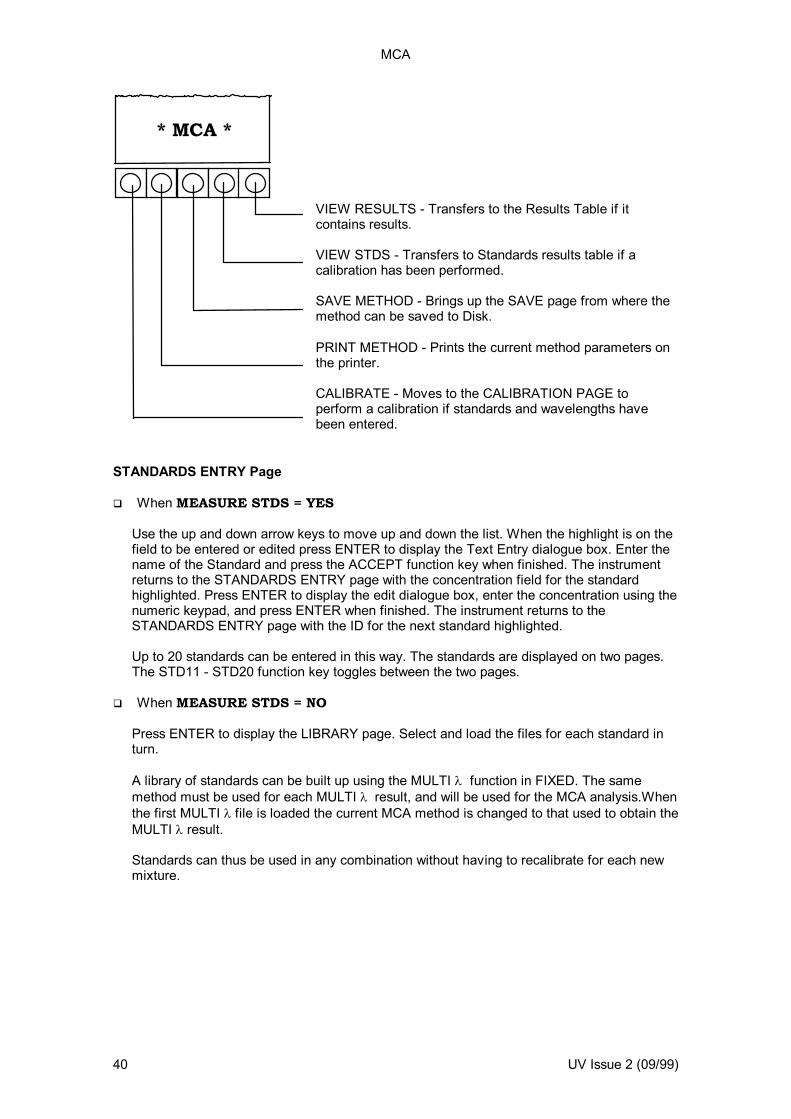
VIEW RESULTS - Transfers to the Results Table if it contains results. VIEW STDS - Transfers to Standards results table if a calibration has been performed. SAVE METHOD - Brings up the SAVE page from where the method can be saved to Disk.
PRINT METHOD - Prints the current method parameters on the printer. CALIBRATE - Moves to the CALIBRATION PAGE to perform a calibration if standards and wavelengths have been entered.
STANDARDS ENTRY Page
When MEASURE STDS = YES
Use the up and down arrow keys to move up and down the list. When the highlight is on the field to be entered or edited press ENTER to display the Text Entry dialogue box. Enter the name of the Standard and press the ACCEPT function key when finished. The instrument returns to the STANDARDS ENTRY page with the concentration field for the standard highlighted. Press ENTER to display the edit dialogue box, enter the concentration using the numeric keypad, and press ENTER when finished. The instrument returns to the STANDARDS ENTRY page with the ID for the next standard highlighted.
Up to 20 standards can be entered in this way. The standards are displayed on two pages. The STD11 - STD20 function key toggles between the two pages.
When MEASURE STDS = NO
Press ENTER to display the LIBRARY page. Select and load the files for each standard in turn. A library of standards can be built up using the MULTI function in FIXED. The same method must be used for each MULTI result, and will be used for the MCA analysis.When the first MULTI file is loaded the current MCA method is changed to that used to obtain the MULTI result. Standards can thus be used in any combination without having to recalibrate for each new mixture.
* MCA *
MCA
UV Issue 2a (12/2000) 41
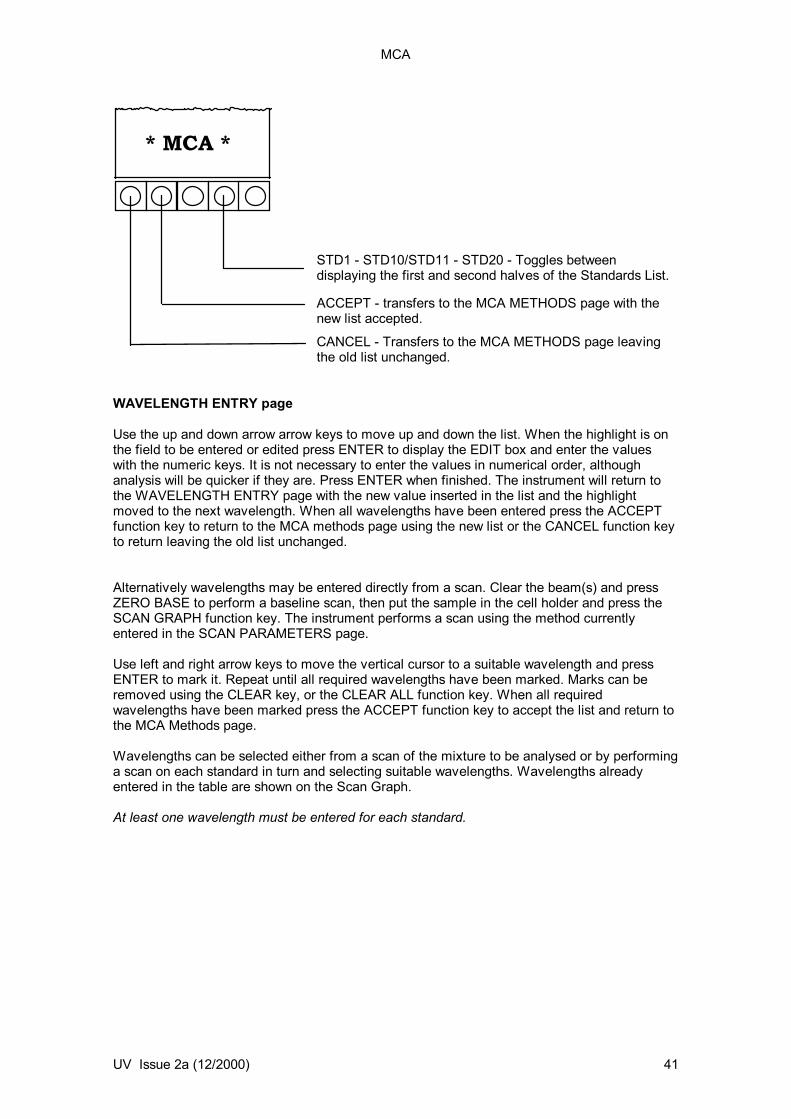
STD1 - STD10/STD11 - STD20 - Toggles between displaying the first and second halves of the Standards List. ACCEPT - transfers to the MCA METHODS page with the new list accepted.
CANCEL - Transfers to the MCA METHODS page leaving the old list unchanged.
WAVELENGTH ENTRY page Use the up and down arrow arrow keys to move up and down the list. When the highlight is on the field to be entered or edited press ENTER to display the EDIT box and enter the values with the numeric keys. It is not necessary to enter the values in numerical order, although analysis will be quicker if they are. Press ENTER when finished. The instrument will return to the WAVELENGTH ENTRY page with the new value inserted in the list and the highlight moved to the next wavelength. When all wavelengths have been entered press the ACCEPT function key to return to the MCA methods page using the new list or the CANCEL function key to return leaving the old list unchanged. Alternatively wavelengths may be entered directly from a scan. Clear the beam(s) and press ZERO BASE to perform a baseline scan, then put the sample in the cell holder and press the SCAN GRAPH function key. The instrument performs a scan using the method currently entered in the SCAN PARAMETERS page. Use left and right arrow keys to move the vertical cursor to a suitable wavelength and press ENTER to mark it. Repeat until all required wavelengths have been marked. Marks can be removed using the CLEAR key, or the CLEAR ALL function key. When all required wavelengths have been marked press the ACCEPT function key to accept the list and return to the MCA Methods page. Wavelengths can be selected either from a scan of the mixture to be analysed or by performing a scan on each standard in turn and selecting suitable wavelengths. Wavelengths already entered in the table are shown on the Scan Graph. At least one wavelength must be entered for each standard.
* MCA *
MCA
42 UV Issue 2 (09/99)
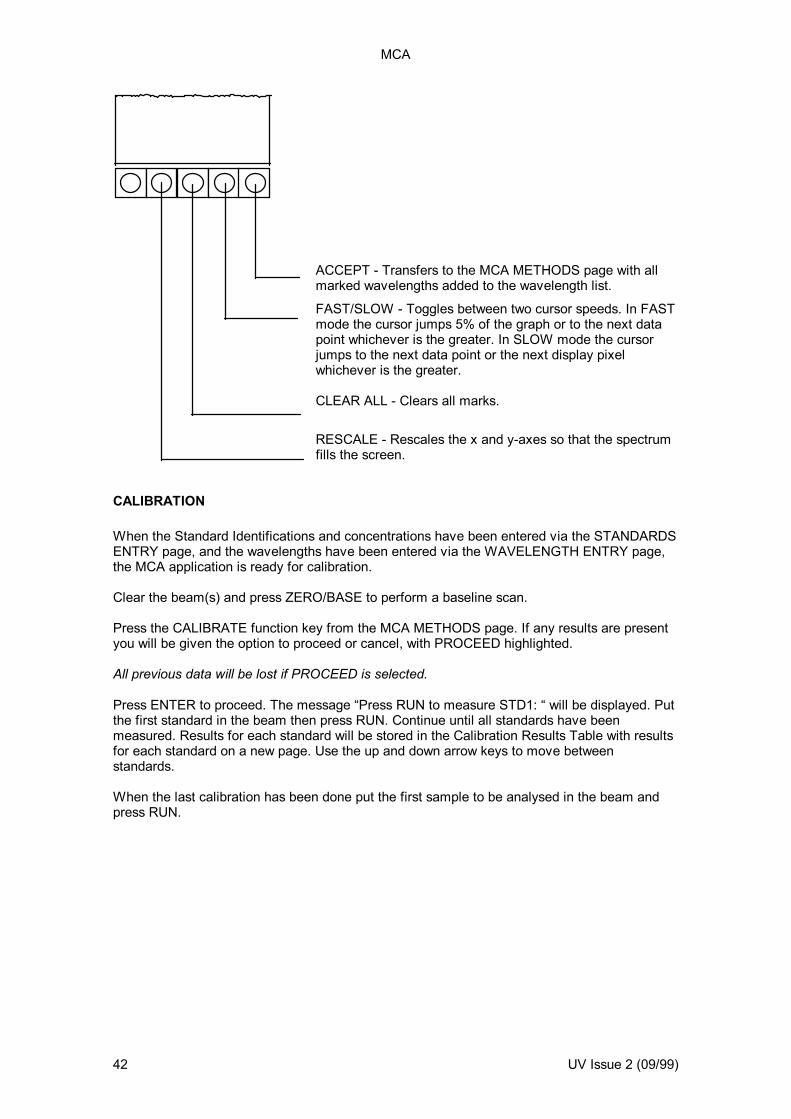
ACCEPT - Transfers to the MCA METHODS page with all marked wavelengths added to the wavelength list.
FAST/SLOW - Toggles between two cursor speeds. In FAST mode the cursor jumps 5% of the graph or to the next data point whichever is the greater. In SLOW mode the cursor jumps to the next data point or the next display pixel whichever is the greater. CLEAR ALL - Clears all marks.
RESCALE - Rescales the x and y-axes so that the spectrum fills the screen.
CALIBRATION When the Standard Identifications and concentrations have been entered via the STANDARDS ENTRY page, and the wavelengths have been entered via the WAVELENGTH ENTRY page, the MCA application is ready for calibration. Clear the beam(s) and press ZERO/BASE to perform a baseline scan. Press the CALIBRATE function key from the MCA METHODS page. If any results are present you will be given the option to proceed or cancel, with PROCEED highlighted. All previous data will be lost if PROCEED is selected. Press ENTER to proceed. The message “Press RUN to measure STD1: “ will be displayed. Put the first standard in the beam then press RUN. Continue until all standards have been measured. Results for each standard will be stored in the Calibration Results Table with results for each standard on a new page. Use the up and down arrow keys to move between standards. When the last calibration has been done put the first sample to be analysed in the beam and press RUN.

MCA
UV Issue 2a (12/2000) 43
ANALYSING A SAMPLE When a calibration has been performed or loaded with the method the MCA application is ready to use. When RUN is pressed from the METHOD or RESULTS pages the instrument will measure the absorbance of the sample at each of the wavelengths specified in the method and compare with the absorbances of the standards at these wavelengths. The concentrations of each component are calculated and displayed on the results page. Results for each sample are displayed on a new page. Use the up and down arrow keys to move through the pages of results.
CLEAR RESULTS - Clears the results table.
MCA PAGE - Returns to the MCA METHOD page. SAVE DATA - Displays the SAVE page from which the results can be saved to Library or Disk. PRINT LIST - Prints the list on the selected printer
SETUP
UV Issue 2a (12/2000) 47
SETUP
19/01/9811:35
UNICAM UV310 v5.0 66.55%T432.1nm
SETUPPAGE
* CLOCK *
CANCEL ACCEPT
* TIME *
HOURS : 16MINS : 32
* DATE *
DAY : 25MONTH : 03YEAR : 98
19/01/9811:35
UNICAM UV310 v5.0 66.55%T432.1nm SERIAL No 100661
CAL.VAL.
ACCESS-ORIES REMOTESETUP
* HOME *
SCANFIXEDQUANTRATEMCALIBRARY
INSTRUMENT HOURS 12345
19/01/98
11:35UNICAM UV510 v5.0 66.55%T
432.1nm
* EHT CALIBRATION *
EHT TABLE NORMAL
EHT TABLE
NORMALHIGH ABSFLAT
SETUPPAGE
CALIB-RATE
19/01/9811:35
UNICAM UV510 v5.0 66.55%T432.1nm
* SETUP *
CLOCKEHTPRINTERENVIRONMENTWAVELENGTHINITIALISEWHITE LIGHT
LAMPS 19/01/9811:35
UNICAM UV310 v5.0 66.55%T432.1nm
SETUPPAGE
* WAVELENGTH CALIBRATION *
CALIBRATION : USING Hg LAMP
CALIBRATION COMPLETED
CALIBR-RATE
19/01/9811:35
UNICAM UV310 v5.0 66.55%T432.1nm
SETUPPAGE
* PRINTERS *
PRINTER TYPE : HP MONO
PRINTER
EPSON 9 PINHP LASERJETHP MONOHP PAINTJETHP PLOTTERHP 690CHP 400
19/01/98
11:35UNICAM UV310 v5.0 66.55%T
432.1nm
INITIALISATION TYPE : OPTICSINITIALISE WITH D2 : OFF
INITIALISE
OPTICSBASELINE
SETUPPAGE
INITI-ALISE
* INITIALISE *
19/01/9811:35
UNICAM UV310 v5.0 66.55%T432.1nm
SETUPPAGE
* ENVIRONMENT *
LANGUAGE : ENGLISHSOUND : OFFDATE FORMAT : dd/MM/yyAUTOMATIC CAL. VAL. : OFFDEFAULT FILE TYPE : NORMALCVU WAVELENGTH TEST : FILTERLIMS SUPPORT : OFFUSE SAMPLE IDS : SEEDEDSAMPLE ID :SAMPLE ID SEED : 5AUTOSAVE RESULTS : OFFAUTOPRINT RESULTS : OFFUSER LOG-ON : OFFHISTORY FILE : ON
UVCALCOFF
19/01/9811:35
UNICAM UV310 v5.0 66.55%T432.1nm
* LAMPS *
SWITCHD2 ENERGY RESET
HOURS
TUNGSTEN : ON HOURS : 54321 ENERGY : 91%
D2 : OFF HOURS : 1234 ENERGY : 0%
Hg : OFF HOURS : 2 ENERGY : 0%
SWITCHHg
19/01/9811:35
UNICAM UV310 v5.0 66.55%T432.1nm
SETUPPAGE
INITI-ALISE
* WHITE LIGHT *
SETUP
48 UV Issue 2a (12/2000)
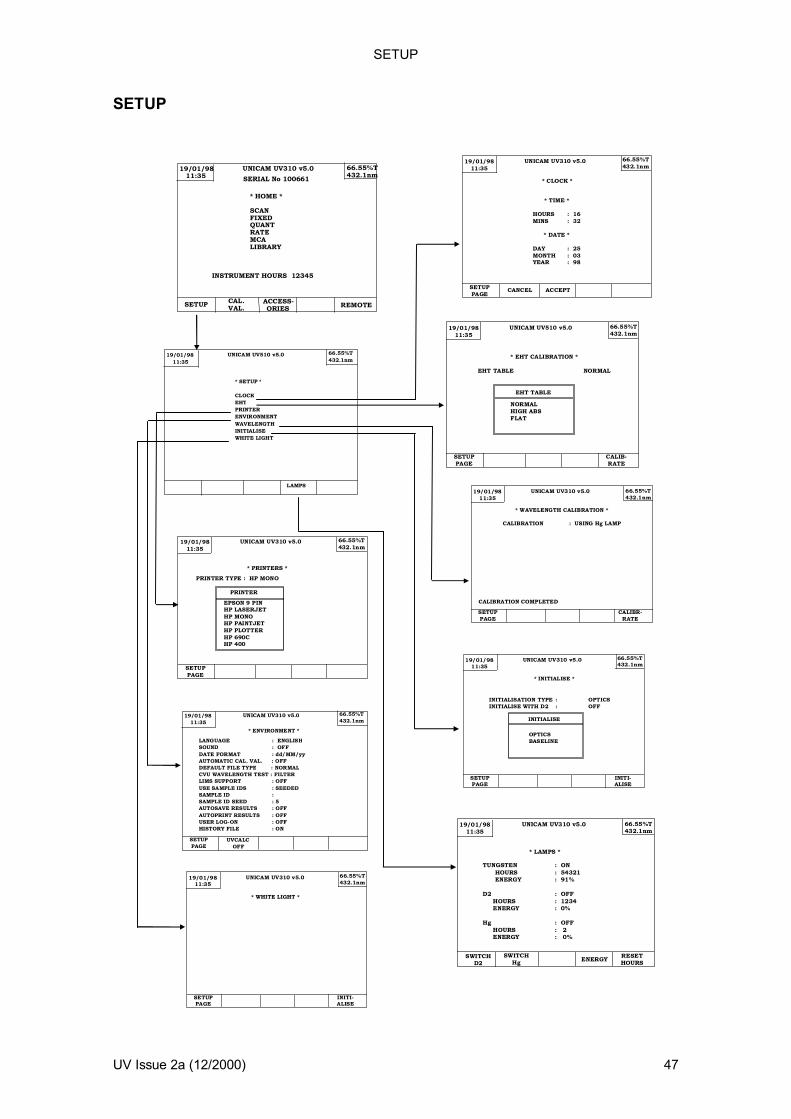
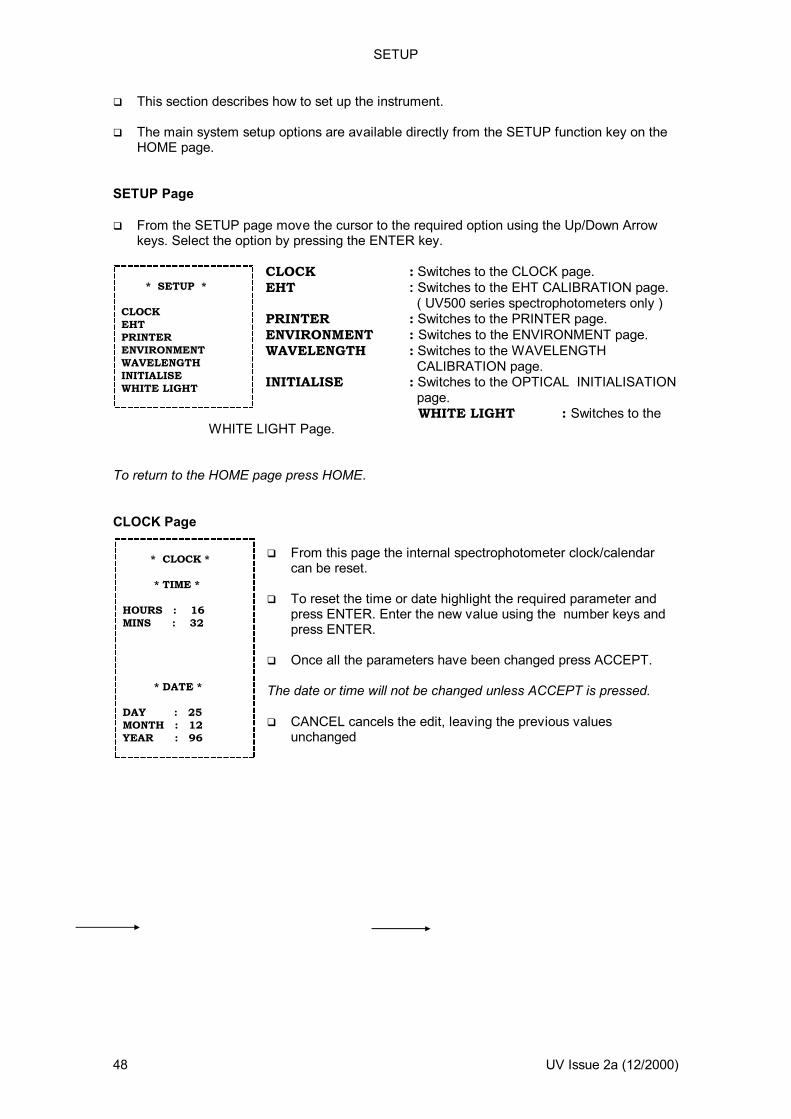
This section describes how to set up the instrument. The main system setup options are available directly from the SETUP function key on the
HOME page. SETUP Page From the SETUP page move the cursor to the required option using the Up/Down Arrow
keys. Select the option by pressing the ENTER key.
CLOCK : Switches to the CLOCK page. EHT : Switches to the EHT CALIBRATION page.
( UV500 series spectrophotometers only ) PRINTER : Switches to the PRINTER page. ENVIRONMENT : Switches to the ENVIRONMENT page. WAVELENGTH : Switches to the WAVELENGTH CALIBRATION page. INITIALISE : Switches to the OPTICAL INITIALISATION
page. WHITE LIGHT : Switches to the
WHITE LIGHT Page. To return to the HOME page press HOME. CLOCK Page
From this page the internal spectrophotometer clock/calendar
can be reset. To reset the time or date highlight the required parameter and
press ENTER. Enter the new value using the number keys and press ENTER.
Once all the parameters have been changed press ACCEPT. The date or time will not be changed unless ACCEPT is pressed. CANCEL cancels the edit, leaving the previous values
unchanged
* SETUP * CLOCK EHT PRINTER ENVIRONMENT WAVELENGTH INITIALISE WHITE LIGHT
* CLOCK * * TIME * HOURS : 16 MINS : 32 * DATE * DAY : 25 MONTH : 12 YEAR : 96
SETUP
UV Issue 2a (12/2000) 49
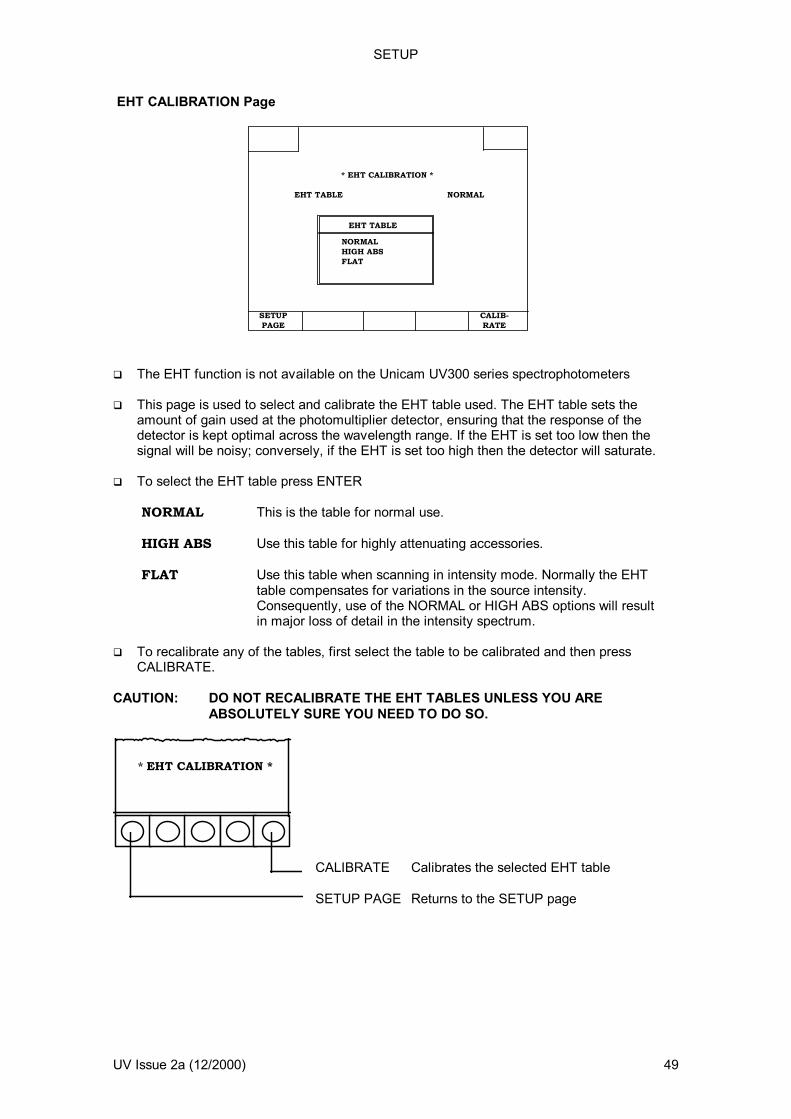
EHT CALIBRATION Page
The EHT function is not available on the Unicam UV300 series spectrophotometers This page is used to select and calibrate the EHT table used. The EHT table sets the
amount of gain used at the photomultiplier detector, ensuring that the response of the detector is kept optimal across the wavelength range. If the EHT is set too low then the signal will be noisy; conversely, if the EHT is set too high then the detector will saturate.
To select the EHT table press ENTER
NORMAL This is the table for normal use. HIGH ABS Use this table for highly attenuating accessories. FLAT Use this table when scanning in intensity mode. Normally the EHT table compensates for variations in the source intensity. Consequently, use of the NORMAL or HIGH ABS options will result in major loss of detail in the intensity spectrum.
To recalibrate any of the tables, first select the table to be calibrated and then press CALIBRATE.
CAUTION: DO NOT RECALIBRATE THE EHT TABLES UNLESS YOU ARE ABSOLUTELY SURE YOU NEED TO DO SO.
CALIBRATE Calibrates the selected EHT table SETUP PAGE Returns to the SETUP page
* EHT CALIBRATION *
EHT TABLE NORMAL
EHT TABLE
NORMALHIGH ABSFLAT
SETUPPAGE
CALIB-RATE
* EHT CALIBRATION *
SETUP
50 UV Issue 2a (12/2000)
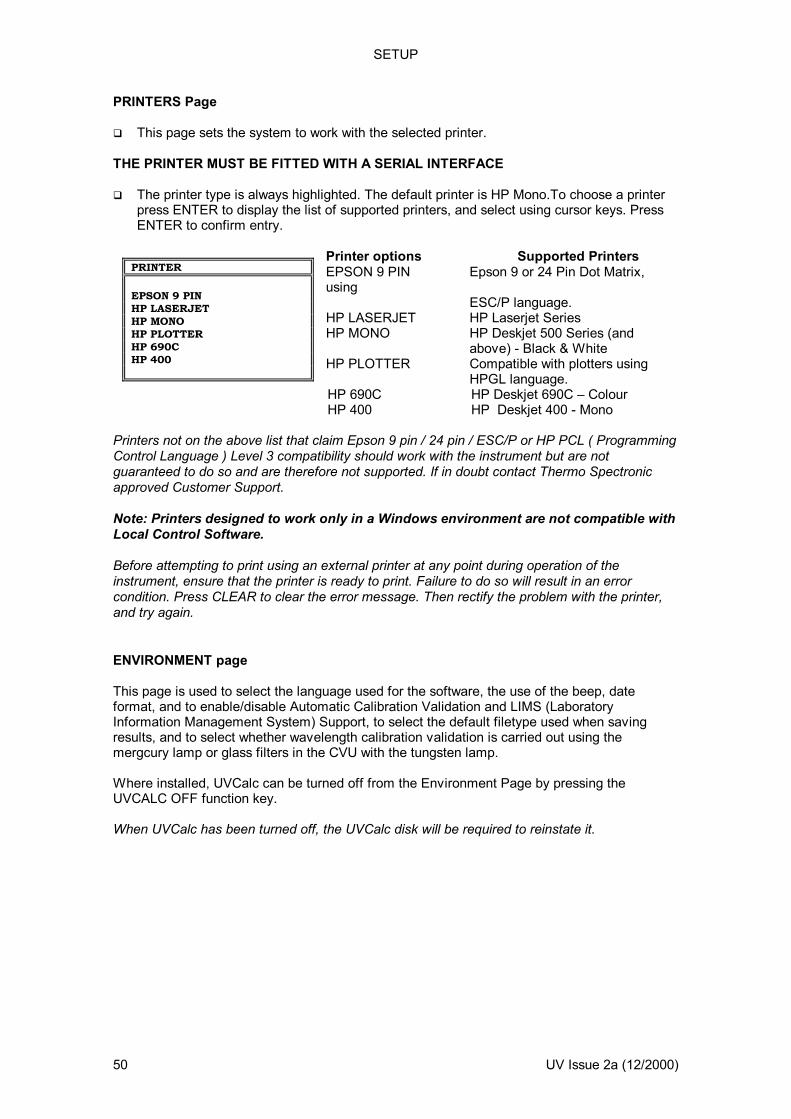
PRINTERS Page This page sets the system to work with the selected printer. THE PRINTER MUST BE FITTED WITH A SERIAL INTERFACE The printer type is always highlighted. The default printer is HP Mono.To choose a printer
press ENTER to display the list of supported printers, and select using cursor keys. Press ENTER to confirm entry.
Printer options Supported Printers EPSON 9 PIN Epson 9 or 24 Pin Dot Matrix, using
ESC/P language. HP LASERJET HP Laserjet Series HP MONO HP Deskjet 500 Series (and above) - Black & White HP PLOTTER Compatible with plotters using HPGL language.
HP 690C HP Deskjet 690C – Colour HP 400 HP Deskjet 400 - Mono
Printers not on the above list that claim Epson 9 pin / 24 pin / ESC/P or HP PCL ( Programming Control Language ) Level 3 compatibility should work with the instrument but are not guaranteed to do so and are therefore not supported. If in doubt contact Thermo Spectronic approved Customer Support. Note: Printers designed to work only in a Windows environment are not compatible with Local Control Software. Before attempting to print using an external printer at any point during operation of the instrument, ensure that the printer is ready to print. Failure to do so will result in an error condition. Press CLEAR to clear the error message. Then rectify the problem with the printer, and try again. ENVIRONMENT page This page is used to select the language used for the software, the use of the beep, date format, and to enable/disable Automatic Calibration Validation and LIMS (Laboratory Information Management System) Support, to select the default filetype used when saving results, and to select whether wavelength calibration validation is carried out using the mergcury lamp or glass filters in the CVU with the tungsten lamp. Where installed, UVCalc can be turned off from the Environment Page by pressing the UVCALC OFF function key. When UVCalc has been turned off, the UVCalc disk will be required to reinstate it.
PRINTER EPSON 9 PIN HP LASERJET HP MONO HP PLOTTER HP 690C HP 400
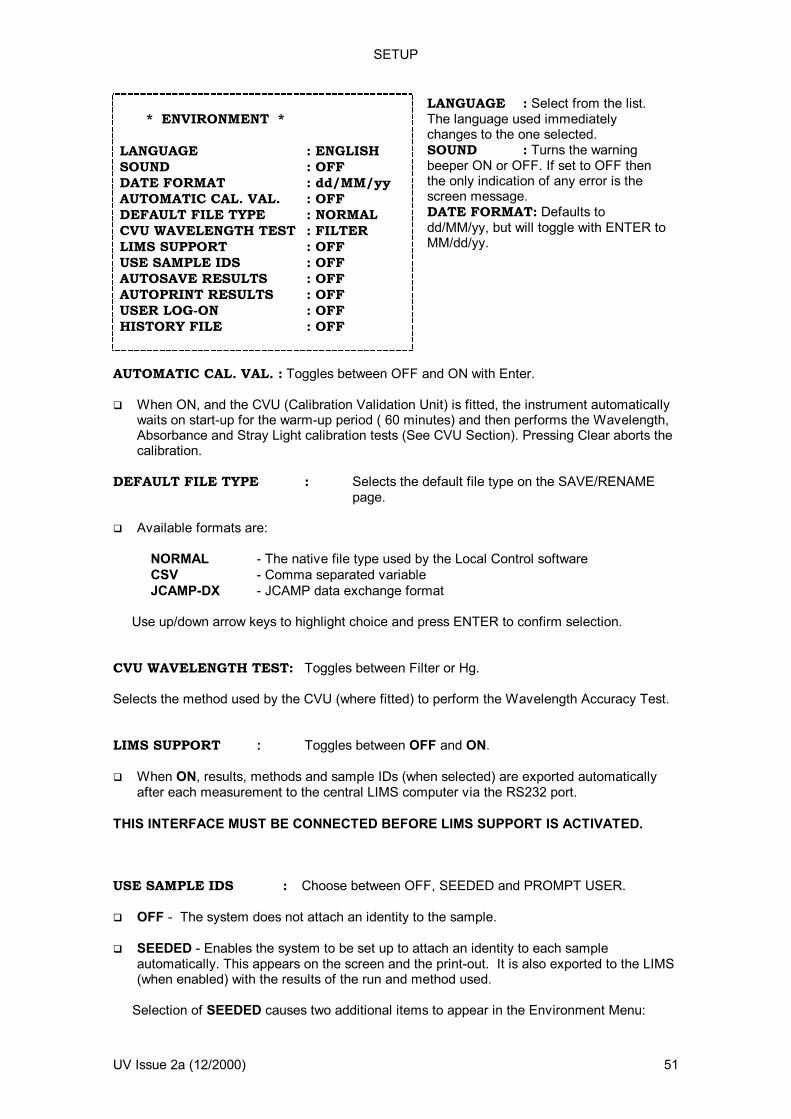
SETUP
UV Issue 2a (12/2000) 51
AUTOMATIC CAL. VAL. : Toggles between OFF and ON with Enter. When ON, and the CVU (Calibration Validation Unit) is fitted, the instrument automatically
waits on start-up for the warm-up period ( 60 minutes) and then performs the Wavelength, Absorbance and Stray Light calibration tests (See CVU Section). Pressing Clear aborts the calibration.
DEFAULT FILE TYPE : Selects the default file type on the SAVE/RENAME
page. Available formats are:
NORMAL - The native file type used by the Local Control software CSV - Comma separated variable JCAMP-DX - JCAMP data exchange format
Use up/down arrow keys to highlight choice and press ENTER to confirm selection. CVU WAVELENGTH TEST: Toggles between Filter or Hg. Selects the method used by the CVU (where fitted) to perform the Wavelength Accuracy Test. LIMS SUPPORT : Toggles between OFF and ON. When ON, results, methods and sample IDs (when selected) are exported automatically
after each measurement to the central LIMS computer via the RS232 port. THIS INTERFACE MUST BE CONNECTED BEFORE LIMS SUPPORT IS ACTIVATED. USE SAMPLE IDS : Choose between OFF, SEEDED and PROMPT USER. OFF - The system does not attach an identity to the sample. SEEDED - Enables the system to be set up to attach an identity to each sample
automatically. This appears on the screen and the print-out. It is also exported to the LIMS (when enabled) with the results of the run and method used.
Selection of SEEDED causes two additional items to appear in the Environment Menu:
LANGUAGE : Select from the list. The language used immediately changes to the one selected. SOUND : Turns the warning beeper ON or OFF. If set to OFF then the only indication of any error is the screen message. DATE FORMAT: Defaults to dd/MM/yy, but will toggle with ENTER to MM/dd/yy.
* ENVIRONMENT *
LANGUAGE : ENGLISH SOUND : OFF DATE FORMAT : dd/MM/yy AUTOMATIC CAL. VAL. : OFF DEFAULT FILE TYPE : NORMAL CVU WAVELENGTH TEST : FILTER LIMS SUPPORT : OFF USE SAMPLE IDS : OFF AUTOSAVE RESULTS : OFF AUTOPRINT RESULTS : OFF USER LOG-ON : OFF HISTORY FILE : OFF

SETUP
52 UV Issue 2a (12/2000)
SAMPLE ID : Enter the name of the sample via the Text Entry Page. Use the Arrow keys to move the cursor to the required character and press ENTER. Once all the required characters (up to 11) have been entered press ACCEPT. If you make a mistake will act as a backspace or CLEAR will clear the whole entry. SAMPLE ID SEED : Sets the number to be used for the first sample, via the numeric keypad. The Sample ID is incremented automatically before each run. Set the seed to zero for the results of the first run to be numbered 1.
PROMPT USER - Before each run the Text Entry Page appears and the user is prompted to enter an identity for the sample.
NOTE - a) When the Cell Programmer is used in AUTO mode the Sample ID is incremented automatically without stopping for ID confirmation between samples. b) PROMPT USER is not compatible with the Sipper used in Sip and Run or AutoSampler modes
AUTOSAVE RESULTS : Toggles between ON and OFF. When ON, results are saved automatically after each run. Selecting ON causes two additional items to appear in the Environment menu:
FILENAME - Enter a filename of up to 5 characters via the Text Entry Page. FILE NUMBER - Enter a number between 0 and 999 via the numeric keypad. The number is appended to the filename and incremented automatically
after each run. AUTOPRINT RESULTS : Toggles between ON and OFF. When ON, results are printed automatically after each run. Before attempting to print at any point during operation of the instrument ensure that the printer is ready to print, ie switched on, on line and supplied with paper. Failure to do so will result in an error condition. Press Clear to clear the error message ( the system may take a little time to respond ). Ensure the printer is ready and retry. USER LOG-ON : The default setting is OFF. Changing the setting to ON is password protected. When set to OFF, any user has full access to all the functions of the instrument. When set to ON, users must identify themselves by user name and password at log-on, and then have access to whichever functions are enabled for them by the System Administrator. Setting User Log-on to ON is password protected. Use the up and down arrow keys to move the highlight to USER LOG-ON and press Enter. This brings up the Text Entry Page. When the correct password is entered USER LOG-ON is set to ON, otherwise an error message is displayed, and it remains set to OFF. The default password is ADMIN. Note that the password is case sensitive, and in this password all the letters are upper case. Logging on as ADMIN gives access to the system at Administrator level, and the CHANGE USERS function key is enabled.
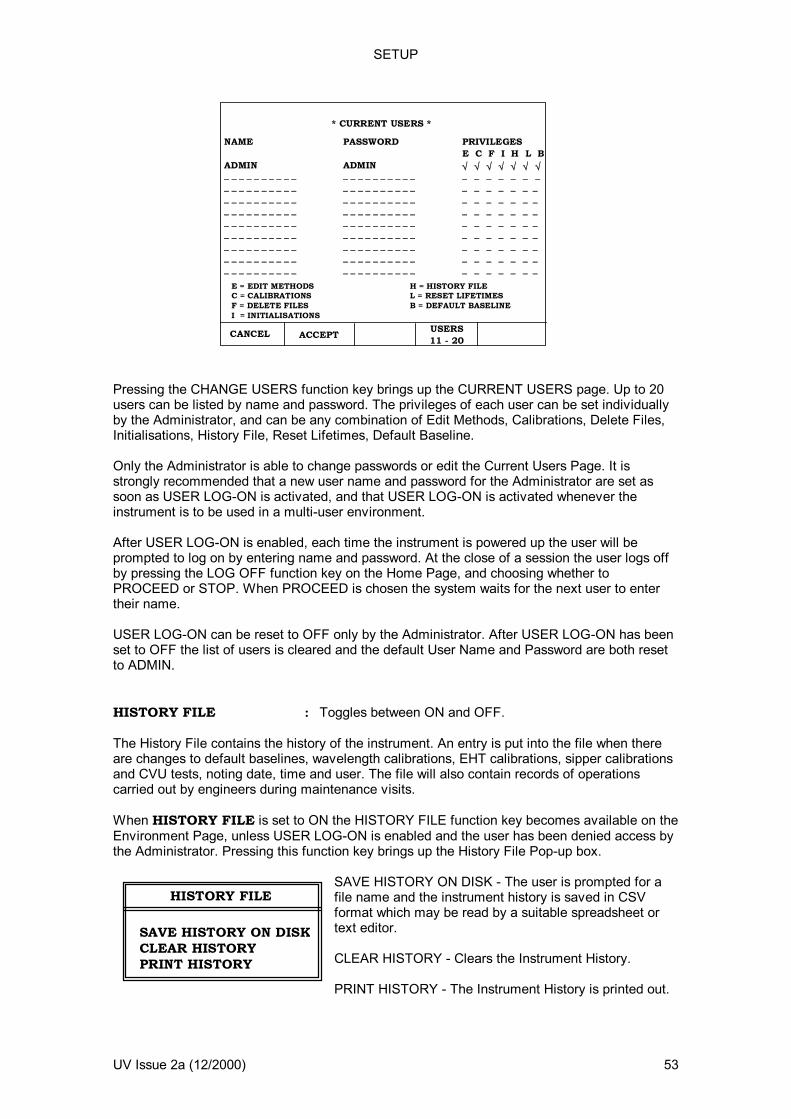
SETUP
UV Issue 2a (12/2000) 53
Pressing the CHANGE USERS function key brings up the CURRENT USERS page. Up to 20 users can be listed by name and password. The privileges of each user can be set individually by the Administrator, and can be any combination of Edit Methods, Calibrations, Delete Files, Initialisations, History File, Reset Lifetimes, Default Baseline. Only the Administrator is able to change passwords or edit the Current Users Page. It is strongly recommended that a new user name and password for the Administrator are set as soon as USER LOG-ON is activated, and that USER LOG-ON is activated whenever the instrument is to be used in a multi-user environment. After USER LOG-ON is enabled, each time the instrument is powered up the user will be prompted to log on by entering name and password. At the close of a session the user logs off by pressing the LOG OFF function key on the Home Page, and choosing whether to PROCEED or STOP. When PROCEED is chosen the system waits for the next user to enter their name. USER LOG-ON can be reset to OFF only by the Administrator. After USER LOG-ON has been set to OFF the list of users is cleared and the default User Name and Password are both reset to ADMIN. HISTORY FILE : Toggles between ON and OFF. The History File contains the history of the instrument. An entry is put into the file when there are changes to default baselines, wavelength calibrations, EHT calibrations, sipper calibrations and CVU tests, noting date, time and user. The file will also contain records of operations carried out by engineers during maintenance visits. When HISTORY FILE is set to ON the HISTORY FILE function key becomes available on the Environment Page, unless USER LOG-ON is enabled and the user has been denied access by the Administrator. Pressing this function key brings up the History File Pop-up box.
SAVE HISTORY ON DISK - The user is prompted for a file name and the instrument history is saved in CSV format which may be read by a suitable spreadsheet or text editor. CLEAR HISTORY - Clears the Instrument History. PRINT HISTORY - The Instrument History is printed out.
CANCEL
* CURRENT USERS *
ACCEPT USERS11 - 20
NAME PASSWORD PRIVILEGESE C F I H L B
ADMIN ADMIN
E = EDIT METHODS H = HISTORY FILEC = CALIBRATIONS L = RESET LIFETIMESF = DELETE FILES B = DEFAULT BASELINEI = INITIALISATIONS
HISTORY FILE
SAVE HISTORY ON DISKCLEAR HISTORYPRINT HISTORY
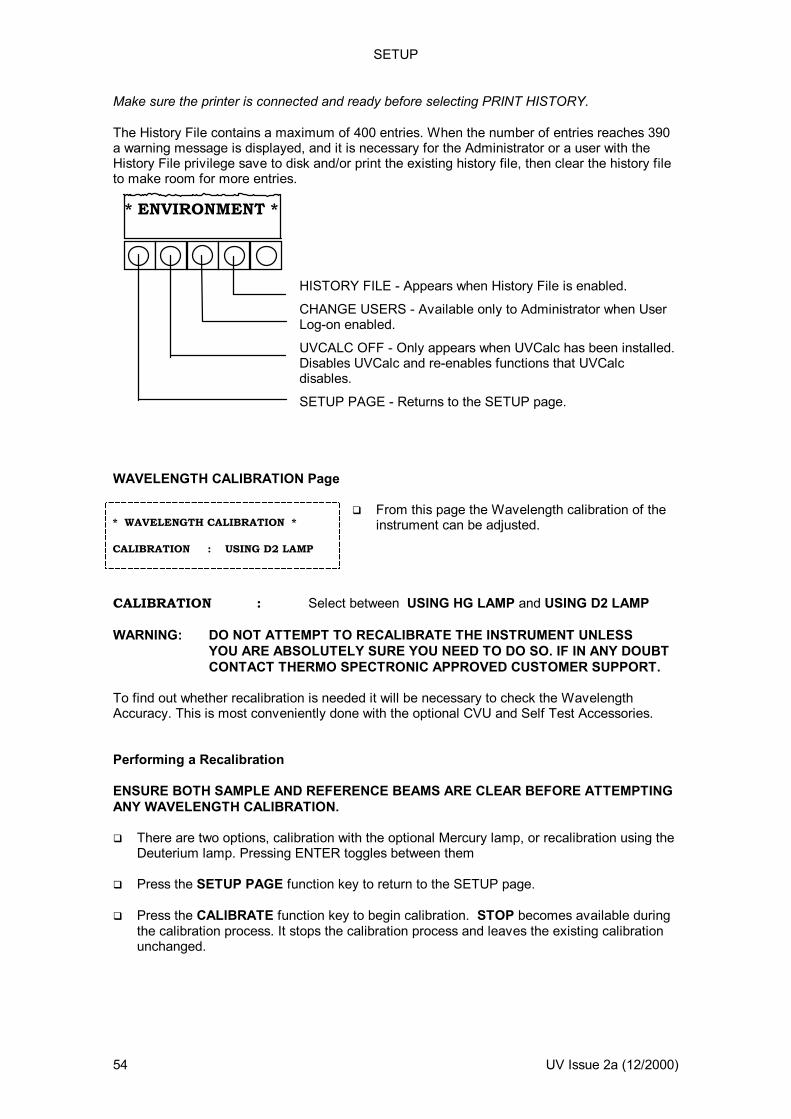
SETUP
54 UV Issue 2a (12/2000)
Make sure the printer is connected and ready before selecting PRINT HISTORY. The History File contains a maximum of 400 entries. When the number of entries reaches 390 a warning message is displayed, and it is necessary for the Administrator or a user with the History File privilege save to disk and/or print the existing history file, then clear the history file to make room for more entries.
HISTORY FILE - Appears when History File is enabled.
CHANGE USERS - Available only to Administrator when User Log-on enabled.
UVCALC OFF - Only appears when UVCalc has been installed. Disables UVCalc and re-enables functions that UVCalc disables.
SETUP PAGE - Returns to the SETUP page.
WAVELENGTH CALIBRATION Page
From this page the Wavelength calibration of the instrument can be adjusted.
CALIBRATION : Select between USING HG LAMP and USING D2 LAMP WARNING: DO NOT ATTEMPT TO RECALIBRATE THE INSTRUMENT UNLESS
YOU ARE ABSOLUTELY SURE YOU NEED TO DO SO. IF IN ANY DOUBT CONTACT THERMO SPECTRONIC APPROVED CUSTOMER SUPPORT.
To find out whether recalibration is needed it will be necessary to check the Wavelength Accuracy. This is most conveniently done with the optional CVU and Self Test Accessories. Performing a Recalibration ENSURE BOTH SAMPLE AND REFERENCE BEAMS ARE CLEAR BEFORE ATTEMPTING ANY WAVELENGTH CALIBRATION. There are two options, calibration with the optional Mercury lamp, or recalibration using the
Deuterium lamp. Pressing ENTER toggles between them Press the SETUP PAGE function key to return to the SETUP page. Press the CALIBRATE function key to begin calibration. STOP becomes available during
the calibration process. It stops the calibration process and leaves the existing calibration unchanged.
* ENVIRONMENT *
* WAVELENGTH CALIBRATION * CALIBRATION : USING D2 LAMP
SETUP
UV Issue 2a (12/2000) 55
Mercury Lamp Calibration This option will optimise the wavelength calibration of the instrument by measuring the
position of the emission lines of the mercury lamp and fitting the calibration accordingly. It can only be performed if the Mercury Lamp Accessory (Part Number 9423 UV9 0023E) is fitted and switched on. It should only be attempted if for any reason the instrument no longer achieves its quoted wavelength accuracy specification.
The calibration will take at least 15 minutes. Once the calibration is complete the Default
Baseline must be run. This operation will only need to be done if the existing calibration is corrupt, the grating has
been replaced, or the monochromator drive has been replaced.
Install the Mercury Lamp Accessory as detailed in the Mercury Lamp Accessory Installation and Maintenance Manual
Ensure the Mercury Lamp is ON. Ensure the instrument is fully warmed up and the beams are clear. From WAVELENGTH CALIBRATION page select CALIBRATION USING Hg LAMP
and press CALIBRATE. Once calibration is complete, switch both the Mercury Lamp and instrument OFF. Switch the instrument ON and allow to warm up. Run the Default Baseline.
Deuterium Lamp Calibration This option will optimise the wavelength calibration of the instrument by measuring the
Deuterium lamp emission line at 656.1nm and fitting the calibration accordingly. It should only be attempted if for any reason the instrument no longer achieves its quoted wavelength accuracy specification.
The calibration will take at least 10 minutes.
Ensure Deuterium Lamp is ON. Ensure instrument is fully warmed up and the beams are clear. From WAVELENGTH CALIBRATION page press CALIBRATE. Once calibration is complete switch the instrument OFF. Switch instrument and Deuterium lamp ON and allow to warm up. Run Default Baseline as detail below.
OPTICAL INITIALISATION Page This page is used to reset the instrument and define its initialisation and default baseline.
These procedures ensure the optimum performance of the spectrophotometer. INITIALISATION TYPE : When selected this displays a pop-up menu to choose between initialisation of optics or baseline.
OPTICS - During the normal initialisation procedure the spectrophotometer optimises the alignment of the lamp change mirror over a predefined range to give the maximum energy throughput. this operation defines the range over which the optimisation takes place. This should always be done when one of the lamps is changed. BASELINE - This re-measures the default baseline. Ensure that both lamps are on and that the spectrophotometer is fully warmed up. This process will take about one hour.

SETUP
56 UV Issue 2a (12/2000)
The default baseline should be re-measured whenever one of the source lamps is changed or if the instrument is working at temperatures significantly different from 25 C, or if the wavelength calibration is altered.
INITIALISE WITH D2 : This sets the instrument to initialise with or without the Deuterium lamp on. If set to ON then the instrument will automatically strike the Deuterium lamp during initialisation. WHITE LIGHT Page
The WHITE LIGHT feature is used to facilitate alignment of optical accessories in the
sample compartment. When the INITIALISE function key is pressed the instrument will align the grating so that
the zero order diffraction passes through the sample compartment. This provides a beam of white light which can be seen when a white card or similar is placed in the light path. In double beam instruments the action of the chopper causes the light to alternate between the sample and reference beams.
When alignment is completed, pressing the STOP function key returns the grating to its
normal position and pressing the SETUP PAGE function key returns to the Setup Page. LAMPS Page The lamp functions are available directly from the LAMPS key on the SETUP page. If User
Log-on is not in use, the HOME page will also have a LAMPS key. This page shows the status of the Tungsten Halogen, Deuterium and Mercury lamps,
whether ON, OFF or FAILED, and their appropriate energy levels. It also allows the lamp hours to be reset and the Deuterium and Mercury lamps to be switched on or off.
THE MERCURY LAMP SHOULD BE SWITCHED OFF WHEN NOT IN USE. The HOURS parameter states the number of hours that the lamp has been in use. The Tungsten Halogen lamp should be replaced after 2000 hours. The Deuterium lamp should be replaced after 1000 hours. Whenever a lamp is changed then the hours parameter should be reset to zero.
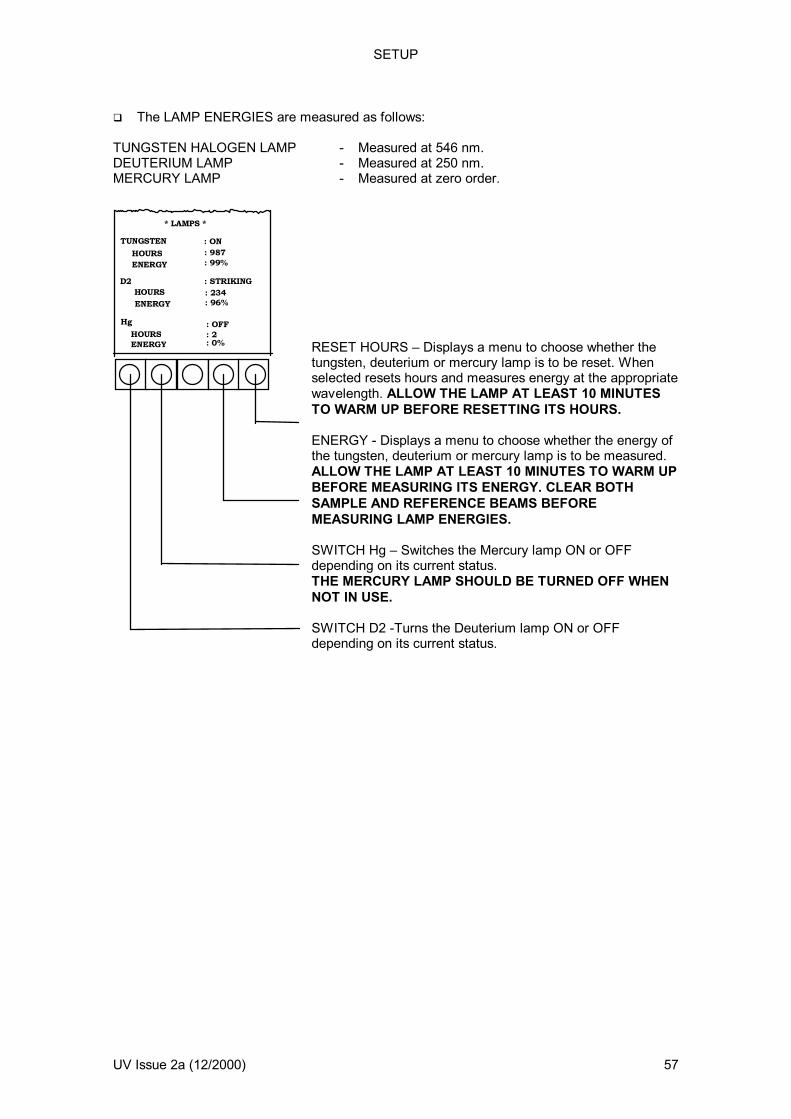
SETUP
UV Issue 2a (12/2000) 57
The LAMP ENERGIES are measured as follows: TUNGSTEN HALOGEN LAMP - Measured at 546 nm. DEUTERIUM LAMP - Measured at 250 nm. MERCURY LAMP - Measured at zero order.
RESET HOURS – Displays a menu to choose whether the tungsten, deuterium or mercury lamp is to be reset. When selected resets hours and measures energy at the appropriate wavelength. ALLOW THE LAMP AT LEAST 10 MINUTES TO WARM UP BEFORE RESETTING ITS HOURS. ENERGY - Displays a menu to choose whether the energy of the tungsten, deuterium or mercury lamp is to be measured. ALLOW THE LAMP AT LEAST 10 MINUTES TO WARM UP BEFORE MEASURING ITS ENERGY. CLEAR BOTH SAMPLE AND REFERENCE BEAMS BEFORE MEASURING LAMP ENERGIES. SWITCH Hg – Switches the Mercury lamp ON or OFF depending on its current status. THE MERCURY LAMP SHOULD BE TURNED OFF WHEN NOT IN USE. SWITCH D2 -Turns the Deuterium lamp ON or OFF depending on its current status.
* LAMPS *
TUNGSTEN : ON HOURS : 987 ENERGY : 99%
D2 : STRIKING HOURS : 234 ENERGY : 96%
Hg : OFFHOURSENERGY
: 2: 0%