User Guide - Perpetuum Software
120
User Guide Destination and Basic Features License Agreement Product Registration Technical Support System requirements Installation Components licensing Product Localization Getting Started Basic Information Creating templates in the wizard Report Creation Techniques Using the Widgets Component Using the ChartControl Component Working with the Report Viewer Working with the Report Designer Using the Report Using the Report Generator in Applications Additional Information Working with the Expression Editor Destination and Basic Features Report Sharp-Shooter™ is the most flexible .NET report engine available on the market. It's a suite of 100% managed .NET components allowing the creation of both bound and unbound reports, with an unlimited number of master-detail relations, groups, columns and crosses. The product supports the ADO.NET hierarchical data model, WinForms and ASP.NET WebForms and C#/VB.NET scripting. The package includes the designer needed for final documents and report templates. The built-in pivot table component allows dynamic data analysis. You can visualize data contained in the report by using the embedded Charting component. For more information visit our home page: http://www.perpetuumsoft.com Product features: 100% .NET Compatible: • Managed report engine. • Managed report designer is available in both design- and run-time. • Compatible with Visual Studio .NET, Borland C# Builder, Delphi.NET and other .NET IDEs. It is also possible to use the product without an IDE. • Compatible with ADO.NET, supports hierarchical data model with relations. • Supports WinForms and ASP.NET WebForms. • Supports all .NET data sources, including ADO.NET DataSets, DataViews, Collections, Arrays and any classes that implement IEnumerable, IList or IListSource.
-
Upload
khangminh22 -
Category
Documents
-
view
1 -
download
0
Transcript of User Guide - Perpetuum Software
User Guide Destination and Basic
Features
License Agreement
Product Registration
Technical Support
System requirements
Installation
Components licensing
Product Localization
Getting Started
Basic Information
Creating templates in the wizard
Report Creation Techniques
Using the Widgets Component
Using the ChartControl Component
Working with the Report Viewer
Working with the Report Designer Using the Report
Using the Report Generator in Applications
Additional Information
Working with the Expression Editor
Destination and Basic Features Report Sharp-Shooter™ is the most flexible .NET report engine
available on the market. It's a suite of 100% managed .NET
components allowing the creation of both bound and unbound
reports, with an unlimited number of master-detail relations, groups,
columns and crosses. The product supports the ADO.NET
hierarchical data model, WinForms and ASP.NET WebForms and
C#/VB.NET scripting. The package includes the designer needed
for final documents and report templates. The built-in pivot table
component allows dynamic data analysis. You can visualize data
contained in the report by using the embedded Charting component.
For more information visit our home page:
http://www.perpetuumsoft.com
Product features:
100% .NET Compatible:
• Managed report engine.
• Managed report designer is available in both design- and
run-time.
• Compatible with Visual Studio .NET, Borland C# Builder,
Delphi.NET and other .NET IDEs. It is also possible to use
the product without an IDE.
• Compatible with ADO.NET, supports hierarchical data
model with relations.
• Supports WinForms and ASP.NET WebForms.
• Supports all .NET data sources, including ADO.NET
DataSets, DataViews, Collections, Arrays and any classes
that implement IEnumerable, IList or IListSource.
2
Re
po
rt Sh
arp
-Sh
oo
ter
• Multiple data sources can be used in a single report.
• Use of GDI+ advantages: gradient fills, alpha blending, custom shapes etc.
• Scripting is supported for C# and VB.NET, as well as for any language supported by the .NET
Framework. No need to learn any additional script language.
100% Flexible:
• Unlimited level of nested master-detail bands in a single report.
• Natural cross-reports generation using cross-bands.
• Full rendering customization using C#/VB scripting with full access to all .NET Framework
capabilities (including import of any project namespaces, local variables, procedures, functions
etc.).
• Fully managed document object model (Report DOM), easy to understand, same for report
templates and ready documents.
• Different page sizes and orientations within a single report.
• Flexible page headers and footers make your reports look nice and easier to read.
• Page overlays allow you to create objects such as watermarks on a page background.
• Open plug-in architecture.
• Rich visual controls set, including texts, shapes, pictures, bar codes and zip codes. You can also
use any WinForms control as a report element.
• Styles are supported. You can use different style sheets to optimize reports for preview, print,
export etc.
• Both bound and unbound modes are supported.
• Manual build mode is supported. Use manual build mode to control all aspects of report
generation process (for very complex reports only). You can also combine manual and automatic
rendering mechanisms to produce any possible band sequence.
• Metric and inch measure units support.
• Powerful binding model (similar to Win/Web Forms data-binding) allows you to bind all
controls properties to data fields, system and local variables, as well as to a custom expression
written in current script language (C# or VB.NET).
• Generated reports are stored in the form of objects graph (using ReportDOM) rather than in
metafile format, which allows you to easily modify final reports.
• PDF, RTF, HTML, EMF, BMP, JPG, GIF, TIFF, PNG, Excel, Excel(XML), CSV and Text
export filters are available. Report Sharp-Shooter allows using custom export filters.
• Create reports with the exact positioning without bands utilization
3
Re
po
rt Sh
arp
-Sh
oo
ter
• An automatic converter allows quick transformation of Crystal Reports into Report Sharp-
Shooter.
100% easy to use and deploy:
• Easy to deploy - just copy few DLLs!
• XML-based report file format, easy to share over Internet.
• Report Wizard availability allows your customers to create reports quickly and easily.
• Report generator is fully localized (including PropertyGrid). It is possible to change the interface
language without the product rerun.
100% Royalty free runtime:
• Royalty free report engine
• Royalty free report viewer
• Royalty free full-featured final documents run-time designer
• Royalty free full-featured report templates run-time designer
License Agreement Perpetuum Software LLC
Report Sharp-Shooter
SOFTWARE COMPONENT PRODUCT
Copyright (C) 2006 Perpetuum Software LLC
END-USER LICENSE AGREEMENT FOR REPORT SHARP-SHOOTER SOFTWARE
COMPONENT PRODUCT
IMPORTANT - READ CAREFULLY: This Perpetuum Software LLC End-User License Agreement
("EULA") is a legal agreement between you, a developer of software applications ("Developer End
User") and Perpetuum Software LLC (“Perpetuum Soft”) for Report Sharp-Shooter SOFTWARE
COMPONENT PRODUCT, its relevant controls, source code, demos, intermediate files, media, printed
materials, and "online" or electronic documentation ("PRODUCT") contained in the installation file.
By installing, copying, or otherwise using the PRODUCT, the Developer End User agrees to be bound
by the terms of this EULA. The PRODUCT is in "use" on a computer when it is loaded into temporary
memory (i.e. RAM) or installed into permanent memory (e.g. hard disk, CD-ROM, or other storage
device) of that computer.
4
Re
po
rt Sh
arp
-Sh
oo
ter
If the Developer End User does not agree to any part of the terms of this EULA, THE DEVELOPER
END USER CAN NOT INSTALL, USE, DISTRIBUTE, OR REPLICATE IN ANY MANNER, ANY
PART, FILE OR PORTION OF THE PRODUCT, OR USE THIS PRODUCT FOR ANY OTHER
PURPOSES.
The PRODUCT is licensed, not sold.
LICENSE GRANT.
Upon acceptance of this EULA Perpetuum Soft grants the Developer End User a personal, nonexclusive
license to install and use the PRODUCT on compatible devices for the sole purposes of designing,
developing, testing, and deploying application programs the Developer End User creates. If the
Developer End User is an entity, it must designate one individual within its organization to license the
right to use the PRODUCT in the manner provided herein.
The Developer End User may install and use the PRODUCT as permitted by the license type purchased
as described below. The license type purchased is specified in the product receipt.
EVALUATION LICENSE.
Under the terms of an Evaluation License the Developer End User may install and use any number of
copies of the PRODUCT on unlimited number of computers for the limited purposes of testing,
evaluation and demonstrations ONLY.
This License is granted for a limited period of thirty (30) days after installation of the evaluation version
of the PRODUCT ("Evaluation Period"). After the Evaluation Period, the Developer End User shall
either
(i) delete the PRODUCT and all related documentation from ALL computers onto which it was installed
or copied, or
(ii) contact Perpetuum Soft or one of its authorized resellers to purchase the PRODUCT.
The Developer End User may not distribute ANY of the files provided with the evaluation version of the
PRODUCT to ANY PARTIES.
DESCRIPTION OF OTHER RIGHTS AND LIMITATIONS.
Not for Resale Software.
5
Re
po
rt Sh
arp
-Sh
oo
ter
If the PRODUCT is labeled and provided as "Not for Resale" or "NFR", then, notwithstanding other
sections of this EULA, the Developer End User may not resell, distribute, or otherwise transfer for value
or benefit in any manner, the PRODUCT or any derivative work using the PRODUCT. The Developer
End User may not transfer, rent, lease, lend, copy, modify, translate, sublicense, time-share or
electronically transmit the PRODUCT, media or documentation. This also applies to any and all
intermediate files, source code, and compiled executables.
Limitations on Reverse Engineering, Decompilation, and Disassembly.
The Developer End User may not reverse engineer, decompile, create derivative works, modify,
translate, or disassemble the PRODUCT, and only to the extent that such activity is expressly permitted
by applicable law notwithstanding this limitation. The Developer End User agrees to take all reasonable,
legal and appropriate measures to prohibit the illegal dissemination of the PRODUCT or any of its
constituent parts and redistributables to the fullest extent of all applicable local, federal and international
laws and treaties regarding anti-circumvention, including but not limited to the Geneva and Berne
World Intellectual Property Organization (WIPO) Diplomatic Conferences.
Separation of Components, their Constituent Parts and Redistributables.
The PRODUCT is licensed as an indivisible unit. The PRODUCT and its constituent parts and any
provided redistributables may not be reverse engineered, decompiled, disassembled or separated for use
on more than one computer, nor placed for distribution, sale, or resale as individual creations by the
Developer End User. The provision of source code, if included with the PRODUCT, does not constitute
transfer of any legal rights to such code, and resale or distribution of all or any portion of all source code
and intellectual property will be prosecuted to the fullest extent of all applicable local, federal and
international laws. All PRODUCT libraries, source code, redistributables and other files remain
Perpetuum Soft exclusive property. The Developer End User may not distribute any files, except those
that Perpetuum Soft has expressly designated as Redistributables.
REDISTRIBUTABLES.
The PRODUCT may include certain files intended for distribution by the Developer End User to the
users of the programs created by him/her – “Redistributables”. Redistributables include, for example,
those files identified in printed or on-line documentation as redistributable files, those files preselected
for deployment by an install utility provided with the PRODUCT (if any). In any event, the
Redistributables for the PRODUCT are only those files specifically designated as such by Perpetuum
6
Re
po
rt Sh
arp
-Sh
oo
ter
Soft. Subject to all of the terms and conditions in this EULA, the Developer End User may reproduce
and distribute exact copies of the Redistributables, provided that such copies are made from the original
copy of the PRODUCT. Copies of Redistributables may only be distributed with and for the sole
purpose of executing application programs permitted under this EULA that the Developer End User has
created using the PRODUCT. Under no circumstances may any copies of Redistributables be distributed
separately.
The following file(s) are considered redistributables under this EULA:
PerpetuumSoft.Framework.dll
PerpetuumSoft.Reporting.dll
PerpetuumSoft.Reporting.Export.CSV.dll
PerpetuumSoft.Reporting.Export.Excel.dll
PerpetuumSoft.Reporting.Export.ExcelXML.dll
PerpetuumSoft.Reporting.Export.Html.dll
PerpetuumSoft.Reporting.Export.Pdf.dll
PerpetuumSoft.Reporting.Export.Rtf.dll
PerpetuumSoft.Reporting.Web.dll
PerpetuumSoft.Writers.Excel.dll
PerpetuumSoft.Writers.Pdf.dll
THE DEVELOPER END USER IS NOT AUTHORIZED TO REDISTRIBUTE ANY OTHER FILE
CONTAINED IN THE PRODUCT.
Rental.
The Developer End User may not rent, lease, or lend the PRODUCT.
Transfer.
The Developer End User may NOT permanently or temporarily transfer ANY of his/her rights under
this EULA to any individual or entity. Regardless of any modifications which the Developer End User
makes and regardless of how the Developer End User might compile, link, and/or package his/her
programs, under no circumstances may the libraries, redistributables, and/or other files of the
PRODUCT (including any portions thereof) be used for developing programs by anyone other than the
Developer End User. Only the Developer End User has the right to use the libraries, redistributables, or
other files of the PRODUCT (or any portions thereof) for developing programs created with the
PRODUCT. In particular, the Developer End User may not share copies of the Redistributables with
other co-developers. The Developer End User may not reproduce or distribute any PRODUCT
documentation without Perpetuum Soft explicit permission.

7
Re
po
rt Sh
arp
-Sh
oo
ter
Termination.
Without prejudice to any other rights or remedies, Perpetuum Soft will terminate this EULA upon the
failure of the Developer End User to comply with all the terms and conditions of this EULA. In such
events, the Developer End User must destroy all copies of the PRODUCT and all of its component parts
including any related documentation, and must immediately remove ANY and ALL use of the
technology contained in the PRODUCT from any applications developed by the Developer End User,
whether in native, altered or compiled state.
Additional Restrictions.
Distribution by the Developer End User of any design-time tools (EXE's, OCX's or DLL's), executables,
and source code distributed by Perpetuum Soft as part of this PRODUCT and not explicitly identified as
a redistributable file is strictly prohibited. Redistribution by the Developer End User’s users of
Perpetuum Soft DLL's and OCX's or PRODUCT redistributable files modified by the Developer End
User without an appropriate redistribution license obtained from Perpetuum Soft is strictly prohibited.
The Developer End User shall not develop software applications that provide an application
programming interface to the PRODUCT or the PRODUCT as modified.
The Developer End User may NOT distribute the PRODUCT, in any format, to other users for
development or application compilation purposes. Specifically, if Developer End User creates a control
using the PRODUCT as a constituent control, Developer End User may NOT distribute the control
created with the PRODUCT (in any format) to users to be used at design time and or for ANY
development purposes.
THE DEVELOPER END USER MAY NOT USE THE PRODUCT TO CREATE ANY TOOL OR
PRODUCT THAT DIRECTLY OR INDIRECTLY COMPETES WITH THE PRODUCT.
UPDATES, UPGRADES AND FIXES.
Perpetuum Soft will provide the Developer End User with free updates, upgrades and fixes for the
PRODUCT for one year since the purchase date.
RIGOROUS ENFORCEMENT OF INTELLECTUAL PROPERTY RIGHTS.
8
Re
po
rt Sh
arp
-Sh
oo
ter
IF THE DEVELOPER END USER IS USING THE EVALUATION VERSION OF THE PRODUCT,
Perpetuum Soft WILL NOT PROVIDE THE DEVELOPER END USER WITH UPDATES,
UPGRADES AND FIXES RELATED TO THE PRODUCT.
COPYRIGHT.
All title and copyrights in and to the PRODUCT (including but not limited to any images, demos, source
code, intermediate files, packages, photographs, redistributables, animations, video, audio, music, text,
and "applets" incorporated into the PRODUCT, the accompanying printed materials, and any copies of
the PRODUCT) are owned by Perpetuum Soft. The PRODUCT is protected by copyright laws and
international treaty provisions. Therefore, the Developer End User must treat the PRODUCT like any
other copyrighted material except that the Developer End User may install the PRODUCT on a single
computer provided that he/she keeps the original solely for backup or archival purposes. The Developer
End User may not copy the printed materials accompanying the PRODUCT.
RIGOROUS ENFORCEMENT OF INTELLECTUAL PROPERTY RIGHTS.
If the licensed right of use for this PRODUCT is purchased by the Developer End User with any intent
to reverse engineer, decompile, create derivative works, and the exploitation or unauthorized transfer of
any Perpetuum Soft intellectual property and trade secrets, to include any exposed methods or source
code where provided, no licensed right of use shall exist, and any product created as a result shall be
judged illegal by definition of all applicable laws. Any sale or resale of intellectual property or created
derivatives so obtained will be prosecuted to the fullest extent of all local, federal and international laws.
Installation and Use.
The license granted in this EULA for the Developer End User to create his/her own compiled programs
and to distribute such programs and the Redistributables (if any), is subject to all of the following
conditions:
(i) the programs by the Developer End User that contain Perpetuum Soft PRODUCT must be
written using a licensed, registered copy of the PRODUCT;
(ii) the programs by the Developer End User must add primary and substantial functionality, and
may not be merely a set or subset of any of the libraries, code, Redistributables or other files
of the PRODUCT;
(iii) the Developer End User may not remove or alter any Perpetuum Soft copyright, trademark or
other proprietary rights notices contained in any portion of Perpetuum Soft libraries, source
code, Redistributables or other files that bear such a notice;

9
Re
po
rt Sh
arp
-Sh
oo
ter
(iv) all copies of the programs the Developer End User creates must bear a valid copyright notice,
either his/her own or the Perpetuum Soft copyright notice that appears on the PRODUCT;
(v) the Developer End User may not use Perpetuum Soft or any of its suppliers' names, logos, or
trademarks to market his/her programs;
(vi) the Developer End User will remain solely responsible to anyone receiving his/her programs
for support, service, upgrades, or technical or other assistance, and such recipients will have
no right to contact Perpetuum Soft for such services or assistance;
(vii) the Developer End User will indemnify and hold Perpetuum Soft, its related companies and
its suppliers, harmless from and against any claims or liabilities arising out of the use,
reproduction or distribution of his/her programs.
NO WARRANTIES.
Perpetuum Soft EXPRESSLY DISCLAIMS ANY WARRANTY FOR THE PRODUCT. THE
PRODUCT AND ANY RELATED DOCUMENTATION IS PROVIDED "AS IS" WITHOUT
WARRANTY OF ANY KIND, EITHER EXPRESS OR IMPLIED, INCLUDING, WITHOUT
LIMITATION, THE IMPLIED WARRANTIES OF MERCHANTABILITY, FITNESS FOR A
PARTICULAR PURPOSE, OR NONINFRINGEMENT. THE ENTIRE RISK ARISING OUT OF
USE OR PERFORMANCE OF THE PRODUCT REMAINS WITH THE DEVELOPER END
USER.
NO LIABILITIES.
To the maximum extent permitted by applicable law, in no event shall Perpetuum Soft be liable for
any special, incidental, indirect, or consequential damages whatsoever (including, without limitation,
damages for loss of business profits, business interruption, loss of business information, or any other
pecuniary loss) arising out of the use of or inability to use the PRODUCT or the provision of or
failure to provide Support Services, even if Perpetuum Soft has been advised of the possibility of
such damages.
SUPPORT SERVICES.
Perpetuum Soft will provide the Developer End User with free support services related to the
PRODUCT ("Support Services") for one year since the purchase date. Use of Support Services is
governed by Perpetuum Soft policies and programs described in the user manual, in "on line"
documentation and/or other Perpetuum Soft provided materials. Any supplemental PRODUCT
provided to the Developer End User as part of the Support Services shall be considered part of the
PRODUCT and subject to the terms and conditions of this EULA. With respect to technical
10
Re
po
rt Sh
arp
-Sh
oo
ter
information the Developer End User provides to Perpetuum Soft as part of the Support Services,
Perpetuum Soft may use such information for its business purposes, including for PRODUCT
support and development. Perpetuum Soft will not utilize such technical information in a form that
personally identifies the Developer End User.
GENERAL PROVISIONS.
This EULA may only be modified in writing signed by you and an authorized officer of Perpetuum
Soft. If any provision of this EULA is found void or unenforceable, the remainder will remain valid
and enforceable according to its terms. If any remedy provided is determined to have failed for its
essential purpose, all limitations of liability and exclusions of damages set forth in the Limited
Warranty shall remain in effect.
Perpetuum Soft reserves all rights not specifically granted in this EULA.
Perpetuum Soft reserves the right to make changes in this EULA at any moment by publishing the
appropriate alterations on http://www.perpetuumsoft.com 20 calendar days prior to the moment
these alternations take effect.
ACKNOWLEDGEMENT.
THE DEVELOPER END USER ACKNOWLEDGES THAT IT HAS READ AND UNDERSTANDS
THIS AGREEMENT AND AGREES TO BE BOUND BY ITS TERMS. THE DEVELOPER END
USER FURTHER AGREES THAT THIS AGREEMENT IS THE COMPLETE AND EXCLUSIVE
STATEMENT OF THE AGREEMENT BETWEEN THE DEVELOPER END USER AND
PERPETUUM SOFTWARE, AND SUPERCEDES ANY PROPOSAL OR PRIOR AGREEMENT,
ORAL OR WRITTEN, AND ANY OTHER COMMUNICATIONS RELATING TO THE SUBJECT
MATER OF THIS AGREEMENT.
Product Registration The product is licensed for each computer on which it is installed and used. If you need to used the
product on more than one computer, you should obtain additional license for the product. After you
ordered your license and made payment, an e-mail containing detailed instructions on how to register
the product is sent to your e-mail. If you have any questions regarding product licensing, please, feel
free to contact our sales representative via e-mail: [email protected]

11
Re
po
rt Sh
arp
-Sh
oo
ter
Technical Support Perpetuum Software official policy is to employ a very strong support team. This guarantees that all
your questions and inquiries will be answered in a quick and professional manner. We would be very
thankful for any suggestions and recommendations you might have regarding our products. We do take
in account the opinion of every single person who has shown interest in our products.
Of course, Perpetuum Software support team is for all to help you with products troubleshooting if any.
They can be reached via e-mail: [email protected].
You can get additional information or exchange your opinion on technical issues with Perpetuum
Software representatives and other users at our technical support forum:
http://www.perpetuumsoft.com/Forums.aspx
If you are interested in our products, have suggestions on broadening products functionality; if you have
questions on licensing or would like to make a cooperation proposal, please contact our sales department
at: [email protected].
System requirements To create applications with the Report Sharp-Shooter components, we recommend that you use such
high-level development environments as Microsoft Visual Studio 2003 and 2005, Borland Delphi 8,
Borland C# Builder or others.
To run applications that use Report Sharp-Shooter components, Microsoft .NET Framework 1.1/2.0 is
required. Minimal hardware requirements match those for Microsoft .NET Framework 1.1.
Installation Report Sharp-Shooter is distributed as a Microsoft Installer package. The name of the installation
package file is NETModelKitSuite.msi. To install the software, run this file and follow instructions of
the wizard.
If during setting installation you chose the «Add components to Visual Studio Toolbox» option, the
Report Sharp-Shooter components will be automatically added to the Microsoft Visual Studio .Net
Toolbox. This option works only for Visual Studio 2003. To use the Report Sharp-Shooter components
in Microsoft Visual Studio 2005, you should add the Report Sharp-Shooter components onto the
ToolBox manually. To do it, start Visual Studio, right-click on the ToolBox, select the Add Tab item
from the context menu, enter the name of the tab (for example, Report Sharp-Shooter) and press Enter.
12
Re
po
rt Sh
arp
-Sh
oo
ter
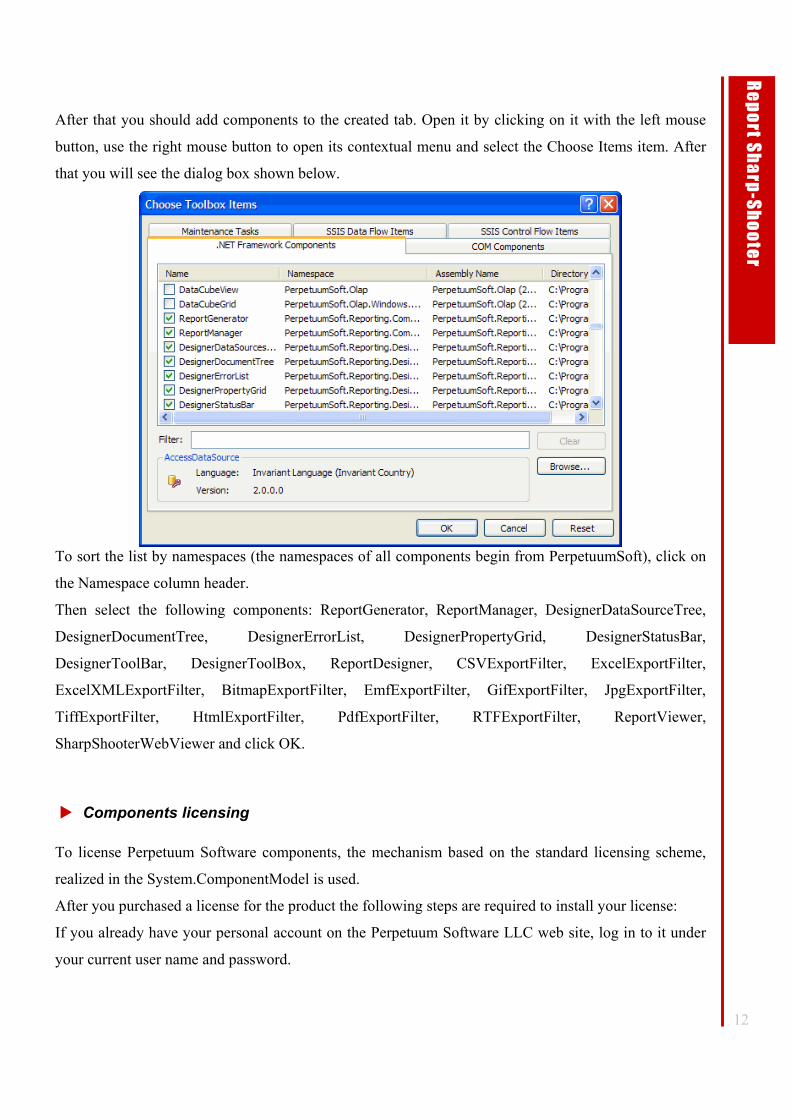
After that you should add components to the created tab. Open it by clicking on it with the left mouse
button, use the right mouse button to open its contextual menu and select the Choose Items item. After
that you will see the dialog box shown below.
To sort the list by namespaces (the namespaces of all components begin from PerpetuumSoft), click on
the Namespace column header.
Then select the following components: ReportGenerator, ReportManager, DesignerDataSourceTree,
DesignerDocumentTree, DesignerErrorList, DesignerPropertyGrid, DesignerStatusBar,
DesignerToolBar, DesignerToolBox, ReportDesigner, CSVExportFilter, ExcelExportFilter,
ExcelXMLExportFilter, BitmapExportFilter, EmfExportFilter, GifExportFilter, JpgExportFilter,
TiffExportFilter, HtmlExportFilter, PdfExportFilter, RTFExportFilter, ReportViewer,
SharpShooterWebViewer and click OK.
Components licensing To license Perpetuum Software components, the mechanism based on the standard licensing scheme,
realized in the System.ComponentModel is used.
After you purchased a license for the product the following steps are required to install your license:
If you already have your personal account on the Perpetuum Software LLC web site, log in to it under
your current user name and password.
13
Re
po
rt Sh
arp
-Sh
oo
ter
If you don’t have your personal on the Perpetuum Software LLC web site, company representative will
create it for you. Corresponding information on your account will be sent to the e-mail, specified in the
order form.
Then, proceed to the ‘Downloads’ section. Download and install evaluation version of the product.
Note: If the current product version trial is already installed on your computer, there is no need to
reinstall the software.
Look up for a license link for the product and click it. You will be prompted to download the zip-packed
license key file. This file should contain the *.elic license file. If you purchased several licenses, license
key file should include several different *.elic files, one for each purchased license.
Download and unpack the license key file. Open the file and launch the product LicenseManager from
the 'Start' menu. In the License Manager, click the ‘Add License’ button and copy-paste the registration
key file content into the ‘Register Form’ window. Then, click the ‘Register’ button.
If you purchased several licenses for the product, you should install different licenses on the machines.
If the license has not been installed, you will get a warning that the trial version of the product is used.
When you add components or compile your project, the data on the installed license are added to the
resources of your application. For that purpose, the license.licx file is created and included in the
resources of your project. This license.licx file contains a list of the licensed components.
The license is being embedded in the project during the application compiling. And when you run your
application on a machine where the license is not installed, the license will be taken from the resources
of your application. It allows you to use your final application without installing the license on your end
users machines.
We strongly recommend that you make sure that the data on the license have been included into your
project before your final application is distributed. To do that, please make sure that the license.licx file
is created and included into the root folder of your application and that this file contains description of
all types of the used components. In addition, run your application on a machine where the license for
the product is not installed.
Sometimes recompilation of the application does not cause recompilation of its resources. And it is
possible that the license.licx file will not be created in some Integrated Development Environments
(IDE). In this case, please do the following: make any minor changes on a form where the used
components are located and recompile the application. These changes will force an IDE to recompile
resources and refresh the license.licx file.
Each license has an expiration date. But it doesn’t mean that your product will not work after this date.
The expiration date indicates the date after which you will not be entitled to use your current license

14
Re
po
rt Sh
arp
-Sh
oo
ter
with the product versions released after this date. If you don’t want to renew your license you are able to
work with the previous product versions without any time limits.
If the project is created by a group of developers with use of several computers, it is required to install a
unique license on each machine. Otherwise, if you use only one license and move your project to
another machine, you will get a warning that the license is illegally used.
You will get this warning if the project has been developed on one machine but transported to another
machine for some reason or another. It is not a violation, but you will get a warning while compilation.
After that the license will be assigned to this machine and you will not get the warning.
If you do not use forms in your application or do not place components on these forms but dynamically
create them from the code, you can create the license.licx file manually. For example, your application
uses report generator that runs the report designer, ReportViewer component and uses the
ReportManager component. Then, the license.licx file should include the following:
PerpetuumSoft.Reporting.Components.ReportManager, PerpetuumSoft.Reporting, Version=2.0.0.0, Culture=neutral,
PublicKeyToken=<keytoken>
PerpetuumSoft.Reporting.View.ReportViewer, PerpetuumSoft.Reporting, Version=2.0.0.0, Culture=neutral,
PublicKeyToken=<keytoken>
PerpetuumSoft.Reporting.Designer.ReportDesigner, PerpetuumSoft.Reporting, Version=2.0.0.0, Culture=neutral,
PublicKeyToken=<keytoken>
If manual creation of this file causes difficulties, you may do the following. Create a temporary form (or
a web page) in your application, place there all types of components you use and recompile the
application. The license.licx file will be created and you may delete the temporary form. And the
license.licx file will remain in your application resources.
If you create your application without using any visual tools and compile it from the command line, you
should use the lc utility that is included into the .NET Framework SDK. For example, you create an
application with the MyApplication.exe name and it uses the licensed components. Then, you should
create the license.licx file with the list of components you use (how to create this file is described above)
and write the following in the command line:
lc.exe /target:MyApplication.exe /complist:licenses.licx /i:PerpetuumSoft.Framework.dll /i:PerpetuumSoft.Reporting.dll
This utility creates resource file with licenses (we get the MyApplication.exe.licenses file in our
example)
After that you should add this file to the resources of your application. For example:
15
Re
po
rt Sh
arp
-Sh
oo
ter
csc /res:MyApplication.exe.licenses /reference:….
Product Localization
The Perpetuum Software’s products can be easily localized. All string resources used by the products
are taken from the ad hoc localization XML-file.
There are several ways to set localization language:
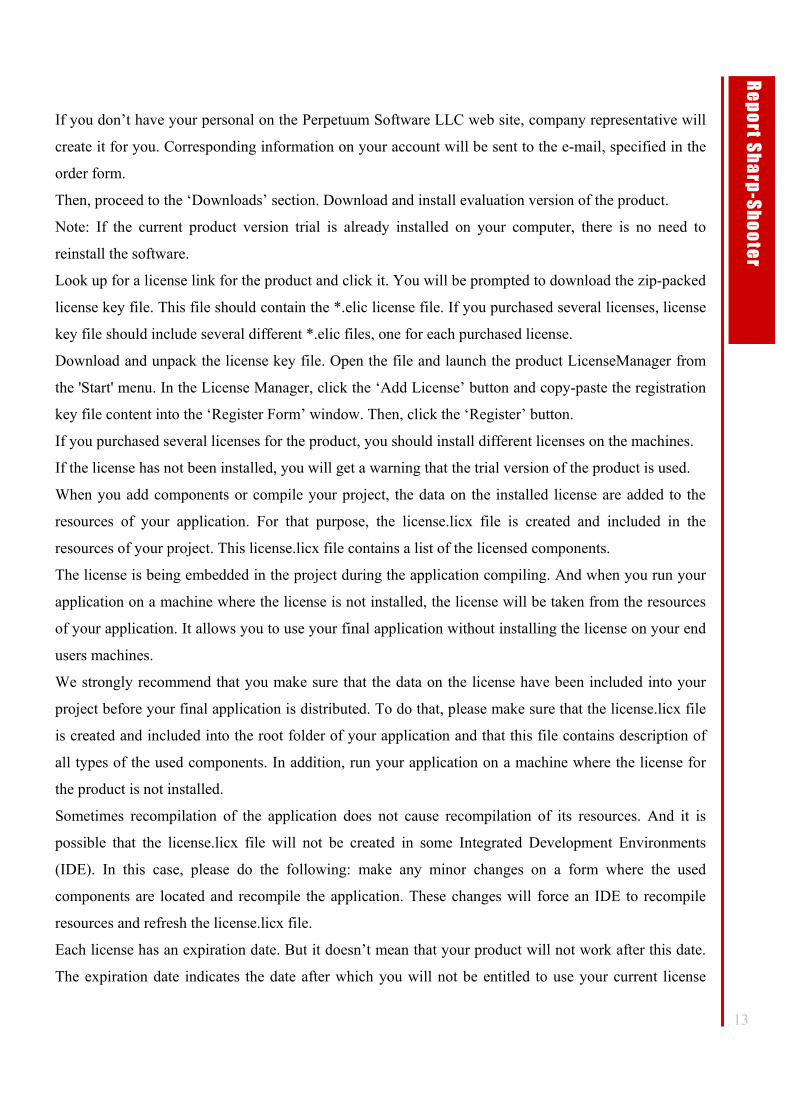
1) One can set language by means of the SelectLanguage application included in the delivery package.
This application changes the register record responsible for the language of Perpetuum Software’s
products.
Here you can select one of the preinstalled languages (Select from list); set custom language using a
custom localization file (Load from file); set default language (Default) or change the folder from which
the list of languages is selected.
2) Another way is to set language from your application. To do it, use the types from the
PerpetuumSoft.Framework.Localization namespace.
PerpetuumSoft.Framework.Localization.Language.CurrentLanguage – is the current language.
You can change it by means of:

16
Re
po
rt Sh
arp
-Sh
oo
ter
1. Loading a localization string from a special format file PerpetuumSoft.Framework.Localization.LocalizationFile localizationFile = new PerpetuumSoft.Framework.Localization.LocalizationFile(); localizationFile.Read(<filePath>); PerpetuumSoft.Framework.Localization.Language language = PerpetuumSoft.Framework.Localization.Language(); language. AddLocalizationFile(localizationFile); PerpetuumSoft.Framework.Localization.Language.CurrentLanguage = language; 2. Setting default language PerpetuumSoft.Framework.Localization.Language.CurrentLanguage = PerpetuumSoft.Framework.Localization.Language.DefaultLanguage; 3. Specifying localization language as a current language in the registry.
PerpetuumSoft.Framework.Localization.Language.CurrentLanguage =
PerpetuumSoft.Framework.Localization.Language.CreateLanguageFromRegistrySettings();
If a language you need is not included in the package, you can create a localization file for a desired
language on your own. You will need to translate all strings.
Upon your request, we can provide an XML-file containing the strings to be translated. After we receive
translation of string resources, a localization file will be produced and provided to you.
Please feel free to contact us at [email protected] in regard to localization issues.
Getting Started In this section we will go through creating a simple report step by step.
Start Microsoft Visual Studio and create a new C# Windows Application project.
Create a data source for the report. To do it, add the System.Data.DataSet object to the form and create a
Customers table with two fields of the string type called Name and Phone.
Insert the following code into the form Load event handler to fill the table with data DataRow row = dataTable1.NewRow(); row["Name"] = "Johnson Leslie"; row["Phone"] = "613-442-7654"; dataTable1.Rows.Add(row); row = dataTable1.NewRow(); row["Name"] = "Fisher Pete"; row["Phone"] = "401-609-7623"; dataTable1.Rows.Add(row); row = dataTable1.NewRow(); row["Name"] = "Brown Kelly"; row["Phone"] = "803-438-2771"; dataTable1.Rows.Add(row);
17
Re
po
rt Sh
arp
-Sh
oo
ter
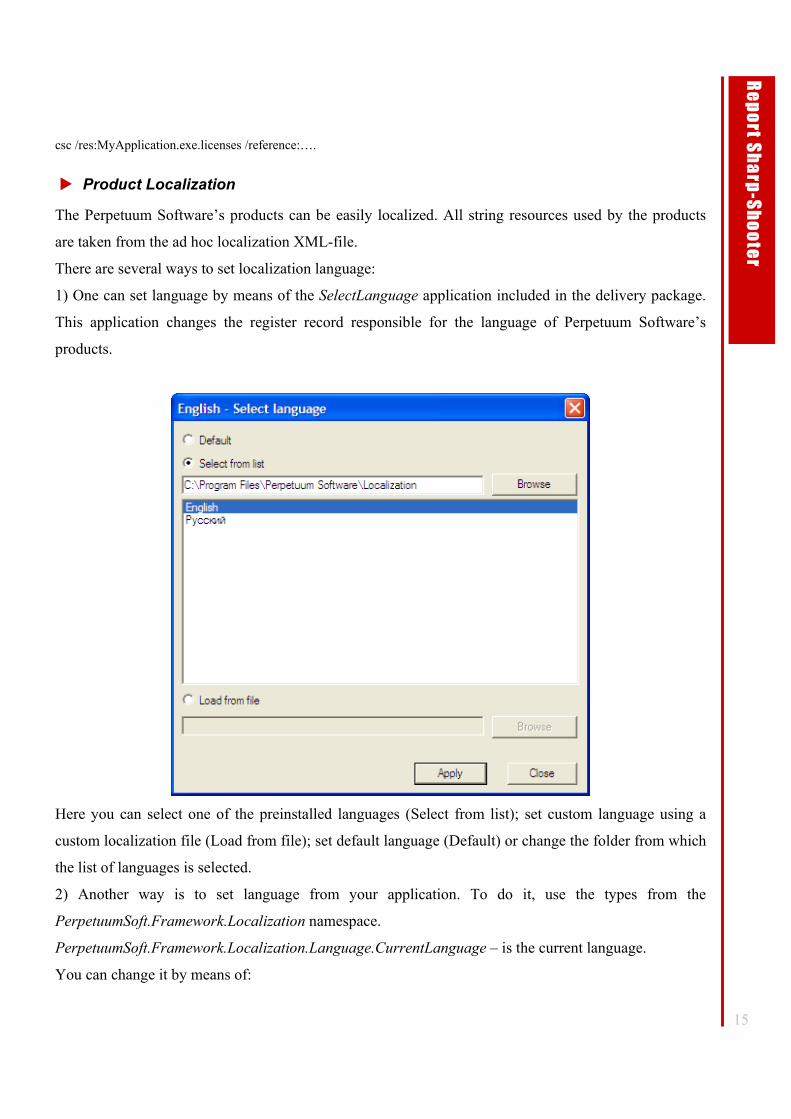
Place the ReportManager component onto the form (if this component is not available on the ToolBox
see the Installation section). ReportManager is a non-visual component and is displayed in the lower
part of the Form Designer window.
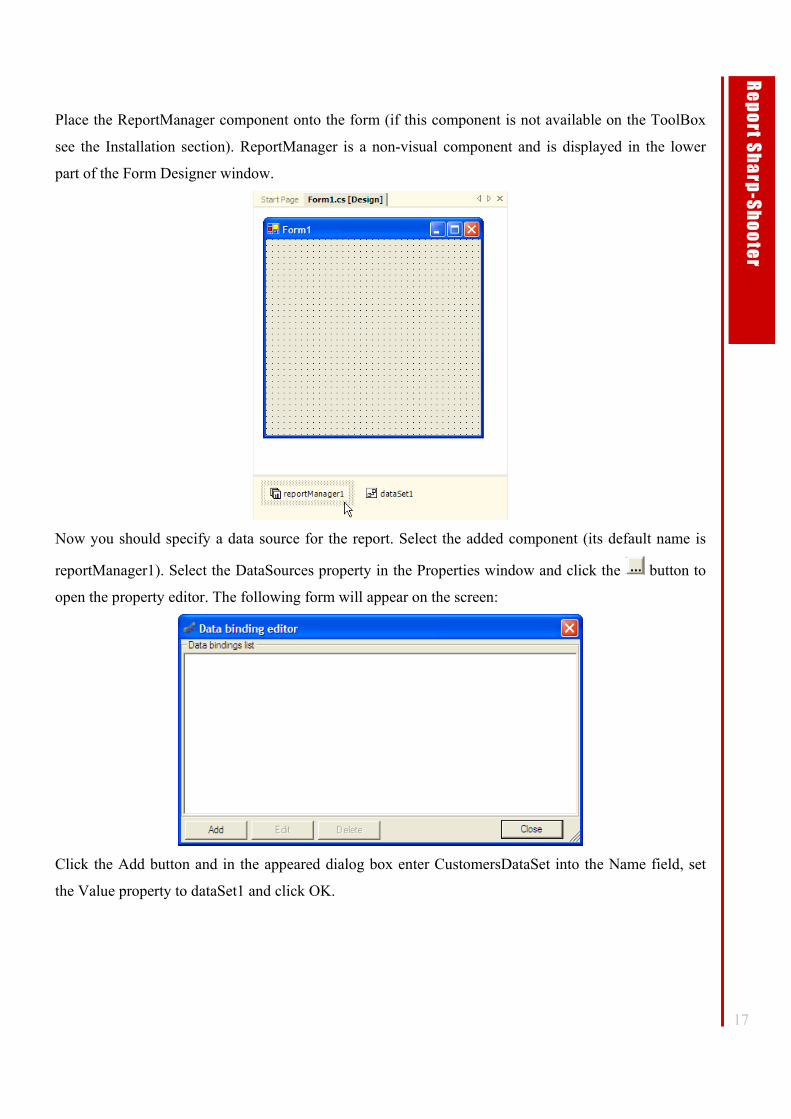
Now you should specify a data source for the report. Select the added component (its default name is
reportManager1). Select the DataSources property in the Properties window and click the button to
open the property editor. The following form will appear on the screen:
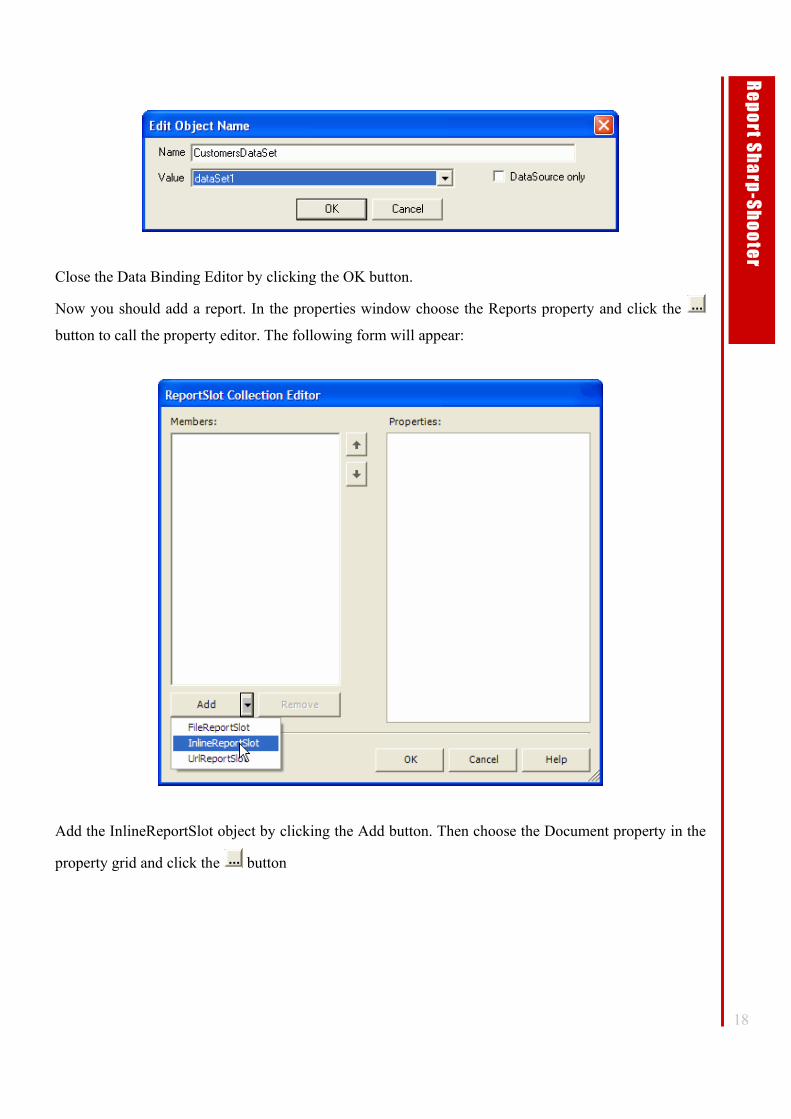
Click the Add button and in the appeared dialog box enter CustomersDataSet into the Name field, set
the Value property to dataSet1 and click OK.
18
Re
po
rt Sh
arp
-Sh
oo
ter
Close the Data Binding Editor by clicking the OK button.
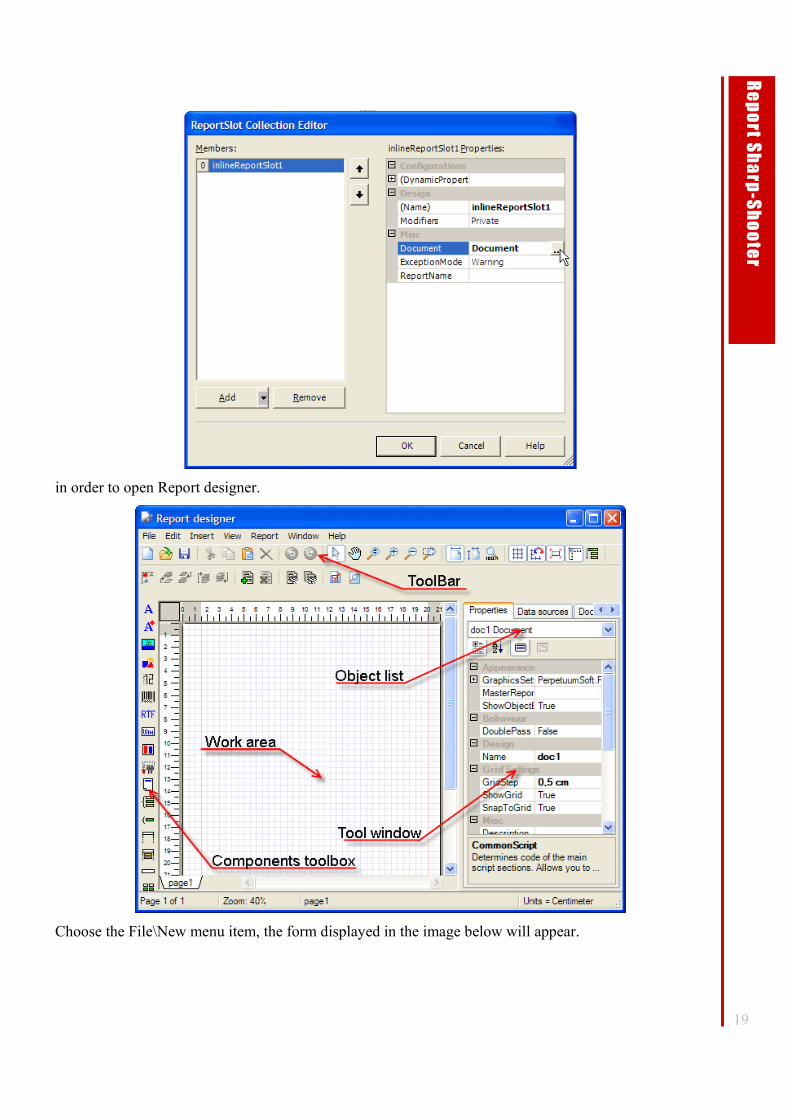
Now you should add a report. In the properties window choose the Reports property and click the
button to call the property editor. The following form will appear:
Add the InlineReportSlot object by clicking the Add button. Then choose the Document property in the
property grid and click the button
19
Re
po
rt Sh
arp
-Sh
oo
ter
in order to open Report designer.
Choose the File\New menu item, the form displayed in the image below will appear.
20
Re
po
rt Sh
arp
-Sh
oo
ter
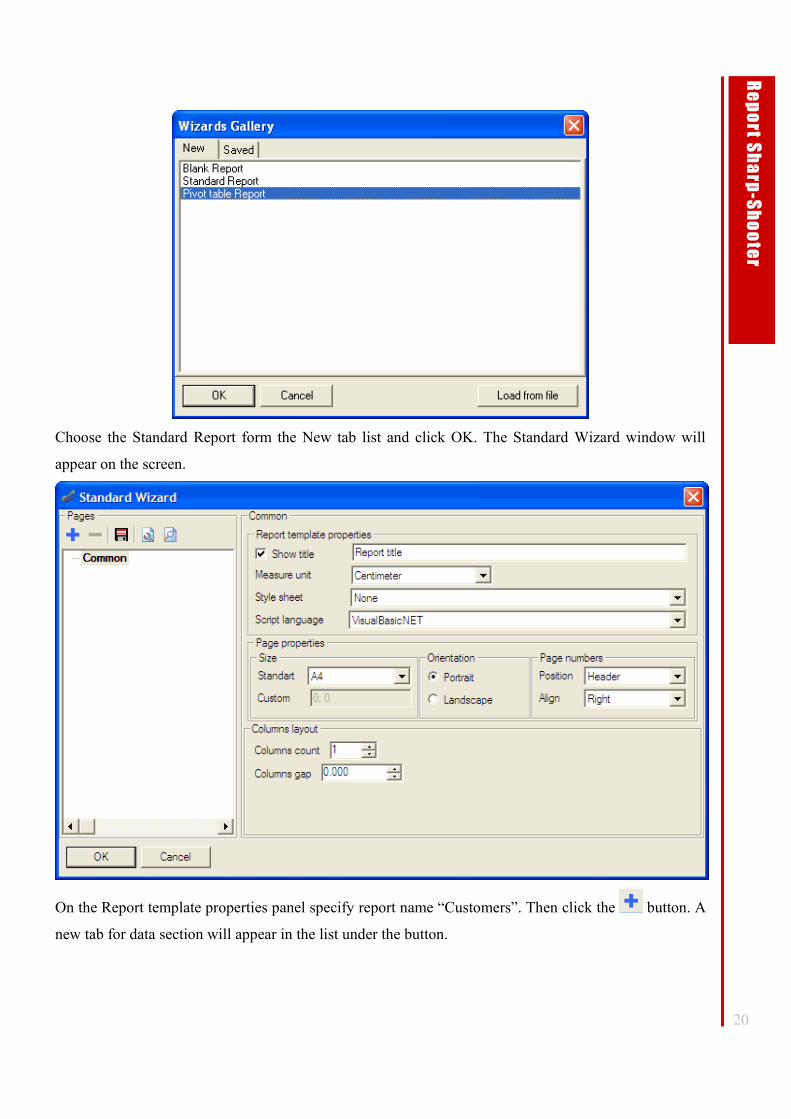
Choose the Standard Report form the New tab list and click OK. The Standard Wizard window will
appear on the screen.
On the Report template properties panel specify report name “Customers”. Then click the button. A
new tab for data section will appear in the list under the button.
21
Re
po
rt Sh
arp
-Sh
oo
ter
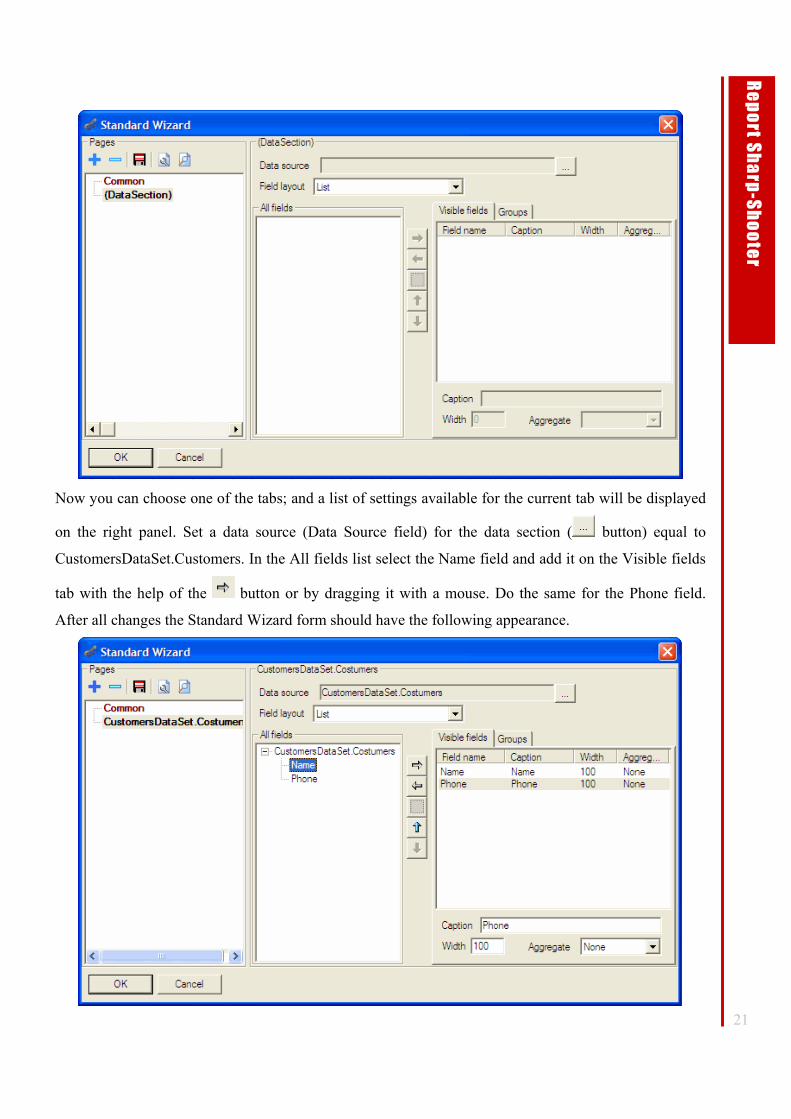
Now you can choose one of the tabs; and a list of settings available for the current tab will be displayed
on the right panel. Set a data source (Data Source field) for the data section ( button) equal to
CustomersDataSet.Customers. In the All fields list select the Name field and add it on the Visible fields
tab with the help of the button or by dragging it with a mouse. Do the same for the Phone field.
After all changes the Standard Wizard form should have the following appearance.
22
Re
po
rt Sh
arp
-Sh
oo
ter
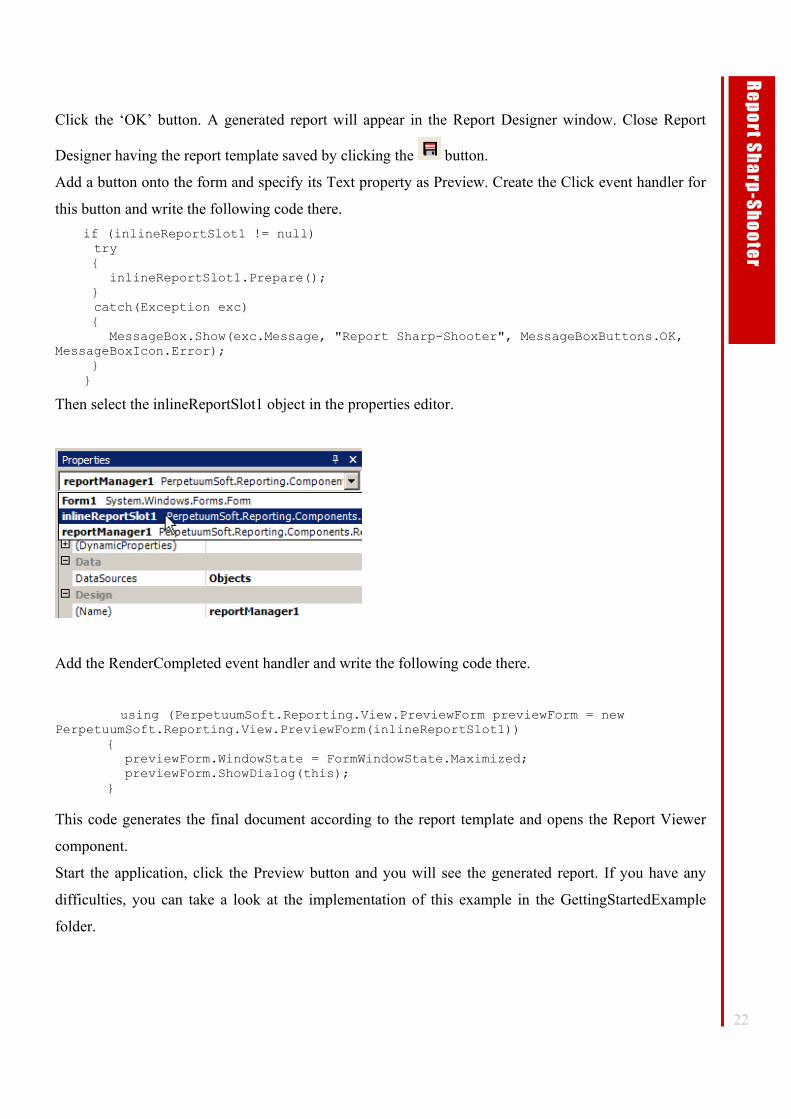
Click the ‘OK’ button. A generated report will appear in the Report Designer window. Close Report
Designer having the report template saved by clicking the button.
Add a button onto the form and specify its Text property as Preview. Create the Click event handler for
this button and write the following code there. if (inlineReportSlot1 != null) try { inlineReportSlot1.Prepare(); } catch(Exception exc) { MessageBox.Show(exc.Message, "Report Sharp-Shooter", MessageBoxButtons.OK, MessageBoxIcon.Error); } }
Then select the inlineReportSlot1 object in the properties editor.
Add the RenderCompleted event handler and write the following code there.
using (PerpetuumSoft.Reporting.View.PreviewForm previewForm = new PerpetuumSoft.Reporting.View.PreviewForm(inlineReportSlot1)) { previewForm.WindowState = FormWindowState.Maximized; previewForm.ShowDialog(this); } This code generates the final document according to the report template and opens the Report Viewer
component.
Start the application, click the Preview button and you will see the generated report. If you have any
difficulties, you can take a look at the implementation of this example in the GettingStartedExample
folder.
23
Re
po
rt Sh
arp
-Sh
oo
ter
Basic Information
Concept
Let us examine basic concepts necessary for working with Report Sharp-Shooter.
To generate a report, its template is created. A template is a set of pages (one page is usually
used). Each page contains various visual components; the components’ properties allow you to
customize the appearance of the future report. There are three ways to create a report template:
• design it in the Report Designer component;
• create it dynamically using the wizard;
• create it dynamically in a programmatic way.
A template can be saved in the xml format with the extensions *.xml or *.rst. The created template is
saved with the help of the PerpetuumSoft.Reporting.Components.ReportSlot class’s methods. The
ReportManager component is designed for storing various report sources (the Report property) and data
sources (the DataSource property). After report generation (data replacement in a template) a Final
Document is gotten. The PerpetuumSoft.Reporting.DOM.Document class is used for both representing
final documents and report templates.
Any final document is viewed in the Report Viewer component. Here you can print out the
report and save it in the XML format with the extensions *.xml or *.rsd, as well as export it to many
popular formats.
At present, Report Sharp-Shooter supports exporting to the following formats: GIF, PNG, JPG, BMP,
EMF, PDF, HTML, CSV, TXT, Excel, XML, Excel, and RTF.
After a final document is generated, you can make minor changes to it either programmatically
or using the Report Designer component that can be opened directly from the Report Viewer
component.
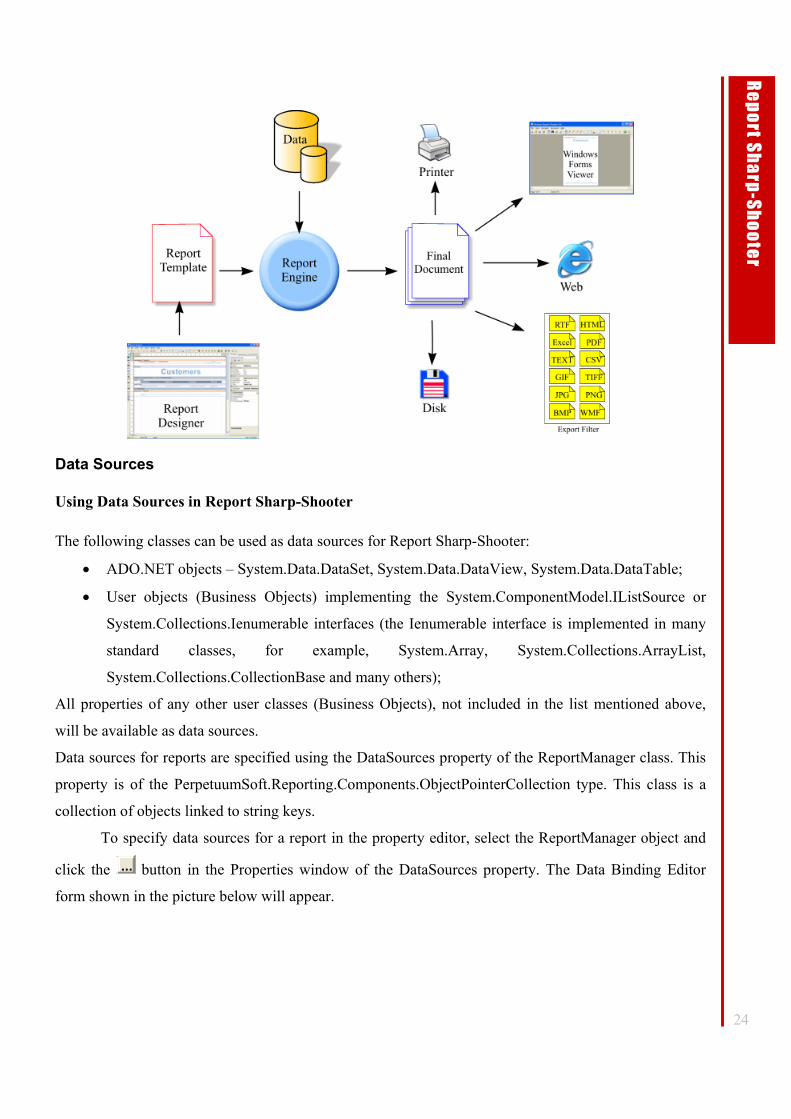
You can see how reports are generated in the picture below.
24
Re
po
rt Sh
arp
-Sh
oo
ter
Data Sources
Using Data Sources in Report Sharp-Shooter The following classes can be used as data sources for Report Sharp-Shooter:
• ADO.NET objects – System.Data.DataSet, System.Data.DataView, System.Data.DataTable;
• User objects (Business Objects) implementing the System.ComponentModel.IListSource or
System.Collections.Ienumerable interfaces (the Ienumerable interface is implemented in many
standard classes, for example, System.Array, System.Collections.ArrayList,
System.Collections.CollectionBase and many others);
All properties of any other user classes (Business Objects), not included in the list mentioned above,
will be available as data sources.
Data sources for reports are specified using the DataSources property of the ReportManager class. This
property is of the PerpetuumSoft.Reporting.Components.ObjectPointerCollection type. This class is a
collection of objects linked to string keys.
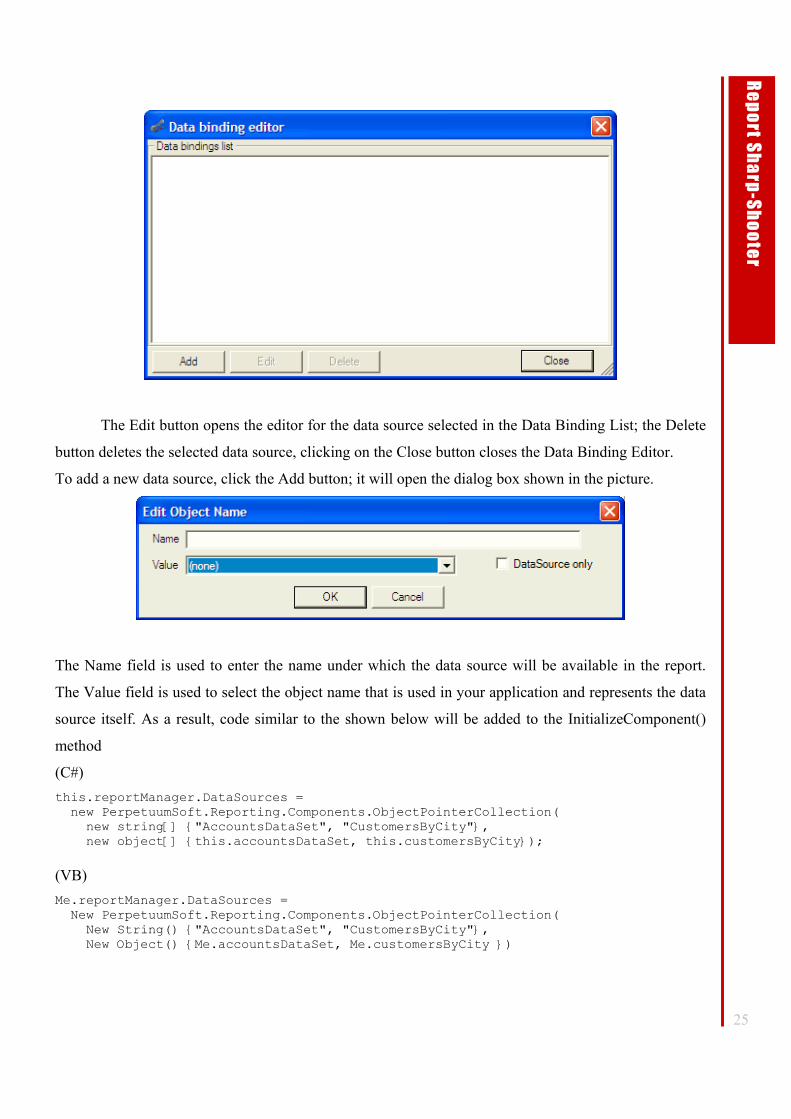
To specify data sources for a report in the property editor, select the ReportManager object and
click the button in the Properties window of the DataSources property. The Data Binding Editor
form shown in the picture below will appear.
25
Re
po
rt Sh
arp
-Sh
oo
ter
The Edit button opens the editor for the data source selected in the Data Binding List; the Delete
button deletes the selected data source, clicking on the Close button closes the Data Binding Editor.
To add a new data source, click the Add button; it will open the dialog box shown in the picture.
The Name field is used to enter the name under which the data source will be available in the report.
The Value field is used to select the object name that is used in your application and represents the data
source itself. As a result, code similar to the shown below will be added to the InitializeComponent()
method
(C#) this.reportManager.DataSources = new PerpetuumSoft.Reporting.Components.ObjectPointerCollection( new string[] {"AccountsDataSet", "CustomersByCity"}, new object[] {this.accountsDataSet, this.customersByCity}); (VB) Me.reportManager.DataSources = New PerpetuumSoft.Reporting.Components.ObjectPointerCollection( New String() {"AccountsDataSet", "CustomersByCity"}, New Object() {Me.accountsDataSet, Me.customersByCity })
26
Re
po
rt Sh
arp
-Sh
oo
ter
To be displayed in the Value list, a data source should be inherited from the
System.ComponentModel.Component class.
To add a data source from the code, you can use either the Add method of the
ObjectPointerCollection class or the Item property
(C#) reportManager.DataSources.Add("DataSourceName", dataSource); (VB) reportManager.DataSources.Add("DataSourceName", dataSource) or
(C#) reportManager.DataSources["DataSourceName"] = dataSource; (VB) reportManager.DataSources("DataSourceName ") = dataSource
The Add method has two parameters: name of the data source under which it will be available in the
report and the data source itself. In the same way we specify the name and the data source when using
the Item property.
A data source for a report can also be loaded directly into the template with the help of report scripts
(see the example GetDataExample).
Using ADO.NET Objects Let us take an example of using ADO.NET as a data source. Suppose we have a database with two
tables named “Authors” and “Books” where we store names of the authors and the titles of books they
wrote. There will be two fields in the “Authors” table: a primary key and author's name, in the “Books”
table there will be a primary key, author's key, title and price. You can find this example in the folder
ADODataSource.
Using Business Objects As it was stated above, business objects should implement either the
System.Collections.IEnumerable or System.ComponentModel.IlistSource interface (the IEnumerable
interface is implemented in many standard classes, for example, System.Array,
System.Collections.ArrayList, System.Collections. CollectionBase and many others) to be used as a
data source. There are two members defined in the IlistSource interface: the Boolean
ContainsListCollection {get;}property that does not affect Report Sharp-Shooter; and the GetList()
method that returns reference to the System.Collections.Ilist interface that in its turn implements the
Ienumerable interface.

27
Re
po
rt Sh
arp
-Sh
oo
ter
Anyway, working with a business data source is performed via the IEnumerable interface that
has a single method named GetEnumerator() defined in it; it returns reference to the
System.Collections.IEnumerator interface. This interface allows you to access all collection items. The
IEnumerator interface has the Current {get;} property object defined in it that represents the current
object in the collection and two methods: a boolean method called MoveNext() and a void method
called Reset(). The MoveNext() method provides moving on to the next item in the collection and
returns true if it is successful and false if the current item is the last item in the collection. The Reset()
method resets the enumerator; it means that the position before the first item in the collection becomes
the current one.
All properties of objects stored in business datasets will be available as data fields. If a property
is of a type that implements the IListSource or IEnumerable interface, it can also be considered as a list
in its turn. Using business data sources allows you to create complex reports with the hierarchical links.
If a data source implements neither the IListSource interface nor the IEnumerable interface, all
its properties will be available as data. Thus, we can create one record in the table.
Now let us create our data sources for the database with authors and books from the “Using
ADO.NET objects” section.
To store information about one book, create the following class public class Book { public Book() { } private string name = string.Empty; public string Name { get { return name; } set { name = value; } } private decimal price; public decimal Price { get { return price; } set {
28
Re
po
rt Sh
arp
-Sh
oo
ter
price = value; } } } This class contains two properties that will be available while creating a report.
Now add a collection class named BookCollection that implements the IEnumerable interface for
storing instances of the Book class. We will store data in the ArrayList class instance. Besides, we will
implement the Add() method to add an item to the collection and the GetEnumerator method to
implement the IEnumerable interface. The code of this class is given below public class BookCollection : IEnumerable { private ArrayList list = new ArrayList(); public BookCollection() { } public void Add(Book b) { list.Add(b); } public IEnumerator GetEnumerator() { return list.GetEnumerator(); } }
Now create a class that will be used to store information about one author. Since an author can
have numerous books, the property where books are stored must be a collection. Thus, we implement
the hierarchical link in the business data sources. public class Author { public Author() { } private string name = string.Empty; public string Name { get { return name; } set { name = value; } } private BookCollection books = new BookCollection(); public BookCollection Books { get
29
Re
po
rt Sh
arp
-Sh
oo
ter
{ return books; } } }
And finally create a collection for storing authors. For example, this class can be inherited from
System.Collections.CollectionBase that is the base class for strongly typed collections. It implements
the IEnumerable interface. public class AuthorCollection : CollectionBase { public Author Add(Author value) { base.List.Add(value as object); return value; } public void Remove(Author value) { base.List.Remove(value as object); } public void Insert(int index, Author value) { base.List.Insert(index, value as object); } public Author this[int index] { get { return (base.List[index] as Author ); } set { base.List[index] = value; } } }
In this example the BookCollection class implements the IEnumerable interface only to
demonstrate such a possibility. Of course, collections can also be stored in arrays or, for example, in the
ArrayList class instances, but it is better to use strongly typed collections (those inherited from
CollectionBase).
You can find this example in the UserDataSource folder. Data source filling and its addition to
the DataSources collection of the ReportManager class is executed in the Init() method.
Nonstandard Ways of Using Business Objects If you need to change the standard mechanism of working with business data sources to use
dynamically calculated properties instead of object properties, you should implement the
ICustomTypeDescriptor interface for an object representing one record in the data source and the
ITypedList interface for the collection where these objects are stored.

30
Re
po
rt Sh
arp
-Sh
oo
ter
Let us take this feature in our next example. Suppose we are developing a program for a
company engaged in supplying various constituents around the entire world. Obviously, we will have to
convert prices to various currencies from the main currency in our reports. You can find this example in
the CustomTypeDescriptorExample folder.
The Currency class is used to store information about possible currencies. The class has two
properties defining name and the rate used to coverting from the main currency. The SystemCurrencies
static array is also declared in the class. It is used to store all the currencies used in the system. In our
example, the value is directly assigned to the array, but in real applications you can upload this array
from a database.
To store one record representing a constituent, we use the Path class that implements the
IcustomTypeDescriptor interface. Below you can see the code of the static method generating the
collection of dynamic properties for this class. public static PropertyDescriptorCollection GetPartProperties() { PropertyDescriptorCollection props = new PropertyDescriptorCollection(null); foreach(Currency c in Currency.SystemCurrencies) { props.Add(new CurrencyPropertyDescriptor(c)); } props.Add(TypeDescriptor.CreateProperty(typeof(Part), "Name", typeof(string))); return props; } This method is called by following methods: ICustomTypeDescriptor.GetProperties(Attribute[] attributes) ICustomTypeDescriptor.GetProperties()
As you can see from the code, at first the CurrencyPropertyDescriptor class instances are created for
each currency from the Currency.SystemCurrencies array and then the name of a constituent is added.
The CurrencyPropertyDescriptor is inherited from the PropertyDescriptor class. Please pay
attention to the way the PropertyType and ComponentType properties of this class are implemented.
They return type of the property and class that implements this property. The GetValue and SetValue
methods return and set property value correspondingly.
And finally, we are going to consider the PartCollection class used to store constituents
collection. This class implements the ITypedList interface. The interface has two methods: GetListName
that returns name of the list and GetItemProperties that returns the array of the PropertyDescriptors
objects that describe dynamic properties of objects in the list. This method returns the result of the static
Part.GetPartProperties() method.
31
Re
po
rt Sh
arp
-Sh
oo
ter
Thus, it will be enough just to implement a separate report template for each country where
prices will be displayed in the required currency.
Using an XML File as a Data Source An example of using data from XML file can be found in the XmlDataSourceExample folder. In
this example, the Document CommonScript property contains descriptions of objects that will read data
from an XML file private XPathDocument doc; private XPathNavigator nav; XPathNodeIterator iTitle; XPathNodeIterator iPrice; XPathNodeIterator iFirstName; XPathNodeIterator iLastName; Initialization code is inserted in the Document object’s GenerateScript: doc = new XPathDocument("books.xml"); nav = doc.CreateNavigator(); iTitle = (XPathNodeIterator) nav.Evaluate("bookstore/book/title"); iPrice = (XPathNodeIterator) nav.Evaluate("bookstore/book/price"); iFirstName = (XPathNodeIterator) nav.Evaluate("bookstore/book/author/first-name"); iLastName = (XPathNodeIterator) nav.Evaluate("bookstore/book/author/last-name"); dataBand1.InstanceCount = iTitle.Count; Please pay attention to the last line. Here the number of records in the data source is assigned to the
DataBand InstanceCount property. The InstanceCount property defines the number of records; it means
that the section will be repeated InstanceCount times while generating a report.
The GenerateScript property of dataBand1 contains the following code iTitle.MoveNext(); iFirstName.MoveNext(); iLastName.MoveNext(); iPrice.MoveNext(); That is, we move on to the next record when each new DataBand is displayed. This code cannot be used
in the GenerateScript properties of the TextBox objects, since these objects will be destroyed and
regenerated for a new page if the next generated line does not fit into the current page. Thus we will
miss a record; and GenerateScript of the DataBand section will always be called once for each record.
Direct Access to the Database Data sources for reports can be loaded directly to the template. To do it, we use the
GenerateScript property of the document containing the entire code that loads data and adds a source to
the report. This is an example of such a code OleDbConnection cn = new OleDbConnection(); cn.ConnectionString = "Provider=\"Microsoft.Jet.OLEDB.4.0\";"+ "Data Source=\"D:\\DataBases\\database.mdb\""; cn.Open(); string sqlCmd = "select * from persons"; OleDbDataAdapter adapt = new OleDbDataAdapter(sqlCmd,cn); DataSet dataSet = new DataSet("Persons"); try
32
Re
po
rt Sh
arp
-Sh
oo
ter
{ adapt.Fill(dataSet,"Persons"); } catch(Exception exc) { MessageBox.Show(exc.Message, "Report Sharp-Shooter", MessageBoxButtons.OK, MessageBoxIcon.Error); } finally { cn.Close(); } DataObjects.Add("Persons",dataSet.Tables["Persons"]);
The last line adds a table to report data sources.
Unbound Reports It is also possible to create reports without specifying their data source. The DataBand object has
the InstanceCount property that defines how many times this object will display its content in the report.
You can find an example of an unbound report in the WithoutDataExample folder. This example
displays a multiplication table. The report template contains two DataBand sections. The dataBand2
section is embedded in the dataBand1. Both have the InstanceCount property set to 10. The following
value is assigned to the Value property of the textBox1 object dataBand1.LineNumber.ToString() + " * " + dataBand2.LineNumber.ToString() + " = " + (dataBand1.LineNumber * dataBand2.LineNumber).ToString()
The LineNumber property of the DataBand section contains number of the current line. Thus, we
consecutively display the multiplication table for 1, then for 2 and so on up to 10.
Report Parameters Custom data sources can be used as report parameters. Let us consider a simple example of using
report parameters. Suppose we need to create a report on all books in the database with their prices (see
the “Using business objects” section). But we want to provide clients from various countries with
reports containing the prices not only in our currency, but also in their national currencies. To do it, we
will need a currency exchange coefficient. At the same time, clients from our country do not need this
additional information. That is why we will need a boolean parameter defining if it is necessary to give
prices in another.
An example with this report can be found in the ParamsExample folder. There are TextBox and
CheckBox elements on the form. They will be used to enter report parameters. When the Designer
button is clicked, the Report Designer component runs, the Preview button opens the Report Viewer
component. The Exit button closes the program. To store report parameters, the par variable of the
Params type is used. The code of the Params class is given below
33
Re
po
rt Sh
arp
-Sh
oo
ter
public class Params { public Params() { } private bool show = false; public bool Show { get { return show; } set { show = value; } } private decimal factor; public decimal Factor { get { return factor; } set { factor = value; } } }
To add our parameters as a report data source, the following line is inserted in the form editor. reportManager1.DataSources["Parameters"] = par;
Now let us see how these parameters are used in the report. Start the program and click the
Design button. The right textBox4 column is displayed in the report only if the Show parameter is set to
true. In this case prices are converted according to the coefficient we have specified. It is achived due to
assigning the Value and Visible properties calculated during the report generation process. To view
these properties, select the textBox4 object and click the button in the Properties window. The
Visible property is set to GetData("Parameters.Show"), so this property will have the value returned by
the GetData method with the "Parameters.Show" parameter during the report generation process. The
GetData method returns the values of the provided data source. It means that the TextBox will be visible
only if the "Parameters.Show" value is set to true. In a similar manner, the Value property of textBox4
has the decimal value GetData("Parameters.Factor")*(decimal)dataBand2["Price"], i.e., the price of a
book multiplied by the currency exchange coefficient.
Starting from version 2.0, Report Sharp-Shooter features the mechanism of passing parameters
straight to a document. It can be demonstrated in the following example. Let us create a new project.
Add the reportManager1 component onto the form and add the inlineReportSlot1 data source in its
34
Re
po
rt Sh
arp
-Sh
oo
ter
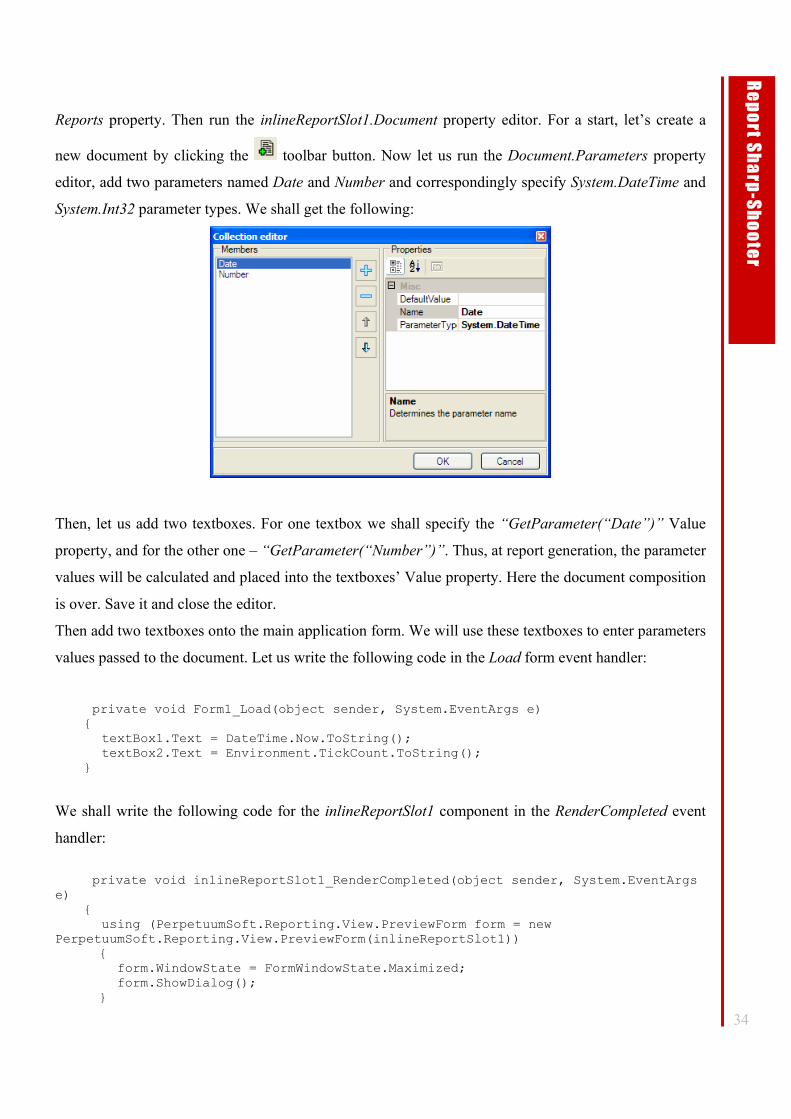
Reports property. Then run the inlineReportSlot1.Document property editor. For a start, let’s create a
new document by clicking the toolbar button. Now let us run the Document.Parameters property
editor, add two parameters named Date and Number and correspondingly specify System.DateTime and
System.Int32 parameter types. We shall get the following:
Then, let us add two textboxes. For one textbox we shall specify the “GetParameter(“Date”)” Value
property, and for the other one – “GetParameter(“Number”)”. Thus, at report generation, the parameter
values will be calculated and placed into the textboxes’ Value property. Here the document composition
is over. Save it and close the editor.
Then add two textboxes onto the main application form. We will use these textboxes to enter parameters
values passed to the document. Let us write the following code in the Load form event handler:
private void Form1_Load(object sender, System.EventArgs e) { textBox1.Text = DateTime.Now.ToString(); textBox2.Text = Environment.TickCount.ToString(); }
We shall write the following code for the inlineReportSlot1 component in the RenderCompleted event
handler:
private void inlineReportSlot1_RenderCompleted(object sender, System.EventArgs e) { using (PerpetuumSoft.Reporting.View.PreviewForm form = new PerpetuumSoft.Reporting.View.PreviewForm(inlineReportSlot1)) { form.WindowState = FormWindowState.Maximized; form.ShowDialog(); }
35
Re
po
rt Sh
arp
-Sh
oo
ter
}
In the GetReportParameter event handler we shall write the following:
private void inlineReportSlot1_GetReportParameter(object sender, PerpetuumSoft.Reporting.Components.GetReportParameterEventArgs e) { e.Parameters["Date"].Value = textBox1.Text; e.Parameters["Number"].Value = textBox2.Text; }
Now, let us add a button onto the form and write the code shown below in the Click event handler:
private void button1_Click(object sender, System.EventArgs e) { inlineReportSlot1.Prepare(); }
This example can be found in the DocumentParametersUsing catalogue.
Let us see what is happening while report rendering. A document copy is created before the beginning
of report rendering. At the same time, the handlers of the GetReportParameter event which helps to set
parameter values from an application are called. If a report contains sub reports, the event handlers for
them are called before rendering these sub reports. If a report presupposes Master report availability, the
event handlers for such Master report are called prior to the ones for a current report.
Exporting Reports At present, Report Sharp-Shooter supports reports export to the following formats: GIF, PNG,
JPG, BMP, EMF, PDF, HTML, CSV, TXT, Excel, XML, Excel, and RTF
Export filters for PNG, BMP, EMF, GIF, JPG and TIFF file formats are located in the
PerpetuumSoft.Reporting assembly; PDF filter is located in the PerpetuumSoft.Reporting.Export.Pdf
and PerpetuumSoft.Writers.Pdf assemblies; HTML filter is located in the
PerpetuumSoft.Reporting.Export.Html assembly; filters for CSV and TXT formats are located in the
PerpetuumSoft.Reporting.Export.Text assembly; Excel export filter is in
PerpetuumSoft.Reporting.Export.Excel and PerpetuumSoft.Writers.Excel; Excel XML filter is in the
PerpetuumSoft. Reporting.Export.ExcelXML assembly.
Export filters have the overloaded Export function that is used to export a document to the
corresponding format: public void Export(Document document, string fileName ) public virtual void Export(Document document,string fileName,bool showDialog ), here, document is the final document;
fileName is the name of the file the exported document will be saved to;
36
Re
po
rt Sh
arp
-Sh
oo
ter
showDialog defines whether to show the filter settings dialog box.
In case the first method is used, the filter settings dialog box will be displayed.
Exporting to the formats that use filters from the PerpetuumSoft.Reporting assembly is always
available in Report Viewer. To use the rest of filters, you will have to enable the corresponding
assembly and create at least one instance of this filter class. The simplest way to do it is to place the
needed filter on the form.
Besides, the PerpetuumSoft.Reporting.Export.RegisterExportFilter(ExportFilterFactory factory) static
method and the PerpetuumSoft.Reporting.Export.ExportFilters static collection are accessible in order to
manipulate available export filters.
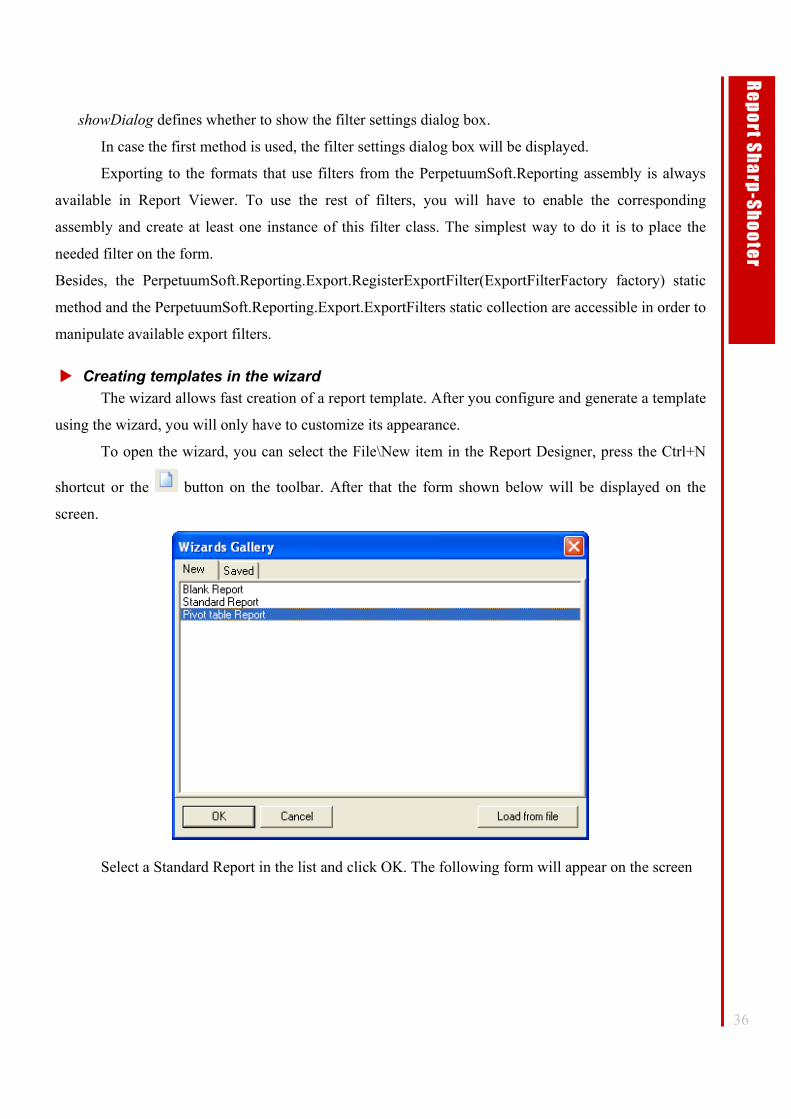
Creating templates in the wizard The wizard allows fast creation of a report template. After you configure and generate a template
using the wizard, you will only have to customize its appearance.
To open the wizard, you can select the File\New item in the Report Designer, press the Ctrl+N
shortcut or the button on the toolbar. After that the form shown below will be displayed on the
screen.
Select a Standard Report in the list and click OK. The following form will appear on the screen
37
Re
po
rt Sh
arp
-Sh
oo
ter
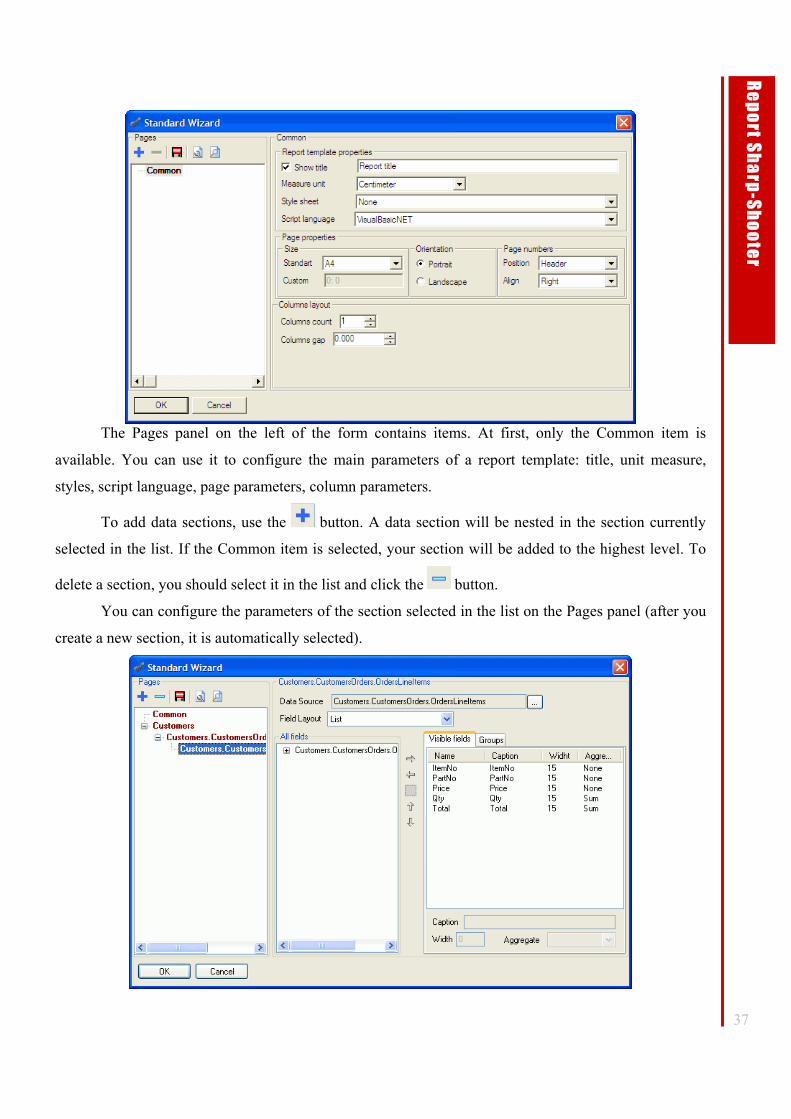
The Pages panel on the left of the form contains items. At first, only the Common item is
available. You can use it to configure the main parameters of a report template: title, unit measure,
styles, script language, page parameters, column parameters.
To add data sections, use the button. A data section will be nested in the section currently
selected in the list. If the Common item is selected, your section will be added to the highest level. To
delete a section, you should select it in the list and click the button.
You can configure the parameters of the section selected in the list on the Pages panel (after you
create a new section, it is automatically selected).
38
Re
po
rt Sh
arp
-Sh
oo
ter
Use the Data Source field to specify data source name and the Field layout drop-down list to
specify the fields layout type. When the Field Layout value is set to List, fields are displayed as a table,
when its value is set to Card, each field will be displayed as a new line.
Fields available in the data source are displayed in the All fields list. Fields that will be present in the
report should be moved to the Visible fields tab. You can use the and/or buttons to add and
remove fields from the Visible fields list. To add a blank field, you should click the button. To
change the field position, you should use the and/or buttons. You can specify field caption and
width in the Caption and Width input fields. The Aggregate column allows you to specify an aggregate
function that will be calculated by this field. In this case, the LineNumber property of all data sections
the current section is included to will be defined as a condition for aggregate grouping.
To specify grouping conditions, you should add the corresponding fields to the list on the Groups tab.
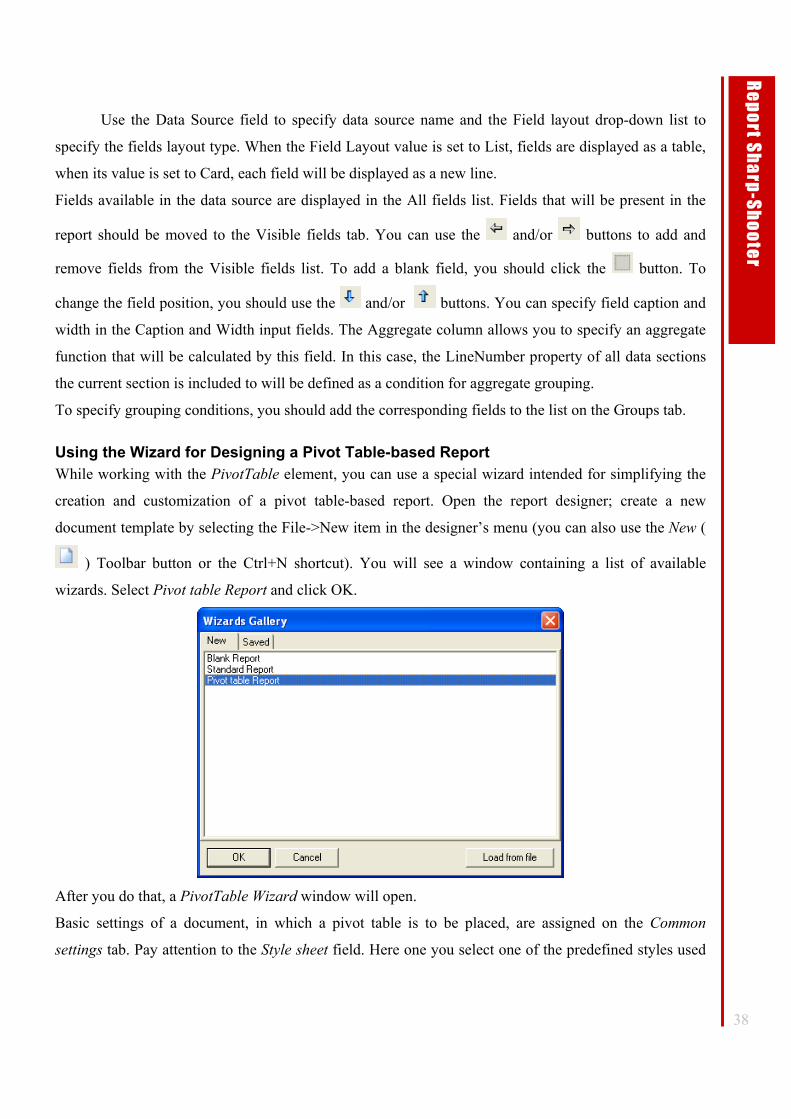
Using the Wizard for Designing a Pivot Table-based Report While working with the PivotTable element, you can use a special wizard intended for simplifying the
creation and customization of a pivot table-based report. Open the report designer; create a new
document template by selecting the File->New item in the designer’s menu (you can also use the New (
) Toolbar button or the Ctrl+N shortcut). You will see a window containing a list of available
wizards. Select Pivot table Report and click OK.
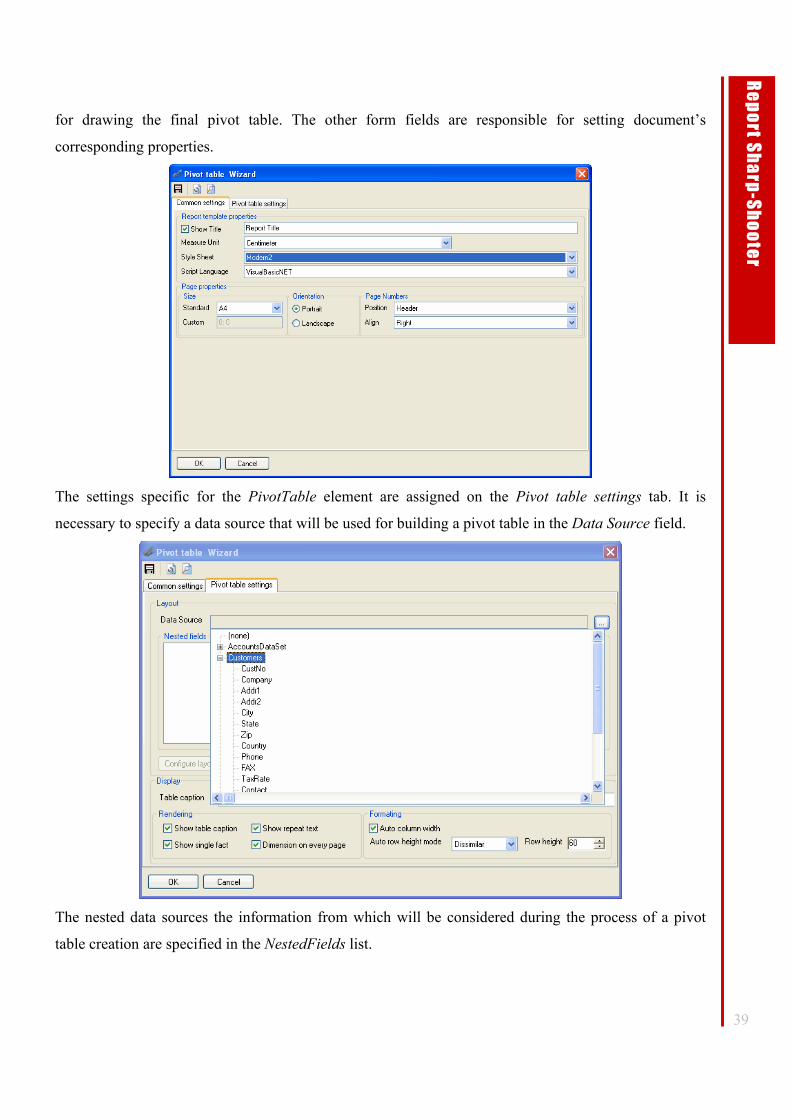
After you do that, a PivotTable Wizard window will open.
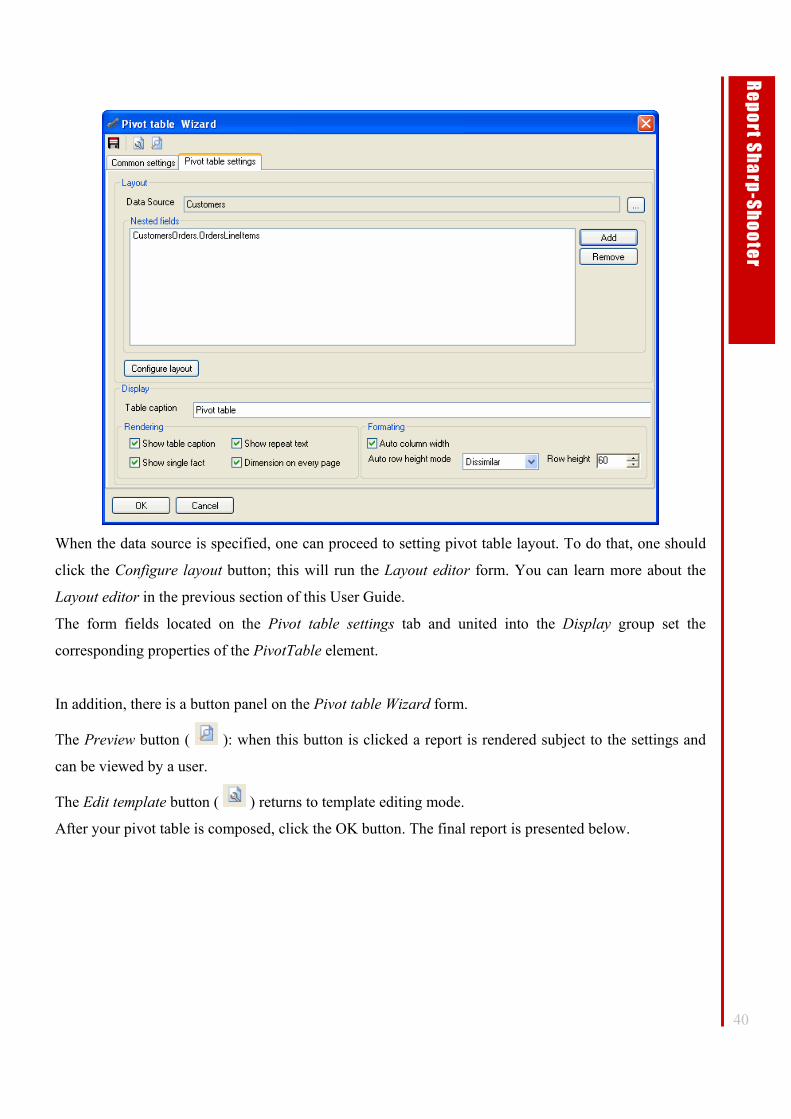
Basic settings of a document, in which a pivot table is to be placed, are assigned on the Common
settings tab. Pay attention to the Style sheet field. Here one you select one of the predefined styles used
39
Re
po
rt Sh
arp
-Sh
oo
ter
for drawing the final pivot table. The other form fields are responsible for setting document’s
corresponding properties.
The settings specific for the PivotTable element are assigned on the Pivot table settings tab. It is
necessary to specify a data source that will be used for building a pivot table in the Data Source field.
The nested data sources the information from which will be considered during the process of a pivot
table creation are specified in the NestedFields list.
40
Re
po
rt Sh
arp
-Sh
oo
ter
When the data source is specified, one can proceed to setting pivot table layout. To do that, one should
click the Configure layout button; this will run the Layout editor form. You can learn more about the
Layout editor in the previous section of this User Guide.
The form fields located on the Pivot table settings tab and united into the Display group set the
corresponding properties of the PivotTable element.
In addition, there is a button panel on the Pivot table Wizard form.
The Preview button ( ): when this button is clicked a report is rendered subject to the settings and
can be viewed by a user.
The Edit template button ( ) returns to template editing mode.
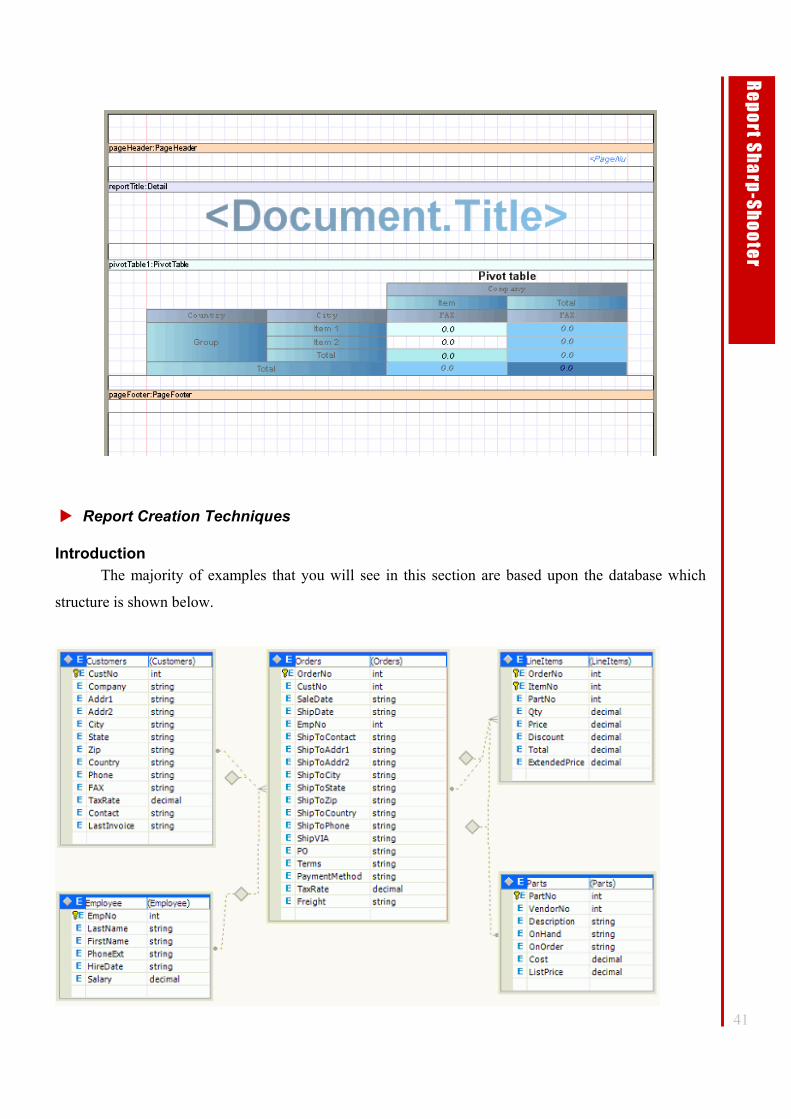
After your pivot table is composed, click the OK button. The final report is presented below.
41
Re
po
rt Sh
arp
-Sh
oo
ter
Report Creation Techniques
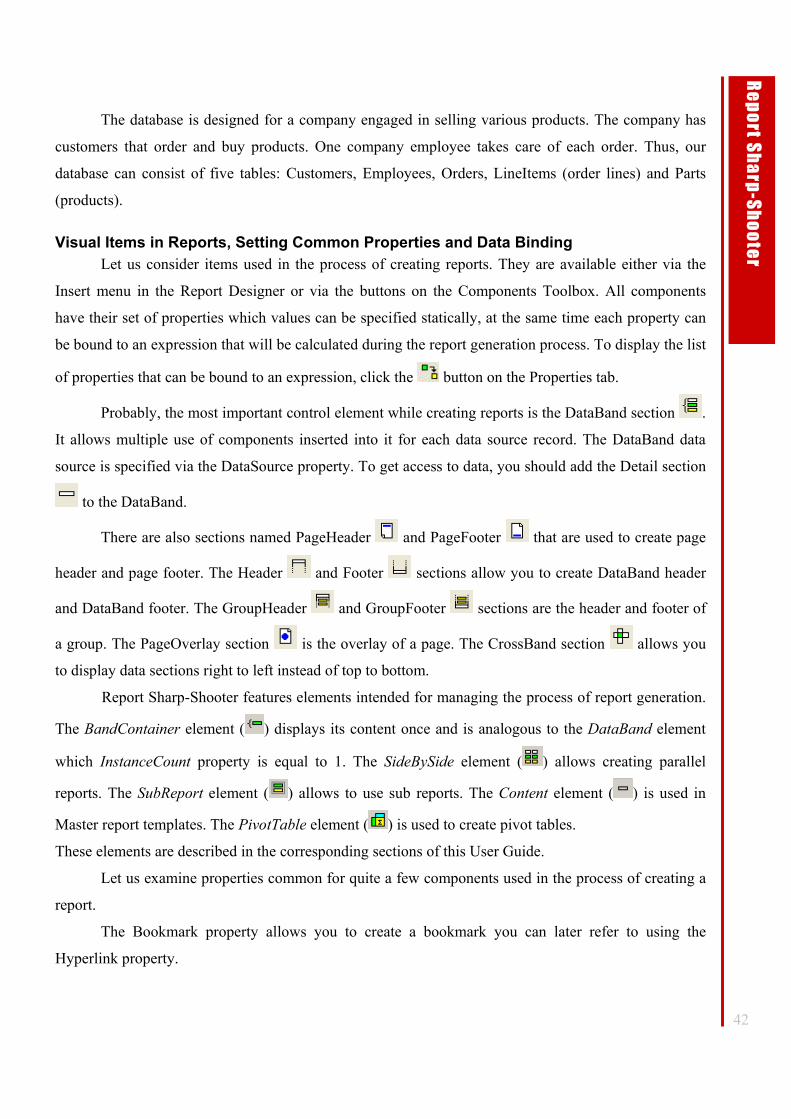
Introduction The majority of examples that you will see in this section are based upon the database which
structure is shown below.
42
Re
po
rt Sh
arp
-Sh
oo
ter
The database is designed for a company engaged in selling various products. The company has
customers that order and buy products. One company employee takes care of each order. Thus, our
database can consist of five tables: Customers, Employees, Orders, LineItems (order lines) and Parts
(products).
Visual Items in Reports, Setting Common Properties and Data Binding Let us consider items used in the process of creating reports. They are available either via the
Insert menu in the Report Designer or via the buttons on the Components Toolbox. All components
have their set of properties which values can be specified statically, at the same time each property can
be bound to an expression that will be calculated during the report generation process. To display the list
of properties that can be bound to an expression, click the button on the Properties tab.
Probably, the most important control element while creating reports is the DataBand section .
It allows multiple use of components inserted into it for each data source record. The DataBand data
source is specified via the DataSource property. To get access to data, you should add the Detail section
to the DataBand.
There are also sections named PageHeader and PageFooter that are used to create page
header and page footer. The Header and Footer sections allow you to create DataBand header
and DataBand footer. The GroupHeader and GroupFooter sections are the header and footer of
a group. The PageOverlay section is the overlay of a page. The CrossBand section allows you
to display data sections right to left instead of top to bottom.
Report Sharp-Shooter features elements intended for managing the process of report generation.
The BandContainer element ( ) displays its content once and is analogous to the DataBand element
which InstanceCount property is equal to 1. The SideBySide element ( ) allows creating parallel
reports. The SubReport element ( ) allows to use sub reports. The Content element ( ) is used in
Master report templates. The PivotTable element ( ) is used to create pivot tables.
These elements are described in the corresponding sections of this User Guide.
Let us examine properties common for quite a few components used in the process of creating a
report.
The Bookmark property allows you to create a bookmark you can later refer to using the
Hyperlink property.
43
Re
po
rt Sh
arp
-Sh
oo
ter
The Hyperlink property allows you to create a link that is followed when the object is clicked. In
this case searching is done in the following way. If the link is found among the bookmarks of objects
included in the report, the corresponding report part is opened; the rest of links is passed to the operating
system that decides what application should be used for this link.
The Border property allows you to specify whether borders should be displayed and set the style
of lines.
The CanGrow property allows you to enable enlarging objects if their content inserted during the
report generation process does not fit to the size specified to the object in the template.
The CanShrink property allows you to enable shrinking objects if their content inserted during
the report generation process is smaller in size than the size of the object specified in the template.
The GrowToBottom allows you to enable enlarging objects in the final document so that it can
reach the bottom of its section irrespective of its size in the template.
The Fill property defines the color and fill style for the area occupied by the object.
The Location and Size properties define the position and size of the upper-left corner of the
object.
The Margins property defines the size of margins in the object.
The Name property allows you to specify an object name.
The StyleName property defines the style used for the control element.
The Tag property is used to store additional information about the object.
The Visible property defines the visibility of the object.
Now let us consider visual components used for creating a report.
TextBox
This component allows you to display text information. The Text property defines some static
value for the text, it is possible to calculate this value dynamically by specifying an expression for the
Value property. For example, you can take the value of a field from your data source. If the Value
property is specified, the Text property is ignored. The component has also the Font property defining
text font, its TextAlign property defines text alignment, the TextFill property defines text color and text
style, and the TextFormat property defines text format.
More details about specifying a text format can be found in the .NET Framework Developer’s
Guide Formatting types.
AdvancedText
This component allows displaying information as formatted text. It is possible to assign
paragraph and text styles and to use expressions directly within a certain text item. The formatted text
44
Re
po
rt Sh
arp
-Sh
oo
ter
can be defined with the help of: an HTML similar markup language (the Text property), an RTF format
subset (the RtfText property). For more details see the “Using AdvancedText component” section.
Picture
The Picture object allows you to include pictures in the report. This object has the Image
property allowing you to specify the image; it also has the ImageAlign property that allows specifying
the alignment for the picture and the SizeMode property making it possible to specify how the picture
should be stretched.
Shape
The Shape object allows you to display various shapes. A shape is specified in the ShapeStyle
property, the Line property allows you to specify the type of lines while the Shadow and ShadowFill
properties define its shadow and fill.
ZipCode
This object allows you to display a zip code. Its value is specified in the Code property.
BarCode
The BarCode object allows you to display a bar code. Its value is specified in the Code property,
the CodeType property is used to specify the type of code.
RichText
RichText allows you to display the text in the RTF format. The text is specified in the RTFText
property.
WinFormsControl
This object allows you to include a Windows Forms control element in the report. The
ControlTypeName property allows you to specify the type for the control element.
Using Expressions and Scripts
General Overview All expressions and scripts in a report template are written in the programming language you
select. C#, Visual Basic .NET or any other language supporting the .NET environment can be used for
that.
Attention: All scripts are saved in a template as a source code, that is why the client computer
where the report will be generated should have the corresponding compiler installed on it. The
compilers of the C#, Visual Basic .NET and Jscript .NET languages are included in the Microsoft
.NET Framework package.
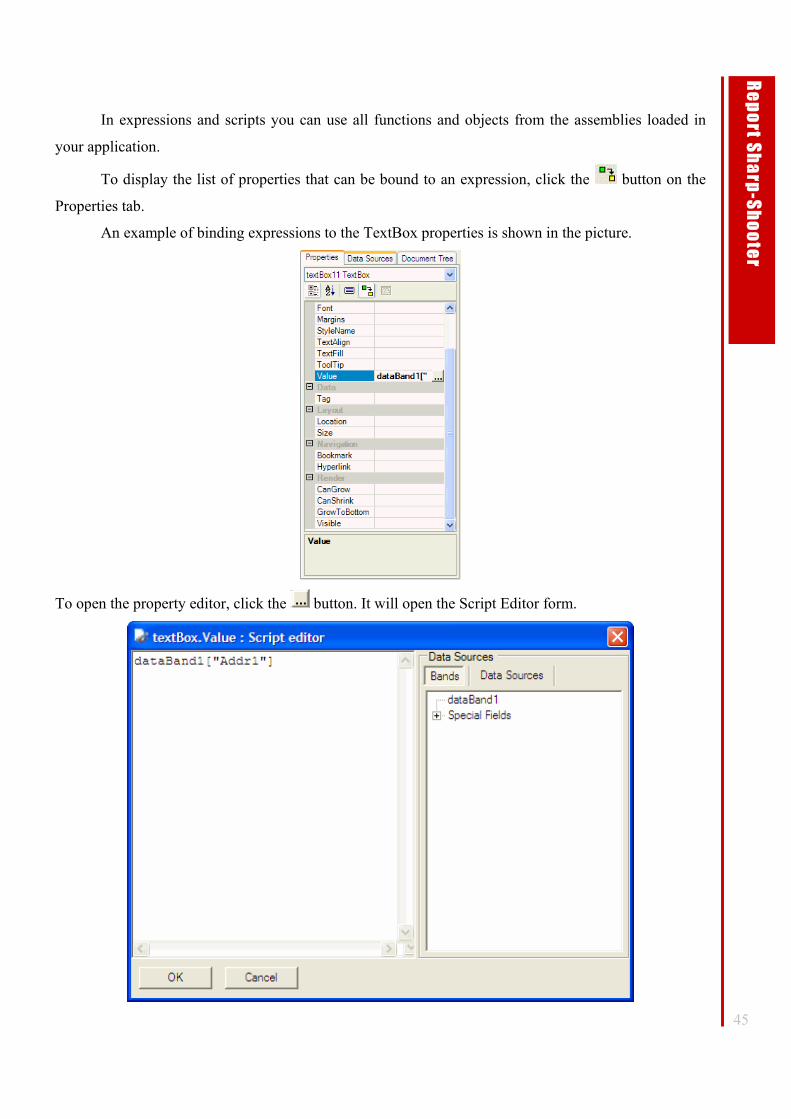
45
Re
po
rt Sh
arp
-Sh
oo
ter
In expressions and scripts you can use all functions and objects from the assemblies loaded in
your application.
To display the list of properties that can be bound to an expression, click the button on the
Properties tab.
An example of binding expressions to the TextBox properties is shown in the picture.
To open the property editor, click the button. It will open the Script Editor form.
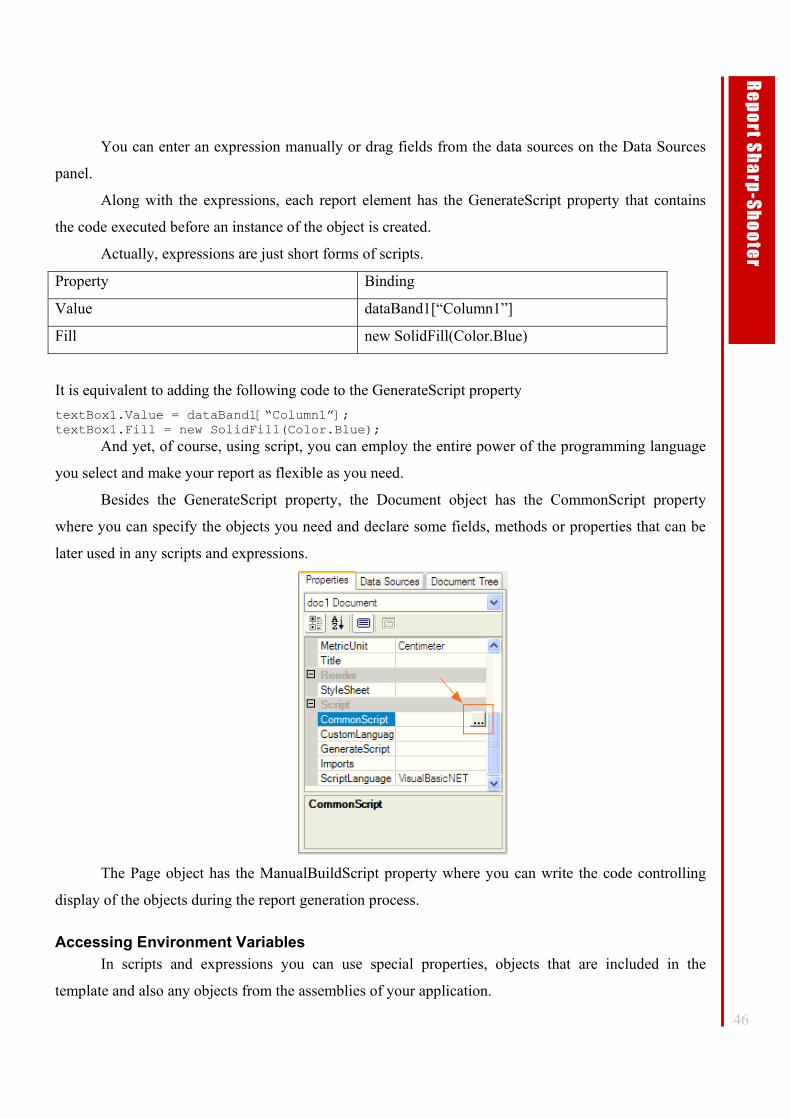
46
Re
po
rt Sh
arp
-Sh
oo
ter
You can enter an expression manually or drag fields from the data sources on the Data Sources
panel.
Along with the expressions, each report element has the GenerateScript property that contains
the code executed before an instance of the object is created.
Actually, expressions are just short forms of scripts.
Property Binding
Value dataBand1[“Column1”]
Fill new SolidFill(Color.Blue)
It is equivalent to adding the following code to the GenerateScript property textBox1.Value = dataBand1[“Column1”]; textBox1.Fill = new SolidFill(Color.Blue);
And yet, of course, using script, you can employ the entire power of the programming language
you select and make your report as flexible as you need.
Besides the GenerateScript property, the Document object has the CommonScript property
where you can specify the objects you need and declare some fields, methods or properties that can be
later used in any scripts and expressions.
The Page object has the ManualBuildScript property where you can write the code controlling
display of the objects during the report generation process.
Accessing Environment Variables In scripts and expressions you can use special properties, objects that are included in the
template and also any objects from the assemblies of your application.
47
Re
po
rt Sh
arp
-Sh
oo
ter
Template objects are represented as global variables with the corresponding names stored in the
Name field: textBox1.Text = “New Text”; etc.
During the report generation process, the following special properties are available
Property Value
PageNumber Current page number
PageCount Total number of pages in the report
ColumnNumber Current column number
Now Date when report generation was started
Document.Title Document title
Document.Description Document description
DataObjects Collection of data sources
Attention. During the first pass, the PageCount property is always equal to PageNumber as the
total number of pages is not yet known. If you want to use this property, make your report
double-pass. To do it, set the DoublePass property of the Document object to true.
Please, pay attention to the DataObjects property. This property allows you to access all data
sources of your report. Thus, you can use methods of data source objects to calculate some values. For
example, you can calculate aggregate functions using the Compute method of the
System.Data.DataTable object. (DataObjects["AccountsDataSet"] as DataSet).Tables["LineItems"].Compute("Sum(Price)", "OrderNo = " + dataBand1["OrderNo"])
To sum it up, you can use in scripts and expressions the following elements:
• all properties and functions available in the
PerpetuumSoft.Reporting.Rendering.ReportScriptBase class;
• all objects included in the template;
• any objects and functions from the assemblies loaded in your application;
• all objects and methods described in the Document.CommonScript property.
Examples of Using Scripts
Color Management

48
Re
po
rt Sh
arp
-Sh
oo
ter
Let us create a report where 100 random numbers are generated and mark negative ones with red
color. You can find this example in the TextFillExample folder. An array with random numbers is used
as a data source. The following value is assigned to the TextFill property (int)dataBand1.DataItem >= 0 ? null : new SolidFill(Color.Red) The Document’s Imports property has the string System.Drawing inserted into it. All namespaces used
in the scripts are specified in this property. This task can be also implemented with the help of styles.
Visibility Management Let us create an example that will display the number of the current line and only odd lines will
be visible. You can find this example in the VisibleBindingExample folder. In our example, the
DataBand section has the InstanceCount property set to 100. This property defines the amount of times
the DataBand section will display its content in the report. The TextBox object in the template is used to
display the number of the current line, while the following value is assigned to the Visible property of
the Detail object:
(C#) dataBand1.LineNumber % 2 == 0 ? false : true (VB) IIf(dataBand1.LineNumber Mod 2 = 0,false,true) Detail is visible only if the current line is an odd one. If we want to manage the visibility of the TextBox
object instead of the Detail object, there will be an empty line displayed between odd lines: it is the
Detail object with the invisible TextBox object.
Position Management The following example shows how you can manage the position of an object. You can find this
example in the LocationBindingExample folder. Similarly to the previous example, the InstanceCount
property of the DataBand object is set to 100. In our example, each five TextBox objects are displayed
with a 3.5-centimeter shift to the right. To make it possible, the following value is assigned to the
dynamic Location property
(C#) new PerpetuumSoft.Framework.Drawing.Vector(1.5f+3.5f*((dataBand1.LineNumber - 1) % 5),0f).ConvertUnits(Unit.Centimeter,Unit.InternalUnit) (VB)
New PerpetuumSoft.Framework.Drawing.Vector(1.5f+3.5f*((dataBand1.LineNumber - 1) Mod 5),0f).ConvertUnits(Unit.Centimeter,Unit.InternalUnit) The ConvertUnits method converts unit measure.
Accessing Application Functions

49
Re
po
rt Sh
arp
-Sh
oo
ter
As it was shown above, all objects from the assemblies of your application are available for using in
scripts. Let us consider a simple example of using a function from the application. You can find this
example in the HostingApplicationExample folder. The static GetString() function declared in the class
of the main form returns the string “Hello from HostingApplicationExample.exe”. To access the form
class, just add the namespace where the form is stored to the Imports property of the Document object.
The GetString() function is invoked in the Value property of the textBox1 object.
Calculating a Rrunning Sum Let us take an example of using a script to calculate the running sum. You can find this example
in the CustomScript folder. There are two reports in this example. The first one displays an array of 100
random numbers and the sum of all previous elements opposite each number. To calculate the sum, the
int sum=0 variable is declared in the CommonScript property of the Document object; GenerateScript of
DataBand contains the following code
sum += (int) dataBand1.DataItem; It means that each time we move on to a new record, the value of the next array element is added to the
sum. You cannot put this code into the GenerateScript property of the TextBox object that is used to
display the sum, since if some generated line does not fit into the current page, all visual components
will be generated once again and we will add one and the same number to the sum twice.
In the second example, the array is displayed in reverse order and the sum of the current element
with all the following elements is displayed opposite each number. In this case, we will have to make
the report double-pass. To do it, set the DoublePass property of the Document object to true. There are
two int variables: sum1 = 0 and sum2 = 0 - declared in Document CommonScript property. The sum of
elements during the first pass is calculated in the variable sum1, and during the second pass it is done in
sum2. To make it possible, the following code is added to the DataBand GenerateScript property: if(!Engine.IsDoublePass) sum1 += (int) dataBand1.DataItem; else sum2 += (int) dataBand1.DataItem; The IsDoublePass property is false during the first pass and it is true during the second pass. The
following value is assigned to the dynamic Value property of the TextBox sum1-sum2+(int)dataBand1.DataItem
Scripting Background The information below is given for those who want to know the inner mechanism of using
scripts in the report manager.
Actually, all scripts and expressions form a class with the following structure public class Script : PerpetuumSoft.Reporting.Rendering.ReportScriptBase
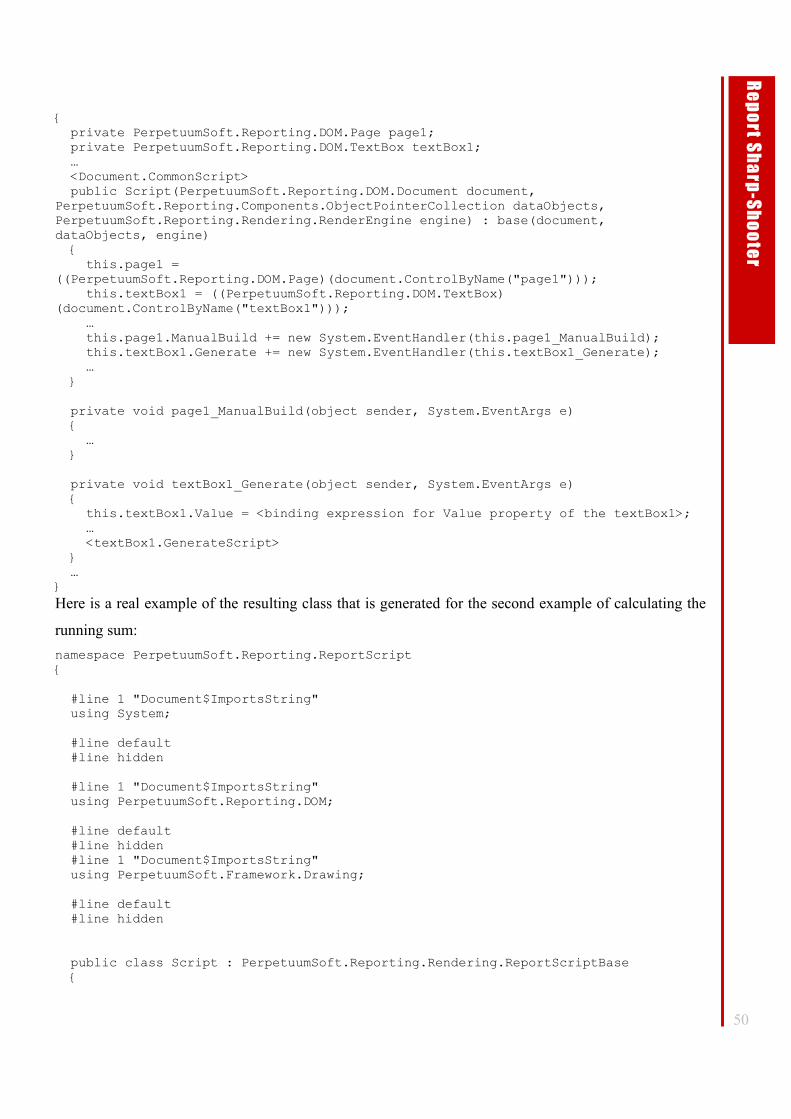
50
Re
po
rt Sh
arp
-Sh
oo
ter
{ private PerpetuumSoft.Reporting.DOM.Page page1; private PerpetuumSoft.Reporting.DOM.TextBox textBox1; … <Document.CommonScript> public Script(PerpetuumSoft.Reporting.DOM.Document document, PerpetuumSoft.Reporting.Components.ObjectPointerCollection dataObjects, PerpetuumSoft.Reporting.Rendering.RenderEngine engine) : base(document, dataObjects, engine) { this.page1 = ((PerpetuumSoft.Reporting.DOM.Page)(document.ControlByName("page1"))); this.textBox1 = ((PerpetuumSoft.Reporting.DOM.TextBox) (document.ControlByName("textBox1"))); … this.page1.ManualBuild += new System.EventHandler(this.page1_ManualBuild); this.textBox1.Generate += new System.EventHandler(this.textBox1_Generate); … } private void page1_ManualBuild(object sender, System.EventArgs e) { … } private void textBox1_Generate(object sender, System.EventArgs e) { this.textBox1.Value = <binding expression for Value property of the textBox1>; … <textBox1.GenerateScript> } … } Here is a real example of the resulting class that is generated for the second example of calculating the
running sum: namespace PerpetuumSoft.Reporting.ReportScript { #line 1 "Document$ImportsString" using System; #line default #line hidden #line 1 "Document$ImportsString" using PerpetuumSoft.Reporting.DOM; #line default #line hidden #line 1 "Document$ImportsString" using PerpetuumSoft.Framework.Drawing; #line default #line hidden public class Script : PerpetuumSoft.Reporting.Rendering.ReportScriptBase {
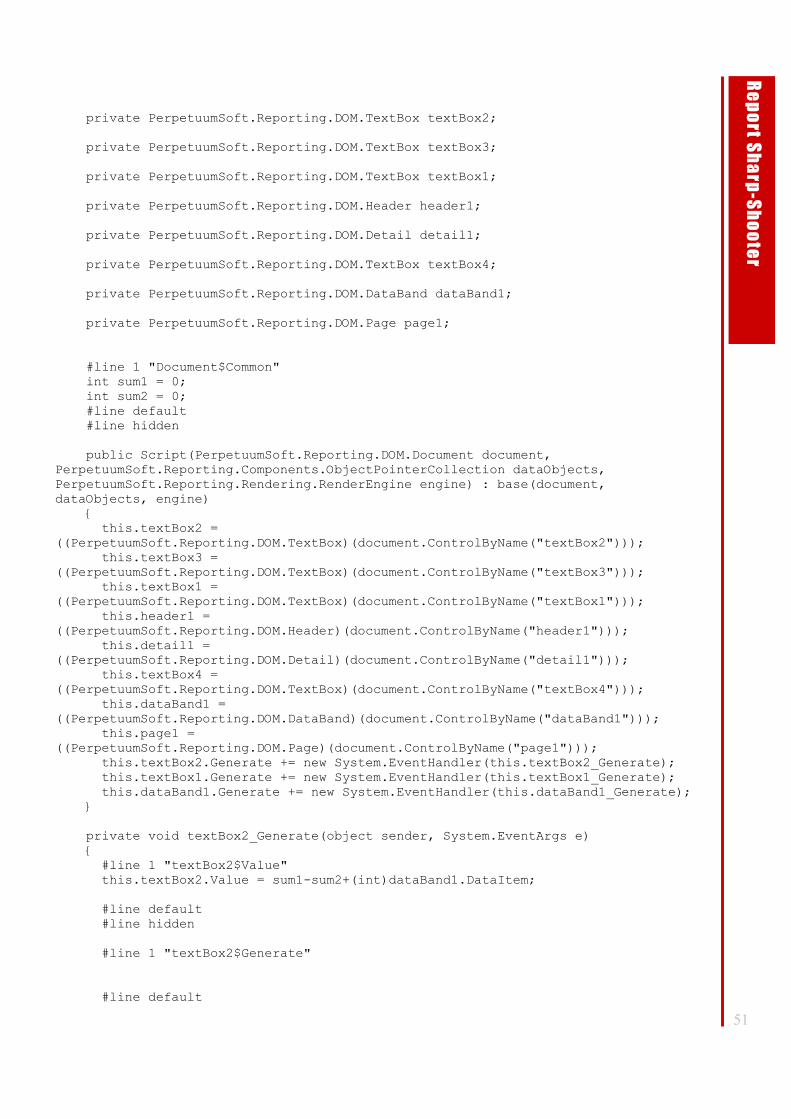
51
Re
po
rt Sh
arp
-Sh
oo
ter
private PerpetuumSoft.Reporting.DOM.TextBox textBox2; private PerpetuumSoft.Reporting.DOM.TextBox textBox3; private PerpetuumSoft.Reporting.DOM.TextBox textBox1; private PerpetuumSoft.Reporting.DOM.Header header1; private PerpetuumSoft.Reporting.DOM.Detail detail1; private PerpetuumSoft.Reporting.DOM.TextBox textBox4; private PerpetuumSoft.Reporting.DOM.DataBand dataBand1; private PerpetuumSoft.Reporting.DOM.Page page1; #line 1 "Document$Common" int sum1 = 0; int sum2 = 0; #line default #line hidden public Script(PerpetuumSoft.Reporting.DOM.Document document, PerpetuumSoft.Reporting.Components.ObjectPointerCollection dataObjects, PerpetuumSoft.Reporting.Rendering.RenderEngine engine) : base(document, dataObjects, engine) { this.textBox2 = ((PerpetuumSoft.Reporting.DOM.TextBox)(document.ControlByName("textBox2"))); this.textBox3 = ((PerpetuumSoft.Reporting.DOM.TextBox)(document.ControlByName("textBox3"))); this.textBox1 = ((PerpetuumSoft.Reporting.DOM.TextBox)(document.ControlByName("textBox1"))); this.header1 = ((PerpetuumSoft.Reporting.DOM.Header)(document.ControlByName("header1"))); this.detail1 = ((PerpetuumSoft.Reporting.DOM.Detail)(document.ControlByName("detail1"))); this.textBox4 = ((PerpetuumSoft.Reporting.DOM.TextBox)(document.ControlByName("textBox4"))); this.dataBand1 = ((PerpetuumSoft.Reporting.DOM.DataBand)(document.ControlByName("dataBand1"))); this.page1 = ((PerpetuumSoft.Reporting.DOM.Page)(document.ControlByName("page1"))); this.textBox2.Generate += new System.EventHandler(this.textBox2_Generate); this.textBox1.Generate += new System.EventHandler(this.textBox1_Generate); this.dataBand1.Generate += new System.EventHandler(this.dataBand1_Generate); } private void textBox2_Generate(object sender, System.EventArgs e) { #line 1 "textBox2$Value" this.textBox2.Value = sum1-sum2+(int)dataBand1.DataItem; #line default #line hidden #line 1 "textBox2$Generate" #line default
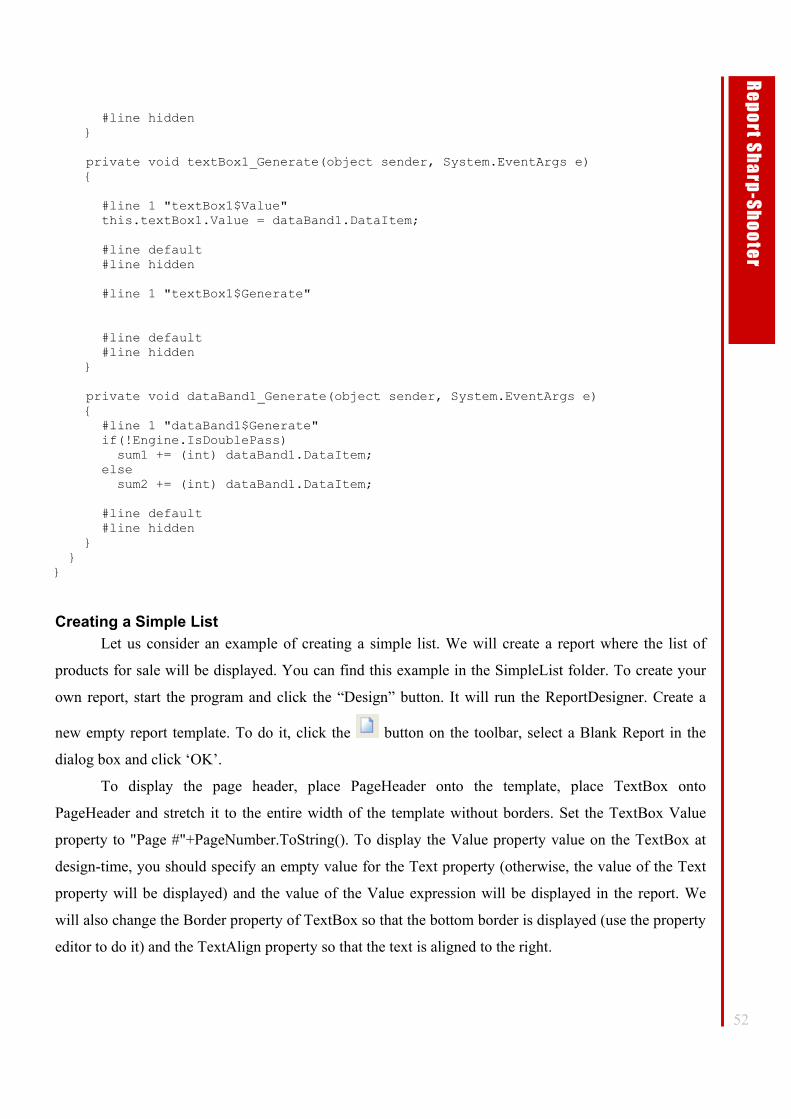
52
Re
po
rt Sh
arp
-Sh
oo
ter
#line hidden } private void textBox1_Generate(object sender, System.EventArgs e) { #line 1 "textBox1$Value" this.textBox1.Value = dataBand1.DataItem; #line default #line hidden #line 1 "textBox1$Generate" #line default #line hidden } private void dataBand1_Generate(object sender, System.EventArgs e) { #line 1 "dataBand1$Generate" if(!Engine.IsDoublePass) sum1 += (int) dataBand1.DataItem; else sum2 += (int) dataBand1.DataItem; #line default #line hidden } } }
Creating a Simple List Let us consider an example of creating a simple list. We will create a report where the list of
products for sale will be displayed. You can find this example in the SimpleList folder. To create your
own report, start the program and click the “Design” button. It will run the ReportDesigner. Create a
new empty report template. To do it, click the button on the toolbar, select a Blank Report in the
dialog box and click ‘OK’.
To display the page header, place PageHeader onto the template, place TextBox onto
PageHeader and stretch it to the entire width of the template without borders. Set the TextBox Value
property to "Page #"+PageNumber.ToString(). To display the Value property value on the TextBox at
design-time, you should specify an empty value for the Text property (otherwise, the value of the Text
property will be displayed) and the value of the Value expression will be displayed in the report. We
will also change the Border property of TextBox so that the bottom border is displayed (use the property
editor to do it) and the TextAlign property so that the text is aligned to the right.
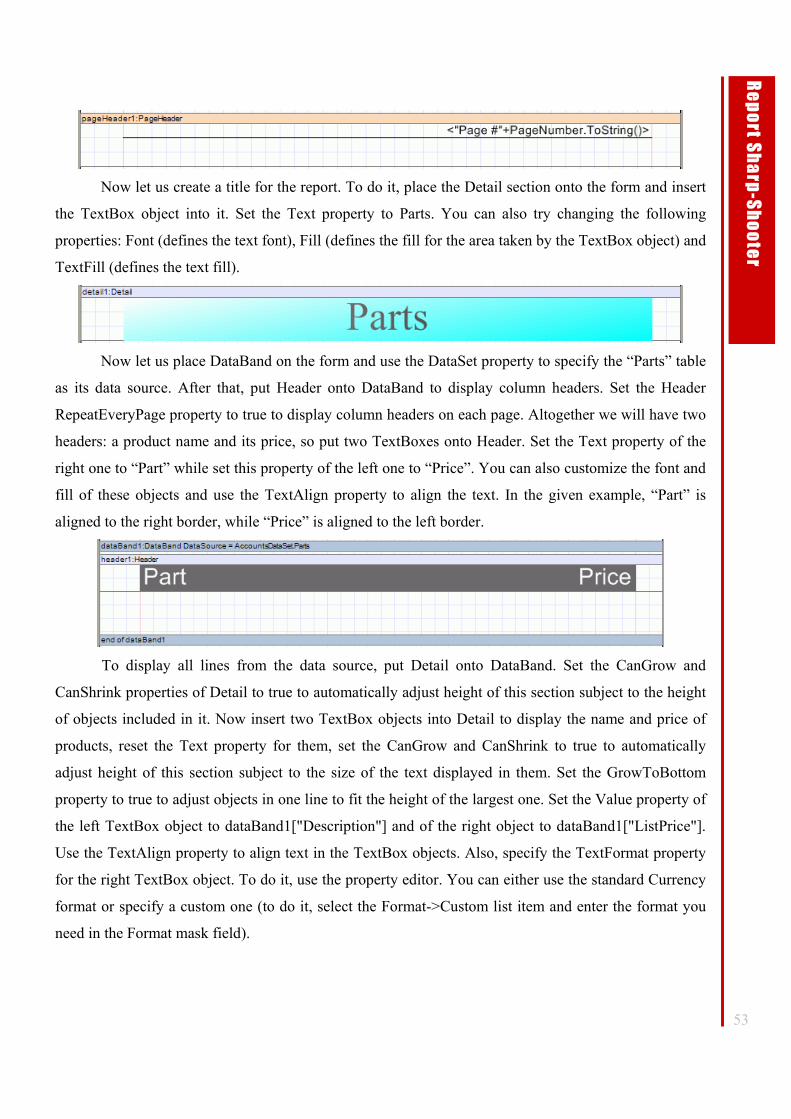
53
Re
po
rt Sh
arp
-Sh
oo
ter
Now let us create a title for the report. To do it, place the Detail section onto the form and insert
the TextBox object into it. Set the Text property to Parts. You can also try changing the following
properties: Font (defines the text font), Fill (defines the fill for the area taken by the TextBox object) and
TextFill (defines the text fill).
Now let us place DataBand on the form and use the DataSet property to specify the “Parts” table
as its data source. After that, put Header onto DataBand to display column headers. Set the Header
RepeatEveryPage property to true to display column headers on each page. Altogether we will have two
headers: a product name and its price, so put two TextBoxes onto Header. Set the Text property of the
right one to “Part” while set this property of the left one to “Price”. You can also customize the font and
fill of these objects and use the TextAlign property to align the text. In the given example, “Part” is
aligned to the right border, while “Price” is aligned to the left border.
To display all lines from the data source, put Detail onto DataBand. Set the CanGrow and
CanShrink properties of Detail to true to automatically adjust height of this section subject to the height
of objects included in it. Now insert two TextBox objects into Detail to display the name and price of
products, reset the Text property for them, set the CanGrow and CanShrink to true to automatically
adjust height of this section subject to the size of the text displayed in them. Set the GrowToBottom
property to true to adjust objects in one line to fit the height of the largest one. Set the Value property of
the left TextBox object to dataBand1["Description"] and of the right object to dataBand1["ListPrice"].
Use the TextAlign property to align text in the TextBox objects. Also, specify the TextFormat property
for the right TextBox object. To do it, use the property editor. You can either use the standard Currency
format or specify a custom one (to do it, select the Format->Custom list item and enter the format you
need in the Format mask field).
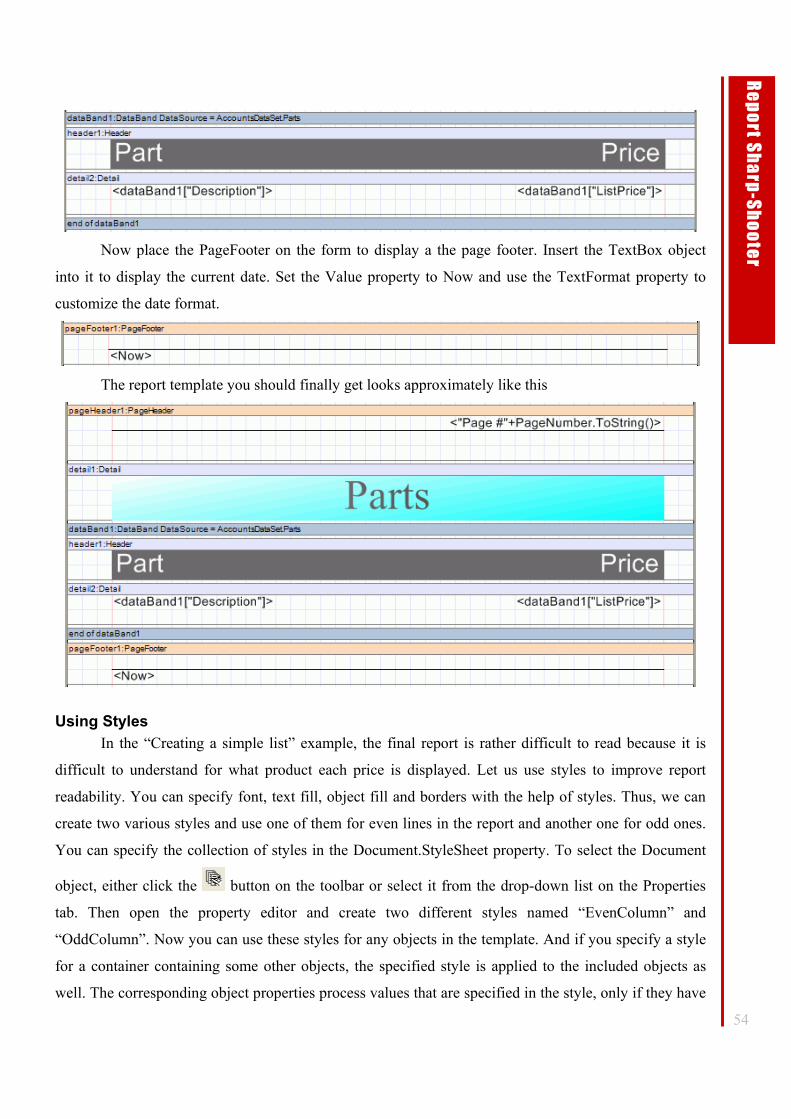
54
Re
po
rt Sh
arp
-Sh
oo
ter
Now place the PageFooter on the form to display a the page footer. Insert the TextBox object
into it to display the current date. Set the Value property to Now and use the TextFormat property to
customize the date format.
The report template you should finally get looks approximately like this
Using Styles In the “Creating a simple list” example, the final report is rather difficult to read because it is
difficult to understand for what product each price is displayed. Let us use styles to improve report
readability. You can specify font, text fill, object fill and borders with the help of styles. Thus, we can
create two various styles and use one of them for even lines in the report and another one for odd ones.
You can specify the collection of styles in the Document.StyleSheet property. To select the Document
object, either click the button on the toolbar or select it from the drop-down list on the Properties
tab. Then open the property editor and create two different styles named “EvenColumn” and
“OddColumn”. Now you can use these styles for any objects in the template. And if you specify a style
for a container containing some other objects, the specified style is applied to the included objects as
well. The corresponding object properties process values that are specified in the style, only if they have
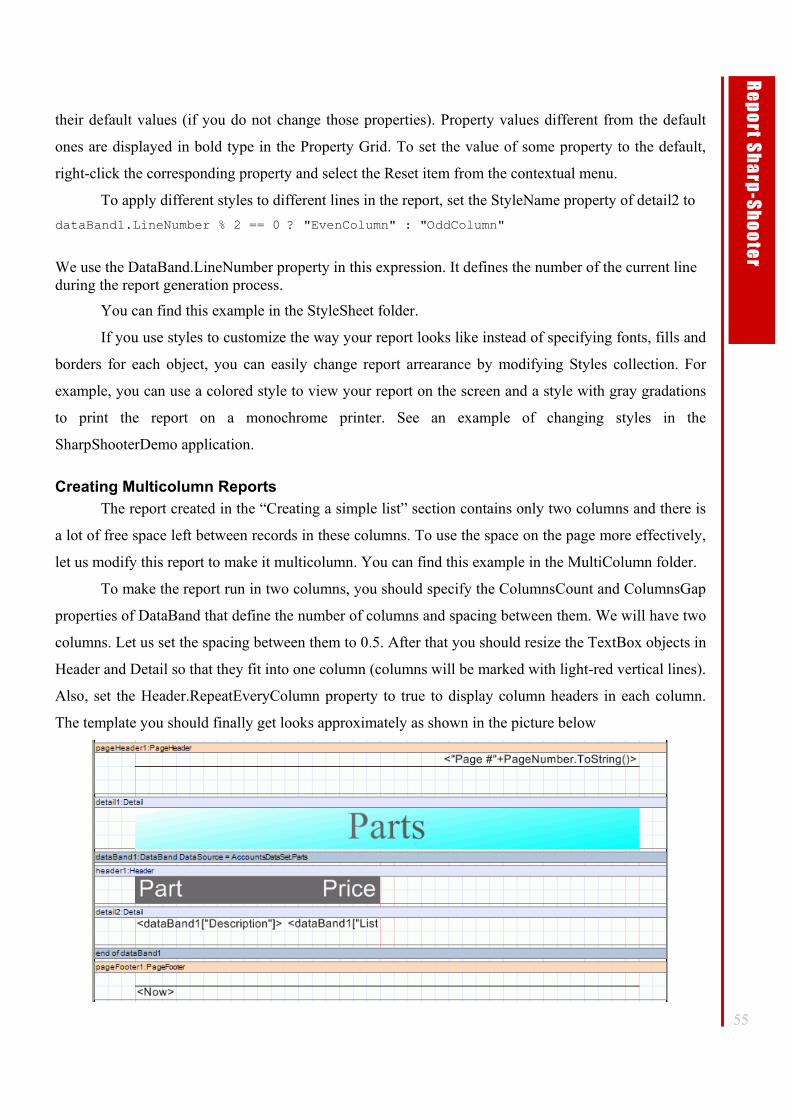
55
Re
po
rt Sh
arp
-Sh
oo
ter
their default values (if you do not change those properties). Property values different from the default
ones are displayed in bold type in the Property Grid. To set the value of some property to the default,
right-click the corresponding property and select the Reset item from the contextual menu.
To apply different styles to different lines in the report, set the StyleName property of detail2 to dataBand1.LineNumber % 2 == 0 ? "EvenColumn" : "OddColumn"
We use the DataBand.LineNumber property in this expression. It defines the number of the current line during the report generation process.
You can find this example in the StyleSheet folder.
If you use styles to customize the way your report looks like instead of specifying fonts, fills and
borders for each object, you can easily change report arrearance by modifying Styles collection. For
example, you can use a colored style to view your report on the screen and a style with gray gradations
to print the report on a monochrome printer. See an example of changing styles in the
SharpShooterDemo application.
Creating Multicolumn Reports The report created in the “Creating a simple list” section contains only two columns and there is
a lot of free space left between records in these columns. To use the space on the page more effectively,
let us modify this report to make it multicolumn. You can find this example in the MultiColumn folder.
To make the report run in two columns, you should specify the ColumnsCount and ColumnsGap
properties of DataBand that define the number of columns and spacing between them. We will have two
columns. Let us set the spacing between them to 0.5. After that you should resize the TextBox objects in
Header and Detail so that they fit into one column (columns will be marked with light-red vertical lines).
Also, set the Header.RepeatEveryColumn property to true to display column headers in each column.
The template you should finally get looks approximately as shown in the picture below
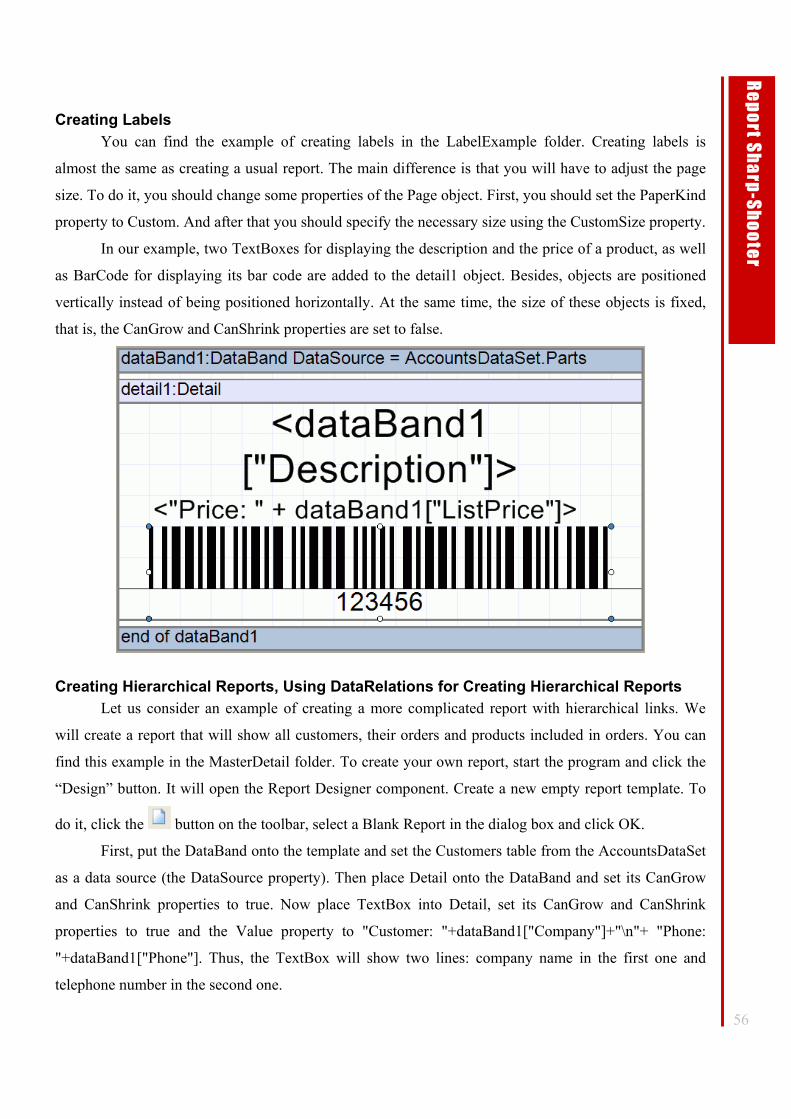
56
Re
po
rt Sh
arp
-Sh
oo
ter
Creating Labels You can find the example of creating labels in the LabelExample folder. Creating labels is
almost the same as creating a usual report. The main difference is that you will have to adjust the page
size. To do it, you should change some properties of the Page object. First, you should set the PaperKind
property to Custom. And after that you should specify the necessary size using the CustomSize property.
In our example, two TextBoxes for displaying the description and the price of a product, as well
as BarCode for displaying its bar code are added to the detail1 object. Besides, objects are positioned
vertically instead of being positioned horizontally. At the same time, the size of these objects is fixed,
that is, the CanGrow and CanShrink properties are set to false.
Creating Hierarchical Reports, Using DataRelations for Creating Hierarchical Reports Let us consider an example of creating a more complicated report with hierarchical links. We
will create a report that will show all customers, their orders and products included in orders. You can
find this example in the MasterDetail folder. To create your own report, start the program and click the
“Design” button. It will open the Report Designer component. Create a new empty report template. To
do it, click the button on the toolbar, select a Blank Report in the dialog box and click OK.
First, put the DataBand onto the template and set the Customers table from the AccountsDataSet
as a data source (the DataSource property). Then place Detail onto the DataBand and set its CanGrow
and CanShrink properties to true. Now place TextBox into Detail, set its CanGrow and CanShrink
properties to true and the Value property to "Customer: "+dataBand1["Company"]+"\n"+ "Phone:
"+dataBand1["Phone"]. Thus, the TextBox will show two lines: company name in the first one and
telephone number in the second one.
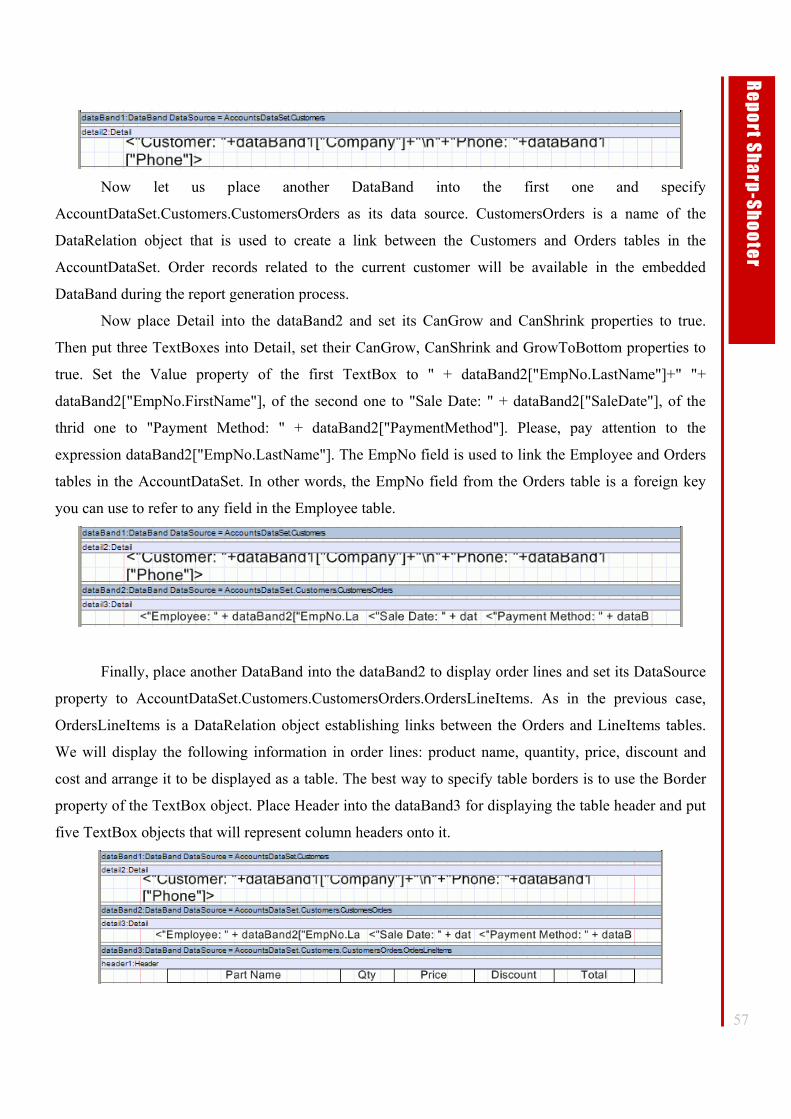
57
Re
po
rt Sh
arp
-Sh
oo
ter
Now let us place another DataBand into the first one and specify
AccountDataSet.Customers.CustomersOrders as its data source. CustomersOrders is a name of the
DataRelation object that is used to create a link between the Customers and Orders tables in the
AccountDataSet. Order records related to the current customer will be available in the embedded
DataBand during the report generation process.
Now place Detail into the dataBand2 and set its CanGrow and CanShrink properties to true.
Then put three TextBoxes into Detail, set their CanGrow, CanShrink and GrowToBottom properties to
true. Set the Value property of the first TextBox to " + dataBand2["EmpNo.LastName"]+" "+
dataBand2["EmpNo.FirstName"], of the second one to "Sale Date: " + dataBand2["SaleDate"], of the
thrid one to "Payment Method: " + dataBand2["PaymentMethod"]. Please, pay attention to the
expression dataBand2["EmpNo.LastName"]. The EmpNo field is used to link the Employee and Orders
tables in the AccountDataSet. In other words, the EmpNo field from the Orders table is a foreign key
you can use to refer to any field in the Employee table.
Finally, place another DataBand into the dataBand2 to display order lines and set its DataSource
property to AccountDataSet.Customers.CustomersOrders.OrdersLineItems. As in the previous case,
OrdersLineItems is a DataRelation object establishing links between the Orders and LineItems tables.
We will display the following information in order lines: product name, quantity, price, discount and
cost and arrange it to be displayed as a table. The best way to specify table borders is to use the Border
property of the TextBox object. Place Header into the dataBand3 for displaying the table header and put
five TextBox objects that will represent column headers onto it.
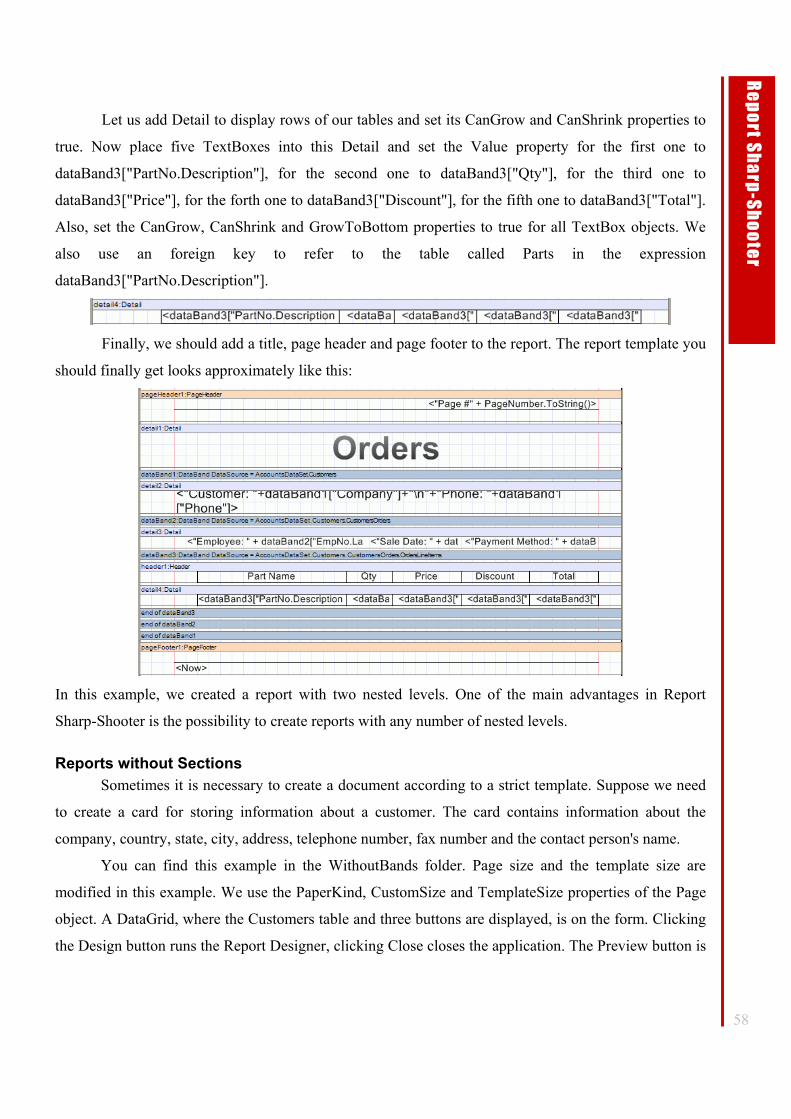
58
Re
po
rt Sh
arp
-Sh
oo
ter
Let us add Detail to display rows of our tables and set its CanGrow and CanShrink properties to
true. Now place five TextBoxes into this Detail and set the Value property for the first one to
dataBand3["PartNo.Description"], for the second one to dataBand3["Qty"], for the third one to
dataBand3["Price"], for the forth one to dataBand3["Discount"], for the fifth one to dataBand3["Total"].
Also, set the CanGrow, CanShrink and GrowToBottom properties to true for all TextBox objects. We
also use an foreign key to refer to the table called Parts in the expression
dataBand3["PartNo.Description"].
Finally, we should add a title, page header and page footer to the report. The report template you
should finally get looks approximately like this:
In this example, we created a report with two nested levels. One of the main advantages in Report
Sharp-Shooter is the possibility to create reports with any number of nested levels.
Reports without Sections Sometimes it is necessary to create a document according to a strict template. Suppose we need
to create a card for storing information about a customer. The card contains information about the
company, country, state, city, address, telephone number, fax number and the contact person's name.
You can find this example in the WithoutBands folder. Page size and the template size are
modified in this example. We use the PaperKind, CustomSize and TemplateSize properties of the Page
object. A DataGrid, where the Customers table and three buttons are displayed, is on the form. Clicking
the Design button runs the Report Designer, clicking Close closes the application. The Preview button is
59
Re
po
rt Sh
arp
-Sh
oo
ter
used to prepare a data source and form a card for the current customer in the DataGrid. An instance of
the Customer class is used as a data source for the report. The code of this class is given below public class Customer { public Customer() { } private string company = String.Empty; public string Company { get { return company; } set { company = value; } } private string country = String.Empty; public string Country { get { return country; } set { country = value; } } private string state = String.Empty; public string State { get { return state; } set { state = value; } } private string city = String.Empty; public string City { get { return city; } set { city = value; } } private string addr = String.Empty; public string Addr {
60
Re
po
rt Sh
arp
-Sh
oo
ter
get { return addr; } set { addr = value; } } private string phone = String.Empty; public string Phone { get { return phone; } set { phone = value; } } private string fax = String.Empty; public string Fax { get { return fax; } set { fax = value; } } private string contact = String.Empty; public string Contact { get { return contact; } set { contact = value; } } } Eight TextBox objects are placed on the report template to display the corresponding information. To
access data, the following method is used: public object GetData(string dataMember). This method is
defined in the ReportScriptBase class that is a parent for the script class generated during the report
creation process.
For example, the Value property of the textBox1 object used to display the company name is set
to "Company: " + GetData("Customer.Company"). Below you can see what this template looks like
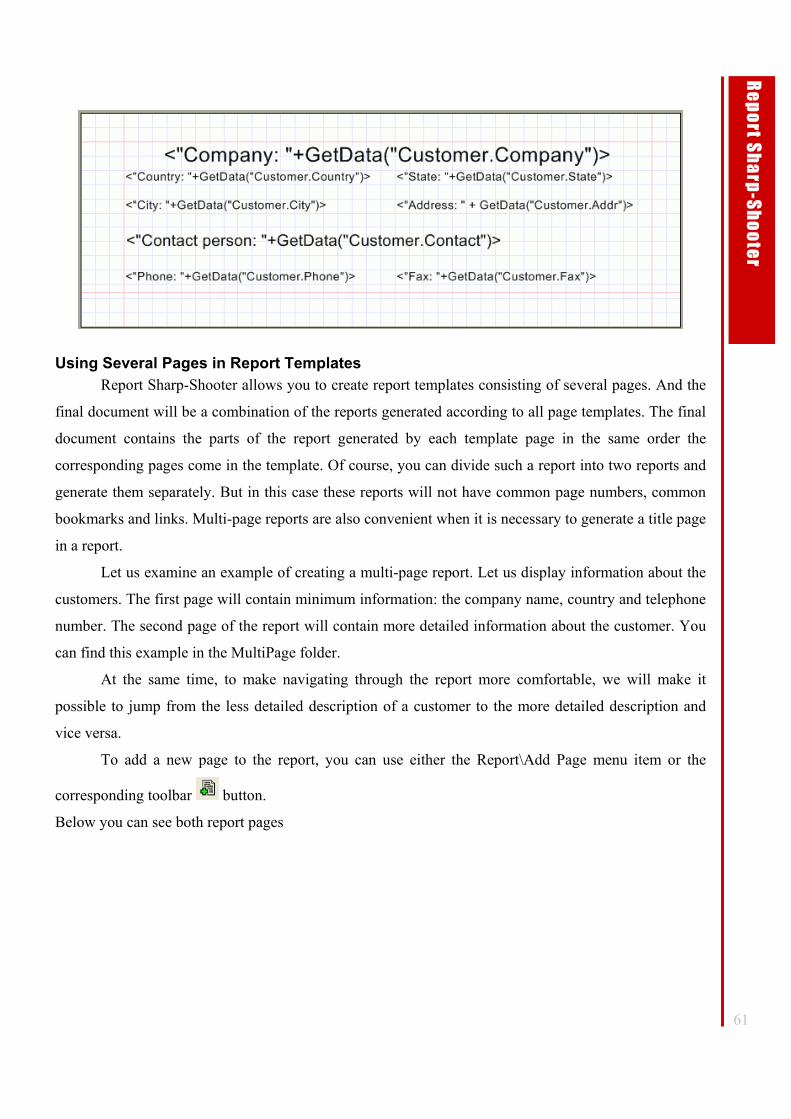
61
Re
po
rt Sh
arp
-Sh
oo
ter
Using Several Pages in Report Templates Report Sharp-Shooter allows you to create report templates consisting of several pages. And the
final document will be a combination of the reports generated according to all page templates. The final
document contains the parts of the report generated by each template page in the same order the
corresponding pages come in the template. Of course, you can divide such a report into two reports and
generate them separately. But in this case these reports will not have common page numbers, common
bookmarks and links. Multi-page reports are also convenient when it is necessary to generate a title page
in a report.
Let us examine an example of creating a multi-page report. Let us display information about the
customers. The first page will contain minimum information: the company name, country and telephone
number. The second page of the report will contain more detailed information about the customer. You
can find this example in the MultiPage folder.
At the same time, to make navigating through the report more comfortable, we will make it
possible to jump from the less detailed description of a customer to the more detailed description and
vice versa.
To add a new page to the report, you can use either the Report\Add Page menu item or the
corresponding toolbar button.
Below you can see both report pages
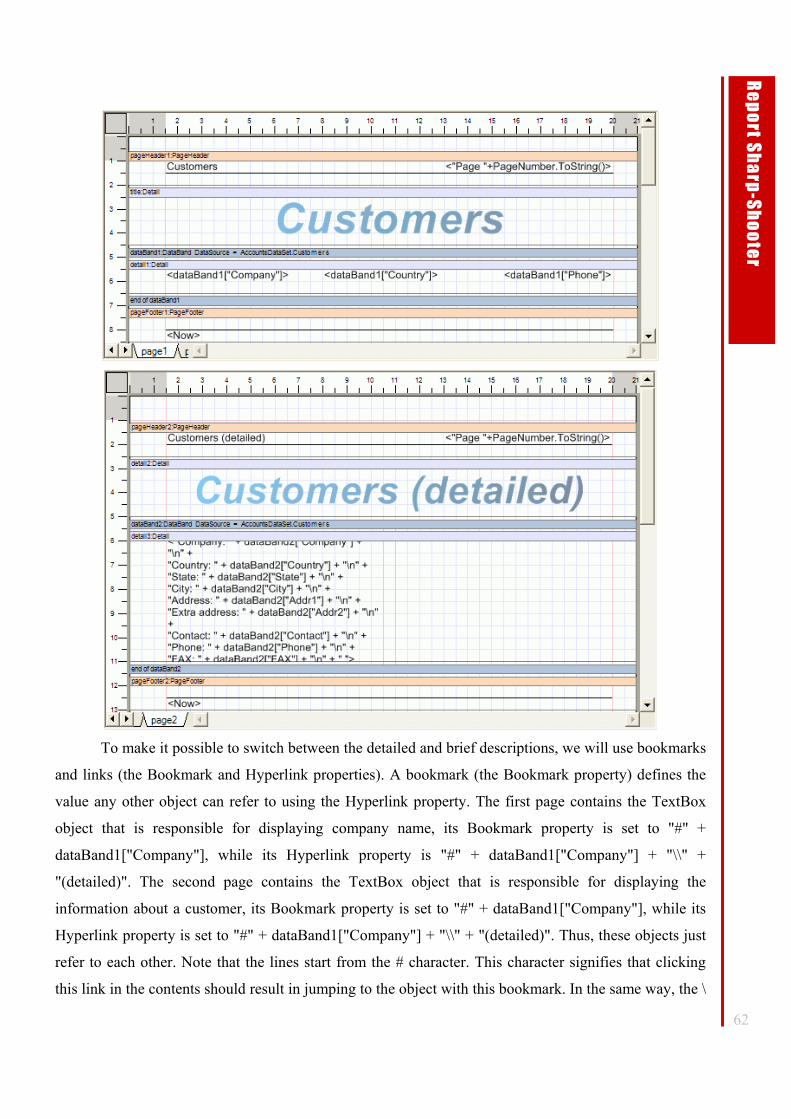
62
Re
po
rt Sh
arp
-Sh
oo
ter
To make it possible to switch between the detailed and brief descriptions, we will use bookmarks
and links (the Bookmark and Hyperlink properties). A bookmark (the Bookmark property) defines the
value any other object can refer to using the Hyperlink property. The first page contains the TextBox
object that is responsible for displaying company name, its Bookmark property is set to "#" +
dataBand1["Company"], while its Hyperlink property is "#" + dataBand1["Company"] + "\\" +
"(detailed)". The second page contains the TextBox object that is responsible for displaying the
information about a customer, its Bookmark property is set to "#" + dataBand1["Company"], while its
Hyperlink property is set to "#" + dataBand1["Company"] + "\\" + "(detailed)". Thus, these objects just
refer to each other. Note that the lines start from the # character. This character signifies that clicking
this link in the contents should result in jumping to the object with this bookmark. In the same way, the \
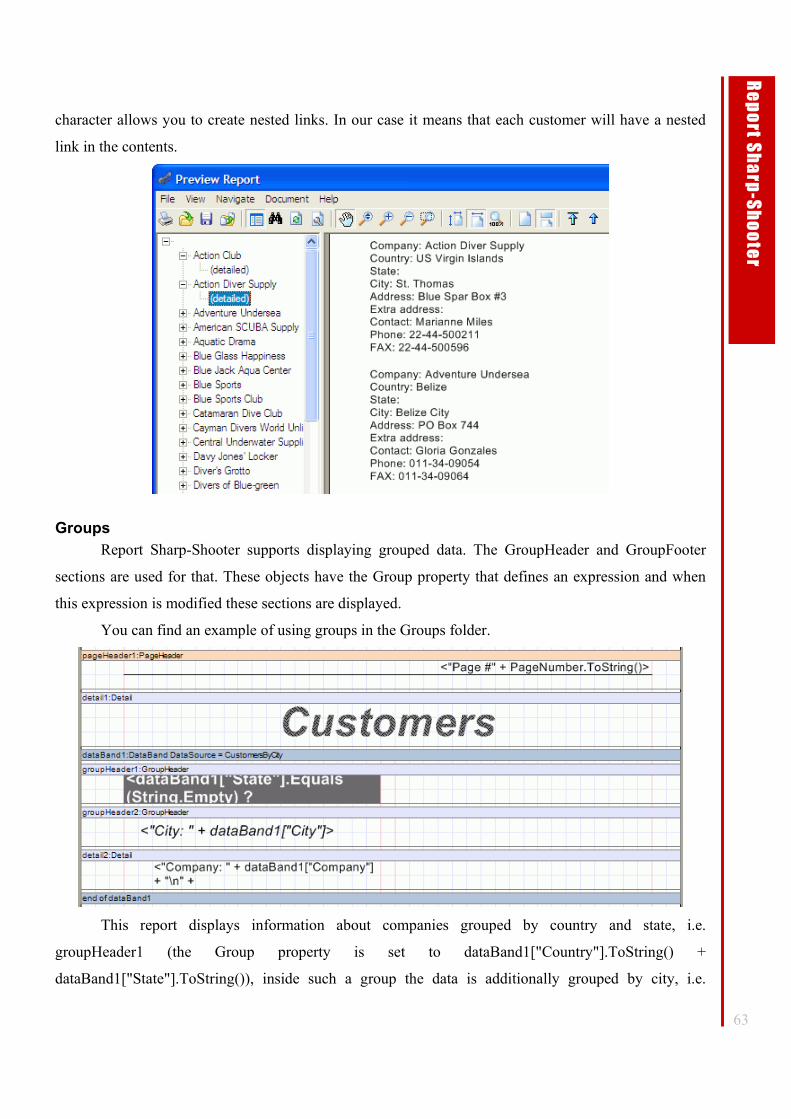
63
Re
po
rt Sh
arp
-Sh
oo
ter
character allows you to create nested links. In our case it means that each customer will have a nested
link in the contents.
Groups Report Sharp-Shooter supports displaying grouped data. The GroupHeader and GroupFooter
sections are used for that. These objects have the Group property that defines an expression and when
this expression is modified these sections are displayed.
You can find an example of using groups in the Groups folder.
This report displays information about companies grouped by country and state, i.e.
groupHeader1 (the Group property is set to dataBand1["Country"].ToString() +
dataBand1["State"].ToString()), inside such a group the data is additionally grouped by city, i.e.
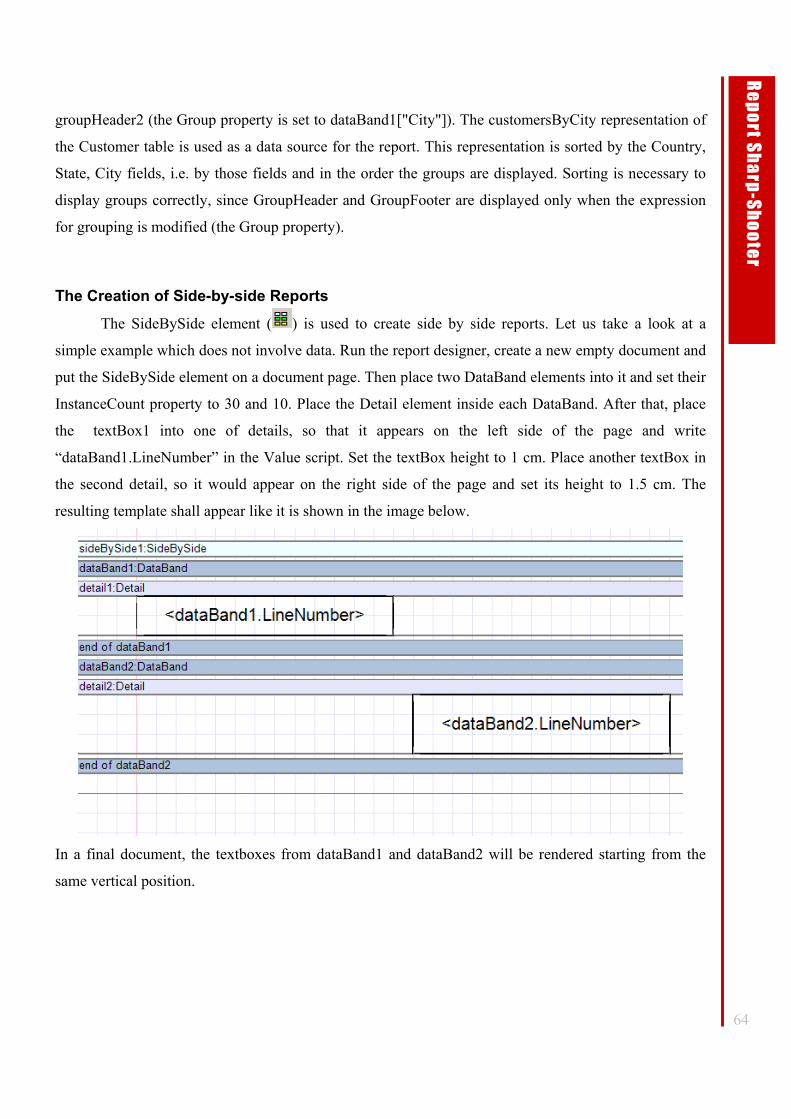
64
Re
po
rt Sh
arp
-Sh
oo
ter
groupHeader2 (the Group property is set to dataBand1["City"]). The customersByCity representation of
the Customer table is used as a data source for the report. This representation is sorted by the Country,
State, City fields, i.e. by those fields and in the order the groups are displayed. Sorting is necessary to
display groups correctly, since GroupHeader and GroupFooter are displayed only when the expression
for grouping is modified (the Group property).
The Creation of Side-by-side Reports
The SideBySide element ( ) is used to create side by side reports. Let us take a look at a
simple example which does not involve data. Run the report designer, create a new empty document and
put the SideBySide element on a document page. Then place two DataBand elements into it and set their
InstanceCount property to 30 and 10. Place the Detail element inside each DataBand. After that, place
the textBox1 into one of details, so that it appears on the left side of the page and write
“dataBand1.LineNumber” in the Value script. Set the textBox height to 1 cm. Place another textBox in
the second detail, so it would appear on the right side of the page and set its height to 1.5 cm. The
resulting template shall appear like it is shown in the image below.
In a final document, the textboxes from dataBand1 and dataBand2 will be rendered starting from the
same vertical position.
65
Re
po
rt Sh
arp
-Sh
oo
ter
The Use of the PivotTable Element
Destination and Main Features
The PivotTable element ( ) is intended for creating cross-reports based on high volume statistical data
as well as for generating pivot tables. The result of its use is a report block containing the visual
representation of a pivot table described within a Report Sharp-Shooter document.
The ad hoc pivot table layout editor allows a user to visually specify the data used for calculation. In
order to get a required report it is simply enough to drag the existing fields of a specified data source
into the required areas within the editor and click several buttons to set your pivot table presentation
style.
You can use scripts in one of the programming languages supported by Report Sharp-Shooter in order to
assign the calculation rules for pivot table dimensions as well as for dimensions intersection cells. This
allows you to adjust a pivot table depending on your data source content. The use of scripts affords a
broad variety of pivot table setting options from simple summation of several data source field values up
to diverse variants of setting groupings within report dimensions (e.g. the breaking of dates into years,
months, quarters or days of week).
To calculate the values at pivot table dimension intersections, one can use an aggregate function (e.g.
the retrieval of average, minimum or maximum value).
All pivot table settings can be saved to a file thus making it possible to promptly get back to pivot table
unconfigured state at any moment.
A Pivot Table-based Report Creation Example The PivotTable element serves to organize data from an external data source as a pivot table. To set a
table, one should specify fields for each dimension (by rows and columns). The fact fields, which data
are used to calculate the values at rows and columns intersections, should also be specified.
A rule for retrieving data from a data source is specified in a field by means of a script.
An aggregate function intended to be used for intersection value calculation should also be specified to
fact fields.
Let us try to construct a simple cross-report, using the PivotTable element, step-by-step. We shall build
a pivot table representing the total sales data of a specific product for each of two conditional
companies.
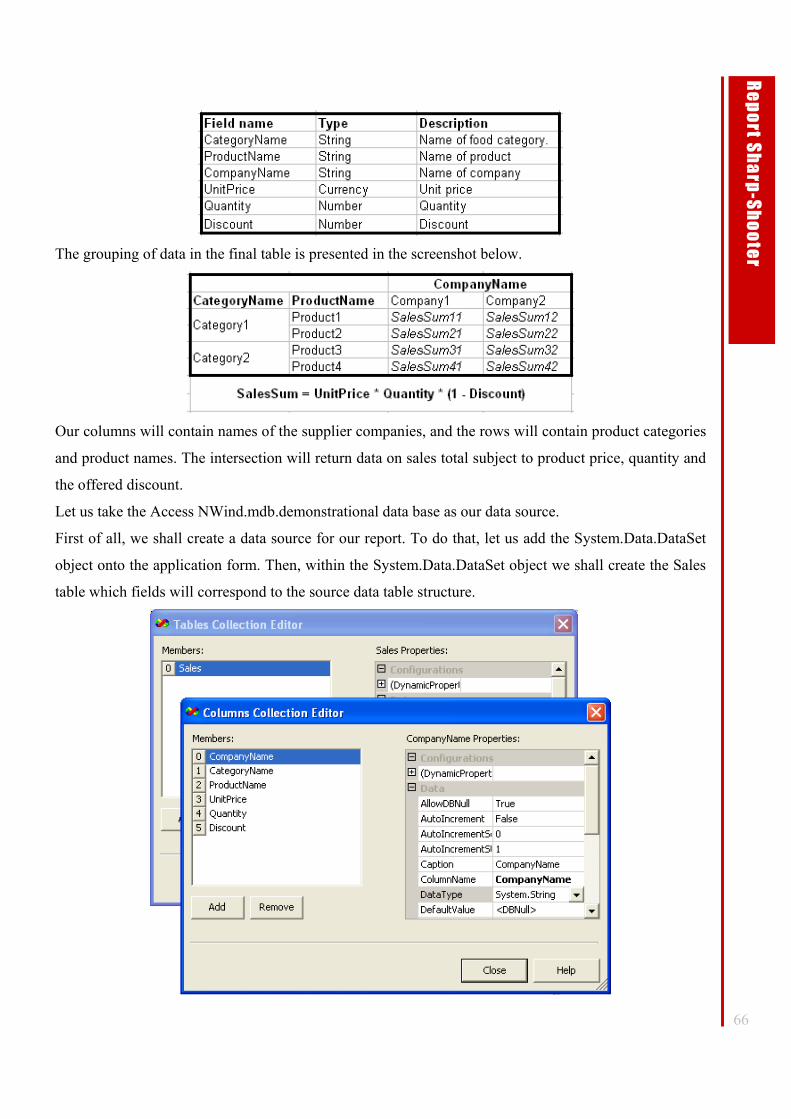
66
Re
po
rt Sh
arp
-Sh
oo
ter
The grouping of data in the final table is presented in the screenshot below.
Our columns will contain names of the supplier companies, and the rows will contain product categories
and product names. The intersection will return data on sales total subject to product price, quantity and
the offered discount.
Let us take the Access NWind.mdb.demonstrational data base as our data source.
First of all, we shall create a data source for our report. To do that, let us add the System.Data.DataSet
object onto the application form. Then, within the System.Data.DataSet object we shall create the Sales
table which fields will correspond to the source data table structure.
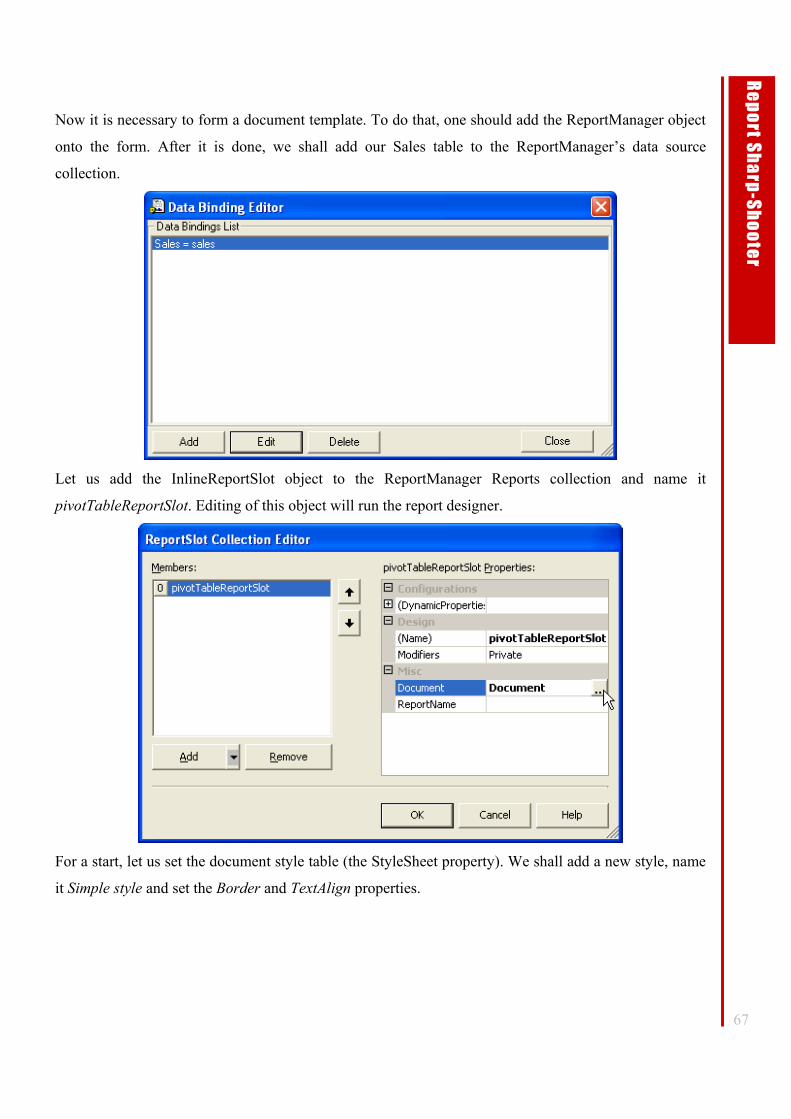
67
Re
po
rt Sh
arp
-Sh
oo
ter
Now it is necessary to form a document template. To do that, one should add the ReportManager object
onto the form. After it is done, we shall add our Sales table to the ReportManager’s data source
collection.
Let us add the InlineReportSlot object to the ReportManager Reports collection and name it
pivotTableReportSlot. Editing of this object will run the report designer.
For a start, let us set the document style table (the StyleSheet property). We shall add a new style, name
it Simple style and set the Border and TextAlign properties.
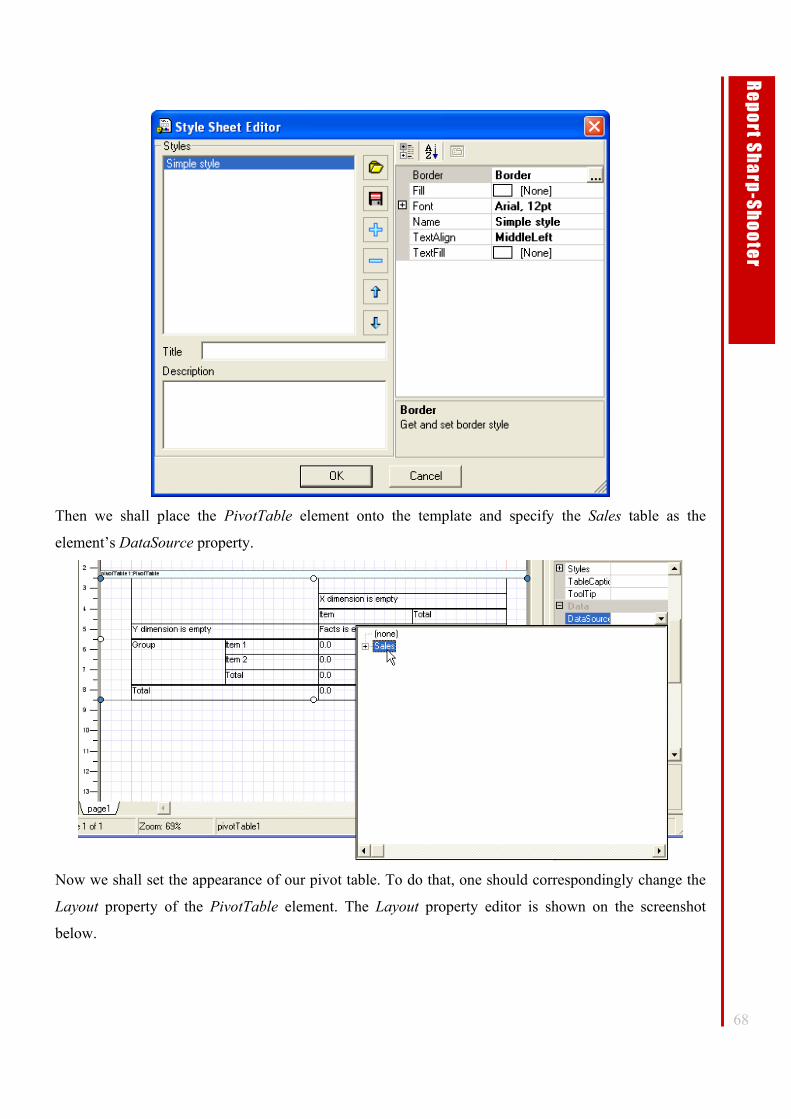
68
Re
po
rt Sh
arp
-Sh
oo
ter
Then we shall place the PivotTable element onto the template and specify the Sales table as the
element’s DataSource property.
Now we shall set the appearance of our pivot table. To do that, one should correspondingly change the
Layout property of the PivotTable element. The Layout property editor is shown on the screenshot
below.
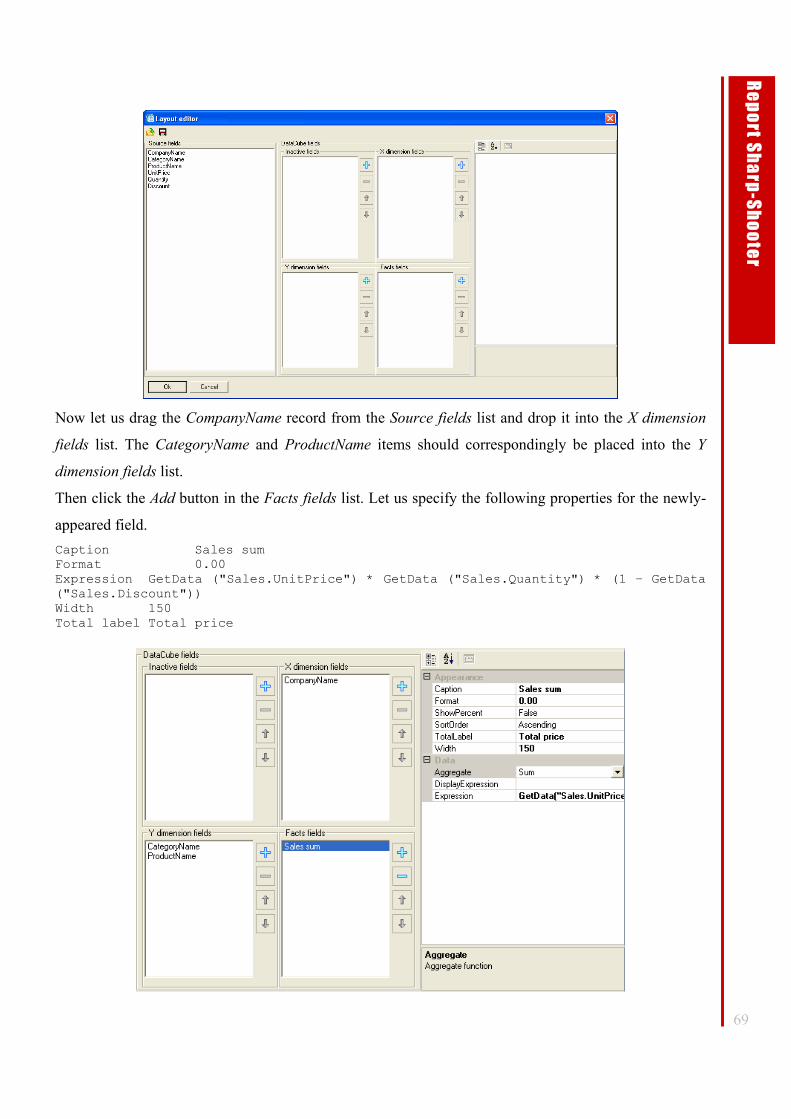
69
Re
po
rt Sh
arp
-Sh
oo
ter
Now let us drag the CompanyName record from the Source fields list and drop it into the X dimension
fields list. The CategoryName and ProductName items should correspondingly be placed into the Y
dimension fields list.
Then click the Add button in the Facts fields list. Let us specify the following properties for the newly-
appeared field. Caption Sales sum Format 0.00 Expression GetData ("Sales.UnitPrice") * GetData ("Sales.Quantity") * (1 – GetData ("Sales.Discount")) Width 150 Total label Total price
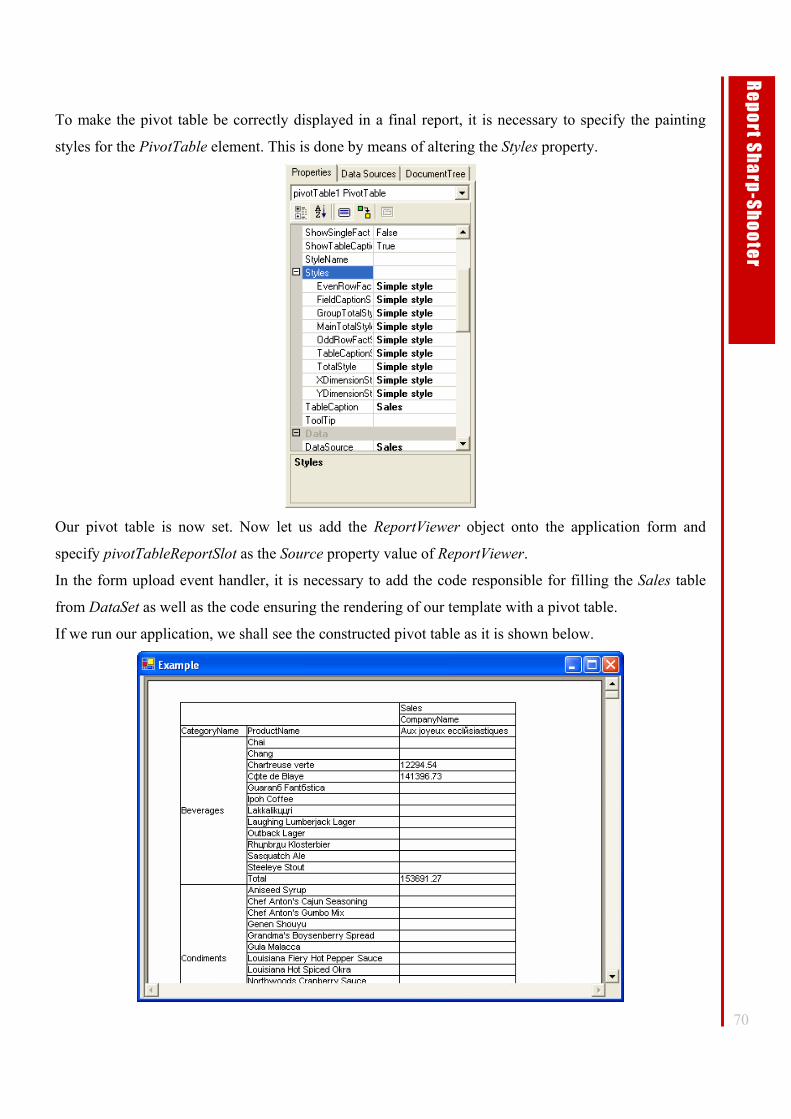
70
Re
po
rt Sh
arp
-Sh
oo
ter
To make the pivot table be correctly displayed in a final report, it is necessary to specify the painting
styles for the PivotTable element. This is done by means of altering the Styles property.
Our pivot table is now set. Now let us add the ReportViewer object onto the application form and
specify pivotTableReportSlot as the Source property value of ReportViewer.
In the form upload event handler, it is necessary to add the code responsible for filling the Sales table
from DataSet as well as the code ensuring the rendering of our template with a pivot table.
If we run our application, we shall see the constructed pivot table as it is shown below.
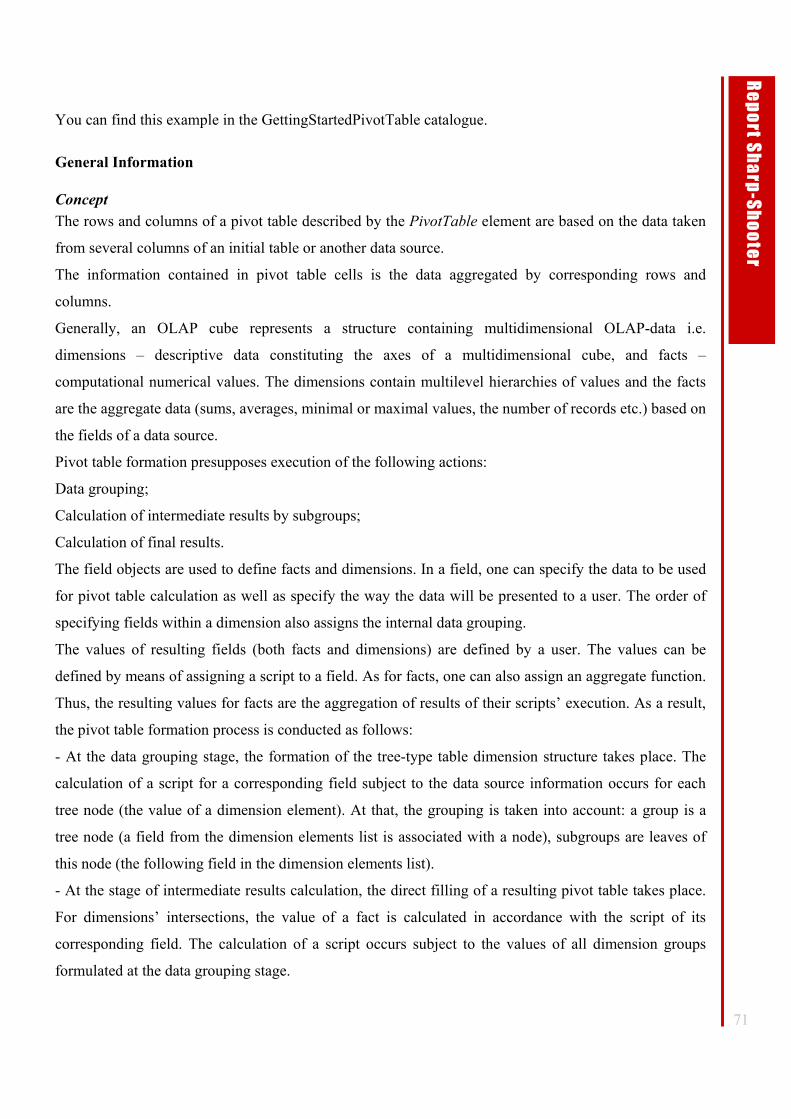
71
Re
po
rt Sh
arp
-Sh
oo
ter
You can find this example in the GettingStartedPivotTable catalogue.
General Information
Concept The rows and columns of a pivot table described by the PivotTable element are based on the data taken
from several columns of an initial table or another data source.
The information contained in pivot table cells is the data aggregated by corresponding rows and
columns.
Generally, an OLAP cube represents a structure containing multidimensional OLAP-data i.e.
dimensions – descriptive data constituting the axes of a multidimensional cube, and facts –
computational numerical values. The dimensions contain multilevel hierarchies of values and the facts
are the aggregate data (sums, averages, minimal or maximal values, the number of records etc.) based on
the fields of a data source.
Pivot table formation presupposes execution of the following actions:
Data grouping;
Calculation of intermediate results by subgroups;
Calculation of final results.
The field objects are used to define facts and dimensions. In a field, one can specify the data to be used
for pivot table calculation as well as specify the way the data will be presented to a user. The order of
specifying fields within a dimension also assigns the internal data grouping.
The values of resulting fields (both facts and dimensions) are defined by a user. The values can be
defined by means of assigning a script to a field. As for facts, one can also assign an aggregate function.
Thus, the resulting values for facts are the aggregation of results of their scripts’ execution. As a result,
the pivot table formation process is conducted as follows:
- At the data grouping stage, the formation of the tree-type table dimension structure takes place. The
calculation of a script for a corresponding field subject to the data source information occurs for each
tree node (the value of a dimension element). At that, the grouping is taken into account: a group is a
tree node (a field from the dimension elements list is associated with a node), subgroups are leaves of
this node (the following field in the dimension elements list).
- At the stage of intermediate results calculation, the direct filling of a resulting pivot table takes place.
For dimensions’ intersections, the value of a fact is calculated in accordance with the script of its
corresponding field. The calculation of a script occurs subject to the values of all dimension groups
formulated at the data grouping stage.
72
Re
po
rt Sh
arp
-Sh
oo
ter
- The calculation of final results occurs simultaneously to filling the table for subgroups in whole. It is
conducted subject to the aggregate functions specified in fields and on the basis of fact values already
calculated. A user can modify the sorting, assign an expression for filtering by optional combinations of
data and execute various table transformations.
Data Sources The data sources specified in the ReportManager object’s DataSources property are used as data
sources for creating cross-reports designed with the help of the PivotTable element. Please visit the Data
Sources section of this User Guide to learn more about Report Sharp-Shooter’s data sources.
The PivotTable Element – Detailed Description. In order to duly set the PivotTable element one can use its following properties:
AutoColumnWidth.
When this property is set, the width of table cells will align by their content at table rendering.
AutoRowHeight.
This property has three values:
None – the alignment of row height will not be executed;
Dissimilar – the height of each table cell is set depending on the maximal height of cell content within
the given row.
Similar – the height of all table rows is the same (set depending on maximal content height in all rows).
DimensionOnEveryPage.
When this property is set, the dimension headers will appear on every report page.
ShowRepeatText.
When this property is set, the cell text will be displayed in every case of moving a cell to another page.
ShowSingleFact.
When this property is set, the resulting report will show the names of facts even in case when there is
only one fact present.
TableCaption.
The text displayed as a pivot table caption.
ShowTableCaption.
If this property is not set, the pivot table caption will not be displayed in the resulting report.
DataSource.
The name of a data source used to build a pivot table.
NestedFields.
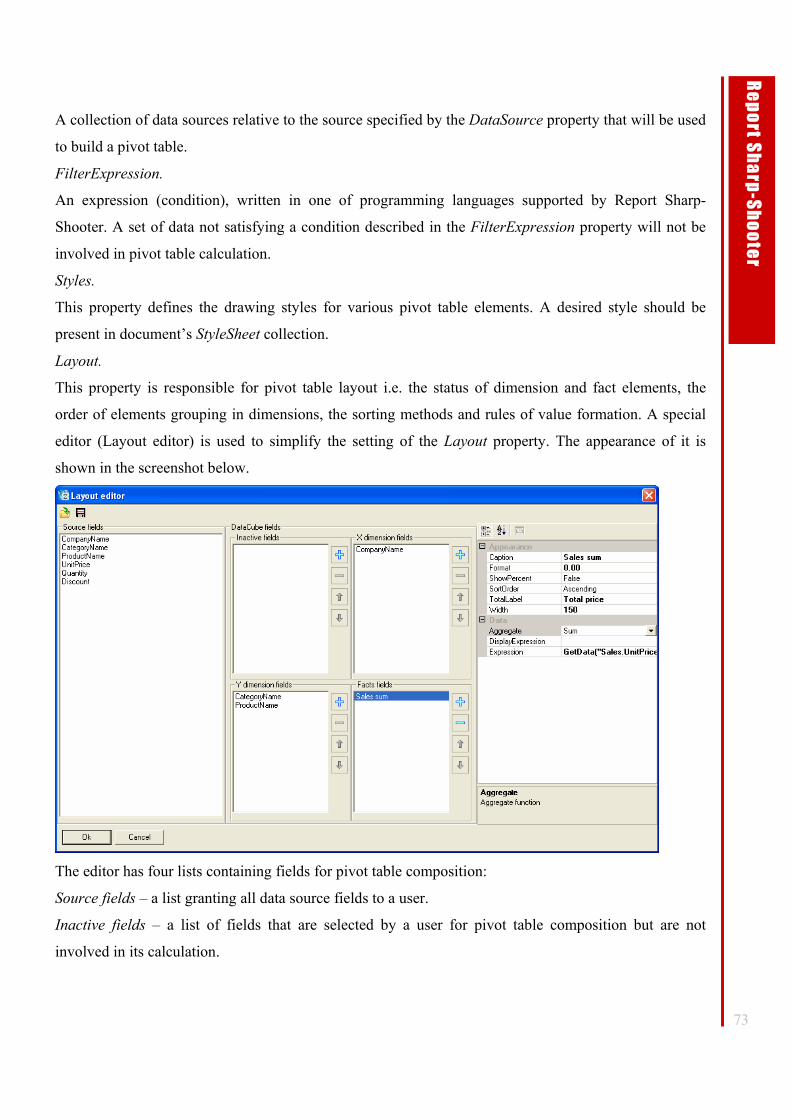
73
Re
po
rt Sh
arp
-Sh
oo
ter
A collection of data sources relative to the source specified by the DataSource property that will be used
to build a pivot table.
FilterExpression.
An expression (condition), written in one of programming languages supported by Report Sharp-
Shooter. A set of data not satisfying a condition described in the FilterExpression property will not be
involved in pivot table calculation.
Styles.
This property defines the drawing styles for various pivot table elements. A desired style should be
present in document’s StyleSheet collection.
Layout.
This property is responsible for pivot table layout i.e. the status of dimension and fact elements, the
order of elements grouping in dimensions, the sorting methods and rules of value formation. A special
editor (Layout editor) is used to simplify the setting of the Layout property. The appearance of it is
shown in the screenshot below.
The editor has four lists containing fields for pivot table composition:
Source fields – a list granting all data source fields to a user.
Inactive fields – a list of fields that are selected by a user for pivot table composition but are not
involved in its calculation.
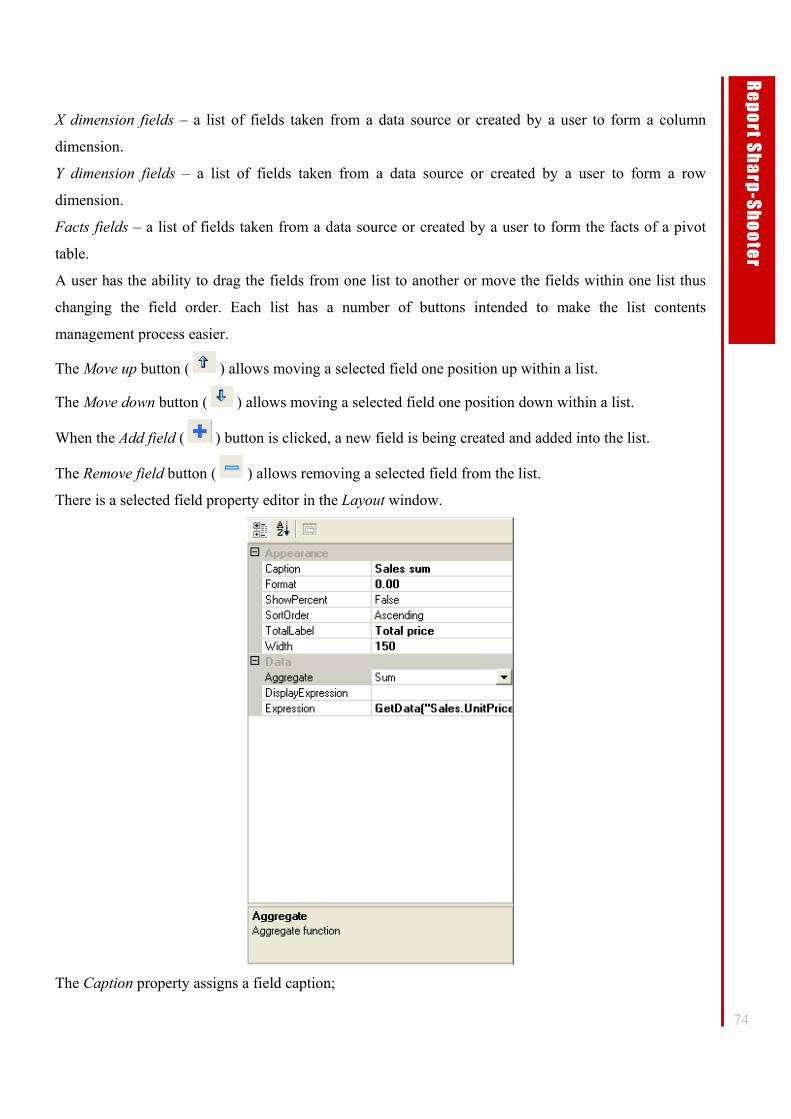
74
Re
po
rt Sh
arp
-Sh
oo
ter
X dimension fields – a list of fields taken from a data source or created by a user to form a column
dimension.
Y dimension fields – a list of fields taken from a data source or created by a user to form a row
dimension.
Facts fields – a list of fields taken from a data source or created by a user to form the facts of a pivot
table.
A user has the ability to drag the fields from one list to another or move the fields within one list thus
changing the field order. Each list has a number of buttons intended to make the list contents
management process easier.
The Move up button ( ) allows moving a selected field one position up within a list.
The Move down button ( ) allows moving a selected field one position down within a list.
When the Add field ( ) button is clicked, a new field is being created and added into the list.
The Remove field button ( ) allows removing a selected field from the list.
There is a selected field property editor in the Layout window.
The Caption property assigns a field caption;

75
Re
po
rt Sh
arp
-Sh
oo
ter
The Format property assigns a field data output formatting string;
The Show percent property defines whether the current field data will be presented in percentage terms;
The Sort order property assigns field data sorting order;
The Total label property assigns a label for field total;
The Width property assigns field width;
The Aggregate property assigns field data aggregation type (makes sense for facts only);
The Expression property assigns an expression the result of which will take part in pivot table
calculation;
The DisplayExpression property assigns an expression the result of which will be displayed in the
resulting pivot table;
The Layout editor has a button panel.
The Open button ( ) allows loading pivot table settings from file.
The Save button ( ) allows saving pivot table settings to file.
Working with Sub Reports Report Sharp-Shooter 2.0 makes it possible to use sub reports.
The SubReport element ( ) is used to create sub reports. The TemplateName property is used to
indicate a report to be used as a subordinate one. In a simple case, a reportSlot containing a report
intended to be used as a sub report should be included into the reportManager.Reports collection.
However, there is another way. One can write a handler for the reportManager.ResolveSubReport event.
There one can define a required report template by name and pass a link to it in handler parameters.
There is a possibility to pass parameters to a sub report. The subReport.Parameters collection is used
for that purpose. Each parameter is assigned by name and a script the calculation result of which will be
passed to a document used as a sub report. If a sub report already has a parameter with a given name, the
value will be replaced; otherwise it will be added.
It should be mentioned that only sections (such as DataBand, detail etc.) of a report used as a sub report
will be rendered; visual elements that are placed directly on a page as well as PageBands are not
considered.
Destination of the BandContainer Report Sharp-Shooter features an element called BandContainer. This element is intended expressly for
users’ convenience and is analogous to the DataBand element which InstanceCount property is equal to
1.
76
Re
po
rt Sh
arp
-Sh
oo
ter
Master Report Concept Report Sharp-Shooter makes it possible to use the co-called ‘Master report’.
When a document that uses master template is rendered, the final document includes results of rendering
master template and document template. This ability provides an opportunity to design a group of
documents homogeneously.
In order to assign a master report it is necessary to assign a name to a master template in the
Document.MasterReport property. At report rendering a template with a given name should be gotten
through the IResolveSubReport interface. For example, master template with the required name should
be added to the same ReportManager the initial template was added to.
While creating a template used as a master template, it is necessary to place the Content element onto
this template. Creation of a document that uses master template is executed in the following way. The
final report includes the result of the master template rendering and the Content element is substituted
by the result of the initial report rendering.
Working with Aggregate Functions
Basic Information
If you have worked with other report generators before, you might expect that it is enough to
introduce SUM() to get the total sum of data in Footer. Report Sharp-Shooter allows you to combine
sections with data, groups, etc. so this kind of summing cannot be correct in all cases. You will have to
perform some extra actions to exactly inform the report generator what groups should be summed. You
will need some time to deal with it, but it is not so bad because:
1. you have more flexibility concerning the use of aggregate functions and can make calculations
that would need additional queries in different conditions;
2. you are always aware of what is going on;
3. it is possible to calculate the total for any expression (using any available functions);
4. this approach allows you to optimize the report generation process (reports are created in one
pass mode in most cases).
Besides, the wizard will do the entire work for you in most cases.
At present, the report generator supports 5 built-in aggregate functions:
• Sum – the total of all elements;
• Avg – arithmetic mean;
• Min – minimal element;
• Max – maximal element;

77
Re
po
rt Sh
arp
-Sh
oo
ter
• Count – the number of elements.
Aggregate functions are bound to sections. It ensures that only those records that are visible in
the report are calculated. For calculation, you should add an aggregate field to the Aggregates collection
of the corresponding section and give it a unique name, as well as specify an expression for aggregating
using the syntax of the language you chose to writing scripts in.
Calling the function calculating aggregates looks like this
band.Sum ([int pageNumber], string aggregateName, [groupCondition1 [, groupCondition2]…])
where
pageNumber is an optional parameter defining the number of the page to calculate the total for. If this
parameter is absent, the total is calculated for the entire document.
aggregateName – the unique name of an aggregate field
and at the end there are grouping conditions according to which summing is performed, absent grouping
conditions are ignored.
The aggregate values are calculated at the first pass of the document rendering. Now there is an
opportunity to recalculate aggregates at the second pass with the help of the Running property. It means
that, if this property is set to ‘true’, the aggregate will be calculated during the second pass of the
document rendering. Thus, if there is the need to calculate a cumulative sum, it is enough to set the
Running property to ‘true’.
Examples of Using Aggregates
Using Aggregates in Hierarchical Reports
Let us consider an example of using aggregates in hierarchical reports. To do it, we will add the
possibility to calculate the total sum of every order and the total sum of all company orders to our report
from the section “Creating hierarchical reports, using DataRelations for creating hierarchical reports”.
You can find this example in the MasterDetailAggregates folder.
To calculate these two figures, add two sections - footer1 and footer2 - to the report and an
aggregate to the Aggregates collection of the dataBand3 section (the Add button in the Aggregate
Collection Editor).
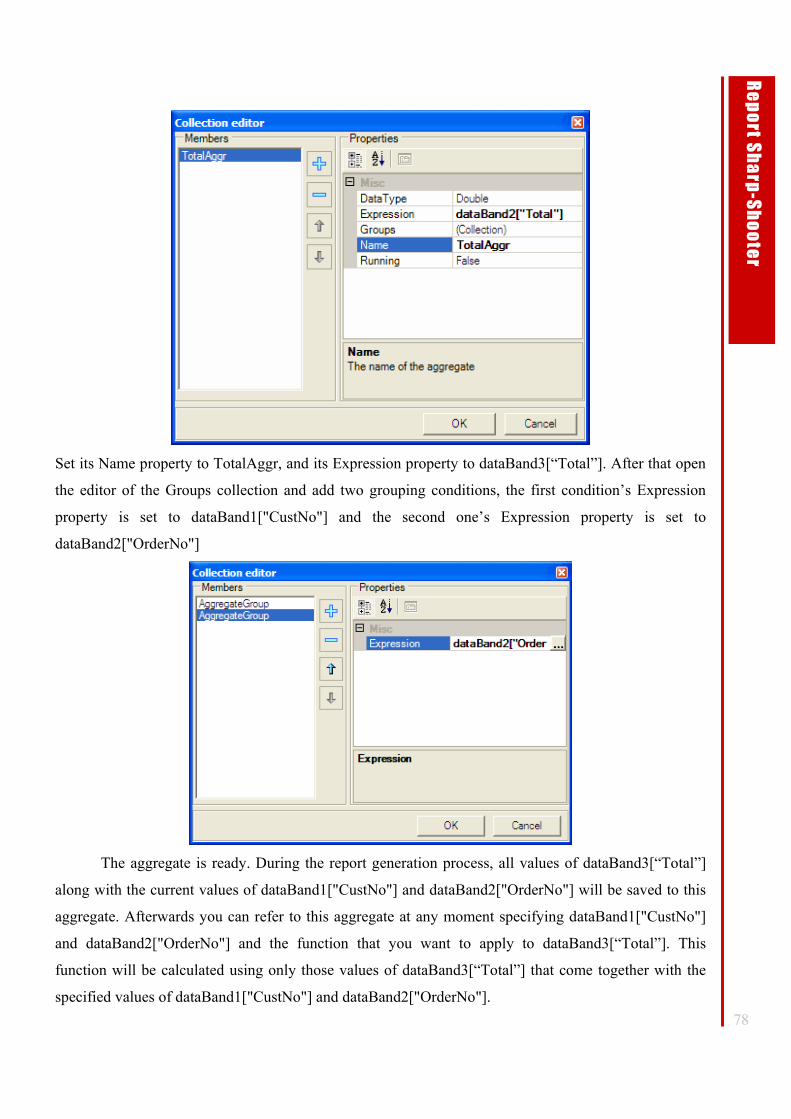
78
Re
po
rt Sh
arp
-Sh
oo
ter
Set its Name property to TotalAggr, and its Expression property to dataBand3[“Total”]. After that open
the editor of the Groups collection and add two grouping conditions, the first condition’s Expression
property is set to dataBand1["CustNo"] and the second one’s Expression property is set to
dataBand2["OrderNo"]
The aggregate is ready. During the report generation process, all values of dataBand3[“Total”]
along with the current values of dataBand1["CustNo"] and dataBand2["OrderNo"] will be saved to this
aggregate. Afterwards you can refer to this aggregate at any moment specifying dataBand1["CustNo"]
and dataBand2["OrderNo"] and the function that you want to apply to dataBand3[“Total”]. This
function will be calculated using only those values of dataBand3[“Total”] that come together with the
specified values of dataBand1["CustNo"] and dataBand2["OrderNo"].
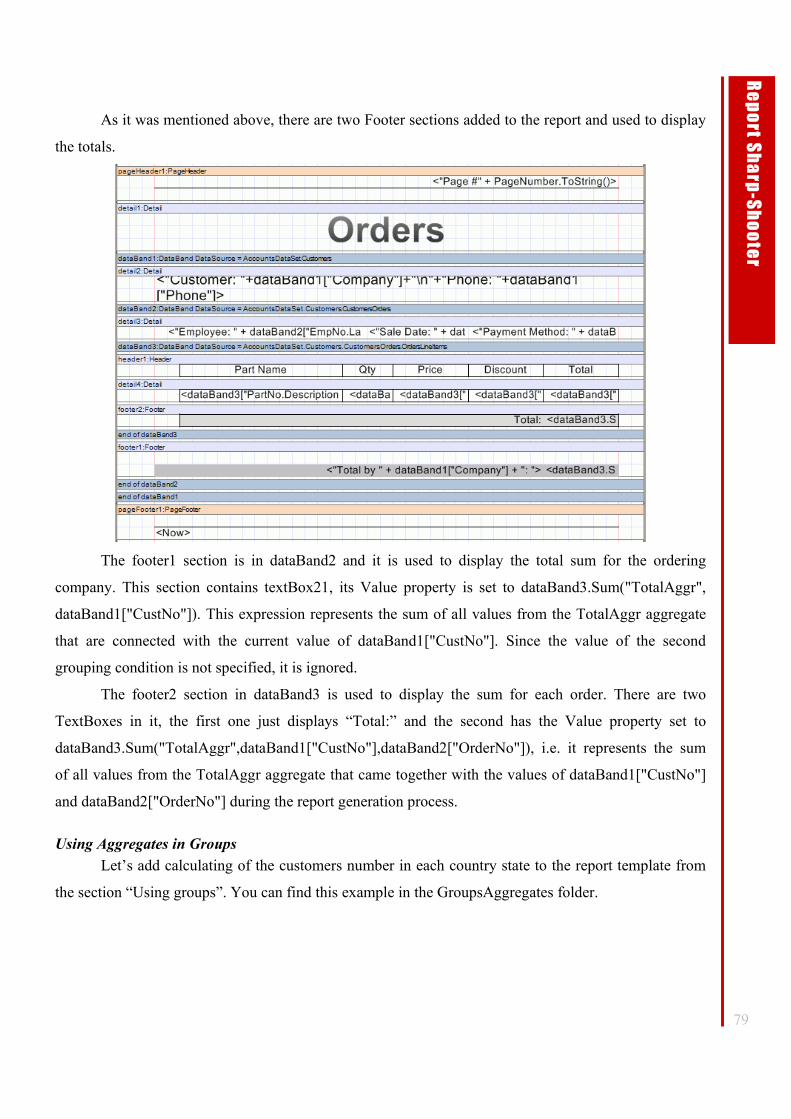
79
Re
po
rt Sh
arp
-Sh
oo
ter
As it was mentioned above, there are two Footer sections added to the report and used to display
the totals.
The footer1 section is in dataBand2 and it is used to display the total sum for the ordering
company. This section contains textBox21, its Value property is set to dataBand3.Sum("TotalAggr",
dataBand1["CustNo"]). This expression represents the sum of all values from the TotalAggr aggregate
that are connected with the current value of dataBand1["CustNo"]. Since the value of the second
grouping condition is not specified, it is ignored.
The footer2 section in dataBand3 is used to display the sum for each order. There are two
TextBoxes in it, the first one just displays “Total:” and the second has the Value property set to
dataBand3.Sum("TotalAggr",dataBand1["CustNo"],dataBand2["OrderNo"]), i.e. it represents the sum
of all values from the TotalAggr aggregate that came together with the values of dataBand1["CustNo"]
and dataBand2["OrderNo"] during the report generation process.
Using Aggregates in Groups Let’s add calculating of the customers number in each country state to the report template from
the section “Using groups”. You can find this example in the GroupsAggregates folder.
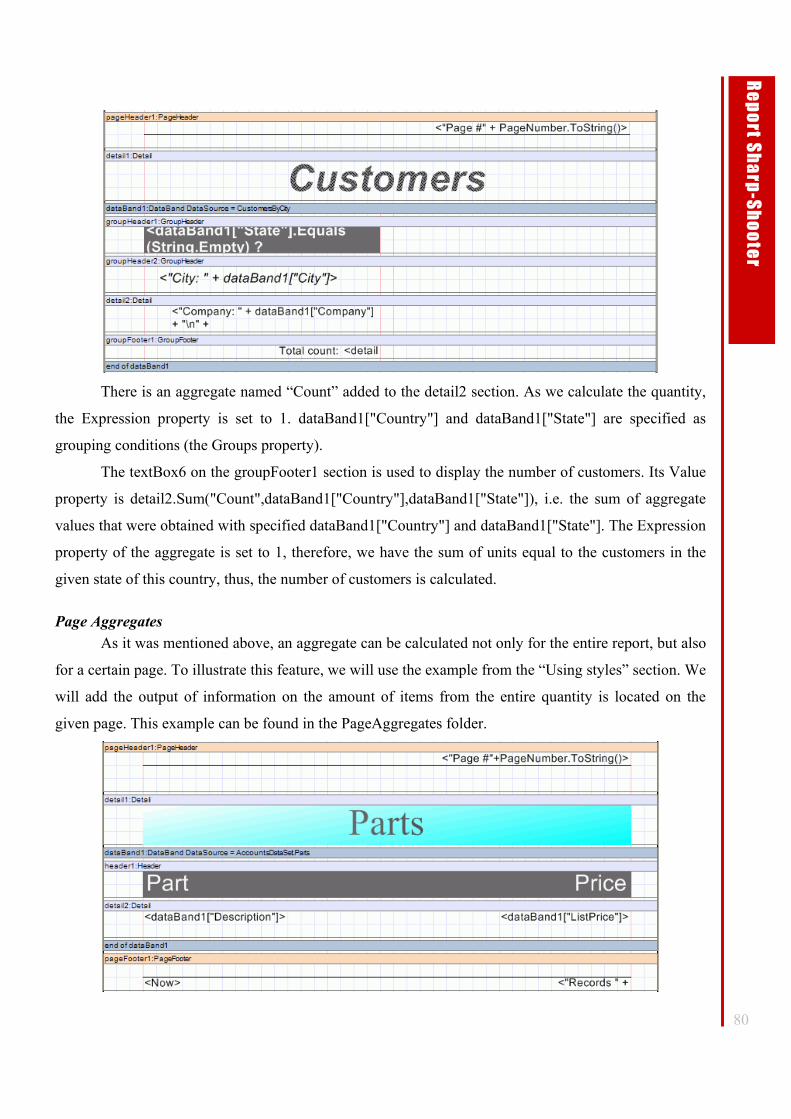
80
Re
po
rt Sh
arp
-Sh
oo
ter
There is an aggregate named “Count” added to the detail2 section. As we calculate the quantity,
the Expression property is set to 1. dataBand1["Country"] and dataBand1["State"] are specified as
grouping conditions (the Groups property).
The textBox6 on the groupFooter1 section is used to display the number of customers. Its Value
property is detail2.Sum("Count",dataBand1["Country"],dataBand1["State"]), i.e. the sum of aggregate
values that were obtained with specified dataBand1["Country"] and dataBand1["State"]. The Expression
property of the aggregate is set to 1, therefore, we have the sum of units equal to the customers in the
given state of this country, thus, the number of customers is calculated.
Page Aggregates As it was mentioned above, an aggregate can be calculated not only for the entire report, but also
for a certain page. To illustrate this feature, we will use the example from the “Using styles” section. We
will add the output of information on the amount of items from the entire quantity is located on the
given page. This example can be found in the PageAggregates folder.

81
Re
po
rt Sh
arp
-Sh
oo
ter
The “Count” aggregate is added to the Aggregates collection of the detail2 section. The Groups
collection of this aggregate is empty because we do not need any grouping conditions. pageFooter1 has
textBox8 added to it. The Value property of the textBox8 is set to "Records " +
detail2.Count(PageNumber,"Count") + " of " + detail2.Count("Count"). The expression
detail2.Count(PageNumber,"Count") represents the number of elements in the “Count” aggregate on
page PageNumber. PageNumber is a special variable available during the report generation process and
used to store the number of the current page. The expression detail2.Count("Count") represents the
overall number of elements in the “Count” aggregate.
In most cases, data is displayed before totals. But there are exceptions when displaying some
total in the header is more convenient. Moreover, mind that elements located directly on the page or on
various page sections (such as PageHeader, PageFooter, PageOverlay) are calculated prior to elements
in other sections. The report must be a double-pass one so that aggregate functions in all the above cases
can be correctly calculated. To make a report double-pass, just set the Document.DoublePass property to
true.
In our case, the aggregate value is displayed in the PageFooter section. Besides, the overall
number of records is displayed on each page and this number can become known only after the entire
report is processed and it means that the report must be a double-pass one.
Scenarios of Using Text and Images Below you can see the recommendations that you should follow, especially when you are going
to export your reports to tabular formats, such as Microsoft Excel.
It is better to use the Border property of the TextBox objects to add not only cell borders to your
tables, but also any other lines. This object will be just converted to the borders of table cells.
Also, we do not recommend that you place objects over each other because it will be impossible
to match objects and cells exactly while exporting.
Let us dwell upon the methods of using pictures in a report. One of possible variants is when the
pictures are stored in a database. To use them, you should include the Picture object in the template and
assign the corresponding value to its Image property. There is a report demonstrating this feature in the
SharpShooterDemo example. The report is called Pictures.
Another possible case is when only filenames are stored in a database. In this case you can load
the image by assigning the following value to the Image property. Image.FromFile((string)dataBand1["Picture"]) Besides, in this case you should specify the System.Drawing namespace in the Imports property of the
Document object.
82
Re
po
rt Sh
arp
-Sh
oo
ter
Another variant is loading a picture from a server. Suppose URLs are stored in a database. In this
case you will have to write approximately the following code in the Picture.GenerateScript property: System.Net.WebRequest req = System.Net.WebRequest.Create((string)dataBand1["Picture"]); using(System.Net.WebResponse res = req.GetResponse()) { using(Stream strm = res.GetResponseStream()) { picture1.Image = Image.FromStream(strm); } } and add two namespaces called System.Drawing and System.IO to the Imports property of the
Document object.
Using the AdvancedText Component This component allows displaying the information as formatted text. It is possible to assign paragraph
and text styles and also to use expressions directly within a certain text item. The formatted text can be
defined with the help of: an HTML similar markup language (the Text property), a subset of RTF format
(the RtfText property).
The use of the Text property: HTML similar markup tags are used for text formatting.
Paragraph formatting: the couple of tags <P> </P> defines a separate paragraph. The align
attribute defines the horizontal alignment of the text in the paragraph. Legitimate values:
• Align = “left” – alignment to paragraph left margin.
• Align = “right” - alignment to paragraph right margin.
• Align = “center” – alignment to paragraph center.
• Align = “justify” - paragraph alignment with both the left and right margins.
Align = “left” is assumed by default.
Text formatting: the <Font> tag defines the subsequent text display style. The </Font> closing tag
cancels the previous settings. Embedding font tags is allowed. Text style is defined with the help of the
following attributes:
• face – defines font name,
• size – defines font size,
• color – defines text color.
The admissible properties are color name (e.g. color = red), assigning a hexadecimal RGB color value of
separate components (e.g. color = #FF0000)
The <B> tag – the subsequent text will appear as the bold type. The </B> closing tag
cancels this setting.
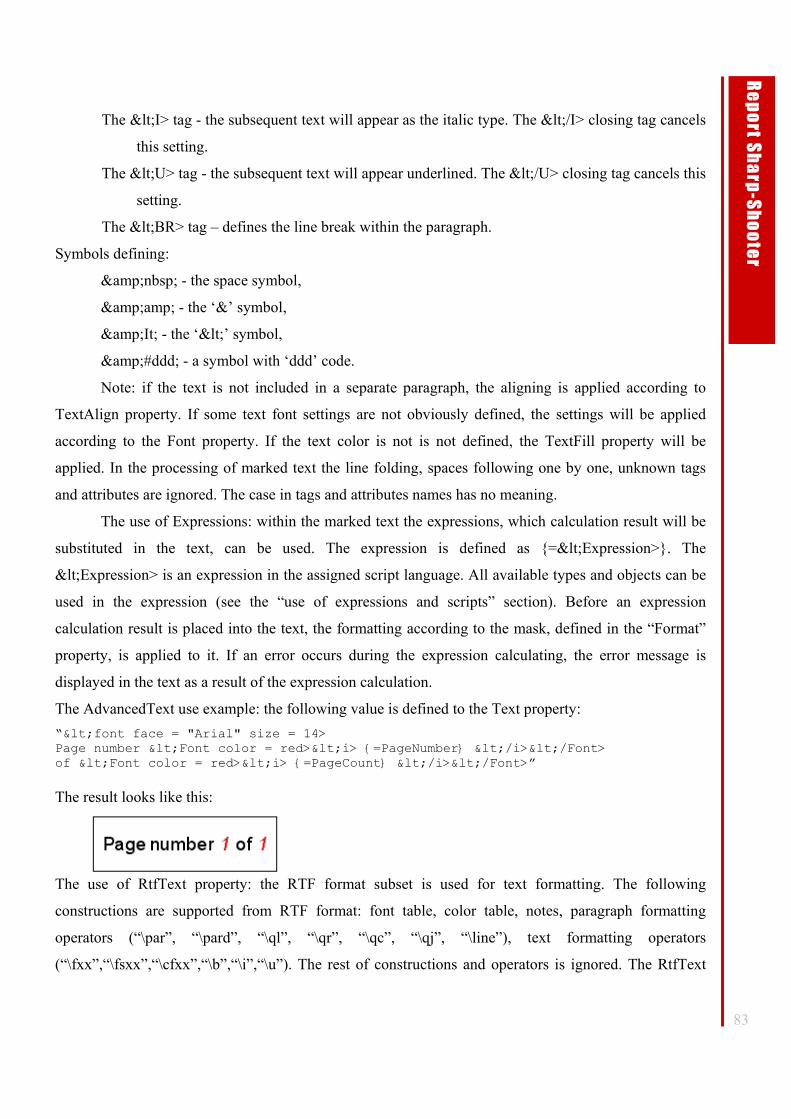
83
Re
po
rt Sh
arp
-Sh
oo
ter
The <I> tag - the subsequent text will appear as the italic type. The </I> closing tag cancels
this setting.
The <U> tag - the subsequent text will appear underlined. The </U> closing tag cancels this
setting.
The <BR> tag – defines the line break within the paragraph.
Symbols defining:
&nbsp; - the space symbol,
&amp; - the ‘&’ symbol,
&It; - the ‘<’ symbol,
&#ddd; - a symbol with ‘ddd’ code.
Note: if the text is not included in a separate paragraph, the aligning is applied according to
TextAlign property. If some text font settings are not obviously defined, the settings will be applied
according to the Font property. If the text color is not is not defined, the TextFill property will be
applied. In the processing of marked text the line folding, spaces following one by one, unknown tags
and attributes are ignored. The case in tags and attributes names has no meaning.
The use of Expressions: within the marked text the expressions, which calculation result will be
substituted in the text, can be used. The expression is defined as {=<Expression>}. The
<Expression> is an expression in the assigned script language. All available types and objects can be
used in the expression (see the “use of expressions and scripts” section). Before an expression
calculation result is placed into the text, the formatting according to the mask, defined in the “Format”
property, is applied to it. If an error occurs during the expression calculating, the error message is
displayed in the text as a result of the expression calculation.
The AdvancedText use example: the following value is defined to the Text property: “<font face = "Arial" size = 14> Page number <Font color = red><i> {=PageNumber} </i></Font> of <Font color = red><i> {=PageCount} </i></Font>” The result looks like this:
The use of RtfText property: the RTF format subset is used for text formatting. The following
constructions are supported from RTF format: font table, color table, notes, paragraph formatting
operators (“\par”, “\pard”, “\ql”, “\qr”, “\qc”, “\qj”, “\line”), text formatting operators
(“\fxx”,“\fsxx”,“\cfxx”,“\b”,“\i”,“\u”). The rest of constructions and operators is ignored. The RtfText
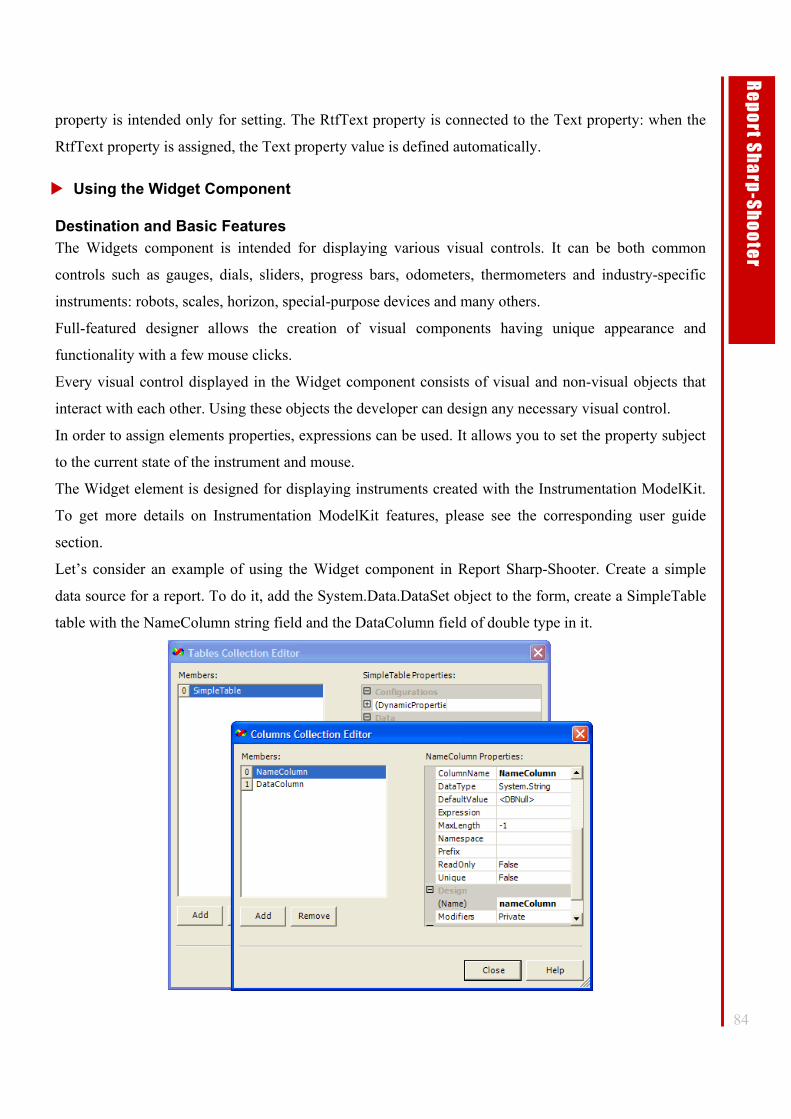
84
Re
po
rt Sh
arp
-Sh
oo
ter
property is intended only for setting. The RtfText property is connected to the Text property: when the
RtfText property is assigned, the Text property value is defined automatically.
Using the Widget Component
Destination and Basic Features The Widgets component is intended for displaying various visual controls. It can be both common
controls such as gauges, dials, sliders, progress bars, odometers, thermometers and industry-specific
instruments: robots, scales, horizon, special-purpose devices and many others.
Full-featured designer allows the creation of visual components having unique appearance and
functionality with a few mouse clicks.
Every visual control displayed in the Widget component consists of visual and non-visual objects that
interact with each other. Using these objects the developer can design any necessary visual control.
In order to assign elements properties, expressions can be used. It allows you to set the property subject
to the current state of the instrument and mouse.
The Widget element is designed for displaying instruments created with the Instrumentation ModelKit.
To get more details on Instrumentation ModelKit features, please see the corresponding user guide
section.
Let’s consider an example of using the Widget component in Report Sharp-Shooter. Create a simple
data source for a report. To do it, add the System.Data.DataSet object to the form, create a SimpleTable
table with the NameColumn string field and the DataColumn field of double type in it.
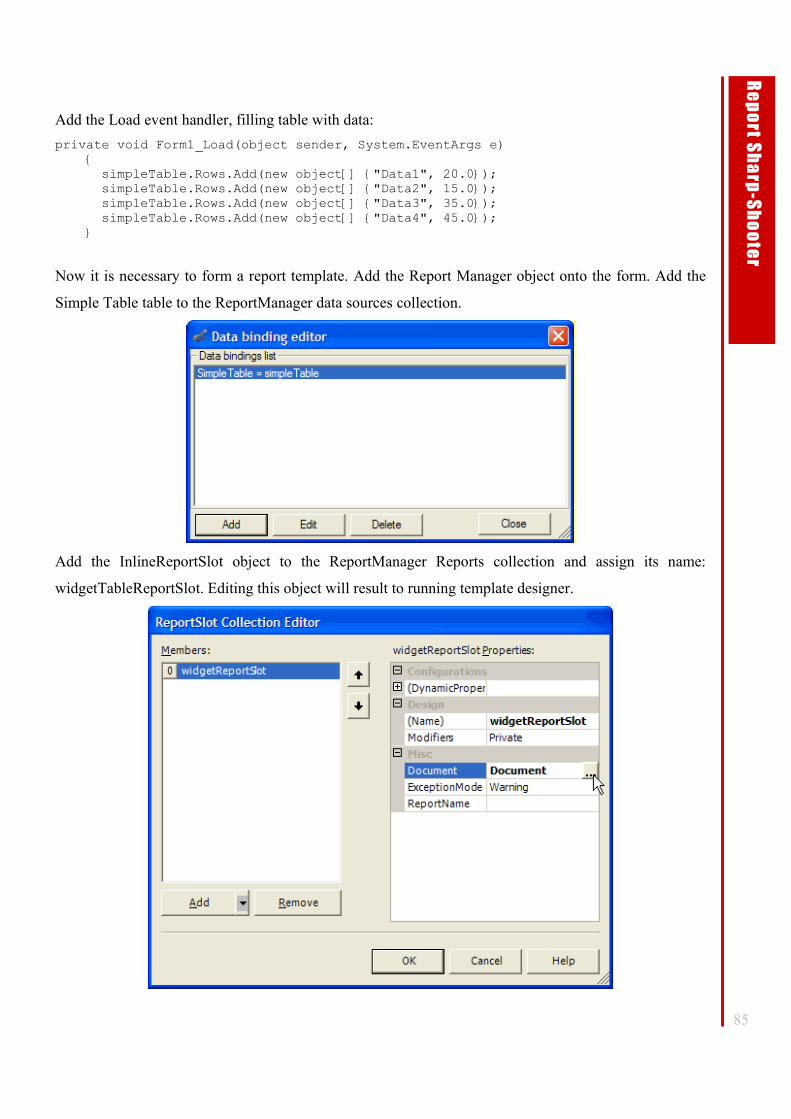
85
Re
po
rt Sh
arp
-Sh
oo
ter
Add the Load event handler, filling table with data: private void Form1_Load(object sender, System.EventArgs e) { simpleTable.Rows.Add(new object[] {"Data1", 20.0}); simpleTable.Rows.Add(new object[] {"Data2", 15.0}); simpleTable.Rows.Add(new object[] {"Data3", 35.0}); simpleTable.Rows.Add(new object[] {"Data4", 45.0}); }
Now it is necessary to form a report template. Add the Report Manager object onto the form. Add the
Simple Table table to the ReportManager data sources collection.
Add the InlineReportSlot object to the ReportManager Reports collection and assign its name:
widgetTableReportSlot. Editing this object will result to running template designer.
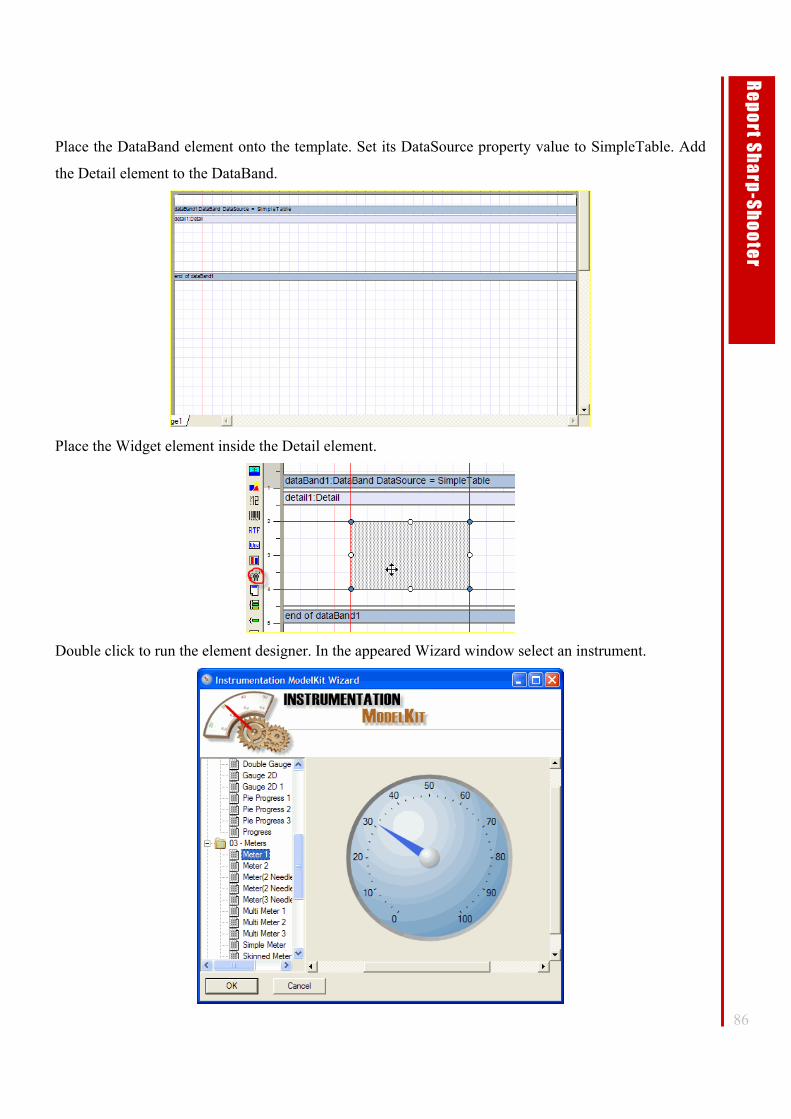
86
Re
po
rt Sh
arp
-Sh
oo
ter
Place the DataBand element onto the template. Set its DataSource property value to SimpleTable. Add
the Detail element to the DataBand.
Place the Widget element inside the Detail element.
Double click to run the element designer. In the appeared Wizard window select an instrument.
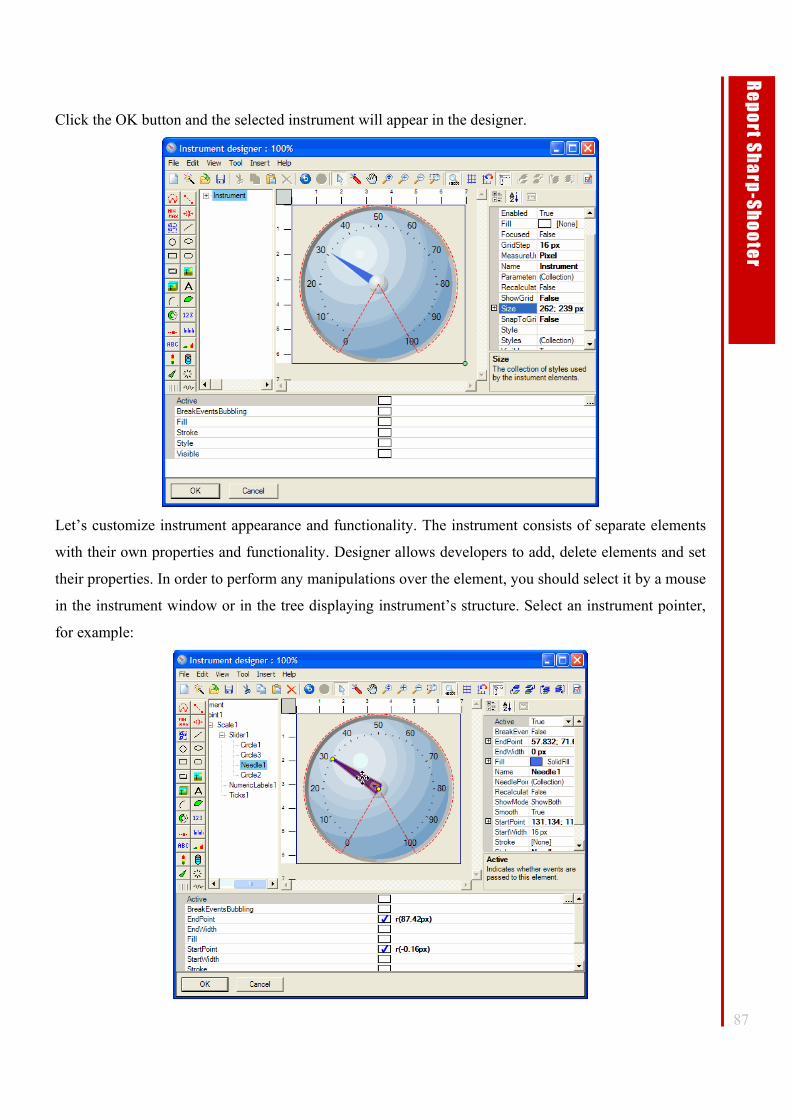
87
Re
po
rt Sh
arp
-Sh
oo
ter
Click the OK button and the selected instrument will appear in the designer.
Let’s customize instrument appearance and functionality. The instrument consists of separate elements
with their own properties and functionality. Designer allows developers to add, delete elements and set
their properties. In order to perform any manipulations over the element, you should select it by a mouse
in the instrument window or in the tree displaying instrument’s structure. Select an instrument pointer,
for example:
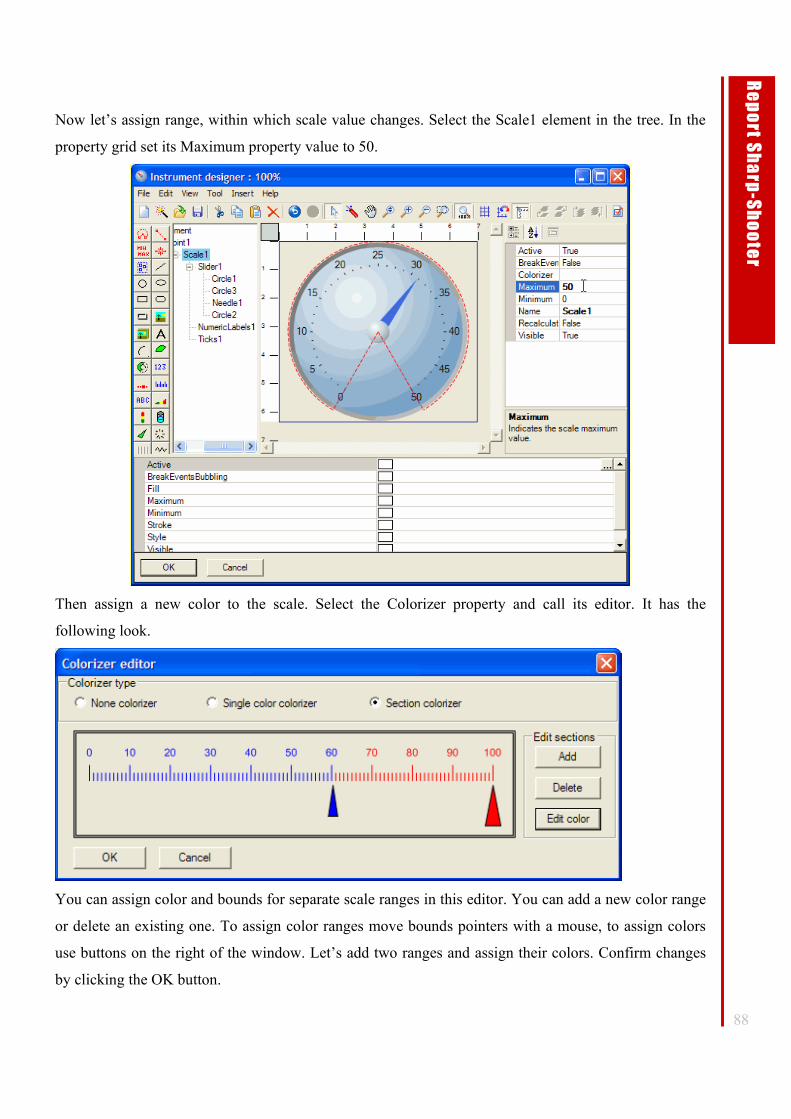
88
Re
po
rt Sh
arp
-Sh
oo
ter
Now let’s assign range, within which scale value changes. Select the Scale1 element in the tree. In the
property grid set its Maximum property value to 50.
Then assign a new color to the scale. Select the Colorizer property and call its editor. It has the
following look.
You can assign color and bounds for separate scale ranges in this editor. You can add a new color range
or delete an existing one. To assign color ranges move bounds pointers with a mouse, to assign colors
use buttons on the right of the window. Let’s add two ranges and assign their colors. Confirm changes
by clicking the OK button.
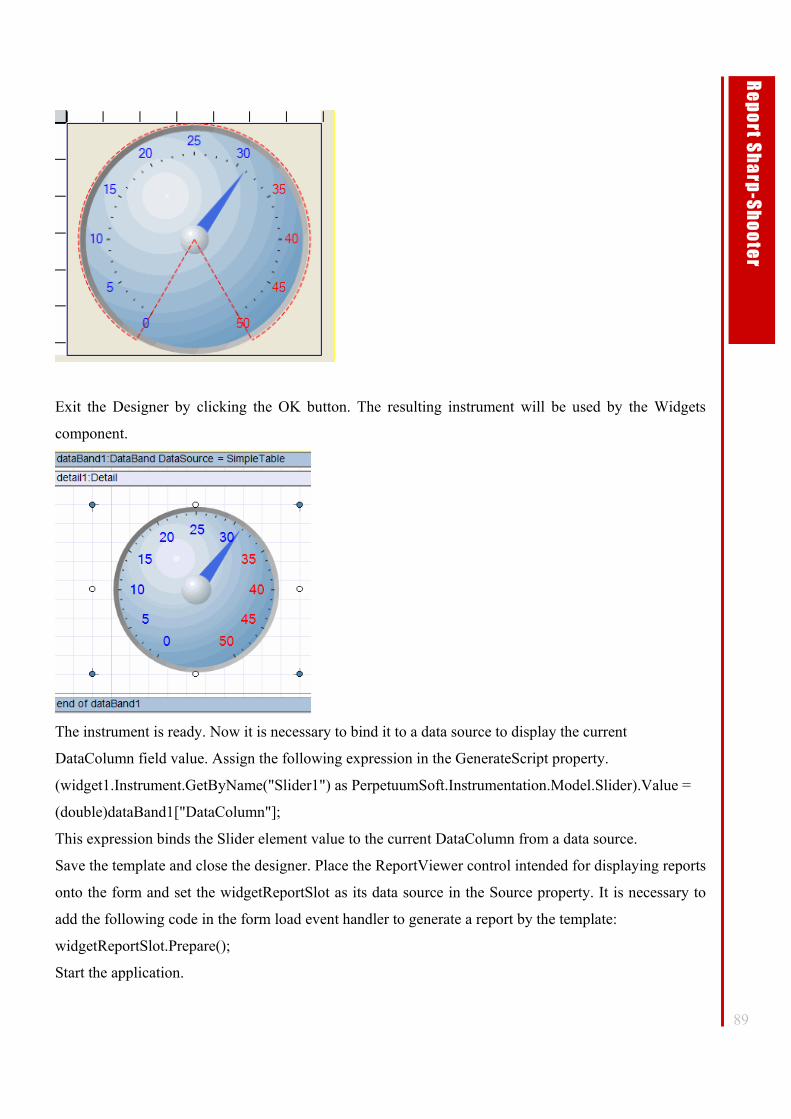
89
Re
po
rt Sh
arp
-Sh
oo
ter
Exit the Designer by clicking the OK button. The resulting instrument will be used by the Widgets
component.
The instrument is ready. Now it is necessary to bind it to a data source to display the current
DataColumn field value. Assign the following expression in the GenerateScript property.
(widget1.Instrument.GetByName("Slider1") as PerpetuumSoft.Instrumentation.Model.Slider).Value =
(double)dataBand1["DataColumn"];
This expression binds the Slider element value to the current DataColumn from a data source.
Save the template and close the designer. Place the ReportViewer control intended for displaying reports
onto the form and set the widgetReportSlot as its data source in the Source property. It is necessary to
add the following code in the form load event handler to generate a report by the template:
widgetReportSlot.Prepare();
Start the application.
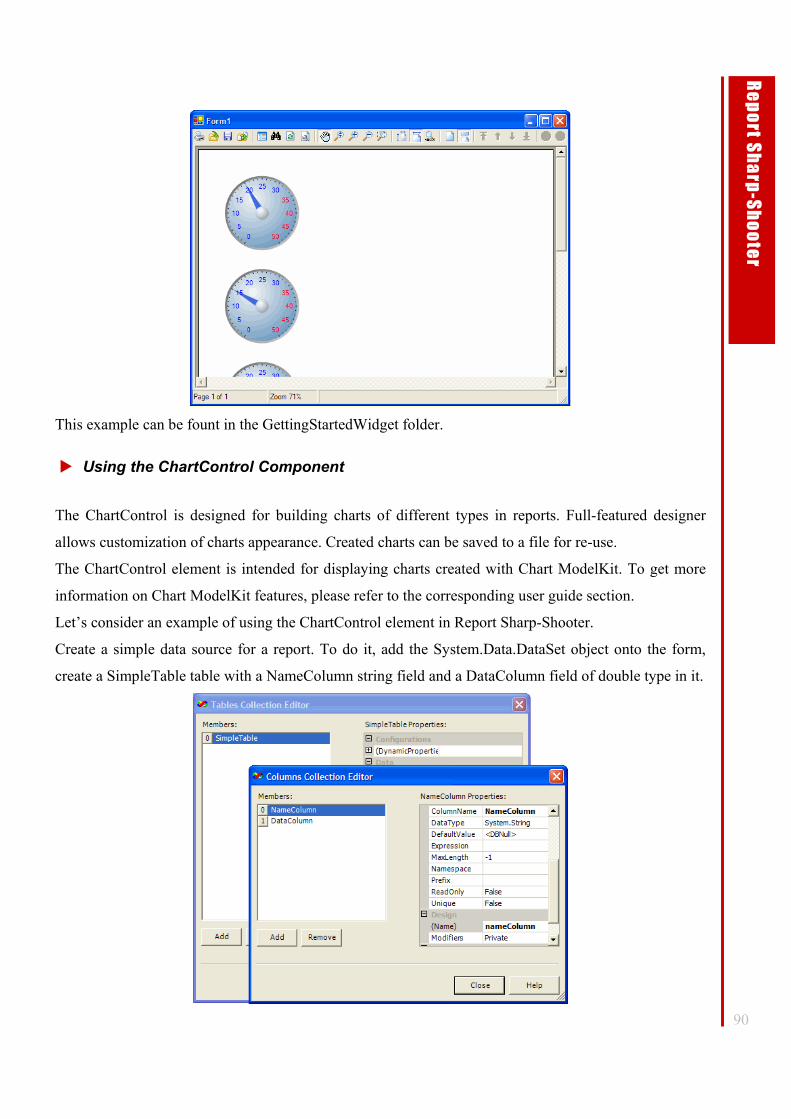
90
Re
po
rt Sh
arp
-Sh
oo
ter
This example can be fount in the GettingStartedWidget folder.
Using the ChartControl Component
The ChartControl is designed for building charts of different types in reports. Full-featured designer
allows customization of charts appearance. Created charts can be saved to a file for re-use.
The ChartControl element is intended for displaying charts created with Chart ModelKit. To get more
information on Chart ModelKit features, please refer to the corresponding user guide section.
Let’s consider an example of using the ChartControl element in Report Sharp-Shooter.
Create a simple data source for a report. To do it, add the System.Data.DataSet object onto the form,
create a SimpleTable table with a NameColumn string field and a DataColumn field of double type in it.
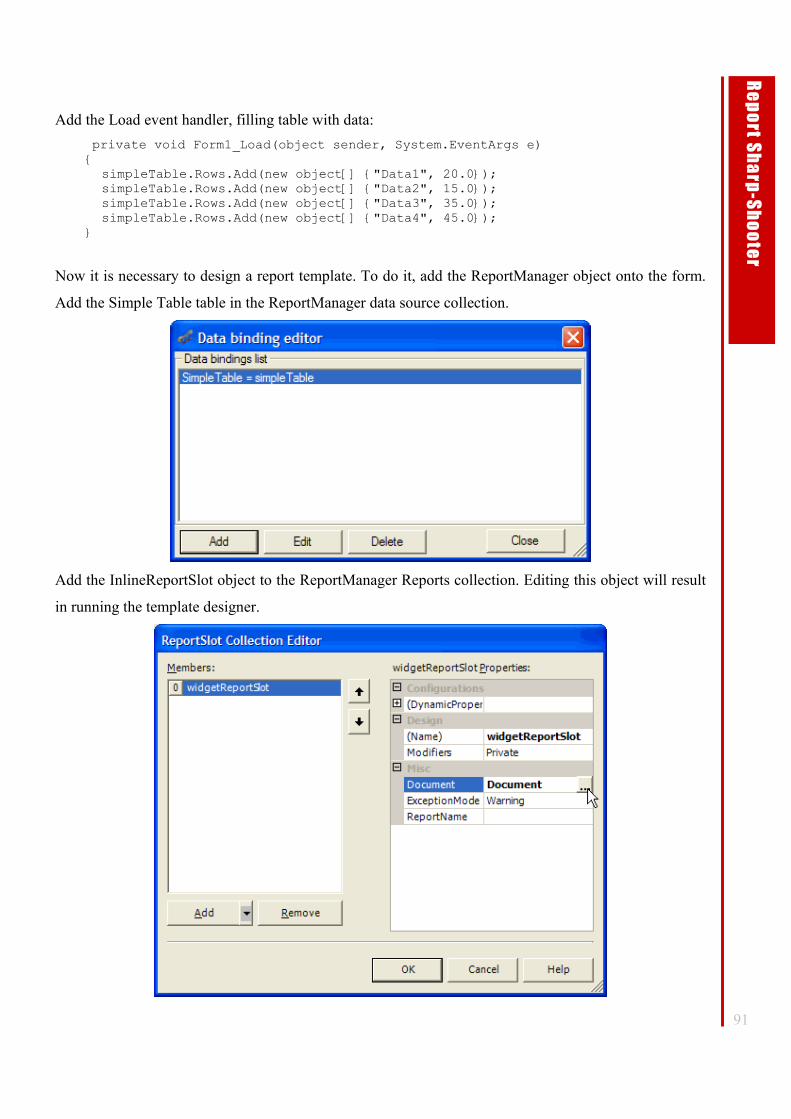
91
Re
po
rt Sh
arp
-Sh
oo
ter
Add the Load event handler, filling table with data: private void Form1_Load(object sender, System.EventArgs e) { simpleTable.Rows.Add(new object[] {"Data1", 20.0}); simpleTable.Rows.Add(new object[] {"Data2", 15.0}); simpleTable.Rows.Add(new object[] {"Data3", 35.0}); simpleTable.Rows.Add(new object[] {"Data4", 45.0}); }
Now it is necessary to design a report template. To do it, add the ReportManager object onto the form.
Add the Simple Table table in the ReportManager data source collection.
Add the InlineReportSlot object to the ReportManager Reports collection. Editing this object will result
in running the template designer.
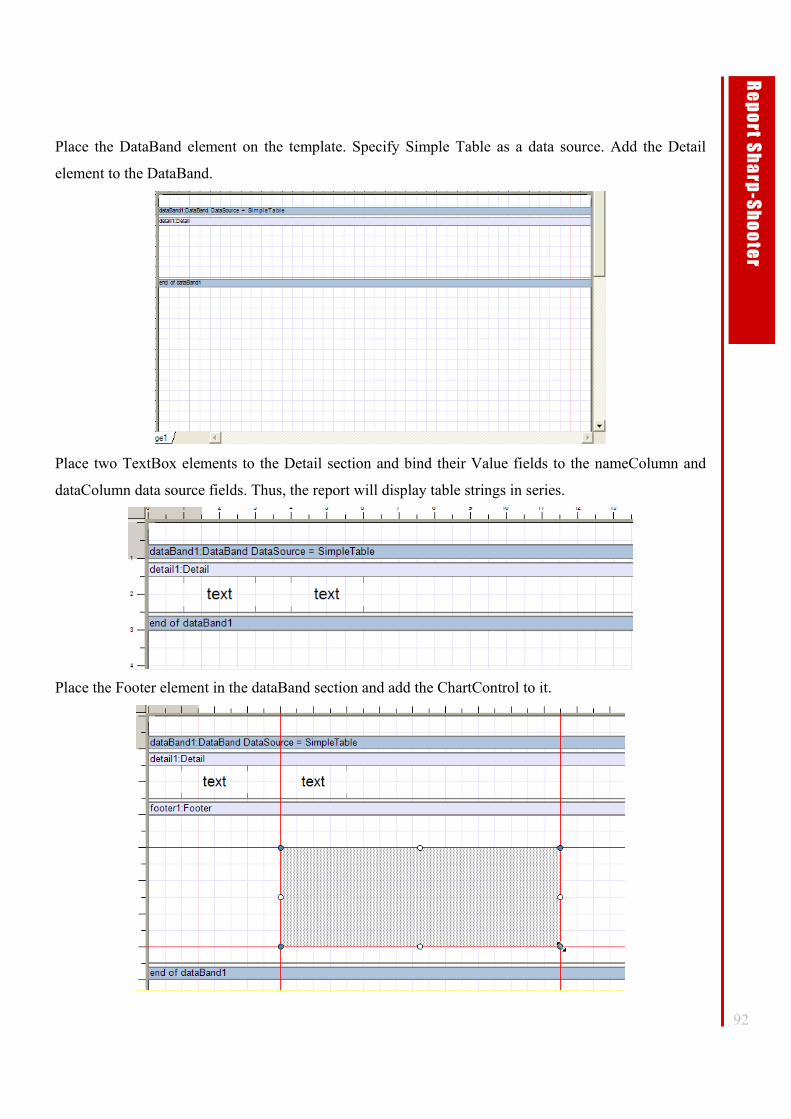
92
Re
po
rt Sh
arp
-Sh
oo
ter
Place the DataBand element on the template. Specify Simple Table as a data source. Add the Detail
element to the DataBand.
Place two TextBox elements to the Detail section and bind their Value fields to the nameColumn and
dataColumn data source fields. Thus, the report will display table strings in series.
Place the Footer element in the dataBand section and add the ChartControl to it.
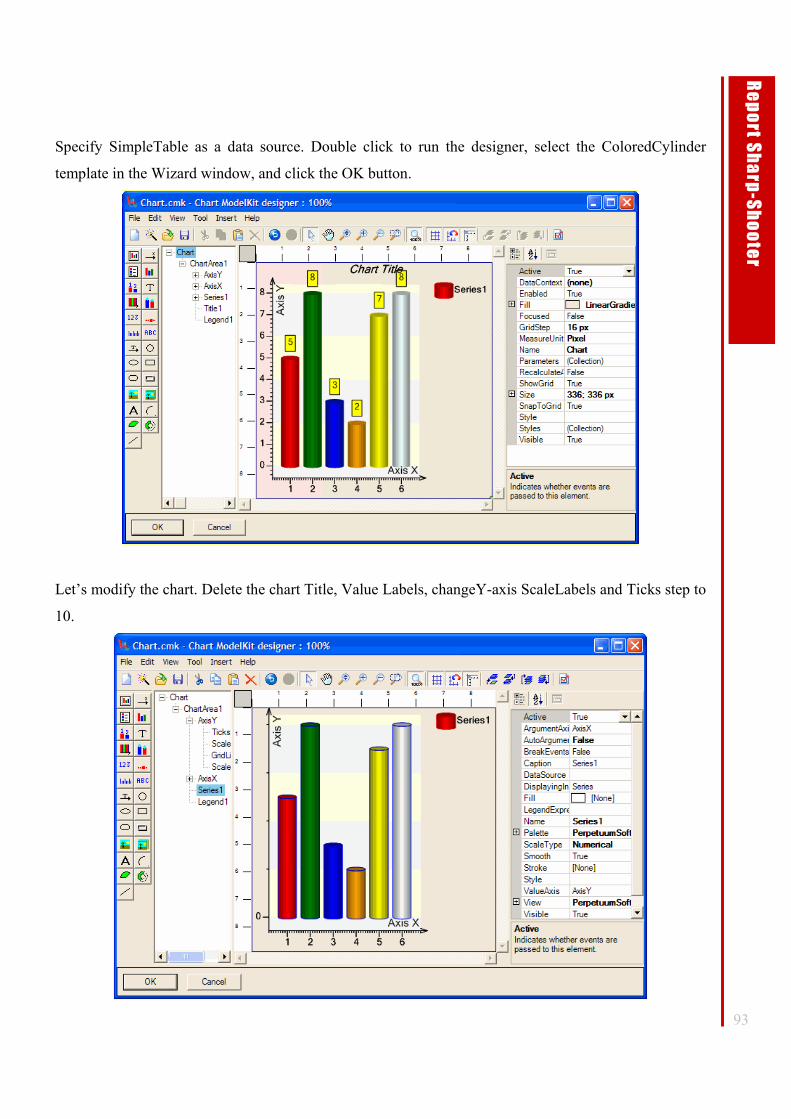
93
Re
po
rt Sh
arp
-Sh
oo
ter
Specify SimpleTable as a data source. Double click to run the designer, select the ColoredCylinder
template in the Wizard window, and click the OK button.
Let’s modify the chart. Delete the chart Title, Value Labels, changeY-axis ScaleLabels and Ticks step to
10.
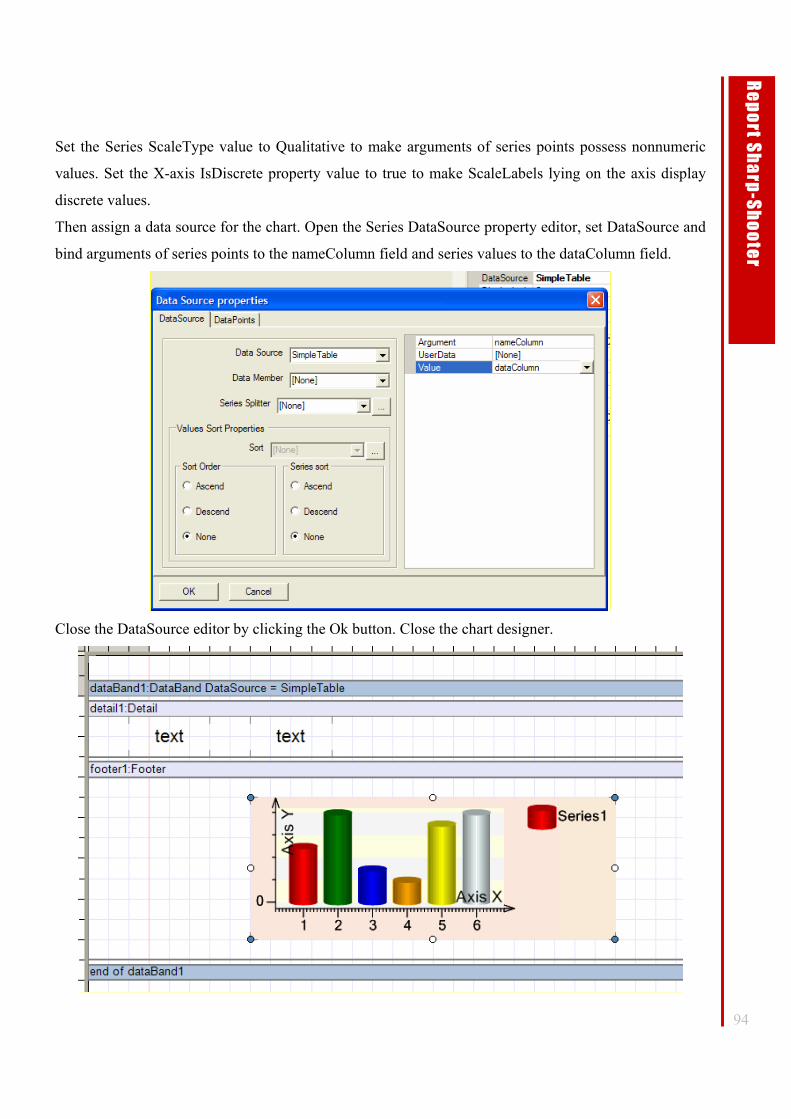
94
Re
po
rt Sh
arp
-Sh
oo
ter
Set the Series ScaleType value to Qualitative to make arguments of series points possess nonnumeric
values. Set the X-axis IsDiscrete property value to true to make ScaleLabels lying on the axis display
discrete values.
Then assign a data source for the chart. Open the Series DataSource property editor, set DataSource and
bind arguments of series points to the nameColumn field and series values to the dataColumn field.
Close the DataSource editor by clicking the Ok button. Close the chart designer.
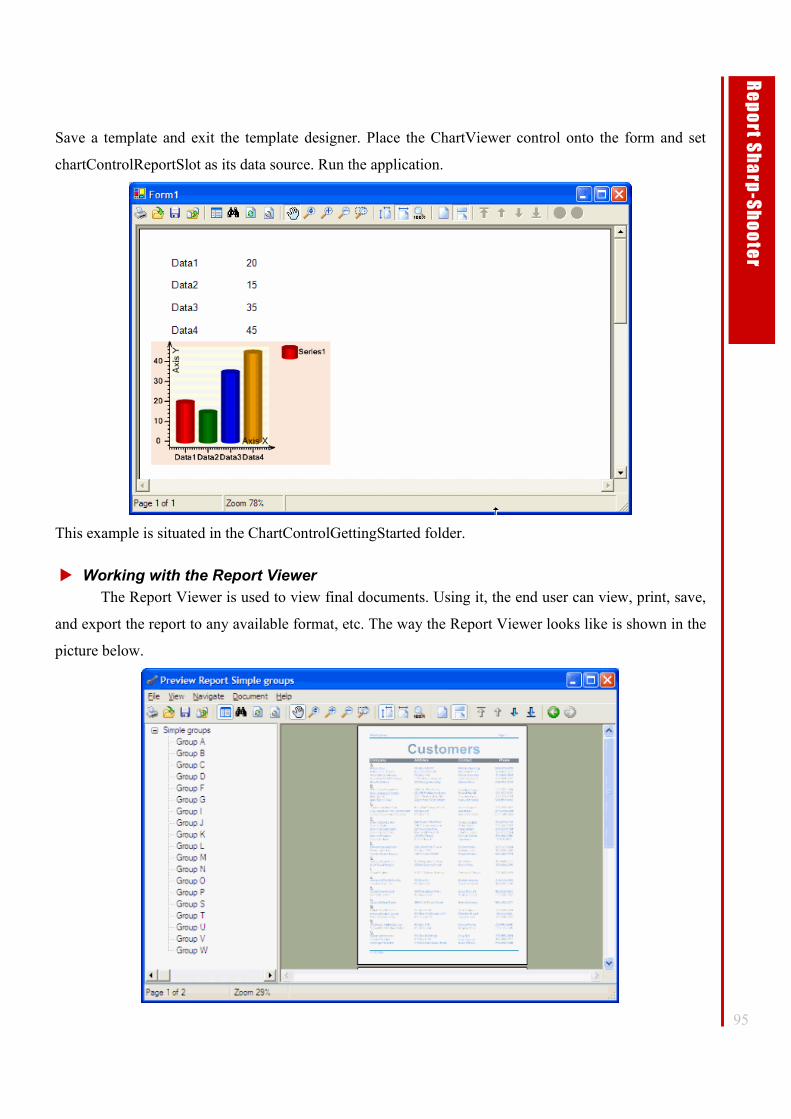
95
Re
po
rt Sh
arp
-Sh
oo
ter
Save a template and exit the template designer. Place the ChartViewer control onto the form and set
chartControlReportSlot as its data source. Run the application.
This example is situated in the ChartControlGettingStarted folder.
Working with the Report Viewer The Report Viewer is used to view final documents. Using it, the end user can view, print, save,
and export the report to any available format, etc. The way the Report Viewer looks like is shown in the
picture below.
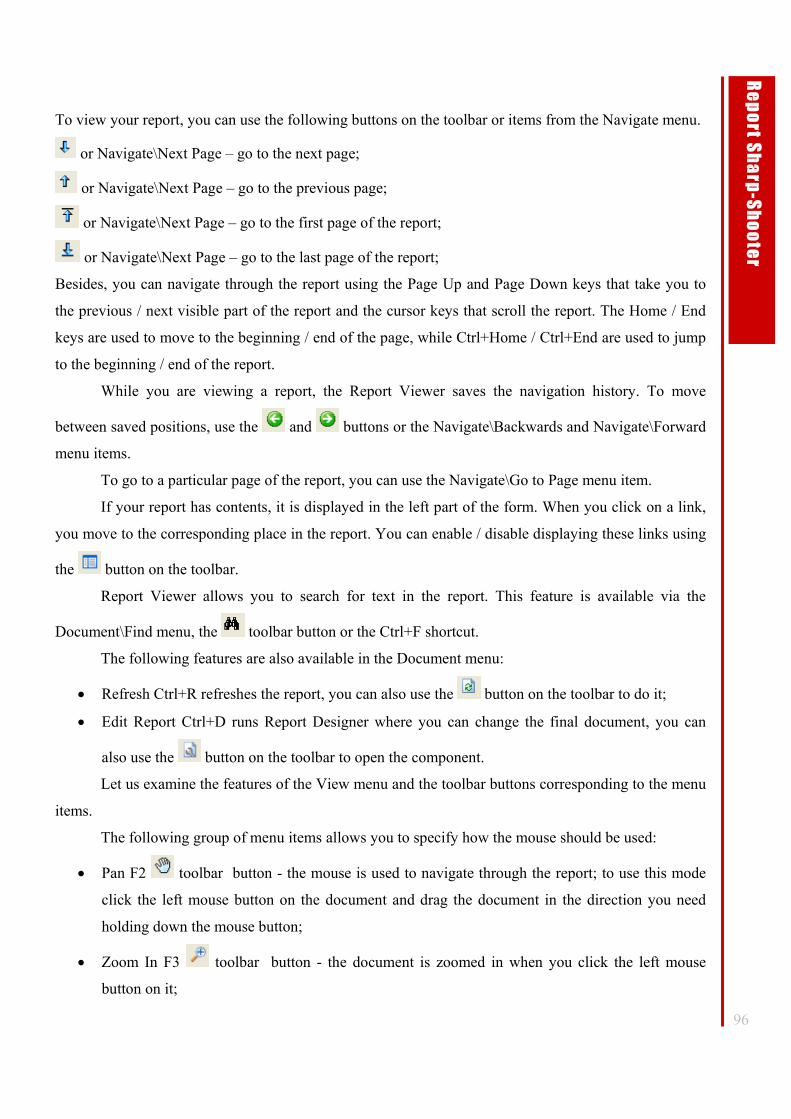
96
Re
po
rt Sh
arp
-Sh
oo
ter
To view your report, you can use the following buttons on the toolbar or items from the Navigate menu.
or Navigate\Next Page – go to the next page;
or Navigate\Next Page – go to the previous page;
or Navigate\Next Page – go to the first page of the report;
or Navigate\Next Page – go to the last page of the report;
Besides, you can navigate through the report using the Page Up and Page Down keys that take you to
the previous / next visible part of the report and the cursor keys that scroll the report. The Home / End
keys are used to move to the beginning / end of the page, while Ctrl+Home / Ctrl+End are used to jump
to the beginning / end of the report.
While you are viewing a report, the Report Viewer saves the navigation history. To move
between saved positions, use the and buttons or the Navigate\Backwards and Navigate\Forward
menu items.
To go to a particular page of the report, you can use the Navigate\Go to Page menu item.
If your report has contents, it is displayed in the left part of the form. When you click on a link,
you move to the corresponding place in the report. You can enable / disable displaying these links using
the button on the toolbar.
Report Viewer allows you to search for text in the report. This feature is available via the
Document\Find menu, the toolbar button or the Ctrl+F shortcut.
The following features are also available in the Document menu:
• Refresh Ctrl+R refreshes the report, you can also use the button on the toolbar to do it;
• Edit Report Ctrl+D runs Report Designer where you can change the final document, you can
also use the button on the toolbar to open the component.
Let us examine the features of the View menu and the toolbar buttons corresponding to the menu
items.
The following group of menu items allows you to specify how the mouse should be used:
• Pan F2 toolbar button - the mouse is used to navigate through the report; to use this mode
click the left mouse button on the document and drag the document in the direction you need
holding down the mouse button;
• Zoom In F3 toolbar button - the document is zoomed in when you click the left mouse
button on it;
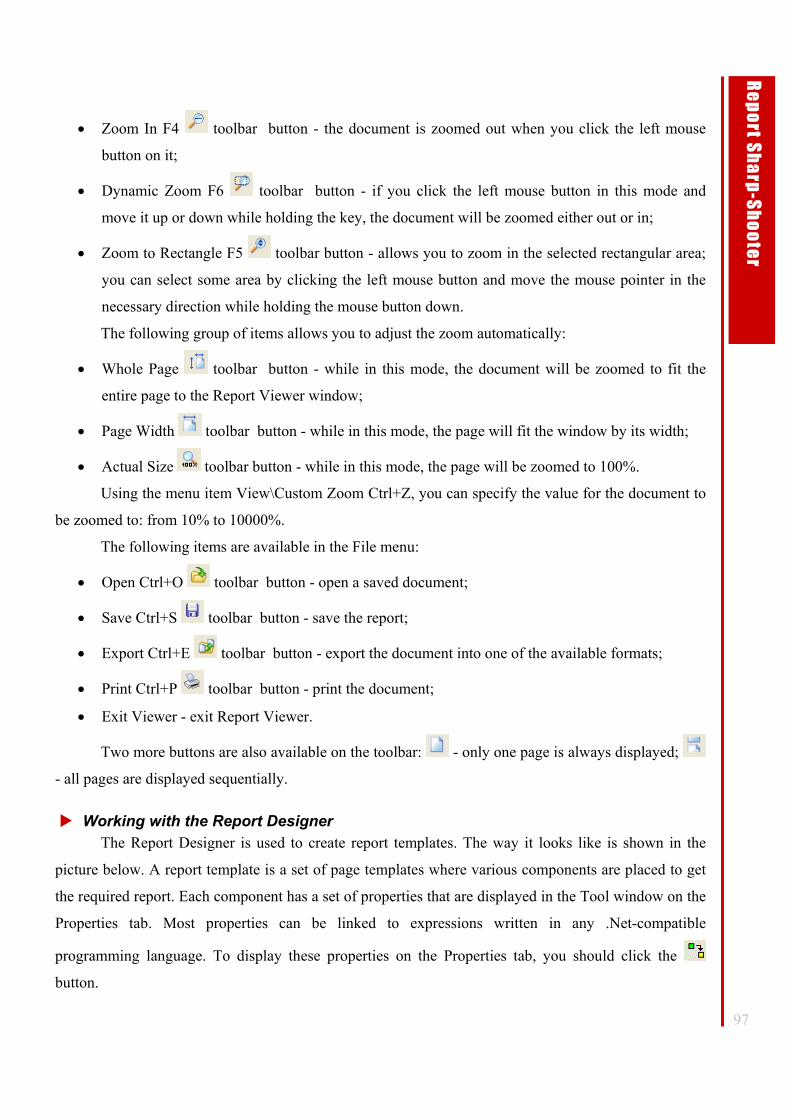
97
Re
po
rt Sh
arp
-Sh
oo
ter
• Zoom In F4 toolbar button - the document is zoomed out when you click the left mouse
button on it;
• Dynamic Zoom F6 toolbar button - if you click the left mouse button in this mode and
move it up or down while holding the key, the document will be zoomed either out or in;
• Zoom to Rectangle F5 toolbar button - allows you to zoom in the selected rectangular area;
you can select some area by clicking the left mouse button and move the mouse pointer in the
necessary direction while holding the mouse button down.
The following group of items allows you to adjust the zoom automatically:
• Whole Page toolbar button - while in this mode, the document will be zoomed to fit the
entire page to the Report Viewer window;
• Page Width toolbar button - while in this mode, the page will fit the window by its width;
• Actual Size toolbar button - while in this mode, the page will be zoomed to 100%.
Using the menu item View\Custom Zoom Ctrl+Z, you can specify the value for the document to
be zoomed to: from 10% to 10000%.
The following items are available in the File menu:
• Open Ctrl+O toolbar button - open a saved document;
• Save Ctrl+S toolbar button - save the report;
• Export Ctrl+E toolbar button - export the document into one of the available formats;
• Print Ctrl+P toolbar button - print the document;
• Exit Viewer - exit Report Viewer.
Two more buttons are also available on the toolbar: - only one page is always displayed;
- all pages are displayed sequentially.
Working with the Report Designer The Report Designer is used to create report templates. The way it looks like is shown in the
picture below. A report template is a set of page templates where various components are placed to get
the required report. Each component has a set of properties that are displayed in the Tool window on the
Properties tab. Most properties can be linked to expressions written in any .Net-compatible
programming language. To display these properties on the Properties tab, you should click the
button.
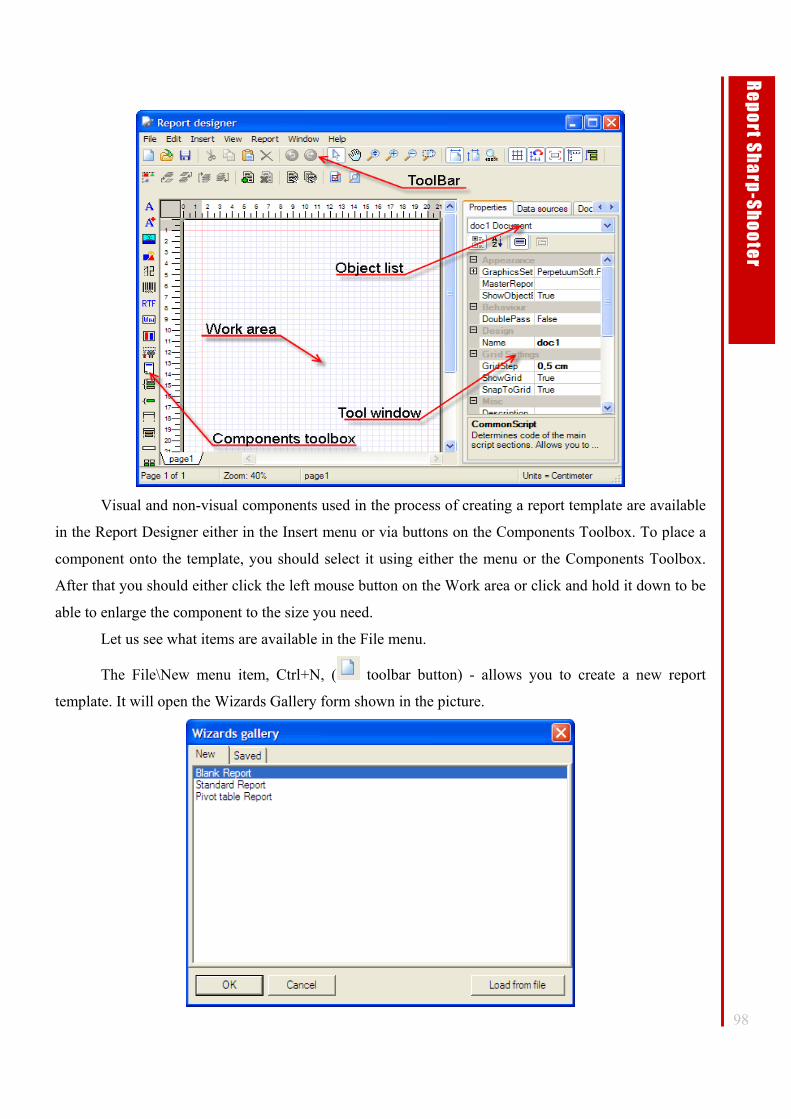
98
Re
po
rt Sh
arp
-Sh
oo
ter
Visual and non-visual components used in the process of creating a report template are available
in the Report Designer either in the Insert menu or via buttons on the Components Toolbox. To place a
component onto the template, you should select it using either the menu or the Components Toolbox.
After that you should either click the left mouse button on the Work area or click and hold it down to be
able to enlarge the component to the size you need.
Let us see what items are available in the File menu.
The File\New menu item, Ctrl+N, ( toolbar button) - allows you to create a new report
template. It will open the Wizards Gallery form shown in the picture.
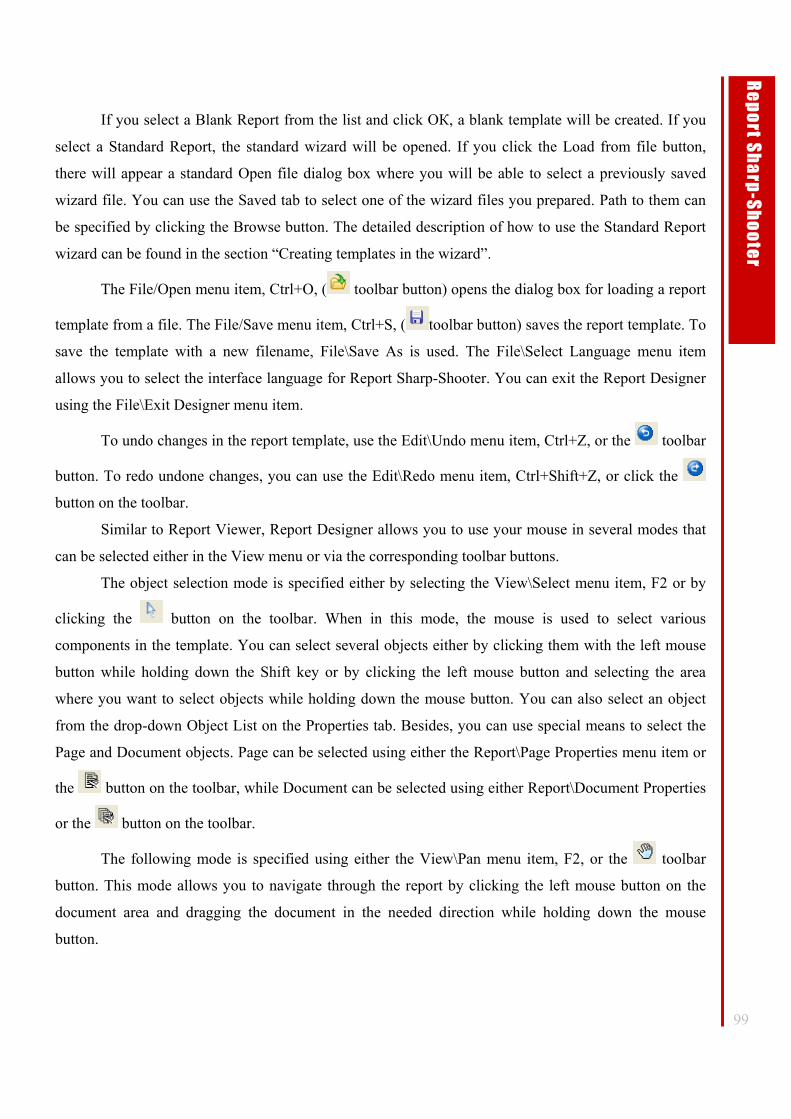
99
Re
po
rt Sh
arp
-Sh
oo
ter
If you select a Blank Report from the list and click ОК, a blank template will be created. If you
select a Standard Report, the standard wizard will be opened. If you click the Load from file button,
there will appear a standard Open file dialog box where you will be able to select a previously saved
wizard file. You can use the Saved tab to select one of the wizard files you prepared. Path to them can
be specified by clicking the Browse button. The detailed description of how to use the Standard Report
wizard can be found in the section “Creating templates in the wizard”.
The File/Open menu item, Ctrl+O, ( toolbar button) opens the dialog box for loading a report
template from a file. The File/Save menu item, Ctrl+S, ( toolbar button) saves the report template. To
save the template with a new filename, File\Save As is used. The File\Select Language menu item
allows you to select the interface language for Report Sharp-Shooter. You can exit the Report Designer
using the File\Exit Designer menu item.
To undo changes in the report template, use the Edit\Undo menu item, Ctrl+Z, or the toolbar
button. To redo undone changes, you can use the Edit\Redo menu item, Ctrl+Shift+Z, or click the
button on the toolbar.
Similar to Report Viewer, Report Designer allows you to use your mouse in several modes that
can be selected either in the View menu or via the corresponding toolbar buttons.
The object selection mode is specified either by selecting the View\Select menu item, F2 or by
clicking the button on the toolbar. When in this mode, the mouse is used to select various
components in the template. You can select several objects either by clicking them with the left mouse
button while holding down the Shift key or by clicking the left mouse button and selecting the area
where you want to select objects while holding down the mouse button. You can also select an object
from the drop-down Object List on the Properties tab. Besides, you can use special means to select the
Page and Document objects. Page can be selected using either the Report\Page Properties menu item or
the button on the toolbar, while Document can be selected using either Report\Document Properties
or the button on the toolbar.
The following mode is specified using either the View\Pan menu item, F2, or the toolbar
button. This mode allows you to navigate through the report by clicking the left mouse button on the
document area and dragging the document in the needed direction while holding down the mouse
button.

100
Re
po
rt Sh
arp
-Sh
oo
ter
The dynamic zoom mode is available either via View\Dynamic Zoom F6 or the toolbar
button. If you click the left mouse button in this mode and move the mouse up or down while holding
down its button, the document will be zoomed either out or in.
The zoom-in mode is enabled using either the View\ Zoom In menu item, F4, or the button
on the toolbar. If you click the document with the left mouse button in this mode, it will be zoomed in.
The zoom-out mode is enabled using either the View\ Zoom Out menu item, F5, or the
button on the toolbar. If you click the document with the left mouse button in this mode, it will be
zoomed out.
Zooming in a certain area of the document is available via the Zoom to Rectangle menu item, F5
(the toolbar button). This mode allows you to zoom in the selected rectangular area. You can select
such an area by clicking the left mouse button on the document area and moving the mouse pointer in
the needed direction while holding down the mouse button.
The following group of items in the View menu allows you to adjust the automatic zoom:
• Whole Page toolbar button - while in this mode, the page will be zoomed to fit the entire
page to the Report Viewer window;
• Page Width toolbar button - while in this mode, the page will fit to the window by its width;
• Actual Size toolbar button - while in this mode, the page will be zoomed to 100%.
The View menu also contains the following items:
• Show Grid (toolbar button ) – enable / disable the grid;
• Snap to Grid (toolbar button ) – enable / disable snapping to the grid; While in this mode,
you can move or resize objects only along the grid line;
• Show Object bounds (toolbar button ) – enable / disable displaying object borders;
• Layout Bands (toolbar button ) – enable / disable arranging sections automatically; while in
this mode, sections are arranged automatically according to the order they will be displayed in
the report;
• Show Rulers (the toolbar button) – enable / disable displaying vertical and horizontal rulers;
A report template can consist of several pages. To add a page, you should use either the
Report\Add Page menu item or the button on the toolbar. Deleting pages is possible using either the

101
Re
po
rt Sh
arp
-Sh
oo
ter
Report\Delete Page menu item or the button on the toolbar; the template must have at least one
page. Switching between pages is done with the help of bookmarks in the lower-left part of the form.
The Edit menu provides various means for working with selected objects. The Edit\Cut Objects
menu item, Ctrl+X (or the button on the toolbar) allows you to copy the selected objects onto the
clipboard and cut them. Edit\Copy Objects, Ctrl+C (the button on the toolbar) copies selected
objects onto the clipboard. Edit\Insert Objects Ctrl+V (the button on the toolbar) inserts objects
from the clipboard. Edit\Delete Objects Ctrl+D (the button on the toolbar) deletes the selected
objects. Report Designer uses the Z-buffer for objects. The earlier an object is inserted into the template,
the lower it is in the Z-buffer. The order of objects is also changed via the Edit menu. Edit\Arrange\
Bring to Front (the button on the toolbar) places the selected object on top of all other objects on the
page. Edit\Arrange\ Bring to Back (the button on the toolbar) places the selected object below all
other objects on the page. Edit\Arrange\Move forward (the button) and Edit\Arrange\Move back
(the button) place the selected object one step up or down respectively.
To create a report according to a template prepared beforehand, you can use either the
Report\Preview menu item or the button on the toolbar. If there is an error detected in the script, the
Error List will appear in the lower part of the Report Designer window. You can enable / disable it using
the Window\Error List menu item, Ctrl+E. You can also check your script without generating the report.
To do it, you can use either the Report\Check Script menu item or the button on the toolbar.
Similarly, you can enable / disable displaying the Tool Window using the Window\Tool
Window menu item, Ctrl+P.
The Tool Window contains two more tabs called Data Sources and Document tree along with the
Properties tab. You can use the Data Sources tab to view available data sources. Also, you can add these
components to the report by drag-and-drop. The Document Tree tab displays the structure of the current
template.
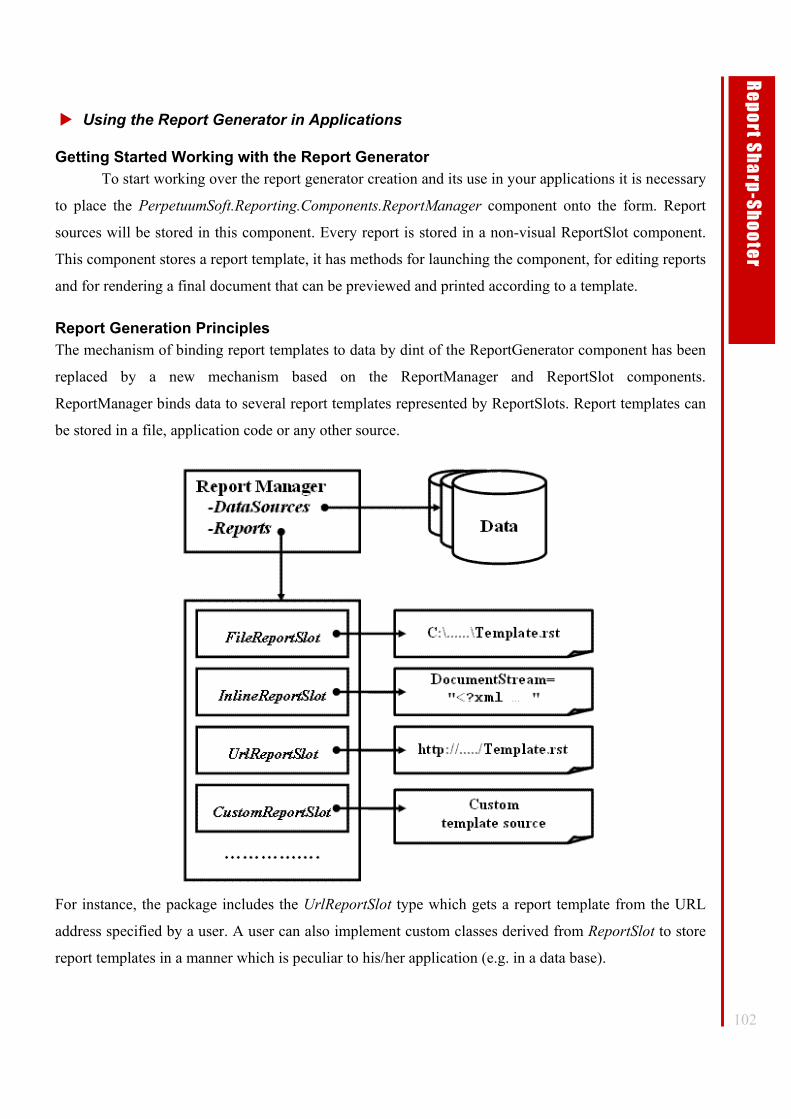
102
Re
po
rt Sh
arp
-Sh
oo
ter
Using the Report Generator in Applications
Getting Started Working with the Report Generator To start working over the report generator creation and its use in your applications it is necessary
to place the PerpetuumSoft.Reporting.Components.ReportManager component onto the form. Report
sources will be stored in this component. Every report is stored in a non-visual ReportSlot component.
This component stores a report template, it has methods for launching the component, for editing reports
and for rendering a final document that can be previewed and printed according to a template.
Report Generation Principles The mechanism of binding report templates to data by dint of the ReportGenerator component has been
replaced by a new mechanism based on the ReportManager and ReportSlot components.
ReportManager binds data to several report templates represented by ReportSlots. Report templates can
be stored in a file, application code or any other source.
For instance, the package includes the UrlReportSlot type which gets a report template from the URL
address specified by a user. A user can also implement custom classes derived from ReportSlot to store
report templates in a manner which is peculiar to his/her application (e.g. in a data base).
103
Re
po
rt Sh
arp
-Sh
oo
ter
The ReportManager component provides the ability to manage a group of reports that use the same data
source regardless of the report templates location. The ReportManager also binds dependent templates
for such relations as Report - MasterReport, Report –SubReports.
The data for the ReportManager are specified in the DataSources property. DataSources is a collection
of data sources. The object-source and its name are assigned for every data source. The object-source is
any object (ADO.NET object, business-object). The ReportManager is also capable of calling data with
the help of the ResolveDataSource event.
Templates are assigned in the ReportManager.Reports property. Report is a collection of objects that
implement IReportSource interface.
IReportSource represents the interface for managing report generation according to a report template.
The Document property provides report templates.
The RenderDocument() method returns a rendered report.
The Prepare() method launches the anisochronous process of the report rendering.
The RenderCompleted method notifies about the report rendering completion.
The IReportSource interface is implemented for the ReportSlot type by default. ReportSlot is a basic
class for all slot types.
Basic ReportSlot properties:
Manager is the object of the ReportManager which is included in the ReportSlot component.
StyleSheet is a set of styles that are used at report rendering. If the given property is set to null, the
styles saved in the document are used.
ReportName is a name of a report template by which it can be called through the IResolveSubReport
interface that is implemented in the ReportManager.
SupportSave indicates whether a report template can be saved.
Basic ReportSlot methods:
SaveReport(<template>) saves a templates to a slot.
LoadReport() returns a template specified in a slot.
Slot types used for template representation.
FileReportSlot is a report slot for a template from a file. The path to the file is specified in the FilePath
property.
InlineReportSlot represents a template that is serialized to the application code.
UrlReportSlot represents a template that is received form the URL address that is specified in the Url
property.
104
Re
po
rt Sh
arp
-Sh
oo
ter
ReportManager implements the IResolveSubReports interface. This interface is required for getting a
bound report by its name, i.e. for getting sub reports or master reports by the assigned name.
The ReportManager selects a template from the Reports collection by the assigned name. In addition,
ReportManager calls the ResolveSubReport event for getting a template by its name.
The Report slots mechanism and grouping in the ReportManager component are intended for report
generation and substitute the ReportGenerator mechanism. The ReportGenerator type is available to
secure compatibility, but its use is not recommended and will not be supported in future versions of
Report Sharp-Shooter.
Editing Reports at Design Time and at Run Time You can design report templates in the Report Designer either by launching it from the
development environment or by opening Report Designer from you running application. To call the
Report Designer in the IDE you should select the ReportManager.Reports property. Add the required
source type and launch the Document property editor. Some data sources can be unavailable, for
example those added at application run time. As a rule, available sources are empty (data are not loaded
to them). That is why you will not be able to preview a final document (see how a final document looks
like). Thus, it is better to design report templates in the launched application when all data sources are
available and data are uploaded to them.
To do this you can temporarily add a button for calling the Report Designer to your application, prepare
all necessary report templates, save them on a disk and then remove this button. The following code in
required for calling the Report Designer. reportSlot.DesignTemplate();
Working in Web Applications
Peculiarities of Working on the Web When you use Report Sharp-Shooter in WebForms applications, reports are always generated on
the server side and then sent to the client. In this case you can send the report to the client in various
formats: html, pdf etc. You can send the entire report or only the requested page at once. Below we will
see various examples of using Report Sharp-Shooter in web applications.
Using the SharpShooterWebViewer Report Sharp-Shooter has a special web control called
PerpetuumSoft.Reporting.Web.SharpShooterWebViewer for viewing reports from ASP.NET
applications. This component has the property for customizing the ViewMode mode of viewing reports
that can process the following values from the PerpetuumSoft.Reporting.Web.ViewMode enumeration:

105
Re
po
rt Sh
arp
-Sh
oo
ter
• HtmlSinglePage – view a single page;
• HtmlWholeReport – view the entire report;
• WindowsForms – view the report in PerpetuumSoft.Reporting.View.ReportViewer (the
component for viewing reports in Windows Forms applications).
The source of the SharpShooterWebViewer document is specified in the Source property of the
ReportBase type from which the ReportSlot component is inherited. SharpShooretWebViewer also
allows you to view the entire report in the pdf format. SharpShooretWebViewer caches all viewed
documents; the time for reports to be stored in the cache is specified in the CacheTimeOut property.
Using properties from the Page category, you can customize the way the line allowing navigating
through pages in the report will look like, NextText defines text for the link to the next page,
PagePosition defines the position of the navigation line, etc. The ImageFormat property defines the
format in which pictures from the report are sent.
The WebDemo example demonstrates the use of SharpShooterWebViewer.
Displaying a Report Instead of the Web Page Content The WebPublish example shows the way of displaying reports on a web page without using
SharpShooterWebViewer. The main page is used to customize the report header and the format to get
the report in. After the “Show” button is clicked, its Click event handler redirects the request to the
ReportPage page Response.Redirect("ReportPage.aspx?format="+DropDownList1.SelectedItem.Value.ToString()+"&title="+TextBox1.Text) The Load event handler of the ReportPage page exports the report into the necessary format and sends it
to the client.
Using the HttpHandler Another way to view reports without using SharpShooterWebViewer is to implement the
System.Web.IHttpHandler interface that allows you to create your own HTTP request handler and
configure it for a particular extension: for example, *.rst. This handler will return a document generated
according to the template specified in the request. The IHttpHandler interface is used in the HttpHandler
example. Request processing is implemented in the ProcessRequest method of the ReportHttpHandler
class. The request handler just exports the report into the requested format and places it into the respond
stream. To use such a handler, you should include approximately the following information into
Web.config. <configuration> <system.web> <httpHandlers> <add verb="*" path="*.rst" type="HttpHandler.ReportHttpHandler,HttpHandler"/>

106
Re
po
rt Sh
arp
-Sh
oo
ter
</httpHandlers> </system.web> </configuration>
The verb attribute defines the list of HTTP commands for which this handler will be called, the path
attribute defines the URL or the URL mask to call this handler for, and the type attribute defines the
handler class and the assembly that contains it.
In our case, we should also click the “Settings” button on the “Home directory” tab in the web
server settings and assign the .rst extension to {disk}:\{Microsoft.NET Framework
path}\aspnet_isapi.dll. on the “Assignment” tab.
Property Description
ShowContent Show/Do not show the Show content button
ShowDesigner Show/Do not show the Edit report button
ShowExport Show/Do not show the Export document button
ShowFind Show/Do not show the Find text button
ShowNavigator Show/Do not show the Move backwards and Move forward buttons
ShowOpen Show/Do not show the Open document button
ShowPageNavigator Show/Do not show the Go to first page, Go to previous page, Go to
next page, Go to last page buttons
ShowPrint Show/Do not show the Print document button
ShowRefresh Show/Do not show the Refresh report button
ShowSave Show/Do not show the Save document button
ShowScale Show/Do not show the Pan mode, Dynamic zoom mode, Zoom in
mode, Zoom out mode, Zoom to rectangle, Fit to whole page, Fit to
page width, Actual size buttons
ShowStatusBar Show/Do not show the status bar
ShowStatusBarGrip Show/Do not show Grip on the status
ShowToolBar Show/Do not show the toolbar
Working in Windows Forms Applications
Using the Report Viewer Component in Applications
The Report Viewer is a separate component with a set of properties that allows you to customize
its appearance. These properties allow you to enable / disable displaying its status bar, toolbar, as well as
separate buttons and column groups on the toolbar. The list of these properties is given below.
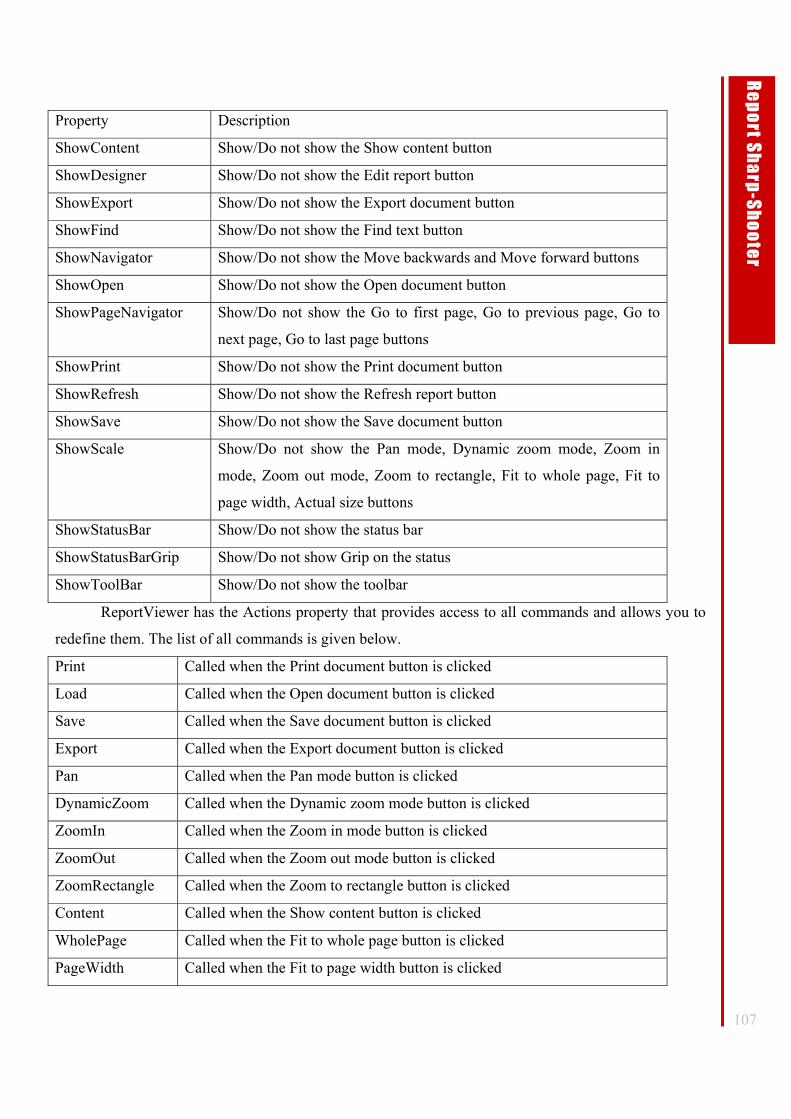
107
Re
po
rt Sh
arp
-Sh
oo
ter
Property Description
ShowContent Show/Do not show the Show content button
ShowDesigner Show/Do not show the Edit report button
ShowExport Show/Do not show the Export document button
ShowFind Show/Do not show the Find text button
ShowNavigator Show/Do not show the Move backwards and Move forward buttons
ShowOpen Show/Do not show the Open document button
ShowPageNavigator Show/Do not show the Go to first page, Go to previous page, Go to
next page, Go to last page buttons
ShowPrint Show/Do not show the Print document button
ShowRefresh Show/Do not show the Refresh report button
ShowSave Show/Do not show the Save document button
ShowScale Show/Do not show the Pan mode, Dynamic zoom mode, Zoom in
mode, Zoom out mode, Zoom to rectangle, Fit to whole page, Fit to
page width, Actual size buttons
ShowStatusBar Show/Do not show the status bar
ShowStatusBarGrip Show/Do not show Grip on the status
ShowToolBar Show/Do not show the toolbar
ReportViewer has the Actions property that provides access to all commands and allows you to
redefine them. The list of all commands is given below.
Print Called when the Print document button is clicked
Load Called when the Open document button is clicked
Save Called when the Save document button is clicked
Export Called when the Export document button is clicked
Pan Called when the Pan mode button is clicked
DynamicZoom Called when the Dynamic zoom mode button is clicked
ZoomIn Called when the Zoom in mode button is clicked
ZoomOut Called when the Zoom out mode button is clicked
ZoomRectangle Called when the Zoom to rectangle button is clicked
Content Called when the Show content button is clicked
WholePage Called when the Fit to whole page button is clicked
PageWidth Called when the Fit to page width button is clicked
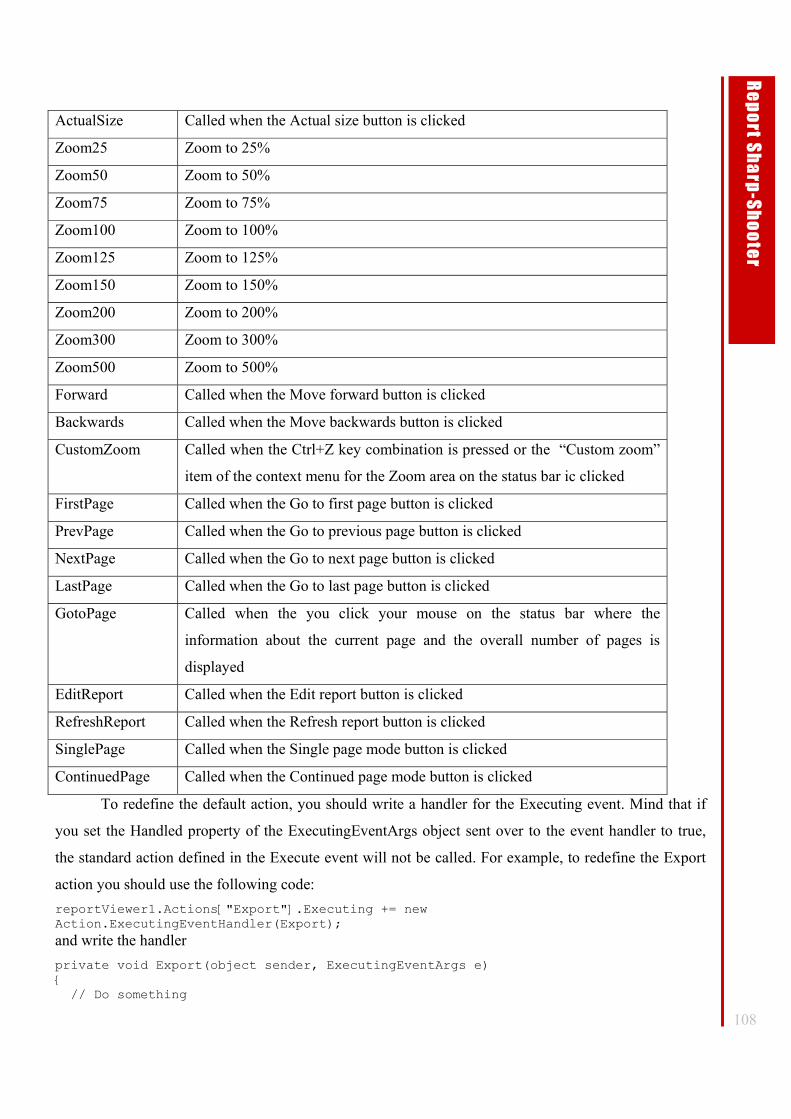
108
Re
po
rt Sh
arp
-Sh
oo
ter
ActualSize Called when the Actual size button is clicked
Zoom25 Zoom to 25%
Zoom50 Zoom to 50%
Zoom75 Zoom to 75%
Zoom100 Zoom to 100%
Zoom125 Zoom to 125%
Zoom150 Zoom to 150%
Zoom200 Zoom to 200%
Zoom300 Zoom to 300%
Zoom500 Zoom to 500%
Forward Called when the Move forward button is clicked
Backwards Called when the Move backwards button is clicked
CustomZoom Called when the Ctrl+Z key combination is pressed or the “Custom zoom”
item of the context menu for the Zoom area on the status bar ic clicked
FirstPage Called when the Go to first page button is clicked
PrevPage Called when the Go to previous page button is clicked
NextPage Called when the Go to next page button is clicked
LastPage Called when the Go to last page button is clicked
GotoPage Called when the you click your mouse on the status bar where the
information about the current page and the overall number of pages is
displayed
EditReport Called when the Edit report button is clicked
RefreshReport Called when the Refresh report button is clicked
SinglePage Called when the Single page mode button is clicked
ContinuedPage Called when the Continued page mode button is clicked
To redefine the default action, you should write a handler for the Executing event. Mind that if
you set the Handled property of the ExecutingEventArgs object sent over to the event handler to true,
the standard action defined in the Execute event will not be called. For example, to redefine the Export
action you should use the following code: reportViewer1.Actions["Export"].Executing += new Action.ExecutingEventHandler(Export); and write the handler private void Export(object sender, ExecutingEventArgs e) { // Do something
109
Re
po
rt Sh
arp
-Sh
oo
ter
e.Handled = true; }
Customizing the Report Viewer Component Sometimes you may need to change standard interface of the Report Viewer component. For
example, it does not correspond to the style of your application or you need to modify the toolbar.
As an example, let us create the Report Viewer with no toolbar (to do it, we should set the
ShowToolBar properties of Report Viewer to false) and add onto the form three buttons for moving on
to the previous / next page of the report and for printing it. To do so, we will use the Actions collection
of the ReportViewer component. A correspondence between a management component and an Action is
set up by the ActionBind type methods. To bind the buttons to certain actions, it is necessary to
implement a class derived from ActionBind.
Here is an example of how it can be done: public class ButtonActionBind : ActionBind { public ButtonActionBind(Button button) { SetComponent(button); } public Button Button { get { return this.Component as Button; } } protected override void Bind() { Button.Click += new EventHandler(Button_Click); } protected override void Unbind() { Button.Click -= new EventHandler(Button_Click); } public override void Update() { if (Action != null) { Button b = Button; b.Enabled = Action.Enabled; b.Text = Action.Text; b.Visible = Action.Visible; } } private void Button_Click(object sender, EventArgs e) {
110
Re
po
rt Sh
arp
-Sh
oo
ter
if (Action != null) Action.ExecuteAction(); } } Now let us bind the buttons to Actions in the ReportViewer: PerpetuumSoft.Reporting.Windows.Forms.Action action = reportViewer1.Actions["PrevPage"]; ButtonActionBind bind = new ButtonActionBind(prevPageButton); action.Bind(bind); action = reportViewer1.Actions["NextPage"]; bind = new ButtonActionBind(nextPageButton); action.Bind(bind); action = reportViewer1.Actions["Print"]; bind = new ButtonActionBind(printButton); action.Bind(bind);
Thus, we have bound the corresponding buttons to the specified actions of the ReportViewer.
The generated report source in the ReportViewer is specified in the ReportBase type Source property.
The form designer on which the ReportViewer is placed takes the ReportBase type parameter and
assigns it to the Source property.
You can find this example in the CustomDesignerViewer folder.
Using the Report Designer Component in Applications To open the Report Designer from your application, it is enough just to call the
DesignTemplate() method of the ReportSlot component.
Customizing the Report Designer Component If you are not satisfied with the standard Report Designer interface, you can easily develop your
own interface because all its elements: its toolbar, status bar, error list, etc. - are available as separate
components. The full list of all these components is given below.
DesignerDataSourceTree – the component displaying data sources. In the standard Report
Designer, it is on the Data Sources tab of the Tool Window.
DesignerDataSourceTree – the component displaying the document structure. In the standard
Report Designer, it is on the Document Tree tab of the Tool Window.
DesignerErrorList – the component displaying the list of errors in the script. In the standard
Report Designer, it is displayed when the function of checking the script is called or during the report
generation process in the lower-part of the form in case there are errors in the report.
DesignerPropertyGrid – the component displaying the list of properties for the selected object. In
the standard Report Designer, it is on the Properties tab of the Tool Window.
DesignerStatusBar – the status bar of the Report Designer.
DesignerToolBar – the toolbar of the Report Designer.
111
Re
po
rt Sh
arp
-Sh
oo
ter
DesignerToolBox – Component ToolBox. In the standard Report Designer, it is docked to the
left border of the form.
ReportDesigner – the main component where the template of a document is edited. All other
components are linked together by the ReportDesigner. To do it, you should set the Designer property to
specify the corresponding ReportDesigner component.
You can find an example of a custom Report Designer in the CustomDesignerViewer folder. To
open a custom Report Designer, there is a button labeled Custom Designer on the main form. When this
button is clicked the button1_Click event handler is executed. The first line creates the form of our
Report Designer CustomDesignerForm f = new CustomDesignerForm(); The Designer property of the ReportDesigner type is declared in the form. We use this property to
specify data sources for the report and the edited report template f.Designer.DataSourceManager = reportManager1.DataSources; f.Designer.SubReportResolver = reportManager1; f.Designer.Document = reportSlot1.LoadTemplate(); And then we display the form on the screen f.ShowDialog();
Let us also redefine handling a click on the Preview Report button ( ), so that the final document will
be displayed in the custom Report Viewer. To do it, we will use the Actions property of the
ReportDesigner component. The Actions property is a collection of actions. The action we need is called
Preview. When you call an action, the Executing event is called first and then the Execute event is
called, if the Executing event handler returns the event that is not processed, the Execute event will not
be called. When the Execute event is called, the standard handler for this event is called. Thus, we
should write our own handler for the Executing event that will open our Report Viewer and set the flag
signaling that the event is processed. This event handler is shown below private void Preview(object sender, ExecutingEventArgs e) { if (reportDesigner1.Document != null) { ReportManager manager = new ReportManager(); InlineReportSlot slot = new InlineReportSlot(); manager.Reports.Add(slot); manager.DataSources = this.DataSources; slot.SaveReport(this.Document); manager.OwnerForm = ParentForm; manager.ResolveSubReport += new ResolveSubReportEventHandler(manager_ResolveSubReport); slot.RenderCompleted += new EventHandler(slot_RenderCompleted); slot.HyperlinkClick += new HyperlinkEventHandler(slot_HyperlinkClick); slot.GetReportParameter += new GetReportParameterEventHandler(slot_GetReportParameter); slot.Prepare(); e.Handled = true; }
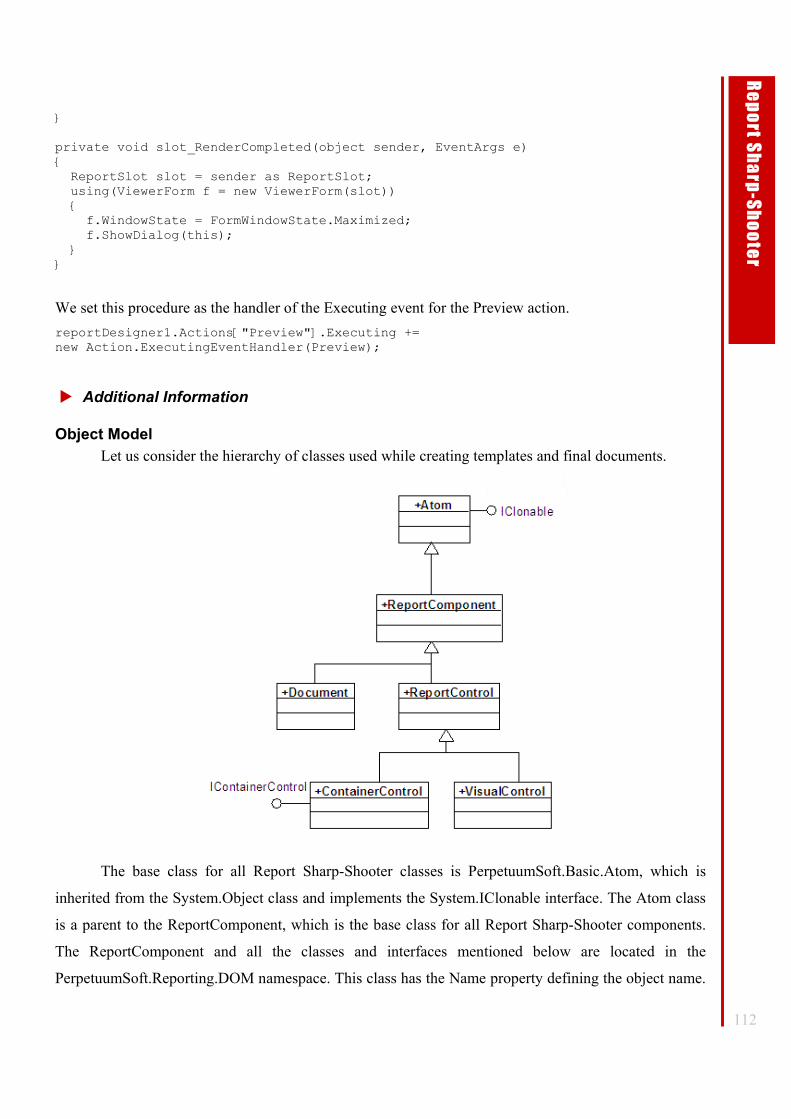
112
Re
po
rt Sh
arp
-Sh
oo
ter
} private void slot_RenderCompleted(object sender, EventArgs e) { ReportSlot slot = sender as ReportSlot; using(ViewerForm f = new ViewerForm(slot)) { f.WindowState = FormWindowState.Maximized; f.ShowDialog(this); } }
We set this procedure as the handler of the Executing event for the Preview action. reportDesigner1.Actions["Preview"].Executing += new Action.ExecutingEventHandler(Preview);
Additional Information
Object Model Let us consider the hierarchy of classes used while creating templates and final documents.
The base class for all Report Sharp-Shooter classes is PerpetuumSoft.Basic.Atom, which is
inherited from the System.Object class and implements the System.IClonable interface. The Atom class
is a parent to the ReportComponent, which is the base class for all Report Sharp-Shooter components.
The ReportComponent and all the classes and interfaces mentioned below are located in the
PerpetuumSoft.Reporting.DOM namespace. This class has the Name property defining the object name.
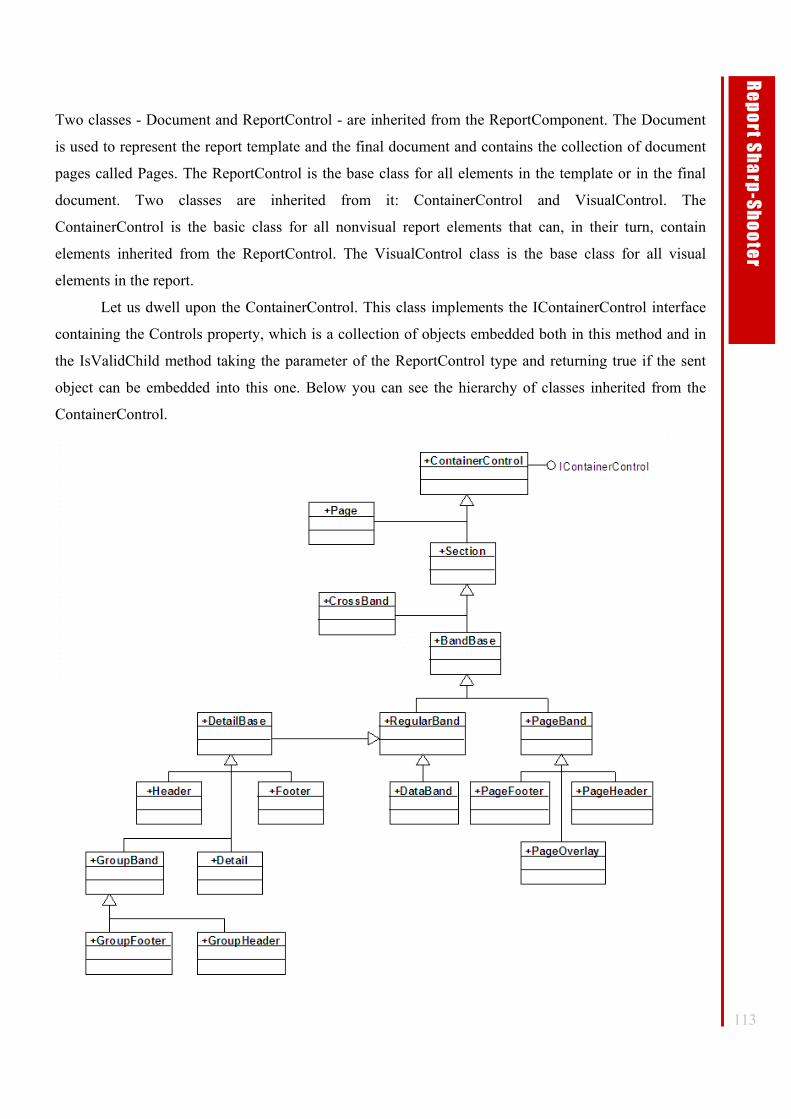
113
Re
po
rt Sh
arp
-Sh
oo
ter
Two classes - Document and ReportControl - are inherited from the ReportComponent. The Document
is used to represent the report template and the final document and contains the collection of document
pages called Pages. The ReportControl is the base class for all elements in the template or in the final
document. Two classes are inherited from it: ContainerControl and VisualControl. The
ContainerControl is the basic class for all nonvisual report elements that can, in their turn, contain
elements inherited from the ReportControl. The VisualControl class is the base class for all visual
elements in the report.
Let us dwell upon the ContainerControl. This class implements the IContainerControl interface
containing the Controls property, which is a collection of objects embedded both in this method and in
the IsValidChild method taking the parameter of the ReportControl type and returning true if the sent
object can be embedded into this one. Below you can see the hierarchy of classes inherited from the
ContainerControl.
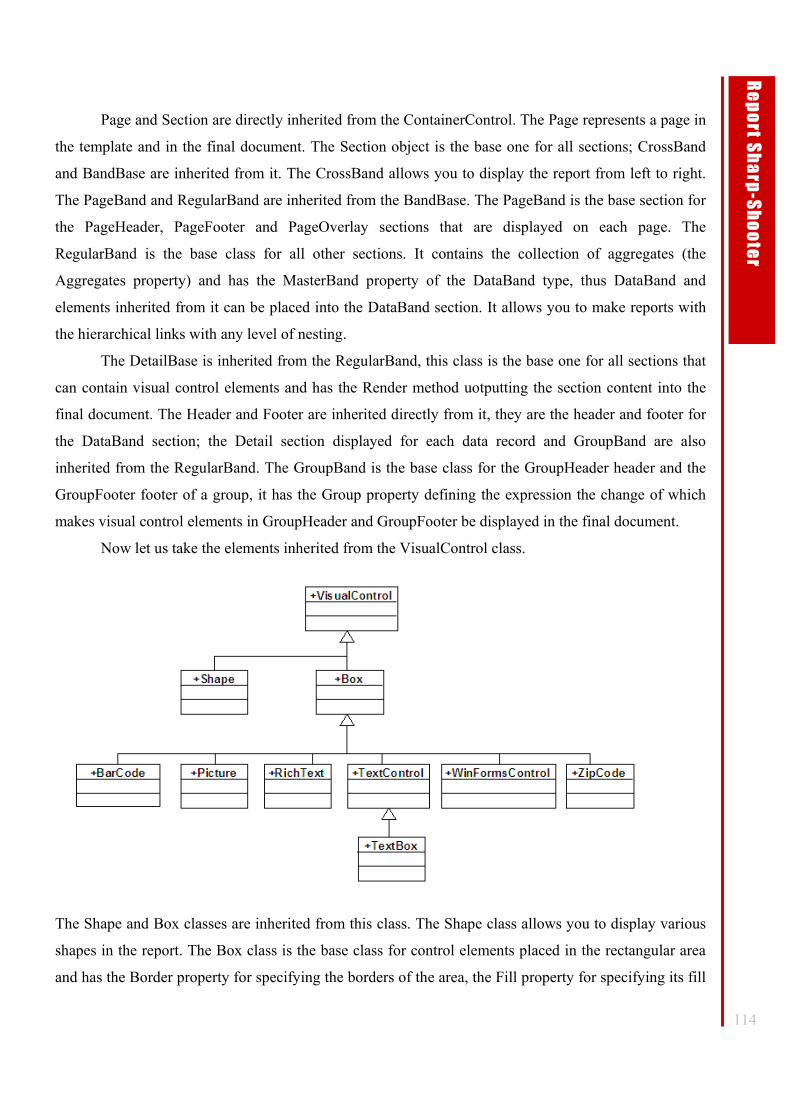
114
Re
po
rt Sh
arp
-Sh
oo
ter
Page and Section are directly inherited from the ContainerControl. The Page represents a page in
the template and in the final document. The Section object is the base one for all sections; CrossBand
and BandBase are inherited from it. The CrossBand allows you to display the report from left to right.
The PageBand and RegularBand are inherited from the BandBase. The PageBand is the base section for
the PageHeader, PageFooter and PageOverlay sections that are displayed on each page. The
RegularBand is the base class for all other sections. It contains the collection of aggregates (the
Aggregates property) and has the MasterBand property of the DataBand type, thus DataBand and
elements inherited from it can be placed into the DataBand section. It allows you to make reports with
the hierarchical links with any level of nesting.
The DetailBase is inherited from the RegularBand, this class is the base one for all sections that
can contain visual control elements and has the Render method uotputting the section content into the
final document. The Header and Footer are inherited directly from it, they are the header and footer for
the DataBand section; the Detail section displayed for each data record and GroupBand are also
inherited from the RegularBand. The GroupBand is the base class for the GroupHeader header and the
GroupFooter footer of a group, it has the Group property defining the expression the change of which
makes visual control elements in GroupHeader and GroupFooter be displayed in the final document.
Now let us take the elements inherited from the VisualControl class.
The Shape and Box classes are inherited from this class. The Shape class allows you to display various
shapes in the report. The Box class is the base class for control elements placed in the rectangular area
and has the Border property for specifying the borders of the area, the Fill property for specifying its fill
115
Re
po
rt Sh
arp
-Sh
oo
ter
and the Margins margins. The following classes are inherited from Box: BarCode – the control element
for displaying the bar code, Picture – for displaying pictures, RichText – for displaying text in the RTF
format, WinFormsControl – for displaying the Windows Forms control elements, ZipCode – for
displaying zip code, and the TextControl class. The TextControl is the base class for displaying text
information in the report, it has the properties defining the angle for text called Angle, allowing you to
automatically change the height of an object depending on the displayed text called CanGrow and
CanShrink, defining the font called Font, defining text alignment called TextAlign, defining the text
filling called TextFill and defining the text format called TextFormat. The TextBox and FindText
method are inherited from the TextControl. The TextBox has the Text property defining the static value
for the text and the Value property defining the expression for calculating it during the report generation
process. The FindText is used to find text information.
Managing the Report Generation Process Report Sharp-Shooter allows its user to change the standard report generation mechanism if
needed. To do it, the ManualBuildScript code should be written in the corresponding Page object. An
example demonstrating the custom report generation process can be found in the ManualBuildExample
folder. This example contains two reports. The first one displays a multiplication table and the second
one displays the tree of the folder where Report Sharp-Shooter is installed.
Let us start from a simpler example: a multiplication table. There is only one Detail with three
TextBoxes in the report template. The Value property of these TextBox objects is set to a, b and c
respectively. a, b and c are variables of the int type declared in the CommonScript property of the
Document object. The following code is inserted in the ManualBuildScript on the page for (a = 1; a < 10; a++) for (b = 1; b < 10; b++) { c = a*b; detail1.Render(); }
Thus, we use loops to assign all possible pairs of values from 1 to 10 to the variables a and b,
calculate the value c, and the detail1.Render() line makes the Detail section be displayed in the report.
We have just assigned new values to the variables a, b and c that will be displayed by the TextBox
objects in this section.
Now let us see the example displaying the tree of folders. There is one detail1 section with the
textBox1 object in the template. This TextBox object is used to display the current folder or file. The
CommonScript property of the Document object contains the following code private string fileName; private float x = 0; private void walkTree(DirectoryInfo dirInfo, int c)
116
Re
po
rt Sh
arp
-Sh
oo
ter
{ x = (float)c * 0.5f; fileName = "[" + dirInfo.Name + "]"; detail1.Render(); DirectoryInfo[] di = dirInfo.GetDirectories(); foreach(DirectoryInfo d in di)walkTree(d,c+1); FileInfo[] fi = dirInfo.GetFiles(); x = (float)(c+1) * 0.5f; foreach(FileInfo f in fi) { fileName = f.Name; detail1.Render(); } } private void buildTree() { string path = (string)Microsoft.Win32.Registry.LocalMachine.OpenSubKey("SOFTWARE\\PerpetuumSoft\\Report Sharp-Shooter").GetValue("Reports"); path = path.Substring(0,path.LastIndexOf("Examples\\Reports")); DirectoryInfo dirInfo = new DirectoryInfo(path); walkTree(dirInfo,0); }
Two variables - fileName and x - are declared in the script. The fileName variable is assigned to
the Value property of the textBox1 object, while x is used to calculate the new values of the Location
and Size properties for textBox1. The buildTree() method is used to find the directory where Report
Sharp-Shooter is installed and to call the walkTree() method that makes a recursive search through the
tree of folders and displays the names of directories and files. To display the tree of folders during the
report generation process, we just have to add the ManualBuildScript property to the Page object and
add calling the buildTree() method.
Dynamic Report Template Generation You can create a report template dynamically using the wizard or you can create it completely on
your own. An example with both template creation methods can be found in the Dynamic folder. There
are two buttons on the main form: “Wizard” – template generation using the wizard, “Dynamic” – report
generation completely on your own.
First, let us examine using the wizard. Classes from the PerpetuumSoft.Reporting.Wizards
namespace are used to create the template. The main class on which the creation of the template is based
is a StandartWizard. The StandartWizard class has properties for creating multicolumn reports, setting
up page parameters, unit measure and a language used for writing scripts, creating data sections, etc. For
more information, consult the Report Sharp-Shooter Class Reference. After all the information about the
report is ready, the StandartWizard.BuildTemplate() function is called to generate the report.
117
Re
po
rt Sh
arp
-Sh
oo
ter
Data sections of the report are stored in the DataSections collection. The DataWizardInfo class is
used to represent a section. The properties of this class allow us to specify a data source, fields displayed
in the section, how elements should be combines in the section, groups and embedded sections.
The FieldInfoWizard class is used to represent a field, the GroupInfoWizard class is used to
represent a group.
Of course, dynamic report generation without using the wizard is a much more flexible method.
You can use absolutely all Report Sharp-Shooter features, but this method is more difficult than using
the wizard.
The Document class is used to represent both templates and final documents, but a report
template must have the IsTemplate property set to true. It is important to mention that all properties
defining the size and position of an object use internal unit measure; that is why it is necessary to
convert the unit measure you use. To do it, you can use either the structure method called Vector public Vector ConvertUnits( Unit fromUnit, Unit toUnit)
or the static structure method called Unit public static float Convert(float value, Unit fromUnit, Unit toUnit )
Creating Live Reports Report Sharp-Shooter allows you to redefine the standard mechanism of handling clicks on links,
as well as any other object in your report. An example demonstrating this feature can be found in the
LiveReportExample folder. In the example, the report template contains the TextBox object and two
Shape objects. The Hyperlink property of the TextBox object is equal to “New report”. To intercept a
click on this link, the HyperlinkClick event of the ReportManager component is used. Let us do so that a
new report is displayed when this link is clicked. The code of the HyperlinkClick event handler is given
below. private void reportManager1_HyperlinkClick(object sender, PerpetuumSoft.Reporting.Components.HyperlinkEventArgs e) { if (e.Hyperlink == "New report") { e.Handled = true; try { reportSlot2.RenderDocument(); using(PerpetuumSoft.Reporting.View.PreviewForm previewForm = new PerpetuumSoft.Reporting.View.PreviewForm(reportSlot2)) { previewForm.WindowState = FormWindowState.Maximized; previewForm.ShowDialog(this); } } Catch (Exception exception) {

118
Re
po
rt Sh
arp
-Sh
oo
ter
MessageBox.Show(exception.Message, "Report Sharp-Shooter", MessageBoxButtons.OK, MessageBoxIcon.Error); } } }
The HyperlinkEventArgs class has two important Hyperlink properties – the text for the link and the
Handled property that returns the value that the event was handled.
When clicking some Shape object, its name is displayed on the screen. The ViewObjectClick
event of the ReportViewer component is used for that. This event handler contains the following code private void reportManager1_ViewObjectClick(object Sender, PerpetuumSoft.Reporting.View.ReportViewEventArgs e) { if(e.Control is PerpetuumSoft.Reporting.DOM.Shape) { MessageBox.Show("You click on shape: " + (e.Control as PerpetuumSoft.Reporting.DOM.Shape).Name); e.Handled = true; } }
The ReportViewEventArgs contains two Control properties of the
PerpetuumSoft.Reporting.DOM.ReportControl type: the object that has been clicked and the Handled
property of the boolean type, the latter is used to return the value whether the event has been handled or
not.
Creating Custom Components An example of using a custom component can be found in the CustomReportControlDemo
folder. This example contains a custom component inherited from the Box object. The new component
has two properties added to it: the Color property defining its color and the Checked property. If
Checked is true, the area the object is crossed by two diagonal lines. The Stored attribute indicates that
this property is saved when the document is saved. The ReportBindable attribute indicates that you can
write expressions calculating values for this property.
If you want to change the default values for some properties of a class, you should write the
corresponding code in the InitNew() method. The PaintContent method draws the component. The most
important method is Render(), this method is called to display a component in the final document. You
should create a new instance of your object in this method CheckBoxReportControl result = new CheckBoxReportControl(); Then you should assign the necessary values to its properties by calling the method PopulateProperties(result); find its position in the final document RenderLocation(result); and place it on the current page in the final document
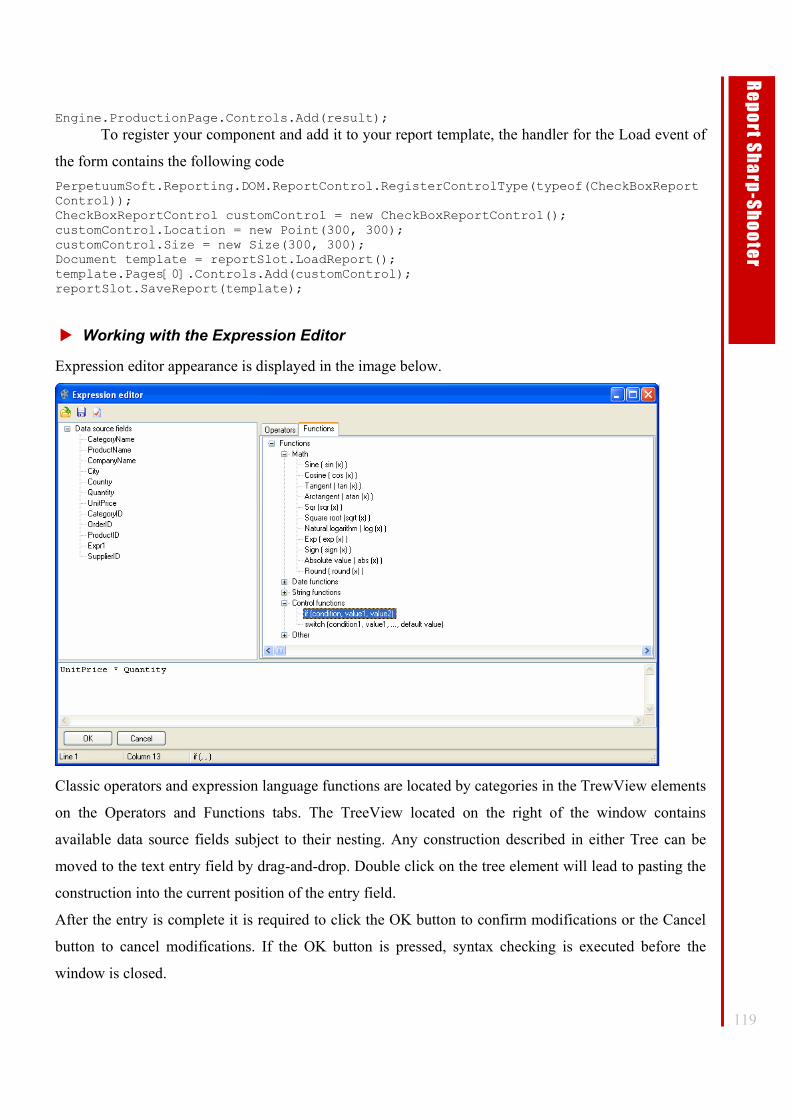
119
Re
po
rt Sh
arp
-Sh
oo
ter
Engine.ProductionPage.Controls.Add(result); To register your component and add it to your report template, the handler for the Load event of
the form contains the following code PerpetuumSoft.Reporting.DOM.ReportControl.RegisterControlType(typeof(CheckBoxReportControl)); CheckBoxReportControl customControl = new CheckBoxReportControl(); customControl.Location = new Point(300, 300); customControl.Size = new Size(300, 300); Document template = reportSlot.LoadReport(); template.Pages[0].Controls.Add(customControl); reportSlot.SaveReport(template);
Working with the Expression Editor
Expression editor appearance is displayed in the image below.
Classic operators and expression language functions are located by categories in the TrewView elements
on the Operators and Functions tabs. The TreeView located on the right of the window contains
available data source fields subject to their nesting. Any construction described in either Tree can be
moved to the text entry field by drag-and-drop. Double click on the tree element will lead to pasting the
construction into the current position of the entry field.
After the entry is complete it is required to click the OK button to confirm modifications or the Cancel
button to cancel modifications. If the OK button is pressed, syntax checking is executed before the
window is closed.
120
Re
po
rt Sh
arp
-Sh
oo
ter
The expression editor has a button panel.
The Save button ( ) allows saving expression text to a file.
The Open button ( ) allows reading expression text from a file.
The Check expression button ( ) allows executing syntax checking. In case a syntax error is found a
corresponding warning specifying the initial position of the erroneous construction is displayed.
Russia,
Perpetuum Software LLC Barnaul, [email protected] Prospect Kalinina 15, 238 [email protected] Altay 656002 http://www. perpetuumsoft.com Tel: +7 3852 357 347