Use of stable isotope labeling by amino acids in cell culture as a spike-in standard in quantitative...
11
© 2011 Nature America, Inc. All rights reserved. PROTOCOL NATURE PROTOCOLS | VOL.6 NO.2 | 2011 | 147 INTRODUCTION Proteomic research analyzes cells, tissues and body fluids in a system-wide and unbiased manner. Today, the mainstream pro- teomic approach is ‘shotgun’ proteomics, in which complex pro- tein mixtures are digested to peptides; these are then separated by reverse-phase liquid chromatography (LC) and analyzed by mass spectrometry (MS) 1,2 . The LC-MS/MS run typically takes 2 h and is composed of thousands of repeating cycles that are made up of two basic units: an MS scan that determines the peptide intensi- ties and mass to charge ratios (m/z) and an MS/MS scan in which a peptide precursor ion is isolated, fragmented and a spectrum of its fragments is obtained 3 . Normally, 5–10 peptides are fragmented for each MS scan. The fragment data from one or up to hundreds of LC-MS/MS runs is then searched in an amino acid sequence database to determine the peptide identity. With state-of-the-art technology, it is now possible to identify tens of thousands of pep- tides in a single chromatographic run, and to identify thousands of proteins from this information. The functionality and significance of the expressed proteins can- not be assessed simply by their qualitative identification; rather this requires their quantification. Quantitative data can constitute the absolute number of molecules in a specific sample; for example, when measuring disease biomarkers one may strive to determine their amounts in nanograms per milliliter of blood. But, most commonly, quantitative studies instead aim to determine relative amounts, typically expressed as a fold-change between two or more different conditions. There is a wide range of experimental as well as computational methods for relative quantification, which differ in their accuracy, simplicity and applicability to various sample types 4–6 . ‘Label-free’ quantification methods compare peptide spec- tral counts or peptide intensities between separate LC-MS/MS runs of the samples to be analyzed. With appropriate computational tools, it is then possible to infer the difference in protein abundance between two samples 7–10 . However, as the samples are processed and analyzed separately, the quantification accuracy is compromised when the number of unpaired steps in the procedure increases. Although they are not very accurate, these label-free algorithms can approximate the protein ratios between samples and can be quite appropriate when large fold changes are expected. For more accurate quantification, most MS-based proteomic methods use labeling of samples with stable isotopes. This creates two versions of each peptide that differ only in the isotopic com- position, but otherwise behave identically during sample prepara- tion, separation and MS analysis. The relative ratios of the resulting peptide pairs are a direct measure of the relative abundance of the peptides in the samples to be compared. Differentially labeled sam- ples are combined and analyzed together by MS, and appropriate software determines the signals and their ratios. Different tools have been developed for relative quantification based on stable isotopes, and they can be classified into two broad categories: chemical or metabolic labeling. In chemical labeling, distinct tags are added to the proteins or the peptides in vitro, giving this method the advan- tage of being applicable to basically all types of protein samples from cells to body fluids 11 . In metabolic labeling, by contrast, heavy isotopes are integrated into the proteome in the process of protein turnover in the living cell 12,13 . This approach started with 15 N label- ing of yeast cells 14 , which was followed a few years later by SILAC, in which cells are labeled with heavy and light amino acids 15,16 . When selecting the quantification method, it is important to consider if it is appropriate to the samples of interest, as well as what the desired accuracy of quantification is. The accuracy of the different Use of stable isotope labeling by amino acids in cell culture as a spike-in standard in quantitative proteomics Tamar Geiger 1 , Jacek R Wisniewski 1 , Juergen Cox 1 , Sara Zanivan 1 , Marcus Kruger 2 , Yasushi Ishihama 3 & Matthias Mann 1 1 Department of Proteomics and Signal Transduction, Max Planck Institute of Biochemistry, Martinsried, Germany. 2 Department of Cardiac Development and Remodeling, Max Planck Institute for Heart and Lung Research, Bad Nauheim, Germany. 3 Graduate School of Pharmaceutical Sciences, Kyoto University, Kyoto, Japan. Correspondence should be addressed to M.M. ([email protected]). Published online 20 January 2011; doi:10.1038/nprot.2010.192 Mass spectrometry (MS)-based proteomics is increasingly applied in a quantitative format, often based on labeling of samples with stable isotopes that are introduced chemically or metabolically. In the stable isotope labeling by amino acids in cell culture (SILAC) method, two cell populations are cultured in the presence of heavy or light amino acids (typically lysine and/or arginine), one of them is subjected to a perturbation, and then both are combined and processed together. In this study, we describe a different approach—the use of SILAC as an internal or ‘spike-in’ standard—wherein SILAC is only used to produce heavy labeled reference proteins or proteomes. These are added to the proteomes under investigation after cell lysis and before protein digestion. The actual experiment is therefore completely decoupled from the labeling procedure. Spike-in SILAC is very economical, robust and in principle applicable to all cell- or tissue-based proteomic analyses. Applications range from absolute quantification of single proteins to the quantification of whole proteomes. Spike-in SILAC is especially advantageous when analyzing the proteomes of whole tissues or organisms. The protocol describes the quantitative analysis of a tissue sample relative to super- SILAC spike-in, a mixture of five SILAC-labeled cell lines that accurately represents the tissue. It includes the selection and preparation of the spike-in SILAC standard, the sample preparation procedure, and analysis and evaluation of the results.
-
Upload
independent -
Category
Documents
-
view
0 -
download
0
Transcript of Use of stable isotope labeling by amino acids in cell culture as a spike-in standard in quantitative...

©20
11 N
atu
re A
mer
ica,
Inc.
All
rig
hts
res
erve
d.
protocol
nature protocols | VOL.6 NO.2 | 2011 | 147
IntroDuctIonProteomic research analyzes cells, tissues and body fluids in a system-wide and unbiased manner. Today, the mainstream pro-teomic approach is ‘shotgun’ proteomics, in which complex pro-tein mixtures are digested to peptides; these are then separated by reverse-phase liquid chromatography (LC) and analyzed by mass spectrometry (MS)1,2. The LC-MS/MS run typically takes 2 h and is composed of thousands of repeating cycles that are made up of two basic units: an MS scan that determines the peptide intensi-ties and mass to charge ratios (m/z) and an MS/MS scan in which a peptide precursor ion is isolated, fragmented and a spectrum of its fragments is obtained3. Normally, 5–10 peptides are fragmented for each MS scan. The fragment data from one or up to hundreds of LC-MS/MS runs is then searched in an amino acid sequence database to determine the peptide identity. With state-of-the-art technology, it is now possible to identify tens of thousands of pep-tides in a single chromatographic run, and to identify thousands of proteins from this information.
The functionality and significance of the expressed proteins can-not be assessed simply by their qualitative identification; rather this requires their quantification. Quantitative data can constitute the absolute number of molecules in a specific sample; for example, when measuring disease biomarkers one may strive to determine their amounts in nanograms per milliliter of blood. But, most commonly, quantitative studies instead aim to determine relative amounts, typically expressed as a fold-change between two or more different conditions. There is a wide range of experimental as well as computational methods for relative quantification, which differ in their accuracy, simplicity and applicability to various sample types4–6. ‘Label-free’ quantification methods compare peptide spec-tral counts or peptide intensities between separate LC-MS/MS runs
of the samples to be analyzed. With appropriate computational tools, it is then possible to infer the difference in protein abundance between two samples7–10. However, as the samples are processed and analyzed separately, the quantification accuracy is compromised when the number of unpaired steps in the procedure increases. Although they are not very accurate, these label-free algorithms can approximate the protein ratios between samples and can be quite appropriate when large fold changes are expected.
For more accurate quantification, most MS-based proteomic methods use labeling of samples with stable isotopes. This creates two versions of each peptide that differ only in the isotopic com-position, but otherwise behave identically during sample prepara-tion, separation and MS analysis. The relative ratios of the resulting peptide pairs are a direct measure of the relative abundance of the peptides in the samples to be compared. Differentially labeled sam-ples are combined and analyzed together by MS, and appropriate software determines the signals and their ratios. Different tools have been developed for relative quantification based on stable isotopes, and they can be classified into two broad categories: chemical or metabolic labeling. In chemical labeling, distinct tags are added to the proteins or the peptides in vitro, giving this method the advan-tage of being applicable to basically all types of protein samples from cells to body fluids11. In metabolic labeling, by contrast, heavy isotopes are integrated into the proteome in the process of protein turnover in the living cell12,13. This approach started with 15N label-ing of yeast cells14, which was followed a few years later by SILAC, in which cells are labeled with heavy and light amino acids15,16. When selecting the quantification method, it is important to consider if it is appropriate to the samples of interest, as well as what the desired accuracy of quantification is. The accuracy of the different
Use of stable isotope labeling by amino acids in cell culture as a spike-in standard in quantitative proteomicsTamar Geiger1, Jacek R Wisniewski1, Juergen Cox1, Sara Zanivan1, Marcus Kruger2, Yasushi Ishihama3 & Matthias Mann1
1Department of Proteomics and Signal Transduction, Max Planck Institute of Biochemistry, Martinsried, Germany. 2Department of Cardiac Development and Remodeling, Max Planck Institute for Heart and Lung Research, Bad Nauheim, Germany. 3Graduate School of Pharmaceutical Sciences, Kyoto University, Kyoto, Japan. Correspondence should be addressed to M.M. ([email protected]).
Published online 20 January 2011; doi:10.1038/nprot.2010.192
Mass spectrometry (Ms)-based proteomics is increasingly applied in a quantitative format, often based on labeling of samples with stable isotopes that are introduced chemically or metabolically. In the stable isotope labeling by amino acids in cell culture (sIlac) method, two cell populations are cultured in the presence of heavy or light amino acids (typically lysine and/or arginine), one of them is subjected to a perturbation, and then both are combined and processed together. In this study, we describe a different approach—the use of sIlac as an internal or ‘spike-in’ standard—wherein sIlac is only used to produce heavy labeled reference proteins or proteomes. these are added to the proteomes under investigation after cell lysis and before protein digestion. the actual experiment is therefore completely decoupled from the labeling procedure. spike-in sIlac is very economical, robust and in principle applicable to all cell- or tissue-based proteomic analyses. applications range from absolute quantification of single proteins to the quantification of whole proteomes. spike-in sIlac is especially advantageous when analyzing the proteomes of whole tissues or organisms. the protocol describes the quantitative analysis of a tissue sample relative to super-sIlac spike-in, a mixture of five sIlac-labeled cell lines that accurately represents the tissue. It includes the selection and preparation of the spike-in sIlac standard, the sample preparation procedure, and analysis and evaluation of the results.

©20
11 N
atu
re A
mer
ica,
Inc.
All
rig
hts
res
erve
d.
protocol
148 | VOL.6 NO.2 | 2011 | nature protocols
methods depends on the stage in the sample preparation process in which the label is integrated, the number of peptides per protein that are labeled and that are therefore available for quantification, and the total number of quantification data points generated in MS acquisition. Naturally, the earlier the samples are combined and the more measurement points for each protein ratio, the better the quantification will be.
In SILAC, proteins are labeled in cell culture with heavy forms of essential amino acids. Dialyzed serum is used so that the added amino acids are the exclusive source. In contrast to labeling with heavy nitrogen or carbon, the heavy amino acids create a distinct and known mass difference between the samples, and only affect the isotope distribution of the peptides in a minor and predict-able way, thereby making data interpretation and quantification more accurate and robust. Typically, cells are labeled with lysine and arginine, which after protein digestion with trypsin, creates a complex peptide mixture where all peptides (except the C-terminal peptide of the protein) are labeled and can be used for quantifica-tion. Peptides are quantified from the MS scans, allowing multiple scans for each peptide across its elution time. Furthermore, protein quantification is usually based on the median values of multiple peptides, resulting in high accuracy of ratio determination. In SILAC experiments, the cells are grown for several passages in the presence of normal (light), medium or heavy amino acids. After the experiment is performed, cells are lysed, mixed, and the whole procedure of sample preparation and MS analysis is then done together (Fig. 1a). Although SILAC appears to be the most accurate
method for the quantification of proteins, until recently it has been limited to cells in culture. In the past few years, the applicability of SILAC has been broadened by labeling entire organisms13, including microorganisms (e.g., bacteria17,18 and yeast7,19), flies20 and mice21. However, complete labeling of organisms may require extended time, which complicates the experiments. Furthermore, the SILAC diet, which must have a defined amino acid content, can sometimes interfere with the experimental design. A major principal limita-tion of SILAC, however, has been its restriction to systems in which the complete proteome can be labeled by proteome turnover. This excluded, for example, the quantitative analysis of human tissue samples. As we describe below, almost all of these restrictions can in principle be removed by using SILAC not in the experiment itself but to produce a SILAC-labeled spike-in standard22,23.
SILAC as a spike-in standardHere we describe protocols for a method in which SILAC-labeled samples are used as references to which the experimental samples are compared. In contrast to classical SILAC experiments, the SILAC sample is produced separately and is spiked into each of the experimental samples, which are then processed and analyzed together. Importantly, the experimental samples are prepared with-out any restriction on experimental design and in particular, nor-mal media and amino acids are used. In the analysis, the sample is the ‘light’ SILAC population and the spike-in SILAC is the ‘heavy’ one. Peptide ratios between sample and the heavy spike-in standard are determined for each of the samples. As the standard is identical
m/z
Inte
nsity
m/z
Inte
nsity
m/z
Inte
nsity
Non-labeled samples
SILAClabeling
Lys0, Arg0
State A
Lys4, Arg6
State B
Lys8, Arg10
State C
State A State B State C
SILAC labeling
Lys-containing peptide Arg-containing peptide
m/z
Inte
nsity
10 Da6 Da
Heavy
Middle
Light
m/z
Inte
nsity
4 Da
Middle
Heavy
8 Da
Light
SILAC ratios
Ratio1 =
Ratio2 =
Ratio3 =
Heavy (SILAC standard)
Light (State A)
Light (State B)
Light (State C)
‘Spike-in’ SILAC ratios
Heavy (SILAC standard)
Heavy (SILAC standard)
Ratio1
Ratio2
Ratio2
Ratio3
=Light (State B)
Light (State A)
=Light (State C)
Light (State B)
SILACstandard
Mix 1:1:1
a b
Heavy (State C)Light (State A)
Ratio1 =
Ratio2 =
Ratio3 = Middle (State B)
Light (State A)
Heavy (State C)
Middle (State B)
Figure 1 | The workflow of classical SILAC experiment versus spike-in SILAC standard. (a) In the classical approach, two or three cell populations are labeled with heavy amino acids, then combined and analyzed together by LC-MS/MS. In the MS spectra, each peptide appears as a doublet or triplet with distinct mass differences. The ratios between the samples are calculated directly by comparing the differences in the intensities of the peaks. (b) With the spike-in SILAC standard, the labeling is separated or ‘decoupled’ from the biological experiment, which is then carried out under normal cell culture conditions. After the experiment is performed, the non-labeled samples are combined with the SILAC standard and each of these combined samples is analyzed separately by LC-MS/MS. The difference between the experimental samples is calculated as the ‘ratio of ratios’, where the ratio of one sample relative to the standard is divided by the ratio of the other relative to the standard.
©20
11 N
atu
re A
mer
ica,
Inc.
All
rig
hts
res
erve
d.
protocol
nature protocols | VOL.6 NO.2 | 2011 | 149
in all cases, the peptide fold-change ratio between the samples is then the ‘ratio of ratios’ (Fig. 1b). The statistical errors in determin-ing a ratio of ratios are higher than in the classical SILAC setup, which only involves a single ratio determination (Fig. 1). However, for many experimental designs and statistical methods, the actual ratios can be used, thus avoiding the propagation of errors. For example, when multiple tissue samples are measured, the obtained ratios to the standard can be directly compared without the need to normalize to a common control tissue. These ratios can be used for t-tests, principle component analyses, clustering and so on.
The choice between a classical SILAC strategy and a spike-in SILAC strategy depends on the question asked and the systems used (Box 1). SILAC as an internal standard has the primary advantage of decoupling the labeling from the experiment. This has many other practical advantages. For example, the labeled standard can be produced very economically in large amounts, aliquotted and stored for long periods. The experiments are performed in exactly the way that they normally would be, without any influence of the labeling process. Furthermore, with internal standard there is no limit to the number of samples that can be analyzed. In contrast, the classical SILAC setup is limited to three samples in a direct com-parison. Most notably, these spike-in standards can be used in the analysis of cells and tissues that cannot be SILAC labeled, thereby expanding the reach of SILAC-based quantitative proteomics.
Selection and production of the SILAC-labeled internal standard. Metabolic labeling with amino acids involves growing the cells or organisms in the presence of heavy labeled amino acids (usually produced with 13C and/or with 15N) instead of their normal coun-terparts. The basic procedure of labeling is the same for spike-in SILAC as for classical SILAC experiments. Protocols for the classical SILAC experiments have been described previously15,24. First, heavy amino acids have to be essential ones, otherwise complete labeling cannot be achieved. Second, the mass difference between the heavy and the normal amino acids should be at least 4 Da, otherwise the natural isotope distributions of the SILAC peptide pairs will partially overlap. Third, the selection of amino acids should match the enzyme used for protein digestion. For example, trypsin cleaves
C-terminal to lysines and arginines; therefore, labeling with heavy forms of these amino acids creates a peptide mixture where almost all peptides can be used for quantification. Furthermore, for use as a spike-in standard, the SILAC-labeled proteome should be simi-lar to the proteomes under investigation to provide counterparts to the expressed proteins and to allow accurate ratio determina-tion. However, this similarity does not have to be very high, and even proteins that are low in the standard may still be identified and quantified (see TROUBLESHOOTING). More generally, it is important to realize that the spike-in standard only serves as a source of peptides to quantify against. It does not necessarily need to represent the biological conditions and processes under investi-gation. As an example, cell lines can be used as spike-in standards for in vivo investigations even if the process of interest only occurs in vivo. The only requirement is that the proteomes are sufficiently similar to allow quantification. To determine in advance whether the spike-in standard is sufficiently similar to the experimental sam-ple, we recommend performing a small-scale experiment, analyzing the data and determining the similarity as described below.
The spike-in SILAC strategy can be used for a wide variety of biological questions. Applications range in complexity from single proteins to highly complex tissues, such as human tumors (Fig. 2). We will discuss each of these applications in turn.
Single SILAC protein (absolute SILAC). Biological and even proteomics experiments often include the analysis of single pro-teins and the determination of their relative or absolute amounts. Several methods in MS-based proteomics have been developed for this purpose; e.g., absolute SILAC17, AQUA25, QConCAT26,27 and FLEXIquant28. In the SILAC paradigm, single, recombinantly pro-duced and purified SILAC-labeled proteins can be spiked into dif-ferent samples, then digested together with the sample and analyzed in the mass spectrometer17,29. In comparison with the synthesis of labeled peptides25, quantification on the basis of whole proteins has the advantage that the reference protein is digested and proc-essed together with the proteome, which automatically corrects for inevitable differences in the preparation procedure. Furthermore, in absolute SILAC the quantification of each protein can be based
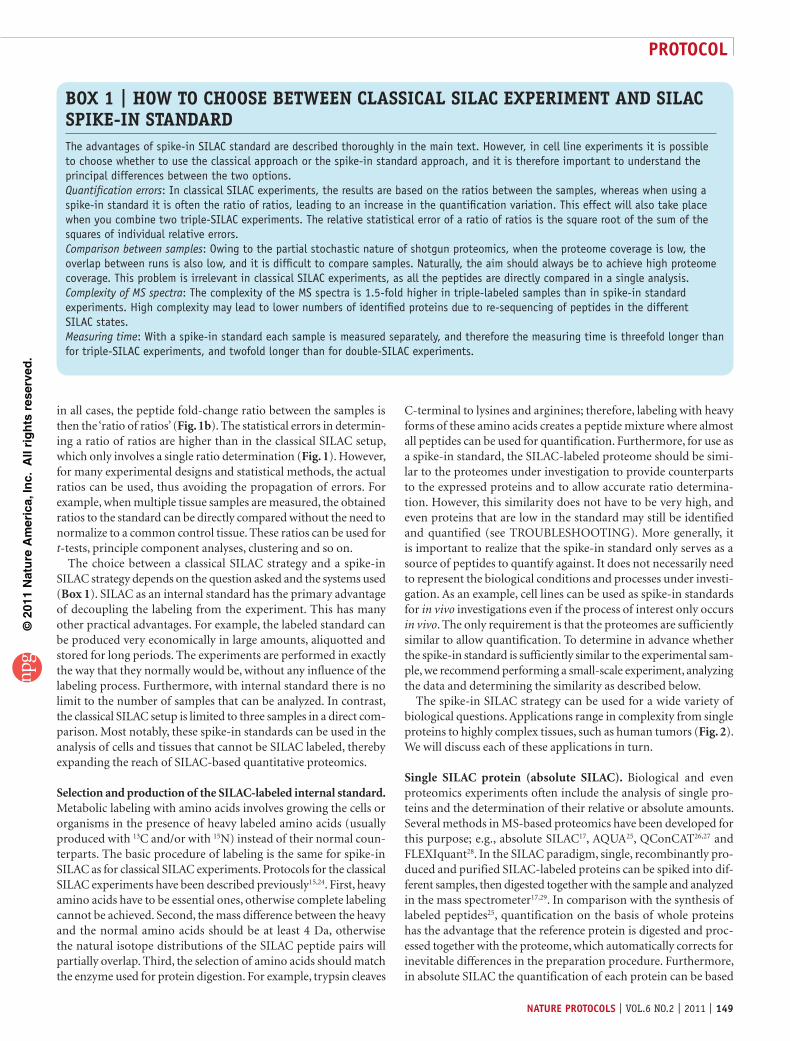
Box 1 | HoW To CHooSE BETWEEN CLASSICAL SILAC ExPERIMENT AND SILAC SPIKE-IN STANDARD The advantages of spike-in SILAC standard are described thoroughly in the main text. However, in cell line experiments it is possible to choose whether to use the classical approach or the spike-in standard approach, and it is therefore important to understand the principal differences between the two options.Quantification errors: In classical SILAC experiments, the results are based on the ratios between the samples, whereas when using a spike-in standard it is often the ratio of ratios, leading to an increase in the quantification variation. This effect will also take place when you combine two triple-SILAC experiments. The relative statistical error of a ratio of ratios is the square root of the sum of the squares of individual relative errors.Comparison between samples: Owing to the partial stochastic nature of shotgun proteomics, when the proteome coverage is low, the overlap between runs is also low, and it is difficult to compare samples. Naturally, the aim should always be to achieve high proteome coverage. This problem is irrelevant in classical SILAC experiments, as all the peptides are directly compared in a single analysis.Complexity of MS spectra: The complexity of the MS spectra is 1.5-fold higher in triple-labeled samples than in spike-in standard experiments. High complexity may lead to lower numbers of identified proteins due to re-sequencing of peptides in the different SILAC states.Measuring time: With a spike-in standard each sample is measured separately, and therefore the measuring time is threefold longer than for triple-SILAC experiments, and twofold longer than for double-SILAC experiments.

©20
11 N
atu
re A
mer
ica,
Inc.
All
rig
hts
res
erve
d.
protocol
150 | VOL.6 NO.2 | 2011 | nature protocols
on multiple peptides, making the quantification more precise. This method can either be used for relative quantification by reference to the same amount of internal SILAC protein, or for absolute quan-tification of the proteins provided that the exact amount of the purified protein has been determined beforehand.
Recombinant proteins can be expressed in various ways ranging from in vitro systems, to bacteria and to mammalian cells. These systems should be auxotrophic for arginine and lysine in case of trypsin digestion or auxotrophic for lysine in case of LysC diges-tion. For some microorganisms, this can be achieved by deletion of the enzymes in the pertinent amino-acid synthesis pathways. For example, for the production of arginine and lysine auxo-trophic Escherichia coli strain, the enzymes ArgA and LysA are deleted, which are essential for the synthesis of the corresponding amino acids17.
Spike-in standard for single cell types. If a single cell type is to be quantified, the SILAC experiment will normally be performed in a classical format. Nevertheless, the generic advantages of spike-in SILAC may make it an attractive alternative in these cases, too (see Box 1). For example, the spike-in standard has the advantage that the experimental cells are maintained in their normal state and are not affected by the special media required for SILAC or by the use of dialyzed serum. Furthermore, the same standard can be used for multiple similar cell lines, and there is therefore no need to label all of them.
In the case of yeast and several other microorganisms, arginine and proline interconversion can be high. This can lead to incom-plete labeling of arginine-containing peptides or complex spectra for proline-containing peptides, which are observed in several
states. In yeast, therefore, lysine labeling and LysC digestion are often preferred30. This problem can also elegantly be solved by genetic engineering, by deleting the enzymes necessary for amino acids conversion31.
SILAC-labeled multicellular model organisms as spike-in standards. SILAC labeling of whole organisms requires preparation of food that contains the SILAC amino acid as the sole source and that is compatible with the growth of the organism13. Full incorpora-tion requires the turnover of the organism’s entire proteome, which can be achieved by feeding it for more than one generation with food that contains heavy amino acids in place of the normal ones. These then represent the real complexity of the organism and the specific organs and tissues of interest, including extracellular pro-teins and body fluids21. As in the case of individual cell types, label-ing multicellular organisms with arginine can raise difficulties as a result of the different rates of arginine to proline conversion; there-fore, most model organisms are labeled only with lysine. Drosophila can be labeled by feeding the flies with heavy labeled yeast20. SILAC-labeled mice have been generated by feeding them with a 13C
6-Lys-
containing diet21. After two generations, they are fully labeled and can serve as a spike-in standard for the analysis of mouse tissues and body fluids. After establishing a mouse colony, it can be main-tained by exclusively feeding the mice with SILAC food.
We recommend using the SILAC model organisms as standards rather than as the experimental system themselves. In the SILAC mouse diet, amino acids substitute for complete proteins; in addi-tion, it has a high sucrose content, which may have metabolic effects and thereby affect biological results. Note, however, that if SILAC-labeled mice were to be used in the classical approach, both ‘heavy’ and ‘light’ mice would show the same effects and differ-ences would not be apparent between case and control. Moreover, with the spike-in standard approach, the same SILAC mice can be used for experiments with mouse strains of various genetic back-grounds32.
Super-SILAC approach for the analysis of complex samples. Tissue proteomics has always posed a special challenge as a result of the great complexity of the sample, which consists of many dif-ferent cell types and extracellular components. In particular, for many years SILAC was considered not to be applicable to tissues due to the inability to label them, especially human ones. Use of SILAC-labeled cells as standard solves this problem, because the quantification of each of the tissue samples can be performed rela-tive to a standard that can readily be labeled. This approach has been demonstrated for the first time by spiking labeled Neuro2A cell lysates into mouse brain tissue lysates23. Depending on the complexity of the tissue, however, using a single cell line as rep-resentative of the tissue may be insufficient. Furthermore, when the samples of interest are diverse (e.g., tumor samples), a single cell line may not represent this variability. To overcome these chal-lenges, one can mix several SILAC-labeled cell lines that together serve as the spike-in standard22. This creates a super-set of SILAC-labeled cells, termed a ‘super-SILAC’ mix. The super-SILAC mix is more representative of the tissue, resulting in more easily quan-tifiable ratios between the proteins in the standard and the tissue of interest.
In our initial description of the super-SILAC approach, we used five cell lines to represent the breast cancer proteome22. In general,
Human tissuesnon-labeled
Mouse tissuesnon-labeled
Yeast Bacteria
Super-SILAC mix
SILAC yeast SILAC bacteria
SILAC protein
Cell lineNon-labeled
Control
Exp A
Exp B
Recombinantprotein expression
SILAC mouse
a
b
Figure 2 | Applications of spike-in SILAC standards. (a) Quantification of cells and tissues can be performed with a super-SILAC mix internal standard or with a labeled model organism. The model organisms can serve as references for the same species. Super-SILAC mix can be used for tissue analysis of model organism and humans. It can also be an alternative approach in cell culture studies. (b) Microorganisms can also be labeled and used as references for the analysis of the same organism. SILAC bacteria can be used to produce SILAC proteins for absolute protein quantification.
©20
11 N
atu
re A
mer
ica,
Inc.
All
rig
hts
res
erve
d.
protocol
nature protocols | VOL.6 NO.2 | 2011 | 151
we recommend creating a mix of 2–5 cell lines. Mixing too many samples will dilute each one, and result in decreased representa-tion of cell-specific proteins. The selection of the cell lines in the mix should be based on the difference between them and on the similarity of each of them to the experimental sample. The cell lines should differ as much as possible from one another, but should still be similar to some of the experimental samples. Using two highly similar cell lines in the mixture would not contribute to the diver-sity of the represented samples and therefore should be avoided. Optimal selection and evaluation of the super-SILAC mix can be performed in silico, given proteome measurements of the target proteome and the proteomes of the potential components of the super-SILAC mix (T.G., unpublished data).
Design of a SILAC experiment. At first, the researcher must con-sider the biological question and the system studied. The makeup of the SILAC standard will vary depending on the complexity of the system of interest, ranging from single proteins to a complex mixture of thousands of proteins, and the approach will depend on the variability of the samples. For each purpose, a specific SILAC strategy can be selected (Fig. 2). The classical SILAC approach should be used in simple experiments, in which 2–5 samples are compared and the samples can be easily labeled without affecting the results. In these cases, the cell lines can be labeled with lysine and arginine in a double- or triple-SILAC format, thus yielding the greatest possible quantitative accuracy. When 4 or 5 samples are compared, they can be split into two experiments, which are later combined based on a common experimental point.
In contrast, a single cell line spike-in standard should be used when multiple samples with high similarity are studied, or in cases where growing the cells in SILAC medium might affect the results. Of course, SILAC-labeled organisms can be used to study these same organisms. Owing to the relatively large investment required for the creation of a SILAC-labeled mouse colony, this effort is recommended mainly for large-scale and long-term studies. It is also possible to purchase specifically labeled mouse organs from commercial sources (at this time, Silantes or Cambridge Isotope Laboratories). We recommend using super-SILAC whenever possible because it is robust, economical and easy to apply for any biological laboratory. In particular, it can be used for tissue analysis, for organisms that cannot be labeled, and for samples
with large variability. In the future, ready-made super-SILAC mixes—associated with in depth proteomic characterization of their proteomes—are available from central distributors or from commercial sources, thus further simplifying the quantitative pro-teomics experiment.
MS analysis and processing of data in MaxQuant. To achieve data of high quality, it is necessary to perform MS analysis on instru-ments with high resolution, high mass accuracy, high dynamic range and high sequencing speed. In our laboratories, we use linear ion trap–Orbitrap instruments (LTQ-Orbitrap or LTQ-Orbitrap Velos)33–35. In combination with proper sample preparation pro-cedures and data analysis, this should result in in-depth coverage; in our hands, typically to more than 4,000 quantified proteins in a mammalian proteome. Coverage of a large or at least consistent part of the proteome in each experiment is important in order to be able to compare multiple samples in an experiment. One sample preparation protocol is described below, but other alternatives may also be suitable and are described elsewhere36,37. We recommend the MaxQuant software38 for data analysis (a detailed protocol has been described before39). MaxQuant detects peaks, isotope clusters and SILAC pairs as three-dimensional peaks in the m/z, elution time and intensity space. Mass accuracy in the p.p.b. range is achieved by multiple peptide mass measurements along the elution profile, resulting in higher confidence in peptide and protein identifica-tion40. MaxQuant quantifies thousands of SILAC pairs in a single LC-MS run, leading to very accurate quantification of thousand of proteins38.
In this protocol, we describe a workflow of quantitative analysis of a tissue sample relative to a super-SILAC mix. We chose this application because of the challenge of tissue quantification and the dramatic simplification with the spike-in SILAC approach. We describe the labeling process and quality check of the SILAC standard, which are a precondition for the success of the method. We continue with lysis and protein digestion, where we follow the filter-aided sample preparation (FASP) method41, and fractionation with strong anion exchange in a StageTip format42. However, the spike-in SILAC approach is not restricted to this procedure and it can be used with other digestion and fractionation methods. In particular, the method can readily be combined with the enrich-ment of modified peptides.
MaterIalsREAGENTS
Cell lines to serve as the spike-in standard. To select an appropriate set of cell lines for the super-SILAC spike-in, it is possible to perform a small-scale, label-free analysis of the candidate cell lines and the tissue of interest. The label-free data can give an estimate of the correlation between the cell lines and the correlation to the tissue and suggest the optimal standard.Tissues of interest ! cautIon All experiments should be performed in ac-cordance with relevant guidelines and regulations.Cell culture medium without lysine and arginine (with glutamine)Dialyzed serumAntibioticsSILAC amino acids (Sigma, Cambridge Isotope Laboratories or Silantes)SDSDTTTris/HCl
•
•
•••••••
IodoacetamideAmmonium bicarbonate (ABC)UreaAcetic acidPhosphoric acidBoric acidNaOHNaClProteomics grade modified trypsin (Promega, cat. no. V5113)Trifluoroacetic acidAcetonitrile (ACN)MethanolMilli-Q ultrapurified water (Millipore) crItIcal Organic solvents should be HPLC grade or higher. Buffers should be prepared with Milli-Q water.
••••••••••••••
©20
11 N
atu
re A
mer
ica,
Inc.
All
rig
hts
res
erve
d.
protocol
152 | VOL.6 NO.2 | 2011 | nature protocols
EQUIPMENTMass spectrometer (with high resolution and high mass accuracy; preferen-tially a hybrid instrument such as LTQ-FT, LTQ-Orbitrap or LTQ-Orbitrap-Velos from Thermo Fisher Scientific)Nanoflow HPLC systemData analysis software for peptide and protein identification and quantifica-tion (preferentially MaxQuant)Bench-top microcentrifugeUV SpectrophotometerFluorometerVacuum concentratorTissue homogenizerSonicatorEmpore C
18 disks for StageTips (3M)
Empore strong anion exchange (SAX) disks (3M)Capillary columns (75 µm inner diameter, 15 cm length) packed with Reprosil C
18-AQ 3 µm beads
FASP filters (30 kDa cutoff; Millipore or Sartorius)Filters, 22-µm poreThermomixer
REAGENT SETUPSILAC amino acid solutions The specific amino acids can be decided by the user. Recommended amino acids are 13C
615N
2-L-lysine (lysine 8) and 13C
615N
4-
L-arginine (arginine 10). To prepare stock solutions, amino acids should be
•
••
•••••••••
•••
dissolved in PBS to a concentration of 146 mg ml − 1 for lysine and 84 mg ml − 1 for arginine. These concentrations are 1,000–3,000-fold higher than the final concentrations necessary for normal cell growth and proper labeling. The exact amounts should be titrated for each cell line and batch of amino acids. Stock solutions can be stored for 1 month at 4 °C.SDS lysis buffer Lysis buffer is composed of 4% (wt/vol) SDS, 100 mM Tris/HCl (pH 7.6) and 0.1 M DTT. crItIcal The lysis buffer should be prepared fresh before use.Urea buffer Urea (8 M) in 0.1 M Tris/HCl (pH 8.5). crItIcal This solu-tion should be prepared fresh. Do not heat urea buffer over 30 °C to avoid peptide carbamylation.Strong anion exchange elution buffers Elution from the strong anion exchange (SAX) filters is performed with six buffers of different pH values. These buffers are based on Britton-Robinson universal buffer, which is composed of 0.1 M acetic acid, 0.1 M phosphoric acid and 0.1 M boric acid. Titrate this buffer with NaOH to the following pH values: 3, 4, 5, 6, 8 and 11. Before use, dilute the buffers fivefold in water. Add NaCl to the pH 3 buffer to a concentration of 0.25 M. crItIcal Stock solution can be stored at 20–25 °C for 1 year, but the diluted buffers should be prepared fresh.HPLC buffer Buffer A contains 0.5% (vol/vol) acetic acid. Buffer B contains 80% (vol/vol) ACN with 0.5% (vol/vol) acetic acid. Buffer A* contains 2% (vol/vol) ACN and 0.1% (vol/vol) trifluoroacetic acid.
proceDuresIlac labeling1| Dilute Lys8 and Arg10 1:2,000 into cell culture medium deprived of these amino acids. The final concentration should be 73 mg per liter for lysine and 42 mg per liter for arginine. These concentrations may need to be further titrated for some cell lines if the incorporation rate is below 0.95 or if there is conversion between arginine and proline (detailed in Steps 5–12). Add 10% dialyzed serum and antibiotics, and filter the medium with 0.22-µm flasks. pause poInt SILAC medium (i.e., medium containing serum and antibiotics) can be stored at 4 °C for up to 2 months.
2| Grow cells in SILAC medium for 5–10 doublings. crItIcal step In every trypsinization step, centrifuge the cells at 500g for 5 min to eliminate the trypsin. Remains of trypsin reduce labeling efficiency of the cells.
3| Exchange the medium every 2–3 days.
4| After five doublings, process a small aliquot of the culture (105 cells or more) for labeling check.
labeling check 5| Lyse the sample from Step 4 with 50 µl SDS lysis buffer.
6| Process and digest 20–50 µg of the sample according to standard protocols. A recommended workflow is described be-low (Steps 16–19 and 24–38).
7| Purify 5–10 µg of the peptides from Step 6 on C18 StageTips43 (or equivalents). pause poInt StageTips can be stored for several months at 4 °C.
8| Elute peptides from the StageTips with buffer B.
9| Remove ACN by vacuum concentrator to reach a volume of 2–5 µl, and dilute with buffer A* to a volume of 5–10 µl.
10| Inject 2–5 µl of peptides onto the column for nano-LC-MS/MS analysis.
11| Analyze the samples with MaxQuant according to the previously published protocol39. Specifically, for the labeling check, analyze the files as ‘double labeled’ with the appropriate heavy amino acids. Add the variable modifications ‘methionine oxi-dation’, ‘N-term acetylation’ and ‘heavy proline’ (to check arginine to proline conversion). Add ‘fixed modification of carbami-domethyl cysteine’. In the ‘Identify’ module, do not use the ‘re-quantify’ option.

©20
11 N
atu
re A
mer
ica,
Inc.
All
rig
hts
res
erve
d.
protocol
nature protocols | VOL.6 NO.2 | 2011 | 153
12| Analyze the peptide.txt output file to calculate the incorporation rate. Distinguish between lysine- and arginine- containing peptides. For each of these subsets determine the incorporation rate as 1–1/average ratio, using the non-normal-ized ratios. The density plot of the density distribution should be narrow, and for both lysine and arginine it should be above 0.95. In cases where arginine incorporation is significantly lower than lysine incorporation, there is probably proline to arginine conversion. Continue labeling the cells with higher arginine concentrations. Arginine to proline conversion can be seen in the evidence.txt table. The number of cases in the evidence.txt table that contain heavy proline indicate the extent of conversion. Heavy proline–containing peptides can be seen as extra peaks with a mass difference of 6 Da from the heavy peaks. In cases in which heavy proline is seen in more than 1–2%, lower the arginine concentration. Alternatively, titration of the light proline concentration may be effective44.
preparation of super-sIlac mix13| Calculate the amount of protein needed for the spike-in standard. Count the number of samples in the whole experiment and multiply by the amount of material for each experiment. For standard proteomic analysis, 50–100 µg will be needed per sample. crItIcal step Always prepare an excess of standard.? trouBlesHootInG
14| Grow a sufficient number of SILAC-labeled cells for the whole protein amount (see Steps 1–4).
15| Lyse the cells with SDS lysis buffer (approximately 100 µl buffer per 106 cells).
16| Incubate the lysate at 95 °C for 5–10 min.
17| Sonicate for 20 s (output control 3; duty cycle 20%).
18| Centrifuge for 5 min at 16,000g at room temperature.
19| Estimate protein concentration of the supernatant using established methods that tolerate high SDS and high DTT con-centrations. We recommend the method of fluorescence measurement relative to tryptophan fluorescence emission at 350 nm with an excitation wavelength of 295 nm.
20| To create the SILAC standard, mix equal protein amounts of the labeled cells from the different cell lines. pause poInt You can aliquot the lysates, snap-freeze them and store them at − 20 °C for one year.
sample preparation—Fasp21| Homogenize a tissue sample with SDS lysis buffer.
22| For sample processing, repeat Steps 16–19.
23| Mix the tissue lysates with the super-SILAC mix at a ratio of 1:1 (amounts of protein).
24| Dilute 100–200 µg protein from Step 23 approximately 1:8 in urea buffer.
25| Place a FASP filter in a collection tube, and load the mixture from the previous step onto the FASP filter.
26| Centrifuge at 14,000g for 15 min.
27| Add 200 µl of urea buffer to the filter and centrifuge at 14,000g for 15 min.
28| Discard the flow-through from the collection tube.
29| Add 100 µl of 50 mM iodoacetamide in urea solution, mix for 1 min at 600 r.p.m. in a thermomixer and incubate for 20 min in the dark.
30| Centrifuge the filter at 14,000g for 10 min.
31| Add 100 µl urea buffer and centrifuge at 14,000g for 10 min. Repeat this step twice.
©20
11 N
atu
re A
mer
ica,
Inc.
All
rig
hts
res
erve
d.
protocol
154 | VOL.6 NO.2 | 2011 | nature protocols
32| Add 100 µl of 50 mM ABC to the filter and centrifuge at 14,000g for 10 min. Repeat this step twice.
33| Add 40 µl of 50 mM ABC buffer with 1–4 µg trypsin (the enzyme-to-protein ratio is between 1:50 to 1:100).
34| Incubate the filters in a wet chamber at 37 °C for 4–18 h.
35| Transfer the filter to a new collection tube.
36| Centrifuge the filter at 14,000g for 10 min.
37| Add 50 µl of 50 mM ABC buffer and centrifuge the filter at 14,000g for 10 min.
38| Measure peptide concentration with a UV spectrophotometer. Record the spectrum from 240 to 340 nm. It should have a distinct peak at 270–280 nm. pause poInt Peptides can be frozen and stored at − 20 °C for 6 months.
saX in a stagetip format39| For each sample, prepare one SAX StageTip by stacking six layers of Empore anion exchange disks.
40| For each sample, prepare six C18 StageTips by stacking three layers of Empore C18 disks.
41| Activate SAX StageTips with one 100 µl methanol wash, followed by one 100 µl 1 M NaOH wash and then by two washes with 100 µl of pH 11 SAX buffer.
42| Activate C18 StageTips with one 100 µl methanol wash, followed by one 100 µl buffer B wash and one 100 µl Milli-Q water wash.
43| Dilute 30–50 µg of the peptides from Step 38 in SAX buffer, pH 11, to make up to 200 µl. Check the pH; if it is < 11, titrate with NaOH.
44| Assemble each SAX StageTip into a C18 StageTip and place in a collection tube. Make sure that the assembled tips can fit your centrifuge; otherwise, cut the top part of the SAX StageTips.
45| Load the diluted peptides onto the SAX StageTips and centrifuge at 4,000–7,000g for 3 min or until all the sample has passed through both filters.
46| Add 100 µl of pH 11 SAX buffer to the same SAX StageTips. Repeat centrifugation.
47| Transfer each SAX StageTip to the second C18 tip; add 100 µl of pH 8 SAX buffer and centrifuge.
48| Continue subsequently eluting with SAX buffers at pH 6, 5, 4 and 3.
49| Wash the C18 StageTips with HPLC buffer A. pause poInt StageTips can be stored for several months at 4 °C.
50| For elution of the peptides for MS analysis, repeat Steps 8–10.
51| In the LC-MS/MS analysis, we recommend gradient lengths of up to 4 h.
MaxQuant analysis52| Analyze the data with MaxQuant according to the published protocol39. Specifically, for this protocol, in the Quant.exe select ‘double labeling’ and the appropriate amino acids. In the Identify.exe file, select the ‘re-quantify’ option, and select the ‘match between runs’ option. Load the necessary files according to the protocol and keep other settings as the default.
53| To check the quality of the standard, analyze the proteinGroups.txt file. A histogram of the ‘ratio H/L normalized’ (i.e., SILAC ratio of heavy to light) can show how well the standard represents the sample.
©20
11 N
atu
re A
mer
ica,
Inc.
All
rig
hts
res
erve
d.
protocol
nature protocols | VOL.6 NO.2 | 2011 | 155
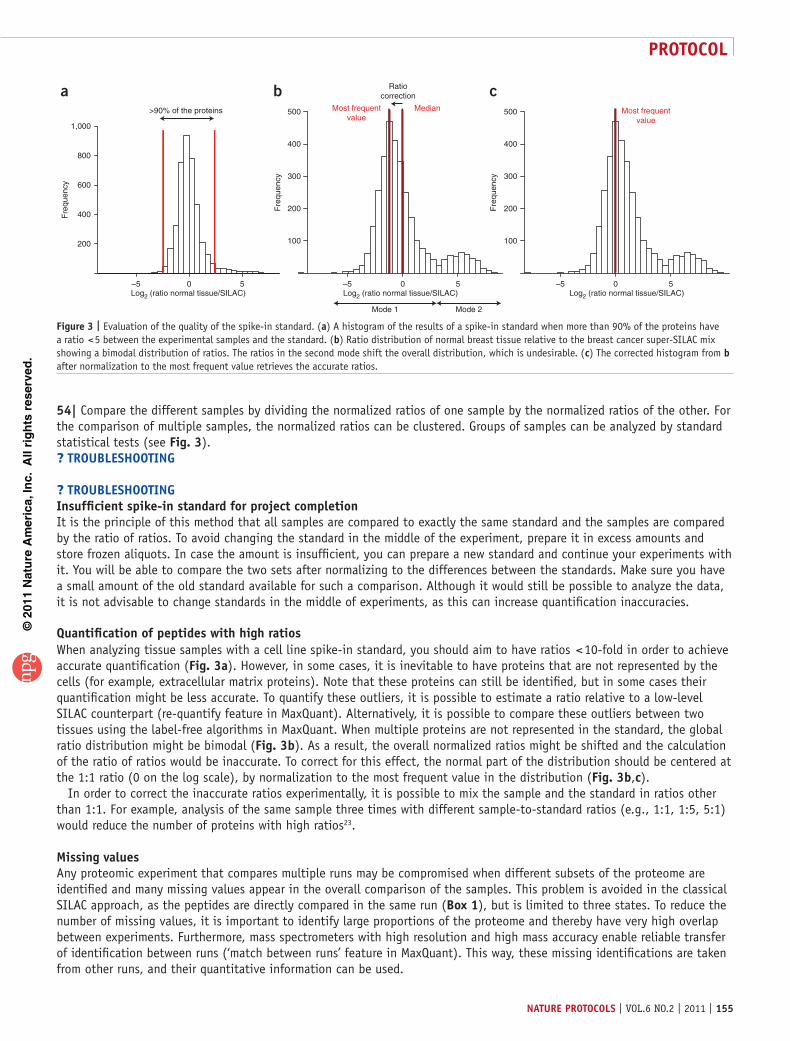
54| Compare the different samples by dividing the normalized ratios of one sample by the normalized ratios of the other. For the comparison of multiple samples, the normalized ratios can be clustered. Groups of samples can be analyzed by standard statistical tests (see Fig. 3).? trouBlesHootInG
? trouBlesHootInGInsufficient spike-in standard for project completion It is the principle of this method that all samples are compared to exactly the same standard and the samples are compared by the ratio of ratios. To avoid changing the standard in the middle of the experiment, prepare it in excess amounts and store frozen aliquots. In case the amount is insufficient, you can prepare a new standard and continue your experiments with it. You will be able to compare the two sets after normalizing to the differences between the standards. Make sure you have a small amount of the old standard available for such a comparison. Although it would still be possible to analyze the data, it is not advisable to change standards in the middle of experiments, as this can increase quantification inaccuracies.
Quantification of peptides with high ratiosWhen analyzing tissue samples with a cell line spike-in standard, you should aim to have ratios < 10-fold in order to achieve accurate quantification (Fig. 3a). However, in some cases, it is inevitable to have proteins that are not represented by the cells (for example, extracellular matrix proteins). Note that these proteins can still be identified, but in some cases their quantification might be less accurate. To quantify these outliers, it is possible to estimate a ratio relative to a low-level SILAC counterpart (re-quantify feature in MaxQuant). Alternatively, it is possible to compare these outliers between two tissues using the label-free algorithms in MaxQuant. When multiple proteins are not represented in the standard, the global ratio distribution might be bimodal (Fig. 3b). As a result, the overall normalized ratios might be shifted and the calculation of the ratio of ratios would be inaccurate. To correct for this effect, the normal part of the distribution should be centered at the 1:1 ratio (0 on the log scale), by normalization to the most frequent value in the distribution (Fig. 3b,c).
In order to correct the inaccurate ratios experimentally, it is possible to mix the sample and the standard in ratios other than 1:1. For example, analysis of the same sample three times with different sample-to-standard ratios (e.g., 1:1, 1:5, 5:1) would reduce the number of proteins with high ratios23.
Missing valuesAny proteomic experiment that compares multiple runs may be compromised when different subsets of the proteome are identified and many missing values appear in the overall comparison of the samples. This problem is avoided in the classical SILAC approach, as the peptides are directly compared in the same run (Box 1), but is limited to three states. To reduce the number of missing values, it is important to identify large proportions of the proteome and thereby have very high overlap between experiments. Furthermore, mass spectrometers with high resolution and high mass accuracy enable reliable transfer of identification between runs (‘match between runs’ feature in MaxQuant). This way, these missing identifications are taken from other runs, and their quantitative information can be used.
Fre
quen
cy–5 50
500
400
300
200
100
Most frequentvalue
Median
Ratiocorrection
Mode 1 Mode 2
Fre
quen
cy
–5 50
500
400
300
200
100
Most frequentvalue
ba
Fre
quen
cy
–5 50Log2 (ratio normal tissue/SILAC)
1,000
800
600
400
200
c>90% of the proteins
Log2 (ratio normal tissue/SILAC) Log2 (ratio normal tissue/SILAC)
Figure 3 | Evaluation of the quality of the spike-in standard. (a) A histogram of the results of a spike-in standard when more than 90% of the proteins have a ratio < 5 between the experimental samples and the standard. (b) Ratio distribution of normal breast tissue relative to the breast cancer super-SILAC mix showing a bimodal distribution of ratios. The ratios in the second mode shift the overall distribution, which is undesirable. (c) The corrected histogram from b after normalization to the most frequent value retrieves the accurate ratios.
©20
11 N
atu
re A
mer
ica,
Inc.
All
rig
hts
res
erve
d.
protocol
156 | VOL.6 NO.2 | 2011 | nature protocols
● tIMInGSteps 1–4, initial labeling of cells: 1–2 weeks depending on their growth rateSteps 5–12, labeling check: 2–3 dSteps 13–14, expansion of SILAC-labeled cultures: 1–4 weeks depending on the size of the experimentSteps 15–20, cell lysis and preparation of super-SILAC mix: 2 hSteps 21–22, tissue homogenization: 2 hSteps 23–49, FASP-SAX: 1.5 dSteps 50–51, LC-MS/MS analysis: 24 h per sample (six fractions)Steps 52–54, MaxQuant and quality analysis: ~0.5 d per sample (six fractions)
antIcIpateD resultsThe SILAC spike-in standard should be representative of the biological sample of interest, and this quality can be measured in several ways. The distribution of the ratios between the samples and the standard should be narrow; ideally you should have more than 90% of all proteins within a fivefold ratio (Fig. 3a). This narrow ratio distribution then translates to accurate quantification and a mean coefficient of variation of a few percent. A total of 4,000–6,000 proteins should be analyzable in a super-SILAC experiment as described above.
acknowleDGMents We thank P. Roerth for suggesting the term ‘spike-in SILAC’. T.G. is supported by the Humboldt Foundation. This project was supported by the European Commission’s 7th Framework Program PROteomics SPECification in Time and Space (PROSPECTS, HEALTH-F4-2008-021,648).
autHor contrIButIons T.G. developed the super-SILAC mix protocol. J.R.W. contributed the FASP and SAX protocols. J.C. developed MaxQuant and adapted it to spike-in SILAC. S.Z. contributed to the development, analysis and maintenance of the SILAC mice. M.K. developed and analyzed the SILAC mice. Y.I. contributed to the use of SILAC in a cell line as a spike-in standard. M.M. initiated and supervised all of these projects. T.G. and M.M. wrote the manuscript. All authors revised the manuscript.
coMpetInG FInancIal Interests The authors declare no competing financial interests.
Published online at http://www.natureprotocols.com/. Reprints and permissions information is available online at http://npg.nature.com/reprintsandpermissions/.
1. Wolters, D.A., Washburn, M.P. & Yates, J.R. III. An automated multidimensional protein identification technology for shotgun proteomics. Anal. Chem. 73, 5683–5690 (2001).
2. Aebersold, R. & Mann, M. Mass spectrometry-based proteomics. Nature 422, 198–207 (2003).
3. Steen, H. & Mann, M. The ABC’s (and XYZ’s) of peptide sequencing. Nat. Rev. Mol. Cell. Biol. 5, 699–711 (2004).
4. Ong, S.E. & Mann, M. Mass spectrometry-based proteomics turns quantitative. Nat. Chem. Biol. 1, 252–262 (2005).
5. Bachi, A. & Bonaldi, T. Quantitative proteomics as a new piece of the systems biology puzzle. J. Proteomics 71, 357–367 (2008).
6. Bantscheff, M., Schirle, M., Sweetman, G., Rick, J. & Kuster, B. Quantitative mass spectrometry in proteomics: a critical review. Anal. Bioanal. Chem. 389, 1017–1031 (2007).
7. Gruhler, A. et al. Quantitative phosphoproteomics applied to the yeast pheromone signaling pathway. Mol. Cell. Proteomics 4, 310–327 (2005).
8. Kohlbacher, O. et al. TOPP—the OpenMS proteomics pipeline. Bioinformatics 23, e191–e197 (2007).
9. Mueller, L.N. et al. SuperHirn—a novel tool for high resolution LC-MS-based peptide/protein profiling. Proteomics 7, 3470–3480 (2007).
10. Luber, C.A. et al. Quantitative proteomics reveals subset-specific viral recognition in dendritic cells. Immunity 32, 279–289 (2010).
11. Leitner, A. & Lindner, W. Chemistry meets proteomics: the use of chemical tagging reactions for MS-based proteomics. Proteomics 6, 5418–5434 (2006).
12. Beynon, R.J. & Pratt, J.M. Metabolic labeling of proteins for proteomics. Mol. Cell. Proteomics 4, 857–872 (2005).
13. Gouw, J.W., Krijgsveld, J. & Heck, A.J. Quantitative proteomics by metabolic labeling of model organisms. Mol. Cell. Proteomics 9, 11–24 (2010).
14. Oda, Y., Huang, K., Cross, F.R., Cowburn, D. & Chait, B.T. Accurate quantitation of protein expression and site-specific phosphorylation. Proc. Natl. Acad. Sci. USA 96, 6591–6596 (1999).
15. Ong, S.E. et al. Stable isotope labeling by amino acids in cell culture, SILAC, as a simple and accurate approach to expression proteomics. Mol. Cell. Proteomics 1, 376–386 (2002).
16. Mann, M. Functional and quantitative proteomics using SILAC. Nat. Rev. Mol. Cell. Biol. 7, 952–958 (2006).
17. Hanke, S., Besir, H., Oesterhelt, D. & Mann, M. Absolute SILAC for accurate quantitation of proteins in complex mixtures down to the attomole level. J. Proteome Res. 7, 1118–1130 (2008).
18. Soufi, B. et al. Stable isotope labeling by amino acids in cell culture (SILAC) applied to quantitative proteomics of Bacillus subtilis. J. Proteome Res. 9, 3638–3646 (2010).
19. de Godoy, L.M. et al. Status of complete proteome analysis by mass spectrometry: SILAC labeled yeast as a model system. Genome Biol. 7, R50 (2006).
20. Sury, M.D., Chen, J.X. & Selbach, M. The SILAC fly allows for accurate protein quantification in vivo. Mol. Cell. Proteomics 9, 2173–2183 (2010).
21. Kruger, M. et al. SILAC mouse for quantitative proteomics uncovers kindlin-3 as an essential factor for red blood cell function. Cell 134, 353–364 (2008).
22. Geiger, T., Cox, J., Ostasiewicz, P., Wisniewski, J.R. & Mann, M. Super-SILAC mix for quantitative proteomics of human tumor tissue. Nat. Methods 7, 383–385 (2010).
23. Ishihama, Y. et al. Quantitative mouse brain proteomics using culture-derived isotope tags as internal standards. Nat. Biotechnol. 23, 617–621 (2005).
24. Ong, S.E. & Mann, M. A practical recipe for stable isotope labeling by amino acids in cell culture (SILAC). Nat. Protoc. 1, 2650–2660 (2006).
25. Gerber, S.A., Rush, J., Stemman, O., Kirschner, M.W. & Gygi, S.P. Absolute quantification of proteins and phosphoproteins from cell lysates by tandem MS. Proc. Natl. Acad. Sci. USA 100, 6940–6945 (2003).
26. Beynon, R.J., Doherty, M.K., Pratt, J.M. & Gaskell, S.J. Multiplexed absolute quantification in proteomics using artificial QCAT proteins of concatenated signature peptides. Nat. Methods 2, 587–589 (2005).
27. Pratt, J.M. et al. Multiplexed absolute quantification for proteomics using concatenated signature peptides encoded by QconCAT genes. Nat. Protoc. 1, 1029–1043 (2006).
28. Singh, S., Springer, M., Steen, J., Kirschner, M.W. & Steen, H. FLEXIQuant: a novel tool for the absolute quantification of proteins, and the simultaneous identification and quantification of potentially modified peptides. J. Proteome Res. 8, 2201–2210 (2009).
29. Brun, V. et al. Isotope-labeled protein standards: toward absolute quantitative proteomics. Mol. Cell. Proteomics 6, 2139–2149 (2007).
30. de Godoy, L.M. et al. Comprehensive mass-spectrometry-based proteome quantification of haploid versus diploid yeast. Nature 455, 1251–1254 (2008).
31. Bicho, C.C., de Lima Alves, F., Chen, Z.A., Rappsilber, J. & Sawin, K.E. A genetic engineering solution to the ‘Arginine Conversion Problem’ in stable isotope labeling by amino acids in cell culture (SILAC). Mol. Cell. Proteomics 9, 1567–1577 (2010).
©20
11 N
atu
re A
mer
ica,
Inc.
All
rig
hts
res
erve
d.
protocol
nature protocols | VOL.6 NO.2 | 2011 | 157
32. Walther, D.M. & Mann, M. Accurate quantification of more than 4,000 mouse tissue proteins reveals minimal proteome changes during aging. Mol. Cell. Proteomics 9 published online, doi: 10.1074/mcp.M110.004523 (3 November 2010).
33. Scigelova, M. & Makarov, A. Orbitrap mass analyzer—overview and applications in proteomics. Proteomics 6 (Suppl 2): 16–21 (2006).
34. Makarov, A. et al. Performance evaluation of a hybrid linear ion trap/orbitrap mass spectrometer. Anal. Chem. 78, 2113–2120 (2006).
35. Olsen, J.V. et al. A dual pressure linear ion trap Orbitrap instrument with very high sequencing speed. Mol. Cell. Proteomics 8, 2759–2769 (2009).
36. Shevchenko, A., Tomas, H., Havlis, J., Olsen, J.V. & Mann, M. In-gel digestion for mass spectrometric characterization of proteins and proteomes. Nat. Protoc. 1, 2856–2860 (2006).
37. Masuda, T., Saito, N., Tomita, M. & Ishihama, Y. Unbiased quantitation of Escherichia coli membrane proteome using phase transfer surfactants. Mol. Cell. Proteomics 8, 2770–2777 (2009).
38. Cox, J. & Mann, M. MaxQuant enables high peptide identification rates, individualized p.p.b.-range mass accuracies and proteome-wide protein quantification. Nat. Biotechnol. 26, 1367–1372 (2008).
39. Cox, J. et al. A practical guide to the MaxQuant computational platform for SILAC-based quantitative proteomics. Nat. Protoc. 4, 698–705 (2009).
40. Cox, J. & Mann, M. Computational principles of determining and improving mass precision and accuracy for proteome measurements in an Orbitrap. J. Am. Soc. Mass. Spectrom. 20, 1477–1485 (2009).
41. Wisniewski, J.R., Zougman, A., Nagaraj, N. & Mann, M. Universal sample preparation method for proteome analysis. Nat. Methods 6, 359–362 (2009).
42. Wisniewski, J.R., Zougman, A. & Mann, M. Combination of FASP and StageTip-based fractionation allows in-depth analysis of the hippocampal membrane proteome. J. Proteome Res. 8, 5674–5678 (2009).
43. Rappsilber, J., Mann, M. & Ishihama, Y. Protocol for micro-purification, enrichment, pre-fractionation and storage of peptides for proteomics using StageTips. Nat. Protoc. 2, 1896–1906 (2007).
44. Bendall, S.C. et al. Prevention of amino acid conversion in SILAC experiments with embryonic stem cells. Mol. Cell. Proteomics 7, 1587–1597 (2008).