Use of Diffusion-Weighted, Intravoxel Incoherent Motion, and Dynamic Contrast-Enhanced MR Imaging in...
8
Original Investigations Use of Diffusion-Weighted, Intravoxel Incoherent Motion, and Dynamic Contrast-Enhanced MR Imaging in the Assessment of Response to Radiotherapy of Lytic Bone Metastases from Breast Cancer Michele Gaeta, MD, Caterina Benedetto, MD, Fabio Minutoli, MD, Tommaso D’Angelo, MD, Ernesto Amato, PhD, Silvio Mazziotti, MD, Santi Racchiusa, MD, Enricomaria Mormina, MD, Alfredo Blandino, MD, Stefano Pergolizzi, MD Rationale and Objectives: To investigate the value of diffusion-weighted (DW), perfusion-sensitive, and dynamic contrast-enhanced (DCE) magnetic resonance imaging (MRI) techniques in assessing the response of bone metastases from breast cancer to radiotherapy, with partic- ular emphasis on the role of intravoxel incoherent motion (IVIM)-DW parameters as a potential valuable imaging marker of tumor response. Materials and Methods: Fifteen women having breast cancer and bone metastases underwent MRI before and after radiotherapy (3 weeks [time 1], 2 months [time 2], and 4 months [time 3]), consisting of DW, perfusion-sensitive (IVIM), and DCE acquisitions. MR-based DW and perfusion parameters, including water diffusivity (D), perfusion fraction (f), pseudodiffusion (D*), total apparent diffusion coefficient (ADC-total), fractionated ADCs (ADC-high and ADC-low), and initial area under the gadolinium concentration curve after the first 60 seconds (IAUGC60), were determined. The morphologic MRI findings were also recorded. A one-way repeated measures analysis of variance was used to compare the value of MR-based parameters at the different time points. Results: A significant variation between pretreatment (time 0) and post-treatment (times 1, 2, and 3) was found for ADC-total and D parameters (P < .001). A statistically significant reduction was also found for IAUGC60 values between times 0 and 3 (P < .001). A significant change across the different time points was observed for D* and IAUGC60 parameters (P < .001). On the contrary, there was no statistically significant change over time for parameters ADC-total, D, f, and IAUGC60 comparing response between each metastasis, that is, the response to therapy was similar for each metastasis. Conclusions: DW, IVIM, and DCE-MRI techniques show effectiveness in assessing the response to radiotherapy in bone metastases from breast cancer. Key Words: DW; IVIM; DCE-MRI; bone metastases; radiotherapy. ªAUR, 2014 B reast cancer accounts for 16% of all cancers in women, the most common cancer worldwide in the women after skin cancer. The bone is the most common site of recurrence of breast cancer, and autopsy studies showed an incidence of bone metastases of 73% (1). To assess the effectiveness of anticancer therapy, the most commonly used set of criteria is the Response Evaluation Criteria in Solid Tumors (RECIST), which focus predomi- nantly on the physical measurement of solid tumors (2). There is an increasing awareness that the evaluation of tumor response to oncologic treatments based solely on anatomic imaging assessments faces many limitations, and, in particular, fails in the evaluation of bone metastases (3,4). The limitations of morphologic-based diagnosis can be successfully addressed using functional imaging techniques as dynamic contrast- enhanced (DCE) magnetic resonance imaging (MRI), diffusion-weighted (DW) MRI, MRI spectroscopy, and posi- tron emission tomography (PET) (5–7). Acad Radiol 2014; -:1–8 From the Section of Radiological Sciences, Department of Biomedical Sciences and Morphologic and Functional Imaging, University of Messina, Italy (M.G., C.B., F.M., T.D., E.A., S.M., S.R., E.M., A.B., S.P.). Received March 25, 2014; accepted May 20, 2014. Conflicts of interest: None. Address correspondence to: C.B. e-mail: [email protected] ªAUR, 2014 http://dx.doi.org/10.1016/j.acra.2014.05.021 1
Transcript of Use of Diffusion-Weighted, Intravoxel Incoherent Motion, and Dynamic Contrast-Enhanced MR Imaging in...
Original Investigations
Use of Diffusion-Weighted, IntravoxelIncoherent Motion, and DynamicContrast-Enhanced MR Imagingin the Assessment of Responseto Radiotherapy of Lytic Bone
Metastases from Breast Cancer
Michele Gaeta, MD, Caterina Benedetto, MD, Fabio Minutoli, MD, Tommaso D’Angelo, MD,Ernesto Amato, PhD, Silvio Mazziotti, MD, Santi Racchiusa, MD, Enricomaria Mormina, MD,Alfredo Blandino, MD, Stefano Pergolizzi, MD
Ac
FrScItaMco
ªht
Rationale and Objectives: To investigate the value of diffusion-weighted (DW), perfusion-sensitive, and dynamic contrast-enhanced (DCE)magnetic resonance imaging (MRI) techniques in assessing the response of bonemetastases frombreast cancer to radiotherapy, with partic-
ular emphasis on the role of intravoxel incoherent motion (IVIM)-DW parameters as a potential valuable imaging marker of tumor response.
Materials and Methods: Fifteen women having breast cancer and bone metastases underwent MRI before and after radiotherapy
(3 weeks [time 1], 2 months [time 2], and 4 months [time 3]), consisting of DW, perfusion-sensitive (IVIM), and DCE acquisitions.MR-based DW and perfusion parameters, including water diffusivity (D), perfusion fraction (f), pseudodiffusion (D*), total apparent diffusion
coefficient (ADC-total), fractionated ADCs (ADC-high and ADC-low), and initial area under the gadolinium concentration curve after the first
60 seconds (IAUGC60), were determined. The morphologic MRI findings were also recorded. A one-way repeated measures analysis ofvariance was used to compare the value of MR-based parameters at the different time points.
Results: A significant variation between pretreatment (time 0) and post-treatment (times 1, 2, and 3) was found for ADC-total and D
parameters (P < .001). A statistically significant reductionwas also found for IAUGC60 values between times 0 and 3 (P< .001). A significantchange across the different time points was observed forD* and IAUGC60 parameters (P < .001). On the contrary, there was no statistically
significant change over time for parameters ADC-total, D, f, and IAUGC60 comparing response between each metastasis, that is, the
response to therapy was similar for each metastasis.
Conclusions: DW, IVIM, andDCE-MRI techniques show effectiveness in assessing the response to radiotherapy in bonemetastases frombreast cancer.
Key Words: DW; IVIM; DCE-MRI; bone metastases; radiotherapy.
ªAUR, 2014
Breast cancer accounts for 16% of all cancers in
women, the most common cancer worldwide in
the women after skin cancer. The bone is the most
common site of recurrence of breast cancer, and autopsy
studies showed an incidence of bone metastases of 73% (1).
ad Radiol 2014; -:1–8
om the Section of Radiological Sciences, Department of Biomedicaliences and Morphologic and Functional Imaging, University of Messina,ly (M.G., C.B., F.M., T.D., E.A., S.M., S.R., E.M., A.B., S.P.). Receivedarch 25, 2014; accepted May 20, 2014. Conflicts of interest: None. Addressrrespondence to: C.B. e-mail: [email protected]
AUR, 2014tp://dx.doi.org/10.1016/j.acra.2014.05.021
To assess the effectiveness of anticancer therapy, the most
commonly used set of criteria is the Response Evaluation
Criteria in Solid Tumors (RECIST), which focus predomi-
nantly on the physical measurement of solid tumors (2). There
is an increasing awareness that the evaluation of tumor
response to oncologic treatments based solely on anatomic
imaging assessments faces many limitations, and, in particular,
fails in the evaluation of bone metastases (3,4). The limitations
of morphologic-based diagnosis can be successfully addressed
using functional imaging techniques as dynamic contrast-
enhanced (DCE) magnetic resonance imaging (MRI),
diffusion-weighted (DW) MRI, MRI spectroscopy, and posi-
tron emission tomography (PET) (5–7).
1

GAETA ET AL Academic Radiology, Vol -, No -, - 2014
Of note, DCE-MRI and DW-MRI became objects of
utmost interest owing to their potential of providing informa-
tion on tumor blood supply and cellular changes as response to
treatment (8–10). Particularly, the apparent diffusion
coefficient (ADC) has proven to be a reliable predictor of
response to tumor treatment. To our knowledge, the value
of intravoxel incoherent motion (IVIM) imaging has not
been clinically investigated so far (11–13). The IVIM theory
presumes the presence of two diffusion components: true
diffusion component related to Brownian motion of water
molecules and perfusion component related to blood
microcirculation in the capillary network (11,12).
The aim of our study was to investigate the value of DW,
perfusion-sensitive, and DCE-MRI techniques in assessing
the response of bone metastases from breast cancer to radio-
therapy, with particular emphasis on the role of IVIM as a
potential valuable imaging marker of tumor response.
MATERIALS AND METHODS
The Institutional Review Board approved this study.
Informed consent was obtained from each patient.
Subjects
Twenty-five women (mean age, 73 years; range, 67–84 years)
with breast cancer and bonemetastaseswere recruited to partic-
ipate in this prospective study betweenAugust 2012 and August
2013. Diagnosis of bone metastasis was made on the basis of
clinical history, 99mTc-methylene diphosphonate bone scintig-
raphy, PET scan, and/or bone marrow biopsy. We studied only
purely lytic metastases to avoid interference because of the pres-
ence of calcium in sclerotic and mixed metastases. Study inclu-
sion criteria were (1) the presence of pure lytic bone metastases
of the iliac bone and/or upper femurs as demonstrated on
computed tomography (CT) and (2) the presence of pain or
risk of fracture indicating the need to perform radiotherapy
of the lesions. The exclusion criteria were (1) contraindications
to MR and/or to gadolinium-based contrast agents (n = 2) and
(2) inability to lie on the MR table (n = 2).
In the remaining 21 patients, radiotherapy was started imme-
diately after the firstMRI examination. Each patient underwent
the following radiotherapy regimen: five sessions of 4 Gywith a
total dose of 20Gy in aweek. In three patients two pelvic and/or
femoral lesions were treated simultaneously. After radiotherapy,
the patients underwent an MRI follow-up protocol with MRI
examination obtained3weeks, 2months, and4months after the
starting of radiotherapy. Six patientswere unable to complete the
scheduled follow-up. The remaining 15 patients with a total of
16 treated metastases constituted the final study population.
The clinical response to treatment was evaluated at multiple
time points, namely 3 weeks, 2 months, and 4 months after the
starting of radiotherapy.We used the Visual Analog Scale (VAS)
for pain evaluation in which the pain intensity varies from ‘‘no
pain’’ (score 0) to ‘‘worst imaginable pain’’ (score 100) (14).
Of note, at the start of radiotherapy, eight patients had a
VAS score of 5–6 and seven patients a VAS score of 7–10; at
2
time 1 follow-up, pain score of 0–2 was reported in five
patients and 3–4 in 10 patients. At time 2, pain score was
0–2 in seven patients and 3–4 in eight patients. Finally, at
time 3, pain score of 0–2 was reported in eight patients and
3–4 in seven patients. For all the cases, a reduction in analgesic
and opioid intake was observed.
Magnetic Resonance Imaging
All MRI examinations were performed with a 1.5-Twhole-
body imaging system (Achieva; Philips Medical Systems,
Best, the Netherlands). A SENSE XL Torso coil with 16
elements was used in all the patients. SENSE is a Philips spe-
cific scan technique used for optimal coil performance. The
SENSE principle relies on the multiple coil elements in the
XL Torso Coil simultaneously receiving a reduced field of
view image. SENSE reconstruction combines and unfolds
the individual coil images.
In each patient, the region from the subtrochanteric regions
up to the iliac crests was scanned using the following acquisi-
tion protocol:
1. Axial fast-short tau inversion recovery (fast-STIR): 4000/
50/140 (repetition time (TR) in milliseconds/echo time
(TE) in milliseconds/inversion time in milliseconds), slice
thickness 6 mm, and matrix 314 � 314.
2. Axial T1-weighted dual-echo fast field echo (FFE): TR
300 milliseconds, TE 2.3/4.6 milliseconds, flip angle
80�, slice thickness 6 mm, and matrix 280 � 225.
3. Axial DW: TR 1880 milliseconds, TE 73 milliseconds,
slice thickness 6 mm, matrix 124 � 124, b values of 0,
20, 40, 80, 100, 300, 600, and 1000 s/mm2 with spectral
presaturation inversion recovery fat saturation.
4. Dynamic gadolinium-enhanced examinations were
performed with a three-dimensional FFE spectral attenu-
ated inversion recovery, T1-weighted high-resolution
isotropic volume examination sequence using the
following parameters: 4.4/2.2 (TR in milliseconds/TE
in milliseconds), a 10� flip angle, matrix 180 � 180, and
acquisition time 4–6 seconds.
An automated power injector (Mallinckrodt, Hazelwood,
MO) was used to inject a bolus of 0.2 mL of gadoterate meglu-
mine (Dotarem;LaboratoireGuerbet,Aulnay-sous-Bois, France)
per kilogram of body weight through a catheter inserted into an
antecubital vein at a rate of 3mL/s, followed by a 30-mL saline at
the same flow rate. The sequences were started when half the
contrast medium had been injected and were repeated 40 times.
After the dynamic-enhanced examination, an axial delayed-
enhanced T1-weighted turbo spin echo (TSE) with spectral
presaturation inversion recovery fat saturation was acquired
with the following parameters: TR 560 milliseconds, TE
20 milliseconds, slice thickness 6 mm, and matrix 380 � 300.
The sequence parameters are detailed in Table 1.
Imaging after Processing and Data Analysis
A radiologist, with 15 years of experience in MRI, manually
placed regions of interest on each bone metastasis. Fast-STIR

TABLE1.SequenceParameters
UsedforMagneticResonanceStudies
Sequence
Acquisition
Plane
RepetitionTim
e(m
illiseconds)/
EchoTim
e(m
illiseconds)/Flip
Angle
(degrees)
No.ofSignals
Acquired
EPI
Factor
No.ofb
Values
Turbo
Factor
Matrix
Paralle
l
Imaging
Factor
Section
Thickness
(mm)
Contrast
Material
Injection
Fast-STIR
Axial
4000/50/N
A
IT(m
illiseconds)=140
2NA
NA
30
314�
314
1.5
6NO
T1-w
eighteddual-echoFFE
Axial
300/2.3–4
.6/80
5NA
NA
NA
280�
225
1.7
6NO
Diffusion-w
eightedSPIR
fat
saturation
Axial
1880/73/N
A4
53
8*
NA
124�
124
26
NO
3DFFE-S
PAIR-e-THRIVE
Axial-coronal
4.4/2.2/10
1NA
NA
NA
180�
180
22
YESy
T1-w
eightedturbospin-echo-
SPIR
fatsaturation
Axial
560/20/N
A3
NA
NA
10
380�
380
NA
6YES
3D,three-dim
ensional;e-THRIVE,T
1-w
eightedhigh-resolutionisotropicvolumeexamination;F
FE,fastfield
echo;IT,inversiontime;N
A,n
otapplicable;SPAIR,spectralattenuatedinversion
recovery;SPIR,spectralpresaturationinversionrecovery;STIR,shorttauinversionrecovery;EPI,echoplanarim
aging.
*Eightbvalues:
0,20,40,80,100,300,600,and1000s/m
m2.
y e-THRIVEsequenceswere
startedwhenhalfthecontrastmedium
hadbeeninjectedandwere
repeated40times.
Academic Radiology, Vol -, No -, - 2014 MRI ASSESSMENT OF RESPONSE TO RADIOTHERAPY
and precontrast T1-weightedMR images were used as a refer-
ence to determine tumor areas on the corresponding DWand
DCE images. During the regions of interest placement (mean
size, 4.3 mm2; range, 1.4–7.4 mm2), care was taken to encom-
pass as much of the tumor as possible.
The ADC-IVIM parameters were calculated on a voxel-by-
voxel basis and averaged. ADC-IVIM parameter maps were
also generated (15). Themarkers used to evaluate any treatment
response included the signal intensity at different b values, the
water diffusivity (D), the perfusion fraction (f), the pseudo-
diffusion (D*), the total ADC (ADC-total), the fractionated
ADCs (ADC-high and ADC-low), and the perfusion ADC
(ADC-perf = ADC-low to ADC-high) (15).
DCE-MRI data, which also evaluate the permeability and
perfusion ofmetastases, were calculated using a semiquantitative
method, analyzing the initial area under the gadolinium con-
centration curve after the first 60 seconds (IAUGC60) (8–10).
The analysis of all bone metastases was performed both
before (time 0) and 3 weeks (time 1), 2 months (time 2),
and 4 months (time 3) after the beginning of radiotherapy.
Changes in perfusion and diffusion were assessed.
In addition, two independent readers, with 10 and 5 years
of experience in MRI, were asked to independently evaluate
morphologic MR images (fast-STIR, axial T1-weighted
dual-echo FFE, and delayed-enhanced T1-weighted TSE
sequences) (16,17). They were unaware of the patient
treatment response and all clinical data except patient age.
For each patient, all baseline and post-treatment MR images
were analyzed on workstations in two separate sessions, with
a 2-week interval to assess the ability of morphologic MR
images in detecting the response of metastases to radiotherapy
in early phases. The response was classified as present, absent,
or indeterminate.
Finally, 6 months after the beginning of radiotherapy the
same radiologists evaluated the response of treated lesions by
CTusing modified criteria for the detection of bone response
developed at The University of Texas MD Anderson Cancer
Center (MDA criteria), to obtain a standard of reference for
comparison to our IVIM and perfusion data (2,3).
IVIM Magnetic Resonance Imaging
In 1986, Le Bihan et al. introduced the principles of IVIM
used to quantitatively assess the microscopic translational
motions that occur in each image voxel at MRI. Using
IVIM-based DW imaging (DWI), it is possible to estimate tis-
sue diffusivity and tissue microcapillary perfusion using multi-
ple b values (11,12).
In our study, the following equation was used to express the
relationship between signal intensities and b values:
Sb
S0
¼ ð1� f Þexpð�bDÞ þ f exp½ � bðDþD�Þ�; (1)
where f represents the perfusion fraction, in particular the
contribution of blood microcirculation and microscopic
3

Figure 1. (a)Bonemetastasis of the rightiliac bone (arrow). ADC-high map ob-
tained before radiotherapy (time 0) shows
amean ADC value of 1.1� 2� 10�3 mm2/
s. (b) ADC-high map obtained 4 monthsafter the beginning of the radiotherapy
(time 3) shows an evident increase in the
signal of the lesion (arrow). ADC values
are 1.9 � 2 � 10�3 mm2/s, suggestingtumor cell death. ADC, apparent diffusion
coefficient.
GAETA ET AL Academic Radiology, Vol -, No -, - 2014
flow to signal decay (18), D the pure diffusion coefficient (ie,
slow component of diffusion), and D* the pseudodiffusion
coefficient (ie, fast component of diffusion); S0 and Sb are
signal intensities at b = 0 and b = 20, 40, 80, 100, 300, 600,
or 1000 s/mm2, respectively.
We determined f, D, and D* values by fitting experimental
data by means of a Levenberg-Marquardt algorithm (19). The
IVIM parameters (f, D, and D*) for each tumor were
expressed as means of those obtained from all the tumor areas
analyzed.
Figure 2. Signal attenuation curves obtained bymeans of intravoxel
incoherent motion biexponential analysis show behavior of metasta-
ses before and after radiotherapy, with significant increases in D
values at time 1 (3 weeks after the beginning of radiotherapy), time2 (2months after the beginning of radiotherapy), and time 3 (4months
after the beginning of radiotherapy), lowering signal intensity on high
b value. RT, radiotherapy.
Statistical Analysis
A one-way repeated measures analysis of variance (ANOVA)
was conducted to compare the value of each parameter at the
different time points. A ‘‘mixed between-within subjects
ANOVA’’ was then used to analyze the change and an inter-
action effect between D* and IAUGC60 across the time
points. This analysis is an extension of the one-way repeated
measures design mixed with a two-way ANOVA.
The Cohen kappa statistic was used to assess the interob-
server agreement. The guidelines of Landis and Koch (20)
were followed to interpret kappa values: 0.00–0.20, poor
agreement; 0.21–0.40, fair agreement; 0.41–0.60, moderate
agreement; 0.61–0.80, good agreement; and 0.81–1.00,
almost perfect agreement.
Differences were considered significant if the P value was
<.05 (21). All statistical analyses were performed using a
statistical software program (SPSS, version 15; SPSS, Inc,
Chicago, IL).
RESULTS
A significant effect between pretreatment examinations (time
0) and each of the post-treatment examinations (times 1, 2,
and 3) was found for ADC-total and D parameters
(Figs 1 and 2) (P < .001). A statistically significant reduction
was also found for IAUGC60 values between times 0 and 3
(Fig 3) (P < .001). On the other hand, a statistically significant
increase for IAUGC60 values was found at time 1 in compar-
ison to time 0 (P < .001).
In 11 lesions,D* was significantly reduced at time 3 (Fig 4);
however, D* calculated as average value of all the lesions was
not significantly reduced between the different times. In addi-
tion, no significant longitudinal variation for f parameter was
4
found at the different times. A significant change across the
different time points for D* and IAUGC60 parameters was
observed (P < .001). A statistically significant interaction
effect denoted a changeover time for these parameters
(P < .001). By comparison, there was no significant difference
in response between different metastases for parameters
ADC-total, D, f, and IAUGC60.
For all lesions, the two readers defined the early tumor
response to treatment evaluated on morphologic images as
indeterminate, with an almost perfect agreement (k = 1.00)
(Fig 5).
On the contrary, the response to treatment at 6 months was
evaluated as complete in 12 patients and partial in three pa-
tients according to MDA criteria (Fig 6).
DISCUSSION
In this study, we sought to determine the value of MR-based
perfusion and diffusion imaging characteristics of bone metas-
tases of breast cancer both before and after radiotherapy
(4,22). In addition, we also compared these results to those
obtained by using the IVIM model.
Figure 3. (a) Coronal maximum intensityprojection (MIP) reconstruction of the arte-
rial phase of gadolinium-enhanced dy-
namic examination, performed at time
0 (before radiotherapy), demonstrates theintense arterial enhancement of the un-
treated right iliac metastasis (arrows). (b)Coronal MIP reconstruction of the arterial
phase of gadolinium-enhanced dynamicexamination, performed at time 3
(4 months after the beginning of radio-
therapy), depicts the disappearance ofthe pathologic arterial enhancement of
the lesion.
Figure 4. (a) Perfusion map obtained at
time 0 (before radiotherapy) shows high
signal intensity of the right iliac bonemetastasis (arrow) (ADC-low to ADC-
high = 2.7 � 2 � 10�3 mm2/s). (b) Fourmonths after the beginning of radiotherapy(time 3), the signal intensity of the metas-
tasis (arrow) is clearly reduced (ADC-low
to ADC-high = 2.0 � 3 � 10�3 mm2/s).
This finding is in accordance with reducedperfusion demonstrated by gadolinium-
enhanced dynamic examination (see Fig
3b). ADC, apparent diffusion coefficient.
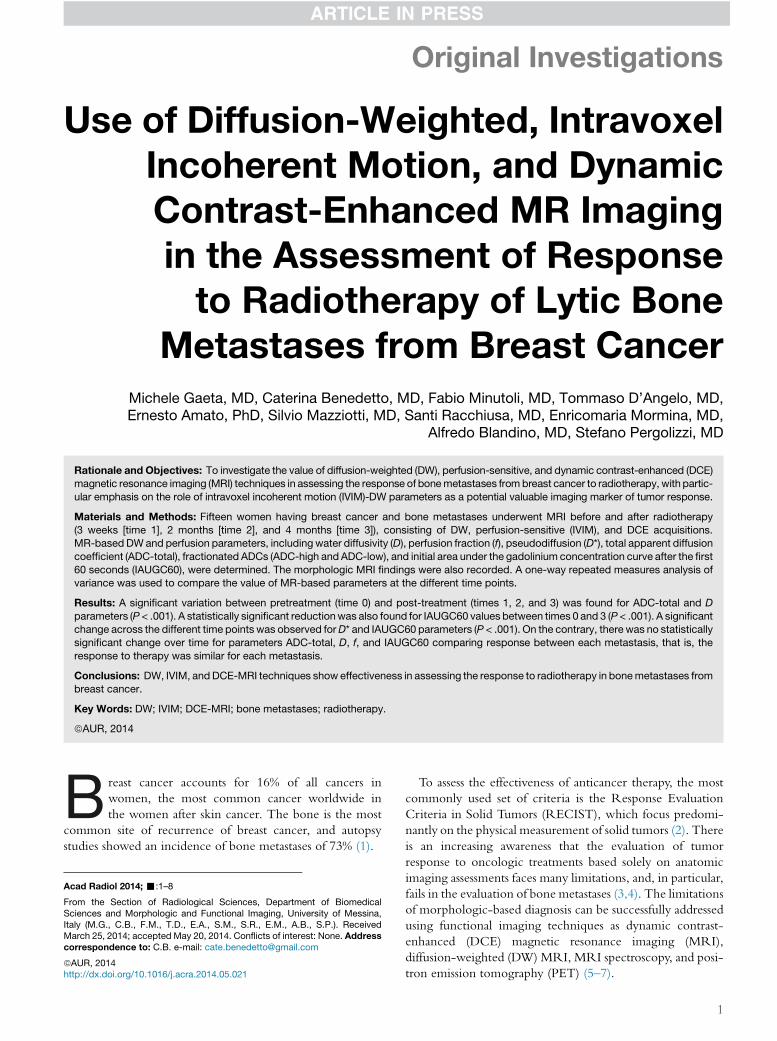
Figure 5. (a) The right iliac bone metas-tasis (arrow) is well visible on the axial
fast-STIR image obtained before radio-
therapy (time 0). (b) Four months after
the beginning of radiotherapy (time 3), onaxial fast-STIR image, the lesion (arrow)
shows the same signal intensity and
extension than before radiotherapy. Aslight edema of the gluteal muscles (E) is
related to after radiotherapy myopathy.
STIR, short tau inversion recovery.
Academic Radiology, Vol -, No -, - 2014 MRI ASSESSMENT OF RESPONSE TO RADIOTHERAPY
The results of our study showed a significant response toD
and ADC-total parameters. This response was likely related
to necrosis or cellular lysis because of radiotherapy, which
leads to increases in tissue water diffusivity (D), thus
lowering signal intensity on high b value images with corre-
sponding increases in ADC values (23). Because cell death in
response to treatment precedes changes in lesion size,
changes in DW-MRI may act as an effective, early biomarker
of response to radiotherapy (24,25), therefore overcoming
the limitations of RECIST for response of bone metastases
to treatment.
In our study, we extended our evaluations also to ADC-
high, ADC-low, and ADC-perf (26,27). The increase in
ADC-high values after radiotherapy can be related to changes
in cellularity induced by radiotherapy, thereby resulting in
higher values of D. The ADC-low, which was calculated
using low b values (0–100 s/mm2) and dominated by
perfusion component of the total tissue diffusivity, revealed
no significant differences in bone metastases before and after
radiotherapy. The ADC-perf (calculated as ADC low- ADC
high) showed a decrease after radiotherapy, likely reflecting
a reduction in perfusion.
The pseudodiffusion coefficient (D*) is considered propor-
tional to the mean capillary segment length and average blood
velocity. In particular, in 11 of 16 lesions (68%),D* was signif-
icantly reduced at time 3. These results showed that DW-MRI
measurements are sensitive to tissue perfusion, and the tech-
nique could thus be potentially used to provide assessment
of the microcirculatory perfusion of tissues, in addition to
measuring tissue diffusivity.
Interestingly, although D* after radiotherapy was signifi-
cantly reduced in 68% of the treated metastases, the vascular
volume fraction f showed no change before and after treat-
ment. As yet, it is challenging to provide a definite explanation
for these apparent discrepancies, considering that blood vol-
ume to bone metastasis is clearly reduced as IAUGC60
5

Figure 6. (a) Lytic bone metastasis of the
right iliac bone (arrow) is well visible on the
axial computed tomography (CT) imagebefore radiotherapy (time 0). (b)Sixmonths
after the beginning of radiotherapy (time 3),
on axial CT image, the right iliac bone
metastasis (arrow) shows a scleroticconversion.
GAETA ET AL Academic Radiology, Vol -, No -, - 2014
demonstrated. It is conceivable that D* and f values may
reflect distinct perfusion properties. A similar effect was
recently reported by Luciani et al. (18) in the clinical setting
of liver cirrhosis. In fact, the f value may correlate with the
amount of normal angiogenesis with intact vessels in terms
of basement membrane thickness and pericyte coverage.
Therefore, it may represent an indicator of preserved vascular
permeability (28). It could be argued that the microcapillary
perfusion is affected by tumor hypoxia. In a recent study
focusing on prostate cancer, ADC-low values were lower in
high-risk than in low-risk prostate cancers probably because
of hypoxia than in more aggressive tumor might reduce tumor
perfusion (29).
On the basis of the results of our study, one may advocate
that the use of IVIM perfusion parameters (f) is not useful to
assess the response of bone metastasis from breast cancer after
radiotherapy. Notably, in all patients the DCE MR perfusion
evaluation using IAUGC60 calculation showed a statistically
significant reduction between times 0 and 3, with decreases
in the rate and magnitude of enhancement, indicating success-
ful treatment results.
DCE-MRI is able to provide functional tumor informa-
tion, such as vascular permeability, vessel density, and perfu-
sion (6,30–32). Interestingly, our results showed a
statistically significant increase for IAUGC60 at time 1 in
comparison to time 0; after 3 weeks from the beginning of
radiotherapy, the perfusion parameters showed an increase in
blood flow in all metastases, which well correlates with the
hypervascularization induced by endothelial growth factors
as an early response to radiotherapic treatment (24).
On the contrary, no statistically significant correlation be-
tween semiquantitative perfusion values (IAUGC60) and
microperfusion values of D* was found. This is in line with
the published literature in which only a few studies about
brain and renal circulation showed a significant agreement be-
tween IVIM and DCE MR perfusion (33,34).
Perfusion parameters obtained with DW-MRI could be
different from perfusion parameters measured using intra-
vascular tracers (eg, contrast medium) because the latter
method is influenced by tissue uptake or removal of the
injected tracer (35).
6
To date, there are no universally accepted methods for
assessing tumor response in skeletal metastases. Response is
estimated by a combination of imaging tests, serum and urine
biochemical markers, and clinical evaluations (36).
Bone scintigraphy, plain radiographs, or cross-sectional im-
aging, such as CT or MRI remains the commonest imaging
methods used to characterize and follow up bone marrow
metastases.
Unfortunately, bone scintigraphy suffers from poor spatial
resolution and limited diagnostic specificity; moreover, it may
be unsuitable for the therapy assessment of predominantly lytic
metastases without an associated osteoblastic response (36).
CT scans are also limited in their ability to assess therapy
response of bony disease. RECIST (v 1.1) criteria do allow
individual osteolytic or mixed osteolytic/osteoblastic metasta-
ses to be measured but diffuse disease and osteoblastic bone
metastases are considered as nonmeasurable. Moreover, CT
is not sensitive to early response (4).
There are a number of MRI methods that can evaluate the
bone for metastasis detection and response assessment. How-
ever, morphologic MRI sequences as T1 weighted, T2
weighted, and fast-STIR are not sensitive in the early phase
of response (37).
DWI and DCE-MRI techniques are emerging as accurate
bone marrow assessment tools for detection and therapy
monitoring of bone metastases and myeloma. The major ad-
vantages of DWI include the fact that no ionizing radiation is
administered and no injection of isotopes or any contrast
medium is necessary (38–40).
Limitations of our study must be acknowledged. The first
limitation is that fairly small cohort represents the foremost
criticism of our research. However, our sample could be
considered representative of a subtype of breast cancer bone
metastases (purely lytic) that is more rare than the mixed
lytic-sclerotic type.
A second limitation attains to the standard of reference in
evaluating the response of bone metastases because multiple
biopsies obviously cannot be obtained. Response criteria spe-
cific to bone metastases have been developed at The Univer-
sity of Texas MD Anderson Cancer Center (MDA criteria)
and can be used to assess therapeutic response in numerous

Academic Radiology, Vol -, No -, - 2014 MRI ASSESSMENT OF RESPONSE TO RADIOTHERAPY
types of bone metastases. Recently developed PET Response
Criteria in Solid Tumors allow response to be measured in the
absence of anatomic change through the assessment of meta-
bolic activity; however, PET examination is expensive
(41,42). We used the recently modified MDA criteria and
clinical response as a standard of reference to compare our
data (3).
A third limitation is the use of semiquantitative parameters
(IAUGC60) for the evaluation of T1-weighted gadolinium-
enhanced perfusion examinations. Semiquantitative parameters
may not accurately reflect contrast agent concentration in the
tissue of interest and can be influenced by the contrast agent in-
jection procedure, the scanner settings (including the pulse
sequence, gain, and scaling factors), and target position in the
image. The relationship between IAUGC60 and underlying
physiology is complex and not completely clarified (43,44).
On the other hand, IAUGC60, calculated from the area
under the contrast agent concentration curve up to a
specified cutoff time (60 seconds), has the advantage of being
relatively straightforward to acquire. In addition, it does not
require any curve-fitting or knowledge of an accurate physio-
logical model, and for this reason it is more robust than other
parameters, which can be vulnerable to fit failures in the case
of highly vascular regions, very poorly perfused regions, or
physiological motion; therefore, it has been recommended as
a practical substitute for K trans in clinical studies (45).
CONCLUSIONS
The results of our study indicate that MR functional imaging
techniques, such as DW-MRI, IVIM, and DCE-MRI are
effective tools in assessing the response to radiotherapy. To
be specific, although the f factor showed a limited value, other
parameters such as D*, ADC, and the IVIM diffusion param-
eter (D) seem very promising because they may evaluate
change in tumor viability and vascularity also in the early
phase of response to radiotherapy.
REFERENCES
1. Coleman RE. Clinical features of metastatic bone disease and risk of skel-
etal morbidity. Clin Cancer Res 2006; 12:6243s–6249s.
2. Hamaoka T, Madewell JE, Podoloff DA, et al. Bone imaging in metastatic
breast cancer. J Clin Oncol 2004; 22:2942–2953.
3. Hamaoka T, Costelloe CM, Madewell JE, et al. Tumour response interpre-
tation with new tumour response criteria vs the World Health Organisation
criteria in patients with bone-only metastatic breast cancer. Br J Cancer
2010; 102:651–657.
4. B€auerle T, Semmler W. Imaging response to systemic therapy for bone
metastases. Eur Radiol 2009; 19:2495–2507.
5. Lee KC, Sud S, Meyer CR, et al. An imaging biomarker of early treatment
response in prostate cancer that has metastasized to the bone. Cancer
Res 2007; 67:3524–3528.
6. Theilmann RJ, Borders R, Trouard TP, et al. Changes in water mobility
measured by diffusion MRI predict response of metastatic breast cancer
to chemotherapy. Neoplasia 2004; 6:831–837.
7. Lee KC, Bradley DA, Hussain M, et al. A feasibility study evaluating the
functional diffusion map as a predictive imaging biomarker for detection
of treatment response in a patient with metastatic prostate cancer to the
bone. Neoplasia 2007; 9:1003–1011.
8. O’Connor JP, Jackson A, Parker GJ, et al. DCE-MRI biomarkers in the
clinical evaluation of antiangiogenic and vascular disrupting agents. Br
J Cancer 2007; 96:189–195.
9. Evelhoch JL. Key factors in the acquisition of contrast kinetic data for
oncology. J Magn Reson Imaging 1999; 10:254–259.
10. Li SP, Padhani AR, Makris A. Dynamic contrast-enhanced magnetic
resonance imaging and blood oxygenation level-dependent magnetic
resonance imaging for the assessment of changes in tumor biology with
treatment. J Natl Cancer Inst Monogr 2011; 43:103–107.
11. Le Bihan D, Breton E, Lallemand D, et al. MR imaging of intra-voxel
incoherent motions: application to diffusion and perfusion in neurologic
disorders. Radiology 1986; 161:401–407.
12. Le Bihan D, Breton E, Lallemand D, et al. Separation of diffusion and perfu-
sion in intravoxel incoherent motion MR imaging. Radiology 1988; 168:
497–505.
13. Le Bihan D. Intravoxel incoherent motion perfusion MR imaging: a wake-
up call. Radiology 2008; 249:748–752.
14. Mc Cormack HM, Horne DJ, Sheather S. Clinical applications of visual
analogue scales: a critical review. Psychol Med 1988; 18:1007–1019.
15. Koh DM, Collins DJ, Orton MR. Intravoxel incoherent motion in body
diffusion-weighted MRI: reality and challenges. AJR Am J Roentgenol
2011; 196:1351–1361.
16. Saip P, Tenekeci N, Aydiner A, et al. Response evaluation of bone metas-
tases in breast cancer: value of magnetic resonance imaging. Cancer
Invest 1999; 17:575–580.
17. Brown AL, Middleton G, MacVicar AD, et al. T1-weighted magnetic reso-
nance imaging in breast cancer vertebral metastases: changes on treat-
ment and correlation with response to therapy. Clin Radiol 1998; 53:
493–501.
18. Luciani A, Vignaud A, Cavet M, et al. Liver cirrhosis: intravoxel incoherent
motion MR imaging-pilot study. Radiology 2008; 249:891–899.
19. Gao Q, Srinivasan G, Magin RL, et al. Anomalous diffusion measured by a
twice-refocused spin echo pulse sequence: analysis using fractional order
calculus. J Magn Reson Imaging 2011; 33:1177–1183.
20. Landis JR, Koch GG. The measurement of observer agreement for cate-
gorical data. Biometrics 1977; 33:159–174.
21. Tabachnick BG, Fidell LS. Using multivariate statistics. 3rd ed. New York:
Harper Collins, 1996.
22. Maisano R, Pergolizzi S, Cascino S. Novel therapeutic approaches to can-
cer patients with bone metastasis. Crit Rev Oncol Hematol 2001; 40:
239–250.
23. ThoenyHC,RossBD. Predicting andmonitoring cancer treatment response
with diffusion-weighted MRI. J Magn Reson Imaging 2010; 32:2–16.
24. Li SP, Padhani AR. Tumor response assessments with diffusion and perfu-
sion MRI. J Magn Reson Imaging 2012; 35:745–763.
25. Dzik-Jurasz A, Domenig C, George M, et al. Diffusion MRI for prediction of
response of rectal cancer to chemoradiation. Lancet 2002; 360:307–308.
26. Sakuma H, Tamagawa Y, Kimura H, et al. Intravoxel incoherent motion
(IVIM) imaging using an experimental MR unit with small bore (in Japa-
nese). Nippon Igaku Hoshasen Gakkai Zasshi 1989; 49:941–943.
27. Sun X, Wang H, Chen F, et al. Diffusion-weighted MRI of hepatic tumor in
rats: comparison between in vivo and postmortem imaging acquisitions.
J Magn Reson Imaging 2009; 29:621–628.
28. Lewin M, Fartoux L, Vignaud A, et al. The diffusion-weighted imaging
perfusion fraction f is a potential marker of sorafenib treatment in
advanced hepatocellular carcinoma: a pilot study. Eur Radiol 2011; 21:
281–290.
29. De Souza NM, Riches SF, Vanas NJ, et al. Diffusion-weighted magnetic
resonance imaging: a potential non-invasivemarker of tumour aggressive-
ness in localized prostate cancer. Clin Radiol 2008; 63:774–782.
30. Tofts PS, Brix G, Buckley DL, et al. Estimating kinetic parameters from
dynamic contrast-enhanced T (1)-weighted MRI of a diffusable tracer:
standardized quantities and symbols. J Magn Reson Imaging 1999; 10:
223–232.
31. Collins DJ, Padhani AR. Dynamic magnetic resonance imaging of tumor
perfusion. Approaches and biomedical challenges. IEEE Eng Med Biol
Mag 2004; 23:65–83.
32. Wang H, Li J, Chen F, et al. Morphological, functional and metabolic imag-
ing biomarkers: assessment of vascular-disrupting effect on rodent liver
tumours. Eur Radiol 2010; 20:2013–2026.
33. Wirestam R, Borg M, Brockstedt S, et al. Perfusion-related parameters in
intravoxel incoherent motion MR imaging compared with CBV and CBF
measured by dynamic susceptibility-contrast MR technique. Acta Radiol
2001; 42:123–128.
7

GAETA ET AL Academic Radiology, Vol -, No -, - 2014
34. Powers TA, Lorenz CH, Holburn GE, et al. Renal artery stenosis: in vivo
perfusion MR imaging. Radiology 1991; 178:543–548.
35. Henkelman RM. Does IVIM measure classical perfusion? Magn Reson
Med 1990; 16:470–475.
36. Padhani AR, Gogbashian A. Bony metastases: assessing response to ther-
apy with whole-body diffusion MRI. Cancer Imaging 2011; 11:129–145.
37. Schmidt GP, Reiser MF, Baur-Melnyk A. Whole-body MRI for the staging
and follow-up of patients with metastasis. Eur J Radiol 2009; 70:393–400.
38. Fenchel M, Konaktchieva M, Weisel K, et al. Response assessment in
patients with multiple myeloma during antiangiogenetic therapy using
arterial spin labeling and diffusion-weighted imaging: a feasibility study.
Acad Radiol 2010; 17:1326–1333.
39. Vanel D, Casadei R, Alberghini M, et al. MR imaging of bone metastases
and choice of sequence: spin echo, in-phase gradient echo, diffusion,
and contrast medium. Semin Musculoskelet Radiol 2009; 13:97–103.
40. Biffar A, Dietrich O, Sourbron S, et al. Diffusion and perfusion imaging of
bone marrow. Eur J Radiol 2010; 76:323–328.
8
41. Costelloe CM, Chuang HH, Madewell JE, et al. Cancer response criteria
and bone metastases: RECIST 1.1, MDA and PERCIST. J Cancer 2010;
1:80–92.
42. Stafford SE, Gralow JR, Schubert EK, et al. Use of serial FDG PET to mea-
sure the response of bone-dominant breast cancer to therapy. Acad Ra-
diol 2002; 9:913–921.
43. Larcombe-McDouall JB, Mattiello J, McCoy CL, et al. Size dependence of
regional blood flow in murine tumours using deuterium magnetic reso-
nance imaging. Int J Radiat Biol 1991; 60:109–113.
44. He ZQ, Evelhoch JL. Analysis of dynamic contrast enhanced MRI in
tumours: relationship of derived parameters with physiological factors.
Proceedings of the 6th annual meeting of the international society of mag-
netic resonance, Sydney, 1652 Berkeley, CA: ISMRM, 1998.
45. Leach MO, Brindle KM, Evelhoch JL, et al. The assessment of antiangio-
genic and antivascular therapies in early-stage clinical trials using mag-
netic resonance imaging: issues and recommendations. Br J Cancer
2005; 92:1599–1610.