An Empirical Analysis of User Content Generation and Usage Behavior on the Mobile Internet
Upload
khangminh22Category
view
1download
0
International Journal of Library and Information Studies ISSN: 2231-4911
Vol.2(3), Jul-Sep, 2012
Page 74
USAGE OF INTERNET SERVICES BY ENGINEERING STUDENTS IN
TIRUPATI: A STUDY
A.J. Madhuri Research Scholar in LIS,
Sri Venkateswara University, Tirupati E-mail: [email protected]
ABSTRACT
The internet has emerged as the most powerful medium for storage and retrieval of information. This paper deals with the use of internet by the students of the engineering College students in and around of Tirupati, Andhra Pradesh, India. This paper examines the frequency of Internet use, purpose of using the internet, use of different internet services and impact of internet on engineering education. Questionnaire method was used for collection of data from the engineering students. The main findings of the study are 81.42% of the colleges are providing sufficient computer systems in their labs, 78.28% were browsing Internet for the purpose of E-mail, 31.42 were browsing Internet through Mozilla Fire Fox, 37.85% of them are using Internet to update their knowledge, and 82.14% of them are using Google Search engine and also 65% of them are using Gmail service for mailing purpose and the main problem faced by the students is accessing Internet is low speed of Internet. Keywords: Internet, Search Engines, User Studies, Engineering education, ICT,
1. INTRODUCTION The internet was become as powerful instrument in the field of education with advent of ICT in technical education especially internet become most powerful tool in updating technological knowledge by the engineering students. Know a days engineering colleges playing a important role in any nation by providing technical skills to its students through internet. The study has been under taken to examine the availability and use of internet by the engineering students. The main aim of the study is to know the impact of internet among engineering students and the problems faced by the engineering students. 2. REVIEW OF LITERATURE A review of the literature reveals that there is a large amount of literature available on the use of the internet, but no in-depth study has been doe on the use of the internet in the engineering colleges under study. The present status of internet use in the engineering colleges of in and around of the Tirupati Town. Panda and sahu1 (2003) described the state of internet connectivity with myriad internet services provided in the Engineering colleges of Orissa. They analyses the system details types of

International Journal of Library and Information Studies ISSN: 2231-4911
Vol.2(3), Jul-Sep, 2012
Page 75
browsers and search engines used and purpose of internet connectivity availed. Also indicates user’s demand to access internet, and suggestions for the improvement of internet use/services in the Engineering Colleges. Kumar and Kaur2 (2005) was conducted a case study on Internet and its use in the Engineering Colleges of Punjab, India: among teachers and students used questionnaire method. The response rate was 84.2%. The study demonstrates and elaborates the various aspects of Internet use such as, frequency of Internet use, most frequently used place for Internet use, problems faced by the users and satisfaction level of users with the Internet facilities provided in the colleges. The result of the survey also provided information about the benefits of the Internet over conventional documents. It was found that the Internet had become a vital instrument for teaching research and learning process of these respondes. Devendra and Suresh3 (2007) conducted a survey, to examine the potentialities of internet services to meet user needs in accessing, communicating and disseminating information and emphasize the modes of internet optimization in library and information center. Jaya Prakash and Koteswara Rao4 (2007) have discussed the importance of the internet in the internet in the library functions and services provided by library and information centre and the Role of Internet and Web Technology in Library and Information Services in Digital Environment. A case study conducted by Gururaj., Kumbar and Siddu5 (2007) discussed the use of internet by the members of Social Science Faculty of Karnataka University in Dharwad, India. Kaur and Manhas6 (2008) conducted a study on use of internet services and resources in the Engineering Colleges of Punjab and Haryana (India): A Study. Data were collected by questionnaire and follow up interviews with internet users. Result showed that Google and Yahoo search engines are found to be more widely used than other search engines. More then 70% of the respondents feel that the internet is useful informative, easy to use, inexpensive and time saving. A study was conducted by Velmurugan and Kannan7 (2010) they investigated the awareness on Internet and its resources by the members’ of the students of International school of Class VIII, IX and X and was limited to Chennai city only. The analysis of the data was carried out with SPSS(Statistical Package for Social Science)package and the result were obtained using simple percentile analysis and chi-square test and to arrive at meaningful conclusions. Sharma U.C., Raman Chawla and Priya Madaan8 (2011) found in their study that the majority of the users 84.2% were faculty members and Students. The most used internet services were E-mail and WWW, Chatting, Search Engines, Remote login, FTP, FAQ. They use internet through Google search engine (85%) retrieving required information (50%) uses to improve professional Competency. 4. OBJECTIVES The objectives of the study are
1. To highlight the importance of Internet and its services over the Engineering students;
2. To know the purpose of using the Internet;
3. To study the impact of Internet on Engineering education;
4. To find out the problems faced by the students in using the Internet; and
5. To make suggestion to improve internet facilities in engineering college libraries.

International Journal of Library and Information Studies ISSN: 2231-4911
Vol.2(3), Jul-Sep, 2012
Page 76
5. METHODOLOGY
In this study, a structured questionnaire was prepared covering the relevant aspects of the study. It was distributed to students studying B. Tech in engineering colleges located in and around the Tirupati town, Chittoor District during the 1st Jan 2012 to 31st March 2012. In total 180 questionnaires were distributed to the students who are studying B. Tech course in 12 Engineering colleges located in Tirupati. 15 questionnaires were distributed in each Engineering college including all branches at random. 6. SCOPE OF THE STUDY This study includes only B. Tech students pursuing their degree during the year 2011. The students include 1st Year B. Tech to Final Year B. Tech. students in Engineering College in and around of Tirupati Town. 7. ANALYSIS AND INTERPRETATION OF DATA The data collected from the students has been prepared in the following paragraphs in the form of Tables and Graphs. 7.1 Familiarity in Using Computers Computers are playing an important role in the present society without computers we can not imagine the present society. The respondents were asked a question to know their computer knowledge. The replies given by them are shown in Table-1.
Table – 1 Familiarity in Using Computers
S. No. Familiarity Number Percentage (%)
1. Yes 137 97.85
2. No 3 2.14
Total 140 99.99
It is evident from Table-1that the majority of the respondents (97.85%) have knowledge in Computers and 2.14% of them are do not have knowledge in computers. It can be concluded that 97.85% of the respondents have experienced in the computer operations.

International Journal of Library and Information Studies ISSN: 2231-4911
Vol.2(3), Jul-Sep, 2012
Page 77
7.2 Experiences in Using Computers Again they were asked a question to know their experience in years in computer operations. The replies given by them are shown in Table-2
Table – 2 Experience in Using Computers
S. No. Experience Number Percentage (%)
1. 1 Year 9 6.42
2. 2 years 28 20
3. 3 years 27 19.30
4. 4 years 76 54.28
Total 140 100
It is evident from Table-2 that half of the respondents (54.28%) have experience in using computers more than four years followed by two years (20%), three years (19.30%) and one year experience (6.42%). It can be concluded that half of the respondents have experience in using computers more than 4 years. 7.3 Usage of Internet A Question has been asked the respondents to know their familiarity in using internet. The replies given by them are shown in Table-3
Table – 3
Usage of Internet S. No. Years Respons
e Percentage (%)
1. 0 – 1 23 16.42
2. 1 – 2 35 25
3. 2 – 3 32 22.87
4. More than 4 years 50 35.71
Total 140 100

In
V
Itin(1
Iin
7. Tth
Itinusac It 7. Athmla 7. Ape
nte
Vol
It isinter(16.4
It cinter
7.4 F The them
It isinterusinacce It ca 7.5 A A quthe cmajolabs 7.6 T A quper w
ern
.2(
is evterne6.42%
t can terne
.4 Fre
he resem a
is evterne
sing iccess
can b
.5 Ad
quese comajoritbs an
.6 Tim
queser we
nati
(3),
evidenet m42%)
an benet m
requ
respo are s
evidet d
g intess int
n be c
deq
uestiocomprity
and l
ime
estioweek.
ion
, Ju
identmor
%).
be cot mor
quen
pondre sho
vident dailnternintern
e con
equa
tion hpute
ty of d libr
e sp
tion hek. Th
nal
ul-S
ent frore
concore t
ency
ndenshown
ent faily frnet ernet
concl
uacy
n hasuters of theibrari
spen
n has. The
Jou
Sep
fromre tha
nclude that
cy of
ents wwn in
t fromy follet 2-3et oc
clude
cy of
has bers in the caries
ent in
as behe rep
urn
p, 2
om ththan
ludedhat fo
of In
ts wen in th
rom Follow
3 ti occas
uded
of Co
beenin co colles an
t in u
beenreplie
nal
01
the n 4
ded tht four
Inte
were an the
Figowed timecasio
ed tha
Com
een p compollege and r
usin
en pulies g
l of
12
e Ta4 yea
thatur ye
tern
re askhe Fig
Figured bymes isional
that a
mpu
put mputeges d rem
sing
put ts giv
f Li
Tableyears
at hi years
rnet U
askedFigur
ure-1 by 2s in
nally.
t a hi
puter
ut to puterses (81emain
g Int
to thiven
22
ibra
ble-3ars fo
highars.
et Us
ed toure-1
1 th 23.5
in a wlly.
high
ters
to theers la(81.4ainin
Inter
o the en by
.14
ary
3 th follo
ghest
Use
to m1
that3.57%a wee
ghest
s
the re labs.42%ing o
ernet
he res by th
4%
y an
that llowe
est pe
ment
F
at a 7% oeek,
est pe
respbs of2%) ag of t
net
respo them
nd
at a hwed
perc
ention
Freq
a hi of tk, 5.
perce
spon of th) aref them
pondem ar
23
In
a higed by
rcent
tion th
requ
higheof the 5.71%
rcent
onden their
are prhem (
ndent are s
.57
for
ighesby 1
entag
n thei
Fquenc
ghestthem 71%
entage
dents eir re provm (18
ents te sho
4
%
rm
hest p 1-2
age o
eir fr
Figency
est pem usi% of
ge o
ts tor respovidi
(18.57
ts to khown
42.8
ati
st per2 ye
e of t
r freq
igurcy of
percusing of th
e of th
to knspectiding.57%
o known in
85%
on
percenyears
f the
requen
ure –of Int
ercenting in them
f the
knowectiveng su%) r
now in T
%
5
5
n St
centaars (2
he stu
uency
– 1Inter
entag interem u
e res
ow wtive c suffi) repl
w ho Tabl
5.71
5.71
tud
ntage (25%
stude
ncy o
1 terne
tage oterne usin
respo
whee collfficieeplied
how mable-
1%
1%
dies
ge of25%)
udent
of u
net U
e of net 2sing
pond
hetheollegcient ied n
w mu-4
s
of th%),
ents (
f use
t Use
of thet 2-3 g on
ndent
ther eges.nt co nega
much
D
2-
2-
O
Ra
the r, 2-
s (35
se Int
se
the r3 timonce
ents (
er thees. It compegativ
ch tim
aily
-3 T
-3 T
nce
are
e res-3 y
35.71
Intern
resptimesce in
s (42
their It is mputtively
time
y
T/W
T/M
e in
ly
respon yea
.71%)
ernet
espones inin a
42.85
ir col is revuter ely in
e the
W
M
a m
pondeears
%) h
et. T
onde in a m a mo
.85%)
collegreveaer syy in th
they
mon
ndentrs (22
) have
. The
dents a momonth
%) ar
llege vealedsysten this
ey spe
nthe
ents ((22.8
ave e
he rep
nts (4monthnth a
) are u
e proled f
stemshis reg
spent
e
ISS
s (352.87%
e exp
replie
(42.nth, 2h and
re use
provid fromms in regar
ent on
SN:
35.717%)
xperi
plies g
42.85, 22.nd 5.
se in
videsrom t in thgard.
on us
: 22
.71%)) and
erienc
es giv
85%)2.14% 5.71
inter
des ad the
theird.
usin
23
%) aand 0
ence
given
%) ar14% .71%
terne
adeqthe steir c
sing i
1-4
Pa
) are d 0-1
ce in
en by
are % of% of
net da
dequa studyr com
g inte
491
age
re usi1 y
in usi
by
re usi of thof th
t daily
uacyudy tompu
nterne
11
e 78
using year
using
using them them
aily.
cy ofy thatputer
rnet
8
ing ear
ing
ing em em
of hat ter
et

In
V
Itinm It 7. Tre
Itinm
nte
Vol
It isintermor It ca 7.7 P The repli
It isintermob
ern
.2(
is evterneore th
can b
.7 Pla
he resplies
is evterneobile
nati
(3),
evidnet bthan
n be c
lace
respoies giv
evidenet aile (9
ion
, Ju
vident betwhan 10
e con
ce of
spondgiven
identt at t (9.28
nal
ul-S
ent fetwee 10 h
concl
of Ac
ndenven b
ent frt the.28%
Jou
Sep
t fromeen
0 hou
clude
Acce
ents by th
fromtheir %), f
urn
p, 2
rom n 4-1ours
uded
ccessi
ts wey them
om Gir ho), frie
nal
01
S.
Ta10 h
rs (10
ed tha
ssing
were hem a
Grahomeriend
1
1
2
2
3
3
l of
12
S. No
1.
2.
3.
4.
Z
Table0 hou
(10%
that m
ing In
re ask are
raph.me fond’s
0%
5%
10%
15%
20%
25%
30%
35%
f Li
No.
ble-4 hours%).
t maj
Inte
askedre sh
ph.-1 follo’s hou
%
%
%
%
%
%
%
%
ibra
4 thurs pe
ajori
tern
ed a show
1 thollowhouse
At
ary
Mo
that per w
ority
rnet
a quown i
that owed use (6
30%
Co
y an
Ti
4
More
at 37r wee
ty of
questn in G
P
at a hed by (6.42
%
lleg
nd
Time
T
0-
1-4
4-1
ore th
T
37.15eek
of the
estionin Gra
Plac
a high by a.42%
ge
In
me sp
Tim
-1 h
4 h
10 h
than
Tot
.15%k fol
the re
tion toraph
lace o
ighes at C
2%).
3
At
for
spen
ime
1 hou
hour
0 hou
an 10
otal
% ofollow
resp
n to kph-1
Ge of a
hest pt Col
32.8
t Ho
rm
Taent i
e
our
ours
ours
10 ho
al
of tlowed
spon
o kno1
Graof acc
t perolleg
85%
ome
ati
Tablet in u
rs
hour
f the ed b
onden
now
raphacces
ercenllege
%
e
on
ble –n usi
ours
he re by 1
dents
w the
aph –essin
centagge (3
2
Cyb
n St
– 4 sing
respoy 1-4
nts are
the pl
– 1sing i
tage (30%
21.4
ber
tud
ng In
Nu
spond4 ho
are s
plac
1 g int
ge of 0%),
42%
Caf
dies
Inter
Num
28
46
52
14
140
onden hour
e spen
lace w
intern
of th), at
%
fé
s
terne
mber
28
46
52
14
140
ents urs (3
pendi
e whe
ernet
the rat br
6.
F
H
net
ber
ts ars (32.
ding
here
et
e resp brow
.42%
Frind
Hom
P
are s32.85
ng 4-
ere th
esponowsin
%
ds
me
Perc
2
3
3
1
10
e spe.85%)
-10
they
ondesing
ercen
20.0
32.8
37.1
10.0
100.
pend%), le
10 ho
ey co
dent ng ce
9.
M
entag
0.00
2.85
7.15
0.00
0.00
nding, less
hours
could
nt (3centr
.28%
Mobi
tage
00
ing thess th
urs in
uld a
(32.8ntre
%
ile
ISS
ge
thei than
s in us
acce
2.85%e (21
SN:
heir tan ho
usin
ccess
5%) (21.4
: 22
r tim hour
sing i
ss in
) are.42%
23
ime iur (20
g inte
inter
are ac2%),
1-4
Pa
e in (20%
nterne
ternet
acce), th
491
age
in usi0%) a
rnet.
net. T
ccessithrou
11
e 79
using) and
et.
t. The
ssingrough
9
ing nd
he
ing gh

International Journal of Library and Information Studies ISSN: 2231-4911
Vol.2(3), Jul-Sep, 2012
Page 80
It can be concluded that a highest percentage of the respondents are accessing internet at their home. It is also noticed that 9.28% of the respondents are accessing internet through mobile phones. 7.8 Purpose of using Internet The respondents were asked a question to know the purpose for which they use internet. The replies given by them are shown in Table-5.
Table – 5 Purpose for Using Internet
S. No. Purpose Number Percentage
(%)
1. Education 93 66.42
2. Entertainment 75 53.57
3. E-mail 111 78.28
4. Job purpose 29 20.71
5. Chatting 89 63.57
(Respondents were permitted to tick more than one answer)
It is clear from Table-5 that majority of the respondents (78.28%) were browsing internet for the purpose of E-mail Purpose, followed by Education (66.42%), Entertainment (53.57%), chatting (63.57%) and for job searching (20.71%). It can be concluded that most of the students were searching internet for the purpose of Entertainment. . 7.9 Frequently used browsers The respondents were asked a question to know the browsers which they use frequently. The replies given by them are shown in Table-6
Table – 6 Frequently used Browsers
S. No. Browsers Number Percentage (%)
1. Internet Explorer 42 30 2. Mozilla Fire Fox 44 31.42 3. Opera 12 8.58 4. Google Chrome 42 30 Total 140 100%

International Journal of Library and Information Studies ISSN: 2231-4911
Vol.2(3), Jul-Sep, 2012
Page 81
It is clear from Table-6 that a highest percentage of the respondents are browsing Internet from Mozilla Fire Fox (31.42%), followed by Internet Explorer (30%), from Google Chrome (30%) and from Opera (8.58%). It can be concluded that a highest percentage of the respondents (31.42) are browsing internet from the Mozilla Fire Fox. 7.10 Motivating Factor to Use Internet A question has been posed to the respondents to know the factors which motivate them to use internet. The replies given by them are shown in Table-7
Table – 7 Motivating factor to use internet
S. No. Motivating Factor Response
Percentage (%)
1. Faster communication 34 25
2. To update the knowledge 53 37.85
3. To get Quick Information 50 35.71
4. To save Time 12 8.5
(Respondents are permitted to tick more than one answer) It is obvious from the Table-7 that a highest percentage of the respondents (37.85%) are replied that getting of update knowledge is the main motivating factor for using internet followed by to get quick information (35.71%), faster communication (25%), and to save time (8.5%).
7.11 Preferred Internet Service A question has been put to the respondents to know which Internet service they prefer to use. The replies given by them are shown in Figure-2.

International Journal of Library and Information Studies ISSN: 2231-4911
Vol.2(3), Jul-Sep, 2012
Page 82
Figure – 2
Preferred Internet Service
It is clear from Figure-2 that a highest percentage of the respondents (35.71%) preferred to use e-mail service followed by WWW (33.57%), Chatting (12.14%), FAQ (7.14%), Remote login (6.42%), BBS (5.71%) and Discussion Forum (5%). It can be concluded that a highest percentage of the respondents (35.71) are prefer to use internet for E-mail purpose. 7.12 Use of Search Engines A question has been posed to the respondents to know which search engines they use most. The replies given by them are shown in Table-8.
Table – 8
Most used search Engines S. No. Search Engines Response Percentage)
1. Google 115 82.14
2. Yahoo 31 22.14
3. MSN 6 4.28 4. Alta-vista 1 0.71 5. Sify 2 1.42
6. Indian Times 1 0.71
7. Bing 6 4.28 (Respondents are permitted to tick more than one answer)
35.71%
33.57%
7%
6.42%
5.71%
7.14%
12.14%5%
Email WWW
FTP Remote Login
BBS FAQ
Chatting Discussion Forum

International Journal of Library and Information Studies ISSN: 2231-4911
Vol.2(3), Jul-Sep, 2012
Page 83
It is clear from Table-8 that most of the respondents. (82.14%) use Google search engine followed by Yahoo Search Engine (22.14%), MSN search Engine and Bing (4.28%), Sify Search Engine (1.42%), Alta-Vista and Indian Times Search Engines (0.71%). It can be concluded that most of the respondents (82.14%) are using Google search engine. 7.13 Type of Mail Service The respondents were asked to know which mail service thy use most. The replies given by them are shown in Table-9.
Table – 9 Type of Mail Service
S. No. Mail Services Number Percentage 1. Yahoo 32 22.85 2. Gmail 91 65.00 3. Rediff 5 3.57 4. Hotmail 9 6.42 5. Orkut 28 20.00
(Respondents are permitted to tick more than one answer) It is clear from Table-9 that majority of the respondents (65%) use Gmail service followed by Yahoo (22.85%), Orkut (20%), Hotmail (6.42%), and Rediff (3.57%). It was concluded the majority of the respondents (65%) are using Gmail services. 7.14 Browsing Method Generally the users can search Internet for required items in different methods. Some people use search engines and some people use direct websites when they are aware. In this regard, a question has been put to the respondents to know the methods which they use for search internet for required information. The replies given by them are shown in Table-10
Table – 10 Browsing Method
S. No. Browsing Method Number Percentage
1. Through web address
directly 53 37.85
2. Through search engines 87 62.15
Total 140 100.00
It is know from the Table-10 that the majority of the respondents (62.15%) searching internet by using search engines and remaining of them (37.85%) through web address. It can be concluded that majority of the respondents are searching inter through search engines.

International Journal of Library and Information Studies ISSN: 2231-4911
Vol.2(3), Jul-Sep, 2012
Page 84
7.15 Reasons for Using Internet than Print Sources The respondents were again asked to mention the reasons for using electronic sources than prints sources. The replies given by them are shown in Table-11
Table - 11 Reasons for using electronic Sources
S. No.
Reason Number Percentage
1. Time saving 50 35.71 2. More Information available 51 36.42 3. Less Expensive 21 15.00 4. More Accurate 22 15.71 5. Multiple Documents can be retrieved at a Time 28 20.00 6. Most updated information available 12 8.57
(Respondents were permitted to tick more than one answer) It is found from the Table-11 that a highest percentage of the respondents (36.42%) were using internet to get more information than print sources followed by to save the Time (35.71%), multiple documents can be retrieved at a time (22.14%), more accurate (15.71%), less expensive (15%) and most updated information available (8.57%). It can be concluded that a highest percentage of the respondents (36.42%) are using internet to get more information in the electronic form then print form. 7.16 Problems in using Internet Even today majority of the students are facing many problems in using Internet like low speed of internet, lack of computer knowledge, network failures and other problems in order to know the problems faced by the respondents in using internet, a question has been put to them. The replies given by them are shown in Table-12
Table – 12 Problems in using Internet
S. No. Problems Number Percentage
1. Slow Access 78 55.71
2. Lack of sufficient Computer Systems
34 24.29
3. Power Fluctuations 28 20.00
Total 140 100.00

International Journal of Library and Information Studies ISSN: 2231-4911
Vol.2(3), Jul-Sep, 2012
Page 85
It is clear from the Table-12 that the half of the respondents (55.71%) expressed that the speed of the internet is very slow followed by lack of sufficient Computer Systems (24.28%), and Power Fluctuations (19.99%). The main problem is the low speed of the Internet faced by the half of the respondents. 7.17 Level of Satisfaction The respondents were asked a question regarding to their level of satisfaction on the availability of Internet facilities in their colleges. The replies given by them are shown in the Table-13
Table – 13 Level of Satisfaction
Sl. No. Level of Satisfaction Response Percentage 1. Fully 23 16.42 2. Partially 26 18.57
3. Neither Satisfied nor dissatisfied
74 52.85
4. Not Satisfied 17 12.14 Total 140 100.00
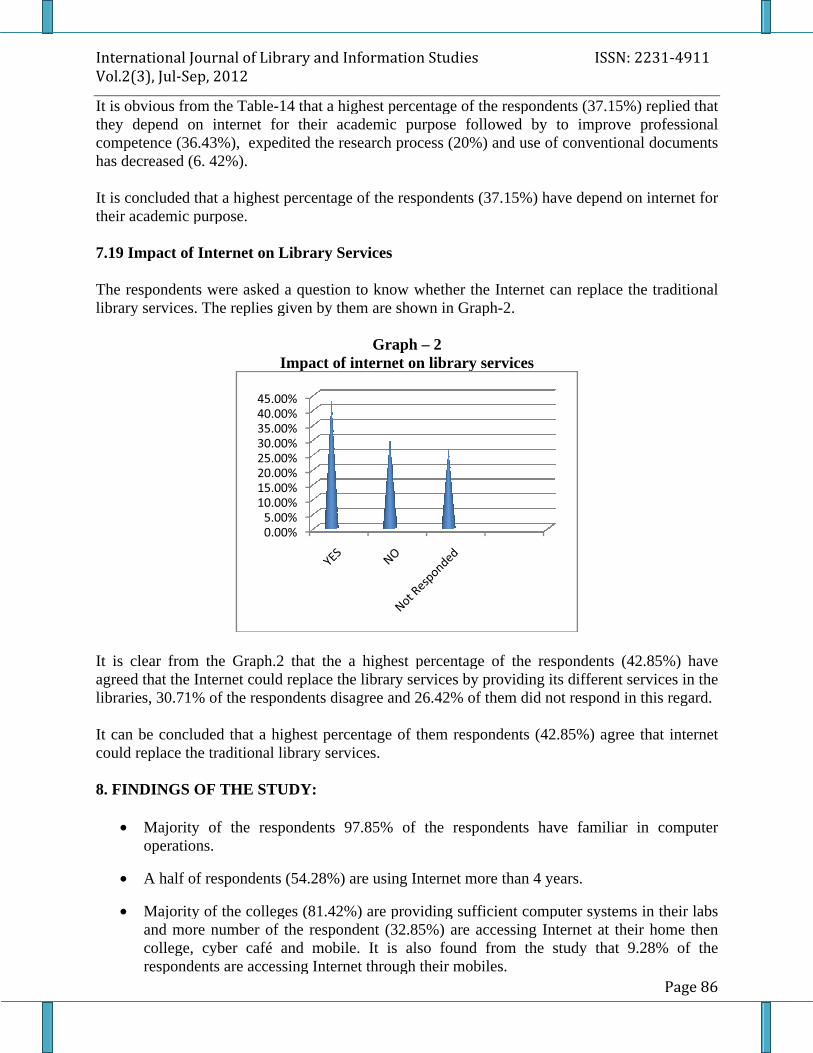
It is clear from the Table-13 that the half of respondents (52.85%) were neither satisfied or nor dissatisfied, 18.57% of the respondents were satisfied partially, 16.42% of the respondents were satisfied fully and 12.14% of them have not satisfied. It is concluded that the half of the respondents (52.85%) are neither satisfied nor dissatisfied on the available of computer facilities. 7.18 Influence of Internet on Education A question has been posed to the respondents to know the influence of Internet on educational activities. The replies given by them are shown in the Table-14
Table - 14 Influence of Internet on Education
Sl. No. Impact of Internet Response Percentage
1. Use of conventional documents has decreased
9 6.42
2. Dependency on the Internet 52 37.15
3. Expedited the research process
28 20.00
4. Improve professional Competence
51 36.43
Total 140 100.00
In
V
Itthcoha Itth 7 Tli
Itagli Itco 8.
nte
Vol
It is theycomhas d It is their 7.19 The libra
It isagrelibra It cacoul 8. F
ern
.2(
is obey d
ompetas dec
is coeir ac
19 Im
he resbrary
is clgreed brarie
can bould r
. FIN
•
•
•
nati
(3),
obvio deppetendecre
concl acad
Imp
respory se
cleaed tharies,
n be d rep
INDI
Mop
A
Mancore
ion
, Ju
viousependtence rease
ncludadem
pact
spond servi
lear f that ts, 30.
be coeplac
DING
Majoopera
A ha
Majoand collerespo
nal
ul-S
us frend oce (3ased (
ludedemic
act of
ndenrvices
r fromat the30.71
concllace t
NGS
ajoriteratio
half o
ajoritd mollegespond
Jou
Sep
from on
(36.4d (6.
ed thic pu
t of In
ents ces. T
rom the In.71%
nclude the
S OF
rity ations
lf of r
rity omore ge, cnden
urn
p, 2
om thn in
6.43%(6. 42
that a purpo
f Inte
ts we. The
the Inter% of
ludedhe tra
OF T
y of ons.
of res
y of tre nu, cybents
nal
01
the Tinter3%),
42%)
at a hrpose
tern
were he re
the Gternet of the
ed th tradit
F TH
of th
respon
f the numbyber ts are
l of
12
e Tabternet), ex
%).
a highose.
rnet
re ask repli
Grapnet co the re
that dition
HE
the
ponde
the comberer caare ac
f Li
ablenet f expe
ighes
et on
askedplies
raph.t coule resp
at a hional
E ST
e res
ndent
colleber ofcafé acce
0
5
10
15
20
25
30
35
40
45
ibra
le-14t for xpedit
est p
on Li
ked aes giv
Im
ph.2 uld rspon
a higal lib
TUD
respo
ents (5
llege of thfé ancessi
.00%
.00%
.00%
.00%
.00%
.00%
.00%
.00%
.00%
.00%
ary
14 thor thdited
t perc
Libr
a qu given
Imp
2 thad replonden
ighes librar
UDY
pond
s (54.
ges (8f the and
ssing
%
%
%
%
%
%
%
%
%
%
y an
that their
ted th
ercen
brary
quesven by
pact
that teplacdents
hest prary s
Y:
ndent
54.28
s (81.e resd mong In
nd
at a heir a the r
entag
ary S
estio by th
act of
t the lace thnts di
st perry ser
ents
.28%)
81.42respomobi Inter
In
a high acade rese
tage o
y Ser
tion ty them
t of in
he a e the disag
ercenservic
ts 97
%) ar
.42%)pondobile.ternet
for
ighescademesear
e of t
ervic
n to khem a
Gf inter
a highe libsagre
centavices
97.85
are u
%) arndentile. Itnet th
rm
hest pdemicarch
f the
vices
o kno are
Graterne
highelibrarree a
ntage es.
.85%
e usin
are pent (3 It ist throu
ati
t percic p
ch pro
he re
es
now re sh
raphrnet o
ghest rary se and
ge of
% o
sing
e prot (32. is arough
on
ercen pur
proce
respo
w wh show
aph –et on
st pey servnd 26
of th
of t
ng Int
rovid2.85% also
ugh th
n St
centagurpos
ocess
spond
whetown i
– 2n lib
perceervic 26.42
them
f the
Intern
vidin85%)lso f their
tud
tage pose ss (2
nden
hethern in G
2 libra
rcentvices
42%
em re
e re
ernet
ing s%) ar foueir m
dies
e of se fo (20%
ents
her thn Gra
rary
entagees by2% of
resp
resp
et mo
g suff are aound r mob
s
of thefollo
0%) a
ts (37
r the raph
ry ser
age oby pr of th
spon
spon
more
ufficie accnd frobile
the rellowe) and
(37.15
e Intph-2.
serv
e of prov them
onden
onden
ore th
ficienccess
fromiles.
respowed nd us
.15%
Intern2.
rvices
f theovidiem d
dents
dents
than
ient cessinom t
spondd by use o
5%) h
ernet
ces
the reiding did n
nts (4
nts h
an 4 y
t comsing I the
ondenby tose of c
) hav
et ca
respng itsid not
(42.8
have
4 yea
ompug Intehe st
dents to iof con
ave d
can r
spon its dinot re
2.85%
ave f
years.
puterntern study
ts (37 imp
conve
e dep
n rep
onden diffet respo
5%)
e fam
rs.
ter syrnet
udy t
ISS
(37.1mproventi
epen
eplac
dentsfferenspond
) ag
amili
systeet at y tha
SN:
7.15%rovention
end o
lace t
nts (4rent sond in
agree
iliar
stemat thethat 9
: 22
5%) rve pional
d on i
e the
(42.8t serv
d in th
ree th
ar in
ms intheir t 9.2
23
) rep profal do
n inte
he tra
2.85%ervic this
that
in c
s in thir ho.28%
1-4
Pa
replierofessdocum
intern
tradi
85%) ices is reg
at in
com
n theihome8% o
491
age
lied tessiocume
ernet
ditio
) haes in regar
inter
ompu
heir lame th of
11
e 86
d thatsionalments
et for
tional
havein thegard.
ternet
puter
r labs thenf the
6
hat nal nts
for
nal
ve the
net
ter
abs en
the

International Journal of Library and Information Studies ISSN: 2231-4911
Vol.2(3), Jul-Sep, 2012
Page 87
• .Majority of the respondents (78.28%) were browsing Internet for the purpose of E-mail Purpose, followed by Education (66.42%), Entertainment (53.57%), chatting (63.57%) and for job searching (20.71%).
• A highest percentage of the respondents are browsing Internet from Mozilla Fire Fox (31.42%).
• The main motivating factor for using Internet by the respondents (37.85%) is updating of knowledge.
• Majority of the respondents (82.14%) use Google search engine and also 65% of respondents use Gmail service for mailing purpose.
• A highest percentage of the respondents (36.42%) opined that Internet is providing more information with latest figures than print sources.
• Low speed of internet is main problem in accessing Internet expressed by the Half of the respondents (55.71%).
• Half of respondents (52.85%) are neither satisfied nor dissatisfied on the available of computer facilities.
• A highest percentage of the respondents (37.15%) replied that they depend on internet for their academic purpose.
• A highest percentage of the respondents (42.85%) have agreed that the Internet could replace the library services by providing its different services in the libraries.
9. SUGGESTIONS: Based on the findings of the study, the following suggestions are made to improve the use of internet among engineering students.
� 78.28% of the respondents use internet for mail purpose. An awareness should be created among the students to use internet for academic purpose.
� Internet bandwidth should be enhanced to overcome the low access of the internet. And also suggested to have more than one internet providers to reduce the network failures.
� Majority of the respondents neutrally satisfied on the availability of internet facilities in their colleges. Hence, more computer systems, skilled man power, comfortable computer labs with good infrastructure should be provided to satisfy the users.
� Orientation programs should be conducted periodically by the engineering colleges to make the students for efficiency use of internet.
� Entertainment websites should be blocked to avoid long sitting of the students before computers to facilitate inter facility to other users.

International Journal of Library and Information Studies ISSN: 2231-4911
Vol.2(3), Jul-Sep, 2012
Page 88
�
9. CONCLUSION:
Internet facilitates students to enhance their knowledge with latest updates not only in their subjects but also their all-round development. Libraries are also playing an important role for providing information by using ICT facilities. The above study reveals that the internet facilities are not satisfactory in serving the information needs of the engineering students. It is in the this context the college authorities should take necessary steps for providing better internet facilities in their colleges and to take measures to utilize internet by the students to compete with the developed countries. REFERENCE:
1. Panda, K.C. and Sahu, N.K (2003) “Usee of Internet in the Engineering Colleges of Orissa: An Analysis”. Online: C/CALIBER-Files/caliber-2003-CD/Us/13.htm. pp.1-13.
2. Kumar and Kaur (2005). “Internet and its use in the Engineering Colleges of Punjab, India: A Case Study”. Webology. 2(4), December, pp.1-18.
3. Devendra S. Gobbur and Suresh Jange (2007). “Quality information service on the internet: A Study”. Indian Journal of information Library and Science, 20(1-2), January-June; pp.59-68.
4. Jaya Prakash and Koteswara Rao(2007). “Role of internet and Web Technology in Library and Information Services in Digital Environment”. Indian Journal of information Library and Science. 20(1-2), January-June; pp.26-37.
5. Gururaj S. Hadagali, Kumbar B.R. and Siddu Kashmireddy (2007). “Use of Internet by the Social Science Faculty of Karnataka University, Dharwad, India: A Case Study”. PEARL, 1(4), Oct-Dec. pp. 3-10.
6. Kaur and Manhas (2008). “Use of Internet Services and Resources in the Engineering Colleges of Punjab and Haryana (India): A Study”. The International Information and Library Review. 40, pp.10-20.
7. Velmurugan and Kannan (2010) “Understanding on Internet and its Usages amongst students of International Schools in Chennai, India”. A Journal of Library and Information Science. 4(2); April-June; pp.117-121.
8. Sharma U.C., Raman Chawla and Priya Madaan (2011). “Internet Usage by the faculty Members & the Students in Professional Colleges at Mathura Region: An Empirical Study”. INTERNATIONAL JOURNAL OF INFORMATION DISSEMINATION AND TECHNOLOGY.1(2), pp.77-85.
---@@@---
Copyright © 2022 FDOKUMEN