Adoption et usage marchand de l’Internet : une étude économétrique sur données bretonnes
Upload
khangminh22Category
view
0download
0
Factors Influencing the Adoption and Usage of
Internet Banking: A New Zealand Perspective
Braja Podder
This thesis is presented as a part of the requirements for the award of the Degree of
Master of Information Technology at the Auckland University of Technology
June 2005

ii
TABLE OF CONTENTS
LIST OF TABLES .......................................................................................................vii
LIST OF FIGURES ..................................................................................................... ix
ATTESTATION OF AUTHORSHIP ........................................................................... x
ETHICS APPROVAL................................................................................................... x
ACKNOWLEDGEMENTS......................................................................................... xi
ABSTRACT .................................................................................................................xii
Chapter 1 Introduction............................................................................................... 1
1.1 Background to the study..................................................................................... 1
1.2 Studying Internet banking adoption .................................................................... 3
1.3 Research objectives ............................................................................................ 5
1.4 Significance of the research................................................................................. 5
1.5 Organisation of this thesis .................................................................................. 5
Chapter 2 An overview of Internet banking: Global and local perspectives ................... 7
2.0 Introduction ...................................................................................................... 7
2.1 Internet banking................................................................................................. 7
2.2 Global Internet banking trend............................................................................. 9
2.2.1 Internet banking trend in U.S.A and Canada .............................................. 11
2.2.2 Internet banking trend in Europe .............................................................. 14
2.2.3 Internet banking trend in Africa ................................................................ 17
2.2.4 Internet banking trend in Australia ............................................................ 18
2.2.5 Internet banking trend in Middle East ....................................................... 19
2.2.6 Internet banking trend in Asia ................................................................... 21
2.2.7 Internet banking trend in New Zealand ..................................................... 23
2.3 Chapter summary ............................................................................................. 25
Chapter 3 Theoretical background of Internet banking adoption or usage behaviour ... 28

iii
3.0 Introduction .................................................................................................... 28
3.1 Theory of reasoned action ................................................................................ 29
3.2 Theory of planned behaviour ............................................................................ 30
3.3 Diffusion of innovation.................................................................................... 32
3.4 Technology acceptance model .......................................................................... 35
3.5 Comparison of theories / models...................................................................... 38
3.5.1 Comparison of TPB and TAM .................................................................. 38
3.5.2 Comparison of TAM and DOI ................................................................. 41
3.6 Research models and hypotheses ...................................................................... 42
3.6.1 Research model 1 ..................................................................................... 42
3.6.1.1 Perceived ease of use ........................................................................ 44
3.6.1.2 Perceived usefulness ......................................................................... 44
3.6.1.3 Perceived self-efficacy ....................................................................... 45
3.6.1.4 Perceived risk ................................................................................... 47
3.6.1.5 Actual use......................................................................................... 49
3.6.2 Research model 2 ..................................................................................... 49
3.6.2.1 Relative advantage ............................................................................ 50
3.6.2.2 Compatibility .................................................................................... 51
3.6.2.3 Ease of use ....................................................................................... 51
3.6.2.4 Trialability ........................................................................................ 51
3.6.2.5 Observability .................................................................................... 52
3.6.2.6 Actual use......................................................................................... 52
3.7 Chapter summary ............................................................................................. 53
Chapter 4 Research Method...................................................................................... 54
4.0 Introduction .................................................................................................... 54
4.1 Research purpose ............................................................................................. 54
4.2 Research approach ........................................................................................... 55
4.3 Research design................................................................................................ 56
4.4 Data collection ................................................................................................. 57
4.4.1 Data collection method............................................................................. 57

iv
4.4.2 Designing survey instrument ..................................................................... 60
4.4.2.1 Measurement of the constructs.......................................................... 61
4.4.2.2 Ordering questions in the questionnaire ............................................. 64
4.4.2.3 Choosing the first question................................................................ 65
4.4.2.4 Raising response rates ....................................................................... 66
4.4.3 Pre-testing................................................................................................ 69
4.4.4 Ethical approval ....................................................................................... 70
4.5 Sample selection............................................................................................... 70
4.5.1 Survey error ............................................................................................. 73
4.5.2 Survey distribution.................................................................................... 75
4.5.3 Response Rate.......................................................................................... 75
4.6 Data analysis .................................................................................................... 75
4.7 Summary ......................................................................................................... 76
Chapter 5 Research findings ..................................................................................... 77
5.0 Introduction .................................................................................................... 77
5.1 Data analysis .................................................................................................... 77
5.1.1 Sample characteristics ............................................................................... 77
5.1.2 Construct validation ................................................................................. 80
5.1.3 Averaging items........................................................................................ 87
5.1.4 Treating Likert scale data as interval data ................................................... 87
5.1.5 Correlation matrices ................................................................................. 88
5.2 Hypotheses testing ........................................................................................... 91
5.2.1 Perceived ease of use and intention ........................................................... 93
5.2.2 Perceived ease of use and perceived usefulness .......................................... 93
5.2.3 Perceived usefulness and intention ............................................................ 93
5.2.4 Self-efficacy and intention......................................................................... 93
5.2.5 Self-efficacy and perceived ease of use ....................................................... 94
5.2.6 Self-efficacy and perceived usefulness ........................................................ 94
5.2.7 Self-efficacy and risk ................................................................................. 94
5.2.8 Perceived risk and intention ...................................................................... 94
5.2.9 Intention and usage_1............................................................................... 95
5.2.10 Intention and usage_2............................................................................... 95

v
5.2.11 Relative advantage and intention ............................................................... 95
5.2.12 Compatibility and intention....................................................................... 96
5.2.13 Trialability and intention ........................................................................... 96
5.2.14 Visibility and intention.............................................................................. 96
5.2.15 Result demonstrability and intention.......................................................... 97
5.3 Model analysis.................................................................................................. 98
5.3.1 Model 1: extended TAM ........................................................................... 98
5.3.2 Model 2: PCI.......................................................................................... 100
5.3.3 Summary of model analysis ..................................................................... 101
5.4 Perceptions of Internet banking ...................................................................... 102
5.4.1 t-test of independent sample ................................................................... 102
5.4.2 Mann-Whitney test ................................................................................. 103
5.5 Chapter summary ........................................................................................... 104
Chapter 6 Discussion and conclusion ...................................................................... 105
6.0 Introduction .................................................................................................. 105
6.1 Discussion ..................................................................................................... 105
6.1.1 Model 1 variables.................................................................................... 107
6.1.2 Model 2 variables.................................................................................... 108
6.1.3 Model performance ................................................................................ 109
6.1.4 Internet banking perception .................................................................... 110
6.2 Limitations..................................................................................................... 111
6.3 Research contributions ................................................................................... 112
6.4 Practical implications...................................................................................... 113
6.5 Recommendations for future study ................................................................. 116
6.6 Conclusion..................................................................................................... 117
REFERENCES......................................................................................................... 118
APPENDICES ......................................................................................................... 133
Appendix A: Covering letter........................................................................................... 1

vi
Appendix B: Survey Questionnaire ................................................................................. 2
Appendix C: Survey Area ............................................................................................... 8
Appendix D: Survey distribution .................................................................................. 10
Appendix E: Survey data (original data) ........................................................................ 12
Appendix F: Box-Cox transformed data........................................................................ 19
Appendix G: Survey data(after averaging items) ............................................................ 26
Appendix H: SPSS results ............................................................................................ 28

vii
LLIISSTT OOFF TTAABBLLEESS
Table.2.1: Country-wise adoption trends and factors influenced adoption or usage ......... 26
Table 3.1: Summary of prior studies used TAM............................................................. 36
Table 3.2: Risk source and dimension in electronic shopping context ............................. 48
Table 4.1: Features of two research paradigms............................................................... 55
Table 4.2: Internet adoption research works: surveys and case studies ............................ 57
Table 4.3: Advantages and disadvantages of various methods of data collection .............. 59
Table: 4.4: List of items by construct ............................................................................ 62
Table 4.5: Summary of changes after pre-testing questionnaire for user .......................... 69
Table 4.6: Summary of changes after pre-testing for non- user ....................................... 70
Table 4.7: Summary of populations in Auckland west and cental region.......................... 71
Table 5.1: Summary of demographic profile .................................................................. 78
Table 5.2: Male and female population.......................................................................... 79
Table 5.3: Intention to use Internet banking services in future ....................................... 79
Table 5.4: Intention to use Internet banking services ..................................................... 79
Table 5.5: Frequency and actual use of Internet banking in last 30 days .......................... 79
Table 5.6: Internet banking experience.......................................................................... 80
Table 5.7: Internet use experience................................................................................. 80
Table 5.8: Factor analysis and Cronbach alpha coefficient.............................................. 81
Table 5.9: Correlations of item to item and variation of perceived ease of use........................ 84
Table 5.10: Correlations of item-to-item and variation of risk......................................... 85
Table 5.11: Correlations of item to item and variation of risk ......................................... 86
Table 5.12: Construct-wise items in survey and used in data analysis............................... 86
Table 5.13: Pearson correlation coefficients................................................................... 89
Table 5.14: Kendall’s tau correlation ............................................................................. 91
Table 5.15: Regression analysis ..................................................................................... 92
Table 5.16: Stepwise regression analysis of model 1 ....................................................... 98
Table 5.17: Explanation power of variables associate with model 1 ................................ 99
Table 5.18: Excluded variables of model 1 .................................................................... 99
Table 5.19: Stepwise regression analysis of model 2 ..................................................... 100
Table 5.20: Stepwise regression analysis of model 2 ..................................................... 100
Table 5.21: Stepwise regression analysis of model 2 ..................................................... 101
Table 5.22: Result of independent sample t-test........................................................... 103
Table 5.23: Mann-Whitney U-test analysis................................................................... 104

viii
Table.6.1: Result of hypotheses testing with prior studies ............................................. 106

ix
LLIISSTT OOFF FFIIGGUURREESS
Figure 2.1: Processing cost (US$) per transaction............................................................. 8
Figure 2.2: Rate of diffusion (by % total banking customers)............................................ 9
Figure 2.3: Estimates Internet banking services users..................................................... 10
Figure 2.4: Diffusion of Internet and Internet banking services (% total population)....... 11
Figure 2.5: Projected and actual Internet banking users.................................................. 12
Figure 2.6: Clustering of on-line banking in Europe....................................................... 15
Figure 2.7: Internet banking criteria required by customers in South Africa..................... 17
Figure 2.8: Analysis of Internet banking services for Middle East banks ......................... 20
Figure 2.9: Service-wise channel preferences of Internet banking in New Zealand........... 24
Figure 3.1: Theory of reasoned action model (TRA) ...................................................... 30
Figure 3.2: Theory of Planned Behaviour (TPB) ............................................................ 31
Figure 3.3: Adoption of innovation curve...................................................................... 33
Figure 3.4: Technology acceptance model (TAM) .......................................................... 35
Figure 3.5: Research model 1 (extended TAM) .............................................................. 43
Figure 3.6: Research model 2 (modified PCI) ................................................................ 50
Figure 4.1: Schematic presentation of research method.................................................. 54
Figure 4.2: Role of researcher in two paradigms ............................................................ 56
Figure 5.1: Regression analysis of model 1..................................................................... 95
Figure 5.2: Regression analysis of model 2..................................................................... 97
Figure 5.3 Example of data distribution ........................................................................ 98
Figure 5.4: Model 1 regression analysis........................................................................ 100
Figure 5.5: Model 2 regression analysis........................................................................ 101

x
AATTTTEESSTTAATTIIOONN OOFF AAUUTTHHOORRSSHHIIPP
“I hereby declare that this submission is my own work and that, to the best of my
knowledge and belief, it contains no material previously published or written by another
person nor material which to a substantial extent has been accepted for the qualification of
any other degree or diploma of a university or other institution of higher learning, except
where due acknowledgement is made in the acknowledgements.”
Yours sincerely,
(Braja Podder)
EETTHHIICCSS AAPPPPRROOVVAALL
The research conducted as a part of this thesis has been approved by the Auckland
University of Technology Ethics Committee, Reference Number: 04/235

xi
AACCKKNNOOWWLLEEDDGGEEMMEENNTTSS
I would like to take this opportunity to acknowledge the help and encouragement of all
who have supported and assisted me during this thesis work. Without their guidance and
advice, I would have never been able to accomplish the work of this thesis.
Firstly, I would like to express my sincere gratitude to Professor Bill Doolin, my supervisor,
for his guidance, support, advice and encouragement added considerably to enrich my
work. I would like to sincerely thank Professor Brett Collins, for his constant valuable ideas
and encouragement to improve my thesis work.
Secondly, I would like to thank all the participants who took part in the surveys conducted
as a part of this research for their valuable time and kind assistance. I am also grateful to all
my colleagues and friends, especially Saritha Kodthuguli and Nisha Mohan for their
comments and reviews, which helped enrich this thesis work.
Very special thanks go to my wife Sima, daughter Sayantani and Nayanika for their patience
and support throughout my study. They made my dream come true. Finally my special
thanks go to Ratna, Aloke, Soma, Prasanta, Dolly, Bianca and Shreya for their love and
encouragement.

xii
AABBSSTTRRAACCTT
Although the offering of financial products and services over the Internet by banks and
financial institutions continues to spread, reports on Internet banking show that the
adoption and usage of such services by consumers are low. Further, relatively little
empirical research has been carried out to examine factors influencing users’ adoption or
use of Internet banking services, particularly in New Zealand. Hence, there is a need to
identify relevant factors that influence New Zealand’s bank customers’ intentions to use
Internet banking. This research used two commonly applied and empirically supported
models of information technology adoption to achieve this objective. In this study, Davis’s
(1989) technology acceptance model (TAM) is extended by two external variables, namely
risk and self-efficacy. The second model used is a reduced version of Moore and Benbasat’s
(1991) perceived characteristics of innovation (PCI) model, without the image and
voluntariness constructs. A questionnaire was used to conducting a postal survey of 1000
individuals in Auckland, New Zealand. Out of 163 responses received 157(15.7%) were
usable and with this data both research models were tested.
The results reveal that perceived usefulness, perceived ease of use, self-efficacy, relative advantage,
compatibility, and result demonstrability have a significant association with intention to use
Internet banking, while risk, visibility and trialability are not significant. Both the modified
TAM and PCI models used in the study have a similar explanatory power of slightly over
20% of the variance in intention. In the TAM model, perceived usefulness and self-efficacy are
significant variables, while compatibility is the only variable significant for the PCI model.
Further, results indicate that users’ perceptions of various aspects of Internet banking are
more positive than non-users’ perceptions, except for risk.
The results of this study indicate that both TAM and PCI have low capabilities in
explaining the variances in users’ intention to adopt or use Internet banking services.
Therefore, further studies are recommended to examine the performance of these models
in Internet banking studies and also to improve the prediction power of these models by
incorporating additional constructs. Although risk is found to be insignificant in this study,
considering results of prior studies, further studies are required to examine its influence on
intention.

xiii
For banks point of view, banks should consider launching campaigns to demonstrate the
usefulness and benefits. Once users perceive that advantages outweigh disadvantages, they
are more likely to adopt or use Internet banking. Additionally, banks must make
continuous effort to understand consumers’ requirement and design and deliver their
products and services in such a way that it is consistent with customers’ requirements,
beliefs and the way customers are accustomed to work. Banks website should facilitate
customers with a ‘one stop comprehensive financial’ service. Banks can arrange hands-on
training for prospective users to enhance their self-efficacy or may pay additional interest on
online-deposit accounts (can be access through Internet only). Besides promoting services,
banks need to invest in staff education and training and be equipped with advanced
computer technology.

Factors influencing the adoption and usage of Internet banking: A New Zealand perspective
1
CCHHAAPPTTEERR 11 IINNTTRROODDUUCCTTIIOONN
1.1 Background to the study
The rapid growth and popularity of the Internet has created great opportunities as well as
threats to companies in various business sectors, to endorse and deliver their products and
services using Internet as a distribution channel (Chau & Lai, 2003). Researchers have
emphasised the importance of the Internet for financial services more than other industries
(Mukherjee & Nath, 2003; Tan & Teo, 2000). Besides opportunities of this channel, banks
and financial institutions across the world face new challenges to the ways they operate,
deliver services and compete with each other in the financial sector. Driven by these
challenges banks and financial institutions have implemented delivering their services using
this channel (Chan & Lu, 2004; Cronin, 1997). Internet banking refers to the use of the
Internet as a delivery channel for banking services, which includes all traditional services
such as balance enquiry, printing statement, fund transfer to other accounts bill payment
and so on, and new banking services such as electronic bill presentment and payment
(Frust, Lang, & Nolle, 2000) without visiting to bank branch (Mukherjee & Nath, 2003;
Sathye, 1999).
The objectives of Internet banking include cost containment through reduction in
operating cost, performance improvement by making the service available at all times of
the day, wider coverage by enabling the access to service from any location, revenue
growth through better quality and additional non-financial services, and customer
convenience through personalised service (Bradley & Stewart, 2002; Chau & Lai, 2003;
Frust et al., 2000; Suganthi & Balachandran, 2001). From the customer’s perspective,
Internet banking facilitates a convenient and effective approach to manage personal
finances, as it is accessible 24 hours a day and 365 days in a year without visiting the bank
and from any locations (Rotchanakitumunai & Speece, 2003).
Although there is a significant growth of Internet users in almost every country, the
number of financial transactions carried out over Internet remains to be low. It is observed
that potential users either do not adopt Internet banking or do not use it continually after
adoption. Mearian (2001) indicated that most of the banks’ websites are getting accessed by
huge number of customers in USA but only a minority of customers have made online
financial transactions. Gartner expressed that out of 61% online users, only 20% of
consumers carries out online banking in USA (J. Brown, 2001). Several studies have

Factors influencing the adoption and usage of Internet banking: A New Zealand perspective
2
reported not only low adoption rate but also disparity in adoption rates among European
countries. ACNeilsen (2002b) found that use of Internet banking is increasing in Asian
countries but it is still slower than estimation. Due to these slow adoption rates, the
transformation of banking services from ‘bricks and mortar’ to ‘clicks and mortar’ is yet to
eventuate to the extent it was predicted (Bradley & Stewart, 2002). Customers in some
countries have ranked Internet banking as less important than other channels such as ATM
or telephone banking (Aladwani, 2001; Rotchanakitumunai & Speece, 2003; Suganthi &
Balachandran, 2001).
In order to be successful, banks and financial organisations are keen to understand to what
extent customers are adopting or using Internet banking services. Courtier and Gilpatric
(1999) recommended that banks and financial companies must survey customers’
requirements on a regular basis in order to understand factors that can affect their intention
to adopt or use Internet banking. Researchers (I. Brown, Hoppe, Mugera, & Newman,
2004) suggested banks (mainly international banks) for considering influence of national
factors while introducing their services. For example, socio-economic conditions that
affects income and levels of affluence, and the consumers’ ability to use Internet banking
need to be considered. Further banks must be equipped with necessary technological
infrastructure and resources to demonstrate the potential benefits of this new channel. But
due to the limited number of studies that have been conducted in understanding users’
adoption or usage intention, availability of information in this context is found limited for
many countries, including New Zealand.
In New Zealand Internet banking was started in mid 1996 by the ASB bank. First Internet-
only bank (without a branch) was launched in 1997. The number of online customers was
low in every New Zealand bank in 1999, but was doubling every six months. Around
200,000 customers used Internet banking in New Zealand in 2000, which increased to
480,000 in 2001 (Chung & Paynter, 2002). A recent report claimed that about 100,000
customers bank online daily. The relative success of Internet banking to date can be gauged
by identifying the number of active users and anticipated future adopters (Gerrard &
Cunningham, 2003). All major banks have introduced their Internet banking services and
are constantly investing and expanding their products and services in New Zealand.
According to Chung and Paynter (2002), Internet banking services offered by most of the
New Zealand banks are similar and are not customer focused Therefore, although numbers
of bank customers are growing, the use of services remains at the lowest amongst all

Factors influencing the adoption and usage of Internet banking: A New Zealand perspective
3
banking facilities. Privacy and security are found to be the most important issues that
inhibit customers from using Internet banking in New Zealand (Chung & Paynter, 2002).
As mentioned earlier, due to limited research on Internet banking in New Zealand,
information on factors that have influenced users’ behaviour to adopt or use Internet
banking is limited. The current study will address this shortcoming. The findings of this
study will help the banking industry in developing strategic plans to promote products and
services over the Internet in future (Chau & Lai, 2003; Wang, Wang, Lin, & Tang, 2003).
1.2 Studying Internet banking adoption
There is a growing body of academic research that has focused on examining the factors
that have influenced user behavioural intention to adopt or use innovations in information
technology (Compeau, Higgins, & Huff, 1999; Davis, 1989; Davis, Bagozzi, & Warshaw,
1989; Moore & Benbasat, 1991; Rogers, 1983; Taylor & Todd, 1995a; Venkatesh & Davis,
1996; Wang et al., 2003). Among the different models that have been proposed, the
technology acceptance model (TAM) suggested by Davis (1989) is the most widely
accepted model because of its specific focus on information system (IS) use, its basis in
social psychology theory, its parsimony and empirical support from various studies.
According to TAM, adoption behaviour is determined by the intention to use which is turn
determined by the perceived usefulness and perceived ease of use traits of the system.
Although researchers have found support for TAM but there are studies that have claimed
that TAM’s fundamental constructs are unable to fully explain the variances in intention.
Davis (1989) expressed that future research of TAM needs to address how other variables
affect perceived usefulness and perceived ease of use. Recent research on Internet banking and
online shopping has revealed that risk (Doolin, Dillon, Thompson, & Corner, 2005), self-
efficacy (Chan & Lu, 2004; Wang et al., 2003), credibility (Chan & Lu, 2004; Luarn & Lin,
2004), and task familiarity (Chau & Lai, 2003) have a significant influence on intention to
adopt or use Internet banking or buying products online.
In studying the adoption or usage of Internet banking, we argue that the original TAM’s
constructs are not sufficient because technology settings and transaction environment are
different from conventional information system studies such as adopting software packages
or tools (Moon & Kim, 2001), thus necessitating a search for additional variables that
better explain adoption or use of Internet banking. Moreover researchers (Plouffe,
Hulland, & Vandenbosch, 2001) commented that TAM’s parsimony can be trade-off by

Factors influencing the adoption and usage of Internet banking: A New Zealand perspective
4
adding richer set of constructs that enhances the prediction ability of the model. Therefore,
this research proposes to extend TAM in the context of Internet banking with a view to
provide a more in-depth analysis of intention to adopt or use of services. For this study, we
propose two additional variables, risk and self-efficacy to enhance understanding of users’
behavioural intention. Risk is found to be a widely recognised obstacle to Internet banking
adoption in prior studies. This may because of lack of security and privacy over the
Internet and thereby any commercial transaction over Internet is viewed as a risky
undertaking. On the other hand, self-efficacy, an internal control factor, is found to influence
the adoption or rejection decisions of information system users.
Another model that has been used in studies of information system adoption is Rogers’
(1983) diffusion of innovation (DOI) theory. Rogers (1983) proposed five characteristics of
an innovation that affect adoption behaviour: relative advantage, compatibility, complexity,
trialability and observability. Although both TAM and DOI focus on usage as the primary
outcome of adoption process, DOI has gone beyond in explaining various types of usage
such as initial usage and continual usage (Rogers, 1983). Although TAM has been the most
widely studied model in users’ technology acceptance field, researchers (Plouffe, Hulland,
& Vandenbosch, 2001) are of the opinion that DOI’s constructs explain a higher
proportion of the variance than TAM when it is being used as antecedents to adoption
intention. Further, Moore and Benbasat (1991) have extended DOI for studying
information technology usage by adopters and potential adopters. Their extended model,
perceived characteristics of innovating (PCI), comprises eight user perceptions that can
help in explaining information technology usage (Agarwal & Prasad, 1997). These are:
relative advantage, compatibility, ease of use, image, voluntariness, trialability, result demonstrability and
visibility.
Motivated by the conceptual similarity of TAM and PCI on technology acceptance
behaviour, and the set of constructs used in TAM which is a subset of some of the
constructs of PCI, this study proposes to apply the PCI model along with TAM to identify
factors that influence Internet banking adoption and usage in New Zealand.
In this study variable image is not considered because the researcher belief that one’s status
does not get elevated any more in the social system by seeing him or her using Internet
banking. Further, the construct image is considered as a part of relative advantage (Agarwal &
Prasad, 1997). The construct voluntariness is also dropped because the researcher is of the

Factors influencing the adoption and usage of Internet banking: A New Zealand perspective
5
opinion that there will not be any external pressure on the individual to adopt or use
Internet banking system. Moreover, support for the role of external pressure on to
intention is inconclusive (Agarwal & Prasad, 1997).
1.3 Research objectives
This study aims to enhance the understanding and knowledge of factors that affect
adoption and usage of Internet banking services in New Zealand. The primary objectives
of this study are to:
?? Identify factors influencing the adoption and usage of Internet banking services in
New Zealand
?? Examine whether TAM or PCI can explain more variance in intention to adopt or
use Internet banking
?? Investigate whether differences exist in perceptions of Internet banking between
users and non-users of those services.
1.4 Significance of the research
This study has a number of theoretical contributions. It is the first study to empirically
examine the influences of TAM constructs together with risk and self-efficacy on behavioural
intention to adopt or use Internet banking services in New Zealand. It is one of the few
studies on Internet banking context that have used most of the PCI constructs, and the
first in New Zealand. Further, this study aims to indicate which model has the better
explanation capabilities. Aside from theoretical values, practitioners, information system
developers and researchers require a better understanding of why people refuse to use new
technologies, in order to predict how people respond to new innovations. They need to
motivate user acceptance of information technology based innovations by changing the
technological characteristics and processes by which it is implemented.
1.5 Organisation of this thesis
This thesis is organised into six chapters. Chapter 1 provides an introduction to Internet
banking services and sets out the objective and significance of this research. Chapter 2
outlines the adoption trends of Internet banking in several countries across the world.
Chapter 3 review prior literature on information technology adoption, and formulates the
hypotheses used in this study. Chapter 4 presents the research method, including data

Factors influencing the adoption and usage of Internet banking: A New Zealand perspective
6
collection and analysis. Chapter 5 and 6 present the research findings and discuss the
implications of this study.

Factors influencing the adoption and usage of Internet banking: A New Zealand perspective
7
CCHHAAPPTTEERR 22 AANN OOVVEERRVVIIEEWW OOFF IINNTTEERRNNEETT BBAANNKKIINNGG::
GGLLOOBBAALL AANNDD LLOOCCAALL PPEERRSSPPEECCTTIIVVEESS
2.0 Introduction
In order to exemplify the importance of current study, this chapter provides a background
highlighting the benefits of Internet banking, consumers’ adoption trends across various
countries in the world and those in New Zealand. The first section focus on types of
Internet banking services, its acceptance trends as against predictions from different market
research organisations and factors that motivated adoptions, followed by a comparative
review of adoption trend in New Zealand and other countries, which forms the
significance of this study.
2.1 Internet banking
Internet banking refers to the delivery of banking services over the Internet. Such services
are advantageous as no transfer of physical goods are involved, any transaction can be
processed electronically that includes balance enquiry, transferring funds to other accounts,
bill payments and so on. Banks have adopted various means in providing banking services
over the Internet and those are: creation of an Internet-only bank, called as virtual bank
where bank does not have physical existence and provide services through the Internet,
ATMs and other remote delivery channels (Carlson, Furst, Lang, & Nolle, 2001); offer
services through its website as a complementary distribution channel besides its traditional
delivery channels; creation of an Internet bank as a subsidiary of bricks and mortar bank
targeting complementary user segments (Centeno, 2003).
The objective of Internet banking services is to provide financial services to consumers 24
hours a day and 365 days a year from locations where Internet access is available. Apart
from any time and anywhere, consumers can have better control on their banking
transactions. On the other side, banks expect to reduce operating costs, enhance customer
reach, enable business diversification such as providing non-financial services, increase
volume of business, provide better services, form alliances with other industries and retain
market share by implementing Internet banking services (Carlson et al., 2001; Centeno,
2003). Booz Allen and Hamilton (B. Singh & Malhotra, 2004) conducted a survey in 42
countries comprising of 386 retail and corporate banking institutions to assess the strategic
impact of Internet banking on the financial service industry and found that there is a large
perception gap between North American and European banks compared to Japanese

Factors influencing the adoption and usage of Internet banking: A New Zealand perspective
8
banks. Japanese banks expect to retain traditional channel while Internet banking is
expected to become the most important retail channel within 10 years in North America or
in Europe.
According to Carlson et al (2002) $6 million would be required to set-up an Internet bank
compared to $25 to $30 million for a brick-and-mortar bank in USA. In addition to this,
low customers’ servicing cost (shown in figure 2.1) has encouraged organisations to invest
in Internet banking, even though the channel is yet to produce profitable results. Figure 2.1
indicates that the cost of providing services is approximately $1.07 per transaction from a
physical bank, $0.47 per transaction from phone banking, $0.27 per transaction from ATM
banking and $0.1 per transaction from Internet banking (Carlson et al., 2001; Centeno,
2003; Perumal & Shanmugam, 2004).
Figure 2.1: Processing cost (US$) per transaction (Source: Perumal & Shanmugam, 2004)
Centeneo (2003) argued that Internet banking has the capability of increasing customers’
satisfaction, enhancing bank’s profitability through cost efficiency and could be useful for
cross-border bank expansion but in reality, the cost of introducing new technologies,
managing associated risk and acquiring new customers are the major barriers in achieving
profitability in short or even medium term. Besides this, Internet banking has brought huge
competition between banks and products and services for users in countries where Internet
banking is most developed, for instance, Sweden. Due to this competition or consumer
demand, banks are forced to introduce and maintain several services including non-
profitable services. Researchers (Frust et al., 2000) have expressed that the statistical

Factors influencing the adoption and usage of Internet banking: A New Zealand perspective
9
relationship between offering services and profitability might be different with smaller
banks (having assets less than US$100 million) than bigger banks (assets over US$100).
2.2 Global Internet banking trend
Several research organisations have predicted the future growth of Internet banking users
in different countries based on available adoption trends, and banks’ strategies and
initiative toward implementing it. It is evident from extant literature review that the average
consumer has accepted the Internet with phenomenal intensity, but adoption of Internet
banking services has been found much slower than predictions made (Centeno, 2003). A
similar trend is reported in study conducted in New Zealand (Chung & Paynter, 2002).
Figure 2.2: Rate of diffusion (by % total banking customers)
(Source: Grealish, 2002)
Barwise (1997) estimated that 60% of retail banking transactions would be online by 2007
while Burnham (1997) indicated that 20% of retails and 30% of corporate customers will
use some form of Internet banking by 2002. Grealish (2002) report showed online banking
penetration by percentage of total banking customers across countries in the world till 2002
(shown in figure 2.2). Figure 2.2 shows European countries are in the lead, with Norway
over 40%, Finland and South Korea around 40% followed by Sweden over 35%, far
behind is USA having around 20% and Japan less than 5%.
Further, a report from International Data Corporation (IDC) (Perumal & Shanmugam,
2004) estimated that the number of Internet banking users in Western European would
reach the total number of Internet banking users of USA, Japan and Asia-Pacific counties
by 2004 and diffusion rate in Japan’s users would almost same as of USA (shown in figure
2.3). Figure 2.3 shows that the rate of growth would be very slow for the countries
categorised under rest of the world. However, estimations on the growth rate as indicated

Factors influencing the adoption and usage of Internet banking: A New Zealand perspective
10
by various market research organisations also vary significantly. For example, Forrester
research estimated 16% growth in users while Datamonitor estimated 36% increase
(Centeno, 2003).
Figure 2.3: Estimates Internet banking services users
(Source: Perumal & Shanmugam, 2004)
Another study found a significant disparity between use of the Internet and adoption rate
of Internet banking (shown in figure 2.4). Through a statistical analysis, Bughin (2001)
concluded that when a country achieves Internet penetration rate of 30%, (which he
referred to as a measure of customer’s readiness to transact on-line) use of Internet
banking services will start increasing disproportionately. For example, Sweden and Norway
have Internet and Internet banking penetration rates over 50% and 25% respectively. On
the contrary, Spain, France and Portugal have Internet usage less than 20% and Internet
banking diffusion rate less than 5%. Other researchers also have supported such relation
(Christiansen, 2001; Corrocher, 2001). However, the relation does not hold valid for USA,
Korea and Switzerland where Internet banking diffusion rates are low, despite high
Internet penetration rates. Even for New Zealand low Internet banking usage was reported
low (Chung & Paynter, 2002) despite Internet penetration rate was well above 45%
(http://www2.stats.govt.nz). The differences might be due to the lack of banks’ initiative
towards converting their offline customers to online (Bughin, 2001) and are not related
with countries’ economic development (Centeno, 2003) status.
In summary, slower diffusion rate is experienced in various countries in the world
compared to estimations made by the market research organisations. This has caused

Factors influencing the adoption and usage of Internet banking: A New Zealand perspective
11
several virtual banks running into trouble. European countries are found much ahead from
rest of the world in Internet banking adoption. Although use of the Internet is high in
several countries, such as USA, Canada, adoption of Internet banking is lacking. In the next
few sections levels of Internet banking adoptions in several countries across the world are
reviewed.
Figure 2.4: Diffusion of Internet and Internet banking services (% total population)
(Source: Grealish, 2002)
2.2.1 Internet banking trend in U.S.A and Canada
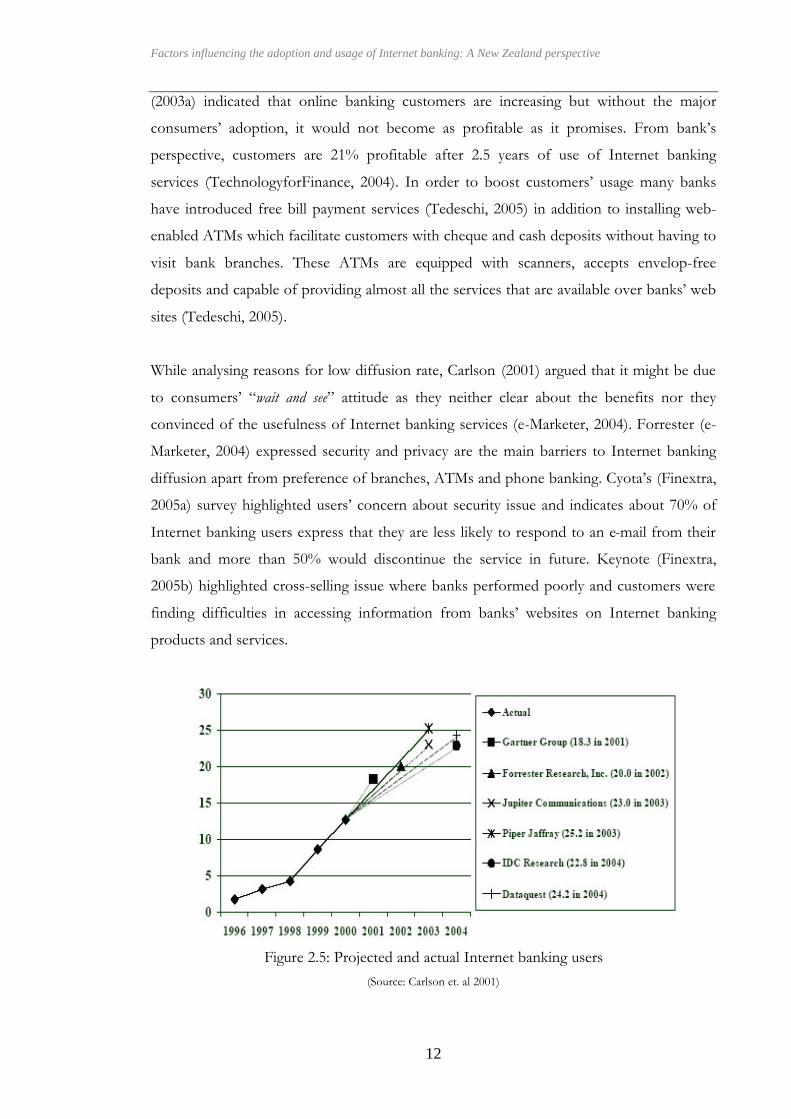
Figure 2.5 shows actual online banking in USA as against estimated by different market
research analysts. The data shows that although actual number of online banking users is
growing, it is still much lower than what was predicted.
Fox (2002) found “convenience” is the main attraction for 79% of consumers to use Internet
banking services of which 82% of respondents aged between 30-49 years. About 71% of
consumers use Internet banking for time saving, 30% for cost savings and 52% to have
better control of their finance. TowerGroup (CRMToday, 2003a) found that Internet
banking users make 30% less calls to banks’ help line and have higher overall account and
loan balances. Further, study indicated that 56% of consumers chose bank for the quality
and reliability of bill payment service, ahead of physical branch location (45%) or the
number of ATMs (52%) a bank has (Finextra, 2005b).
CRMToday highlighted TowerGroup’s prediction on IT spending by large banks in USA,
which amounts to 24.1 billion in 2004 as compare to 22 billion in 2002. CRMToday
Factors influencing the adoption and usage of Internet banking: A New Zealand perspective
12
(2003a) indicated that online banking customers are increasing but without the major
consumers’ adoption, it would not become as profitable as it promises. From bank’s
perspective, customers are 21% profitable after 2.5 years of use of Internet banking
services (TechnologyforFinance, 2004). In order to boost customers’ usage many banks
have introduced free bill payment services (Tedeschi, 2005) in addition to installing web-
enabled ATMs which facilitate customers with cheque and cash deposits without having to
visit bank branches. These ATMs are equipped with scanners, accepts envelop-free
deposits and capable of providing almost all the services that are available over banks’ web
sites (Tedeschi, 2005).
While analysing reasons for low diffusion rate, Carlson (2001) argued that it might be due
to consumers’ “wait and see” attitude as they neither clear about the benefits nor they
convinced of the usefulness of Internet banking services (e-Marketer, 2004). Forrester (e-
Marketer, 2004) expressed security and privacy are the main barriers to Internet banking
diffusion apart from preference of branches, ATMs and phone banking. Cyota’s (Finextra,
2005a) survey highlighted users’ concern about security issue and indicates about 70% of
Internet banking users express that they are less likely to respond to an e-mail from their
bank and more than 50% would discontinue the service in future. Keynote (Finextra,
2005b) highlighted cross-selling issue where banks performed poorly and customers were
finding difficulties in accessing information from banks’ websites on Internet banking
products and services.
Figure 2.5: Projected and actual Internet banking users
(Source: Carlson et. al 2001)

Factors influencing the adoption and usage of Internet banking: A New Zealand perspective
13
On the other hand, although banks are introducing new services and making continuous
effort in improving existing services on a short-term basis; they are yet to determine when
and how deep to plunge into Internet banking services. This is due to huge competition, not
only from traditional rival banks but also from banks from new and distant locations and
from non-financial institutions. TowerGroup’s (CRMToday, 2003b) review of 10 top
Internet banking sites in USA revealed that security is the top barrier to adoption of
Internet banking services and banks have made poor attempt, so far, in communicating key
points about Internet security to their customers or their responsibilities in the event of
unauthorised access not clearly stated. Most of banks’ website have mentioned what
security technology they follow such as 128-bit Secure Socket Layer (SSL) encryption – this
technical information does little to communicate consumers about the level of protection
measure that banks’ have adopted. The report recommended banks to intimate customers
about the following:
?? Security measures in place and how those systems works in non-technical language
?? Procedure customers to follow to protect their data
?? Inform Bank’s indemnification policy
In contrast to what was discussed until now, a recent study by Pew research organisation
(e-Marketer, 2004), portrayed a different picture of Internet banking adoption or usage in
USA. According to their report, 53 million people that constitute 44% of the Internet users
carried out online banking in USA in 2004, which is an increase of 47% from 2002. If these
figures are considered valid, then Internet banking user’s growth has surpassed most of the
previous predictions. The usage gains are significant in 28-39 and 50-58 year age groups
with high school or college degrees and in broadband user category. Among the users 50%
are men and 40% are women compared to 31% and 29% in 2002. The study also indicated
that 39% of consumers who have been using Internet for four or more years have ported
to Internet banking services, while 20% of those with 2-3 years and 6% of those with one
year of experience. About 92% use Internet banking services for checking account balances
and transactions, 51% for checking and printing statements and 43% for bill payment
services and 21% for downloading transactions to use with other software applications (e-
Marketer, 2004). Further researches or reports on current status would help to ascertain
how diffusion has grown over the years in USA.

Factors influencing the adoption and usage of Internet banking: A New Zealand perspective
14
According to a Canadian market research company (Finextra, 2005c), use of Internet
banking services is increasing but once it reaches to a sizeable segment of consumers it
might slow down or even get stopped as they presumed that Internet banking service is not
for everyone. The major barrier to Internet banking service diffusion is due to availability
of other channels, which adequately meet customers’ need. The study reported the use of
ATMs in 2004 is 75%, which is same as that of 2003 while telephone banking has reduced
to 20% in 2004 from 26% in 2001. About 59% of consumers visit branches for banking,
which remain unchanged since 2003. Further, among 6% of non-user has shown interest to
use Internet banking services within next six months. Review on adoption and usage of
Internet banking services in Canada remains limited due to very little studies that have
found by the current researcher.
In short, Internet banking diffusion appears to be slower than expected except Pew’s (e-
Marketer, 2004) findings. Individuals are aware of Internet banking products and its
benefits but are not adopting due to risks involved in carrying out financial transactions.
Banks are facing huge competition from their rivals as well as from new entrants in
Internet banking services. Large banks are dominating the market with more variety of
products and services while small and medium sized banks waiting for market to grow.
Canadians prefer to visit bank branches or using ATMs than using Internet banking
services, whereas majority of US customers select bank based on their quality and reliability
of Internet banking services.
2.2.2 Internet banking trend in Europe
According to the European Central Bank in 2002 (Centeno, 2003), although all major
banks offer Internet banking services, the level of services and its quality differ according
to the country and the banks. The adoption rate is found to be averaging less than 6% of
total bank customers or only 17% of Internet users (Bughin, 2001). Since majority of
consumers continue to rely on either branch access or telephone banking as they found
these channel provide more information and better services than bank’s website. Even
countries where Internet penetration rate is over 50%, such as Finland and Sweden, online
consumers found to transact with physical branch or call centres. Around 60% of Internet
customers do not have issue in buying books, CDs or low valued item through online but
are reluctant to make online banking transactions (Bughin, 2001).

Factors influencing the adoption and usage of Internet banking: A New Zealand perspective
15
Further, disparities in Internet banking adoption also exited among several countries in
Europe. For example in Estonia, 18-25% of population are using Internet banking services
whereas Italian bank had almost no on-line customers by early 2000, banks in Malta
launched Internet banking services in December 2002 (Centeno, 2003). Even adoption
disparities are evident among banks within the same country. For example, in France,
leading banks have diffusion rate over 11% while minor bank such as the Credit
Commercial de France have converted only 2% of its customers to online for the same
period (Bughin, 2001). Bankinter, a medium bank in Spain, has ranked by Euromoney as one
of the best Internet bank in Europe in year 2000 (Ward & Peppard, 2003) despite country’s
low Internet penetration rate and inferior telecommunication system. Through a cluster
analysis (shown in figure 2.6), Bughin (2001) found that the Scandinavian banks are the
best performing banks (7%) due to strong “push” and “pull” effects while poorly
performing cluster (of 7%) Irish and French banks have lower level of “push” and “pull”
factors.
Figure 2.6: Clustering of on-line banking in Europe
(Source: Bughin, 2001)
While analysing reasons behind disproportion adoption rates and means to improving
adoption and usage, Kulkun (2002) found home-Internet access have increased Internet
banking service acceptance but exception was found for Estonia where home-Internet
access is only 10% but Internet banking diffusion rate is 18-25%. Further, researches have
indicated a strong correlation between Internet diffusion and cost of service access,
confidence in the security of the system, privacy of the service and trust on banks (e-

Factors influencing the adoption and usage of Internet banking: A New Zealand perspective
16
Marketer, 2002; Gourova & Burgelman, 2002) but mixed results are reported in prior
studies. Among other factors that have influenced on the acceptance of Internet banking
services, access to ATM, use of cashless payment instruments and value of cash in
circulation to gross domestic products (GDP) are reported in earlier studies (Centeno,
2003). But results are inconclusive due to number of exceptions are reported in prior
studies.
Bughin (2001) identified cost effectiveness, customer convenience and online readiness as
the significant factors that motivate customer to bank online. Grealish (2002)
recommended two practices to be followed by the banks to boost their customers to:
?? Make bill payment as cornerstone of the service rather than an add-on service
?? Allocate sufficient resources on staff education and training, so that the staff can
explain and encourage non-users of Internet banking services
Deutsche Bank Research (Centeno, 2003) predicted Internet banking diffusion rate could
rise from 1% to 10% in newly developed market and could reach 20% by 2005 whereas it
could rise from 8.5% to 50% in industrial countries. In Nordic countries for example,
adoption of Internet banking services could reach 80% by 2005, while in UK and USA,
Internet banking diffusion could be around 50%. The study estimated that western
European countries are expected to consolidate their lead in terms of numbers of Internet
banking customers, which would go past 60 million.
Study on the usage of Internet banking services for 5000 small and medium size businesses,
Ramsay (2004) revealed that there has been only a 3% of increase in Internet banking usage
since 2002 compare to 13% increase between 2000 and 2002. Datamonitor (Centeno,
2003) estimated that spending on Internet banking services in Europe would go past $2.3
billion in 2005 from the figure of $1.7 billion in 2002 and the number of users is estimated
to reach 75 million in 2005. A workshop on “the future of on-line banking” in 2002,
researcher argued that pure Internet banking would be unlikely to succeed in Europe since
high level of technology investment and high customer acquisition cost would hinder
economic viability of most projects. Rather Internet banking could succeed by integrating
with traditional channels.

Factors influencing the adoption and usage of Internet banking: A New Zealand perspective
17
In summary, adoption rate found to be averaging less than 6% of total bank customers.
Consumers continue to depend on branches and call centres to get more information or
make banking transaction rather than using banks’ websites. Consumers are ready to use
online banking services for low valued items but are found reluctant for high valued
transactions. Disparities in adoption of Internet banking service exist among countries in
Europe. Scandinavian banks are ahead of others in terms of Internet banking penetration
due to high Internet penetration and banks’ initiatives. Several European banks have
experienced reduction in Internet banking users in 2002. Researchers recommended banks
to make the bill payment as keystone of their services and educate banks’ staff on products
and benefits of Internet banking services in order to attract more customers.
2.2.3 Internet banking trend in Africa
In South Africa, Internet banking is relatively new and also making slow progress (A.
Singh, M, 2002); only four banks were providing Internet banking services in 2002. Around
31% of customers banked online of which 59% are male and 41% are female. Over 50% of
users aged between 25 and 34 years while 30% are aged between 35 and 44 years. The
frequency Internet banking ranges from 12% daily, 29% weekly and 59% monthly. About
92% depend mainly on ATMs, 39% transfer funds within accounts, 14% transfer funds to
other banks, 27% check balance or print statements.
Figure 2.7: Internet banking criteria required by customers in South Africa
(Source: Singh A M, 2002)
Among non-Internet banking users, 69% were not using Internet banking services due to
transactions unsafe, unaware of Internet banking products and benefits (33%), time
consuming (10%) and more costly (10%). On the other hand, discontinued Internet
banking users are willing to comeback, if current service met the criteria as shown in figure
Factors influencing the adoption and usage of Internet banking: A New Zealand perspective
18
2.7. Although large number of people (33%) found to be ignorant of Internet banking
services and its benefits, still free training has received low importance (17%).
In short, Internet banking is relatively new in the country with low diffusion rate. Current
situation could not be analysed further due lack of information and limited studies that
carried out on diffusion of Internet banking service.
2.2.4 Internet banking trend in Australia
The Market Intelligence Strategy Centre (MISC) reported over 7.2 million customers
accessed 27 millions accounts in 2003 which is a 31% increase
(AustralianBusinessIntelligence, 2003) compared to 16.2% in 2002 (Douglas, 2003). A
significant increase in the number of transactions transferring funds to external accounts
are found, which consumers found more cost effective option than transferring fund
through the traditional banking process. The report also indicated that users are able to
transact more amounts using fewer sessions, which indicated users become more efficient
in using Internet banking services. The multiple-access accounts were activated 15% more
in 2004 compared to 12% in 2003. Further, among users women in particular are becoming
increasingly attracted to Internet banking services and 50+ years age group is the fastest
growing category. Recent reports highlighted a 6% growth of active users in 2004
compared to 5% in previous year (Lebihan, 2004; MISC, 2004). Another survey indicated
that new registration has fallen from 19.4% in 2002 to 2.8% in last quarter of 2003, which
might be an indication of existing consumers are immune to the security issue and behaves
normally but new users may have been deterred.
Banks are considering active-user’s growth and increase in the number of online
transactions are the factors that determine the performance of online banking channel
rather than the number of new registrations. Banks are facing increased competition from
their rivals that lure consumers with a range of services including loans, savings, managed
funds, etc rather than only transactional banking facilities. Unlike USA, where larger banks
provide more variety services than smaller banks in Australia, some small and medium
sized banks offer more user-friendly services than lager banks and performed well in the
area of personal Internet banking, and website reliability and transactional capabilities.
Banks are taking initiative to educate customers over on-line risk. ACNielsen (2004)
highlighted higher interest rate in online savings account have motivated 89% of users in
using online banking and also forces major banks in offering similar products. For

Factors influencing the adoption and usage of Internet banking: A New Zealand perspective
19
example, St. George bank’s “dragondirect directsaver”, Citibank’s “Online Cash Manager”,
Suncorp’s “Everyday options” and HSBC’s “online savings account” are few of them.
In summary, Internet banking diffusion rate is significant since 2000. Banks experienced
800,000 new online users in 2004 and are focusing on active-user’s growth and to increase
the number of online transactions rather than the number of new customers. Transferring
to other bank’s account has grown 24% in 2004 due to lower transfer fees. Small and
medium sized Australian banks are found to offer more user-friendly services than larger
banks and are successful in providing personal banking services. High interest rate in online
savings account has motivated most customers in using online banking and also forces
major banks in introducing similar products.
2.2.5 Internet banking trend in Middle East
Al-Bassera’s (Guru, Shanmugam, Alam, & Perera, 2003) study showed that only 19% of
banks have full transactional capability in their current services. About 41.4% of banks
websites have rated less than 10 on a maximum rating of 27 (Guru et al., 2003). But banks
are soon catching up with the conventional system. A recent study by the Institute of
Banking in Kuwait expressed that Islamic banks can no longer ignore the importance of
Internet banking as 20% of their customers are willing to move to another financial
institution if their current bank fails to offer financial services over the Internet. According
to the Economist Intelligence Unit’s (Guru et al., 2003) report, 14% of the region's Internet
users are now registered to Internet banking services. The most significant is three Arab
countries having high Internet banking adoption and they are Bahrain with 17%, the
United Arab Emirates with 21% and Kuwait with 29% (Roth, 2001).
Similar to European countries a significant disparity in adoption rate is noticed in Gulf
countries. For instance, Kuwait, which had 2.2 million people, has nearly as many online
banking customers as Saudi Arabia, with a population of 20.5 million. Figure 2.8 shows that
no banks in Turkey, Iran, Palestine and Yemen have online transactional capabilities
(Awamleh, Evans, & Mahate, 2003). Further, level of services provides by banks in Egypt,
Lebanon and Cyprus is not known.
Jasimuddin (2001) expressed that use of Internet banking is a marginal activity in Saudi
Arabia. About 73% of banks’ have their own websites, out of which 25% of sites are
offering full services over the Internet and rest use for brand awareness and promotions.

Factors influencing the adoption and usage of Internet banking: A New Zealand perspective
20
As of September 2003, only two banks are providing Internet banking services in Oman
and Jordan (Awamleh et al., 2003). However, other banks in Oman and Jordan maintained
an informational website with basic interactive capability. Awamleh et al (2003) argued that
banking industries in Jordan and USA exhibit weakness in building customer relationship.
Accenture's study (Guru et al., 2003) on banks’ strategies expressed that almost 33% of
Gulf countries banks have no intention of introducing Internet banking services in the next
18 months either because of non core area of business, high technology or marketing costs,
lack of customers and/ or banks are not interested in it.
Figure 2.8: Analysis of Internet banking services for Middle East banks
(Source: Guru et al, 2003)
Although arguments in favour of adopting Internet banking services such as time saving,
convenience and increased efficiency are highlighted in prior studies but those factors seem
to be less convincing considering the slower pace of life where a visit to the bank branch
may be viewed as an opportunity to socialise. Further, absence of adequate infrastructure
may be another obstacle to online banking particularly with regards to connectivity.
In summary, Internet Banking is a relatively recent phenomenon, especially in Arab
countries except UAE, Kuwait and Bahrain where Internet banking adoption reported
high. Only a few banks have online transactional capabilities. Although one-third banks
have no intentions of introducing Internet banking, customer demands might force them

Factors influencing the adoption and usage of Internet banking: A New Zealand perspective
21
to change their views. Disparity in adoption rate is noticed within gulf countries as
experienced in Europe. Limited number of studies and lack of information from other
sources have restricted analysis for this region.
2.2.6 Internet banking trend in Asia
According to ACNielsen (2001) online banking consumers has grown by 63% across South
Korea, Hong Kong, Singapore, China and Taiwan. The total Internet banking population
for this region has increased by 4 million in one year time. About 38% of Internet users are
now using Internet banking services compared to 29% a year ago. South Korea has the
largest number of users followed by China and Taiwan and out of top 20 Internet banks,
South Korea has 12, China 5 and one each in Singapore, Taiwan and Hong Kong. A recent
report from IDC (CRMToday, 2004) highlighted growing usage of Internet banking
services in nine countries in Asia Pacific that includes Australia, China, Hong Kong, India,
Korea, Malaysia, Singapore, Taiwan and Thailand. Internet banking population has crossed
1 million marks in most of these countries. A maximum growth of 300% is expected in
India and China, where the number of Internet banking users estimated to reach in the tens
of millions within couple of years. Furthermore, the report indicated as more affluent and
educated people move to Internet banking services, banks will be challenged in near future
to remain focused to service online customers rather than servicing a majority of its least
profitable customers that use most expensive offline banking channel.
In Malaysia, although the accessibility to computers and the Internet is found to be higher
within non-Internet banking users, Suganthi et al (2001) found that the level of awareness
on Internet banking services is lacking within non-user. They recommended banks to
create awareness on banking products and services. Guru et al. (2003) found almost all
domestic banks are offering full Internet banking services in 2003 while it was only four
banks in 2000 (Suganthi & Balachandran, 2001). Vijayan and Shanmugam (2003) revealed
that two of the top five Malaysian banks had a four star rating out of a maximum five star
rating. The remaining three top banks had a three star rating based on a 40-item evaluation
instrument indicating that banks must focus on improving their service quality. The
diffusion Internet banking services is affected by trust, security and preference to human
interface (Suganthi & Balachandran, 2001).

Factors influencing the adoption and usage of Internet banking: A New Zealand perspective
22
Thailand banks expressed that there is a high potential growth for retail Internet banking
that includes features such as balance enquiry, bill payment, fund transfer, business
information and payment for goods purchased.
Steyen et al (2003) reported over half a million users have visited an online banking site in
Hong Kong from their home computers, represents a growth of 42% in 2003. Although
Internet banking is gaining popularity, home Internet users are found reducing in numbers.
It might be due to the fact that the Internet users have reached a critical mass. The average
time spend in top ranking bank site is 30 minutes per month per visitor of which 39% is
female, which has increased by 4%.
Several studies (B. Singh & Malhotra, 2004) on diffusion of Internet banking services in
India predicted a highly sophisticated and competitive Internet banking market would
emerge by 2005. But to reach a critical mass, level of services offered by Indian banks
currently requires much improvement to reach international standard. In addition to this
sufficient infrastructure must be in place (Rao & Prathima, 2003). As of March 2004,
51.6% of commercial banks and 48% of public sector banks provide Internet banking
services. Among public sector banks only 15% offer fully transactional Internet banking
service while foreign and private sector banks offer a broad range of service over the
Internet. Internet banking in private and public sectors are less profitable than non-internet
banks (B. Singh & Malhotra, 2004).
The first Internet bank in Japan, the Japan Net bank (JNB) started in 2000 without a
physical branch, offers savings account, term deposit account, mortgages, fund transfers
and insurance. It serves customers in all 50 states and 20 foreign countries. In 2001, Sony,
the electronic giant started Sony bank as a second online bank in Japan. Another bank
named as E*TradeBank has become the world’s largest Internet-only bank with 435, 000
customers and total deposit exceeding 7.7 billion. Till 2002, there were only four online
banks in Japan (Pyun et al., 2002). Since Net bank operates only over the Internet, their
operating cost is much lower than the cost in traditional banks with physical existence. It
offers 20% and 40% interest on ordinary and time deposits accounts, which are twice the
rates that are offered by conventional banks. Further, for transferring fund to other banks,
JNB charges only 26% of fees of traditional banks for amounts up to 30,000 yen
(TrendsinJapan, 2001). The customer base consists of 85% male and 15% female. The age
of online banking users shows that 25% are in their forties, 37% are in their thirties and

Factors influencing the adoption and usage of Internet banking: A New Zealand perspective
23
28% are in their twenties (TrendsinJapan, 2001). All four Japanese online banks face uphill
battles for profitability like USA banks. Researchers (Pyun et al., 2002) estimated that it will
take at least a period of two to three years to secure profitability as more and more younger
generation feel comfortable with Internet banking services and become active Internet
banking users.
In summary, Internet banking is growing rapidly in this region. Highest growth is expected
in India and China where expected users would reach tens of millions by 2005. Due to
huge competitions, banks in many Asian countries are challenged to remain focused on
service online customers rather than servicing offline-banking channel. Japan’s only-
Internet bank found to offer consumer better terms than conventional banks because of
their low operating cost.
2.2.7 Internet banking trend in New Zealand
New Zealand consumers are accustomed to use a safe and secure ‘electronic information
and money transfer systems’ (Chung & Paynter, 2002). They are found to be reluctant in
online purchase compare to USA or European customers (McStay, 2003). The use of the
Internet in New Zealand has been increased at the reduction of charges by the Internet
Service Providers (ISPs) which in turn motivates several financial institutions and Banks in
introducing their Internet banking products into the New Zealand market, such as
Australia and New Zealand Bank (ANZ), Bank of New Zealand (BNZ), ASB Bank,
National Bank of New Zealand (NBZ), WestpacTrust Bank and TSB Bank. Although
Internet penetration and usage has reached to a significant level, still use of Internet
banking services is the lowest amongst all banking facilities in New Zealand (Chung &
Paynter, 2002).
ACNeilsen (2001) indicated that attitude towards online banking have decreased from 32%
in 1998 to 11% in the 2001 due to unpleasant experience of Internet users (McStay, 2003)
but the survey conducted between October and December 2001 by the same organisation
found that the attitude toward online banking have changed significantly and the online
banking population has reached to 480,000, which is a growth of 54%. Almost 50% of
Internet users now bank online once a week or more and over 100,000 users bank online
on a daily basis. The popularity of online banking has overtaken online shopping. Even
64% of non-Internet banking service users are willing to bank online in near future. Figure
2.9 shows that almost 60% of consumers use Internet banking services to view account

Factors influencing the adoption and usage of Internet banking: A New Zealand perspective
24
balances and recent transactions, transfer funds between accounts and paying bills but
while applying for credit cards or home loans, they prefer to visit bank branches
(AcNielsen, 2002a).
Figure 2.9: Service-wise channel preferences of Internet banking in New Zealand
(Source: ACNielsen, 2002)
According to Consumer magazine's annual banking survey, customers expect banks to
offer personal one-to-one service. Further, they are found satisfied with smaller banks
services. While evaluating banks’ performance, PSIS bank, Bank Direct and TSB bank are
the found to be the top three spots for overall performance. Kiwibank, ASB and National
Bank in the fourth spot, BNZ is the next followed by Westpac and ANZ. HSBC is last in
the list, in which customers demand more branches and services such as credit card
(Herald, 2005).
Although banks are denying on the issue of hacking Internet banking systems (Eames,
2005), but media have reported Internet banking scam and security violations in couple of
occasions. A Sunday newspaper, the Star-Times, reported a computer hacker has accessed
private accounts to demonstrate the level of Internet banking security adopted on the part
of New Zealand banks. In another occasion, One News, the television channel, reported
“New Zealanders are having money stolen from their internet banking accounts all the
time and banks need to upgrade their security” (OneNews, 2005). The New Zealand
Herald on March 2005, reported that hundreds of customers of major banks were blocked
from accessing banks’ website (Beston, 2005).

Factors influencing the adoption and usage of Internet banking: A New Zealand perspective
25
McStay’s (2003) report on security policies adopted by five major banks in New Zealand
highlights that ASB offers highest secure environment, followed by Westpac, National
bank and ANZ and the lowest is the BNZ. The author (McStay, 2003) concluded that
banks in New Zealand are yet to reach the levels of security implemented by international
banks.
In short, Internet banking in New Zealand started late as compared to USA and Europe
despite higher Internet diffusion. Internet banking is gaining popularity in recent years but
limited to certain types of services. People generally prefer personalised services and found
satisfied with smaller banks. The researcher of this study found there are very few studies
conducted to examine users’ adoption or usage behaviour of Internet banking services and
therefore the knowledge on factors that have influenced their intention is limited. This has
motivated researcher to carry out this study in this field.
2.3 Chapter summary
It is evident from the extant literature that Internet banking offers many opportunities for
the growth and development for financial institutions that includes additional transaction
revenue by providing link to other services such as insurance and stock brokerage, reduced
customer service cost by converting more transactions to electronic form, acquiring new
customers by providing quality services and continually inventing new products and
services, and retaining customers by customising services. Its usage, till date, mainly
remains with certain types of transactions. At the same time Internet banking has brought
increased competitions from within the sectors and from new entrants coming from
financial service market.
The picture presented by several researchers on the future of Internet banking, has yet to
be materialised in reality due to either low adoption rate or low active users presence.
Researchers recommended banks to understand customers’ requirements and their
financial priorities in order to boost adoption and usage. Further, banks and financial
institutions must design Internet banking as an alternate service distribution channel rather
that the only distribution channels.
Even though Internet banking has not been living up to the hype that surrounded it,
adoption and usage is reported increasing in most of the countries. Due to limited studies,

Factors influencing the adoption and usage of Internet banking: A New Zealand perspective
26
current trend of adoption or usage of Internet banking services is not known for New
Zealand. Therefore following questions arise:
?? Why are users not adopting or using Internet banking services despite its assured
benefits?
?? Do banks provide service of international standard?
?? Do banks communicate key points on security and privacy measure they have
implemented to protect users’ interest
?? Are banks indemnified their responsibilities in the event of unauthorised access to
their customers’ account?
?? Do banks make efforts to understand customers’ requirements on a regular basis or
to create awareness of their products and services (as seen in Malaysia)?
?? Do banks accept lesser fees for external fund transfers (as seen in Australia) or do
they pay higher interest rate for online-only deposit accounts (as seen in Australia
and Japan).
?? Are banks planning to install web-enabled ATMs (as seen in USA)?
Other countries
Adoption or usage trend and other issues Factors affected
USA Canada
2002: 79% of customers use due to convenience of which 82% aged 30-49 years. 71% are using for time saving, 30% for cost savings and 52% for better control 2004: 47% growth since 2002. More usage is in 28-39 and 50-58 age groups, comprises of 50% men and 40% women. Around 40% users having experience over 4 years and 20% having of 2-3 years of experience. 92% use for checking account balances
2005: 56% of users select banks for Internet banking due to quality and reliability of bill payment service. More than 50% would discontinue the service in future. 85% of users are concerned about Security and privacy of Internet banking. 2004: Not much information available. People prefer visiting banks branches (59%). Use of ATMs is 75% of total banking transactions.
User: Security and privacy, time saving, better control, quality and reliability of service Banks: Security, high competition and low customer size
Europe 2001: 17% of Internet users have adopted. Users are reluctant to buy high valued item over the Internet. Convenience, cost-effectiveness and availability motivate customers to bank online 2002: Positive relation between the Internet access and diffusion of Internet banking services except Estonia. 2003: Disparity in adoption across counties in Europe. Correlation between adoption and cost of service, privacy of service and trust on bank. Access to ATMs, use of cashless payment and cash in circulation to GDP are reasons for not using Internet banking. Growth could reach to 80% for Scandinavian countries due to their advancement in banking sector
User: Internet access, cost of service, trust, convenience, availability and prior banking knowledge Banks: High technology investment and customer acquisition cost. Low profitability due to small customer size.
Table.2.1: Country-wise adoption trends and factors influenced adoption or usage

Factors influencing the adoption and usage of Internet banking: A New Zealand perspective
27
Table 2.1: Country-wise adoption trends and factors influenced adoption or usage (cont.) Other countries
Adoption or usage trend and other issues Factors affected
Africa 2002: One study is found. 31% of bank customer bank online of which 59% male and 41% female aged between 25 and 34 years (50%) and about 30% aged between 35 and 44 years age. Security, time taking and cost are found inhabiting customer to adopt or use
User: security, time consuming and cost Banks: Not known
Australia 2003: 31% increases in usage. New registration has fallen over 16% due to security issue 2004: Significant growth in new users. Multiple-access accounts are more used. Users of age 50+ years are adopting more. Active users have grown 6%. High interest rate in online account attracted 89% of users.
User: Security and cost
Banks: No data available
Middle East
2003: Only few banks provide services. Disparity in adoption among countries. Visiting banking is viewed as an opportunity to socialise in their slow pace of lifestyle.
Users: social risk in Internet banking and compatibility Banks: 33% banks have no intention to provide due to lack of customers, high technology coat and non-core area of business
Asia 2001: 63% growth found five countries comprising of 4 million of users. South Korea is leading in number of uses. Additional interest rate has attracted customer to online banking in Japan of which 85% male and 15% female. 2003: 42% growth is experienced in Hong Kong of which 39% female 2004: Many countries have Internet banking users over 1 million. A 300% growth is expected in India and China. Indian banks need to improve quality of service
Users: cost, availability, quality of service Banks: Huge competition
New Zealand
Only one study is found. 2001: Attitude to adopt has decreased 22% since 1998 due to security and privacy issue 2002: 50% prefer online banking for checking balances or fund transfers. 2003: 54% growth reported which is about 50% of Internet users. About 64% of nonusers intend to adopt in near future.
Users: Security and privacy Banks: Not known
With an objective of providing information on the above, this study made an attempt to
identify factors that have influenced customers’ intention to adopt or use Internet banking
services in of New Zealand customers. Table 2.1 presents a summary of adoption and
usage trends of Internet banking across countries in the world along with New Zealand,
which might assist to identify factors influencing adoption or usage of services.
In the next chapter, literature on theories and frameworks from social psychology are
reviewed to identify the suitable framework(s) for this study and also to identify possible
factors that have influenced Internet banking adoptions in other countries. These factors
are further examined with data collected from New Zealand and results are discussed in
later chapters.

Factors influencing the adoption and usage of Internet banking: A New Zealand perspective
28
CCHHAAPPTTEERR 33 TTHHEEOORREETTIICCAALL BBAACCKKGGRROOUUNNDD OOFF IINNTTEERRNNEETT
BBAANNKKIINNGG AADDOOPPTTIIOONN OORR UUSSAAGGEE BBEEHHAAVVIIOOUURR
3.0 Introduction
Within the Internet banking adoption context, researchers have indicated various
determinants or drivers that have had a positive effect on adoption decisions. For example
usefulness, compatibility, self-efficacy, relative advantage, visibility and trialability are
among few. On the contrary, lack of user-friendly technology, high initial set-up costs, high
security and privacy risk, lack of suitable skills, slow rate of adoption and low usage have
been the major factors that have limited banks from widespread implementations of
financial services over the Internet. In chapter 2, we have reviewed actual adoption and
usage against trends projected by market research organisation across countries in the
world.
In addition to the above, we have identified that there is limited information available
either on projected trends or on actual adoption or usage rates for New Zealand’s Internet
banking services and this might be due to limited number of studies carried in this field. To
the best of our knowledge there is only one published study (Chung & Paynter, 2002) that
was carried out in 2002. It was an exploratory study that evaluated the functionalities of
Internet banking services using information from banks’ websites while the effectiveness of
services was judged by collecting information from computer literate university students.
Thus there was almost no study conducted to understand what users and non-users
perceive about Internet banking services and what are the factors that have influenced
users’ intension. This study focuses on individual perspective and proposes to identify
factors that influence adoption and use of Internet banking services in New Zealand. It
does so by drawing upon a number of theories that have achieved popularity in the study
of technology adoption behaviour. This chapter presents a review of literature in these
areas.
Four widely used models or theories are reviewed and discussed in relation to Internet
banking. These are: a) the theory of reasoned action (TRA) proposed by Fishbein and Azjen
(1975) to explain and predict the determinants of intended behaviour of individuals; b) the
theory of planned behaviour (TPB) developed by Ajzen (1991) by adding a perceived behavioural
control construct to TRA; c) diffusion of innovation (DOI) proposed by Rogers (1983) which
identifies factors that are important in the decision to adopt an innovation and d) the

Factors influencing the adoption and usage of Internet banking: A New Zealand perspective
29
technology acceptance model (TAM) proposed by Davis (1989) to address why users adopt or
decline information technology. In the following sections, these theories are reviewed from
prior studies and an attempt is made to identify the most suitable framework(s) for this
study.
3.1 Theory of reasoned action
The theory of reasoned action (TRA) is a widely studied model from social psychology that is
concerned with the determinants of intended behaviour (Ajzen & Fishbein, 1980; Fishbein
& Ajzen, 1975). According to TRA, an individual’s behavioural intention to perform a specific
behaviour is determined by his / her attitude towards performing the behaviour and subjective
norms. Attitude is defined as individual’s negative or positive feelings about performing a
specific behaviour and can be determined by one’s beliefs that performing the behaviour
will lead to various consequences multiplied by the subjective evaluation of those
consequences (Davis et al., 1989). Subjective norms refer to “the person’s perception that most people
who are important to him think he should or should not perform the behaviour in question” (Fishbein &
Ajzen, 1975). In other words, the effect of subjective norms on intention is that an individual
may choose to perform a behaviour, if he / she believes that one or more important
individuals or group think he or she should, even though it may not be favourable to him /
her (Venkatesh & Davis, 2000). Figure 3.1 displays the TRA model, wherein behavioural
intention is a measure of one’s intention to perform a specific behaviour and is the only
antecedent of actual behaviour.
The ability of attitude and subjective norms to predict behavioural intention will differ within the
domain of study. Attitude will be a dominant predictor of behavioural intention over subjective
norms when personal-based influence is stronger in behaviour domain. On the other hand,
subjective norms are a dominant predictor of behavioural intention for behaviour in which
normative implications are strong. For example, attitude is a dominant predictor of
behavioural intention when purchasing something for personal use while subjective norms would
be a dominant predictor when purchasing something for others. Furthermore, subjective
norms can be more important in the early stages of innovation implementation when users
have limited knowledge or experience that forms the attitude (Taylor & Todd, 1995a). Since
TRA is a general theory it does not specify the beliefs that are operative for particular
behaviour. Ajzen and Fishbein (1980) suggested that researchers using TRA must first
identify the beliefs that are silent in the behaviour under investigation.

Factors influencing the adoption and usage of Internet banking: A New Zealand perspective
30
Figure 3.1: Theory of reasoned action model (TRA) (Source: Davis et al,. 1989)
TRA has been successfully applied to predict behaviour and intention in a variety of subject
areas. At the same time, a number of studies have been carried out to understand its
limitations, test hypotheses and analyse extensions, and refinements. In a meta-analysis of
research on TRA, Sheppard, Hartwick and Warshaw (1988) concluded that the predictive
power of TRA is significant across a variety of domains. Despite the strong predictability
of TRA across studies, it becomes problematic as researchers reported mixed results on the
effects of subjective norms on behavioural intention. For example, researchers (Davis et al., 1989;
Mathieson, 1991) found no significant effect of subjective norms on behavioural intention, while
Taylor and Todd (1995a) found the opposite. With a view to identify possible reason(s) for
such difference in outcomes, Hartwick and Barki (1994) separated their sample into
mandatory and voluntary settings and have identified that subjective norms has significant
influence on behavioural intention in mandatory settings but not in voluntary settings. To
overcome the lack of variable in TRA that captures situation specific information, Ajzen
(1991) developed the Theory of Planned Behaviour (TPB) by including an additional
construct namely perceived behavioural control.
3.2 Theory of planned behaviour
The theory of planned behaviour (TPB) refers to an individual’s perception of the presence or
absence of requisite resources or opportunities necessary for performing a specific
behaviour (Ajzen & Madden, 1986). Thus, in TPB, behavioural intention acts as a mediator of
three distal constructs’ effects on actual performance (figure 3.2). Further, these three distal
constructs also mediate the effects of three conceptually distinct sets of beliefs. Perceived
behavioural control mediates the effects of control belief and perceived facilitation. Control belief is
defined as individual’s self-confidence in his or her ability to perform a behaviour, similar
Normative
beliefs and
motivation to
comply
Behavioural
intention
Actual
behaviour
Attitude
towards
behaviour
Subjective
norms
Beliefs and
evaluations

Factors influencing the adoption and usage of Internet banking: A New Zealand perspective
31
to self-efficacy (Bandura, 1977) and perceived facilitation, which is defined as individual’s
assessment of the importance of those resources to the achievement of outcomes (Ajzen &
Madden, 1986). External factors that mediate through attitude and subjective norms are already
discussed in section 3.1.
Figure 3.2: Theory of Planned Behaviour (TPB)
(Source: Ajzen, 1991)
In TPB, Azjen (1991) hypothesised that perceived behavioural control has both an indirect effect
on behaviour through behavioural intention and a direct effect on actual behaviour. In figure 3.2,
the direct path from perceived behavioural control to actual behaviour is hypothesised to represent
the actual control one possesses over a particular behaviour. For example, when people
believe that they have little control over performing the behaviour because of a lack of
requisite resources such as skill, hardware or software knowledge, money, time,
documentation, data and human assistance that are needed to use an information system
(IS) (Mathieson, Peacock, & Chin, 2001), then their intentions to perform the behaviour
may be low even if they have favourable attitude and /or subjective norms concerning
performance of the behaviour (Ajzen, 1991). Similar to TRA, the dominant predictors of
behavioural intention and actual behaviour might vary with the behavioural domain of study.
TPB has been successful in variety of subject areas for predicting the performance of actual
behaviour and behavioural intention.
Normative
beliefs and
motivation to
comply
Behavioural
intention
Actual
behaviour
Attitude
towards
behaviour
Subjective
norms
Beliefs and
evaluations
Perceived
behavioural
control
Control belief
and
perceived
facilities

Factors influencing the adoption and usage of Internet banking: A New Zealand perspective
32
The main difference between TRA and TPB is that the TPB has added an exogenous
variable, perceived behavioural control that has both direct and indirect effect on actual
behaviour through intention. Several researchers claimed that TPB has a better prediction
power of behaviour than TRA (Cheung, Chan, & Wong, 1999; Madden, Ellen, & Ajzen,
1992). We have considered TPB for further comparison with other models because its
similarity with TRA except it has an additional variable and it is found more widely used
than TRA to study technology acceptance and Internet banking adoptions.
3.3 Diffusion of innovation
An innovation is a new concept, object, information technology or system presented to the
targeted audience for adoption. Rogers (1983) developed a diffusion of innovation (DOI)
model to explain how the diffusion of innovations takes place in social systems. According
to DOI theory, individuals collect and synthesise information about an innovation and
compiling this information forms their perceptions about an innovation. Based on these
perceptions, an individual may decide to accept or reject an innovation (Agarwal & Prasad,
1997; Moore & Benbasat, 1991).
Rogers’s (1983) postulated that innovation is more likely to be adopted i) if the relative
advantage (the degree to which an innovation is perceived to be better than idea it
supersedes) of a technology is evident by its introduction, ii) if it is compatible (the degree to
which an innovation is consistent with the existing values) with the individual’s life style or
organisation, iii) if it is not too complex (the degree to which an innovation is hard to
understand and use), iv) if it can be trialled (the degree to which an innovation can be
experimented with) before accepting, and v) if it can be observed (the degree to which the
result of an innovation is visible) prior to adoption (Pease & Rowe, 2004).
However, there is always a high degree of uncertainty in making a decision to adopt an
innovation. According to Rogers (1983) information about innovation flows through
different channels, such as mass-media or interpersonal channels into the social system
where adopters are located. The potential adopters form perceptions about characteristics
of innovations, which influence adoption decision (Agarwal & Prasad, 1998). Knol and
Stroeken (2001) suggested that diffusion is about minimising uncertainty among the
members of social system through communication. Wejnert (2002) claimed that the
process of adoption is not uniform and may differ depending upon the nature of
innovations, the adopters and the environmental context where innovation is placed.

Factors influencing the adoption and usage of Internet banking: A New Zealand perspective
33
Figure 3.3: Adoption of innovation curve
(Source: Rogers, 1983)
The rate of diffusion is measured by the rate of adoption over a period of time.
Researchers observed only a few early adopters, who are active information seekers of new
ideas, have less reliance on others evaluations, have access to resources necessary to adopt
changes, have good formal education, are able to cope with risk and uncertainty, and are
willing to adopt an innovation at an early stage. It has also been observed that when early
adopters begin to communicate to their peers about the innovation, the rate of adoption
increases rapidly, then slows down in a subsequent phase, as only late adopters remain to
accept. The adoption of innovation can be represented by a S-curve graph (figure 3.3).
DOI has been widely used to understand consumers' adoption of various innovations
(Howcroft, Hamilton, & Hewer, 2002; Lee & Lee, 2000; Moore & Benbasat, 1991; Tan &
Teo, 2000).
Moore and Benbasat (1991) extended and refined Rogers (1983) model to develop an
instrument that can be used across a variety of information system / technology innovation
domains and at the same time robust enough to tap a variety of perceptions of innovations.
They retained relative advantage, compatibility and trialability as original, and renamed complexity
as ease of use to be consistent with Davis’s (1989) TAM. Rogers’s (1983) construct
observability was argued to be more generic purpose than specific to information systems
studies. Therefore, Moore and Benbasat (1991) replaced it with two new constructs:
visibility (the degree to which an innovation in visible) and result demonstrability (the degree to
which the result of an innovation is readily apparent to adopters). Further, they added two

Factors influencing the adoption and usage of Internet banking: A New Zealand perspective
34
new constructs: image (the degree to which an individual believes that by adopting a
technology will enhance his or her prestige in the community) and voluntariness (the degree
to which an innovation adoption is perceived to be under adopter’s control).
The extended model passed through rigorous initial testing and claimed to be a reliable
candidate for predicting various information system adoptions. However, the model has
received only little empirical attention with all constructs (Agarwal & Prasad, 1998; Plouffe
et al., 2001). For example, Agarwal and Prasad (1997) found relative advantage, visibility,
compatibility, trialability and result demonstrability, Tan and Teo (2000) found relative advantage,
complexity, compatibility and trialability, Chin and Gopal (1995) found compatibility, Karahanna
et al (1999) claimed voluntariness, Taylor and Todd (1995a) found relative advantage and ease of
use and compatibility, and Chan and Lu (2004) found image and result demonstrability, as
significant predictors of intention to adopt an innovation. Further, from a meta-analysis of
adoption of innovation studies, relative advantage, complexity and compatibility were identified as
consistently related to innovation adoption (Tornatzky & Klein, 1982).
Another study (Lehmann & Markman, 2001) investigated the psychological processes
involved in consumer’s adoption decision and reported that prior product knowledge had a
negative influence on adoption. Explaining the above, the authors(Lehmann & Markman,
2001) argued that experts are likely to have more product-related goals than novices do
and, therefore, if a product does not have relevant characteristics, experts will not accept it
while novices would not mind to adopt. For example, consumers, who have little camera
knowledge but high computer knowledge are found to buy digital cameras whereas those
with high camera and low computer knowledge are less likely to buy a digital camera.
Technology-based consumer innovations such as Internet banking services or e-commerce
represent an innovation where both intangible service and an innovative medium of service
delivery employing high technology are present. In the Internet banking context, although
Tan and Teo (2000) found that relative advantage, compatibility and trialability influence
intention, complexity is found insignificant, which contradicted prior findings (Taylor &
Todd, 1995a). While explaining possible reasons(s) for such deviation, researchers (Tan &
Teo, 2000) stated that since Internet banking is in early stage of implementation at
Singapore, where not many users have tried to use it, the perceived complexity of using
such services was not significant. In another empirical study in Turkey, relative advantage is

Factors influencing the adoption and usage of Internet banking: A New Zealand perspective
35
found to be one of the important factors affecting users’ adoption decisions (Polatoglu &
Ekin, 2001).
3.4 Technology acceptance model
The technology acceptance model (TAM) developed by Davis (1989) was adapted from TRA
(Fishbein & Ajzen, 1975). The objective of TAM is to provide an explanation of users’
acceptance and usage behaviour across a variety of end-user computing technologies
(Davis, 1989; Davis et al., 1989). Among other technology acceptance and diffusion
models, TAM is arguably the approach most widely accepted and used by information
system researchers. The main reason for the TAM’s popularity is perhaps due to its
parsimony, information system-specific nature and empirical support from several studies
(Mathieson et al., 2001; Wang et al., 2003).
TAM postulated that user acceptance of a new technology is determined by their behavioural
intention to use the system, which can be explained jointly by user’s perception about the
technology’s usefulness and attitude towards the technology use (figure 3.4). Attitude is
jointly influenced by two behavioural beliefs, perceived usefulness and perceived ease of use.
Perceived usefulness is defined as the degree to which a person believes that using a particular
system will enhance his or her performance, while the perceived ease of use is defined as the
extent to which a person believes that using a particular system is free of effort. External
variables, such as task, user characteristics, political influence, organisational factors, are
expected to influence technology acceptance behaviour indirectly by affecting perceived
usefulness and perceived ease of use (Szajna, 1996). Further, perceived usefulness is influenced by
perceived ease of use.
Figure 3.4: Technology acceptance model (TAM)
(Source: Davis, 1989)
A significant body of research supports the role of perceived usefulness as a strong factor that
influences user intention and usage behaviour over time (Taylor & Todd, 1995b; Venkatesh

Factors influencing the adoption and usage of Internet banking: A New Zealand perspective
36
& Davis, 1996). Chau (2000) decomposed perceived usefulness into two parts – perceived near-
term usefulness and perceived long-term usefulness and hypothesised that behavioural
intention to use a particular technology is dependent on the above two variables as well as
perceived ease of use. Studying the utilisation of two software packages by 285 subjects, Chau
(2000) found that perceived near-term usefulness had the most significant relation with the
intention to use a technology, followed by perceived long-term usefulness variable. In
January 2000, the Institute for Scientific Information’s Social Sciences Citation Index® listed
424 journal citations of the two journal articles that introduced TAM (Davis, 1989; Davis et
al., 1989), which indicated that TAM has become a well established, robust and
parsimonious model for predicting user adoption of information system. Across many
empirical tests of TAM, perceived usefulness has been found to be the consistent determinant
of usage intentions, with standard regression co-efficient typically around 0.6.
Study Framework Subject and findings
Szajna (1996) TAM Email system: Findings indicated that TAM is a valuable for predicting intention to use electronic mail system.
Laurn and Lin (2004)
Extended TAM Mobile banking: Support was found for an extended version of TAM. Perceived credibility found to have stronger influence on behavioural intention than perceived usefulness and perceived ease of use. Self- efficacy and cost affect behavioural intention significantly.
Wang et al. (2003)
Extended TAM Internet Banking: The results strongly supported modified TAM in predicting the intention of users to adopt Internet banking services. Perceived self-efficacy has significant effect on intention through perceived usefulness, perceived ease of use and perceived credibility
Chan and Lu (2004)
TAM2 and Social cognitive theory
Internet Banking: Findings indicated that subjective norms and self- efficacy play significant role in influencing the behavioural intentions to adopt internet banking services. Effects of perceived usefulness and perceived ease of use on intention found similar to other studies.
Chau and Lai (2003)
Extended TAM Internet Banking: Personalisation, alliance services, task familiarity and accessibility were found to have significant influence to attitude through perceived ease of use and perceived usefulness
Riemenschneider et al (2003)
TAM & TPB Website: Results indicated that combination of TAM and TPB models is a framework in predicting website adoption. Social contact facilitated by Internet found to be influencing factor for website adoption
Shih (2004) Extended TAM e-shopping: Both perceived usefulness and perceived ease of use significantly influence attitude towards e-shopping. User satisfaction and perception of information system and service affect user acceptance.
Lederer et al (2000)
TAM WWW: Findings supported TAM. Ease of understanding and ease of finding were antecedent to perceived ease of use and information quality predicted perceived usefulness
Gefen & Straub (1997)
Extended TAM e-mail: Results indicated that men and women differ in their perceptions about email. Recommended gender to included in information technology diffusion model
Klopping and McKinney (2004)
TAM and Task technology fit (TTF)
e-commerce: The study found strong support for applying modified TAM in e-commerce. Perceived usefulness is found to be more dominant predictor than perceived ease of use
Chau (2000) Extended TAM Internet: The study found strong support for applying modified TAM in Internet use.Perceived near-term usefulness found to be more dominant to influence intention than perceived long-term usefulness
Teo et al.(1999) Extended TAM Internet: Perceived enjoyment is found to have significant influence on actual use apart from TAM’s fundamental variables i.e. perceived usefulness and perceived ease of use
Table 3.1: Summary of prior studies used TAM

Factors influencing the adoption and usage of Internet banking: A New Zealand perspective
37
In contrast, the role of perceived ease of use in TAM has been reported differently in prior
studies. Gefen and Straub (2000) argued that the role of perceived ease of use is more complex
than reported in prior research. They expressed that perceived ease of use deals with the
motivation that is based on the assessment of ease of use and ease of learning of the interfaces
and the process involved in using it, which they refer as intrinsic aspect of information
technology. Since most studies captured extrinsic aspect of information technology, perceived
ease of use is therefore often found not to affect information technology adoption. Chau
(2000) suggested that learning to use a technology is much easier now than in the past and
thereby influence of perceived ease of use on adoption is not significant in many studies.
The results from various studies indicated that TAM does not consistently explain more
than 40% of system use except those where subjects of studies are students, which is
comparatively a simpler environment (Legris, Ingham, & Collerette, 2003) and students
tend to support the view of researchers (Agarwal & Prasad, 1997; Chau & Lai, 2003; Gefen
& Straub, 1997; Klopping & McKinney, 2004; Luarn & Lin, 2004; Wang et al., 2003). In
order to enhance TAM’s predictability, researchers extended TAM with different factors
but mixed results are reported. Studies used TAM in Internet related studies are
summarised in table 3.1. These studies are recent and are using following criteria:
?? TAM or an extended TAM is used in an empirical study
?? Study focuses on the adoption / continual use of online services for
example email, e-shopping, Internet banking, mobile banking and related
examples.
?? Research results are available and complete.
Of the twelve studies summarised in table 3.1, ten studies suggested for additional variables
to explain variances in intention, apart from TAM’s fundamental variables. Several studies
(Luarn & Lin, 2004; Wang et al., 2003) found perceived credibility has stronger influence on
intention than perceived usefulness and perceived ease of use in Internet banking and mobile
banking context. Among other variables that are reported influenced intention in prior
studies, self-efficacy (Chan & Lu, 2004; Wang et al., 2003), perceived cost (Luarn & Lin, 2004),
social contact (Riemenschneider, Harrison, & Mykytyn, 2003) and gender (Lederer, Mauphin,
Sena, & Zhuang, 2000) perceived enjoyment (Teo, Lim, & Lai, 1999) are few of them.

Factors influencing the adoption and usage of Internet banking: A New Zealand perspective
38
We have, so far, reviewed four frameworks that are commonly used in social psychology
studies in identifying factors that influence user’s behavioural intention in adopting or
rejecting a new technology or innovation. In the next few sections, these frameworks are
compared to identify the most suitable framework(s) for this study.
3.5 Comparison of theories / models
In this section, TPB, DOI and TAM are compared with a view to establish justifications in
favour of theory / model that are theoretically as well as empirically tested and found to
have better prediction power in understanding users’ intentions towards adoptions and
continual usage of Internet banking services. As mentioned in section 3.2 TRA is not
considered for further comparison with other theories or models.
3.5.1 Comparison of TPB and TAM
TPB is general theory of human behaviour while TAM is developed to predict information
system/technology usage. TAM assumes that perceived usefulness and perceived ease of use are
always the determinants to predict the users’ behavioural intentions of information system
use, whereas TPB assumes those users’ beliefs are situation specific and cannot be
generalised across situations. In particular, it requires the development of instruments for
almost every study (Mathieson et al., 2001). This provides TPB with an additional
advantage of capturing situation specific variables, which is not present in TAM since
perceived usefulness and perceived ease of use are the two primary determinants of user’s decision.
In the case of TPB, a pilot study is required to identify relevant outcomes, control variables
in every context it is used, whereas TAM’s constructs are measured in the same way in
every study. The main reason for the TAM’s popularity is perhaps due to its parsimony but
Venkatesh (2000) suggested that parsimony is both a strength and a limitation of TAM.
TAM provides predictive information but does not provide sufficient information that
helps designers with the information required to create acceptances for a new system
(Mathieson, 1991). Furthermore, TAM does not explicitly include any social variables.
Davis et al. (1989) argued that social norms are not independent of outcomes and omitted
them from the original TAM. However, they did acknowledge the need for additional
research to “investigate the conditions and mechanisms governing the impact of social influences on usage
behaviour” (Davis et al, 1989, p.999).
Several studies have extended TAM by adding subjective norms in order to examine the effect
of subjective norms on intentions but have produced mixed results so far. Mathieson (1991)

Factors influencing the adoption and usage of Internet banking: A New Zealand perspective
39
found subjective norms has no significant effect on intention while Taylor and Todd (1995a)
has reported significant. Further, Hartwick and Barki (1994) found its effects under
mandatory settings and does not influence in voluntary settings, which is supported by
Venkatesh and Davis (2000). This lead researchers (Taylor & Todd, 1995a) to conclude
that social effects might be complex and might affect decisions only in some situations. For
example, people get motivated by thinking that their friends or co-workers will perceive
them as technology sophisticated and start using technology. This motivation is more likely
to be captured by TPB than by TAM. In the Internet banking context, subjective norms have
been found to have no or little influence on intention (Liao, Shao, Wang, & Chen, 1999;
Tan & Teo, 2000). Tan and Teo (2000) suggested that this might be due to the fact that a
potential adopter can get relevant information that is readily available from banks, reducing
the dependency of potential adopters on others.
Another major difference between TAM and TPB is in addressing behavioural control.
TAM has only one such variable i.e. perceived ease of use, which according to Davis (1989)
refers to user’s capabilities and the skills required to use the system. This is similar to the
internal control factors defined by Azjen (1985). External control factors include time,
opportunity, resources and the co-operations of others (Ajzen, 1985) can be argued that
perceived ease of use has addressed those but it is not explicit. Moreover, in a situation where
internal control factors vary from those in another situation, TAM’s constructs would not be
able to address those situation specific internal control factors. For example, studies have
confirmed that self-efficacy, which refers to an individual’s belief in his or her capability to
perform a specific task (Bandura, 1977), plays a significant role in understanding users’
intentions toward adoption and usage of information system. Perceived ease of use does not
have items that capture information on self-efficacy. On the other hand, TPB captures
variables for each situation and is more likely to tap such factors.
In summary, TAM is information system-specific while TPB is not. TPB requires unique
operationalisation in each situation in which it is used (Mathieson et al., 2001), suggesting
development of customised instruments for behavioural beliefs, normative beliefs and
control beliefs, while TAM is a general model and is robust across time, setting,
populations and technologies (Davis et al., 1989; Venkatesh, 2000) and its instrument is
psychometrically sound. TAM is more parsimonious than TPB, and is easier to apply in
practice, giving TAM an empirical advantage over TPB (Mathieson, 1991). Finally, TAM is

Factors influencing the adoption and usage of Internet banking: A New Zealand perspective
40
superior to TPB in explaining behavioural intention to adopt or use information systems
(Luarn & Lin, 2004).
Some consideration was also given to a decomposed TPB, which integrates TPB with
TAM to make it more information system specific and was found to have better prediction
capabilities than TAM. But considering the increase in model complexity as against the
small increase in predictive power as reported in earlier studies (Chau & Hu, 2001; Taylor
& Todd, 1995a), decomposed TPB is not considered for this study.
The other approach is to extend TAM to include necessary constructs from TPB so that
the extended model retains underlying simplicity of TAM while improving its ability to
predict behavioural intention and explain information system usage. Riemenschneider et al
(2003) argued that hybrid model (combination of TAM and TPB) offers a richer
explanation of the determinants of adoption decision. In attempts to extend TAM with
constructs from TPB, subjective norms is dropped since its effect on behavioural intention is
inconclusive in prior studies, it was excluded by Davis (1989) due to theoretical and
measurement problem (Venkatesh & Morris, 2000), and subjective norms will not have effects
on behavioural intention if Internet banking services adoption is considered to be voluntary
(Venkatesh & Davis, 2000). Further, individuals are unlikely to have any influence on
potential adopters of Internet banking, since relevant information is readily available from
the banks. Also, it is presumes that there is lack of experienced and knowledgeable users
around who could influence potential adopters since body of knowledge on Internet
banking in New Zealand is limited due limited research in this field. Among the other
constructs of TPB, attitude also dropped due to reasons discussed in section 3.7.
This leaves attempts to extend TAM with perceived behavioural control. In most of the studies
that attempted this, it decreases the parsimony of their models. For example, Mathieson et
al.(2001), with an objective to identify how technology and resources influence information
system usage, added a construct perceived resources to TAM. Perceived resources is defined by
them as the extent to which a user beliefs that he or she has the both personal and
organisational resources needed to use an information system. Mathieson et al.(2001)
considered perceived resources as a subset of perceived behavioural control and operationalised it so
as to be compatible with TAM. Researchers (Mathieson et al., 2001) found that resources
such as data, documentation and assistance of others do not influence users’ acceptance.
Moreover, if an individual has the necessary resources such as hardware, software, and time

Factors influencing the adoption and usage of Internet banking: A New Zealand perspective
41
and so on, perceived usefulness and perceived ease of use should adequately explain information
system usage, indicating the extended model is less parsimonious than the TAM. As the
technological infrastructure supporting Internet banking becomes cheaper, it will become
easily and readily available (Goh, 1995). As a result, the resources barrier for Internet
banking adoption will be minimised and thereby ‘perceived resources’ is not considered in this
study.
3.5.2 Comparison of TAM and DOI
Both TAM and DOI are concerned with individuals’ perceptions about innovation
characteristics, which influence the acceptance behaviour. TAM, TRA, TPB and DOI have
different conceptualisations of perceptions. For example, TAM includes two perceptions,
TRA and TPB recommend beliefs need to be elicited from target users and could be
different for each innovation (Agarwal & Prasad, 1997), while DOI posits five perceived
characteristics of an innovation affect adoption behaviour (Rogers, 1983). Although both
TAM and DOI focus on usage as the primary outcome of adoption process, DOI has gone
beyond in explaining various types of usage such as initial usage and continual usage
(Rogers, 1983). As mentioned earlier, TAM has been the most widely studied model in
users’ technology acceptance field and both the constructs; perceived usefulness and perceived
ease of use are empirically tested and found consistent. In comparison, most of the studies on
DOI have found only few constructs are consistently related to adoption behaviour
(Agarwal & Prasad, 1998; Taylor & Todd, 1995a).
Plouffe et al. (2001) claimed that DOI’s constructs explain a higher proportion of the
variance than TAM when they are used as antecedents to adoption intention. Although,
TAM is more parsimonious than DOI, it places relatively lower strains on respondents and
researchers. But reliance on TAM can at times misleading (Plouffe et al., 2001). For
example, one could conclude from prior studies that perceived usefulness plays a key role in
explaining intention while others might emphasis the importance of perceived ease of use. In
DOI, although relative advantage has a significant importance, its other constructs are found
to be equally important. Researchers (Plouffe et al., 2001) commented that TAM’s
parsimony can be traded-off by adding richer set of constructs that enhances the prediction
ability of the model.
Motivated by the conceptual similarity of TAM and DOI on technology acceptance
behaviour and that the set of constructs used in TAM is in many ways similar to some of

Factors influencing the adoption and usage of Internet banking: A New Zealand perspective
42
the constructs of DOI, this study proposes to apply both TAM and DOI models to
identify factors that influence Internet banking adoption and usage in New Zealand.
3.6 Research models and hypotheses
In the following sections prior studies using TAM and DOI in the adoption of information
system/technology and Internet banking services contexts are used to develop two
research models. The first model takes the original TAM and attempts to include additional
factors that have been empirically tested and found to influence on intention in order to
enhance the prediction capabilities of TAM. The second research model is based on the
extended DOI approach proposed by Moore and Benbasat (1991), and adapted to the
Internet banking context.
3.6.1 Research model 1
Most of the initial studies using TAM have been conducted on the adoption and usage of
relatively simple information system/technology, such as word processing, personal
computers and spreadsheet software. In these studies, TAM was generally found to be
valid in predicting user acceptance of the various systems. However, in more complex
domains, as mention before, TAM’s original constructs do not fully explain behavioural
intentions toward adoption and use of information system, necessitating a search for
additional factors that can enhance prediction power of the model. As Davis (1989)
suggested, future technology acceptance research must look for other variables that
influence perceived usefulness and perceived ease of use and user acceptance.
In addition to studies mention in table 3.1, several studies (Agarwal & Prasad, 1997;
Karahanna & Straub, 1999; Venkatesh & Davis, 2000; Venkatesh & Morris, 2000) have
attempted to extend TAM with different variables and had observed that addition of such
variables increases the prediction of system usage. But results are inconclusive in terms of
increase in model’s capability in explaining the variances in intention since studies found
both significant (Luarn & Lin, 2004; Mathieson, 1991) and marginal increase (Chau & Hu,
2001; Mathieson et al., 2001) in prediction power.
Considering the importance of the construct perceived behavioural control of TPB in explaining
Internet banking usage as expressed in prior studies, the current study proposes to extend
TAM by adding an internal control factor, perceived self efficacy (Luarn & Lin, 2004). Further,
perceived risk is added to the model since it is a widely recognised obstacle to the adoption of

Factors influencing the adoption and usage of Internet banking: A New Zealand perspective
43
Internet-related applications in prior studies. The security and privacy issues are found to
be significant concern for users while conducting commercial transactions over the
Internet (discussed in chapter2).
Figure 3.5: Research model 1 (extended TAM)
Recent studies that have used TAM as a theoretical framework have suggested to exclude
attitude construct from the model since it does not arbitrate fully the effect of perceived
usefulness and perceived ease of use on behavioural intention as originally anticipated (Koufaris,
2002; Venkatesh, 1999). Originally, Davis (1989) found a weak link between perceived
usefulness and attitude, but a strong link between perceived usefulness and behavioural intention,
therefore dropped attitude from the final model. The revised model of TAM has two
versions: pre and post implementation. Davis et al (1989) expressed that in both the phases
of implementations, individuals would depend more on perceived usefulness and perceived ease of
use to form intentions which predicts acceptance behaviour. The modified TAM has been
tested in several users’ technology adoption / continual usage investigations (Luarn & Lin,
2004; Venkatesh, 1999; Venkatesh & Davis, 2000; Venkatesh & Morris, 2000; Venkatesh,
Morris, Davis, & Davis, 2003), and has consistently done well in predicting users’
intentions. On the other hand, attitude has found to mediate the effect of perceived usefulness
and perceived ease of use (Davis et al., 1989; Mathieson, 1991; Taylor & Todd, 1995a, 1995b).
In a meta-analysis of prior studies on TAM, Legris et al. (2003) observed that only 3 out of
Perceived
self-efficacy
Perceived
ease of use
Perceived
risk
Perceived
usefulness
Intention
Actual use

Factors influencing the adoption and usage of Internet banking: A New Zealand perspective
44
22 studies have included attitude. For these reasons, attitude has not been considered in this
study. Research model 1 is shown in figure 3.5.
3.6.1.1 Perceived ease of use
A significant number of studies suggested that perceived ease of use influences intention both
directly or indirectly via its impact on perceived usefulness (Agarwal & Prasad, 1997; Davis et
al., 1989; Venkatesh, 1999; Venkatesh & Davis, 2000). The direct path indicates that
perceived ease of use motivates user acceptances when the system is easy to learn and use. The
indirect effect is explained as stemming from a situation, where other things being equal,
the less effort needed to use a system, the more system’s usefulness will be perceived by
users. In other words, the system that is easier to use will facilitate more system use and
task accomplishment than systems that are hard to use (Venkatesh & Morris, 2000).
Prior studies have shown that while the direct effects of perceived ease of use remain important
over the time, the indirect effect of perceived ease of use becomes stronger (Venkatesh &
Morris, 2000). In the Internet banking context it is presumed that the system must be easy
to learn and use for potential adopters otherwise they might refrain from adopting or using
of Internet banking. The indirect effect of perceived ease of use through perceived usefulness will
be more significant for existing users of Internet banking services as experience with the
target system increases. Thus the following hypotheses are proposed:
H1a: Perceived ease of use will have a positive effect on the behavioural intention to use Internet banking.
H1b: Perceived ease of use will have a positive effect on the perceived usefulness of Internet banking.
3.6.1.2 Perceived usefulness
A significant number of studies have shown that perceived usefulness is an important
antecedent to behavioural intention to adopt and use technology (Davis et al., 1989;
Venkatesh, 1999, 2000; Venkatesh & Davis, 2000). In these studies, researchers provided
support for Davis et al.’s (1989) argument that in a real work environment, behavioral
intentions are based primarily on performance-related elements, rather than on the
individual’s attitude towards the behavior.
In the Internet banking context, it is presumed that the level of usefulness that Internet
banking offers over and above regular banking methods could affect intentions towards
adoption and usage. For example, individuals who find it difficult to visit to the bank

Factors influencing the adoption and usage of Internet banking: A New Zealand perspective
45
would perceive the possibility of performing transactions at any time of the day from any
location useful. Therefore the following hypothesis is tested:
H2: Perceived usefulness will have a positive effect on the behavioural intention to use Internet banking.
3.6.1.3 Perceived self-efficacy
Control is a construct that has been shown to have an effect on intention and usage in a
variety of domains. It relates to one’s behaviour through the availability of knowledge,
opportunities and resources required to perform the specific behaviour. The role of control
was not explicitly incorporated in the TAM. Rather, it was assumed that there are no
barriers in technology acceptance and thereby the effect of control on intention over and
above of perceived usefulness and perceived ease of use is not known (Venkatesh, 2000). In
information system research control is viewed as a one-dimensional structure that includes
self-efficacy, technology facilitating conditions and resource facilitating conditions (Venkatesh,
2000). Azjen (1985) defined controls as internal and external constraining factors. Internal
control relates to self-efficacy while external control relates to environment. Despite the
controversy of conceptualisation of control, empirical results confirm that both internal
and external control play an important role in shaping intention and behaviour across a
variety of domains (Venkatesh, 2000).
Further, the social cognitive theory of self-efficacy (Bandura, 1977) has been used in
understanding human behaviour and performance in a wide range of activities. Bandura
(1977) defined self-efficacy as one’s belief or judgement on what he or she can do with the
skill he or she possess within a particular domain. Self-efficacy beliefs or judgement differ on
three interrelated dimensions: generalisability, magnitude and strength. Generalisability
shows that the degree to which one’s belief is limited to a specific domain of the activity or
not (Chan & Lu, 2004). Within a computing context these skills might be what users can
do with such skills, such as using software to analyse data (Compeau & Higgins, 1995).
Thus individuals with high generalisability are expected to be able to confidently use
different computer systems and software packages. The magnitude refers to the level of
capability expected. Thus, individuals with high (self-efficacy) magnitude perceive themselves
competent to accomplish more difficult tasks with minimum support and assistance as
those with lower magnitude of self-efficacy. The strength of self-efficacy refers to the confidence
an individual has on his/her ability to perform tasks as mentioned earlier. Researchers
(Wang et al., 2003) suggested that individuals with high computer self-efficacy are expected to
be able to use computer systems more regularly because they feel “comfortable” about
computers, than those with low strength of self-efficacy. Venkatesh and Davis (1996)

Factors influencing the adoption and usage of Internet banking: A New Zealand perspective
46
suggested that many systems fail due to usability issues where a key element of the problem
could be users with ‘low self-efficacy’. In other words, users with high self-efficacy not only
perceive themselves as able to accomplish difficult tasks but also display confidence about
their ability to successfully perform tasks.
Chan and Lu (2004) suggested that self-efficacy is formed through a gradual and dynamic
weighing, integration and evaluation of complex cognitive, linguistic, social experiences.
Compeau and Higgins (1995) found self-efficacy as a mediator between environmental
variables, outcome expectations and usage, which in turn enhances outcome expectations
(Eastin & LaRose, 2000). Several studies have found evidence of the relationship between
self-efficacy and the adoption of technology. Venkatesh and Davis (1996) have identified that
computer self-efficacy plays a role as an antecedent of perceived ease of use. The authors
explained when users do not have experience on information system, their confidence in
computer related abilities and knowledge can be expected to serve as the basis for his or
her judgement about how easy or difficult a new system will be to use. This is empirically
supported by other researchers (Agarwal, Sambamurthy, & Stair, 2000; Chan & Lu, 2004;
Chau & Lai, 2003; Hong, Thong, Wong, & Tam, 2001; Hsu & Chiu, 2004; Igbaria & Iivari,
1995; Venkatesh, 2000; Venkatesh & Davis, 1996).
Further, Mathieson et al. (2001) found perceived resources, which can be viewed as a subset of
construct perceived behavioural control, influences behavioural intention. Since perceived
behavioural control is most compatible with self-efficacy (Ajzen & Madden, 1986), therefore, self-
efficacy can considered a factor that influences behavioural intention. Prior studies (Compeau &
Higgins, 1995; Compeau et al., 1999; Igbaria & Iivari, 1995) expressed that self-efficacy has
positive effect on decisions involving computer adoption and usage and also on perceived
usefulness (Lopez & Manson, 1997). Igbaria and Iivari (1995) claimed that computer self-
efficacy affects one’s computer anxiety, which in turn influences perceived ease of use and
perceived usefulness. Another empirical study (Eastin, 2002) proposed that task-specific self-
efficacy to be considered as a new variable in the adoption process which is supported by
other researchers stating that task-specific self-efficacy has significant effect on online search
performance (L. Thompson, Foster, Meriac, & Cope, 2002) and software usage (Agarwal et
al., 2000).
In the Internet banking context, self-efficacy is treated as one’s confidence in having the
knowledge and skill in using the computer and the Internet to carryout banking

Factors influencing the adoption and usage of Internet banking: A New Zealand perspective
47
transactions over the Internet. Luarn and Lin (2004) found that self-efficacy has a significant
positive influence on behavioural intention to use mobile banking. Chan and Lu (2004) and
Wang et al. (2003) found self-efficacy indirectly influences intention through perceived usefulness,
perceived ease of use and perceived credibility in the Internet banking context. Perceived credibility is
used as a variable to capture users’ security and privacy risk in the acceptance of Internet
banking (Wang et al., 2003). In order to enhance customers’ self-efficacy researchers
recommended banks’ managers arrange familiarity sessions for mobile banking (Luarn &
Lin, 2004) and Internet banking (Chan & Lu, 2004; Wang et al., 2003), which might
enhance adoptions of services.
Based on above literature review it is found that self-efficacy influences behavioural intention
of Internet banking adoption and usage directly or indirectly through perceived ease of use or
perceived usefulness or perceived risk. Therefore, self-efficacy is tested as follows:
H3a: Perceived self-efficacy will have a positive effect on behavioural intention to use Internet banking.
H3b: Perceived self-efficacy will have a positive effect on the perceived ease of use of Internet banking.
H3c: Perceived self-efficacy will have a positive effect on the perceived usefulness of Internet banking.
H3d: Perceived self-efficacy will have a negative effect on the perceived risk of Internet banking.
3.6.1.4 Perceived risk
The role of perceived risk has been investigated widely in the business arena in understanding
consumers’ intended and actual purchase behaviour. Perceived risk has been conceptualised
in the extant literature in various ways. Moreover, risk level associated with certain
dimensions might get elevated under a specific context. Although studies showed perceived
risk as an important factor that influences online shopping(Doolin, Dillon, Thompson, &
Corner, 2005; Jarvenpaa & Todd, 1997; Stewart, 1999), still limited work has been carried
to identify risk dimensions in this context(Cases, 2002).
Wong and Chang (2005) argued that perceived risk usually arises from the uncertainty that
customers face when they cannot foresee the consequences of their purchase decisions. In
an e-shopping context, this uncertainty regarding the value of services, the technological
unpredictability of the Internet that reduces consumer perceptions of control over their
transactions, and the impersonal nature of online transactions, drive consumers’ beliefs
about the risk associated with the purchase process (Pavlou, 2001). Consumers’ purchasing
behaviours or speed of adoption gets influenced by risks that they perceive as against their

Factors influencing the adoption and usage of Internet banking: A New Zealand perspective
48
own tolerance of risk (Bhatnagar, Misra, & Rao, 2000; Chan & Lu, 2004; Lim, 2003). It
should be stressed that users are influenced only by their perception of risk, whether or not
such risk actually exists. In a study on online shopping, authors (Bhatnagar et al., 2000)
found that consumers patronising the Internet are those who perceive the risk associated
with shopping on the Internet as low or find that the relative advantages of buying over the
Internet channel are high. Four sources of risk in the e-shopping context, comprising eight
dimensions, are summarised in table 3.2.
Measuring the dimensions of risk, Wong and Chang (2005) found that confidentiality and
security associated with Internet transactions are the major risks, while social risk incurred
appears to be the lowest. In another study, performance risk is found to be the prime
determinant of adoption of e-services (Featherman, 2002). According to Bhatnagar et al.
(2000), consumers are more concerned about losing credit card details and/or not receiving
the right product rather than the monetary amount involved in the transactions. However,
several studies have reported consumers’ apprehension of financial risk associated with
purchasing items over the Internet.
Source of risk Risk dimension Description
Product Performance risk Dissatisfaction of the consumer in relation to expectations concerning
product quality Remote transaction Time risk
Financial risk Delivery risk
Time spent for purchasing includes a bad purchase Loss of money in bad purchase or purchase of a item can end up being higher than expected Fear of not receiving the product on time or long waiting period
Internet Social risk Privacy risk Payment risk
Use of the Internet for purchase item may cause disagreement with other family members or friends Personal information might be used for other purposes Fear of giving credit card number to others
Website Source risk Fear of credibility and reliability of website and web-service provider Table 3.2: Risk source and dimension in electronic shopping context
(Source: adapted from Cases, 2002)
In Internet banking services, perceived risk may be associated with the financial product itself
as well as with the electronic delivery channel. Importance must be given to this attribute
while examining consumers’ adoption behaviour (Harrison, 2000). Authors (Polatoglu &
Ekin, 2001; Sathye, 1999; Tan & Teo, 2000) found that perceived risk is one of the major
factors affecting user adoption of Internet banking. Chan and Lu (2004) added that risk
perception hinders adoption for potential customers more than for existing customers of
Internet banking services. Wong and Chan (2005) claimed that more experienced Internet
users are likely to involve themselves in Internet banking services than those less-
experienced, as adoption is affected by the perceived risks and familiarity with the Internet

Factors influencing the adoption and usage of Internet banking: A New Zealand perspective
49
technology. For example, in Thailand, non-Internet banking customers have greater levels
of worry about the risk involved in carrying out financial transactions over Internet and
prefer to receive services from the bank directly (Rotchanakitumunai & Speece, 2003). In
an empirical study on the adoption of Internet banking in Finland, Mattila, Karjaluoto and
Pento (2003) found that customers over 65 years of age are more concerned about risk
involvement of Internet banking services and, therefore, are the late adopters of Internet
banking services. Kim and Prabhakar (2000) suggested that the balance between willing to
take risk and perceived risk influences the adoption of Internet banking. If the level of
willingness to take risk exceeds the level of perceived risk, consumers generally adopt Internet
banking services.
From the literature review it is evident that many consumers believe carrying out financial
transactions over the Internet is a risky undertaking. Their concerns are about the reliability
of the Internet and related infrastructure, as well as the spatial and temporal separation
among users and bank personnel. Consequently, the lower the perception of risks involved
in using Internet banking the more likely an individual would be prepared to use it. Thus
the following hypothesis is formulated:
H4: Perceived risk will have a negative effect on the behavioural intention to use Internet banking.
3.6.1.5 Actual use
In prior studies intention to use is found to be a predictor of actual use. Therefore, actual use
has been used as a dependent variable in several studies (Agarwal & Prasad, 1997; Davis,
1989). In Internet banking context it is presumed that an individual with positive intension
to adopt or use will use Internet banking services more frequently. In other words, positive
intention will increase the number of times the services is being used within a period of
time. Thus the following hypotheses are tested:
H5a: Perceived behavioural intention will have a positive effect on the frequency of Internet banking use
H5b: Perceived behavioural intention will have a positive effect on the number of times of Internet banking
use
3.6.2 Research model 2
Research model 2 uses extended DOI model proposed by Moore and Benbasat (1991). As
noted earlier, this model replaced Rogers’ (1983) complexity factor with ease of use, and

Factors influencing the adoption and usage of Internet banking: A New Zealand perspective
50
observability with the two constructs visibility and result demonstrability. However, the new
constructs, image and voluntariness, added by Moore and Benbasat (1991) are not used for
this study since Image is considered to be of low relevance to Internet banking, which is
typically conducted in private by an individual. Similarly, as this study if focusing on the
adoption or use of Internet banking by individuals in non-organisational contexts,
voluntariness as proposed by Moore and Benbasat (1991) is not considered to be relevant.
Research model 2 is shown in figure 3.6.
Figure 3.6: Research model 2 (modified PCI)
3.6.2.1 Relative advantage
Relative advantage is often referred to in terms of convenience, savings of time and effort,
and decrease of discomfort in adopting or using an innovation. It is domain and
environment specific (Rogers, 1983). With respect to Internet banking, consumers may
perceive a relative advantage over branch banking in accessing accounts from any location
and at any time of the day, and in facilitating greater control and flexibility in managing
their accounts. Several empirical studies (Kolodinsky & Hogarth, 2001; Polatoglu & Ekin,
2001; Tan & Teo, 2000) on Internet banking have reported relative advantage as one of the
key determinants that influences consumers’ adoption decisions. However, Agarwal and
Prasad (1997) found a lack of significance of relative advantage in predicting the usage of
Relative
advantage
Ease of use
Trialability
Visibility
Intention Actual
use
Compatibility
Results
demonstrabili
ty

Factors influencing the adoption and usage of Internet banking: A New Zealand perspective
51
WWW. They suggested that adopters get curious about the innovation due to its high
visibility, putting the innovation into initial use, irrespective of any benefits it might offer.
In the light of advantages that Internet banking services offer and a review of extant
literature, it is presumed that an individual, who perceives Internet banking as
advantageous over branch banking, would be likely to adopt the service. Therefore the
following hypothesis is tested:
H6: Perceived relative advantage will have a positive effect on the behavioural intention to use Internet
banking
3.6.2.2 Compatibility
According to researchers (Agarwal & Prasad, 1998; Tornatzky & Klein, 1982) an
innovation is more likely to be adopted when individuals find it compatible with their past
experience, beliefs and the way they are accustomed to work. In the Internet banking
context, compatibility can be viewed as how well does the service fit with the way consumers
manage their finances and how does it suits their lifestyle or current situations. Studies
(Agarwal & Prasad, 1997; Kolodinsky & Hogarth, 2001; Tan & Teo, 2000) on e-commerce
and Internet banking have reported positive influence of compatibility on intention to adopt.
It is expected that people perceive Internet banking services more compatible to their
lifestyle, they will more likely to adopt (Tan & Teo, 2000). Thus the following hypothesis is
tested:
H7: Perceived compatibility will have a positive effect on the behavioural intention to use Internet banking
3.6.2.3 Ease of use
In studies based on DOI, complexity or ease of use is found to be an important factor affecting
users’ intentions. Again, an exception was the study by (Agarwal & Prasad, 1997), where
ease of use was not found to be significant due to high visibility of Internet technology.
Ease of use is hypothesised in the same way as in Research model 1 (see Hypothesis 1a).
3.6.2.4 Trialability
According to Rogers (1983), consumers might adopt an innovation if they are given the
opportunity to trial the innovation because it provides a means for potential adopters to
reduce the uncertainty of outcomes they feel toward an unfamiliar technology. Tan and

Factors influencing the adoption and usage of Internet banking: A New Zealand perspective
52
Teo (2000) and Agarwal and Prasad (1997) suggested that by trying out a technology, users
feel more comfortable with the innovation and are more likely to adopt it.
In Internet banking, trialability can be viewed as the ability to access accounts and carry out
banking transactions before setting up one’s own system, preferably at bank premises
where bank personnel will be available to demonstrate how it works, what it can do and
also to provide assistance, if required. This will minimise potential adopters’ fears about
Internet banking services and motivate them to adopt it. Thus the following hypothesis is
tested:
H8: Perceived trialability will have a positive effect on the behavioural intention to adopt Internet banking.
3.6.2.5 Observability
Rogers (1983) argued that more easily individuals could observe the positive effects of an
innovation, the greater its chance to accept. The original construct was complex and has
been redefined into two constructs by Moore and Benbasat (1991). Those are visibility and
result demonstrability.
In the Internet banking context, visibility can be viewed as the coverage of Internet banking
in public media such as newspapers, television or the Internet. Through such exposure,
consumers could gain knowledge about Internet banking services and its benefits. If this
knowledge and benefits can be shared with peers, adoption may be facilitated. Thus it is
presumed that the visibility and result demonstrability of Internet banking services will
influence potential adopters positively. The following hypotheses are tested:
H9: Perceived visibility will have a positive effect on the behavioural intention to adopt Internet banking.
H10: Perceived result demonstrability will have a positive effect on the behavioural intention to adopt
Internet banking.
3.6.2.6 Actual use
Studies based on PCI presumed that intention have positive effect on actual use. In internet
banking context intention is assumed to have positive influence on actual use and therefore
hypotheses H5a and H5b are formulated (see section 3.7.1.5) for testing in this study.

Factors influencing the adoption and usage of Internet banking: A New Zealand perspective
53
3.7 Chapter summary
In this chapter, factors that influence behavioural intention towards adopting and using of
Internet banking are discussed. Despite divergences in hypothesised relationships, a
common theme underlying the various streams of research in technology adoption is the
inclusion of perceptions of an information technology as key independent variables. Four
widely used theories or models that have been used in technology adoption and diffusion
studies are reviewed. Among these models, TAM is selected for this study because of its
wide acceptance in information system/technology acceptance studies. In the Internet
banking context, two additional factors that might influence adoption intention have been
identified from prior studies and included to extend TAM as one of two research models.
The second research model is PCI, which an extension diffusion of innovation (DOI)
model and is considered for this study due to its similarity with TAM in the
conceptualisation of perceptions. Hypotheses from the two models will be empirically
tested. A comparison will be made between the two models to identify which model has
the better ability to predict Internet banking adoption or usage. The next chapter will
discuss the research method used to accomplish this.

Factors influencing the adoption and usage of Internet banking: A New Zealand perspective
54
CCHHAAPPTTEERR 44 RREESSEEAARRCCHH MMEETTHHOODD
4.0 Introduction
This chapter discusses the research method used to accomplish the objectives of this study.
It describes the research objective, research approach and research design adopted,
followed by sections on the data collection method, sample selection and data analysis
approach undertaken in this study. Motivations and justifications have been given for all
adopted methods of this study. Figure 4.1 depicts the steps followed in this study.
Figure 4.1: Schematic presentation of research method
4.1 Research purpose
The purpose of this study is to determine which factors influence customers’ behavioural
intentions to adopt or use Internet banking services in New Zealand. In chapter 2,
literature on Internet banking adoption and usage trend across different countries including
in New Zealand was reviewed. Literature on technology adoption theories and frameworks
was reviewed in chapter 3 and two research frameworks were identified that included
factors that might have an influence on the adoption and usage of Internet banking
services in New Zealand. Hypotheses were formulated to investigate the impact of these
factors using data collected from sample of New Zealand population. Finally, a comparison
will be made highlighting the prediction capabilities of these frameworks.
As mentioned in earlier chapters, limited studies have been carried out on the adoption and
usage of Internet banking services in New Zealand and, therefore, both the adoption and
usage trend remains unclear. This study attempts to provide a better understanding of the
current trend of Internet banking adoption and usage in New Zealand. This, therefore, is
an exploratory study, which is appropriate when the problem is difficult to demarcate, there
exists no or limited knowledge on the subject area and no clear apprehension about what
model should be used for gaining a better understanding of dimensions of the problem.
Research Method
Sample
Selection Research
Approach Research
Design Data
Collection Data
Analysis Research
Purpose

Factors influencing the adoption and usage of Internet banking: A New Zealand perspective
55
The objective of this study is neither to develop a theory, which is a descriptive approach,
nor to identify factors from various perspectives, which is an explanatory approach
(Hussey & Hussey, 1997).
4.2 Research approach
There are two main approaches to performing research in social science, a positivistic
paradigm and a phenomenological paradigm. The purpose of research in both of these
approaches is to create a better understanding of the actions of individuals, groups and
institutions, and to analyse the influence on each other. Some researchers have referred to
the positivistic paradigm as ‘quantitative’ and the phenomenological paradigm as
‘qualitative’ (Hussey & Hussey, 1997).
Table 4.1 summarises the features of two paradigms. It is evident from the table 4.1 that
this study is located within the positivistic paradigm rather than the phenomenological
paradigm, as the study intends to gain an overview of the present situation pertaining to
adoption, and continual usage of Internet banking services in New Zealand. In this study,
hypotheses were formulated by applying logical reasoning to the findings of prior studies.
These hypotheses will be tested with data collected from a survey using instruments applied
in prior studies. An attempt is made to select samples that represent the characteristics of
New Zealand population.
Positivistic paradigm
Phenomenological paradigm
Uses large sample size Uses small sample size Researcher does not get involved into problem domain Researcher gets involved The location is artificial The location is natural Data is specific and more precise Data is subjective Concerned with testing hypothesis Concerned with developing theories Generalises from sample to population Generalises from one setting to another
Table 4.1: Features of two research paradigms (Source: Hussey & Hussey, 1997)
Since the determinants that motivate Internet banking adoption and usage will be identified
by establishing relationships between the variables and linking them to a theory (rather than
developing theory), the researcher remains unaffected by the problem domain (Hussey &
Hussey, 1997) as shown in figure 4.2. Further, the researcher observes the problem
domain, Internet banking services, as a spectator observes the world and remains neutral
through out the study. Therefore, this is a positivistic approach. In the phenomenological

Factors influencing the adoption and usage of Internet banking: A New Zealand perspective
56
paradigm, the researcher would include himself with the problem and thus participate in
the subjective world.
Positivistic paradigm Phenomenological paradigm
Figure 4.2: Role of researcher in two paradigms
4.3 Research design
There are number of approaches for a researcher to undertake data collection and it
depends upon the question(s), depth, width and the time span of a research. Using a
positivistic methodology, a researcher may choose between an experiment, a longitudinal
study, a cross-sectional study, a survey or a case study(Hussey & Hussey, 1997). Again
choice of method depends upon research questions and objectives.
Out of these available methods, experimental studies are carried out in a systematic either
in a laboratory or in a natural setting way, where researchers tend to keep some variables
under their control. Experimental studies are difficult to perform in business research
(Hussey & Hussey, 1997). In longitudinal studies fixed samples are repeatedly investigated
and measured over a period of time with a view to find out the relative stability of the
problem under study. This is often runs for many years and therefore is not appropriate for
this study due to time limitation of this research. In a cross-sectional study, a single
investigation of a sample of elements selected from the studied population is conducted in
order to have a “snapshot of an ongoing situation” (Hussey & Hussey, 1997). Cross-
sectional studies are inexpensive, have low time and resource requirements, and are
ethically safe. However they were found not suitable because although they establish
association between variables they do not indicate the clear cause of relationship between
them and also are susceptibility to bias (Hussey & Hussey, 1997).
A survey can be a powerful and effective tool for collecting data on human attitudes,
behaviour and characteristics. A survey is made when a sample of elements is selected to be
representative of the investigated population. Sometimes it is the only available option for
acquiring information to examine research questions. However, a survey may not be the
Internet banking
Researcher
Internet
banking
Researcher

Factors influencing the adoption and usage of Internet banking: A New Zealand perspective
57
best approach for every study, as it requires a familiarity with the basic principles and
methods of statistical analysis for large survey data sets (Doyle, 2003).
Study
Application
Methodology
Sample Size
Gefen and Straub (1997) E-mail Email Survey 392 Mathieson, Peacock and Chin (2001) Software application Postal survey 1172 Agarwal and Karahanna (2000) WWW Field survey Not known Shih (2004) e-Shopping Postal survey 320 Chan et al (2004) Internet Banking Mail survey 634 Mattila et al (2003) Internet banking Mail survey 3000 Cooke and Kroeze (2004) Impact of Internet Case study 1 Chau and Lai (2003) Internet banking Postal survey 422 Polatoglu and Ekin (2001) Internet Banking Email survey 987 Klopping and Mckinney (2004) e-Commerce Web survey 263 Henfridssen and Holmstrom (2002) Computer game Case study 1
Table 4.2: Internet adoption research works: surveys and case studies
A case study is an extensive examination of one or a small amount of units. It involves
gathering information on the unit of analysis over a long period of time and is often used
when boundaries between the phenomenon and the context are not clearly understood due
to lack of theories or a deficient body of knowledge (Hussey & Hussey, 1997). Often case
studies are carried out in connection with evaluations or when the research objective is to
explain, comprehend or describe an organisation or system. Case studies may be applied in
both positivistic and phenomenological paradigms, and are common in information system
research. Table 4.2 displays prior studies of the adoption of Internet banking or mobile
banking services that used survey or case study approaches.
Considering the benefits of survey method and its common use in business studies (shown
in table 4.2), survey method was considered suitable for this study.
4.4 Data collection
There are several methods that can be used to collect data for survey research. These are:
mail survey, telephone survey, personal interview survey, email survey and web-based
survey. Each method has its advantages and disadvantages. The choice will depend upon
the type and size of sample being studied, the purpose of study, time limit, available budget
and resources.
4.4.1 Data collection method
Some consideration was given to running the survey over the Internet since web and e-mail
surveys are quite common (Kaplowitz, Hadlock, & Ralph, 2004; Yun & Trumbo, 2000).

Factors influencing the adoption and usage of Internet banking: A New Zealand perspective
58
Analysis of prior studies that conducted surveys on the Internet have shown web and e-
mail surveys can offer shorter administration time and lower survey costs (Porter, 2004;
Shaeehan & McMillian, 1999; Yun & Trumbo, 2000). While several experiments have
yielded higher response rates in web-based surveys compared to postal surveys (Cobanoglu,
Warde, & Moreo, 2001; Kaplowitz et al., 2004; Schaefer & Dillman, 1998), other studies
have shown mixed or contradictory results. For example, Cobanoglu et al (2001) reported
18% higher response rates for web-based surveys while Schaefer and Dillman (1998)
reported only 0.5% higher. Further, Shannon and Bradshaw (2002) reported 15% lower
response rates whereas Weible and Wallace (1998) reported 1% lower. Porter (2004)
suggested that reduced response rate might be due to the survey design and characteristics
of the sample.
Kaplowitz, Hadlock and Levine (2004) suggested that a web survey can achieve a higher
response rate when the population has easy access to the Internet and is comfortable with
using the Internet (Porter, 2004). Besides this, lower response rates in a web-based survey
was reported because the survey instrument was delivered to non-regularly-used email
accounts or due to “fancy” appearance of survey websites (Dillman, Tortora, Conradt, &
Bowker, 1998). Drawing any conclusion about response rates from web-based or e-mail
surveys is thus difficult. table 4.3 shows an overview of advantages and disadvantages of
various methods of data collection in survey research (Cobanoglu et al., 2001; Czaja &
Blair, 1995; Diem, 2002).
From table 4.3, it is evident that while postal survey costs and time requirements are higher
than web-based or email surveys, the potential coverage for postal surveys is higher
because every individual has some kind of postal address. Since 37.40% of New Zealanders
have access to the Internet (http://www2.stats.govt.nz), it can be assumed that everyone
might not have access to Internet or does not have email address. Further, non-deliverable
survey instrument in postal survey are lower than that of web-based or email survey as
people change their email addresses and Internet service providers (ISP) more frequently
compared to postal addresses (Cobanoglu et al., 2001). Even if the postal addresses get
changed, people can use the facility of mail forwarding, while in case of email there is
usually no way to redirect email that were send to old email address. Postal surveys are
easier to construct than web surveys, where a separate skill set is required for programming
and designing the survey site.

Factors influencing the adoption and usage of Internet banking: A New Zealand perspective
59
Postal
Telephone
Personal Interview
Web-based
Coverage High: Everyone has some kind of address
Low: Not everyone has a telephone
Low: Sample size must be low
Low: Everyone may not have access to Internet
Response rate
Low: Low response in general
Medium: Generally people participate
High: Generally every respondent will participate
High: Generally high with exceptions
Speed Low: Takes time, requires follow-up
High: Quick response possible
High: Quick response possible
High: Quick response possible
Wrong address
Low: Change of address can be tackled using mail forwarding facility
Low: Change of telephone number can be handled except unpublished numbers
Nil: Direct contact with participant
High: Change of email addressed can not be tracked
Labour High: Copying, labelling, folding and stuffing into envelopes and preparing return envelopes takes considerable labour
Medium: Staff required for dialling
Low: Except preparing questionnaire and interviewing, no other labour is needed
Low: Except setting up website, labour is minimal
Expertise to construct
Low: Easy to construct Low: Easy to construct High: Requires social skills and quick thinking
High: Setting up web server, designing page and validating questionnaire
Cost High: Postage, photo copying, stationery and labour costs are involved
Low: If dialling is local and volunteers are available
High: Requires an inordinate time and cost
No cost or minimal cost since postage and stationery cost are eliminated
Others Can be buried in junk mail Requires literacy Difficult accurate mailing list
Language barrier could affect the process Caller ID and answer machines limit access Only few and simple questions can be asked Respondent might be uncooperative
Trained interviewer needed Researcher can make more valid interpretations More than one interview might be necessary to check the validity of the data if third party is engaged
Can be deleted without opening / reading email Reminder needed
Table 4.3: Advantages and disadvantages of various methods of data collection (Cobanoglu et al., 2001; Czaja & Blair, 1995; Diem, 2002)
Research has shown that inclusion of pre-paid cash and non-cash benefits can increase
response rates, while inclusion of post-paid incentives have no impact on response rate
(Porter, 2004). Cash or non cash incentives can be included with postal surveys while it is
not possible to include prepaid incentives with web-based surveys (Cobanoglu et al., 2001).
Schaefer and Dillman (1998) cited several studies that have not found any significant
difference in response rates that used a mixed-mode survey strategy; i.e. web-based and
postal surveys. The major problem with using mixed-mode surveys for the same
population is defined as the measurement differences between modes (Dillman, 2000).
Other challenges in the use of web and email based surveys are recipients may delete
messages from unknown recipients without even reading them, considering them as junk

Factors influencing the adoption and usage of Internet banking: A New Zealand perspective
60
mail (Dillman, 2000). Yun and Trumbo (2000) have highlighted ethical concerns and
technical problems generally involved in web-based or email surveys.
Telephone surveys are popular because information can be obtained quickly and can be
inexpensive, if dialling is local and staff/volunteers are available (Newman & McNeil,
1998). This method is appropriate when there are a few simple questions to be asked and
when superficial information is sought from respondent instead of in-depth responses.
Since the current study aims to collect information on several factors and on consumers’
intentions towards Internet banking services, it was decided that a telephone survey would
not be suitable.
In the case of interview surveys, there are advantages such as i) the interviewer can obtain
insights into why the respondent answered the way he or she did; ii) sensitive data may be
able to be collected; iii) complex questions can be asked; and iv) interview sessions may be
recorded. The disadvantages of interview surveys include a) a high time and cost
requirement; b) requirement of training on interviewing techniques; and c) low
coverage(Newman & McNeil, 1998). Consequently, the researcher decided not to use this
option for this study.
In a directly administered survey, information is collected by distributing a survey
questionnaire to students in a classroom or at a meeting of a group of the population to
which results are to be generalised. The procedures for developing such survey are similar
to those for a postal survey. However, considering the researcher’s possible influence on
the subjects, a directly administered survey was not considered for this study.
The above review suggests that while every mode of survey has its own advantages and
disadvantages, a postal survey was found appropriate mode of data collection for this
study.
4.4.2 Designing survey instrument
In a survey, individuals are asked to volunteer their time to complete a questionnaire for
which they will receive no instant response, benefit, or gratification. If the questionnaire
design makes the task difficult due to confusing questions, poor directions, or lengthy
questions, people tend to choose not to donate their time “to the cause” (Dillman, 2000).
Though items of this study were adopted from prior research, still attention was given to

Factors influencing the adoption and usage of Internet banking: A New Zealand perspective
61
content validity, readability and formatting of the items in order to minimise the chance of
misleading and inaccurate recording responses. Further, emphasis was given to the original
items and the items that were used in most studies.
From the extant literature on Internet banking, e-commerce and information systems
research, it was noticed that most studies used a single set of questionnaire to collect
information from both users and non-users of a system or application. Other studies
designed questionnaire to in such a way that items within each construct could capture
information for both users and non-users. For example, question such as “Internet banking
would be (is) easy to use. In both the approaches, it is difficult to be sure how respondents
have interpreted the question. To overcome this issue, current researcher decided to
develop two sets of the survey instrument: one set with questions suitable for users and the
other set comprising of questions suitable for non-users. Different coloured paper was
used to distinguish the two versions of the survey instrument: yellow for users and blue
non-users. Both sets of questionnaires were delivered to every household surveyed.
Instructions were given on the front page of each questionnaire form, as well as in a
covering letter, which explained which questionnaire should be used by whom.
Respondents were requested to complete only one of the two questionnaire forms
(covering letter can be found in Appendix A).
4.4.2.1 Measurement of the constructs
This section discusses the procedure followed in constructing the items used in the survey
instrument. Wherever possible, items used for the constructs were adapted from prior
research in order to ensure the content validity of the scale used (Luarn & Lin, 2004). The
instruments used for TAM and PCI surveys are psychometrically sound and have been
applied in several studies. The scales for perceived usefulness, perceived ease of use and behavioural
intention were measured using items adapted from the original TAM instrument (Davis,
1989) and subsequent applications of TAM to Internet banking and other technology
acceptance studies (Agarwal & Prasad, 1997; Davis et al., 1989; Lederer et al., 2000; Luarn
& Lin, 2004; Tan & Teo, 2000; Venkatesh & Davis, 2000; Wang et al., 2003). Items for the
perceived self-efficacy construct were adapted from an original instrument developed by
Compeau and Higgins (1995) and from other studies that have used self-efficacy as a
construct (Luarn & Lin, 2004; Tan & Teo, 2000; Venkatesh, 2000; Venkatesh et al., 2003;
Wang et al., 2003). Measures of perceived risk were adapted from studies on Internet banking

Factors influencing the adoption and usage of Internet banking: A New Zealand perspective
62
(Tan & Teo, 2000), e-services(Pavlou & Featherman, 2002), and e-shopping and e-
commerce(Cases, 2002; Jarvenpaa & Todd, 1997; Lim, 2003).
Construct Items Adapted from Perceived Usefulness
1. Internet banking enables me to accomplish my banking tasks more quickly
2. Internet banking makes it easier for me to do my banking 3. I find Internet banking useful
(Davis, 1989),(Davis et al., 1989),(Venkatesh & Davis, 2000),(Lederer et al., 2000), (Luarn & Lin, 2004), (Wang et al., 2003)
Perceived Ease of Use
1. Learning to use Internet banking was easy for me 2. It was easy to become skilful at using Internet banking 3. I find Internet banking easy to use 4. Using Internet banking can often be frustrating 5. Internet banking can be complicated to use
(Davis, 1989),(Davis et al., 1989),(Venkatesh & Davis, 2000), (Moore & Benbasat, 2001) (Tan & Teo, 2000), (Luarn & Lin, 2004)
Self Efficacy 1. I can use Internet banking even if there was no one around to show me how to do it
2. I can use Internet banking with only the online help function for assistance
3. I could use Internet banking even if the system was changed
(Compeau & Higgins, 1995), (Venkatesh et al., 2003), (Tan & Teo, 2000), (Luarn & Lin, 2004), (Wang et al., 2003)
Risk 1. Using Internet banking increases my cost of banking 2. Internet banking lacks the benefits of personal interaction
with bank personnel 3. Internet banking is unreliable 4. Using Internet banking may expose me to fraud or monetary
loss 5. Using Internet banking may jeopardise my privacy 6. Internet banking is insecure 7. Using Internet banking would increase the time it takes to do
my banking
(Tan & Teo, 2000), (A. Pavlou, Paul & S. Featherman, M, 2002), (S. Jarvenpaa, L & P. Todd, A, 1997)
Relative advantage
1. Internet banking is more convenient than other banking options
2. Internet banking is more accessible than other banking options
3. Internet banking is less time-consuming than other banking options
4. Internet banking gives me greater control over my finances than other banking option
(Moore & Benbasat, 2001), (Agarwal & Prasad, 1997), (Plouffe et al., 2001), (Tan & Teo, 2000)
Compatibility 1. Internet banking is compatible with my lifestyle 2. Using Internet banking fits well with the way I like to manage
my finances 3. Using Internet banking suits my current situation
(Moore & Benbasat, 2001), (Agarwal & Prasad, 1997), (Taylor & Todd, 1995a), (Tan & Teo, 2000)
Observability 1. The advantages and disadvantages of using Internet banking are obvious
2. I would have difficulty explaining why using Internet banking may or may not be beneficial
3. Internet banking is very visible in the public media 4. I have seen what others do using Internet banking
(Moore & Benbasat, 2001), (Agarwal & Prasad, 1997), (Venkatesh & Davis, 2000), (Plouffe et al., 2001), (Karahanna & Straub, 1999)
Trialability 1. 1.Internet banking is available for me to use on a trial basis 2. .I am able to see how Internet banking works and what it can
do 3. I know where I can get more information on Internet banking
(Moore & Benbasat, 2001), (Agarwal & Prasad, 1997), (Plouffe et al., 2001) , (Tan & Teo, 2000), (Karahanna & Straub, 1999)
Intention to Use
1. I intend to use Internet banking in the future (Davis, 1989), (Venkatesh & Davis, 2000),(Lederer et al., 2000), (Luarn & Lin, 2004), (Wang et al., 2003), (Plouffe et al., 2001),(Tan & Teo, 2000) (Mathieson, 1991)
Usage 1. In the last 30 days, approximately how often have you used Internet banking?
2. In the last 30 days, approximately how many times have you used Internet banking?
(Davis, 1989), (Davis et al., 1989), (Lederer et al., 2000), (Venkatesh & Davis, 2000), (Agarwal & Prasad, 1997),
Table: 4.4: List of items by construct

Factors influencing the adoption and usage of Internet banking: A New Zealand perspective
63
Table 4.4: List of items by construct (cont.)
Construct Items Adapted from Gender
1. What is your gender
Age
1 What is your age
Computer Use 1 For how long have you used a computer Internet
1. For how long have you used the Internet
Internet Banking
1 For how long have you used Internet banking
Internet access 1 Do you currently have access to the Internet
(Luarn & Lin, 2004; Tan & Teo, 2000)
With respect to PCI, some studies have reported similarities between relative advantage and
perceived usefulness, arguing that both constructs are broadly based and indicate an increase in
productivity, effectiveness and performance (Moore & Benbasat, 1991). However,
researchers have used these constructs differently. Tornatzky and Klein (1982) expressed
concern at combining relative advantage and perceived usefulness. They suggest that this is a
measurement issue, which could lead to a plethora of scales and terms since all would
subsumed under the idea of relative advantage, and meaning that perceived usefulness will be
treated in relative terms. In order to retain the intuitive appeal of both the terms and
considering their recognition across a variety of disciplines, it was decided to treat the
constructs separately in this study. Items for relative advantage construct were adapted from
Moore and Benbasat (2001) study, Tan and Teo (2000), Agarwal and Prasad (1997;1998),
Karahanna and Straub (1999) and Plouffe et al (2001). As mentioned earlier, however,
complexity is considered to be the equivalent of perceived ease of use (Moore and Benbasat,
1991), and the same scale was used in both TAM and PCI models.
Items for the constructs compatibility, trialability, visibility and result demonstrability were adapted
from studies of Moore and Benbasat (2001), Tan and Teo (2000), Agarwal and Prasad
(1997;1998), Plouffe et al (2001) and Karahanna and Straub (1999). Roger’s (1983) original
notion of observability has been defined as the degree to which the results of an innovation
are visible and communicable. Moore and Benbasat (2001) and several other researchers
have used two constructs: visibility and result demonstrability in place of observability to focus on
each dimension separately, and this approach was also adopted in this study. Items for
actual use construct were adapted from Davis (1989), Moore and Benbasat (1991) and
Lederer et al.’s (2000) studies. Items for demographic variables such as gender, age,
computer, Internet and Internet banking experiences were adopted from previous studies
(Luarn & Lin, 2004; Tan & Teo, 2000)

Factors influencing the adoption and usage of Internet banking: A New Zealand perspective
64
Table 4.4 indicates the list of items used for developing each construct in the Internet
banking-user questionnaire. The same items were used for the non-Internet banking-user
questionnaire except that wordings were changed wherever required. For example, the first
question in table 4.4 was modified for non-users as “Internet banking would enable me to
accomplish my banking tasks more quickly”. A seven-point Likert scale with anchors ranging
from strongly disagrees to strongly agree was used to ensure statistical variability among survey
responses for all items measured.
4.4.2.2 Ordering questions in the questionnaire
The order in which questions are asked can affect the response as well as the overall data
collection activity. The occurrence of adjusting answers to succeeding questions based on
the answer of the previous questions - have been reported by many studies (Babbie, 1990;
Dillman, 2000). Dillman (2000) indicated five distinct situations where answering one
question may influence responses to later questions.
?? The norm of evenhandedness: Occurs when there are similarities in questions and they
are placed next to each other. Some researchers (Bishop, Hippler, Schwarz, &
Strack, 1988) argued that evenhandedness is likely to occur more in telephone
surveys than in postal surveys as in the latter respondents can view all the questions
before answering and can adjust answers accordingly. But empirical studies from
field surveys provide evidence that effects in postal and telephone surveys are
similar (Ayida & McCledon, 1990; Sangster, Lorenz, & Saltiel, 1995).
?? The anchoring effect: The anchoring effect is a form of suggestibility where response to
the first opinion question serves as an anchor for the second answer. In other
words, a respondent answers a question taking into account his / her preference
and the answer to the previous question (Dillman, 2000).
?? The addition effect: In a survey, Schuman and Presser (1981) identified that percentage
responding to the general question varied when a specific question is asked before a
general question. The authors explain that respondents continued to think about
specific question and adjust their answer while answering the second question.
?? The subtraction effect: The opposite of the addition effect is reported in another study
(Mason, Carlson, & Tourangeau, 1994) where the authors noticed that respondents
tended to “subtract” out reasons used to justify their answer to the preceding
question.

Factors influencing the adoption and usage of Internet banking: A New Zealand perspective
65
?? The summary item effect: Willits and Saltiel (1995) illustrated that responses to the
summary question tend to score low if it is asked before a list of questions relating
to the domains that are summarised.
From the extant literature review, it is noticed that there has been a debate on the
advisability of different approaches to place multiple items of constructs on a
questionnaire. Some researchers have suggested that items for all constructs should be
randomly placed so that no two items of a construct are adjacent (Babbie, 1990; Goodhue,
1998), while others (Babbie, 1990; Davis & Venkatesh, 1996) have argued that intermixing
of questions creates difficulty for respondents as they are required to switch their attention
continually from one topic to another. The measures from intermixed questions are more
correlated with related variables than grouping the questions (Goodhue & Loiacono, 2002).
However, Goodhue and Loiacono (2002) noticed that although intermixing improves the
path coefficients, it is not significant and concluded that intermixing of questions is suitable
for newly developed items and constructs. Since constructs of TAM and PCI are strong
and well tested, it may not be the best context for testing the impact of questions order on
measurement quality. Dillman (2000) suggested making half of the questions in one order
and half in another. Babbie (1990) suggested constructing more than one version of the
questionnaire containing different possible ordering of questions and then pre-testing the
questionnaire using the different forms to determine different possible ordering effects.
However, it is important to recognise that a questionnaire cannot be considered as a
compilation of completely independent questions that have no effects on one another even
though similar questions are placed separately. This is because respondents might evaluate
each question on the basis of its individual content and the larger content as well and adjust
answers accordingly (Dillman, 2000). Considering the pros and cons of arranging questions
in a questionnaire, the current study decided to place all items measuring a construct
adjacent to each other, which was found consistent with several prior studies (Agarwal &
Prasad, 1997; Chan & Lu, 2004; Tan & Teo, 2000).
4.4.2.3 Choosing the first question
According to Dillman (2000) choosing the first question in a questionnaire is more
important than any other items, since it influences the destiny of the questionnaire – either
to the mail box or to the garbage bin. The potential respondent casually glances through
the first few questions before he or she starts answering. Success in understanding and

Factors influencing the adoption and usage of Internet banking: A New Zealand perspective
66
answering the first question motivates respondents to continue. Babbie (1990) suggested
beginning the questionnaire with the most interesting questions. Alternatively, one can use
a question that respondents would be keen to express an answer to and is likely to apply to
everyone (Dillman, 2000). The question must be easy to comprehend and answer. It
should not be a long question or an open-ended question. There are many well-designed
surveys that start with age or education because it applies to everyone and easy to
understand. However, such surveys have received poor responses due to the lack of
connectedness between the objectives of surveys and the understanding of respondents
(Babbie, 1990; Dillman, 2000). Therefore, researchers (Babbie, 1990; Dillman, 2000)
proposed not to start a questionnaire with demographic questions. Placing demographic
questions at the end of a questionnaire may or may not (Dillman, 2000) affect the response
rate. In the current survey, demographic questions were placed at the end, considering that
in a postal survey, respondents read the entire questionnaire and once they find it
interesting they start answering it.
4.4.2.4 Raising response rates
Demands for survey research are increasing but reports indicated that survey response rates
have been falling, both in USA and Europe (Porter, 2004). While addressing the cause for
this decline, researcher (Porter, 2004) stated that respondents may either lack a survey
response propensity or may be suffering from survey response fatigue. Since non-response
is usually not random, conclusions drawn from such underrepresented data may be
erroneous. It is, therefore, essential for researchers conducting a survey to understand how
respondents will perceive and react to the survey. In order to have a better understanding
of survey non-response, researchers have developed a theoretical framework from
reasoned action and psychological perspectives.
From literature on the reasoned action approach, it is observed that researchers have
considered different methods of survey administration and survey design to improve the
rate of response. For example, by reducing survey length, providing cash incentives,
reducing the cost of survey participation or using multiple contacts with members of the
sample (Dillman, 2000; Porter, 2004). Literature on the psychological approach has tended
to focus on several heuristic factors to increase survey response rates, including helping
tendencies, compliance with legitimate authority and the norms of reciprocity. Keeping in
mind the two different approaches, the following factors were considered in an attempt to
increase the survey response rate of this study.

Factors influencing the adoption and usage of Internet banking: A New Zealand perspective
67
A. Survey length
Results of experimental studies on postal surveys indicated that surveys where length of
questionnaire was short yielded better response rate than surveys with long questionnaire.
One study using USA Census Bureau forms of varying lengths found that the response rate
increases by 4% when a shorter version of the questionnaire is used (Porter, 2004). While a
survey in Norway found that response rate dropped by 9% when the length of
questionnaire increased from two pages to eight pages (Groves, Singer, Corning, &
Bowers, 1999). Baumgartner (Porter, 2004) estimated that a 5% reduction in response rates
for every additional 10 pages of questionnaire. Another study (Yammarino, Skinner, &
Childers, 1991) estimated a 8% drop in response rate for surveys greater that four pages
length. Conversely studies have found small differences in response rate for longer and
shorter surveys (Porter, 2004). This indicates that survey length alone might not be enough
to predict response rates rather there might be other factors that influence response rate.
In order to increase survey response rate in the current study, consideration was given to
the length of the questionnaire at development and pre-testing phase. After pre-testing, the
length of the questionnaire was 39 questions for the Internet banking-user form and 36
questions for non-Internet banking-user form. Each questionnaire form fitted within 3
pages of A4 sized paper.
B. Request for help
Porter (2004) claimed that survey response rate increases when surveys request
respondents for assistance. For example by including the phrase “ it would really help us
out”, a study reported an 18% increase in survey response rate (Porter, 2004).
Consequently, in this study the statement: “We would appreciate your help in this research”, was
included in the covering letter of the survey.
C. Statement of confidentiality
Porter (2004) suggested that providing a statement of confidentiality fosters a sense of trust
which in turn influences survey response rate. However, in a meta-analysis of thirty studies,
researchers (Singer, Von, & Miller, 1995) revealed that the inclusion of a strong statement
of confidentiality resulted in lower response rates. They suggested that a strong
confidentiality statement influenced respondents to believe that the surveys contained
sensitive or embarrassing questions, which in turn discouraged subjects from participation.
Dillman et al. (1996) suggested that neither a standard statement nor a strong statement of

Factors influencing the adoption and usage of Internet banking: A New Zealand perspective
68
confidentiality has a significant effect on the response rates. However, for this study, it was
decided to include a standard confidentiality statement in both the covering letter as well as
in the questionnaire, in the hope that it would increase the survey response.
D. Salience
Salience of an issue to the sampled population has been found to have a strong positive
correlation with response rate for postal, e-mail and web-based surveys. Groves, Singer,
and Corning (2000) experienced an increase of 14.9 % by conducting a survey on a
community related topic. Bean and Roszkowski (1995) argued that salience has more
influence on response rate than survey length. They noted that "if a person attaches little interest
or importance to the particular content of a survey, then it will not matter if the survey form is short; the
person still is unlikely to respond" (p. 25). Internet banking is an important issue from both
banks’ and consumers’ perspectives. Respondent might perceive that replying to a
questionnaire will help banks in improving its services, which indirectly benefits him and
therefore he or she might attach interest to participate in the survey. With this view, a
statement about the survey’s objective and the possible benefits of responding was
included in the covering letter of this survey.
E. Introductory letter
As stated before, a letter introducing the study, its objective and importance, the
importance of participation, and the mechanics of returning the questionnaire, was
delivered along with questionnaire. A statement of “help required” was included within the
letter. Further, a statement of the auspices under which the study was conducted, followed
by two names, email addresses and phone numbers were provided for those who might
want more information about the study.
F. Cash incentives
Church (1993) concluded from a meta-analysis of 34 studies, that people respond more
favourably to incentives that are included with the questionnaire rather than those that are
promised for after completing the survey questionnaire. Porter (2004) reported two studies
where response rate increased by 18% and 12% by including $0.50 and $1 respectively with
the survey instruments, while Groves et al.(2000) experienced an increase of 23.7% by
adding $5. On the contrary, no significant change in response rate was observed even after
combining a $5 bill and a promise of additional $50 for a completed survey (Hager, Wilson,
Pollak, & Rooney, 2003). Researcher (Porter, 2004) expressed that incentives offered in

Factors influencing the adoption and usage of Internet banking: A New Zealand perspective
69
online surveys resulted in a drop in response rate compared to those where no incentives
were offered. Furthermore, according to Kehoe and Pitkow (1996), incentives might
introduce systematic bias. Since the effects of incentives on response rate are inconclusive,
it was decided not to include any incentives in this survey.
4.4.3 Pre-testing
Prior to the primary survey it was considered essential to validate the survey instrument
through pre-testing in order to identify if there were any ambiguous questions, problems in
understanding the questions, threatening or embarrassing questions, or suggestions, if any,
for revision of the questionnaire (Remenyi, Williams, Money, & Swartz, 1998). In other
words, to ensure that measurement scales were adapted and developed appropriately to the
context, pre-testing was considered essential. Six Internet banking users and six non-users
were selected from fellow Masters’ students and friends. Both questionnaire forms along
with the covering letter were distributed to each participant. Each respondent was timed so
that the time requirement for answering the questionnaire was known. Respondents were
then interviewed to identify issues relating to questionnaire.
Item Construct
No Description
Participants’ comment Action taken
Perceived ease of use
2 It was easy to become skilful at using Internet banking
Four Participants found item 2 and 3 are confusing and other two found item 2 3 and 4 had similar meaning
Dropped: Item 2 was dropped
Self- efficacy
3 I could use Internet banking even if the system was changed
Two respondents were not clear ‘what was meant by the word ‘system’
Revised: Interpretation of the word ‘system’ for this study was included
Risk 3 Internet banking is unreliable “Does unreliable mean trust?” commented by three participants
Revised: Related to expectation
Relative advantage
1 2 3 4
Internet banking is more convenient than other banking options Internet banking is more accessible than other banking options Internet banking is less time-consuming than other banking options Internet banking gives me greater control over my finances than other banking option
Clarify what is meant by ‘other banking’ – commented by all participants
Revised: Word ‘other banking’ was replaced with ‘visiting bank’ and ‘phone banking’
Compatibility
3 Using Internet banking would suit my current situation
Similarity found with item 1 of the same construct by all participants
Dropped Due to similarity
Demographic
7 Are there currently significant barriers to you using the Internet
“Be more explicit” – commented by a participant
Dropped: Not relevant
Table 4.5: Summary of changes after pre-testing questionnaire for user
The pre-testing of questionnaire elicited valuable comments from respondents on the
questions. After reviewing these comments, current researcher dropped three items from

Factors influencing the adoption and usage of Internet banking: A New Zealand perspective
70
user and five from non-user questionnaire and also modified some questions. These
changes are shown in table 4.5 and table 4.6. Final questionnaire form for user and non-
user are included in Appendix B.
Item Construct
No Description
Participants’ comment Action taken
Perceived ease of use
2 It would be easy to become skilful at using Internet banking
All six participants found item 2,3,4 are similar meaning
Dropped: Item 2 was dropped
Self- efficacy
3 I would be able to use Internet banking even if I had never used a system like it before
There were no comments from participants
Revised: Since modification carried for user question form
Risk 3 Internet banking is unreliable “Does unreliable mean security issue?” commented from one participant
Revised: Made changes similar to user question form
Relative advantage
1 2 3 4
Internet banking is more convenient than other banking options Internet banking is more accessible than other banking options Internet banking is less time-consuming than other banking options Internet banking gives me greater control over my finances than other banking option
“Clarify what is meant by other banking?” – comments from three participants.
Revised Similar to user questionnaire
Compatibility
3 Using Internet banking would suit my current situation
Similarity found with item 1 of the same construct by three participants
Dropped: Item 3 due to similarity
Usage 1 2
In the last 30 days, approximately how often have you used Internet banking? In the last 30 days, approximately how many times have you used Internet banking?
All participants commented as non -relevant – since they had never used Internet banking
Dropped: Item 1 and 2 were dropped as they were not applicable for non-users
Demographics
2 It would be easy to become skilful at using Internet banking
‘Be more explicit’ – commented by a participant
Dropped: Item 7 dropped due to non relevant
Table 4.6: Summary of changes after pre-testing for non- user
4.4.4 Ethical approval
Since this study intended to collect data from individuals prior approval was required from
the Auckland University of Technology’s Ethics Committee. Application along with both
sets of questionnaire was forwarded for Ethical Approval and the approval for conducting
survey was received subsequently.
4.5 Sample selection
Selecting a sample is a fundamental element of positivistic study. Good sample selection
involves considering that every member of the population has a chance of being selected.
The sample should also be unbiased and large enough to satisfy the need of the research
(Hussey & Hussey, 1997). It is possible to survey the entire population in few studies but it
is impractical and unnecessary in majority studies. If chosen appropriately, a small sample
of a population can yield highly accurate predictions. For example professional polling

Factors influencing the adoption and usage of Internet banking: A New Zealand perspective
71
organisations in the USA often use fewer than 2000 individuals as their survey sample to
predict how more than 100 million people will vote in national elections (Doyle, 2003).
Most of the prior studies on Internet or mobile banking, university students were chosen as
subjects since they were easy to access and chances of receiving higher response rate.
Findings from those studies are confined to a particular segment of population and
therefore cannot be generalised. This study targeted New Zealand households with a view
to include all segments of the population who currently use or intend to use Internet
banking in near future and non-users. Subjects to be surveyed were determined by natural
sampling method (Babbie, 1990; Hussey & Hussey, 1997) since the researcher had little
influence on the composition of the sample.
Profile AWC RCP BBC ASC ROC ECC ACW TKC HEC LNC ACC
Number of households 1158 1236 1914 1509 1767 1077 1395 1644 1329 1671 130530
Number of males 1929 2136 2559 2178 2331 1515 1731 2229 1821 2427 177999
Number of females 2022 2025 2895 2325 2724 1755 1527 2514 2037 2541 189735
Age 15-64 years 65.6 69.1 61.6 63.7 67.4 68.4 90.4 68.6 66.3 66.2 70.0
Age 65 years and above 8.3 7.8 18.9 13.8 13.2 9.5 5.3 9.2 17.3 13.7 10.3
Ethnic group: European 35.0 43.1 72.1 55.2 74.5 58.8 56.5 54.0 74.5 51.0 65.7
Maori 12.3 15.1 4.1 9.3 4.1 1.9 7.0 8.8 4.7 6.7 8.4
Asian 24.1 19.5 24.0 28.2 21.8 40.3 36.7 24.5 19.6 38.5 18.7
Post school qualification 25.8 25.1 33.0 29.7 45.8 47.1 44.3 36.0 41.5 30.6 41.2
Internet connection 30.3 35.4 44.6 39.2 56.4 63.6 46.3 40.6 51.8 44.7 47.2
Telephone connection 92.1 95.5 98.7 97.7 99.0 98.5 93.8 96.0 98.6 98.5 96.5
Income 13900 17300 17300 16100 25100 19900 23000 18700 21700 16100 22300
AWC = Avondale west community, RCP = Rosebank community, BBC = Blockhouse bay community, ASC =Avondale
south community, ROC = Royal oak community, ECC = Epsom central community, ACW = Auckland central west,
TKC = Three kings community, HEC = Hillsborough east community, LNC = Lynfield north community, ACC =
Auckland city community
Table 4.7: Summary of populations in Auckland west and cental region (Source: Statics New Zealand website http://www2.stats.govt.nz)
It was decided to collect data from households in the Auckland region so that the
researcher could deliver survey questionnaires directly to residents’ letterbox instead of

Factors influencing the adoption and usage of Internet banking: A New Zealand perspective
72
mailing. Names and addresses of residents were not required and chances of returned mails
due to wrong addresses were thus eliminated. Population statistics for ten different
locations in west and central Auckland, together with the profile of the Auckland region as
given in Statistics New Zealand’s website (http://www2.stats.govt.nz) were evaluated in
selecting the sample frame. Table 4.7 indicates profile of population for those locations.
While selecting survey area(s) emphasis was given on Internet access, education levels and
household income since these factors were found to produce gap between online and
offline population (Courtier & Gilpatrick, 1999; Hall et al., 1999). Therefore area(s) were
selected where values for these factors were at par with the values of Auckland city area.
Further importance was placed on area(s) with larger number of households as opposed to
commercial organisations so that information can be collected from individuals.
Furthermore, ethnic dwelling distributions were also considered
It is evident from table 4.7 that four areas, BBC, ROC, TKC and LNC, had more than
1500 households and the percentage of ethnic dwelling of BBC and ROC areas were much
close to ethnic dwelling of ACC area than other areas including TKC and LNC. For
instance European populations in BBC, ROC and ACC were 72.1%, 74.5% and 65.7%
whereas as TKC and LNC had 54% and 51%. Furthermore, percentage of Internet
connection and average yearly income of BBC and ROC were higher than TKC and LNC.
Therefore BBC and ROC were selected for this study. A list of roads and streets in BBC
and ROC that were covered in this survey can be found in Appendix C.
From the literature, it is understood that deciding a sample size is a complex process. It
depends on the kind of statistical analysis the study proposes, the anticipated response rate
and the expected variability within the samples and the results (Hussey & Hussey, 1997).
Newton and Rudestam (1999) suggested that survey cost and time are also to be
considered. On one hand, if sample size is taken small to suit the budget, many statistical
tests do not work well with a smaller data size. On the other hand, results might be tenable
for a large sample size but due to high cost and longer time requirement, such surveys may
not be feasible to carry out. There are number of guidelines or rules of thumb that have
been developed to assist researchers in selecting sample size. For example, Newton and
Rudestam (1999) suggested a 4 to 1 ratio of responses to items. Others suggest a 10 to 1
ratio. For this study, if we consider 4 to 1 ratio, which means for 40 items questionnaire
responses should be 160. Further, there would be some incomplete and incorrectly fill out
questionnaire and if those are estimated to be 10% of the responses received (Newton &

Factors influencing the adoption and usage of Internet banking: A New Zealand perspective
73
Rudestam, 1999), then the required number of responses would be nearly 180. Now the
typical response rate from a postal survey is between 15% and 25% and is decreasing over
the time. If we consider that the current survey would generate about a 20% response rate,
a sample size of 900 people would be required for this survey. In another calculation,
authors (Newton & Rudestam, 1999) conducted a power analysis, assuming a multiple
regression analysis with R² value (effect size) of .10 and recommended sample size as below
9.0___
??
rateresponserequiredresponseTotal
SampleSize
If we follow the similar approach, we require 1000 subjects to be surveyed in order to get
180 responses, with 20% response rate and R² value of .10. In another calculation Dillman
(2000) estimated the sample size would be 1067 with ±3% sampling error, 50/50 expected
variation in answers to the question of interest. Considering different formulas for sample
size calculation, survey cost, time requirement and available resources, it was decided to
survey 1000 subjects for this study.
4.5.1 Survey error
Salant and Dillman (1994), and Dillman (2000) expressed that researchers conducting
surveys should take necessary steps to minimize four potential sources of error: sampling
error, non-coverage error, non-response error, and measurement error.
Sampling error is the degree to which the selected sample does not represent the general
population and is caused by exclusion of certain members of the population from the
sample. Several studies have suggested increasing sample size to decrease sampling error
when simple random sampling is used. For example, when the sample size is increased
from 400 to 1000, the sampling error decreases from 5% to 3%, which is an acceptable
trade-off between precision of estimate and costs (Cui, 2003; Dillman, 2000). Therefore in
this study, the sample size was set to 1000 to minimise the sampling error.
According to Dillman (2000) and Cui (2003) some members of the sample simply do not
respond to the survey questions, irrespective of the process followed during a sample
selection. A low response rate does not necessarily lead to non-response error. In section
4.4.2.4, techniques to raise the survey response rate were discussed at length. In summary,
the following measures were taken to reduce the non-response error:

Factors influencing the adoption and usage of Internet banking: A New Zealand perspective
74
?? Survey instrument was kept short and simple
?? Survey sponsor was made known
?? Confidentiality and anonymity were assured
?? Questionnaire started with non-threatening questions
?? An offer was made to provide a summary of results, if requested
?? A pre-paid envelope was enclosed for returning the completed questionnaire.
Measurement error results when the respondent fails to follow instructions on how to
complete the survey form, does not respond to specific questions, or supplies inadequate
answers that cannot be compiled in any useful way with responses from others (Dillman,
2000). Measurement error is defined as the difference between the answer given by the
respondent and the true value that applies to that answer. There are several causes of
measurement error that have been discussed in the literature. Out of these causes, error
due to non-response bias, a badly designed questionnaire, respondent bias and processing
error are found to be most common. We have already discussed measures taken to
improve the response rate and the strategy adapted for designing the survey questionnaire.
The remaining causes and how they are addressed in the current survey are now discussed.
Respondent bias is due to a refusal or inability to answer questions, or the provision of
incomplete or inaccurate information. In the current survey, attention was paid to the
wording of questions during questionnaire development and after the pre-testing phase.
Further, importance was placed on protecting respondents’ privacy, integrity and interest
while designing the instruments.
Emphasis was placed on editing techniques and quality assurance practices at data
grooming (preliminary checking before entering), data capture, editing and at estimation
stages in order to ensure that there was no data loss, no duplication and no inaccurate
weights in the estimation procedure. Several processes such as checks for duplicate
responses, logic edits and range edits (valid range were entered) were carried out to
minimise the error. However, such techniques can only minimise measurement error
(Newton & Rudestam, 1999) and therefore every effort was made to reduce the magnitude
of measurement error by focusing mainly on the questionnaire design and evaluation
process as recommended by Esposito (2002)

Factors influencing the adoption and usage of Internet banking: A New Zealand perspective
75
4.5.2 Survey distribution
It was planned to distribute one thousand survey documents equally between the two areas
selected for sampling; i.e. 500 each to ROC and BBC. Since the numbers of households in
these two areas were 1767 and 1914, it was decided to deliver survey documents to
households randomly. A list of roads and streets along with number of houses in each of
them was constructed using information from www.wises.co.nz and the quickmap software.
It was found that the number of houses in the two areas was more than that given in
Statistics New Zealand’s website. The difference was due to new houses built since 2001,
when statistical data was last collected. A few roads and streets in each area were kept aside
from the initial survey distribution, for a second survey distribution if the initial response
rate turned out to be low. In order to cover more households of each area using available
resources, it was also planned to delivery survey documents to alternate houses within a
road or street where number of houses was up to 20, and one in every 3 houses where
number of houses was over 20. Survey documents distribution was started in first week of
March 2005 and was completed in seven days. Details of survey distribution can be found
in Appendix D.
4.5.3 Response Rate
Of the thousand survey documents distributed, 163 responses were received by the first
week of April 2005. Of these responses, 109 were from Internet banking users and 54 were
from non-users. Six responses – 1 from a user and 5 from non-users – were either
incomplete or blank and therefore were not considered for further data analysis.
Despite decreasing response rates in postal surveys, this survey achieved an acceptable
response rate of 16.3% (15.7% usable responses). This compares favourably with recent
studies. For example, Lin and Pervan (2003) received 6.8% in the first mail-out, Laitinen
(2002) received 10.8% and Wu (2003) received 10.5%. Considering the response rate
achieved, it was decided not to opt for a second round of survey distribution, which would
have cost additional time and resources.
4.6 Data analysis
Survey data was entered into a statistical package, SPSS (Statistical package for social
sciences) for analysis and graphical presentation of the results (a list of original data can be
found in Appendix E). Using SPSS, frequencies and percentage distributions of
respondents’ demographic information were developed in tables to check that these
responses were representative of the larger population of New Zealand and also to assess

Factors influencing the adoption and usage of Internet banking: A New Zealand perspective
76
non-response bias. Items that were negatively stated were reverse coded. These items were
item 3 and 4 of perceived ease of use, item 3 of risk and item 2 of result demonstrability i.e.
question number 6,7,13 and 25. The psychometric properties of the research instrument
were assessed for its reliability and construct validity as well. The Cronbach alpha
coefficient for each research variable was computed to test for reliability, while factor
analysis was used for convergent and discriminant validity of the variables. Hypotheses
were tested using linear regression analysis in the next chapter. Multi-linear regression
analysis was used to test models’ prediction capabilities. Further, t-test and Mann-Whitney
tests were used to examine the differences in perception of Internet banking between users
and non-users groups. Details of data analysis are discussed in details in next chapter.
4.7 Summary
This chapter has described and discussed the research method, survey mode, survey
instrument, sample selection and survey process followed in order to investigate the
research objectives of this study. Measurements for theoretical constructs have been
adapted from the relevant literature. In the next chapter, the survey results and data analysis
are described.

Factors influencing the adoption and usage of Internet banking: A New Zealand perspective
77
CCHHAAPPTTEERR 55 RREESSEEAARRCCHH FFIINNDDIINNGGSS
5.0 Introduction
In previous chapters, we described the theoretical background, significance and approach
undertaken for practical investigation of this research. Information collected through the
survey was intended to satisfy the research objectives. This chapter analyses the responses
of the survey and presents the results.
5.1 Data analysis
The demographic profiles of respondents are summarised and comparisons are made with
users and non-users of Internet banking in other countries. The validity and reliability tests
of the research variables were carried out before statistical techniques were employed to
analyse data. Both parametric and nonparametric tests, wherever applicable, were carried
out to investigate the following research objectives:
1. Are the hypothesised relationships between variables in each of the models
supported?
2. Which model, TAM or PCI, can explain more variance in intention to adopt or use
Internet banking?
3. How do users and non-users differ in their perceptions of Internet banking?
5.1.1 Sample characteristics
It was noticed from the responses that few participants chose not to answer one or two
items in the questionnaire. However, answers to the remaining items were found
reasonable and therefore an initial value of ‘99’ was assigned to the missing items at the
time of data entry. Deleting responses from the analysis due to one or two absent data
points would not be prudent, as the other key responses provided by participants would
also be omitted. To enhance the use of questionnaire data, series mean was used to
substitute for missing items (Piguet & Peraya, 2000). Table 5.1 shows the summary of
respondents’ demographics. The data shows that number of female respondents is higher
than male respondents, with females accounting for 62.4 % and males 37.6% of responses.
One possible explanation for more female respondents could be that female population
was higher than male in New Zealand as well as in both the survey areas as shown in the
table 5.2 (http://www2.stats.govt.nz).

Factors influencing the adoption and usage of Internet banking: A New Zealand perspective
78
All respondents Internet banking user
Non-internet banking-user
Variables
Frequency Percent Frequency Percent Frequency Percent
Response Type User 108 68.8 108 100 49 100 Non-user 49 31.2
Gender Female 98 62.4 70 64.8 28 57.1 Male 59 37.6 38 35.2 21 42.9
Age 15-24 years 12 7.6 9 8.3 3 6.1
25-39 years 52 33.1 48 44.4 4 8.2
40-54 years 49 31.2 36 33.3 13 26.5
55-69 years 27 17.2 13 12.0 14 28.6
>69 years 17 10.8 2 1.9 15 30.6
Computer Use Never 5 3.2 0 0 5 10.2 < 1 year 4 2.5 2 1.9 2 4.1 1 – 2 years 3 1.9 1 0.9 2 4.1 3 – 5 years 19 12.1 12 11.1 7 14.3 6 – 10 years 38 24.2 25 23.1 13 26.5 > 10 years 88 56.1 68 63.0 20 40.8
Internet use Never 8 5.1 0 0 8 16.3 < 1 year 5 3.2 2 1.9 3 6.1 1 – 2 years 6 3.8 5 4.6 1 2.0 3 – 5 years 57 36.3 38 35.2 19 38.8 6 – 10 years 58 36.9 46 42.6 12 24.5 > 10 years 23 14.6 17 15.7 6 12.2 Internet banking use
Non-user 49 31.2 0 0 0 0
< 6 months 6 3.8 6 5.6 0 0 6 – 11
months 5 3.2 5 4.6 0 0
1 – 2 years 27 17.2 27 25.0 0 0 3 – 5 years 54 34.4 54 50.0 0 0 > 5 years 15 9.6 15 13.9 0 0 No
response 1 0.6 1 0.9 0 0
Table 5.1: Summary of demographic profile
About 95% of respondents (149 out of 157 respondents) were Internet users. This is a
significant increase over estimates of 47% in 2001 (http://www2.stats.govt.nz). Among
these users, 73% have used the Internet for 3 to 10 years, while 14.6% have used it for over
10 years. This suggests that New Zealanders are generally experienced Internet users.
A predominance of females among Internet banking users is evident from data; female
were 65% and males were 35%. Studies in several other countries have observed male
domination in Internet banking (reported in chapter 2). Internet banking users are relatively
younger than the overall sample, with 44.4% aged between 25 and 39 years, Male and
33.3% aged between 40 and 54 years. Half of Internet banking users has used these services
for between 3 to 5 years, 35% have used Internet banking for less than 2 years and about
15% have used Internet banking services for longer than 5 years.

Factors influencing the adoption and usage of Internet banking: A New Zealand perspective
79
New Zealand BBC (survey area 1)
ROC (survey area 2)
Female 1,914,273 2,895 2,724 Male 1,823,007 2,559 2,331 Total 3,737,277 5,457 5,055
Table 5.2: Male and female population BBC: Blockhouse bay community; ROC: Royal oak community
All participants
(N = 157) User
(N = 108) Non user (N = 49)
Mean 5.25 6.43 2.65
Median 6.00 7.00 2.00 Table 5.3: Intention to use Internet banking services in future
Intention to use
Respondents Male Female Users Male Female Non-users
Male Female
1 21 (13%) 8 13 1 (1%) 0 0 21 (43%) 8 13 2 9 (6%) 4 5 1 (1%) 0 1 8 (16%) 4 4 3 5 (3%) 1 4 4 (4%) 0 1 4 (8%) 1 3 4 13 (8%) 3 10 8 (7%) 0 4 9 (18%) 3 6 5 11 (7%) 5 6 2 (2%) 5 5 1 (2%) 0 1 6 23 (15%) 10 13 21 (19%) 8 13 2 (4%) 2 0 7 75 (47%) 28 47 71 (66%) 25 46 4 (8%) 3 1
Total 157(100%) 59 98 108100%) 38 70 49(100%) 21 28 1= strongly disagree7 = strongly agree
Table 5.4: Intention to use Internet banking services
Frequency of use
up to 10 times
11–20 times
21–30 times
31–40 times
> 40 times
Total
Not at all 1 2 3 4 5 6 Frequently 7
1 7 5 11 26 9 13
0 0 0 0 3 5 11
0 0 0 0 0 4 9
0 0 0 0 0 0 2
0 0 0 0 0 0 2
2 7 5 11 29 18 37
Total 72 (66.7%) 19 (17.6%) 13 (12.0%) 2 (1.9%) 2 (1.9%) 108(100%)
Male Female
22(20.4%) 50(47.5%)
11(10.2%) 8(7.4%)
3(2.9%) 10(9.2%)
0 2(1.9%)
2(1.9%) 0
38(35.1%) 70(64.9%)
Table 5.5: Frequency and actual use of Internet banking in last 30 days
Intention to use Internet banking in future was measured with a 7-point Likert scale and
shown in table 5.3 and table 5.4. The data show that existing users intended to use services
in future (mean is 6.43 on a 7 point scale), while non-users were unlikely to adopt or use
Internet banking (mean is 2.65 out of 7 in table 5.3). However, the overall scale mean is
5.25 out of 7, suggesting a high intention in adoption or using services in future. Further,
about 47% of the respondents strongly agreed that they would use Internet banking in future,
of which 94% were users and 6% non-users. On the other hand, about 43% of non-users
strongly disagreed that they would use this channel in future, compared to less than 1% of
users (table 5.4). From this, it can be assumed that existing users are likely to continue

Factors influencing the adoption and usage of Internet banking: A New Zealand perspective
80
using banking services over the Internet, while non-users are unlikely to adopt Internet
banking.
Actual use of Internet banking was measured with a 7-point Likert scale to record
agreement with overall frequency of use in prior 30 days, and an absolute estimate of use in
the same period and is shown in table 5.5. The data shows that about 67% of users used
Internet banking services up to 10 times in the prior 30 days. About 18% used Internet
banking from 11 to 20 times in that period, nearly 12% between 21 and 30 times, and less
than 4% were used Internet banking over 30 times in 30 days. Nearly 71% of females and
39% of males were using Internet banking services 10 times a month. Although the
number of female users was more in Internet banking, males were found used services for
maximum number of times (only males were found used over 40 times a month). The data in
tables 5.6 and 5.7 indicate both that female and male users had similar Internet and Internet
banking experience.
Internet banking experience
< 6 months 6-12 months 1-2 years 3-5 years > 5 years Total
Male 0 0 9(8.3%) 21(19.4%) 8(7.4%) 38(35.1%) Female 6 6(5.5%) 18(16.7%) 33(30.6%) 7(6.4%) 70(64.9%)
Table 5.6: Internet banking experience
Internet use
< 1 year 1-2 years 3-5 years 6-10 years > 10 years Total
Male 0 1(0.9%) 14(12.9) 15(13.9%) 8(7.4%) 38(35.1%) Female 2(1.8%) 4(3.7%) 24(22.2%) 31(28.7%) 9(8.3%) 70(64.9%)
Table 5.7: Internet use experience
In the next section, the constructs used in survey instrument are tested for various validity
and reliability properties.
5.1.2 Construct validation
The validity and reliability of variables were tested to ensure that they produced reliable and
consistent results. Construct reliability measures the stability of scale based on internal
consistency of items measuring the construct. Construct validity measures “the degree to
which the scale being used represents the concept about which generalisation is to be
made” (Davis, 1989).

Factors influencing the adoption and usage of Internet banking: A New Zealand perspective
81
Factor Factor Factor Factor Factor Cronbach Alpha Item description
1 2 3 4 5 Usefulness_1 0.851 -0.106 0.268 0.110 0.051 Usefulness_2 0.861 -0.078 0.259 0.152 0.009 Usefulness_3 0.870 -0.133 0.231 0.138 0.000 0.972 Ease of use_1 0.735 -0.093 0.320 0.274 0.018 Ease of use_2 0.731 -0.097 0.387 0.301 0.006 Ease of use_3 0.340 -0.139 0.676 -0.103 -0.043 Ease of use_4 0.356 -0.144 0.742 0.064 -0.015 0.872 Self efficacy_1 0.567 -0.165 0.323 0.400 -0.072 Self efficacy_2 0.249 0.064 0.262 0.525 -0.019 Self efficacy_3 0.641 -0.136 0.269 0.387 -0.056 0.760 Risk_1* -0.442 0.383 -0.132 0.071 0.120 Risk_2* -0.290 0.488 -0.387 0.014 0.059 Risk_3 -0.695 0.064 -0.304 -0.139 0.121 Risk_4 -0.038 0.905 -0.103 -0.049 -0.053 Risk_5 -0.061 0.910 -0.098 -0.078 -0.017 Risk_6 -0.248 0.810 0.074 -0.054 0.015 Risk_7 -0.519 0.186 -0.126 -0.185 0.245 0.792 Relative Advantage_1 0.893 -0.147 0.152 0.091 -0.011 Relative Advantage_2 0.882 -0.143 0.046 0.123 0.044 Relative Advantage_3 0.872 -0.085 0.109 0.028 0.017 Relative Advantage_4 0.792 -0.149 0.130 0.186 0.056 0.935 Compatibility_1 0.886 -0.065 0.200 0.119 0.014 Compatibility_2 0.879 -0.076 0.264 0.106 0.057 0.959 Result_Demo_1 0.342 0.051 0.524 0.225 0.133 Result_Demo_2* 0.199 -0.073 0.334 0.374 -0.099 0.316 Visibility_1 0.072 0.145 0.070 0.065 0.790 Visibility_2 -0.106 -0.153 -0.088 0.165 0.749 0.466 Trialability_1 -0.061 0.090 -0.189 0.669 0.074 Trialability_2 0.312 -0.176 0.110 0.620 0.281 Trialability_3 0.327 -0.209 0.027 0.590 0.213 0.606
* alpha values below cut-off value; figures in Bold are above cut-off value; figures in Italics are below cut-off value
Table 5.8: Factor analysis and Cronbach alpha coefficient
Construct reliability was assessed by calculating Cronbach alpha coefficient, for variables
since it is widely used research. Reliability of the constructs was tested by examining their
alpha value at ? 0.6, as suggested by Nunnally (1967). With respect to construct validity,
factor analysis was used to test the convergent and discriminant validity of items. The
convergent validity was evaluated by examining whether items of a variable converged
together on a single construct (Premkumar & Ramamurthy, 1995), and whether the factor
loading for every item was ? 0.50, as suggested by Nunnally (1967) and Hair et al (1998).
The discriminant validity was evaluated by examining the cross loading of items on
different factors.
Results of factor analysis and Cronbach alpha coefficient are shown in table 5.8. The results
show that all three items of perceived usefulness were loaded on to factor 1 with individual

Factors influencing the adoption and usage of Internet banking: A New Zealand perspective
82
value > 0.85, which confirmed the validity of the scale. Further Cronbatch alpha of the
scale was 0.97, which provided support for scale’s reliability. With regards to perceived ease of
use variable, two out of four items were loaded with factor of usefulness, suggesting that
usefulness of Internet banking services was perceived due to ease of use of services. While
rest two items i.e. item 3 and 4 which were targeting to capture user’s “frustration” and
“complexity”, opposite of ease of use trait of Internet banking, were perceived differently and
therefore loaded on to factor 3. Technically these items should be treated separately from
item 1 and 2 but considering the reliability of the scale (Cronbatch alpha > 0.87) items were
retained with same construct.
Furthermore, item 1 and 3 of self-efficacy was loaded on factor 1 while item 2 was loaded on
factor 4 with Cronbatch alpha value over 0.76. Item 2 was intended to capture individual’s
confidence in using services with only online help or instructions but respondents might
have viewed differently. Although the scale showed reliable, validity could not be
established.
Table 5.8 shows that the reliability of risk scale was above the recommended value but the
validity could not be established due to items were either below the cut-off value or loaded
on more than one factors. Factor analysis shows that item 1 and 2 were below the cut-off
value suggesting that respondents found economic risk (item 1) and social risk (item 2)
were less significant to Internet banking context. Further item 3 and 7 were loaded on
factor 1 (where items of perceived usefulness were loaded) indicating that respondents might
have considered these items as usefulness traits of Internet banking services (Tornatzky &
Klein, 1982) rather than risk associated in it.
Items of relative advantage were loaded on factor 1, where items of perceived usefulness were also
loaded, suggesting similarity between these constructs (Moore & Benbasat, 1991). The
reliability of scale was also established (Cronbatch alpha value > 0.93). Further on, the
reliability and validity of compatibility scale was also established Cronbatch alpha value of the
scale was > 0.95 and all items were loaded on factor 1, indicating that relative advantage
and compatibility did not emerge as separate factors eventhough the items different were
users for measuring these scales. This supported Moore and Benbasat’s (1991) view that
these constructs are correlated at the 0.99 level and difficult to segregate. Factor analysis
shows that all items of trialability construct were loaded on factor 3 with Cronbach alpha
just over cut-off value of 0.60 which established scale’s validity and reliability.

Factors influencing the adoption and usage of Internet banking: A New Zealand perspective
83
The above factor loadings indicate that items of some scales tended to correlate more with
other items of different traits rather than item used to measure the same trait. Furthermore,
figures in table 5.8 shows that Cronbach alpha of result demonstrability and visibility were less
than the cut-off value of 0.6. Although items used for this research were empirically tested
and their reliability and validity were established in prior studies, deviations in both
reliability and validity was experienced in this research. The possible reason could be that
respondents not viewed them identically in the Internet banking context. As Moore and
Benbasat (1991) expressed that ‘researchers must understand the difference between
conceptual and empirical dimensionality … high correlation is not a sufficient condition to
claim that a concept is unidimensional rather than bidimensional’.
At this stage, before proceeding for data analysis using statistical techniques that are based
on the assumption that variables are normally distributed, it was decided check the
normality of the data and, if appropriate, to transform the data using one of the available
normalisation techniques. Normalisation provides a means of modifying data to correct
violations of normality. In other words, it reduces the possibilities of greatest variance
dominate the results(Hair et al., 1998). Most normalisation methods effectively reduce the
amount of variance by treating the outliers. Depending upon the skewness observed and
the types of data, various data transformations can be applied such as mean correction,
linear regression, nonlinear models, Bayesian methods (Finkelstein, Gollub, & Cherry,
2002) and Box-Cox transformation(Hair, Anderson, Tatham, & Black, 1998). Each
normalisation method has its own assumptions, calculations and the adjusted values are
often different. Some are more complicated and take into account more factors that could
incur bias, while others are simpler to use and thus have higher popularity. For this
research, the Box-Cox transformation (Hair et al., 1998) was used because it is simple and
effective.
The Box-Cox transformation transforms variables allowing a flexible functional form for
estimation and is useful when there are many variables, a small sample size and samples
does not have any zero observations. It is defined as:
?? /)1()( ?? YyT (for ? ? 0 )
)log()( yyT ? (for ? = 0)
Where y is the response variable and ? is the transformational parameter.

Factors influencing the adoption and usage of Internet banking: A New Zealand perspective
84
Using the above formula data was transformed and factor analysis and reliability of scales
for the normalised data were calculated (shown in Appendix F). But there were not
appreciable differences in the results produced by the transformed and untransformed data.
Therefore, it was decided to use the original data for further analysis.
Reliability analysis Items of perceived ease of use
Mean Std. Dev Cases
Item 1 Item 2 Item 3 Item 4
5.6624 5.6242 4.9038 5.1795
1.5712 1.6385 1.8494 1.6583
157 157 157 157
Correlation Matrix Item1 Item2 Item3 Item4 Item 1 Item 2 Item 3 Item 4
1.0000 .8543 .3682 .5135
1.0000 .4132 .5775
1.0000 .5953
1.0000
Item-total Statistics
Scale Mean if item deleted
Scale Variance if item deleted
Corrected item-total correlation
Squared multiple
Correlation
Alpha if item deleted
Item 1 Item 2 Item 3 Item 4
15.7075 15.7458 16.4661 16.1905
18.1483 17.1052 18.1154 17.6162
0.6883 0.7408 0.5269 0.6799
0.7304 0.7567 0.3617 0.4876
0.7681 0.7424 0.8456 0.7700
Table 5.9: Correlations of item to item and variation of perceived ease of use
At this point, in order to enhance the psychometric properties of the constructs, items that
were either not loaded on any factors or loaded on multiple factors and the constructs with
low Cronbach alpha coefficient values were reviewed. Review of constructs is discussed
below.
Items 3 and 4 of the perceived ease of use variable were adopted from the Tan and Teo’s
(2000) study, and were present in the original construct developed by Davis (1989) and
Moore and Benbasat (1991). These items were: “Using Internet banking can be often be
frustrating” and “Internet banking can be complicated to use” and they were loaded on factor 3,
while item 1 and 2 were loaded on factor 1. Items 3 and 4 were negatively stated (and were
reverse coded, mentioned in chapter 4) and reflected the complexity of Internet banking
services. A possible reason for loading on two factors could be that users and non-users
perceived complexity differently because complexity of using an innovation starts to play a
role only after one starts using an innovation (Moore & Benbasat, 1991). However, item-wise

Factors influencing the adoption and usage of Internet banking: A New Zealand perspective
85
mean, correlation matrix, corrected item-total correlation and effects on Cronbach alpha were not
affected significantly significant, if these items were considered to be deleted (as shown in
table 5.9). Therefore, items 3 and 4 were not considered differently from items 1 and 2 and
we decided to retain all the items of perceived ease of use for further analysis.
Reliability analysis
Correlation Matrix Items of RISK
RS1 RS2 RS3 RS4 RS5 RS6 RS7
RS1 RS2 RS3 RS4 RS5 RS6 RS7
1.0000 .2633 .3050 .2598 .3330 .3829 .2566
1.0000 .3425 .4237 .4039 .3794 .3186
1.0000 .1508 .1540 .2234 .4292
1.0000 .8491 .6607 .1847
1.0000 .6795 .2058
1.0000 .2440
1.0000 RS1…RS7 = item 1 to item 7 of risk variable
Item-total Statistics
Scale Mean if item deleted
Scale Variance if item deleted
Corrected item-total correlation
Squared multiple Correlation
Alpha if item deleted
RS1 RS2 RS3 RS4 RS5 RS6 RS7
23.0182 21.5239 23.1473 21.1187 21.3225 21.9277 23.3543
57.1158 51.4830 58.9725 52.7173 52.2825 53.2169 58.4526
.4300
.5221
.3869
.6328
.6601
.6442
.3923
.2240
.2875
.2627
.7429
.7523
.5254
.2335
.7815
.7667
.7883
.7435
.7385
.7425
.7878
Table 5.10: Correlations of item-to-item and variation of risk
Item 2 of self-efficacy was loaded on factor 4 whereas items 1 and 3 were loaded on factor 1.
This might be due to the wording of item 2, which was “I can use Internet banking with only the
online help function or instructions for assistance”. Although the item was intended to captures the
self-efficacy attribute, but the word ‘only’ in the question might have misled respondents to
answer differently from other items. Although it is technically desirable to treat item 2
separately, the correlation factor between items gave us confidence to retain all the items.
Items 1 and 2 of risk were not loaded over 0.5 values on any factors and items 3 and 7 were
loaded on factor 1 while items 4, 5 and 6 were loaded on factor 2 (shown in table 5.8). This
suggests that respondents might have viewed economic risk (item 1), social risk (item 2),
performance risk (item 3) and time risk (item 7) conceptually different from internal risk (items
4, 5 and 6) associated with Internet banking services. With regard to item 1 and 2,
respondents’ opinion were almost evenly distributed on 1-7 scale, resulting items were not
loaded on to any factors. On the other hand, respondents might have treated items 3 and 7
as the desirable features of Internet banking. A similar item was used in relative advantage
variables (item number 3). Further, item-to-item relationship and corrected item-total correlation of

Factors influencing the adoption and usage of Internet banking: A New Zealand perspective
86
these items were very low (shown in table 5.10). Therefore, it was decided to drop item 1
and 2 due to lack of loading. Although loading for item 7 was above cut-off value, it was
dropped due existence of a similar item in relative advantage scale. Furthermore, reliability of
item 3, 4, 5 and 6 (shown in table 5.11) indicates that Cronbach alpha of risk construct
would increase significantly if item 3 was deleted. In other words, item 3 seemed to be
pulling the reliability of the scale and therefore it was decided to drop item 3 from risk
construct.
Item-total Statistics ? item 3,4,5,6
Scale Mean if item deleted
Scale Variance if item deleted
Corrected item-total correlation
Squared multiple Correlation
Alpha if item deleted
Q13_RS3 Q14_RS4 Q15_RS5 Q16_RS6
13.3374 11.3088 11.5126 12.1179
22.6088 15.3536 15.3167 16.4197
0.1938 0.7365 0.7503 0.6803
0.0499 0.7339 0.7459 0.4999
0.8906 0.6202 0.6128 0.6558
Table 5.11: Correlations of item to item and variation of risk
Although we aimed to measure several dimensions of risk such as performance, social,
economical and so on, but due to lack of loading or loading on several factors, 4 out of 7
items were dropped to achieve scales reliability and validity. Thus the risk construct was left
with items 4, 5 and 6, representing internal risk associated with Internet banking system.
However internal risk i.e. security and privacy were found to be the most important factors
that had negatively influenced Internet banking adoption and usage in various countries in
the world, reported in chapter 2.
Construct
Number of items in survey
Items used in analysis
Perceived usefulness Perceived ease of use Self-efficacy Risk Relative Advantage Compatibility Result Demonstrability Visibility Trialability Intention Usage Demographic Total (users) Total (non-users)
3 4 3 7 4 2 2 2 3 1 2* 6** 39 34
3 4 3 3 4 2 1 2 3 1 2* 6** 34 29
* number of items was 0 for non-user, ** number of items was 5 for non-user
Table 5.12: Construct-wise items in survey and used in data analysis

Factors influencing the adoption and usage of Internet banking: A New Zealand perspective
87
Item 2 of result demonstrability was not loaded on any factors and the alpha value of the scale
was below the acceptable limit of 0.5. In order to include a measure of result demonstrability,
item 1 retained and item 2 was dropped from the scale. The Cronbach alpha coefficient of
visibility was just below the cut-off point of 0.50. However, considering its high loading
values for both items (item 1 was 0.790 and item 2 was 0.749), it was decided to retain
these items for further analysis. But importance will not be given to it while generalising
research findings. A list of scale-wise number of original items used in the survey and the
number of items used for statistical analysis is shown in table 5.12.
5.1.3 Averaging items
In the fields of psychology, marketing, political science and so on, it is common to
compute average scores for items of a construct. According to Piguet et al (2000) averaging
items enhances the flexibility of scale without affecting the statistical properties of the
scores. Further averaging standardises the range of scale scores (Nunnally, 1978). But when
a distribution of dataset is heavily skewed, the average or mean might be misleading due to
presence of outliers (Argyrous, 1996). Since the data was not heavily skewed (results of
Box-Cox transformation data was not significantly different from results with normal data),
average score for items of each construct was used for further analysis (data after averaging
item can be found in Appendix G).
5.1.4 Treating Likert scale data as interval data
The objective of Likert scale was to be able to accurately and reliably quantify verbal study
instruments in sociological research. It is one-dimensional method of measurement. By
using a combined score, some social scientists believe that the ordinal-scaled data based
upon a Likert-scale can be converted into a form of interval data (Adams, 2004; Cooper &
Schendler, 2001). For example, when a seven-point Likert scale for 30 items is totalled as a
composite score, the possible range of data value will be from 30 to 210. According to
Johnson (2005) although in most cases Likert scale data is ordinal but the extent they
approach the intervalness depends on the correspondence of the ordinal labels to the
empirical data. Turkey (1986) argued that not using “ordinal data for interval-based
statistical techniques was a historically unfounded overreaction”. He expressed that if p-
values or confidence intervals are to be sacred, then it must be precise. “In the practical
world, when data values are transformed, the p values resulted from different expressions
of data would change. Thus, ordinal-scaled data should not be banned from entering the
realm of parametric tests” (Turkey, 1986).

Factors influencing the adoption and usage of Internet banking: A New Zealand perspective
88
On the contrary, according Mitchel (1996) data collected using Likert scale is ranked in
order of importance to the researcher and are symbols not "scores". But use of these
numbers, which identifies positions become quantity. Mathematically, the difference
between 2 and 1 is equal to the difference between 3 and 2; but the difference between "I
strongly agree" (coded as 7) and "I agree" (coded as 6) is not same. Thus, it violates
epistemological and mathematical requirements to assume that these differences are
equivalent.
Parametric tests are more flexible and can detect smaller differences or relationships when
they exist, due to its precise and powerful measurement procedures. On the other hand,
nonparametric tests are appropriate when a very small differences or relationships are less
likely to be treated significant. Several studies were conducted to explore this issue,
comparing the effectiveness of parametric versus nonparametric tests and had identified
that statistical power to detect differences was no less for ordinal data than for interval
level data. The investigators (Baker, Hardyck, & Petrinovich, 1966) concluded that
parametric tests with ordinal data rarely distort the results. Baker el al (1966) and Borgatta
and Bohrnstedt (1980) expressed that for typical data, whether scales are ordinal or interval
does not matter.
Considering above, parametric techniques were used to analysis the survey data. But for
comparison of results, nonparametric techniques were also employed wherever it was
found appropriate.
5.1.5 Correlation matrices
In order to investigate possible association between variables, Pearson coefficient of
correlation was calculated for all variables and shown in table 5.13. The Pearson coefficient,
is a parametric technique and is so widely used that often the word ‘correlation’ by itself
refers to it (Hussey & Hussey, 1997). Although this technique presumes interval data, its
use for ordinal data is common – although this remains a matter of some debate (Bryman
& Cramer, 1997).
A one-tailed test was performed on the data since there is some basis (previous studies) to
predict the direction of the relationship existed between each pair of variables (except
demographic variables) and shown in Table 5.13. The data in the table 5.13 shows that
most of the users’ perceptions were significantly correlated. All the correlations were in the

Factors influencing the adoption and usage of Internet banking: A New Zealand perspective
89
expected directions and provide support for the set of hypotheses constructed in chapter 3.
The extant literature recommends examining multicollinearity effects in the predictor
variables before proceeding to identify relations between independent and dependent
variables particularly when data is collected through survey or field studies. This is because
in survey and field studies researcher has much less control over the predictors and is thus
vulnerable to this problem (Grapentine, 1986). On the contrary, in an experimental setting,
researcher designs the predictor variables to be uncorrelated and can thereby avoid the
multicollinearity problem.
PU EOU SE RSK RA COM DEM VIS TRI BI Use_1 Use_2 Gender Age Comp Inter
PU EOU 0.788
SE 0.646 0.657
RSK -0.242 -0.272 -0.222
RA 0.840 0.722 0.657 -0.272
COM 0.843 0.751 0.682 -0.205 0.892
DEM 0.466 0.522 0.446 -0.076 0.427 0.420
VIS -0.004 -0.028 0.057 -0.030 0.005 0.026 0.059
TRI 0.370 0.348 0.453 -0.203 0.373 0.340 0.266 0.304
BI 0.441 0.373 0.406 -0.139 0.451 0.485 0.218 0.001 0.143
Use_1 0.478 0.452 0.393 -0.176 0.437 0.489 0.311 0.018 0.170 0.795
Use_2 0.312 0.288 0.239 -0.132 0.296 0.347 0.242 -0.037 0.043 0.511 0.709
Gender -0.044 -0.060 -0.071 -0.008 -0.027 -0.040 -0.037 -0.071 -0.206 0.014 0.020 0.053
Age -0.314 -0.220 -0.278 0.125 -0.271 -0.284 -0.161 0.005 -0.215 -0.540 -0.423 -0.228 0.256
Comp 0.234 0.221 0.245 -0.080 0.221 0.268 0.130 -0.040 0.087 0.437 0.316 0.191 -0.018 -0.314
Inter 0.188 0.173 0.234 -0.099 0.210 0.274 0.180 0.014 0.060 0.387 0.320 0.206 0.044 -0.246 0.734
IB 0.452 0.415 0.391 -0.175 0.410 0.463 0.274 0.024 0.157 0.797 0.904 0.581 0.010 -0.408 0.394 0.396figures in Bold are where correlation is significant at the 0.01 level (1-tailed)
figures in Italic are where correlation is significant at the 0.05 level (1-tailed)
PU: Usefulness, EOU: Ease of use, SE: Self efficacy, RSK: Risk, RA: Relative advantage, COM: Compatibility, Dem: Result
Demonstrability, VIS: Visibility, TRI: Trialability, BI: Intention, Comp: Computer use, Inter: Internet use, IB: Internet
banking use.
Table 5.13: Pearson correlation coefficients
Multicollinearity is defined as the extent to which a variable can be explained by other
variables in the analysis (Hair et al., 1998) or an explanatory variable demonstrates a near-
linear dependence with another explanatory variable (Leelerc & Pireaux, 1995). The effects
of multicollinearity make it difficult to determine the contribution of each independent
variable as the effects of independent variables are mixed or confounding (Hair et al.,
1998). In other words, regression coefficients can be insignificant (Grapentine, 1986).
There are several ways to detect and analyse multicollinearity effects. For this study,

Factors influencing the adoption and usage of Internet banking: A New Zealand perspective
90
squared correlation coefficient ( 2R ) was calculated. None of the calculated squared
correlation coefficient values were ? 0.80, which suggests no multicollinearity problem
within the research variables (Thong, 1999).
Table 5.13 shows the inter-correlationship matrix with Pearson’s correlation coefficients.
Significant values are shown using bold and italic fonts and are discussed briefly next.
The relationship between perceived usefulness and other variables was found significant except
for visibility and gender. Visibility was found not correlated with other variables, indicating
either Internet banking had limited visibility in public media and due to this respondents
were not aware of usefulness of Internet banking or respondent viewed that visibility would
not change their perceptions of benefits of Internet banking. Even Cronbach alpha was
below the cut-off value. Similarly, gender did not correlate with most of the variables,
meaning males and females perceived characteristics of Internet banking in a similar way.
On the other hand, age was correlated with most of the variables but in opposite direction,
meaning younger people found Internet banking more useful than the older people (Moore
& Benbasat, 1991). Risk was found not correlated with most of the research variables
suggesting that risk had minimum influence on Internet banking in New Zealand, which
was not perceived from the literature review. The correlation of Internet use (r = .396, p <
.01) with Internet banking use was found significant, meaning that the use of Internet banking
will increase if the use of the Internet increases. This does not support Grealish’s (2002)
findings reported in chapter2 (section 2.2).
Although Pearson's correlation is probably one of the most highly employed statistical
techniques, one outlier can significantly affect the result. Moreover, as mentioned above
underlying assumption for using Pearson coefficient technique is that data must be interval.
Since the major part of the data of this research was ordinal, an alternative to Pearson’s
correlation technique was searched in the literature. The extant literature review revealed
that the two most commonly used nonparametric techniques are Kendall’s tau and Spearman’s
rho. Several studies expressed that the Spearman and the Kendall correlation measures give an
excellent compromise between local robustness and high efficiency in presence of outliers.
The interpretation of the results of either method is identical to Pearson’s correlation
coefficient. Although underlying assumptions in these two measures are similar but they are
not identical in magnitude, since their underlying logic and computational formulae are
quite different. For this study, Kendall’s tau is preferred over Spearman’s rho since the former

Factors influencing the adoption and usage of Internet banking: A New Zealand perspective
91
has greater power than Spearman's (Ferrier & Watson, 1997) and deals better with tied
ranks (Bryman & Cramer, 1997).
PU EOU SE RSK RA COM DEM VIS TRI BI Use_1 Use_2 Gender Age Comp Inter
PU EOU 0.644
SE 0.438 0.435
RSK -0.263 -0.250 -0.148
RA 0.687 0.547 0.431 -0.234
COM 0.697 0.584 0.468 -0.203 0.755
DEM 0.366 0.346 0.297 -0.074 0.319 0.324
VIS -0.042 -0.013 0.036 -0.021 0.006 0.010 0.026
TRI 0.293 0.247 0.309 -0.174 0.291 0.284 0.199 0.207
BI 0.444 0.331 0.337 -0.132 0.398 0.441 0.167 0.008 0.142
Use_1 0.367 0.321 0.250 -0.161 0.324 0.373 0.236 0.000 0.109 0.621
Use_2 0.337 0.284 0.213 -0.131 0.296 0.337 0.208 -0.010 0.086 0.553 0.812
Gender -0.028 -0.019 -0.081 0.004 -0.032 -0.010 -0.050 -0.076 -0.182 0.009 0.031 0.031
Age -0.227 -0.171 -0.205 0.101 -0.213 -0.202 -0.124 -0.021 -0.147 -0.362 -0.317 -0.246 0.232
Comp 0.156 0.130 0.125 -0.101 0.137 0.164 0.036 -0.048 0.021 0.327 0.208 0.188 0.029 -0.169
Inter 0.116 0.084 0.108 -0.108 0.106 0.133 0.098 0.004 0.021 0.257 0.204 0.172 0.082 -0.133 0.559
IB 0.334 0.290 0.233 -0.158 0.275 0.329 0.189 0.000 0.081 0.613 0.707 0.646 0.045 -0.270 0.340 0.343figures in Bold : Correlation is significant at the 0.01 level (1-tailed)
figures in Italic: Correlation is significant at the 0.05 level (1-tailed)
PU: Usefulness, EOU: Ease of use, SE: Self efficacy, RSK: Risk, RA: Relative advantage, COM: Compatibility, Dem: Result
demonstrability, VIS: Visibility, TRI: Trialability, BI: Interntion, Comp: Computer use, Inter: Internet use, IB: Internet
banking use.
Table 5.14: Kendall’s tau correlation
The Kendall’s correlation coefficients for all variables are presented in table 5.14. Results of the
parametric and nonparametric analysis do not indicate significant differences in correlations
between variables except correlations of risk with compatibility, trialability and use_1 were
found more significant in nonparametric test. The results of both techniques extend
support to studies that argued in favour of using Pearson’s correlation coefficient for ordinal data
since outcomes from both techniques do not differ significantly.
5.2 Hypotheses testing
In order to test the hypotheses formulated in chapter 3, a series of simple linear regression
analyses was conducted to calculate direct and indirect path coefficients ( ? ). Simple linear
regression is a useful statistical method for exploring the relationship between dependent
and independent variables and can be described by the following equation:
bxay ??

Factors influencing the adoption and usage of Internet banking: A New Zealand perspective
92
Where “x” and “y” are classed as independent and dependent variables and “b” is the slope
of the line and “a” is the intercept i.e. where the line cuts the y-axis.
In social and natural science research, linear regression is widely used mainly for its
simplicity and ability for producing output quickly. Hypotheses are considered supported
when path coefficients ( ? ) are significant at the 0.05 level. The path coefficients were
calculated using simple linear regression technique for the following:
1. Independent variables, perceived ease of use, perceived usefulness, self-efficacy, and risk were
separately regressed with the dependent variable, intention (Hypotheses H1a, H2,
H3a, and H4).
2. Independent variable perceived ease of use was regressed against perceived usefulness
(Hypothesis H1b).
3. Independent variable self-efficacy was regressed individually against perceived ease of use,
perceived usefulness, and risk (hypotheses H3b, H3c, H3d).
4. Using intention as an independent variable, regression was run separately for
dependent variables, actual use_1 and actual use_2 (hypotheses H5a, H5b).
5. Using relative advantage, compatibility, trialability, visibility and result demonstrability as
independent variables, individual regression analyses were carried out with intention
as the dependent variable (hypotheses H6, H7, H8, H9, H10).
Hypothesis
Dependent variable
Independent variable
? t-value p-value
H1a Intention Perceived ease of use 0.373 5.005 0.000 H1b Perceived usefulness Perceived ease of use 0.788 15.910 0.000 H2 Intention Perceived usefulness 0.441 6.124 0.000 H3a Intention Perceived self-efficacy 0.406 5.530 0.000 H3b Perceived ease of use Perceived self-efficacy 0.657 10.850 0.000 H3c Perceived usefulness Perceived self-efficacy 0.356 3.919 0.000 H3d Perceived risk Perceived self-efficacy -0.222 -2.828 0.005 H4 Intention Perceived risk -0.139 -1.753 0.082 H5a Use_1 Intention 0.795 16.324 0.000 H5b Use_2 Intention 0.511 7.393 0.000 H6 Intention Relative advantage 0.451 6.285 0.000 H7 Intention Compatibility 0.485 6.905 0.000 H8 Intention Trialability 0.143 1.803 0.073 H9 Intention Visibility 0.001 .012 0.991 H10 Intention Result demonstrability 0.218 2.785 0.006
Table 5.15: Regression analysis
The results of linear regression analysis are presented in table 5.15 and discussed in the
following sections. Figure 5.1 and 5.2 present the relationship of independent variables
with dependent variables in the TAM and PCI models.

Factors influencing the adoption and usage of Internet banking: A New Zealand perspective
93
5.2.1 Perceived ease of use and intention
Hypothesis H1a, that Perceived ease of use will have a positive effect on the behavioural intention to use
Internet banking, was supported ( ? = 0.373, t = 5.005 and p < .001). This result is consistent
with the findings of prior studies that used either TAM or PCI model (Mathieson et al.,
2001; Moore & Benbasat, 1991; Wang et al., 2003). This suggests that if bank customers
perceive an Internet banking system is easy to use, they might adopt that system or use it in
preference to other Internet banking systems perceived as hard to use.
5.2.2 Perceived ease of use and perceived usefulness
Hypothesis H1b, that Perceived ease of use will have a positive effect on the perceived usefulness of
Internet banking was supported ( ? = .788, t = 15.910 and p < .001). It is consistent with
findings of prior studies (Chan & Lu, 2004; Wang et al., 2003). The path coefficient ( ? )
values for perceived ease of use to perceived usefulness was higher than ? values for perceived ease of
use to intention, which indicates that although the direct effects of perceived ease of use on to
users intention remain important over the time but indirect through perceived usefulness will
be more weighted by the existing users as their experience with Internet banking system
increases (Chau & Lai, 2003; Luarn & Lin, 2004). Both the hypotheses H1a and H1b, thus
support Davis’(1989) argument that “ perceived ease of use may actually be a casual antecedent to
perceived usefulness, as opposed to a parallel, direct determinant of system usage”.
5.2.3 Perceived usefulness and intention
Hypothesis H2, that Perceived usefulness will have a positive effect on the behavioural intention to use
Internet banking was supported ( ? = .441, t = 6.124 and p < .001). The result is expected
and consistent with prior studies that used TAM in Internet or mobile banking context
(Chan & Lu, 2004; Luarn & Lin, 2004). This suggests that if banks customers perceive
Internet banking to be a useful, quicker and easier way of carrying out financial transactions
than traditional branch banking, they will adopt or use the services.
5.2.4 Self-efficacy and intention
As expected, hypothesis H3a, that perceived self-efficacy will have a positive effect on behavioural
intention to use Internet banking was supported ( ? = .406, t = 5.530 and p < .001). This
indicates that banks customer, who are confident of their abilities to use Internet banking
services are more likely to adopt such services. The result extends support to previous
findings (Luarn & Lin, 2004; Tan & Teo, 2000).

Factors influencing the adoption and usage of Internet banking: A New Zealand perspective
94
5.2.5 Self-efficacy and perceived ease of use
Table 5.15 demonstrates support for hypothesis H3b that, Perceived self-efficacy will have a
positive effect on the perceived ease of use of Internet banking ( ? = .657, t = 10.850 and p < .001).
The result is consistent with finding of prior researches (Agarwal et al., 2000; Chan & Lu,
2004; Hong et al., 2001; Igbaria & Iivari, 1995; Venkatesh, 2000; Venkatesh & Davis, 1996;
Wang et al., 2003). This implies that individuals with higher self-efficacy will perceive Internet
banking services easier to use than those with lower self-efficacy.
5.2.6 Self-efficacy and perceived usefulness
The support ( ? = .356, t = 3.919 and p < .001) for hypothesis H3c that, Perceived self-efficacy
will have a positive effect on the perceived usefulness of Internet banking extended support to prior
researches (Wang et al., 2003). This implies that individuals with higher self-efficacy will
perceive more positive usefulness of Internet banking than others with lower self-efficacy.
5.2.7 Self-efficacy and risk
Hypothesis H3d that Perceived self-efficacy will have a negative effect on the risk of Internet banking
was supported ( ? = -0.222, t = -2.828 and p = .005), suggesting individual has higher self-
efficacy will perceive less risk that individual with lower self-efficacy. The result supports Wang
et al (2003) findings.
5.2.8 Perceived risk and intention
There was a weak negative relationship between perceived risk and intention to use Internet
banking. Consequently, hypothesis H4 that, Perceived risk will have a negative effect on the
behavioural intention to use Internet banking, was not supported ( ? = -0.139, t = -1.753 and p
=.082). This conflicts with the findings of prior studies (Bhatnagar, Misra, & Rao, 2000;
Chan & Lu, 2004; Doolin, Dillon, Thompson, & Corner, 2005; Jarvenpaa & Todd, 1997;
Lim, 2003; Pavlou, 2001). Further, in chapter 2, perceived security and security risk
associated with Internet banking have been found major impediments to Internet banking
adoptions in many countries across the world. One explanation for the deviation from
could be that respondents did not perceive risk associated with Internet banking system.
This might be one of the reasons behind the growing popularity of Internet banking over
online shopping, mentioned in chapter 2.

Factors influencing the adoption and usage of Internet banking: A New Zealand perspective
95
5.2.9 Intention and usage_1
Usage_1 was measured as the frequency of use of Internet banking services. The
hypothesis H5a that, perceived behavioural intention will have a positive effect on the frequency of
Internet banking use, was supported ( ? =0.795, t = 16.324 and p < .001) and thus extended
support to previous studies (Agarwal & Prasad, 1997; Davis, 1989; Mathieson et al., 2001).
Figure 5.1: Regression analysis of model 1 Note. t-values for standardised path coefficient ( ? ) are shown in parenthesis
5.2.10 Intention and usage_2
Usage_2 was measured as the number of times in a month user used Internet banking
services. The hypothesis H5b that, Perceived: behavioural intention will have a positive effect on the
number of times of Internet banking use, was supported ( ? = 0.511, t = 7.393 and p < .001) and
the result is inline with findings of prior study (Davis, 1989).
5.2.11 Relative advantage and intention
The Hypothesis H6 that, perceived relative advantage will have a positive effect on the behavioural
intention to adopt Internet banking, was supported ( ? = 0.451, t = 6.285 and p < .001), which
0.66 * * * (10.85)
-0.22 * * (-2.83)
use_2 =
0.51 * * * (7.39)
use_1=
0.79 * * * (16.32)
-0.14 (-1.75)
0.41 * * * (5.53)
0.37 * * * (5.00) 0.36 * * * (3.91)
0.79 * * * (15.91)0.44 * * * (6.12)
Perceived
self-efficacy
Perceived
ease of use 2R = 0 .432 (SE)
Perceived
risk 2R = 0 .049 (SE)
Perceived
usefulness 2R = 0.620 (EOU)
Intention 2R = 0 .139 (EOU)
= 0 .195 (PU)
= 0 .165 (SE)
= 0 .019 (RSK)
Actual use 2R =
0.632 (Use_1)
0.261(Use_2)
** p ? 0.01 *** p ? 0.001

Factors influencing the adoption and usage of Internet banking: A New Zealand perspective
96
was expected since most of the studies that uses either Roger’s (1983) DOI model or
Moore and Benbasat’s (1991) PCI model, have found relative advantage is one of the key
factor that influence adoption or use of Internet banking services (Kolodinsky & Hogarth,
2001; Polatoglu & Ekin, 2001; Tan & Teo, 2000). This suggests that if bank customers
perceive that Internet banking has a relative advantage over branch banking in accessing
accounts from any location and at any time, and provides greater control and flexibility in
managing their accounts, they may adopt it and use it.
5.2.12 Compatibility and intention
The support ( ? = 0.485, t = 6.905 and P < .001) for hypothesis H7 that Perceived
compatibility will have a positive effect on the behavioural intention to adopt Internet banking is shown in
table 5.15, which suggests Internet banking services in New Zealand fit well with the way
individuals manage their finances as well as it suits to their lifestyle or current situations.
This is consistent with prior findings (Agarwal & Prasad, 1997; Kolodinsky & Hogarth,
2001; Tan & Teo, 2000).
5.2.13 Trialability and intention
Table 5.15 shows lack of support for hypothesis H8 that Perceived trialability will have a positive
effect on the behavioural intention to adopt Internet banking and does not support prior findings
(Agarwal & Prasad, 1997; Moore & Benbasat, 1991) that supported Rogers’ (Rogers, 1983)
argument that users who feel more comfortable with the innovation are more likely to
adopt provided they are able to try out a technology. Further, Tan and Teo (2000) have
expressed that trialability influences intention to adopt or use Internet banking services in
Singapore. One possible reason for the lack of support could be that New Zealand banks
do not provide services on a trial basis and therefore respondents perceived trialability was
not a factor that could influence their intentions. Another possible reason could be easy
access to information on Internet banking that had made respondents less dependent on
trying the option.
5.2.14 Visibility and intention
The results of linear regression show lack of support for hypothesis H9 that Perceived
visibility will have a positive effect on the behavioural intention to adopt Internet banking (see table 5.15).
This suggests that visibility in public media is not be instrumental in persuading New
Zealand bank customers to adopt or use Internet banking, which is inconsistent with
findings of empirical researches (Agarwal & Prasad, 1997; Moore & Benbasat, 1991).

Factors influencing the adoption and usage of Internet banking: A New Zealand perspective
97
Figure 5.2: Regression analysis of model 2 Note. t-values for standardised path coefficient ( ? ) are shown in parenthesis
5.2.15 Result demonstrability and intention
Hypothesis H10 that Perceived result demonstrability will have a positive effect on the behavioural
intention to adopt Internet banking, was supported ( ? = .218, t = 2.785 and P <.05). It
extended support to prior studies (Agarwal & Prasad, 1997; Moore & Benbasat, 1991;
Venkatesh & Davis, 2000), which suggest that the tangible benefits of Internet banking, as
measured by result demonstrability, may influence individuals to adopt or use it.
The nonparametric versions of linear regression are established in method comparison
studies, of which the Passing Bablok regression (PBR) perhaps is the widely used method. But
its application to date has been restricted to clinical research and is not supported by SPSS.
Therefore, this study did not explore the nonparametric regression method (Stockel,
Dewitte, & Thienpont, 1998).
0.00 (.012)
0.21 * * (2.78)
0.14 (1.80)
0.49 * * * (6.90)
0.37 * * * (5.00)
0. 45 * * * (6.29)
Relative
advantage
Ease of use
Trialability
Visibility
Intention 2R = 0 .139 (EOU)
= 0 .203 (RA)
= 0 .021 (TR)
= 0 .000 (VIS)
= 0 .048 (DEM)
Actual use 2R = 0.632 (Use_1)
= 0.261 (Use_2)
Compatibility
Result
demonstrability ** p ? 0.01 *** p ? 0.001
use_1= 0.79 * * * (16.32)
use_2 =0.51 * * * (7.39)

Factors influencing the adoption and usage of Internet banking: A New Zealand perspective
98
5.3 Model analysis
Multiple linear regression were used to analyse the amount of variance ( 2R ) accounted for
in the dependent variable from a set of independent variables. As mentioned before, this
technique is useful and easy to use but has some disadvantages too. For example, figure 5.3
shows (non-normal distribution) for a type of data set no line can be accurately map the
input sample to appropriate output classes. Further, this technique can be affected due to
outliers. For example, figure 5.3 shows (data with outstanding outliers) a dataset with
outstanding outliers. This outlier can skew the regression line away from the others points
to a significant degree as this regression technique does not ignore outliers and treats all
points as important ones, these outliers can skew the regression line away from its optimal
position. However in this research the data set used apparently does not have outliers and
therefore linear regression was used for examining variances in dependent variable.
Non-normal distribution Data with outstanding outliers
Figure 5.3 Example of data distribution
5.3.1 Model 1: extended TAM Model 1: Stepwise regression analysis Model
2R Adjusted
2R Sum of
squares df Mean
squares F p
1 Regression Residual Total 2 Regression Residual Total
0.195
0.220
0.190
0.210
148.698 614.490 763.187
167.859 595.329 763.187
1 155 156
2
154 156
148.698 3.964
83.929 3.866
37.508
21.711
0.000
0.000
Model 1: Independent variable: Perceived usefulness Dependent variable: Intention Model 2: Independent variable: Perceived usefulness, Self-efficacy
Table 5.16: Stepwise regression analysis of model 1
In order to identify most the important independent variables that explain the behaviour of
dependent variable, stepwise regression analysis (Norusis, 1999) was carried out. The

Factors influencing the adoption and usage of Internet banking: A New Zealand perspective
99
stepwise multiple regression technique allows isolating those independent variables that
contribute most to the explanation of the variance of a dependent variable. The results of
stepwise regression analysis are presented in table 5.16, table 5.17 and table 5.18.
Coefficient Model Standardised
Beta t p
1 Perceived usefulness 2 Perceived usefulness Self-efficacy
0.441
0.307 0.207
6.124
3.300 2.226
0.000
0.001 0.027
Table 5.17: Explanation power of variables associate with model 1
Excluded variables
Model Beta in t p
1 Perceived ease of use Self-efficacy Risk 2 Perceived ease of use Risk
0.067 0.207 -0.035
-0.016 -0.021
0.569 2.226 -0.467
-0.131 -0.278
0.570 0.027 0.641
0.896 0.781
Model 1: Independent variable: Perceived usefulness Model 2: Independent variable: Perceived usefulness, Self-efficacy Dependent variable: Intention
Table 5.18: Excluded variables of model 1
Although the sum of squares (148.698) is larger than residual sum of squares (614.490), still
the value of F was found significant at 0.001 level (p <0.001). The analysis suggests two
models: one with perceived usefulness ( ? = .441, t = 6.124 and p < .001) as the only
independent variable that explains 19.5% ( 2R = 0.195) of the variance in intention, while the
second model comprises of perceived usefulness ( ? = 0.307, t = 3.300 and p = 0.001) and self-
efficacy ( ? = 0.207, t = 2.226 and p = .027) as the independent variables, that increases
explanation power to 22% ( 2R = 0.220) (shown in figure 5.4). This means self-efficacy in the
second model explains only 2.5% (0.220 – 0.195 = 0.025) of the variance in intention. The
effect of perceived usefulness ( ? = 0.307) on intention is higher than the effect of self-efficacy
( ? = 0.207) and both effects are statistically significant (p < 0.005) in model 2 (Chau &
Lai, 2003; Luarn & Lin, 2004).
Model 1 variables that had not been entered in to the equation are shown in table 5.18. Beta
in is the standardised regression coefficient that would result if the variables were entered
into the equation in the next step. Figure 5.4 shows variables are related with intention
(values of table 5.17 and table 5.18 for model 2 are used).

Factors influencing the adoption and usage of Internet banking: A New Zealand perspective
100
Figure 5.4: Model 1 regression analysis Note. t-values for standardised path coefficient ( ? ) are shown in parenthesis
5.3.2 Model 2: PCI Model 1 : Stepwise Regression Analysis
Model
2R Adjusted 2R
Sum of Squares
df Mean squares
F p
1 Regression Residual Total
0.235
0.230
179.519 583.668 783.187
1 155 156
179.519 3.766
47.673
0.000
Model 2: Independent variable: Compatibility Dependent variable: Intention
Table 5.19: Stepwise regression analysis of model 2
Coefficient Model Standardised Beta t p
1 Compatibility
0.485
6.905
0.000
Table 5.20: Stepwise regression analysis of model 2
The results of stepwise regression analysis are presented in tables 5.19, 5.20 and 5.21. The
results show that compatibility ( ? = .485, t = 6.905 and p < .001) is the only independent
variable that explains 23.5% ( 2R = 0.235) the variances in intention (shown in figure 5.5).
Table 5.21 shows other variables of model2 that had not been entered in to the equation.
As explained, Beta in is the standardised regression coefficient that would result if the
* p ? 0.05 ** p ? 0.01
-0.02 (-0.28)
0.20 * (2.22)
0.30 * * (3.30)
Perceived
self-efficacy
Perceived
ease of use
Perceived
risk
Perceived
usefulness
Intention
2R = 0.22
Actual use
-0.01(-0.13)

Factors influencing the adoption and usage of Internet banking: A New Zealand perspective
101
variables were entered into the equation. Figure 5.5 shows how variables are related to
intention.
Excluded variables
Model Beta in t p
1 Relative advantage Perceived ease of use Trialability Visibility
Result demonstrability
0.088 0.020 -0.024 -0.011 0.017
0.566 0.192 -0.327 -0.162 0.225
0.572 0.848 0.822 0.871 0.744
Model 2: Independent variable: Compatibility Dependent variable: Intention
Table 5.21: Stepwise regression analysis of model 2
Figure 5.5: Model 2 regression analysis Note. t-values for standardised path coefficient ( ? ) are shown in parenthesis
5.3.3 Summary of model analysis
Multiple regression analysis shows that both models have almost same explanation
capabilities. Extended TAM with two independent variables, perceived usefulness and self-efficacy
are found to explain 22% variance in intention, while PCI model with one independent
variable as compatibility can explain 23.8% variance in intention. The independent variable,
perceived ease of use, was found not significant in either model. Further, risk in TAM and
0.49 * (6.91
0.01(0.22)
0.02(0.19)
0. 09 (0.57)
Relative
advantage
Ease of use
Trialability
Visibility
Intention 2R = 0.238
Actual use
Compatibility
Result
demonstrability * p ? 0.05
0.01(.16)
-0.02(-0.32)

Factors influencing the adoption and usage of Internet banking: A New Zealand perspective
102
relative advantage, trialability, visibility and result demonstrability in PCI model, are found not
significant in explaining variances in intention to adopt or use Internet banking services.
5.4 Perceptions of Internet banking
In order to understand the differences in perceptions of Internet banking services between
users and non-users, this research carried out t-test and the Mann-Whitney U-test. As
mentioned earlier both parametric and nonparametric tests were carried in this research
due to ordinal data.
5.4.1 t-test of independent sample
The t-test is a parametric technique which can be used for either independent or dependent
samples (Hussey & Hussey, 1997). For carrying out t-test for independent samples, data
should meet the underlying assumptions and those are: data must be at least ordinal; data in
each data set are normally distributed; and the two populations have similar variance
(Hussey & Hussey, 1997). The t-test has some disadvantages. It is sensitive to data
interdependence in which case t-test has a tendency to indicate differences between groups
but in reality there are none (Livingstone, 2004). However, considering its robustness, i.e. it
provides a good estimates of significance even when there is fair amount of deviations
from its underlying assumptions and popularity over other statistical techniques
(Livingstone, 2004), t-test was used in this study to examine the differences in perceptions
of Internet banking between user and non-user groups.
Table 5.22 shows the results of t-test of independent samples. As recommended by SPSS
package, values associated with equal variances assumed are considered where F values were
significant at ? 0.05 levels in Levene’s test. For others, values in equal variances not assumed
were considered for evaluation. Thus values for risk, trialability, visibility and result
demonstrability, in assume equal variances were considered. Apart from visibility, perceptions of
Internet banking between users and non-users groups were significant. The mean difference
indicates that users’ perception of Internet banking was higher than non-users in all aspects
except risk. Similar results were found in Mann-Whitney U-test, described in the next section.

Factors influencing the adoption and usage of Internet banking: A New Zealand perspective
103
Levene’s test for equality of variance
t-test for equality means
95% confidence interval of the difference
F Sig. t df
Sig. (1- tailed)
Mean Difference
Std. Error Difference Lower Upper
EVA 10.384 0.002 -6.955 155.000 0.000 -1.880 0.270 -2.414 -1.346 PU EVNA -6.202 72.292 0.000 -1.880 0.303 -2.484 -1.276 EVA 4.697 0.032 -5.834 155.000 0.000 -1.246 0.214 -1.668 -0.824 EOU EVNA -5.218 72.742 0.000 -1.246 0.239 -1.722 -0.770 EVA 21.602 0.000 -5.985 155.000 0.000 -1.509 0.252 -2.006 -1.011 SE EVNA -5.179 68.301 0.000 -1.509 0.291 -2.090 -0.927 EVA 1.707 0.193 2.560 155.000 0.011 0.687 0.268 0.157 1.217 RSK EVNA 2.370 78.002 0.020 0.687 0.290 0.110 1.264 EVA 8.035 0.005 -6.199 155.000 0.000 -1.594 0.257 -2.102 -1.086 RA EVNA -5.576 73.553 0.000 -1.594 0.286 -2.164 -1.025 EVA 8.641 0.004 -6.845 155.000 0.000 -2.015 0.294 -2.596 -1.433 COM EVNA -6.216 74.959 0.000 -2.015 0.324 -2.660 -1.369 EVA 0.002 0.964 -3.730 155.000 0.000 -0.918 0.246 -1.404 -0.432 DEM EVNA -3.596 85.225 0.001 -0.918 0.255 -1.426 -0.411 EVA 1.654 0.200 -0.739 155.000 0.461 -0.162 0.220 -0.596 0.272 VIS EVNA -0.773 103.687 0.441 -0.162 0.210 -0.579 0.254 EVA 0.810 0.369 -2.689 155.000 0.008 -0.579 0.215 -1.004 -0.154 TRI EVNA
-2.556 82.591 0.012 -0.579 0.226 -1.029 -0.128
User = 108 Non-user = 49 EVA: Equal variance assumed EVNA: Equal variance not assumed Table 5.22: Result of independent sample t-test
PU: Usefulness, EOU: Ease of use, SE: Self efficacy, RSK: Risk, RA: Relative advantage, COM: Compatibility, Dem: Result
demonstrability, VIS: Visibility, TRI: Trialability
5.4.2 Mann-Whitney test
The Mann-Whitney U-test is the most commonly used alternative to t-test (Norusis, 1999).
It is powerful, compares the number of times a score of one of the samples ranked higher
that a score from the other sample (Bryman & Cramer, 1997) irrespective of the shapes of
distribution of data (Norusis, 1999). The two-tailed probability was used to find out if any
difference between users and non-users’ perceptions and if the scores between two groups
were statistically significant (Yuksel, 2003). The results of the Mann-Whitney U-test, as
shown in table 5.23, indicate that out of 9 areas assessed, eight are showing significant
differences between users and non-users’ perceptions. On the visibility there is no significant
difference between the mean scores of users and non-users. The possible explanation is the
limited coverage of Internet banking in public media. The mean scores between users and
non-users indicate that non-users are more negative on perceptions than users in all areas
except perception of risk. One possible reason for high mean scores in risk is that non-
users perceive higher risk involvement in carrying out banking transactions over the
Internet than existing user (Rotchanakitumunai & Speece, 2003).

Factors influencing the adoption and usage of Internet banking: A New Zealand perspective
104
Non-users User Variables Mean
Rank Sum of Ranks
Mean Rank
Sum of Ranks
Mann-Whitney
U
Sig.
(2-tailed)
Perceived usefulness Perceived Ease of use Self-efficacy Risk Relative advantage Compatibility Trialability Visibility Result Demonstrability
47.32 51.27 52.81 95.50 49.66 48.96 64.13 75.33 60.62
2318.50 2512.00 2587.50 4679.50 2433.50 2399.00 3142.50 3691.00 2970.50
93.38 91.58 90.88 71.51 92.31 92.63 85.75 80.67 87.34
10084.50 9891.00 9815.50 7723.50 9969.50
10004.00 9260.50 8712.00 9432.50
1093.500 1287.000 1362.500 1837.500 1208.500 1174.000 1917.500 2466.000 1745.500
0.000 0.000 0.000 0.002 0.000 0.000 0.006 0.492 0.000
User = 108 Non-user = 49 Table 5.23: Mann-Whitney U-test analysis
5.5 Chapter summary
This chapter presents the results of data analysis. Demographic profile together with
respondents’ perception of Internet banking was presented. Regression techniques were
employed to test the research hypotheses and capabilities of models in explaining the
variances in intention to adopt or use of Internet banking. The t-test and the Mann-
Whitney test were carried out to examine the difference in perceptions between users and
non-users of Internet banking.
The results of hypotheses testing provide support for all variables except risk in TAM and
visibility and result demonstrability in PCI model. Results of model analysis indicate that
extended TAM with perceived usefulness and self-efficacy as independent variables and PCI
model with compatibility as independent variable, have almost similar explanation capabilities
with PCI marginally higher than TAM. Over difference in perceptions, user and non-user
had significant differences except visibility. Users’ perception of Internet banking was higher
than non-user on all dimensions except risk, where the non-user group had higher risk
perceptions than existing users. All SPSS outputs can be found in Appendix H.

Factors influencing the adoption and usage of Internet banking: A New Zealand perspective
105
CCHHAAPPTTEERR 66 DDIISSCCUUSSSSIIOONN AANNDD CCOONNCCLLUUSSIIOONN
6.0 Introduction
This chapter begins with a discussion of the results found in chapter 5 and its comparison
with prior research works that either support or contradict with findings of this research
work. This is followed by conclusions that are drawn from this research work. Several
implications for both research and practice emerged and are discussed in following
sections. In the final part recommendations for future research are made.
6.1 Discussion
The objectives of this research are to identify the following:
1. Are the hypothesised relationships between variables in each of the models
supported?
2. Which model, TAM or PCI, can explain more variance in intention to adopt or use
Internet banking?
3. How do users and non-users differ in their perceptions of Internet banking?
Based of the research findings, mentioned in chapter 5, we will now discuss how results of
this study support the objectives.
Using two commonly applied and supported models of information technology adoption,
the Technology Acceptance Model (TAM) proposed by Davis (1989) and the Perceived
Characteristics of Innovating (PCI) model proposed by Moore and Benbasat (1991), this
research examines factors that influence the adoption or usage of Internet banking services
in New Zealand. The PCI model is an extension of Rogers’(1983) Diffusion of Innovation
(DOI) model, developed for studying information technology usage by adopters and
potential adopters. The conceptual similarity between TAM and PCI have motivated
current researcher to include PCI model along with TAM for this research.
This study has extended TAM, while retaining its parsimony and information system focus,
with two external variables: risk and self-efficacy. These variables were theoretically justified to
have influence on behavioural intention within the Internet banking context. On the other
hand, for PCI model we had a priori reason to believe that all the innovation characteristics
would be significant in affecting intention (Agarwal & Prasad, 1997). However, considering

Factors influencing the adoption and usage of Internet banking: A New Zealand perspective
106
the context of current study two constructs, image and voluntariness, were dropped from the
PCI model (discussed in detail in chapter 3).
Hypothesis
Dependant Variable
Independent Variable
This Study Prior Studies
H1a Intention Perceived Ease of use
Supported Tan et al (2000) in Singapore: Not supported Chau et al (2003) in Hong Kong: Perceived Ease of use is the single most determinant of acceptance Chan et al (2004) in Hong Kong : Not supported Gefen et al (2000) in USA: Supported Agarwal et al.(1997) in USA: Not supported
H1b Usefulness Perceived Ease of use
Supported Chau et al (2003) in Hong Kong: Perceived Ease of use influence attitude through perceived usefulness. Chan et al (2004) in Honk Kong: Supported Gefen et al (2000) in USA: Supported
H2 Intention Perceived usefulness
Supported Chau et al (2003) in Hong Kong: Supported Chan et al (2004) in Hong Kong: Supported
H3a Intention Perceived Self-efficacy
Supported Tan et al (2000) in Singapore: Supported Laurn et al (2004) in Hong Kong: Supported
H3b Ease of use Perceived Self-efficacy
Supported Chan et al (2004) in Hong Kong: Supported for both user and potential adopters Laurn et al (2004) in Hong Kong: Supported
H3c Usefulness Perceived Self-efficacy
Supported Laurn et al (2004) in Hong Kong: Supported
H3d Risk Perceived Self-efficacy
Supported Wang et al. (2003) in Taiwan: Supported
H4 Intention Risk Not supported Tan et al (2000) in Singapore: Supported Rotchanakitumunai (2003) in Thailand: Supported Doolin et al (2005) in New Zealand: Supported
H5a Usage_1 Intention Supported Davis et al (1989) in USA: Supported
H5b Usage_2 Intention Supported Davis et al (1989) in USA: Supported
H6 Intention Relative Advantage Supported Tan et al (2000) in Singapore: Supported Kolodinsky et al. (2001) in USA: Supported
H7 Intention Compatibility Supported Tan et al (2000) in Singapore: Supported Kolodinsky et al. (2001) in USA: Supported
H8 Intention Trialability Not supported Tan et al (2000) in Singapore: Supported Kolodinsky et al. (2001) in USA: Supported Agarwal et al.(1997) in USA: Weak support
H9 Intention Visibility Not supported Kolodinsky et al. (2001) in USA: Supported
H10 Intention Result Demonstrability
Supported Chan et al (2004) in Hong Kong: Supported for users but not for potential adopters
Table.6.1: Result of hypotheses testing with prior studies
A number of hypotheses concerning the adoption and use of Internet banking were
formulated after an extensive literature review. Hypotheses were tested using regression

Factors influencing the adoption and usage of Internet banking: A New Zealand perspective
107
analyses and results are summarised in table 6.1 together with the results of prior studies.
The results of the current study were found to be generally consistent with prior studies
except for risk, trialability and visibility. The possible explanations for lack of support for
these constructs are discussed later in this section. In addition, TAM and PCI were
compared on their explanation powers on the variances in intention. Both models
exhibited explanation of variances in intention slightly over 20%. Results of t-tests and
Mann-Whitney-U tests showed that there are differences in perceptions of Internet
banking between users and non-users of Internet banking services. A detailed discussion is
presented below.
6.1.1 Model 1 variables
The results of linear regression analysis indicate that perceived usefulness was found to be the
most significantly related factor affecting intention. This confirms the importance of
perceived usefulness in explaining adoption or use of a new technology. If Internet banking is
to be accepted by the users, they should perceive it to be useful, quicker and easier way of
carrying out financial transactions than traditional branch banking system. This finding
supports previous studies on Internet banking (Chan & Lu, 2004; Chau & Lai, 2003)
(shown in table 6.1). The perceived ease of use was found to affect intention significantly, which
confirms the importance of the role of ease of use variable that reflects users’ concern of
newness (Chau & Lai, 2003) of the Internet banking environment and confirms that
difficulty of use can discourage intention. Although the effects of ease of use on intention
concurs with the study of Chau et al.(2003), it contradicts the findings of other studies by
(Chan & Lu, 2004; Tan & Teo, 2000). A plausible reason could be that the perceived ease of
use-intention relationship is significant when Internet banking is new but diminishes over the
time as experience makes use of Internet banking services easier.
In addition, perceived ease of use exhibited a significant indirect effect on intention through
perceived usefulness. This suggests that the easier Internet banking is to use, the greater will be
a user’s feeling of determination and which in turn might motivate user to explore features
and benefits of service and thereby increase perceived system usefulness (Chan & Lu,
2004). Further, the findings of this study confirm that the indirect effect of perceived ease of
use on intention through perceived usefulness will be more weighted by existing users as their
experience with Internet banking system increases. In other words, difficulty of use can
discourage intention to adopt or use of a useful system but no amount of ease of use can
compensate for a system that is not found useful by users (Davis, 1989). The implication is

Factors influencing the adoption and usage of Internet banking: A New Zealand perspective
108
that New Zealand banks must not overemphasise ease of use at the expense of overlooking
the usefulness of Internet banking.
Self-efficacy was found to influence intention either directly or indirectly through its effects on
perceived ease of use and perceived usefulness. This finding supports prior research on Internet
banking (Chan & Lu, 2004; Luarn & Lin, 2004). To boost customer’s confidence and
enhance their self-efficacy in Internet banking, banks could organise demonstrations via video
presentation or arrange hands-on training to show the user-friendliness of such services.
Further, self-efficacy was found to have negative effect on risk, which confirms individual
with higher self-efficacy will perceive less risk than individual with low self-efficacy and is
consistent with prior findings (Wang et al., 2003). Therefore banks must focus in
enhancing customers’ self-efficacy, which would enhance adoption indirectly. However,
risk is not significantly related to intention, contradicting expectations and the findings of
prior studies(Bhatnagar, Misra, & Rao, 2000; Chan & Lu, 2004; Doolin, Dillon, Thompson,
& Corner, 2005; Jarvenpaa & Todd, 1997; Lim, 2003; Pavlou, 2001). One possible
explanation for such deviation in New Zealand could be that respondents did not perceive
any risk associated with Internet banking services since very few security violations have
been publicly reported so far (discussed in chapter 2). Another possible explanation could
be that the measures of risk used for this research might not suitable for the Internet
banking context, although they were adopted from prior studies conducted in other
countries. According to Liao et al (1999) getting a reliable measure on perceived risk in the
virtual banking environment is difficult. For example, some of the risk facets (time risk,
financial risk) were found to be salient concerns in the adoption of e-services (Featherman,
2002), while those were dropped in this study due to lack of loading in factor analysis.
6.1.2 Model 2 variables
The attribute compatibility emerged as the most significant factor affecting intention of
Internet banking, followed by relative advantage. This suggests that if Internet banking
services are perceived as a better channel than traditional banking systems, as consistent
with users’ needs and lifestyle, and as easy to use, then adoption of Internet banking is
more likely to take place. Support for relative advantage and compatibility concur with findings
of prior studies (Tan & Teo, 2000; S. Thompson, H, Tan, & Buk, 1997). A possible reason
for the lack of support for relative advantage in prior study (Agarwal & Prasad, 1997) could
be that respondents started using a technology without evaluating its benefits as a result of
high visibility, which created a willingness to put the innovation into initial use.

Factors influencing the adoption and usage of Internet banking: A New Zealand perspective
109
The lack of support for trialability suggests that respondents viewed it as an insignificant
factor that could motivate their intentions to adopt Internet banking. The role of trialability
in affecting intention is found mixed in prior studies, although it was found important for
initial use. Trialability was found insignificant in adoption of e-commerce services in
Thailand because of availability of too many options in the market place including access to
free trial, which leads to an unimportance of perceived trialability of e-commerce. On the
contrary, studies(Agarwal & Prasad, 1997; Moore & Benbasat, 1991; Tan & Teo, 2000)
found trialability as a predictor of technology usage since it is perceived as a risk free
exploration before adoption. However, the facility of trying out an innovation was available
in the initial days when of e-commerce or Internet banking services were getting
implemented. But the facility of ‘free trying out’ was diminished over the period of time
and to the best of our knowledge no banks in New Zealand provide such service. This is
possibly explaining why respondents perceived it as insignificant in motivating their
intentions.
The lack of significance of visibility in predicting adoption of Internet banking services
contradicts prior studies (Agarwal & Prasad, 1997; Moore & Benbasat, 1991) which viewed
visibility of an innovation to be instrumental in motivating user adoption. One possible
reason could be a lack of presence of Internet banking services in public media. In order to
enhance the adoption or usage rate of Internet banking services, banks need to increase
their presence in public media.
Result demonstrability was found to be a significant factor influencing customers’ intentions to
adopt Internet banking. This suggests that result demonstrability has contributed to user
perceptions of the tangible benefits of Internet banking. The relative advantage and result
demonstrability appeared to work in tandem with each other. If relative advantage of Internet
banking is perceived positive, result demonstrability might influence intention positively.
Alternately result demonstrability might affect intention negatively if relative advantage is perceived
negative (Agarwal & Prasad, 1997).
6.1.3 Model performance
The findings of this study show that model 1 (TAM) could explain 22% of variance in
intention with two variables. Out of these variables perceived usefulness could explain 19.5% and
self-efficacy only 2.5% of variance. The explanatory power is lower than that found in other
studies. For instance, in Chau and Hu (2001), Chan and Lu (2004), Luarn and Lin (2004)

Factors influencing the adoption and usage of Internet banking: A New Zealand perspective
110
and Mathieson et. al. (2001) studies, it was 42%, 53%, 82% and 43.8% respectively. Further
perceived ease of use and risk are found not associated with Internet banking intention in
model 1. For model 2 (PCI), compatibility is the only variable with explanation capability of
23.8% of variance in intention. All other variables are found non-significant.
The low explanation capabilities raise the issue of whether the constructs or the models
used in this study are suitable for the Internet banking context. Some researchers are of the
opinion that TAM’s fundamental constructs do not adequately reflect the comprehensive
set of technological and financial influences on users’ acceptance and intention to use
Internet-related technologies (Luarn & Lin, 2004; Moon & Kim, 2001). Therefore, the
incorporation of other constructs into TAM may provide a broader framework to
understand user acceptance or rejection of Internet banking services in New Zealand.
There are few studies that have used PCI model in the Internet banking context and results
are mixed (Liao et al., 1999; Tan & Teo, 2000). Most of these studies have used only a few
variables as Tornatzky and Klein (1982) concluded that relative advantage, compatibility,
and complexity are the most relevant constructs to adoption research. These three
constructs may fall short of capturing information on factors that influence users’
intentions to adopt and use Internet banking. It is recommended that a richer set of
variables is considered in order to enhance the explanatory power of this model in the
Internet banking context.
6.1.4 Internet banking perception
It is observed from the results that users and non-users perceive Internet banking
differently. Users have higher perceptions in all dimensions of Internet banking use except
risk. For most of these dimensions, it seems likely that this reflects that, as users of Internet
banking, they have a higher degree of ‘involvement’ (Barki & Hartwick, 1989) than non-
users with Internet banking services. For example, users of Internet banking presumably do
so because they perceive it as easy to use, as compatible with the way they manage their
finances, and that it is useful or provides them with a relative advantage in terms of carrying
out financial transactions compared with the traditional branch banking system (Chau &
Lai, 2003).
Similarly, the tangible recognition of the benefits of Internet banking as measured by result
demonstrability was found to be higher for users. With regard to trialability, users might have

Factors influencing the adoption and usage of Internet banking: A New Zealand perspective
111
explored the ramification of Internet banking services for themselves before using them
and thereby have higher perceptions of trialability than non-users. The difference in
perceptions of visibility of Internet banking between users and non-users was low, probably
reflecting that the limited presence of Internet banking in public media is not likely to have
motivated either users or non-users to adopt or use Internet banking services.
Technology adopters tend to hold stronger self-efficacy beliefs than non-adopters (Venkatesh
& Davis, 1996), which may explain why self-efficacy perceptions were found to be higher for
users of Internet banking. In contrast, higher levels of involvement or use of a technology
generally leads to a reduced perception of its risks and an increased willingness to adopt it
(Wang et al., 2003). This might explain why users’ perceptions of the risk associated with
Internet banking were lower than those of non-users (Wong & Chang, 2005).
6.2 Limitations
The present study has several limitations that should be noted before discussing the
implications of the results. Due to the limited number of studies on Internet banking in
New Zealand, the information available on the subject inevitably came from other
countries. This might not reflect actual situation of New Zealand due to the influence of
national environment on the users, which found to be an important factor that influences
intention (I. Brown et al., 2004).
Multiple items for each construct were used for collecting information, which might have
not included all possible alternatives. Despite effort given to amend survey instrument at
the time of development and after pre-testing, respondents perceived a few questions
differently than it was intended. Thus additional work is certainly required to further
validate these scales in Internet banking context. One of the fundamental assumptions of
research in the area of user acceptance of information systems is determined by system
usage, which is defined as the utilisation of information system (Venkatesh, 2000). There
has been some concern about how this construct has been conceptualised and
operationalised (Straub, Limayem, & Karahanna, 1995) and then predictability of TAM
(Venkatesh, 2000). However, considering support from existing body of research that
intention as a predictor of actual use, the issue of usage construct treated as less critical for
this research (Venkatesh, 2000).

Factors influencing the adoption and usage of Internet banking: A New Zealand perspective
112
Although the results of this study suggest several factors affecting intention to adopt or use
Internet banking services, caution needs to be taken while generalising current findings to
users in different geographical location since it is probably the first study of this nature in
New Zealand and consistency of the results could hardly be validated. Further, both the
research model has explanation power below 25% (2
R = 0.22 for TAM and 2
R = 0.23 for
PCI), which are low compared to results from prior TAM or PCI studies. The unexplained
over 75% indicates that there might be omission of some important factors that affect user
intentions.
Parametric tests were used for ordinal data, which is common in psychological and
business research. As an alternative, non-parametric tests were also carried out wherever
applicable to examine the differences. As mentioned before, for testing research models
only parametric technique was used since non-parametric technique is not supported by
SPSS and its use found limited to clinical research.
Web/e-mail surveys are now quite common (Kaplowitz et al., 2004; Yun & Trumbo, 2000)
and can offer shorter administration time and lower survey cost (Porter, 2004; Shaeehan &
McMillian, 1999; Yun & Trumbo, 2000). They would potentially have yielded a higher
response rate (Cobanoglu et al., 2001; Kaplowitz et al., 2004; Schaefer & Dillman, 1998)
especially when considering that 95% of New Zealand population has access to the
Internet (Porter, 2004). Nevertheless, a postal survey was used for this study because
numerous studies have compared the responses on postal and web-based surveys and have
shown mixed results. It is quite common in web/email surveys that recipients delete
messages from unknown sources without even reading them, considering them as junk
mail (Dillman, 2000). Drawing any conclusion about effects on response rate due to
adoption of postal survey is thus difficult.
6.3 Research contributions
Despite the limitations mentioned in an earlier section, this study and its findings form a
useful contribution to the body of knowledge regarding the adoption and usage behaviour
of Internet banking in New Zealand. To be useful, research findings must be validated in a
larger context and subsequently generalised or considered applicable in different settings.
Understandably, users from a different culture may demonstrate differences in technology
assessment and therefore their adoption decision factors might vary in a culture
characterised by differences in levels of individualism (Chau & Lai, 2003). As mentioned

Factors influencing the adoption and usage of Internet banking: A New Zealand perspective
113
there were very few studies on Internet banking and probably this is the first study of users’
adoption in New Zealand. In this connection, this research represents an effort towards
validating previous results in a different context by investigating the intention to adopt or
use of Internet banking services by users in New Zealand.
Although the survey instrument used in this study was adapted from prior research on
Internet banking and technology acceptance studies, rewording of items within variables
was required to suit Internet banking study. Further, the survey instrument was modified
suitably to incorporate the changes suggested by the faculty members and colleagues at the
time of pre-testing the questionnaire. Therefore, this survey instrument could be useful for
similar studies with possible changes as discussed in earlier section.
The response rate of this study appears to be better than postal surveys in recent studies,
which might be due to direct delivery of the survey instruments to householders’ letterbox
rather than using postal addresses. This reduces the chances of mail returns due to wrong
addresses. Future studies can adopt such an approach to the enhance response rate.
Utilisation of TAM with two additional external variables, self-efficacy and risk and PCI
model with almost all variables is possibly the first approach for determining factors that
influences user intention to adopt or use of Internet banking services and is therefore
considered to be a contribution of this study. Further, it might be the first approach to
investigate the role of determinants direct on to behavioural intention in Internet banking
context.
The New Zealand context provides a useful extension of research on Internet banking
services and comparison with previous studies conducted in other countries. The results of
this study contradict several studies that have used risk as a variable. Further studies are
needed to examine this difference.
6.4 Practical implications
The findings of this study hold important practical implications for banks and financial
organisations that are offering Internet banking. In particular, compared with perceived ease of
use, perceived usefulness might be important in technology acceptance. Banks should consider
launching campaigns to demonstrate the features of Internet banking services, its benefits
and how easy to use. When more people are aware of the availability, they are more likely

Factors influencing the adoption and usage of Internet banking: A New Zealand perspective
114
to discuss the advantages and disadvantages of Internet banking. Once users perceive that
advantages outweigh disadvantages, they are more likely to adopt or use the services. The
types of products and services offered should be those that are frequently used and
requiring minimum visit to bank branches. Further, banks should continuously innovate in
adding value to their service. For instance, personalisation was found to be a significant
influence on perceived usefulness and (Chau & Lai, 2003) recommended banks to allow
customers not only access their current and historic transactions but also other related
applications of their interest.
In addition to above, banks should introduce sending more personalised information in
order to build one-to-one relationship marketing and might include financial planning
services. Chau and Lai (2003) observed that customer prefer multiple services or “one-stop
comprehensive financial service” instead of single or simple tasks/transactions. Therefore banks
need to build link with other services or enter into business agreement with major vendors
in the market to provide all banking and other financial-related services to their customers.
This might motivate customers to visit more frequently to consolidate the usefulness of
Internet banking services. Conversely, potential customers either will not adopt services or
will select a competitor bank for Internet banking services.
With regard to perceived ease of use, banks should design sophisticated websites to provide
Internet banking services and these Wes sites must be easy to use so that users get
motivated to explore the services and its features. This will lead to increase perceived
system usefulness (Teo et al., 1999) and consequently a favourable users intention on
Internet banking will be created, which will eventually motivate them to spend more time
on banking services (Chau & Lai, 2003). Further, access to the banking websites must be
quick and 24 hours a day. If a user finds difficulty in getting access or gets frustrated due to
slower connection speed, his or her perception on the ease of use will be negative and
thereby reduces the chances of his re-visit or reuse that website. Therefore, banks must
emphasise on improving the quality and performance of their website in terms of
availability at all times with response time.
In order to boost customer’s confidence and enhance their self-efficacy in Internet banking,
banks could organise demonstrations via video presentation or arrange hands-on training
to show the user-friendliness of such services. Such an initiative would help customers in
developing positive perceptions of ease of use and usefulness of Internet banking services.

Factors influencing the adoption and usage of Internet banking: A New Zealand perspective
115
Further individuals with higher self-efficacy will perceive less risk than individuals with low
self-efficacy (Chan & Lu, 2004; Wang et al., 2003). Chan and Lu (2004) have identified that
use of automatic teller machine (ATM) as the most popular channel in Hong Kong and
therefore they recommended banks for arranging demonstration of Internet banking
through web-enabled ATM (Tedeschi, 2005). New Zealand banks may also adopt similar
approach to enhance self-efficacy of their customers.
The results of the second model suggest that compatibility might be more significant in
adoption or usage of Internet banking than its relative advantage. Therefore, banks should
design and deliver their products and services in a way that is consistent with customers’
past experience, beliefs and the way they are accustomed to work (Chau & Lai, 2003). For
instance, New Zealand customers prefer Internet banking services for all activities other
than home loan and credit card services (refer section 2.3.6 of chapter 2) and also one-to-
one service. As discussed before, personalisation of a website would assist banks to satisfy
their customers further. Recognising such preferences would lead to a fit between banking
services and the environment in which it will be utilised (Agarwal & Prasad, 1997).
With regard to relative advantage and result demonstrability, it is not only important for banks to
promise the benefits of Internet banking services, but equally important to deliver on those
promises. Banks could invest in campaigns and arrange information sessions to
demonstrate the features of Internet banking services, and its benefits over traditional
channels. Unless customers are convinced about its advantages, no amount of external
information propagation will produce results (Agarwal & Prasad, 1997). Apart from
implementing trouble-free access and a highly responsive website, banks might continue to
investigate offering Internet banking services at a reduced cost to customers, including
cheque cancellation. Since the operating cost of Internet banking is lower that any other
channels of service (refer section 2.1 of chapter 2), banks may lower fees for wire transfers
or may reduce home loan interest rates or may pay higher interest rates on deposits that
can only be operated over the Internet.
In order to enhance the adoption or usage rate, banks might target more on the group of
Internet-experienced non-users of Internet banking. This should enable banks to cover the
majority of non-user customers (about 84% in this study) and might take less time due to
their prior Internet experience.

Factors influencing the adoption and usage of Internet banking: A New Zealand perspective
116
Besides promoting Internet banking services, banks need to invest in enhancing resources
to maintain and improve upon such services. In this process banks should allocate
sufficient resources on staff education and training, so that the staff can explain and
encourage non-users of Internet banking services. Further, banks need to equip themselves
with more powerful and advanced computer technology with minimum downtime to
support any increase in banking transactions over the Internet. Furthermore, banks can
introduce mobile banking to supplement Internet banking. Currently, only ASB bank
provides such services in New Zealand, with limited options.
6.5 Recommendations for future study
The discussed limitations and implications single out several avenues for future research. In
the area of adoption and usage of Internet banking services in New Zealand, more works
need to be carried out. This study has investigated intentions of individuals from the
Auckland area, so future studies can build upon this study through replication across
samples from different parts of New Zealand as well as different types of users, such as
corporate customers. A comparison can be made between individual customer and
corporate customer in terms of determinants influencing their adoption or usage
behaviour.
Although the measurement scales used in this study were previously tested in technology
acceptance and Internet banking samples, reliabilities for visibility and trialability were
experienced low. Furthermore wording of items for self-efficacy, risk, visibilities and trialability
were consistent with previous studies, but validity for these scales were found low in this
study. Thus, characteristics of these scales need to be investigated. Future study may use
both subjective and objective measures for research variables, since self-reported scale
measure suggests the possibility of method bias. Alternately, additional instrument
development research could seek to build these scales.
Given that the results of this study show that TAM can explain 22% and PCI can explain
23.8% of the variances in intention, further studies can be carried out to validate and
improve these models by incorporating additional external constructs to suit Internet
banking study. Prior research suggested trust-based construct (Gefen, Karahanna, &
Straub, 2003), perceived financial cost (Luarn & Lin, 2004), subjective norms (Chan & Lu,
2004) and personalisation, alliance services, task familiarity and accessibility (Chau & Lai,
2003) are possible candidates. These constructs can be used with TAM in future research.

Factors influencing the adoption and usage of Internet banking: A New Zealand perspective
117
Issues of privacy and security risk of Internet banking services, although not significant in
this study, need to be further tested in future research as other studies on Internet banking
or e-shopping have found risk is a significant barrier to adoption. A final suggestion for
future research should focus on longitudinal investigations involving samples from
different locations or of different characteristics.
As an alternative approach suggested by Agarwal and Prasad (1997), a unitary model may
not be suitable to explain users’ intention to adopt the services in future adopt or current
usage intentions and therefore different models might be necessary to develop that should
include the nature of the technology, as not all perceptions may be salient for each
technology. For instance, characteristic of Internet banking services is different to the e-
shopping context. For instance risk was found significant in e-shopping study in New
Zealand whereas found insignificant for Internet banking study.
6.6 Conclusion
As more and more banking and financial institutions implement Internet banking services,
it is of paramount importance for these organisations to identify factors that influence
users’ intention to adopt or use those services. This study extended TAM with risk and self-
efficacy and also used Moore and Benbasat’s (1991) PCI model without image and voluntariness
constructs. Models were empirically tested against data collected from 157 subjects using
postal survey. Results were found consistent with prior studies except risk, which was
found hindered adoption or use of online banking in USA, Thailand and Hong Kong.
Further visibility and trialability were found insignificant for Internet banking context while
Self-efficacy was found significant. Both the models were found to have similar capabilities in
explaining the variance in intention to use Internet banking, although this was lower than
expected and also lower than recent studies in other countries. Non-users’ perceptions of
Internet banking were lower than users in all aspects except perception of risk.

Factors influencing the adoption and usage of Internet banking: A New Zealand perspective
118
RREEFFEERREENNCCEESS AcNielsen. (2001). Online Banking Surge Ahead. Retrieved 14/3/2005, 2005, from
http://asiapacific.acnielsen.com.au
AcNielsen. (2002a). 480,000 New Zealanders now take it to the bank online. Retrieved
15/03/2005, 2005, from www.acnielsen.co.nz
AcNielsen. (2002b). AcNielsen Consult Online Banking Research. Retrieved 01/02/2005, 2005,
from www.consult.com.au
AcNielsen. (2004). 76% of frequent online Australia now banking over the 'Net and 80% have high
interest savings accounts'. Retrieved 08/03/2005, 2005, from
http://www.acnielsen.com.au
Adams, N., C. (2004). Assignment ratio coding to nominal or ordinal data: inferring attributes from one
to the other. Paper presented at the Allied Academies International Conference, Maui,
Hawaii.
Agarwal, R., & Karahanna, E. (2000). Time flies when you're having fun: Cognitive
absorption and beliefs about Information technology usage. MIS Quarterly, 24(4),
665-694.
Agarwal, R., & Prasad, J. (1997). The role of innovation characteristics and perceived
voluntariness in the acceptance of information technologies. Decision Science, 28(3),
557-582.
Agarwal, R., & Prasad, J. (1998). A conceptual and operational definition of personal
innovativeness in the domain of information technology. Information Systems Research,
9(2), 204-301.
Agarwal, R., Sambamurthy, V., & Stair, R., M. (2000). Research report: The evolving
relationship between general and specific computer self-efficacy - An empirical
assessment. Information Systems Research, 11(4), 418-430.
Ajzen, I. (1985). From intention to action: A Theory of planned behaviour. In action control: from
cognition to behaviour Kuhland, J., and Beckman, J(eds): Springer, Heidelberg.
Ajzen, I. (1991). The theory of planned behaviour. Organizational Behaviour and Human
Decision Processes, 50(2), 179-211.
Ajzen, I., & Fishbein, M. (1980). Understanding attitude and predicting social behaviour. NJ:
Prentice-Hall.
Ajzen, I., & Madden, T., J. (1986). Prediction of goal-directed behaviour: Attitude,
intentions, and perceived behavioural control. Journal of Experimental Social Psychology,
22, 453-474.

Factors influencing the adoption and usage of Internet banking: A New Zealand perspective
119
Aladwani, A. (2001). Online banking: a field study of drivers, development challenges and
expectations. International Journal of Information Management, 21(3), 213-225.
Argyrous, G. (1996). Statistics for Social Research: Macmillan Education Australia Pty Ltd.
AustralianBusinessIntelligence. (2003, 30/10/2003). More banking via Internet. Australian
Business Intelligence, October 2003.
Awamleh, R., Evans, J., & Mahate, A. (2003). Internet Banking in Emergency Markets.
Journal of Internet Banking and Commerce, 8(1).
Ayida, S., A, & McCledon, M., J. (1990). Response effects in mail surveys. Public Opinion
Quarterly, 54, 229-247.
Babbie, E. (1990). Survey Research (Vol. 2nd edition). California: Wadsworth publishing
company.
Baker, B., O, Hardyck, C., D, & Petrinovich, L., F. (1966). Weak measurement vs. strong
statistics: An empirical critique of S.S Steven's propositions on statistics. Educational
and Psychological Measurement, 26, 291-309.
Bandura, A. (1977). Self-efficacy: Towards a unifying of behaviour change. Psychological
Review, 84, 191-215.
Barki, H., & Hartwick, J. (1989). Rethinking the concept of user involvement. MIS
Quarterly, 13(1), 53-63
Barwise, P. (1997). " Editorial". The Journal of Brand Management(4), 220-223.
Bean, A., G, & Roszkowski, M., J. (1995). The long and short of it. Marketing Research, 7(1),
20-26.
Beston, A. (2005, 12/03/05). Online banking users locked out. The New Zealand Herald.
Bhatnagar, A., Misra, S., & Rao, H., Raghav. (2000). On risk, convenience and Internet
shopping behaviour. Communication of ACM, 43(11), 98-105.
Bishop, G., Hippler, H., J, Schwarz, N., & Strack, F. (1988). A comparison of response effects in
self-administered and telephone surveys. New York: Wiley.
Borgatta, E., F, & Bohrnstedt, G., W. (1980). Level of measurement: Once over again.
Sociological Methods and Research, 9, 147-160.
Bradley, L., & Stewart, K. (2002). A delphi study of the drivers and inhibitors of Internet
banking. International Journal of Bank Marketing, 20(6), 250-260.
Brown, I., Hoppe, R., Mugera, P., & Newman, P., Stander, Adrie. (2004). The impact of
national environment on the adoption of Internet banking: Compare Singapore and
South Africa. Journal of Global Information Management, 12(2), 1-26.
Brown, J. (2001, 12/12/2001). Web banking moves to the mainstream. Online Financial
Innovations, 2004, 48.

Factors influencing the adoption and usage of Internet banking: A New Zealand perspective
120
Bryman, A., & Cramer, D. (1997). Quantitative Data Analysis with SPSS for Windows. New
York: Routledge.
Bughin, J. (2001). E-push or e-pull? laggards and first movers in European on-line banking.
Journal of Computer Mediated Communication, 7(1), 1-19.
Burnham, B. (1997). Internet banking: a global study of potential. NY, New York: Booz Allen &
Hamilton Inc.
Carlson, J., Furst, K., Lang, W., W, & Nolle, D., E. (2001). Internet banking: Market
Developments and Regulatory issues. Paper presented at the Society of Government
Economists Conference 2000, Washington, DC.
Cases, A., S. (2002). Perceived risk and risk-reduction strategies in Internet shopping. The
International Review of Retail Distribution and Consumer Research, 12(4), 375-394.
Centeno, C. (Cartographer). (2003). Adoption of Internet services in the enlarged European Union
Chan, S., Cheung, & Lu, t., Ming. (2004). Understanding Internet Banking Adoption and
Use behaviour: A Hong Kong perspective. Journal of Global Information Management,
12(3), 12-43.
Chau, K., Y, Patrick. (2000). E-commerce user behaviour model: an empirical study. Journal
of Management Information Systems, 13(2), 185-204.
Chau, K., Y, Patrick, & Hu, P., J, H. (2001). Information Technology acceptance by
individual professionals: A model comparison approach. Decision Science, 32(4), 699-
719.
Chau, K., Y, Patrick, & Lai, S., K,Vincent. (2003). An empirical investigation of the
determinants of user acceptance of Internet Banking. Journal of Organizational
Computing and Electronic Commerce, 13(2), 123-145.
Cheung, S., F, Chan, K., S, & Wong, S., Y. (1999). Relaxing the Theory of Planned
Behavior in understanding waste paper recycling. Environment and Behaviour, 31(5),
587-612.
Chin, W., W, & Gopal, A. (1995). Adoption intentions in GSS: relative importance of
beliefs. Database for Advances in Information Systems, 26(2-3), 189-211.
Christiansen, H. (2001). Electronic finance: Economics and Industrial factors. Organisation
for Economic Co-operation and Development, 2(November 2001).
Chung, W., & Paynter, J. (2002). An evaluation of Internet Banking in New Zealand. Paper
presented at the 35th Annual Hawaii International Conference of System Services -
2002.
Church, H., Allan. (1993). Estimating the effect of incentives on mail survey response rates:
A meta analysis. Public Opinion Quarterly, 57(1), 62-79.

Factors influencing the adoption and usage of Internet banking: A New Zealand perspective
121
Cobanoglu, C., Warde, B., & Moreo, J., Patrick. (2001). A comparison of mail fax and web-
based survey methods. International Journal of Market Research, 43(4), 441-452.
Compeau, D., & Higgins, C., A. (1995). Computer self-efficacy: Development of a measure
and initial test. MIS Quarterly, 19(2), 189-211.
Compeau, D., Higgins, C., A, & Huff, S. (1999). Social cognitive theory and Individual
reactions to computing technology: A longitudinal study. MIS Quarterly, 23(2), 145-
158.
Cooke, P., & Kroeze, J., H. (2004). The impact of the Internet on organizational culture within the
IT industry. Paper presented at the SAICSIT 2004, South Africa.
Cooper, D., R, & Schendler, P., S. (2001). Business Research Methods (7th ed.). Boston:
McGraw-Hill/Irwin.
Corrocher, N. (2001). Internet diffusion dynamics in Europe: demand scenarios and the digital divide:
Socio-economic trends assessment for the digital revolution.
Courtier, E., & Gilpatrick, K. (1999). Home banking Missteps? Credit Union Management,
22(3), 10-12.
CRMToday. (2003a). New eMarketer Interactive banking report released. Retrieved 10/02/2005,
2005, from www.crm2day.com
CRMToday. (2003b). Online banking adoption hindered by consumer security fear. Retrieved
10/02/2005, 2005, from www.crm2day.com
CRMToday. (2004). Financial insights Forecasts rapid Internet banking usage through 2007.
Retrieved 21/02/2005, 2005, from www.crm2day.com
Cronin, M., J. (1997). Banking and finance on the Internet. New York: Van Nostrand Reinhold.
Cui, W. W. (2003). Reducing error in mail surveys. Practical assessment research & evaluation,
8(18).
Czaja, R., & Blair, J. (1995). Designing survey: a guide to decisions and procedures: Pine forge press.
Davis, F., D. (1989). Perceived Usefulness, Perceived Ease of use, and user acceptance of
Information technology. MIS Quarterly, 13(3), 319-340.
Davis, F., D, Bagozzi, P., Richard, & Warshaw, R., Paul. (1989). User acceptance of
computing technology: a comparison of two theoretical models. Management Science,
35(8), 982-1003.
Davis, F., D, & Venkatesh, V. (1996). A critical assessment of potential measurement
biases in the technology acceptance model: three experiments. International Journal of
Human Computer Interaction, 45, 19-45.
Diem, G., Keith. (2002). Choosing a data collection method for survey research. Retrieved
10/12/2004, 2004, from http://www.rce.rutgers.edu

Factors influencing the adoption and usage of Internet banking: A New Zealand perspective
122
Dillman, D., A. (2000). Mail and Internet surveys: the tailored design method (Vol. 2nd edition).
New York: John Wiley & sons, Inc.
Dillman, D., A, Singer, E., Clark, J., R, & Treat, J., B. (1996). Effects of benefits appeals,
mandatory appeals and variation of confidentiality on completion rates for census
questionnaires. Public Opinion Quarterly, 60, 376-389.
Dillman, D., A, Tortora, R. D., Conradt, J., & Bowker, D. K. (1998). Influence of plain vs. fancy
design on response rates for Web surveys. Paper presented at the Paper presented at the
statistical meetings, Dallas, Texas.
Doolin, B., Dillon, S., Thompson, F., & Corner, J., L. (2005). Perceived risk, the Internet
shopping experience and online purchasing behaviour: A New Zealand perspective.
Journal of Global Information Management, 13(2), 66-88.
Douglas, J.-V. (2003). Banking of the Web 2003. ZDNet Australia(March 2003), 1-14.
Doyle, K. J. (2003). Introduction to survey Methodology and design. Retrieved 25/12/2004, 2004,
from www.wpi.edu
Eames, D. (2005). Internet banking quite secure, never been infiltrated. The New Zealand
Herald.
Eastin, M., S. (2002). Diffusion of e-commerce: an analysis of the absorption of four e-
commerce activities. Telematics and Informatics, 19(3), 251-267.
Eastin, M., S, & LaRose, R. (2000). Internet self-efficacy and the psychology of the digital
divide. JCMC, 6(1), 1-18.
e-Marketer. (2002). Interactive banking: Integrating online into traditional channels. Retrieved
28/02/2005, 2005, from http://www.emarketer.com
e-Marketer. (2004). Can online banking reach widespread US adoption? Retrieved 21/02/2005,
2005, from uuu.emarketer.com
Esposito, L., James. (2002). A framework relating questionnaire design and evaluation processes to
sources of measurement error. Paper presented at the 2002 International Conference on
questionnaire development, evaluation and testing methods (QDET), Charleston,
South Carolina, USA.
Featherman, S., Mauricio. (2002). Predicting e-services adoption: a perceived risk facets perspective.
Paper presented at the Eighth Americas Conference on Information Systems,
Dallas, Texas.
Ferrier, S., & Watson, G. (1997). An Evaluation of the Effectiveness of Environmental
Surrogates and Modelling Techniques in Predicting the Distribution of Biological
Diversity. Department of Environment, Sports and Territories.

Factors influencing the adoption and usage of Internet banking: A New Zealand perspective
123
Finextra. (2005a). Online bank viability at risk as phising scams proliferate. Retrieved 10/02/2005,
2005, from www.finextra.com
Finextra. (2005b). Online banking services key to bank selection. Retrieved 10/02/2005, 2005,
from www.finextra.com
Finextra. (2005c). Web banking growth stalls in Canada. Retrieved 10/02/2005, 2005, from
www.finextra.com
Finkelstein, D., B, Gollub, J., & Cherry, M., J. (2002). Normalization and Systematic
Measurement error in cDNA Microarray data.Unpublished manuscript.
Fishbein, M., & Ajzen, I. (1975). Belief, Attitude, Intention and Behaviour: An Introduction to theory
and research. MA: Addition-Wesley.
Fox, S. (2002, November 2002). Online banking. Retrieved 01/01/2005, 2005, from
www.pewinternet.org
Frust, K., Lang, W., W, & Nolle, D., E. (2000). Internet Banking: Developments and Prospects:
Office of the Comptroller of the currency(September).
Gefen, D., Karahanna, E., & Straub, W., Detmar. (2003). Trust and TAM in online
shopping: An imntegrated model. MIS Quarterly, 27(1), 51-90.
Gefen, D., & Straub, W., Detmar. (1997). Gender differences in perception and use of e-
mail: an extension to the technology acceptance model. MIS Quarterly, 21(2), 389-
400.
Gefen, D., & Straub, W., Detmar. (2000). The relative importance of perceived ease of use
in IS adoption: A study of e-commerce adoption. Journal of the Association for
Information Systems, 1(October), 1-30.
Gerrard, P., & Cunningham, B., J. (2003). The diffusion of Internet banking among
Singapore consumers. International Journal of Bank Marketing, 21(1), 16-28.
Goh, H., P. (1995). The diffusion of Internet in Singapore. Singapore: National University of
Singapore, Faculty of Business Administration.
Goodhue, L., Dale. (1998). Development and measurement validity of a task-technology fir
instrument for user evaluations of information systems. Decision Science, 29(1), 105-
138.
Goodhue, L., Dale, & Loiacono, T., Eleanor. (2002). Randomising survey question order vs.
grouping of questions by construct: An empirical test of the impact on apparent reliabilities and
links to related constructs. Paper presented at the Proceedings of the 35th Hawaii
International conference of system sciences - 2002, Hawaii.
Gourova, E., & Burgelman, J.-C. (2002). Information and communication technologies: Institute
for Prospective Technological Studies.

Factors influencing the adoption and usage of Internet banking: A New Zealand perspective
124
Grapentine, T. (1986). Managing Multicollinearity. Retrieved 20/05/2005, 2005, from
www.grapentine.com/articles
Grealish, A. (2002). Online banking adoption: beyond the tip of the iceberg. Retrieved 22/02/2005,
2005, from www.celent.com
Groves, R. M., Singer, E., & Corning, A. D. (2000). Leverage-Salience theory of survey
participation. Public Opinion Quarterly, 64, 299-308.
Groves, R. M., Singer, E., Corning, A. D., & Bowers, A. (1999). A laboratory approach to
measuring the effects on survey participation of interview length, Incentives,
differential incentives, and refusal conversion. Journal of Official Statistics, 15(2), 251-
268.
Guru, B., Krishnan, Shanmugam, B., Alam, N., & Perera, C., J. (2003). An Evaluation Of
Internet Banking Sites In Islamic Countries. Journal of Internet Banking and Commerce,
8(2).
Hager, M., A, Wilson, S., Pollak, T., H, & Rooney, P., Michael. (2003). Response rates for
mail surveys of nonprofit organisations: A review and empirical test. Nonprofit and
Voluntary Sector Quarterly, 32(2), 252-267.
Hair, J., F, Jr, Anderson, R., E, Tatham, R., L, & Black, W., C. (1998). Multivariate Data
Analysis (Fifth ed.). New Jersey: Prentice-Hall, Inc.
Hall, S., D, Whitmire, R., E, & Knight, E., L. (1999). Using Internet for Retail Access:
Banks found lagging. Journal of retail banking services, 21(1), 51-55.
Harrison, T. (2000). Financial Services Marketing. Wiltshire: Prentice Hall.
Hartwick, J., & Barki, H. (1994). Explaining the role of user participation in information
system use. Management science, 40, 440-465.
Henfridssen, O., & Holmstrom, H. (2002). E-commerce in inter-networked organisations:
A case study of customer involvement throughout the computer gaming value
chain. Communication of ACM, 33(4), 1-13.
Herald, T. N. Z. (2005, 08/02/2005). Customers of small banks most satisfied. The New
Zealand Herald.
Hong, W., Thong, J., Y, L, Wong, W., M, & Tam, K., Y. (2001). Determinants of user
acceptance of digital libraries: An empirical examination of individual differences
and system characteristics. Journal of Management Information Systems, 18(3), 97-124.
Howcroft, B., Hamilton, R., & Hewer, P. (2002). Consumer attitude and the usage and
adoption of home-banking in the United Kingdom. International Journal of Bank
Marketing, 20(3), 111-121.

Factors influencing the adoption and usage of Internet banking: A New Zealand perspective
125
Hsu, M., Hsiang, & Chiu, C., Min. (2004). Internet self-efficacy and electronic service
acceptance. Decision Support Systems, 38, 369-381
Hussey, J., & Hussey, R. (1997). Business research: A practical guide for undergraduate and
postgraduate student. New York: Palgrave.
Igbaria, M., & Iivari, J. (1995). The effects of self-efficacy on computer usage. OMEGA,
23(6), 587-605.
Jarvenpaa, S., L, & Todd, P., A. (1997). Consumer Reactions to Electronic Shopping on the
World Wide Web. Journal of Electronic Commerce, 1(2), 59-88.
Jasimuddin, S., M. (2001). Saudi Arabian Banks on the Web. Journal of Internet Banking and
Commerce, 6(1).
Johnson, J., M. (2005). Visual analog scales: Part III.Unpublished manuscript.
Kalkun, M., & Kalvet, T. (2002). Digital divide in Estonia and how to bridge it? Tallinn: Emor
and PRAXIS centre for polity studies.
Kaplowitz, D. M., Hadlock, D. T., & Ralph, L. (2004). A comparison of Web and mail
survey response. Public Opinion Quarterly, 68(1), 94-101.
Karahanna, E., & Straub, W., Detmar. (1999). Information technology adoption across
time: A cross- sectional comparison of pre-adoption and post-adoption beliefs.
MIS Quarterly, 23(2), 183-213.
Kehoe, C., M, & Pitkow, J., E. (1996). Surveying the territory: GVU’s five www user
survey’s. The Worldwide Web Journal, 1(3), 77-84.
Kim, K., & Prabhakar, B. (2000). Initial trust, perceived risk and the adoption of Internet banking.
Paper presented at the Proceedings of the 21st International Conference of
Information Systems, Brisbane, Australia.
Klopping, M., Inge, & McKinney, E. (2004). Extending the Technology Acceptance Model
and Task-Technology fit model to consumer e-commerce. Information Technology
Learning and Performance Journal, 22(1), 35-48.
Knol, W., H, C, & Stroeken, J., H, M. (2001). The diffusion and adoption of information
technology in small- and medium - sized enterprises through IT scenarios.
Technology Analysis & Strategic Management, 13(2), 227-246.
Kolodinsky, J., & Hogarth, J., M. (2001). The adoption of electronic banking technologies
by American consumers. Consumer Interests Annual, 47, 1-9.
Koufaris, M. (2002). Applying the technology acceptance model and flow theory to online
consumer behavior. Information Systems Research, 13(2), 205-223.
Laitinen, E., K. (2002). A dynamic performance measurement system: evidence from small
Finish technology companies. Scandinavian Journal of Management, 18, 65-69.

Factors influencing the adoption and usage of Internet banking: A New Zealand perspective
126
Lebihan, R. (2004). Online banking growth moves to a new phase. Financial Review(2004), 1-
3.
Lederer, L., Albert, Mauphin, J., Donna, Sena, P., Mark, & Zhuang, Y. (2000). The
technology acceptance model and the world wide web. Decision Support Systems, 29,
269-282.
Lee, E.-J., & Lee, J. (2000). Have'nt adopted electronic financial services yet? The
acceptance and diffusion of electronic banking technologies. Journal of Financial
Counselling and Planning, 11(1), 49-60.
Leelerc, G., & Pireaux, J., J. (1995). The use of least squares for XPS peak parameters
estimation. Journal of Electron Spectroscopy and Relative phenomena, 71, 179-190.
Legris, P., Ingham, J., & Collerette, P. (2003). Why people use information technology? A
critical review of the technology acceptance model. Information and management, 40,
191-204.
Lehmann, D., R, & Markman, A., B. (2001). Entrenched knowledge structures and
consumer response to new products. Journal of Marketing Research, 38(1), 14-29.
Liao, S., Shao, Y., P, Wang, H., & Chen, A. (1999). The adoption of virtual banking: an
empirical study. International Journal of Information Management, 19, 63-74.
Lim, N. (2003). Consumers' perceived risk: sources versus consequences. Electronic commerce
research and application, 2, 216-228.
Lin, C., & Pervan, G. (2003). The practice of IS/IT benefits management in large
Australian organisations. Information & Management, 2003(1-12).
Livingstone, E., H. (2004). Who was student and why do we care so much about his t-test?
Journal of Surgical Research, 118, 58-65.
Lopez, D., A, & Manson, D., P. (1997). A study of individual computer self-efficacy and
perceived usefulness of the empowered desktop information system. Journal of
Interdisciplinary Studies, 10, 83-92.
Luarn, P., & Lin, H., Hsin. (2004). Towards an understanding of the behavioural intention
to use mobile banking. Computers in Human Behavior, 1-19
Madden, T., J, Ellen, P., S, & Ajzen, I. (1992). A comparison of the Theory of planned
behaviour and the Theory of reasoned action. Personality and Social Psychology Bulletin,
18, 3-9.
Mason, R., Carlson, J., E, & Tourangeau, R. (1994). Contrast effects and subtraction in
part-whole questions. Public Opinion quarterly, 58, 569-578.

Factors influencing the adoption and usage of Internet banking: A New Zealand perspective
127
Mathieson, K. (1991). Predicting User Intentions: Comparing the Technology Acceptance
Model with the Theory of Planned Behaviour. Information Systems Research, 2(3), 173-
191.
Mathieson, K., Peacock, E., & Chin, W., W. (2001). Extending the technology acceptance
model: The influence of perceived user resources. Database for advances in information
systems, 32(3), 86-112.
Mattila, M., Karjaluoto, H., & Pento, T. (2003). Internet banking adoption among mature
customers: early majority or laggard. Journal of Services Marketing, 17(5), 514-528.
McStay, J. (2003). Online banking in New Zealand - A comparison. Retrieved 15/03/2005, 2005,
from www.createonline.co.nz
Mearian.L. (2001). Despite growth in online usage, banks urged not to forgot their roots,
Computer World.
MISC. (2004). Internet Banking. Retrieved 08/03/2005, 2004, from
www.marketintelligence.com.au
Mitchell, D., P. (1996). Making sense of computer aided learning research: A critique of the pseudo-
scientific method. Retrieved 07/06/05, 2005, from http://www.media.uwe.ac.uk
Moon, J., W, & Kim, Y., G. (2001). Extending the TAM for a world-wide-web context.
Information and Management, 38(4), 217-230.
Moore, C., Gary, & Benbasat, I. (1991). Development of an instrument to measure the
perceptions of adopting an information technology innovation. Information Systems
Research, 2(3), 192-222.
Moore, C., Gary, & Benbasat, I. (2001). Development of an instrument to measure the
perceptions of adopting an information technology innovation, Information Systems
Research (Vol. 2, pp. 192-222).
Mukherjee, A., & Nath, P. (2003). A model trust in online relationship banking. International
Journal of Bank Marketing, 21(1), 5-15.
Newman, I., & McNeil, K. (1998). Conducting survey research in social science. New York:
University press of America inc.
Newton, R., Rae, & Rudestam, E., Kjell. (1999). Your statistical consultant. Thousands Oaks,
California: Sage Publications Inc.
Norusis, M., J. (1999). SPSS 9.0 Guide to data analysis. New Jersey, USA: Prentice Hall.
Nunnally, J., C. (1967). Psychometric theory. New York: McGraw-Hill.
Nunnally, J., C. (1978). Psychometric Theory. New York: McGraw-Hill.
OneNews. (2005). Internet banking risks highlighted. Retrieved 17/03/2005, 2005, from
www.tvnz.co.nz

Factors influencing the adoption and usage of Internet banking: A New Zealand perspective
128
Pavlou, A., Paul. (2001). Consumer intentions to adopt electronic commerce- incorporating trust and risk
in the technology acceptance model. Retrieved January 2005, Paper presented at DIGIT
workshop, from http://www.mis.temple.edu/digit
Pavlou, A., Paul, & Featherman, S., Mauricio. (2002). Predicting E-services adoption: a perceived
risk facets perspectives. Paper presented at the Eighth Americas Conference on
Information Systems, Florida, USA.
Pease, W., & Rowe, M. (2004). Diffusion Of Innovation – The Adoption of Electronic Commerce By
Small And Medium Enterprises (SMEs) - A Comparative Analysis’. Paper presented at
the collECTeR 2004, Adelaide, Australia.
Perumal, V., & Shanmugam, B. (2004). Internet Banking: Boon or Bane? Journal of Internet
Banking and Commerce, 9(3).
Piguet, A., & Peraya, D. (2000). Creating web-integrated learning environments: An
analysis of WebCT authoring tools in respect to usability. Australian Journal of
Educational Technology, 16(3), 302-314.
Plouffe, R., Christopher, Hulland, S., John, & Vandenbosch, M. (2001). Research report:
richness versus parsimony in modelling technology adoption decisions-
understanding merchant adoption of a smart-card based payment system.
Information Systems Research, 12(2), 208-222.
Polatoglu, V., N, & Ekin, S. (2001). An empirical investigation of the Turkish consumers'
acceptance on Internet banking services. The International Journal of Bank Marketing,
19(4/5), 156-166.
Porter, R., Stephen. (2004). New direction for institutional research. Wiley periodicals Inc,
121, 5-21.
Premkumar, G., & Ramamurthy, K. (1995). The role of Interorganizational and
organizational factors of the decision mode for adoption of interorganizational
systems. Decision Science, 26(3), 303-336.
Pyun, C., Soo, Scruggs, L., & Nam, K. (2002). Internet banking in the U.S., Japan and
Europe. Multinational Business Review, 10(2), 73-81.
Ramsay, S. (2004). Firms slow down Internet Banking revolution. Retrieved 21/02/2005, 2005,
from www.manchesteronline.co.uk/business
Rao, G., R, & Prathima, K. (2003). Internet Banking in India. Retrieved 14/03/05, 2005, from
www.mondaq.com
Remenyi, D., Williams, B., Money, A., & Swartz, E. (1998). Doing research in business and
management : An introduction to process and method (pp. 309). London: Sage
publications.

Factors influencing the adoption and usage of Internet banking: A New Zealand perspective
129
Riemenschneider, K., Cynthia, Harrison, A., David, & Mykytyn, P., Peter,Jr. (2003).
Understanding IT adoption decisions in small business: integrating current theories.
Information and management, 40, 269-285.
Rogers, E., M. (1983). Diffusion of innovations (3rd ed.). New York: The free press.
Rotchanakitumunai, S., & Speece, M. (2003). Barriers of Internet banking adoption: a
qualitative study among corporate customers in Thailand. International journal of Bank
Marketing, 21(6-7), 312-323.
Roth, A. (2001). Middle East Web could draw U.S. bankers. Retrieved 12/03/2005, 2005, from
http://www.itp.net/features
Salant, P., & Dillman, A. D. (1994). How to conduct your own survey. New York: John Wiley &
Sons.
Sangster, R., L, Lorenz, F., O, & Saltiel, J. (1995). Measurement effects of mail versus telephone.
Paper presented at the Paper presented at the meeting of W-183, Regional research
group, Tucson, AZ.
Sathye, M. (1999). Adoption of Internet banking by Australian consumers: an empirical
investigation. The International Journal of Bank Marketing, 17(7), 324.
Schaefer, D. R., & Dillman, A., Don. (1998). Development of a standard e-mail
methodology: results of an experiment. Public Opinion quarterly, 62(3), 378-397.
Schuman, H., & Presser, S. (1981). Questions and answers in attitude surveys: Experiments on
question form, wording , and context. New York: Academic.
Shaeehan, B., K, & McMillian, J., S. (1999). Response variation in e-mail surveys: an
exploration. Journal of Advertising Research, 39(4), 45-54.
Shannon, D. M., & Bradshaw, C. C. (2002). A comparison of response rate and time and
cost of mail and electronic surveys. Journal of Electronic Commerce, 70(2), 179-192.
Sheppard, H., Blair, Hartwick, J., & Warshaw, R., Paul. (1988). The theory of reasoned
action: A meta-analysis of past research with recommendations for modifications
and future research. Journal of consumer research, 15(3), 325-343.
Shih, P., Hung. (2004). An empirical study of predicting user acceptance of e-shopping on
web. Information and management, 41, 351-368.
Singer, E., Von, T., & Miller, E. R. (1995). Confidentially assurance and survey response: A
review of the experimental literature. Public Opinion quarterly, 59, 266-277.
Singh, A., M. (2002). Internet banking: to bank or not to bank. Where is the question. University of
Durban Westville, Durban.
Singh, B., & Malhotra, P. (2004). Adoption of Internet Banking: An empirical investigation
of Indian banking sector. Journal of Internet Banking and Commerce, 9(2), 1-22.

Factors influencing the adoption and usage of Internet banking: A New Zealand perspective
130
Stewart, K., J. (1999). Transference as a means of building trust in world wise web sites. Paper
presented at the 20th International Conference of Information Systems, Charlotte,
North Carolina.
Steyen, P., & Chan, E. (2003). Over half a million Hong Kong people visited an Internet banking site
in January 2003. Retrieved 14/03/2005, 2005, from www.nielsen-netratings.com
Stockel, D., Dewitte, K., & Thienpont, L., M. (1998). Validity of linear regression in
method comparison studies: is it limited by the statistical model or the quality of
the analytical input data? Clinical Chemistry, 44(11).
Straub, W., Detmar, Limayem, M., & Karahanna, E. (1995). Measuring Systems Usage:
Implications for IS theory testing. Management Science, 41(8), 1328-1342.
Suganthi, & Balachandran, B. a. (2001). Internet Banking Patronage: An Empirical
Investigation of Malaysia. Journal of Internet Banking and Commerce, 6(1).
Szajna, B. (1996). Empirical evaluation of the revised technology acceptance model.
Management science, 42(1), 85-92.
Tan, M., & Teo, T., S,H. (2000). Factors influencing the adoption of Internet banking.
Journal of the association for information systems, 1, 1-42.
Taylor, S., & Todd, P., A. (1995a). Understanding information technology usage: A test of
competing models. Information Systems Research, 6(2), 144-176.
Taylor, S., & Todd, P., A. (1995b). Assessing IT usage: The role of prior experience. MIS
Quarterly, 19(4), 561-570.
TechnologyforFinance. (2004). Online banking continue to grow. Retrieved 21/02/2005, 2005,
from www.technologyforfinance.com
Tedeschi, B. (2005, 09/03/05). Banks see online gain via updated cash sites. International
Herald Tribune, pp. 1-2.
Teo, T., S,H, Lim, V., K, G, & Lai, R., Y, C. (1999). Intrinsic and extrinsic motivation in
Internet usage. OMEGA, 27(1), 25-37.
Thompson, L., Foster, Meriac, J., P, & Cope, J., G. (2002). Motivating online performance:
the influences of goal setting and Internet self-efficacy. Social Science Computer Review,
20(2), 149-160.
Thompson, S., H, Tan, M., & Buk, K., Wong. (1997). A Contingency Model of Internet
Adoption in Singapore. International Journal of Electronic Commerce, 2(2), 95-118.
Thong, J., Y, L. (1999). An Integrated Model of Information Systems Adoption in Small
Businesses. Journal of Management Information Systems, 15(4), 187-214.

Factors influencing the adoption and usage of Internet banking: A New Zealand perspective
131
Tornatzky, L., G, & Klein, K., J. (1982). Innovation characteristics and innovation
adoption -implementation: a meta analysis of findings. IEEE Transaction on
Engineering Management, 29(1), 28-45.
TrendsinJapan. (2001). Online banking arrives in Japan: Lower cost may attract customers. Retrieved
14/03/2005, 2005, from www.web-japan.org
Turkey, J., W. (1986). The collected works of John W (volume IV): Philosophy and principal of data
analysis 1965-1986. Monterey, CA: Wadsworth & Brooks/Cole.
Venkatesh, V. (1999). Creation of favourable user perceptions: Exploring the role of
intrinsic motivation. MIS Quarterly, 23(2), 239-260.
Venkatesh, V. (2000). Determinants of perceived ease of use: integrating control, intrinsic
motivation, and emotion into the technology acceptance model. Information systems
research, 11(4), 342-365.
Venkatesh, V., & Davis, F., D. (1996). A model of the perceived ease of use: development
and test. Decision Science, 27(3), 451-481.
Venkatesh, V., & Davis, F., D. (2000). A theoretical extension of the technology
acceptance model: four longitudinal field studies. Management Science, 46(2), 186-204.
Venkatesh, V., & Morris, G., Michael. (2000). Why don't men ever stop to ask for
direction? Gender, social influence and their role in technology acceptance and
usage behaviour. MIS Quarterly, 24(1), 115-137.
Venkatesh, V., Morris, G., Michael, Davis, B., Gordon, & Davis, D., Fred. (2003). User
acceptance of Information technology: Towards a unified view. MIS Quarterly,
27(3), 425-478.
Vijayan, P., & Shanmugam, B. (2003). Service quality evaluation if Internet banking in
Malaysia. Journal of Internet Banking and Commerce, 8(1).
Wang, Y., Shun, Wang, Y., Min, Lin, H., Hsin, & Tang, T., I. (2003). Determinants of user
acceptance of Internet banking: an empirical study. International journal of service
Industry management, 14(5), 501-519.
Ward, J., & Peppard, J. (2003). Strategic Planning for Information Systems (Third ed.). UK: John
Wiley & Sons, Ltd.
Weible, R., & Wallace, J. (1998). Cyber research: The impact of the Internet on data
collection. Marketing Research, 10(3), 19-23.
Wejnert, B. (2002). Integrating model of diffusion of innovations: A conceptual
framework. 28, 1(297-326).
Willits, F., K, & Saltiel, J. (1995). Question Order effects on subjective measures of quality
of life. Rural Sociology, 60, 654-665.

Factors influencing the adoption and usage of Internet banking: A New Zealand perspective
132
Wong, S., Y, & Chang, T., B. (2005). Effects of perceived risks on Internet banking
services: An empirical investigation in Taiwan. International journal of e-business research,
1(1), 70-88.
Wu, I.-L. (2003). Understanding senior management's behaviour in promoting the strategic
role of IT in process reengineering: use of the theory of reasoned action. Information
and Management, 1-11.
Yammarino, F., J, Skinner, S., J, & Childers, T., L. (1991). Understanding Mail survey
Response Behaviour: A meta analysis. Public Opinion Quarterly, 55(4), 613-639.
Yuksel, A. (2003). Shopping experience evaluation: a case of domestic and international
visitors. Tourism Management, 25, 751-759.
Yun, G. W., & Trumbo, C. W. (2000). Comparative response to a survey executed by post,
email & web form. Journal of Computer Mediated Communication, 6(1).

Factors influencing the adoption and usage of Internet banking: A New Zealand perspective
133
AAPPPPEENNDDIICCEESS
Appendix A: Covering letter........................................................................................... 1
Appendix B: Survey Questionnaire ................................................................................. 2
Appendix C: Survey Area ............................................................................................... 8
Appendix D: Survey distribution .................................................................................. 10
Appendix E: Survey data (original data) ........................................................................ 12
Appendix F: Box-Cox transformed data........................................................................ 19
Appendix G: Survey data(after averaging items) ............................................................ 26
Appendix H: SPSS results ............................................................................................ 28

1
Appendix A: Covering letter
Internet Banking in New Zealand
SURVEY QUESTIONNAIRE
Internet banking is where bank customers access their bank accounts and perform banking transactions using the
Internet. Internet banking is an alternative to other banking options such as physically visiting a bank, using ATMs or
phone banking.
This is an Auckland University of Technology survey designed to collect information on attitudes towards Internet
banking. The information collected will be used to build a better understanding of what influences people’s intentions to
use Internet banking.
We would appreciate your help in this research, regardless of whether or not you have ever used Internet
banking.
Enclosed are two short questionnaire forms. Please complete only ONE form. Complete:
EITHER
(a) the YELLOW form, if you currently USE or HAVE USED Internet banking
OR
(b) the BLUE form, if you have NEVER used Internet banking
When you have completed the form most appropriate for you, please return it to us using the enclosed pre-paid
envelope.
Your response is anonymous. You also have the opportunity to request a copy of the survey results.
Thank you for participating in this survey
Queries regarding this survey can be directed to Professor Bill Doolin, Auckland University of Technology:
[email protected], (09) 917 9999, ext 5807.
Concerns regarding the conduct of the research should be notified to Madeline Banda, Executive Secretary, AUT Ethics
Committee: [email protected], (09) 917 9999, ext 8044.
This research has been approved by the Auckland University of Technology Ethics Committee on 14 January 2004.
AUTEC Reference Number: 04/235
ALL RESPONSES ARE ANONYMOUS AND WILL BE TREATED IN CONFIDENCE

2
Appendix B: Survey Questionnaire
Internet Banking Survey
COMPLETE THIS FORM ONLY IF YOU USE OR HAVE USED INTERNET BANKING
Thank you for taking the time to help us with our research. Your response is anonymous. Please indicate the extent to which you agree or disagree with each of the following statements. Circle a number from 1 to 7 that best represents your level of agreement with the statement, where 1=“strongly disagree” and 7=“strongly agree”:
Strongly disagree
Strongly agree
1. Internet banking enables me to accomplish my banking tasks more quickly 1 2 3 4 5 6 7
2. Internet banking makes it easier for me to do my banking 1 2 3 4 5 6 7
3. I find Internet banking useful 1 2 3 4 5 6 7
4. It was easy to become skilful at using Internet banking 1 2 3 4 5 6 7
5. I find Internet banking easy to use 1 2 3 4 5 6 7
6. Using Internet banking can often be frustrating 1 2 3 4 5 6 7
7. Internet banking can be complicated to use 1 2 3 4 5 6 7
8. I can use Internet banking without anyone around to show me how to do it 1 2 3 4 5 6 7
9. I can use Internet banking with only the online help function or instructions for assistance 1 2 3 4 5 6 7
10. I could use Internet banking even if I changed banks 1 2 3 4 5 6 7
11. Using Internet banking increases my cost of banking 1 2 3 4 5 6 7
12. Internet banking lacks the benefits of personal interaction with bank personnel 1 2 3 4 5 6 7
13. I can rely on Internet banking to work as expected 1 2 3 4 5 6 7
14. Using Internet banking may expose me to fraud or monetary loss 1 2 3 4 5 6 7
15. Using Internet banking may jeopardise my privacy 1 2 3 4 5 6 7
16. Internet banking is insecure 1 2 3 4 5 6 7
17. Using Internet banking increases the time it takes to do my banking 1 2 3 4 5 6 7
Strongly disagree
Strongly agree

3
18. Internet banking is more convenient than visiting a bank or phone banking 1 2 3 4 5 6 7
19. Internet banking is more accessible than visiting a bank or phone banking 1 2 3 4 5 6 7
20. Internet banking is less time-consuming than visiting a bank or phone banking 1 2 3 4 5 6 7
21. Internet banking gives me greater control over my finances than visiting a bank or phone banking 1 2 3 4 5 6 7
22. Internet banking is compatible with my lifestyle 1 2 3 4 5 6 7
23. Using Internet banking fits well with the way I like to manage my finances 1 2 3 4 5 6 7
24. The advantages and disadvantages of using Internet banking are obvious 1 2 3 4 5 6 7
25. I would have difficulty explaining why using Internet banking may or may not be beneficial 1 2 3 4 5 6 7
26. Internet banking is very visible in the public media 1 2 3 4 5 6 7
27. I have seen what others do using Internet banking 1 2 3 4 5 6 7
28. Internet banking is available for me to use on a trial basis 1 2 3 4 5 6 7
29. I am able to see how Internet banking works and what it can do 1 2 3 4 5 6 7
30. I know where I can get more information on Internet banking 1 2 3 4 5 6 7
31. I intend to use Internet banking in the future 1 2 3 4 5 6 7
Please answer the following question by circling the number from 1 to 7 that best represents your level of use, where 1=“not at all” and 7=“frequently”:
Not at all
Fre-quently
32. In the last 30 days, approximately how often have you used Internet banking? 1 2 3 4 5 6 7
Please answer the following question by writing the number that best reflects your level of use in the box provided:
33. In the last 30 days, approximately how many times have you used Internet banking?

4
Please answer the following questions by ticking the box with the most appropriate option:
34.
What is your gender?
? Male
? Female
35.
What is your age?
? <15 years
? 15-24 years
? 25-39 years
? 40-54 years
? 55-69 years
? >69 years
36.
For how long have you used a computer?
? Never
? <1 year
? 1-2 years
? 3-5 years
? 6-10 years
? >10 years
37.
For how long have you used the Internet?
? Never
? <1 year
? 1-2 years
? 3-5 years
? 6-10 years
? >10 years
38.
For how long have you used Internet banking?
? Never
? <6
months
? 6-11
months
? 1-2 years
? 3-5 years
? >5
years
39.
Do you currently have access to the Internet?
? Yes
? No
Yes, I would like to receive a copy of the survey results. If yes, please provide an email or postal address below:

5
Internet Banking Survey
COMPLETE THIS FORM ONLY IF YOU HAVE NEVER USED INTERNET BANKING Thank you for taking the time to help us with our research. Your response is anonymous. Please indicate the extent to which you agree or disagree with each of the following statements. Circle a number from 1 to 7 that best represents your level of agreement with the statement, where 1=“strongly disagree” and 7=“strongly agree”:
Strongly disagree
Strongly agree
1. Internet banking enables me to accomplish my banking tasks more quickly 1 2 3 4 5 6 7
2. Internet banking makes it easier for me to do my banking 1 2 3 4 5 6 7
3. I find Internet banking useful 1 2 3 4 5 6 7
4. It was easy to become skilful at using Internet banking 1 2 3 4 5 6 7
5. I find Internet banking easy to use 1 2 3 4 5 6 7
6. Using Internet banking can often be frustrating 1 2 3 4 5 6 7
7. Internet banking can be complicated to use 1 2 3 4 5 6 7
8. I can use Internet banking without anyone around to show me how to do it 1 2 3 4 5 6 7
9. I can use Internet banking with only the online help function or instructions for assistance 1 2 3 4 5 6 7
10. I could use Internet banking even if I changed banks 1 2 3 4 5 6 7
11. Using Internet banking increases my cost of banking 1 2 3 4 5 6 7
12. Internet banking lacks the benefits of personal interaction with bank personnel 1 2 3 4 5 6 7
13. I can rely on Internet banking to work as expected 1 2 3 4 5 6 7
14. Using Internet banking may expose me to fraud or monetary loss 1 2 3 4 5 6 7
15. Using Internet banking may jeopardise my privacy 1 2 3 4 5 6 7
16. Internet banking is insecure 1 2 3 4 5 6 7
17. Using Internet banking increases the time it takes to do my banking 1 2 3 4 5 6 7
Strongly disagree
Strongly agree
18. Internet banking is more convenient than visiting a bank or phone banking 1 2 3 4 5 6 7

6
19. Internet banking is more accessible than visiting a bank or phone banking 1 2 3 4 5 6 7
20. Internet banking is less time-consuming than visiting a bank or phone banking 1 2 3 4 5 6 7
21. Internet banking gives me greater control over my finances than visiting a bank or phone banking 1 2 3 4 5 6 7
22. Internet banking is compatible with my lifestyle 1 2 3 4 5 6 7
23. Using Internet banking fits well with the way I like to manage my finances 1 2 3 4 5 6 7
24. The advantages and disadvantages of using Internet banking are obvious 1 2 3 4 5 6 7
25. I would have difficulty explaining why using Internet banking may or may not be beneficial 1 2 3 4 5 6 7
26. Internet banking is very visible in the public media 1 2 3 4 5 6 7
27. I have seen what others do using Internet banking 1 2 3 4 5 6 7
28. Internet banking is available for me to use on a trial basis 1 2 3 4 5 6 7
29. I am able to see how Internet banking works and what it can do 1 2 3 4 5 6 7
30. I know where I can get more information on Internet banking 1 2 3 4 5 6 7
31. I intend to use Internet banking in the future 1 2 3 4 5 6 7
Please answer the following questions by ticking the box with the most appropriate option:
32.
What is your gender?
? Male
? Female
33.
What is your age?
? <15 years
? 15-24 years
? 25-39 years
? 40-54 years
? 55-69 years
? >69 years
34.
For how long have you used a computer?
? Never
? <1 year
? 1-2 years
? 3-5 years
? 6-10 years
? >10 years
35.
For how long have you used the Internet?
? Never
? <1 year
? 1-2 years
? 3-5 years
? 6-10 years
? >10 years

7
36.
Do you currently have access to the Internet?
? Yes
? No
Yes, I would like to receive a copy of the survey results. If yes, please provide an email or postal address below:

8
Appendix C: Survey Area
Blockhouse bay area

9
Royal Oak area

10
Appendix D: Survey distribution
Distribution of survey instruments in Royal oak community
Road / Street Name Number of houses
Distribution pattern Document distributed
Royal Oak Community (ROC)
Acron Street 30 One in every three houses 10 Adrienne Palce 15 Alternate Houses 8 Ambury Avenue 18 Alternate Houses 9 Baker Place 20 Alternate Houses 10 Backenham Avenue 54 One in every three houses 18 Banvillie Place 12 Alternate Houses 6 Bingley Avenue 12 Alternate Houses 6 Boyd Avenue 49 One in every three houses 17 Brookfield Avenue 39 One in every three houses 13 Buckley Road 68 One in every three houses 23 Budock Road 22 One in every three houses 8 Campbell Road 20 Alternate Houses 10 Chandler Avenue 8 Alternate Houses 4 Clarke Road 44 One in every three houses 15 Crown Street 21 One in every three houses 7 Elgar Street 9 Alternate Houses 5 Epworth Avenue 20 Alternate Houses 10 Erson Avenue 30 One in every three houses 10 Fernleigh Avenue 47 One in every three houses 16 Greenfield Road 22 One in every three houses 8 Gorrie Avenue 21 One in every three houses 8 Hollywood Avenue 48 One in every three houses 16 Inkerman Street 45 One in every three houses 15 Kingsway 8 Alternate Houses 4 Korma Road 40 One in every three houses 14 Lauchlan Avenue 8 Alternate Houses 4 Liverpool Street 82 One in every three houses 28 Manukau Road 146 Not clear about area under ROC 0 Mt Albert Road 119 Provision for second survey 0 Mt Smart Road 149 Provision for second survey 0 Oak Street 29 One in every three houses 10 Pah Road 137 One in every three houses 46 Peet Avenue 26 One in every three houses 9 Peglar Avenue 11 Alternate Houses 6 Queensway 27 One in every three houses 9 Quentin Avenue 19 Alternate Houses 9 Raurenga Avenue 25 One in every three houses 9 Rewi Road 45 One in every three houses 15 Rongo Road 10 Alternate Houses 5 Rowan Road 31 One in every three houses 11 St. Andrew Road 75 Not clear about area under ROC 0 Torrance Road 64 One in every three houses 22 Tansley Avenue 20 Alternate Houses 10 Turama Road 60 One in every three houses 20 Vagus Place 30 One in every three houses 10 Winchlane 14 Alternate Houses 7 Total 1849 500
(source: www.wises.co.nz)

11
Distribution of survey instruments in Blockhouse bay community
Road / Street Name Number of houses
Distribution pattern Document distributed
Blockhouse Bay Community (BBC)
Barton (east) street 31 One in every three houses 11 Blockhouse Bay Road 40 One in every three houses 14 Bolton Road 40 One in every three houses 14 Boundary Road 25 One in every three houses 9 Connaught Street 78 One in every three houses 26 Connel Street 109 One in every three houses 37 Donovan Street 40 One in every three houses 14 Dundale Avenue 91 Provision for second survey 0 Endeavour Street 67 One in every three houses 23 Ernie Pinches 77 Provision for second survey 0 Exminister Street 60 One in every three houses 20 Francis Curtis 62 One in every three houses 21 Gill Crescent 25 One in every three houses 9 Heaphy Street 92 One in every three houses 31 Kay Drive 79 One in every three houses 27 Kinross Street 80 One in every three houses 27 Lewis Street 54 One in every three houses 18 Lucknow Place 16 Alternate Houses 8 Lynbrook Avenue 126 One in every three houses 42 Mcfadzean Drive 76 One in every three houses 26 Mulgan Street 86 Provision for second survey 0 New Windsor Street 173 Provision for second survey 0 Portage Road 14 Alternate Houses 7 Rathlin Street 44 One in every three houses 15 Tania Place 17 Alternate Houses 7 Taylor Street 30 One in every three houses 10 Temuka Gardens 120 One in every three houses 40 Terry Street 44 One in every three houses 15 Whitney Street 48 One in every three houses 16 Windermere Crescent 38 One in every three houses 13 Wolverton Street 65 Provision for second survey 0 Total 1947 500
(source: www.wises.co.nz)

12
Appendix E: Survey data (original data)

13

14

15

16

17

18

19
Appendix F: Box-Cox transformed data

20

21

22

23

24

25

26
Appendix G: Survey data(after averaging items)

27

28
Appendix H: SPSS results

29

30

31

32

33

34

35

36

37

38
Simple Linear Regression
Variables Entered / Removed (b)
Model
Variables
Entered
Variables
Removed Method
1 PU(a) . Enter
a All requested variables entered.
b Dependent Variable: Intention
Model Summary
Model R R Square
Adjusted
R Square
Std. Error of
the Estimate Change Statistics
R Square
Change F Change df1 df2
Sig. F
Change
1 .441(
a) .195 .190 1.9911 .195 37.508 1 155 .000
a Predictors: (Constant), PU
ANOVA(b)
Model
Sum of
Squares df Mean Square F Sig.
Regression 148.698 1 148.698 37.508 .000(a)
Residual 614.490 155 3.964
1
Total 763.187 156
a Predictors: (Constant), PU
b Dependent Variable: Intention
Coefficients(a)
Model Unstandardized
Coefficients
Standardized
Coefficients t Sig.
B Std. Error Beta
1 (Constant) 2.223 .519 4.278 .000
PU .545 .089 .441 6.124 .000
a Dependent Variable: Intention
Variables Entered/Removed(b)
Model
Variables
Entered
Variables
Removed Method
1 EOU(a) . Enter
a All requested variables entered.
b Dependent Variable: Intention

39
Model Summary
Model R R Square
Adjusted R
Square
Std. Error
of the
Estimate Change Statistics
R Square
Change
F
Change df1 df2
Sig. F
Change
1 .373(a) .139 .134 2.0588 .139 25.046 1 155 .000
a Predictors: (Constant), EOU
ANOVA(b)
Model
Sum of
Squares df Mean Square F Sig.
Regression 106.166 1 106.166 25.046 .000(a)
Residual 657.021 155 4.239
1
Total 763.187 156
a Predictors: (Constant), EOU
b Dependent Variable: Intention
Coefficients(a)
Model
Unstandardized
Coefficients
Standardized
Coefficients t Sig.
B Std. Error Beta
1 (Constant) 2.024 .666 3.041 .003
EOU .604 .121 .373 5.005 .000
a Dependent Variable: Intention
Variables Entered/Removed(b)
Model
Variables
Entered
Variables
Removed Method
1 SE(a) . Enter
a All requested variables entered.
b Dependent Variable: Intention
Model Summary
Model R R Square
Adjusted R
Square
Std. Error of
the Estimate Change Statistics
R Square
Change F Change df1 df2
Sig. F
Change
1 .406(a) .165 .159 2.0279 .165 30.584 1 155 .000
a Predictors: (Constant), SE

40
ANOVA(b)
Model
Sum of
Squares df Mean Square F Sig.
Regression 125.772 1 125.772 30.584 .000(a)
Residual 637.415 155 4.112
1
Total 763.187 156
a Predictors: (Constant), SE
b Dependent Variable: Intention
Coefficients(a)
Model Unstandardized
Coefficients
Standardized
Coefficients t Sig.
B Std. Error Beta
1 (Constant) 2.389 .542 4.407 .000
SE .555 .100 .406 5.530 .000
a Dependent Variable: Intention
Variables Entered/Removed(b)
Model
Variables
Entered
Variables
Removed Method
1 RSK(a) . Enter
a All requested variables entered.
b Dependent Variable: Intention
Model Summary
Model R R Square
Adjusted R
Square
Std. Error
of the
Estimate Change Statistics
R Square
Change
F
Change df1 df2
Sig. F
Change
1 .139(a) .019 .013 2.1973 .019 3.074 1 155 .082
a Predictors: (Constant), RSK
ANOVA(b)
Model
Sum of
Squares df Mean Square F Sig.
Regression 14.843 1 14.843 3.074 .082(a)
Residual 748.344 155 4.828
1
Total 763.187 156
a Predictors: (Constant), RSK
b Dependent Variable: Intention

41
Coefficients(a)
Model Unstandardized
Coefficients
Standardized
Coefficients t Sig.
B Std. Error Beta
1 (Constant) 6.117 .524 11.680 .000
RSK -.195 .111 -.139 -1.753 .082
a Dependent Variable: Intention
Variables Entered/Removed(b)
Model
Variables
Entered
Variables
Removed Method
1 RA(a) . Enter
a All requested variables entered.
b Dependent Variable: Intention
Model Summary
Model R R Square
Adjusted R
Square
Std. Error
of the
Estimate Change Statistics
R Square
Change
F
Change df1 df2
Sig. F
Change
1 .451(a) .203 .198 1.9809 .203 39.496 1 155 .000
a Predictors: (Constant), RA
ANOVA(b)
Model
Sum of
Squares df Mean Square F Sig.
Regression 154.981 1 154.981 39.496 .000(a)
Residual 608.207 155 3.924
1
Total 763.187 156
a Predictors: (Constant), RA
b Dependent Variable: Intention
Coefficients(a)
Model Unstandardized
Coefficients
Standardized
Coefficients t Sig.
B Std. Error Beta
1 (Constant) 2.019 .538 3.752 .000
RA .599 .095 .451 6.285 .000
a Dependent Variable: Intention

42
Variables Entered/Removed(b)
Model
Variables
Entered
Variables
Removed Method
1 COM(a) . Enter
a All requested variables entered.
b Dependent Variable: Intention
Model Summary
Model R R Square
Adjusted R
Square
Std. Error of
the Estimate Change Statistics
R Square
Change
F
Change df1 df2
Sig. F
Change
1 .485(a) .235 .230 1.9405 .235 47.673 1 155 .000
a Predictors: (Constant), COM
ANOVA(b)
Model
Sum of
Squares df Mean Square F Sig.
Regression 179.519 1 179.519 47.673 .000(a)
Residual 583.668 155 3.766
1
Total 763.187 156
a Predictors: (Constant), COM
b Dependent Variable: Intention
Coefficients(a)
Model
Unstandardized
Coefficients
Standardized
Coefficients t Sig.
B Std. Error Beta
1 (Constant) 2.414 .439 5.498 .000
COM .552 .080 .485 6.905 .000
a Dependent Variable: Intention
Variables Entered/Removed(b)
Model
Variables
Entered
Variables
Removed Method
1 DEM(a) . Enter
a All requested variables entered.
b Dependent Variable: Intention

43
Model Summary
Model R R Square
Adjusted R
Square
Std. Error
of the
Estimate Change Statistics
R Square
Change F Change df1 df2
Sig. F
Change
1 .218(a) .048 .041 2.1655 .048 7.754 1 155 .006
a Predictors: (Constant), DEM
ANOVA(b)
Model
Sum of
Squares df Mean Square F Sig.
Regression 36.359 1 36.359 7.754 .006(a)
Residual 726.828 155 4.689
1
Total 763.187 156
a Predictors: (Constant), DEM
b Dependent Variable: Intention
Coefficients(a)
Model Unstandardized
Coefficients
Standardized
Coefficients t Sig.
B Std. Error Beta
1 (Constant) 3.622 .610 5.936 .000
DEM .325 .117 .218 2.785 .006
a Dependent Variable: Intention
Variables Entered/Removed(b)
Model
Variables
Entered
Variables
Removed Method
1 VIS(a) . Enter
a All requested variables entered.
b Dependent Variable: Intention
Model Summary
Model R R Square
Adjusted R
Square
Std. Error of
the Estimate Change Statistics
R Square
Change
F
Change df1 df2
Sig. F
Change
1 .001(a) .000 -.006 2.2190 .000 .000 1 155 .991
a Predictors: (Constant), VIS

44
ANOVA(b)
Model
Sum of
Squares df Mean Square F Sig.
Regression .001 1 .001 .000 .991(a)
Residual 763.186 155 4.924
1
Total 763.187 156
a Predictors: (Constant), VIS
b Dependent Variable: Intention
Coefficients(a)
Model Unstandardized
Coefficients
Standardized
Coefficients t Sig.
B Std. Error Beta
1 (Constant) 5.245 .561 9.353 .000
VIS .002 .139 .001 .012 .991
a Dependent Variable: Intention
Variables Entered/Removed(b)
Model
Variables
Entered
Variables
Removed Method
1 TRI(a) . Enter
a All requested variables entered.
b Dependent Variable: Intention
Model Summary
Model R R Square
Adjusted R
Square
Std. Error of
the Estimate Change Statistics
R Square
Change F Change df1 df2
Sig. F
Change
1 .143(a) .021 .014 2.1960 .021 3.252 1 155 .073
a Predictors: (Constant), TRI
ANOVA(b)
Model
Sum of
Squares df Mean Square F Sig.
Regression 15.681 1 15.681 3.252 .073(a)
Residual 747.506 155 4.823
1
Total 763.187 156
a Predictors: (Constant), TRI
b Dependent Variable: Intention

45
Coefficients(a)
Model Unstandardized
Coefficients
Standardized
Coefficients t Sig.
B Std. Error Beta
1 (Constant) 4.164 .628 6.626 .000
TRI .083 .046 .143 1.803 .073
a Dependent Variable: Intention
Variables Entered/Removed(b)
Model
Variables
Entered
Variables
Removed Method
1 EOU(a) . Enter
a All requested variables entered.
b Dependent Variable: PU
Model Summary
Model R R Square
Adjusted R
Square
Std. Error of
the Estimate Change Statistics
R Square
Change
F
Change df1 df2
Sig. F
Change
1 .788(
a) .620 .618 1.10763 .620 253.133 1 155 .000
a Predictors: (Constant), EOU
ANOVA(b)
Model
Sum of
Squares df Mean Square F Sig.
Regression 310.554 1 310.554 253.133 .000(a)
Residual 190.161 155 1.227
1
Total 500.715 156
a Predictors: (Constant), EOU
b Dependent Variable: PU
Coefficients(a)
Unstandardized
Coefficients
Standardized
Coefficients
Model B Std. Error Beta t Sig.
(Constant) .038 .358 .106 .916 1
EOU 1.033 .065 .788 15.910 .000
a Dependent Variable: PU

46
Variables Entered/Removed(b)
Model
Variables
Entered
Variables
Removed Method
1 SE(a) . Enter
a All requested variables entered.
b Dependent Variable: EOU
Model Summary
Model R R Square
Adjusted R
Square
Std. Error
of the
Estimate Change Statistics
R Square
Change F Change df1 df2
Sig. F
Change
1 .657(
a) .432 .428 1.03269 .432 117.729 1 155 .000
a Predictors: (Constant), SE
ANOVA(b)
Model
Sum of
Squares df Mean Square F Sig.
Regression 125.551 1 125.551 117.729 .000(a)
Residual 165.299 155 1.066
1
Total 290.850 156
a Predictors: (Constant), SE
b Dependent Variable: EOU
Coefficients(a)
Unstandardized
Coefficients
Standardized
Coefficients
Model B Std. Error Beta t Sig.
(Constant) 2.483 .276 8.991 .000 1
SE .554 .051 .657 10.850 .000
a Dependent Variable: EOU
Variables Entered/Removed(b)
Model
Variables
Entered
Variables
Removed Method
1 SE(a) . Enter
a All requested variables entered.
b Dependent Variable: PU

47
Model Summary
Model R R Square
Adjusted R
Square
Std. Error of
the Estimate Change Statistics
R Square
Change
F
Change df1 df2
Sig. F
Change
1 .646(
a) .417 .413 1.37269 .417 110.733 1 155 .000
a Predictors: (Constant), SE
ANOVA(b)
Model
Sum of
Squares df Mean Square F Sig.
Regression 208.652 1 208.652 110.733 .000(a)
Residual 292.063 155 1.884
1
Total 500.715 156
a Predictors: (Constant), SE
b Dependent Variable: PU
Coefficients(a)
Unstandardized
Coefficients
Standardized
Coefficients
Model B Std. Error Beta t Sig.
(Constant) 1.872 .367 5.100 .000 1
SE .715 .068 .646 10.523 .000
a Dependent Variable: PU
Variables Entered/Removed(b)
Model
Variables
Entered
Variables
Removed Method
1 SE(a) . Enter
a All requested variables entered.
b Dependent Variable: RSK
Model Summary
Model R R Square
Adjusted R
Square
Std. Error of
the Estimate Change Statistics
R Square
Change F Change df1 df2
Sig. F
Change
1 .222(
a) .049 .043 1.55055 .049 8.000 1 155 .005
a Predictors: (Constant), SE

48
ANOVA(b)
Model
Sum of
Squares df Mean Square F Sig.
Regression 19.234 1 19.234 8.000 .005(a)
Residual 372.651 155 2.404
1
Total 391.886 156
a Predictors: (Constant), SE
b Dependent Variable: RSK
Coefficients(a)
Unstandardized
Coefficients
Standardized
Coefficients
Model B Std. Error Beta t Sig.
(Constant) 5.565 .415 13.422 .000 1
SE -.217 .077 -.222 -2.828 .005
a Dependent Variable: RSK
Variables Entered/Removed(b)
Model
Variables
Entered
Variables
Removed Method
1 Intention(a) . Enter
a All requested variables entered.
b Dependent Variable: Use_1
Model Summary
Model R R Square
Adjusted R
Square
Std. Error
of the
Estimate Change Statistics
R Square
Change F Change df1 df2
Sig. F
Change
1 .795(a) .632 .630 1.7209 .632 266.466 1 155 .000
a Predictors: (Constant), Intention
ANOVA(b)
Model
Sum of
Squares df Mean Square F Sig.
Regression 789.172 1 789.172 266.466 .000(a)
Residual 459.052 155 2.962
1
Total 1248.224 156
a Predictors: (Constant), Intention
b Dependent Variable: Use_1

49
Coefficients(a)
Unstandardized
Coefficients
Standardized
Coefficients
Model B Std. Error Beta t Sig.
(Constant) -1.603 .355 -4.518 .000 1
Intention 1.017 .062 .795 16.324 .000
a Dependent Variable: Use_1
Variables Entered/Removed(b)
Model
Variables
Entered
Variables
Removed Method
1 Intention(a) . Enter
a All requested variables entered.
b Dependent Variable: Use_2
Model Summary
Model R R Square
Adjusted R
Square
Std. Error of
the Estimate Change Statistics
R Square
Change
F
Change df1 df2
Sig. F
Change
1 .511(a) .261 .256 8.9196 .261 54.656 1 155 .000
a Predictors: (Constant), Intention
ANOVA(b)
Model
Sum of
Squares df Mean Square F Sig.
Regression 4348.409 1 4348.409 54.656 .000(a)
Residual 12331.764 155 79.560
1
Total 16680.173 156
a Predictors: (Constant), Intention
b Dependent Variable: Use_2
Coefficients(a)
Unstandardized
Coefficients
Standardized
Coefficients
Model B Std. Error Beta t Sig.
(Constant) -4.401 1.839 -2.393 .018 1
Intention 2.387 .323 .511 7.393 .000
a Dependent Variable: Use_2

50
Multilinear linear regression – Model 1 Variables Entered/Removed(a)
Model
Variables
Entered
Variables
Removed Method
1
PU .
Stepwise
(Criteria:
Probability-
of-F-to-
enter <=
.050,
Probability-
of-F-to-
remove >=
.100).
2
SE .
Stepwise
(Criteria:
Probability-
of-F-to-
enter <=
.050,
Probability-
of-F-to-
remove >=
.100).
a Dependent Variable: Intention
Model Summary
Change Statistics
Model R R Square
Adjusted R
Square
Std. Error of
the Estimate R Square
Change F Change df1 df2
Sig. F
Change
1 .441(a) .195 .190 1.9911 .195 37.508 1 155 .000
2 .469(b) .220 .210 1.9662 .025 4.957 1 154 .027
a Predictors: (Constant), PU
b Predictors: (Constant), PU, SE
ANOVA(c)
Model
Sum of
Squares df Mean Square F Sig.
Regression 148.698 1 148.698 37.508 .000(a)
Residual 614.490 155 3.964
1
Total 763.187 156
Regression 167.859 2 83.929 21.711 .000(b)
Residual 595.329 154 3.866
2
Total 763.187 156
a Predictors: (Constant), PU
b Predictors: (Constant), PU, SE c Dependent Variable: Intention

51
Coefficients(a)
Unstandardized
Coefficients
Standardized
Coefficients
Model B Std. Error Beta t Sig.
(Constant) 2.223 .519 4.278 .000 1
PU .545 .089 .441 6.124 .000
2 (Constant) 1.679 .568 2.955 .004
PU .380 .115 .307 3.300 .001
SE .284 .127 .207 2.226 .027
a Dependent Variable: Intention
Excluded Variables(c)
Collinearity
Statistics
Model Beta In t Sig.
Partial
Correlation Tolerance
EOU .067(a) .569 .570 .046 .380
SE .207(a) 2.226 .027 .177 .583
1
RSK -.035(a) -.467 .641 -.038 .942
EOU -.016(b) -.131 .896 -.011 .342 2
RSK -.021(b) -.278 .781 -.022 .934
a Predictors in the Model: (Constant), PU
b Predictors in the Model: (Constant), PU, SE
c Dependent Variable: Intention
`

52
Model 2 Variables Entered/Removed(a)
Model
Variables
Entered
Variables
Removed Method
1
COM .
Stepwise
(Criteria:
Probability-
of-F-to-
enter <=
.050,
Probability-
of-F-to-
remove >=
.100).
a Dependent Variable: Intention
Model Summary
Change Statistics
Model R R Square
Adjusted
R Square
Std. Error of
the Estimate R Square
Change F Change df1 df2
Sig. F
Change
1 .485(a) .235 .230 1.9405 .235 47.673 1 155 .000
a Predictors: (Constant), COM
ANOVA(b)
Model
Sum of
Squares df Mean Square F Sig.
Regression 179.519 1 179.519 47.673 .000(a)
Residual 583.668 155 3.766
1
Total 763.187 156
a Predictors: (Constant), COM
b Dependent Variable: Intention
Coefficients(a)
Unstandardized
Coefficients
Standardized
Coefficients
Model B Std. Error Beta t Sig.
(Constant) 2.414 .439 5.498 .000 1
COM .552 .080 .485 6.905 .000
a Dependent Variable: Intention

53
Excluded Variables(b)
Collinearity
Statistics
Model Beta In t Sig.
Partial
Correlation Tolerance
RA .088(a) .566 .572 .046 .204
EOU .020(a) .192 .848 .015 .437
DEM .017(a) .225 .822 .018 .823
VIS -.011(a) -.162 .871 -.013 .999
1
TRI -.024(a) -.327 .744 -.026 .884
a Predictors in the Model: (Constant), COM
b Dependent Variable: Intention
Copyright © 2022 FDOKUMEN