Correlation Between Internet Usage and Academic ... - CORE
90
Correlation Between Internet Usage and Academic Performance Among University Students Unnel-Teddy NGOUMANDJOKA A Dissertation submitted to the Faculty of Science, University of the Witwatersrand, in fulfilment of the requirements for the degree of Master of Science Johannesburg, 2012 brought to you by CORE View metadata, citation and similar papers at core.ac.uk provided by Wits Institutional Repository on DSPACE
-
Upload
khangminh22 -
Category
Documents
-
view
2 -
download
0
Transcript of Correlation Between Internet Usage and Academic ... - CORE
Correlation Between Internet Usage and Academic PerformanceAmong University Students
Unnel-Teddy NGOUMANDJOKA
A Dissertation submitted to the Faculty of Science, University of the Witwatersrand, in fulfilment of therequirements for the degree of Master of Science
Johannesburg, 2012
brought to you by COREView metadata, citation and similar papers at core.ac.uk
provided by Wits Institutional Repository on DSPACE
DECLARATION
I declare that this dissertation is my own, unaided work. It is being submitted for the Degree of Masterof Science at the University of the Witwatersrand, Johannesburg. It has not been submitted before forany degree or examination at any other University.
—————————————————–Unnel-Teddy Ngoumandjoka
—————————————– day of —————————– 20—-.
1
Abstract
The Internet is a technology that has become a big part of people’s daily living. Through its abilityto act as a support medium in the different functions for which people use it, the Internet was introducedto academic institutions as a tool to enhance students’ academic experience in the mid 1990s. Today, theInternet plays a major role in the classroom, from course materials being available online to larger rangesof academic resources being a few clicks away, the influence of the Internet on campus is incontestablyfelt.
This dissertation looks at finding evidence of an association between Internet usage and academicperformance among university students. It addresses the need to evaluate whether the Internet is fulfillingthe role it was initially brought on campus for.
In this dissertation, a qualitative and a quantitative study were developed to measure students’ Inter-net usage on campus, the reasons for which they use it and how the Internet influences their academicgrades. 389 3rd year students from different academic disciplines participated in this study.
In summary, the results of this study show that the Internet exerts some influence on students’ aca-demic performance but no link of causality between the two could be established.
ACKNOWLEDGEMENTS
I would like to thank the following individuals for their contribution to this dissertation. They are:
• my supervisor, Prof Ian Sanders, for his advice and continuous assistance in the completion of thisdissertation
• Wits University Human Research Ethics Committee (Non-Medical) for granting me clearance toconduct this research
• The various Head of Schools and lecturers at Wits University who gave me permission to hand outmy questionnaires to their students during lecture time
• All the students who agreed to participate to this research
• Mr Umesh Bodalina and Mr Hement Gopal at CNS (Wits University) for going through thepainstaking process of retrieving Squid proxy log files for over 300 students
• Mrs Caroline Fairbrother, Head of the Academic Information and Systems Unit at Wits Universityfor providing me with the participating students’ academic grades
• My family in Gabon and Ms Davina Bomy Dusabe for their continuous encouragements and mo-tivation
Finally, I would like to thank anyone whom I did not mention above who contributed in any fashionto this dissertation.
i
Contents
1 INTRODUCTION 1
2 LITERATURE REVIEW 32.1 Introduction . . . . . . . . . . . . . . . . . . . . . . . . . . . . . . . . . . . . . . . . . 32.2 User acceptance of technology and its effect on individual performance . . . . . . . . . 42.3 The existence of Internet Dependency among university students . . . . . . . . . . . . . 62.4 What do students use the Internet for? . . . . . . . . . . . . . . . . . . . . . . . . . . . 92.5 The influence of the Internet on students’ academic performance . . . . . . . . . . . . . 142.6 Conclusion . . . . . . . . . . . . . . . . . . . . . . . . . . . . . . . . . . . . . . . . . 20
3 RESEARCH HYPOTHESIS 223.1 Introduction . . . . . . . . . . . . . . . . . . . . . . . . . . . . . . . . . . . . . . . . . 223.2 Research Hypothesis . . . . . . . . . . . . . . . . . . . . . . . . . . . . . . . . . . . . 223.3 Conclusion . . . . . . . . . . . . . . . . . . . . . . . . . . . . . . . . . . . . . . . . . 23
4 RESEARCH METHODOLOGY 244.1 Introduction . . . . . . . . . . . . . . . . . . . . . . . . . . . . . . . . . . . . . . . . . 244.2 Qualitative Design . . . . . . . . . . . . . . . . . . . . . . . . . . . . . . . . . . . . . 244.3 Quantitative design . . . . . . . . . . . . . . . . . . . . . . . . . . . . . . . . . . . . . 264.4 Conclusion . . . . . . . . . . . . . . . . . . . . . . . . . . . . . . . . . . . . . . . . . 26
5 TRIANGULATION RESEARCH DESIGN:CONVERGENCE MODEL 275.1 Qualitative study . . . . . . . . . . . . . . . . . . . . . . . . . . . . . . . . . . . . . . 27
5.1.1 Introduction . . . . . . . . . . . . . . . . . . . . . . . . . . . . . . . . . . . . . 275.1.2 The Methodology . . . . . . . . . . . . . . . . . . . . . . . . . . . . . . . . . . 285.1.3 Data Analysis and Results Interpretation . . . . . . . . . . . . . . . . . . . . . . 305.1.4 Discussion . . . . . . . . . . . . . . . . . . . . . . . . . . . . . . . . . . . . . 405.1.5 Conclusion . . . . . . . . . . . . . . . . . . . . . . . . . . . . . . . . . . . . . 42
5.2 Quantitative study . . . . . . . . . . . . . . . . . . . . . . . . . . . . . . . . . . . . . . 435.2.1 Introduction . . . . . . . . . . . . . . . . . . . . . . . . . . . . . . . . . . . . . 435.2.2 The Methodology . . . . . . . . . . . . . . . . . . . . . . . . . . . . . . . . . . 435.2.3 Data Analysis and Results Interpretation . . . . . . . . . . . . . . . . . . . . . . 445.2.4 Discussion . . . . . . . . . . . . . . . . . . . . . . . . . . . . . . . . . . . . . 565.2.5 Conclusion . . . . . . . . . . . . . . . . . . . . . . . . . . . . . . . . . . . . . 57
5.3 Cross-triangulation of studies’ findings . . . . . . . . . . . . . . . . . . . . . . . . . . . 585.3.1 Introduction . . . . . . . . . . . . . . . . . . . . . . . . . . . . . . . . . . . . . 585.3.2 Comparison and contrast of the findings . . . . . . . . . . . . . . . . . . . . . . 585.3.3 Interpretation of qualitative and quantitative studies . . . . . . . . . . . . . . . . 605.3.4 Conclusion . . . . . . . . . . . . . . . . . . . . . . . . . . . . . . . . . . . . . 60
ii
6 FURTHER ANALYSIS 626.1 Introduction . . . . . . . . . . . . . . . . . . . . . . . . . . . . . . . . . . . . . . . . . 626.2 Comparison of courses Internet usage and academic performance . . . . . . . . . . . . . 626.3 Comparison of Internet usage and academic performance between students living on
campus and the rest . . . . . . . . . . . . . . . . . . . . . . . . . . . . . . . . . . . . . 646.4 Conclusion . . . . . . . . . . . . . . . . . . . . . . . . . . . . . . . . . . . . . . . . . 66
7 LIMITATIONS AND RECOMMENDATIONS FOR STUDY 677.1 Limitations of the study . . . . . . . . . . . . . . . . . . . . . . . . . . . . . . . . . . . 677.2 Recommendations for future work . . . . . . . . . . . . . . . . . . . . . . . . . . . . . 67
8 CONCLUSION 69
A Participant Information Sheet 74
B Participant Consent Form 75
C Research Questionnaire 76
D Triangulation Design: Convergence Model 77
E Websites Frequently Visited 78
F Proportion of ‘heavy’ and ‘light’ Internet users by categories of students 79
G Proportion of ‘good’,‘average’ and ‘bad’ students with academic work being first purpose 80
H Main Reason students use the Internet per course 81
I Main reason students use the Internet per residential status 82
iii

List of Tables
5.1 Distribution of students per course . . . . . . . . . . . . . . . . . . . . . . . . . . . . . 285.2 Distribution of students per living arrangements . . . . . . . . . . . . . . . . . . . . . . 285.3 Measures of location and spread for the total population sample . . . . . . . . . . . . . 305.4 Measures of location and spread for the total population sample . . . . . . . . . . . . . 475.5 One-way ANOVA test for ‘good’,‘average’ and ‘bad’ students based on Internet usage . 53
6.1 One-way ANOVA test for difference in Internet usage among the different courses . . . . 636.2 One-way ANOVA test for difference in academic performance among the different courses 63
iv
List of Figures
5.1 Histogram representing Internet usage for the entire sample population . . . . . . . . . . 315.2 Box and Whiskers plot of our sample population . . . . . . . . . . . . . . . . . . . . . 315.3 Distribution of uncorrectly classified students by criterion . . . . . . . . . . . . . . . . . 325.4 Proportions of Internet users by category . . . . . . . . . . . . . . . . . . . . . . . . . . 335.5 Purposes for which students use the Internet . . . . . . . . . . . . . . . . . . . . . . . . 345.6 Chi-Square test results for association between type of Internet user and Academic In-
fluence . . . . . . . . . . . . . . . . . . . . . . . . . . . . . . . . . . . . . . . . . . . . 355.7 Chi-Square test results for association between type of Internet use and purpose for which
the Internet is used . . . . . . . . . . . . . . . . . . . . . . . . . . . . . . . . . . . . . 365.8 Chi-Square and Fisher’s Exact tests results for association between purpose Internet is
used for and Academic Influence . . . . . . . . . . . . . . . . . . . . . . . . . . . . . . 375.9 Chi-Square and Fisher’s Exact tests results for association between Internet for improv-
ing grades and Academic Influence . . . . . . . . . . . . . . . . . . . . . . . . . . . . . 385.10 Chi-Square and Fisher’s Exact tests results for association between Internet for improv-
ing grades and main online activities . . . . . . . . . . . . . . . . . . . . . . . . . . . . 395.11 Internet for improving grades by its perceived influence on academic grades . . . . . . . 405.12 Histogram representing Internet usage for the entire sample population . . . . . . . . . . 455.13 Boxes and whiskers plots for the transformed data . . . . . . . . . . . . . . . . . . . . . 465.14 Distribution of students by Internet usage and Academic Performance . . . . . . . . . . 485.15 Purposes students use the Internet for . . . . . . . . . . . . . . . . . . . . . . . . . . . 495.16 Purposes students use the Internet for by category of students . . . . . . . . . . . . . . 505.17 Purposes students use the Internet for by category of Internet users . . . . . . . . . . . . 515.18 Scatterplot of Internet bandwidth and academic performance . . . . . . . . . . . . . . . 525.19 T-test for ‘heavy’ and ‘light’ Internet users based on academic performance . . . . . . . 535.20 Internet usage means of the three categories of students . . . . . . . . . . . . . . . . . . 545.21 Correlation test between ‘heavy’ and ‘light’ Internet users and academic performance . . 545.22 Correlation test between ‘Average’, ‘Bad’ and ‘Good’ students and Internet usage . . . . 55
6.1 Class academic average vs student average Internet usage for each course . . . . . . . . 626.2 Internet usage Means of all courses . . . . . . . . . . . . . . . . . . . . . . . . . . . . . 636.3 Class Academic Means of all courses . . . . . . . . . . . . . . . . . . . . . . . . . . . 646.4 Class academic average vs student average Internet usage for each category of students . 646.5 T-test for statistical difference in academic performance between ‘on campus’ and ‘off
campus’ students . . . . . . . . . . . . . . . . . . . . . . . . . . . . . . . . . . . . . . 656.6 Correlation between Internet usage and academic performance by residential status . . . 66
v

Chapter 1
INTRODUCTION
The Internet has become an essential component of people’s everyday life throughout the world. Thisranges from its support in improving the way people seek information, conduct research, perform busi-ness transactions, and communicate with others and various other features [Chou 2001]. The number ofInternet users in the world has experienced a growth of 480.4% between 2000 and 2011 with the numberof Internet users around the world estimated to be over 2 billion people within a world population ofapproximatively 6,93 billion by March 31, 2011 [World Internet Users and Population Stats 2011].
With a growing demand for Internet access on campuses, universities have contributed to this growthas they perceive the Internet to be a valuable source of information for students and a tool to enhancetheir productivity [Scherer 1997; Lubans 1999; Jones 2002; Metzger et al. 2003; Kirschner and Karpinski2010]. This has made students to be heavy users of the Internet compared to the general public [Kandell1998; Jones 2002; Choi et al. 2009; Ni et al. 2009; Judd and Kennedy 2010]. According to Jones [2002],86% of university students in America are Internet users compared to only 59% of the general Americanpopulation. Fifteen years since its introduction on campus, the Internet’s main purpose is still to enhancestudents’ collegiate experience as an educational support tool. However, we believe it should be assessedto determine whether it is meeting its expectations today.
Young [1996] shows in her study that the Internet has become a cause of concern among the gen-eral population because of its addictive-like applications and services. The Internet just like any addictivesubstance can therefore have a negative influence on its extensive users. Due to a growing demand for In-ternet access on campuses, students are regarded as heavier users of the Internet compared to the generalpublic [Kandell 1998; Perry et al. 1998; Jones 2002; Ni et al. 2009]. Although this remains a perception,not much research has been conducted on the influence of the Internet on students’ lives [Metzger etal. 2003; Johnson 2009; Hazelhurst et al. 2011]. A general consensus exists amongst researchers thatthe adoption of the Internet and its technologies does have a negative influence on students’ collegiateexperience [Morahan-Martin and Schumacher 2000; Anderson 2001; Kubey et al. 2001; Chen and Peng2008; Kirschner and Karpinski 2010; Hazelhurst et al. 2011]. However, little emphasis has been put oninvestigating its influence on academic performance even though this aspect remains the main reasonthe Internet was brought to campus. Johnson [2009] and Hazelhurst et al. [2011] stipulate that previousstudies have relied on self-reported data from students, therefore, as Young [1996] suggested, there is ahigh probability of students being in denial about their Internet surfing habits, thus the need to have stan-dardized and more reliable research instruments [Rumbough 2001; Gross 2004; Fortson et al. 2007]. Itis against this backdrop that we investigated whether a correlation between Internet usage and academicperformance among university students exists.
A mixed methodology approach was developed to compare what students reported about their Inter-net usage and what the university recorded. A qualitative study was conducted first, which started offwith the handing out of a questionnaire to 389 3rd year students at Wits University which helped mea-sure students’ daily Internet usage on campus, the reasons for which they use it and how they perceive itinfluences their academic performance. This study was followed by a quantitative study which used 359students from the previous study that made use of students’ Squid proxy logs Internet data for the same
1
purpose as the qualitative study mentioned above. A comparison of the results of the two studies wasperformed to enable us to shed light on the reliability of people’s reports when it comes to their surfinghabits. Does the Internet help students perform better academically or worse? This is the question thatwas expected to have been answered at the end of this study.
The results of our conducted studies reveal that students who were identified as ‘heavy’ on campusInternet users performed significantly worse academically than those identified as ‘light’ on campusInternet users but there was no strong evidence found to argue that Internet usage could be associated withacademic performance for either type of Internet users. Similarly, it was found that students identifiedas ‘good’ students use the Internet significantly less than those identified as ‘bad’ students but again, nostrong evidence could be found to associate Internet usage with academic performance for these typesof students either. However, it was found in the quantitative study that recreational activities was themain purpose for which students use the Internet as opposed to academic work as found in the qualitativestudy. These divergent findings were highlighted when the cross-triangulation of the results of the twostudies was performed, which subsequently helped realize that 70% of our participants were in denialabout the reasons for which they use the Internet as well as the influence it exerts on their academicperformance.
By the methodology used, this research addressed the issue of the unreliability of research instru-ments when using self-reported data as expressed by Rumbough [2001], Gross [2004], Fortson et al.[2007], and Johnson [2009]. The use of Squid proxy logs helped reveal more reliable results and identifythe shortcomings of research that only use self-reported data to make way for future work that would usestronger research instruments. The cross-triangulation of this studies’ results helped reveal that there is astrong phenomenon of denial among university students which would have never been exposed were self-reported data solely used. Therefore, apart from answering the research problem posed and developing astronger research instrument in the field of ICT in Education, this research added value by helping Witsuniversity identify the issue of students’ denial about their Internet usage habits and its consequenceson their academic grades so that the university could find a way to develop support structures to help itsstudents deal with this issue.
Chapter two of this document reviews the literature on areas ranging from user acceptance of tech-nology and its impact on individual performance; to evidences of Internet addiction among students, tothe purposes for which students use the Internet and finally the influence of the Internet on academicperformance. Chapter three consists of the research hypothesis, chapter four, the research methodologywhich gives a view of the adopted mixed research methodology, chapter five presents the core of thisresearch, chapter six provides further analysis outside the scope of the research but which we deemednecessary, chapter seven, the limitations of the study and recommendations for future work and chaptereight is the conclusion to this research.
2
Chapter 2
LITERATURE REVIEW
2.1 Introduction
Research conducted on the possible negative effects of the Internet usage on students have so far been di-vergent as far as their results are concerned. Apart from agreeing on the existence of Internet dependencyamong university students, previous studies have not been unanimous on aspects such as the reasons forwhich students use the Internet or even how the Internet influences students’ academic performance.Early studies conducted on the negative effects of the Internet, made use of the general public such asYoung’s [1996]. Studies that followed further investigated the role played by the Internet on campus asit was in its early years in academic institutions to help students with their academic work.
Metzger et al. [2003] showed that limited research has been conducted on the influence of the Inter-net on students’ lives. Young [1996] was among the first scholars to investigate the existence of Internetaddiction and the possible problems linked to its extensive use. As the adoption of the Internet and itstechnologies grows rapidly, its usage has not been without any consequences on students’ collegiate ex-perience [Morahan-Martin and Schumacher 2000; Anderson 2001; Kubey et al. 2001; Chen and Peng2008; Ogedebe 2010]. The observed consequences, range from physical and mental problems, devel-opment and maintenance of relationships, to academic performance impairments. The study conductedby Young [1996] revealed that students who were identified as Internet ‘dependent’ reported more neg-ative effects on their lives due to their excessive Internet usage than ‘non-dependent’ users. Subsequentstudies have revealed mixed results on this topic, except for Hazelhurst et al. [2011], these studies havestrongly relied on qualitative data gathered from students’ self-reports about their Internet usage habits.However, Gross [2004] found that research combining both quantitative and qualitative data could yieldmore enlightening results when investigating students and their Internet usage behaviours due to theinconsistency that arises from what students report and what they actually do.
Although the Internet was brought to university to improve students’ collegiate experience by ex-panding the information sources reservoir, enhancing students’ productivity and research skills amongothers, limited research has been conducted on the use of the Internet as an educational tool for studentsand its correlation with their academic performance. We believe that the most important contribution theInternet has to make into students’ collegiate experience is towards improving their academic grades andunfortunately limited studies have put an emphasis on this particular aspect. In this section we reviewthe literature on user acceptance of technology and its effect on individual performance, followed by theexistence of Internet dependency among university students, then we review the studies which investi-gated the reasons for which students use the Internet and then conclude by reviewing the studies thathave addressed the influence of the Internet on students’ academic performance as part of their researchfocus.
3
2.2 User acceptance of technology and its effect on individual perfor-mance
A study conducted by Davis [1989] argues that perceived usefulness and perceived ease of use of atechnology are fundamental determinants of user acceptance and unfortunately, research in this fieldhave been affected by a shortage of realiable measures for these determinants of user acceptance. Theauthor used the conceptual definitions of perceived usefulness and perceived ease of use to generatepre-test interview items involving 15 experienced computer users to assess the reliability and validityof the resulting scales. After conducting a field study that involved 112 participants which allowedthe author to scale down each construct to 14 items using the Spearman-Brown Prophecy formula, theauthor conducted a lab study involving 40 participants to further scale down the measurements items ofthese two constructs to 6 items. Each of the two conducted studies involved respectively two differentinteractive computer systems and two graphics systems. The author then used data from the two studiesto assess the relationship between usefulness, ease of use, and self-reported usage. The study revealsthat a .63 correlation coefficient was found between perceived usefulness and self-reported current usein Study 1 while a .85 correlation coefficient was found between perceived usefulness and self-predicteduse in Study 2. Furthermore, perceived ease of use was correlated .45 with use in Study 1 and .69 inStudy 2. The author also found that there was a stronger relationship between perceived usefulness andusage than perceived ease of use and usage. We judged necessary to review this study in this documentbecause we believe that the adoption of the Internet by students just like with any other technology ishighly dependent on whether it has been accepted by them which in turn is determined by how usefuland easy to use the students find the Internet. Recognizing that these factors may vary depending on thereasons for which students use the Internet play an important role in arguing about the reliability of theresults of the studies that look into the reasons for which students use the Internet.
Igbaria and Tan [1997] investigated the implications and consequences of IT acceptance by exam-ining the relationship between IT acceptance and its impact on the individual user. The authors’ studymade use of a model involving three components: user satisfaction, system usage, and impact on individ-ual. The study made use of a questionnaire on computer acceptance to collect data from 625 employeesof a large organization. 371 of the 625 employees successfully completed the questionnaire. The authorshypothesized that user satisfaction affects system usage and individual impact and that system usage hasa direct effect on individual impact. The authors’ analysis reveals that there is no significant differenceacross demographic groups and functional areas in terms of their user satisfaction level, system usage,and individual impact. The measure of overall user satisfaction included: measurement of the satisfac-tion of the extent to which computer applications meets the end user needs with regards to informationcontent, accuracy, timeliness, format and ease of use. Two indicators of system usage were used by theauthors in this study to measure the system usage variable: number of computerized applications usedby employees and number of business tasks for which the system is used. The latter was used to mea-sure the extent to which respondents use a computer in their work. The individual impact variable wasmeasured by perceived performance impact in areas such as productivity and effectiveness of the job.The results to the study reveal that user satisfaction is directly correlated to System usage, a correlationcoefficient of 0.39 was found between the two variables and furthermore, user satisfaction and systemusage were directly positively correlated to individual impact. The resulting correlation coefficients wererespectively 0.40 and 0.28 with a probability p < 0.01.Through the finding that user satisfaction is pos-itively correlated to system usage, the authors have proven that a system acceptance is dependent on itsperceived usefulness and ease of use as argued in the study by Davis [1989] since we believe the abovementioned two constructs drive user satisfaction. We believe it was therefore important before reviewingthe role played by the Internet and its effect on students’ lives to review if its usage is not affected bysatisfaction which is proven in this study.
Gelderman [1998] investigated the validity of the usage and user satisfaction in measuring the successof Information Systems. The author made use of a questionnaire distributed to 1024 Dutch managers, in-formation managers, and controllers. Of the 1024 questionnaires handed out, only 172 were successfully
4
completed. The questionnaire developed by the author measured: satisfaction with contents, accuracy,format, timeliness of information and satisfaction with the system’s ease of use for the user satisfactionvariable, and for the usage variable, the questionnaire measured: the number of hours of direct usage,the number of hours of indirect usage, the frequency of direct usage and the frequency of indirect usage.The author assessed performance using the Van de Ven and Ferry measure. The results of the study re-veal a significant relationship between usage satisfaction and performance as found in Igbaria and Tan’s[1997] study with ease of use having a 0.44 coefficient of correlation with performance. This substan-tiates finding by Davis [1989] that perceived ease of use is a fundamental determinant of acceptance ofa technology and subsequently this affects how well a user performs at a job related task. However, thefindings to this study suffer from a lack of reliability because self-reports of performance were used justlike in the study conducted by Igbaria and Tan [1997]. Therefore, there is a need for the development ofa more reliable instrument to measure performance as the author acknowledges.
The study conducted by Devaraj and Kohli [2003] proposed that the driver of IT impact is not theinvestment in the technology, but the actual usage of it by looking at the application of strategic technol-ogy in decision support systems (DSS) and their impact on organizational performance. In the case ofthis study financial performance was used as a mean of measuring the impact of IT on the organization.This study collected data for 36 monthly periods from eight hospitals of a health system network that hadimplemented a DSS. The measured usage data consisted of DSS reports with a strategic value excludingreports that ran over business hours.The actual usage was based on user resource consumption recordsstored in a log created by a utility program. The usage variables recorded by the utility program were:Reports, Disk I/O, and CPU time. Hospitals revenues were used as variables to measure performance.Revenues were divided into two categories: net patient revenue per day (NPRDAY) and net patient rev-enue per admission (NPRADM). The study reveals that there is a positive and significant associationbetween technology usage and NPRDAY and NPRADM. The calculated correlation coefficients were3.122 and 14.437 for NPRDAY and NPRADM respectively for usage measured by executed number ofreports while for usage measured as CPU time, these coefficents were: 0.379 and 0.178 respectively.The study further consolidates the above two mentioned findings by revealing that for usage measured asDisk Input/Output, the correlation coefficient were 69.02 for NPRDAY and 270.79 for NPRADM. Thesepositive and significant relationships found between usage variables and financial performance variablesconfirm the authors’ propositions that the actual usage of technology has a significant positive impacton financial performance. Devaraj and Kohli’s [2003] study confirms findings by Gelderman [1998] inthat system usage is associated to system performance in the case of this study that meant financial rev-enues. However, unlike in the study conducted by Igbaria and Tan [1997], the authors failed to considerin their study the user acceptance variable to see how/if it influences the actual usage of DSS and/ororganizational performance. We believe that not considering this variable could lead to organizationsnot considering improving their systems for the users but rather for enhancing organizational perfor-mance when it has been proven that user acceptance of a system is also associated with organizationalperformance [Igbaria and Tan 1997; Gelderman 1998].
Burton-Jones and Straub Jr. [2006] presented a two stages systematic approach for reconceptualizingthe system usage construct. These stages are: a definition stage, which requires the researcher to definesystem usage and explain its underlying assumptions; and a selection stage where the authors suggestthe system be conceptualized in terms of its structure and function whereby the structure of systemusage will consist of a user, system and a task components. The authors investigated the relationshipbetween system usage and short-run task performance in cognitively engaging tasks to provide evidenceof the viability of the presented approach. The chosen cognitively engaging tasks were analysts’ useof spreadsheets for financial analysis because of the popularity of these applications. For this purpose229 accounting university students were required to build an MS Excel spreadsheet to determine thebest approach for financing an asset purchase. The authors defined two measures of system usage:cognitive absorption (that captures a user’s employment of an Information System), and structure usage(that captures the use of a system for the task). Of the two types of system usage defined by the authors:explorative and exploitive, the authors chose exploitive usage (which refers to usage that involves routine
5
execution of knowledge) as a reference for their measures of system usage because their performancefocus is on short-run tasks. In the same line of thoughts, the authors measured task performance as anassessment of task outcome in terms of its effectiveness. Cognitive absorption was measured by a handedpost-task questionnaire which items required the participants to report how distracted and absorbed theygot when using MS Excel to perform the task while questionnaire items used to measure structure usagemeasured data analysis, assumptions testing and deriving of conclusions. The participants’ marks wereused as a measure of performance. The study reveals that cognitive absorption and structure usage bothpositively impact performance which supports findings by Gelderman [1998] and Devaraj and Kohli[2003] that system usage has a positive relationship with performance. We believe this study madea very valuable contribution to this field of study because it proposed a reliable and valid approachthat researchers could use to define system usage and how to precisely measure it and its impact onperformance. Moreover, the approach developed by the authors in this study encourages researchersto define the theory and assumptions behind the choices of usage measures they propose to use as thisdepends on the context the system is being used for as the authors have successfully shown in their study.
2.3 The existence of Internet Dependency among university students
Young [1996] was among the early supporters of the existence of Internet dependency among Internetusers of different ages. This study developed an eight item questionnaire referred to as a DiagnosticQuestionnaire (DQ) which she used to define addictive from normal Internet usage. This questionnairerequired respondents to indicate whether they feel preoccupied with the Internet, how they feel whenattempting to reduce their Internet use, to the time they spend online among many other criteria. Young[1996] further indicated that respondents who answered ‘yes’ to at least five items in this eight item listwould be classified as Internet ‘dependent’. The results of this study revealed that out of a sample of496 respondents, 396 of them filled the criterion for being labeled as Internet ‘dependent’. The authorreveals that an increasing familiarity with the Internet is at the origin of the development of dependencycharacteristic to Internet usage, which in turn is exacerbated by the level of interactivity of the onlineapplication used by an individual. She concluded that excessive Internet usage could result in problemswith one’s academic performance, relationships maintenance and developments.
Scherer [1997] narrowed the research by Young [1996] by focusing on the existence of Internet de-pendency among college students. This study developed a list of 10 clinical symptoms of Internet depen-dency and students who reported at least three of these symptoms were classified as Internet ‘dependent’.In this study, Scherer [1997] revealed that 13% of the 531 respondents were found to fit the classifica-tion of Internet ‘dependent’. Furthermore, Scherer [1997] shows in contradiction to Young [1996], thatInternet dependency is not related to how long an individual has been using the Internet but concurs withYoung [1996] that interactive online services like chat rooms or online multi-users dungeons were moreattractive to Internet ‘dependent’ users. Both studies revealed a significant difference in time spent onlinebetween the ‘dependent’ and the ‘non-dependent’ categories although Scherer [1997] emphasized thatthis difference is only noticeable when measuring time spent online for leisure activities. Both Scherer[1997] and Young [1996] concur that excessive Internet usage has an impact on scholastic performanceamong students. Of importance, Scherer’s [1997] results apply more to college students while Young’s[1996] focuses on the general public. Most participants in Scherer’s [1997] study reported a more pos-itive than negative perception of the influence the Internet has had on their lives, however self-reporteddata used in this study could in no way identify students who suffer from a great amount of denial abouttheir dependency to the Internet as it has become a major component of their everyday lives.
The study by Morahan-Martin and Schumacher [2000] wanted to establish the effects of pathologicaluse of the Internet among college students. They developed a pathological use scale consisting of 13questions to assess the level of dependency to the Internet among the 277 undergraduate Internet usersthat they surveyed. Among the three levels of pathology identified by this study (No symptoms, limitedsymptoms and pathological symptoms), they found that 8.1% of the participating students reported fouror more symptoms and were considered pathological Internet users. This study reveals that 72.8% of the
6
students surveyed reported at least one symptom indicating problems caused by their Internet usage inaddition to the 8.1% who were found to be pathological users. This study also supports Scherer’s [1997]and Young’s [1996] findings in that pathological users use the Internet more than others as it found anaverage weekly hours online being of 8.48 for pathological users, 3.18 for those with limited symptomsand 2.47 for those not displaying any symptoms of pathological Internet usage. In agreement withScherer [1997], this study found that pathological Internet users were more likely than those showinglimited symptoms or no symptoms at all to use the Internet for interactive online applications and formultiple other reasons such as wasting time or staying abreast of new developments. In oppositionto Young [1996], the authors show that comfort and competence while using the Internet was not acontributing factor to excessive Internet usage which supports Scherer’s [1997] hypothesis that Internetdependency is not associated with the number of years students have been using the Internet.
A paper-and-pencil survey conducted by Kubey et al. [2001] used self-reported evidence to sup-port the existence of Internet dependency in college students and its correlation with students’ academicproblems. It employed a five-point Likert scale to assess students’ self-reported dependency on the In-ternet. 9.26% of the 576 respondents reported being Internet ‘dependent’ and as reported by Scherer[1997] these students spent more time online (nearly three times) than ‘non-dependent’ Internet users.In contradiction with Scherer [1997], Kubey et al. [2001] support Young’s [1996] finding that Internet‘dependent’ users are more experienced Internet users with regards to length of time having used theInternet than ‘non-dependent’ users. They report 79.2% of ‘dependent’ students having used the Internetfor 2 to 3 years or longer compared with 55.1% of ‘non-dependent’ students and also 35.9% ‘dependent’students have been using the Internet for 4 years or longer compared to only 7.5% of ‘non-dependent’students. These findings support Scherer’s [1997] results that showed that Internet dependency is moreassociated with interactive Internet applications as it found the ‘dependent’ students averaging 2.81 hoursper week using synchronous communication Internet applications compared with 20 minutes on averagefor ‘non-dependent’ students. Similar studies by Young [1996] and Scherer [1997], Kubey et al. [2001]found that Internet dependency could cause some problems in students’ life; it has found for instancea 0.563 Pearson correlation coefficient between Internet dependency and academic impairment as dis-cussed in a later section. Kubey et al.’s [2001] study shows that Internet dependency is associated withlength of time having used the Internet as opposed to Scherer’s [1997] unsupported contradictory resultswhich suggests that the longer students have been using the Internet, the more likely they are to be In-ternet ‘dependent’ and thus the more they are subjected to the impaired academic performance causedby extensive Internet usage. As Internet usage is becoming a major educational support tool on cam-pus and assuming that senior year students have more experience using the Internet than their juniorcounterparts, we believe attention could be directed to investigating whether among Internet ‘dependent’students, senior students report more academic performance problems than junior level students due totheir extensive Internet usage.
A study by Anderson [2001] identified students as susceptible to problems related to excessive Inter-net usage because of factors such as easy accessibility to the Internet as mentioned by Kandell [1998],along with the sense of security provided by the anonymity of the Internet, which allows some studentswho are less socially inclined to develop virtual relationships. This study surveyed 1,078 Internet usersand identified 9.8% of this sample as Internet ‘dependent’ as they responded positively to at least three ofthe seven questions the author used as criteria for Internet dependency. This study confirms findings fromKubey et al. [2001] and Scherer [1997] that Internet ‘dependent’ students spend more time on the Inter-net than other students as it actually found Internet ‘dependent’ students to be averaging 229 minutes perday for Internet usage compared to only 73 minutes per day for ‘non-dependent’ students. Although incontrast to Scherer [1997] who found most students to report a positive influence of the Internet on theirlives, in this study, Anderson [2001] found that Internet ‘dependent’ students were more likely to reportnegative effects on various aspects of their lives due to their extensive Internet usage than the rest. It isimportant to note that of all the above-mentioned studies, the one conducted by Scherer [1997] is the onlyone that did not only measure students’ Internet usage for recreational online activities. We view this tohave led to a biased categorization of students under either Internet ‘dependent’ or ‘non-dependent’ users
7
because by not excluding the time students spend online for school related work, Scherer’s [1997] studymight have falsely included students who spend a lot of time online for school related purposes into theInternet dependent class. Thus, this sampling bias might have affected the generalization of his findingthat Internet ‘dependent’ students spend more time online using interactive applications such as onlinemulti-users dungeons as mentioned by Young [1996]. The latter’s findings were supported by Kubey etal. [2001] and Anderson [2001] and in these studies, we are led to question if students, ‘dependent’ ornot, use the Internet for the intended purpose it was brought to campus; as an educational enhancementtool or as an entertainment tool.
Fortson et al. [2007] assessed Internet use, abuse and dependence among 411 students from a South-eastern regional American university. This study made use of a 9 item demographics questionnaire toassess the Internet abuse and dependency level among the participants drawn from the model used by An-derson [2001] in his study. The study considered respondents to be Internet ‘dependent’ if they endorsedat least three or more symptoms of dependency such as withdrawal, impairment in social, occupationalactivities due to extensive Internet usage amongst others. The study reveals that 26.3% of the respondentsmet the criteria for Internet dependence. The study found that participants meeting the criteria for Inter-net dependency spend more time online than those not meeting the criteria as argued by previous studieslike the ones conducted by Young [1996], Scherer [1997], Morahan-Martin and Schumacher [2000]. Italso supports the findings of Scherer [1997] and Young [1996] that Internet ‘dependent’ users accessthe Internet more for its interactive applications than for any other purposes. This study although usinga model similar to the one used by Anderson [2001] to evaluate pathological Internet use and buildingits questionnaire around Scherer’s [1997] work, found that 22% of its participants were Internet ‘depen-dent’ whereas with regards to the same characteristic, Anderson [2001] found 9.8% and Scherer [1997]13%. As the author suggests, more rigorous survey instruments need to be developed and researchersneed to agree on common criteria to use when evaluating pathological Internet usage among students.This suggestion in our opinion supports the findings of Gross [2004] that a combination of qualitativeand quantitative data will shed more light into students’ Internet usage behaviours since previous studieswhich have been using qualitative data only reveal inconsistencies when comparing their findings. Thisobservation clearly indicates that standardized measures of Internet usage and Internet dependency needto be agreed on for future research in the field.
Choi et al. [2009] examined the association of Internet use with excessive daytime sleepiness among2336 high school students in South-Korea. The authors developed a questionnaire which items measuredevidences of Internet addiction, excessive daytime sleepiness, durations of Internet use and night sleepand other sleep-related problems such as insomnia symptoms. The level of Internet addiction was mea-sured using the instrument developed by Young [1996]. The study identified three types of Internet usergroups: Internet addicted, possibly addicted, and non-addicted. Daytime sleepiness was measured usingthe Epworth Sleepiness Scale (ESS) which is a frequently used sleepiness questionnaire consisting ofeight items. The study reveals that 50.3% of the participants were classified as ‘Non-addicted’ Internetusers, while 47.4% and 2.3% of the participants were respectively classified as ‘possibly addicted’ and‘addicted’ Internet users. The study also reveals that 11.2% of its participants showed symptoms of ex-cessive daytime sleepiness with 37.7% of them being ‘Internet addicts’, 13.9% being ‘possible Internetaddicts’ and 7.4% being ‘non-addicts’ Internet users. The study further reveals that ‘addicted’ users usedthe Internet significantly more than the ‘possibly addicted’ and ‘non-addicted’ counterparts. Their re-spective daily average Internet usage were: 3.5hours, 2.3 hours and 1.7 hours. Furthermore, ‘addicted’Internet users were found to perform significantly worse academically than ‘possibly addicted’ Internetusers and ‘non-addicted’ Internet users. They were in the respective proportions of : 37.7%, 31.5%,and 29.3%. ‘Internet addicted’ users were found to sleep on average less than their ‘possibly addicted’and ‘non-addicted’ counterparts at night. They were found to respectively sleep for 5.4 hours, against6.1 hours and 6.1 hours. These findings were similar to the revealed evidences of insomnia. 35.9% of‘Addicted’ Internet users showed symptoms of insomnia, compared to 26.1% and 19.3% of ‘possiblyaddicted’ and ‘non-addicted’ Internet users. This study confirms that Internet addiction is well-existantand is a problem among students [Young 1996; Scherer 1997; Morahan-Martin and Schumacher 2000;
8

Kubey et al. 2001; Anderson 2001; Fortson et al. 2007]. However, as argued by Fortson et al. [2007],the results of this study might suffer from a lack of reliability as they were based on self-reported data.Furthermore, we believe the authors should have developed stronger measures of Internet addiction todetermine whether a user is ‘addicted’ or ‘not-addicted’ to the Internet because ‘possibly addicted’ isa term which does not reliably describe what type of Internet user a student really is. We believe theterm ‘moderate’ Internet user would have been academically more acceptable, provided that the authorsdefined what they understood by ‘moderate’ Internet user.
The study by Ni et al. [2009] investigated evidence of Internet addiction and influential factors asso-ciated with Internet addiction among 3557 first year university students. The study made use of Young’s[1996] study questionnaire to measure the level of Internet addiction among the participants. The studyreveals that 6.44% of its participants showed symptoms of Internet addiction confirming therefore the ex-istence of Internet dependency among students [Young 1996; Scherer 1997; Morahan-Martin and Schu-macher 2000; Kubey et al. 2001; Anderson 2001; Fortson et al. 2007]. The study further reveals thatstudents who surf the Internet more than 4 hours per day had a higher probability of Internet addictionand subsequently showed more significant, severe psychiatric symptoms compared to those not addictedto the Internet. The self-rating depression and self-rating anxiety scales used in this study substantiatethis finding by finding that ‘addicted’ students had significantly higher scores on these scales than the‘non-addicted’ group and also, positive correlation coefficients between these psychiatric syndroms andthe level of Internet addiction were found. They were respectively 0.338 and 0.3555 with both having ap value p < 0.0001. Ni et al. [2009] further argue that early exposure to the Internet can be associatedwith Internet addiction. They found a probability p < 0.05 between the age of first exposure to Inter-net factor and Internet addiction. We believe that this latter finding brings into play the importance ofinvestigating the user acceptance of a system factor as reviewed in the previous section of this chapteras it is probable that the age of exposure to the Internet might influence its usage and subsequently itsacceptance as demonstrated by Davis [1989] and Gelderman [1998].
Ko et al. [2009] study aimed at developing diagnostic criteria of Internet addiction using 216 col-lege students who had to answer which assessed the frequency of Internet use and time spent onlineweekly. This questionnaire was divided into three main sections that measured: characteristics symp-toms of Internet addiction, functional impairment secondary to Internet use, and the exclusive criteria.The study reveals that 43.1% of its participants were classified as the addictive group and 56.9% asthe non-addictive group. This finding confirms the finding by Young [1996] and Scherer [1997] thatthere is an existence of Internet dependency among students. The study further reveals that 113 of itsparticipants, mostly from the addictive group were found to show at least one symptom of functionalimpairment due to Internet use. Of these 113 participants, 78.8% were suffering from academic perfor-mance impairment, 48.7% relationships break-ups, 3.5% have failed to fulfill family obligations. Theauthors did not demonstrate in their study what was the primary use of the Internet for the students. Webelieve failing to do this prevents one from seeing if the extensive usage of the Internet for any purposecan be linked to a particular impairment. For instance, it would have been informative to see if the dropin students’ recreational activities or in relationships maintenance is not caused by students building newrelationships or being involved in recreational activities online. Doing this would have allowed the au-thors to pin-point the actual online activities being at the center of the found impairments and directlyaddress them.
2.4 What do students use the Internet for?
Preliminary findings on the main reasons for which students use the Internet can be attributed to Young[1996] which revealed that students who were identified as being Internet ‘dependent’ had differentsurfing behaviours than those who were identified as being ‘non-dependent’ users of the Internet. Fur-thermore, this study found that chat rooms and Multi-Users Dungeons (MUDs) were the most usedapplications with scores of 35% and 28% respectively for the ‘dependent’ population while between the‘non-dependent’ population, e-mail and the World Wide Web were the most used services with scores of
9

30% and 25% respectively. The author argues that the Internet is attractive to its users for its interactivityand its ease of use which links to Davis’s [1989] study in that the general public has quickly adopted theInternet and its technologies because among other reasons, it is easy to use.
In contrast to Young [1996], Scherer [1997] revealed that MUDs and chat rooms were the less popu-lar services used by students, 9.1% and 1.8% respectively for the surveyed students population, while themost used applications were e-mail (98.7%); the World Wide Web (85.2%) and library services (54.0%)for the surveyed population. Moreover, Scherer’s [1997] study reveals that weekly Internet users ac-cessed the Internet mostly to maintain relationships with family and friends (97.9% of the respondents)and for academic work (91.9% of the respondents). Although Scherer’s [1997] study does not differenti-ate in details the purposes of using the Internet between ‘dependent’ and ‘non-dependent’ Internet usersas illustrated by Young’s [1996] study, which revealed that ‘non-dependent’ users predominantly usedthose online services which allowed them to gather information, Scherer [1997] supports this finding byrevealing that ‘dependent’ users mostly used the Internet for entertainment purposes as they were shownto be the predominant users of chat rooms, MUDs, news groups and others similar applications. Interest-ingly, when comparing both studies, there are significant differences in weekly Internet usage between‘dependent’ and ‘non-dependent’ Internet users for personal or recreational activities. Scherer [1997]found that ‘dependent’ Internet users spent on average 7.8 hours per week online for personal or leisureactivities against 3.7 hours per week for ‘non-dependent’ users while Young [1996] found that ‘depen-dent’ Internet users spent on average 38.5 hours per week online for recreational activities compared toonly 4.9 hours for ‘non-dependent’ users. Young [1996] classified almost 80% of her respondents (396out of a sample of 496 respondents) as Internet ‘dependent’ while Scherer’s [1997] study classified only13% of its respondents (taken from a total of 531 respondents) as Internet ‘dependent’ users. Althoughthe samples in both studies were very similar regarding the number of respondents, the remarkable dif-ference observed in the average time spent online for recreational activities between ‘dependent’ Internetusers in both studies as illustrated earlier supports in our opinion the results by Fortson et al. [2007] thatthere is a need for researchers in the field to develop and agree on standardized instruments to measureInternet usage and Internet dependency among students.
Perry et al. [1998] investigated the potential existence of differences in Internet usage among 548students belonging to various age groups who use the Internet at least once a week. 43.8% of the re-spondents self-identified themselves as regular Internet users. The study considers as a regular Internetuser any person who uses the Internet for at least one hour per week. The study reveals that 80% of itsself-identified regular Internet users use the Internet for email compared to 48.3% who use it to obtainuniversity information. 28.3% of the respondents were found to use the Internet for a maximum of anhour per week while 2.1% of them were found to use it for at least 20 hours per week. Although thisstudy supports findings by Scherer [1997] and Young [1996] in that e-mail is among the most predom-inant online applications used by students, we believe that the study should have specified which typeof Internet usage it was measuring together with a larger number of most used online applications asdescribed by the aforementioned studies. By failing to do so, the authors are unable to show whether theInternet is mostly used for recreational activities or other types of activities such as academic research.The study by Perry et al. [1998] fails to show the difference in Internet usage behaviours among thedifferent groups of regular users. Their study presumes that these groups might be using online servicessimilarly and therefore the Internet may affect all aspects of these different groups of users’ lives thesame way irrespective of whether they are ‘dependent’ to the Internet or not and whether they perceivethe Internet as useful or easy to use as suggested in Davis’s [1989] study.
The majority of the 226 7-10th graders students surveyed by Lubans [1999] reported using the In-ternet for academic/learning purposes. This supports findings by Scherer [1997] which reveal that over90% of its survey responding students used the Internet for academic work. However, Lubans [1999]found that as a group, freshmen significantly use the Internet more than 7-10th graders yet the latterstudents rated themselves more expert in using the Internet than did the former. This finding supportsthe results by Scherer [1997] that Internet dependency is not related to Internet experience because ifit was, by following both Scherer’s [1997] and Lubans [1999] logic, even though freshmen would have
10

been exposed to the Internet longer than junior students, it does not imply that the former would be moreeffective Internet users than the latter because a common belief is that comfort and effectiveness using anapplication comes with the experience acquired while using it. Furthermore, Lubans [1999] found that7-10th graders reported more academic benefits from their Internet usage than did the freshmen althoughthe latter use the Internet more than the former. This finding by Lubans [1999] suggests a hypotheticalassociation between Internet usage and academic performance which future research could support orreject as it showed that the students who used the Internet the least reported more benefits with regardsto their academic performance than did those who used the Internet the most. In contrast to Young’s[1996] findings, Internet dependency was found not to be associated with Internet experience, we sug-gest that Scherer [1997] and Lubans [1999] should have investigated in their studies the differentiatingcharacteristics of an Internet ‘dependent’ student from an Internet experienced student with regards totheir Internet usage as both groups may also have a different perception of the usefulness of the Internetand how easy for them it is to use it .
Morahan-Martin and Schumacher [2000] investigated types of Internet sites used and reasons foruse among 277 undergraduate Internet users. The survey they used included 11 questions which askedparticipants to indicate their average weekly use of Internet applications such as emails, World WideWeb, Instant relay chat and MUDs. The participants were also asked to indicate how frequently theyused the Internet for multiple reasons ranging from communication, academic work, to recreationalactivities as well as requiring those who have used the Internet to indicate for how long they have used it.The study reveals that pathological Internet users used more Internet sites and all Internet sites more thanother students. Email was found to be the least used application. This study confirms findings by Young[1996] and Scherer [1997] that pathological Internet users were more likely than other users to use theInternet mostly for the interactive services it provides, such as platforms to meet new people, playinggames or relaxation. Although the authors support the findings by Scherer [1997] and Lubans [1999]which show that Internet experience is not associated with Internet dependency, they found that besidesa difference in average weekly Internet usage, pathological Internet users have been using the Internet forthe same length of time as other users. The study thus fails to capture the activities performed by ‘non-dependent’ Internet users online. The fact that the study found pathological users to be more likely touse the Internet more for recreational activities than ‘non-dependent’ users as opposed to Scherer [1997]and Lubans [1999] who found academic work to be one of the main reasons students go online, does notshow that ‘non-dependent’ users are using the Internet for academic purposes either. We suggest that itis crucial to study the Internet usage behaviours of both ‘dependent’ and ‘non-dependent’ Internet usersand assess its effects on their lives. By doing so, it would enable us to determine whether ‘dependent’users happen to be reporting more negative problems due to their Internet usage, if it means that excessiveInternet usage is correlated to students’ impairments in areas such as academic performance.
A study conducted by Odell et al. [2000] analyzed in detail gender differences in Internet usageamong 843 college students. 385 respondents were males and 458 were females. The study confirmedfindings by Morahan-Martin and Schumacher [2001] and Gross [2004] in that there is no persistinggender gap in Internet usage among students. The study also reveals that female students used the Internetby a smaller weekly average than their male counterparts, for 5.4 hours and 7.1 hours respectively. E-mailwas found to be the most predominant Internet application used by both genders as showed by Scherer[1997] and Perry et al. [1998] although more females (91%) used it than males (85.7%). The authors’finding also supports Scherer’s [1997] and Lubans’s [1999] results that academic work is also a majorreason students use the Internet as it found its usage between both genders being of 91.7% for femalesagainst 84.9% for males. Although male students were found to be using the Internet for more otherpurposes than female students, those other reasons were not as major as students’ use of the Internet fore-mail and academic research. For instance, the study revealed that 43.6% of males against 26.6% offemales were more likely to use the Internet for playing games. This study also confirms findings fromKandell [1998] and Anderson [2001] that students majoring in hard sciences use the Internet far morethan students from other academic disciplines such as arts. This finding could actually as suggested byJohnson [2009] be a basis of a research that would seek to determine the possible existence of a difference
11
in Internet usage patterns among students from different academic disciplines.Rumbough [2001] explored controversial online behaviours of 985 college students enrolled in dif-
ferent academic disciplines. The study reveals that 53.8% of its participants use the Internet ‘severaltimes a day’. The main reasons students used the Internet were for downloading music, as indicatedby 62.4% of the respondents and to play games, as indicated by 29.1% of the respondents. A total of17.7% were found to use the Internet for academic cheating. In contrast to Rumbough [2001], studies byScherer [1997] and Lubans [1999] reveal that academic work is a major reason why students use the In-ternet. These studies induce us to ask the question, whether the use of the Internet as an educational toolis more for students to cheat for their academic tasks or to perform genuine research. This suggestioncould trigger future research that would investigate whether students who claim to be performing wellacademically because of the Internet do not do so because they use it as an academic cheating tool. Hadthe study categorized students into either Internet ‘dependent’ or ‘non-dependents’, it would have beenable to reveal if both categories engage in similar controversial surfing behaviours to the same extent; thiscould have provided an answer to our previously mentioned research suggestion. The author similarlyrecommends, as do Gross [2004] and Fortson et al. [2007], that future studies should use other methodsof research to triangulate the findings as the responses to the survey may suffer from a lack of validity.
The Internet applications mostly used by 83 Taiwanese college students were explored by Chou[2001] to evaluate the excessive and addictive usage of the Internet among Taiwanese students. Those 83students were selected from the pool of Internet addicts identified by a similar study the author previouslyconducted [Chou and Hsiao 2000]. ‘Heavy’ users were identified as those students whose weekly Internetusage exceeded 30 hours and self-identified ‘heavy’ Internet users. The research focuses of Chou [2001]were: Internet use, reasons and features of that use and impact of heavy Internet usage. As showedby Scherer [1997], Odell et al. [2000] and Perry et al. [1998], email was found to be among the mainapplications used by most subjects. Ninety five percent (95%) of the respondents reported using theInternet mainly for electronic bulletin boards systems (BBS), email and the World Wide Web as well asfor other applications such as games and MUDs. It also supports findings from Young [1996], Scherer[1997], Lubans [1999] that the World Wide Web was used for academic research, personal interests andentertainment. As showed by Young [1996], this study reveals that among the attractive features of theInternet are its interactivity and ease of use which in our opinion suggest that Internet ‘dependent’ usersmay feel more comfortable using the Internet because of its perceived ease of use as illustrated by Cheungand Huang [2005]. The latter argument hypothesizes that Internet ‘dependent’ users may perceive theInternet as being more easy to use than ‘non-dependent’ and thus perceived ease of use of the Internetcould also be considered as a biasing factor when classifying Internet users into either ‘dependent’ or‘non-dependent’ users. In the same line of thought it would also be interesting to measure the influenceof time spent using the Internet on perceived ease of use of the Internet as it is probable that experiencedInternet users have a more positive perception of the ease of use of the Internet than less experiencedusers.
Jones [2002] investigated the impact of Internet usage on students’ academic and social lives. Thestudy made use of two surveys distributed to 2,054 college students from 27 higher learning institutions inAmerica. The study reveals that 86% of college students use the Internet compared to 59% of the generalpopulation and that 19% of them use it for at least 12 hours per week which support claims that studentsare heavy Internet users [Kandell 1998; Anderson 2001; Kubey et al. 2001]. The author found that 60%of its respondents are likely to use the Internet to download music as supported by Rumbough [2001].Jones [2002] found that the main reasons students use the Internet are for: social communication (42% ofthe respondents), engaging in work for classes (38%), entertainment (10%), professional communication(7%), do not know/not sure (2%). These results support findings by Scherer [1997], Lubans [1999]and Chou [2001] that the Internet is mostly used by students for academic work and for maintainingrelationships. Email was the most predominant Internet application used by students, as indicated by62% of the study’s respondents, followed by instant messaging, 29% of the respondents like previousstudies reported [Young 1996; Scherer 1997; Perry et al. 1998; Odell et al. 2000; Chou 2001]. The studyalso reveals that 73% of its respondents use the Internet more than the library as a source of academic
12

information. This finding which has never been supported will enable us to evaluate the influence of theInternet as an educational tool on students’ academic performance by finding out which one of the twosources of information allows students to perform better academically. Furthermore, this study revealsthat students spend more time on the Internet than studying as 62% of the respondents reported studyingfor classes for a maximum of 7 hours per week while only 14% of them reported studying 12 or morehours per week. While there is no literature in the field which supports this suggestion, it would havebeen necessary for the study to investigate if differences were observed between both these groups in thisrespect and to determine the impact the Internet has had on these students’ lives.
Metzger et al. [2003] examined the nature of students’ use of the Internet and how it influences theireducation. This study surveyed 356 undergraduate students from different year levels who had to fillin a questionnaire with open and close ended items. These items were related to students’ frequencyof Internet use, the general purposes for which they accessed the Internet and how often they used theInternet for academic related purposes compared to other information sources. The study reveals thatstudents are heavy users of the Internet similar to studies by Scherer [1997], Kandell [1998], Anderson[2001], Kubey et al. [2001], and Jones [2002]. They found that 51% of the respondents were using theInternet on a daily basis and as showed by Odell et al. [2000], Morahan-Martin and Schumacher [2001]and Gross [2004], no difference between genders in the frequency of Internet usage was found. How-ever as opposed to Lubans [1999], the authors did not find a difference in frequency of Internet usagebetween students from different year levels. This study’s close ended questions showed that studentsuse the Internet more for entertainment than for academic research as opposed to studies by Scherer[1997], Lubans [1999], Odell et al. [2000], Chou [2001], and Jones [2002] which made a contradictorysuggestion. However, the responses to open ended questions related to the reasons students use the Inter-net and these supported the findings from the previously mentioned studies by Scherer [1997], Lubans[1999], Odell et al. [2000], Chou [2001], and Jones [2002] as students reported using the Internet morefor school purposes than any others. This significant difference found between the answer to students’purposes for which they used the Internet when using close ended and open ended questions support therecommendation by Rumbough [2001], Gross [2004] and Fortson et al. [2007] that more accurate in-struments need to be used when measuring students’ Internet usage as well as their purposes for using it.This study also found that students mostly used books when looking for information related to academicwork as opposed to Jones [2002] who suggested that 73% of his study’s respondents reported using theInternet more than other media in this regard. The authors also found that both genders used the Internetequally for schoolwork as opposed to Odell et al. [2000] who found that 91.7% of its responding femalestudents used the Internet for academic related purposes compared to 84.9% of its male respondents.Moreover, this study contradicts the findings by Lubans [1999] that freshmen used the Internet less thanjunior students as it found no major difference between the two groups in this regard and thus the authorsfound that students felt the Internet was slightly useful to improve their grades or the quality of theirwritten work. Metzger et al. [2003] similarly to Young [1996] and Chou [2001] showed that a positiveperception of use of the Internet is a factor towards students’ adoption of this technology. Therefore, theimportance of this factor needs to be assessed when classifying students as either Internet ‘dependent’ or‘non-dependent’ users.
As aforementioned, Fortson et al. [2007] assessed Internet use, abuse, and dependence among 411undergraduate students from the same university. They made use of a paper and an Internet surveywhich respondents had to select any one of the two to complete. Both the paper and the Internet surveyinstruments contained an Internet usage questionnaire to determine the purposes students accessed theInternet. The authors report that no major differences were found between both survey-instruments formost questions except for the reasons why the participants used the Internet. Individuals completing theInternet version were found to be more likely to report using the Internet for academic purposes as withstatistics being of (M= 3.4, SD=0.6; M=3.2, SD= 0.7, for Internet and paper respectively.) This differencein findings between the two instruments used supports the view that there is a need for standardizedinstruments to be developed by researchers in this field [Rumbough 2001; Metzger et al. 2003; Gross2004]. As previously found by Scherer [1997], Lubans [1999] and Chou [2001], the study reveals that
13
academic and relationship maintenance were the most predominant reasons students use the Internet,with daily usage being of 41% and 57% respectively for the respondents. The study also found that emailwas the most used application as indicated by 80% of the study’s respondents. This finding supports thoseof Young [1996], Scherer [1997], Perry et al. [1998], Odell et al. [2000], Chou [2001], and Jones [2002].Moreover, Fortson et al. [2007] suggests that there is no difference in usage between male and femaleInternet users as supported in earlier research by Odell et al. [2000], Morahan-Martin and Schumacher[2001], Metzger et al. [2003], and Gross [2004] .
A study conducted by Hazelhurst et al. [2011] investigated the association between academic per-formance and Internet usage among 2153 second year students by looking at the websites these studentsgo to as well as their Internet usage. The study reveals that 51.6% of its participants are heavy Internetusers although the figures in studies making similar suggestions were different because of the samplessize used [Scherer 1997; Kandell 1998; Anderson 2001; Kubey et al. 2001; Jones 2002; Metzger et al.2003]. After investigating the top 100 sites used, this study reveals that students’ Internet use is non-academic in nature and that students use the Internet more for social purposes, in opposition to somestudies we reviewed above by Scherer [1997], Lubans [1999], Chou [2001], and Fortson et al. [2007].This study is very innovative compared to earlier mentioned studies as it made use of quantitative dataas recommended by Rumbough [2001] who recommended that other instruments be used to triangulatethe findings. This study could thus yield more accurate results because what students report might not bereflective of their actual web-surfing behaviours. However, this study did not measure the length of timerespondents have been using the Internet as opposed to Young [1996], Scherer [1997], Lubans [1999]and Morahan-Martin and Schumacher [2000] and therefore like the mentioned studies it does not addressthe hypothesis that Internet experience just like perceived ease of use of the Internet as argued by Davis[1989] might be a contributing factor towards students’ usage of the Internet and considering this factorcould help having a fairly unbiased categorization of students as either ‘heavy’ or ‘light’ Internet users.Qualitative data collection instrument could have been used to support or not support the classification ofstudents as either ‘heavy’ or ‘light’ Internet users. A survey for example could have been used to ask stu-dents to also report about their Internet usage at home since by only measuring students’ Internet usageat university, this study might not have taken into account that those students found to be ‘light’ Internetusers on campus might be ‘heavy’ Internet users at home. This suggestion supports recommendationsby Gross [2004] and Fortson et al. [2007] that a combination of quantitative and qualitative collecteddata could yield more enlightening results when conducting research in the field of Internet usage andstudents.
Ogedebe [2010] examined the relationship between academic performance and Internet servicesamong 350 students from different academic disciplines by using a questionnaire which requested stu-dents to report about the reasons for which they use the Internet and how often they use it on a weeklybasis. His study reveals that 73% of its participants use it for a maximum of two days per week withoutbeing precise about how many hours they use the Internet during those days therefore making it impos-sible to tell whether they are ‘heavy’ or ‘light’ Internet users. Ogedebe’s [2010] study supports findingsby Scherer [1997] and Lubans [1999] by revealing that students mostly use the Internet for academicwork as reported by 45% of them and for relationship maintenance as 13% of them reported using theInternet for sending and receiving emails. The author’s study reveals that only 65% of its participants arecomputer literate. We believe that the author’s failure to investigate the possibility that this may affectwhether or not a student uses the Internet and the reasons for which he/she uses it raises doubt aboutthe reported reasons for which students use the Internet. From our perspective, computer literacy caninfluence the perceived ease of use of the Internet which in return can influence the reasons for whichone uses the Internet.
2.5 The influence of the Internet on students’ academic performance
As illustrated in the previous sections, one major aspect of Young’s [1996] study was to examine the ex-tent of problems caused by excessive Internet usage among 496 volunteers taken from the general public.
14

Following a Diagnostic Questionnaire developed by Young [1996] to identify individuals who met thecriteria for pathological Internet usage, the author later found that 396 individuals were Internet ‘depen-dent’ users while the remaining 100 were ‘non-dependent’ to Internet usage. The study reveals that while‘non-dependent’ users mainly complained about poor time management when on-line, ‘dependent’ usersreported a wider range of problems due to extensive Internet usage; these problems ranged from personalto occupational problems. The author classified problems related to extensive Internet usage into five cat-egories: academic, relationship, financial, occupational and physical, and she further broke impairmentlevel into four categories, from none to severe. Academic performance was the most affected aspect ofthe respondents’ lives as 58% of them reported severe academic impairments due to extensive Internetusage. On the same impairment level, relationship, financial, occupational and physical had respectivescores of 53%, 52%, 51% and 0% among the respondents. The author linked the academic problemsdiscovered to student’s irrelevant web site surfing, chat room gossiping, interactive game playing and notenough sleep. Furthermore, Young’s [1996] findings as discussed in the previous chapter are consistentwith the findings of the study by Chou [2001], Odell et al. [2000] revealing that ‘dependent’ users mostlyused the Internet for its interactive services such as chat rooms and MUDs (multi-users dungeons), 35%and 28% respectively for the respondents; while, ‘non-dependent’ predominantly used Internet featuresthat allowed them to collect information i.e: Information protocols, 24% of the respondents, the WorldWide Web, 25% of the respondents and email, 30% of the respondents. Therefore, the assumption elu-cidated from the author’s findings is that ‘dependent’ Internet users will see their academic performancesuffering from more impairments than others due to their extensive Internet usage.
Scherer [1997] revealed that students mostly use the Internet for academic work. Scherer [1997]found that out of the study’s 531 responding college students, 90% reported using the Internet for aca-demic work and also 58% against only 2% of the respondents perceived the Internet as having a positiveimpact on their lives. Although the author found academic work to be a predominant reason studentsuse the Internet, the author did not actually investigate whether this extensive academic usage of theInternet was helping students to perform better with regards to their grades, which is a conclusion notto be taken without evidence. The study of 226 7-10th graders by Lubans [1999] reveals similarly withScherer’s [1997] that the Internet is used for academic/learning purposes as indicated by a majority ofweekly Internet respondents. Although Lubans [1999] found in his study, that freshmen claimed usingthe Internet more significantly than 7-10 graders, the former reported not seeing too many benefits fromtheir Internet usage on their academic performance. The author actually found that for many students(mostly 7-10th graders), the Internet has helped them academically for completing required papers, toimproving their grades as well as to helping them improving the quality of their written work. WhileScherer’s [1997] study does not reveal which between Internet ‘dependent’ and ‘non-dependent’ usersreports more benefits on their academic performance due to their Internet usage, Lubans [1999] suggestthat although freshmen use the Internet more than their 7-10th grade counterparts, the latter reports moreacademic benefits from their Internet usage than the former. From both studies, it is not yet possible tofind an association between extensive Internet usage and academic performance. Moreover, the above-mentioned studies together with Young’s [1996] do not clearly establish a link between extensive Internetusage and academic performance. Young [1996] found that academic impairments was the most reportedproblem caused by extensive Internet usage, but did not explicitly show that ‘dependent’ Internet userswere the ones suffering the most in this aspect.
The study conducted by Morahan-Martin and Schumacher [2000] on 277 undergraduate Internetusers supports findings from Young [1996] that Internet usage is causing problems among students as itfound that 72.8% of the respondents to their study reported at least one problem related to Internet usage.The study reveals that 54.6% of its pathological Internet users reported that their Internet usage had notdeteriorated their work and/or school performance compared to 44% of the users with limited symptomsof pathological Internet use. Moreover, they found 27.3% of pathological users reported to have missedclasses or work because of online activities compared to 1.1% of those with limited symptoms. Thestudy also found 22.7% of pathological Internet users to have been in trouble with their employer orschool because of being online compared to only 1.7% of those with limited symptoms. Also, 36.2%
15
of pathological users reported cutting short on sleep to spend more time online compared to 2.8% ofthose with limited symptoms. The latter two findings correspond with Young’s [1996] in that extensiveInternet usage has a negative influence on students’ academic performance because they shorten theirsleeping time to stay online. According to the study’s statistics, students with limited symptoms reportedmore impairment on their academic performance due to Internet usage than pathological Internet users.Besides the non-deterioration of school performance of most pathological Internet users compared tothose with limited symptoms, the study does not provide information on whether it had helped themimprove. Therefore, similar to Scherer [1997] and Lubans [1999] , the authors do not establish anexplicit correlation, either positive or negative between Internet usage and academic performance.
Anderson [2001] surveyed 1,300 college students to identify the social and academic effects of In-ternet usage. After dividing the participants into either ‘high’ or ‘low’ Internet users, the author foundsimilar to Young [1996] that ‘high’ Internet users reported more negative effects from their extensiveInternet use. Some of the negatively affected aspects of students’ lives included academic work andsleeping patterns. The fact that this study requested that the participants only reported about their onlinerecreational activities, in our opinion makes the finding that ‘high’ Internet users perform worse academ-ically than others questionable. This limitation biases the previously mentioned finding because thereis no way to determine whether the authors also measured online time dedicated to academic activities.Therefore, study says nothing about whether students who use the Internet the most for academic workperform better academically than others. This suggests a gap in previous research in that despite the factthat some studies have found an association between extensive Internet usage and academic performanceimpairment [Young 1996; Kubey et al. 2001; Metzger et al. 2003; Fortson et al. 2007; Hazelhurst et al.2011], it is not possible to determine if a higher academic usage of the Internet means a better academicperformance by students.
In the aforementioned study, Kubey et al. [2001] also investigated evidence that heavier Internet us-age was associated with academic performance problems among college students. The paper-and-pencilsurvey they administered to the 572 respondents also measured whether respondents had experiencedacademic impairments by asking them to report how often, if at all, their schoolwork has been impairedbecause of the time they spend online. The study reveals that 14% of the total sample reported that theiracademic work has been negatively affected occasionally, frequently, or very frequently due to Internetuse. The results of the study also shows that 56.6% of the Internet ‘dependent’ group belong to the14% reporting academic impairment and that four times as many Internet ‘dependent’ students reportedacademic problems related to Internet usage than did the ‘non-dependent’. This finding is consistentwith Young’s [1996] in that Internet ‘dependent’ students are more likely to suffer from the influence ofextensive Internet usage than others. Moreover, 40% of the students in the academically impaired groupreported that their Internet use had affected their sleeping patterns which has led them to miss classesas mentioned by Young [1996] and Anderson [2001]. Likert items used to compare opinions betweenthe academic impaired subgroup versus their non-impaired counterparts about their Internet use revealthat academic impaired subgroup respondents were more likely to agree or strongly agree with the Likertitems which support the suggestion that there is a relationship between Internet dependency and academicimpairment. A 0.563 Pearson correlation coefficient found between Internet dependency and academicimpairment later supported this. The findings of this study are consistent with claims by Young [1996]and Anderson [2001] in that it found an association between Internet usage and academic performanceimpairment as opposed to Scherer [1997], Lubans [1999] and Morahan-Martin and Schumacher [2000]who found that the Internet had more of a positive influence on students’ lives. This study is innovativebecause unlike Young [1996] and Anderson [2001] who only found a positive correlation between Inter-net usage and academic impairment, this study further showed that ‘heavy’ Internet users are the onesmostly suffering from academic impairment due to their extensive Internet usage. Furthermore, Young[1996] and Anderson [2001] in their studies did not investigate how many of their Internet ‘heavy’ userswere suffering from academic impairment and thus failed to establish a positive link between Internetdependency and academic performance decrement.
Chou [2001] also investigated the impact of excessive Internet use among 83 selected college students
16
‘heavy’ Internet users in Taiwan as mentioned in the previous section of this literature review. As foundby Scherer [1997], Lubans [1999] and Morahan-Martin and Schumacher [2000], this study revealed thatgenerally, subjects reported the Internet as being more of a positive component of their campus lives.However, the author suggests that about half of its subjects reported that their sleeping patterns had beenimpaired due to their Internet usage and this resulted in them being late for classes or appointmentsas Young [1996] also found. However several subjects reported that their excessive Internet use hasresulted in poor grades, failure in courses which is consistent with Anderson’s [2001] and Kubey et al.’s[2001] findings. The study also highlights the story of a master’s degree candidate addicted to MUDs inhis/her junior year who decided not to take an exam due to his/her inability to stop playing MUDs on theprevious night until 6 in the morning. This finding is also consistent with Young’s [1996] finding thatInternet ‘dependent’ students are mostly into interactive online applications. The main limitation of thisstudy is its very small sample size consisting of only 83 students, which makes its results difficult to begeneralized for a larger population.
Jones [2002] evaluated the impact of Internet usage on the academic component of students’ livesby surveying 2,054 students at 27 institutions of higher learning in America. His finding that 89% ofcollege students have a positive attitude towards the Internet is consistent with what authors of earlierstudies such as Scherer [1997], Lubans [1999], Morahan-Martin and Schumacher [2000], and Chou[2001] have suggested. Moreover, the author shows that approximatively 79% of the respondents agreeor strongly agree that the Internet has had a positive impact on their collegiate academic experience asLubans [1999] revealed in his study. The study also reveals that 46% of college students prefer express-ing ideas to a professor via email rather than in class and that 68% of them report subscribing to one ormore academic-oriented mailing list that relate to their studies so that they can carry on email discus-sions about topics covered in their classes. This study however, differs from that of Lubans [1999] andScherer [1997] because they suggest that students mostly used the Internet for academic/learning pur-poses without actually having investigated students’ academic uses of the Internet. The author found thatthe academic purposes students used the Internet for were mainly to communicate with their professors,search for information and for carrying on discussions related to classes with their classmates. Besidesstating that 79% of the respondents agree or strongly agree that the Internet has had a positive impacton their collegiate academic experience, the author did not investigate how much of this positive impactwas related to academic performance increment.
In Metzger et al.’s [2003] examination of the nature of students’ Internet usage, 356 undergraduatestudents had to indicate the academic purposes for which they used the Internet as well as in what waysthey perceived the Internet to impact their school work. Respondents had to indicate the extent to whichthey felt the Internet increased the quality of their written work, the use of their time for searching forinformation and their grades amongst other factors. The study reveals similar to Young [1996], Scherer[1997], Morahan-Martin and Schumacher [2000], Anderson [2001], and Kubey et al. [2001] that studentsare heavy Internet users as it found 51% of its respondents to be using it every day. The results of theinvestigation into the academic purposes for which the students used the Internet are consistent withJones [2002] as it found 89% of its respondents to spend their school-related use of the Web to doresearch/get information, followed by emailing professors and viewing course web sites as indicated by51% and 32% of the respondents respectively. The study also revealed that accessing library informationand databases was another popular use as reported by 20% of the study’s participants. This findingsupports a similar finding by Lubans [1999] who however in his study did not mention whether students’usage of databases was to perform academic or non-academic searches. The study also reveals thatstudents felt that the Internet was moderately helpful for saving time searching for information and alsofelt it was slightly useful in improving their grades and the quality of their written work. Regarding thelatter finding, the authors’ results contradicts the findings by Lubans [1999], which revealed that 7-10thgraders reported more benefits towards their academic performance from their Internet usage than theirsenior level counterparts. This study differs from Young’s [1996] and Anderson’s [2001] in that it founda relatively neutral correlation between Internet usage and academic performance, yet similar in that itdid not investigate if academic performance decrement can be associated with extensive Internet usage
17

as done in Kubey et al.’s [2001] study.Cheung and Huang [2005] researched the benefits of the Internet for university education, the fac-
tors affecting its use, its impact on students’ learning and how to foster a positive attitude in studentstowards using the Internet by exploring the antecedents and impacts the Internet has had on universityeducation. The study made use of a questionnaire which was completed by 328 undergraduate studentsand included questions to measure factors such as students’ Internet skills, perceived usefulness of usingthe Internet and impact on general learning. The study reveals that perceived usefulness and enjoymentof the Internet correlated positively with students’ general learning and Internet usage as determined byYoung [1996]. The authors also argue that greater Internet use in university could result in better learn-ing performance as they found it was helpful to increase students’ verbal communication skills. Thisfinding contradicts findings by Young [1996], Anderson [2001] and Kubey et al. [2001] since it actuallysuggests that heavier Internet usage could improve students’ general learning and thus also improve theiracademic performance. Although this study did not investigate the influence of the Internet on students’academic performance, we believe its findings are important to this question because it brings to lightfactors that affect students’ usage of the Internet such as perceived usefulness and ease of use which havenot been studied. This shows therefore a gap in the literature in that these factors might need to be takeninto account when differentiating between students who are heavy Internet users and those who are notbecause it may be possible that light Internet users may not perceive the Internet as useful or easy to useas do the heavier users.
Suhail and Bargees [2006] investigated the effects (positive and negative) of extensive Internet useamong 350 undergraduate students at a college in Pakistan who are regular Internet users. The partici-pants were given a 28 item questionnaire that included two questions focusing on study-related problemsdue to excessive Internet use. The study reveals that in comparison with other negative subscales such asinterpersonal or physical problems among others, fewer number of students reported educational prob-lems due to Internet use. Thirty one percent of the students (31%) reported deterioration in their gradesor college performance and another 21% admitted they were missing their classes or work due to timespent online. The authors also found that 78% of the respondents reported that the Internet actuallyhelped them improving their grades, 74% reported improvement in their reading and writing skills by us-ing the Internet similar to findings by Lubans [1999]. Moreover, 48% reported becoming better studentsdue to the Internet. Since this study used respondents who were identified as regular Internet users, thelatter mentioned result contradicts findings from Young [1996], Anderson [2001], Kubey et al. [2001]who suggest that excessive Internet usage leads to academic performance impairments.
Pierce and Vaca [2008] studied whether differences in academic performance between teen usersand non-users of MySpace and other communication technologies existed. This study examined theinfluence of social networking sites and other communication technologies on teenagers’ academic per-formance. This study chose MySpace for its reputation of being the most popular social networking siteparticularly among adolescents as well as other technologies such as Instant Messaging and cell phone.Five hundred and seventeen (517) high school students participated in the study. The study formulatedresearch questions that asked students to indicate whether they had a social network site account so thatit could investigate whether differences existed in grades among students using different social network-ing services. The study revealed that 72% of its respondents have a MySpace account and 68% of themreported having an Instant Messaging account which is consistent with results obtained in other stud-ies which suggest that students are heavy users of interactive online applications [Young 1996; Scherer1997; Morahan-Martin and Schumacher 2000; Hazelhurst et al. 2011]. Results of this study show thatstudents who had a MySpace account reported lower grades than those who did not have a MySpaceaccount or those who did not even possess a social networking site account. This result is consistentwith findings from earlier studies which suggest that students who excessively use the Internet and itsapplications suffer from academic performance decrement [Young 1996; Anderson 2001; Kubey et al.2001].
The study conducted by Chen and Peng [2008] investigated the relationships between Internet useand academic performance among 49.609 university students in Taiwan. Students were asked to com-
18
plete an online questionnaire with six sections. The different sections measured: demographics, onlineexperience, interpersonal relationships, psychosocial adjustment, self-evaluation, and academic perfor-mance. The study made use of Young’s [1996] instrument to classify students whose weekly time spentonline was greater than 33.97 hours as ‘heavy’ Internet users while the rest were classified as ‘non-heavy’Internet users. The study reveals that the primary reasons students use the Internet is for making friendsor chatting, followed by the search for academic information, then playing online games and finallychecking emails. These results contradicts finding by Scherer [1997] and Lubans [1999] that studentsprimarily use the Internet for academic work. Men were found to use the Internet less for academic workthan women but rather more for recreational activities as supported by Odell et al.’s [2000] study. Thestudy further reveals that ‘heavy’ Internet users had lower grades than ‘non-heavy’ Internet users in ac-cordance with Young’s [1996] and Anderson’s [2001] who found that extensive Internet usage can havea negative impact on aspects of students’ lives such as on their academic performance. The study how-ever, made use of self-reported data like most studies reviewed in this section and therefore the potentialunreliability of the authors’ findings strengthen the need for more reliable research instrument [Young1996; Rumbough 2001; Gross 2004; Fortson et al. 2007].
As reviewed in the previous section of this document, Hazelhurst et al. [2011] investigated the as-sociation between Internet usage and academic performance among second year university students at asingle university. The study used proxy logs and bandwidth utilization to measure students’ Internet us-age and focused on those students who live on campus because their surfing behaviours could effectivelybe collected. The authors used a weighted average mark and a performance index scaling each student’smark in a course by the average of that course to measure students’ academic performance. The studyseparated the 2153 participants into ‘good’ students (those with a course weighted average mark of atleast 65%) and ‘bad’ students (those with a course weighted average mark being less than 40%). Thestudy reveals that 50.2% of the ‘good’ students fall in the bottom 40% of Internet users and 27.1% ofthem are heavy users. The authors also found that the number of passes and fails among heavy Internetusers are 70.6% and 29.4% respectively while among light users they are 83.4% and 17.6% respectively.This study shows that ‘good’ students use the Internet less than ‘bad’ students furthermore, it shows that‘light’ Internet users perform better academically than heavy Internet users as reported by Young [1996],Anderson [2001] and Kubey et al. [2001]. While this study is consistent with previous studies that foundthat extensive Internet usage causes academic performance impairments, little is shown to suggest that‘heavy’ Internet users perform worse academically than ‘light’ users. A better knowledge of the influ-ence of the Internet on students’ academic performance is required and this could probably be acquiredby investigating the Internet usage of ‘heavy’ Internet users and ‘light’ users and observe whether theiracademic performance will suffer from an extensive use of the Internet. An example would be to inves-tigate the Internet usage patterns of a particular individual over a period of time and observe how his/heracademic performance has been affected by it. Although a ‘heavy’ Internet user might perform worseacademically than a ‘light’ user overall, his/her academic performance might have been improving ordeteriorating due to his/her extensive Internet usage. This study is more innovative than the majorityof the studies we reviewed in this section in that it makes use of quantitative data to measure studentsInternet usage as suggested in studies which recommend that the interpretation of data collected withdifferent instruments could yield more reliable results since self-reported data might be affected by stu-dents suffering from a great amount of denial regarding their Internet habits [Young 1996; Rumbough2001; Gross 2004; Fortson et al. 2007].
The study conducted by Ogedebe [2010] on the relationship between academic performance andInternet services among university students reveals that 79% of its participants reported a positive influ-ence of the Internet on their academic grades such as found by Suhail and Bargees’s [2006] and Lubans’s[1999] studies. Unlike its title suggests, the study does not establish a relationship between academicperformance and Internet services but between academic performance and the Internet in general. Whilethe author identifies the reasons for which students use the Internet, the study fails to tell the readerwhether there is a link of causality between the reported reasons for which the Internet is being used andthe observed effects on academic performance. In other words, the author does not tell us if an extensive
19
usage of the Internet for academic purposes or for relationship maintenance causes a decrease or an in-crease in academic performance unlike in the sudy conducted by Hazelhurst et al. [2011]. However, byrevealing just like Jones’s [2002] study that the Internet is used more than the library for academic work,the author identifies the need to study further the role of other learning resources or facilities in helpingstudents improve their academic performance. This study stresses the need mentioned above because itreveals that lecture notes were found to best serve students’ interest in terms of improving their gradescompared to the Internet as reported respectively by 35% vs 20% of the study’s participants, yet 79% ofthem reported that the Internet has helped them enhance their academic performance.
Kirschner and Karpinski [2010] examined whether differences exist in the academic performanceof 102 undergraduate and 117 graduate college student Facebook users and nonusers. The authors de-veloped a five sections questionnaire which items measured: demographic information, academic infor-mation, computer and Internet use, hours of Facebook use, perceptions of the impact of Facebook ontheir own academic achievement. The results revealed that Facebook users (141 out of the total sample)reported a lower mean GPA than non-users (M=3.06 and M = 3.82 respectively). Also, Facebook usersreported studying fewer hours per week on average than non-users (M =1.47 and M= 2.76 respectively).The authors also found that Facebook use and GPA and hours spent studying were not dependent onwhether a students is an undergraduate or a graduate. 90.8% of the Facebook users claimed to use theInternet for academically related purposes. 73.8% of the Facebook users claimed that Facebook doesnot exert any influence on their GPA while the remainder reported perceiving some kind of influenceeither positive or negative. The study further reveals that of those who reported an impact of Facebookon their academic performance, 74.3% of them reported a negative impact while 25.7% reported a pos-itive impact. This study confirms findings by Scherer [1997] and Lubans [1999] that academic work isthe reason for which students use the Internet. Furthermore, the study supports the arguments that theInternet can play a negative impact on academic performance if used mainly for recreational activities asrevealed in Pierce and Vaca’s [2008] study which focused on MySpace, which is another popular Internetapplication like Facebook.
2.6 Conclusion
Although the Internet is a major component of people’s lives due to the support it provides in the waypeople communicate, perform business transactions and conduct research; it has also become a cause ofconcern as its overuse influences the way people live [Young 1996; Kandell 1998]. Students in particular,are more avid users of the Internet and its technologies than the general population. The introduction ofthe Internet to campus was mainly envisaged for enhancing students’ collegiate experience. However,students are easily exposed to the problems an excessive usage of the Internet brings as Kandell [1998]suggested. In the first section, we reviewed studies that supported the hypothesis that the Internet shouldbe seen as a cause of concern for students because of some of its applications which are addictive-like.Young [1996] found that some Internet applications were addictive and as such many students wereheavy users of such online services as later found by Kubey et al. [2001]. Young’s [1996] study showsthat students who were identified as being very heavy users of online services developed symptoms of de-pendency to the Internet similar to individuals who are addicted to drugs and as the latter, the former werefound to have some aspects of their lives becoming negatively affected because of heavy Internet usage.Some of those affected aspects, included academic performance, relationships maintenance, physical andmental health among others. Young’s [1996] study was at the basis of further research in this field andas such, future studies either supported or contested these findings due to the different methodologiesthe later studies used sometimes or the unreliability of the findings which made the results difficult tobe generalized. However, most studies have confirmed the existence of Internet dependency symptomsamong the general population, particularly students. This prompts a need to further investigate the extentof the problems associated with extensive Internet usage.
As the third section reviewed studies which confirmed the existence of Internet dependency amonguniversity students, it was important then to review studies which investigated whether students were
20

using the Internet for the main purpose it was intended for on campus, as a tool to support their educationor whether they were misusing it. On these aspects, the reviewed studies are not unanimous. Some earlystudies supported findings by Scherer [1997] and Lubans [1999] that students mostly used the Internet foracademic purposes while others found that the Internet was not being used by students as an educationaltool but mostly as an entertainment tool [Rumbough 2001; Hazelhurst et al. 2011]. The fact that studiesdiffer in their findings regarding what students use the Internet for reveals an urgent need for researchersto agree on standard instruments to measure Internet usage by students [Rumbough 2001; Gross 2004;Fortson et al. 2007].
After finding that students were subjected to Internet dependency and later on reviewing what theyuse the Internet for, there was a need to focus on the effects of their dependency to the Internet on theiracademic life. Since the Internet was mainly brought to campus to help students in their learning, it wasnecessary to review studies that investigated whether the Internet was fulfilling its intended purposes byasking students to report if they felt their usage of the Internet was influencing their academic perfor-mance anyhow. On this aspect, studies diverged again in their findings as Lubans [1999] and Chou [2001]among others suggested that students reported academic performance increment while other studies sug-gested otherwise [Young 1996; Anderson 2001; Kubey et al. 2001]. The difference in results amongthese studies may have been affected by the unreliability of self-reported data collected from studentsbecause what students report might be different from what they do as reported in Johnson’s [2009] study,or because heavy Internet users may suffer from a great amount of denial as stated by Young [1996]and may thus report themselves as light Internet users. By using quantitative data collection methods,Hazelhurst et al. [2011] exposed the unreliability of results from previous studies conducted in this fieldbecause most of them over-relied on self-reported data whose validity was never tested. Therefore, webelieve a combination of quantitative and qualitative data analyses could allow for triangulation of resultsand for identification of inconsistencies generated by both methodologies in order to get more reliablefindings.
21
Chapter 3
RESEARCH HYPOTHESIS
3.1 Introduction
Following the belief that any healthy consumable or service becomes noxious when it is misused oroverused, we believe that Internet usage may become harmful to students if they extensively use it.Since the Internet was brought to campus as an educational tool to support students in their learning,it is expected that an effective usage of it should just serve this purpose. The Internet being identifiedas a supporting tool needs therefore to be assessed against the purpose it was introduced for. How dopeople use it? For what purposes do people use it? What differences has it made since being introduced?Has its introduction come at some costs? If so, what are they and what are the extents of the problemsidentified? These are just a few questions that one could seek answers to when looking at whether theInternet is fulfilling its role on campus. As we have seen in our literature review, the Internet has for overfifteen years now been identified as a potential cause of concern for students. Although its importance isincontestable for people’s daily living, researchers are not unanimous on the influence it has on its users,especially on students.
3.2 Research Hypothesis
The particular diversity of findings on the influence of the Internet on students’ academic performancereviewed in the literature review chapter of this document shows an urgent need to study in enough detailthe following hypothesis:
There is a positive correlation between excessive Internet usage and poor academic perfor-mance among students.
Excessive Internet users will be those students who will be identified as heavy Internet users by boththe qualitative and the quantitative study.
To study whether there are enough evidence to support or refute the previously mentioned hypothesis,one needs to be mindful of the bias observed in the instruments previous studies have used as mentionedin the literature review chapter. This bias was mainly caused by the fact that previous studies’ resultshave not taken into account students’ denial of their real Internet surfing behaviours by relying only onwhat they self-reported. We therefore deemed important to pose the following research questions whichanswers should provide more reliable evidence:
1. Do students who use the Internet excessively perform badly?
2. Do students who perform badly use the Internet excessively?
In the literature review chapter of this document, we saw how findings from previous studies wereprone to the unreliability of students’ self-reporting of their Internet usage habits. The first researchquestion will be using the same research instrument as those studies and therefore its findings will un-doubtedly suffer from the same unreliability. This is why in our opinion by coupling findings from the
22
second and the first research questions, we will actually address the issue of students denial of theirInternet usage habits by checking whether what students have reported for question 1 is what is beingobserved in the analysis of answers to question 2.
3.3 Conclusion
The motivation to this study is that previous studies have made use of self-reported data and its unre-liability weakens the conclusions that such studies have drawn. We made use of quantitative data toinvestigate the potential existence of an association between high Internet usage and academic perfor-mance decrease among university students. The data collected for the quantitative study was triangulatedwith the participating students’ self-reported data so as to show evidence of students being in denial abouttheir Internet usage and its effects on their academic performance.
After formulating above the two research questions which answers helped us refute the hypothesis ofa positive association between extensive Internet usage and poor academic performance, the next chaptergives an overview of the methodologies we used to collect the data that we used to answer our tworesearch questions. This chapter highlights the two studies we conducted, the procedures we employedto select the participants to these studies, the variables we used to answer our research questions and howthese variabes were measured.
23

Chapter 4
RESEARCH METHODOLOGY
4.1 Introduction
In the previous chapter of this document, we posed two research questions that helped us find evidenceof a potential mutual association between Internet usage and academic performance among universitystudents. As further explained in this chapter, we adopted a mixed research methods to prevent the un-reliability of the intended research outcomes due to students’ denial of their Internet surfing behaviours.The first study we conducted is a qualitative study that used an 11 item questionnaire that we distributedto 389 3rd year students that helped us measure how much time students spend online while on campus,what are the reasons they use the Internet for and how do they perceive the Internet has influenced theiracademic performance. The subsequent quantitative study made use of 359 of the initial pool we sur-veyed and it used Squid Proxy logs data to measure the same concepts as the qualitative study althoughwe also had to collect the courses final grade of these participants from the university as well. Each studyis further explained below.
4.2 Qualitative Design
The first study we conducted was a qualitative study that made use of a questionnaire (see Appendix C)we developed and handed out to 389 3rd year students to measure the concepts highlighted in the tablebelow in order for us to answer the research questions we posed in the Research Hypothesis chapter ofthis document.
Concept Variable Measurement MethodTime students spend online Internet Usage Ask students how much time they
spend online in hours per dayPurposes students use the Internet for Educational vs.
Non-educationalInternet usage
Ask students to indicate the rea-sons they use the Internet for i.e.:academic work, relationship mainte-nance, and professional work, others. . .
Academic Performance self-evaluation
Academic Perfor-mance
Ask students to report whether theythink the Internet has influenced(negatively/positively) their semestergrades over the past 2 years
Anderson [2001] identified seven criteria that are used to determine substance dependence based onthe Diagnostic and Statistical Manual of Mental Disorders, Fourth Edition (DSM IV). They are:
• Tolerance
24
• Withdrawal
• Using larger amounts or over a longer period than was intended
• A desire for or unsuccessful efforts to cut down or control the substance use
• A great deal of time spent in obtaining, using, or recovering from the substance
• Social, occupational, or recreational activities are reduced because of substance use
• Substance use continues in spite of negative effects
As we mentioned earlier in the literature review chapter of this document, previous studies haveinvestigated and confirmed the existence of Internet dependency among students. Although no actualsubstances are involved in Internet use as Anderson [2001] mentioned in his studies, excessive Internetuse is similar in behaviour to the concept of dependence. Similar to the above-mentioned study, a di-agnosis of dependence in ours will be based on the presence of three or more symptoms. We thereforeformulated statements in our survey that are related to the dependence criteria we have cited earlier.These statements are included in our survey and range from item 5 to item 11. The respondents who willagree with more than three of these statements will be classified as ‘heavy’ Internet users. We say thatwe will classify such students as ‘heavy’ Internet users instead of Internet ‘dependent’ users as wouldbe expected because most studies we have reviewed in our literature review have been consistent in sup-porting the hypothesis that Internet ‘dependent’ users were ‘heavy’ Internet users. This is why we willjust label ‘dependent’ users as ‘heavy’ Internet users for the purpose of our study.
This instrument was administered as a paper-and-pencil survey to 389 3rd year students registered fordifferent university courses. We presumed that it would be safer for us to administer this survey during aclass due to the high probability of having the surveys returned immediately once completed as opposedto conducting the surveys online, via emails, or interviews. Prior arrangements were made with thelecturers of the selected courses before we administered the questionnaire. We chose 3rd year studentsfrom different academic disciplines because we also investigated the probability of Internet usage habitsbeing dependent on the discipline of study. Moreover, 3rd year students would already have spent atleast two years at the university where we conducted this study and therefore their last four semestersproxy records would be available for the quantitative section of our study. Based on their answers, weclassified the participants as either ‘heavy’ or ‘light’ Internet users.
Since we did not want to identify students who are willing to participate due to ethical requirementsthat ask for anonymity upon return of completed questionnaires, the following steps illustrate how theoverall survey answering process was conducted:
• Distribute questionnaire to the whole class and ask students to turn the questionnaire over whethercompleted or not so that on collection none of them is visually identified as a participant.
• A random number was included on the questionnaire students had to fill along with their studentnumber on a separate sheet so that students’ responses could not be recorded with their studentnumber on the same document as required for participants’ anonymity.
25
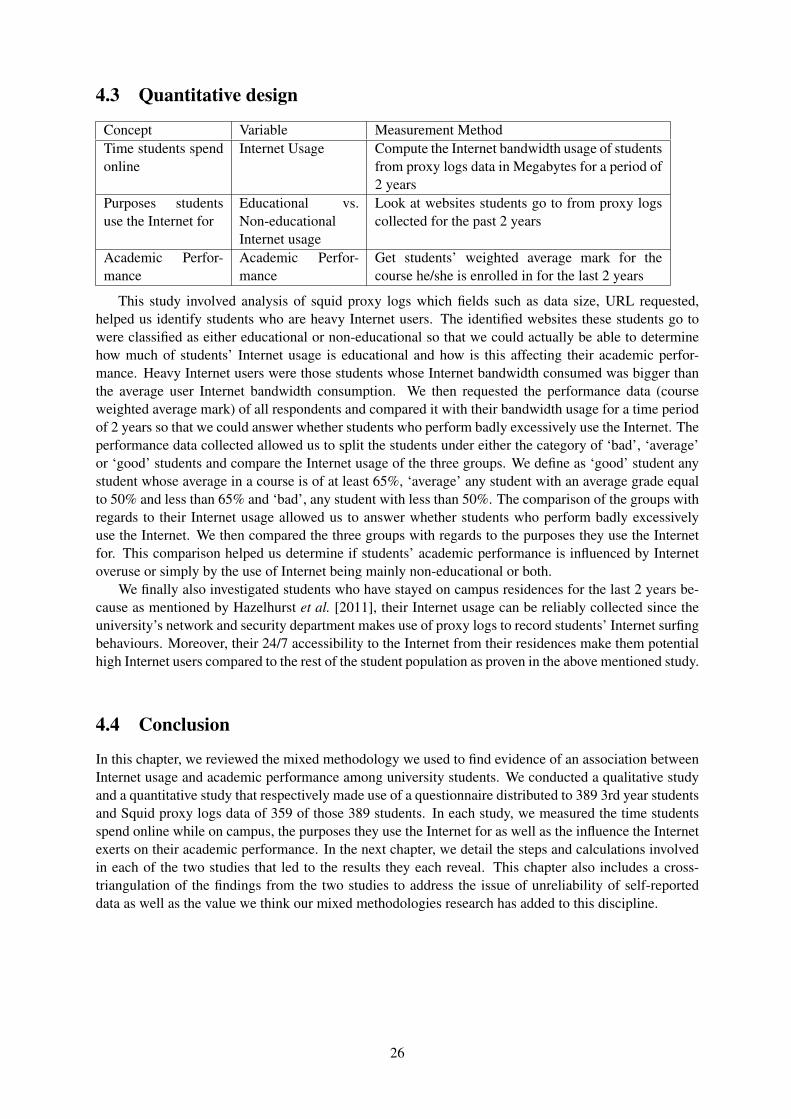
4.3 Quantitative design
Concept Variable Measurement MethodTime students spendonline
Internet Usage Compute the Internet bandwidth usage of studentsfrom proxy logs data in Megabytes for a period of2 years
Purposes studentsuse the Internet for
Educational vs.Non-educationalInternet usage
Look at websites students go to from proxy logscollected for the past 2 years
Academic Perfor-mance
Academic Perfor-mance
Get students’ weighted average mark for thecourse he/she is enrolled in for the last 2 years
This study involved analysis of squid proxy logs which fields such as data size, URL requested,helped us identify students who are heavy Internet users. The identified websites these students go towere classified as either educational or non-educational so that we could actually be able to determinehow much of students’ Internet usage is educational and how is this affecting their academic perfor-mance. Heavy Internet users were those students whose Internet bandwidth consumed was bigger thanthe average user Internet bandwidth consumption. We then requested the performance data (courseweighted average mark) of all respondents and compared it with their bandwidth usage for a time periodof 2 years so that we could answer whether students who perform badly excessively use the Internet. Theperformance data collected allowed us to split the students under either the category of ‘bad’, ‘average’or ‘good’ students and compare the Internet usage of the three groups. We define as ‘good’ student anystudent whose average in a course is of at least 65%, ‘average’ any student with an average grade equalto 50% and less than 65% and ‘bad’, any student with less than 50%. The comparison of the groups withregards to their Internet usage allowed us to answer whether students who perform badly excessivelyuse the Internet. We then compared the three groups with regards to the purposes they use the Internetfor. This comparison helped us determine if students’ academic performance is influenced by Internetoveruse or simply by the use of Internet being mainly non-educational or both.
We finally also investigated students who have stayed on campus residences for the last 2 years be-cause as mentioned by Hazelhurst et al. [2011], their Internet usage can be reliably collected since theuniversity’s network and security department makes use of proxy logs to record students’ Internet surfingbehaviours. Moreover, their 24/7 accessibility to the Internet from their residences make them potentialhigh Internet users compared to the rest of the student population as proven in the above mentioned study.
4.4 Conclusion
In this chapter, we reviewed the mixed methodology we used to find evidence of an association betweenInternet usage and academic performance among university students. We conducted a qualitative studyand a quantitative study that respectively made use of a questionnaire distributed to 389 3rd year studentsand Squid proxy logs data of 359 of those 389 students. In each study, we measured the time studentsspend online while on campus, the purposes they use the Internet for as well as the influence the Internetexerts on their academic performance. In the next chapter, we detail the steps and calculations involvedin each of the two studies that led to the results they each reveal. This chapter also includes a cross-triangulation of the findings from the two studies to address the issue of unreliability of self-reporteddata as well as the value we think our mixed methodologies research has added to this discipline.
26

Chapter 5
TRIANGULATION RESEARCHDESIGN:CONVERGENCE MODEL
We highlighted in the literature review chapter of this document that previous findings on the topic ofInternet usage and academic performance suffered from the unreliability of students’ self-reports abouttheir Internet usage due to their possible state of denial when it came to reporting their Internet usagehabits and the impact they have on their academic grades. We then argued that it was therefore importantto address this unreliability by comparing what students self-reported with hard data collected on thesame issue by the academic institution where students are enrolled, in our case, Squid Proxy logs datakept by Wits University.
We decided to use the Triangulation Convergence Model Research Design (see Appendix D) in ourstudy to best highlight students’ denial about their Internet usage and subsequently the unreliability ofself-reported data because this model allows for the cross-triangulation of results gathered from differ-ent methodologies. This was achieved by comparing and contrasting the results gathered in both thequalitative and quantitative studies since they used different methodologies to answer the same researchquestions, notably:
1. Do students who use the Internet excessively perform badly?
2. Do students who perform badly use the Internet excessively?
The studies that followed tried each to answer both questions and the results they found were cross-triangulated in the final section of this chapter. Please go to Appendix D to view a diagram that illustratethe Triangulation Convergence Model.
5.1 Qualitative study
5.1.1 Introduction
In this section, we cover the first fold of our mixed methods research that involves the conduct of aqualitative study whose aim was to identify evidence of a potential correlation between extensive Internetusage on campus and degrading academic performance among 3rd year students at Wits university. Thisis based on students’ self reported-data about their Internet usage habits on campus. We therefore startthis section with a review of the methodology we used to conduct this study, followed by the data analysisand results interpretation section of the data we collected and we finish with a discussion of this study’sfindings in comparison with findings from the literatures we reviewed in this field. Since this study isbased on participants’ self-reports, we respectively rephrased the research questions we asked earlier:
1. Were students who reported a negative influence of the Internet on their academic grades identifiedas ‘heavy’ Internet users?
27

2. Did students who were found to be ‘heavy’ Internet users on campus report a negative influence ofthe Internet on their grades?
5.1.2 The Methodology
The Sample
Our sample population consists of 389 full-time 3rd year students at Wits University. Those studentswere coming from the following fields: Public International Law, Engineering Economics, Architectureand Networks, Igneous Petrology, French Studies, Remote Sensing, Physics, Microbiology, Formal Lan-guages (Computer Science), Political Studies, and Management and Cost Accounting. We decided touse 3rd year students because our study requires students to report about their Internet usage habits oncampus for the last 2 years, therefore 3rd year students unlike other year levels’ students were more likelyto have been studying at this institution during the last 2 years. We also deemed necessary to survey stu-dents from different academic disciplines because we would like to investigate the probability of Internetusage patterns varying across academic disciplines. We also requested students to indicate whether theywere staying in university residences or not during the relevant time frame because since they had moreaccess to the Internet than their counterparts on campus, the effects on their academic performance couldbe more reliable. Moreover, it is important to note that our sample consists of students from various de-mographics and socio-economic backgrounds. Our main participating criteria was that our participantswere 3rd year students at the time the questionnaire was being administered because we did not thinkthat the mentioned factors would influence a student’s Internet usage habits on campus. After ethicalclearance was granted by the University Research Ethics Committee (Non-Medical), we contacted ran-domly selected 3rd year lecturers upon being granted permission by their respective Head of school towhom a copy of the obtained ethical clearance certificate was emailed. The mentioned courses are theones whose lecturers accepted to collaborate, the distribution of students per course appears in the tablebelow:
Course Number of studentsArchitecture and Networks 20Engineering Economics 37Formal Languages 29Igneous Petrology 29Management and Cost Accounting 84Microbiology 29Physics 14Political Studies 42Public International Law 42Remote Sensing 59French Studies 3 4
Table 5.1: Distribution of students per course
Total Number of students Number of students in Residence Number of students not in residence389 108 281
Table 5.2: Distribution of students per living arrangements
The Research Questionnaire
Internet addiction as reviewed in the literature review chapter of this document is a construct for whichresearchers’ opinions are divergent mainly because, as most of them have acknowledged, self-reported
28
data are unreliable. The questionnaire used in this study was a nonstandardized tool we developed basedon research related to Internet addiciton by students. Although no substances are involved in Internet useas Anderson [2001] mentioned in his study, excessive Internet use is similar in behaviour to the conceptof dependence. We therefore developed our questionnaire items from the seven criteria identified inAnderson’s [2001] study that are based on the Diagnostic and Statistical Manual of Mental Disorders,Fourth Edition (DSM IV) used to determine substance dependence. They range from item 5 to item 11of our questionnaire and are:
• Tolerance
• Withdrawal
• Using larger amounts or over a longer period than was intended
• A desire for or unsuccessful efforts to cut down or control the substance use
• A great deal of time spent in obtaining, using, or recovering from the substance
• Social, occupational, or recreational activities are reduced because of substance use
• Substance use continues in spite of negative effects
We developed a paper-and-pencil questionnaire (Appendix C) consisting of 11 items that mainlyrequired participants to report about their daily Internet usage, to rank the reasons for which they usedthe Internet by descending order of daily usage, and their perceptions of social and academic changesresulting from their Internet usage. The main reasons we asked students to report about ranged from:academic work, recreational activities, relationship development and maintenance and others. Theirresponses to item 5 to item 11 of the questionnaire by either ‘Yes’ or ‘No’ allowed us to measure theeffects of their Internet usage on the aspects of their lives we mentioned earlier. Students had to reportabout their Internet usage on campus because the university records it into Squid proxy log files (whichwe used in the quantitative part of our research) for each student on a daily basis and we would latercompare their reports and the university recordings in the cross-triangulation findings section of ourresearch.
Variables measured
The following variables were measured by different items on the research questionnaire we mentionedabove:
Internet Usage. To measure this variable, the questionnaire asked students to report on how much timethey spend online on campus in hours per day.
Educational vs. Non-Educational Internet usage. This variable helped us determine the purpose stu-dents use the Internet for on campus. From their responses to the relevant item on the questionnaire, wewere able to identify whether this usage was for an educational or for a non-educational purpose. Thepie chart appearing in Figure 1.5 depicts this difference.
Academic Performance. One item of the questionnaire helped us measure students’ perception of theinfluence the Internet has had on their academic performance over the past 2 years by asking them toreport whether they think the Internet has influenced their grades either positively or negatively for thementioned period.
29
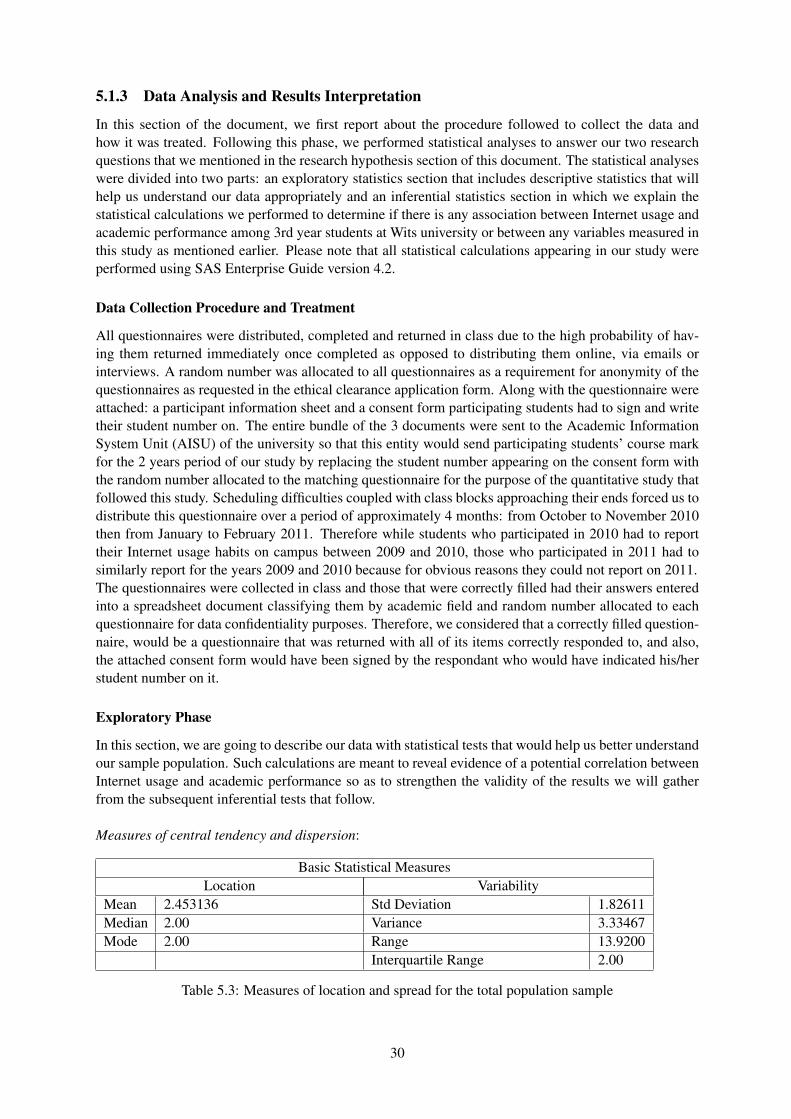
5.1.3 Data Analysis and Results Interpretation
In this section of the document, we first report about the procedure followed to collect the data andhow it was treated. Following this phase, we performed statistical analyses to answer our two researchquestions that we mentioned in the research hypothesis section of this document. The statistical analyseswere divided into two parts: an exploratory statistics section that includes descriptive statistics that willhelp us understand our data appropriately and an inferential statistics section in which we explain thestatistical calculations we performed to determine if there is any association between Internet usage andacademic performance among 3rd year students at Wits university or between any variables measured inthis study as mentioned earlier. Please note that all statistical calculations appearing in our study wereperformed using SAS Enterprise Guide version 4.2.
Data Collection Procedure and Treatment
All questionnaires were distributed, completed and returned in class due to the high probability of hav-ing them returned immediately once completed as opposed to distributing them online, via emails orinterviews. A random number was allocated to all questionnaires as a requirement for anonymity of thequestionnaires as requested in the ethical clearance application form. Along with the questionnaire wereattached: a participant information sheet and a consent form participating students had to sign and writetheir student number on. The entire bundle of the 3 documents were sent to the Academic InformationSystem Unit (AISU) of the university so that this entity would send participating students’ course markfor the 2 years period of our study by replacing the student number appearing on the consent form withthe random number allocated to the matching questionnaire for the purpose of the quantitative study thatfollowed this study. Scheduling difficulties coupled with class blocks approaching their ends forced us todistribute this questionnaire over a period of approximately 4 months: from October to November 2010then from January to February 2011. Therefore while students who participated in 2010 had to reporttheir Internet usage habits on campus between 2009 and 2010, those who participated in 2011 had tosimilarly report for the years 2009 and 2010 because for obvious reasons they could not report on 2011.The questionnaires were collected in class and those that were correctly filled had their answers enteredinto a spreadsheet document classifying them by academic field and random number allocated to eachquestionnaire for data confidentiality purposes. Therefore, we considered that a correctly filled question-naire, would be a questionnaire that was returned with all of its items correctly responded to, and also,the attached consent form would have been signed by the respondant who would have indicated his/herstudent number on it.
Exploratory Phase
In this section, we are going to describe our data with statistical tests that would help us better understandour sample population. Such calculations are meant to reveal evidence of a potential correlation betweenInternet usage and academic performance so as to strengthen the validity of the results we will gatherfrom the subsequent inferential tests that follow.
Measures of central tendency and dispersion:
Basic Statistical MeasuresLocation Variability
Mean 2.453136 Std Deviation 1.82611Median 2.00 Variance 3.33467Mode 2.00 Range 13.9200
Interquartile Range 2.00
Table 5.3: Measures of location and spread for the total population sample
30

According to Table 5.3, our sample has an arithmetic mean Internet usage of about 2.45 hours/day,which is relatively low considering that Wits university provides its students with 24/7 campus wideInternet coverage. However, this is understandable when we consider that across all year levels, classesstart at 8 AM until 4PM from Monday to Friday and in between students will have breaks accumulatingto a rough average of 2 hours, which is why a mean of about 2.45 hours is justifiable. Table 5.3 alsoreveals that our sample population is roughly normally distributed because the mean, the median and themode are almost equal. If we were to round them off, we would see that all three statistics are equal to 2.Moreover, the small value of the standard deviation allows us to say that most values of Internet usagefor our sample are clustered around the mean which will give our distribution a bell shape.
Distribution of our sample:
Figure 5.1: Histogram representing Internet usage for the entire sample population
Figure 5.1 confirms as cited in Table 5.3 that students are light Internet users on campus. Indeed,Figure 5.1 confirms that students use the Internet for an average of 2 hours daily on campus as the graphdepicts this value as the most frequent reported value for students’ daily Internet usage. This graph alsoconfirms that the population is roughly normally distributed as we can see the values for Internet usageare following a bell-shape figure. Please note that one bar represents each unique value for the Internetusage variable and therefore, the gap in between bars does not hide reported values unaccounted for bythe diagram.
Figure 5.2: Box and Whiskers plot of our sample population
31
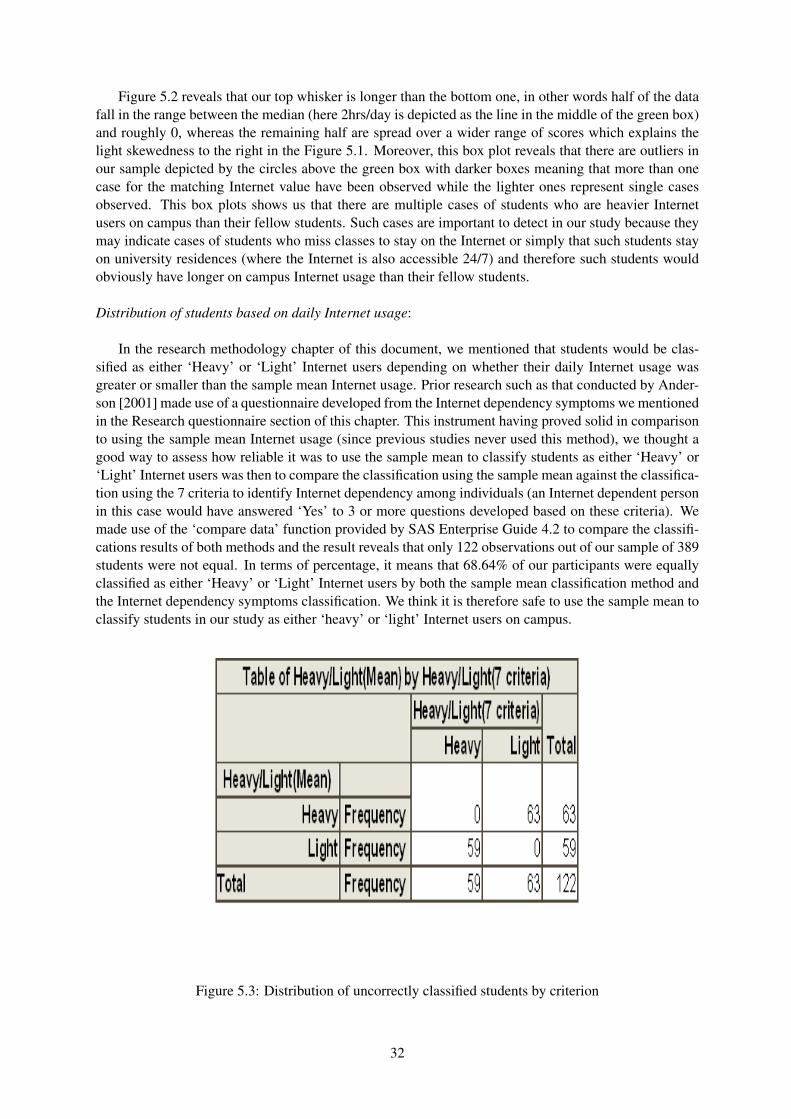
Figure 5.2 reveals that our top whisker is longer than the bottom one, in other words half of the datafall in the range between the median (here 2hrs/day is depicted as the line in the middle of the green box)and roughly 0, whereas the remaining half are spread over a wider range of scores which explains thelight skewedness to the right in the Figure 5.1. Moreover, this box plot reveals that there are outliers inour sample depicted by the circles above the green box with darker boxes meaning that more than onecase for the matching Internet value have been observed while the lighter ones represent single casesobserved. This box plots shows us that there are multiple cases of students who are heavier Internetusers on campus than their fellow students. Such cases are important to detect in our study because theymay indicate cases of students who miss classes to stay on the Internet or simply that such students stayon university residences (where the Internet is also accessible 24/7) and therefore such students wouldobviously have longer on campus Internet usage than their fellow students.
Distribution of students based on daily Internet usage:
In the research methodology chapter of this document, we mentioned that students would be clas-sified as either ‘Heavy’ or ‘Light’ Internet users depending on whether their daily Internet usage wasgreater or smaller than the sample mean Internet usage. Prior research such as that conducted by Ander-son [2001] made use of a questionnaire developed from the Internet dependency symptoms we mentionedin the Research questionnaire section of this chapter. This instrument having proved solid in comparisonto using the sample mean Internet usage (since previous studies never used this method), we thought agood way to assess how reliable it was to use the sample mean to classify students as either ‘Heavy’ or‘Light’ Internet users was then to compare the classification using the sample mean against the classifica-tion using the 7 criteria to identify Internet dependency among individuals (an Internet dependent personin this case would have answered ‘Yes’ to 3 or more questions developed based on these criteria). Wemade use of the ‘compare data’ function provided by SAS Enterprise Guide 4.2 to compare the classifi-cations results of both methods and the result reveals that only 122 observations out of our sample of 389students were not equal. In terms of percentage, it means that 68.64% of our participants were equallyclassified as either ‘Heavy’ or ‘Light’ Internet users by both the sample mean classification method andthe Internet dependency symptoms classification. We think it is therefore safe to use the sample mean toclassify students in our study as either ‘heavy’ or ‘light’ Internet users on campus.
Figure 5.3: Distribution of uncorrectly classified students by criterion
32
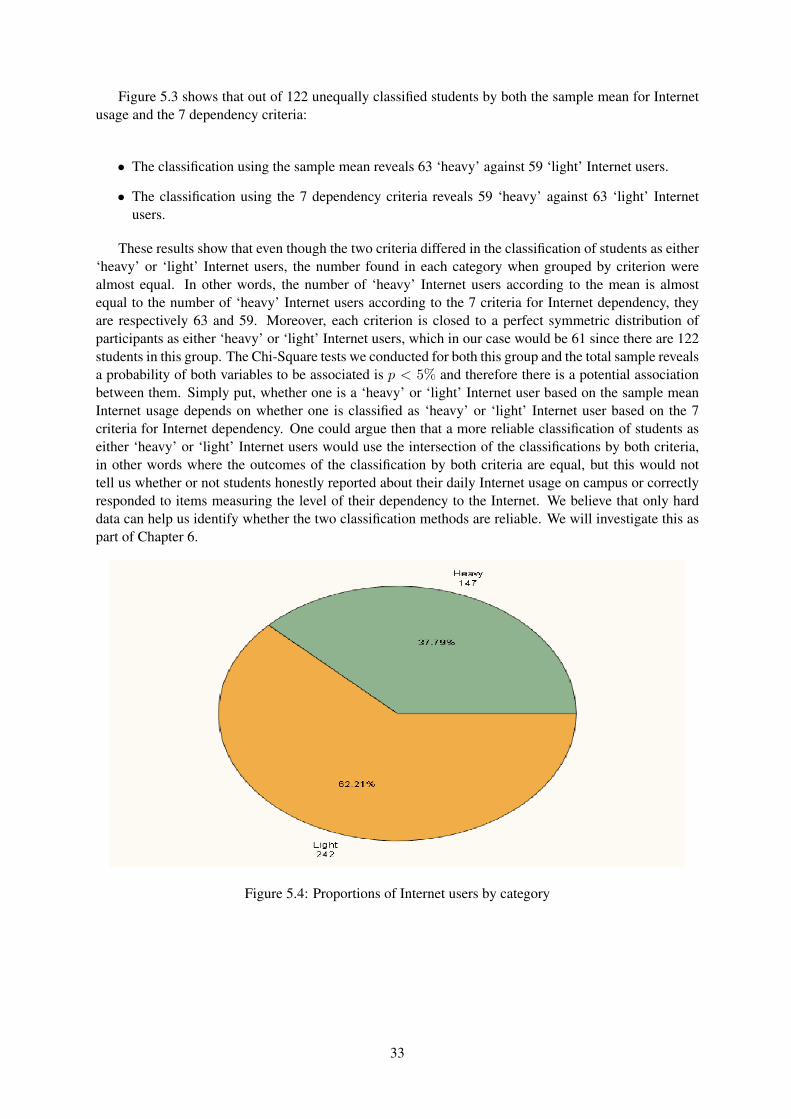
Figure 5.3 shows that out of 122 unequally classified students by both the sample mean for Internetusage and the 7 dependency criteria:
• The classification using the sample mean reveals 63 ‘heavy’ against 59 ‘light’ Internet users.
• The classification using the 7 dependency criteria reveals 59 ‘heavy’ against 63 ‘light’ Internetusers.
These results show that even though the two criteria differed in the classification of students as either‘heavy’ or ‘light’ Internet users, the number found in each category when grouped by criterion werealmost equal. In other words, the number of ‘heavy’ Internet users according to the mean is almostequal to the number of ‘heavy’ Internet users according to the 7 criteria for Internet dependency, theyare respectively 63 and 59. Moreover, each criterion is closed to a perfect symmetric distribution ofparticipants as either ‘heavy’ or ‘light’ Internet users, which in our case would be 61 since there are 122students in this group. The Chi-Square tests we conducted for both this group and the total sample revealsa probability of both variables to be associated is p < 5% and therefore there is a potential associationbetween them. Simply put, whether one is a ‘heavy’ or ‘light’ Internet user based on the sample meanInternet usage depends on whether one is classified as ‘heavy’ or ‘light’ Internet user based on the 7criteria for Internet dependency. One could argue then that a more reliable classification of students aseither ‘heavy’ or ‘light’ Internet users would use the intersection of the classifications by both criteria,in other words where the outcomes of the classification by both criteria are equal, but this would nottell us whether or not students honestly reported about their daily Internet usage on campus or correctlyresponded to items measuring the level of their dependency to the Internet. We believe that only harddata can help us identify whether the two classification methods are reliable. We will investigate this aspart of Chapter 6.
Figure 5.4: Proportions of Internet users by category
33
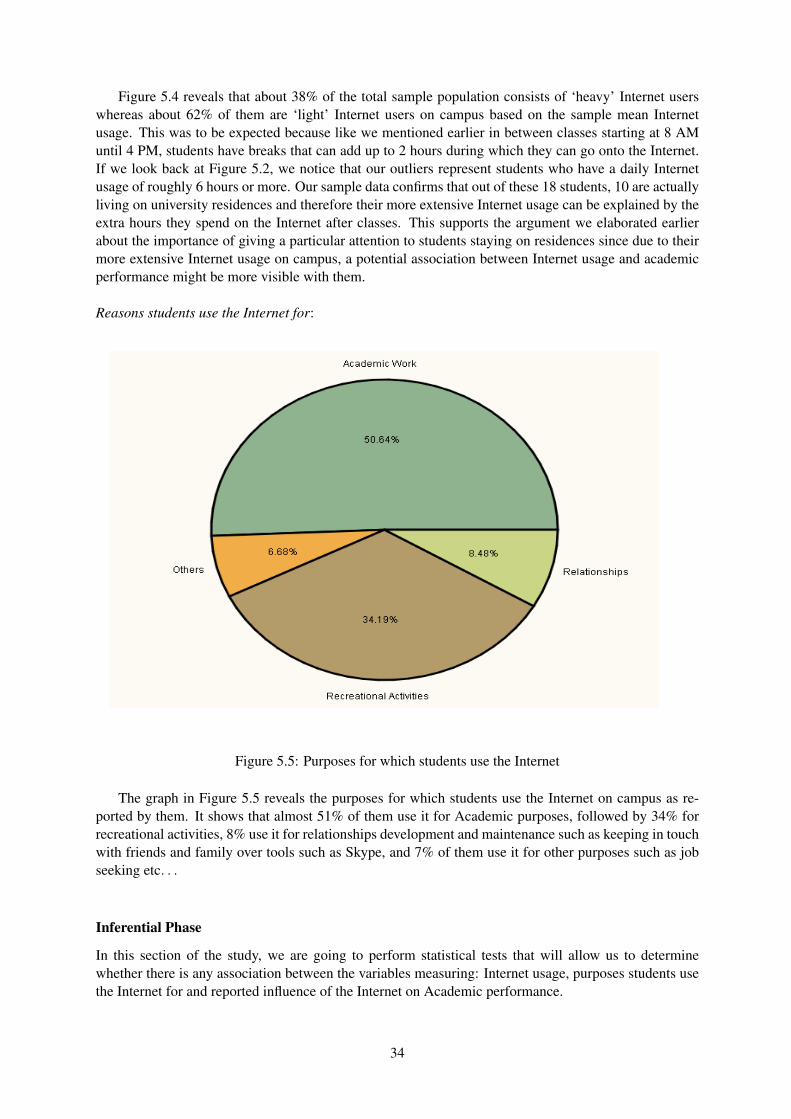
Figure 5.4 reveals that about 38% of the total sample population consists of ‘heavy’ Internet userswhereas about 62% of them are ‘light’ Internet users on campus based on the sample mean Internetusage. This was to be expected because like we mentioned earlier in between classes starting at 8 AMuntil 4 PM, students have breaks that can add up to 2 hours during which they can go onto the Internet.If we look back at Figure 5.2, we notice that our outliers represent students who have a daily Internetusage of roughly 6 hours or more. Our sample data confirms that out of these 18 students, 10 are actuallyliving on university residences and therefore their more extensive Internet usage can be explained by theextra hours they spend on the Internet after classes. This supports the argument we elaborated earlierabout the importance of giving a particular attention to students staying on residences since due to theirmore extensive Internet usage on campus, a potential association between Internet usage and academicperformance might be more visible with them.
Reasons students use the Internet for:
Figure 5.5: Purposes for which students use the Internet
The graph in Figure 5.5 reveals the purposes for which students use the Internet on campus as re-ported by them. It shows that almost 51% of them use it for Academic purposes, followed by 34% forrecreational activities, 8% use it for relationships development and maintenance such as keeping in touchwith friends and family over tools such as Skype, and 7% of them use it for other purposes such as jobseeking etc. . .
Inferential Phase
In this section of the study, we are going to perform statistical tests that will allow us to determinewhether there is any association between the variables measuring: Internet usage, purposes students usethe Internet for and reported influence of the Internet on Academic performance.
34

As previously discussed in this chapter, the sample mean was a strong determinator in classifying stu-dents as either ‘heavy’ or ‘light’ Internet users. In the tests that follow, we have decided to use Chi-Squaretests because they are best at showing whether there is a relationship between categorical variables. Themeasurement of daily Internet usage allowed us to have a type of user category with ‘heavy’ and ‘light’as sub-categories, the purpose for which students use the Internet was divided into four (4) different cat-egories: Academic work, Relationships development and maintenance, recreational activities and others.All four categories were explained earlier in this document. Finally, the variable measuring reported in-fluence of the Internet on academic performance was divided into three (3) categories: positive, negativeand neutral. The results appear in Figure 5.6:
Figure 5.6: Chi-Square test results for association between type of Internet user and Academic Influence
Figure 5.6 reveals (in the top table) that out of 147 ‘heavy’ Internet users: 20 reported a negativeinfluence of the Internet on their academic grades, 15 had a neutral opinion on the matter and 112 reporteda positive influence of the Internet on their grades. On the other hand, out of 242 ‘light’ Internet users: 18reported a negative influence of the Internet on their academic grades, 25 had a neutral opinon and 199reported a positive influence of the Internet on their grades. Overall, ‘light’ Internet users reported a morepositive influence of the Internet compared to ‘heavy’ Internet users, their proportions were respectively82.23% and 76.19%. The table in Figure 5.6 also reveals that 13.61% of ‘heavy’ Internet users comparedto only 7.44% of the ‘light’ Internet users reported a negative influence of the Internet on their academicgrades. Furthermore, of those who reported a negative influence of the Internet on their grades, 52.63%were found to be ‘heavy’ Internet users while 47.47% were found to be ‘light’ Internet users.
Although one would be quick to conclude based on our early cited results that heavier Internet
35
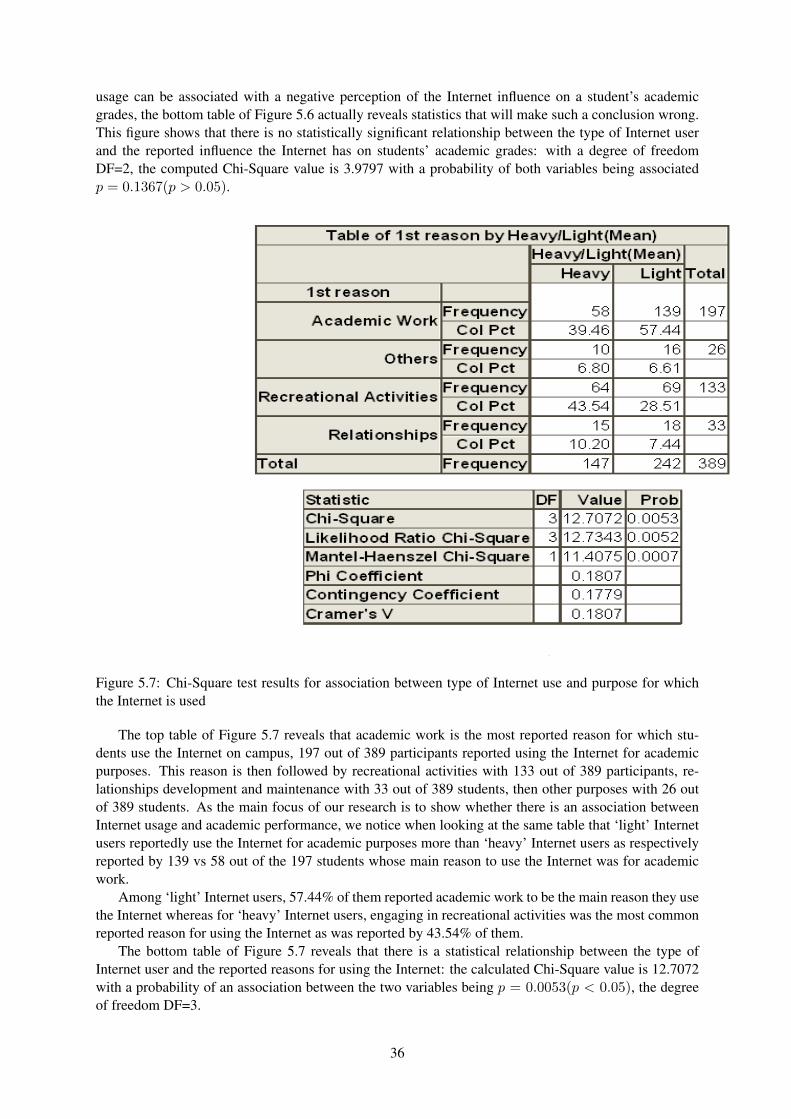
usage can be associated with a negative perception of the Internet influence on a student’s academicgrades, the bottom table of Figure 5.6 actually reveals statistics that will make such a conclusion wrong.This figure shows that there is no statistically significant relationship between the type of Internet userand the reported influence the Internet has on students’ academic grades: with a degree of freedomDF=2, the computed Chi-Square value is 3.9797 with a probability of both variables being associatedp = 0.1367(p > 0.05).
Figure 5.7: Chi-Square test results for association between type of Internet use and purpose for whichthe Internet is used
The top table of Figure 5.7 reveals that academic work is the most reported reason for which stu-dents use the Internet on campus, 197 out of 389 participants reported using the Internet for academicpurposes. This reason is then followed by recreational activities with 133 out of 389 participants, re-lationships development and maintenance with 33 out of 389 students, then other purposes with 26 outof 389 students. As the main focus of our research is to show whether there is an association betweenInternet usage and academic performance, we notice when looking at the same table that ‘light’ Internetusers reportedly use the Internet for academic purposes more than ‘heavy’ Internet users as respectivelyreported by 139 vs 58 out of the 197 students whose main reason to use the Internet was for academicwork.
Among ‘light’ Internet users, 57.44% of them reported academic work to be the main reason they usethe Internet whereas for ‘heavy’ Internet users, engaging in recreational activities was the most commonreported reason for using the Internet as was reported by 43.54% of them.
The bottom table of Figure 5.7 reveals that there is a statistical relationship between the type ofInternet user and the reported reasons for using the Internet: the calculated Chi-Square value is 12.7072with a probability of an association between the two variables being p = 0.0053(p < 0.05), the degreeof freedom DF=3.
36
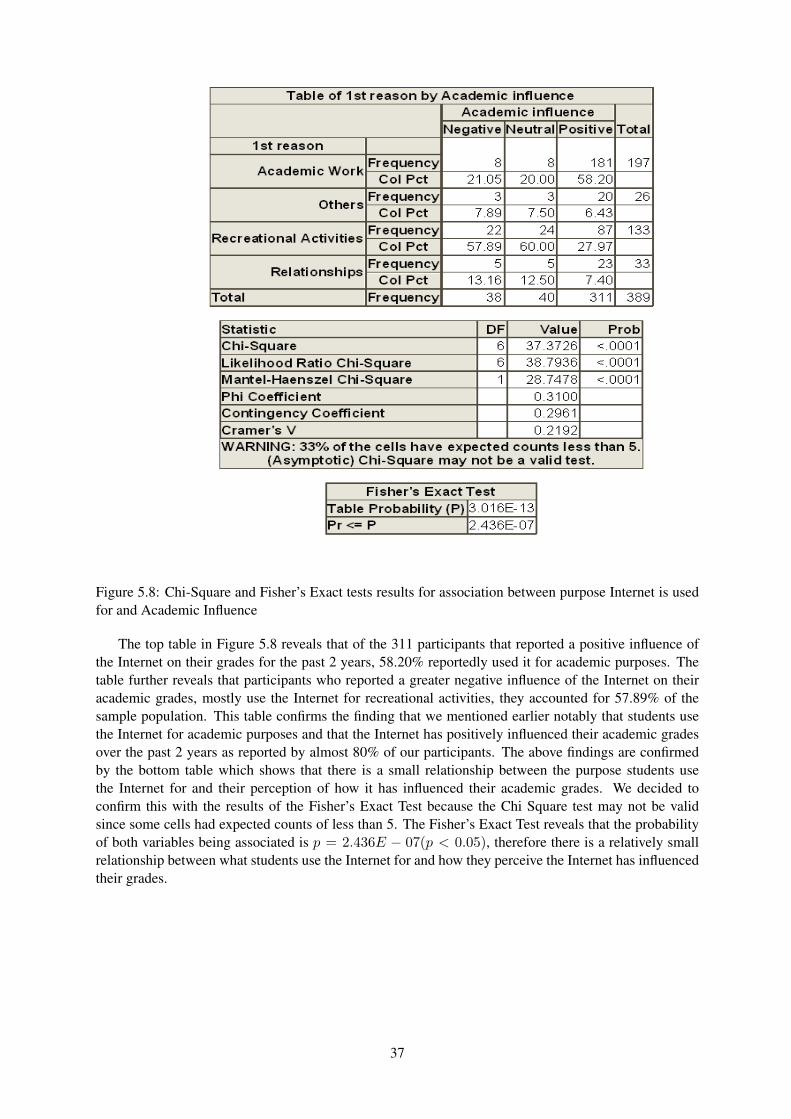
Figure 5.8: Chi-Square and Fisher’s Exact tests results for association between purpose Internet is usedfor and Academic Influence
The top table in Figure 5.8 reveals that of the 311 participants that reported a positive influence ofthe Internet on their grades for the past 2 years, 58.20% reportedly used it for academic purposes. Thetable further reveals that participants who reported a greater negative influence of the Internet on theiracademic grades, mostly use the Internet for recreational activities, they accounted for 57.89% of thesample population. This table confirms the finding that we mentioned earlier notably that students usethe Internet for academic purposes and that the Internet has positively influenced their academic gradesover the past 2 years as reported by almost 80% of our participants. The above findings are confirmedby the bottom table which shows that there is a small relationship between the purpose students usethe Internet for and their perception of how it has influenced their academic grades. We decided toconfirm this with the results of the Fisher’s Exact Test because the Chi Square test may not be validsince some cells had expected counts of less than 5. The Fisher’s Exact Test reveals that the probabilityof both variables being associated is p = 2.436E − 07(p < 0.05), therefore there is a relatively smallrelationship between what students use the Internet for and how they perceive the Internet has influencedtheir grades.
37
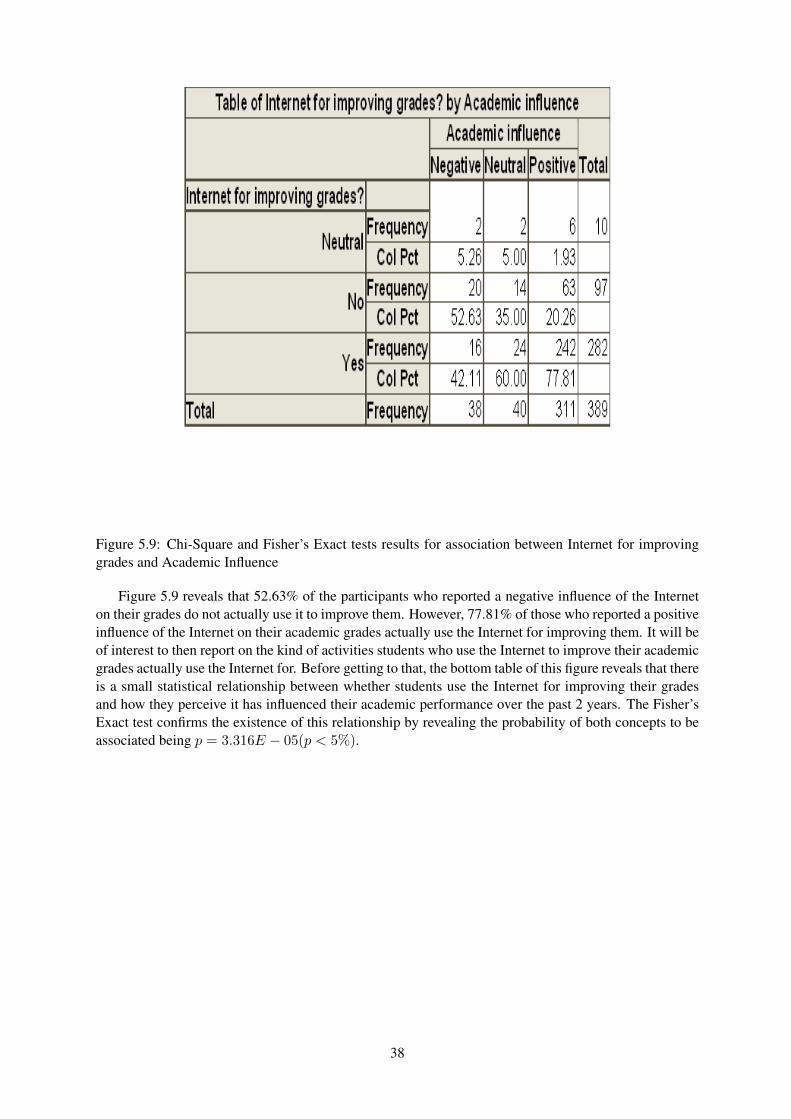
Figure 5.9: Chi-Square and Fisher’s Exact tests results for association between Internet for improvinggrades and Academic Influence
Figure 5.9 reveals that 52.63% of the participants who reported a negative influence of the Interneton their grades do not actually use it to improve them. However, 77.81% of those who reported a positiveinfluence of the Internet on their academic grades actually use the Internet for improving them. It will beof interest to then report on the kind of activities students who use the Internet to improve their academicgrades actually use the Internet for. Before getting to that, the bottom table of this figure reveals that thereis a small statistical relationship between whether students use the Internet for improving their gradesand how they perceive it has influenced their academic performance over the past 2 years. The Fisher’sExact test confirms the existence of this relationship by revealing the probability of both concepts to beassociated being p = 3.316E − 05(p < 5%).
38
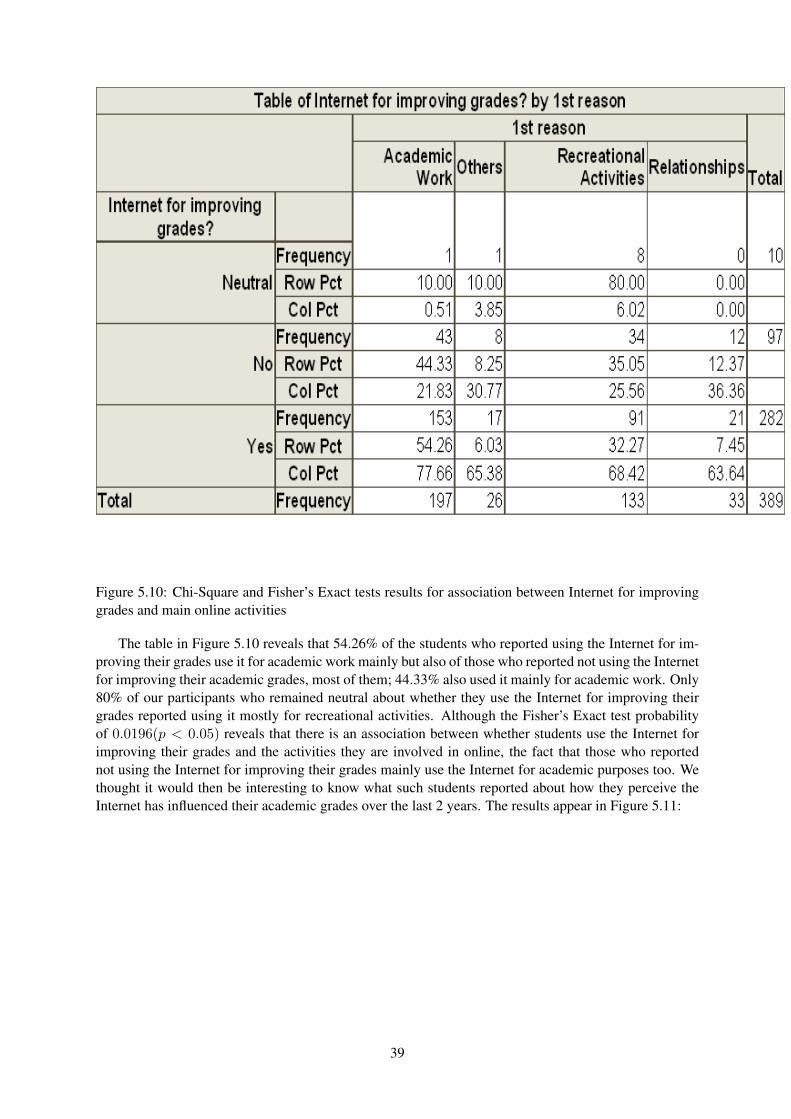
Figure 5.10: Chi-Square and Fisher’s Exact tests results for association between Internet for improvinggrades and main online activities
The table in Figure 5.10 reveals that 54.26% of the students who reported using the Internet for im-proving their grades use it for academic work mainly but also of those who reported not using the Internetfor improving their academic grades, most of them; 44.33% also used it mainly for academic work. Only80% of our participants who remained neutral about whether they use the Internet for improving theirgrades reported using it mostly for recreational activities. Although the Fisher’s Exact test probabilityof 0.0196(p < 0.05) reveals that there is an association between whether students use the Internet forimproving their grades and the activities they are involved in online, the fact that those who reportednot using the Internet for improving their grades mainly use the Internet for academic purposes too. Wethought it would then be interesting to know what such students reported about how they perceive theInternet has influenced their academic grades over the last 2 years. The results appear in Figure 5.11:
39

Figure 5.11: Internet for improving grades by its perceived influence on academic grades
The diagram appearing in Figure 5.11 reveals that of the students who reported not using the Internetfor improving their grades and using it mostly for academic purposes, 81.40% of them reported thatthe Internet has had a positive influence on their academic grades against only 13.95% who respondednegatively and 4.65% were neutral. This result, which we find a bit ironic, suggests that there is apossibility that students may not have been completely honest with regards to either their online activitiesor the influence the Internet has had on their academic performance. We think this might be the casebecause one would not expect students to report that although they use the Internet mostly for academicwork and it turned out to be academically productive, they were not using it to improve their grades. Thishighlights the need for a reliable research instrument when collecting data regarding students’ Internetusage and the influence it has on their academic performance.
5.1.4 Discussion
Although we have used the sample mean throughout this study to classify students as either ‘heavy’ or‘light’ Internet users, when we used the 7 criteria for Internet dependency as used by Anderson [2001],we found that almost 37% of our participants showed symptoms of Internet dependency compared to63% who did not. This result concurs with findings by Scherer [1997], Morahan-Martin and Schumacher[2000], Anderson [2001], Kubey et al. [2001], Metzger et al. [2003], and Fortson et al. [2007] that thereis an existence of Internet dependency among university students. This study also reveals that almost38% of our sample population use the Internet daily for more than 2.45 hours compared to about 62% ofthe total sample, therefore 38% of them were classified as ‘heavy’ Internet users and the remaining 62%as ‘light’ Internet users. The two above mentioned findings confirm that the sample mean Internet usagethat was never used before as a way of grouping students under ‘heavy’ or ‘light’ Internet users groups isas reliable as the 7 criteria for Internet dependency symptoms used in previous studies. As we mentionedin the interpretation of Figure 5.2, 10 out of 18 students (about 56%) whose Internet usage were indetifiedas outliers, were living in university residences. Even though we asked students to report only about theirInternet usage on campus when handing out the questionnaires, we believe that if we were to ask studentsto report about their overall daily Internet usage both on and off campus, the distribution of ‘heavy’ vs
40
‘light’ Internet users could have been different. Since we had no way to measure students’ Internet usageoff campus for the quantitative study that follows, for the sake of consistency of sampling proceduresbetween the two studies, we verbally asked students to only report about their Internet usage on campus.Therefore, we acknowledge that the probable finding of a different distribution in the types of on-campusInternet users in the study that will follow may highlight the unreliability of students self-reports.
Our study reveals in contrast to Scherer [1997], Jones [2002], Fortson et al. [2007], Young [1996],Rumbough [2001], and Metzger et al. [2003] who respectively found relationship maintenance and recre-ational activities to be the most predominant reasons students use the Internet that students mostly usethe Internet for academic work, then for recreational activities, then for relationships maintenance, theyrespectively accounted for 50.54%, 34.19% and 8.48% of the total sample. Furthermore, we discoveredthat ‘heavy’ Internet users used the Internet mainly for recreational activities as opposed to ‘light’ Inter-net users who reported using the Internet mostly for academic purposes. They respectively were in thefollowing proportions: for recreational activities, 43.54% vs 28.51% and for academic work 39.46% vs57.44%. This finding corroborates Morahan-Martin and Schumacher’s [2000] finding as far as ‘heavy’Internet users are concerned, even though in their study the authors failed to show what was the majorreason for which ‘light’ Internet users used the Internet.
We have revealed in Figure 5.6 that overall, no matter the category of Internet users they belong to,students perceive the Internet as a positive contributor towards their academic performance as reportedby Ogedebe’s [2010] study which also just like our qualitative study reveals that academic work is themain reason for which students use the Internet as reported by 45% of its participants. This was reportedby 79.95% of our sample whereas only 9.77% and 10.27% respectively reported that the Internet hada negative and a neutral influence on their academic performance. This finding is in concordance withLubans [1999], Scherer [1997], and Jones [2002] who also reported in their studies that most studentsbelieved the Internet had a positive impact on their academic performance. However, in agreement withKubey et al.; Hazelhurst et al.’s [2001; 2011]’s findings we found that of those who reported a negativeinfluence of the Internet on their academic grades, 52.63% were ‘heavy’ Internet users and 47.37%were ‘light’ Internet users. Moreover, of the identified ‘heavy’ Internet users, only 13.61% reported theInternet has negatively influenced their grades, while 10.20% had a neutral opinion and 76.19% of themreported a positive influence. The finding that most students who reported a negative influence of theInternet on their academic grades were initially identified as ‘heavy’ Internet users positively answersour first research question. However we also found that the majority of students who were labelledas ‘heavy’ Internet users reported a positive influence of the Internet on their grades, thus providing anegative answer to our second research questions. For an excessive Internet usage to be associated with adecreasing academic performance, we believe that there needs to exist a mutual relationship betweenboth concepts, in other words, if an excessive usage of the Internet is associated with a decreasingacademic performance, similarly, a decreasing academic performance needs to be associated with anabusive usage of the Internet. Unfortunately our findings could not find evidence of such an associationas was confirmed by the results of the Chi-Square test in Figure 5.6, the probability found was greaterthan 5%, eliminating therefore any probability of extensive Internet usage being correlated to impairedacademic performance.
This study has confirmed findings from some aforementioned authors that ‘heavy’ Internet users usethe Internet more for recreational purposes than ‘light’ users as shown in Figure 5.7. Also, we foundthat the more the Internet was used for academic work, the more likely it was to be perceived as apositive contributor to students’ academic performance increase as depicted in Figure 5.8. This findingwhen coupled with the ones we previously mentioned raises the hypothesis that the Internet in itselfmay not have any effects whether used excessively or not, but factors such as the reason it is beingused for, whether it is used for improving grades or not may contribute to how it is being perceivedwith regards to the main reason it was brought to campus for: as an educational support tool. Thisis confirmed by the results appearing in Figure 5.9 which shows that students who reported using theInternet for improving their grades reported a more positive influence of the Internet on their gradesand those who did not, reported otherwise. Figure 5.10 takes this further by showing that students who
41

used the Internet for academic reasons use it for improving their grades. Therefore future studies couldlook into this hypothesis to also determine if indeed using the Internet for academic purposes helps in apositive perception of its contribution to students’ academic grades regardless of whether one is a ‘heavy’or a ‘light’ Internet user.
This study also confirms the need for more reliable research instruments as suggested by Young[1996], Rumbough [2001], Gross [2004], and Fortson et al. [2007] because as depicted in Figure 5.8,students who use the Internet for recreational activities reported a more negative influence than positiveof it on their academic grades but yet identified ‘heavy’ Internet users who reported using it mostly forthe aforementioned reason reported a positive influence of the Internet on their grades. This findingwhich is somehow contradictory highlights the possibility of students not being completely honest whenreporting about their Internet usage habits and the effects they have on their academic performance.Indeed, how can one not use the Internet for academic purpose but yet report it as having a positiveinfluence on one’s grades? The need for a further investigation into this question is confirmed by theresults in Figure 5.9 which shows that students who reported not using the Internet for improving theirgrades reported nonetheless that the Internet has had a positive influence on their grades.
5.1.5 Conclusion
In summary, the different answers we gathered from the 389 correctly filled questionnaires we collectedallowed us to confirm that there is indeed an existence of Internet dependency among students. Academicwork was found to be the main reason students use the Internet on campus and the students we classifiedas ‘heavy’ Internet users were found to use the Internet more for recreational purposes than ‘light’ Inter-net users and also the more the Internet was used for academic work the more it was perceived to exerta positive influence on academic grades. In the next chapter of this document, we detail the quantitativestudy we conducted using Squid poxy logs recorded by the university for 359 out of the 389 participantswe used for the qualitative study. This study will use the recorded logs to measure the time studentsspend online on campus, the kind of websites they go to which will be combined with their courses finalgrade so as to establish if there is an association between Internet usage and academic performance.
42

5.2 Quantitative study
5.2.1 Introduction
In this section, we cover the second part of our mixed methods research that involves the conduct of aquantitative study whose aim is to identify evidence of a correlation between extensive Internet usageon campus and degrading academic performance among university students. This study will make useof hard data and will (by the nature of the reliability of the kind of data we are going to use) eithercorroborate or refute the findings we discussed earlier in the qualitative study chapter of this document.We therefore start this chapter with a review of the methodology we used to conduct this study, then thedata analysis and results interpretation section of the data we collected and we finish with a discussionof this study’s findings in comparison to the findings from the literature we reviewed in this domain. Atthe end of this study, we expect to have answered the following research questions:
1. Are ‘heavy’ Internet users ‘bad’ students?
2. Are ‘bad’ students ‘heavy’ Internet users?
5.2.2 The Methodology
The Sample
Our sample population consists of the same student sample we used in the qualitative study chapter ofthis document. We decided to use the same sample population so that when we triangulate the findingsof the two research methodologies we used, our findings of evidence of an association between extensiveInternet usage and academic performance impairment will be more reliable. Also we would be able toidentify potential inconsistencies between students’ self-reports and the collected hard data. Upon ourrequest and after ethical clearance was granted, the Academic Information Systems Unit (AISU) and theComputer Network Services (CNS) at Wits University respectively provided us with our participants’academic grades (course final grade for each year relevant to our study) and Squid proxy logs files forthe years 2008 through 2010. After receiving the information we requested from CNS and AISU, oursample population consisted of only 359 students because of the 389 we surveyed in the qualitative study,18 students provided us with wrong student numbers and CNS could not get any proxy logs for 12 otherstudents. With such a small quantity of data compared to our total sample, we decided to proceed withthe 359 students worth of data anyway because we concluded it would not have much of an influence onour conclusions.
The Research Instrument used
We mentioned in the literature review chapter of this document, that there was a strong need for morereliable instruments to be developed when measuring students’ online usage after the shortcomings ofself-reported data were exposed as expressed by Young [1996], Rumbough [2001], Gross [2004], andFortson et al. [2007]. We therefore decided that since the university (and this should be the case in mostacademic institutions across the globe) records its network’s users’ activities online for its informationsecurity and resource usage policies, we could actually use such records in our study because they wouldtruly be reflective of students’ real habits when they are online. At Wits University, CNS keeps suchrecords under a Squid proxy logs file format. Each network user therefore has his/her daily Internetactivities recorded in a squid proxy log file under his/her university person number. Everytime a newweb request is performed during a day, it is recorded as a new line. Each access.log entry consistsof about ten fields organized in columns. The main fields we were interested in were: the date, thebandwidth used, and the URL visited. We then developed a Java application that helped us process thesefiles in order to retrieve only the information we needed in the access.log file.
43
Variables measured
The following variables were measured in our study:
Internet Usage. We retrieved student’s bandwidth usage (converted from bytes to MB) from the logfiles. Since for multiple network failure reasons we did not manage to get logs for each day of the 2years requested, we decided to compute the yearly average over a 2 year period of all the distinct band-width values retrieved for each of our participants so that we could arrange students as either ‘heavy’ or‘light’ Internet users based on the 2 year average bandwidth usage of the whole group.
Educational vs. Non-Educational Internet usage. This variable helped us determine the purpose stu-dents use the Internet for on campus. We retrieved the top 10 webistes frequently visited by students todetermine how much of their Internet browsing on campus is academically related. We then went ontoeach particular website so that we could determine whether they are academic-related, entertainment-related, relationships maintenance and development related types of websites amongst others.
Academic Performance. In most tertiary academic institutions in South-Africa an average of 65% quali-fies a student as a ‘good’ student. We computed students’ average mark from the weighted average markswe received from AISU for the years 2008 through 2010 to classify students as either ‘good’ (if averagegrade is greater than or equal to 65%), ‘average’ (if average grade is between 50% inclusive and 65%)and ‘bad’ (if average grade is below 50%).
We also stored the yearly average bandwidth usage as well as their matching weighted average markto investigate a potential trend/pattern in academic grades variations according to varying Internet band-width used.
5.2.3 Data Analysis and Results Interpretation
In this section, we are going to report about the procedure we followed to treat the data and how muchtime was taken to actually collect the hard data we needed for this study, in this case they are students’weighted average mark for the years 2008 through 2010 and their Squid proxy logs files. Following thisphase, we will report about the different statistical analyses we performed to answer the two researchquestions we mentioned earlier. Like in the qualitative study section of our research, the statisticalanalyses performed are divided into two parts: an exploratory statistics section that includes descriptivestatistics that will help us appropriately understand our data then an inferential statistics section in whichwe explain the different calculations performed to determine if there is any association between Internetusage and academic performance among 3rd year university students at Wits or between any variablesmeasured in this study as mentioned earlier. Just like for the qualitative study section reported prior tothis study, all statistical computations to appear were performed using SAS Enterprise Guide version 4.2.
Data Collection Procedure and Treatment
As we mentioned earlier, Squid Proxy log files and weighted average marks for the years 2009 through2010 were collected by respectively sending the student numbers of our participants to CNS and AISU.Upon reception of the requested data, for confidentiality purposes, all student numbers were replacedby their corresponding questionnaire random number. The created file in which student numbers werematched with the random numbers appearing on the questionnaires was given to the research supervisorof this study. Similarly, after this file was created, all the questionnaires, whether filled correctly orincorrectly were transmitted to AISU as per this department’s request to have them included into eachparticipants’ student file kept by Wits. We would like to inform our readers that the number of studentsused in this study is lower than the one from the qualitative study because upon receiving feedback fromAISU, we realised that 18 of our participants did not supply us with their correct student numbers. As we
44
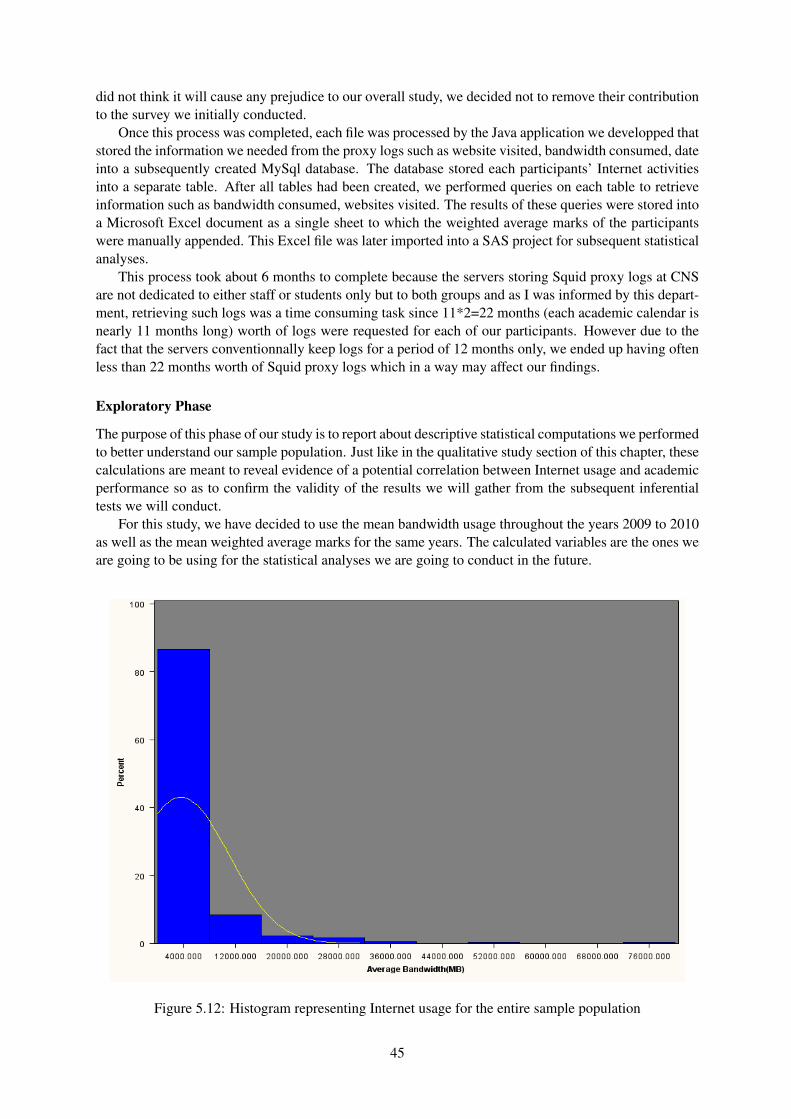
did not think it will cause any prejudice to our overall study, we decided not to remove their contributionto the survey we initially conducted.
Once this process was completed, each file was processed by the Java application we developped thatstored the information we needed from the proxy logs such as website visited, bandwidth consumed, dateinto a subsequently created MySql database. The database stored each participants’ Internet activitiesinto a separate table. After all tables had been created, we performed queries on each table to retrieveinformation such as bandwidth consumed, websites visited. The results of these queries were stored intoa Microsoft Excel document as a single sheet to which the weighted average marks of the participantswere manually appended. This Excel file was later imported into a SAS project for subsequent statisticalanalyses.
This process took about 6 months to complete because the servers storing Squid proxy logs at CNSare not dedicated to either staff or students only but to both groups and as I was informed by this depart-ment, retrieving such logs was a time consuming task since 11*2=22 months (each academic calendar isnearly 11 months long) worth of logs were requested for each of our participants. However due to thefact that the servers conventionnally keep logs for a period of 12 months only, we ended up having oftenless than 22 months worth of Squid proxy logs which in a way may affect our findings.
Exploratory Phase
The purpose of this phase of our study is to report about descriptive statistical computations we performedto better understand our sample population. Just like in the qualitative study section of this chapter, thesecalculations are meant to reveal evidence of a potential correlation between Internet usage and academicperformance so as to confirm the validity of the results we will gather from the subsequent inferentialtests we will conduct.
For this study, we have decided to use the mean bandwidth usage throughout the years 2009 to 2010as well as the mean weighted average marks for the same years. The calculated variables are the ones weare going to be using for the statistical analyses we are going to conduct in the future.
Figure 5.12: Histogram representing Internet usage for the entire sample population
45
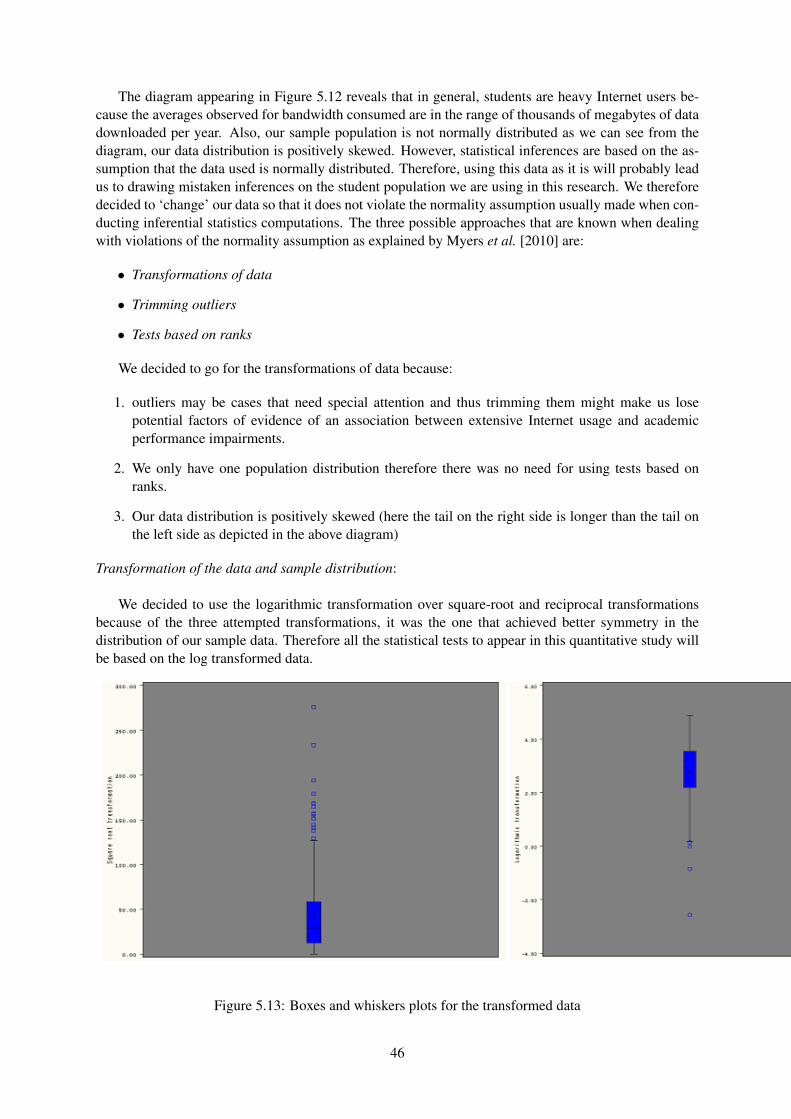
The diagram appearing in Figure 5.12 reveals that in general, students are heavy Internet users be-cause the averages observed for bandwidth consumed are in the range of thousands of megabytes of datadownloaded per year. Also, our sample population is not normally distributed as we can see from thediagram, our data distribution is positively skewed. However, statistical inferences are based on the as-sumption that the data used is normally distributed. Therefore, using this data as it is will probably leadus to drawing mistaken inferences on the student population we are using in this research. We thereforedecided to ‘change’ our data so that it does not violate the normality assumption usually made when con-ducting inferential statistics computations. The three possible approaches that are known when dealingwith violations of the normality assumption as explained by Myers et al. [2010] are:
• Transformations of data
• Trimming outliers
• Tests based on ranks
We decided to go for the transformations of data because:
1. outliers may be cases that need special attention and thus trimming them might make us losepotential factors of evidence of an association between extensive Internet usage and academicperformance impairments.
2. We only have one population distribution therefore there was no need for using tests based onranks.
3. Our data distribution is positively skewed (here the tail on the right side is longer than the tail onthe left side as depicted in the above diagram)
Transformation of the data and sample distribution:
We decided to use the logarithmic transformation over square-root and reciprocal transformationsbecause of the three attempted transformations, it was the one that achieved better symmetry in thedistribution of our sample data. Therefore all the statistical tests to appear in this quantitative study willbe based on the log transformed data.
Figure 5.13: Boxes and whiskers plots for the transformed data
46

The diagram appearing in Figure 5.13 represents box and whiskers plots of the data after it has beensquare root transformed (left picture) and log transformed (right picture). Notice that after the data hasbeen square root transformed, its distribution still shows a bit of skewness. As the picture on the left ofthe figure shows, the lower whisker and the lower half of the box are altogether much smaller than theupper half of the box and the upper whisker, which means that after this transformation, our distributionstill displayed characteristics of a positive skewness of the distribution. However, as depicted on the rightside of the above figure, the log transformed data shows a better symmetry between the lower whiskerand lower half of the box, and the upper whisker and the upper half of the box. Moreover, as we men-tioned above, trimming outliers which is known as an approach to deal with skewed data distribution hasbeen accomplished by the logarithmic transformation. As Figure 5.13 shows, the log transformed dataon the right has fewer outliers (depicted by the little squares below the lower whisker) than the squareroot transformed data on the left. Please note that the outliers observed in the log transformed data repre-sent the log transformed Internet bandwidth usage of students who actually happen to be the students forwhom we did not receive 22 months worth of logs as we indicated in the above ‘data collection procedureand treatment’ section of this study. This means that the classification of these students into either the‘heavy’ or ‘light’ Internet users category could have been biased. However, we were lucky enough thatthe logs we received for these few students were nearly one year long and therefore what we did was justfor these particular students for which we only received logs data worth one year only, we only used thecourse grade they received for the year that corresponds to the year for which we managed to get logsdata. Therefore, by reducing the time period of our study from 2 years to 1 year for these students, theirclassification as either ‘heavy’ or ‘light’ Internet users was fair.
Measures of central tendency and dispersion:
Basic Statistical MeasuresLocation Variability
Mean 2.768411 Std Deviation 1.04556Median 2.929148 Variance 1.09320Mode . Range 7.44708
Interquartile Range 1.34790
Table 5.4: Measures of location and spread for the total population sample
The results of the basic statistical measures reported in Table 5.4 confirms our previously mentionedconclusions that the log transformed data is normally distributed because there is not much differencebetween the mean and the median, their values vary respectively between 2.8 and 2.9. In other words,students consume on average between 630MB and 800MB of bandwidth per year while online. Thisresult shows that students are relatively light on campus Internet users. However, while this may be amisrepresentation of actual students’ Internet bandwidth consumption on campus due to the fact that wedid not get 22 months worth of Squid proxy logs, a counter-argument to this may be that students oftenhave 8AM to 4PM full timetables. It is important to note that only labs may involve the use of comput-ers during which students have limited opportunities to browse non-educational related websites whichusually have more bandwidth consuming materials than academic websites.
47
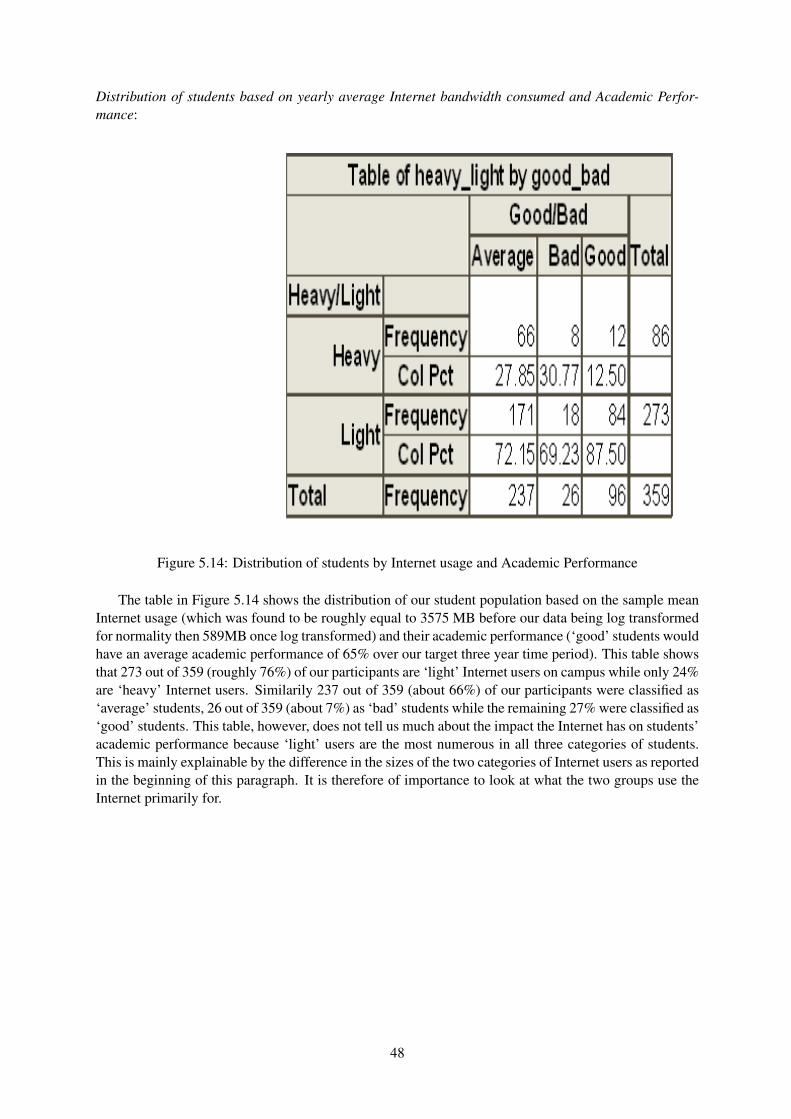
Distribution of students based on yearly average Internet bandwidth consumed and Academic Perfor-mance:
Figure 5.14: Distribution of students by Internet usage and Academic Performance
The table in Figure 5.14 shows the distribution of our student population based on the sample meanInternet usage (which was found to be roughly equal to 3575 MB before our data being log transformedfor normality then 589MB once log transformed) and their academic performance (‘good’ students wouldhave an average academic performance of 65% over our target three year time period). This table showsthat 273 out of 359 (roughly 76%) of our participants are ‘light’ Internet users on campus while only 24%are ‘heavy’ Internet users. Similarily 237 out of 359 (about 66%) of our participants were classified as‘average’ students, 26 out of 359 (about 7%) as ‘bad’ students while the remaining 27% were classified as‘good’ students. This table, however, does not tell us much about the impact the Internet has on students’academic performance because ‘light’ users are the most numerous in all three categories of students.This is mainly explainable by the difference in the sizes of the two categories of Internet users as reportedin the beginning of this paragraph. It is therefore of importance to look at what the two groups use theInternet primarily for.
48
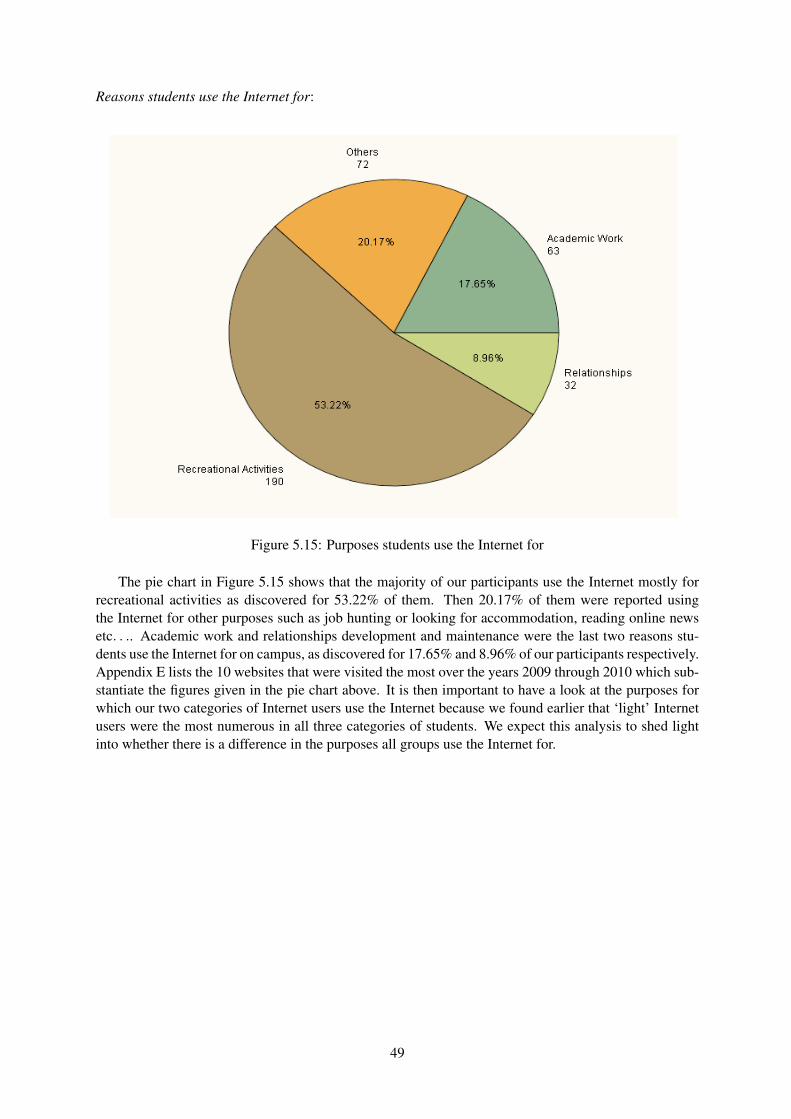
Reasons students use the Internet for:
Figure 5.15: Purposes students use the Internet for
The pie chart in Figure 5.15 shows that the majority of our participants use the Internet mostly forrecreational activities as discovered for 53.22% of them. Then 20.17% of them were reported usingthe Internet for other purposes such as job hunting or looking for accommodation, reading online newsetc. . .. Academic work and relationships development and maintenance were the last two reasons stu-dents use the Internet for on campus, as discovered for 17.65% and 8.96% of our participants respectively.Appendix E lists the 10 websites that were visited the most over the years 2009 through 2010 which sub-stantiate the figures given in the pie chart above. It is then important to have a look at the purposes forwhich our two categories of Internet users use the Internet because we found earlier that ‘light’ Internetusers were the most numerous in all three categories of students. We expect this analysis to shed lightinto whether there is a difference in the purposes all groups use the Internet for.
49
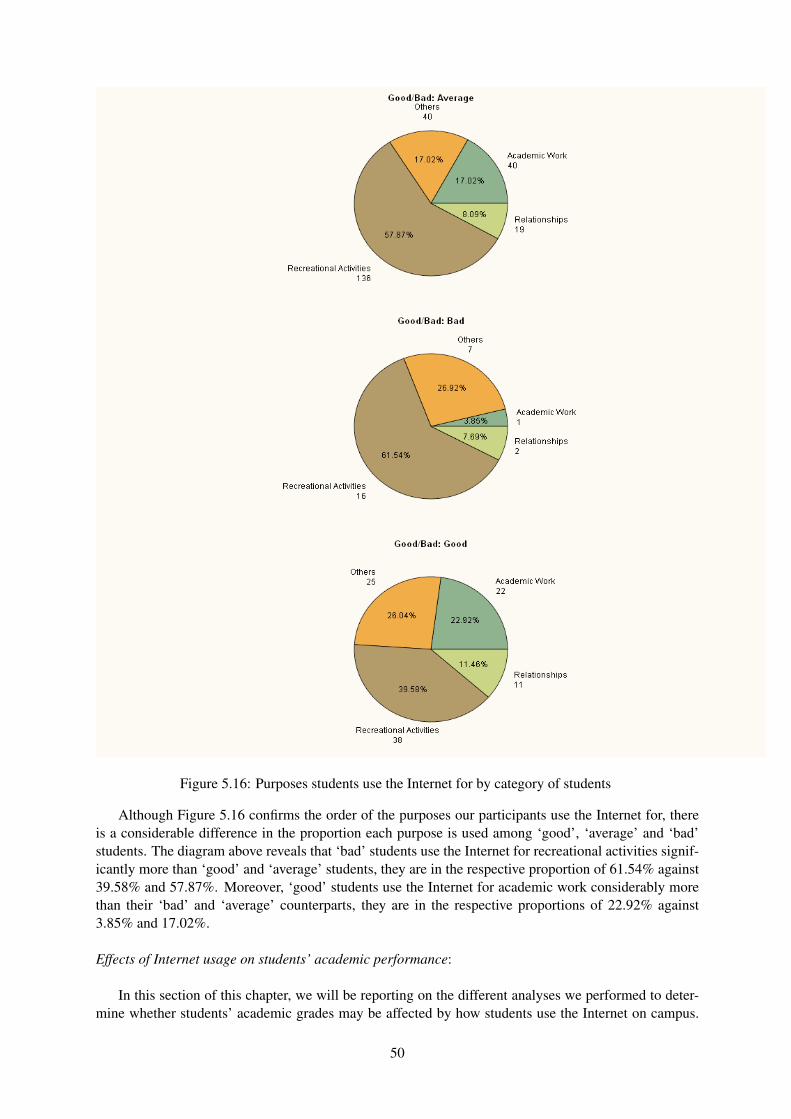
Figure 5.16: Purposes students use the Internet for by category of students
Although Figure 5.16 confirms the order of the purposes our participants use the Internet for, thereis a considerable difference in the proportion each purpose is used among ‘good’, ‘average’ and ‘bad’students. The diagram above reveals that ‘bad’ students use the Internet for recreational activities signif-icantly more than ‘good’ and ‘average’ students, they are in the respective proportion of 61.54% against39.58% and 57.87%. Moreover, ‘good’ students use the Internet for academic work considerably morethan their ‘bad’ and ‘average’ counterparts, they are in the respective proportions of 22.92% against3.85% and 17.02%.
Effects of Internet usage on students’ academic performance:
In this section of this chapter, we will be reporting on the different analyses we performed to deter-mine whether students’ academic grades may be affected by how students use the Internet on campus.
50
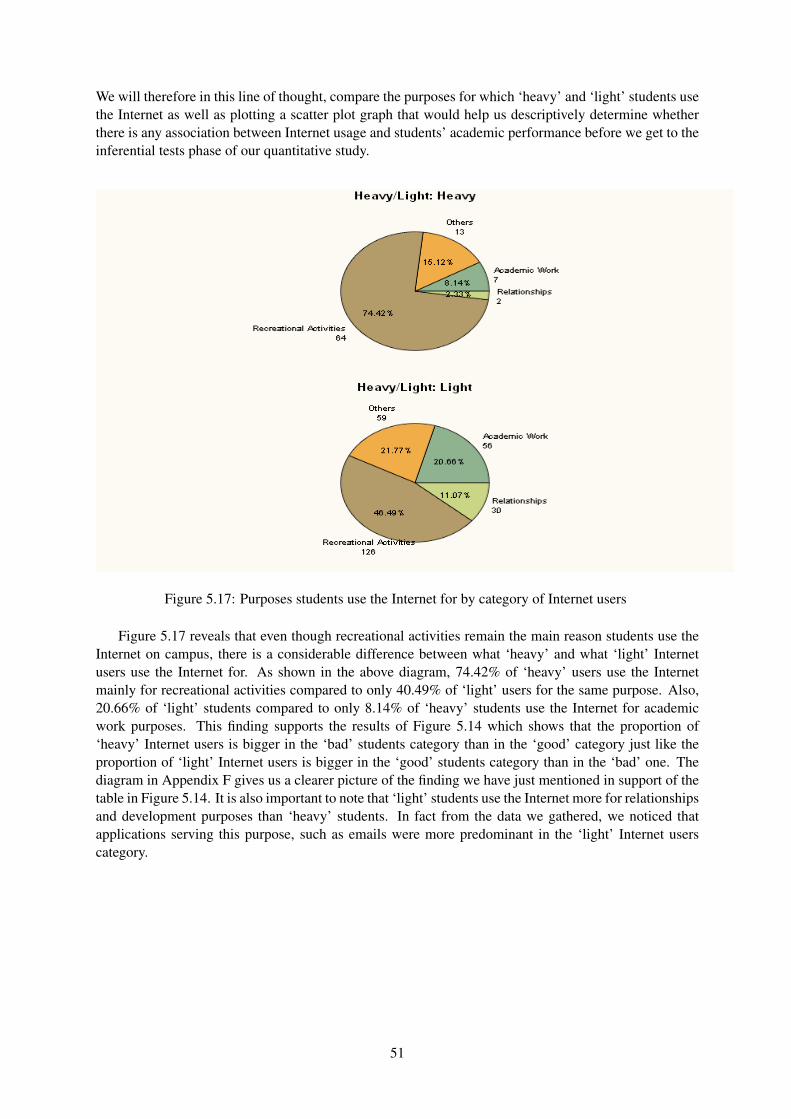
We will therefore in this line of thought, compare the purposes for which ‘heavy’ and ‘light’ students usethe Internet as well as plotting a scatter plot graph that would help us descriptively determine whetherthere is any association between Internet usage and students’ academic performance before we get to theinferential tests phase of our quantitative study.
Figure 5.17: Purposes students use the Internet for by category of Internet users
Figure 5.17 reveals that even though recreational activities remain the main reason students use theInternet on campus, there is a considerable difference between what ‘heavy’ and what ‘light’ Internetusers use the Internet for. As shown in the above diagram, 74.42% of ‘heavy’ users use the Internetmainly for recreational activities compared to only 40.49% of ‘light’ users for the same purpose. Also,20.66% of ‘light’ students compared to only 8.14% of ‘heavy’ students use the Internet for academicwork purposes. This finding supports the results of Figure 5.14 which shows that the proportion of‘heavy’ Internet users is bigger in the ‘bad’ students category than in the ‘good’ category just like theproportion of ‘light’ Internet users is bigger in the ‘good’ students category than in the ‘bad’ one. Thediagram in Appendix F gives us a clearer picture of the finding we have just mentioned in support of thetable in Figure 5.14. It is also important to note that ‘light’ students use the Internet more for relationshipsand development purposes than ‘heavy’ students. In fact from the data we gathered, we noticed thatapplications serving this purpose, such as emails were more predominant in the ‘light’ Internet userscategory.
51
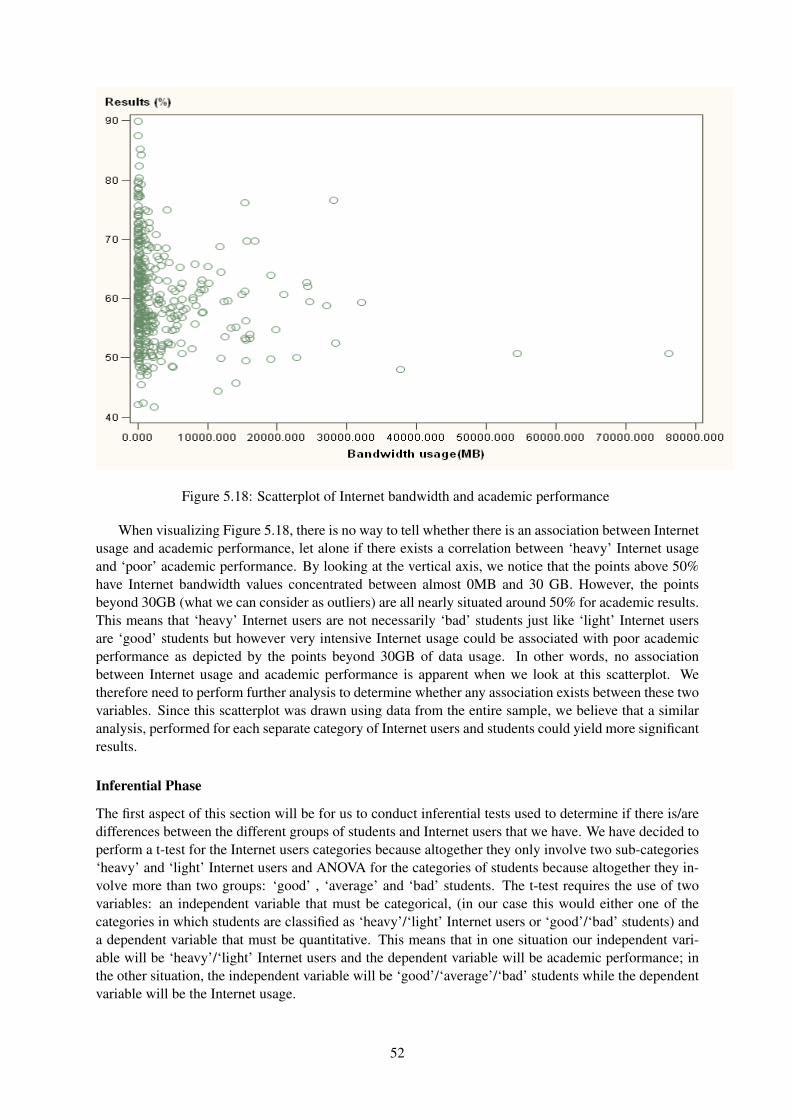
Figure 5.18: Scatterplot of Internet bandwidth and academic performance
When visualizing Figure 5.18, there is no way to tell whether there is an association between Internetusage and academic performance, let alone if there exists a correlation between ‘heavy’ Internet usageand ‘poor’ academic performance. By looking at the vertical axis, we notice that the points above 50%have Internet bandwidth values concentrated between almost 0MB and 30 GB. However, the pointsbeyond 30GB (what we can consider as outliers) are all nearly situated around 50% for academic results.This means that ‘heavy’ Internet users are not necessarily ‘bad’ students just like ‘light’ Internet usersare ‘good’ students but however very intensive Internet usage could be associated with poor academicperformance as depicted by the points beyond 30GB of data usage. In other words, no associationbetween Internet usage and academic performance is apparent when we look at this scatterplot. Wetherefore need to perform further analysis to determine whether any association exists between these twovariables. Since this scatterplot was drawn using data from the entire sample, we believe that a similaranalysis, performed for each separate category of Internet users and students could yield more significantresults.
Inferential Phase
The first aspect of this section will be for us to conduct inferential tests used to determine if there is/aredifferences between the different groups of students and Internet users that we have. We have decided toperform a t-test for the Internet users categories because altogether they only involve two sub-categories‘heavy’ and ‘light’ Internet users and ANOVA for the categories of students because altogether they in-volve more than two groups: ‘good’ , ‘average’ and ‘bad’ students. The t-test requires the use of twovariables: an independent variable that must be categorical, (in our case this would either one of thecategories in which students are classified as ‘heavy’/‘light’ Internet users or ‘good’/‘bad’ students) anda dependent variable that must be quantitative. This means that in one situation our independent vari-able will be ‘heavy’/‘light’ Internet users and the dependent variable will be academic performance; inthe other situation, the independent variable will be ‘good’/‘average’/‘bad’ students while the dependentvariable will be the Internet usage.
52
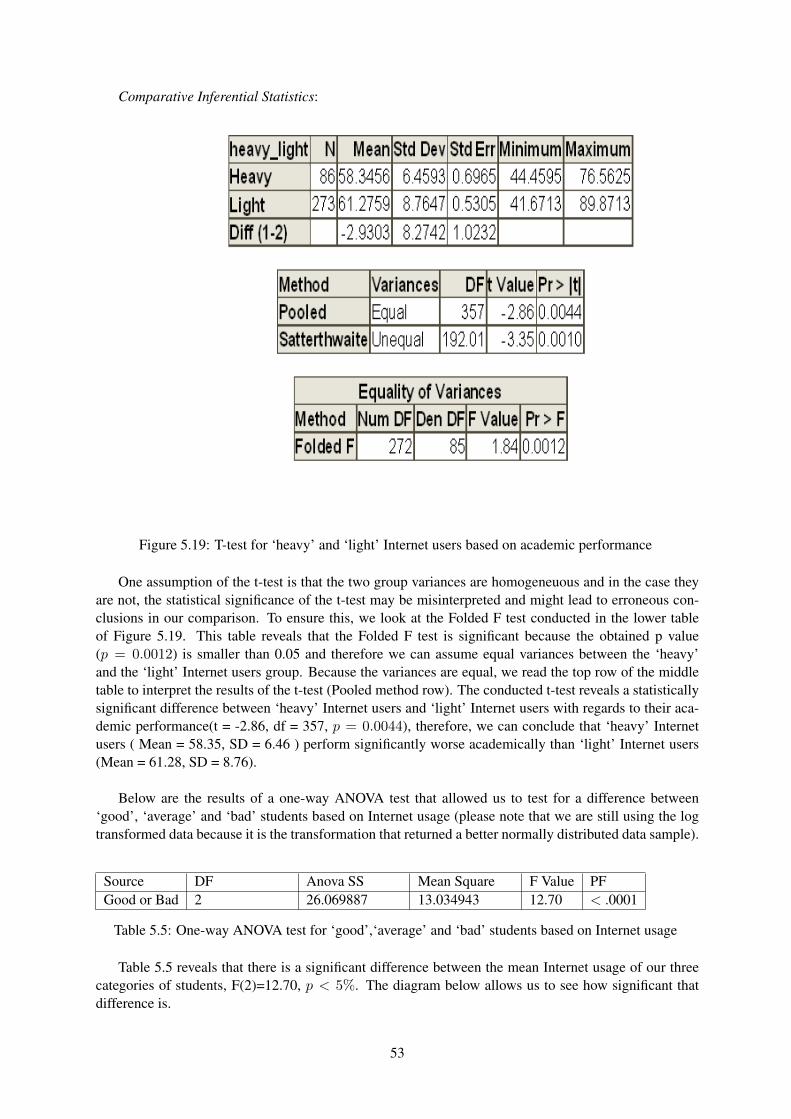
Comparative Inferential Statistics:
Figure 5.19: T-test for ‘heavy’ and ‘light’ Internet users based on academic performance
One assumption of the t-test is that the two group variances are homogeneuous and in the case theyare not, the statistical significance of the t-test may be misinterpreted and might lead to erroneous con-clusions in our comparison. To ensure this, we look at the Folded F test conducted in the lower tableof Figure 5.19. This table reveals that the Folded F test is significant because the obtained p value(p = 0.0012) is smaller than 0.05 and therefore we can assume equal variances between the ‘heavy’and the ‘light’ Internet users group. Because the variances are equal, we read the top row of the middletable to interpret the results of the t-test (Pooled method row). The conducted t-test reveals a statisticallysignificant difference between ‘heavy’ Internet users and ‘light’ Internet users with regards to their aca-demic performance(t = -2.86, df = 357, p = 0.0044), therefore, we can conclude that ‘heavy’ Internetusers ( Mean = 58.35, SD = 6.46 ) perform significantly worse academically than ‘light’ Internet users(Mean = 61.28, SD = 8.76).
Below are the results of a one-way ANOVA test that allowed us to test for a difference between‘good’, ‘average’ and ‘bad’ students based on Internet usage (please note that we are still using the logtransformed data because it is the transformation that returned a better normally distributed data sample).
Source DF Anova SS Mean Square F Value PFGood or Bad 2 26.069887 13.034943 12.70 < .0001
Table 5.5: One-way ANOVA test for ‘good’,‘average’ and ‘bad’ students based on Internet usage
Table 5.5 reveals that there is a significant difference between the mean Internet usage of our threecategories of students, F(2)=12.70, p < 5%. The diagram below allows us to see how significant thatdifference is.
53

Figure 5.20: Internet usage means of the three categories of students
As we can see in Figure 5.20, ‘bad’ students use the Internet more than ‘average’ and ‘good’ studentswhen comparing the log transformed values of their mean Internet usage.
Associational Inferential Statistics
In this section, we conducted inferential tests that would help us determine whether there is an asso-ciation between Internet usage and academic performance. We decided to conduct a Pearson correlationtest to determine if there is an association between Internet usage and academic performance for ‘heavy’and ‘light’ Internet users, and if there is an association between Internet usage and academic performancefor ‘good’, ‘average’ and ‘bad’ students.
Figure 5.21: Correlation test between ‘heavy’ and ‘light’ Internet users and academic performance
Figure 5.21 shows the results of a Pearson correlation analysis to examine whether there is a rela-tionship between ‘heavy’ Internet users and academic performance (table on the left) and whether thereis also a correlation between ‘light’ Internet users and academic performance (table on the right). Theresults reveal a nonsignificant and negative relationship (r = -0.1, p = 0.36) with a weak in strengthcorrelation between ‘heavy’ Internet users and academic performance. In other words, higher values ofInternet bandwidth usage are associated with lower academic grades for ‘heavy’ Internet users. The tableon the right reveal a significant and negative relationship (r = -0.25, p < 0.0001) with a weak in strengthcorrelation between ‘light’ Internet users and academic performance. In other words, higher values ofInternet bandwidth are associated with lower academic grades for ‘light’ Internet users as well.
54
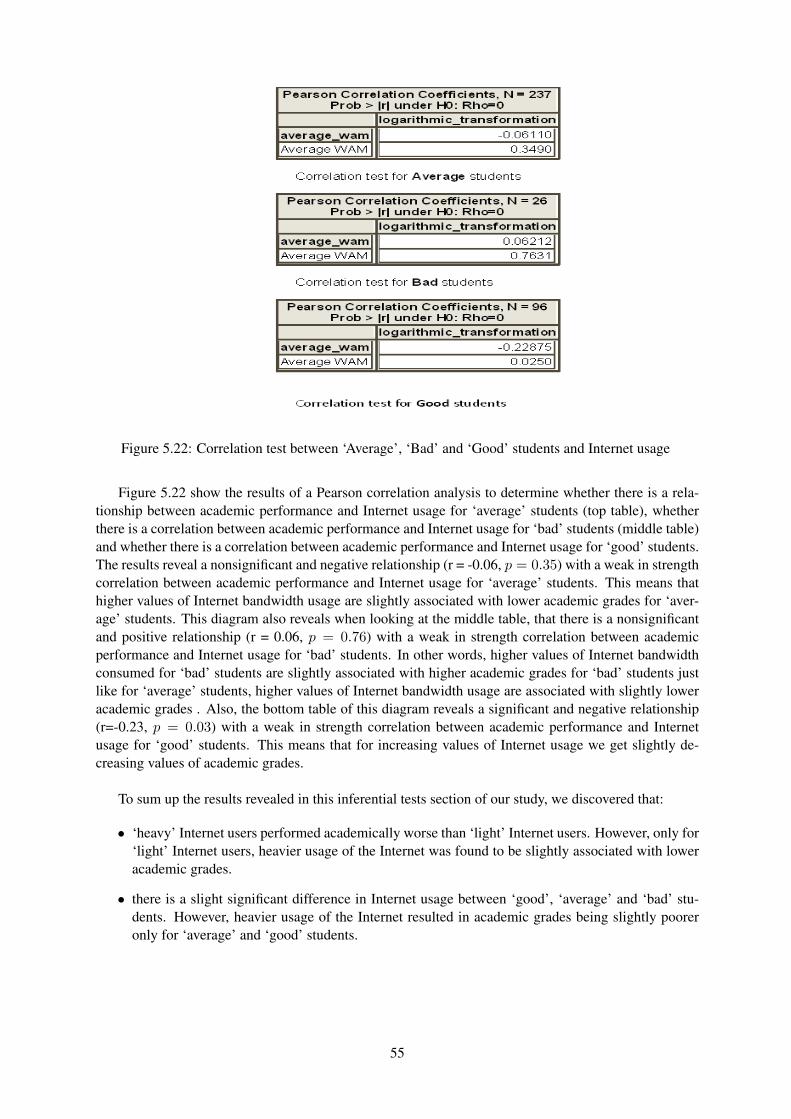
Figure 5.22: Correlation test between ‘Average’, ‘Bad’ and ‘Good’ students and Internet usage
Figure 5.22 show the results of a Pearson correlation analysis to determine whether there is a rela-tionship between academic performance and Internet usage for ‘average’ students (top table), whetherthere is a correlation between academic performance and Internet usage for ‘bad’ students (middle table)and whether there is a correlation between academic performance and Internet usage for ‘good’ students.The results reveal a nonsignificant and negative relationship (r = -0.06, p = 0.35) with a weak in strengthcorrelation between academic performance and Internet usage for ‘average’ students. This means thathigher values of Internet bandwidth usage are slightly associated with lower academic grades for ‘aver-age’ students. This diagram also reveals when looking at the middle table, that there is a nonsignificantand positive relationship (r = 0.06, p = 0.76) with a weak in strength correlation between academicperformance and Internet usage for ‘bad’ students. In other words, higher values of Internet bandwidthconsumed for ‘bad’ students are slightly associated with higher academic grades for ‘bad’ students justlike for ‘average’ students, higher values of Internet bandwidth usage are associated with slightly loweracademic grades . Also, the bottom table of this diagram reveals a significant and negative relationship(r=-0.23, p = 0.03) with a weak in strength correlation between academic performance and Internetusage for ‘good’ students. This means that for increasing values of Internet usage we get slightly de-creasing values of academic grades.
To sum up the results revealed in this inferential tests section of our study, we discovered that:
• ‘heavy’ Internet users performed academically worse than ‘light’ Internet users. However, only for‘light’ Internet users, heavier usage of the Internet was found to be slightly associated with loweracademic grades.
• there is a slight significant difference in Internet usage between ‘good’, ‘average’ and ‘bad’ stu-dents. However, heavier usage of the Internet resulted in academic grades being slightly pooreronly for ‘average’ and ‘good’ students.
55
5.2.4 Discussion
The results of our study confirm findings by Young [1996], Scherer [1997], Morahan-Martin and Schu-macher [2000], Anderson [2001], Kubey et al. [2001], Metzger et al. [2003], and Fortson et al. [2007]that there is an existence of Internet dependency among university students. Our study shows that of the359 students we used in our quantitative study, 24% of them were categorized as ‘heavy’ Internet users.Although the Squid proxy logs files we received differed in terms of sizes which resulted in our data notbeing normally distributed initially because the total Internet bandwidth computed would obviously varydepending on the size of the Squid log file received, transforming it using the logarithmic based transfor-mation gave us a better normally distributed sample which we used to conduct the statistical analyses weperformed. Although the sizes of the log files we received varied, the reality is that Internet usage variesby its bandwidth consumed and purposes among 3rd year students at Wits.
Our study confirms findings by Young [1996], Rumbough [2001], and Metzger et al. [2003] whofound that recreational activities are the most predominant reasons for which students use the Internet.In our study, this reason accounted for 53.22% of our sample population. The second reason for whichstudents use the Internet was ‘others’ (20.17% of our sample) which consisted of reasons such as jobhunting, information seeking because most sites visited in this category were predominantly search en-gines such as google as confirmed by Judd and Kennedy’s [2010] study who found that informationseeking is a key activity for most Internet users. Internet usage for academic work was in the proportionof 17.65% of our population and therefore this contradicts arguments by Lubans [1999], Scherer [1997],and Jones [2002] who found that academic work was a predominant reason for which students used theInternet. Our study furthermore reveals that there is a difference in activities ‘heavy’ Internet users and‘light’ Internet users engage themselves in while online. We found that ‘light’ Internet users were lessengaged in recreational activities online than ‘heavy’ users and that ‘light’ Internet users use the Internetfor academic work more than double ‘heavy’ Internet users did, they were respectively for each purpose:40.49% vs 74.42% and 20.66% vs 8.14%. This finding corroborates Morahan-Martin and Schumacher’s[2000] finding that ‘heavy’ Internet users are more engaged in recreational activities while online thantheir ‘light’ user counterparts. Similarily, we have revealed that ‘bad’ students use the Internet more forrecreational activities and less for academic work compared to ‘good’ and ‘average’ students. They werein the respective proportions of 61.54% vs 39.58% and 57.87% for recreational activities and 3.85% vs22.92% and 17.02% for academic work.
After looking at the entire sample in Figure 5.18 we could see that there is no linear relationshipbetween Internet usage and academic performance. We however decided to investigate whether thisremained true if we separated our participants into the different categories we have used all along thisstudy: ‘heavy’ vs ‘light’ Internet users and ‘good’ vs ‘bad’ vs ‘average’ students. After the t-test weconducted in Figure 5.19 revealed a statistically significant difference between ‘heavy’ Internet usersand ‘light’ Internet users in terms of academic performance, although there was a positive and weakcorrelation between heavier Internet usage and increasing academic performance as shown in the middletable of Figure 5.21, ‘heavy’ Internet users were still found to perform worse academically than ‘light’Internet users. In the same line of thoughts, the one-way ANOVA test we conducted in Figure 5.5revealed that there is a statistically significant difference between ‘good’, ‘average’ and ‘bad’ studentswith regards to Internet usage. Also regarding our three categories of students, Figure 5.22 reveals thatthere is a weak negative correlation between Internet usage and academic performance whether a studentis ‘average’ or ‘good’. Since Appendix G reveals that of the students who use the Internet primarilyfor academic purposes these two groups are the most predominant, this finding leads us to think that asthe Internet usage of these students gets heavier, they engage themselves less in academically relatedactivities while online. Therefore looking at the variation in Internet usage values and academic gradeswithin these categories could yield important information to substantiate the influence exerted by theInternet on students’ academic performance.
Based on the results mentioned above, one could argue that poor academic performance is associatedwith increasing Internet usage because as depicted in Figure 5.16, ‘good’ students use the Internet morefor academic purposes than ‘bad’ and ‘average’ students. This is strengthened by the calculated Pearson
56
correlation coefficients which revealed that heavier Internet usage for ‘good’ and ‘average’ students wasfound to be slightly associated with decreasing academic performance. We were able to find evidence ofthis correlation because as we found in the analysis section of this study, not only ‘heavy’ Internet userswere found to perform academically worse than ‘light’ Internet users, but also a statistically significantdifference was found between ‘good’, ‘average’ and ‘bad’ students with regards to Internet usage, inother words, ‘bad’ students used the Internet slightly more than ‘average’ and ‘good’ students. Thisfinding coupled with the results appearing in Appendix F which reveals that among the three categoriesof students, there is a higher percentage of ‘heavy’ Internet users in the ‘bad’ students category confirmsthat indeed there is an association between heavy Internet usage and academic performance. AppendixG further strengthens this argument by showing that among the students who use the Internet primarilyfor academic work, there is only one who is a bad academic performer.
5.2.5 Conclusion
In conclusion, this study confirmed the existence of Internet dependency among university students asprevious studies mentioned in the first paragraph of this discussion section discovered. Students werefound to use the Internet mostly for entertainment purposes as found in 53.22% of our sample population.The categorization of our participants as either ‘heavy’ or ‘light’ Internet users and as either ‘bad’,‘average’ or ‘good’ students allowed us to find that ‘light’ Internet users are less engaged in recreationalactivities while on campus compared to ‘heavy’ Internet users and the latter perform significantly worseacademically than the former. ‘Bad’ students were also found to use the Internet more for recreationalactivities than other students. However, no relationship of causality was found between Internet usageand academic performance regardless of the category a student belonged to. In the next chapter of thisdocument, we are going to triangulate the results of the qualitative and the quantitative studies in orderto determine the proportion of students who are in denial about their Internet usage habits and why usinghard and self-reported data proved to be valuable for our research.
57

5.3 Cross-triangulation of studies’ findings
5.3.1 Introduction
In this section of this chapter, we will triangulate the findings of the quantitative and qualitative studiesconducted above so as to generate information that neither of them alone would have been able to bycomparing and contrasting their results. We will subsequently interpret these studies in terms of howrelevant they were in addressing the issue of whether Internet usage can be associated with academicperformance at Wits.
5.3.2 Comparison and contrast of the findings
In this section of the chapter, we will compare and contrast the findings of the two studies we conductedwith regards to the three areas we focused our research on. These areas were notably:
• Is there an existence of Internet dependency among university students?
• What do students use the Internet for?
• What influence does the Internet have on students’ academic performance?
Existence of Internet dependency among university students
The two conducted studies reveal that students are ‘light’ on campus Internet users. Of the 389 studentswe surveyed in the qualitative study chapter of our document, 232 of them (about 62%) were classifiedas ‘light’ Internet users for having a daily Internet usage less than 2.45 hours/day which was the meanInternet usage of the entire sample. The quantitative study revealed that of the 359 distinct Squid proxylogs we received, 273 students (76%) were classified as ‘light’ Internet users for having their meanInternet usage being below 3575MB/year or roughly 10MB/day. While we recognize that these findingsmay be an under-estimation of students Internet usage on campus firstly because of the unreliability ofstudents’ self-reports and secondly because as we mentioned in a previous section, we did not receive3 years worth of Squid proxy logs from CNS for each of the 359 students, we would like to arguethat at Wits, classes run from 8AM until run about 4PM and in between students may have breaks thatonly add up to 2 hours/day during which they are free to do whatever they want such as going onto theInternet. This is further supported by the fact that at Wits, the only classes that may involve Internet useare tutorials (usually if computers needed would be on average 4 to 6 hours per subject per week, plusInternet access is restricted to mostly search engines and academically related websites only) becauselectures still follow the traditional approach whereby a lecturer would go through the teaching materialsand students would write down notes.
The qualitative and quantitative studies also confirm the existence of Internet dependency among uni-versity students as found in 38% and in 24% of our sample population for the qualitative and quantitativestudy respectively. Among those students whom we classified as ‘heavy’ Internet users on campus, 18out of the 147 identified ‘heavy’ Internet users from the qualitative study reported using the Internet formore than 6 hours/day while of the identified 86 ‘heavy’ Internet users in the quantitative study, 38 werefound to be using the Internet for over 10 Gigabytes/year or roughly 27MB/day. This is quite ‘heavy’ inboth instances especially for the latter mentioned since students do not go to university everyday of theyear and an academic year contains less than 365 days. These show that there is an existence of Internetdependency among 3rd year university students at Wits to confirm findings by Young [1996], Scherer[1997], Morahan-Martin and Schumacher [2000], Anderson [2001], Kubey et al. [2001], Metzger etal. [2003], and Fortson et al. [2007] that there is an existence of Internet dependency among universitystudents in general.
58

Reasons for which students use the Internet
Regarding this aspect of our research, we found diverging results between the two studies we conductedwith regards to the reasons for which students use the Internet on campus. The qualitative study weconducted revealed that academic work is the main reason for which students use the Internet, followedby recreational activities, relationships development and maintenance then other reasons as reported by50.64%, 34.19%, 8.48% and 6.68% of our sample population respectively. The quantitative study how-ever tells a different story. It revealed that recreational activities are the main reason for which studentsgo online, followed by other reasons, academic work in third position then relationships developmentand maintenance last as found in 53.22%, 20.17%, 17.65% and 8.96% of our sample population respec-tively. The divergence of these findings raises a question of reliability as far as students’ self-reports areconcerned. Because we made use of hard-data in our quantitative study, we are compelled to argue thatstudents are in denial about the reasons for which they use the Internet. Out of the 359 students whoseSquid proxy logs were received, for only 107 of them, the reason for which they reported using the In-ternet actually matched what the Squid proxy logs were telling us, in other words 70% of our studentpopulation can be said to be in denial about the reason for which they mainly go online. Since the surveywe conducted in the qualitative study was anonymous, we dare assuming that our participants had noreason to lie to us in their reports and therefore instead of implying that 70% of them lied to us, we preferto say that 70% of our participants are in denial about their Internet usage habits.
Our studies also reveal diverging results in terms of the reasons for which our different groups of stu-dents and Internet users use the Internet. The qualitative study reveal for our ‘heavy’ Internet users thatto engage in recreational activities is the most predominant reason for which students go online, followedby academic work, relationships development and maintenance the other reasons while the quantitativestudy reveals for the same group that, recreational activities is the first reason, then other reasons, fol-lowed by academic work and then relationships development and maintenance. Regarding the ‘light’Internet users group, the qualitative study reveals that the main reason for which students go online are(in descending order of preference): academic work, recreational activities, relationships developmentand maintenance and other reasons while the quantitative study reveals following the same logic that itis in fact, recreational activities followed by other reasons, academic work and then relationships devel-opment and maintenance. We believe that the diverging findings between the two studies regarding thesetwo groups of Internet users is explained by the elevated number of students we found earlier who are indenial, 70% of our sample population.
The influence of the Internet on academic grades
Regarding the influence exerted by the Internet on students’ academic grades, both studies concurred onthe negative effects of excessive Internet usage on academic grades. The qualitative study we conductedrevealed that students who were classified as ‘heavy’ Internet users reported a negative perception ofthe Internet on their grades more than students who were classified as ‘light’ Internet users and that‘heavy’ Internet users engaged more recreational activities and less academic work online than studentswho were classified as ‘light’ Internet users. The statistical calculations performed in the quantitativestudy corroborated these findings by revealing that ‘heavy’ Internet users used the Internet more forrecreational activities and less for academic work compared to ‘light’ Internet users.Another finding which we found to be interesting because the two studies seemed to concur on thisaspect is that in the qualitative study, we found that students who reported a perceived positive influenceof the Internet on their academic grades use it considerably more for academic work than for recreationalpurposes, they were in the respective proportions of 58.20% vs 27.97% and students who reported aperceived negative influence of the Internet on their grades use the Internet more for recreational activitiesthan for academic work, they were in the respective proportion of 57.89% vs 21.05%. Similarily, inthe quantitative study, ‘good’ students were found to use the Internet considerably more for academicpurposes than ‘bad’ students, 22.92% vs 17.02% and less for recreational purposes than ‘bad’ students,39.58% vs 57.87%.
59

The equality of the findings arising from the comparison we performed above, makes it arguable thatextensive Internet usage for activities that are not academically related can have a negative influence onstudents’ academic performance at university.
5.3.3 Interpretation of qualitative and quantitative studies
The two studies we conducted in this research allowed us to address two important questions beyondour main research focus which was to investigate evidence of a potential association between extensiveInternet usage and poor academic performance among students at Wits. These questions are:
1. Are self-reported data reliable?
2. Do hard data tell us the full story?
With regards to question 1, the diverging results between the qualitative and the quantitative studiesregarding aspects such as the purposes for which students go online show us that self-reported datais unreliable and that stronger instruments based on hard data need to be developed when dealing withpeople’s behaviours as it is likely that they will not report them as they are in reality. This may be becausethey are not aware of them as we believe if data about such behaviours are collected in an anonymousmanner they will be reported genuinely. In this sense, we think it has been beneficial for us to use amixed methods research so that possibilities of denial can be easily identified and dealt with when weconsider how critical is the role played by academic institutions in shaping individuals.
With regards to the second question, we believe that although hard data would have allowed us todraw reliable and generalizable inferences, the absence of self-reported data would have not made itpossible to identify the possible existence of denial among university students which we believe wouldhave been critical with regards to the value we expect any research should add.
Finally, we would like to add that even though the two studies differed in their findings of the reasonsfor which students go online, they concurred in revealing that there is an existence of Internet depen-dency among 3rd year students at Wits and that the Internet has an influence on their academic grades.The findings of the qualitative study have revealed that students, both ‘heavy’ and ‘light’ Internet usersperceive the Internet as a positive contributor to their academic performance and that there was no mutualrelationship found between extensive Internet usage and degrading academic performance. The results ofthe quantitative study have shown that ‘heavy’ Internet users performed academically worse than ‘light’Internet users and that ‘bad’ students were found to use the Internet a bit more than the rest. Howeverfor ‘bad’ students, increasing usage of the Internet was found to be slightly associated with increasingacademic grades which was not the case for other students. The latter finding reduces therefore the prob-ability of extensive Internet usage being the cause of poor academic performance, they may be associatedas suggested by previous findings mentioned earlier but other factors may be at the cause of extensiveInternet usage causing degrading academic performance.
5.3.4 Conclusion
The different comparisons we performed in this chapter allowed us to realize that the qualitative andquantitative studies we conducted agree that there is an existence of Internet dependency among univer-sity students and that the Internet exerts negative effects on students’ acdemic performance. However,we found a divergence of results when comparing the two studies around the reasons for which studentsuse the Internet on campus. The qualitative study reveal that academic work is the main reason for whichstudents go online on campus while the quantitative study reveals that students mostly use the Internetto engage in recreational activities when they are on campus. The reliability of the data we used in thequantitative study allowed us to deduce that students are in denial about their Internet usage habits oncampus. We found that 70% of our participants were in denial about the reasons for which they use theInternet on campus. This finding supports the existing critics around the unreliability of self-reporteddata which was strengthened by a side analysis we performed that revealed to us that 53% of the students
60
we classified as ‘light’ Internet users in the qualitative study were found to be ‘heavy’ Internet users inthe quantitative study. This chapter also allowed us to realize the importance of combining self-reporteddata with hard data when studying the effects of people’s behaviours on their productivity for only suchcombination can reveal phenomenon that no type of data on its own could have. The following chapterinvestigates evidence of a relationship between Internet usage and academic performance if we considerfactors such as academic discipline’s Internet requirements and students’ living arrangements.
61

Chapter 6
FURTHER ANALYSIS
6.1 Introduction
In this chapter of our research, we investigated if the Internet usage patterns were different among thedistinct academic courses involved in our study and if it could explain probable divergence in the overallacademic performance of an entire class. We also looked at whether students who live in universityresidences are more extensive Internet users than those who stay off campus because they have 24/7access to the Internet and if effects resulting from their Internet usage could be different from the rest.The results of the following investigations appear below.
6.2 Comparison of courses Internet usage and academic performance
Figure 6.1: Class academic average vs student average Internet usage for each course
To cater for difference in sample sizes among all surveyed courses, we decided to plot the yearlyaverage Internet usage of a student instead of the yearly average Internet usage of an entire class. As
62
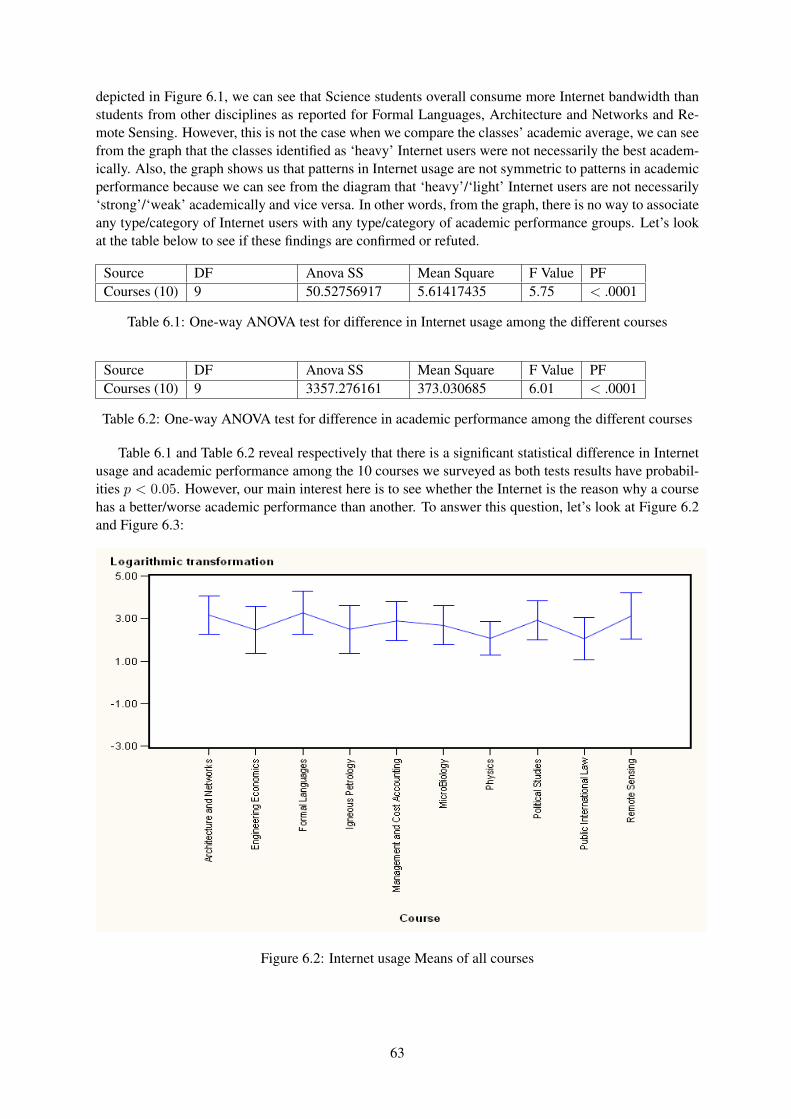
depicted in Figure 6.1, we can see that Science students overall consume more Internet bandwidth thanstudents from other disciplines as reported for Formal Languages, Architecture and Networks and Re-mote Sensing. However, this is not the case when we compare the classes’ academic average, we can seefrom the graph that the classes identified as ‘heavy’ Internet users were not necessarily the best academ-ically. Also, the graph shows us that patterns in Internet usage are not symmetric to patterns in academicperformance because we can see from the diagram that ‘heavy’/‘light’ Internet users are not necessarily‘strong’/‘weak’ academically and vice versa. In other words, from the graph, there is no way to associateany type/category of Internet users with any type/category of academic performance groups. Let’s lookat the table below to see if these findings are confirmed or refuted.
Source DF Anova SS Mean Square F Value PFCourses (10) 9 50.52756917 5.61417435 5.75 < .0001
Table 6.1: One-way ANOVA test for difference in Internet usage among the different courses
Source DF Anova SS Mean Square F Value PFCourses (10) 9 3357.276161 373.030685 6.01 < .0001
Table 6.2: One-way ANOVA test for difference in academic performance among the different courses
Table 6.1 and Table 6.2 reveal respectively that there is a significant statistical difference in Internetusage and academic performance among the 10 courses we surveyed as both tests results have probabil-ities p < 0.05. However, our main interest here is to see whether the Internet is the reason why a coursehas a better/worse academic performance than another. To answer this question, let’s look at Figure 6.2and Figure 6.3:
Figure 6.2: Internet usage Means of all courses
63

Figure 6.3: Class Academic Means of all courses
When looking at Figure 6.2 and Figure 6.3 simultaneously, we realise that the lines linking themeans do not follow the same pattern (please notice that the courses appear in alphabetical order inboth diagrams). Actually, we can go as far as to say that the lines do not follow any pattern at allwhen we compare the individual values we get for Internet usage and class academic average for eachcourse. Therefore, since we were not able to identify any pattern linking Internet usage to class academicperformance, we can say that there is no evidence to prove that Internet usage is the reason why a courseperforms better/worse academically than another. Appendix H shows for each course the main reasonfor which students go online.
6.3 Comparison of Internet usage and academic performance betweenstudents living on campus and the rest
Figure 6.4: Class academic average vs student average Internet usage for each category of students
64
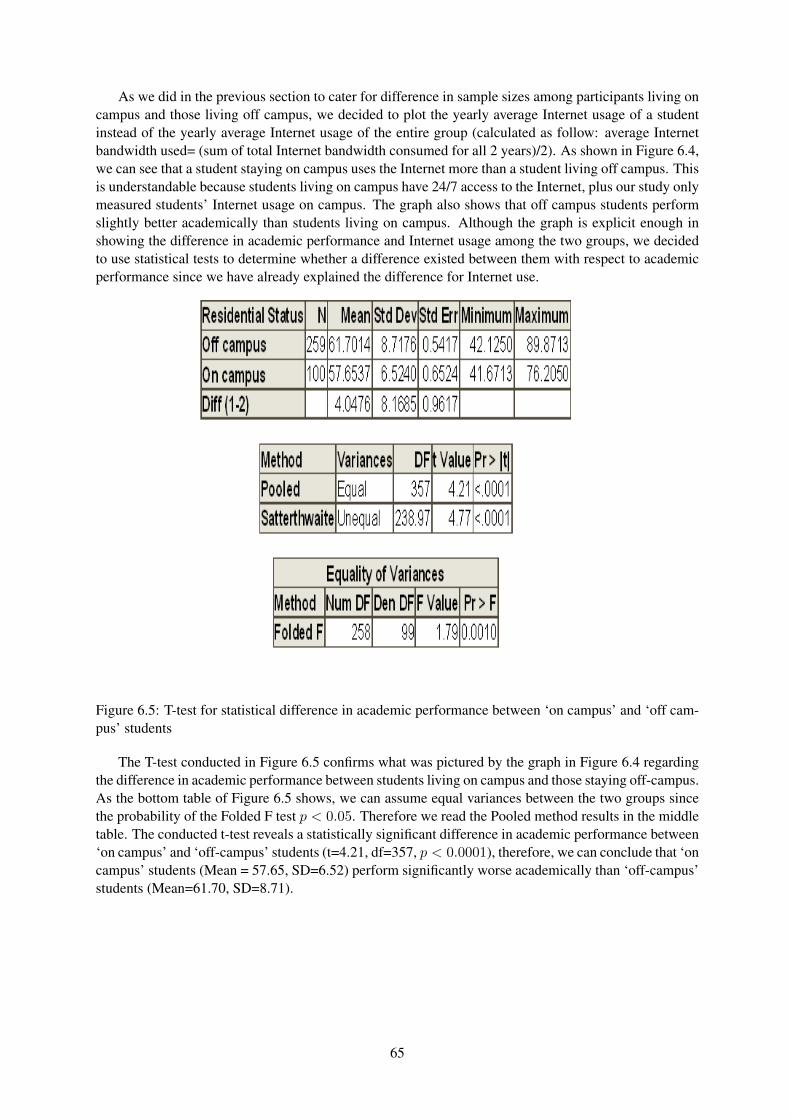
As we did in the previous section to cater for difference in sample sizes among participants living oncampus and those living off campus, we decided to plot the yearly average Internet usage of a studentinstead of the yearly average Internet usage of the entire group (calculated as follow: average Internetbandwidth used= (sum of total Internet bandwidth consumed for all 2 years)/2). As shown in Figure 6.4,we can see that a student staying on campus uses the Internet more than a student living off campus. Thisis understandable because students living on campus have 24/7 access to the Internet, plus our study onlymeasured students’ Internet usage on campus. The graph also shows that off campus students performslightly better academically than students living on campus. Although the graph is explicit enough inshowing the difference in academic performance and Internet usage among the two groups, we decidedto use statistical tests to determine whether a difference existed between them with respect to academicperformance since we have already explained the difference for Internet use.
Figure 6.5: T-test for statistical difference in academic performance between ‘on campus’ and ‘off cam-pus’ students
The T-test conducted in Figure 6.5 confirms what was pictured by the graph in Figure 6.4 regardingthe difference in academic performance between students living on campus and those staying off-campus.As the bottom table of Figure 6.5 shows, we can assume equal variances between the two groups sincethe probability of the Folded F test p < 0.05. Therefore we read the Pooled method results in the middletable. The conducted t-test reveals a statistically significant difference in academic performance between‘on campus’ and ‘off-campus’ students (t=4.21, df=357, p < 0.0001), therefore, we can conclude that ‘oncampus’ students (Mean = 57.65, SD=6.52) perform significantly worse academically than ‘off-campus’students (Mean=61.70, SD=8.71).
65
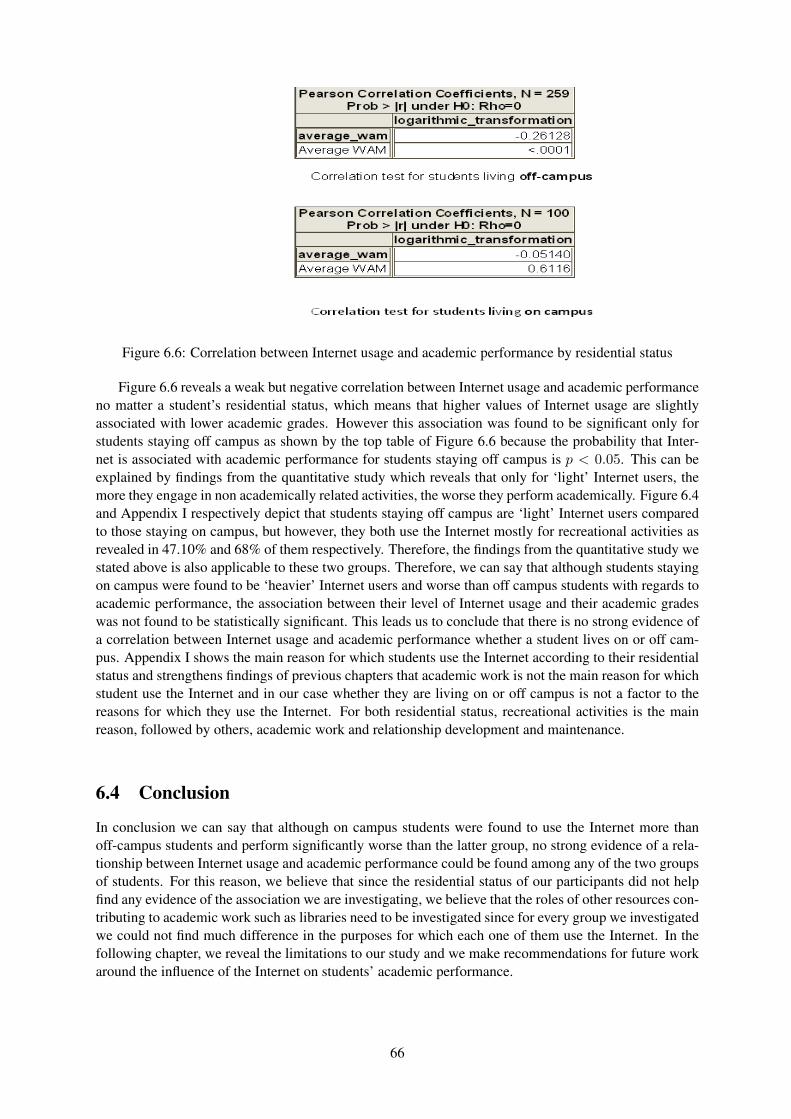
Figure 6.6: Correlation between Internet usage and academic performance by residential status
Figure 6.6 reveals a weak but negative correlation between Internet usage and academic performanceno matter a student’s residential status, which means that higher values of Internet usage are slightlyassociated with lower academic grades. However this association was found to be significant only forstudents staying off campus as shown by the top table of Figure 6.6 because the probability that Inter-net is associated with academic performance for students staying off campus is p < 0.05. This can beexplained by findings from the quantitative study which reveals that only for ‘light’ Internet users, themore they engage in non academically related activities, the worse they perform academically. Figure 6.4and Appendix I respectively depict that students staying off campus are ‘light’ Internet users comparedto those staying on campus, but however, they both use the Internet mostly for recreational activities asrevealed in 47.10% and 68% of them respectively. Therefore, the findings from the quantitative study westated above is also applicable to these two groups. Therefore, we can say that although students stayingon campus were found to be ‘heavier’ Internet users and worse than off campus students with regards toacademic performance, the association between their level of Internet usage and their academic gradeswas not found to be statistically significant. This leads us to conclude that there is no strong evidence ofa correlation between Internet usage and academic performance whether a student lives on or off cam-pus. Appendix I shows the main reason for which students use the Internet according to their residentialstatus and strengthens findings of previous chapters that academic work is not the main reason for whichstudent use the Internet and in our case whether they are living on or off campus is not a factor to thereasons for which they use the Internet. For both residential status, recreational activities is the mainreason, followed by others, academic work and relationship development and maintenance.
6.4 Conclusion
In conclusion we can say that although on campus students were found to use the Internet more thanoff-campus students and perform significantly worse than the latter group, no strong evidence of a rela-tionship between Internet usage and academic performance could be found among any of the two groupsof students. For this reason, we believe that since the residential status of our participants did not helpfind any evidence of the association we are investigating, we believe that the roles of other resources con-tributing to academic work such as libraries need to be investigated since for every group we investigatedwe could not find much difference in the purposes for which each one of them use the Internet. In thefollowing chapter, we reveal the limitations to our study and we make recommendations for future workaround the influence of the Internet on students’ academic performance.
66
Chapter 7
LIMITATIONS ANDRECOMMENDATIONS FOR STUDY
In this chapter of our document, we present aspects of our research that present limitations of our studyfor various reasons and we mention areas which fell out of the scope of our research that could serve asground for future work.
7.1 Limitations of the study
Firstly, we would like to mention that our sample size is relatively small when considering the numberof 3rd year students at Wits. Our sample population consisted of 389 students for the qualitative studyand 359 students for the quantitative study. This sample represents less than 10% of Wits university 3rdyear students population. We initially intended to have over 1000 students to participate to our study butunfortunately due to a lack of collaboration from a number of academic staff contacted, we were forcedto review our target down to the numbers mentioned above. We believe that a bigger sample could haveallowed for a more reliable generalization of the various findings we presented in our document.
Secondly, we believe that our classification of students’ Internet users as either ‘heavy’ or ‘light’suffered from the bias that only on campus Internet usage was considered in our study. This can beconsidered as a major argument for contesting the results of this classification because it is arguable that‘light’ on campus Internet users can be ‘heavy’ Internet users at home. While we acknowledge that thismay be a major drawback for our study, we would like to argue that even if it was possible to includehome Internet usage, the fact it would rely on self-reported data, therefore be unreliable advocates forthe necessity to solely rely on Internet usage on campus because it is quantitatively measurable and thusreliable.
Thirdly, our data suffered from a lack of consistency among our participants. Our study involvedSquid Proxy logs and yearly academic average for a 2 year time period (2009 to 2010). Unfortunately,we did not get 2 years worth of Squid Proxy logs for most of our participants (it is actually about 22months worth of logs because classes at Wits university usually start in February and end in Novemberwith holidays that may add up to about 1 month) nor did we get for all students, their course averagemark for every year, from 2009 to 2010. This respectively had an impact on our classification of studentsin the quantitative study as ‘heavy’ or ‘light’ Internet users and ‘good’, ‘average’ or ‘bad’ students. Webelieve that a better consistency in the data we received from AISU and CNS could have helped generatemore reliable findings.
7.2 Recommendations for future work
Among our recommendations for future work in this field, we firstly would like to suggest that in inves-tigating evidence of academic discipline influencing Internet usage, one could look at surveying students
67
enrolled in different courses and compare their Internet usage for each course. In our study, each one ofour participants coincidentally happened to be registered for only one course among all the courses wesurveyed. We believe that we were not able to find differences in Internet usage patterns among coursesbecause we looked at the behaviour of the entire classes. It is probable that studying Internet usagebehaviours for students enrolled in more than one course (each course belonging to a distinct academicdiscipline) could yield more significant results in investigating the difference in Internet needs and usageamong distinct academic disciplines.
Secondly, we would like to recommend that other academic learning mediums be investigated besidethe Internet. We found that the Internet is not mostly used for academic purposes rather for recreationalactivities. Moreover, the Internet was not found to be associated with any trend in academic performance,either ‘improving’ or ‘impaired’. This means that if the Internet does not make much of a difference instudents’ academic performance, perhaps students rely on other academic mediums such as libraries oruniversity online course material. We believe it would be beneficial to look at the role played by eachacademic learning medium in enhancing students’ academic performance. Also, other factors such asstudents’ socio-economic background could be investigated in looking at how the Internet influencesstudents’ academic performance. By investigating the socio-economic background factor, we believethat students who have access to a computer at home and the Internet are more likely to adopt thistechnology faster and perceive it as easy to use compared to students from less privileged backgroundswho would have lesser interactions opportunities with these technologies. Subsequently, if a studentperceives the Internet as easy to use, this will definitely have an impact on how much he/she uses it andfor what purposes. Therefore ‘light’ Internet users may be ‘light’ Internet users by using the Internet lessthan others because they do not perceive it as intuitive enough and this in return could be caused by howaffordable it is for them to interact with it or even a computer outside university.
Thirdly, we believe as mentioned in the first paragraph of this section that conclusions drawn fromgroup observations may distract us from what is experienced at an individual level. In our study, wecould not conclude whether the Internet can be associated with academic performance as no evidenceto support this argument was found for each group we studied. However, future studies could establishfocus group consisting of individuals who initally belonged to the groups we studied. For each individualin the focus groups, we could look at the difference in Internet usage patterns and academic grades yearafter year and see if there is any causality that could be derived should a relationship be found betweenInternet usage and academic performance. This way, it would be possible to tell for example if Internetusage was found to be increasing year after year and academic grades decreasing that extensive Internetusage may cause academic performance impairment. This could yield significant results because therecould be possibilities that for a ‘light’ Internet user observed, his/her Internet usage was increasing andhis/her grades decreasing. In other words, we recommend this approach because we believe that what istrue for a group may not be true for some individuals within this group.
In conclusion, we can say that despite the few limitations our study faces such as the relatively smallsample size of fewer than 400 3rd year students in a university that contains over 10 times more, theinconsistency in the size of the Squid proxy logs we received, we made a substantial contribution to ourdiscipline by our findings and also by using a mixed methodology approach that responds to the need formore reliable research instrument as expressed by the authors of the studies we reviewed in the literaturereview section of this document. Also, we believe that suggesting future work on this topic that wouldinvolve investigating the role played by other academic learning mediums such as libraries, universityportals and also using focus groups with a few individuals from our research sample could prove to befruitful in finding evidence of an association between Internet usage and academic performance amongstudents.
68
Chapter 8
CONCLUSION
Although the Internet has become a daily commodity in most people’s lives, its addictive-like featuresmake any individual who excessively uses it a potential victim of its negative effects. The negativeeffects of excessive Internet usage which have been addressed by most research we reviewed in thesecond chapter of this document range from: impaired sleeping patterns to social relationships breakups, job losses, mental and physical health problems and academic performance decrements.
Students, who represent the majority of the population of Internet users worldwide, are more exposedto the dangers related to excessive Internet usage because of the availability and easy accessibility theyhave to the Internet. This is the reason why we believe there needs to be more research into the roleof the Internet on campus and the negative effects associated to it because most of the problems wehave cited earlier are found in the student population. Most researchers in this domain have focused onother negative effects of excessive Internet usage on students rather than on its consequences on theiracademic performance. As some articles have mentioned, the main reason the Internet was brought oncampus was to enhance students’ academic performance, then this very aspect of students’ lives shouldbe the main focus of studies that investigate the influence the Internet has on students. Has the Internetallowed students to perform better academically? Is excessive Internet usage the reason why studentsperform badly? These are two questions among many others which one needs to ask because after overfifteen years on campus, whether the Internet is fulfilling its role without negative effects on students’academic performance remains a grey area.
The literature we reviewed allowed us not only to identify gaps in the domain of our research in termsof diversity of findings and arguments’ strengths but also in terms of validity of instruments. For instance,despite relying on students’ self-reported data, many authors have admitted that the reliability of theirfindings is affected by the high probability of students being in denial about their Internet surfing habits.This acknowledgement from these authors made us realize that a mixed research methodologies studycombining hard data and soft data analysis could yield more reliable results because of the possibility ofshedding light on whether the sole use of self-reported data in this field suffice to derive reliable findingswhich could be generalized to a wider population. We therefore formulated two research questions inthe research hypothesis section of this document that were both addressed by the two methodologies weused.
The conducted studies revealed that there is an existence of Internet dependency among universitystudents as they both identified a good number of our research participants to be using the Internet farmore than the average on campus Internet user. The results of the two studies led to the conclusion thatthe use of self-reported data or hard data is not enough to conclude whether there exists an associationbetween Internet usage and academic performance among university students; no positive or negative as-sociation between these two variables could be established by any of the studies we conducted. Although‘heavy’ Internet users were found to perform significantly worse academically than ‘light’ Internet users,no link of causality could be established between their intensive Internet usage and impaired academicperformance even though both studies concurred on the negative effects an abusive use of the Internethas on academic performance. All groups of students and Internet users we investigated were found to
69
use the Internet for recreational purposes mainly in spite of the difference in the proportions of usageof each purpose among all the groups. For example, although ‘heavy’ and ‘light’ Internet users use theInternet mainly for recreational activities, ‘light’ Internet users would use it for recreational purposessignificantly less than ‘heavy’ Internet users.
The further analysis we conducted in the sixth chapter of our study reveals that there is a possibilitythat other factors could influence students’ academic performance besides the Internet. These analysesrevealed that academic discipline was not a factor in how much students use the Internet nor was theirresidential status even though students staying on residences were found to use the Internet more thanstudents staying off campus and perform significantly worse academically than those staying off campus.The point could be made that the inability to measure off campus students usage of the Internet outsideuniversity hours could lead to an erroneous conclusion that students staying on campus are ‘heavier’Internet users and the subsequent inferences this could have on the influence their usage of the Internethas on their academic grades. Therefore other factors such as other resources available to students such aslibraries, university portal, socio-economic background need to be investigated because they may dictatefor the first two, what students rely on in terms of resources for their academic research and subsequentlyhow much of the Internet is needed in this regard. For the latter, available opportunities to use a computerand the Internet outside university hours can have an influence on the perceived ease of use of the Internet(as this perception comes with frequency of interactions in our opinion) which subsequently can dictatehow much of the Internet is used on campus.
Finally, the use of a mixed methodology in this research proved to be valuable because after trian-gulating the results of both studies, we were able to identify that 70% of our participants are in denialabout their Internet usage habits and the effects the Internet has on their academic performance. Sucha stunning finding would have never been possible if either methodology was used on its own. Our re-search reveals that self-reported data is unreliable because it differs completely from data recorded aboutthe same studied behaviour but also the sole use of hard data does not add any value to research in thefield our study belongs to. We believe that even though hard data on its own could have led us to morereliable and generalizable inferences, the triangulation of its inferences with results gathered from an-alyzing self-reported data allowed us to identify the existence of self-denial among university students.We believe that 70% is a big percentage and therefore, it should ring the alarm to university administra-tion with regards to the responsibilities it has to its students. Addressing this issue of self-denial amongstudents especially on an aspect that has a direct impact on their academic performance by providingsupport programmes to students who are willing to deal with this issue should be part of the mandateuniversities have to provide their students with quality education and a safe environment to learn and tobecome the best they ought to be.
70
References
[Anderson 2001] Keith J. Anderson. Internet use among college students: An exploratory study. Journalof American College Health, 50(1):21–26, 2001.
[Burton-Jones and Straub Jr. 2006] Andrew Burton-Jones and Detmar W. Straub Jr. Reconceptualizingsystem usage: An approach and empirical test. Information Systems Research, 17(3):228–246,2006.
[Chen and Peng 2008] Ying-Fang Chen and Samuel S. Peng. University students’ internet use and itsrelationships with academic performance, interpersonal relationships, psychosocial adjustment,and self-evaluation. CyberPsychology & Behavior, 11(4), 2008.
[Cheung and Huang 2005] Waiman Cheung and Wayne Huang. Proposing a framework to assess inter-net usage in university education: an empirical investigation from a student’s perspective. BritishJournal of Educational Technology, 36(2):237–253, 2005.
[Choi et al. 2009] Kwisook Choi, Hyunsook Son, Myunghee Park, Jinkyu Han, Kitai Kim, ByungkooLee, and Hyesun Gwak. Internet overuse and excessive daytime sleepiness in adolescents. Psy-chiatry and Clinical Neurosciences, 63:455–462, 2009.
[Chou and Hsiao 2000] Chien Chou and Ming-Chun Hsiao. Internet addiction, usage, gratification, andpleasure experience: the Taiwan college students’ case. Computers & Education, 35(1):65–80,August 2000.
[Chou 2001] Chien Chou. Internet heavy use and addiction among Taiwanese college students: Anonline interview study. CyberPsychology & Behavior, 4(5):573–585, 2001.
[Davis 1989] Fred D. Davis. Perceived usefulness, perceived ease of use, and user acceptance of infor-mation technology. MIS Quarterly, 13:319–340, 1989.
[Devaraj and Kohli 2003] Sarv Devaraj and Rajiv Kohli. Performance impacts of information technol-ogy: Is actual usage the missing link? Management Science, 49(3):273–289, 2003.
[Fortson et al. 2007] Beverly L. Fortson, Joseph R. Scotti, Yi-Chuen Chen, Judith Malone, and Kevin S.Del Ben. Internet use, abuse, and dependence among students at a southeastern regional university.Journal of American College Health, 56(2):137–144, 2007.
[Gelderman 1998] Maarten Gelderman. The relation between user satisfaction, usage of informationsystems and performance. Information & Management, 34:11–18, 1998.
[Gross 2004] E.F Gross. Adolescent internet use: what we expect, what teens report. Applied Develop-mental Psychology, 25:633–649, 2004.
[Hazelhurst et al. 2011] Scott Hazelhurst, Yestin Johnson, and Ian Sanders. An empirical analysis ofthe relationship between web usage and academic performance in undergraduate students. Pro-ceedings of the Annual Conference of the South African Computer Lecturer’s Association, pages29–37, July 2011.
71
[Igbaria and Tan 1997] Magrid Igbaria and Margaret Tan. The consequences of information technol-ogy acceptance on subsequent individual performance. Information & Management, 32:113–121,1997.
[Johnson 2009] Yestin Johnson. The effects of Internet Usage on Educational Performance. ResearchReport, The University of The Witwatersrand, 2009.
[Jones 2002] Steve Jones. The Internet Goes to College: How students are living in the future withtoday’s technology. Research Report, Pew Research Center, 2002.
[Judd and Kennedy 2010] Terry Judd and Gregor Kennedy. A five-year study of on-campus internet useby undergraduate biomedical students. Computers & Education, 55:1564–1571, 2010.
[Kandell 1998] Jonathan J. Kandell. Internet addiction on campus: The vulnerability of college students.CyberPsychology & Behavior, 1(1):11–17, 1998.
[Kirschner and Karpinski 2010] Paul A Kirschner and Aryn Karpinski. Running head: Facebook andacademic performance. Computers in Human Behavior, 26:1237–1245, 2010.
[Ko et al. 2009] Chih-Hung Ko, Ju-Yu Yen, Sue-Hei Chen, Ming-Jen Yang, Huang-Chi Lin, and Cheng-Fang Yen. Proposed diagnostic criteria and the screening and diagnosing tool of internet addictionin college students. Comprehensive Psychiatry, 50:378–384, 2009.
[Kubey et al. 2001] Robert W. Kubey, Michael J. Lavin, and R. Barrows. Internet use and collegiateacademic performance decrements: Early findings. Journal Of Communication, 51(2):366–382,2001.
[Lubans 1999] John Lubans. Key Findings on Internet Use among Students, May 1999. Retrieved May,3rd 2010, from http://www.lubans.org/docs/key/key.html
[Metzger et al. 2003] Miriam J. Metzger, Andrew J. Flanagin, and Lara Zwarun. College students webuse, perceptions of information credibility, and verification behavior. Computers & Education,41:271–290, 2003.
[Morahan-Martin and Schumacher 2000] J. Morahan-Martin and P. Schumacher. Incidence and cor-relates of pathological internet use among college students. Computers in Human Behavior,16(1):13–29, 2000.
[Morahan-Martin and Schumacher 2001] J. Morahan-Martin and P. Schumacher. Gender, internet andcomputer attitudes and experiences. Computers in Human Behavior, 17(1):95–110, 2001.
[Myers et al. 2010] Jerome L. Myers, Arnold D. Well, and JR Lorch, Robert F. Research Design andStatistical Analysis. Routledge, third edition, 2010.
[Ni et al. 2009] Xiaoli Ni, Hong Yan, Silu Chen, and Zhengwen Liu. Factors influencing internet addic-tion in a sample of freshmen university students in China. CyberPsychology & Behavior, 12(3),2009.
[Odell et al. 2000] Patricia M. Odell, Kathleen O. Korgen, Phyllis Schumacher, and Michael Delucchi.Internet use among female and male college students. CyberPsychology & Behavior, 3(5):855–862, 2000.
[Ogedebe 2010] Peter M. Ogedebe. The relationship between academic performance and internet ser-vices in tertiary institutions: A case study of the University of Maiduguri, Nigeria. Journal ofMathematics and Technology, 3, 2010.
72
[Perry et al. 1998] Timothy T. Perry, Leslie Anne Perry, and Karen Hosack-Curlin. Internet use byuniversity students: an interdisciplinary study on three campuses. Internet Research: ElectronicNetworking Applications and Policy, 8(2):136–141, 1998.
[Pierce and Vaca 2008] Tamyra A. Pierce and Roberto Vaca. Distracted: Academic performance differ-ences between teen users and non-users of MySpace and other communication technology. Journalof Systemics, 6(3):67–71, 2008.
[Rumbough 2001] Timothy B. Rumbough. Controversial Uses of the Internet by College Students. Tech-nical Report, Bloomsburg University of Pennsylvania, 2001.
[Scherer 1997] K. Scherer. College life online: Healthy and unhealthy internet use. Journal of CollegeStudent Development, 38(6):655–665, 1997.
[Suhail and Bargees 2006] Kausar Suhail and Zobia Bargees. Effects of excessive internet use on un-dergraduate students in Pakistan. CyberPsychology & Behavior, 9(3):297–307, 2006.
[World Internet Users and Population Stats 2011] World Internet Users and Population Stats. InternetUsage Statistics: the Internet big picture, 2011. Retrieved May 3rd 2011, from http://www.
internetworldstats.com/stats.htm
[Young 1996] Kimberly S. Young. Internet addiction: The emergence of a new clinical disorder. Cy-berPsychology & Behavior, 1(3):237–244, 1996.
73

Appendix A
Participant Information Sheet
Please Note: This survey is only to be completed by students who studied at Wits between 2009 and 2010.
Good day,
My name is NGOUMANDJOKA Unnel-Teddy and I am a second year Masters student in the schoolof computer science at Wits University.
Following the belief that the Internet has an influence on students’ academic performance, I decidedto study evidence of this influence being positive or negative by investigating the potential existence ofan association between extensive Internet usage and poor academic performance among varsity students.
I will be comparing what you have to say about your Internet usage with what the university recordsabout it. Besides looking at your Internet usage records, I will also be looking at your academic perfor-mance in the years 2009 and 2010. I will be using both your academic performance data and Internetusage records for the period mentioned to determine whether extensive Internet usage can be associatedwith poor academic performance. In addition should we find a positive association between extensiveInternet usage and poor academic performance, Wits University could develop some kind of supportprograms for students who want to deal with this issue.
Your participation is voluntary and should you wish to participate in this study may you please beadvised that your information will be kept confidential. The random unique number that appears on yourquestionnaire ensures the confidentiality of the information you will provide us. However, you will haveto indicate to us your student number along with your questionnaire random number so that we couldretrieve your performance data along with your surfing records from the relevant university departments.Once we collect those, your student number will be replaced by the unique random number appearingon your questionnaire so that when we link your surfing records, to your survey answers and to youracademic performance, your identity will remain unknown for the rest of the study. The university willkeep the sheet on which you will have provided your student number and your unique random number.
My study involves participants from different academic courses and who are in their 3rd year ofstudy because they would have spent the previous two academic years at Wits University, which is thetime period I chose to test my research hypothesis. As you can therefore see, your class was randomlyselected so were any of your classmates for that matter.
I will be more than happy to email my findings to you on your request once my study will be com-pleted.
Thank you for your participation.
74
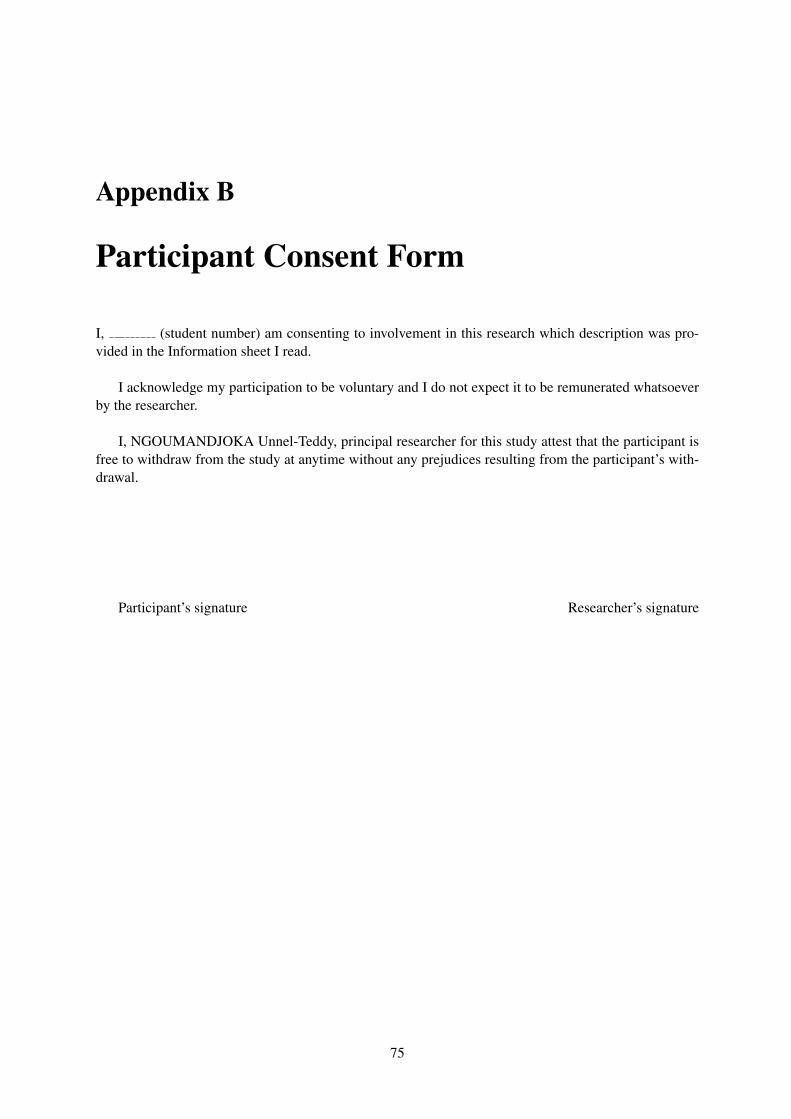
Appendix B
Participant Consent Form
I, (student number) am consenting to involvement in this research which description was pro-vided in the Information sheet I read.
I acknowledge my participation to be voluntary and I do not expect it to be remunerated whatsoeverby the researcher.
I, NGOUMANDJOKA Unnel-Teddy, principal researcher for this study attest that the participant isfree to withdraw from the study at anytime without any prejudices resulting from the participant’s with-drawal.
Participant’s signature Researcher’s signature
75
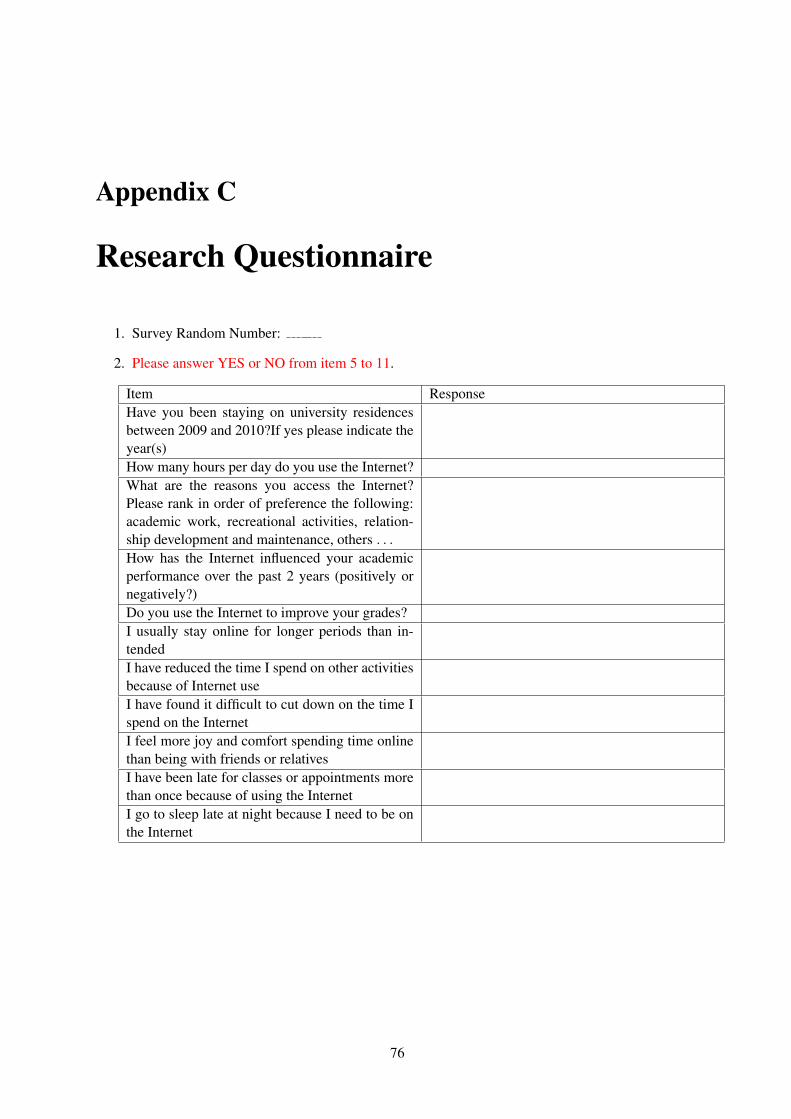
Appendix C
Research Questionnaire
1. Survey Random Number:
2. Please answer YES or NO from item 5 to 11.
Item ResponseHave you been staying on university residencesbetween 2009 and 2010?If yes please indicate theyear(s)How many hours per day do you use the Internet?What are the reasons you access the Internet?Please rank in order of preference the following:academic work, recreational activities, relation-ship development and maintenance, others . . .How has the Internet influenced your academicperformance over the past 2 years (positively ornegatively?)Do you use the Internet to improve your grades?I usually stay online for longer periods than in-tendedI have reduced the time I spend on other activitiesbecause of Internet useI have found it difficult to cut down on the time Ispend on the InternetI feel more joy and comfort spending time onlinethan being with friends or relativesI have been late for classes or appointments morethan once because of using the InternetI go to sleep late at night because I need to be onthe Internet
76
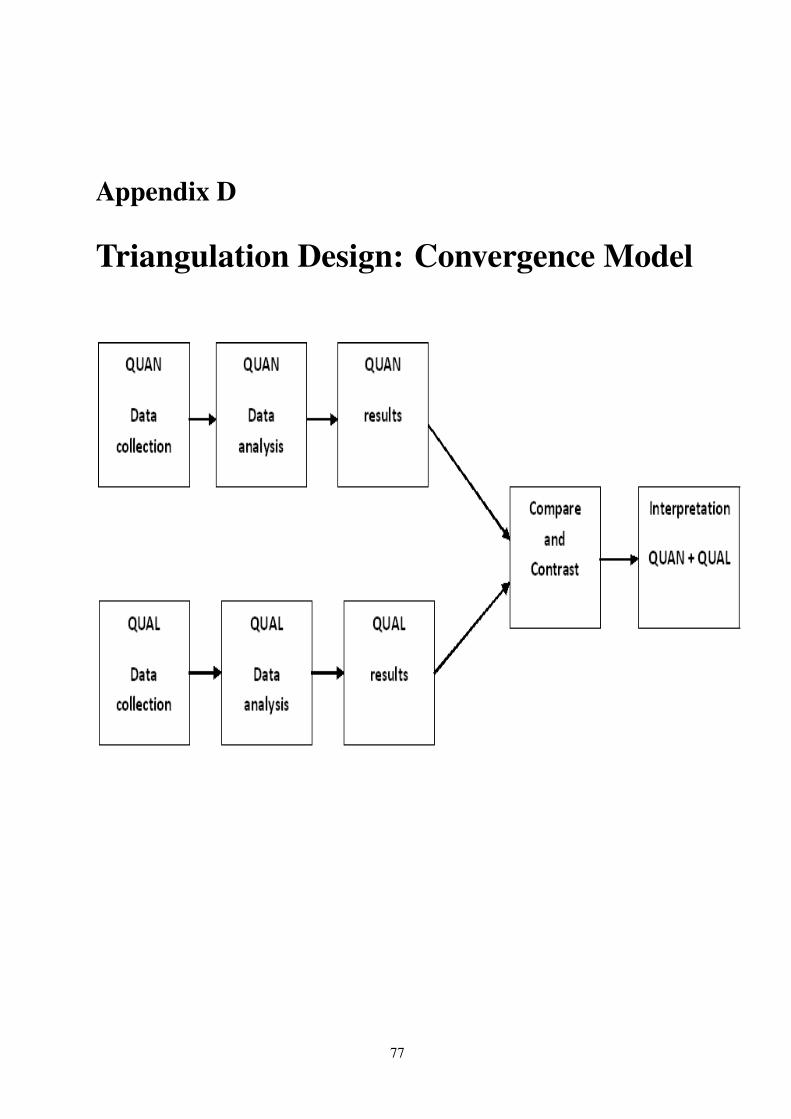
Appendix D
Triangulation Design: Convergence Model
77
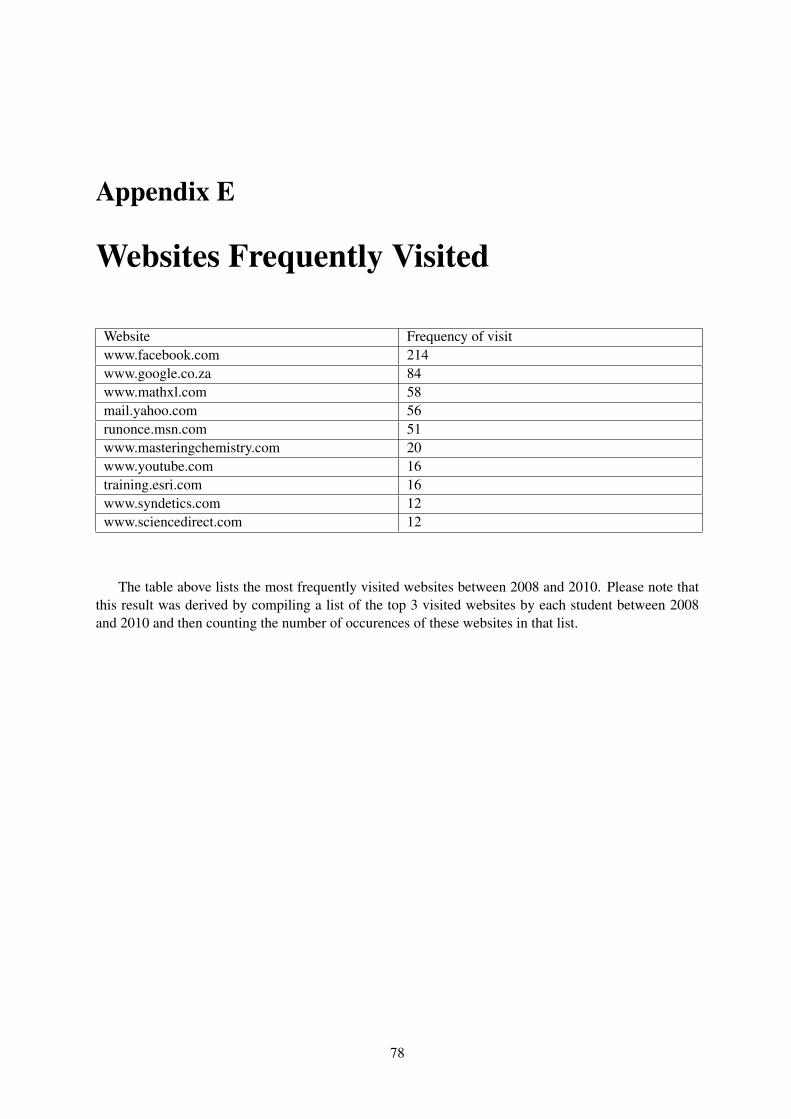
Appendix E
Websites Frequently Visited
Website Frequency of visitwww.facebook.com 214www.google.co.za 84www.mathxl.com 58mail.yahoo.com 56runonce.msn.com 51www.masteringchemistry.com 20www.youtube.com 16training.esri.com 16www.syndetics.com 12www.sciencedirect.com 12
The table above lists the most frequently visited websites between 2008 and 2010. Please note thatthis result was derived by compiling a list of the top 3 visited websites by each student between 2008and 2010 and then counting the number of occurences of these websites in that list.
78

Appendix F
Proportion of ‘heavy’ and ‘light’ Internetusers by categories of students
79

Appendix G
Proportion of ‘good’,‘average’ and ‘bad’students with academic work being firstpurpose
80
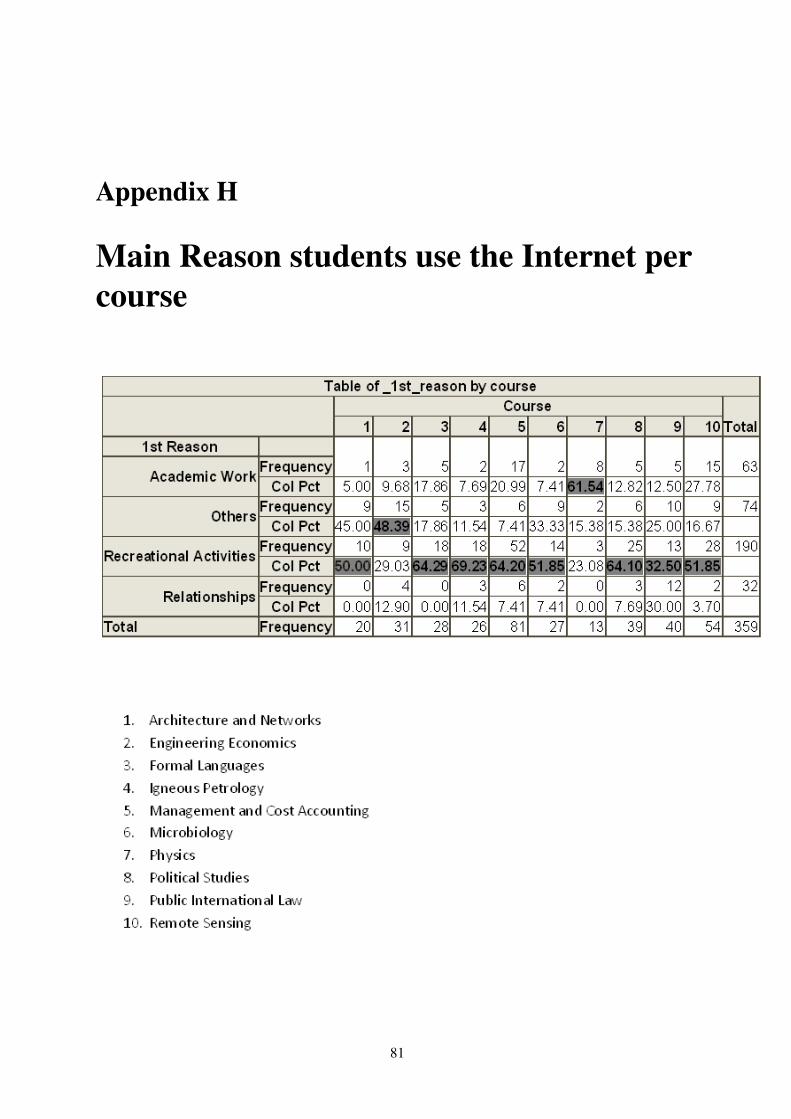
Appendix H
Main Reason students use the Internet percourse
81

Appendix I
Main reason students use the Internet perresidential status
82