Travail conjoint entre un intervenant extérieur scientifique, un professeur des écoles et ses élèves
Upload
independentCategory
view
1download
0
www.elsevier.com/locate/foodqual
Food Quality and Preference 16 (2005) 369–382
Sensory benefits, emotions and usage patterns for olives:using Internet-based conjoint analysis and segmentation
to understand patterns of response
Howard Moskowitz a,*, Matthias Silcher a, Jacqueline Beckley b,Dorothy Minkus-McKenna c,*, Teri Mascuch d
a Moskowitz Jacobs Inc., 1025 Westchester Ave., White Plains, NY 10604, USAb The Understanding & Insight Group, 3 Rosewood Lane, Suite 103, Denville, NJ 07834, USA
c Berkeley College, 3 East 43rd Street, New York, NY 10017, USAd McCormick and Company, 204 Wight Avenue, Hunt Valley, MD 21031, USA
Received 12 June 2002; revised 28 January 2004; accepted 28 January 2004
Available online 10 August 2004
Abstract
Conjoint analysis was used in an Internet-enabled format in order to understand the drivers of interest at the concept level for olives,
a common but not well-researched snack food. The study comprised 36 descriptive phrases covering sensory properties, uses, product
origins and emotions. The utility values revealed differences in interest level when respondents rated the test concepts on an intensity of
craving scale. Although there were some differences in response pattern due to other variables such as hunger, the concept–response
segmentation showed the largest differences, and provides an analytic strategy to uncover groups of individuals with interest in main-
stream or more narrow food categories who demonstrate heightened response to specific messages and product features.
� 2004 Elsevier Ltd. All rights reserved.
Keywords: Choice; Consumer motivation; Product attributes; Conjoint; Snack foods; Olives
1. Introduction
American consumers are spending an increased
amount of money on snack foods, 1 according to US
0950-3293/$ - see front matter � 2004 Elsevier Ltd. All rights reserved.
doi:10.1016/j.foodqual.2004.01.003
* Corresponding authors. Tel.: +1 914 421 7400; fax: +1 914 428
8364.
E-mail addresses: [email protected] (H. Moskowitz), dmm@
berkeleycollege.edu, [email protected] (D. Minkus-McKenna).1 The term ‘‘snack’’ is difficult to define as all eating patterns are
based on culture. According to Oltersdorf et al. ‘‘To date, there is no
general accruement on definitions to categorize the different eating
occasions, like meal or snack.’’ (p. 4). Webster�s Dictionary defines
snack as ‘‘a light meal: food eaten between meals.’’ The Snack Food
Association membership includes, but is not limited to, manufacturers
of potato chips, tortilla chips, cereal snacks, pretzels, popcorn, cheese
snacks, snack crackers, meat snacks, pork rinds, snack nuts, party mix,
corn snacks, pellet snacks, fruit snacks, snack bars, granola, snack
cakes, cookies and various other snacks (www.sfa.org).
Market Trends and Forecasts (deJong, 1999). Snackingfoods overall is a $40 billion a year market (Mintel
International Group Ltd., 2003a). This trend is relevant
to health and wellness because in many cases consump-
tion of snack foods is driven by factors other than basic
nutritional needs. Two words that continue to emerge
regarding snack foods are �want� or �desire�. The desire
by consumers for a particular snack food can be de-
scribed by them as a craving. The exact attributes of thisterm are elusive. A simple, universally accepted defini-
tion of craveability does not exist. According to Web-
ster�s Dictionary, crave is defined as ‘‘to want greatly
or to yearn for’’, and is a word used to describe non-clin-
ical, highly desired foods. Pelchat and Schaefer (2000)
use ‘‘an intense desire or longing to eat a particular
food’’ and note that food cravings are considered to
be highly ‘‘salient psychological phenomena.’’ This
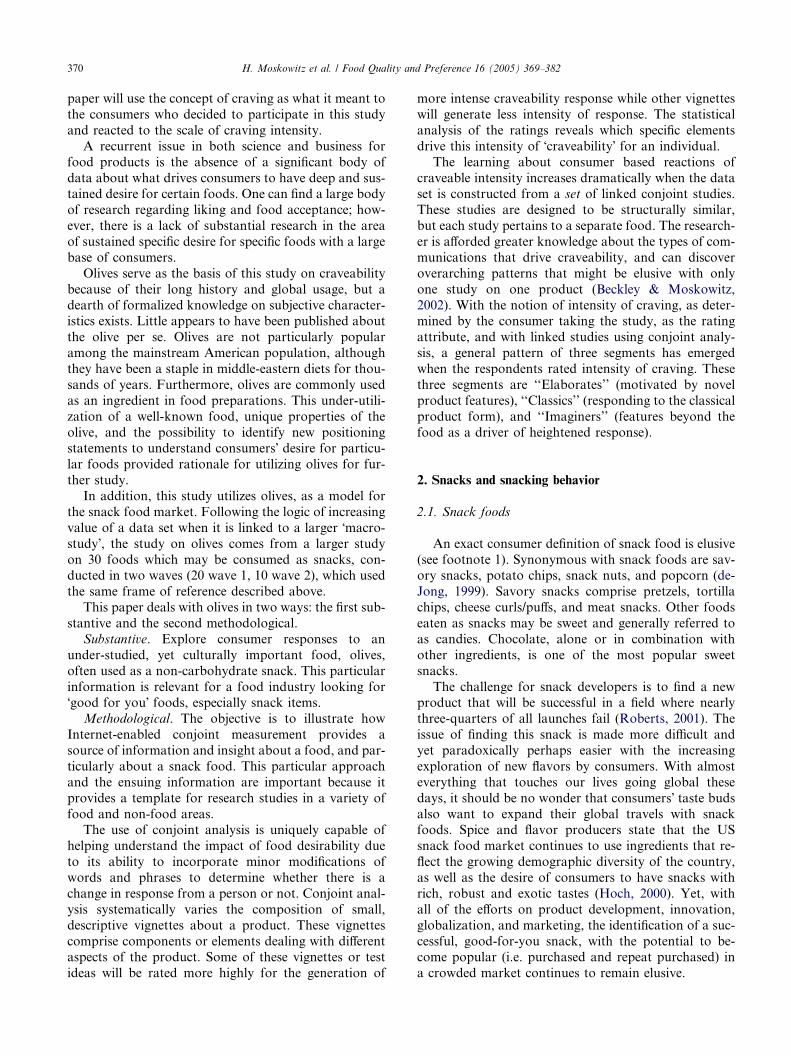
370 H. Moskowitz et al. / Food Quality and Preference 16 (2005) 369–382
paper will use the concept of craving as what it meant to
the consumers who decided to participate in this study
and reacted to the scale of craving intensity.
A recurrent issue in both science and business for
food products is the absence of a significant body of
data about what drives consumers to have deep and sus-tained desire for certain foods. One can find a large body
of research regarding liking and food acceptance; how-
ever, there is a lack of substantial research in the area
of sustained specific desire for specific foods with a large
base of consumers.
Olives serve as the basis of this study on craveability
because of their long history and global usage, but a
dearth of formalized knowledge on subjective character-istics exists. Little appears to have been published about
the olive per se. Olives are not particularly popular
among the mainstream American population, although
they have been a staple in middle-eastern diets for thou-
sands of years. Furthermore, olives are commonly used
as an ingredient in food preparations. This under-utili-
zation of a well-known food, unique properties of the
olive, and the possibility to identify new positioningstatements to understand consumers� desire for particu-
lar foods provided rationale for utilizing olives for fur-
ther study.
In addition, this study utilizes olives, as a model for
the snack food market. Following the logic of increasing
value of a data set when it is linked to a larger �macro-
study�, the study on olives comes from a larger study
on 30 foods which may be consumed as snacks, con-ducted in two waves (20 wave 1, 10 wave 2), which used
the same frame of reference described above.
This paper deals with olives in two ways: the first sub-
stantive and the second methodological.
Substantive. Explore consumer responses to an
under-studied, yet culturally important food, olives,
often used as a non-carbohydrate snack. This particular
information is relevant for a food industry looking for�good for you� foods, especially snack items.
Methodological. The objective is to illustrate how
Internet-enabled conjoint measurement provides a
source of information and insight about a food, and par-
ticularly about a snack food. This particular approach
and the ensuing information are important because it
provides a template for research studies in a variety of
food and non-food areas.The use of conjoint analysis is uniquely capable of
helping understand the impact of food desirability due
to its ability to incorporate minor modifications of
words and phrases to determine whether there is a
change in response from a person or not. Conjoint anal-
ysis systematically varies the composition of small,
descriptive vignettes about a product. These vignettes
comprise components or elements dealing with differentaspects of the product. Some of these vignettes or test
ideas will be rated more highly for the generation of
more intense craveability response while other vignettes
will generate less intensity of response. The statistical
analysis of the ratings reveals which specific elements
drive this intensity of �craveability� for an individual.
The learning about consumer based reactions of
craveable intensity increases dramatically when the dataset is constructed from a set of linked conjoint studies.
These studies are designed to be structurally similar,
but each study pertains to a separate food. The research-
er is afforded greater knowledge about the types of com-
munications that drive craveability, and can discover
overarching patterns that might be elusive with only
one study on one product (Beckley & Moskowitz,
2002). With the notion of intensity of craving, as deter-mined by the consumer taking the study, as the rating
attribute, and with linked studies using conjoint analy-
sis, a general pattern of three segments has emerged
when the respondents rated intensity of craving. These
three segments are ‘‘Elaborates’’ (motivated by novel
product features), ‘‘Classics’’ (responding to the classical
product form), and ‘‘Imaginers’’ (features beyond the
food as a driver of heightened response).
2. Snacks and snacking behavior
2.1. Snack foods
An exact consumer definition of snack food is elusive
(see footnote 1). Synonymous with snack foods are sav-ory snacks, potato chips, snack nuts, and popcorn (de-
Jong, 1999). Savory snacks comprise pretzels, tortilla
chips, cheese curls/puffs, and meat snacks. Other foods
eaten as snacks may be sweet and generally referred to
as candies. Chocolate, alone or in combination with
other ingredients, is one of the most popular sweet
snacks.
The challenge for snack developers is to find a newproduct that will be successful in a field where nearly
three-quarters of all launches fail (Roberts, 2001). The
issue of finding this snack is made more difficult and
yet paradoxically perhaps easier with the increasing
exploration of new flavors by consumers. With almost
everything that touches our lives going global these
days, it should be no wonder that consumers� taste budsalso want to expand their global travels with snackfoods. Spice and flavor producers state that the US
snack food market continues to use ingredients that re-
flect the growing demographic diversity of the country,
as well as the desire of consumers to have snacks with
rich, robust and exotic tastes (Hoch, 2000). Yet, with
all of the efforts on product development, innovation,
globalization, and marketing, the identification of a suc-
cessful, good-for-you snack, with the potential to be-come popular (i.e. purchased and repeat purchased) in
a crowded market continues to remain elusive.

H. Moskowitz et al. / Food Quality and Preference 16 (2005) 369–382 371
2.2. Snacking behavior and health issues
One rationale for the consumption of snacks is that
adults and especially young children need to eat snacks
because it is difficult to obtain enough energy and nutri-
ents in the three main meals. In general, a snack shouldbe consumed in small amounts at frequent intervals.
Mid-morning, mid-afternoon (especially after school
for older children) and after-dinner snacks can become
part of a daily routine. Carefully planned, nutritious
snack foods should make a valuable contribution to
the daily nutrient and energy intake. A snack should
not take the place of a meal, 2 but can be used as a
�mini-meal� that supplies protein, vitamins, mineralsand energy (Baker & Henry, 1987).
The foregoing, however, is an �idealized� descriptionof snacks. It is not the way reality is, however. The qual-
ity and quantity of snacks in individuals� diet can con-
tribute to a number of health problems, such as
obesity when they become part of the cycle of height-
ened energy consumption. Over 300,000 deaths each
year in the United States are related to obesity. Ameri-cans consume 4.72 billion pounds of snack foods a year
(Abersold, 1998). In a 1994 nutritional survey of snack-
ing patterns among 1800 adults and children, the Amer-
ican Dietetic Association found that all age groups
snacked primarily at one time during the day. Asked
the top reasons for choosing a snack, the top response
was taste, followed by health or nutrition. The most
popular and typical snacks include soft drinks, potatoand corn chips, cookies, candy bars, and ice cream
(Cross, Babicz, & Cushman, 1994; Sullivan et al., 2002).
Growth of healthier snacks has been driven by the
natural chip/popcorn/pretzel segment; yet the most
growth was in the smallest category––energy and snack
bars (Mintel International Group Limited, 2003b).
Healthy snacks and the search for items that can become
exemplars, thus take on increased importance in light ofnational health awareness regarding issues like obesity.
From 1998 to 2003, healthy snacking in the US has
established a steady growth pattern, influenced greatly
by diet trends and an increased awareness of incidence
of overweight and obesity issues. Ramona Bennett, mar-
keting manager with Cargill Salt concludes, ‘‘The thing
we are seeing and will continue to see is more variety
with regards to organic and natural snacks. GMO-freeand healthiness is going to be a major concern. The rea-
son is that 50–55% of Americans are overweight’’ (Ro-
berts, 2001).
2 In Oltersdorf et al. (p. 4), the criteria for a meal consists of time of
consumptions (eating events in the morning, at midday and in the
evening); energy content (consumption of more than 375 kcal); social
interaction (presence of fellow eaters); food quantity (more than a
single food); and energy content (Oltersdorf, Schlettwein-Gsell, &
Winkler, 1999).
As Americans have become more interested in taking
control of their health and as obesity in the United
States has reached near epidemic levels, the Food Indus-
try has made health and nutrition a major part of its
growth strategy. This focus continues to be reaffirmed
by corporations in the popular press, but is often chal-lenged by researchers and dietary specialists. For exam-
ple, PepsiCo Chief Executive Officer Steve Reinemund
says that as a food and beverage company PepsiCo
has a �responsibility to offer nutritional guidance to con-
sumers�. Marion Nestle, chairwoman of New York Uni-
versity�s Department of Nutrition and Food Studies, is
skeptical about these types of motivations and corporate
policies directed by those motivations. ‘‘The argumentthat all foods can be part of a healthy diet is the favorite
argument of the food industry,’’ Nestle says. She sees
low fat alternatives of regular snacks as just a way to sell
more food. ‘‘It�s still junk food,’’ she says (Klingbeil,
2003).
2.3. Understanding consumer responses to foods through
a large-scale �Foundation Study�
One strategy to identify the features of a good-for-
you snack food is to survey responses to concepts about
many different foods, as well as asking consumers about
the occasions when they eat the food. Rather than deter-
mining the food as a snack food ahead of time, one can
identify when consumers eat different foods, and thereby
understand more fully the types of foods eaten duringsnack occasions as compared to meal occasions. Fur-
thermore, if the same study deals with different aspects
of the food, then it becomes possible to identify the fea-
tures of the food that drive this type of usage occasion.
This �two-pronged� approach, working with appropri-
ateness of a food for various occasions and intensity
of desire (craving) for the food at the level of �concept�may help to identify the most compelling attributes fornew good-for-you snacks. This approach of working
with appropriateness and then relevant communications
extends the pioneering work of Schutz (Schutz & Mar-
tens, 2001) on appropriateness as a key dimension for
foods.
A �Foundation Study� merges questionnaires about
one�s interaction with products or ideas with responses
to communications about the same products or ideas(Beckley & Moskowitz, 2002). The Crave It! Founda-
tion Study, from which the olive data are taken,
comprises studies using conjoint measurement (Green,
Carroll, & Goldberg, 1981). The underlying ration-
ale for Foundation Studies is to create an inte-
grated database, in which results from one study
could illuminate results from another, and wherein
trends across categories might emerge. Such integratedstudies enable the researcher and the marketer to
understand the individual food in detail, and the food

372 H. Moskowitz et al. / Food Quality and Preference 16 (2005) 369–382
in relation to the performance of other foods. The ele-
ments studied in the conjoint analysis deal with product
features, emotional benefits, origin, product use, etc.
The larger study comprised a set of 30 different, but
linked studies, all having the same structure for
the stimuli (conjoint measurement), and all havingthe same classification questionnaire. This foundation
study, specifically the study dealing with olives, may
provide insights about a potential good-for-you, health-
ful snack.
2.4. Olives
Olives, biologically classified as a fruit, have been cul-tivated for over 5000 years. Approximately 10% of olive
production is for consumption with the remaining 90%
converted into olive oil. Depending on the processing
method, olives are identified as black olives, or green
olives, also referred to as Spanish olives.
In the United States, olives are primarily sold in cans
or jars in the condiment section of grocery stores. In eth-
nic neighborhoods and delis, olives are sold in bulk ineither the black or green variety, and prepared with
various flavorings. Given the ethnic heritage, the growth
of snacks in the United States, and the endless search
for new food products, a rationale for further explora-
tion of attitudes towards olives as a snack food by the
general consumer exists. Olives can be used as is
(straight from the can or jar) or as an ingredient in rec-
ipes. If used as is, then olives may be eaten as a snackfood and thus fall into the category of a snack food that
might conceivably be �craved�, at least as describe in
Section 1.
3. Method
3.1. Conjoint analysis
Conjoint analysis typifies an approach that goes be-
yond conventional questionnaires to understand the
consumer�s response to concepts, and to identify �driversof behavior� (Green et al., 1981; Moskowitz, 1994,
Chap. 1; Moskowitz & Martin, 1993; Wittnk & Cattin,
1989). The conjoint analysis approach can be described
as �stimulus–response�. The stimuli or the raw materialfor a conjoint measurement study comprise single,
stand-alone elements. These elements or phrases are
combined with other phrases to form a concept. The
combination uses principles of experimental design
(Box, Hunter, & Hunter, 1978), which ensures that these
elements appear statistically independently, albeit in the
body of a test concept. The specific stimuli comprised
36 elements. The elements for olives and their ration-ale in the Crave It!� Foundation Study appears in
Appendix A.
The elements were created by a team of research pro-
fessionals with extensive knowledge in the areas of psy-
chology, food product testing, concept development,
and general consumer communications, respectively. A
pilot study was developed to understand the appropriate
structure of the phrase and the categories. With resultsfrom the pilot (and over 300 consumer responses), the
Crave It! categories were created. The general phrases
developed in the pilot study were then customized for
each specific category (Olives being one of the catego-
ries). The phrases were developed from words and ideas
used by manufacturers of the products, off of websites,
in the popular media, from journals and other scholarly
publications, and using terms that the general publicassociates with food.
3.2. Experimental design
The basic experimental design comprised 60 combi-
nations, with 2–4 elements in each combination or vign-
ette describing the olive. The experimental design
structure was permuted in order to create 20 differentvariations. By permuting the design structure, but keep-
ing the design structure itself unchanged, the researcher
ensures that no single combination of concept elements
could ever dramatically influence the results. Each
respondent evaluated the 60 elements in the design in
a unique randomized order, which further eliminated
the possibility of order bias.
The respondent rated the concepts on a single attri-bute scale, anchored at both ends. The question read
�How intense is your craving for this olive?; 1 = Not
craveable at all, 9 = Very intense�. The scale was presentat the bottom of each concept. The respondent read the
concept, and rated the concept by clicking on the appro-
priate scale button which was identified with a numerical
value from 1 to 9.
After completing the evaluation of the 60 systemati-cally varied concepts, all rated by all consumers against
the intensity of craving scale, the respondent completed
a classification questionnaire, dealing with geo-demo-
graphics and attitudes towards olives. The classification
questionnaire comprised 16 questions, and was materi-
ally the same across the different foods in the Crave It!
Foundation Study, enabling a cross-food analysis. The
questions focused on
1. geo-demographics (age, gender, income, market, time
of day),
2. body state (self-reported hunger level, oral health
such as dentures),
3. drivers of craveability (product features and situa-
tions suggested in the literature as being believed to
be associated with food cravings),4. liking of the food (FACT Scale, Schutz, 1964),
5. location the item is purchased.

H. Moskowitz et al. / Food Quality and Preference 16 (2005) 369–382 373
3.3. Respondents and invitations
The respondents were members of an opt-in e-mail
service (Open Venue Ltd., Toronto), who agreed to par-
ticipate in surveys. The respondents were sent an e-mail
invitation which asked them to participate in a study oncravings. They were directed towards a �wall� of 20 stud-
ies. One of these 20 was the olive study. A total of 44,000
invitations were sent out over a two-week period. From
this number more than 4500 respondents participated in
the full set of studies. Altogether 168 respondents com-
pleted the olive study and generated the database used
for this paper.
3.4. Modeling responses at the individual respondent
level
The study was set up so that a model could be cre-
ated for each respondent. The ratings for each respond-
ent were analyzed twice by regression analysis, after
two separate data transformations. The first data
transformation consisted simply of multiplying the rat-ing (1–9) by 11 to generate an 11–99 point scale. The
rationale was to make the coefficients easier to read.
This is called the persuasion scale. The persuasion scale
is used to determine whether or not each respondent val-
idly rated the concepts, in terms of consistency of
response.
The second transformation comprises a simple binary
transformation. If the rating for the concept was 1–6,then the rating was transformed to the value ‘‘0’’. In
contrast, if the rating for the concept was 7–9, then
the rating was transformed to the value ‘‘100’’. This
transformation generated a binary response, called the
�top 3 interests� (or Top 3 for short). The Top 3 repre-
sents the type of data used by marketers, who are inter-
ested in the proportion of respondents interested in a
concept. The marketer does not typically focus on theintensity of the interest but is more interested in the
number of individuals who are positive towards the con-
cept. This difference in the focus, a result of different
intellectual heritages enjoyed by researchers in psychol-
ogy versus sociology, generates differences in the way
that data is analyzed.
After the data were transformed, the individual data
was analyzed by dummy variable regression analysis, atthe individual level. Dummy variable regression is a ver-
sion of ordinary least squares analysis in which the pre-
dictor, independent variables, taken on one of two
values; �0� if the element is absent from the concept, or
�1� if the element is present in the concept. The data from
each respondent generated a simple additive model of
the form:
Rating ¼ k0 þ k1 ðElement 1Þ; . . . ; k36 ðElement 36Þ
3.5. Interpreting the results
The additive constant, k0, can be interpreted as the
conditional probability that an olive will be craved
(viz. the concept about olives rated 7–9) if there are no
elements present in the concept. Clearly this additiveconstant represents only a theoretical value because all
concepts evaluated by respondents comprised at least
two and at most four elements. The regression approach
requires the use of the additive constant as a correction
factor. The individual coefficients, k1 to k36, each show
the conditional probability that the concept describing
the olive will drive the rating of �crave� (e.g., higher
scaled intensity) if the element is added to the concept.Other words for the coefficient are �utility� and �impact�.
From many previous studies, where the concept ele-
ments were evaluated using experimental design, the fol-
lowing norms emerge, that allow interpretation of the
results from this particular study. These norms are not
precise numbers, but rather suggest ranges correspond-
ing to different behaviors in the market.
a. Utility value <0
Element detracts fromstrength of concept
b. Utility value 0–5
Element adds to strengthof concept, but only slightlyc. Utility value 6–10
Element adds to strength ofconcept, should be in concept
d. Utility value 11–15
Element is important(often seen in segment results)
e. Utility value >16
Element is extremely importantFor this paper, and for the Foundation Studies on
foods in general, the operational definition of �intensityof craving� is the sum of two parts; the additive constant,and the average utility value for the first nine concept
elements that deal with the features of the specific food.
This definition represents the re-composition of the util-
ity function into a single estimated value. One particular
benefit of conjoint analysis is the ability to re-create new
combinations and estimate their total utility value by
summing the utilities of the components.
3.6. Consistency and validity of individual data
The issue of validity of data cannot be addressed eas-
ily in consumer research because there are no external
criteria by which to assess validity. Validity often then
devolves down to the demonstration that the panelist
was actually a validly recruited consumer. Fortunately
for studies in which the stimulus is systematically varied,the researcher does have a way to establish validity. One
can relate the ratings assigned by the panelist to the
presence/absence of the concept elements. To the degree
that the panelist is consistent in the ratings of the full
0.5 0.6 0.7 0.8 0.9 1.0RSQUARE
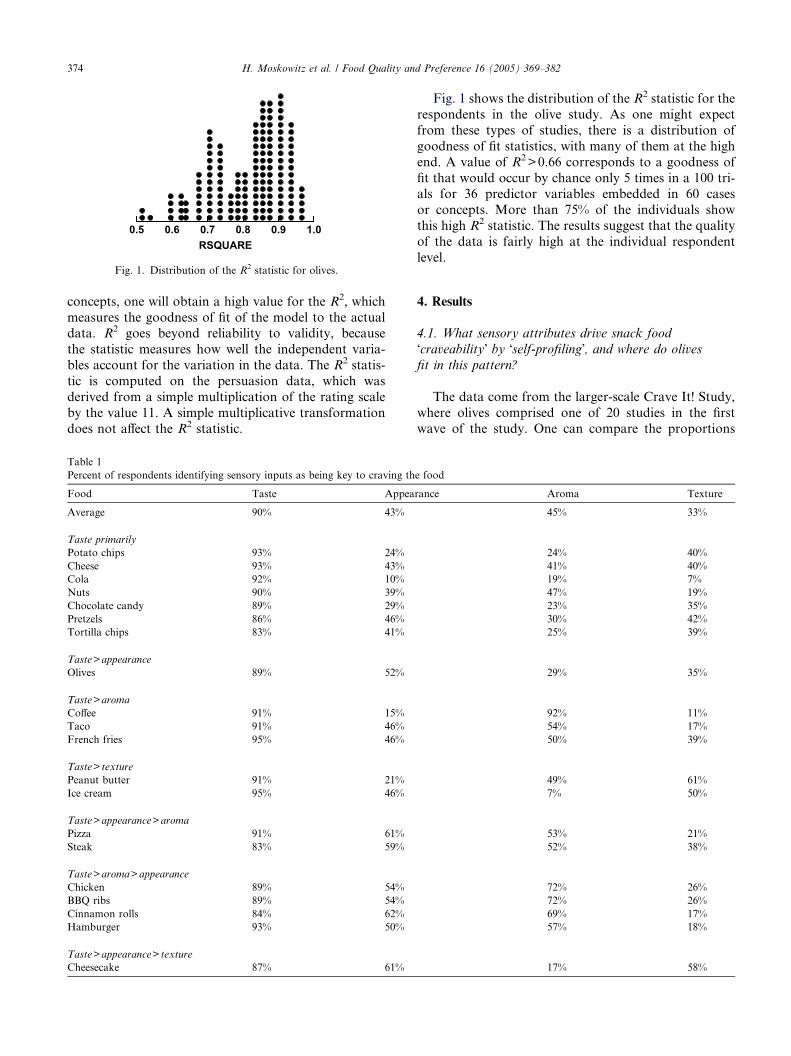
Fig. 1. Distribution of the R2 statistic for olives.
374 H. Moskowitz et al. / Food Quality and Preference 16 (2005) 369–382
concepts, one will obtain a high value for the R2, which
measures the goodness of fit of the model to the actualdata. R2 goes beyond reliability to validity, because
the statistic measures how well the independent varia-
bles account for the variation in the data. The R2 statis-
tic is computed on the persuasion data, which was
derived from a simple multiplication of the rating scale
by the value 11. A simple multiplicative transformation
does not affect the R2 statistic.
Table 1
Percent of respondents identifying sensory inputs as being key to craving th
Food Taste Appea
Average 90% 43%
Taste primarily
Potato chips 93% 24%
Cheese 93% 43%
Cola 92% 10%
Nuts 90% 39%
Chocolate candy 89% 29%
Pretzels 86% 46%
Tortilla chips 83% 41%
Taste>appearance
Olives 89% 52%
Taste>aroma
Coffee 91% 15%
Taco 91% 46%
French fries 95% 46%
Taste> texture
Peanut butter 91% 21%
Ice cream 95% 46%
Taste>appearance>aroma
Pizza 91% 61%
Steak 83% 59%
Taste>aroma>appearance
Chicken 89% 54%
BBQ ribs 89% 54%
Cinnamon rolls 84% 62%
Hamburger 93% 50%
Taste>appearance> texture
Cheesecake 87% 61%
Fig. 1 shows the distribution of the R2 statistic for the
respondents in the olive study. As one might expect
from these types of studies, there is a distribution of
goodness of fit statistics, with many of them at the high
end. A value of R2>0.66 corresponds to a goodness of
fit that would occur by chance only 5 times in a 100 tri-als for 36 predictor variables embedded in 60 cases
or concepts. More than 75% of the individuals show
this high R2 statistic. The results suggest that the quality
of the data is fairly high at the individual respondent
level.
4. Results
4.1. What sensory attributes drive snack food
�craveability� by �self-profiling�, and where do olives
fit in this pattern?
The data come from the larger-scale Crave It! Study,
where olives comprised one of 20 studies in the first
wave of the study. One can compare the proportions
e food
rance Aroma Texture
45% 33%
24% 40%
41% 40%
19% 7%
47% 19%
23% 35%
30% 42%
25% 39%
29% 35%
92% 11%
54% 17%
50% 39%
49% 61%
7% 50%
53% 21%
52% 38%
72% 26%
72% 26%
69% 17%
57% 18%
17% 58%

H. Moskowitz et al. / Food Quality and Preference 16 (2005) 369–382 375
of respondents across foods and across sensory attri-
butes to better understand the uniqueness of olives.
The results are detailed in Table 1. Taste was always
most important. This study confirms the survey of
snacking patterns of the American Dietetic Association
that taste was the top reasons for choosing a snack(Cross et al., 1994). However, the three remaining sen-
sory inputs (appearance, aroma, texture) vary in their
importance. For the ‘‘classic’’ snack-foods like potato
chips, nuts or chocolate candy, taste was the primary
sensory input considered to be important. For ice cream,
the combination of taste and texture were the primary
sensory inputs considered to be important. For a more
complex product such as chicken, taste, aroma andappearance were all considered to be important. Only
coffee aroma is as important for coffee as taste is
for other foods and beverages. For olives, only appear-
ance was the most important sensory attribute. It is
important to note that the aspect of appearance as the
Table 2
Parameters of the utility model for olives, averaged across the total sample
Constant Constant
E03 Meaty ripened olives ready to stick on your finger or pop
E01 Whole black olives without the pits
E16 Extra large and nicely salted . . .with the stuffing you want
E12 Any size you want . . . small, medium, large, jumbo . . .you
E02 Green fleshy olives with that salty taste
E13 Premium quality . . . that great classic taste . . . like it used to
E05 Fleshy, jumbo olives with the bitter, salty note
E30 From Italy
E28 From your favorite grocery store
E35 Simply the best olives in the whole wide world
E18 So good . . .you practically have to lick your fingers & lips
E25 An outrageous experience . . . shared with family and friend
E34 Freshly prepared . . .especially for you
E24 A joy for your senses . . . seeing, smelling, tasting
E20 When you think about it, you have to have it . . .and after
E09 All sizes of green and black olives in olive oil with lots of
E10 Olives are a party pleaser
E17 You can imagine the taste as you walk in the door
E23 Now you can escape the routine . . .a way to celebrate spec
E27 It feeds THE HUNGER
E29 From California
E04 Medium size glistening olives with the briny taste of salt a
E19 Quick and fun . . .eating alone doesn�t have to be ordinary
E31 From Greece
E36 With the safety, care and cleanliness that makes you trust
E15 100% natural . . .and new choices every month to keep you
E21 Fills that empty spot in you . . . just when you want it
E26 Pure ecstasy
E14 You can just savor it when you think about it during wor
E22 When you�re sad, it makes you glad
E33 From Dean & Deluca
E32 Select from the Deli
E06 Cracked olives, a delicacy flavored with herbs, spices, and
E11 With a chilled glass of water . . . or carbonated beverage
E08 Olive paste with lots of chopped olives
E07 Small dark wrinkled olives marinated with hot pepper flak
�secondary key driver� is unique to olives across these
20 foods.
4.2. Positive and negative element utilities for
statements about olives based on the conjoint study
Dummy variable regression analysis generated one
additive constant and 36 utility values, one per element,
for each respondent. Across the total sample, the addi-
tive constant is 36, which means that 36% of the
respondents say that they �crave� the olive product
(i.e., they assign a rating 7–9), when they evaluate the
concept. Table 2 becomes more interesting when we
look at the ratings of positive and negative elements.The first thing to notice is that the strongest performing
element only scores a +9. The best-scoring statement
�Meaty ripened olives ready to stick on your finger or
pop in your mouth� will attract only 9% more respond-
ents if that strongest performing element is inserted into
Total sample
36
in your mouth 9
7
. . .garlic, pimentos, almonds . . .whatever 7
name it! 7
7
be 4
4
4
3
3
twice after each bite 3
s 2
2
2
you have it, you can�t stop eating it 2
herbs and spices 1
1
1
ial occasions 1
0
0
nd garlic 0
0
0
it & love it all the more �1
tantalized �1
�1
�1
k and school �2
�2
�2
�2
a tasty marinade �5
�6
�15
es �19

376 H. Moskowitz et al. / Food Quality and Preference 16 (2005) 369–382
the concept about olives. In contrast, the worst perform-
ing element, �Small dark wrinkled olives marinated with
hot pepper flakes� will alienate 19% of the respondents.
In the case of olives, the larger negative utility for the
worst scoring element suggests that being wrong is far
worse than being right.The most positive elements are: �Meaty ripened olives
ready to stick on your finger or pop on your mouth� (util-ity = +9); �Whole black olives without the pits� (util-
ity = +7); �Extra large and nicely salted . . .with the
stuffing you want . . .garlic, pimento, almonds, . . .what-ever� (utility = +7); �Any size you want . . . small, medium,
large, jumbo (7); and Green fleshy olives with that salty
taste� (utility = +7). All of these elements deal with thesensory aspect of the product.
The most negative elements in descending order are:
�Small dark wrinkled olives marinated with hot pepper
flakes� (utility = �19); �Olive paste with lots of chopped
olives� (utility = �15); �With a chilled glass of water . . .orcarbonated beverage� (utility = �6); and �Cracked olives,
a delicacy flavored with herbs, spices and a tasty mari-
nade� (utility = �5). These poorly performing elementsalso speak to the product as well, except the statement
about water. It is important to note that although olive
paste scores poorly among consumers, it is used by chefs
for flavoring.
4.3. The winning elements from respondents who buy
olives in a specialty store
Table 3 illustrates how this group of consumers
shows especially strong responses to the concept ele-
ments. One element in particular, stating ‘‘Extra large
and nicely salted . . .with the stuffing you want . . .garlic,pimentos, almonds . . .whatever’’ does extraordinarily
well among this group (utility = 26). This particular ele-
ment paints a very strong word picture for this group of
respondents, as well as for those who say they crave ol-ives in a social situation (utility = 33). In contrast, this
element performs only modestly among the total sample
(utility = 7, Table 2). Those who buy olives at a specialty
store prefer ‘‘the Deli’’ instead of the ‘‘favorite grocery
store’’. These people buy the olives at the special olive-
store where they have a bigger choice of different ‘‘stuff-
Table 3
Utility value of winning elements respondents who buy at a specialty store
Buy olives at a specialty store
E16 Extra large and nicely salted . . .with the stuffing you w
E02 Green fleshy olives with that salty taste
E09 All sizes of green and black olives in olive oil with lots
E06 Cracked olives, a delicacy flavored with herbs, spices, a
E20 When you think about it, you have to have it . . .and a
E12 Any size you want . . . small, medium, large, jumbo . . .y
E32 Select from the Deli
E05 Fleshy, jumbo olives with the bitter, salty note
ing you want’’ (E16) and ‘‘all sizes of green and black
olives’’ (E09).
4.4. Impact of hunger
The respondents rated their own level of hunger on afour-point hunger scale (from no hunger to high hun-
ger). The objective was to determine in subsequent anal-
ysis whether hunger potentiated the response to the
concepts as a whole, based upon the additive constant,
and/or whether there were specific concept elements that
showed greater sensitivity to hunger. Sixty percent of
respondents rated themselves as having either no or
low hunger whereas the remaining 40% rated themselvesas having medium or high hunger. These two groups
(low and high) are separately analyzed, with the results
appearing in Table 4. The additive constant for olives
is far higher for respondents who said that they were
hungry (constant = 45), as compared to respondents
who said they were not hungry (constant = 29).
The array of elements that do well in each segment is
quite diverse. For the low hunger group (rating of noneor low hunger), only two elements show high utilities. In
contrast, for the higher hunger group (self-rating of
medium or high hunger), far more elements show high
utilities. These elements comprise both statements of
product features as well as emotional promises. These
data suggest, therefore, that hunger has an impact on
desire for olives, and that the effect is not limited to re-
sponses to product features alone. Hunger level canmodify the response to other types of messages about
olives.
Some comparisons between utilities for the low and
high hunger groups suggest three findings worth pursing
in more detail through systematic experimentation (Ta-
ble 4).
1. Hunger increases the magnitude of the additive con-stant from 29 to 45. The conditional probability of
a person saying that he or she craves an olive
increases from 29% if the person is not hungry to
45%, if the person is hungry. Clearly, the greater
the perceived state of hunger, the greater the
�craving�.
ant . . .garlic, pimentos, almonds . . .whatever 26
16
of herbs and spices 16
nd a tasty marinade 13
fter you have it, you can�t stop eating it 12
ou name it! 12
10
10
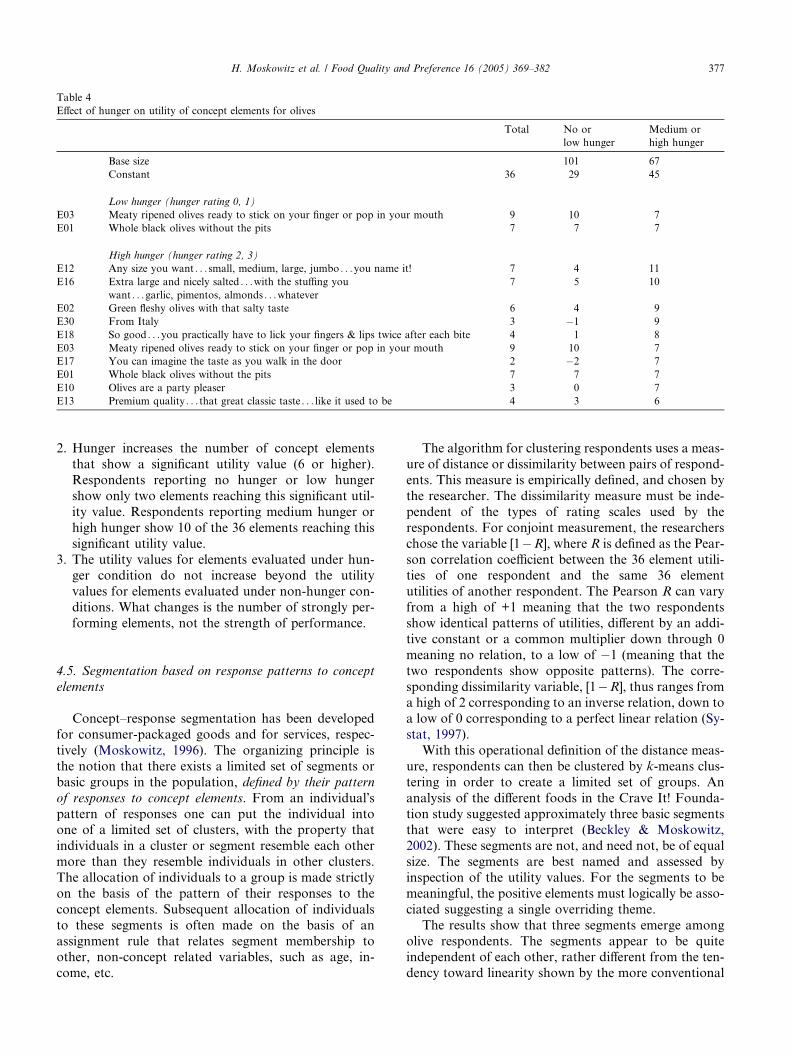
Table 4
Effect of hunger on utility of concept elements for olives
Total No or
low hunger
Medium or
high hunger
Base size 101 67
Constant 36 29 45
Low hunger (hunger rating 0, 1)
E03 Meaty ripened olives ready to stick on your finger or pop in your mouth 9 10 7
E01 Whole black olives without the pits 7 7 7
High hunger (hunger rating 2, 3)
E12 Any size you want . . . small, medium, large, jumbo . . .you name it! 7 4 11
E16 Extra large and nicely salted . . .with the stuffing you
want . . .garlic, pimentos, almonds . . .whatever
7 5 10
E02 Green fleshy olives with that salty taste 6 4 9
E30 From Italy 3 �1 9
E18 So good . . .you practically have to lick your fingers & lips twice after each bite 4 1 8
E03 Meaty ripened olives ready to stick on your finger or pop in your mouth 9 10 7
E17 You can imagine the taste as you walk in the door 2 �2 7
E01 Whole black olives without the pits 7 7 7
E10 Olives are a party pleaser 3 0 7
E13 Premium quality . . . that great classic taste . . . like it used to be 4 3 6
H. Moskowitz et al. / Food Quality and Preference 16 (2005) 369–382 377
2. Hunger increases the number of concept elements
that show a significant utility value (6 or higher).
Respondents reporting no hunger or low hunger
show only two elements reaching this significant util-
ity value. Respondents reporting medium hunger or
high hunger show 10 of the 36 elements reaching this
significant utility value.
3. The utility values for elements evaluated under hun-ger condition do not increase beyond the utility
values for elements evaluated under non-hunger con-
ditions. What changes is the number of strongly per-
forming elements, not the strength of performance.
4.5. Segmentation based on response patterns to concept
elements
Concept–response segmentation has been developed
for consumer-packaged goods and for services, respec-
tively (Moskowitz, 1996). The organizing principle is
the notion that there exists a limited set of segments or
basic groups in the population, defined by their pattern
of responses to concept elements. From an individual�spattern of responses one can put the individual intoone of a limited set of clusters, with the property that
individuals in a cluster or segment resemble each other
more than they resemble individuals in other clusters.
The allocation of individuals to a group is made strictly
on the basis of the pattern of their responses to the
concept elements. Subsequent allocation of individuals
to these segments is often made on the basis of an
assignment rule that relates segment membership toother, non-concept related variables, such as age, in-
come, etc.
The algorithm for clustering respondents uses a meas-
ure of distance or dissimilarity between pairs of respond-
ents. This measure is empirically defined, and chosen by
the researcher. The dissimilarity measure must be inde-
pendent of the types of rating scales used by the
respondents. For conjoint measurement, the researchers
chose the variable [1�R], where R is defined as the Pear-
son correlation coefficient between the 36 element utili-ties of one respondent and the same 36 element
utilities of another respondent. The Pearson R can vary
from a high of +1 meaning that the two respondents
show identical patterns of utilities, different by an addi-
tive constant or a common multiplier down through 0
meaning no relation, to a low of �1 (meaning that the
two respondents show opposite patterns). The corre-
sponding dissimilarity variable, [1�R], thus ranges froma high of 2 corresponding to an inverse relation, down to
a low of 0 corresponding to a perfect linear relation (Sy-
stat, 1997).
With this operational definition of the distance meas-
ure, respondents can then be clustered by k-means clus-
tering in order to create a limited set of groups. An
analysis of the different foods in the Crave It! Founda-
tion study suggested approximately three basic segmentsthat were easy to interpret (Beckley & Moskowitz,
2002). These segments are not, and need not, be of equal
size. The segments are best named and assessed by
inspection of the utility values. For the segments to be
meaningful, the positive elements must logically be asso-
ciated suggesting a single overriding theme.
The results show that three segments emerge among
olive respondents. The segments appear to be quiteindependent of each other, rather different from the ten-
dency toward linearity shown by the more conventional

SEGC1SEGC1
SEGC2 SEGC3
SEGC1
SEGC2 SEG
C2
SEGC1
SEGC3
SEGC2 SEGC3
SEGC3
Fig. 2. Scatterplot for utility values of three olive segments obtained
by clustering 168 respondents based upon the patterns of their utilities.
378 H. Moskowitz et al. / Food Quality and Preference 16 (2005) 369–382
pairs of subgroups. Fig. 2 shows the scatterplot, andclearly reveals that there is no appreciable relation be-
tween the utility values obtained by any pair of the
segments.
The three segments identified show rather different
positive elements, and the utility values of the positive
elements are very high (see Table 5). Segment #1, with
Table 5
Strongest performing elements for three olive segments, clustered by the pat
Base size
Constant
Segment #1 (‘‘Classics’’)
E01 Whole black olives without the pits
E03 Meaty ripened olives ready to stick on your finger or pop in your m
Segment #2 (‘‘Elaborates’’)
E09 All sizes of green and black olives in olive oil with lots of herbs and
E02 Green fleshy olives with that salty taste
E04 Medium size glistening olives with the briny taste of salt and garlic
E03 Meaty ripened olives ready to stick on your finger or pop in your m
E05 Fleshy, jumbo olives with the bitter, salty note
E16 Extra large and nicely salted . . .with the stuffing you
want . . .garlic, pimentos, almonds . . .whatever
E06 Cracked olives, a delicacy flavored with herbs, spices, and a tasty ma
E01 Whole black olives without the pits
E13 Premium quality . . . that great classic taste . . . like it used to be
E12 Any size you want . . . small, medium, large, jumbo . . .you name it!
E18 So good . . .you practically have to lick your fingers & lips twice afte
E25 An outrageous experience . . . shared with family and friends
Segment #3 (‘‘Imaginers’’)
E02 Green fleshy olives with that salty taste
E28 From your favorite grocery store
E16 Extra large and nicely salted . . .with the stuffing you want . . .garlic,pimentos, almonds . . .whatever
E18 So good . . .you practically have to lick your fingers & lips twice afte
E13 Premium quality . . . that great classic taste . . . like it used to be
42% of respondents, responds only to a simple message;
�whole black olives without the pits�. This group appears
to be the �Classics’’ segment, using the nomenclature
of the larger Crave It! Foundation Study. What is
important about the classic segment is its interest in
the simple, traditional messages. These individuals nei-ther respond to unusual or novel flavored products
nor do they react to alternative product forms. Segment
2 may be the ‘‘Elaborates’’ segment. ‘‘Elaborates’’ want
lots of flavors, including stuff that was added to the
product. These individuals want added flavors and fea-
tures of the olive. ‘‘Elaborates’’ also constitute a very
large segment, comprising 42% of respondents. Segment
3 appears to be the ‘‘Imaginers’’. ‘‘Imaginers’’ are distin-guished by their reactivity to elements other than prod-
uct features. ‘‘Imaginers’’ like to dream about the
product, and appear to be swayed by messages about
venue and history as well as being swayed by product
features. They constitute the smallest segment, 16% of
respondents. The three segments identified in this study
correspond to the three overarching segments for the
other food categories in the Foundation Study (Beckley& Moskowitz, 2002).
Table 5 shows clearly different winning elements for
the different consumer groups. Classics select the ‘‘clas-
sic’’ black olives, pure without pits or other ingredients
tern of their utility values
Total Classics Elaborates Imaginers
168 70 71 27
36 44 22 50
7 18 15 �42
outh 9 8 18 �12
spices 2 �12 23 �20
6 �13 22 15
�1 �17 18 �9
outh 9 8 18 �12
4 �11 18 5
7 �5 17 11
rinade �5 �24 17 �13
7 18 15 �42
4 �2 10 6
7 5 9 4
r each bite 4 �1 7 6
3 3 6 �5
6 �13 22 15
3 0 3 12
7 �5 17 11
r each bite 4 �1 7 6
4 �2 10 6

H. Moskowitz et al. / Food Quality and Preference 16 (2005) 369–382 379
like salt (E02, E04, and E05) or flavored spices (E06). It
is not intuitively clear why the classics do not select with
positive intensity green olives. The classics do not care
about the place where they buy the olives nor is the sim-
ple statement of quality particularly appealing; �premium
quality with classic taste� (Utility = �2).The Elaborates positive selection indicates the ‘‘more
is more’’ framework relating to sizes (E05, E016) and
spices (E09, E06), while the product itself does not gen-
erate this intensity (black or green olives, E09, E02,
E01).
The Imaginers gather the most intensity of desire
from a location, a typical favorite grocery store, and
intensity is decreased by the idea of the classic black ol-ive without pits (E01).
5. Discussion
5.1. The uniqueness of olives in terms of sensory drivers
Each respondent had to identify up to three aspectsof the product that drive their intensity of craving.
Among these aspects are the sensory impacts of taste,
appearance, aroma, and texture, but there are others,
such as mood, situation, etc. This paper has only consid-
ered the sensory-based inputs. For foods it is the sensory
attribute of �taste� (including flavor) that drives intensity
of craveability. The secondary sensory attributes of
appearance, aroma, and texture are differentiators ofthe different foods. The definition of �importance� in
the analysis is that an attribute is important as a driver
of craving intensity if 50% or more of the respondents
select it from among the three aspects. For olives,
appearance, but not aroma or texture, is of secondary
importance. Olives are the only food out of the large
scale Crave It! Foundation Study for which taste
and then appearance are key, but aroma and textureare not.
5.2. Olives as the �healthy�, �good-for-you� snack
In the introduction to this paper the point was made
that manufacturers are looking for new products that
can be positioned as healthy snacks. The olive may be
ripe for this positioning, perhaps based upon its uniquedriver: appearance. In the self-profiling classification
questionnaire the unique combination of taste and
appearance as drivers appeared quite clearly. This
means, that for the olive, consumption may be driven
by �seeing the olive� either physically or in one�s mind.
Whether the respondent profiles himself as being hungry
or full, the driving element is appearance. Two appear-
ance elements do best among the hungrier respondents:�Any size you want . . . small, medium, large, jumbo . . .you
name it!�, and �Extra large and nicely salted . . .with the
stuffing you want . . .garlic, pimentos, almonds . . .what-ever�. An appearance element does well among the less
hungry respondents: �Whole black olives without the pits�.Another element, a call to fun and consumption,
also does well among the less hungry respondents:�Meaty ripened olives ready to stick on your finger or
pop in your mouth�. The combination of appearance ele-
ments and the call to consumption among the less hun-
gry respondents suggest that the olive could be the next
healthful snack, whose consumption need not be tied to
a meal.
5.3. Practical guidance for product development of the
healthy snack, and communication from these
consumer insights
A key benefit of conjoint analysis is the concreteness
of the messages. The segmentation is particularly useful
because it pulls apart the different groups, and suggests
different directions for development and communica-
tion. With this in mind it should become easier toachieve a degree of market success because through re-
search the marketer and developer have already ob-
tained some of the keys to the consumer mind
(Hoban, 1998; Trout & Rivkin, 2000). For example,
‘‘Elaborates’’ want a word picture of an exciting taste
to eat. Elaborates want a more spicy olive-snack. This
is the exact trend snack food producers see in the U.S.
snack food market. The consumer wants to have snackswith rich, robust and exotic tastes. It might well be that
the olive, properly flavored to appeal to the �Elaborates�represents that long sought after highly desired, healthy
snack. It is important to keep in mind, however, that the
features that drive response for the Elaborates may de-
creases desirability among the other segments. ‘‘Clas-
sics’’ are not particularly responsive to product
attributes except the promise of a good olive. ‘‘Imagin-ers’’ focus on the experience of eating olives. It may be
impossible to satisfy all of these segments with one prod-
uct, suggesting that perhaps several olive products
would be appropriate for a line of desirable healthful
snacks.
Although the macro research objective was to learn
about the map of the consumer�s mind, in business,
one of the key micro objectives is to discover what spe-cifically to say in marketing communications in order to
promote purchase and maintain repeat purchase of ol-
ives and snack foods. One of the lessons from the study
is that the key messages promoting purchase, on aver-
age, are those that deal with the product features (Hol-
lingsworth, 1996). Most American consumers need to
hear primarily about the product itself. There are how-
ever groups of people who will be motivated by very dif-ferent attributes.

380 H. Moskowitz et al. / Food Quality and Preference 16 (2005) 369–382
5.4. The overriding importance of concept-response
segmentation to provide a set of �ordering� or�organizing� principles
Segmentation constitutes a recurrent theme in the
Foundation Study and in olives in particular. The exist-ence of segments is well known in the marketing field, so
that should cause no surprise (Hammond, Ehrenberg, &
Goodhardt, 1996; Lappin, Figoni, & Sloan, 1994). Seg-
mentation divides consumers into distinct groups with
similar needs and characteristics (Boyd, Westfall, &
Stasch, 1989). Segmentation procedures can also divide
people into different groups, based upon one or another
criterion (e.g. Customer needs, Lappin et al., 1994; Prod-uct use, Wellner, 2000; Demographics, Wellner, 2002;
and Ethnic origin, Gardynhen, 2001).
What is very interesting, however, is the continuing
emergence of the three radically different mind-sets.
Whether these segments (‘‘Classics’’, ‘‘Elaborates’’, and
‘‘Imaginers’’, respectively) represent basic groups or just
emerge as convenient statistical artifacts needs to be fur-
ther explored. In the case of foods as different as ham-burger and cheesecake, this segmentation appears to
work, and to drive different directions of product devel-
opment. Vis-a-vis other snack foods, olives appear to
possess this type of segmentation as well.
Despite all of the advantages of segmentation, the re-
searcher has to be aware of the fact that the assigning of
consumers to segments is fundamentally a statistical
tool, and not a statement of the way the world mayactually be constituted. According to Szmigin (2002),
people of similar geo-demographics do not necessarily
show the same behaviour. Geo-demographic segmenta-
tion is realistic because this is the way people are di-
vided. The criteria are eternal. Concept response
segmentation works at a different level, one that is more
theoretical. One cannot easily point to the characteris-
tics of a respondent and predict membership in one ofthe three segments. What is important is whether the
segmentation makes sense, whether it is general, whether
it leads to increased scientific understanding, and
whether it leads to improved product development and
marketing.
The segmentation into the three groups appears to
satisfy the four above-mentioned criteria. It is possible,
therefore, that the intermediate or even low-levelperformance seen with olives for the total panel may re-
sult from the intermixing of respondents from the three
segments. What one respondent finds acceptable in
terms of the product statements or benefits another
respondent from a different segment may find objection-
able. This difference is clearly seen by looking at winning
elements from one segment, to see how the other seg-
ments respond. Quite often respondents from one oreven both of the other segments dislike that positive
element.
5.5. Conjoint analysis as a new opportunity to
understand the consumer in the sensory and product
testing worlds
Conjoint analysis is often used in the early concept
development stages, where there are many options fromwhich to choose, and where the objective of the research
is to understand the �lay of the land�. Especially for this
initial stage, the Internet offers a particularly attractive
environment for product testing and market research.
First, the cost of creating and testing virtual prototypes
is considerably lower than that for physical prototypes
and many product concepts can be tested within the
same market research budget. Second, the Internet al-lows efficient and expedient access to respondents. Third,
if it is needed, the new technologies, such as VRML (Vir-
tual Reality Markup Language), streaming video, and
interactive sensory peripherals, allow visual, auditory,
and tactile information to be disseminated and retrieved
in rather powerful ways (Mosley-Matchett, 1998).
5.6. The usefulness of Internet research to better
understand products
These data suggest that the Internet can provide a
cost-effective and efficient venue to collect data and
therefore conduct high level consumer research. The
speed at which one can run studies allows the researcher
to move from expensive, difficult to execute tests, to-
wards more iterative tests to explore the consumer per-ception of products. The Foundation Study in general
and the olive study in particular, were created fairly rap-
idly. Most of the effort in Internet based research is ex-
pended on the up-front design of the study. The actual
field execution is fairly straightforward, as described
here. The high degree of consistency in the data is also
very encouraging.
The change in efforts allocated to design versus execu-tion, and the reduction of difficulty in execution means
researchers should be able to conduct a series of studies
to better understand a product. The Foundation Study
comprised a large-scale, cross-sectional view of many
product categories, from which the olive data represent
one study. There is every reason to believe that future
studies conducted in the same way, on the Internet, with
pictures and text, rather than text alone, can further in-crease understanding of products. Thus, one might look
at the Foundation Study as simply the first step in a ser-
ies of studies to understand a product in depth. This
form of semi-syndicated research has been suggested
as a desirable and needed outcome of this type of re-
search (Struse, 2000).
In conclusion, the sensory benefits, emotions, and
usage patterns ascertained for olives through the useof Internet-based conjoint analysis can serve as a model
for the study of other snack foods, enhance product seg-

H. Moskowitz et al. / Food Quality and Preference 16 (2005) 369–382 381
mentation and contribute to the understanding of crave-
ability as a drive of consumer response.
Appendix A. The 36 concept elements for olives, and their
rationales
Category Rationale Olives
E01 Primary Basic physical attributes Whole Black olives without the pits
E20 Primary ** (continuum: basic to complex/detailed
physical attributes) in some cases . . . �healthy�Green fleshy olives with that salty taste
E03 Primary ** (continuum: basic to complex/detailed
physical attributes)
Meaty ripened olives ready to stick on your finger
or pop in your mouth
E04 Primary ** (continuum: basic to complex/detailed
physical attributes) in some cases . . . �real�Medium size glistening olives with the briny taste
of salt and garlic
E05 Primary ** (continuum: basic to complex/detailed
physical attributes)
Fleshy, jumbo olives with the bitter, salty note
E06 Primary ** (continuum: basic to complex/detailed
physical attributes)
Cracked olives, an Italian delicacy flavored with herbs,
spices, and a tasty marinade
E07 Primary ** (continuum: basic to complex/detailed
physical attributes)
Small dark wrinkled olives marinated with hot pepper flakes
E08 Primary ** (continuum: basic to complex/detailed
physical attributes)
Olive paste with lots of chopped olives
E09 Primary Complex physical attributes; details All sizes of green and black olives in olive oil
with lots of herbs and spices
E10 Mood Secondary Party pleaser/inviting Olives are a party pleaser
E11 Mood Secondary Beverages With a chilled glass of water . . . or carbonated beverage
E12 Mood Secondary with . . . Any size you want . . . small, medium, large, jumbo . . .you name it!
E13 Mood Secondary Premium quality/classic taste Premium quality . . . that great classic taste, like it used to be
E14 Mood Secondary Savor it . . . You can just savor it when you think about it during work and school
E15 Mood Secondary All natural/changing flavors 100% natural . . .and new choices every month to keep you tantalized
E16 Mood Secondary With all the extras you want . . . Extra large and nicely salted . . .with the stuffing you want.
Garlic, pimentos, almonds . . .whateverE17 Mood Secondary Imagine the taste . . . You can imagine the taste as you walk in the door
E18 Mood Secondary Lick your lips twice . . . So good . . .you practically have to lick your fingers
&lips twice after each bite
E19 Emotional Quick/fun/alone Quick and fun . . .eating alone doesn�t have to be ordinary
E20 Emotional Have to have it . . .can�t stop When you think about it, you have to have it . . .and
after you have it, you can�t stop eating it
E21 Emotional Fills that empty spot . . . Fills that empty spot in you . . . just when you want it
E22 Emotional Cheers you up . . . When you�re sad, it makes you glad
E23 Emotional Escape routine/celebrations Now you can escape the routine . . .a way to celebrate special occasions
E24 Emotional Multi-dimensional sensory experience A joy for your senses: seeing, smelling, tasting
E25 Emotional with family & friends An outrageous experience . . . shared with family and friends
E26 Emotional Ecstasy. . . Pure ecstasy
E27 Emotional Satisfies hunger . . . It feeds THE HUNGER
E28 Brand or Benefit Basic brands/experiences From your favorite grocery store
E29 Brand or Benefit Basic to premium brands From California
E30 Brand or Benefit Basic to premium brands From Italy
E31 Brand or Benefit Basic to premium brands From Greece
E32 Brand or Benefit Basic to premium brands Select from the Deli
E33 Brand or Benefit Premium brands/experiences From Dean & Deluca
E34 Brand or Benefit Fresh . . . for you . . .by you Freshly prepared . . .especially for you
E35 Brand or Benefit Best in world . . . Simply the best olives in the whole wide world
E36 Brand or Benefit Safety . . . With the safety, care and cleanliness that makes
you trust it & love it all the more
References
Abersold. (1998). Internet Healthy Eating Habits. http://www.unf.edu/
groups/snc/articles/health.
Baker, S., & Henry, R. R. (1987). Parents� guide to nutrition: healthy
eating from birth through adolescence. Reading, MA: Addison-
Wesley Publishing Company, Inc.
Beckley, J., & Moskowitz, H. R. (2002). Databasing the consumer
mind: the crave it!, drink it!, buy it! & healthy you! databases.
Anaheim, CA: Institute Of Food Technologists.
Boyd, H. W., Westfall, R., & Stasch, S. (1989).Marketing research text
and cases. Homewood, IL: Richard D Irwin.
Box, G. E. P., Hunter, J., & Hunter, S. (1978). Statistics for
experimenters. New York, NY: John Wiley.

382 H. Moskowitz et al. / Food Quality and Preference 16 (2005) 369–382
Cross, A. T., Babicz, D., & Cushman, L. F. (1994). Snacking patterns
among 1,800 adults and children. Journal of American Dietetic
Association, 94, 1398–1403.
deJong, A. L., (Ed.). (1999). US market trends and forecasts.
Farmington Hills, MI: The Gale Group.
Gardynhen, R. (2001). Habla English? American Demographics.
Available: www.demographics.com.
Green, P. E., Carroll, D. J., & Goldberg, S. M. (1981). A general
approach to product design optimization via conjoint analysis.
Journal of Marketing, 45, 17–37.
Hammond, K. A., Ehrenberg, A., & Goodhardt, G. J. (1996). Market
segmentation for competitive brands. European Journal of Mar-
keting, 30(12), 39–49.
Hoban, T. J. (1998). Improving the success of new product develop-
ment. Food Technology, 52(1), 46–49.
Hoch, G. J. (2000). Snacks get hotter too––snack foods continue trend
toward hotter, more ethnically diverse products. Available: http://
www.foodprocessing.com.
Hollingsworth, P. (1996). Sensory testing and the language of the
consumer. Food Technology, 50(2), 65–69.
Klingbeil, A. (2003). PepsiCo keeps its plate full. The Journal News.
July 28, 2003.
Lappin, J., Figoni, P., & Sloan, S. (1994). A primer on consumer
marketing research: procedures, methods, and tools. Cambridge,
MA: National Transportation Systems Center.
Mintel International Group Ltd. (2003a). Kid�s snacking, US. Avail-
able: http://www.marketresearch.com.
Mintel International Group Limited (2003b). Healthy snacking, US,
July 2003. Available: http://www.preparedfoods.com.
Moskowitz, H. R. (1994). Concepts: their systematic design, develop-
ment and optimization. In Food concepts and products: just in
time development (pp. 1–69). Westport, CT: Food and Nutrition
Press.
Moskowitz, H. R. (1996). Segmenting consumers worldwide: an
application of multiple media conjoint methods. In Proceedings
of the 49th ESOMAR congress, Istanbul, pp. 535–552.
Moskowitz, H. R., & Martin, D. G. (1993). How computer aided
design and presentation of concepts speeds up the product
development process. Proceedings of the 46th ESOMAR congress,
Copenhagen, pp. 405–424.
Mosley-Matchett, J. D. (1998). Leverage the Internet�s research
capabilities. Marketing News, 32.
Oltersdorf, U., Schlettwein-Gsell, D., & Winkler, G. (1999).
Assessing eating patterns––an emerging research topic in nutri-
tional sciences: introduction to the symposium. Appetite, 32, 1–7.
Pelchat, M. L., & Schaefer, S. (2000). Dietary monotony and food crav-
ing in young and elderly adults. Physiology & Behavior, 68, 353–359.
Roberts, Jr., W. A. (2001). Category analysis: salty foods––worth its
salt. Available: http://www.preparedfoods.com.
Schutz, H. G. (1964). A food action rating scale for measuring food
acceptance. Journal of Food Science, 30, 202–213.
Schutz, H. G., & Martens, M. (2001). Appropriateness as a cognitive–
contextual measure food attitudes. In People, food and society a
European perspective of consumer food choices. New York, NY:
Springer-Verlag.
Struse, D. (2000). Researcher�s Top 25 influence. Marketing Research,
11(4), 5–9.
Sullivan, D. K., Legowski, P. A., Jacobsen, D. J., Synder Heelan, K.
A., Johnson, S. L., & Donnelly, J. E. (2002). A low-fat afterschool
snack improves the nutritional quality of elementary school
children�s diets. Journal of the American Dietetic Association,
102(5), 707–710.
Systat (1997). Systat, the system for statistics. Evanston, IL: SPSS
Corporation.
Szmigin, I. (2002). Consumer behaviour. Available: http://bss2.bha-
m.ac.uk/business/teaching/szmigin/introduction.ppt.
Trout, J., & Rivkin, S. (2000). Differentiate or die: survival in our era of
killer competition (pp. 2–3, 65–73). New York, NY: John Wiley &
Sons, Inc.
Wellner, A. (2000). Brand strategies: profit in loss. American Demo-
graphics 2000. Available: http://www.demographics.com.
Wellner, A. (2002). The female persuasion brand strategies: profit in
Loss, American Demographics 2002. Available: http://
www.demographics.com.
Wittnk, D. R., & Cattin, P. (1989). Commercial use of conjoint
analysis: an update. Journal of Marketing, 53, 91–96.
Copyright © 2022 FDOKUMEN