
a conjoint analysis approach
115
Lingnan University Lingnan University Digital Commons @ Lingnan University Digital Commons @ Lingnan University Bachelor Degree - Marketing - Final Year Project Department of Marketing and International Business 5-2-2002 Consumer preferences for personal digital assistant (PDA) in Consumer preferences for personal digital assistant (PDA) in Hong Kong : a conjoint analysis approach Hong Kong : a conjoint analysis approach Kei Kong LAU Wai Hung YIP Follow this and additional works at: https://commons.ln.edu.hk/mkt_fyp Part of the Marketing Commons Recommended Citation Recommended Citation Lau, K. K., & Yip, W. H. (2002). Consumer preferences for personal digital assistant (PDA) in Hong Kong: A conjoint analysis approach (UG dissertation, Lingnan University, Hong Kong). Retrieved from http://commons.ln.edu.hk/mkt_fyp/6 This UG Dissertation is brought to you for free and open access by the Department of Marketing and International Business at Digital Commons @ Lingnan University. It has been accepted for inclusion in Bachelor Degree - Marketing - Final Year Project by an authorized administrator of Digital Commons @ Lingnan University.
-
Upload
khangminh22 -
Category
Documents
-
view
1 -
download
0
Transcript of a conjoint analysis approach
Lingnan University Lingnan University
Digital Commons @ Lingnan University Digital Commons @ Lingnan University
Bachelor Degree - Marketing - Final Year Project Department of Marketing and International Business
5-2-2002
Consumer preferences for personal digital assistant (PDA) in Consumer preferences for personal digital assistant (PDA) in
Hong Kong : a conjoint analysis approach Hong Kong : a conjoint analysis approach
Kei Kong LAU
Wai Hung YIP
Follow this and additional works at: https://commons.ln.edu.hk/mkt_fyp
Part of the Marketing Commons
Recommended Citation Recommended Citation Lau, K. K., & Yip, W. H. (2002). Consumer preferences for personal digital assistant (PDA) in Hong Kong: A conjoint analysis approach (UG dissertation, Lingnan University, Hong Kong). Retrieved from http://commons.ln.edu.hk/mkt_fyp/6
This UG Dissertation is brought to you for free and open access by the Department of Marketing and International Business at Digital Commons @ Lingnan University. It has been accepted for inclusion in Bachelor Degree - Marketing - Final Year Project by an authorized administrator of Digital Commons @ Lingnan University.

Lingnan University
Bachelor of Business Administration (Hons)
Department of Marketing and International Business
BUS 331 Business Project
Consumer Preferences for Personal Digital Assistant (PDA) in Hong Kong:
A Conjoint Analysis Approach
Name of Supervisor : Dr POON Shing-Chung, Patrick
Department of Marketing and
International Business
Name of Students : Lau Kei Kong, Stanley (1027134)
Yip Wai Hung, Johnny (1000576)
Date of Submission : 2nd May, 2002.

i
Abstract
Stepping into the 21st century, high technology becomes more and more
important. Peoples not only use computers at home or in office, but also need
to manage their work by computer outdoorsy. Therefore, PDA becomes a
more popular mobile digital product in Hong Kong. Besides, because of its
relatively low price, small in size and wide coverage of support software,
number of PDA users in Hong Kong is increasing tremendously.
Since there are many special features of PDA that affect the consumers’
decision, we are going to find out the consumer preferences for PDA by using a
Conjoint Analysis Approach. Conjoint Analysis not only helps us to
understand the consumers’ preferences for each level of attributes, but also
segmenting the market into different groups.
Base on the results found in our research, all respondents preferred color
display. Palm OS no longer monopolized the PDA market and more
consumers chose Win CE. Also, around 80% of the female respondents were
not PDA users. All in all, most consumers are more concern with the screen
display, price and operation system.

ii
Acknowledgments
We are deeply grateful to number of people for their assistance in this project.
We sincerely appreciate the insightful comments from the following people,
who provided constructive feedback based on their experiences and
knowledge.
First of all, we would like to particularly thank our project supervisor, Dr. Patrick
Poon, Assistant Professor of Marketing and International Business Department
in Lingnan University, for his kindness and patience during the whole year of
the research project. Especially in giving us his valuable advice, guidance
and important insights for our project.
Besides, we deeply thank Dr. Wei-ping Wu, Assistant Professor of Marketing
and International Business Department in Lingnan University, for the amount of
time he spent on giving us evaluation.
Finally, we have to thank all the survey respondents who had provided us their
valuable opinions and experience for our data analysis.

List of Figures
Figure 2.1 Marketing Segmentation in the P.25
Context Of Conjoint Analysis
Figure 4.1 Gender Distribution P.45
Figure 4.2 Age Distribution P.45
Figure 4.3 Monthly Income Level P.46
Figure 4.4 Occupation Distribution P.47
Figure 4.5 Utility Functions (Part-Worth) P.53
Based on Conjoint Analysis
Figure 4.6 Amount of Variability Based P.56
on Number of Clusters
Figure 4.7 The Reasons of Using PDA P.73
Figure 4.8 Sources of PDA Information P.74
Figure 4.9 Pie Chart of First Choice Frequency P.76

List of Tables
Table 2.1 Different Levels of P.16
Product Attributes
Table 3.1 Product 1 Profile P.40
Table 3.2 Product 2 Profile P.41
Table 3.3 Product 3 Profile P.41
Table 4.1 Demographic Information of Total P.44
Respondents
Table 4.2 Results of Conjoint Analysis P.49
Table 4.3 Distribution of Preferred Levels P.51
Table 4.4 Respondents’ Preferences P.58
for Group 1
Table 4.5 Respondents’ Preferences P.59
for Group 2

Table 4.6 Respondents’ Preferences P.60
for Group 3
Table 4.7 Respondents’ Preferences P.61
for Group 4
Table 4.8 Respondents’ Preferences P.62
for Group 5
Table 4.9 Market Share of the Three Product P.63
Profiles in the Market Simulation
Model (First Choice Model)
Table 4.10 The Relationship Between P.65
Gender and PDA Users
Table 4.11 The Relationship Between P.66
Age and PDA Users
Table 4.12 The Relationship Between P.67
Monthly Income and PDA Users
Table 4.13 The Relationship Between P.68
Occupation and PDA Users

Table 4.14 Independent t-test Between P.71
Q1-Q5 and Gender
Table 4.15 The Difference Between P.72
Mean and Gender of Q1-Q5
Table 4.16 First Choice Frequency P.75
Table 4.17 The Product Profile of P.76
Card No. 2 and 5

Chapter 1
Introduction
Chapter 1 Introduction
1
Chapter 1 Introduction
1.1 Introduction
Stepping into the 21st century, high technology becomes more and more
important. Personal computer becomes one of the necessities of the people
in Hong Kong. People not only need the help of computers at home or office,
but also need to manage and do their work outdoorsy. That is why notebook
computers, handheld PC and PDA (Personal Digital Assistance) become more
popular in Hong Kong. Because of the relatively low price, small in size and
wide coverage of support software, PDA is the most popular mobile digital
product in Hong Kong now.
A personal digital assistant (PDA) is a small pen-based computing device that
runs software written to manage calendars, contacts, lists, and provide
storage and retrieval of documents and images (Dickson, 1999). In Hong
Kong, the number of PDA users is increasing. It is easy for you to see many
users are using her PDA in the street. When they are taking the bus, they
can read novels from his PDA. Besides, there are more and more reports
about PDA from the magazine. More manufacturers produce her PDA to the
market too, such as Acer, Sony and Instant-Dict. Consumers have more

Chapter 1 Introduction
2
choices when they decide to buy PDA. Moreover, users can buy different
kind of accessories in the market. Hard cover case, USB cable and mobile
phone parts are common accessories which can be found in the market.

Chapter 1 Introduction
3
1.2 Rationale
Why do we choose PDA as our research topic? Hong Kong is an
international city. The speed of life cycle is very high. PDA is useful for us
to manage our time schedule. It is small in size and high potential space for
us to develop other functions. More and more electric manufacturers start to
introduce its products in the market, such as NEC, Sharp and Sony. Under
the keen competition of PDA, more functions have been added, such as MP3
player, higher revolution screen and extended memory medium. PDA
manufacturers also hope these special characters can attract user to choose
its product.
We are interested in investigate the conjoint relationship of consumer when
they choose their favorite PDA, since there are many special features of PDA
that affect the consumer decision. There are lots of special functions that
can be found from PDA. What is the most important feature for the user?
What criteria do we need to consider when we make the buying decision?
PDA has a potential to become the necessary product of us. All of electric
manufacturers hope to understand the consumer behavior of PDA.

Chapter 1 Introduction
4
Besides, conjoint analysis can help us to understand the segment pattern of
PDA user. Different segments have different requirement of PDA. Group A
concerns the operation system. However, Group B concerns the price only.
So, we are interested to investigate the relationship between the
segmentation of PDA user and the feature of PDA.
In this research project, analysis is carried out to investigate how product
features affecting the buying decision. To eliminate the complexity and being
more accurate, we decide to do in-depth interview in order to reduce the
number of features of PDA.

Chapter 1 Introduction
5
1.3 Problem Identification
In fact, it is difficult for us to choose the feature of PDA in the conjoint analysis.
There are many different kinds of feature of one product. To find out the
most important feature that affects the consumer decision is difficult.
1.4 Research Objectives
The general objective of our research is going to understand consumer
preference for PDA in Hong Kong. Give recommendations to manufacturers
to produce the new model of PDA. The specific objectives of our research
are listed below:
1. To find out the consumer preference for PDA attributes.
2. Segmenting market and find out the preference for PDA of each segment.
3. To test the new designed product by market simulation.
4. To make recommendations to PDA manufacturers in doing product
design.

Chapter 1 Introduction
6
1.5 Scope of Research
The aim of this project is to use conjoint analysis analyzing the purchase
decision of Hong Kong people on PDA. To narrow down the research scope,
PDA in this project are specifically referring to the PDA installed with Palm OS
or Windows CE. The other operation system (OS) will not be considered
because they are gaining an extremely small market share of PDA.
Also, our project reflects the situation of Hong Kong only. This is because
different consumer in different places may have different preferences for PDA.

Chapter 2
Literature Review

Chapter 2 Literature Review
7
Chapter 2 Literature Review
2.1 What is PDA?
The name of PDA shows the function clearly. It is pocket size, light in weight
and convenience for the users to use it every day. Most PDAs fit comfortably
into the palm of your hand or your shirt pocket. They are too small to have
keyboards, so you input information into the PDA by using a stylus and
"writing" directly into the PDA, or by downloading information into your PDA
from a personal computer (Dickson, 1999).
PDA is your personal assistant that can help you to manage all the jobs.
Your time schedule can be organized efficiently, easily and clearly. There are
many useful functions in order to help you to manage yourself to be better.
You can download your required software from Internet. There are over
thousands of software you can download. Some software are freeware and
some only charge a small amount of fees. Different kinds of software can
help you to do different kinds of work. There are agenda that can divide your
work into different categories. It divides into 4 categories: Today, Tomorrow,
Week and To Do. It reminds you that what thing do you need to do today,
Chapter 2 Literature Review
8
tomorrow or this week. Also, you can download magazine or newspaper
from Internet. Dictionary and novels also can be downloaded into PDA.
Actually, PDA starts the idea of e-book actually. If PDA connects the
earphone, it can play MP3 music too. PDA acts so many roles. You do not
need to bring your MP3 player, mobile phone, dictionary, magazine and your
pocket book. PDA can satisfy all you needs. It is not difficult for you to
know the successful reason of PDA.
For PDA, it can be divided mainly into two operation systems: Palm OS and
Windows CE. Palm OS and Windows CE are totally different operation
system. Palm OS is new system that is designed for PDA only. Simple and
Easy are main characteristics. However, Windows CE is just simple edition
of Windows. All the specific characters can be found, such as start, program
file. Someone think Windows CE is easier to use for the beginner. This is
because Windows are very popular PC operation system. Palm 4.1 and
Pocket CE 2002 are the newest version of operation system. Palm 4.1 can
support 16-bit color and data can exchange from the extra memory extension
freely. Pocket CE 2002 is simple edition of Windows XP. All new interfaces
can give a fresh look to the users. Different brands of PDA are using

Chapter 2 Literature Review
9
different operation system. They cannot change the operation system to
another one. This is because two systems have two different hardware
requirements.
The market share of these two operation systems is greatly different. They
together occupy over 90% of PDA market. There is an unofficial search
showing that the market ratio of Palm OS and Windows CE is 8:2. More
people choose to use PDA which runs on Palm OS. It is because not only
Palm Inc. manufactures PDA that runs Palm OS, but also there are many
companies, such as Sony, to produce PDA that run Palm OS.

Chapter 2 Literature Review
10
2.2 Business environment of PDA products in Hong Kong
PDA products have been found in Hong Kong since 1997, but at that time,
most users were senior executives and professionals. There was very few
companies invested money to produce PDA products at that time. As PDA
products being more popular in the recent few years, many companies like
Sony, NEC etc. also started their PDA product lines. This makes the
competition in the PDA products market becomes very keen in the world.
For example, Palm originally got around 70% market share 1 year ago, but in
the latest report of the PDA products market, Palm only got around 35%
market share in the second quarter of 2001 (李盈節, 14/11/2001).
The market situation is the same in Hong Kong. The competition in the
market is very serious especially after the invention of the new Operation
System (OS) – Windows CE. The market no more be monopolized by one
company (Palm), and shared by two to three large brands and Taiwan brands.
Chapter 2 Literature Review
11
2.3 Consumer Preferences
2.3.1 Concept of Consumer Preferences
Consumer preference is a straightforward concept, consumer preferences for
a good is consumers’ already established preferences (Chernev, 2001).
Extant research demonstrated that consumers with an already established
preference for one of the choice alternatives are likely to interpret the new
information in a biased manner that bolsters the attractiveness of the initially
more preferred option (Chernev, 2001). This is the reason why marketers
would like to know the consumer preferences for a product before the
invention. Consumer purchases are strongly influence by culture, social,
personal and psychological characteristics (Kotler, 1991, p.164-175).
2.3.2 Consumer Preferences for PDA products in Hong Kong
Although PDA is not a new product in the market, it is under the developing
period. Many large companies have just recognized the potential market of
PDA products and designing their own PDA. The consumer preferences for
PDA products is a curial subject for all producers because it is directly linked
to the succeed of their products. It has been a major area of concern of most
marketers and researchers.
Chapter 2 Literature Review
12
As Personal Digital Assistance has just became popular in the recent years,
there were no previous research papers on the consumer preference for PDA
products in Hong Kong. We can consider the previous consumption pattern
of PDA products to guess the consumer preferences for PDA. Most
consumers in Hong Kong perceive that smaller size products equal to high
technology especially for those mobile products. We can see the trend of the
new notebooks and mobile phones in Hong Kong. Consumer may prefer in
the same direction on PDA products. After conducting the research, we can
find more information about the consumer preferences for PDA products in
Hong Kong.

Chapter 2 Literature Review
13
2.4 How people choose PDA?
PDA is a high technology product; the buying process of PDA is high
involvement. When people going to buy a PDA, they must have many
questions in their mind, what operating system (OS) runs the PDA? How
much memory does the PDA have and can you expand it in the future? Is
the screen color or monochromatic? Does it use household or rechargeable
batteries? What accessories are available and how much do they cost
(Benner and Enger, 2001)? These are the questions that consumers ask
frequently but the manufacturers couldn’t get the answer up till now. These
questions are also the most key points to understand the consumer
preferences for PDA.
In our research, these questions will be addressed base on the results
obtained.

Chapter 2 Literature Review
14
2.5 Conjoint Analysis
2.5.1 Concept of Conjoint Analysis
The focus of conjoint analysis is (Green and Srinivasan, 1990) squarely on
the measurement of buyer preferences for product attribute levels (including
price) and the buyer benefits that may flow from the product attributes. (Green
and Krieger, 1991) It provides individual level measures of preferences,
referred to as part-worths, and has been applied extensively to a wide variety
of marketing problems. Conjoint analysis is not a new approach on
marketing research; the concept of conjoint analysis will be discussed below.
Conjoint Analysis is concerned with the joint effect of two or more independent
variables on the ordering of a dependent variable. A definition of conjoint
analysis must proceed from its underlying assumption that a composition rule
may be established to predict a response variable from two or more preditor
variables. Conjoint analysis, like multidimensional sealing, is concerned with
the measurement of psychological judgments, such as “consumer preference”.
(Evans, Moutinho and Raaij, 1999, p.227)

Chapter 2 Literature Review
15
The primary purpose of Conjoint Analysis is to model human behavior, usually
purchase behavior. By measuring purchase interest in a “complete” product
or service, Conjoint Analysis captures the essential dilemma of market choice:
the “perfect” product is seldom available but lesser alternatives are. By
forcing respondents to trade-off competing values and needs, Conjoint
Analysis is able to uncover purchase motivations that the respondent may be
unwilling to admit to and sometimes, may even be unaware that he or she has.
(McCullough)
A traditional measurement technique might elicit values of the importance of
product attributes ranging from “extremely important” to “not at all important”.
This method can, for example, isolate price as the “most important” attribute,
but would give no direction as to what price levels are likely to generate price
resistance. Even if an alternative technique identified particular styles,
brands, and packages that were most preferred, it would give no indication as
to which combination of these characteristics was preferred to another
combination. Conjoint analysis gives managerial direction as to how to
change the product or pricing, whereas other approaches give much less
precise conclusions and direction (Gordon A., 1992).
Chapter 2 Literature Review
16
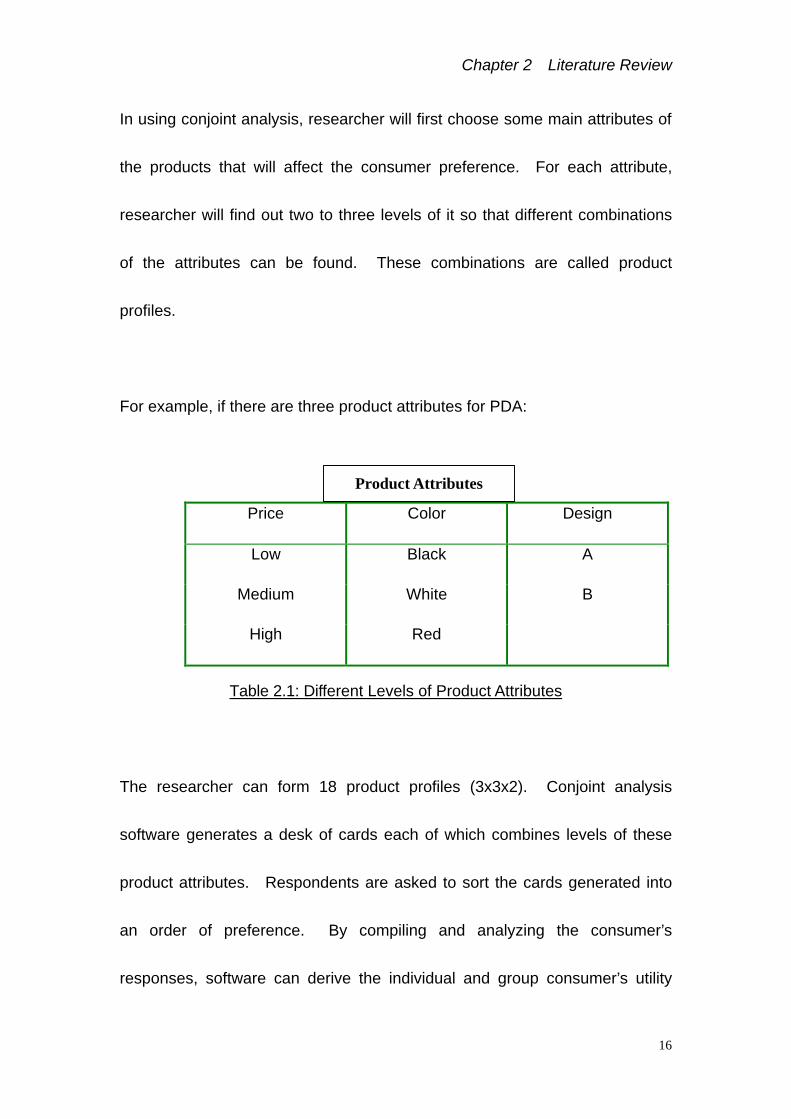
In using conjoint analysis, researcher will first choose some main attributes of
the products that will affect the consumer preference. For each attribute,
researcher will find out two to three levels of it so that different combinations
of the attributes can be found. These combinations are called product
profiles.
For example, if there are three product attributes for PDA:
Price Color Design
Low Black A
Medium White B
High Red
Table 2.1: Different Levels of Product Attributes
The researcher can form 18 product profiles (3x3x2). Conjoint analysis
software generates a desk of cards each of which combines levels of these
product attributes. Respondents are asked to sort the cards generated into
an order of preference. By compiling and analyzing the consumer’s
responses, software can derive the individual and group consumer’s utility
Product Attributes
Chapter 2 Literature Review
17
functions for each attribute.
Utility, sometimes called part worth, is the buying preferences for product
attributes. It can be a number that shows the consumers preference on that
level of attributes, the higher the utility, the stronger the consumer’s
preference for that level of the attribute measure utility. The overall utility of
concepts is determined by calculating the weighted sum of the attribute-level
rankings.
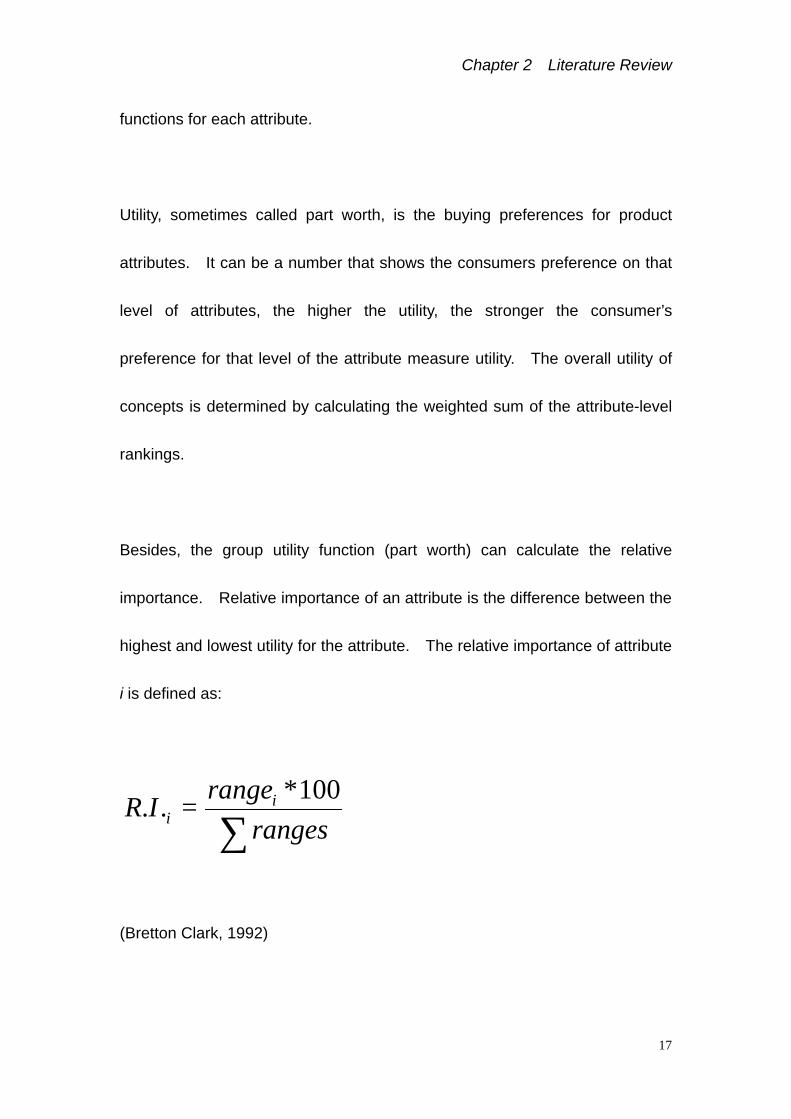
Besides, the group utility function (part worth) can calculate the relative
importance. Relative importance of an attribute is the difference between the
highest and lowest utility for the attribute. The relative importance of attribute
i is defined as:
∑=
rangesrange
IR ii
100*..
(Bretton Clark, 1992)

Chapter 2 Literature Review
18
2.5.2 Conjoint Techniques
The first step in doing Conjoint right is to pick the most appropriate method for
your particular objectives and circumstances. In principle, the right technique
will be the one that most closely mimics your marketplace dynamics.
(McCullough)
There are three types of conjoint technique:
1. Ratings-based Conjoint
Ratings-based Conjoint involves nomadically rating individual product
alternatives or pairwise rating two product alternatives simultaneously.
No-buy options are not easily accommodated in Rating-based Conjoint
(McCullough).
2. Choice-based Conjoint
Choice-based Conjoint offers respondents a series of choice sets, generally
two to five alternative products. Respondents can pick any of the available
alternatives or even elect not to buy, if none of the alternatives in that choice
set are sufficiently attractive. This format closely mimics buying
environments in markets with competition (McCullough).

Chapter 2 Literature Review
19
3. Hybrid techniques
Hybrid techniques, approaches which combine self-explicated scaling with
either Rating-based Conjoint or Choice-based Conjoint, are generally most
appropriate when a large number of attributes must be included (McCullough).
2.5.3 Application of Conjoint Analysis
Marketers and Researchers have long been interested in new product
development. They frequently use conjoint analysis to measure consumer
preferences for alternative product concepts. Conjoint analysis can be used
to design packaging, establish price, rank a hypothetical product against
existing competitors already in the market and suggest modifications to
existing products which would help to strength a product’s preference (Evans,
Moutinho and Raaij, 1999, p.227).
Conjoint analysis can provide answers to several of the questions typically
asked by persons responsible for marketing and planning for consumer and
industrial products and services. The types of output it produces can be
grouped into several broad categories (Wyner, Gordin A., 1992).

Chapter 2 Literature Review
20
1. Understanding Marketing Preferences
2. Predicting Market Choices
3. Developing Market Strategies
4. Segmenting the Market
Researchers not only used conjoint analysis on new product development, but
also on market segmentation. Consumer can be segmented on the basis of
their utility values or attribute importance scores. Simulations can be viewed
as segmentation analyses that group people according to their most preferred
product among the ones available (Wyner, Gordon A., 1992).
The concept of Conjoint Segmentation and Market Simulation will be
discussed below.

Chapter 2 Literature Review
21
2.6 Conjoint Segmentation
2.6.1 Concept of Segmentation
Market segmentation presupposes heterogeneity in buyers’ preferences for
products/services. The goal of segmentation is to obtain groups of
customers that react similarly to elements of the marketing mix such as
product features, price, and promotion. Ideally, customers within each
segment respondent similarly to product and marketing efforts, and differ
strongly from customers in different segments. Segmentation is very
important to all marketers because people with different geographic,
demographic, psychographic and socioeconomic background may have
different needs. Segmentation involves dividing the market into different
segments with homogeneous buying behavior within a segment, but
heterogeneous buying behavior between segments (Evans, Moutinho and
Raaij, 1999, p.126). Therefore, segmenting the market into different
categories and target the potential segment for the product can helps
marketers to achieve the goal of satisfying consumer needs and the succeed
of their product.

Chapter 2 Literature Review
22
Marketers use different segmentation variables to divide the market.
Segmentation variables may be objective and subjective (Evans, Moutinho
and Raaij, 1999, p.123). Those variables like gender, age, and marital status
are objective variables. On the other hand, lifestyle, personality and
purchase intention are subjective variables. Most researchers will collect
these kinds of information for segmentation.
Many large companies also apply segmentation on inventing their products to
the market but a firm must take care to choose its target market segment
carefully. If it picks too narrow a group of segments, it may fail to reach the
volume of sales and profits it needs (Berkowitz, Kerin, Hartley and Rudelius,
2000, p.268).
2.6.2 The Role of Conjoint Analysis in Segmentation
Most methods of segmentation fall far short of the goal of segmentation. The
most common type of segmentation strategy involves grouping customers on
the basis of demographic or other background variables. But these variables
are generally not closely related to the buying behavior of interest.

Chapter 2 Literature Review
23
Conjoint analysis is well suited for the implementation of selected types of
market segmentation (Green and Krieger, 1991). Firstly, the focus of conjoint
analysis is squarely on the measurement of buyer preferences for product
attribute levels and the buyer benefits that may flow from the product
attributes. Also, conjoint analysis is a mirco-based measurement technique.
Part-worth functions are measured at the individual level. Hence, if
preference heterogeneity is present the researcher can find it.
Moreover, conjoint studies typically entail the collection of respondent
background information (e.g., demographic data). One should bear in mind.
However, that buyer background variable, particularly demographic ones, do
not necessarily correlate well with attribute preference.
Lastly, conjoint studies usually include a buyer choice simulation stage in
which the researcher can enter new or modified product profiles and find out
who chooses them versus those of competitors.

Chapter 2 Literature Review
24
2.6.3 Conjoint Segmentation Methods
There are two principal approaches to applied market segmentation.
1. Priori segmentation
In a priori segmentation, the researcher first chooses some variable(s) of
interest (e.g., buyer’s age, gender, principal benefit sought, and current brand)
and then classifies buyers according to that designation (Wind, 1978).
2. Post hoc or cluster-based segmentation
In post hoc or cluster-based segmentation, the researcher chooses a battery
of interrelated variables (e.g., psychographics characteristics, preferences for
various user benefits associated with the product category).
Person-by-variable “scores” then are clustered into person groups whose
average within-group similarity is high and whose between-group similarity is
low (Wind, 1978).

Chapter 2 Literature Review
25
Figure 2.1 is a schematic diagram of the proposed segmentation approach.
The researcher’s initial focus: buyer background characteristics versus
product attribute part-worths (as computed from conjoint analysis). (Green
and Krieger, 1991, p.20-31)
Figure 2.1: Market Segmentation in the Context of Conjoint Analysis
(i) Background characteristics
The researcher either defines a set of a priori target segments or clusters the
battery of background characteristics to find segments.
Chapter 2 Literature Review
26
(ii) Product attribute part-worths
In the a priori approach, the researcher may segment buyers in terms of their
part-worths for one (or one) product attributes. However, in the post hoc
approach, it is the part-worths (or some function of them) that are clustered to
obtain buyer segments having preference similarities across the full set of
attributes. (Green and Krieger, 1991, p. 20-31)
2.6.4 Cluster Analysis
Cluster analysis always is used to do post hoc or cluster-based segmentation.
Cluster analysis can be employed to group respondents with similar
“importance” (i.e. part worth) or similar predicted preferences for the stimuli
(Green and Srinivasan, 1978).
The basic concepts of clustering belong to the biological inheritance of
humans and many other animals. It appears that the concept of "similarity"
is built into the human nervous system. A human being growing up under
primitive conditions, but with a reasonable set of life experiences, would
doubtless form many cluster spontaneously: the cluster of people, the cluster
of birds, the cluster of trees, and so forth. He or she would no doubt

Chapter 2 Literature Review
27
perceive a cat as more similar to a squirrel than a cat to an ant. There are
two main types of data used in clustering. (Green and Srinivasan, 1978)
(i) Multivariate data
Multivariate data gives the values of several variables for several individuals.
(ii) Proximity data
Proximity data consist of proximities among objects of the same kind: either
proximities among individuals, proximities among variables, proximities
among stimuli, or proximities among objects of any single cohesive type.
Proximity refers to a similarity, or dissimilarity, or correlation, or any other
variable for measuring closeness or distance between two objects of a single
type.

Chapter 2 Literature Review
28
There are three types of clustering:
1. Agglomeration
All objects start by being alone in groups of one. Close groups are then
gradually merged until finally all individuals are in a single group.
2. Division
All objects start in a single group. This is then split into two groups; the two
groups are then split, and so on until all objects are in groups of their own.
3. Partitioning
Objects are allowed to move in and out of groups at different stages of the
analysis.

Chapter 2 Literature Review
29
2.7 Market Simulation
Market simulation models are then conducted by first computing product
utilities to determine which product is the most preferred of all those simulated.
The product utility is simply the sum of all the utilities that define a product.
Test market simulation (TMS) can provide a valid framework for evaluating
new products and can establish realistic expectations for them-if the proper
model is used. Simulations can answer important questions about whether
the core strategic concept, advertising program, packaging, name, and
product work together to produce the trial and repeat satisfaction levels
necessary to meet business goals. Also, test market simulation has
established an impressive track record. The primary application of TMS is the
assessment of a new product's survivability. It is also useful in evaluating
such strategic marketing plan elements as: 1. price, 2. positioning, 3.
packaging, 4. formulation, 5. source of volume, 6. sampling effectiveness, and
7. shelf location. If TMS is used with early test markets, it will provide time to
react to projections of trial, repeat, and buying rates. TMS is a good tool, but
it should not be used in isolation; its strength lies in its ability to evaluate
elements in combination (Anonymous, 1982, p.10).
Chapter 2 Literature Review
30
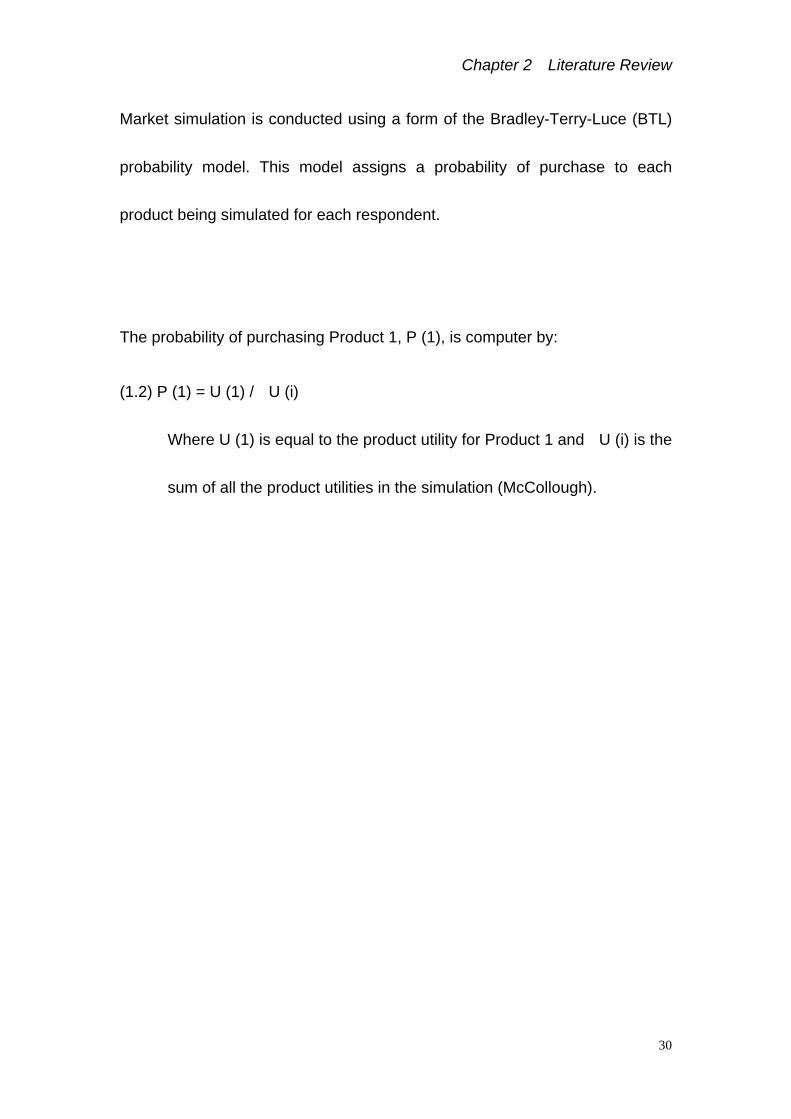
Market simulation is conducted using a form of the Bradley-Terry-Luce (BTL)
probability model. This model assigns a probability of purchase to each
product being simulated for each respondent.
The probability of purchasing Product 1, P (1), is computer by:
(1.2) P (1) = U (1) / U (i)
Where U (1) is equal to the product utility for Product 1 and U (i) is the
sum of all the product utilities in the simulation (McCollough).

Chapter 3
Methodology

Chapter 3 Methodology
31
Chapter 3 Methodology
In this part, we will talk about the design of our research and the questionnaire.
Our research will be divided into two stages: Exploratory Research and
Descriptive Research.
3.1 Exploratory Research
Exploratory research can help us to understand what consumers concern with
when choosing PDA. It is used when one is seeking insights into the general
nature of a problem, the possible decision alternatives, and relevant variables
that need to be considered. After the exploratory research, the main features
of PDA, that consumers are used to evaluate the buying decision, can be
found.
(i) Primary data collection
We had conducted an in-depth interview consisting of 20 current PDA users
from our schoolmates in Lingnan University. The aim of such in-depth
interview was to collect the consumer consideration when they made the
buying decision. What features of PDA are the most considerable?

Chapter 3 Methodology
32
Brand name, type of external memory interface, size, screen, operation
system and price are the main feature of PDA. All the above are evaluated
by the consumer when they are making buying decision. However, in the
research, the last four features are used. Brand name is not used because it
is affected by another feature of PDA, when the consumer decides to use
Palm OS. Then, he cannot choose HP PDA. This is because HP does not
introduce the PDA that is using Palm OS.
Besides, different electric manufacturer introduces different type of external
memory interface. So, it cannot be compared because consumer cannot
choose to use what type of external memory interface freely. If consumer
chooses this model, he must use this interface as the external memory.
Chapter 3 Methodology
33
(ii) Secondary data collection
We collected information on history, development and the market share of
PDA from the books, journals, articles, Internet and the resources of library in
Lingnan University and other universities.
Above information and tentative explanation or hypothesis would work as
specific guides for the design of descriptive and causal research.

Chapter 3 Methodology
34
3.2 Descriptive Research
Descriptive Research is the most important part of our study. We base on
the result found in the exploratory research, and design a questionnaire to
conduct a research on people’s background information and their preferred
combination of different levels of product attributes.
Sampling Method
Population
As we are going to find out the consumer preference
for PDA products in Hong Kong, the population of
our research should be all Hong Kong citizens.
Sampling Frame
Because PDA is a high technology product, not all
people have experience on using PDA or even know
what it is, so we must set a frame for our sample
population. The sample frame usually is a list of
population members used to obtain a sample
(Kumar, Aaker and Day; p.371; 1999). The
sampling frame of our study is the combination of
current PDA users and potential PDA buyers who
want to buy a PDA with 3-6 months.

Chapter 3 Methodology
35
Sampling Size Under the limited resources we have, we decided to
take around 200 samples for our study.
Sampling Process
We will use convenience-sampling method for our
research. It means that select samples in
computer shopping malls. The procedure is simply
to contact sampling units that are convenient
(Kumar, Aaker and Day; p.384; 1999). We planned
to assign researchers to different large computer
malls in different districts like Wan Chai, Mongkok
etc. They will select samples beside the shops that
selling PDA products. Those potential buyers or
users will be selected for face-to-face interview. It
is because potential buyers will go to the shop to
gather information of PDA and users will go there to
buy peripheral products for their PDA. Besides, we
also planned to interview the potential buyers
outside some large chain electric appliances shops
like Fortress or Broadway. It is because potential
buyers will also go to these shops to buy PDA
products. Before we start to do the questionnaire,
we need to ask a question to confirm the respondent
that he/she decides to buy a PDA within 3-6 months.
We start our interview under the respondent decides
to buy a PDA in the coming half year.

Chapter 3 Methodology
36
3.3 Questionnaire Design
We will divide the questionnaire into two main parts; the data from the first part
will be used for the conjoint analysis, segmentation and market simulation.
The data from the second part will be used to understand the consumers’
attitude on buying high technology digital products.
3.3.1 Pre-Test
Before we start our data collection. Pre-test was done in order to ensure that
the questionnaire met our expectations in terms of the information that will be
obtained. 20 respondents completed questionnaires. We collected all
questionnaires and made some corrections.
The number of card for product profiles was reduced. By using these
different levels of attributes, we made total 24 (3x2x2x2) product profiles out.
We made 24 cards for the 24 product profiles. In part 1 for the questionnaire,
the interviewee was required to rank the cards according to their preference.
However, after the pre-test, we reduced the number of attributes from 24 to 16
(2x2x2x2). This was because we found that the interviewees felt annoyance
since the numbers of cards were too many.

Chapter 3 Methodology
37
Also, some questions were rewritten in order to clear the meaning of
questions.
3.3.2 Questionnaire Part 1
After analyzed the result from the exploratory research, we found out some
most important attributes with different levels of PDA. There are four main
attributes that consumers most concern with (listed with different levels of
attributes):
1. Price
w High -- above $2,500
w Low -- $1,000 to $2,500
2. Operation System
w Palm OS
w Windows CE
3. Screen Display
w Color Display (16-bit)
w Monochromatic Display

Chapter 3 Methodology
38
4. Type of Battery
w Li-ion rechargeable battery
w AAA battery
By using these different levels of attributes, we can make total 16 (2x2x2x2)
product profiles out. In this part, we will make cards for the 16 product
profiles and request the interviewees to rank the cards according to their
preferences. In order to increase the respondents’ interest to this part, we
will design a cardboard with holder number 1 to 16 and ask the interviewees
put the cards into the holders by themselves.
3.3.3 Questionnaire Part 2 and Part 3
In this part, questions will be asked to the interviewees. The questions are
going to collect the demographic information of the interviewees. Besides, 5
questions are used to find the consumers’ attitude to high technology digital
products.
Chapter 3 Methodology
39
3.4 Data Analysis
3.4.1 Part 1 Data
After get the ranking of the product profiles, we will input the data to the
software Conjoint Analyzer to find out the results. Group utility function
(part-worth) and relative importance indexes will be obtained.
Besides, we will also use the data file from Conjoint Analyzer to run the
segmentation (cluster analysis) in the software Conjoint Segmenter. The
number of segments and the preferences of the respondents from different
segments will be obtained.
Lastly, we will use software Simgraf to do the market simulation. There are
two basic types of simulation models in the software. The first type is called
the First Choice model, or the maximum utility model. The second type of
model is the Probabilistic model. In the data analysis part, we will use First
Choice model because it does best when there is less noise in the data and
Probabilistic model does better for simulating frequently purchased products.
The First Choice model assumes that a respondent will choose the product
with the highest utility to him.

Chapter 3 Methodology
40
Three products will be chosen and test the respondents preferences (i.e.
part-worth) on them. We will choose two existing PDA in the market and one
new product which designed by us according to the information from the
exploratory research.
The three test products for market simulation are:
1. Product 1 (Sony 760C)
The price of this model is around $3,500 in the market. It is equipped
with color screen and installed with Palm OS version 4.1. This model
uses Li-ion battery. Therefore the product profile is:
Price Operation System Screen Display Types of
Battery
Above $2500 Palm OS Color Display Li-ion Battery
Table 3.1: Product 1 Profile

Chapter 3 Methodology
41
2. Product 2 (Palm M105)
The price of this model is around $1,200 in the market. It is equipped
with monochromatic screen and installed with Palm OS version 3.5.
This model uses AAA battery. Therefore the product profile is:
Price Operation System Screen Display Types of Battery
$1000 to $2500 Palm OS Monochromatic Display AAA Battery
Table 3.2: Product 2 Profile
3. Product 3 (Self-Designed)
The price of this model will be around $2,000 in the market. It will be
equipped with color screen and installed with Win CE version Pocket CE
2002. This model will use Li-ion battery. Therefore the product profile
is:
Price Operation System Screen Display Types of Battery
$1000 to $2500 Win CE Color Display Li-ion Battery
Table 3.3: Product 3 Profile
Chapter 3 Methodology
42
We design this product for market simulation because there are no
existing PDA operating with Win CE and color display which are priced in
between $1,000 and $2,500. We only can find color PDA, which
operating with Palm OS, is priced under $2,500 in the market.
The software Simgraf will calculate out the market share of these three
products.
We will write our report base on those conjoint analysis results from three
software; all the three software were written by Bretton Clark.
3.4.2 Part 2 Data
We will use SPSS (Statistical Package for the Social Sciences) to do different
tests and get the results for the data. We will run t-test or ANOVA test in
order to find out results that are useful for us to investigate our problems.
We can see the significances of the differences between two variables. In
addition, we will run cross tabulation between the questions to see the
frequencies distribution over different variables. Analytical reports will be
written based on the information generated from the SPSS.

Chapter 3 Methodology
43
3.4.3 Part 3 Data
The data in part 3 of the questionnaire will be used to do analysis with the
data in part 2. Part 3 data are demographic data which used to find out the
attitude difference between respondents with different background.

Chapter 4
Results and Analysis

Chapter 4 Results and Analysis
44
Chapter 4 Results and Analysis
4.1 Respondents Profile
In the research, we had finished 200 completed questionnaires. Since we
need to do the conjoint analysis, we needed our respondent to help us to rank
the card of the product in part 1, so our success rate was 100%. The follows
were results and analysis of the research.
Factors Variables Frequency Valid Percentage
Female 59 29.5 Gender
Male 141 70.5
16-22 48 24.1
23-29 98 49.2
30-37 34 17.1
38-44 14 7.0
Age
45 or above 5 2.5
$10,000 or below 54 27.6
$10,001 - $20,000 64 32.7
$20,001 - $30,000 45 23.0
$30,001 - $40,000 15 7.7
Monthly Income
$40,001 or above 18 9.2
Student 28 14.1
Blue Collar 22 11.1
Clerical 64 32.2
Management 38 19.1
Self-employed 21 10.6
Housewife 5 2.5
Occupation
Others 21 10.6
Table 4.1: Demographic Information of Total Respondents

Chapter 4 Results and Analysis
45
(i) Gender distribution
Around 70% of the respondents were male; the proportion of male and female
had a great difference.
70.5%
29.5%
Female
Male
Figure 4.1: Gender Distribution
(ii) Age distribution
Age group was divided into five categories. A great majority of the
respondents were aged between 23-29 and the second largest group aged
16-22 accounted for 24.1%. Only 5 respondents were aged 45 or above.
49.2%
17.1%7.0% 2.5% 24.1%
16-22
23-29
30-37
Figure 4.2: Age Distribution

Chapter 4 Results and Analysis
46
(iii) Monthly income level
There were 5 monthly income categories. Almost four of five of our
respondents earned less than $30,000 per month. The largest monthly
income group of the respondents earned $10,001 - $20,000. 16.9% earned
more then $30,000.
27.5%
32.6%
23.0%
7.7%9.2%
$10,000 or Below
$10,001-$20,000
$20,001-$30,000
$30,001-$40,000
$40,001 or Above
Figure 4.3: Monthly Income Level

Chapter 4 Results and Analysis
47
(iv) Occupation distribution
The occupation of the respondents was classified into 7 categories. Among the
respondent, most of them are clerical and management. Only 5 respondents
were housewife.
10.6%2.5%
10.6%
19.1% 32.1%
11.1%14.1%
Student
Blue Collar
Clerical
Management
Self-EmployedHousewife
Others
Figure 4.4: Occupation Distribution
Chapter 4 Results and Analysis
48
4.2 Conjoint Analysis Results
There were three parts of finding in conjoint analysis. In our research, 200
respondents were asked to rank the 16 product profiles, which with different
combinations of attributes, according to their own preferences. The data was
input into three different software: Conjoint Analyzer, Conjoint Segmenter and
Simgraf.
Firstly, we input the data into the software Bretton-Clark “Conjoint Analyzer”,
we got the group utility function (part-worth) and the relative importance
indexes. Besides, we also used Bretton-Clark “Conjoint Segmenter” to find
the different segments of the respondents based on cluster analysis. Lastly,
Bretton-Clark “Simgraf” was also be used to do market simulations and know
how each respondents would choose among alternative products.
Chapter 4 Results and Analysis
49
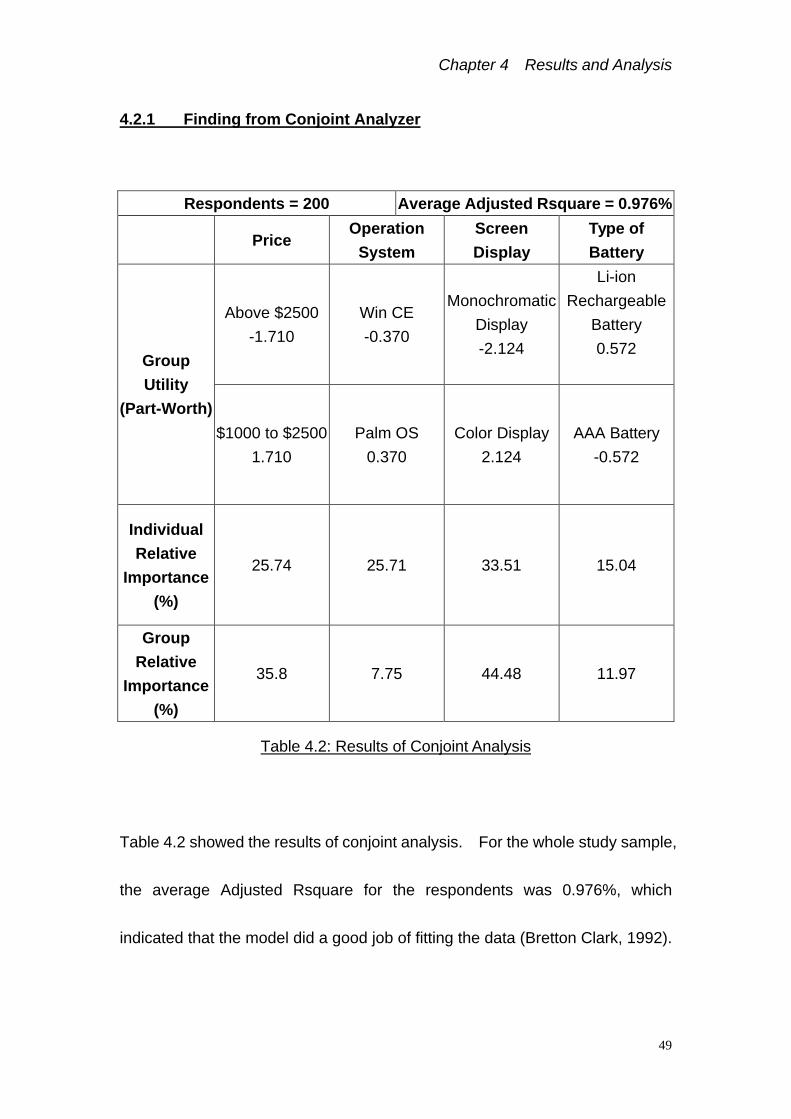
4.2.1 Finding from Conjoint Analyzer
Table 4.2: Results of Conjoint Analysis
Table 4.2 showed the results of conjoint analysis. For the whole study sample,
the average Adjusted Rsquare for the respondents was 0.976%, which
indicated that the model did a good job of fitting the data (Bretton Clark, 1992).
Respondents = 200 Average Adjusted Rsquare = 0.976%
Price Operation
System Screen Display
Type of Battery
Above $2500 -1.710
Win CE -0.370
Monochromatic Display -2.124
Li-ion Rechargeable
Battery 0.572
Group Utility
(Part-Worth)
$1000 to $2500 1.710
Palm OS 0.370
Color Display 2.124
AAA Battery -0.572
Individual Relative
Importance (%)
25.74 25.71 33.51 15.04
Group Relative
Importance (%)
35.8 7.75 44.48 11.97

Chapter 4 Results and Analysis
50
4.2.1.1 Utility Estimation
The most positive utility score indicates the most preferred level for that
attribute. But in the case if respondents in the study are heterogeneous (i.e.
half the respondents strongly prefer level 1 of a attribute, while the other half
equally strongly prefer level 2 of a attribute), the group utility function will be
misleading. It is because the two attribute levels neutralize each other, so
that the part-worth for both levels of the attribute will be zero or nearly zero.
When there is heterogeneity, use of group data will lead to aggregation error
(Bretton Clark, 1992).
Table 4.3 showed the distribution of preferred levels for the four attributes in
our model which can be used to see the heterogeneity of the preferences of
the respondents. The table displayed the percentage of respondents that
“preferred” each of its level. The results suggested that respondents had very
different preferences for operation systems (51.5% for Win CE and 48.5% for
Palm OS) but they had similar preferences for the other three attributes (all
around 90% versus 10%).

Chapter 4 Results and Analysis
51
Table 4.3: Distribution of Preferred Levels
Because of the heterogeneity on operation systems, we can ignore the group
utility function of it, but we found that number of respondents preferred Win CE
was almost the same as the number of respondents preferred Palm OS. For
price, screen display and types of battery, respondents were homogenous; we
could analyze their part-worth to know the consumer preferences on these
attributes. The table 4.3 above and figure 4.5 below showed the utility
functions of the levels of attributes. Firstly, respondents strongly preferred
lower price ($1000 to $2500) in buying PDA, the part-worth of it was 1.710 and
the part-worth of price above $2500 was –1.710. This was very easy to
Above $2500
4.5%
$1000 to $2500
95.5%
Win CE
51.5%
Palm OS
48.5%
Monochromatic Display
8.5%
Color Display
91.5%
Li-ion Rechargeable Battery
88.75%
AAA Battery
11.25%

Chapter 4 Results and Analysis
52
understand because rational consumers prefer lower prices to higher prices.
Secondly, respondents preferred color display rather than monochromatic
display in buying PDA, the part-worth was –2.124 for monochromatic display
and 2.124 for color display. The reasons might be color display was trendier
and more attractive than monochromatic display. Besides, color display
could show a higher resolution than monochromatic display. Lastly, for types
of battery, the part-worth of Li-ion rechargeable battery was 0.572 and the
part-worth of AAA battery was –0.572. It was because Li-ion rechargeable
battery was cost-effective. In addition, Li-ion rechargeable battery could
operate longer time on color display than AAA battery.

Chapter 4 Results and Analysis
53
Price
-2.5
-1.5
-0.5
0.5
1.5
2.5
Above $2500 $1000 to $2500
Level of Attributes
Uti
lity(
Par
t-W
ort
h)
Screen Display
-2.5
-1.5
-0.5
0.5
1.5
2.5
Monochromatic Color
Level of Attributes
Uti
lity(
Par
t-W
ort
h)
Type of Battery
-2.5
-1.5
-0.5
0.5
1.5
2.5
Li-ion Battery AAA Battery
Level of Attributes
Uti
lity(
Par
t-W
ort
h)
Figure 4.5: Utility Functions (Part-Worth) Based on Conjoint Analysis

Chapter 4 Results and Analysis
54
4.2.1.2 Relative Importance
There were two different relative importance indexes generated from the
Conjoint Analyzer, one was the individual relative importance percentage and
the other one was the group relative importance percentage. The group
relative importance is calculated by using the group utility function (part-worth).
In our research, the group utility function of operation system was misleading;
the part-worth of both levels were nearly zero, thus the group relative
importance of operation system was also nearly zero. Therefore, we would
like to ignore the group relative importance indexes and analyze the individual
relative importance indexes which were more reliable. The individual relative
importance indexes of the four attributes were price 25.74%, operation system
25.71%, screen display 33.51% and types of battery 15.04%. The results
suggested that respondents concerned with screen display as the most
important attribute in buying PDA. After that, they would concern price or
operation system, which with very similar relative importance.
Lastly, respondents concerned with the types of battery that the PDA used.
Respondents concerned with screen display as most important because PDA

Chapter 4 Results and Analysis
55
with color screen had more multimedia functions, e.g. showing short clip movie
and displaying photos, than PDA with monochromatic screen. Besides, as
mentioned above, color screen was trendier than monochromatic screen.
The results from the part two of our research also showed that owners bought
PDA because of functions and trendy.

Chapter 4 Results and Analysis
56
4.2.2 Findings from Conjoint Segmenter
Conjoint segmenter calculated the similarity of the respondents’ utilities. The
number of clusters and the distance were shown in the table below.
Figure 4.6: Amount of Variability Based on Number of Clusters
The larger the distance in the above figure, the larger the variability within each
cluster. As the number of clusters increased, the amount of variability within
clusters decreased. Distance decreased sharply at first, and then leveled out.
The place where distances started to level out was the “elbow” which indicated
the appropriate number of clusters or segments (Bretton-Clark, 1992). There

Chapter 4 Results and Analysis
57
were two significant “elbow” in our research, five-segment solution and
nine-segment solution. We analyzed both cases and found that the
nine-segment solution had many insignificant small groups which only
accounted for 4.5% to 5% of the total number of respondents (please refer to
appendices F). We finally chose five-segment solution for our research.

Chapter 4 Results and Analysis
58
The five segments that generated by Conjoint Segmenter were listed below:
Group 1
Attributes Utility Function (Part-Worth) Relative
Importance
Price Above $2500
-1.584 $1000 to $2500
1.584 24.44%
Operation System
Win CE 0.573
Palm OS -0.573
8.85%
Screen Display
Monochromatic Display -3.741
Color Display 3.741
57.73%
Types of Battery
Li-ion Rechargeable Battery 0.582
AAA Battery -0.582
8.98%
Table 4.4: Respondents’ Preferences for Group 1
There were 58 respondents in Group 1 which accounted for 29% of total
respondents. There preferred color display and Li-ion rechargeable battery in
buying PDA. Besides, they liked PDA running under Win CE and cheap in
price ($1000 to $2500). The respondents were more concerned with screen
display than all other three attributes. Then they more concerned with price
than operation system and types of battery. They did not concern too much
on both operation system and types of battery in buying PDA.
Chapter 4 Results and Analysis
59
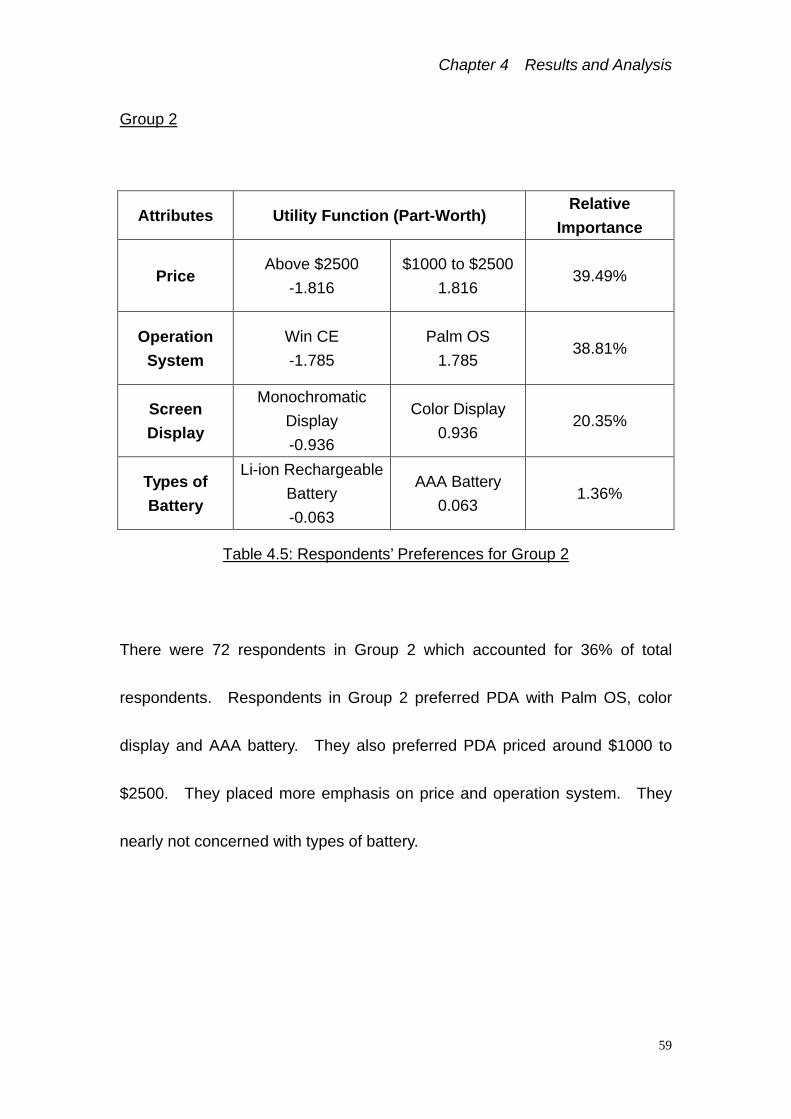
Group 2
Attributes Utility Function (Part-Worth) Relative
Importance
Price Above $2500
-1.816 $1000 to $2500
1.816 39.49%
Operation System
Win CE -1.785
Palm OS 1.785
38.81%
Screen Display
Monochromatic Display -0.936
Color Display 0.936
20.35%
Types of Battery
Li-ion Rechargeable Battery -0.063
AAA Battery 0.063
1.36%
Table 4.5: Respondents’ Preferences for Group 2
There were 72 respondents in Group 2 which accounted for 36% of total
respondents. Respondents in Group 2 preferred PDA with Palm OS, color
display and AAA battery. They also preferred PDA priced around $1000 to
$2500. They placed more emphasis on price and operation system. They
nearly not concerned with types of battery.

Chapter 4 Results and Analysis
60
Group 3
Attributes Utility Function (Part-Worth) Relative
Importance
Price Above $2500
-1.758 $1000 to $2500
1.758 24.73%
Operation System
Win CE 1.901
Palm OS -1.901
26.74%
Screen Display
Monochromatic Display -1.906
Color Display 1.906
26.81%
Types of Battery
Li-ion Rechargeable Battery 1.544
AAA Battery -1.544
21.72%
Table 4.6: Respondents’ Preferences for Group 3
There were total 48 respondents in Group 3 which accounted for 24% over the
200 respondents. The respondents here again preferred Palm OS, color
display and Li-ion rechargeable battery. As the same as the above two
groups, respondents preferred cheaper priced PDA ($1000 to $2500). The
respondents in Group 3 concerned almost equally on the four attributes in
buying PDA; relative importance ranged from 21% to 26%.

Chapter 4 Results and Analysis
61
Group 4
Attributes Utility Function (Part-Worth) Relative
Importance
Price Above $2500
-2.000 $1000 to $2500
2.000 26.67%
Operation System
Win CE -4.000
Palm OS -4.000
53.33%
Screen Display
Monochromatic Display -1.000
Color Display 1.000
13.33%
Types of Battery
Li-ion Rechargeable Battery 0.500
AAA Battery -0.500
6.67%
Table 4.7: Respondents’ Preferences for Group 4
There were 13 respondents in Group 4 which accounted for 6.5% of total
respondents. Respondents preferred cheap PDA ($1000 to $2500) with Palm
OS, color display and Li-ion rechargeable battery. They placed most
emphasis on operation system. Then they more concerned with price than
screen display. The types of battery is least concerned.

Chapter 4 Results and Analysis
62
Group 5
Attributes Utility Function (Part-Worth) Relative
Importance
Price Above $2500
-1.000 $1000 to $2500
1.000 13.33%
Operation System
Win CE 2.000
Palm OS -2.000
26.67%
Screen Display
Monochromatic Display -4.000
Color Display 4.000
53.33%
Types of Battery
Li-ion Rechargeable Battery 0.500
AAA Battery -0.500
6.67%
Table 4.8: Respondents’ Preferences for Group 5
There were only 9 respondents in the last group which accounted for 4.5% of
total respondents. The 9 respondents most concerned with screen display
and least concerned with types of battery. They preferred color display, Li-ion
battery, Palm OS and price at around $1000 to $2500.
We had an overlook on the segments of potential customers of PDA and
understood their preferences through the results from Conjoint Segmenter.

Chapter 4 Results and Analysis
63
4.2.3 Findings from Simgraf
After input the product profiles that we used for market simulation model (First
Choice model) to the software Simgraf, it would calculate the market share of
each product profile according to the respondents’ highest utility option. The
results from the Simgraf were list in the table below:
Product Profiles Market Share
Product 1 (Sony 760C) 20.5%
Product 2 (Palm M105) 23.5%
Product 3 (Self Designed) 56%
Table 4.9: Market Share of the Three Product Profiles in the Market Simulation
Model (First Choice Model)
From the results, we found that Product 1 accounted for 20.5% of the market,
Product 2 accounted for 23.5% of the market and Product 3 accounted for 56%
of the market.
According to the results from the Conjoint Segmenter, all segments of
respondents also had higher utility point for cheap ($1,000 to $2,500) PDA

Chapter 4 Results and Analysis
64
than expensive one (Above $2,500). It was the main reason why Product 1
only accounted for a small part of the market in the simulation model.
For Product 2, although it was cheap, it operated with monochromatic screen
display which was not matched with the respondents’ preferences. In the five
segments generated by Conjoint Segmenter, all respondents showed that they
preferred a PDA with color screen display.
For the product that designed by us (Product 3), it matched most respondents’
preferences. It accounted for half of the market share.
According to these results, we had made some recommendations to the
manufactures in the next chapter.

Chapter 4 Results and Analysis
65
4.3 Data Analysis Results
4.3.1 The Relationship Between Gender and PDA User
According to table 4.10, the result between Female and Male had a great
difference. For Female, nearly 80% female respondents were not a PDA user.
However, over half male respondents were PDA users.
Gender
Female Male
Total
Count 12 75 87
% within Gender 20.3% 53.2% 43.5%
Yes
% of total 6.0% 37.5% 43.5%
Count 47 66 113
% within Gender 79.7% 46.8% 56.5%
No
% of total 23.5% 33.0% 56.5%
Count 59 141 200
% within Gender 100.0% 100.0% 100.0%
Total
% of total 29.5% 70.5% 100.0%
Table 4.10: The Relationship Between Gender and PDA User

Chapter 4 Results and Analysis
66
4.3.2 The Relationship Between Age and PDA User
According to the results from the respondents, the difference between PDA
user and Non-PDA user in different age groups was not so significant. Only
two aged groups had difference. 80% of aged 45 or above was using PDA.
However, over 62% of aged 23-29 answered they were Non-PDA user.
Age
16-22 23-29 30-37 38-44 45 or above
Total
Count 20 37 18 7 4 86
% within Age 41.7% 37.8% 52.9% 50.0% 80.0% 43.2%
Yes
% of Total 10.1% 18.6% 9.0% 3.5% 2.0% 43.2%
Count 28 61 16 7 1 113
% within Age 58.3% 62.2% 47.1% 50.0% 20.0% 56.8%
No
% of Total 14.1% 30.7% 8.0% 3.5% 0.5% 56.8%
Count 48 98 34 14 5 199
% within Age 100.0% 100.0% 100.0% 100.0% 100.0% 100.0%
Total
% of Total 24.1% 49.2% 17.1% 7.0% 2.5% 100.0%
Table 4.11: The Relationship Between Age and PDA User
Chapter 4 Results and Analysis
67
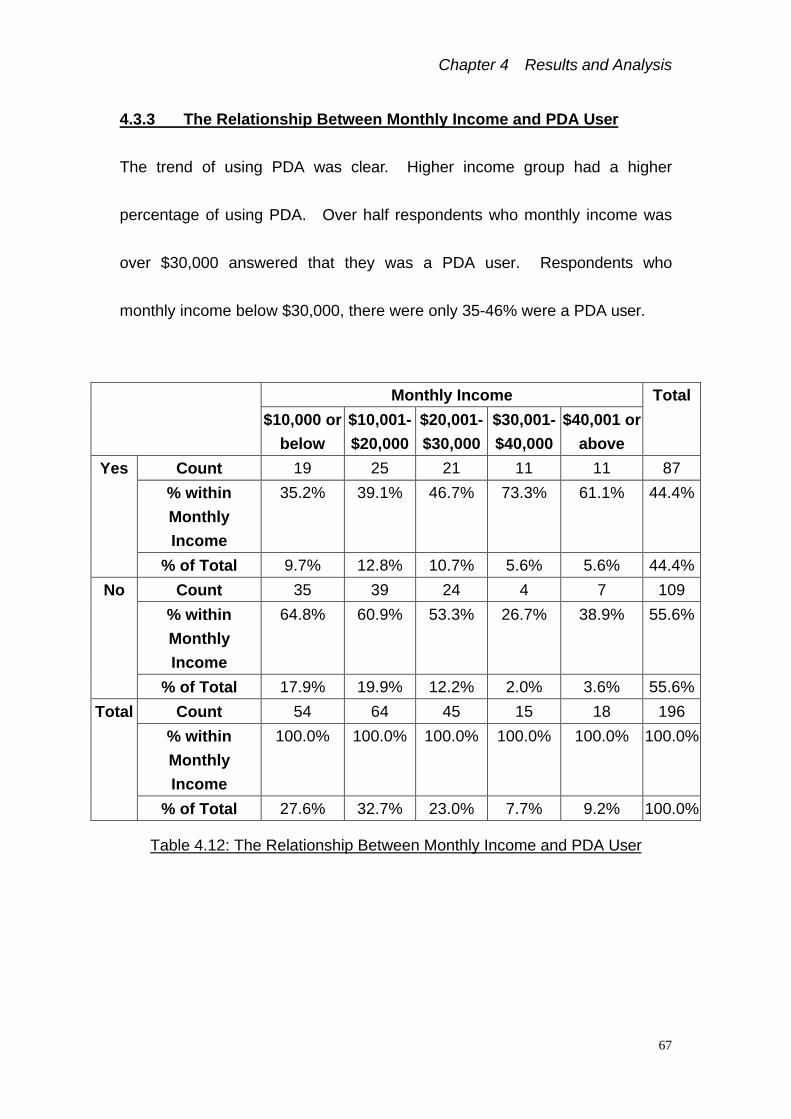
4.3.3 The Relationship Between Monthly Income and PDA User
The trend of using PDA was clear. Higher income group had a higher
percentage of using PDA. Over half respondents who monthly income was
over $30,000 answered that they was a PDA user. Respondents who
monthly income below $30,000, there were only 35-46% were a PDA user.
Monthly Income
$10,000 or below
$10,001- $20,000
$20,001- $30,000
$30,001- $40,000
$40,001 or above
Total
Count 19 25 21 11 11 87
% within Monthly Income
35.2% 39.1% 46.7% 73.3% 61.1% 44.4%
Yes
% of Total 9.7% 12.8% 10.7% 5.6% 5.6% 44.4%
Count 35 39 24 4 7 109
% within Monthly Income
64.8% 60.9% 53.3% 26.7% 38.9% 55.6%
No
% of Total 17.9% 19.9% 12.2% 2.0% 3.6% 55.6%
Count 54 64 45 15 18 196
% within Monthly Income
100.0% 100.0% 100.0% 100.0% 100.0% 100.0%
Total
% of Total 27.6% 32.7% 23.0% 7.7% 9.2% 100.0%
Table 4.12: The Relationship Between Monthly Income and PDA User

Chapter 4 Results and Analysis
68
4.3.4 The Relationship Between Occupation and PDA user
Table 4.13: The Relationship Between Occupation and PDA User
In table 4.13, management and self-employed were the main PDA user.
65.8% respondents who were doing management were using PDA. Nearly
half of self-employed respondents were a PDA user (47.6%). However, over
half of student, blue collar, clerical and housewife were a Non-PDA user with a
percentage of 57.1%, 59.1%, 64.1%, 52.4% and 100% respectively.
Occupation
Student Blue
Collar
Clerical Management Self-
Employed
Housewif
e
Other
s
Total
Yes Count 12 9 23 25 10 8 87
% within
Occupation
42.9% 40.9% 35.9% 65.8% 47.6% 38.1% 43.7%
% of Total 6.0% 4.5% 11.6% 12.6% 5.0% 4.0% 43.7%
No Count 16 13 41 13 11 5 13 112
% within
Occupation
57.1% 59.1% 64.1% 34.2% 52.4% 100.0% 61.9% 56.3%
% of Total 8.0% 6.5% 20.6% 6.5% 5.5% 2.5% 6.5% 56.3%
Total Count 28 22 64 38 21 5 21 199
% within
Occupation
100.0% 100.0
%
100.0% 100.0% 100.0% 100.0% 100.0
%
100.0%
% of Total 14.1% 11.1% 32.2% 19.1% 10.6% 2.5% 10.6% 100.0%

Chapter 4 Results and Analysis
69
4.3.5 The Difference Point of View About Electronic Product Among
Different Gender
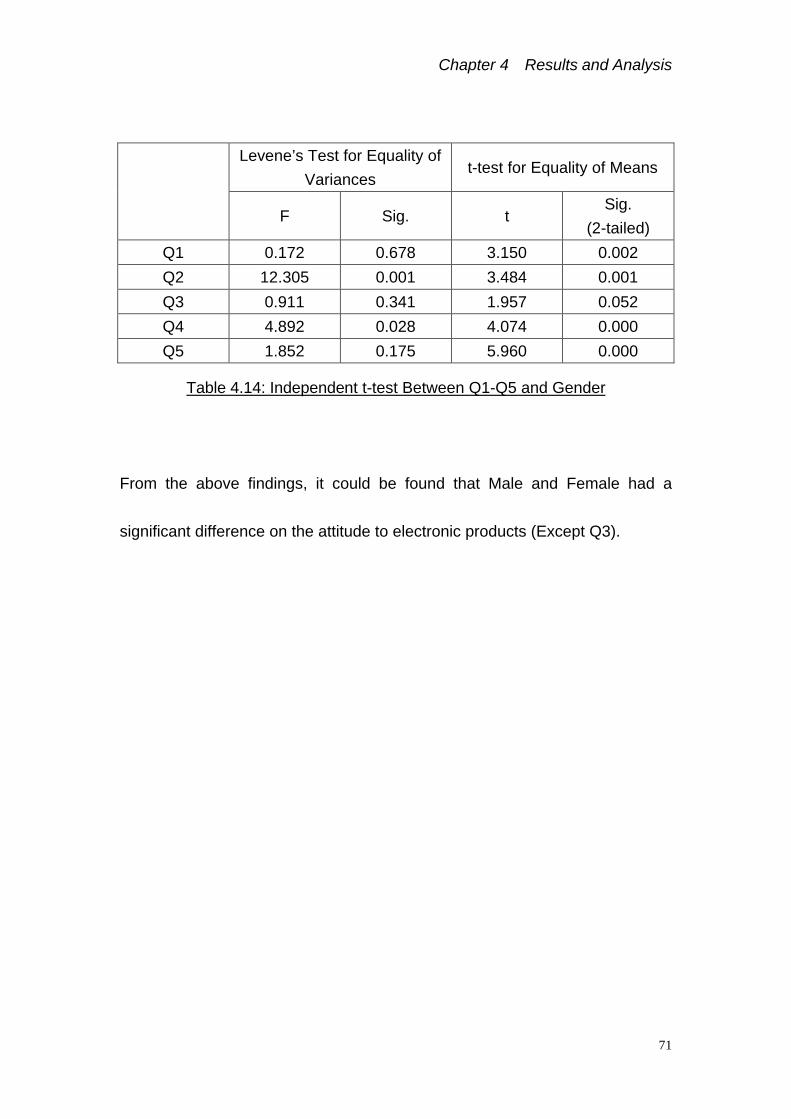
Table 4.14 was showing the independent groups t-test for the difference
between Male and Female about the feeling of electric product. Levene ‘s
Test for Equality of Variances was used to classify the null hypothesis was no
difference between the variances or not.
Q1: Do you agree the electric product can improve your living standard?
Q5: How likely you would buy a new model of electronic product?
According to Table 4.14, a probability of Q1 and Q5 were 0.678 and 0.175
(much greater than 0.05). It indicated that there were no variances. Using
the Equal variance estimate information, the associated probabilities of
support for the null hypothesis of no difference between Male and Female
were 0.002 and 0.000 (2-tailed sig.). Two groups differed significantly.

Chapter 4 Results and Analysis
70
Q2: Do you agree using high technology product represent high status?
Q4: How likely you search information of new electronic products?
A probability of Q2 and Q4 were 0.001 and 0.028 (much smaller than 0.05). It
indicated that there were variances. Using Unequal variance estimate
information, the associated probability between Male and Female were 0.001
and 0.000 (2-tailed sig.). Two groups differed significantly.
Q3: How likely you would buy a high-technology product?
A probability was 0.341 (much greater than 0.05) indicated that there was no
variance. Using Equal variance estimate information, the associated
probability between Male and Female was 0.052. The difference between
two groups was not significant.
Chapter 4 Results and Analysis
71
Levene’s Test for Equality of Variances
t-test for Equality of Means
F Sig. t Sig.
(2-tailed)
Q1 0.172 0.678 3.150 0.002
Q2 12.305 0.001 3.484 0.001
Q3 0.911 0.341 1.957 0.052
Q4 4.892 0.028 4.074 0.000
Q5 1.852 0.175 5.960 0.000
Table 4.14: Independent t-test Between Q1-Q5 and Gender
From the above findings, it could be found that Male and Female had a
significant difference on the attitude to electronic products (Except Q3).
Chapter 4 Results and Analysis
72
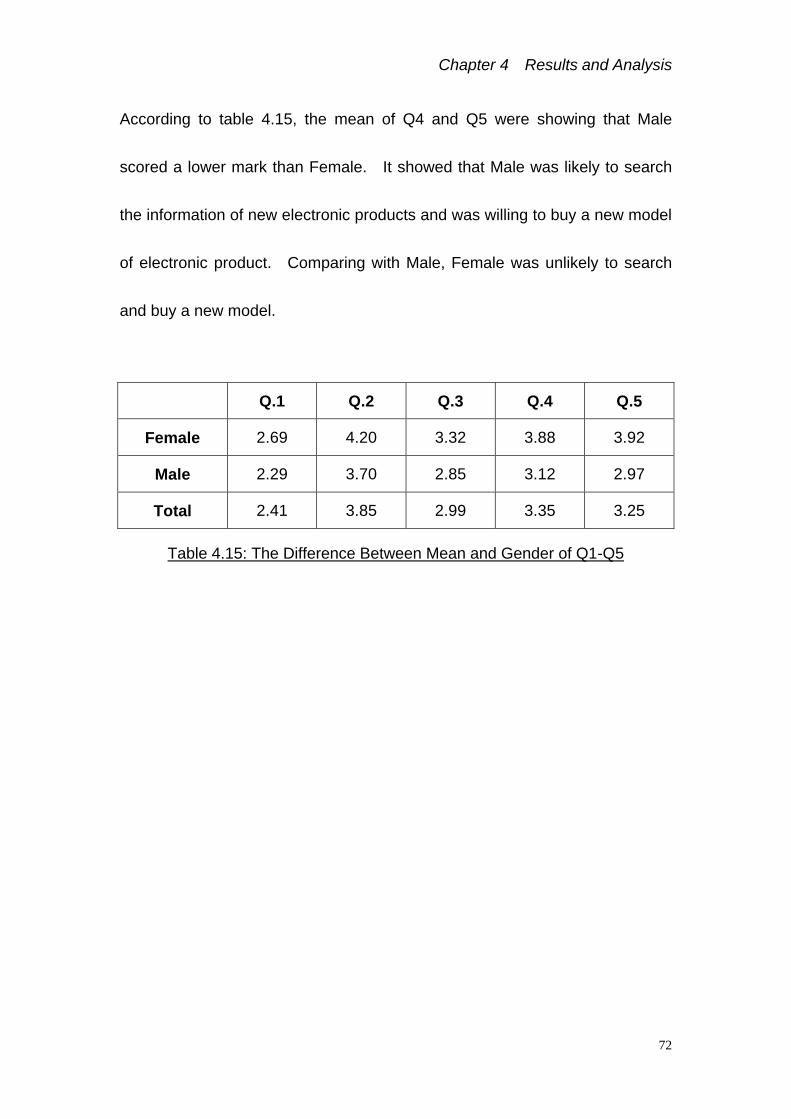
According to table 4.15, the mean of Q4 and Q5 were showing that Male
scored a lower mark than Female. It showed that Male was likely to search
the information of new electronic products and was willing to buy a new model
of electronic product. Comparing with Male, Female was unlikely to search
and buy a new model.
Q.1 Q.2 Q.3 Q.4 Q.5
Female 2.69 4.20 3.32 3.88 3.92
Male 2.29 3.70 2.85 3.12 2.97
Total 2.41 3.85 2.99 3.35 3.25
Table 4.15: The Difference Between Mean and Gender of Q1-Q5

Chapter 4 Results and Analysis
73
4.3.6 Reasons of Using PDA
According to figure 4.7, it shows that trendy, functional and convenience were
the main reasons of using PDA of the respondents. There were 69% of
respondents choosing Functional as the reason of using PDA. It shows that
users hope the function of PDA can assist them daily in a certain level.
0
10
20
30
40
50
60
70
80
90
100
Trend
y
Func
tiona
l
Conve
nienc
eStat
us
Others
Reasons of Using PDA
Per
cen
tag
e
CheckedUnchecked
Figure 4.7: The Reasons of Using PDA

Chapter 4 Results and Analysis
74
4.3.7 Sources of PDA Information
The sources of PDA information were quite narrow in figure 4.8.
Respondents mainly collected information from Newspaper and Friends
(34.5% and 73.6%). Also, 73.6% of respondents collected information about
PDA from his/her friends directly. It indicated that Word of Month was a main
role in the source of information of PDA.
0
10
20
30
40
50
60
70
80
90
100
Newspaper Friends Promotioncounter
Retail Shop Others
Sources of PDA Information
Per
cen
tag
e
Checked
Unchecked
Figure 4.8: Sources of PDA Information

Chapter 4 Results and Analysis
75
4.4 Other Findings
4.4.1 First Choice product profiles
According to table 4.16, the highest frequency of First choice product profile
was Card No. 5 (70). Card No. 2 was in the second position among 16 cards.
There were 66 respondents chose Card No.2 as their first choice product
profile. Some product profiles had not been chosen by any respondent as the
first choice product profile, such as Card No.7, 9, 10, 11, 13 and 15.
Frequency Valid Percent Cumulative Percent
No.1 3 1.5 1.5
No.12 3 1.5 3.0
No.14 20 10.0 13.0
No.16 9 4.5 17.5
No.2 66 33.0 50.5
No.3 12 6.0 56.5
No.4 7 3.5 60.0
No.5 70 35.0 95.0
No.6 3 1.5 96.5
No.8 7 3.5 100.0
Total 200 100.0
Table 4.16: First Choice Frequency

Chapter 4 Results and Analysis
76
66
70No.1
NO.12
No.14
No.16
No.2
No.3
No.4
No.5
No.6
No.8
Figure 4.9: Pie Chart of First Choice Frequency
Card No.2
Price $1000 to $2500
Operation System Palm OS
Screen Display Color Display
Type of Battery Li-ion rechargeable battery
Card No.5
Price $1000 to $2500
Operation System Win CE
Screen Display Color Display
Type of Battery Li-ion rechargeable battery
Table 4.17: The Product Profile of Card No. 2 and 5

Chapter 5
Discussion

Chapter 5 Discussion
77
Chapter 5 Discussion
5.1 Recommendations
Base on the results found in our research, we would like to make some
recommendations to the PDA manufacturers.
5.1.1 Recommendations base on Conjoint Analysis Results
The results in the conjoint analysis showed that PDA manufacturers should
focus in producing models with color display because almost all respondents
preferred color display in our research. Market of PDA with monochromatic
display is diminishing and it may be superannuated after a few years.
Besides, it also suggested that Palm OS no longer monopolize the PDA
market and more and more consumers choose Win CE.
Most consumers are more concern with the screen display, price and
operation system. Manufacturers must carefully choose the right operation
system for their new models of PDA, besides, rational pricing for their new
product is also very important for the success.

Chapter 5 Discussion
78
From the Conjoint Segmenter outputs, the largest segment was only
accounted for 36% in the research; it showed that there is no specific model
of PDA can attract most consumers. The consumer preferences still have
great variation. It is not similar to computer market that Microsoft Windows
and Intel Pentium Processor are monopolizing the market. Manufacturers
can build in some new special functions to their new models of PDA, which
solely provided by them, in order to attract more customers. A product which
combined PDA with mobile phones manufactured by Motorola is a very good
example.
In the current PDA market, all PDA which operating under Win CE and with
color screen display are very expensive (above $3,000). On the other hand,
there are many PDA which operating under Palm OS and also with color
screen display selling at a low price (around $2000). As we mentioned
above, market for Win CE is enlarging, manufacturers can target the low price
market with the Win CE PDA. This suggestion can be supported by the
results from the market simulation part.

Chapter 5 Discussion
79
5.1.2 Recommendation base on results generated from the questions
The results showed that around 80% of the female respondents were not PDA
users. This suggested that the female market of PDA products has not yet
been developed. Manufacturers can produce some PDA models which
mainly target the female market. They can follow the strategies that mobile
phone manufacturers using. The Queen phone produced by Samsung is a
very good example. PDA manufacturers can design some “female PDA”, e.g.
use Hello Kitty pattern printing on the case of the PDA for the female
customers.
High technology digital products are always being thought as trendy and must
buy products by the youngsters and young bachelors. From the results in
the last chapter, we found that only half of the young respondents (aged 16 -
29) had bought PDA. It showed that the market of PDA had not yet been
well developed. Manufacturers should put more effort on promotion and
increase people’s awareness of PDA.
PDA was always being regarded as luxurious product in two years ago and
only be used by rich people and high executives. As the price of PDA has

Chapter 5 Discussion
80
reduced these years, more and more people also buy PDA, but most of the
users were still managers and boss (refer to the result s of our research).
Therefore, manufacturers should change people’s perception on PDA. This
can greatly increase the number of customers.
Male and female always have different attitudes to some products; PDA is one
of these products. In our research, we found that female and male had
significantly difference in the following issues:
1. Impact of high technology products on living standard.
2. Agree level to high technology products represent high status.
3. Attitude to searching information of new electronic product.
4. Attitude to buying high technology products frequently.
The results suggested that manufacturers of PDA should use different
strategies to promote their products to male and female customers.
Lastly, we can summarize the reasons why people used PDA and where they
got the information about PDA. In our research, we found most existing
users of PDA thought that PDA was functional, convenience and trendy.

Chapter 5 Discussion
81
They got the information of PDA mainly from their friends and newspaper.
The manufacturers of PDA should emphasize these characteristics of PDA
when promoting their PDA products. Besides, most respondents knew PDA
from their friends showed that promotion of PDA products is not enough and
couldn’t stimuli consumers’ consumption intension. Manufacturers should
improve their marketing strategies.

Chapter 5 Discussion
82
5.2 Limitations
5.2.1 Sampling Method
Convenient sampling has an advantage that it is quickly and inexpensively.
However, on the other hand, it carries the negative effect at the same time.
Convenient sampling is prone to bias and influences which are beyond your
control, as the cases only appear in the sample because of the ease of
obtaining them (Saunders, Lewis and Thornhill, p 147). It has a problem that
the interviewee does not give the real answer in the interview. They may feel
that the interview is wasting their time.
Also, there are external factors affecting the answer of interviewee, such as
location of interview, the attitude of interviewee and the skill of interviewer.
Moreover, convenient sampling is not systematic to collect the data from the
real world. It is not a random to find the interviewee. It may not reflect the
real situation. Besides, it is no way to know if the respondents included are
representative of the target population due to the usage of convenience
samples. It is one type of non-probability sampling techniques.
Besides, field experiment means that the situation cannot be controlled by the

Chapter 5 Discussion
83
interviewer. The interviewee answers the question under the natural
situation. However, it carries out the problem that there is much external
effect. These external effects affect the answer of interviewee directly.
5.2.2 Sample Size
Conjoint analysis is quite time consuming of each questionnaire.
Respondent needs to spend around 5-10 minutes to finish the card ranking.
Owning to the manpower and time constraint, the sample size of our research
project was 200. If more resources are available, more information and
ideas could be generated for this research.
5.2.3 Limitation of Conjoint Analysis
1. It is not always clear that the constructed segments can be meaningfully
pursued in the marketplace.
2. The number of product profiles to be rated is very large and each
individual product description may be very complex. With more than six
to eight attributes, respondents can become overloaded with information,
and the reliability of their answers may diminish.

Chapter 5 Discussion
84
3. A conjoint study gives us only half the picture – the demand side. There
are also cost, capacity, and other implications of implementing a
particular product strategy. In the real situation of buying PDA,
consumers would consider several factors more than just features of PDA,
such as the design of PDA and brand name. Although elimination of
other factors would allow the research focuses on the desired factor, it
have ignored the importance of other elements in the decision making
process. Decisions need to be based on interplay between what a
market wants and what a company can afford to offer.
4. There is a problem that the situation for the respondent is analogous to a
paired product test in which it is assumed that one product will be chosen.
The respondent may like none of what is offered or like and purchase
more than one of what is offered.
5. There are so many models of a product in the market. We cannot input
all the models of a product into the simulation model for calculation of
market share. The real picture of the market may not be shown in the
results.

Chapter 5 Discussion
85
6. Again in the simulation model, market share is calculated base on the
product profiles with limited number attributes. In the real case, some
special attributes (e.g. MP3 function) may greatly affect the market share
of the product.

Chapter 6
Conclusion
Chapter 6 Conclusion
86
Chapter 6 Conclusion
PDA is more popular in the market. More people buy PDA for different
purpose. There is a large market potential. Under the keen competition of
the PDA market, every manufacturers hope to understand the customer
preference in order to produce the most suitable product to the consumer.
Using the Conjoint Analysis, we try to understand more about the consumer
preference of PDA. Moreover, we investigate different segments of the
consumer in the market in order to collect more useful information from the
research.
From our research, we found many information of PDA. Firstly, different
gender had significant different preference of PDA. Male was likely to search
a new product, such as PDA, and bought an electronic product. Secondly,
the trend of the development of PDA could be found. Color display, Li-ion
rechargeable battery and Window CE started to replace monochromatic
display, AAA battery and Palm OS. Thirdly, the price still was the payoff factor
to affect consumers to make the buying decision.

Chapter 6 Conclusion
87
There are some recommendations for those PDA manufacturers, such as PDA
manufacturers must use different strategies to promote their products to
different gender. Also, PDA manufacturers can design some “female PDA” in
order to develop the female PDA user because there is a potential market from
the results of research. Moreover, PDA manufacturers must put more effort
on promotion in order to increase the market size. Word of month and
newspaper are the main source of information for the PDA user. PDA
manufacturers can concern this situation.

References

References
88
References
w Alexander Chernev (2001), The impact of common features on consumer
preferences: A case of confirmatory reasoning, Journal of Consumer
Research, 27 (Mar).
w Anonymous (1982), Test market simulation evaluates new products, sets
realistic expectations. If right model used, Marketing News, 15 (Jan).
w Dick McCullough, How to do conjoint analysis right.
w Eric N. Berkowitz, Roger A. Kerin, Steven W. Hartley and William
Rudelius (2000), Marketing, 6th ed., McGraw Hill, 268.
w Giles D’ Souza and Seungoog Weun (1997), Assessing the Validity of
market segments using conjoint analysis, Journal of Managerial Issues,
9.

References
89
w Jane Benner and Jan Corwin Enger (2001), In the palm of your hand:
Buying a PDA, Nursing, 31 (Nov).
w Mark NK Saunders, Philip Lewis & Adrian Thornhill (1997), Research
Methods for Business Students, 1st ed., Pitman Publishing, 147.
w Martin J. Evans, Luiz Moutinho & W. Fred Van Raaij. (1996), Applied
Consumer Behaviour, 1st ed., Addison-Wesley.
w Michael R Dickson (1999), Understanding personal digital assistants: A
day in the life of a PDA user, Ohio CPA Journal, 58 (Apr-Jun).
w Paul E. Green & Abba M. Krieger (1991), Segmenting Markets with
Conjoint Analysis, Journal of Marketing, 55 (October).
w Paul E. Green & V. Srinivasan (1978), Conjoint Analysis in Consumer
Research: Issues and Outlook, Journal of Consumer Research, 5.

References
90
w Paul E. Green & V. Srinivasan (1990), Conjoint Analysis in Marketing:
New Developments with Implications for Research and Practice, Journal
of Marketing, 54 (October).
w Philip Kotler (1991), Marketing management: analysis, planning,
implementation, and control, 7th ed., Prentice-Hall, 164-175.
w V. Kumar, David A.Aaker and George S.Day (1999), Essentials of
Marketing Research, 1st ed, John Wiley & Sons, Inc.
w Wyner, Gordon A. (1992), Uses and Limitations of Conjoint Analysis,
Marketing Research, American Marketing Association, (Jun).
w 李盈節 (2001/11/14), PDA產業現況, 智富網.

Appendixes
91
Appendixes
Appendix A Card Samples
No. 11
Price Above $2500
Operation System Palm OS
Screen Display
Color Display
Type of Battery
AAA battery
No.6
Price $1000 to $2500
Operation System Win CE
Screen Display
Monochromatic Display
Type of Battery Li-ion rechargeable
battery

Appendixes
92
Appendix B Cardboard

Appendixes
93
Appendix C Sample Questionnaire for Pre-test
Questionnaire for Pre-test We are the final year students of Department of Marketing and International Business of Lingnan University. We are now collecting the information for our final year project. This questionnaire is designed to investigate the consumer preference and opinions towards selecting Personal Digital Assistant (PDA). All information collected will be for academic purpose only and will be kept in strict confidence. Part 1 Which combination of product features of PDA is the most favorable to you? There are total 24 cards. Please rank your preference in the descending order (most favorite to least favorite). Part 2 1. Have you bought a PDA before?
Yes (Please go to Question 2) No (Please go to Question 3)
2. Why do you use PDA? (You can tick more than one option)
Trendy Functional Convenience Status Others (Please specify__________________)
3. From which source(s) do you know about PDA. (You can tick more than
one option) Newspaper or magazine advertisement Friends Promotion counter at shopping hall Retail shop Others (Please specify__________________)

Appendixes
94
Part 3 Gender : Female (please answer questions in part 4)
Male Age : 16-25 26-35 36 or above Monthly : $10,000 or below Income $10,001 - $20,000 $20,001 - $30,000 $30,001 - $40,000 $40,000 or above Occupation : Student Blue Collar Clerical Management Self-employed Housewife Others (Please specify__________________) Part 4 1. Did you seek opinions from your friends (male) when purchasing high
technology products e.g. Computers, PDA, Camera, Cars etc. Yes, I did No, I didn’t
2. Did their opinions significantly affect your purchase decision?
End of Questionnaire Thank you for your cooperation!
Very Significantly Slightly Significantly Not Significantly
1 3 4 5 6 7 10 8 2 9

Appendixes
95
Appendix D Sample Questionnaire for Survey Ref. No.____________
Questionnaire for Survey We are the final year students of Department of Marketing and International Business
of Lingnan University. We are now collecting the information for our final year project.
This questionnaire is designed to investigate the consumer preference and opinions
towards selecting Personal Digital Assistant (PDA). All information collected will be
for academic purpose only and will be kept in strict confidence.
Part 1
Which combination of product features of PDA is the most favorable to you? There
are total 24 cards. Please rank your preference in the descending order (most
favorite to least favorite).
1. 3. 5. 7. 9. 11. 13. 15.
2. 4. 6. 8. 10. 12. 14. 16.
Part 2
1. Do you agree the electronic product
can improve your living standard?
2. Do you agree using high
technology product represent high
status?
Strongly Strongly
Agree____________________Disagree
1 2 3 4 5 6 7
1 2 3 4 5 6 7
3. How likely you would buy a
high-technology product?
4. How likely you search information
of new electronic products?
5. How likely you would buy a new model of electronic product?
Extremely Extremely
Likely____________________Unlikely
1 2 3 4 5 6 7
1 2 3 4 5 6 7
1 2 3 4 5 6 7
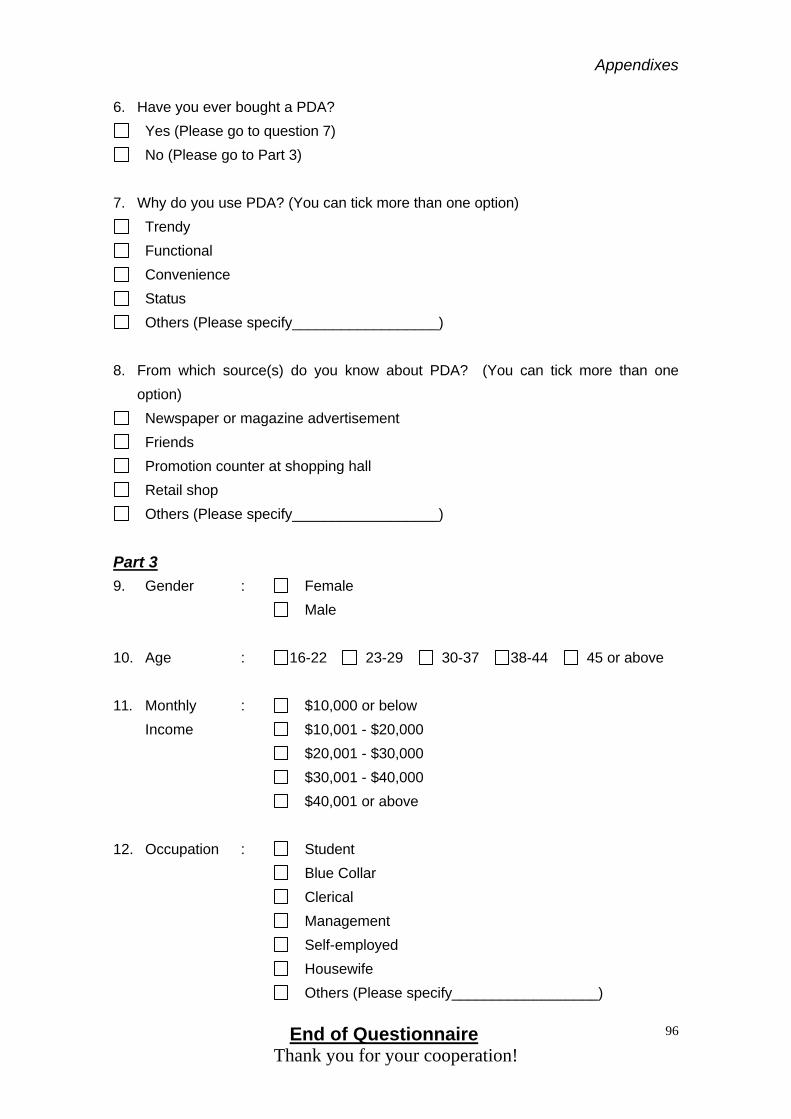
Appendixes
End of Questionnaire Thank you for your cooperation!
96
6. Have you ever bought a PDA?
Yes (Please go to question 7)
No (Please go to Part 3)
7. Why do you use PDA? (You can tick more than one option)
Trendy
Functional
Convenience
Status
Others (Please specify__________________)
8. From which source(s) do you know about PDA? (You can tick more than one
option)
Newspaper or magazine advertisement
Friends
Promotion counter at shopping hall
Retail shop
Others (Please specify__________________)
Part 3 9. Gender : Female
Male
10. Age : 16-22 23-29 30-37 38-44 45 or above
11. Monthly : $10,000 or below
Income $10,001 - $20,000
$20,001 - $30,000
$30,001 - $40,000
$40,001 or above
12. Occupation : Student
Blue Collar
Clerical
Management
Self-employed
Housewife
Others (Please specify__________________)

Appendixes
97
Appendix E Questionnaire for Exploratory Research
Question 1:
What features of PDA will you concern when you buy a PDA? (Please List Out)
Question 2:
What features of PDA are the most considerable?
Question 3:
Why you think that these features are the most considerable?
Question 4:
In you opinion, what features should a good PDA include?
Question 5:
What features of PDA are useless when you considering a PDA?

Appendixes
98
Appendix F The Result from Conjoint Segmenter -
Nine-segment solution

Appendixes
99

Appendixes
100