Knowledge based requirement engineering for one-of-a-kind complex systems
Upload
khangminh22Category
view
2download
0
HAL Id: hal-01281986https://hal.archives-ouvertes.fr/hal-01281986
Submitted on 3 Mar 2016
HAL is a multi-disciplinary open accessarchive for the deposit and dissemination of sci-entific research documents, whether they are pub-lished or not. The documents may come fromteaching and research institutions in France orabroad, or from public or private research centers.
L’archive ouverte pluridisciplinaire HAL, estdestinée au dépôt et à la diffusion de documentsscientifiques de niveau recherche, publiés ou non,émanant des établissements d’enseignement et derecherche français ou étrangers, des laboratoirespublics ou privés.
Knowledge engineering approach for the analysis ofviticulture
Bernard Kamsu-Foguem, Aurélie Flammang, Germaine Tchuenté Foguem
To cite this version:Bernard Kamsu-Foguem, Aurélie Flammang, Germaine Tchuenté Foguem. Knowledge engineeringapproach for the analysis of viticulture. Ecological Informatics, Elsevier, 2015, vol. 30, pp. 72-81.�10.1016/j.ecoinf.2015.09.004�. �hal-01281986�

Open Archive TOULOUSE Archive Ouverte (OATAO) OATAO is an open access repository that collects the work of Toulouse researchers and makes it freely available over the web where possible.
This is an author-deposited version published in : http://oatao.univ-toulouse.fr/ Eprints ID : 15539
To link to this article : DOI:10.1016/j.ecoinf.2015.09.004URL : http://dx.doi.org/10.1016/j.ecoinf.2015.09.004
To cite this version : Kamsu-Foguem, Bernard and Flammang, Aurélie and Tchuenté Foguem, Germaine Knowledge engineering approach for the analysis of viticulture. (2015) Ecological Informatics, vol. 30. pp. 72-81. ISSN 1574-9541
Any correspondance concerning this service should be sent to the repository
administrator: [email protected]

Knowledge engineering approach for the analysis of viticulture
Bernard Kamsu-Foguem a,⁎, Aurélie Flammang b, Germaine Tchuenté-Foguem c
a Laboratory of Production Engineering (LGP), EA 1905, ENIT-INPT University of Toulouse, 47 Avenue d'Azereix, BP 1629, 65016, Tarbes Cedex, Franceb COGESENS, 207 rue Jean Baptiste Charcot, 92400 Courbevoie, Francec Département d'Informatique, UMI 209, UMMISCO, Faculté des Sciences, Université de Yaoundé I, B.P. 812 Yaoundé, Cameroon
a b s t r a c t
Keywords:
ViticultureClimatic indexesMulticriteria analysisConceptual graphsNumerical–symbolic reasoning
The sustainable development of agricultural regions requires a methodical approach that will make a viable landmanagement systempolicy in practice. In this regard, distinctive contextual characteristics of a country (remark-able areas for raising the regional products) could be taken into account in order to promote the good character ofagricultural outputs and to increase the added value of considered lands. The manuscript primarily describes inqualitative and quantitative terms a mechanism for synthesizing information about wine production character-istics and therefore provides sufficient substantive treatment of agricultural or other system interactions. Firstly,the manuscript presents a discussion about many factors that affect wine production, and secondly, the focus ismore on the development of an integrated approach using numerical and symbolic reasoning. The GeoviticultureMulticriteria Climatic Classification (MCC) System is engaged with a methodology comprising three viticulturalclimatic indexes of different natures: hydric type (dryness index), heliothermal type (Huglin index), andNictothermal type (Cold Night Index). The knowledge representation is symbolized with the conceptual graphsformalism and the reasoning mechanisms are based on graph operations. A visual reasoning developmentfocuses more on the decision process that would seem more appropriate for a practice on decision support. Inaddition, the Decision Support System (DSS) component is illustrated with a case study of Croatia republic invery broad characterizations of its main regional grape varieties.
.
1. Introduction
With the collapse of the Berlin Wall in November 1989, the landpolicies and land market in Central and Eastern European countrieshave been evolved through the land reform and the self-regulation ofthe free market (Bojnec, 2011; Lerman et al., 2002). Furthermore, in July2013, the accession of Croatia as new member state of the EuropeanUnion has made it possible to be eligible for assistance of Common Agri-cultural Policies. Under these circumstances, the European agriculturalpolicies may encourage the development of intensive production prac-tices in fertile regions and extensive farming situations (i.e. abandonedor marginalized farming areas) in regions with limited environmentalconditions (e.g. mountainous and isolated areas). This underscores theneed of targeting policies in these agricultural landscapes and the impor-tance to highlight the principles andmeasures that preserve the integrat-ed development with local, regional and national characteristics(Kanianska et al., 2006).
Croatia is a young country; it declared independence in June 1991 and6months later obtained diplomatic recognitionby the European Econom-ic Communitymembers, and subsequently, the United Nations. However,it is a very old wine country. The country enjoyed a huge renaissance
which allowed a new generation of winemakers to revive an ancient tra-dition. The vines have grown there since ancient times (Jackson, 2000). Itwas introduced about five centuries before Christ by the Greeks whoplanted the first vines in the south of Dalmatia, particularly in the islandsof Vis, Hvar, and Korcula. The first experiences were not conducive to anyform of culture with their rocky slopes tumbling steeply to an indigo seaand azure sky. In terms of production, with an average overall annualquantity of 1.5 million hectoliters, it arrives at the 21st largest in theworld. With over 100 traditional varieties of local grapes listed in asmall area, Croatia has a very promising future, especially as the youngwinemakers are determined to highlight this feature. The strong wineidentity of Croatia is a major asset in a market increasingly globalized.Croatia has recently tried to build a strategy and to adapt his business inthe field of viticulture and marked the first major breakthrough ofCroatian wines on the international scene. This is not surprising, givenits extraordinary climatic predispositions and in light of the fact that theCroatia has two great traditional varieties of local grapes, Plavac Maligrape and Malvasia Istarska grape, which have become an essential partof the Istrian peninsula's tourism offerings.
The aim of this paper is to study the Croatian vineyard as a wholeand to shed light on its characteristics. Local types of grape varietiesare numerous, their characteristics are part of Croatian heritage, butthe best known/common varieties are also present in some vineyards.As a first step, we describe the Croatian regions and identify its main
⁎ Corresponding author. Tel.: +33 624302337.E-mail address: [email protected] (B. Kamsu-Foguem).
http://dx.doi.org/10.1016/j.ecoinf.2015.09.004
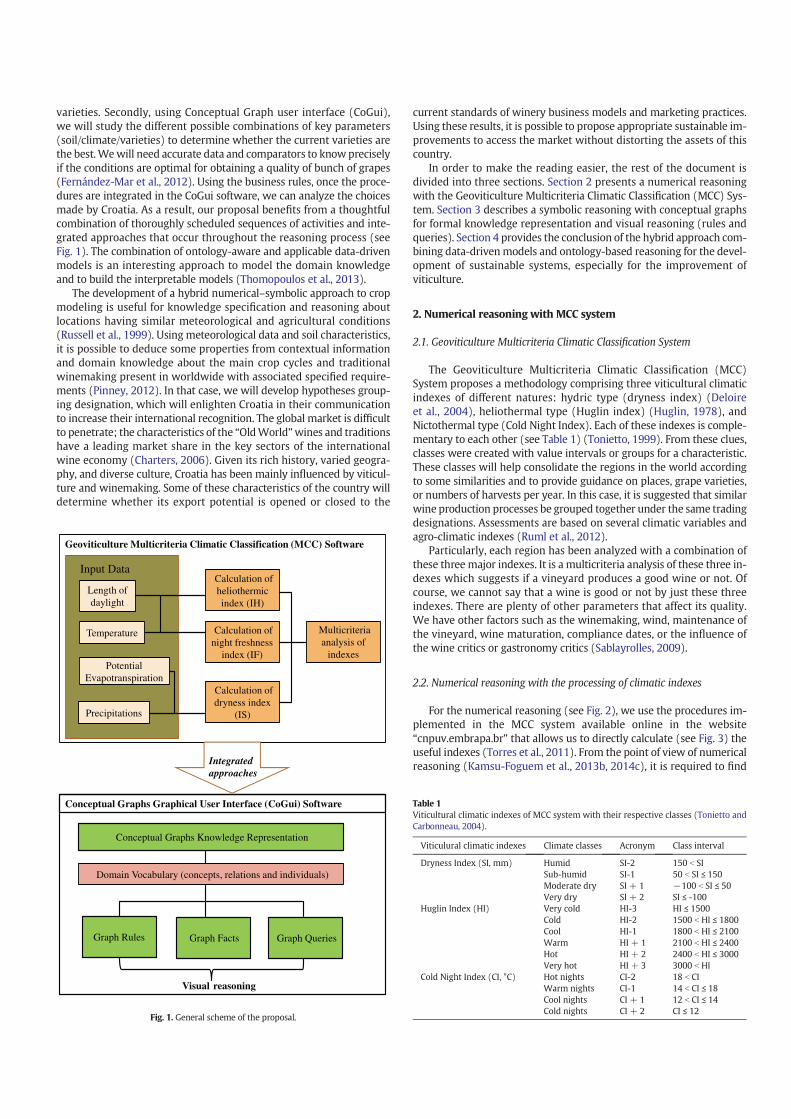
varieties. Secondly, using Conceptual Graph user interface (CoGui),we will study the different possible combinations of key parameters(soil/climate/varieties) to determine whether the current varieties arethe best.Wewill need accurate data and comparators to knowpreciselyif the conditions are optimal for obtaining a quality of bunch of grapes(Fernández-Mar et al., 2012). Using the business rules, once the proce-dures are integrated in the CoGui software, we can analyze the choicesmade by Croatia. As a result, our proposal benefits from a thoughtfulcombination of thoroughly scheduled sequences of activities and inte-grated approaches that occur throughout the reasoning process (seeFig. 1). The combination of ontology-aware and applicable data-drivenmodels is an interesting approach to model the domain knowledgeand to build the interpretable models (Thomopoulos et al., 2013).
The development of a hybrid numerical–symbolic approach to cropmodeling is useful for knowledge specification and reasoning aboutlocations having similar meteorological and agricultural conditions(Russell et al., 1999). Using meteorological data and soil characteristics,it is possible to deduce some properties from contextual informationand domain knowledge about the main crop cycles and traditionalwinemaking present in worldwide with associated specified require-ments (Pinney, 2012). In that case, we will develop hypotheses group-ing designation, which will enlighten Croatia in their communicationto increase their international recognition. The global market is difficultto penetrate; the characteristics of the “OldWorld”wines and traditionshave a leading market share in the key sectors of the internationalwine economy (Charters, 2006). Given its rich history, varied geogra-phy, and diverse culture, Croatia has been mainly influenced by viticul-ture and winemaking. Some of these characteristics of the country willdetermine whether its export potential is opened or closed to the
current standards of winery business models and marketing practices.Using these results, it is possible to propose appropriate sustainable im-provements to access the market without distorting the assets of thiscountry.
In order to make the reading easier, the rest of the document isdivided into three sections. Section 2 presents a numerical reasoningwith the Geoviticulture Multicriteria Climatic Classification (MCC) Sys-tem. Section 3 describes a symbolic reasoning with conceptual graphsfor formal knowledge representation and visual reasoning (rules andqueries). Section 4 provides the conclusion of the hybrid approach com-bining data-drivenmodels and ontology-based reasoning for the devel-opment of sustainable systems, especially for the improvement ofviticulture.
2. Numerical reasoning with MCC system
2.1. Geoviticulture Multicriteria Climatic Classification System
The Geoviticulture Multicriteria Climatic Classification (MCC)System proposes a methodology comprising three viticultural climaticindexes of different natures: hydric type (dryness index) (Deloireet al., 2004), heliothermal type (Huglin index) (Huglin, 1978), andNictothermal type (Cold Night Index). Each of these indexes is comple-mentary to each other (see Table 1) (Tonietto, 1999). From these clues,classes were created with value intervals or groups for a characteristic.These classes will help consolidate the regions in the world accordingto some similarities and to provide guidance on places, grape varieties,or numbers of harvests per year. In this case, it is suggested that similarwine production processes be grouped together under the same tradingdesignations. Assessments are based on several climatic variables andagro-climatic indexes (Ruml et al., 2012).
Particularly, each region has been analyzed with a combination ofthese three major indexes. It is a multicriteria analysis of these three in-dexes which suggests if a vineyard produces a good wine or not. Ofcourse, we cannot say that a wine is good or not by just these threeindexes. There are plenty of other parameters that affect its quality.We have other factors such as the winemaking, wind, maintenance ofthe vineyard, wine maturation, compliance dates, or the influence ofthe wine critics or gastronomy critics (Sablayrolles, 2009).
2.2. Numerical reasoning with the processing of climatic indexes
For the numerical reasoning (see Fig. 2), we use the procedures im-plemented in the MCC system available online in the website“cnpuv.embrapa.br” that allows us to directly calculate (see Fig. 3) theuseful indexes (Torres et al., 2011). From the point of view of numericalreasoning (Kamsu-Foguem et al., 2013b, 2014c), it is required to find
Length of
daylight
Temperature
Potential
Evapotranspiration
Precipitations
Calculation of
heliothermic
index (IH)
Calculation of
night freshness
index (IF)
Calculation of
dryness index
(IS)
Input Data
Multicriteria
analysis of
indexes
Geoviticulture Multicriteria Climatic Classification (MCC) Software
Conceptual Graphs Knowledge Representation
Graph Rules Graph Facts Graph Queries
Conceptual Graphs Graphical User Interface (CoGui) Software
Domain Vocabulary (concepts, relations and individuals)
Visual reasoning
Integrated
approaches
Fig. 1. General scheme of the proposal.
Table 1
Viticultural climatic indexes of MCC system with their respective classes (Tonietto andCarbonneau, 2004).
Viticulural climatic indexes Climate classes Acronym Class interval
Dryness Index (SI, mm) Humid SI-2 150 b SISub-humid SI-1 50 b SI ≤ 150Moderate dry SI + 1 −100 b SI ≤ 50Very dry SI + 2 SI ≤ -100
Huglin Index (HI) Very cold HI-3 HI ≤ 1500Cold HI-2 1500 b HI ≤ 1800Cool HI-1 1800 b HI ≤ 2100Warm HI + 1 2100 b HI ≤ 2400Hot HI + 2 2400 b HI ≤ 3000Very hot HI + 3 3000 b HI
Cold Night Index (CI, °C) Hot nights CI-2 18 b CIWarm nights CI-1 14 b CI ≤ 18Cool nights CI + 1 12 b CI ≤ 14Cold nights CI + 2 CI ≤ 12

the similarities between two regions by information management andprocessing with fuzzy similarity (Paoli et al., 2007).
The exact numerical reasoning can find some similarities if thenumbers are equal. But in certain cases, there are slight differences. Toremedy this, we believe there would be two options. The first optionwould be to add a programming software module to process informa-tion similarity approached. The second option would be to use indexclasses. These classes are ranges of values. In our example regardingthe viticultural climatic indexes, Dalmatia is characterized by the classesHI, CI-1, and DI-1 (See Table 1). Las Bruxas being in the same case, thenthe software can find a similarity and highlights the common features.However, the described classes can still be criticized as being a rangeof values; a region may have a close indication of another class. In thiscase, it is possible to find alternative interesting locations in neighborclasses including regions that are similar to the region of interest.
Concerning reasoningwith similarities between regions of theworld,a problem remains to be settled out about the range of possible valuesand the probabilities of different values occurring. Since we don't haveany potential evapotranspiration data, the DI of each region is anecdotal.MMC procedures allow finding some regions in the world that are
similar with those of Croatia, but a more efficient system of reasoningwould do away with the perceived dissimilarity. Therefore, we mustfind the appropriatemeans to improve the reasoning process. Each com-parative analysis should consider not only the geology but also the cli-mate and winemaking practices. It becomes evident that sets of areashave approximately the same viticulural climatic indexes but receive sig-nificantly different considerations for vineyards applications. The knowl-edge generated by primary lessons shows that it would be pertinent toshare best practices between similar geographical regions experiencinganalogous wine production.
Indeed, the regions of Zagreb and Slavonia have respective indexvalues HI 1877, DI 200, CI 12 and HI 1881, DI 200, CI 13 (very similarindexes). If we compare the varieties by region, five out of seven varietiesare the same: Cabernet Sauvignon, Pinot, Cabernet Franc, Chardonnay,andGraševina. Therefore,we can observe a possible link between indexesand varieties. However, the MCC system indicates that Huglin index isonly a minimum value for the proper development of a variety, abovethis value regions are equivalent. It is not just this index that canbe criticalin distinguishing the wine regions. In addition, the Cold Night Index is amore accurate impact on the quality of a wine (flavors and coloring).
The informationwe have at our disposal do not allow us to connect avariety of indexes to specific values. We cannot rely on any scientificstudy to determine the optimal growing method for each variety. Sowe only compared the regions of Croatia with other wine regions ofthe world to get an idea of the possible outcomes of the culture ofknown wine varieties in order to monitor quality standards forproducts.
3. Symbolic reasoning with conceptual graphs
A conceptual graph is a graph with two kinds of nodes respectivelycalled concepts and conceptual relations, and each arc must connect aconceptual relation to a concept (it is said that the graph is bipartite)(Sowa, 1984). Visual reasoning is performed through graph homomor-phism which maps adjacent nodes to adjacent nodes and offersthe possibilities of specialization of the concept and relation nodeslabels (Sowa, 2000). As the saying goes “a picture is worth a thousandwords,” the visual reasoning by means of conceptual graph operations
Length of
daylight
Temperature
Potential
Evapotranspiration
Precipitations
Calculation of
heliothermic
index (IH)
Calculation of
night freshness
index (IF)
Calculation of
dryness index
(IS)
Input Data
Multicriteria
analysis of
indexes
Geoviticulture Multicriteria Climatic Classification (MCC) Software
Fig. 2. Numerical reasoning with MCC software.
Fig. 3. Geoviticulture MCC system: online calculation of climatic indexes.

(Baget and Mugnier, 2002) is a magnificent view for the scientific pop-ularization of logical reasoning. Without ruling out the demonstrationsby the logical formulas, graph operations are sufficient to explain the vi-sual reasoning process like a diagram that could serve as proof of graph-ical demonstrations (Chein and Mugnier, 2008).
Once the “algorithmic” rules were established, we need to analyzeregions. For this, we decided to implement these rules by using a
software tool called Conceptual Graphical User Interface (CoGui)(Carloni et al., 2009). CoGui is graphic design software developed inJava language. This software allows, from a conceptual graph, to estab-lish a link between the different parameters, it is then possible tobuild some control rules in a visual form with conceptual graphs.Then, we can ask a new structure to analyze and compare thepredefined control rules. Thus, the software will investigate whetherthe structure has similarities with the control rules, and it is possibleto draw a conclusion (Genest and Chein, 2005).
This software seems to fit our need, indeed as we have “algorithmic”rules and we can search whether the Croatian regions are capable ofreceiving a production of French vineyards. Therefore, we simply enterour control rules as means to generate the conceptual graph operationsin visual reasoning for the analysis of Croatian regions (Kamsu-Foguemet al., 2008).
Note that the software is only an aid to improve the speed compar-isons taking into account all technical, operational, and environmentalconstraints (Nicholas and Durham, 2012). Adaptive managementstrategies can allow to stop climatic effects on grapevine performances(Lorenz et al., 1995; Ripoche et al., 2011).
In our context, the reasoningmechanism advocates the use of graphoperations (mainly rules application and constraints verification) toanalyze a set of facts (Baget et al., 2011). So, it has the ability to selectsome graphical representation and therefore the provided resultshighlight relationships that could not be true in a series of charts(Kamsu-Foguem et al, 2013c). In addition, the engaged visual reasoning
Conceptual Graphs Knowledge Representation
Graph Rules Graph Facts Graph Queries
Conceptual Graphs Graphical User Interface (CoGui) Software
Domain Vocabulary (concepts, relations and individuals)
Visual reasoning
Fig. 4. Symbolic reasoning with CoGui software.
Fig. 5. Partial hierarchy of concepts in the vineyard (tree view and graph view).

would challenge the relevance, redundancy, or inconsistency ofdescribed rules (Kamsu-Foguem, 2012). However, this remains theresponsibility of the knowledge engineer for whom it is important tobe successful and as faithful as possible to the reality in the study. Themanagement of business rules is done in collaboration with domainexperts (Kamsu-Foguem, 2014; Kamsu-Foguem and Abanda, 2015;Kamsu-Foguem and Noyes, 2013; Kamsu-Foguem et al., 2014a,b,2015; Potes Ruiz et al., 2013, 2014; Sene et al., 2015).
This section is related to symbolic reasoning based on conceptualgraph structures and its visual operations (see Fig. 4). We want toknow whether a given structure corresponds to some existing onesin the database. So, we must use some automated proceduresimplemented in the CoGui software. The queries are representedby conceptual graph structures, which we compare to other graphs(facts and rules), recorded in CoGui software. The representationof weakly structured imprecise data enables us tomakemore flexiblecomparisons of fuzzy conceptual graphs (Thomopoulos et al., 2003).Then, the software will indicate if the studied structure hassimilarities (with a given degree) with already modeled graphs,and we will present these similarities. This will also give us an indi-cation of a conclusion to be drawn with regard to the policy onwinemaking and respect for local products (Kamsu-Foguem andFlammang, 2014).
3.1. Concepts categorization
The first step is to formalize the domain vocabulary with someinformation associated to usual concept types (see Fig. 5) and commonrelation types between these concepts.
• During this stage, the various elements of the hierarchized types areorganized in order to have consistency in terms.
• In some cases, we can change largely the concept types of the previousproject, if we believe that certain categories were not modeled withsuitable considerations. For example, we placed the treatment aftereach disease (Ellison et al., 1998) and not in parallel.We also added nu-merical data.
• Therefore, we added first most popular varieties that are present inCroatia. Then we added the appellations and some parameters linkswith appellations.
• Finally, on climate, reorganization was made with the addition of newindexes.
3.2. Binary relations and numerical data
Binary relations are used to link two concepts together and are alsoorganized with a hierarchy of types (see Fig. 6).
Fig. 6. Hierarchy of conceptual relations (tree view and graph view).

Fig. 7. An example of numerical data.
Fig. 8. An example of graph rules (Vhrunsko Vino region B).

The numerical values (see Fig. 7) of data are added to precise thedescriptions of modeled rules and facts. These data are associated tothe value of viticultural climatic indexes (Dryness Index, Huglin Index,and Cold Night Index).
3.3. Graph rules
• Regarding the rules, their solicitation triggers the verification ofproperties in the contextual application and places the results in theknowledge base.
• In terms of designations, four appellations are registered: IstrianQual-ity (wine of protected origin with a base-line style and a guarantee ofquality), Stolno vino (table wine), Kvalitetno vino (quality wine) andVhrunsko vino (superior quality wine).
• These three designations are based on a specific legislation issued bythe Ministry of Agriculture and Forestry referring to the law onwine. This text translated as “Regulations on wine” was published in1996 in the official journal. This law defined three geographicaldesignations of origin and quality.
• It divides Croatia into regions and sub-regions and performs fourclasses: the first zone B comprises the following sub-regions:
Moslavina Varazdin, Plešivica, Zagorje-Medjimurje; the second zoneC1 includes these sub-regions: the Danube, Slavonia; the third zoneC2 comprises the sub-regions: Istria, Croatian coast and hinterland;and the fourth zone C3 includes sub-regions: North, Central, andSouth Dalmatia. The information processing will recommend somevarieties depending on the ability of each area to produce a wine ofsuperior quality (Vino Vhrunsko) and to produce a quality wine(Vino Kvalitetno). So, it will involve the performance of the parcel inkilograms of grapes per hectare, which again varies by class for oneof the three designations. Also according to each area and quality,the sugar rate must be determined in g/l, alcohol rate in % volumeand ash content (wood residues) in g/l.
We can see below two examples of conceptual graph rules modeledin the CoGui software (see Figs. 8 and 9). In these figures the hypothesisof the rules is described in the left part and the consequence of the ruleis described in the right part.
Through these rules, we see the authorized varieties and requiredconditions to trigger the application of the rule. In the right part, thefindings of the rule application are shown in purple color: if the studied
Fig. 9. An example of graph rules combining indexes.
Specific
Query
Regions
found
Answer (s)
in the black
part of the
target graph
(facts)
Fig. 10. An example of reasoning with query in the left frame and its answer (black sub graph) in the right frame.

fact respects the hypotheses of that rule, the winewill be qualified withVhrunsko Vino designation and considered as a potential good wine.Regarding the rules for the indexes, we informed the extreme valuesof the indexes so that if an index is below this threshold, it is excludedand the studied wine is considered as a bad wine.
Logical expression of the graph rule visualized in Fig. 8: ∃x ∃y ∃z ∃m∃n ∃r ∃s ∃t (Vineyards (x) ∧ Varieties (y) ∧ Parameters (z) ∧ Cabernet
Franc (m) ∧ Rizling (n) ∧ Chardonnay (r) ∧ Grasevina (s) ∧ Pinot
(t) ∧ Yield per hectare kgs/ha (9000) ∧ Sugar in g/L (19) ∧ Ashes in
g/L (1, 6) ∧ Alcool by %volume (10) ∧ Attribute (x, y) ∧ Attribute (x,
z) ∧ Attribute (y, m) ∧ Attribute (y, n) ∧ Attribute (y, r) ∧ Attribute
(y, s) ∧ Attribute (y, t) ∧ Inferior (z, 9000) ∧ Superior (z, 19) ∧ Superior
(z, 1,6) ∧ Superior (z, 10)→ ∃u ∃v ∃w (Vineyards (x) ∧ Varieties (y) ∧
Designations (u) ∧ Good wine (v) ∧ Vrhunsko Vino (Wine of superior
quality) (w) ∧ Attribute (x, u)) ∧ Influence (x, y) ∧ Membership (u,
w) ∧ Qualifier (y, w))
Logical expression of the graph rule visualized in Fig. 9: ∃x ∃y (Re-
gion (x) ∧ Climate (y) ∧ Huglin (1000) ∧ Huglin (2500) ∧ Dryness
Index (−100) ∧ Dryness Index (200) ∧ Cold Night Index (12) ∧ Cold
Night Index (18) ∧ Attribute (x, y) ∧ Inferior (x, 1000) ∧ Superior (x,
2500) ∧ Inferior (x, -100) ∧ Superior (x, 200) ∧ Inferior (x, 12) ∧ Supe-
rior (x, 18)→ ∃u ∃v ∃w (Region (x) ∧ Vineyards (u) ∧ Varieties (v) ∧
Bad wine (w) ∧ Refusal (x, u)) ∧ Influence (v, w) ∧ Qualifier (v, w))
3.4. Graph facts
• The facts are built in the sameway as the rules for one detail, but withone important difference: there is no conclusion.
• The facts are built according to their contents, and semantic featureshave to be analyzed in turn, first at the various levels, then as
interwoven groups of regional situations. Indeed, the facts will serveas a basis when you want to ask a question (query). They are the fac-tual knowledge of the basic elements of logical reasoning: what is themost suitable region or is there a region corresponding to a possiblelocation of the vineyard?
• The facts established are related to the most notorious reputation inproducingwines in Croatia. So each region contains varieties, dryness,Huglin and Cold Night Indexes, and soil types. Also, we indicate theregions with similarities to the Croatian regions for target indexes.
• Sometimes, the facts are structured according to regional areas with afact for the designation and another one for each season. From our per-spective, this is not an ideal way for the processing of queries with a va-riety of attributes in the CoGui software, since we can get a season or acorresponding name of a specific region, but this does not meet thecriteria of other neighboring regions having potentially relevant infor-mation. In our case, if we have one group of facts by region with differ-ent sub-facts inside, then the software can detect the consistentmatching to find similar interesting locations of the target region.
3.5. Graph queries
The general queries contain a list of relevant attributes such asmete-orological factors, soil conditions, or crop requirements that are usefulfor viticulture. Questions are modeled in conceptual graph queries toprovide visual answers using the projection operation. By inputtingdata such as the region, the designation, or the climatic indexes, theCoGui software automatically generates the possible corresponding an-swers for the specified requirements (see Fig. 10).
The reasoning is dynamic with visual sequences that allow an easyunderstanding of different processing steps. With this visual reasoning,we can know if there are similarities between the facts and specifiedqueries, and some visual suggestions are provided with arguments(Doumbouya et al., 2015a; Doumbouya et al., 2015b; Doumbouya et
Table 2
Results of reasoning procedures on Croatian viticulture.
Croatian Regions Similar regions Typical varieties International varieties
Croatian Coastal
Region
Southern Dalmatia California (United States of America) Red variety (Plavac Mali) White variety (Malvasia)Apulia (Italy) White varieties (Pošip, Grk,
Maraština or Rukatac)Las Brujas (Uruguay)Central Dalmatia Styria (Austria) Red variety (Plavac mali) Red variety (Zinfandel)
South Moravian (Czech Republic) White variety (Vugava)Lower Styrian (Slovenia)
Northern Dalmatia Rhone valley (France) Red varieties (Plavina, Babić, Lasina) Red varieties (Merlot, Syrah, Grenache)Aragon (Spain) White varieties (Maraština, Debit)
Dalmatian Zagora Livno (Bosnia and Herzegovina) Red variety (Trnjak) Red variety (Merlot)White variety (Kujundžuša)
Croatian Littoral Maja Briaset (Albania) White varieties (Žlahtina, Gegić) White variety (Sauvignon blanc)Orjen (Montenegro)Tara (Serbia)Gorjanci (Slovenia)
Istria Trieste (Italy) Red varieties (Teran) Red varieties (Merlot, Cabernet sauvignon)Burgundy (France) White varieties (Malvazija, Muškat)
Continental
Croatia
Danube region Bačka Palanka (Serbia) Red varieties (Frankovka) Red varieties (Cabernet sauvignon, Merlot)White varieties (Graševina, Traminac)
Slavonia Burgundy (France) Red varieties (Frankovka) Red varieties (Merlot, Pinot noir, CabernetSauvignon)
California (United States of America) White varieties (Graševina, Silvanaczeleni)
White varieties (Chardonnay, Riesling,Pinot Gris, Sauvignon blanc)
Moslavina Tokaj-Hegyalja wine region (Hungary) White varieties (Škrlet, Dišeća Ranina) White varieties (Chardonnay, Pinot blanc)Plešivica Rheinhessen, Pfalz (Austria) Red varieties (Portugizac) Red varieties (Pinot noir)
Weinsberg (Germany) White varieties (Rajnski rizling orRiesling)
White varieties (Sauvignon blanc, Chardonnay)Tarn (France)
Međimurje and Varaždin Samos (Greece), Frontignan (France) White variety (Muškat žuti) White variety (Sauvignon blanc)Piedmont (Italy)
Hrvatsko Zagorje andPrigorje
Franconia (Germany), White variety (Kraljevina) White varieties (Sylvaner, Pinot Blanc)Transylvania (Romania)Alsace (France)Limbach (Slovakia)California (United States of America)

al., 2015c; Doumbouya et al., 2015d) that underline the part of factswhich allow or not to obtain the desired results. The results of reasoningprocedureswith someCroatian regions are described in Table 2 (Croatiaboasts a variety of vine growing regions, from Mediterranean glowingheat to cold slopes of the Alps (Špiranec, 2011) . In the continental Cro-atia, western areas are appropriate for the cultivation of aromatic varie-ties (e.g. Sauvignon, Muscat a Petit Grain and Riesling) and the easternareas are ideal for the cultivation of aromatic varieties and yield winesof the highest quality (e.g. Pinot Noir, Graševina, Merlot, Syrah andGrenache). In the Croatian Coastal Region, vine varieties vary widelywith the warmest area producing stronger wines (e.g. Plavac Mali andBabić) and the colder area producing aromatic wines with a refreshingcharacter (e.g. Chardonnay and Malvazija Istarska)).
4. Conclusion
Throughout an integrated numerical and symbolic framework, weprovide a formal visual reasoning process with the aim of highlightingthe rich identity card of the Croatian vineyard and strategic options forits international development. After careful consideration and detailedstudy of wine regions of Croatia, we developed a mapping of Croatianviticultural settings with the identification of different varieties presentboth autochthonous and classic features and key designations.
In order to find similarities between these regions and varieties withother regions of the world, a multicriteria climatic analysis wasdeveloped. The numerical reasoning is implemented with the MCCsoftware through calculations based on three climatic indexes comple-mentary to each other and their combination ensures that the targetedanalysis can be effectively accomplished. A symbolic reasoning isdeployed through the CoGui software, which allowed us to establisha knowledge base with visual operations displaying the similaritiesor not between viticultural regions. It will be useful to incorporateother web-based tools that can help non experts in visual identificationof critical information in vineyard monitoring (Pertot et al., 2012).
In order to achieve climate analysis, somedata require a contactwithgovernment agencies on the federal, provincial/ territorial, and munici-pal level to determine the regulatory agency and applicable regulationsgoverning the viticulture sector. It is also clear that the domain of thewine production is very complex and requires consideration of manydifferent activities in the process (harvesting and destemming, crushingand fermentation, laboratory tests, blending and fining, preservatives,and filtration) (Gómez-Plaza and Cano-López, 2011; Urtubia et al.,2007). In addition, the used climatic and geologic factors are certainlyadequate, but it still lacks some factors such as complete considerationof wind and landscape transformations (Papadimitriou, 2012) (e.g. theslope of the land down to the water or shoreline).
In a context of winemarket globalization, the theme of geographicaldiversity and identity has a growing importance. Countries that areendowed with some agricultural areas connecting the culture and theheritage of the lands have traditional and significant assets to meetthe challenges of our globalized world. The domain features of specificlands provide many advantages that will help them ensure the sustain-able preservation of their activities and development in an evolvingmarket driven by users. From that perspective, national cooperativesconstitute one of the pillars of agricultural policy to ameliorate theperformance and competitiveness of producers in the dynamic marketorganization. Croatian land is therefore suitable for its vineyards havingearned specific designations that can offer an effective economic energyto the national agricultural policy.
The continuous improvement of the wine production activities ofthe Croatian agricultural regions under identifiable product is expectedto lead to a better-quality visibility of the wine production activities. Asdemonstrated by the variety labels which refer to specific Croatianagricultural regions, it should be noted that its viticulture shares certaincommon characteristics with recognized European brand names, for abroader market.
References
Baget, J.F., Mugnier, M.L., 2002. Extensions of simple conceptual graphs: the complexity ofrules and constraints. J. Artif. Intell. Res. 16, 425–465.
Baget, J.F., Leclère, M., Mugnier, M.L., Salvat, E., 2011. On rules with existential variables:walking the decidability line. Artif. Intell. 175 (9-10), 1620–1654 (June).
Bojnec, S., 2011. Land Markets in the EU Candidate Countries of Croatia, Former YugoslavRepublic of Macedonia and Turkey. Factor Markets Working Paper No. 1. Centre forEuropean Policy Studies, Brussels.
Carloni, O., Leclère, M., Mugnier, M.-L., 2009. Introducing reasoning into an industrialknowledge management tool. Appl. Intell. 31, 211–224.
Charters, Steve, 2006. Chapter 2 - The history of wine. Wine and Society 10–45.Chein, M., Mugnier, M.L., 2008. Graph-based knowledge representation : computational
foundations of conceptual graphs. Series: Advanced Information and KnowledgeProcessing. Springer, London (United Kingdom) (445 pp., ISBN 978-1-84800-285-2,October).
Deloire, A., Carbonneau, A., Wang, Z., Ojeda, H., 2004. Vine and water: a review. J. Sci.Vigne Vin 38 (1), 1–13.
Doumbouya, Mamadou Bilo, Kamsu-Foguem, Bernard, Kenfack, Hugues, Foguem, Clovis,2015a. Combining conceptual graphs and argumentation for aiding in theteleexpertise. Comput. Biol. Med. 63, 157–168 (1 August).
Doumbouya, Mamadou Bilo, Kamsu-Foguem, Bernard, Kenfack, Hugues, Foguem, Clovis,2015b. A framework for decision making on teleexpertise with traceability of the rea-soning. IRBM 36 (1), 40–51 (February).
Doumbouya, Mamadou Bilo, Kamsu-Foguem, Bernard, Kenfack, Hugues, Foguem, Clovis,2015c. Argumentation semantics and graph properties. Inf. Process, Manag. http://dx.doi.org/10.1016/j.ipm.2015.08.003.
Doumbouya, Mamadou Bilo, Kamsu-Foguem, Bernard, Kenfack, Hugues, Foguem, Clovis,2015d. Argumentative reasoning and taxonomic analysis for the identification ofmedical errors. Eng. Appl. Artif, Intell. http://dx.doi.org/10.1016/j.engappai.2015.08.009.
Ellison, Patricia, Ash, Gavin, McDonald, Craig, 1998. An expert system for the manage-ment of Botrytis cinerea in Australian vineyards. I. Development. Agric. Syst. 56 (2),185–207 (February).
Fernández-Mar, M.I., Mateos, R., García-Parrilla, M.C., Puertas, B., Cantos-Villar, E., 2012.Bioactive compounds in wine: resveratrol, hydroxytyrosol and melatonin: A review.Food Chem. 130 (4), 797–813 (15 February).
Genest, D., Chein, M.A., 2005. Content-search information retrieval process based onconceptual graphs. Knowl. Inf. Syst. 8, 292–309 (no. 3, Springer).
Gómez-Plaza, E., Cano-López, M., 2011. A review on micro-oxygenation of red wines:claims, benefits and the underlying chemistry. Food Chem. 125 (4), 1131–1140 (15April).
Huglin, P., 1978. Nouveau mode d'évaluation des possibilités héliothermiques d'unmilieuviticole. Symposium International sur l'Écologie de la Vigne, l, Constança, Roumanie,1978. Ministère de l'Agriculture et de l'Industrie Alimentaire, pp. 89–98.
Jackson, Ron S., 2000. 9 – Specific and Distinctive Wine Styles. Wine Science, Secondedition. Principles, Practice, Perception, pp. 434–481.
Kamsu Foguem, B., Coudert, T., Béler, C., Geneste, L., 2008. Knowledge formalization inexperience feedback processes: an ontology-based approach. Comput. Ind. 59 (7),694–710 (September).
Kamsu-Foguem, Bernard, 2012. Knowledge-based support in non-destructive testingfor health monitoring of aircraft structures. Adv. Eng. Inform. 26 (4), 859–869(October).
Kamsu-Foguem, Bernard, 2014. Ontological view in telemedicine. Eur. Res. Telemed. (LaRecherche Européenne en Télémédecine) 3 (2), 67–76 (June).
Kamsu-Foguem, Bernard, Flammang, Aurélie, 2014. Knowledge description for thesuitability requirements of different geographical regions for growing wine. LandUse Policy 38C, 719–731.
Kamsu-Foguem, Bernard, Henry Abanda, Fonbeyin, 2015. Experiencemodelingwith graphsencoded knowledge for construction industry. Comput. Ind. 70, 79–88 (June).
Kamsu-Foguem, Bernard, Noyes, Daniel, 2013. Graph-based reasoning in collaborativeknowledge management for industrial maintenance. Comput. Ind. 64 (8),998–1013 (October).
Kamsu-Foguem, Bernard, Rigal, Fabien, Mauget, Félix, 2013a. Mining association rules forthe quality improvement of the production process. Expert Syst. Appl. 40 (4),1034–1045 (March).
Kamsu-Foguem, Bernard, Diallo, Gayo, Foguem, Clovis, 2013b. Conceptual graph-basedknowledge representation for supporting reasoning in african traditional medicine.Eng. Appl. Artif. Intell. 26 (4), 1348–1365 (April).
Kamsu-Foguem, Bernard, Tchuenté-Foguem, Germaine, Foguem, Clovis, 2014a. Verifyinga medical protocol with temporal graphs: the case of a nosocomial disease. J. Crit.Care 29 (4), 690.e1–690.e9 (August).
Kamsu-Foguem, Bernard, Tchuenté-Foguem, Germaine, Foguem, Clovis, 2014b. Concep-tual graph operations for formal visual reasoning in the medical domain. IRBM 35(5), 262–270 (October).
Kamsu-Foguem, Bernard, Tchuenté-Foguem, Germaine, Foguem, Clovis, 2014c. Usingconceptual graphs for clinical guidelines representation and knowledge visualization.Inf. Syst. Front. 16 (4), 571–589 (September).
Kamsu-Foguem, B., Tiako, P.F., Mutafungwa, E., Foguem, C., 2015. Knowledge-basedmodelling applied to synucleinopathies. Eur. Geriatr. Med. 6 (4), 381–388 (July).
Kanianska, Radoslava, Kizeková, Miriam, Nováˇcek, Jozef, Zeman, Martin, 2014. Land-useand land-cover changes in rural areas during different political systems: a case studyof Slovakia from 1782 to 2006. Land Use Policy 36, 554–566.
Lerman, Z., Csaki, C., Feder, G., 2002. Land policies and evolving farm structures intransition countries. Policy Research Working Paper No. 2794. World Bank,Washington, DC.

Lorenz, D.H., Eichhorn, K.W., Bleiholder, H., Klose, R., Meier, U., Weber, E., 1995.Phenological growth stages of thegrapevine (Vitis vinifera L. ssp. vinifera) – codesanddescriptions according to the extended BBCH scale. Aust. J. Grape Wine Res. 1,100–110.
Nicholas, Kimberly A., Durham,William H., 2012. Farm-scale adaptation and vulnerabilityto environmental stresses: insights from winegrowing in Northern California. Glob.Environ. Chang. 22 (2), 483–494 (May).
Paoli, J.-N., Strauss, O., Tisseyre, B., Roger, J.-M., Guillaume, S., 2007. Spatial data fusion forqualitative estimation of fuzzy request zones: application on precision viticulture.Fuzzy Sets Syst. 158 (5), 535–554 (1 March).
Papadimitriou, Fivos, 2012. Artificial Intelligence in modelling the complexity of Mediter-ranean landscape transformations. Comput. Electron. Agric. 81, 87–96 (February).
Pertot, Ilaria, Kuflik, Tsvi, Gordon, Igor, Freeman, Stanley, Elad, Yigal, 2012. Identificator: aweb-based tool for visual plant disease identification, a proof of concept with a casestudy on strawberry. Comput. Electron. Agric. 84, 144–154 (June).
Pinney, Thomas, 2012. The Makers of American Wine: A Record of Two Hundred Years.University of California Press, Berkeley, CA.
Potes Ruiz, Paula Andrea, Kamsu-Foguem, Bernard, Noyes, Daniel, 2013. Knowledge reuseintegrating the collaboration from experts in industrial maintenance management.Knowl. Based Syst. 50, 171–186 (September).
Potes Ruiz, Paula, Kamsu Foguem, Bernard, Grabot, Bernard, 2014. Generating knowledgeinmaintenance from Experience Feedback. Knowl.-Based Syst. 68, 4–20 (September).
Ripoche, Aude, Rellier, Jean-Pierre, Martin-Clouaire, Roger, Paré, Nakié, Biarnès, Anne,Gary, Christian, 2011. Modelling adaptive management of intercropping in vineyardsto satisfy agronomic and environmental performances under Mediterranean climate.Environ. Model Softw. 26 (12), 1467–1480 (December).
Ruml, Mirjana, Vuković, Ana, Vujadinović, Mirjam, Djurdjević, Vladimir, Ranković-Vasić,Zorica, Atanacković, Zoran, Sivčev, Branislava, Marković, Nebojša, Matijašević, Saša,Petrović, Nevena, 2012. On the use of regional climate models: implications ofclimate change for viticulture in Serbia. Agric. For. Meteorol. 158–159, 53–62 (15June).
Russell, G., Muetzelfeldt, R.I., Taylor, K., Terres, J.-M., 1999. Development of a crop knowl-edge base for Europe. Eur. J. Agron. 11, 187–206 (November).
Sablayrolles, J.M., 2009. Control of alcoholic fermentation in winemaking: current situa-tion and prospect. Food Res. Int. 42 (4), 418–424 (May).
Sene, Alsane, Kamsu-Foguem, Bernard, Rumeau, Pierre, 2015. Telemedicine Frameworkusing Case-based Reasoning with Evidences. Comput. Methods Prog. Biomed. 121(1), 21–35 (August).
Špiranec, Saša, 2011. Wines of Croatia: unique and exciting. Publisher: Croatian Chamberof Economy, for the publisher Vidošević, Nadan, CCE President, Zagreb, (May). Availableonline at: https://www.bluedanubewine.com/pdf/Wines_of_Croatia.pdf (last accessedSeptember 25, 2015).
Sowa, J., 1984. Conceptual structures: information processing in mind and machine. TheSystems Programming Series (Hardcover). Addison-Wesley Longman PublishingCo., Inc, Boston, Massachusetts, USA, p. 481.
Sowa, J.F., 2000. Knowledge Representation: Logical, Philosophical and computationalFoundations. Brooks Cole Publishing Co.
Thomopoulos, Rallou, Buche, Patrice, Haemmerlé, Ollivier, 2003. Representation of weak-ly structured imprecise data for fuzzy querying. Fuzzy Sets Syst. 140 (1), 111–128 (16November).
Thomopoulos, Rallou, Destercke, Sébastien, Charnomordic, Brigitte, Johnson, Iyan,Abécassis, Joël, 2013. An iterative approach to build relevant ontology-aware data-driven models. Inf. Sci. 221, 452–472 (1 February).
Tonietto, J., 1999. Les macroclimats viticoles mondiaux et l'influence dumésoclimat sur latypicité de la Syrah et du Muscat de Hambourg dans le sud de la France :méthodologie de caractérisation (Thèse Doctorat), École Nationale SupérieureAgronomique de Montpellier - ENSA-M (233p).
Tonietto, J., Carbonneau, A., 2004. A multicriteria climatic classification system for grape-growing regions worldwide. Agric. For. Meteorol. 124/1-2, 81–97.
Urtubia, Alejandra, Ricardo Pérez-Correa, J., Soto, Alvaro, Pszczólkowski, Philippo, 2007.Using data mining techniques to predict industrial wine problem fermentations.Food Control 18 (12), 1512–1517 (December).
Zavaglia Torres, Tércia, Pierozzi Jr., Ivo, Rodrigues Pereira, Nadir, de Castro, Alexandre,2011. Knowledge management and communication in Brazilian agricultural re-search: An integrated procedural approach. Int. J. Inf. Manag. 31 (2), 121–127 (April).
Bernard Kamsu-Foguem: He has a PhD in Computer Science and Engineering from theUniversity of Montpellier 2 in 2004. He got the “accreditation to supervise research”,abbreviated HDR from University of Toulouse in 2013. He has obtained the status ofVisiting Professor at international universities: United Kingdom (e.g. Oxford BrookesUniversity, Oxford), and Finland (e.g. Aalto University, Helsinki University of Technology,VTT Technical Research Centre of Tampere, University of Oulu, Åbo akademi ofTurku University). His current interests are in Knowledge Discovery and Data Mining,Knowledge Representation, Formal Visual Reasoning, Ontology-based Semantic Analysis,Knowledge Exploitation for remote Collaboration, Decision Support Systems andIntelligent Systems. Application domains include industrial Continuous Improvementprocesses, Telemedicine services and Health Information Systems. He is a reviewer for alarge number of international scientific journals such as Computers in Biology andMedicine, Knowledge Management Research & Practice, Interacting with Computers,Sensors, Engineering Applications of Artificial Intelligence and Knowledge-Based Systems.He is a member of the thematic group: e-Health of InterOP-VLab (International VirtualLaboratory for Enterprise Interoperability).
Aurélie Flammang: She graduated in wine business from Université du vin de Suze-La-Rousse (southeastern France) in 2008. She is passionate about thewinefield from the landto the commercialization. She already contributed to the publication of a scientist report ofknowledge description for the suitability requirements of different geographical regionsfor growing wine in China. She is specialized in opening-market for foreign and domesticbeverages. She travels often all around theworld tomeet peoplewho are at the root of theproducts to experience total immersion in their natural environment. Her interest is alsofocused on social and cultural aspects. She has been a wine writer in one of the mostinfluential French gastronomic guide Gault et Millau.
Germaine Tchuenté-Foguem: She has a Master of Advanced Studies from the Universityof Yaoundé I (Cameroon) in 2007, in the domain of synchronization in dynamic distribut-ed systems. She has a Research Master in automatic and decisional systems obtained in2010 from ENIT-INPT of Tarbes (France) on Fuzzy logic in competence management.She is preparing a PhD thesis focused on a knowledge-based information system for visualsupport in critical decision-making. She currently takes an active interest in Computer in-formation system(s) (e.g. algorithmic processes), information and communication tech-nology, Data Warehouse, Data mining (Sequential rule mining, Sequential patternmining or Association rule mining), Knowledge acquisition and Knowledge discovery.
Copyright © 2022 FDOKUMEN