Supporting Decision Analysis: A Pragmatic Approach - White ...
145
Supporting Decision Analysis: A Pragmatic Approach by Lisa Simpson Submitted in accordance with the requirements for the Degree of Doctor of Philosophy The University of Leeds School of Computer Studies June 1998 The candidate confirms that the work submitted is her own work and that appropriate credit has been given where reference has been made to the work of others.
-
Upload
khangminh22 -
Category
Documents
-
view
2 -
download
0
Transcript of Supporting Decision Analysis: A Pragmatic Approach - White ...

Supporting Decision Analysis: A Pragmatic
Approach
by
Lisa Simpson
Submitted in accordance with the requirements for the Degree of Doctor of
Philosophy
The University of Leeds
School of Computer Studies
June 1998
The candidate confirms that the work submitted is her own work and that
appropriate credit has been given where reference has been made to the work of
others.

ii
Abstract
Decision making is a practical task. Clearly, all aspects of any approach to
decision analysis and decision support should be considered with respect to their
ease of application as well as their value. The work presented in this thesis is
motivated by such a viewpoint. The field of decision analysis is broad, and this is
reflected by the consideration of four linked aspects. Cross-sections have been
taken through the research literature in an attempt to consider the most important
aspects of decision analysis and decision support. These research findings are
examined with respect to how things might function in practice. Specifically the
aspects which I consider are: a comparison of underlying mathematical theories;
the elicitation and application of preference data; facilitation as a group decision
support tool; and the development of hypothetical scenarios.
The purpose of decision analysis and decision support is to improve problem
solving. With a pragmatic approach in mind, two normative models are compared
on the basis of the assumptions they make about a decision maker. Further, how
these alternative techniques have worked in practice is discussed. In order to make
use of such methods, particular data are required. Perhaps a major criticism of
decision analysis concerns its use of subjective preference data. Therefore, an
investigation of the ease with which these data can be elicited is conducted. The
nature of the data is considered via an application. Having concentrated upon
decision analysis, i.e. the examination of a formulated problem, I take a broader
view of the field by considering decision support.
Supporting decision making requires the setting of aims and objectives in addition
to establishing a problem model from a problem mess. Supporting a group adds
complexity to the analyst’s role. Group decision making and group decision
support are examined. Particular attention is given to the technique of group
facilitation and some pertinent issues for successful decision support are
established. In order to strengthen these findings a further study of group decision
making is made. Case study work provides a more realistic view of supporting an

iii
actual group in a live setting. In addition, I am able to describe the development
and use of hypothetical scenarios to promote decision analysis and decision
support.
Decision analysis and decision support is no different from any other technology
in that it is not a ‘quick fix’. Users are faced with a learning curve as they are
required to approach their problem in a novel way. From an analyst’s perspective,
the needs of each decision maker may be different, so any technique must be
flexible. This thesis demonstrates the ability of both decision makers and analysts
to rise to such challenges, resulting in successful applications of decision analysis
and support. It also reinforces the value of employing these techniques. Further, I
identify aspects which can make this undertaking easier.

iv
Contents
LIST OF TABLES ........................................................................................................................VI
CHAPTER 1 - INTRODUCTION ................................................................................................. 1
DECISION ANALYSIS AND DECISION SUPPORT ............................................................... 1
UNDERLYING THEORIES........................................................................................................ 4
ELICITATION............................................................................................................................. 7
GROUP DECISION MAKING.................................................................................................... 9
SCENARIO SETTING .............................................................................................................. 10
LAYOUT OF THESIS............................................................................................................... 11
CHAPTER 2 - A COMPARISON OF NORMATIVE TOOLS ................................................ 14
INTRODUCTION...................................................................................................................... 14
MULTI-ATTRIBUTE VALUE THEORY ................................................................................ 18
Introduction ........................................................................................................................... 18
Model..................................................................................................................................... 18
Discussion.............................................................................................................................. 20
ELECTRE II............................................................................................................................... 21
Introduction ........................................................................................................................... 21
Model..................................................................................................................................... 22
Discussion.............................................................................................................................. 24
A COMPARISON OF MAVT AND ELECTRE II.................................................................... 25
THE ROLE OF NORMATIVE MODELS IN PRESCRIPTIVE DECISION SUPPORT ......... 30
DISCUSSION ............................................................................................................................ 32
CHAPTER 3 - APPLICATION OF ELICITATION TECHNIQUES...................................... 36
INTRODUCTION...................................................................................................................... 36
PREFERENCE ELICITATION................................................................................................. 38
ELICITATION EXERCISE....................................................................................................... 41
Method................................................................................................................................... 41
Analysis.................................................................................................................................. 44
Results.................................................................................................................................... 47
SIMULATED EVALUATION .................................................................................................. 49
DISCUSSION ............................................................................................................................ 51
Conclusions ........................................................................................................................... 53

v
CHAPTER 4 - GROUP DECISION MAKING AND FACILITATION.................................. 55
INTRODUCTION...................................................................................................................... 55
WORKING IN A GROUP ......................................................................................................... 57
FACILITATION ........................................................................................................................ 61
EXPERIMENTS ........................................................................................................................ 64
Problems Related to Group Decision Making Research ....................................................... 64
Criteria for Evaluation and Validation ................................................................................. 69
Pilot Experiment .................................................................................................................... 72
Main Experiment ................................................................................................................... 77
Comments on the Data Analysis ............................................................................................ 85
DISCUSSION ............................................................................................................................ 86
Conclusions ........................................................................................................................... 89
CHAPTER 5 - SCENARIO SETTING AND USE ..................................................................... 91
INTRODUCTION...................................................................................................................... 91
SUMMARIES OF CASE STUDY GROUPS AND SCENARIO THEMES ............................. 94
Study Group 1 - RODOS ....................................................................................................... 95
Study Group 2 - DoH............................................................................................................. 96
Study Group 3 - SPUDM....................................................................................................... 98
SCENARIO BUILDING.......................................................................................................... 100
The Uncontrollable Factor.................................................................................................. 102
The Unforeseen Event.......................................................................................................... 103
The Red Herring .................................................................................................................. 103
SCENARIO USE...................................................................................................................... 105
Breakout Groups ................................................................................................................. 105
Development of Possible Outcomes..................................................................................... 106
I do, and I understand ......................................................................................................... 107
OBSERVATIONS FROM APPLIED WORK ......................................................................... 108
Study Group 1 - RODOS ..................................................................................................... 108
Study Group 2 - DoH........................................................................................................... 110
Study Group 3 - SPUDM..................................................................................................... 111
DISCUSSION .......................................................................................................................... 113
Conclusions ......................................................................................................................... 114
CHAPTER 6 - DISCUSSION AND CONCLUSION ............................................................... 116
INTRODUCTION.................................................................................................................... 116
THE POWER AND ROLE OF DECISION ANALYSIS. ....................................................... 118
THE VARIATION IN TECHNIQUES AND METHODOLOGY........................................... 120

vi
THE PROBLEMS OF ANALYSING DECISION ANALYSIS. ............................................. 122
AN APPROACH TO SYSTEMATIC EVALUATION OF DECISION ANALYSIS. ............ 124
CONCLUSION ........................................................................................................................ 125
APPENDIX 1 ............................................................................................................................... 135
ELICITATION EXERCISE..................................................................................................... 135
DATA CALCULATIONS FOR TABLE 3.4 ........................................................................... 144
DATA CALCULATIONS FOR TABLE 3.5 ........................................................................... 144
APPENDIX 2 ............................................................................................................................... 145
PILOT STUDY QUESTIONNAIRE ....................................................................................... 145
MAIN STUDY QUESTIONNAIRE........................................................................................ 152
PILOT DATA .......................................................................................................................... 157
MAIN DATA ........................................................................................................................... 159
List of Tables
TABLE 2.1: MODEL OF A DECISION PROBLEM 15
TABLE 2.2: PERFORMANCE ON CRITERIA 28
TABLE 3.1: DESCRIPTION OF THE FOUR DIMENSIONS 42
TABLE 3.2: THE THREE LEVELS ON THE FOUR DIMENSIONS 43
TABLE 3.3: RESULTS OF THE SG AND VAS ELICITATIONS 48
TABLE 3.4: SIMULATED OUTCOMES FOR 250 CLIENTS ON EACH PROGRAMME 50
TABLE 3.5: UTILITY BASED OUTCOMES FOR THE ALTERNATIVES 50
TABLE 4.1: ALTERNATIVE HYPOTHESES FOR PILOT EXPERIMENT 73
TABLE 4.2: AVERAGE RESPONSE TO PROCESS INDICATORS 74
TABLE 4.3: WILCOXON PILOT RESULTS 76
TABLE 4.4: ALTERNATIVE HYPOTHESES FOR THE MAIN STUDY 80
TABLE 4.5: CONFLICT MEASURE FOR THE TREATMENTS 81
TABLE 4.6: WILCOXON MAIN RESULTS 83

vii
Acknowledgments
I would like to thank Simon French who remained my supervisor despite leaving
Leeds University. The quality of support he gave in his own time was invaluable. I
would also like to thank Les Proll for generously offering to take responsibility for
me after Simon’s move and for fighting in my corner.
I would like to acknowledge the input of the anonymous referees who commented
on the bulk of the work which appears in Chapter 2 during its submission to
JORS. Also, I should mention Theo Stewart and Matthew Sutton for commenting
on early drafts of that paper.
The work which appears in Chapter 3 was performed in collaboration with
Matthew Sutton, and benefited from the comments of Dave Buck and the
anonymous referees chosen by the Addictions Research Journal. Further, thanks
should be given for comments arising out of the presentation of this work at
MCDM ‘97.
The work conducted in Chapter 4 was made possible by the award of an Academic
Development Fund grant. Early comments at SPUDM 15 shaped the approach.
Thanks also to the facilitators who took part in the experiments.
Many people were involved in the scenario work of Chapter 5. In particular, I
would like to thank John Maule, Peter Bennet and Simon French for making the
trips to London such an adventure.
On a personal note, I would like to thank Sarah Fores for tolerating my moods in
such a small office. Keith Hobley was tremendously supportive and always
seemed to have the right answer to calm me down. Jason Wood gave me the
impetus to get started and keep going. I wouldn’t have done it without his drive
and determination rubbing off on me.
Finally, I would like to thank my mum, dad and sister for believing I could do it.

viii

Chapter 1 1 Introduction
Chapter 1 - Introduction
DECISION ANALYSIS AND DECISION SUPPORT
Multi-criteria decision making is, in a non-theoretical sense, commonly practised.
People often make decisions involving a number of conflicting objectives, usually
in an intuitive sense, both in personal and work contexts. However, formal
approaches have been, and continue to be developed in order to ensure a
structured approach to such decisions. Multi-criteria models are being increasingly
studied and applied because of the ability of the human brain to consider only a
limited amount of information at any one time. Simon (1956) argues that many
decisions require a level of understanding about the circumstances, the
alternatives, the impacts and the uncertainties which it is quite unrealistic to
expect an individual, or indeed an organisation, to possess. With the advent of
information technology and information processing, many strategic management
issues are accompanied with a plethora of data. Further, a formal methodology
will enable the decision maker (DM) to provide an audit trail. The recording of
such key information will not only provide a more defensible solution, but will
also allow an individual or organisation to review work, and learn from past
experiences. Therefore, as decisions become more complex, there is value in
formally ordering data and establishing which aspects on which to concentrate.
The opinion of many prominent in the field (Bell et al, 1988, French, 1989,
Belton, 1990, Roy, 1990, Kleindorfer et al, 1993) is that the aim of decision
analysis and decision support should be to help the DM explore the problem, learn
about personal preferences and value systems, establish real objectives, and

Chapter 1 2 Introduction
eventually lead to a preferred course of action. Decision analysis, in this sense, is
characterised by the application of a decision model. The DM is encouraged to
explore the problem via the introduction of a mathematical analysis. The problem
is formulated to facilitate consistent and rational thought. Decision support, on the
other hand, could be characterised by the process of establishing the correct data
for this analysis. It concerns itself with aiding the DM through the problem mess
to find those aspects which are critical to solving the problem. Decision support in
some senses could be described as a sieve, through which only the necessary
information for a decision analysis can pass. The expected outcome of a decision
analysis and support session is not however an acceptance of the solution as
provided by the decision modelling, but is a greater knowledge about the
intricacies of the problem and a clearer view of the DM’s preferences.
As noted above, the aim of an analyst is to promote consistent and rational
decision making. A measure of rationality can be taken from an underlying
mathematical model. This can be observed through examining the axioms
underlying the tool, or measuring it against set problems and paradoxes. However,
further evidence of a rational solution should be gleaned via the production of a
defensible conclusion. Particularly in a practical sense, implementation of the
chosen solution may be more effective if everyone concerned can appreciate why
it has been chosen. Further, the generation of clear objectives which demonstrate
that the chosen solution is rational will assist in future problem solving. Therefore,
both of these measures are important, especially when considering the subjective
nature of the data used in decision modelling.
Decision problems vary significantly in their size, complexity and implication.
Consequently, there is a wide range of decision analysis and decision support
mechanisms. Decision problems can be categorised by their different aspects, for
example, whether they involve any uncertainty, whether they have a finite number
of alternatives. Different methods exist to support such different types of decision.
It is important to note that the growth of decision support tools has not necessarily
corresponded to those categories of decision which are not well catered for. Often,

Chapter 1 3 Introduction
an approach begins with an intuitive model of how a DM makes choices, and
these methods are then extended so that they can be applied to alternative
categories of decision, beginning with the most commonly occurring, or
straightforward to model.
Therefore, the first issue facing a DM may be to choose between the various types
of decision analysis or decision support. This should be an informed rational
decision based on sound evaluation. However, it is likely that this problem is
never specifically considered, rather that the appointment of a consultant will
dictate what methodology will be employed. On the surface, this may be a
legitimate approach if one assumes that the successful applications of decision
support by the consultant are the reasons for employment. What is crucial is that
the DM feels comfortable with the approach and gains knowledge and
understanding from the decision analysis. The importance of the outlook of the
DM is an issue which will be highlighted throughout the thesis.
The international academic support for decision analysis may have stemmed from
the international development of various decision theories. Although there is
much agreement on the role of decision analysis, there is disagreement about a
suitable model and approach on which to base such an analysis. Numerous
methods are being researched, refined and promoted. According to Eden and
Ackermann (1994) the evaluation of the performance of group decision support
systems has been dominated by an experimental and laboratory based approach,
tending to ignore many of the issues that would be paramount for some of the
stakeholders in the evaluation process. In their paper, they explore the criteria that
might be used by a wide variety of stakeholders, including developers, facilitators,
clients, key actors, vendors, as well as academics. A similar, if somewhat reduced
version of this approach, is taken here. Two stakeholders are chosen, the DM and
the decision analyst. Insofar as finding the method acceptable and useful for its
purpose, the suggested criteria for the DM are loosely:
• can I understand the model

Chapter 1 4 Introduction
• do I feel it represents a sensible decision process
• can I use the model
• does it solve my problem.
Those for the analyst would be from a different viewpoint and might include:
• can I justify what I am doing to the DM
• can I establish the correct data for the model
• can I explain the result of the analysis
• can I satisfy the DM.
With these criteria in mind, I have taken a number of cross-sections through the
many aspects of decision analysis and decision support, to try and better
understand their contribution and role. I examine underlying mathematical models
of decision making: that is, solution approaches to a formulated problem. These
models require preference data. The nature of preference data is described, and a
preference elicitation experiment is conducted. Having concentrated on issues
related to decision analysis, I then consider decision support. It is not sufficient to
establish that decision analysis models ‘work’, it is also necessary to investigate
whether they can be used in a real-life, live environment. To this end, I consider
group decision making, and how to support it. One particular method is
investigated. Continuing from this specific aspect of decision support, a broader
view is taken, examining decision support through the use of case studies and
hypothetical scenarios. The work focuses on how to write and use hypothetical
scenarios to promote decision support.
UNDERLYING THEORIES
An initial categorisation of decision analysis splits the field into three areas.
Normative decision theory is concerned with rational and consistent approaches to

Chapter 1 5 Introduction
modelling and solving decision problems. As such, normative models often have
axiomatic bases (French, 1986). Those with a less rigorous approach are still
logically argued and have a formal basis. In particular, they make use of
algorithms for solution methodologies (Saaty, 1980, Roy, 1991). The value of
normative decision analysis is in its aim to make a decision problem explicit.
Evaluation of the normative methods is achieved by investigation of the
mathematics in addition to philosophical/ethical approaches to consider the ‘good
sense’ of any axioms and algorithms. Further, normative analysis can be judged by
how an application of the technique performs on model problems and paradoxes.
Descriptive decision theory investigates and describes the actual techniques used
by DMs to make decisions. Biases such as overconfidence have been identified.
Experiments have shown that DMs systematically overestimate their ability to
provide correct answers to questions. This bias is emphasised in a group setting,
where the members allow a consensus of opinion to boost their confidence further.
The aim of descriptive analysis is to model inconsistencies and irrationalities
which may manifest. The main contribution of descriptive analysis has been to
extend our understanding of the way DMs think and process information. Many
years of research have resulted in the development of judgemental heuristics
which can predict the systematic violations of normative models which DMs
display (Kahneman et al, 1982). Validation of these descriptive theories has been
established via extensive statistical testing.
Prescriptive decision analysis may be considered the third category of decision
analysis. Prescriptive analysis concerns itself with applications of decision
analysis. Therefore, not only does this approach have a base in the normative
modelling of a decision problem, but also in working with DMs and their
descriptive methods of thinking to try and build a representation of a decision
problem with a view to finding a sensible solution (French, 1994). This pragmatic
approach to decision analysis may appeal to DMs and should lead to an increased
number of case studies performed by the academic community to support real
decisions. However, the recent development of the prescriptive approach over the

Chapter 1 6 Introduction
last 10-15 years means that it is yet to be followed by clear validation
methodologies. By their very nature, decision analysis and support sessions are
unrepeatable in the empirical/statistical sense. Involvement in such sessions will
change the outlook of the subjects. The approach is fluid and dynamic which
means that no two applications could be ‘scientifically’ comparable.
A good representation of normative, descriptive and prescriptive approaches is
given by French (1994). He captures the diversity of disciplines which have
influenced decision analysis. Normative and descriptive approaches are presented
as opposite sides of a coin to mirror the considerable differences which exist
between the two. French warns that if this difference is not acknowledged, then
any analysis is likely to be rejected as flawed and irrelevant. See Figure Chapter 1
.1.
Descriptive Analysis
Normative Analysis
Prescriptive Analysis
HCI and Visualisation
Computational Feasibility
Scientific Consensus
Organisation Theory
Politics
Statistics
Economics Voting/Social ChoicePhilosophy
Operational ResearchMathematics
Behavioural SciencePsychology
Figure Chapter 1 .1: The two sides of the prescriptive analysis coin
This thesis will concentrate on the study of prescriptive decision analysis.
Prescriptive decision analysis being a combination of normative and descriptive
methodologies as described above, implies that the thesis will also examine
normative and descriptive issues. However, this work is principally motivated
towards validation and evaluation of the prescriptive approach. Whilst it is very
far from developing a methodology, it does highlight experiences and experiments
which try to work towards this end.

Chapter 1 7 Introduction
Within these three categories of decision theory, many competing normative,
descriptive and prescriptive approaches exist. Two normative models have been
selected for study on the basis that they have different underlying ‘views’ of the
DM. Systematic evaluation of the normative models is relatively straightforward,
not least because it is relatively easy to set evaluation criteria. In the context of a
prescriptive analysis, there are also different ‘ways of use’, e.g. facilitated,
software led, novice led. In any comparison of competing approaches, there is a
need to consider not just the mathematics of the models, but also how they ‘sit’
with the DM, and how they perform with the chosen ‘way of use’. Therefore,
attention will be paid to the running of a decision modelling session. Further, in a
real life application, one should consider the nature of the decision problem itself
with regard to the tool’s appropriateness. As the applications undertaken in the
thesis are all hypothetical, this issue cannot be fully explored. However, the role of
different decision scenarios as a learning and evaluation mechanism is discussed.
Chapter 2 concludes that it is difficult to state that one approach continuously
outperforms another, although based upon the criteria suggested above, one model
could be placed ahead of the other. However, many methods should be available
to mirror the many different types of problems and solution approaches. Through
use of this variety, particular aspects might be identified as ‘good practice’ which
could then be cemented together to form a hybrid approach. Further, the success of
a model also relies on the quality of the inputs and is intertwined with the
analyst’s approach. Therefore, further aspects of decision analysis and support
need to be considered.
ELICITATION
One aspect which normative models have in common is their need to establish a
DM’s preferences. Research work in the field of preference elicitation has
concentrated upon whether elicitation methods are comparable and consistent. The
aim is to establish whether techniques are eliciting the same data, with a view to
finding a ‘gold standard’ (Dolan and Sutton, 1995). This is undoubtedly a

Chapter 1 8 Introduction
complex task, especially when the ‘real’ data to which one might compare the
stated responses are themselves subjective. However, statistical analysis has been
performed, and justification of the methods has been established. This is a
normative approach to evaluation. This thesis is concerned with a prescriptive
approach and therefore will look more towards a DM’s use of elicitation
techniques and how a decision analyst might justify the data by presenting results
of such techniques to the DM.
A normative validation may be of negligible worth, considering all the
contributing errors which may arise during preference elicitation. Such close
scrutiny of formulation issues may seem pointless when the crudity of a DM’s
responses to elicitation are considered. How then might one approach evaluation
sensibly? This thesis will make a case for keeping a clear view of the implications
of the preferences of a DM. This will enable the analyst to explain why a specific
result has been reached, and elucidate the DM’s beliefs and preferences. It is also
possible to investigate how the results of an analysis might alter if the preference
data were different. This can be achieved through the performance of sensitivity
analysis (Belton and Vickers, 1989, Rios Insua, 1990). With the likely
inaccuracies outlined above, the role sensitivity analysis could play in
investigation of preference data is clear.
This thesis reports on a preference elicitation experiment based upon an existing
decision problem in the literature. Chapter 3 concludes that it is relatively
straightforward to collect preference data. Further, the data demonstrate a
complexity consistent with non-linear preference functions. Analysis and
application of the preference data provides a solution to an existing decision
problem. Further, the use of preference data to solve this problem sheds more light
on the nature of the problem itself, in addition to society’s feelings towards it.
GROUP DECISION MAKING
It is intuitive to think that decision making can be made easier by giving the task
to a group rather than an individual. However, complexity increases when

Chapter 1 9 Introduction
decision tasks are given to a group to solve. The reasons for the increase in
complexity are twofold:
(i) the decision problem is likely to be much larger and cover many more areas,
hence the need for a group to solve it;
(ii) management issues arise when groups are used.
Typically then, we find that in applications of prescriptive analysis, more group
problems have been addressed than those faced by individuals. In addition, group
decision making is a popular research field due to its wide applicability and
business opportunities. One of the popular research areas discusses the method of
facilitation as a group decision support tool. This approach could be used with any
normative decision model to form a prescriptive approach, but is often associated
with a value model. As value theory is one of the areas considered by this thesis, it
seems appropriate to choose facilitation to study also. In order to evaluate
facilitation, reasons for possible group dysfunction, as highlighted by descriptive
decision analysis, are discussed. Further, the suggested benefits of facilitation are
outlined. One approach for whether this is a good technique would measure
whether any of the dysfunctional aspects are removed or the stated benefits
observed.
Attempts to evaluate and validate aspects of group decision making are
complicated. Acceptable group criteria could be established to measure whether a
good solution has come from a decision support session, but these may be
pointless if they are outcome based. Outcome is a bad measure for many reasons.
If a decision involves an uncontrollable, uncertain event, then even if the best
decision possible was reached, the outcome may be disastrous. Further, at what
point do you measure whether a solution has worked or not? Many decisions are
strategic and involve consequences over a period of time. Even if the full
repercussions of an action can be established, analysing in retrospect is prey to
hindsight bias (Fischhoff, 1975). A more sensible approach therefore is to look to
quality improvements in process. However, these are mostly anecdotal or

Chapter 1 10 Introduction
perception based coming from either participants or decision analysts.
Unfortunately, there are reasons to doubt the validity of such measures. Business
managers who have spent money on a management consultancy may prefer to lie
about how helpful it has been rather than admit to wasting (large sums of) money.
In the research context, a citation bias (Beach et al., 1987) exists around successful
applications of techniques. Therefore, there will be much more positive presence
in the literature advocating the use of such tools. This thesis will examine the
method of facilitation and present some experimental results. The aspect of
validation will be examined.
Chapter 4 concludes that facilitation can provide a feel-good factor, which may in
turn contribute to a better, more productive, working environment. Unfortunately,
the experiments do not find clear evidence for other positive influences of the
facilitation approach. Possible shortcomings of the experiments are considered in
the light of the findings. Further, the opportunity for the facilitator to learn during
the decision support session is discussed. It is this consideration which leads to the
final piece of work involving case studies and hypothetical teaching scenarios.
SCENARIO SETTING
One approach to assessment and validation of prescriptive decision analysis might
be via scenario setting. This approach must be tempered by the fact that DMs are
likely to act differently in a hypothetical setting. Scenarios can be developed
which are complex and dynamic. However, it is unlikely that analysts can
realistically generate the less tangible aspects which affect decision making, such
as stress and pressure to perform. For the purposes of establishing the DMs’ view
of tools and models, the safe environment of a hypothetical scenario will allow
them to question and criticise more freely. One aspect which should be considered
with an objective of validating prescriptive support is the scenario itself. Initially it
is important to interest the participants. Further, if they feel that the scenario was
straightforward, they might not appreciate the power of the support, so complexity
is key. Lessons which have been learnt through use of scenarios in a number of

Chapter 1 11 Introduction
different settings are discussed below along with recommendations for their
construction and use.
Chapter 5 concludes that hypothetical scenarios have a very productive role to
play in promoting decision analysis and decision support. Moreover, they offer an
opportunity to impart current research findings in particular fields. Further, they
allow each party to ‘practise’ certain skills needed in a decision support session.
The use of scenarios has underlined how important certain basic facets of decision
support can be. For example, objective setting, not only by the DMs but by the
analysts, is fundamental. Moreover, these objectives must be communicated to
each party, and if necessary, brought into harmony. In addition, specific aspects
concerned with scenario building and use are addressed, which will hopefully lead
to a more successful session.
LAYOUT OF THESIS
The layout of this thesis mirrors a route into understanding and appreciating the
subtleties of decision analysis. It charts the chronology of the work in which I
have been involved. To gain an initial understanding of decision analysis, I spent
sometime investigating alternative mathematical models. On the surface, such
models can be very well understood from texts and papers. However, it soon
became clear that to really appreciate the differences between these models, an
application was necessary. In order to work towards performing an application, I
concentrated on the use of a particular mathematical model. This led me to
consider problem modelling and preference elicitation techniques. The main aim
of this work was to consider the charges that decision analysis was too time
consuming to perform and that preference elicitation was too complex for a DM to
comprehend.
The aims of a decision analytic model and how it might work were now clearer. I
began to consider what decision analysis had to offer a group with a complex
decision problem. There are obvious benefits from structuring a problem, but I
also wanted to find some of the more subtle advantages of applying decision

Chapter 1 12 Introduction
support. The group dynamics literature suggested a plethora of problems which
any decision support mechanism must address, in addition to trying to model a
complex problem and establish consensus on group preferences. In order to
remain focused, I chose to study a group support system known as facilitation. The
use of hypothetical scenarios to investigate facilitation led me to the last area for
study within the thesis. It had become apparent that, whilst decision analysis had a
lot to offer, it is in some respects, a ‘new technology’. As such, users would
benefit from exposure to the methods in order to familiarise themselves with how
decision modelling and analysis might progress and evolve. It would be untrue to
claim that this route of discovery through decision analysis had been planned in
advance. But it did arise from a logical chain of events whose basis was a search
for a pragmatic understanding of the role and power of decision analysis.
Prescriptive analysis concerns itself with ‘good practice’ in that it makes use of
consistent and rational models for problem solving whilst helping a DM to
articulate preferences and aims. The results given by this approach should
elucidate aspects of the problem which are particularly crucial or problematic.
There are many aspects to evaluating decision analysis and decision support due to
the fact that there are many parts to a decision support system. Further, setting of
criteria for evaluation and validation is complex and choosing a correct indicator,
such as process as opposed to outcome must be considered. This is additionally
complicated when one considers whose criteria to use, the analyst’s or the DM’s.
This issue will be addressed throughout the thesis, considering all aspects of a
prescriptive decision support.
Chapter 2 will consider two normative theories. They will be outlined at the
axiomatic level in order to examine the implicit view they assume of the DM.
Further, they will be considered at a more philosophical level to address the issue
of how they ‘sit’ with a DM. Evidence from a DM’s perspective will be presented
along with the views of practitioners and academics. Throughout, the issue of
evaluation criteria, what and whose, will be considered. Chapter 3 moves onto the
elicitation of preference data for such models. Concentrating on two techniques,

Chapter 1 13 Introduction
an elicitation exercise is performed and the data applied to a published scenario.
The need to appreciate the data and their implications are stressed.
Communication of this to the DM is key. Chapter 4 considers decision analysis
and decision support in a group setting. Particular group dynamics and
dysfunction aspects are outlined. One technique of group decision support is
considered, that of facilitation. Literature on a DM’s perceptions of, and attempts
to, systematically evaluate the technique are reviewed. A number of personal
applications of the technique are outlined, and their findings explained. Again, the
issue of criteria for assessment is addressed. Chapter 5 draws together aspects
from the earlier chapters to consider the role of scenario setting in evaluation of
decision analysis and decision support. Consideration is given to the important
roles of risk, uncertainty and uncontrollability. Chapter 6 summarises the research
findings of this thesis and concludes the work. Areas for further study are
suggested.

Chapter 2 14 MAVT and ELECTRE
Chapter 2 - A Comparison of Normative Tools
INTRODUCTION
It has been suggested that the process of analysing decisions has been evolving
since the 18th century (Pearman, 1996). Two prominent events in the 1700s show
how, even then, thinking was advanced. There was an interest in the process of
making ‘good’ decisions by considering all the dimensions of a problem and
finding the most beneficial alternative. Further there was a discovery of the
irrationality which DMs would display when compared to a straightforward
mathematical description of a problem. The earlier of the two events involves risk
and uncertainty. It centres on the St. Petersburg Paradox, stated by Daniel
Bernoulli in 1738 (Bernoulli, 1954). This demonstrates how DMs do not act in the
way that a mathematical evaluation would dictate. This has led to the recognition
of preference functions and attitudes to risk. The second event specifically
concerns the need to trade-off values, but touches on issues of modelling and
process. In a letter written in 1772, Benjamin Franklin advises his friend on how
to address a career choice (Willcox, 1975). He recommends the use of the Weight
of Reasons which is constructed by trading arguments for a particular course of
action with arguments against. Such ideas have precipitated the need for more
heavily weighting certain dimensions of a problem.
Many years have passed from these early beginnings of decision analysis, and the
issues raised above have been incorporated into powerful decision models. In
order to explain decision analysis more clearly, and in particular normative theory,
standard terminology exists. The following terms appear in this thesis. A DM

Chapter 2 15 MAVT and ELECTRE
must choose between a number of alternatives / options / strategies. Each of these
alternatives could be described according to a performance level / score on a
number of attributes / dimensions / criteria. A table can be drawn up to represent
this model of the decision problem, an example of which is given in Table
Chapter 2 .1.
Attribute 1 Attribute 2 Attribute 3
Attribute Weights w1 w2 w3
Alternative A a1 a2 a3
Alternative B b1 b2 b3
Alternative C c1 c2 c3
Alternative D d1 d2 d3
Table Chapter 2 .1: Model of a Decision Problem
A DM could express specified preference information for the range of
performances and for each attribute. The preference data required varies from
method to method. However, it is always used to generate information on the
consequences of choosing a particular alternative. Sometimes the consequences of
choosing a particular alternative cannot be determined with certainty due to
uncontrollable external factors. If this is the case, then decisions are made in a
risky or uncertain environment. Since there are several possible states of nature
which may occur after the decision has been made, the interaction of the
alternative and the eventual state of nature will dictate which outcome from a set
of consequences occurs. A DM would state their belief about the likelihood of
each possible state of nature occurring. (I use DM in the singular because the
majority of research work in the field relates to an individual DM. I have chosen
to use pluralise DM to avoid the gender issue (Collinson et al., 1992)). In addition,
preference data which reflects an attitude to risk over the consequences is elicited
from the DM.

Chapter 2 16 MAVT and ELECTRE
There are alternative schools of decision analysis methods. Some of the more
widely developed theories include Utility Theory (Keeney and Raiffa, 1976)
Outranking Methods (Roy, 1991) and the Analytical Hierarchy Process (Saaty,
1980). Within these schools of thought there are many alternative approaches
which correspond to different classes of problem, or different solution
requirements. It is difficult to see how any one of these theories might become a
‘gold standard’, as each has its own disadvantages. Indeed, one could question the
wisdom of trying to encourage the superiority of one method. In an environment
of such diversity of users and needs, the variety of tools can only be of benefit.
What is important, however, is for the DM to be comfortable with the model they
use. Only through this ‘feel-good’ factor will the DM be content with the solution,
or prepared to make further use of the techniques (Phillips, 1984). Perhaps
secondary to this is the requirement for the model to fit the problem.
In this chapter, two normative models are examined. Multi-Attribute Value
Theory (MAVT) is a method used for making decisions in an environment of
certainty (Watson and Buede, 1987). It has its basis in an aggregative model and
gives a ranking of all alternatives from worst to best. Preference intensities and
substitution rates are needed for each element of the problem. The second model
for consideration is ELECTRE II, one of a family of approaches based on
outranking (Roy and Bertier, 1973). These methods split the alternatives according
to an ‘A is at least as good as B’ hypothesis, and then explore this via evidence for
(concordance) and evidence against (discordance) using a decision algorithm. In
this case, preferences are required from the DM, along with a comparative weight
measure. The result of a number of the ELECTRE methods (II, III and IV) is a
partial order of the alternatives. However, this is not true of all of the methods.
ELECTRE II will be used for the purpose of this comparison as it is “undoubtedly
the best known and most widely used” of the models (Vincke, 1992). The reasons
for selecting MAVT and ELECTRE II for discussion relates to their history of
competition, and to their very different approaches to decision modelling.

Chapter 2 17 MAVT and ELECTRE
Comparing the two methods requires consideration of the foundations,
assumptions and properties of the two models. Further, it is interesting to consider
the implicit view of the DM’s requirements and ability. Not only do the models
enforce certain consistency properties for the DM’s preferences to follow, but the
models (and therefore, the developers) also have an implicit, yet undefined, view
of the DM. Value theory and outranking have arisen from different intuitive ideas
for solving multi-criteria problems and from different impressions of the DM.
Therefore, any attempt to evaluate or validate these methods should consider this
aspect.
The work in this chapter draws on two early pieces of work which I undertook.
The first (Simpson, 1993), suggests a hypothetical problem in order to
demonstrate how the normative approaches differ. Although the work clearly
cannot claim to be a perfect description of how each of these tools would really
work in practice, it does highlight that the two models could reach different
conclusions. Further, it shows how ELECTRE may discriminate against certain
alternatives due to the way the model has been built rather than because a DM’s
preferences dictate it. This work will not be repeated here. The second paper,
(Simpson, 1996), concentrates more on the demands each method makes upon the
DM. Some of those findings are repeated here as they are pertinent to a
prescriptive evaluation.
The MAVT and ELECTRE II models are each described below, along with a
consideration of the demands they make both on and about the DM. Next, the two
models are directly compared in order to examine their differences more closely.
Some suggestions are given about the role normative models should play in
prescriptive decision support. This highlights issues which are important to the
validation of and the evaluation of normative models for prescriptive support. The
role which requistite decision modelling (Phillips, 1984) can play in evaluation of
prescriptive support is discussed. These issues are considered from both the DM
and decision analyst viewpoints. Finally a summary of the chapter is presented
which includes conclusions.

Chapter 2 18 MAVT and ELECTRE
MULTI-ATTRIBUTE VALUE THEORY
Introduction
MAVT is a normative tool which models problems in an environment of certainty.
The model has been extended to include uncertainty producing a tool known as
Multi-Attribute Utility Theory (MAUT). MAVT is reminiscent of a scientific
approach to problem solving. An equation is devised to represent the value of each
alternative expressed as an interaction of the dimensions of the problem. The
analyst must determine the elemental values in order to solve the equation. The
result is a comparative, uni-dimensional measure for each of the competing
courses of action. MAVT is built from a few basic axioms as outlined by Keeney
and Raiffa (1976) and starts from the basis that, in the eyes of the DM, all things
are comparable. It is necessary to represent the preferences of a DM via a set of
notional scores for the performance of the alternative strategies on the
measurement criteria. Further, weights must be established to quantify the relative
importance of criteria, and to account for the difference in the magnitudes of the
scales for the criteria scores. It is a transparent technique whose intuitive approach
is appealing to a DM. The DM can see easily how, via the aggregative model,
their beliefs and preferences turn into a suggested ranking of the alternative
strategies.
Model
There are many good texts which outline both MAVT and MAUT from first
principles, building the models via the basic axioms (Ramsey, 1931, Von
Neumann and Morgenstern, 1947, Savage 1954, Keeney and Raiffa, 1976 and
French, 1986). Therefore, only an incomplete description is given here outlining
the main aspects for discussion. The underlying assumption of MAVT is that the
DM should always be able to establish a weak ordering of preferences when
presented with two pieces of data. This implies that the DM is able to consider
their preferences and decide, for example, whether ‘the score a1 is at least as good
as the score b1:

Chapter 2 19 MAVT and ELECTRE
a b1 1≥ (1)
Keeney and Raiffa (1976) outline the following condition for use of MAVT.
Consider a decision problem with a number of alternative strategies. Examine two
of these strategies, A and B. They are measured against two sets of criteria I and J,
where I contains at least two criteria and J contains at least one criterion. A and B
can be expressed as vectors of attribute levels, i.e. A = (ai, aj) and B = (bi, bj). In
defining the attributes on which to measure the strategies, one must ensure that
preference independence exists between them. This implies that for comparisons
in which some of the criteria are kept fixed, preference is determined solely by the
criteria in which the variation does take place. Further, preference does not depend
on the levels of the fixed criteria. Formally, I is preferentially independent of J if
for all ai, bi preferences on criteria I:
For some α α α β β βj i j i j i j i j jJ a b a b J∈ ≤ ⇒ ≤ ∀ ∈,( , ) ( , ) ( , ) ( , ), (2)
When assessments of marginal value are made on an attribute independently of
other attributes then more assumptions may be necessary. Dyer and Sarin (1979)
introduce a concept of difference independence. Using the variables of Equation
(2), I is difference independent of J if for all ai, bi preferences on criteria I, for
someα j J∈ :
( , ) ( , ) ( , )( , ) ~ ( , )( , ),a b a b a b Ji j i j i j i j i j i j jα α α α β β β≤ ⇒ ∀ ∈ (3)
If present, this leads to an existence of an overall additive value function. If these
consistency properties stand, together with some housekeeping conditions such as
transitivity (Keeney and Raiffa, 1976), the problem can be modelled with an
additive value function of the form:
V A V a a a w v a w v a w v ap p p p( ) ( , , . . . . . , ) ( ) ( ) . . . . . ( )= = + + +1 2 1 1 1 2 2 2 (4)

Chapter 2 20 MAVT and ELECTRE
where v1, v2 and vp are themselves constituent value functions. There are
restrictions on the form of the individual preference functions for each of the
criteria, i.e. they are unique up to some affine transformation; v av cp p' (.) (.)= + .
The MAVT method results in a value representing a preference measure for each
alternative. The resulting options can be ranked according to the figures calculated
by the MAVT model, but these figures should be treated with caution. Sensitivity
analysis demonstrates the circumstances in which the ranking of the alternatives
changes. Decision problems are dynamic and information is often unavailable
when it is wanted. There may be changes in initial data, or there may be a dispute
over the nature of specific preference functions. Such inaccuracies may be
investigated to see whether the solution is robust. The result of the MAVT
technique is not merely an ordering of the alternatives, but also an associated
range of values within which this ordering is consistent.
Discussion
The underlying assumption of MAVT is that the DM should always be able to
establish a weak ordering of preferences when presented with two pieces of data.
In practice this assumption goes further as the DM is required to place a numerical
value reflecting strength of preference on this comparison. Not only are relative
preferences required for each performance score, but also to establish criteria
weights. This task can seem like a struggle at first as the DM is being asked to
provide information in a way which is unfamiliar. In my experience, this steep
learning curve can be quickly overcome and the DM can often provide the
remaining preference information easily. This may be an indication that these data
are not too far removed from the way the DM stores the information internally.
The MAVT approach has been devised with an implicit disaggregate view of a
DM in mind. That is, a DM is assumed to be able to examine their own feelings
and to be able to communicate their preferences over outcomes (French, 1986).
The DM is assumed to be able to retain specific information about personal
preferences and beliefs in a format similar to the inputs required by the decision

Chapter 2 21 MAVT and ELECTRE
model. The role of the mathematical model is to help the DM organise their
judgements so that rational choice behaviour can be developed. These specific
building blocks are elicited from the DM directly and used to construct
preferences over strategies.
ELECTRE II
Introduction
Bernard Roy developed the concept of outranking in response to his criticisms of
other decision aids available (Roy, 1991). A large and dispersed research group,
known as the European School (née French School, see discussions Roy and
Vanderpooten, 1997 and Zionts, 1997), has grown up around these methods,
developing ELECTRE, Promethee and others. An outranking relation is a binary
relation which compares the arguments for and against a hypothesis, Alternative A
is at least as good as Alternative B, given what is known about the DM’s
preferences. The ELECTRE approach starts from the intuitively attractive premise
that a DM can only make approximate comparisons of the performances of the
alternatives. The method allows performances which are not numerically equal to
be considered equal. Outranking does not have an axiomatic basis, but rather is
based on parameters and a decision algorithm.
It is important to note that there is some uncertainty surrounding the outranking
methods, in particular the family of ELECTRE models. This has arisen, in some
cases, from the natural development of the models and additions to functionality.
However, in other cases, this arises from inconsistency in the literature. The
following definition of ELECTRE II is taken from Vincke (1992): where
discussion arises from other sources, it is noted appropriately.
It is still necessary for the DM to provide the analyst with preference information
for each of the criteria. However, this is subtly different to that provided in an
MAVT approach. The preference system is ‘designed’ via the approach (Roy and
Bouyssou, 1986). Further, weights are required by the analysis, but it is unclear

Chapter 2 22 MAVT and ELECTRE
what these weights physically represent. Thresholds are used to form sets of
evidence of concordance and discordance. The evidence for the superiority of each
alternative is then compared via the outranking relation and a partial order
devised. There is no reason for an outranking relation to be transitive or complete.
Model
The aim of the ELECTRE II model is to rank the alternatives from best to worst.
The DM is expected to hold some preference function over the performances of
each of the alternatives on all of the criteria. This function is referred to in the
literature as g. It is constructed in such a way that it verifies concepts of
preference, P, indifference, I and incomparability, J. Therefore, g must fulfill
certain conditions relating to transitivity and symmetry (Vincke, 1992). Preference
and indifference are defined to hold for sets of ordered pairs (a,b) and can be
expressed as follows:
aPb ⇔ g(a) > g(b) (5)
aIb ⇔ g(a) = g(b) (6)
From these two sets, we can define a third: the set of ‘a at least as good as b’. This
set of preferences is denoted by S.
aSb ⇔ g(a) ≥ g(b) (7)
In addition to making pairwise comparisons of the performance scores, the DM
needs to assign a weight to each criterion. Unlike the weights associated with
MAVT, which represent the relative importance of the criteria, the weights used
by ELECTRE II do not represent tradeoffs, they are non-compensatory. Roy
(1991) describes the weights for the ELECTRE III model as ordinal only,
measuring whether a criterion is of greater, equal or lesser importance than
another criterion. In all ELECTRE models, the weights are complex to derive,

Chapter 2 23 MAVT and ELECTRE
being a comparison involving one criterion with another criterion, and a group of
criteria with a criterion. Vincke (1992) alludes to the imprecision involved:
‘it is clearly utopian to hope for any precision: it is preferable to
consider several series of weights’ [page 113]
These weights are incorporated into the analysis via the expression for
concordance (c). In general, the concordance coefficient is a measure of the
strength of the arguments that validate the concept A is at least as good as B,
taking all criteria into account.
c A Bw
w
jS
j
( , ) =∑∑
(8)
A further measure is defined, that of discordance (d). If concordance measures the
strength of support for the hypothesis A is at least as good as B, then the
discordance coefficient measures the strength of evidence against this. Two
expressions have been defined, one on the basis of quantitative performances, and
the other on the basis of qualitative performances:
d A B
if g a g b j
g b g a
g k g lotherwise
j j
j j j j
jKL j j
( , )
( ) ( ),
max ( ) ( )
max ( ) ( ),
=≥ ∀
−−
0 (9)
where jKL represents the maximum difference on criterion j between any two
alternatives from the set of possible alternatives, in this case, alternative K and
alternative L. For the qualitative expression, see Vincke (1992).
Pairwise comparisons of each of the alternatives over all the criteria are made
using the specific concordance and discordance equations. Two matrices of
coefficients are obtained. To operationalise these matrices, threshold values for
concordance and discordance must be set, c* and d*. Two thresholds of
concordance and discordance are defined. These correspond to a strong outranking
relation and a weak outranking relation. From the matrices, an outranking relation

Chapter 2 24 MAVT and ELECTRE
can be built using a stated decision algorithm (see Vincke, 1992). c* and d* are
specific to that outranking relation and can be varied to give more or less severe
outranking relations (Roy, 1991).
Discussion
Unlike MAVT, a DM is not assumed to be able to state a cardinal preference
between any two pieces of information presented to them. The DM is expected to
be able to state a direction of preference, and also to give non-compensatory
weights. In my limited experience of applications of ELECTRE II, I have found
that the DM is essentially asked to develop a preference function over each
criterion in turn, as part of finding the preference direction. If this is always the
case, then it is apparent that the DM is implicitly being treated with the same
strong assumptions as MAVT. Worse than this, the DM is providing important
information which is not used in the analysis.
Roy and Bouyssou (1986) wrote of outranking that it had been constructed with
the aim of illuminating possible strategies through the use of intuitive ideas and
‘intentional actions’. Based on this assumption, an analyst examines external
choice behaviour in order to infer internal preference. They claim that, given
scores for the alternative actions, a ‘common-sense’ approach can be taken
towards acceptance or rejection of an outranking relation. Therefore, it would
seem appropriate to infer that outranking has been based on a view of the DM as a
rational economic man. The DM is not assumed to be able to provide the analyst
with the data required for the model explicitly, and so the analyst must elicit this
by asking related choice questions. Further, it appears that the DM provides some
data, whilst the analyst provides other preference information on behalf of the
DM. The ‘common-sense’ decision algorithm is given by the ‘common-sense’ of
the analyst rather than of the DM.

Chapter 2 25 MAVT and ELECTRE
A COMPARISON OF MAVT AND ELECTRE II
This comparison of the two normative models is approached with a prescriptive
decision analysis in mind. A different comparison approach has been considered
in Simpson (1993) and Simpson (1996). There, a discussion of the underlying
assumptions is presented. Possible problems with the ELECTRE II model in terms
of discrimination of certain performance distributions is discussed. Also, there is a
concern about the possibility of ELECTRE II being prone to rank reversal.
Further, there is a consideration of the demands on and assumptions about the
DM. The comparison in this thesis will concentrate upon the loose criteria
suggested in Chapter 1. The suggested criteria for the DM are loosely:
• can I understand the model
• do I feel it represents a sensible decision process
• can I use the model
• does it solve my problem.
Those for the analyst might include:
• can I justify what I am doing to the DM
• can I establish the correct data for the model
• can I explain the result of the analysis
• can I satisfy the DM.
An immediate observation is that, in MAVT, all data for the model are provided
by the DM, whereas in ELECTRE II, the analyst is responsible for helping to build
the model. Limiting indices for concordance and discordance are set by the
analyst. c* and d* are abstract concepts and their appropriateness will depend upon
the complex formulae by which the concordance and discordance indices are
calculated. The important issue here is why these data are provided for the DM. If

Chapter 2 26 MAVT and ELECTRE
it is because the DM cannot appreciate the concordance and discordance equations
enough to provide limits, then this questions the validity of the ELECTRE II
approach both in the eyes of the DM and the decision analyst. If the analyst
provides the data to save demands on the DM, then this implies that the
ELECTRE II model may already be too demanding. If the data could be provided
by the DM, then they should be, as ownership of the problem and its solution is of
the utmost importance.
The ELECTRE II approach requires preferences in the form of a function g and
criteria weights from the DM in order to perform its analysis. MAVT requires
preference values for each level of performance on the attributes in addition to
more complex criteria weights. On the surface, MAVT appears more demanding
of the DM in terms of input data. However, as suggested above, in order to
establish the function g, it is likely that the DM will spend sometime considering
their preferences for the performances on a criterion. So, in essence, the DM is
doing more work with an ELECTRE II model than with an MAVT model. As for
criteria weights, the two models use quite different concepts. The weight used for
MAVT is more complex, representing a tradeoff value. The ELECTRE II weight
claims to be non compensatory, yet remains complex to derive. So, it seems unfair
to propose that the ELECTRE model takes less effort to build than a value theory
model.
An issue which is not addressed in the literature is how outranking proposes to
deal with a choice between a number of alternatives which are incomparable.
Large problems may give the results in a number of disjoint relationships, which
inter-relate, but not intra-relate. This may imply that there are a number of
different scales. Ultimately, there needs to be some way of comparing the
alternatives which are suggested by the partial ranking so that an informed
decision can be made. MAVT rightly or wrongly puts all the possible alternatives
onto the same scale. Therefore, comparisons may be made globally. It would be of
value to investigate what is special about the problem which causes the DM to
find things incomparable. European school academics, however, have not chosen

Chapter 2 27 MAVT and ELECTRE
to address this issue as incomparability is a feature of the model, rather than a
flaw.
MAVT is a transparent method. Transparency promotes appreciation. MAVT does
make strong assumptions about the nature of the preference data. These data must
follow assumptions based on consistency and rationality. Transitivity must hold,
mutual preference independence must hold, and difference independence must
hold amongst other things. However, these conditions are there only to guide a
DM to a more consistent view. It is apparent what happens to these preference
data, and how the final values are established. ELECTRE takes ‘raw’ scores and
tries to mimic how the DM will evaluate the hypothesis ‘at least as good as’
through the concordance and discordance coefficients. The literature does not
justify the formulation of the measures for concordance and discordance
coefficients. ELECTRE compares the measures of evidence of the hypothesis with
the ‘cut-off’ points c* and d*, which have been set by the analyst, via the decision
algorithm. The concordance and discordance coefficients represent complex
mathematical functions of the preference function g and the criteria weights and
there are no obvious values at which these functions become acceptable or
unacceptable. Moreover, these functions are difficult for the DM to conceptualise
- making it hard for an analyst to justify the results of the algorithm.
Therefore, with respect to the validation criteria suggested in Chapter 1, the
following table could be suggested.

Chapter 2 28 MAVT and ELECTRE
Criteria MAVT ELECTRE
Decision Maker
Can I understand the model? Transparent, thoughweights and valuefunctions needexplanation.
Initially intuitive, butequations for c and d arevery complex and notjustified.
Is it sensible? Direction and size ofdifferences dictate theoutcome.
Direction of differencesand ‘imprecise’ weightsdictate the outcome.
Can I use it? With support to elicit thedata, yes.
With support to elicit thedata and provision oflimits by an analyst, yes.
Does it solve the problem? Designed to fully solve theproblem.
May not always find asolution.
Decision Analyst
Can I justify the model? Yes, otherwise it is alteredwith respect to itsshortcomings.
Not necessarily, the limitsare pre-defined.
Can I get the data? Usually. Yes, the analyst can definewhat the DM does notprovide.
Can I explain the results? Yes Yes, although mayproduce rank reversalswhich cannot be justified.
Is it satisfactory? Too contentious and subjective to answer
Table Chapter 2 .2: Performance on Criteria
I have been fortunate to observe a decision modelling session which was based on
an MAVT approach, performed by Professor Simon French. Further, I have
participated as one of a group of DMs in a hypothetical session using an
ELECTRE approach, performed by Dr. Jacques Pictet. Both sessions have been
invaluable in extending my appreciation of these tools. ELECTRE and MAVT
were similar in their modelling phase, the desire to develop a problem structure
was identical. Further, this problem structure consisted of the same elements. Only
once criteria and preferences had been established did the models proceed
differently. In the case of MAVT, the strong preference assumptions outlined

Chapter 2 29 MAVT and ELECTRE
above were not rigorously enforced. Quick checks of data integrity were
performed, such as transitivity. But, in general, much more emphasis was placed
on generating data with which the DM was happy. In order to identify data sets for
the ELECTRE model, the group essentially classified value functions for each of
the criteria. Again, there was no attempt to investigate the consistency of the
preference data. However, on this occasion this was due to ELECTRE not
requiring the data to fit any particular consistency properties. So, it is interesting to
note that applications of the two models have very similar beginnings in spite of
their emphasised differences.
As the modelling progressed, the differences between the two approaches became
apparent. In the case of ELECTRE, I was surprised to find that a concept, with
which initially I had been quite happy, proved to be very demanding and found
that I was unable to give a satisfactory response. Later, during feedback on the
modelling session, I discovered that this occurs often and is overcome by an
analyst providing the data rather than the DMs concerned. Thus, an ELECTRE
approach might use the analyst to provide more data than initially thought.
Further, the concept of the criteria weights for ELECTRE was elusive. We were
instructed to give the weights an ordering, and then asked to assign numerical
values to this order. What these values were to represent was not clear.
During the feedback session on ELECTRE, Jacques explained that his modelling
work often takes place over a number of weeks with occasional meetings to gather
information from the DMs and to demonstrate alternative models which he has
developed. Therefore, he was not used to using the approach in a ‘live’ setting - or
with such a demanding and knowledgeable group. This is a further distinction
between the methods. MAVT is often used in intensive problem solving sessions
with the decision problem owners. The pioneers of ELECTRE seem to have a very
different view of how to use their approach. A final similarity between the two
tools was the ability to input modifications of earlier data. This is important to any
decision analysis technique in view of the need for requisite decision modelling
(Phillips, 1984).

Chapter 2 30 MAVT and ELECTRE
I have claimed that the use of outranking has been based upon a particular
description of the DM, i.e. rational economic man, and that MAVT has a
disaggregate DM in mind. It is reasonable to assert that the rational economic
view of the DM is based on fewer assumptions than a disaggregate approach.
Rational economic man is defined as having a weak preference ordering over the
aspects of the problem. The preference ordering is used to deduce beliefs about the
likelihood of events and to deduce preferences over a range of possible outcomes.
These deductions are made by offering the DM choices and examining their
external behaviour. The disaggregate approach makes greater claims about the
desired coherence of the DM’s internal representation of the problem. Outranking
does not assume that the DM is able to provide the building blocks explicitly to
solve the problem.
Bernard Roy developed the ELECTRE methods based on criticisms of both
MAVT and MAUT. These complaints arose from a belief that a decision analytic
tool should not force all the alternatives to be comparable. The ELECTRE method
is described as a technique which makes fewer assumptions about the DM, takes
less effort to build, demands less of the data, uses weaker poorer models, and does
not always reach a conclusion (Roy, 1977). In the light of the above discussion, it
is unclear whether ELECTRE II achieves these aims, or indeed whether it would
be a sensible tool if it did.
THE ROLE OF NORMATIVE MODELS IN PRESCRIPTIVE DECISION
SUPPORT
The main aim of a prescriptive analysis is to give a DM, or a group of DMs,
decision support viz
• to enable them to break down their problem into manageable chunks
• to encourage them to remain rational and consistent during their attempts at
evaluation of strategies

Chapter 2 31 MAVT and ELECTRE
• and to remain mindful of any possible biases as identified by descriptive
theory (Bell et al., 1988, Kleindorfer et al., 1993).
A prescriptive approach may make use of a mathematical model to investigate a
decision problem. One might think that ELECTRE II with its ‘easy’ model and
indistinct mathematics is a more sensible model for a prescriptive approach. The
model was designed to be more ‘human’, and as such would appear to be designed
with the prescriptive approach in mind. But does it achieve this? The notion of
prescriptive should mean easier for humans rather than more human. I would
suggest, that based on the loose criteria stated above, ELECTRE II does not
perform as well as MAVT in the role of a prescriptive decision support tool.
The ethic of ELECTRE to not force things to be comparable seems in
contradiction with decision analysis itself, where the aim is to consider objectives
and values in order to make the most beneficial changes. ELECTRE could offer
much value as a decision analysis tool through investigation of the issue of
incomparability. However, the European school seems to shy away from both of
these issues and it is difficult to see what function the methodology does have.
ELECTRE II assumes the DM has a weak preference ordering over the alternative
strategies. Unfortunately, the solution of an ELECTRE II approach also seems to
be a weak ordering of the alternative strategies.
Much of the development work of normative decision analysis is based around
making the models appropriate for different classes of problem. However, value
might be added more sensibly by assessing the DM’s requirements. Some criteria
have been suggested above, but quite clearly there are many more possible
measures. Would a DM prefer a solution to provide an optimum or a partial
ordering? Would a DM have a preference between a transparent or black box
approach? Does the DM feel happy that the analyst is providing certain data, that
they are being helped, that they do not have to do all the hard work themselves, or
struggle to find the data for the model - or do they feel usurped, like they have lost
some control? Do they feel relaxed in the hands of the analyst, or sceptical about
the interference? This should be an area for discussion in order that agreement can

Chapter 2 32 MAVT and ELECTRE
be reached. A recognised and accepted validation technique for normative models
would lead to better work provided by decision analysts for DMs.
Phillips (1984) introduces the concept of requisite decision modelling in order to
validate a prescriptive analysis. This approach involves iterations of normative
analyses and discussion with the DM. The problem is respecified and thinking
updated at each iteration. A number of iterations may take place before an
acceptable solution is found. This need for iteration may be an indication of a
number of issues. Firstly, it could be that initially the DM cannot clearly express
the views needed in order to model the problem. The iteration may imply that the
analyst has not been able to include all the important issues in earlier runs.
However, it is more likely that the iteration occurs because preferences are
evolving. A DM may need to work with the problem to help structure thoughts
and preferences. It should be noted here that Phillips’ approach is not universally
accepted. Henig and Buchanan (1996) argue that asking the DM to comment on
the appropriateness of the model is open to bias. It is likely that the DM will too
readily accept earlier models in their desire for an ‘easy life’.
DISCUSSION
MAVT and ELECTRE II are part of the much larger prescriptive decision support
process. Both methods can be used to structure and analyse problems and are
established tools for such. DMs will prefer decision analytic tools which
encompass their beliefs and preferences and encode appropriate consistency
properties for those beliefs and preferences to exhibit. Each decision aiding
technique is built up from a specific set of rules. Therefore, for the method to be
appropriate, the formulation should satisfy certain conditions. Since both MAVT
and ELECTRE can take many forms which vary in complexity, it is necessary to
ensure that these formulations still adequately represent the views of the DM.
MAVT and ELECTRE II are similar in terms of the types of inputs they require.
Substantial work must be done in formulating the problem and evaluating
performances and criteria for both methods. The methods for eliciting these values

Chapter 2 33 MAVT and ELECTRE
have been different due to different views of the DM held by the analysts, but one
is not necessarily more difficult than the other. In terms of the quantity of
information, ELECTRE is slightly more demanding than it claims to be. In terms
of output, similar information may be available from both methods, though it is
unlikely that ELECTRE II will produce a complete order. However, in an
application of prescriptive analysis, all possible alternatives ultimately will be
compared as it is likely that a decision must be made. It is difficult to perceive any
benefits in a method which will not enable a DM to do this.
Comparison of these two normative methods has been coloured by the
fundamental divisions in the way the data have been obtained. MAVT
practitioners have attempted to elicit ‘real’ data from a pre-existing internal set of
preferences owned by the DM. ELECTRE practitioners, on the other hand, have
interpreted the DM’s external choice behaviour and constructed preferences via
the method itself. In the absence of an understanding of the actual cognitive
processes which underlie the human decision making process, it is impossible to
state which is the more appropriate judgement of what a DM knows about their
preferences. This will not however stop personal opinions: French (1994)
expresses a strong preference for the disaggregate view of the DM and the
problem solving methodology this embodies:
I need methods that help sort out a person’s thinking, nottheir external behaviour . . . . Analysts need to work withtheir clients’ beliefs and preferences, not their choices. [page 5]
There is no overriding rationale for the replacement of MAVT techniques by
ELECTRE approaches in the context of a prescriptive analysis. The aim of
prescriptive analysis is to address the needs of a DM, and ELECTRE’s sole reason
for existence is to be more in line with a DM’s approach to problem solving. But
ELECTRE may have gone too far down the descriptive path. ELECTRE
approaches remain an alternative technique which can be used alongside MAVT
to reflect uncertainty about the most appropriate way to analyse complex decision
problems. There are obvious differences between the two methods, but it is not

Chapter 2 34 MAVT and ELECTRE
obvious whether one method is stronger than the other. From a prescriptive
perspective, there may be more benefit in encouraging applications of decision
theory than in time spent extending mathematical theories. Academics should be
encouraged to see that this is an equally valid extension and improvement of their
models.
The best way to compare these tools is to apply them to a decision problem as was
done by Roy and Bouyssou (1986) and Simpson (1993). However, neither of these
studies was able to use a ‘real’ application of both techniques. Therefore, proper
investigation must begin with a positive move towards promoting the use of these
tools. Two further opportunities to run such a comparison over the course of the
thesis were hampered. The original work with Jacques Pictet was to be a larger
event comparing MAVT and ELECTRE, but time and diary constraints would not
allow it. A second session specifically designed with this comparison in mind was
proposed for a conference workshop. Unfortunately, none of the representatives of
the European School who were approached would agree to take part. With the
constant development of these methods, restrictions which once existed are soon
becoming extinct. It is difficult to assess whether either method has any particular
advantages. Debates about the two approaches should recognise the entwined
issue of the assumptions made by the analysts about the vision of the DM,
particularly whether they know their preferences, and the nature of the model,
axiomatic or algorithmic. There appears to have been a difference in the ethos of
the European School and the multi-attribute value theorists with respect to the best
way to model decision problems. MAVT applications have involved intensive
sessions which gather together the problem owners, whereas the Europeans have
been more likely to take a discrete modelling approach.
One possible way forward to extend normative models would be to examine the
demands they make on the DM. Again, this could only be achieved through a
number of application based experiments. However, it is ‘easier’ to become
preoccupied with the underlying logic and truth of the models, and their
appropriateness with respect to specific problem types. The strength of decision

Chapter 2 35 MAVT and ELECTRE
analysis lies in its ability to solve people’s problems, and so should be seen as an
equally legitimate area for research as the mathematics of normative theory.
Validating and evaluating these models is complicated by the fact that the criteria
used by the decision theorists (i.e. the rigour of mathematics) is completely
different to the criteria which a DM would use. Much like the two sides to the
coin of normative and descriptive decision theories, an approach could be sought
which will marry these views.
Normative models are used to model decision problems. A variety of alternatives
are available and perhaps a sensible way to choose between them lies in the
analyst’s ability to justify the selected approach to DMs. DMs may want to
experience a variety of models to find one which best suits their needs. From the
work described above, it is apparent that most of these models use preference
judgements as their basis. Therefore, in moving on from this work, it would be
sensible to consider the elicitation of preference data. Obviously, the data required
by each model are subtly different. Therefore, a particular normative model must
be selected in order to examine elicitation. In addition to this, preferences cannot
be expressed without a context in which to express them. Consequently, a suitable
scenario needs to be identified. The next chapter will consider the nature of
preferences and examine their elicitation in relation to a specific decision problem.

Chapter 3 36 Elicitation
Chapter 3 - Application of Elicitation Techniques
INTRODUCTION
In the previous chapter, I examined competing normative approaches in terms of
their ability to model a decision problem. Also, I raised the issue of usability in the
sense of a prescriptive analysis. This chapter considers usability more rigorously,
by specifically considering the elicitation and use of preference judgements.
Irrespective of which normative tool is employed, preference information must be
‘extracted’ from the DM to perform an analysis. So, a key criterion for usability
must be whether a DM is able to provide the data. Further, there needs to be some
method of establishing the validity of the data. In this chapter, these two issues are
examined.
To evaluate and validate the elicitation mechanism and the preference data it
provides, a specific problem was addressed: treatment of heroin misusers. The
problem was introduced to me by a colleague who is a health economist. The
scenario is a typical multi-criteria decision making problem. The work which
follows is taken from Simpson and Sutton (1997a). It is one of a set of three
papers written jointly and concentrates on the use of a decision analytic tool. The
other two pieces are an editorial highlighting the need for composite outcome
measures (Simpson and Sutton, 1997b) and a paper on the inherent biases of
standard economic approaches for policy evaluation (Sutton and Simpson, 1997).
I have chosen to model this problem with both MAVT and MAUT. These theories
are very powerful tools, and ones with which I am comfortable. However, the

Chapter 3 37 Elicitation
main reason for use of MAVT and MAUT is to continue to examine the claims
that they make complex demands on the DM with respect to stating preference
data. This study has allowed me to work first hand with DMs who are trying to
provide preferences. A brief outline of the problem is given below, along with a
justification for the appropriateness of value and utility theory.
The implications of illicit drug use are many and varied and evaluating the
benefits of alternative drug policies is a complex task. Policy choices between
interventions designed to reduce the problems associated with drug misuse are
typical multi-dimensional problems, with drug misuse impacting on the health of
the user and their family, in addition to the wealth and well-being of society.
However, none of the existing techniques for outcome measurement explicitly
address the problem of comparison and aggregation across different dimensions. If
an experimental programme shows an improvement on one dimension when
compared to existing practice, but deterioration on another dimension, it is
currently only possible to draw overall conclusions based on personal judgement.
Hartnoll et al. (1980), for example, conducted an experiment involving 96
confirmed heroin addicts. The addicts were randomly allocated to treatment with
either injectable heroin or oral methadone. The progress of the addicts was then
monitored for twelve months against a number of criteria. Concluding their work,
Hartnoll et al. state that the controlled trial:
" results do not indicate a clear overall superiority ofeither approach. Both treatments have advantages in someareas, but at the expense of disadvantages in other areas.The approach favoured depends on the priorities assignedto the various outcomes” [page 882].
Therefore, we have identified a problem which will fit neatly into a multi-attribute
decision making model. We have two alternatives which have been measured on
four attributes. Currently, it has not been ‘solved’ as no attribute weights exist.
Assigning priorities, that is, attribute weights, is therefore a way forward from this
work. Involvement of the general public’s preferences in the development of a

Chapter 3 38 Elicitation
composite, uni-dimensional measure of outcome would seem to make this process
more transparent and accountable (Lomas, 1997).
The application of decision theory is one approach which can contribute to the
development of a uni-dimensional outcome measure. The advantage of a value or
utility theoretic approach is in its ability to put all dimensions onto the same scale
explicitly via attribute weights. These weights are elicited from DMs in
accordance with their preferences for each dimension based on well established
axioms of decision making. We believe that such an approach would be able to
take the analysis of Hartnoll et al. (1980) to its eventual conclusion.
In this chapter, a small preference elicitation experiment is presented. The data
from two different elicitation techniques are analysed in order to establish the
most appropriate set to use. This set is then applied to a published study. The
simulated results of a decision analytic approach to the study are presented, along
with an interpretation of why the data lead to the conclusion. The value of a uni-
dimensional solution to the study is highlighted, confirming the important role
which decision analysis should play in social policy and other complex choice
problems. The feasibility of collecting preference data is discussed, and the
validity of the data explored through the results.
PREFERENCE ELICITATION
Preference values are the fundamental tool of any normative decision model.
However, not all models assume that they are well formed. Indeed, there is
discussion in the literature which addresses the issue of whether preferences exist
at all (Goodwin and Wright, 1997). March (1971) discusses the “excavation of
pre-existing values” whilst Keeney (1992) suggests that values are to be
“discovered”. It is clear that many DMs can state a preference on a particular issue
which they will claim to be a permanent part of their personality, and something
which will not change. For example, I prefer a pint of Timothy Taylor’s Landlord
to a pint of John Smith’s Best Bitter. Such preferences tend to exist around areas
where a DM has a passionate or intimate feeling. It is likely that, if faced with a

Chapter 3 39 Elicitation
decision concerning a field where preferences are clear, a DM could quite happily
reach a decision without any form of support. But often, the values required by a
decision analysis are concerned with a business environment. Such preferences
cannot involve the DM as intimately and therefore are likely to be less well
formed. Alternatively, the DM may be intimately involved, but still not have clear
preferences. For example, consider a DM faced with an unfamiliar and serious
health problem in which no treatment options seem preferable. In these situations,
it is likely that hard and fast preferences will not exist. Further, preferences may
change over time.
In addition to questioning the existence of preferences, these values are relational.
Consequently, a DM’s strength of preference for a particular outcome may be
dependent upon other possible outcomes. What is likely, is that preferences are
dynamic. Preference values will evolve as a DM gains information about the
problem and has time to form a more considered view. This confirms the need to
feedback to the DMs how their statements of preference influence the problem
formulation and the results it provides.
There are many techniques for preference elicitation. For this study, I required
preference data that could include an attitude to risk. However, discounting of
preferences over time was not necessary. Therefore, the two tools which were
appropriate to this study were the visual analogue scale (VAS) and the standard
gamble (SG). A VAS gives a cardinal preference ordering of alternatives choices.
The subject is presented with a thermometer-type scale on which the two end
points represent the best possible and the worst possible event. The subject places
each choice alternative on the scale at a point which represents their strength of
preference. As such, the preference for each alternative, relative to the end points
and all other choices, is established. The data can be read directly from the
measurement tool. The preference data generated by the VAS are elicited without
presenting the subject with any uncertainty about the outcomes and therefore VAS
elicits data for use in value functions.

Chapter 3 40 Elicitation
An SG (Dupré, 1995) gives a cardinal preference ordering of choice alternatives
which does take account of the subject’s attitude to risk. Each subject is asked to
consider a choice between a certain outcome or taking part in a risky gamble
between the best outcome and the worst outcome. The certain outcome, by
definition must lie between the best and the worst outcome, and therefore, the
subject’s preference for the certain outcome must lie between their preference for
the best and worst outcome. The likelihood with which the best outcome will
occur is altered until the DM is indifferent between taking the certain outcome and
taking part in the gamble. At this point, the DM’s preferences are such that the
choices are equivalent and the following equation can be set up:
u certain option p u best option p u worst option( _ ) ( _ ) ( ) ( _ )= × + − ×1 (1)
where p is the reported indifference probability. As utility is a theoretical concept,
its end points can be arbitrarily defined. Thus, it has become common practice to
set the utility of the best outcome equal to one and the utility from the worst
outcome equal to zero. Equation (1) becomes:
u certain option p( _ ) = (2)
The multi-dimensional preference data elicited using VAS or SG can be used to
find expressions for the attribute weights and single dimension value or utility
functions respectively. These weights and functions can then be used in the
MAVT or MAUT equation as appropriate in order to give an insight into the
preferences of the subject.
Health economists' attempts to derive composite measures of health outcome
through the use of MAUT techniques have spawned an enormous literature
demonstrating the complexity of the task (Froberg and Kane, 1989). It should be
noted here that the complexity described is not purely associated with the use of
utility theory. Rather, it stems from the enormity of the task. The aim of health
economists is to construct an index of values for different health states based on
the various attributes which may contribute to overall health or well-being. This

Chapter 3 41 Elicitation
process was initially intended to facilitate comparison of programmes in a cost-
utility framework on the basis of cost per Quality-Adjusted Life-Year (Williams,
1985). An optimistic conclusion from this work is that, although individual
responses show a large degree of 'white noise', aggregate measures from large
samples offer intuitive results and exhibit reasonable construct validity (Dolan and
Sutton, 1995).
ELICITATION EXERCISE
Method
Whilst incorporation of societal values is desirable for accountable policy-making,
choices or preferences based on prejudiced or limited knowledge are of dubious
worth to a policy-making process concerned with maximising social welfare.
Therefore, in this study, the attempt was made to elicit values for beneficial effects
of drug misuse interventions independently of how, or from whom, they were
received. Therefore, only dimensions which did not allude to a connection with
illicit drug use were selected. This seems compatible with the aim of assessing
outcomes in terms of end-products.
Studies which have been concerned with consequences of substance misuse
include outcomes which may be grouped broadly under the headings of health,
crime and role functioning (Des Jarlais et al., 1981, Parker et al., 1988, Ball and
Ross, 1991, Deschenes et al. 1991, Darke et al., 1992, Newcombe, 1992, Farrell et
al., 1994, Rydell and Everingham, 1994). In addition, in many studies, social
functioning is also mentioned but difficult to quantify. Particular indicators within
these four dimensions were selected for use in this study. These are listed in Table
Chapter 3 .1, along with the fuller description of each dimension which was
presented to the respondents.
A preference elicitation exercise was performed by a convenience sample of 46
undergraduate and postgraduate students at Leeds University who were registered
on a module in decision analysis. This was performed over the course of an hour

Chapter 3 42 Elicitation
with a facilitator available for support/queries. To aid the subjects, the
questionnaire was organised in a staggered format similar to that used in the
Euroqol study (Euroqol Group, 1990) for eliciting preferences for different
dimensions of health. A full copy of the questionnaire and accompanying
documentation can be found in Appendix 1.
Dimension Description
PrematureDeaths
Aged 15-29 years. Consider pain, grief and suffering offriends and relatives, and general cost to society in terms oflost production and consumption
HomelessIndividualsSocialFunctioning
Including ‘sleeping on the streets’ and hostel accommodation.Consider impact on individuals themselves, their friends andfamily and society as a whole.
UnemploymentRoleFunctioning
Aged 16-24 and fit for work. Consider effects on individualsand families, along with social security costs and lostproductivity to society.
HouseBurglaries
Consider impact on victims and fear of crime in society as awhole.
Table Chapter 3 .1: Description of the Four Dimensions
The respondents were asked to consider the values they placed on various
attributes of the society in which they lived. This was achieved through
comparison of societal states, each measured on four dimensions. To make the
problem more meaningful to respondents, the scenario was based on the city of
Leeds. Intermediate levels on each dimension were estimated from published
statistics (OPCS, 1991, Mayhew et al., 1992, OPCS, 1992, CIPFA, 1994, Home
Office, 1994). The percentage of these statistics that were drug-related were
estimated based on the York Regional Health Authority database and various
other information sources (Dorn et al., 1994, Robertson et al., 1994), but naturally
only ‘ball-park’ figures are possible given the paucity of data (Sutton and
Maynard, 1994). These figures give approximate upper and lower boundaries for
the relevant levels on each dimension. ‘High’ and ‘low’ levels for each dimension
were selected within these parameters such that there were asymmetric changes

Chapter 3 43 Elicitation
from the intermediate levels. This permits testing for linear preferences. The
figures are shown in Table Chapter 3 .2.
Different combinations of the three possible levels on each of the four dimensions
were created using the Orthogonal procedure in SPSS. This procedure produces a
subset of alternatives which ‘bounds’ the decision space. It returns the minimum
subset of combinations of different levels on the dimensions. Further, it ensures
that correlation between the dimensions is minimised. As a result nine ‘societal
states’ were created for consideration by respondents. This procedure is
particularly useful as multi-variate statistical analysis is used to identify the
independent effects of changes in each dimension.
Dimension Levels
Low Intermediate High
Premature Deaths 75 100 140
Homeless Individuals(Social Functioning)
250 320 470
Unemployment(Role Functioning)
9,800 10,200 11,000
House Burglaries 40,000 44,000 49,000
Table Chapter 3 .2: The Three Levels on the Four Dimensions
A description of the nine states was supplied on a separate sheet so that it could be
constantly in view. Initially, the students were asked to rank the nine multi-
dimensional societal states according to their preferences for the type of society
they would like to live in. This was a purely ordinal exercise, and there was a
definitive ‘best state’ which respondents were told to identify and place at the top
of the ranking.
Following this step, subjects were asked to take their ordinal ranking and place it
on a VAS to give a cardinal preference ordering. The subjects were instructed to
position their nine states such that the distances between states represented their
strengths of preference. The approach returns value functions for the nine states.

Chapter 3 44 Elicitation
Furthermore, since respondents were asked to consider their relative preferences
for states involving performances on all four criteria, this approach implicitly
takes a rational economic man view of the DM.
In a second stage, the respondents were requested to give preference data for
multi-dimensional states via seven SGs. As in the VAS exercise, the respondents
were eased into this. Once they had familiarised themselves with the approach,
they attempted the seven multi-dimensional SGs. The SG technique elicits utility
functions. As in the VAS exercise, subjects were asked to give overall preferences
for complex states and therefore a ‘rational economic man’ (Simpson, 1996)
perspective was assumed.
Analysis
Multi-variate regression analysis was employed to estimate the single dimensional
utility and value functions provided by the SG and VAS data respectively. The
subjects had provided information at the multi-dimensional level, incorporating all
four attribute weights and single dimension preference functions. Equations for
the MAUT/MAVT scores were estimated using multi-variate regression analysis
of the scores given by each of the 46 respondents to the nine scenarios. Separate
equations were generated based on the SG and VAS scores.
Preference functions may be non-linear, indicating that assigning a value to each
unit increase in outcome, regardless of the starting point, may be an
oversimplification of the problem. To allow investigation of non-linear
preferences, it was necessary to distinguish between different levels on each
dimension using categorical variables. Representing the multi-attribute
value/utility given by individual i to state j by a score parameter Π ij, the following
regression equations were set up:
(1 - ij ) = 1+ 2 LC + 3 LH + 4 LR + 5 LS + 6 WC + 7 WH + 8 WR + 9 WS + ijΠ β β β β β β β β β ε (3)

Chapter 3 45 Elicitation
In these regression equations, the β-parameters were to be estimated; εij was an
error term; and the remaining variables were categorical variables representing the
levels on the crime, health, role and social functioning dimensions. The estimated
coefficients on these categorical variables will encode information on changes in
preference associated with a movement from low level to intermediate level
compared with a movement from intermediate level to high level on each
dimension. Because it is necessary to model the three states (low, intermediate and
high) of each of the four dimensions (C, H, R and S), two categorical variables for
each dimension are required.
For example, consider the dimension of crime. Two categorical variables related
to crime are defined, CL and CW which take the following values: CL = 0 and CW =
0 if state j included crime at its best level, CL = 1 and CW = 0 if crime was at its
intermediate level and CL = 2 and CW = 1 if crime was at its worst level. The
coefficient associated with CL gives the estimated effect of a change in the level of
crime. The coefficient associated with CW gives the additional effect of moving
from intermediate to worst level, compared to that which is predicted by the move
from best to intermediate level. Thus, the regression equation gives the following
approximation for the contribution of crime to the overall level of utility:
w u crime C CL W1 1 2 6( ) = +β β (4)
so the estimated β parameters indicate that if:
Crime worst w u
Crime medium w u
Crime best w u
( ) , ( , )
( ) , ( , )
( ) , ( , )
= = += == =
49 000 49 000 2
44 000 44 000
40 000 40 000 0
1 2 6
1 2
1
β ββ
(5)
and the β values (given later in Table Chapter 3 .4) are a combination of the
attribute weight and preference function.
To take into account the repeated-measures nature of the data the error term was
modelled in a variety of ways. Fixed effect (FE) and random effect (RE) models
were estimated (Greene 1993,) and compared to ordinary least squares (OLS). Our

Chapter 3 46 Elicitation
estimates of β may be biased if incorrect assumptions are made about the
distribution of εij. In an FE formulation the error terms εij were assumed to
comprise two terms:
ε α λij i ij= + (6)
in which: α i was a set of individual-specific constant terms and λ ij were normally
distributed ‘noise’ terms with zero mean and constant variance. In an RE model,
the individual-specific effects were believed to be constant across the repeated
measures but drawn randomly from an underlying distribution:
ε η λij i ij= + (7)
in which ηi were subject-related error terms which were assumed to be normally
distributed with zero mean and constant variance. Furthermore, it was assumed
that the λ ij and ηi terms were uncorrelated.
The regression equations were estimated using LIMDEP (Greene, 1991). Greene
(1993) suggests that both FE and RE models should be estimated and that a
Hausman test of the RE versus FE specification could be estimated to choose
between models. A Lagrange-Multiplier (LM) test also provided a test of the
significance of the improvement of the RE model over OLS. The results of the
LM and Hausman tests and the coefficients estimated in the superior model
specification are presented in the following section.
The null hypothesis was that respondents had linear preferences. This would be
confirmed by preference data that correlates with simple movement between
levels. Subjects with non-linear preferences would consider the base level in
addition to this movement. To accept this hypothesis the coefficients on the worst-
level dummies, β6,..., β9, should not be significantly different from zero. In
addition, a test of the linearity of preferences on each dimension was then
provided by a test of whether:

Chapter 3 47 Elicitation
β β6 21=−−
−
N N
N NW I
I B
(8)
in which: NW, NI and NB were the performances (number of burglaries in this
instance) at its worst, intermediate and best levels respectively.
Results
The regression results for the multi-attribute utility function elicited using the SG
and value function using a VAS are shown in Table Chapter 3 .4. For the SG
results, data generated by the random error approach are presented. For the VAS,
ordinary least squares’ data are shown.
There are a number of encouraging characteristics of the results. Immediately
apparent is the similarity of results provided by the SG and VAS methods. This
indicates that the questionnaire did actually capture the preferences of the subjects
with some consistency. Further, movements from high to intermediate and
intermediate to low levels are estimated to result in greater preference decreases,
implied by positive signs on all of the β coefficients. Moreover, for the VAS
results, these movements are all significantly different from zero at the 95% level.
For the SG only two of the eight are not statistically significant. Around 60% of
the variation in the preference scores can be accounted for by movements between
levels on the four dimensions. This is shown by the reasonably high R2 goodness-
of-fit statistic in both models. It is also encouraging to note that the results imply
that respondents did take into account the cardinal differences in performances
represented by the shifts between levels, indicated by the fact that many of the
‘worst-level dummies’ are statistically significant.

Chapter 3 48 Elicitation
Variable Standard Gamble Visual AnalogueScale
Coeff. Prob(βi)=0 Coeff. Prob(βi)=0
LM-test of RE vs. OLS 16.062 <0.001 0.195 0.659
Hausman-test of FE vs. RE 0.000 1.000 0.000 1.000
Constant β1 0.000 1.000 0.000 1.000
Per-level changes
Crime β2 0.026 0.267 0.117 <0.001
Health β3 0.073 0.001 0.076 0.003
Social Functioning β4 0.088 <0.001 0.093 <0.001
Role Functioning β5 0.107 <0.001 0.007 0.003
Worst-level dummies
Crime β6 0.154 <0.001 0.130 0.004
Health β7 0.176 <0.001 0.186 <0.001
Social Functioning β8 0.124 0.002 0.092 0.038
Role Functioning β9 0.048 0.226 0.102 0.022
R2 0.587 - 0.630 -
Wald tests for non-linearpreferences
Joint Test 19.2 <0.001 10.1 <0.05
Crime 11.5 <0.001 4.1 <0.05
Health 13.0 <0.001 5.8 <0.05
Social Functioning 0.1 n.s. 0.0 n.s.
Role Functioning 1.0 n.s. 0.1 n.s.
Table Chapter 3 .4: Results of the SG and VAS Elicitations
The Wald statistics for the tests of the linearity of preferences are also shown in
Table Chapter 3 .4. For both the utility and value functions, the joint test of the
linearity of preferences on all dimensions is rejected at the 5% level. The evidence
is much clearer for the SG results. However, it is clear from the individual

Chapter 3 49 Elicitation
dimension tests that it is the non-linearity of the crime and health dimensions
which give rise to this result. There is no evidence on which to reject the null
hypothesis of linear preferences on the role and social functioning dimensions. It
is possible that subjects have non-linear preferences (whereby marginal disutility
is increasing) for those dimensions which they feel are most likely to affect
themselves. In this University student sample, subjects may see themselves as
more likely to be affected personally by house burglaries and premature death than
unemployment or homelessness.
SIMULATED EVALUATION
Non-linear preferences on some dimensions imply that the value attached to
outcomes produced by substance misuse interventions will depend on the levels of
harm from which they begin. Thus, the value of the expected benefits from a drug-
misuse programme will depend on the society in which it is introduced. For
example, the value attached to reductions in criminal activity relative to the value
of health improvements will depend on the pre-existing levels of criminal activity
and premature mortality.
We demonstrate the implications of our results using a subset of the results of the
study by Hartnoll et al. (1980). It is assumed that the choice problem is whether to
introduce an injectable heroin or oral methadone programme for 250 individuals
into a society with intermediate levels on each of the four dimensions. It is
assumed that the four dimensions considered in the elicitation exercise represent
all that is valued from the proposed programmes. In this example, the relative
costs of implementation are not considered. For these reasons and because many
assumptions and much estimation have been involved, these results must be seen
as hypothetical.
The estimated impacts of the two programmes are shown in Table Chapter 3 .6.
Both programmes are simulated to increase the level of unemployment. Broadly
speaking, the oral methadone programme is simulated to save more lives but have
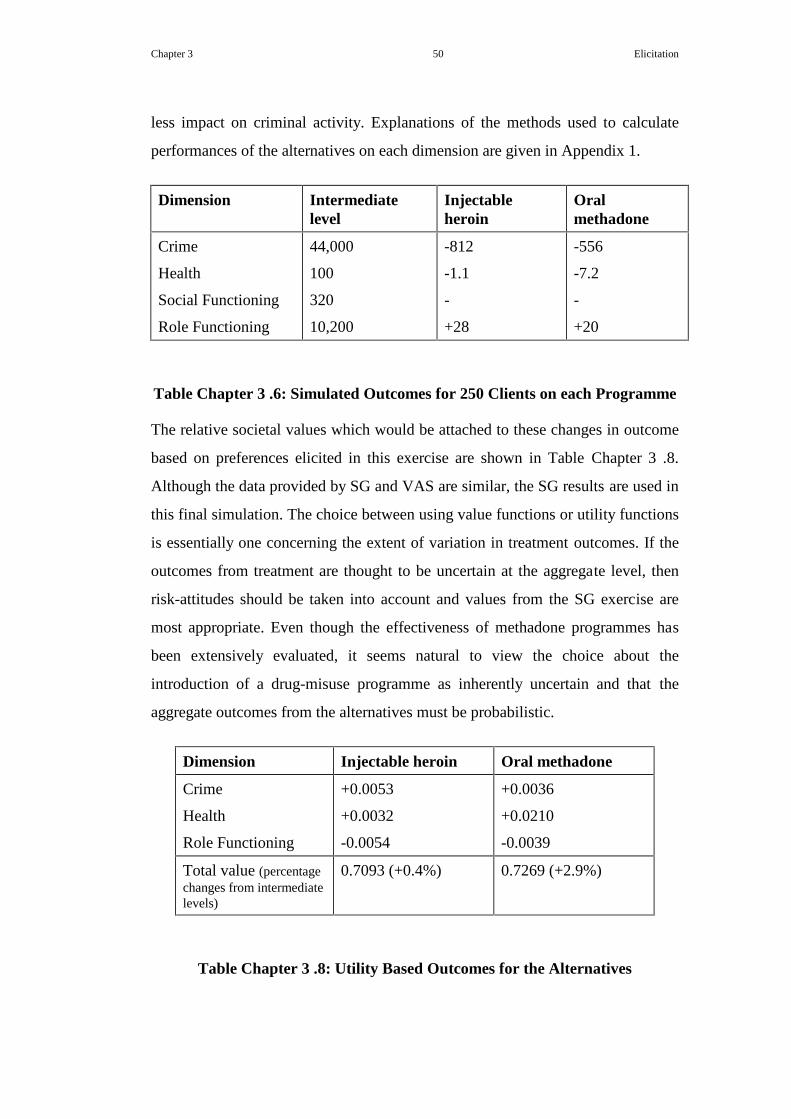
Chapter 3 50 Elicitation
less impact on criminal activity. Explanations of the methods used to calculate
performances of the alternatives on each dimension are given in Appendix 1.
Dimension Intermediatelevel
Injectableheroin
Oralmethadone
Crime
Health
Social Functioning
Role Functioning
44,000
100
320
10,200
-812
-1.1
-
+28
-556
-7.2
-
+20
Table Chapter 3 .6: Simulated Outcomes for 250 Clients on each Programme
The relative societal values which would be attached to these changes in outcome
based on preferences elicited in this exercise are shown in Table Chapter 3 .8.
Although the data provided by SG and VAS are similar, the SG results are used in
this final simulation. The choice between using value functions or utility functions
is essentially one concerning the extent of variation in treatment outcomes. If the
outcomes from treatment are thought to be uncertain at the aggregate level, then
risk-attitudes should be taken into account and values from the SG exercise are
most appropriate. Even though the effectiveness of methadone programmes has
been extensively evaluated, it seems natural to view the choice about the
introduction of a drug-misuse programme as inherently uncertain and that the
aggregate outcomes from the alternatives must be probabilistic.
Dimension Injectable heroin Oral methadone
Crime
Health
Role Functioning
+0.0053
+0.0032
-0.0054
+0.0036
+0.0210
-0.0039
Total value (percentagechanges from intermediatelevels)
0.7093 (+0.4%) 0.7269 (+2.9%)
Table Chapter 3 .8: Utility Based Outcomes for the Alternatives

Chapter 3 51 Elicitation
The relatively high level of utility given to changes in the number of premature
deaths in the SG exercise means that the oral methadone programme is preferred.
It is important to note here that, not only has this approach permitted an overall
comparison of the two programmes, it has also given insight into why one
programme is preferred to another. In this case it is on the basis of the number of
premature deaths averted. As was alluded to earlier, any further analysis of the
robustness of the preference data would consider how changes in this strongly
held preference might impact on the prescribed solution.
DISCUSSION
This chapter investigated the feasibility of eliciting preference data for outcomes
of a heroin misuser treatment programme. Despite the obvious subjectivity and
complexity of summarising the multi-dimensional outcomes of substance-misuse
interventions, failure to do so is a major obstacle to evaluation. A wide variety of
health and other technologies compete for target populations, common resources
and policy-makers’ favour. To fail to develop composite outcome measures, and
therefore informed opinions about relative advantage, is to fail substance-misusers
who seek treatment and communities demanding efficient policy-responses and
accountable resource-allocation. Current resource allocation decisions implicitly
prioritise particular outcomes and make trade-offs between desirable social goals.
Increased accountability would be achieved if the preferences of the policy makers
and the general public for the components of these decisions could be made
explicit and compared.
Consideration of preferences for the different outcome dimensions via utility
theory may be a feasible way to proceed. We have argued that the objectives of
drug policies should remain focused on the ‘end-products’ of these interventions,
i.e. the reduction of social costs. We have demonstrated that, with a small
convenience-sample of University students, it is possible to elicit preference
information for these ‘end-products’ and that these preferences show reasonable
consistency and face validity across elicitation methods. Tests of the linearity of

Chapter 3 52 Elicitation
preferences for different levels of outcome on various dimensions indicate that
subjects have increasing marginal disutility for societal harms. Thus, even when
the behaviour changes that result are held constant, the ‘value’ of drug-misuse
interventions will depend on the society in which they are introduced. This has
important implications for the generalisability of the results of economic
evaluations for local policy-making.
One of the criticisms of utility theory stems from its use of preference data, and
the methods used to elicit this information. Subjective data is undoubtedly less
robust than that used by standard economics approaches. However, subjective
preference data does model valuable information which these other approaches do
not. The added value which preference data offers is substantial enough that any
worries about possible shortcomings are initially put aside and investigated later.
This study must be seen as tentative and probably raises more questions than it
answers. The feasibility of eliciting preference information has been demonstrated.
From this information, composite outcome measures can be derived and used to
summarise evaluation results. However, we have chosen to elicit preferences for a
subset of ‘end-products’ of drug-misuse interventions in an abstract context. This
is based on our contention that the relevant role of community values in policy
analysis is in providing preference weights free from prejudice or misinformation.
This is clearly an important problem in this field (Lomas, 1997).
This brings us inevitably to the crucial issue of ‘whose values count?’ (e.g.
clinicians, drug-workers, researchers, policy-makers, the general public) and we
suggest that this is a priority for further debate. However, for empirical
comparison of different viewpoints, these elicitation methods can be used
opportunistically in future surveys since they are relatively easy to administer and
analyse. Additionally, a conjoint analysis approach, involving the identification of
preference weights from a series of discrete choices (Propper, 1991), is a
promising alternative to the methods demonstrated here.

Chapter 3 53 Elicitation
One apparent consensus, however, which did emerge from the elicitation exercise
was the importance of the avoidance of premature deaths relative to the other
dimensions, especially the prevention of house burglaries. Of course, the
implications of this for evaluation will depend on the extent to which outcomes
are achieved on these dimensions by different technologies. Nevertheless, this
seems in contrast to the little weight which is placed on health-related outcomes in
US studies of drug-misuse interventions (Gerstein et al., 1994). It also questions
the apparent switch of priorities in UK drug policy towards drug-related crime
(HMSO, 1995). This suggests also that, to establish external benchmarks, it may
not be too inaccurate to consider drug programmes as life-saving therapies, and
compare them to other technologies on the basis of costs-per-life-saved.
Conclusions
It is possible to ask DMs to provide preference data for MAUT and MAVT
analyses. The DMs in this study quite quickly adapted to the necessary modes of
thinking demanded of them. The data demonstrate complex non-linear preference
functions, implying that the DMs had an appreciation of the information they were
providing.
Not only has this study provided a solution to the Hartnoll et al. problem, but we
can understand what it is about society’s values which gives us this solution. This
clear interpretation of what the preference data imply can be communicated to the
DMs enabling them to better understand their problem.
Performing a small preference elicitation experiment, although informally
conducted, and using the data in a decision problem has given a great insight into
a specific policy issue. It is clear that many questions have been raised, but also
the usability and usefulness of decision analysis has been demonstrated.
Academics should publicise this tool to potential audiences. DMs need to realise
they can do more, i.e. provide preference data, to tackle hard issues. Prescriptive
analysis could have a useful role to play in business and social policy problems.

Chapter 3 54 Elicitation
The debate on whose values count has not been addressed here. Further, the issue
of aggregation of data from a group is a complex one. However, these issues
should not be allowed to stop the application of decision analyses.
The investigation conducted in this chapter concerned the elicitation of preference
data. This investigation was begun in order to strengthen the proposal that
decision analysis can be usefully applied to problems and result in satisfactory
solutions. I have demonstrated that preference data can be established, and will
potentially provide a spring-board for further discussion about a decision problem.
However, further investigation needs to take place to answer the question
regarding whether DMs will actually make use of decision analysis. Following the
findings of Chapters 2 and 3, it should be apparent that an individual DM could
make use of these tools with the help of an analyst. One consideration which could
be addressed is the consideration of using these methods with a group of DMs.
Groups may function very differently to the individuals who make up that group,
therefore generating a new environment for investigation. If their usefulness could
be established in this setting, then decision analysis and decision support would
have a very large potential audience. The next chapter will discuss group
dynamics and examine one of the many group decision support tools which has
been developed.

Chapter 4 55 Facilitation
Chapter 4 - Group Decision Making and Facilitation
INTRODUCTION
Previous chapters have raised a number of issues. The human brain has a limited
capacity for information processing. This means that it is unrealistic to expect
DMs to be able to process complex decision problems ‘rationally’. They would be
unlikely to be able to mentally simulate the type of complex mathematical
function that a full decision analysis would provide. With respect to the
justification approach to rationality, if DMs cannot process the problem mentally,
then it is likely that they will have over-simplified the problem, hence leaving any
solution open to challenge. The foundations and assumptions of particular
normative decision models introduced to alleviate this problem have been
discussed. The usability of a normative approach has been investigated via a
preference elicitation exercise. The aggregated preference data were applied to a
published policy investigation to give a societal perspective on the issue. The
preference data, although tentative, displayed surface validity and gave a
transparent result. No examination of decision analysis would be complete without
a consideration of how the process would perform in a group application. Indeed
this thesis, with its prescriptive approach to validation and evaluation, proposes
that it is only through applications that validation can be achieved. Therefore, this
chapter will describe the special circumstances which exist within a group of
DMs. An investigation of how to support a group of DMs is performed, and a
specific decision support system, that of facilitation, is considered.

Chapter 4 56 Facilitation
Again the issue of validation criteria must be addressed. Validation in this chapter,
as in previous chapters, refers to a technique reaching an acceptable performance
level in the eyes of the DMs and the decision analysts. I am not discussing
validation in the strict statistical sense. A number of indicators are suggested
below which have been used in this investigation. Initially, this work was started
optimistically with the aim of building a mathematical model of a group decision
making process. Further, measurements were established which might indicate the
presence of certain biases. However, it very quickly became apparent that this task
was too ambitious. The motivation for such an approach is clear, but the problem
itself is very complex. Some of the proposed models, measures and issues
concerning this approach can be found in Simpson (1995). This thesis will not
repeat that work.
The validation approach which I have selected includes both statements of the
negative aspects which may surface from the use of a group and statements of the
positive influence which facilitation is claimed to have on group decision making.
Also, the technique of requisite decision modelling (Phillips, 1984) as a validation
approach will be discussed. Drawing on the earlier discussion of the dynamic
nature of preferences, I suggest that the view of the problem held by the DM is
evolving.
Investigations of decision analysis applications are subjective. Empirical
experiments are not repeatable, are not generalisable, are not observer
independent, are not based on objective measures and it is always possible to find
an (equally (in)valid) alternative approach to the suggested technique. In short,
decision analysis applications are dynamic, responsive and unique. However, in an
attempt to understand our environment better, there will always be attempts to
conduct such research. It is these attempts which have led to the consideration of
how to conduct qualitative research (Levin and Hinrichs, 1995). New definitions
of statistical measurement validity have been suggested, proposals of how to
isolate and measure the desired effects by manipulating experimental design are in

Chapter 4 57 Facilitation
place and statistical techniques have been devised such as tests for confounding
variables and fixed/random error effects.
This chapter will investigate group decision making support. Initially, a brief
outline of a subset of relevant problems which may occur when a group attempts
to work together to solve a problem is given. A description of the technique of
facilitation follows, highlighting the reported advantages of its use. Some
cautionary comments are included which motivate the need for further evaluation
of this technique. A synopsis of the difficulties of conducting qualitative
evaluations is given. A summary of two investigative experiments is presented. I
performed these experiments in order to better appreciate the contribution of
facilitation to promoting good group decision making processes. Finally some
conclusions are outlined, and motivation for the work set out in the next chapter is
given.
WORKING IN A GROUP
The need for evidence to evaluate decision support techniques in general is
emphasised by research from the 1980s that has indicated the significant impact of
psychological biases on individual and group decision making (Kahneman et al.,
1982, Dunning and Ross, 1990). In addition, work done in the field of group
dynamics and group decision making has found many conflicting results about the
performance of groups relative to individuals and have found instances where
groups become dysfunctional (Janis and Mann, 1977, Forsyth, 1983). The research
into group decision making and psychological biases is vast. There are many
effects described in the literature. What follows is only a subset of the possible
areas for investigation.
Subtle biases, which are independent of the decision theoretic model, may be
influential in both individual and group decision making settings. Research
experiments performed in the field of descriptive decision analysis, psychology
and experimental economics have described an array of judgmental heuristics and
psychological effects (Kahneman et al., 1982, Hey, 1991). Most of this work has

Chapter 4 58 Facilitation
been done on the basis of individual decision making. Theories have been
developed to model how a DM actually forms preferences, assesses likelihood and
makes choices. It is likely that biases will manifest themselves in a group setting
also. One bias in particular is studied in the following experiments, that of
overconfidence. The non-numerical nature of the problems to be solved in the
experiments means that other possible biases were not as easy to consider.
Overconfidence is a well researched bias (Kahneman et al, 1982, Dunning and
Ross, 1990). This effect manifests itself in the individuals’ belief that they are
both accurate in their judgements and can say so with a good deal of confidence.
They overestimate their ability to accurately predict values. As their perceived
confidence increases, the gap between their actual accuracy and their stated
confidence widens. It has been shown that this effect is more pronounced in a
group setting where a consensus of opinion is sought (Dunning and Ross, 1990).
The stated confidence in the group prediction is much increased.
There is much research into whether a group of DMs are capable of reaching good
decisions. These are generally comparison based, investigating the relative
performances of individuals and groups. The studies are based on problems which
have a correct response in order that the subjects' responses might be compared.
This may be a somewhat artificial scenario in which to examine group decision
support as it is usual for it to incorporate values, preferences and uncertainty. It is
very unlikely that a problem will have a correct answer, rather there are usually a
number of alternatives from which to choose, each with conflicting outcomes.
Some findings show that groups outperform individuals whereas others find the
reverse, i.e. that individuals outperform groups (Graham, 1977; Laughlin and
Barth, 1981). In order to make sense of these findings, it is necessary to compare
the studies accurately.
• The size and complexity of the cognitive task must be noted.
• The type of task should be considered, whether creative ideas are needed or
general problem solving.

Chapter 4 59 Facilitation
• The actual measurement of group and individual performance should be
considered, i.e. group decision based upon a statistical aggregation, majority
vote or consensus.
Groups are perceived to be more useful under certain scenarios. When problems
are cognitively very large, too large for an individual to grasp, then it may be the
case that a group can comprehend the problem adequately. Groups may be
preferred when creative tasks are being undertaken. Group discussion and
interaction allows the formation and development of new ideas which may not
have come to light if left to an individual. Further, the involvement of the whole
group to come to a group consensus is perceived as an important aspect in cases
where implementation of any decision needs the cooperation of many people. For
these sorts of reasons, the use of groups to solve problems is likely to continue.
However, there are also numerous aspects which have been described in the
literature to explain the breakdown in dynamics within a group discussion.
Groups do not always use discussion to their advantage. Conflict can give rise to a
number of discussion-limiting effects. These include procrastination where the
actual recognition that a decision has been reached is ignored by the members of
the group. This may manifest itself due to an avoidance of responsibility for
making the decision. Even in a group decision making context, it is an individual
who must suggest that the solution has been found. Another effect of discussion
limitation is that possible options may be ignored and the group discussion may be
trivialised. This in turn may give rise to pointless arguments. It is crucial to note
that all groups have a group personality as well as there being individual
personalities within that group. There may be some link between the breakdown
of group dynamics and group personality.
Group discussion has been found to impact profoundly on the individual beliefs
and judgements of members of a group (Forsyth, 1983). Groups have been found
to select a course of action which is more extreme than would be expected by
aggregation of the individuals’ pre-discussion preferences. The shift in behaviour
may be towards more cautiousness or greater riskiness depending on the ex ante

Chapter 4 60 Facilitation
predilections of the group. The suggested reasons for this drift towards riskiness
are that individuals may become less wary when insulated by group decision
making, or the natural propensity of risk takers to ‘lead’ the group. The group
members’ preferences may be influenced normatively (i.e. by a desire to conform
or distance themselves from group norms) or informationally (through the
provision of better information). Kaplan and Miller (1987) found the importance
of each of these effects to depend on the type of issue being considered and the
decision rule adopted by the group.
Groupthink is a concept developed by Janis (1972) which outlines a number of
symptoms and associated causes which result in “a distorted style of thinking that
renders group members incapable of making rational decisions” (Forsyth, 1983,
page 294). Most effects are a result of over-limited communication,
overconfidence in the group’s ability to make a good decision and an over-
estimation of the benefits of the preferred strategy. The participants do not
thoroughly evaluate alternative strategies or air dissenting views in favour of
seeking unanimity with the rest of the group. Groupthink is more likely to occur in
groups which are highly cohesive, are isolated from outside scrutiny during
decision making, face decision problems with potential severe consequences or
whose discussion is limited by structure. These factors have a combined impact.
Forsyth (1983) reports on a range of content analytic studies and experimental
evidence which shows a definite relationship between these factors and poor
decisions.
Further, research in group dynamics shows that groups of workers are prone to
dysfunction. The following aspects cause these problems (Baron et al., 1992):
• Group member characteristics - status effects mean that some members are
not valued. This leads to less confidence in the group solution.
• Group size - although there is likely to be an increase in knowledge and
expertise with the use of a group, there are management issues related to how
all these ideas can be aired and evaluated.

Chapter 4 61 Facilitation
• Social loafing and free riding - some group members may choose to take a
back seat in the problem solving. This may be because they are lazy, but could
also be due to the ‘too many cooks’ approach. It is likely that these group
members will not feel as committed to the group solution due to their lack of
involvement.
• Inequity issues - it is likely that all group members will receive equal credit for
the problem solution. If some members perceive others as having had no input
it will lower their own commitment to solve the problem themselves.
In summary, groups of DMs face many possible problems, some of which they
may not recognise or know about. As outlined above, there are many problems
which may hamper the group’s ability to function cohesively. As discussed in
earlier chapters, problem solving is also a difficult task. When these two aspects
coexist there is even more reason to advocate decision support.
FACILITATION
Facilitation is a group decision support technique which is often used in
conjunction with decision conferencing. The format of decision conferencing is
widely referenced (Hall, 1986, French and Liang, 1993, Phillips and Phillips,
1993). Decision conferencing is a form of facilitated group decision making and
has its basis in three disciplines: decision theory, group processes and information
technology. The facilitator at a decision conference has a central role. Much of
what is supposed to differentiate decision conferencing from a standard group
decision making exercise is orchestrated by the facilitator. Indeed, Hall (1986)
says that the facilitator must be an expert in three areas: group dynamics; rational
decision theory; and communication. A facilitator should influence the process,
quality and efficiency of group decision making. Quality and efficiency are a
consequence (but not necessarily a conclusion) of process. The strengths of
facilitation lie in supporting group decision making processes. Discussion and
conflict are managed, and problems with communication addressed. These aspects

Chapter 4 62 Facilitation
are often overlooked in an unsupported group setting as the group’s concerns lie
with the decision problem itself.
The facilitator’s role is somewhat elusive, not in its definition but rather in the act
of portraying the role. It is possible to define a facilitator, but much harder to
know how to interpret these definitions. The duties of a facilitator have been
usefully discussed in the soft operational research literature. See, for example,
Eden and Radford (1990), Phillips and Phillips (1993) and Huxham and Cropper
(1994). Ideas put forward in the literature stem from early findings on group work.
For example, the duties of a facilitator are akin to those suggested for an impartial
group leader by Maier (1967):
• Encouraging members of the group to listen in order to understand rather than
to appraise or refute.
• Assume responsibility for accurate communication between members.
• Be sensitive to unexpressed feelings.
• Protect minority points of view.
• Keep discussion moving.
• Develop skills in summarising.
However, group facilitation is more involved than group leadership. Phillips and
Phillips (1993) claim that to understand the difference between leading and
facilitating a group, it is necessary to distinguish between what a group is doing,
and how it is doing it. A leader would typically be interested in both the ‘what’
and the ‘how’. A facilitator, on the other hand, would refrain from contributing to
the content of the group’s discussions and would concern themselves with the
processes of group discussion. The research by Phillips and Phillips (1993) makes
it clear that involvement in content may interfere with the effective facilitation of
the process. The facilitator must consider content to a certain extent, for content

Chapter 4 63 Facilitation
and process interact but observation of process becomes difficult when too much
attention is paid to the content of the discussions.
The literature on facilitation claims that it improves group decision making. In
Ackermann (1996), such improvements were defined by over 100 managers who
had taken part in facilitated group decision making events. The measures related
to the participants’ perceptions of the influence of facilitation on a group decision
making process:
• DMs are able to contribute freely to the discussion.
• DMs are able to concentrate on the task.
• Facilitators motivate the group so that the DMs sustain enough interest and
commitment to solve the problem.
• DMs are encouraged to review progress.
• DMs are forced to address complicated issues rather than ignore them.
Certain strategies can be employed in an attempt to avoid groupthink. These
include the use of a group leader as an impartial observer, the use of devil’s
advocacy to extend discussion, an admission of the complexity and inconsistency
surrounding the problem and an acceptance of responsibility for the making and
implementing the decision (Frey, 1997). With such strategies in mind, it would
appear that facilitation may be able to provide support which will encourage good
practice. Further, existing literature on the applications of facilitation and decision
conferencing alludes to its success. Since its introduction by LSE and ICL, it has
had many high profile applications leading to ‘well accepted solutions’ (Hall,
1986). Its use in the International Chernobyl Project (CEC, 1992) has
demonstrated its acceptance by sections of the academic community. The
combined use of this technique with a predictive dispersion/deposition model and
geographic information system has been proposed for use by the RODOS project,
an international project for decision support in radiological protection (Kelly,

Chapter 4 64 Facilitation
1994). However, the recognised existence of a citation bias (Beach et al., 1987),
and possible issues such as an unwillingness to admit to spending money on
worthless advice, may influence the literature. Therefore, the aim of this work was
to investigate facilitation, measuring it against its own claims.
EXPERIMENTS
Important issues concerning the adequacy of an investigation of group decision
support are outlined below. Initially, a number of possible influencing factors are
presented. A scenario was chosen in order to minimise the effects of these
confounding variables. The scenario is described and the investigation of
facilitation as a group support mechanism is justified. A selection of criteria
against which facilitation has been measured are given, along with a discussion of
why some more obvious criteria have been avoided. Following this, the pilot and
main study are described and their results presented. A discussion about the flaws
in the experiments, the performance of facilitation and areas for further research
concludes the chapter.
Problems Related to Group Decision Making Research
When embarking upon evaluating group decision making, there are many
complicating factors which prevent an objective scientific comparison. Some
concerns which are specific to the study of facilitated group decision making are:
• Most measures are subjective and/or qualitative.
• The decision making environment is dynamic, therefore when should
measures be taken?
• Will the DM tell the truth, act truthfully, have hidden agendas?
• Group to group comparisons may not be valid as each group will be different
in uncontrollable ways.

Chapter 4 65 Facilitation
• Changes in group dynamics may be due to personalities of group members
rather than experimental interventions.
• The facilitator will have a learning curve if studying the same problem with
many groups. Altering the problem is not a feasible adaptation, and altering
the facilitator would also call study data into doubt.
• The influence of the facilitator may be based on personality as well as/rather
than techniques.
Further to these issues, I was making use of student subjects to simulate my
problem solving groups. This led to more confounding factors, such as the groups
were not used to working together, were not in a realistic environment and were
not addressing a problem they might expect to face. Let me stress at this point
however, that despite knowing the possible problems which could affect this type
of experiment, it was valuable to attempt such an investigation. If the results from
this analysis were to find significant differences in a facilitated work setting, then
it would be apparent that facilitation would be a robust tool which could be
applied to any environment. A lot of benefit could potentially be gained from a
minimalist effort. If, more likely, the data were to give mixed or no results, then
the experiments themselves could be reflected upon in order to try and highlight
aspects which may be crucial to the conduct of such work. Finally, and most
importantly, only through performing such an investigation could I expect to gain
any insight into the nature of facilitation and the reasons which underlie its
reported success. Although, at the outset, it seemed that there would be many
problems which may impact on the investigation, I still considered the
experiments a fundamental part of the research into prescriptive decision support.
In order to try to eliminate some of these complicating factors, and to address the
criticism concerning the subjects available to me, I chose to simulate a jury
decision making session. Traditionally, such decision making is done ‘behind
closed doors’, and no record is kept of the deliberations. This scenario is
particularly interesting because:

Chapter 4 66 Facilitation
• No other decision support methods would be used, and therefore, any impact
could be attributed to the use of a facilitator.
• No expertise is required by the experimental subjects, as none is required in
the real-case.
• Feelings of problem ownership for the experimental subjects may be very
close to the feelings of responsibility and accountability felt by real-life jurors.
• The group members are unknown to each other and will not have worked
together before (homogenous/heterogeneous aspect pre-defined)
• The group is likely to be diverse socially, culturally and politically, but is
always the same size.
• There is no pre-defined pattern for solution methods or personal role in the
decision making with which the experimental participants must be familiar.
• The actual solution is unknown, but the subjects are required to give a
guilty/not guilty verdict and therefore their task is somewhat simplified.
A jury comprised of 12 people can be described as a ‘small group’ (Phillips and
Phillips, 1993). Juries are novel groups because they are made up of people who
do not know each other, and who come together briefly to solve often complex
and critical problems. Following their verdict on a case, they will never be
expected to work together again. This basic background makes them an interesting
group to study as far as group dynamics is concerned. The traditional findings of
group dynamics research cannot be immediately applied. Further, the individual
DMs are not experts in the problem area in any sense. Moreover, they have an
unusual aspect of accountability and responsibility for the decision. Although they
are obviously accountable for their verdict, there cannot be any personal
repercussions. Further, society is affected by their choice, but it is unlikely that
each juror will feel a specific effect, so feelings of responsibility are unusual. This
makes the setting interesting from a decision analysis point of view. Finally, a jury
is unusual as a group decision making unit because it has no ‘history’. A group of

Chapter 4 67 Facilitation
people who have never met each other, let alone worked together, are asked to
consider a specific case (or set of cases) and will not work with their fellow jurors
ever again.
The individual jurors may have little experience of decision making or group
work. This may make them nervous, or cautious about voicing their opinions.
Therefore, there are reasons to believe that aspects such as perceived status of
other jurors may influence the jury members similarly to the documented effects
of status in other group settings. Further, the nature of the task of a jury means that
there are likely to be two factions to the group. This split must be addressed for a
verdict to be reached. In an ideal world, any changes of opinion would be down to
persuasive argument. However, the group decision making literature documents
much evidence of opinion change due to normative, or peer, pressure rather than
informational, or evidence based, argument.
It is hoped that, by using the scenario outlined above, the impact of hidden
agendas will be minimised, if not totally eradicated. There is also little foreseeable
advantage in lying. Unfortunately, it is almost impossible to address the criticisms
about the groups themselves. Groups were to be identified by a randomisation
technique, but this is not guaranteed to remove biases. Data on the predilections of
the groups were to be collected during the experiment, and used to temper any
experimental results.
Last year, the Master of the Rolls announced that the British Legal System should
be free to examine more closely the work done by juries. It is currently illegal to
solicit information from jurors about the deliberation processes. Any investigation
might consider how to support jury work in the light of the many changes which
have taken place in British legal processes. For example, the use of ‘expert
testimony’ and the introduction of forensics has meant that the evidence presented
at trials is increasingly complex. Information is presented in the form of statistical
likelihoods, and is in danger of being misinterpreted. Further, there is an increase
in the detection and subsequent prosecution of ‘clever crimes’, such as financial
fraud. These cases are often very long and involve complex financial law.

Chapter 4 68 Facilitation
Establishing not only the facts, but also the intention of those involved may be
incredibly demanding.
So, it was proposed that due to the nature of the jury group, a support mechanism
which would attend to the decision and discussion (deliberation) process and may
help in the presentation/interpretation of information would be an ideal
mechanism. Many group decision support techniques exist which operate with
varying levels of invasiveness. Various software packages are available (Belton,
1990) which give graphical representations of aspects of a decision problem.
Varying degrees of meta-support exist in the form of decision pods, consultancy
and facilitation. One possible alternative support mechanism which may have
been employed in these experiments was the delphi technique (Linstone and
Turoff, 1975). This is a group decision support system which has been developed
to incorporate the use of computers to anonymise discussion. Individual DMs can
contribute to the discussion via their keyboard, and then sections of the
contributions are displayed to them via their monitor. On closer inspection, delphi
was deemed to be inappropriate for a jury application. In addition to the
unnecessary expense of providing computers and software, it is unlikely that every
juror would feel happy sat at a computer commenting on the case. There would be
exaggerated status effects in terms of grammar and spelling errors. The results of
technical or power failure could be catastophic, and the security issues too much
to worry about. Further, this system seemed somewhat out of place in a hundreds
of years old legal system. Facilitation is viewed as addressing exactly the issues
which need addressing, whilst not being overtly apparent.
There will be little role for the facilitator to play before or after the decision
making session. Unlike a business environment, the effects of the decision taken
will not impact on the working lives of those involved. So, there will be no need
for follow-up. Similarly, it is unlikely that the subjects will have major personal
concerns before the session regarding what action will be taken, and whether they
will have to admit to professional errors. However, the facilitator will be expected

Chapter 4 69 Facilitation
to encourage discussion during the jury’s deliberations and help with the decision
making processes.
The influence of the facilitator may well be based on their personality, but it is
anticipated that by defining their role carefully, any effects may be linked to these
aspects rather than personality traits. Further work could be done to
examine/model the facilitator. As for a learning curve issue, in the proposed
scenario it is likely that a facilitator would participate in similar problem outlines
on a regular basis, so to claim this as a bias may not be strictly true.
Criteria for Evaluation and Validation
In attempting to assess decision support, many possible methods may be
employed. It would be possible to ask the DMs who have taken part to evaluate
their experience. Equally, the decision analysts might summarise the event.
However, such an approach is open to many influences, not least of which is the
hindsight bias (Fischhoff, 1975). The comparison of two problem solutions, one
generated by an individual and the other by the group, within a normative
framework could be employed. However, this would be equally contentious given
the lack of consensus on normative decision theories. A suggested approach
employs models and an independent observer in order to base the assessment on
evidence (Simpson, 1995). However, the data to be used in these models are still
subjective (from the view of the observer) and open to much criticism.
One suggested criterion for establishing the value of a group decision making
event is the outcome. This is a very contentious issue. In a legal environment,
where it is unclear that society will ever really know the truth, it is difficult to see
how the jury’s decision might be compared to some objective measure of
correctness. In a business decision making setting, there are even more reasons
why outcome might be a bad choice of measure. Quality cannot be measured by
the eventual outcome for two reasons:
1. the outcome may be ongoing;

Chapter 4 70 Facilitation
2. the outcome may be due to the interaction of the decision with an
uncontrollable state of nature.
The consequence of such an interaction will not necessarily reflect the quality of
the eventual decision. Further, the quality of the solution will depend on the
quality of the input data. Even if the decision process has been good, an error in
the data may result in a bad solution. To establish the quality of a decision, one
should consider ‘what’ information a DM chooses to use. Have they considered all
the relevant/ pertinent information? This in itself is a decision (information
fatigue!). In addition to this, different people would establish different criteria as
important. Whose criteria should be used, or could be regarded as ‘best’ with
respect to quality? For example, should mass public opinion (e.g. by a
referendum?) be used, or that of experts (politicians) or perhaps merely the
individual who is making the decision. Consequently, the attempt to measure the
quality of decision is an extremely complex ideal. The work undertaken here will
concentrate on measures of process quality, and assume that this will in some way
aid the quality of the actual decision reached.
Phillips (1984) describes a way of validating a solution of a decision support
session, and therefore the decision support itself, which he calls requisite decision
modelling. This approach encourages the DMs to comment upon whether they feel
that the model represents their vision and their values. The DMs are asked
whether the resultant solution fits with their intuitive choice. If the DMs are
uneasy with any of these aspects, Phillips argues that the model needs
enhancement, or the values need modification. This process is then repeated and,
through iteration, will lead to a satisfactory solution. However, Henig and
Buchanan (1996) argue that DMs’ satisfaction is not a good criterion to assess
validity. In their laboratory experiments, they find that DMs expressed the most
satisfaction for methods which involved the least cognitive effort. This finding
must be tempered by the laboratory nature of the research. It would seem unlikely
that, in a real setting, any DM would be happy to accept a quick fix, especially if
their reputation depended upon it.

Chapter 4 71 Facilitation
What is apparent from this work is that not only could one question the labile
nature of preferences, but one might also consider the impact of this on the model
of the problem. Indeed, assessment criteria may be subject to change. Alternatives
may be unstable. Certainly, it is likely that the intuitive views of a DM are initially
only partially formed or inconsistent. This adds weight to the conclusions found in
Chapter 3. Communication of the results of preference elicitation techniques, and
also an explanation of the effects of certain preference distributions, to the DMs is
crucial. DMs need to increase their self awareness, knowledge and understanding
in addition to comprehending and validating the decision support mechanism.
It would appear that all available measures have drawbacks of one kind or another.
Consequently, the chosen approach has been based on feedback from the DM. A
closed questionnaire which asks opinions before, during and after the decision
making session was used (see Appendix 2). For a facilitator to have a positive
impact they should be able to either establish the positive aspects as described by
the facilitation literature, or should be able to stop the unwanted dysfunctional
problems as outlined in the behavioural group dynamics literature. Therefore, the
questionnaire was based mainly around the Ackermann (1996) measures,
additional indicators were taken from Maier (1967) and Baron et al. (1992).
Pilot Experiment
In running a pilot to simulate a jury discussion, it is not necessary to completely
mimic a jury setting. Especially at the pilot stage, the experimenter is interested in
many aspects of the experiment, and will not run a ‘polished’ scenario. As an
approximation to the jury setting, groups were given a problem which they could
not solve, but which would generate much discussion, and would be influenced by
personal morals. The aim of the experiment was to try and establish what impact,
if any, a facilitator would have on the deliberation process. It is assumed to a
certain extent, that the decision making itself will always come down to a vote,
which will be rerun and rerun until the required split is obtained.

Chapter 4 72 Facilitation
Consequently, an ethical scenario was devised which concerned a possible spread
of HIV in a prison via either consenting homosexual sex, rape or drug use. The
full scenario is described in Appendix 2. This was assumed to be an issue about
which everyone would have some personal opinion. The task given to the subjects
was to discuss the problem, and some of the proposed solutions, and to decide
together what sort of information they would like to help them establish the size of
the problem and then make a decision. Notice that the whole problem is structured
to simulate a group discussion of uncertain, complex issues without a necessarily
right or wrong answer. Some of these groups were supported by a facilitator, and
the others were not.
A self-assessment was then completed by each of the subjects on the nature of
their group discussion. A series of questions were put to the individuals. The
criteria for assessment of the discussion were taken from Ackermann (1996) and a
few common-sense questions were included. This ostensibly would allow me to
test 11 hypotheses. The hypotheses appear below in Table Chapter 4 .1.
Subjects taking part in a facilitated group discussion will be more likely to:
H1 feel able to contribute freely to the discussion
H2 concentrate on the task
H3 feel that the group were interested in solving the problem
H4 review their progress and work logically
H5 address the complicated issues
H6 agree to work within their groups on another occasion
H7 agree with their group solution
H8 feel that all members contributed
H9 feel that they could solve the problem
H10 use informational approaches to solve disagreements
H11 feel that working in the group had influenced their opinions
Table Chapter 4 .1: Alternative hypotheses for pilot experiment

Chapter 4 73 Facilitation
Subjects and the Event
The subjects were 66 first year undergraduate students registered on an
information systems module. They split into 6 groups of 8 members and 2 groups
of 9 members. 4 groups were facilitated (F) and 4 groups were unfacilitated (U).
All groups had the same scenario booklet. All discussions took place around a
large table and were limited to one hour. The groups were self selecting, but the
students were all still new to each other as the experiment took place in one of the
initial weeks of the first semester. The session took place in one of the module
slots and was advertised as giving them experience of group decision making.
There was no assessment based on their responses, and they were essentially free
to make any comments they chose.
The facilitators were all volunteers. They were not trained facilitators in a formal
sense, but were all experienced in group work and group meetings. A short
briefing was given to them about their role. They were advised to support the
discussion process, and not to comment on their own view of the problem. They
were all members of staff in the University of Leeds.
Pilot Results
An initial examination of the data shows the results to be somewhat inconclusive.
Indicators of these eleven hypotheses were included in the questionnaire. A
comparison of the sum of mean responses of each group to the hypotheses was
compiled as an initial indicator. After coding the data appropriately, the possible
range of the sum of responses would be from 11 to -11. For facilitation to have
made an impact we would expect to see a large negative result on the F groups and
a positive average response on the U groups. This rudimentary approach did in
fact give large negative averages for the F groups. Unfortunately, the U groups
also had a negative average, though noticeably smaller than F, see Table Chapter 4
.2. It is interesting to note that when comparing the demographic makeup of the
‘most facilitated’ group (i.e. largest negative average, group D, which was a
facilitated group) with the demographics of the ‘most unfacilitated’ group (i.e.

Chapter 4 74 Facilitation
smallest negative average, group E, which was an unfacilitated group) that they
are very similar.
Facilitated Average response Unfacilitated Average response
Group A -5.63 Group E -1.88
Group B -7.25 Group F -5.38
Group C -8.00 Group G -4.75
Group D -8.11 Group H -6.78
Table Chapter 4 .2: Average response to process indicators
The coded responses for the 11 questions were entered into SPSS. The
investigation was trying to establish a difference between the way in which a
facilitated group worked, compared to a control group, i.e. unfacilitated. Thus, this
was an experimental rather than correlational design. The two treatment groups
were generated from a class of undergraduate students at random. Therefore, the
subjects were considered to be similar on certain key features giving a matched
subject design. The existence of two treatments, the facilitator and the control, led
to two conditions. Finally, the data collected from these subjects were nominal in
nature, i.e. yes/no/don’t know so non-parametric tests were performed.
Appropriate analysis tests were established (Seigel, 1956, Hicks, 1995) and
performed to investigate whether facilitation had any influence on the responses
the groups gave to the group process questionnaire. Wilcoxon Matched-Pairs
Signed-Ranks tests were used to compare the results. Wilcoxon can be used to
compare an experimental condition with a control condition when the subjects
have been matched on critical variables which may influence the results. The test
investigates whether there is any difference between the responses given by the
control group when compared to responses given by the treatment group. It
achieves this by comparing pairs of responses and producing a ranked order of
differences. These differences are then inspected for significance via a look-up
table. A p-value is returned by the test, indicating whether a statistically

Chapter 4 75 Facilitation
significant difference exists between the responses from the treatment and control
groups. The Wilcoxon data are presented in Table Chapter 4 .4 below.
Three significant results emerged with respect to the eleven hypotheses tested. The
facilitated groups were more likely to feel that all members had contributed to the
process. In addition, they were more likely to feel that they could solve the
problem, and also be happy to work together with their group again. It appears that
the presence of a facilitator may have influenced the subjects’ perception of how
well they worked together rather than necessarily affecting the actual way the
groups have worked. It seems that the facilitator may engender a ‘feel-good’ factor
amongst the DMs.
Group process indicator Z p
Could you contribute freely? -1.46 0.14
Did the group concentrate? -1.04 0.30
Did the group try to reach agreement? -1.00 0.32
Did the group review its work? -1.55 0.12
Did the group ignore hard issues? -1.41 0.16
Would you work with this group again? -2.40 0.016
Do you agree with the group solution? -0.97 0.33
Do you feel that all members contributed? -3.90 0.0001
Did the group use informational approaches to solvedisagreements?
-0.55 0.58
Did the group feel that they could solve the problem? -3.15 0.002
Do you feel that working in the group influenced youropinions?
-1.32 0.19
Table Chapter 4 .4: Wilcoxon pilot results
Discussion
The results above do not clearly vindicate or condemn the use of a facilitator. An
interesting aspect has emerged with respect to the role of the facilitator, that of

Chapter 4 76 Facilitation
ensuring that the group feel contentment. However, it is clear that this experiment
has not replicated the findings of others with respect to facilitation. There are a
number of possible reasons why the pilot may have not given a ‘green light’ to
facilitation:
1) Inappropriate measures - The measures are taken from Ackermann (1996).
They were generated by discussions with ‘real’ groups who had used decision
support systems, both facilitation and computer-based decision support. It
could be argued that Ackermann’s findings have established that these things
occur in a facilitated setting, and not that they will not occur in an unfacilitated
setting.
2) Untrained facilitators - There is evidence in the literature which suggests that
untrained facilitators have little effect (Anson et al., 1995). Although the
people used in my pilot had no ‘formal’ training in facilitation, they were
experienced at supporting group work.
3) Intriguing problem - The group members all became involved due to the
interesting nature of the task.
4) Inexperience - The subjects used in the study had not experienced enough
group work to actually judge whether they were functioning well or not.
5) No history - The groups all worked because there was no history of conflict
which pre-existed. Does facilitation only work in this sort of environment?
The inconclusive results cannot be put down to environmental issues: the subjects
did not ‘self select’ (volunteer) for the task; there was no threat of assessment
based on their solution; they had no previous knowledge about the benefits of
facilitation; and they had little previous experience of group work. Therefore, a
further study was performed to try and address these issues and establish more
clearly whether the F and U groups actually worked differently on the task.

Chapter 4 77 Facilitation
Main Experiment
When designing the main study, the possible reasons for the poor results of the
pilot experiment had to be addressed first. I decided not to withdraw the use of the
Ackermann measures, but rather to extend the questionnaire to include
complementary measures. The facilitators used in the main study all underwent
some basic training as described below. The decision problem was less intriguing,
but still had to be intriguing enough to grasp the subjects’ interests. The subjects
used in the main study had all experienced group work to a lesser or greater
extent. In fact, a larger majority were ‘mature’ and therefore had much group
working experience. It was impossible to address the ‘history of conflict’ issue.
Indeed, in the chosen scenario of a jury setting, it would be inappropriate to study
a group with a history of conflict. Therefore, this possible influence on the
efficacy of facilitation was not addressed.
The experiment took place in two separate sessions. An initial meeting occurred
the day before the deliberation. At this session all of the subjects were presented
with the case and the testimonies on an OHP. They were also told what the
following day would involve. They were given an answer booklet, which they
were encouraged to leaf through. They were asked to make some early
observations which were recorded in their booklets. The subjects were supplied
with a case summary and four witness testimonies on five separate cards. A copy
of this material is given in Appendix 2. The groups were then randomly generated
and each subject given a group number for the following day’s deliberation.
The scenario used for the jury experiment was a real case taken from the 1960s in
Canada (Vidmar, 1972). A man had been fatally shot in an attempted robbery at a
general store. There was one independent witness, and testimonies from the
deceased’s brother and mother as well as from the defendant. Further, there was
information from the arresting police officer included in the case summary. The
jury were faced with deciding whether the defendant had murdered the shop
assistant, or whether there should be a lesser charge of manslaughter.

Chapter 4 78 Facilitation
Subjects and Event
The groups used in this study were again students, but this time a mixture of
undergraduate and postgraduates. All were registered on a module in decision
analysis. There were 48 subjects split into 8 groups of 6 members. Four groups
were facilitated (F) and four groups were unfacilitated (U). All groups had the
same scenario booklet. All discussions took place around a large table and were
limited to one hour. The groups were randomised. Both sessions took place in one
of the module slots and were advertised as giving them experience of group
decision making. Again, there was no assessment based on their responses, and
they were essentially free to make any comments they chose.
This time, the facilitators had all experienced some training. They had each
participated in three 2 hour group sessions. The initial session outlined to them
what facilitation was, and what the experiment would involve. The second session
had them role playing group discussion and facilitation. They were each given
instructions about techniques they might use over the next week to practise
facilitation. A third and final session was run in which their role was reiterated and
discussed in the light of their experiences. The facilitators were made up of
members of staff and research postgraduates in the University of Leeds.
Main Results
The results of the main facilitation experiment are again somewhat inconclusive.
Two significant results were found. Unfortunately, they did not correspond to the
significant indicators which emerged from the pilot experiment. The data was
coded and entered into EXCEL and SPSS packages in addition to some analysis
performed by a custom built programme. An initial examination of both the
randomisation into groups and into each treatment was conducted. Next, the six
qualities of facilitation raised by Ackermann (1996) were tested, along with
further hypotheses concerning groupthink and group dysfunction. The results of
these analyses are presented below.

Chapter 4 79 Facilitation
Subjects taking part in a facilitated group discussion will be more likely to:
H1 feel able to contribute freely to the discussion
H2 concentrate on the task
H3 feel that the group were interested in solving the problem
H4 feel able to contribute freely to the discussion
H5 review their progress and work logically
H6 address the complicated issues
H7 agree to work within their groups on another occasion
H8 agree with their group solution
H12 feel that group members were trying to keep the discussion moving
Subjects taking part in a facilitated group discussion will be less likely to:
H9 feel that group members were being purposely awkward/argumentative
H10 feel that group members were making contributions which were stupid
H11 feel that group members were rejecting alternatives without listening
H13 feel that group members were letting other DMs do all the work
H14 feel that group members were ignored/rejected on the basis of personality
Table Chapter 4 .6: Alternative hypotheses for the main study
Data from Section One of the questionnaire asked each individual for an initial
view of the problem (see Appendix 2). The data have been used to examine the
randomisation process used to produce each group. An initial measure examined
whether there was a possible bias in any of the groups towards one or other of the
verdicts. This was performed using a χ2 test on the ‘verdict’ data and gave
insignificant results (χ2 = 1.887, p > 0.01). Therefore, there was no reason to believe
that any of the groups as generated were pre-disposed to solving the problem
irrespective of the treatment.
In order to examine further whether other confounding aspects might be affecting
the group decision making, I devised a specific measure of conflict based on the
‘confidence’ data. Conflict considered both the direction of the verdict and the

Chapter 4 80 Facilitation
strength of conviction with which that view was held. Essentially, each group
member was pairwise-compared with every other group member. This comparison
used a measure of the absolute difference between the two subjects and also a
measure of how far each was from the central point, coinciding with a ‘don’t
know’ response. These values were then averaged over the group. The conflict
measure varied between 0 and 2, where 0 indicated a group who were of like
minds, and 2 indicated a group who were likely to differ strongly. The conflict
measure is reported for each group in Table Chapter 4 .7 below.
Facilitated Groups Conflict Unfacilitated Groups Conflict
Group A 0.47 Group E 1.15
Group B 1.06 Group F 0.32
Group C 1.06 Group G 0.84
Group D 1.12 Group H 0.22
Table Chapter 4 .7: Conflict measure for the treatments
A t-test was employed to see whether there was a significant difference in the
levels of conflict existing in the groups allocated to each treatment. The results
show that the conflict levels were not significantly different (t-value = 0.96, p =
0.408). The third and final test of the randomisation process was performed on the
confidence data reported by each individual. A t-test was used to see whether the
individuals going into either of the treatments were less confident about their
individual decisions. Again, the results showed no significant differences for each
treatment group (t-value = -0.37, p = 0.713).
This initial investigation was performed to identify any possible confounding
variables which may be influencing the group work. Since all of the tests show
that there were no significant differences between those individuals assigned to a
facilitated session and those assigned to an unfacilitated session, then the
following tests should be reporting on the influence of the facilitators themselves.

Chapter 4 81 Facilitation
In addition to testing process hypotheses, one test regarding the overconfidence
bias was performed. Each subject was asked to state their individual confidence in
their verdict prior to joining their groups. Once the groups had performed their
discussion, a second agreed confidence measure was stated. Because of the fact
that not all groups were able to reach a decision within the time, only four groups
were able to state a ‘before’ and ‘after’ confidence measure. Fortunately, of these
four, two groups came from the facilitated groups and two from the control.
Therefore, a t-test was performed on the change in the confidence measure which
matched the average confidence prior with the agreed confidence post. The result
shows an insignificant result, and therefore cannot confirm the existence of this
bias. This is not surprising given the very small sample. However, on examination
of the data, it is apparent that a large growth in confidence occurs within both of
the facilitated groups whereas the unfacilitated group data indicates one large
growth and one small growth.
In all, fourteen hypotheses were tested regarding the nature of the group work in
the main study. These were all tested by asking all individuals to give a personal
response on their perception of how they and their group had performed on certain
process aspects. In order for facilitation to show a measurable positive impact on
the group decision making process, some of these process aspects should indicate
a significant difference between the two treatments. The measures chosen
reflected the positive influences which facilitation is claimed to have on group
process and the negative aspects of group dysfunction which any decision support
tool should address.
The data for these tests were nominal, i.e. yes/no answers. As described above, the
appropriate test with respect to the experimental design and data type, was the
Wilcoxon Matched-Pairs Signed-Ranks test. This test computes differences
between pairs of variables, one taken from the control group and one from the
treatment group. It proceeds by ranking the absolute differences, and then
generates the sum of the positive ranks and the sum of the negative ranks. It then
computes a Z statistic from the positive and negative rank sums. Therefore, all

Chapter 4 82 Facilitation
indicators were tested in order to identify any significant differences in responses
to the measures between the facilitated and unfacilitated treatments. The data are
shown below in Table Chapter 4 .9. Two of the indicators used in the main study
demonstrated a significant difference in the responses from each treatment.
Group process indicator Z p
Could you contribute freely? -.141 0.16
Did the group concentrate? -1.63 0.10
Did the group try to reach agreement? -0.06 0.95
Did the group review its work? -1.43 0.56
Did the group ignore hard issues? -1.62 0.11
Would you work with this group again? -0.90 0.37
Do you agree with the group solution? -1.00 0.32
Was anyone purposely awkward? 0.00 1.00
Was anyone bullying others? 0.00 1.00
Was anyone wasting time? -0.58 0.56
Was anyone rejecting other opinions? 0.00 1.00
Did anyone try to keep discussion moving? -1.67 0.10
Was anyone letting others do the work? -0.38 0.71
Was anyone ignored on the basis of personality? 0.00 1.00
Table Chapter 4 .9: Wilcoxon main results
Low levels of significance do appear to exist for the facilitated groups on two
measures: when asked whether members of the group had concentrated upon the
task; and when asked whether their groups were trying to keep the discussion
moving. The impact on the concentration measure may have been due to the
influence of the facilitator, or may have been due to the perceptions of the group
members that they were ‘being watched’. It is likely that the presence of any
‘outsider’ in a group of students may have encouraged the group to concentrate on
the task at hand. Equally, it is impossible to tell from the response to the

Chapter 4 83 Facilitation
discussion measure whether these groups felt that the facilitator had seen to this,
or whether the group members themselves had been responsible for attending to
the discussion. One point to consider is what impact a longer experiment may
have had on these results. As the experiment stands, the groups all seemed to
function well. It could be the case that, if the groups had had to work for a
prolonged period of time on the task, the functioning may have begun to break
down. With a facilitator there to ensure that the discussion keeps on track, it is
unlikely that a group would falter. However, such a deterioration may occur more
often, or much earlier in the unfacilitated groups, where discussion is not
supported.
Discussion
Unfortunately, the findings of the pilot study were not replicated by the results of
the main experiment. Further, the new measures introduced did not demonstrate a
measurable positive difference in the workings of a facilitated group when
compared to the processes of an unfacilitated group. Many possible complications
were suggested to explain the results of the pilot. To some extent, these
complicating factors were addressed in the practice and design of the main study.
However, this has not led to a more positive group process being reported by the
facilitated groups. The one issue highlighted which, in my belief, is most likely to
have led to such inconclusive results is that of a history of conflict within the
group. This issue was ‘worked around’ rather than explicitly confronted. Clearly,
there are flaws within the experimental design which would make criticism of the
existing research findings regarding facilitation dubious. However, performing the
two experiments outlined above has raised two issues of interest regarding the
preparation of facilitators and the appropriateness of facilitation. Therefore, a
contribution to an understanding of the technique has been made.
Comments on the Data Analysis
The approach taken for this investigation was subject centred. That is, the
experimental design was based upon issues such as: would subjects understand

Chapter 4 84 Facilitation
and be able to answer the questions asked of them; would subjects be interested
enough to complete the questionnaire; and would there be enough time available
for the subjects to consider and answer each question. Care was taken in
developing the decision scenarios in order that a discussion would be provoked
within each group. The existence of a group discussion was crucial to permit
testing of facilitation.
Certain aspects of the experimental design were outside of my control. My overall
sample size was bounded by the number of students registered on each module.
Therefore, the actual sample was smaller than I would have liked. Further, using a
class of students did not lend itself easily to providing the same number of groups
for each treatment, or the same number of subjects within each group. Further,
once groups had been constructed, it was impossible for me to ensure that every
member did attend the discussion session. The importance of identical treatment
sizes was not realised until after the pilot experiment had been conducted.
Consequently, some of the initial pilot data had to be excluded from the analysis.
Similarly, in the main study, although groups of seven members were constructed
originally, some subjects did not attend the second half of the experiment, so
again, some data had to be set aside.
Therefore, there had to be some method for deciding what data to withdraw from
the analysis. The reasoning I employed was as follows: the aim of the experiment
was to demonstrate a difference between the control group (unfacilitated) and the
treatment group (facilitated). For obvious reasons, I was concerned about basing
this judgement on a comparison of answers between the control and treatment
groups. Therefore, the selection of which subjects to eliminate was based purely
upon a within treatment comparison. I reasoned that, if I were to be criticised for
biasing the results in any direction, it was more experimentally sound to make the
test ‘harder’. Therefore, I chose to delete subjects from the group who gave
responses similar to the majority opinions rather than ‘outliers’. This resulted in
preserving the largest range of answers within both treatment groups, and

Chapter 4 85 Facilitation
therefore it became harder to establish that either of the groups had some
underlying trend.
A further issue which should be noted regards the shortcomings of the SPSS
software. When performing a Wilcoxon Matched-Pairs Signed-Ranks test, the
software produces a Z statistic, where the distribution for Z is approximately
normal. According to many elementary statistical texts (Seigel, 1956, Clarke and
Cooke, 1986, Hicks, 1995), Wilcoxon results in a T-value. However, Sprent
(1981) describes that “a normal approximation works quite well for n>20”. My
sample size was very close to the requirement of n>20. Indeed, in some cases, n
was less than 20. SPSS does not enable the user to change the default distribution
underlying the test.
Consequently, the SPSS Wilcoxon tests were verified, as far as possible, by hand.
A rank ordering of the hypotheses from most to least significant (i.e. smallest p
value to largest p value)was derived for both the Z and T approaches. This was
complicated by the fact that the tests were all indicating insignificant results.
Therefore, the absolute p value for the manual approach could not be established
from the look-up table. An ordering of significance had to be devised by
comparing the difference between the actual T value, and the stated T at the
lowest significance level (i.e. p<0.1). This rank order had to be constructed with
the relevant ‘step sizes’ of the appropriate row in the look-up table in mind. That
is, I considered whether the manually calculated T value was within one step of
being significant, or many steps. This expression of significance demonstrated a
similar ordering to that produced by the SPSS software.
DISCUSSION
There is a lot of literature on group decision making. Some of this research has
indicated that this can be a complex event and error prone. Moreover, it is a
common task. Therefore, there is a clear motivation for finding suitable and
efficient methods to support group decision making. This chapter attempted to
evaluate one method of group decision support. Initially, a number of criteria for

Chapter 4 86 Facilitation
validation were put forward. Measures were chosen which reflected the
literature’s claims about the benefits of facilitation and the complications which
befall unsupported group work. Other indicators for validation were discussed. In
particular, the use of outcome as a measure of quality was addressed. This was
found to be unsuitable. However, a related approach, that of requisite decision
modelling, would make a valuable validation criterion.
The problems which are encountered by researchers attempting to investigate
group work have been highlighted. It is unlikely that any experiment could
properly represent group work and generate enough comparable data to evaluate
alternative support techniques. Two small experiments were outlined and
performed. The scenario under investigation, the decision making of a jury, is not
a traditional application area for decision support of any kind. Therefore, the
results which facilitation had shown thus far would not necessarily relate to this
environment. However, there was no reason to believe that a jury would not
manifest any of the dysfunctional aspects which are outlined in the literature.
Therefore, it was hypothesised that facilitation would have a measurable positive
impact on the group. The results which were collected were surprising.
Very few of the hypotheses showed that facilitation had a positive effect on the
groups’ working processes. However, the indicators did show an improvement
when it came to the subjects’ perceptions of their group. The facilitated groups in
the pilot study were more likely to feel that they could solve the problem, and
would be happy to do more group work with their particular group. The facilitator
had encouraged a ‘feel good’ factor. This is an important criterion for good group
work. Having a positive approach to problem solving may result in the fact that
the other dysfunctions do not arise. It may have been the case that the other
treatment groups would have begun to manifest these problems if they had worked
for longer. The main study indicated that the facilitated groups were more likely to
feel as though their members had endeavoured to concentrate on the task at hand
and tried keep discussion moving. Unfortunately, there was an unrealistic time
constraint which may have restricted the impact of this positive process. Given

Chapter 4 87 Facilitation
more time, some groups may have deteriorated if no-one had taken responsibility
for the discussion.
Further, there is another important benefit of a feeling of contentment within a
working group. If we consider implementation as a criterion for assessment then it
is much more likely that those groups who feel positive about their working and
the solution will be more committed to implementing it. The intangible ‘feel-
good’ factor related to the presence of the facilitator may have a tangible influence
in the long-term; it may prevent group breakdown occurring. Therefore, it is a
valuable commodity. I believe that this role should be explicitly addressed in
facilitator training programmes. In addition, it is likely that a facilitator will be
employed in situations where a group has ceased to function and cannot see a way
forward for resolving issues. Such a situation is likely to produce increased stress
levels amongst the key group members. Any intervention which could introduce a
‘feel-good’ factor into the group process is likely to generate improvements.
One possible cause of these results may be that the groups studied had no history
of conflict. It is possible that both the dysfunctional aspects of group work and the
benefits of facilitation are apparent only when a group has gone beyond some
boundary of good working practice. More research would have to be undertaken to
establish this. However, if this is the case then it is apparent that the subject area
of jury decision making may not actually benefit from decision support. Only
through applying alternative techniques to unusual scenarios will we be able to
establish how certain techniques benefit group decision making, and when these
techniques might be inappropriate. The group decision support techniques are
dynamic and responsive. Indeed, the view of the problem held by the DMs is also
ill-formed and changeable. Therefore, this approach can only ever show trends and
produce anecdotal evidence. As discussed above, there would never be enough
comparable data to allow a full analysis. However, it is likely that such
applications would generate knowledge about how and why specific group
decision support techniques work. Once again, there is a good argument for

Chapter 4 88 Facilitation
encouraging decision analysts to work with their techniques and DMs for mutual
gain.
Conclusions
Facilitation can provide a ‘feel-good’ factor amongst the group participants. This
is potentially important and an aspect which might be explicitly addressed when
training would-be facilitators. The fact that only this effect is apparent from the
experiments performed above may be an artefact of the unrealistic time constraint.
If left to their own devices, the unfacilitated groups who attempted the tasks may
have started to demonstrate dysfunction without this positive outlook.
It is unclear how valuable facilitation would be for groups with no history of
conflict. Certainly, such groups would not require all the skills of facilitation, for
example, in terms of mediation. It has been suggested that a group can cease to
function effectively once it has passed some boundary of civility and therefore
require some intervention in order to address its problems. However, juries are
unlikely to break down irrevocably and would not necessarily require a facilitator
in order to function properly.
It is likely that the DM’s view of the decision problem is unstable. Applications of
decision support must be dynamic to accommodate this. DMs will benefit from
gaining understanding about themselves in addition to a clearer view of the
problem they face.
Due to the dynamic nature of decision support, it is likely that such techniques
will evolve and adapt when applied to unusual settings. This may result in a more
powerful tool, or may simply demonstrate that a certain setting is inappropriate for
a particular support technique. There is a clear motivation for the use of scenario
setting. DMs can gain from using decision support techniques and analysts will
also learn more about their methods.
Due to the inconclusive results of this investigation of decision support, it might
be sensible to take a different approach to establishing the value of decision

Chapter 4 89 Facilitation
support. One possible method would be to run more realistic experiments, using
case study groups. I propose to observe group decision making and group decision
support in a less structured way. The value and usability of decision analysis and
decision support can be investigated through specific cases and any results
considered in a wider context. Therefore, the work of the next chapter will
examine decision analysis and decision support through hypothetical scenarios.
Case study groups will be established and the role of scenarios will be considered.
In addition, I will examine the scenarios themselves with respect to content and
use. This will require the identification of a number of ‘tricks of the trade’ and
devices to employ them. Reflecting on these hypothetical sessions will enable a
further examination of the value and usability of decision analysis and decision
support. Further, issues which surface will be identified to aid good practice with
respect to the use of decision analysis, support and hypothetical scenarios.

Chapter 5 91 Scenarios
Chapter 5 - Scenario Setting and Use
INTRODUCTION
Though I strongly advocate the use of decision analysis, it is clear that it is not a
panacea. Each of the earlier chapters has attempted to highlight sometimes
unrecognised pitfalls of decision support. In Chapter 2, I mooted that each
normative model has an implicit, yet undefined assumption of what a DM can
interpret, process and provide. Thus, a particular normative model may not be
appropriate to use with a particular type of DM. Further, I highlighted the
difference in the environment in which these models are used. MAVT can be used
intensively in a decision conferencing setting, whereas ELECTRE is applied over
a longer period of time, with the analyst working independently of the DM. This
may mean that certain normative models are more appropriate for specific
problem environments. In Chapter 3, I noted the dynamic nature of preference
values. This adds complexity to modelling a decision problem and establishing a
sensible solution. An analyst must recognise that the DM’s preferences are
evolving in response to their view of the problem. Therefore, as this view becomes
clearer, so their preferences become well formed. Further, I suggested in Chapter 4
that it was likely that the DM’s view of the problem was also evolving. As a DM
has a greater appreciation of the nature of the problem, and which aspects are
crucial, then further alternatives may present themselves as a solution. Thus, the
analyst’s role must be responsive and their approach flexible. This final concept is
one which will be further addressed in this and the final chapter.

Chapter 5 92 Scenarios
In addition to all the possible problems outlined in the previous chapters, and
others which have not been discussed, it is also important to consider the fact that
decision support techniques may be new to the DMs involved. Therefore, there is
an associated learning curve to be overcome, as with any new technology. Many
of the normative techniques require the DM to provide information which they
may find difficult to quantify, or are simply not used to giving and so ‘have never
thought about’. This does not mean, however, that they cannot provide the
information. For example, consider a consultation with a GP, where information is
requested which a patient may feel unable to provide. However, just because
patients cannot find an immediate satisfactory response does not mean that they
cannot answer the question. Rather, they need an opportunity to reflect on the
question to formulate an answer. In some cases, this may take a day or two. This
will allow the patient to get the measure of a symptom and to provide the GP with
an answer. This conflict generally arises because the GP and the patient approach
the problem differently, and so the information which the GP requires is not
necessarily uppermost in the patient’s mind.
Consequently, there is a clear motivation for practising decision analysis
techniques in order to encourage DMs to develop the necessary skills. Further, the
use of a safe environment, without the stress of time pressure, will allow the DMs
to be free to learn. This should enable DMs to appreciate the type of information
which is required. If the DMs are prepared for what they need to provide, then
they can spend more time contemplating and forming their preferences prior to
any real application. One of the aims of scenario setting is to encourage DMs to
adopt a new way of thinking which is more in line with decision support. In this
context, scenario setting and use refers to the development of a hypothetical
‘problem mess’ designed to interest and challenge a group of DMs. This
underlying story is then used to demonstrate ‘hands-on’ decision support
techniques. This work should be distinguished from scenario planning, which is
an approach whereby a group devise a range of possible future scenarios, and
assess how the group might work in order to achieve or avoid these futures
(Goodwin and Wright, 1991).

Chapter 5 93 Scenarios
I believe that hypothetical scenarios have an important role to play and will
demonstrate that in this chapter. This role is twofold, as evidenced in the
following case studies. Firstly, a hypothetical scenario is a learning tool for DMs.
It provides an opportunity to practise and develop particular skills which will
stand them in good stead for future decision problems. The second role which
hypothetical scenarios can play is concerned with developing an analyst’s
relationship with a group. This gives an analyst an opportunity to address
prescriptive analysis issues, putting research findings into practice, and also to
promote decision analysis and decision support within a wider audience. However,
Hall (1986) cautions against the use of hypothetical scenarios, claiming that
judgements are too ill-formed to give meaningful results. In recognition of Hall’s
comments, the scenario work done within this thesis concentrates on particular
aspects of addressing decision problems and does not attempt to use a full multi-
attribute analysis to solve the problem set out in the scenario. It should also be
noted that there is research which supports aspects of hypothetical scenario setting
(Frey 1997). The techniques outlined in this research form a major part in the
scenarios with which I have been involved. The elements which go together to
make a good scenario are described below.
This chapter will discuss how to build a scenario and some of the possible
elements which could be used to challenge DMs. These aspects are important to
use, but must be controlled in order to enable a DM to feel a sense of
achievement. This control can be achieved also via consideration of the
presentation of the scenario. Some aspects of scenario use will be discussed.
Initially an outline of the groups and their hypothetical problems is described.
Some comments on scenario building and scenario use in the light of these
examples is given. Further, some anecdotal evidence and observations from the
case study work are outlined. It would be inappropriate to claim that these findings
are evidence for the superiority of a particular way of working, especially in the
light of the discussions in Chapter 4 on group work and qualitative research.
However, these sessions did enable me, the other analysts and the delegates to

Chapter 5 94 Scenarios
learn a lot about group work. I am more aware of the power and role of decision
analysis as a result. A discussion of the work and some conclusions are presented.
SUMMARIES OF CASE STUDY GROUPS AND SCENARIO THEMES
Three very different types of scenarios were run during the course of the research
described in this thesis. Each involved quite different decision problems. The first
set of scenarios were linked to a large international research project (RODOS) and
took place in many different countries. The second set of scenarios were
performed as part of a course in risk communication run for the Department of
Health (DoH). However, some of these sessions were attended by delegates from
other government ministries, including the inter-departmental liaison group on
risk assessment (ILGRA). The final scenario was run as part of a workshop for the
16th bi-annual international conference on subjective probability, utility and
decision making (SPUDM ‘97). Consequently, this session had quite different
aims from the earlier sets of scenarios. Each of the three applications is described
more fully below. The similarities and differences are discussed and observations
pertinent to using scenarios are highlighted.
A full description of the SPUDM scenario is available in (French et al., 1998), the
DoH scenarios are included in an internal DoH document (French et al., 1997) and
the RODOS scenarios can be found in a series of reports to the European
Commission (French and Ehrhardt, 1994, Vanmarcke et al., 1995, Lepicard and
Schneider, 1996, French and Morrey, 1996, French, 1997). The outlines presented
below do demonstrate the evolution and learning which occurred with respect to
scenario elements and scenario use. In the earlier case studies, the problem
scenarios were built instinctively. It was not until the last scenario that identifiable
elements began to emerge. This area will be more fully addressed in the following
section.

Chapter 5 95 Scenarios
Study Group 1 - RODOS
RODOS is a real-time online decision support system to be used in the event of a
nuclear accident. It is an international project undertaken in reaction to the
Chernobyl incident. It aims to develop a joint response (cross border) to a
radiation leak. The project centres on a computer based system which
incorporates: a geographical information system describing the affected areas; a
dispersion and deposition model which is used in conjunction with meteorological
data to predict the movements of the radiation cloud; and a multi-criteria
modelling system to support the complex problem of identifying suitable
interventions. The system has been designed to support decision making
throughout all aspects of such a catastrophic event, from just before an initial leak
to strategy planning many years hence.
The hypothetical scenario which I attended took place in Germany with officials
from two neighbouring Länder (similar to our local government, but with more
authority). The aim of the analysts was to elicit preference weight information for
a number of criteria within their multi-criteria model. Further, it was an
opportunity for the DMs to see the prototype software tool in action. The problem
scenario involved a potential accident which might be avoided by a controlled
release of gases from the reactor. There was no immediate time pressure, in that
the group could decide when to make such a release and therefore put any
preparations in place effectively. However, it was not clear that a controlled
release would necessarily be the end of the emergency. Even with this
intervention, the build up of gases could continue, and the reactor could still
‘blow’. To further complicate the scenario, there was some doubt regarding the
weather conditions. If the prevailing wind were to change direction, then the
radiation cloud would be carried over a densely populated area as opposed to the
rural land currently expected. Therefore, the group were explicitly faced with an
uncertain environment.
In earlier work conducted in Norway, the scenario had been developed further.
This version of the problem had been constructed to lead the DMs into a particular

Chapter 5 96 Scenarios
intervention, that of sheltering the population and of distributing iodine tablets. As
the discussion progressed, and the group were reaching agreement on instituting
this solution, a ‘spanner’ was introduced. The delivery van which was transporting
the necessary medication became involved in an accident, and the iodine which
had been promised to the residents was not going to arrive. This new development
served many roles which we, as developers, began to appreciate much later.
Study Group 2 - DoH
The scenarios run with the DoH were specifically targeted at improving their risk
communication to the general public and how they might recognise and handle
potential health scares more sensibly. A number of scenarios were run, each based
around a different potential problem, and addressed by different groups from
(mainly) the DoH. At each event, we took the opportunity to introduce to the
delegates recent research findings on attitudes to risk, human judgement and
communication. Further, techniques which might help them plan a research
strategy and manage the risk were highlighted. It should be noted that, as we, the
analysts, worked through these sessions, we found ourselves adapting our
approach to better suit the needs of the group.
At the first workshop we presented the delegates with an emerging link between
domestic dogs and an incidence of meningitis infections. The disease had been
found mainly in the 9-16 year age group, and in small clusters around the country.
As the story progressed, various pieces of evidence began to link the infection to
certain dog kennels. Swabs taken from the dogs indicated that the disease had
crossed species and therefore the problem was ‘real’. This scenario tapped into
specific fright factors regarding an uncontrollable disease and the infection being
concentrated on children. Further, the link to pet dogs induced a feeling that
everyone was at risk. It added a threatening dimension to a pet which would
normally be regarded as harmless.
The second workshop could initially have been a scare or an emerging ‘real’
problem. However, the topic was one which was devised to precipitate much

Chapter 5 97 Scenarios
media hype, and a strong response from the general public. The problem began
with a number of cases of E-Coli reported from all across the UK. Initially, no
connection was identified. However, as the story unfolded and infections began to
lead to deaths, a source of the infection seems to emerge; all cases had come from
groups who had consumed the same brand of German Salami from the same
national supermarket chain. Whilst the supermarket reacted by removing the
product from the shelves, discussion moved to where the contamination was
entering the system - either at the UK based packing centre, or the German based
manufacturer. The media carried articles blaming the German hygiene standards
and revisited anti-European feeling and BSE arguments. This scenario was
interesting in that it was unclear for a long time whether the cause of the cases was
‘real’. Further, the reaction of the press and public to an age old rivalry magnified
the DoH’s task unecessarily and uncontrollably.
The third scenario was based around the damage which could be done by an
overactive media response to a vociferous scientist. The story suggested a link
between skin cancer and sweet wrappers. The scenario began with a high
incidence of factory workers suffering from skin cancer. This was due mainly to
them not following general health and safety practice guidelines when dealing
with the product, in this case an adhesive. The scenario developed when an
industrial chemist, who used to work at the site, went to the media claiming that
there was a danger from the adhesive which was used in chocolate bar wrappers.
He suggested that an ingredient in the chocolate was likely to interact with the
adhesive and induce a cancer risk in the consumer. The delegates who took part in
this problem had to respond to what to them was obviously ridiculous, but to the
media and therefore much of the public, was causing concern. This was clearly an
exercise in communication.
A further scenario addressed an aspect of competing risks. A well conducted piece
of academic research had uncovered a link between a widely used spermicide,
present in 90% of condoms, and prostate cancer amongst men. The research had
been reviewed by a colleague from another institution, and the results verified.

Chapter 5 98 Scenarios
The DoH lost control of announcing the story, due to a young researcher from the
team who refused to honour the confidentiality agreement. Therefore, in the short-
term at least, the DoH had to try and encourage condom users to continue in their
normal practices, whilst acknowledging the risks they were taking. Of course, the
issue of HIV became paramount, in addition to other sexually transmitted diseases
and unwanted pregnancies. Further, the media and politicians became embroiled
in discussions of ‘the family’, promiscuity and religious observance.
The final scenario combined an aspect which the DoH would like to encourage,
with some findings from which they would wish to distance themselves. This
created a complex problem for the delegates when they had to make their press
statements. Initially, a national supermarket chain had extended its loyalty card
scheme to incorporate a ‘health and well-being’ survey. Customers were keeping
health diaries which they gave to the supermarket in exchange for entry into a
monthly prize draw. Further, the supermarket chain was distributing information
about healthy living and eating to encourage good practice amongst those taking
part. Unfortunately, the supermarket employed an inappropriate group to perform
data analysis on the health diaries. The research was more akin to data mining
than statistical investigation. The survey produced unrealistic claims which again
were repeated within the media. The results suggested a link between poor health
and flight paths. The suggestion was that germs were being carried on the
underside of planes, and deposited on homes. This scenario incorporated an
interesting aspect in that it would be difficult for the DoH to anticipate the
reaction to research generated in such a novel environment.
Study Group 3 - SPUDM
The SPUDM session was very different from the earlier events. In particular, this
session was aimed at comparing the modelling approaches of alternative
normative decision approaches. As was highlighted earlier, decision analysts can
learn from the use of hypothetical scenarios. In this case, the session was
specifically designed so that analysts might better understand different approaches
to decision support. Initially, Simon French and myself tried to enlist decision

Chapter 5 99 Scenarios
analysts from different schools of thought. However, we were unable to get a
representative of the European School to take part. Therefore, the three analysts
who were involved all had a basis in multi-attribute approaches. The analysts were
each presented with a DM who had the same decision problem. The analyst had
two hours in which to attempt to scope the problem and begin to construct a
model. Each analyst was observed by two official observers who made notes on
the analyst’s technique and approach and this information was fed back to a
plenary session two days later. All parties had the opportunity to speak at the
plenary session. The analysts were invited to describe what they had been
attempting to do, where they would have gone next, and what if anything they felt
they had not achieved. Also, the DMs were invited to contribute to the discussion.
The scenario itself was in the form of a ‘problem mess’. Each group had a
different level of briefing on the problem. The DMs had a wide knowledge
concerning the issues. They were all lecturing staff within the School of Computer
Studies, and thus shared a common context. The scenario was related to a real
problem, but had been expanded with some extra hypothetical aspects. It
concerned tea and coffee provision for members of staff and research postgraduate
students. The need to revise the current system had been precipitated by the
impending closure of a university run coffee bar which served many of the staff
members. Further, an argument between a senior member of staff and a volunteer
who organised coffee provision and subscriptions occurred which led to the coffee
committee resigning en bloc.
Underlying this seemingly trivial problem were some very complicating issues.
One was based around tax law and provision of benefits to staff which dictated the
nature of what the School could and could not do. Heated discussions had
emerged from the undergraduates and taught postgraduates with respect to the
School providing them with a similar facility. The School is not contiguous in
nature, and therefore provision of a ‘common room’ has always been difficult.
Interaction, both social and academic, within the School had been in decline with
the increasing staff workloads, and was something which the Head of School

Chapter 5 100 Scenarios
would like to address. In addition, arguments had emerged about the use of the
microwave to reheat pungent food, and the purchase of ethically unsound
products.
The decision analysts and observers were aware that the DMs were interested in
examining the provision of tea and coffee to the members of staff. However, they
were not aware of the issues rumbling in the background. The DMs were briefed
on the problem, which was discussed with Simon French and myself. However,
we were quite careful not to begin leading them towards establishing the critical
issues or finding possible solutions. This would be the role of the analysts.
It is clear that there is great variety in the hypothetical scenario work which was
carried out. This, coupled with the fact that our objectives, as analysts, did not
include an appreciation of how to build a scenario, may have contributed to the
fact that we did not initially reflect on the building process. Indeed, the success of
this work may have been based heavily on our ability to be flexible during the
scenario runs, facing problems as they arose. Therefore, the next two sections will
cover aspects which I consider to be pertinent to the development and use of
scenarios.
SCENARIO BUILDING
The value of case studies to illustrate theories has long been accepted. Further, the
use of case studies in education has a clear role (Easton, 1982). The use of an
application can bring any theory to life, providing specific examples of concepts
and solution methods. Further, the use of theories in the real world can help
models to develop, becoming better reflections of their subjects. However, the use
of a hypothetical scenario is a rarely addressed issue. With claims from academics
that use of hypothetical events is of dubious worth (Hall, 1986), little work exists
on the study of scenario building. Further, research which does use hypothetical
problems is more concerned with reporting on the nature of the decision process
and solutions, rather than on the development of the scenario itself. Similarly, the
findings reported in this thesis evolved from piecing together work which had

Chapter 5 101 Scenarios
been conducted over a period of years. Much of the content of the scenarios
outlined above was chosen instinctively. The process of building the scenarios was
not analysed originally. Rather we worked alone, for example, when I developed
the scenario used in Chapter 4, or in groups, in the case of the DoH scenarios,
brainstorming issues and complications, arguments and concerns. Latterly, I have
reflected upon the nature of the work which was undertaken, and reflected upon
how it was achieved. Further, in addition to identifying aspects existing within the
scenarios which were developed, I would also contest the view that studying a
hypothetical problem is not valuable. Scenarios can have an important role to play.
Their value as a teaching and learning tool, for all who participate, will be
discussed.
As with any activity, when constructing a scenario, it is important to keep a clear
perspective on the purpose of the exercise. Only by acknowledging the aims of the
exercise can a suitable scenario be constructed. As has been stressed earlier, these
aims should be from the perspectives of both the DMs and the decision analysts.
Any possible conflicting issues which arise from consideration of these two
perspectives should be discussed with the group, and a compromise reached. If the
DMs can see the benefits of a certain course of action then they may be willing to
push themselves to achieve it.
Further, it is also crucial to consider the expertise and background of the intended
‘players’. The scenario must be as realistic as possible for those taking part. To be
useful, judgements must always be elicited within as realistic a context as possible
(Keeney, 1992). You cannot expect the DMs to suspend their disbelief. Such
actions are only likely to foster the attitude that they are taking part in a ‘game’
and therefore need not take the session seriously. Realism was achieved in all the
scenarios outlined above. The relevant DMs were used, and realistic problems,
which they could relate to, were developed. This aspect was missing from the
scenarios used in Chapter 4, however, and could have been influential in the
inconclusive results.

Chapter 5 102 Scenarios
There is a fine line between establishing a challenging scenario for the DMs and
presenting them with something which they cannot hope to address. The latter
approach is likely to deflate the DMs and leave them thinking that they could
never hope to address the problem. There needs to be a balance of complexity
between interest, in order that the DMs take part, and attemptability, in order not
to leave the group feeling like failures.
Below, I have outlined some elements which have been used in the construction of
hypothetical scenarios. These elements have been used to establish the realism and
complexity which is so important to scenario setting. Realism and complexity can
be established by introducing uncertainty into a scenario. Historically, uncertainty
is the root of the difficulty which DMs have with solving problems. In addition to
groups having to address the different individual attitudes to what size of risk is
acceptable, the computation of probability is not necessarily an intuitive concept,
and therefore, one which DMs may find confusing. The methods outlined below
introduce uncertainty, some are more explicit than others, but all achieve the same
outcome. It is crucial to encourage DMs to face up to any uncertainty surrounding
their problem, and identify whether they can influence the outcome in any way.
Further, if the group has worked through possible bad outcomes, then they may be
able to plan a sensible course of action for a worst case future. However, if this
option is not considered, the group is likely to adopt an inappropriate response if a
worse case future occurs because no planning or recognition has occurred.
The Uncontrollable Factor
It is often the case, in a real-life situation, that a decision problem will contain an
element which is out of the immediate control of the DMs. For example, there
may be a person whose actions cannot be predicted, like the errant scientists
appearing in two of the DoH scenarios, or the group may be unsure about how a
particular uncertainty will resolve itself, for example, the wind direction in the
RODOS work. The DMs may have an idea of the potential range of outcomes
which could occur. If the group are not encouraged to face up to the uncertainty
and risk surrounding the problem, then the individuals are likely to be worrying

Chapter 5 103 Scenarios
about it and therefore not concentrating their minds on the issues which are being
addressed. Uncertainty is impossible to ignore forever, and can become
destructive. Explicit consideration of the uncertainty surrounding the problem, and
the development of a range of possible futures (Goodwin and Wright, 1991) will
enable the group to find a range of strategies which could be implemented. This
should allow the group to use robustness analysis (Hannan, 1992) in order to plan
a course of action which is likely to be the best under a number of possible
eventualities.
The Unforeseen Event
One very powerful tool for use in hypothetical scenarios is an unforeseen event.
The impact of this element can be varied depending upon how influential the
event is, and at what point it is introduced. Clearly, the event may be so important
as to require that the group begin modelling again, or it could merely be something
which generates further interest and encourages the group to reflect on their view
thus far. To create a big impact, an unforeseen event can be added at a time when
the group seem to be finally reaching a solution, in the example of the transport
accident preventing the delivery of the iodine supplies. The unexpected media
stance which was employed in some DoH scenarios simply generated an
interesting discussion for the groups. Again, this element must be used carefully
and not make the group feel victimised. Further, it is an element which the analyst
can decide to make use of in response to how the group is working.
The Red Herring
Sometimes an element which has preoccupied a problem solving session
eventually comes to nothing. It is in fact a red herring. A red herring can be
defined as anything which diverts attention from a topic or line of inquiry. There
are two issues to consider here:
1. A problem element which may or may not be important,
2. A problem element which is not important.

Chapter 5 104 Scenarios
Firstly, it is impossible to always predict with certainty whether specific elements
of a problem will develop as important issues in the decision. The use of scenarios
may help a group to keep all elements alive, so as to not miss crucial information,
whilst training them to be mindful of becoming pre-occupied by a possible
irrelevant element. For example, we have used a possible cancer link with
chocolate bars and supposed flight path viruses in the DoH work. Both of these
issues eventually turned out to be bogus, but the implications of ignoring them
altogether could have been devastating had the links been real. Although these
were built into our scenarios, other lesser elements were also noticed by the
delegates. Information which was provided on the periphery, simply to make the
scenario more believable, could sometimes be taken up by the DMs. For example,
in the adhesives scenario, the DoH DMs spent sometime discussing the earlier
skin cancer issue affecting the workers at the factory. Further, elements which we
believed would cause problems were ignored by the DMs. In the case of the
SPUDM work, the developers expected there to be a large discussion about the
possible boycott of particular coffee manufacturers with counter claims that such
manufacturers were the only ones who made coffee worth drinking. However,
none of the three DMs touched on this possible problem.
Secondly, though this may sound unlikely, groups can quite easily fall prey to an
element which is not important. When a group is faced with a complex problem,
the DMs may latch onto an element which they can all appreciate and predict. This
allows them to talk with knowledge and certainty. It is an avoidance strategy
which, if not addressed, will lead to time wasting and result in group dysfunction
(Forsyth, 1983). It was pleasing to note that this particular diversionary tactic did
not occur in any of the scenarios in which I was involved.
SCENARIO USE
In addition to the scenario elements highlighted above, the decision analyst can
make use of a variety of delivery techniques when using scenarios. This gives the
analyst a further opportunity to control the session, and to ensure that each of the

Chapter 5 105 Scenarios
group members feel involved. Recall the findings outlined in Chapter 4 which
cause group dysfunction (page 60) in addition to the emerging importance of a
‘feel-good’ factor (page 75). Any tools which the analyst can use to prevent a
breakdown of the group will be of benefit. Further, the introduction of variety in
the decision making session will ensure that the event remains of interest to
participants, encouraging them to take part. The techniques described below were
used widely in the DoH sessions.
A more elusive element which encourages a sense of realism amongst the DMs
comes from the attitude of the analyst or group of analysts who are running the
session. This is a problematic issue. On the one hand, the analysts should role play
the scenario with the DMs, whilst on the other, the analysts may wish to educate
the DMs on decision analysis tools, or pertinent evidence. Again a balance must
be struck between gaining benefit from the scenario and gaining benefit from
appreciating the methods. This level can only be established by the analysts in
response to the nature of each specific group and their level of appreciation of the
tools.
Breakout Groups
Breakout groups are achieved simply by splitting a large group into a number of
smaller groups. These smaller groups will then work independently on a problem
and report their results in a plenary session. The groups may work on the same
aspect of the scenario, or different aspects, depending upon the scenario. This
technique is a valuable way of ensuring that all DMs can take an active part in the
session. Further, different approaches to solving the problem are often generated
and explored when a large group is split into breakout groups. This is an aspect
which Frey (1997) identifies as a technique which may prevent a group from
falling foul of the groupthink phenomenon. It is important to have separate
accommodation for each group in order for this technique to work. Also, the
system will benefit from having a timekeeper responsible for calling each group
back to the main session.

Chapter 5 106 Scenarios
This technique was not used in the RODOS work, and consequently those sessions
may have suffered. The tool was introduced for the DoH scenarios, and generated
many different ideas which would have been unlikely to arise from one large
group discussion. The SPUDM scenario was essentially based around a breakout
group approach, with the three modelling sessions taking place at once in separate
rooms, and a plenary session addressing the work of all three groups.
Development of Possible Outcomes
Another strategy highlighted as a way to avoid groupthink is the discussion of
worst and best case future outcomes (Frey, 1997) i.e. scenario planning. This is a
technique which we employed, often in conjunction with breakout groups, in the
DoH scenarios. The DMs were taken about half way through the hypothetical
scenario and were then encouraged to reflect on their current and future situations.
This was achieved by asking them to develop more than one worst case outcome
in addition to a best case. The value of this approach lies in considering what
chain of events might lead to each future happening, and identifying what the
DMs can do to avoid or encourage a particular outcome. Reflecting on these issues
helps the group to channel their efforts towards the most productive activities.
Also, by voicing their concerns early on, the DMs are able to concentrate their
minds on avoidance strategies. It is interesting to note that, in developing two
worst case futures, a pattern emerged from the DoH delegates. In general, two
fears became apparent: the first worst future concerned a chain of events which
were out of their control and had devastating consequences; whereas, the second
worst outcome was based around a catalogue of errors, bad judgement and
misinformation from DoH staff leaving the blame for any outcome quite firmly at
their door.
I do, and I understand
In order to encourage the groups to use what they have learned it is important to
provide the group with an opportunity to apply the new knowledge during the
scenario. Such an approach allows DMs to see if they have properly understood a

Chapter 5 107 Scenarios
concept by applying the idea. Further, it encourages them to confront their ‘bad
habits’ with the support of the analysts. Scenarios offer many other opportunities
for learning. Another strategy to avoid groupthink was the development of an error
culture (Frey, 1997). The use of a group facilitates the sharing of experiences
which in turn should engender learning from errors. By making use of formal
decision analysis, a group can ensure that an audit trail exists explaining how each
decision was reached. This will allow feedback to be given, which has been
identified as a key tool to improve human judgement (c.f. Murphy and Winkler,
1974 with Christensen-Szalanski and Bushyhead, 1981).
This approach was central to the RODOS scenario with the presentation of the
prototype software tool. The DMs were encouraged to use and comment on the
tool whose basis was a decision analysis approach. Further, this method was
employed in many forms during the DoH scenarios. The DMs were introduced to
stakeholder and uncertainty representations of problems, and were then expected
to construct their own versions for the problem at hand. Further, they were
encouraged to write press releases after a discussion on risk communication
issues. The final SPUDM work was devoted to this delivery issue. The aims were
to appreciate what differences, if any, existed between alternative approaches to
decision modelling. This was to be achieved by performing modelling tasks based
on each approach.
A final observation with respect to scenario setting is the recycling issue. It is
important to tailor a scenario to the particular group, and to the specific aims of
the event. Further, it is important that the analysts are not totally aware of where
the group will take the scenario. One way of encouraging the influence of the
analyst on the aspect of realism is to ensure that the analyst is kept interested and
cannot predict the outcome. The use of scenarios provides an opportunity for both
analysts and DMs to learn.

Chapter 5 108 Scenarios
OBSERVATIONS FROM APPLIED WORK
Study Group 1 - RODOS
It became clear, during the course of the RODOS scenario, that the group was not
working as the analysts had hoped. The aim of the analysts was to establish
criteria weights. The aims of the DMs had not been established. There were a few
reasons which precipitated this malfunction:
• A reluctance to face up to the uncertainty.
• A preoccupation with the software tool.
• A lack of direction with respect to the aim of the exercise.
From the outset, the DMs found it virtually impossible to work with the
uncertainty which had been built into the scenario. I was very surprised at this
attitude, especially given the formal position of the group members. However, it
appeared that their attitude to risk was either defined in the policy books or was
treated as unacceptable. When the group were faced with things which they were
unable to ‘look-up’, they refused to interpret their earlier actions in order to assess
whether a risk was acceptable. This made it hard for the analysts to run the
scenario as they had expected. Unfortunately, the group was able to avoid this
issue and therefore did not fully benefit from the scenario. However, the analysts
involved were able to use the experience to reflect on the group’s avoidance
strategies and develop methods to combat these. For example, in later RODOS
scenarios, the participants were discouraged from bringing any documentation
with them. Further, when a group began to treat a possibility as a certainty, the
implications of inducing perhaps unnecessary costs would be highlighted to them.
The group was able to avoid the complexities of the scenario by asking questions
about how the software tool worked, and requesting that alternative interventions
be demonstrated. In the analysts’ desire to introduce the tool to the DMs, they
allowed themselves to be sidetracked. This strategy further enabled the group to
avoid the risk and uncertainty elements in the scenario. This is a lesson with

Chapter 5 109 Scenarios
regard to setting clear aims for the scenario session and examining whether these
aims can be achieved simultaneously. Clearly, in this case, a separate session
should have been set aside to introduce the software tool to the participants.
Obviously, if the group were now expected to use the software in a genuine
emergency, then familiarisation has been achieved. However, it is clear that the
software produced a diversion. Again, this is a good argument for the practice of
decision analysis and decision support in a safe environment, to allow a group to
become accustomed to the technology. The group would be unlikely to become
sidetracked in a real emergency situation, rather, they would simply not make use
of the tool.
The analysts had not clearly explained the aims of the session to the participants.
As such, the participants were nervous about making errors of judgement, even in
the hypothetical situation. Further, because of this fear, the group found it difficult
to address even the most basic of issues. Hence, the analysts did not achieve their
aims of eliciting criteria weights from the group. This situation should have been
resolved by a clearer communication of the aims of the event. This should have
been reiterated during the two day scenario when it became apparent that the
session was not on course.
Overall the RODOS project has been very successful. In addition to the
development of a dedicated software tool, the use of these scenarios has been
critical in encouraging communication. Not only has this occurred within specific
countries, but also between member states and bordering countries. As often
happens when decision analysis is involved, an aim which was not made explicit
at the outset, but which is crucial to the workings of a group, is identified and
achieved. This is an often overlooked role of decision analysis.
Study Group 2 - DoH
Having learned lessons from previous scenario work, it was pleasing to note that
the DoH sessions were very successful on the whole. Further, a good balance was
struck between enacting the scenario and delivering information and instruction

Chapter 5 110 Scenarios
on key decision research. However, areas were identified where improvement
could take place.
A key element which was absent from all the scenarios which we ran was the
independent setting of objectives by the DMs. During the initial scenario, this was
not catered for. However, once this was identified as an element which needed
underlining, the groups were encouraged to construct objectives based on
scenarios which they had developed. Here is an example of a group of analysts
mistakenly assuming that basic structure principles would be applied by a group of
DMs. It is important that the analysts running decision support can adapt their
approach in order to bring their delivery to an appropriate level for the group.
Further, the analysts need to communicate the value of using such tools to the
group in order that they incorporate the technique into their own approach.
This factor was further highlighted in one of the tasks organised for the end of the
scenario session. The group was issued with a press release which contained some
errors when viewed in the light of the day’s presentations. The group was asked to
rewrite this release and to apply the knowledge they had gained. The analysts felt
it necessary to challenge the group’s ‘everyday’ activities to break the bad habits.
However, each of the groups quickly fell into their own way of working and
neglected the new found skills. This was a worrying event for the analysts. It is
clear that to encourage a new way of working will take more than a day.
On reflection, it is likely that the tasks with which members of the group have the
most difficulty will be the ones they consider for application of decision analysis.
It is probable that in the DoH scenarios, once this support had been provided to
guide the group through the complexity, they were content to ‘take charge’ of the
situation again. That is, the group felt able to compose a press release without
reflecting on decision support and risk communication issues. Hopefully, if
decision analysis has been used earlier in the process, then the events will have
been handled well and the actual wording of a press release may not need such
close attention.

Chapter 5 111 Scenarios
Study Group 3 - SPUDM
The first aspect of interest in the SPUDM work was that each of the analysts, and
some of the observers, were quite convinced that there was more to the problem
than they were initially led to believe. They were suspicious and felt that there was
some attempt to catch them out. This is probably a learned behaviour. Decision
analysts often have to deal with some aspect which is far and away the most
crucial factor, and yet one which is never vocalised by the DMs involved. This
may be because the DMs have not recognised the issue, but more often is due to
the DMs being unable to discuss it openly. This could be as a result of not wanting
to criticise senior colleagues, or simply that they are not prepared to address the
issue once it has been raised. Therefore, though we had not expected this reaction
from the analysts, it was a good indication of how they had each developed their
approach to address such an issue. There is clearly a role emerging for decision
analysis in encouraging and supporting groups to face up to the more fundamental
problems which they face.
The next observation was the apparent differences in the methods of the analysts.
These differences did not arise because of the variety of the underlying
mathematical models, but were due to the different aims of each analyst. For one
analyst, the criteria for a successful modelling session was to elicit preference
values. Thus, he put a lot of pressure on the DM concerned to give information
which the DM felt too unreliable to use. However, for another analyst, the criteria
for success were somewhat different. He was markedly different, in that he did not
take the analysis far enough for the DM. He simply constructed a pros and cons
table, leaving the DM feeling that he had had little assistance. Finally, the third
analyst worked at a level between these two. She queried and questioned the DM
in order to establish stakeholders and criteria. She helped the DM to structure his
problem. Although they did not solve the problem, they had worked towards a
much clearer understanding.
In their reflections, each of the analysts stated how they would normally explain to
the DM involved how they intended to work. It was interesting to note that none

Chapter 5 112 Scenarios
of them explicitly stated that they would try and establish what were the DM’s
aims for the session. Drawing on the three sessions which we conducted, each of
the DMs had a very different experience. One of them was particularly ‘resistive’
of the approach. He had quite a different experience to the two other DMs
involved and had not expected to be pushed quite so hard. Conversely, one of the
other DMs did not feel that he had been given much guidance by the end of the
session. Therefore, success may be measured differently by different analysts, and
differently again by different DMs. The key to a successful decision support
session would be to assess what the DM is expecting to gain from the event, and
then to temper this with the analyst’s expert knowledge in addition to emerging
issues. Clearly, a DM who believes that they can transfer the responsibility for
decision making onto the analyst needs to be confronted.
Hence, we again try to address the question of whether decision analysts can
successfully apply decision support. Further evidence for a dependence upon
whose criteria are used has been found. Another issue arises, that of whether DMs
know their aims and therefore their own criteria for a successful session. I suggest
that this must be a role of the analysis. Ideally, the identification of objectives and
criteria should be a combination of the two views, with input from the DM and the
decision analyst. It is important to share experiences to enable feedback and
learning. Therefore, a collaboration between DM and decision analyst should have
value for both parties.
As a final comment on the SPUDM scenario, it is nice to be able to highlight that
this work generated a lot of interest, and was illuminating. Each of the six
observers managed to see different aspects arising from the modelling sessions
(French et al., 1998). Some of these comments reflect the importance of a ‘feel-
good’ factor in that they describe sessions as being “relaxed……allowing him [the
DM] to speak freely” and specify the role of the analyst as a “confidante”. Other
comments allude to the possible existence of a larger underlying problem which
the DMs were not prepared to confront. Finally, some comments criticise the
inflexible nature of an analyst’s approach in that key features of the problem to

Chapter 5 113 Scenarios
which the DM kept referring were not included. The reason for this absence is that
the aspects could not be modelled by the analyst’s preferred tool. These comments
confirm the importance of the existence of specific findings on group work and
facilitation discussed in Chapter 4.
DISCUSSION
This chapter has presented advice on the use of hypothetical scenarios. I have
suggested that scenarios have a key role to play in encouraging the wider use of
decision analysis. Not only do DMs need to get to grips with a new technology,
but issues such as setting objectives for a decision support session and learning to
face up to risk and uncertainty need to be supported. Further, a decision analysis
session may uncover a wider, more fundamental issue. If the group can find the
courage to address this aspect, then the decision support session is likely to have
been invaluable.
There are considerations which must be taken into account, both in writing and
using a scenario. Further, there are two parties involved in running a scenario, the
analysts and the DMs. The influence of both groups must be considered. When
writing a scenario, the analyst should incorporate elements to challenge the group
and to encourage them to reflect on all outcomes. Groups should be coaxed into
identifying actions they can take, and what influences these might have. When
using the scenario, the analyst must be flexible. The ability of the group may
require an adaptation of the approach in order to keep the session on track. A key
issue is communication between the analyst and the DMs. Both will have
objectives for the session, and these should be identified in order that the session
is a success. It is likely that the DMs will need support in stating objectives, and it
is the responsibility of the analyst to address this. Further, the analyst will set the
tone for the whole event, and as such needs to find the particular scenario
interesting in order to motivate the group.
Through the scenarios used during the course of the research reported in this
thesis, I have found that they provide an ideal opportunity to pass on pertinent

Chapter 5 114 Scenarios
research information. Further, the analyst needs to be ever alert, and cannot
necessarily assume or predict how an event is likely to proceed. Therefore, a
flexible approach must be applied. In considering evaluation and validation of the
scenario, it is clear that the criteria used by a DM is different to that for a decision
analyst. In order that these differences be addressed, the analyst must establish
what the DMs’ requirements are at the outset. Further, they should communicate
their intended approach in order that the DMs can appreciate the whole session.
Finally, decision analysts can benefit from hypothetical scenarios, learning
valuable information about how a group functions and enabling them to practise
working with different types of group.
Conclusions
Taking part in decision analysis will allow DMs to adapt their way of thinking.
Hypothetical scenarios facilitate this in a safe environment, free from the pressure
of a real event. In addition, scenario setting is a potential way to provide DMs
with information about the nature of human judgement and their likely reaction to
information. If groups work together to model hypothetical problems, it will
enable a facilitator to observe the group process. This may provide vital
information to be used at a time of real crisis. Scenario setting should enable both
DMs and decision analyst to learn.
There may be many elements to a scenario, both with respect to content and use,
which can make it seem more realistic in the eyes of the DM. These elements
should be used sensibly and in good proportion. The ‘feel-good’ factor identified
in Chapter 4 can play an important role. The session should be of value to the
DMs in order that they choose to use the techniques again.
It may be an analyst’s opinion that the session has been of great value to the DM,
whilst the DM may have left feeling overwhelmed and beaten. It is the
responsibility of an analyst to help a DM establish sensible objectives for a
decision analysis session and also to communicate to the DM how the analyst
plans to conduct the session. Decision analysis may identify unexpressed issues or

Chapter 5 115 Scenarios
fundamental problems. Further, it can then give a group of DMs support to enable
them to address these issues in a structured and sensible manner.
Finally, then, we have a broad view of the nature of decision analysis and decision
support. Whilst all aspects under investigation in this thesis were not performed
systematically by the same individuals, there is still evidence to support the
premise that decision analyses can be performed, and that decision support does
have a positive impact. This thesis has examined a cross-section of these tools and
approaches. Early work concentrated on the use of analysis to solve decision
problems and gave positive results. Later work considered decision support in its
role to formulate problems via promoting group functioning and consideration of
objectives.
There remain many other aspects of decision analysis and decision support which
might have been considered. It is apparent that decision analysis and decision
support demands a wide range of skills and a good knowledge of many
disciplines. Consequently, the evaluation and validation of decision analysis and
decision support requires measures on many aspects. In addition, this work may
involve many agents, and therefore conflicting views on what is and is not
appropriate. The findings of the whole of this thesis are discussed in the next
chapter. Decision analysis and decision support have a clear role and future which
should be promoted.

Chapter 6 116 Conclusion
Chapter 6 - Discussion and Conclusion
INTRODUCTION
Many aspects of decision analysis and decision support have been considered in
this thesis. This has enabled me to acquire a broad overview of the area, and
therefore gain insight into some issues which may be overlooked by an
investigation which specialises in just one aspect. I have been able to follow the
subject from its groundings in competing mathematical models; to investigate the
building blocks required to operationalise such models; to consider applications of
the data to existing evaluation attempts; to look towards supporting groups of
DMs; and finally to attempt the use of hypothetical scenarios in order to encourage
DMs to adopt a decision analysis approach.
Often, a decision problem will involve many competing objectives, uncertainties
which must be addressed and added pressure from potential catastrophic
consequences and tight time constraints. It can take a long time to disentangle this
information in order to build a representative model of the decision problem. In
addition to this, I have considered the fact that a DM may have ill-defined
preferences, and an evolving view of the problem. This means that the modelling
must be fluid to address the dynamic environment. Further, the use of groups to
solve problems adds complexity. Any group decision support tool must
additionally establish consensus and encourage proper communication between
group members. One emerging aspect has been that decision analysts are often
faced with excavating a hidden problem, which if not addressed, will defeat any

Chapter 6 117 Conclusion
attempt to resolve the issue at hand. There are many reasons why such an issue
may remain unstated. Inevitably, this increases the difficulty of an analyst’s job.
The role of the analyst is multifarious. Clearly, the analyst must be an expert in the
decision modelling tool, but this is not sufficient to describe their role. An analyst
must attend to much more in order to ensure the success of a decision support
session. It is the responsibility of the analyst to communicate their approach to the
DMs and to ensure that the DMs appreciate it and adhere to it. Further, the analyst
must support the DMs in establishing their own objectives for the session and
guide them to achieve these objectives. To ensure this, the analyst must fulfill two
roles:
• support the building and development of sensible preferences and problem
solutions;
• establish hidden issues which are at the nub of the problem and which will
become increasingly detrimental to the groups’ ability to address the problem
at hand.
Once these aspects are recognised and accepted by the group, the analyst must
then help the group to develop coping strategies. Finally, the analyst must achieve
all this whilst engendering a ‘feel-good’ factor amongst the group members. The
DMs need to feel able to apply the methods and deal with the consequences of a
decision analysis approach.
Given all these issues, it seems that decision analysis and decision support is an
impossible task. Why then am I advocating its use?
I have discussed in Chapter 2 that mathematical models exist which, with the
correct problem formulation, can provide recommendations. These models were
considered, not only on the basis of the assumptions they make about a DM, but
also with respect to whether a DM could happily make use of them. I have
suggested that this is so. Loose criteria were suggested against which a decision
analysis might be measured. Whilst I was reluctant to say that either model in the

Chapter 6 118 Conclusion
chapter was better than the other, there was some indication that one performed
better on the suggested criteria. It is not my intention to suggest replacement of
one method with another, but rather to investigate all methods thoroughly in order
to be aware of the shortfalls of each. This will enable analysts to ensure that
findings are tempered where necessary. In addition, rather than attempting to find
the model which performs best overall on agreed criteria, we should be concerned
with the elements within models which DMs like. This way we, the proposers of
the models, can work towards a tool which implements the best parts of each of
these techniques.
Chapter 3 confirmed that a DM could be capable of providing the necessary inputs
to operationalise a decision analysis model. That is, DMs may be able to state
preferences for outcomes. Clearly, there are caveats to this suggestion and much
consideration was given to the nature of preference data. However, the added
insight which preference data provide confirms that their use should continue.
There is little value in only part solving a problem, and then stating that the
solution depends upon what priorities would be set. In order to stop these sorts of
results pervading, certain questions need to be addressed. The nature of preference
data should be further considered. In particular, the role which familiarity has to
play should be addressed, in addition to an examination of how stable the data
might be. At a group level, one must consider aggregation of these data.
Moreover, the question of whose values count must also be addressed so that any
provided solutions will be acceptable.
Given that the early work in the thesis was considered from the point of a
formulated problem, we needed to take a step back and look at how we might
achieve this stage. The work of Chapter 4 considered supporting a group
discussion and group decision making process. In particular, the technique of
facilitation was measured against specific criteria. The findings were less
conclusive, but did demonstrate groups successfully working together to address a
complex decision problem. Facilitation may aid this process. Further work could
be done to measure the impact of facilitation, however, this is unlikely to be as

Chapter 6 119 Conclusion
systematic as was attempted by this thesis. Suggested methods for examining the
impact of decision analysis and decision support are discussed below. What is
clear, is that that as researchers we may have to move away from the ‘scientific’,
systematic approach and look more towards unique, yet real applications for
evidence that decision support has value.
Working with groups to perform decision support was further investigated in
Chapter 5. In addition, this work considered the setting of hypothetical scenarios.
Case study work was described. Chapter 5 concludes that the use of scenarios
should be encouraged. They are a good training vehicle for both DMs and decision
analysts. Having discussed the findings that feedback can improve judgement, one
might also consider that reflecting on previous decisions and their outcomes will
enable DMs to improve their decision making skills. More work could be done to
establish additional scenario elements and further ways to employ these. In
addition, a wider breadth of group objectives might also provide new areas for
scenarios to consider.
Looking more broadly at the role which decision analysis and decision support can
play, this thesis has had many positive findings. Aside from purely finding a
solution to a decision problem, decision analysis and decision support can provide
many services.
THE POWER AND ROLE OF DECISION ANALYSIS.
Decision analysis takes its powerful position not just from the wide applicability
of the techniques, nor from its validity over economics approaches (Sutton and
Simpson, 1997). It is powerful because it can offer so much more than was asked.
For example, companies or ministries are prepared to invite a decision analyst or
decision support team to help them consider a specific strategic issue. Once there,
the decision analyst is in a very strong position to address much more fundamental
problems which may be entrenched in the group’s working practices. It is the
illusion that the group are not admitting to bad management which allows them to
take on board comments and recommendations from an uninvolved outsider.

Chapter 6 120 Conclusion
Outsiders can voice what the group already think, ensuring that the blame does not
lie with any trouble makers ‘in-house’. Further, arguments about personal gain for
individuals within the group will be avoided. Decision analysis is very good at
identifying unexpressed issues and fundamental problems. Further, it gives a
group of DMs support to address these issues in a structured and sensible manner.
An additional high level role of decision analysis lies in the record it produces. By
ensuring that the decision problem has been approached rationally, and considered
carefully, the DMs can confidently establish an audit trail. Not only will this
become a resource for later decisions, but also will enable a group to defend its
work. In view of the discussion about the importance of feedback on improving
the nature of human judgement (Chapter 5), such a resource should allow a group
to improve areas such as strategy planning. Further, if this is combined with an
explicit statement of objectives, it should enable a group to remain focused and
avoid possible pitfalls associated with group dysfunction.
Another issue arises, that of supporting DMs to establish their aims and therefore
their own criteria for a successful decision modelling session. I have already
suggested that this must be a role for the analyst. Certainly, this information
should be from the perspective of the DM in order that they genuinely feel
fulfilled at the end of the session. However, the DM will benefit from the
expertise of the analyst when establishing what is realistically achievable. In
addition, decision analysis requires a DM to provide preference data for analyses.
It was shown in Chapter 3 that an analyst could support the provision of such data.
The DMs in this study quite quickly adapted to the necessary modes of thinking
demanded of them and provided data demonstrating complex nonlinear preference
functions. Not only did this enable us to solve the existing problem, but all parties
gained an understanding of problem issues from the DM’s values. Therefore,
decision analysis is also powerful because it can give great insight. In addition to
supporting the formation of aims and objectives which will clarify a problem
owner’s position, it also helps explain the implications of preference data,
enabling the DMs to better understand their problem and their solution.

Chapter 6 121 Conclusion
Decision analysis can provide a ‘feel-good’ factor. This was demonstrated in
Chapter 4. Further, it is potentially an important role for the technique. Such an
aspect can be influential in the DMs’ decision whether to use decision support in
the future. Further, it can have an impact upon whether DMs implement the results
of the decision analysis session they have experienced. More elusive impacts of
the ‘feel good’ factor include motivation of the group to reach consensus, and to
communicate and appreciate differences of opinion. Such aspects can have a
considerable effect upon the quality of the decision making processes of a group,
and are therefore of key importance. The ‘feel good’ factor can be directly
influenced by the nature and attitude of the analyst. Therefore, this is a
fundamental aspect of the analyst’s role.
A final role of decision analysis is in educating DMs and deepening their approach
to problem solving. There is always value to be gained from considering
alternative methods of problem solving, even if these methods are eventually
abandoned. Such a consideration will help clarify the important aspects of the
preferred approach, and why these aspects are valued. Use of decision analysis can
be achieved through scenario setting as demonstrated in Chapter 5. Groups are
encouraged to work together to model hypothetical problems. Scenario setting is
an ideal way to provide DMs with information about the nature of human
judgement and responses to information. Further, it allows them a safe
environment in which to practise the skill of moulding preferences, space to
consider uncertainty and the opportunity to find strategies for addressing this.
Scenario setting enables both DMs and decision analysts to learn. Thus, a scenario
will enable a facilitator to observe the group process. This may provide vital
information about how a particular group functions. Further, it will give an analyst
an opportunity to attempt alternative modes of working. In addition, widening
their experience will better prepare analysts for the dynamic environment in which
they are destined to function.

Chapter 6 122 Conclusion
THE VARIATION IN TECHNIQUES AND METHODOLOGY.
The fact that many normative decision models exist and that there are variable
ways of applying such models, as highlighted in Chapter 2, make decision analysis
a powerful tool. However, this itself leads to problems when making an informed
decision on which approach to adopt. This thesis proposes that the choice of
normative approach should fit the DM before it fits the problem. That is to say, it
is better that the DM feels at ease with the chosen approach. They will feel happy
with the data which they are asked to provide, though the data and the model may
be a simplification of the problem. The alternative would be to use a more
appropriate model, but risk alienating the DM by demanding what to them might
appear as incorrect information, or simply asking questions which they find
impossible to answer. In the vein of robustness, it is better to be imprecisely right
than precisely wrong.
Chapter 2 demonstrated the difference in the ethos of the European School and the
multi-attribute value theorists with respect to the best way to model decision
problems. One of the unrecognised differences lay in the way these approaches
would be practised. MAVT applications may involve intensive sessions which
gather the problem owners together, whereas the European School is likely to take
a more ‘discrete’ approach. Consequently, there may be cases when one tool is
better suited than another. This could also be viewed as an opportunity for each
method to extend itself.
In Chapter 4 it was shown that facilitation would not be a particularly valuable
method for groups with no history of conflict. It has been hypothesised that a
group ceases to function effectively once it has passed some boundary of civility.
Therefore, this is the point at which a group would benefit from decision support.
This is not to say that decision support has no role to play within groups who
currently conduct themselves well. Ideally, a group would not progress to a flash
point, and a facilitator could be employed to prevent this.
Due to the dynamic nature of decision support, it is likely that such techniques
will evolve and adapt when applied to unusual settings. This may result in more

Chapter 6 123 Conclusion
powerful tools, or may simply demonstrate that a certain setting is inappropriate
for a particular support technique. There is a clear motivation for the use of
scenario setting. This will support the DMs in establishing which method is
appropriate for them. DMs can gain from using decision support techniques and
analysts will also learn more about their methods. However, there are issues to
consider when devising a scenario. There may be many elements to a scenario
which can make it seem more realistic in the eyes of the DM as described in
Chapter 5. These elements should be used sensibly and in good proportion.
THE PROBLEMS OF ANALYSING DECISION ANALYSIS.
The wide variation in decision problems coupled with a DM’s preferences for a
particular approach means that there will always be a number of ways to perform
decision analysis and decision support. It is unlikely that any one technique will
emerge as the ‘best’. This is partly due to the fact that academics and practitioners
are unlikely to agree on a ranked list of criteria indicating what is important about
a decision support tool. If decision analysts cannot do this, how could we expect
DMs to be able to use our techniques and do just this?
Validating and evaluating alternative normative models and support techniques is
complicated by the fact that the criteria used by the decision theorists (e.g. the
rigour of mathematics) is completely different to the criteria which a DM would
use. Much like the two sides to the coin of normative and descriptive decision
theories, an approach must be sought which will marry these views. Chapter 2
indicated some criteria from the perspectives of both the analyst and the DM
which could coexist. Those for the DM are concentrated upon a ‘feel-good’ factor,
i.e. whether a DM could get to grips with the decision modelling approach. The
analyst’s criteria, on the other hand, need to be targetted towards the DM rather
than the problem. Notice that neither set of criteria are concentrated upon the
problem. I feel that, given the evolving nature of the decision modelling process, a
satisfactory representation will be generated more efficiently by an approach
which satisfies the DM than one which better represents the problem.

Chapter 6 124 Conclusion
Chapter 4 discussed the problems of empirical research and the dangers involved
in using qualitative data. The impossibility of ruling out confounding factors was
noted. Researchers have combatted many problem issues so that aspects of
decision analysis can be investigated. However, there is a danger that the
experimental situation becomes so contrived in order to combat errors and biases,
that the artificial nature of the situation becomes a bias in itself. Therefore, a
balance needs to be struck. The analyst must accept that the data they collect will
have errors or omissions. Realism is too important to exclude from an experiment
if the results are to be extrapolated onto applications.
At a higher level, it is likely that the DM’s view of the decision problem is
unstable. Analysts must be aware of this and adapt their modelling appropriately.
They must adopt a patient and supportive role, guiding the DMs towards
achieving their objectives. Applications of decision support must be dynamic to
accommodate this. DMs will benefit from gaining understanding about themselves
in addition to a clearer view of the problem they face. Therefore, when analysing
decision analysis and decision support, the formative role of the analyst must not
be overlooked.
This thesis has not addressed the debate on whose values count. Further, the issue
of aggregation of data from a group is a complex one. Clearly, these are aspects
which influence the value of a decision analysis exercise. In addition, it is not an
aspect which could just be solved with common-sense. However, these aspects
must not be allowed to stop the application of decision analyses. As has been
demonstrated, there are many issues to consider when applying decision analysis.
These problem aspects must be addressed, but cannot all be considered
simultaneously. Therefore, I propose that the aggregation of group preferences is
an issue which is not immediately considered. Sensitivity analysis should be used
in the interim to maintain the high standard and applicability of the solutions
which are generated.

Chapter 6 125 Conclusion
AN APPROACH TO SYSTEMATIC EVALUATION OF DECISION
ANALYSIS.
In order to address this question, I must first outline why there is a need for
evaluation, and what this approach should fulfill. It is imperative to demonstrate
the value of decision analysis in order to encourage the use of the techniques.
Chapter 3 indicated how decision analysis could address issues which current
economics approaches are unable (or unwilling) to solve. Clearly, there are other
examples where decision analysis could be of benefit. However, the DMs must be
encouraged to use a new approach. Key to this is the ability to demonstrate the
value of investing the time and effort required. Therefore, if our aim is to
encourage the use of decision analysis, we must be able to identify the specific
benefits of these tools.
Given that the value of decision analysis needs to be established, there should be a
sensible and appropriate way to achieve this. Can approaches which are
unsystematic be systematically evaluated? More to the point, how would a DM
view a successful decision support tool? It is clear from the discussion presented
throughout the thesis that a DM’s criteria for success would be different from
those of a decision analyst. If, as I have proposed, one of the aims of validation is
to persuade DMs that the tool is useful, then the validation criteria should
demonstrate things which would appeal to a user. To this end, the research which
identifies participants’ perceptions of a decision support session will be a valuable
starting point. However, it was shown in Chapter 4 that although DMs perceived
many improvements, these were likely to have evolved from a central feeling of
‘well-being’. However, well-being may be insufficient as an ‘advertising’
criterion. Clearly, there is much more work needed on this issue. A good starting
point would be to consider the criteria outlined in Chapter 2.
One could follow the systematic evaluation route with the aim of rigorously
testing prescriptive decision analysis. Once there is a set of agreed criteria, in itself
a complex task, then metrics must be established in order that performance levels
can be recorded. It is likely that, given criteria such as ‘satisfaction’, these

Chapter 6 126 Conclusion
measures will be subjective and perception based. Therefore, the investigation is
likely to reduce to an unsystematic analysis. Given the unrepeatable and unique
character of each decision support session, less rigorous approaches are inevitable.
Therefore, I would suggest that this route would be difficult and flawed. It is better
to acknowledge the qualitative nature of prescriptive decision analysis and
establish appropriate validation techniques.
The way forward must be to accept the possible duality of the aims of validation.
Firstly, are we aiming to encourage the more widespread use of decision analysis?
Secondly, are we trying to quieten our academic critics through robust analysis?
Following this, we can establish appropriate criteria and metrics. From a personal
point of view, I would suggest that this thesis has highlighted the importance of
the first approach. Therefore, I would propose a system which ‘proves’ decision
analysis with respect to a DM’s perspective. It is likely that, as the role of decision
analysis becomes established in management practices, the necessary performance
criteria would change. Therefore the second approach, the academic perspective,
would be addressed as a matter of course. The current aim should be to encourage
the use of the techniques, and to provide DMs with training and support. This will
give rise to issues which developers of decision support mechanisms need to
address. Once these demands have been met, then the aims of the analysts might
be to introduce more complex models, or perhaps make less use of support
approaches. From a pragmatic prescriptive perspective, there is more benefit in
encouraging applications of decision theory than in time spent extending
mathematical theories. Academics should be encouraged to see that this is an
equally valid extension and improvement of their models.
CONCLUSION
It is only through use that the practical shortcomings of decision analysis will be
identified, and therefore addressed. Moreover, this can only be achieved through
real DMs making use of these techniques. It should not be based purely upon the
investigations of academics. Until decision analysis and decision support have

Chapter 6 127 Conclusion
been given a fair hearing, and an opportunity to respond to criticism, we cannot
fully establish their role in problem solving environments. It is clear from this
thesis that decision analysis can have a positive impact in many respects.
Moreover, it can influence aspects which have been avoided by a group, or may
not have been even recognised as contributing factors.
In view of the fact that there are many models and support techniques, decision
analysts should be encouraged to apply these widely in order to compare such
approaches. Clear aims on what such a comparison is for should be established
first. Further, the dynamic and flexible role which an analyst must fulfill needs to
be practised so that they have an opportunity to reflect on aspects of their
performance.

References 128 References
References
Ackermann, F. (1996), Participants’ perceptions on the role of facilitators using
group decision support systems, Group Decision and Negotiation, 5(1): 93-112.
Anson, R., Bostrom, R. and Wynne, B. (1995), An experiment assessing group
support system and facilitator effects on meeting outcomes, Management Science,
41(2): 189-208.
Ball, J.C. and Ross, A. (1991), The Effectiveness of Methadone Maintenance
Treatment, Springer-Verlag, New York.
Baron, R.S., Kerr, N.L. and Miller, N. (1992), Group Process, Group Decision,
Group Action, Open University Press, Buckingham.
Beach, L.R., Christensen-Szalanski J. and Barnes, V. (1987), Assessing human
judgement: has it been done, can it be done, should it be done? in Wright, G. and
Ayton, P. (editors), Judgemental Forecasting, 49-62, John Wiley and Sons,
Chichester.
Bell, D.E., Raiffa, H. and Keeney, R.L. (1988), Decision Making: Descriptive,
Normative and Prescriptive Interactions, Cambridge University Press,
Cambridge.
Belton, V., (1990), MCDA - Practically the only way to choose, in: Hendry, L.C.
and Eglese, R.W. (editors), Operational Research Tutorial Papers, 53-101,
Operational Research Society, Birmingham.
Belton, V. and Vickers, S.P. (1989), V.I.S.A. - Visually interactive sensitivity
analysis for multiple criteria decision aid - User Manual.
Bernoulli, D. (1954), Exposition on a new theory on the measurement of risk,
Econometrica, 22: 23-36.

References 129 References
CEC, (1992), International Advisory Committee International Chernobyl Project -
inputs from the Commission of the European Communities to the evaluation of the
relocation policy adopted by the former Soviet Union, Report number EUR
14543EN
Christensen-Szalanksi, J.J.J. and Bushyhead, J.B. (1981), Physicians’ use of
probabilistic information in a real clinical setting, Journal of Experimental
Psychology: Human Perception and Performance, 7(4).
CIPFA (1994), Homelessness Statistics 1992-3 Actuals, Statistics Information
Service Ref 75-94 London, CIPFA.
Clarke, G.M. and Cooke, D. (1986), A Basic Course in Statistics, (2nd Edition),
Arnold, Great Britain.
Collinson, D., Kirkup, G., Kyd R. and Slocombe, L. (1992), Plain English, Open
University Press, Buckingham.
Darke, S., Hall, W., Wodak, A., Heather, N. and Ward, J. (1992), Development
and validation of a multi-dimensional instrument for assessing outcome from
treatment among opiate users: the Opiate Treatment Index, British Journal of
Addiction, 87: 733-42.
Des Jarlais, D.C., Deren, S. and Lipton, D.S. (1981), Cost-effectiveness studies in
the evaluation of substance abuse treatment, in: Lowinson, J and Ruiz, P. (editors)
Substance Abuse: Clinical Problems and Perspectives, 806-16, Williams and
Wilkins, Baltimore/London.
Deschenes, E.P., Anglin, M.D. and Speckart, G. (1991), Narcotics addiction -
related criminal careers, social and economic costs, Journal of Drug Issues,
21(2): 383-411.
Dolan, P. and Sutton, M. (1995), Better than the Real Thing: Is the Visual
Analogue Scale the Sainsbury’s Cola of Elicitation Techniques? Health
Economists’ Study Group, Aberdeen.

References 130 References
Dorn, N., Baker, O. and Seddon, T. (1994), Paying for Heroin: Estimating the
Financial Cost of Acquisitive Crime Committed by Dependent Heroin Users in
England and Wales, Institute for the Study of Drug Dependence, London.
Dunning, D. and Ross, L. (1990), Overconfidence in individual and group
prediction: is the collective any wiser? Working paper series, Center for
Behavioral Economics and Decision Research, Cornell University. Report no.
BEDR 90-02.
Dupré, L. (1995), Bugs in Writing: A Guide to Debugging Your Prose. Addison-
Wesley, Reading, Mass.
Dyer, J.S., and Sarin, R.K. (1979), Measurable multiattribute value functions,
Operations Research, 27(4): 810-822.
Easton, G. (1982) Learning From Case Studies, (2nd Edition), Prentice Hall,
London.
Eden, C. and Ackermann, F. (1994) Horses for courses: - a Stakeholder View of
the Evaluation of GDSS's, Management Science, University of Strathclyde,
Working Papers 94/12.
Eden, C. and Radford, J.(editors) (1990), Tackling Strategic Problems, Sage,
London.
Euroqol Group (1990), Euroqol: a new facility for measurement of health-related
quality of life, Health Policy, 16: 199-208.
Farrell, M., Ward, J., Mattick, R., Hall, W., Stimson, G.V., Des Jarlais, D.,
Gossop, M. and Strang, J. (1994), Methadone-maintenance in opiate dependence -
a review, British Medical Journal, 309(6960): 997-1001.
Fischhoff, B. (1975), Hindsight ≠ foresight: The effect of outcome knowledge on
judgment under uncertainty, Journal of Experimental Psychology; Human
Perception and Performance, 1: 288-299.

References 131 References
Forsyth, D.R. (1983), Group Dynamics, (2nd Edition), Brooks Cole, Montery CA.
French, S. (1986), Decision Theory: An Introduction to the Mathematics of
Rationality, Ellis Horwood, Chichester.
French, S. (editor), 1989, Readings in Decision Analysis, Chapman and Hall,
London.
French, S. (1994), Utility: probability’s younger twin? in: Freeman P.R. and
Smith A.F.M. (editors), Aspects of Uncertainty, 171-180, John Wiley and Sons,
Chichester.
French, S. (1997), RODOS elicitation exercises in Belgium, France and UK,
Confidential to project staff and participants and including DGXII, CEPN, CEA,
SCK.CEN and NRPB.
French, S. and Ehrhardt, J. (1994), Report on the elicitation exercises conducted
within the RODOS project, Confidential to project staff and participants.
French, S. and Liang, Y. (1993), Decision support systems: a decision analytic
perspective, in: Norman J.M., (editor) Developments in Operational Research, 21-
40, Operational Research Society, Birmingham.
French, S., Maule, J. and Simpson L. (1997), Report on risk communication
workshops, Internal report for the Department of Health, contact Peter Bennett,
EOR4 Division, Department of Health, Skipton House, Elephant and Castle,
London.
French, S. and Morrey, M. (1996), RODOS elicitation workshop, Confidential to
project staff and participants.
French, S., Simpson, L., Atherton, E., Belton, V., Dawes, R., Edwards, W.,
Hamalainen, R., Larichev, O., Lootsma, F., Pearman, A., Poyhonen, M., and Vlek,
C., (1998), Problem formulation for multi-criteria decision analysis: report of a
workshop, in preparation for the Journal of Multi-Criteria Decision Analysis.

References 132 References
Frey, D. (1997), Groupthink research and its implications for politics and
economy. Plenary paper presented at the 16th bi-annual conference on subjective
probability, utility and decision making, University of Leeds, 20th August.
Froberg, D.G. and Kane, R.L. (1989), Methodologies for measuring health state
preferences II: scaling methods, Journal of Clinical Epidemiology, 42: 459-471.
Gerstein, D.R., Johnson, R.A., Harwood, H.J., Fountain, D., Suter, N. and Malloy,
K. (1994), Evaluating Recovery Services: The California Drug and Alcohol
Treatment Assessment, California Department of Alcohol and Drug Programs,
Sacramento.
Goodwin, P. and Wright, G. (1991), Decision Analysis for Management
Judgement, John Wiley and Sons, Chichester.
Goodwin, P. and Wright, G. (1997), Do values have to be discovered or can they
be elicited?: an evaluation of the applicability of multiattributed value analysis to
aid decision making. Paper presented at the 16th bi-annual conference on
subjective probability, utility and decision making, University of Leeds, 20th
August.
Graham, W. K., (1977), Acceptance of ideas generated through individual and
group brainstorming, The Journal of Social Psychology, 101: 231-234.
Greene, W.H. (1991), LIMDEP Version 6.0: User’s Manual and Reference Guide
Econometric Software Inc., New York.
Greene, W.H. (1993), Econometric Analysis, MacMillan, New York.
Hall, P. (1986), Managing change and gaining corporate commitment, ICL
Technical Journal, 213- 227.
Hannan, M.T. (1992), Rationality and robustness in multilevel systems, in:
Coleman, J.S. and Fararo, T.J. (editors) Rational Choice Theory - Advocacy and
Critique, Sage, California

References 133 References
Hartnoll, R.L., Mitcheson, M.C., Battersby, A., Brown, G., Ellis, M., Fleming, P.
and Hedley, N. (1980), Evaluation of heroin maintenance in a controlled trial,
Archives of General Psychiatry, 37: 877-84.
Henig, M.I. and Buchanan, J.T. (1996), Solving MCDM problems: process
concepts, Journal of Multi Criteria Decision Analysis, 5: 3-21.
Hey, J.D. (1991), Experiments in Economics, MacMillan, Hampshire.
Hicks, C.M., (1995), Research for Physiotherapists: project design and analysis,
(2nd Edition), Churchill Livingstone.
HMSO (1995), Tackling Drugs Together: A Strategy for England 1995-1998,
HMSO, London.
Home Office (1994), Criminal Statistics England and Wales 1993, Cm 2680
HMSO, London.
Huxham, C. and Cropper, S. (1994) From many to one - and back. An exploration
of some components of facilitation, Omega, International Journal of Management
Science, 22 (1): 1-11.
Janis, I.L. (1972), Victims of Groupthink, Houghton-Mifflin, Boston.
Janis, I.L. and Mann, L., (1977), Decision Making: A Psychological Analysis of
Conflict, Choice and Commitment, Free Press, New York.
Kahneman, D., Slovic, P. and Tversky, A., (editors) (1982), Judgment Under
Uncertainty: Heuristics and Biases, Cambridge University Press, Cambridge.
Kaplan, M. F. and Miller, C. E. (1987), Group decision making and normative
versus informational influence: effects of type of issue and assigned decision rule,
Journal of Personality and Social Psychology, 53(2): 306-313.
Keeney R.L. (1992), Value Focused Thinking, Harvard University Press,
Cambridge, MA.

References 134 References
Keeney, R.L. and Raiffa, H. (1976), Decisions with Multiple Objectives:
Preferences and Value Tradeoffs, John Wiley and Sons, New York.
Kelly, G. N. (1994), Rodos - a decision support system for off-site emergency
management background and future perspectives, Technical report. Commission
of the European Communities, DGXII, F6 Rue de la Loi, B-1049, Brussels,
Belgium.
Kleindorfer, P.R., Kunreuther, H.C. and Schoemaker, P.J. (1993), Decision
Sciences, Cambridge University Press, Cambridge.
Laughlin, P. R. and Barth, J. M., (1981), Group-to-individual and individual-to-
group problem solving transfer, Journal of Personality and Social Psychology, 41:
1087-1093.
Lepicard, S., and Schneider, T., (1996), RODOS elicitation exercise: synthesis
report, CEPN report number NTE/96/23-C411 Commande EDF/DSRE no. 9952
AZF.
Levin, I.P. and Hinrichs, J.V. (1995), Experimental Psychology: Contemporary
Methods and Applications, Brown and Benchmark, USA.
Linstone, H. and Turoff, M. (1975), The Delphi Method: Techniques and
Applications, Addison-Wesley, London.
Lomas, J. (1997), Reluctant rationers: public input into health care priorities,
Journal of Health Services Research and Policy, 2(2): 103-111
Maier N.R.F. (1967), Assets and liabilities in group problem solving: the need for
an integrative function, Psychology Review 74(4): 239-249.
March, J.G. (1971), The technology of foolishness, Copenhagen 18. Reprinted in
March, J.G.(1988), Decisions and Organisations, Blackwell, Oxford.
Mayhew, P., Maung, N.A. and Mirrlees-Black, C. (1992), The 1992 British Crime
Survey, Home Office Research Study 132, HMSO, London.

References 135 References
Murphy, A.H. and Winkler, R.L. (1974), Credible interval temperature
forecasting: some experimental results, Monthly Weather Review, 102: 784-794
Newcombe, R. (1992), The reduction of drug-related harm: a conceptual
framework for theory, practice and research, in: O’Hare, P.A., Newcombe, R.,
Matthews, A., Buning, E.C. and Drucker, E. (editors) The Reduction of Drug-
Related Harm, 1-14, Routledge, London.
OPCS (1991), Mortality Statistics: Cause 1991, Series DH2 no.18 HMSO,
London.
OPCS (1992), Key Population and Vital Statistics 1992: local and health
authority areas, Series VS no.19, PP1 no.15, HMSO, London.
Parker, H., Bakx, K. and Newcombe, R. (1988), Living with Heroin: The Impact
of a Drugs Epidemic on an English Community, Open University Press, Milton
Keynes.
Pearman, A. (1996), Two hundred and twenty three years of decision research in
Leeds: any progress? Inaugural lecture delivered on 29th February, 1996, The
Business School, University of Leeds.
Phillips, L. D. (1984), A theory of requisite decision models, Acta Psychologica,
56: 29-48.
Phillips, L. D. and Phillips, M. C. (1993), Facilitated work groups: theory and
practice, Journal of the Operational Research Society, 44(6): 533-549.
Propper, C. (1991) Contingent valuation of time spent on a waiting list, Economic
Journal, 100: 193-199.
Ramsay, F.P. (1931), Truth and probability, in: The logical foundations of
mathematics and other essays, reprinted in: Kyburg, H.E. and Smokler, H.E.,
(editors), (1964), Studies in Subjective Probability, 61-92, John Wiley and Sons,
New York.

References 136 References
Rios Insua, D. (1990), Sensitivity analysis in multi-objective decision making,
Lecture notes in economics and mathematical systems, 347, Springer Verlag,
Berlin.
Robertson, J.R., Ronald, P.J.M., Raab, G.M., Ross, A.J. and Parpia, T. (1994),
Deaths, HIV-infection, abstinence, and other outcomes in a cohort of injecting
drug users followed up for 10 years, British Medical Journal, 309(6951): 369-372.
Roy, B. (1977), Partial preference analysis and decision aid, in: Bell, D.E.,
Keeney, R.L. and Raiffa, H. (editors), Conflicting Objectives in Decisions, John
Wiley and Sons, New York.
Roy, B. (1990), Decision-aid and decision-making, European Journal of
Operational Research, 45: 324-331.
Roy, B. (1991), The outranking approach and the foundation of ELECTRE
methods, Theory and Decision, 31: 49-73.
Roy, B. and Bertier, P. (1973), La methode ELECTRE II: un application au media
planning, in: Ross M. (editor), OR72, North Holland, Amsterdam.
Roy, B. and Bouyssou, D. (1986), Comparison of two decision-aid models applied
to a nuclear power plant siting example, European Journal of Operational
Research, 25: 200-215
Roy, B. and Vanderpooten, D. (1997), Preface, Journal of Multi-Criteria Decision
Analysis, 6(2): 63-64.
Rydell, C.P. and Everingham, S.S. (1994), Controlling Cocaine - Supply Versus
Demand Programs, RAND, Santa Monica.
Saaty, T.L. (1980), The Analytic Hierarchy Process, McGraw-Hill, New York.
Savage, L.J. (1954), Foundations of Statistics, John Wiley and Sons, New York.

References 137 References
Siegel, S. (1956), Nonparametric Statistics for the Behavioural Sciences,
McGraw-Hill, New York.
Simon, H.A. (1956), Rational choice and the structure of the environment,
Psychological Review, 63: 129-138.
Simpson, L. (1993), MAVT and outranking: a comparison of two multi-criteria
decision analytic methods, Report 94.3, School of Computer Studies, University
of Leeds.
Simpson, L. (1995), Bringing decision support to a count, Report 95.11, School of
Computer Studies, University of Leeds.
Simpson, L. (1996), Do decision makers know what they prefer?: MAVT and
ELECTRE II, Journal of the Operational Research Society, 47(7): 919-929.
Simpson L. and Sutton M.A. (1997a), A alternative approach to drug policy
outcome measurement, Addictions Research, 5(6): 487-506.
Simpson L. and Sutton M.A. (1997b), Composite outcome measurement: a
challenge which must be addressed, Editorial, Addictions Research, 5(6): 433-
437.
Sprent, P. (1981), Quick Statistics: An Introduction to Non-Parametric Methods,
Penguin, Middlesex.
Sutton, M.A. and Maynard, A. (1994), Trends in the Cost-Effectiveness of
Enforcement Activity in the Illicit Heroin Market 1979-90, YARTIC Occasional
Paper 4, Centre for Health Economics, York.
Sutton M.A. and Simpson L. (1997), Potential problems with monetary
aggregation of drug policy outcomes, submitted to Addictions Research.
Vanmarcke, H., Verbruggen, A. and Sohier, A. (1995), Report on the Belgian
elicitation exercise conducted within RODOS, Report number BLG 697,
SCK.CEN, Mol, Belgium.

References 138 References
Vidmar, N. (1972), Effects of decision alternatives on the verdict and social
perceptions of simulated jurors, Journal of Personality and Social Psychology,
22(2): 211-218.
Vincke, P. (1992), Multicriteria Decision Aid, John Wiley and Sons, Chichester.
Von Neumann, J. and Morgenstern, O. (1947), Theory of Games and Economic
Behaviour, (2nd Edition), Princeton University Press, Princeton, NJ.
Watson, S.R. and Buede, D.M. (1987), Decision Synthesis. The Principles and
Practice of Decision Analysis, Cambridge University Press, Cambridge.
Willcox, W.B. (1975), (editor) The Papers of Benjamin Franklin, 19: 299-300,
Yale University Press, New Haven.
Williams, A.W. (1985), Economics of coronary artery bypass grafting, British
Medical Journal, 291: 326-9.
Zionts, S. (1997), The case of the vanishing optimum revisited, Journal of Multi-
Criteria Decision Analysis, 6(2): 247.