An Empirical Analysis of User Content Generation and Usage Behavior on the Mobile Internet
33
Electronic copy available at: http://ssrn.com/abstract=1669678 User Content Generation and Usage Behavior on the Mobile Internet: An Empirical Analysis 1 Anindya Ghose Stern School of Business, New York University, New York, New York 10012, [email protected] Sang Pil Han Stern School of Business, New York University, New York, New York 10012, [email protected] Abstract We quantify how user mobile Internet usage relates to unique characteristics of the mobile Internet. In particular, we focus on examining how the mobile-phone based content generation behavior of users relates to content usage behavior. The key objective is to analyze whether there is a positive or negative interdependence between the two activities. We use a unique panel dataset that consists of individual-level mobile Internet usage data that encompasses individual multimedia content generation and usage behavior. We combine this knowledge with data on user calling patterns, such as duration, frequency, and locations from where calls are placed to construct their social network and to compute their geographical mobility. We build an individual-level simultaneous equation panel data model that controls for the different sources of endogeneity of the social network. We find that there is a negative and statistically significant temporal interdependence between content generation and usage. This finding implies that an increase in content usage in the previous period has a negative impact on content generation in the current period and vice versa. The marginal effect of this interdependence is stronger on content usage (up to 8.7%) than on content generation (up to 4.3%). The extent of geographical mobility of users has a positive effect on their mobile Internet activities. Users more frequently engage in content usage compared to content generation when they are traveling. In addition, the variance of user mobility has a stronger impact on their mobile Internet activities than does the mean. We also find that the social network has a strong positive effect on user behavior in the mobile Internet. These analyses unpack the mechanisms that stimulate user behavior on the mobile Internet. Implications for shaping user mobile Internet usage behavior are discussed. Keywords: Mobile Internet, Social Networks, Content Generation, Content Usage, Interdependence, Geographical Mobility, Identification 1 We thank Sanjeev Dewan, Wendy Duan, Avi Goldfarb, Oliver Yao and participants at the SCECR 2009 and ICIS 2009 conferences for helpful comments. We also thank seminar participants at University of Minnesota, New York University, University of Texas at Dallas, and University of Maryland. The authors acknowledge financial support from NSF CAREER award (IIS-0643847), the Korea Research Foundation Grant funded by the Korean Government [KRF-2008-356-B00011], a Google-WPP Marketing Research Award, the Wharton Interactive Media Institute- Marketing Science Institute (WIMI-MSI), and the NYU Stern- Center for Japan-U.S. Business and Economic Studies. The usual disclaimer applies.
Transcript of An Empirical Analysis of User Content Generation and Usage Behavior on the Mobile Internet

Electronic copy available at: http://ssrn.com/abstract=1669678
User Content Generation and Usage Behavior on the Mobile Internet: An Empirical Analysis1
Anindya Ghose Stern School of Business, New York University, New York, New York 10012, [email protected]
Sang Pil Han
Stern School of Business, New York University, New York, New York 10012, [email protected]
Abstract
We quantify how user mobile Internet usage relates to unique characteristics of the mobile Internet. In particular, we focus on examining how the mobile-phone based content generation behavior of users relates to content usage behavior. The key objective is to analyze whether there is a positive or negative interdependence between the two activities. We use a unique panel dataset that consists of individual-level mobile Internet usage data that encompasses individual multimedia content generation and usage behavior. We combine this knowledge with data on user calling patterns, such as duration, frequency, and locations from where calls are placed to construct their social network and to compute their geographical mobility. We build an individual-level simultaneous equation panel data model that controls for the different sources of endogeneity of the social network. We find that there is a negative and statistically significant temporal interdependence between content generation and usage. This finding implies that an increase in content usage in the previous period has a negative impact on content generation in the current period and vice versa. The marginal effect of this interdependence is stronger on content usage (up to 8.7%) than on content generation (up to 4.3%). The extent of geographical mobility of users has a positive effect on their mobile Internet activities. Users more frequently engage in content usage compared to content generation when they are traveling. In addition, the variance of user mobility has a stronger impact on their mobile Internet activities than does the mean. We also find that the social network has a strong positive effect on user behavior in the mobile Internet. These analyses unpack the mechanisms that stimulate user behavior on the mobile Internet. Implications for shaping user mobile Internet usage behavior are discussed. Keywords: Mobile Internet, Social Networks, Content Generation, Content Usage, Interdependence, Geographical Mobility, Identification
1We thank Sanjeev Dewan, Wendy Duan, Avi Goldfarb, Oliver Yao and participants at the SCECR 2009 and ICIS 2009 conferences for helpful comments. We also thank seminar participants at University of Minnesota, New York University, University of Texas at Dallas, and University of Maryland. The authors acknowledge financial support from NSF CAREER award (IIS-0643847), the Korea Research Foundation Grant funded by the Korean Government [KRF-2008-356-B00011], a Google-WPP Marketing Research Award, the Wharton Interactive Media Institute-Marketing Science Institute (WIMI-MSI), and the NYU Stern- Center for Japan-U.S. Business and Economic Studies. The usual disclaimer applies.
Electronic copy available at: http://ssrn.com/abstract=1669678
1
1.0 Introduction Rapid advances in mobile Internet technologies now allow consumers to interact, create, and share
content based on physical location. Such ubiquitous access to the mobile Internet also provides companies
with new marketing opportunities. Newer marketing strategies need to be implemented in such an
environment. This change requires a deeper understanding of user behavior on the mobile Internet.
However, little is known as yet about how user mobile Internet usage relates to certain unique
characteristics of the mobile Internet space. We examine that topic in this paper.
There are a few aspects of mobile Internet that distinguish it from other types of Internet access via
devices like personal computers (PCs) or laptops. First, in many countries, users incur explicit expenses (for
example, by paying usage-based data transmission charges) during their mobile Internet usage. These are
based on the number of bytes uploaded or downloaded.2 This feature is in contrast to using PCs where the
Internet can be accessed using a fixed connection or a WiFi connection without incurring any monetary
costs based on usage. Second, users can access the Internet via mobile devices anytime and anywhere,
subject to signal reception. In contrast, PCs render stricter limitations on geographical mobility and access,
typically constraining it to office or home or locations where there is access in place. Third, screen sizes are
smaller on mobile devices compared to PCs, thereby rendering higher search costs for mobile devices.
Usage-based data pricing and ubiquitous access can lead to a situation where a diverse set of factors,
such as resource constraints (time or money), geographical mobility, and social networks will influence
user mobile Internet behavior. Advanced mobile technologies, such as 3G services, allow people to build
and maintain their social relationships through co-creation and joint usage of content. Hence, people must
decide how much content to generate and how much content to use. For example, in a given week, the
higher the amount of time or money spent by a user to use content (e.g., downloading music, games,
productivity apps, etc), the lower the amount of time or money left for that user to generate content (e.g.,
uploading photos, reviews, videos, etc).3 In contrast to this scenario, higher levels of content consumption
by users can motivate higher levels of content contribution. This can occur when users begin to feel they
are an integral part of the communities established on these sites and hence engage in reciprocal behavior.
Either way, content generation and usage may not be independent decision-making processes at all.
Whether the former negative interdependence is stronger than the latter positive one is an empirical
question we aim to examine here. Keeping these issues in mind then, in this paper we focus on examining
how user content generation behavior relates to user content usage behavior over time. Is there a positive or
negative interdependence between these two activities? What other factors, if any, affect user content
generation and usage activities on the mobile Internet?
2 The fee structure in our empirical context is usage-based pricing. Subscribers are charged on a per byte basis for data traffic they generate through content uploading and/or downloading. 3 We use the terms “content generation” and “content uploading” interchangeably in this paper. Similarly, we use the terms “content usage” and “content downloading” interchangeably as well.

Electronic copy available at: http://ssrn.com/abstract=1669678
2
We examine these questions by applying a unique dataset that consists of mobile data across a panel
of users, encompassing both their content generation and usage behavior. That dataset consists of 2.34
million individual-level mobile data records across 180,000 users. We also use data on voice calls made by
the same users, which allows us to draw their social networks. We include detailed user demographics (age
and gender) and geographical data, including the location from where a call is placed. This location
information helps us impute the extent of user geographical mobility by mapping the different places they
visit. We then construct two different measures of mobility to map both the mean and the variance of user
travel patterns at both local and national levels, thereby giving us four different mobility metrics. Our
analysis utilizes simultaneous equation models as well as generalized method of moments (GMM)-based
dynamic panel models and several other models (both linear and non-linear) for robustness checks.
There are three key sets of results. First, we find that there exists a negative temporal interdependence
between content generation and usage behavior on the mobile Internet. This finding implies that the
resource constraint (e.g., time and money constraint) is binding at least for some users. The effect is
asymmetric, such that the negative impact of previous period content generation on current period content
usage is much higher than the opposite. Second, the extent of geographical mobility of users positively
affects their mobile Internet activities. Users more frequently engage in content downloading compared to
content uploading when they are traveling. In addition, variance of user travel patterns has a stronger
impact on mobile Internet activities than does the mean. Third, mobile Internet usage behavior of social
network neighbors positively influences an individual user’s mobile Internet usage behavior.
Our paper aims to makes a few key contributions to the literature. We are the first to simultaneously
model and estimate the drivers of user content generation and usage behavior in the mobile Internet space
and the nature of the interdependence between these processes. We build and estimate an individual-level
simultaneous equation panel data model using three-stage least-square (3SLS) estimation. We further
demonstrate the robustness of this analysis by conducting GMM-based dynamic panel data analyses and
other analyses that include models with a random coefficient for a constant term, count data models,
content share models, content size models, and models using different specifications of social network
variables. Our paper is among the first in the emerging literature to research the dual role (content creation
and consumption) played by users in social media settings. Second, the unique nature of our data allows us
to map how the mean and the variance of user geographical mobility at both local and national levels
actually drive their content generation and usage behavior. We are the first to provide novel insights into
how location plays a role in user behavior on the mobile Internet. This paper can thus serve as the
foundation for future research on both the economic and the social impact of the mobile Internet. Third, our
model unpacks the causal mechanisms that stimulate user behavior on the mobile Internet in the presence of
social networks. Mobile phone-based data generate unique kinds of social networks due to the inherent
dynamics present in communication and travel patterns of users; these patterns make these social networks
distinct from various other kinds of social networks already studied in the existing literature. Our model

3
distinguishes and controls for the different sources of endogeneity in this mobile setting, such as
endogenous group formation, correlated unobservables, and simultaneity. Hence, another key contribution
of this paper is to provide a precise empirical framework for resolving identification issues in social
networks now and in the future.
2.0 Literature Review Our paper is related to a small group of literature that discusses the interplay between user Internet
usages, mobility, and social networks.
First, we relate the dynamic interdependence between user content generation and usage behaviors to
two relevant streams of literature – economic behavior under resource constraints and reciprocity stemming
from social exchange theory. Researchers have long recognized that time acts as a constraint (Becker 1965,
Jacoby et al. 1976). In online settings, users need to allocate their resources between content generation and
content usage activities since users can take on the dual role of creators as well as consumers (Ghose & Han
2009, Trusov et al. 2010, Albuquerque et al. 2010). On the mobile Internet, not only do users need to invest
time, but also incur explicit transmission charges to generate and use content in certain countries. This
suggests that there is a negative temporal interdependence between content generation and content usage
activities over time. In contrast, the prior work in the online content sharing literature (Xia et al. 2007)
draws on reciprocity stemming from social exchange theory (Homans 1958) and suggests that the more a
user benefits from the contributions of other users, the more that user is willing to create and share content
(Xia et al. 2007). This behavior suggests that there is a positive temporal interdependence between content
generation and content usage activities over time. Since the extent of reciprocal interactions in the mobile
Internet setting is largely unknown, the overall extent and directional interdependence of the temporal effect
between content generation and usage remains still an intriguing empirical question.
Second, we examine the impact of the extent of the geographical mobility of a user on the mobile
Internet activity of that same user. There are two possible scenarios. The first is that the more a user travels,
the more travel-related discretionary time the user is likely to have. Shim et al. (2008) analyze mobile usage
patterns where people view TV programs on their phone screens. They find that the highest usage occurs
between 6 AM and 9 AM in the morning and between 6 PM and 8 PM in the evening, which is consistent
with the notion that most users view content using mobile phones while commuting from home to work and
back. O’Hara et al. (2007) find that people use mobile video content to pass time, manage solitude, and
disengage from others. In contrast, it is possible that mobile Internet usage can occur at geographically
fixed places as well. Hence, the overall extent of the impact of a user geographical mobility on that same
user’s propensity to engage in mobile Internet activity remains still an empirical question of interest.
Third, users can be influenced by others with whom they communicate. There is some evidence of
this influence in the business world – such as adoption of new services and products (Hill et al. 2006,
Tucker 2008, Aral et al. 2009, Nair et al. 2010, Nam et al. 2010, Iyengar et al. 2010, Oestricher-Singer &

4
Sundararajan 2010), switching from an existing service provider (Dasgupta et al. 2008), and diffusion of
user-generated content in online space (Susarla et al. 2010). Therefore, user mobile Internet activities can
be influenced by the mobile Internet activity of their peers.
3.0 Data Description and Basic Patterns In this section, we provide a short overview of the mobile Internet service found in our data, describe
the data that we obtained from a large telecommunications service company in South Korea, and finally
provide the basic patterns seen in that data that motivated our subsequent model development.
3.1 Data Source
Our sample consists of 2.34 million mobile data records from 180,000 3G mobile users who used the
services of a particular company between March 15, 2008, and June 15, 2008. The South Korea 3G mobile
market had over 10 million subscribers in June 2008. 3G mobile services enable users to upload and
download their content faster than conventional mobile services. These services are more commonly
available on larger screen handsets (i.e., smart phones).
There are two broad categories of websites that users can access through their mobile phones as
demonstrated in our data. The first category is regular social networking and community websites.
Examples of such websites in our data include Cyworld and Facebook. The second category of websites
includes portal sites specifically created by mobile phone service carriers. Examples include Nate Portal
and KTF Portal, the Asian equivalent of U.S. sites like Vodafone live and T-Mobile’s Web ‘n’ Walk.
Content on these sites can be accessed via a mobile phone by users who subscribe to the services of their
mobile operator. Like social networking sites, these mobile portals are community-oriented sites that allow
users to download and upload (to share with others) multimedia content like photos, music, videos, apps,
etc. The transmission charges are the same in our data, irrespective of whether users upload or download
content and whether users access social networking community sites or mobile portal sites. We measure the
level of user mobile Internet activities based on the frequency of content generation and usage.4
3.2 Variable Description
Our mobile Internet data include individual-level information on user content generation and usage
activities over time. The temporal unit in our analysis is a “week.” Technically, a unique mobile Internet
session starts when a user pushes a button on a keypad or clicks an icon on a touchpad, and it ends when the
user deactivates that mobile Internet session. Only when a user initiates a mobile Internet session can the
user either download content or upload content, or do both. An activity involving more than zero bytes of
data transmission is an event. One mobile Internet session usually consists of multiple events. As shown in
Table 2, a user content usage occurs far more frequently than user content generation.
We construct four metrics with respect to user geographical mobility: 1) mean local mobility, 2) mean 4 In our robustness checks, we also use the amount of bytes transmitted via user content uploading and downloading as an alternative measure for the level of user mobile Internet activity.

5
national mobility, 3) local mobility dispersion, and 4) national mobility dispersion. The first two metrics
capture the mean of user travel patterns, and the last two metrics capture the variance of their travel patterns.
Users often engage in mobile content activities when they are outdoors and when they are traveling. In such
circumstances, the geographical locations from where their call is placed will change over time. We refer to
the number of unique locations from where calls are placed by a user as a measure of their “mean mobility.”
In a sense, this variable captures the mean travel pattern of a user. There are two different levels of
granularity regarding the extent of mobility of each user, namely, local and national. Both variables
measure the number of distinct locations from where a user makes calls at the zip code level and the
province/state level, respectively. Since the total number of unique zip codes is much higher than the
number of provinces or states gathered in our data (i.e., 30,116 vs. 16), the number of distinct zip code-level
locations thus corresponds to a user’s “mean local mobility” while the number of distinct province-level
locations corresponds to a user’s “mean national mobility.”
The concept of “mobility dispersion” measures the extent of geographical deviation from one’s
commonly visited places (i.e., home and office), and in that sense, the term captures the variance of a user’s
travel patterns. A user’s mobility dispersion refers to a fraction of uncommonly visited places compared to
the total number of places visited during a given week.5 The notion behind the use of this variable is that
deviations from routine patterns of travel might indicate a trip to a location that is different from a user’s
regular travel. Such unique travel occasions could lead to a higher propensity (compared to the mean) to
upload and download to share travel experiences (i.e., sharing photos taken at tourist attractions). As before,
we have both local and national levels of granularity to apply for the mobility dispersion metric.
We also gather data on voice calls made by the same users, which enables us to draw their social
networks. Voice call records contain a caller’s telephone number and the receiver’s telephone number, call
duration and frequency. Our voice call data can help us identify an exogenously defined network of social
neighbors because we do not use mobile Internet activity data per se to construct the network. Social
network variables in our sample correspond to the level of content activity (i.e., frequencies of content
uploads and downloads) of network neighbors for each user in the sample.
We use social network data to capture a source of learning based on word-of-mouth as identified in
prior work (for example, Ghose & Han 2009). Mobile phone-based data generate unique kinds of social
networks due to the inherent dynamics of communication and mobility patterns, which make them distinct
from other kinds of social networks studied in the existing literature. There are four possible types of user
behavior that can accrue from the interplay of mobility and calling patterns – (a) low mobility and
infrequent calls to people at travel destinations, (b) high mobility and infrequent calls to people at travel
destinations, (c) low mobility and frequent calls to people at travel destinations, and (d) high mobility and
frequent calls to people at travel destinations. The inclusion of social network and mobility variables in the 5 We define commonly visited places as those places where a user visits at least once every week. Hence, we define an uncommonly visited place as one a user does not visit every week.
6
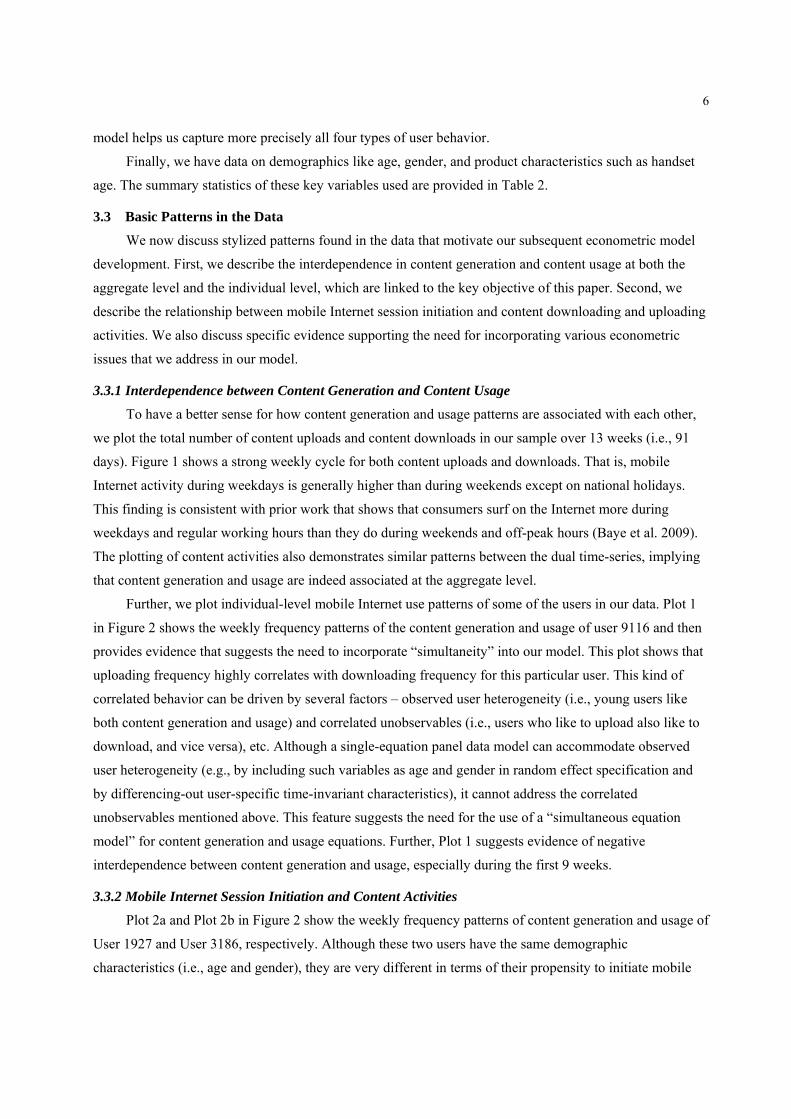
model helps us capture more precisely all four types of user behavior.
Finally, we have data on demographics like age, gender, and product characteristics such as handset
age. The summary statistics of these key variables used are provided in Table 2.
3.3 Basic Patterns in the Data
We now discuss stylized patterns found in the data that motivate our subsequent econometric model
development. First, we describe the interdependence in content generation and content usage at both the
aggregate level and the individual level, which are linked to the key objective of this paper. Second, we
describe the relationship between mobile Internet session initiation and content downloading and uploading
activities. We also discuss specific evidence supporting the need for incorporating various econometric
issues that we address in our model.
3.3.1 Interdependence between Content Generation and Content Usage
To have a better sense for how content generation and usage patterns are associated with each other,
we plot the total number of content uploads and content downloads in our sample over 13 weeks (i.e., 91
days). Figure 1 shows a strong weekly cycle for both content uploads and downloads. That is, mobile
Internet activity during weekdays is generally higher than during weekends except on national holidays.
This finding is consistent with prior work that shows that consumers surf on the Internet more during
weekdays and regular working hours than they do during weekends and off-peak hours (Baye et al. 2009).
The plotting of content activities also demonstrates similar patterns between the dual time-series, implying
that content generation and usage are indeed associated at the aggregate level.
Further, we plot individual-level mobile Internet use patterns of some of the users in our data. Plot 1
in Figure 2 shows the weekly frequency patterns of the content generation and usage of user 9116 and then
provides evidence that suggests the need to incorporate “simultaneity” into our model. This plot shows that
uploading frequency highly correlates with downloading frequency for this particular user. This kind of
correlated behavior can be driven by several factors – observed user heterogeneity (i.e., young users like
both content generation and usage) and correlated unobservables (i.e., users who like to upload also like to
download, and vice versa), etc. Although a single-equation panel data model can accommodate observed
user heterogeneity (e.g., by including such variables as age and gender in random effect specification and
by differencing-out user-specific time-invariant characteristics), it cannot address the correlated
unobservables mentioned above. This feature suggests the need for the use of a “simultaneous equation
model” for content generation and usage equations. Further, Plot 1 suggests evidence of negative
interdependence between content generation and usage, especially during the first 9 weeks.
3.3.2 Mobile Internet Session Initiation and Content Activities
Plot 2a and Plot 2b in Figure 2 show the weekly frequency patterns of content generation and usage of
User 1927 and User 3186, respectively. Although these two users have the same demographic
characteristics (i.e., age and gender), they are very different in terms of their propensity to initiate mobile

7
Internet sessions as well as in terms of the number of their content uploads and downloads. Note that User
1927 in Plot 2a , having a higher frequency of mobile Internet session initiation (13 times), has engaged
more frequently in content usage when compared to User 3186 in Plot 2b, who has a lower propensity for
initiating a mobile Internet session initiation (2 times). In other words, even after controlling for observed
demographics like age and gender, some unobserved user characteristics like inherent interest in initiating a
mobile Internet session do explain behavioral differences, such as the content usage between users. This
feature motivates the need to incorporate a “selection constraint” in our model to control for the non-
randomness in the user mobile Internet session initiation stage.
Descriptive statistics from our data suggest that young, male users tend more frequently to engage in
mobile content generation and usage than other groups. Thus, there could be a disproportionately higher
number of young, male users in this sample for mobile session-initiated users (i.e., the selected sample)
compared to the total sample. Indeed, results from a random effect dynamic probit model for the user
session initiation equation support this argument (see Appendix B). Further, if we were to group those users
who have initiated mobile Internet sessions by the amount of their content activities (both uploads and
downloads) and divide the entire group into heavy-users vs. light-users, we would see a disproportionately
higher number of young, male users in the heavy-user sample compared to the light-user sample.
Lastly, Plots 1, 2a, and 2b indicate that the frequencies of generation and usage in Week 1 vary by
user. For example, User 1927 (Plot 2a) has 56 instances of downloading, whereas User 9116 (Plot 1) has
about 18 instances of downloading. This implies that users could be different in terms of prior experiences
with respect to content generation and usage at the beginning of the sample (i.e., Week 1). We thus model
this “initial condition” issue by specifying selection equations for Week 1 and for Weeks 2 – 13, separately.
4.0 The Econometric Model To analyze the underlying process of user content generation and content usage, we build and
estimate an individual-level simultaneous equations panel data model, using three-stage least-square (3SLS)
estimation. We further demonstrate the robustness of this analysis by conducting GMM-based dynamic
panel data analyses. We also present and discuss other robustness check analyses that include models with a
random coefficient in a constant term, count data models, content share models, content size models, and
models using network variables based on different specifications.
In the mobile Internet space where users generate and use content with their phones, users face a two-
step decision-making process. In Step 1, they decide whether to initiate a mobile Internet session by
clicking a button on the mobile phone. In Step 2, once they have initiated a mobile Internet session, they
determine how much to upload (if any) and how much to download (if any). They can engage in both
uploading and downloading activities multiple times during a given mobile Internet session. Hence, there
are three related user decisions – (a) mobile Internet session initiation, (b) content generation, and (c)
content usage. Conditional on doing (a), the user could decide to do (b), (c), or both.

8
There are five econometric issues to address here: (i) sample selection bias, (ii) social network
endogeneity, (iii) initial conditions problem, (iv) unobserved user heterogeneity, and (v) simultaneity.
First, recall that we (researchers) can observe the content generation and usage frequency of users
only if these users initiate their mobile Internet sessions. Sample selection can arise in this setting because
those people who more frequently initiate their mobile Internet sessions can also be more prone to content
generation (or usage) than those who less frequently initiate their mobile Internet sessions. If uncorrected,
the estimates in the main equations become biased and inconsistent, leading to a misleading inference
(Heckman 1979). Further, it could undermine the external validity of estimates in that the estimates are only
relevant for the selected sample (i.e., people who actually initiated mobile Internet sessions), thereby
limiting the generalizability of any results. In other words, the main source of the selection bias here is the
user decision to initiate a mobile Internet session based on their discretion and intrinsic preferences as
opposed to being randomly chosen. We control for this sample selection bias by including a selection
correction term in our main equations (i.e., content generation and usage frequencies).
Second, the mobile Internet behavior of a user and his social network can seem to be correlated,
regardless of whether it occurred because of causal influence or not. To identify the social network effect,
we control for three other factors that can lead to spurious correlated behaviors: Endogenous group
formation, correlated unobservables, and simultaneity. Endogenous group formation can arise in our setting
if users communicate with other users with similar tastes for content generation and usage. Correlated
unobservables can arise in our setting if marketing activities and promotions exist that are targeted to a user
and that user’s network neighbors. Simultaneity can arise in our setting if network neighbors affect the user
and the user also affects them simultaneously. We explain these aspects in detail in Section 4.3.2.
Third, we account for the well-known initial conditions problem in our model as follows: 1) For each
user, the first observation in our sample may not be the true initial outcome of his mobile content
generation and usage process; and 2) the frequencies of generation and usage in Week 1 vary greatly by
user. Fourth, users are, in general, different in terms of their propensities and preferences toward content
generation and usage. While some consumers tend to be users of content created by others, others
contribute by creating and uploading content to web portals and social networking sites. We account for
this phenomenon by incorporating both observed and unobserved user heterogeneity in our model. Finally,
as several plots of usage have shown before, there could be simultaneity between content generation and
usage, and we need to account for that as well. We address each of five econometric issues above in the
following Sections 4.1 and 4.2. We discuss the identification issues involved in the model in Section 4.3.
4.1 Selection Equations: Mobile Internet Session Initiation
To address the sample selection bias statistically, we explicitly specify our econometric model by
extending Verbeek and Nijman’s (1996) two-step method.6 In Step 1, related to the user’s decision in Step
6 A single-shot estimation model cannot address all econometric issues involved in our context. This has been

9
1, we run a random effect (hereinafter called RE) dynamic probit model for the user’s binary decision for
whether to initiate a mobile Internet session or not initiate one during a given week. Estimates from Step 1
are used to obtain a Heckman (1979)’s selection correction term. In Step 2, we insert the correction term
into content generation and content usage equations, respectively, and estimate the two equations
simultaneously, using a three- stage least-squares (3SLS) method.
To account for social network effects, we use a lagged social network variable. To control for
observed user heterogeneity, we include time-invariant user-specific variables like age and sex. In addition,
to account for the initial condition problem, we specify two separate equations for a user’s mobile Internet
session initiation decision: One for the first time period only and the second for the remaining time periods.
We also include a lagged dependent variable. This variable also allows us to control for state dependence.
There are two forms of dynamics in consumer decisions that can be modeled in a reduced form model
like ours – (i) habit persistence due to switching costs; and (ii) variety-seeking behavior that has been
identified in prior work (Osborne 2007). In our setting, while many users may have prior experience with
PC-based Internet browsing, they may be relatively new to mobile phone-based Internet browsing.
Therefore, some users may have switching costs. Further, some consumers may be variety seeking. Our
data confirms that users with higher levels of mobility tend to engage more in mobile Internet activities.
Hence, we can expect this kind of switching behavior across users in mobile Internet settings. Therefore, by
including a lagged dependent variable in the selection equation, we can examine whether there are
switching costs (whether the sign of the lagged dependent variable is positive and statistically significant)
and any variety-seeking behavior (whether the sign of the lagged dependent variable is negative and
statistically significant).
An orthogonality problem may arise in our model. Because our selection equation is based on a RE
model, the estimator will be inconsistent if the unobserved, user-specific, time-invariant factor is correlated
with the regressors therein. Hence, we follow the Mundlak (1978) and Zabel (1992) approaches and add the
mean values of time-varying regressors (in our case, the mean value of session initiation by social network)
to the selection equation. Notations and variable descriptions are provided in Table 1 (see Appendix A).
Specifically, we specify that user i decides whether to initiate mobile Internet sessions using an
indicator function (i.e., 1 = Yes and 0 = No). We specify a model for the initial period (t = 1) as follows:
Session , π π Age π Age π Sex π Handset Age π z , u 1
Session , 1 Session , 0 .
For the remaining periods (t ≥ 2), we specify a model as follows:
documented in prior work. For example, Verbeek and Nijman (1996) and Stewart (2006) point out that a single-shot estimation is not able to control for simultaneity. Similarly, BiØrn (2004) points out that a single shot estimation is unable to handle the selection issue. Further, a single shot estimation is also computationally very intensive, given the size of our group of data (2.3 million observations). Hence, we utilize the computationally less stringent two-step estimator for our model while explicitly incorporating all economic issues involved in our context.

10
Session , α α Session , α Social Network Session , α Age α Age α Sex
α Socıal Network Sessıon δ λ α z , η , 2
Session , 1 Session , 0 .
where δ is a user-specific random coefficient, λ is a time-period dummy, z , is a mean mobile Internet
session initiation of all other users in user i’s billing zip code, and η , is an error term.
If the initial conditions correlate with the unobserved, user-specific, time-invariant factor, as would be
expected in most situations, our estimators will be inconsistent. Since the u in equation (1) does correlate
with δ in equation (2), but uncorrelate with η , for t = 2, 3,…, T, we specify u as follows:7
u θδ η , . 3
where θ is an initial condition parameter. We then estimate the RE dynamic probit model, using Maximum
Likelihood Estimation methods based on Stewart (2006, 2007).8
4.2 The Main Equations: Content Generation and Content Usage Frequencies
We specify a fixed effect (hereafter FE) model for content generation and usage equations.9 To
account for sample selection bias, we insert a selection correction term into content generation and the
content usage equations, respectively. To incorporate temporal interdependence, we include a lagged
content download frequency variable in a content upload equation and a lagged content upload frequency
variable in a content download equation. We include each one of four mobility metrics in our main
equations in separate estimations to demonstrate robustness to both the mean and the variance of the
mobility metric, at both local and national levels. To account for the individual-level social network effect,
as before, we include lagged social network variables to alleviate the endogeneity bias that can arise when
using the social network variable.10 We include the number of voice calls as a control variable in the
content generation and usage equations to control for user inherent propensity to make calls. Further, we
include control variables, including user-specific dummies, time-period dummies, and time-period and
location specific fixed effects at the user level, to control for endogeneity from using a social network
variable as a regressor.
We take the logarithm on variables to control for their right-skewed nature (i.e., there are some heavy
7 We check serial autocorrelation in the error term and find the estimate for serial autocorrelation is not statistically significant (p-value is 0.627). 8 Given that there are several user-specific, time-invariant variables that may affect a user’s mobile Internet session initiation, we use a RE dynamic probit model for the selection equation. 9 Verbeek and Nijman (1996) demonstrate that a fixed effect estimator in the main equations in their two-step approach is more robust to selection biases than is a random effects estimator. Moreover, they also show that the conditions for the consistency of a fixed effect estimator are weaker than those for a consistent random effects estimator. 10 We also specify an alternative model, allowing for contemporaneous social network effects by using an instrumental variable approach for each equation, similar to Iyengar et al. (2010). The result indicates that the contemporaneous social network effect is positive and statistically significant, while other estimates qualitatively remain the same. Hence, we find no evidence of misspecification bias from using a lagged social network variable.

11
uploaders and heavy downloaders as seen in Table 2). We implement a 3SLS estimation on the first-
differenced equations of log-transformed content generation and content usage frequencies. The
simultaneous estimation method allows for efficiency gain compared to single equation estimation methods
by taking into account the cross-equation error correlation.11 Specifically, content generation frequency and
usage frequency equations are specified as follows for t = 2, 3,…, T:12
log Upload , β β log Download , β log Mobility , β log Social Network Upload ,
β log Voice , β Selection , β log g ,
β log Socıal Network Upload κ φ ν , , 4
log Download , γ γ log Upload , γ log Mobility , γ log Social Network Download ,
γ log Voice , γ Selection , γ log h ,
γ log Socıal Network Download ψ τ ε , . 5
where Social Network Activity , ∑ w , , Activity , . w , , is the normalized
number of calls user i made to user m in week t-1, and Activity is either Upload or Download. g , and
h , are mean uploading and downloading frequencies of all other users in user i’s billing zip code,
respectively. In addition, κ and ψ are user-specific dummies, φ and τ are time-period dummies, and
ν , and ε , are user- and time-specific error terms.
Further, recall that we specified a FE model for equations of content generation and usage frequencies.
It is well-known that estimation of a FE model with a lagged endogenous variable is subject to potential
finite-sample bias (Nerlove 1967, Nickell 1981). Our analysis may suffer from this bias because the number
of observations per user is 13 for the entire sample but only 5 for the sub-sample. Hence, we take a first-
differencing transformation on each variable in the model to alleviate the potential bias from the fixed-
effect model (Wooldridge 2002) and difference out both observed and unobserved user-specific, time-
invariant variables (e.g., age, gender, job characteristics, prior Internet experience, etc.).13 Although we find
there exists no serial correlation in the error term from the selection equation and in the error term from
each of the main equations separately, we control for the potential serial correlation in the main
simultaneous equations of content generation and usage by using the robust variance matrix (Wooldridge 11 When the disturbance covariance matrix is not known, GLS is inefficient compared to a full information maximum likelihood (FIML) and three-stage least-squares (Lahiri and Schmidt 1978). 12 Note that we cannot include a lagged dependent variable as a regressor in Equations 4 and 5, because the lagged dependent variable in each equation correlate with the disturbance term after first-differencing transformation, leading to inconsistency in the estimates. In addition, a series of control variables helps us capture the impact of any potential omitted variable (i.e., LDV). These control variables include (i) time-period fixed effects, (ii) time-and-location specific mean content activity variables at the user-level, and (iii) mean content activity by social network neighbors at the user-level, which can mitigate this bias. That said, our main results are robust even when we include a lagged dependent variable and estimate that variable using GMM-based dynamic panel data models (see Appendix C). 13 This approach is similar to Verbeek’s (1990) where Verbeek takes the within transformation to eliminate the incidental parameters and maximizes the likelihood of the transformed data. He also shows that the corresponding estimator is consistent, even when only a few time-series observations are available.

12
2002).14 The robust variance matrix estimator (Arellano 1987) is valid in the presence of serial correlation
in error terms in Equations 4 and 5 (Wooldridge 2002).
To be specific, the first-differenced content generation frequency and usage frequency equations that
we estimate are specified as follows, for t = 2, 3,…, T:
∆log Upload , β ∆log Download , β ∆log Mobility , β ∆log Social Network Upload ,
β ∆log Voice , β ∆Selection , β ∆log g , ∆φ ∆ν , , 6
∆log Download , γ ∆log Upload , γ ∆log Mobility , γ ∆log Social Network Download ,
γ ∆log Voice , γ ∆Selection , γ ∆log h , ∆τ ∆ε , . 7
4.3 Identification
We discuss two issues in the identification of our model: 1) identifying the selection equations and the
main equations of content generation and usage frequencies; and 2) identifying the social network effect.
4.3.1 Identification of the Selection Equations and the Main Equations
Our identification strategy for the selection equations and the main equations includes normalization
of parameters for binary decision variables, exclusion restrictions, and the use of instrument variables as
part of our estimation process.
In the selection equations, since a user’s mobile Internet session initiation is a binary choice, we need
location and scale normalization on the latent dependent variable, Session , for identification. For location
normalization, we set the user i’s utility of not engaging in any mobile Internet sessions in week t,
Session , 0. For scale normalization, we set the variance of unobserved, user-specific, time-specific
effect, σ to 1. In addition, sample selection issues require our explicitly estimating the selection equation,
using both time invariant and time varying regressors (i.e., age, sex, mobile Internet session initiation by
social network). We call these variables Z. Since a selection correction term is a nonlinear function of the
variables included in the selection equations, our main equations of content generation and usage
frequencies with regressors X is identified due to this nonlinearity, even if Z = X. However, this
nonlinearity arises from the assumption of normality in the probit model. Thus, we check an exclusion
restriction by including variables in Z that are not included in X, which makes the identification cleaner
(Puhani 2000). The exclusion restriction is satisfied because we include some time-invariant variables (e.g.,
age and gender) as well as a time-varying variable (e.g., mobile Internet session initiation by social network)
only in the selection equation, but exclude these variables in the main equations.
In the main equations, in the absence of better data, we use time-series based instruments for
14 We include the time-based control variables to control for underlying time trends that help eliminate serial correlation in our data. That said, we estimate our main equations separately, using the Generalized Estimating Equations method (GEE) and find that the estimated AR(1) coefficients in the upload equation and the download equations are 0.006 and 0.007, respectively. Obviously, with such small AR(1) values, the other estimates qualitatively remain the same as in the result for our main model.

13
identification. Content upload and download frequency variables in a given week are taken to be
endogenous to the system of equations, while all other variables in the system are treated as exogenous to
the system or predetermined. For example, in the content upload frequency equation, variables like lagged
download frequency, geographical mobility, and lagged social network (see Section 4.3.2) are exogenous or
predetermined. This is true for the following reasons:
First, geographical mobility is exogenous because it is very unlikely that one’s mobility is determined
by one’s propensity to generate and use content. Instead, it is far more likely that a user’s propensity to
generate and use content is driven by the extent of their geographical mobility. Second, we assume that
only past content usage level affects the current content generation level of a user and similarly only past
content generation usage level affects the current content usage level of a user. Hence, the download
frequency variable at time t-1 is predetermined because it cannot be determined at time t. This is true
because the error term at time t in equation (4) is uncorrelated with current and lagged values of the
predetermined variable (i.e., E log Download , ν , 0) but may be correlated with future values (i.e.,
E log Download , ν , 0. This claim holds true because we found no serial autocorrelation in the error
terms after controlling for time trends (see Section 4.3.2). For the same reason, log upload at t-1 in the
equation (5) is a predetermined variable. This alleviates the concern of endogeneity from simultaneity and
thus focuses on the dynamics in the interdependence between content generation and usage of a user. Third,
the lagged social network variable is predetermined at time t, because we control for other sources for
endogeneity from using a social network variable as a regressor (see Section 4.3.2). These are valid
instruments for the endogenous variable because they are uncorrelated with the unobservable error term. A
similar set of arguments applies to the content download frequency equation.
As a robustness check, we also include a non- time-series-based variable as an instrument. In
particular, we include the “handset age variable” as an additional instrument in the content generation
equation, excluding it from the content usage equation. The key assumption behind this argument is that the
age of the handset is more likely to impede users from uploading multimedia content than downloading
content. Users can download multimedia content, irrespective of how advanced their handset features are,
such as the number of pixels in their mobile camera, the technical sophistication of the software, and
applications installed in the handset – the kinds of features which are required to experience multimedia
content downloaded from the web. In contrast, the lack of handset functionality and advanced features is
more likely to prevent users from creating and uploading content because older phones are not equipped
with advanced digital cameras and audio/video/photo editing applications – the kinds of features users need
to upload content on the Internet. The qualitative nature of all these results remains the same, however, with
the inclusion of this variable as an instrument.
Further, we examine whether both necessary order condition and sufficient rank condition are
satisfied for our main equations of content generation and usage frequencies. The order condition is met

14
because each equation excludes exogenous or predetermined variables (i.e., a mobility variable, a lagged
social network variable, a lagged temporal interdependent variable, mean mobile Internet activity of all
other users in user i’s billing zip code area, etc.) while it has no right-hand-side endogenous variable.
Further, we check the rank condition, using Baum’s (2007) Stata code to find that the rank condition for
each main equation is satisfied.
4.3.2 Identification of the Social Network Effect
To address the endogeneity issue of the social network variable, we adopt the identification strategy
and modeling approach in accordance with the prior work that has studied the impact of the social network
effect on user behavior (Manski 1993, Hartman et al. 2008, Nair et al. 2010). We distinguish causality from
correlation by separating causal effects from each of three sources of correlation: 1) endogenous group
formation, 2) correlated unobservables, and 3) simultaneity. In doing so, we incorporate several additional
variables. We explain these in detail below.
First, regarding the endogenous group formation, the observed correlation in the behavior of an
individual and other individuals in the social network could arise from omitted individual characteristics
that correlate within the group. For example, users can choose to call users with similar tastes in multimedia
content generation and usage. They might virtually meet at social networking sites or physically meet in the
same office/home neighborhood, and such meetings can lead to the formation of groups endogenously. This
will produce an upward bias in the social network effects. Consistent with the literature, we include a user-
specific random effect in the selection equation (i.e., Equation 3) and a user-specific fixed effect in the main
equations (i.e., Equations 4 and 5) to account for this issue.
Second, regarding the correlated unobservables, some unobservables could drive the behavior of an
individual and other individuals in one’s social network. For example, marketing promotions targeted to
users or exogenous incidents, such as celebrity sightings and festive events, can drive individuals in a given
social network to upload and download photos/videos to social networking sites. If uncorrected, this effect
could be mistaken for a social network effect. In other words, any spatially correlated, location-specific
shocks to users in the same group can lead to such a bias, and we need to account for it.
In addition to adding the user-specific effect, there are three additional controls for correlated
unobservables. The first is to include time-period fixed effects. These can control for common factors or
shocks to all individuals at a given time. Examples include the mobile carrier’s nation-wide mobile
marketing campaigns or promotions, such as free trial downloads of content. The second is location fixed
effects (i.e., zip code dummies). These can control for time-invariant, spatially correlated unobservables.
For example, users in urban areas may be more tech-savvy and more prone to engaging in mobile Internet
activities, compared to users in rural areas. The third is to include time and location effects to control for
unobservables that correlate at the level of zip code and time. We apply both billing zip code-based and

15
calling zip code-based content activities variables.15 For example, celebrity sightings, concerts, family
weddings, social events, festivals, unusual street incidents, etc., may give people the opportunities to
capture and share such moments with friends and families via their mobile devices. Hence, we include
time- and location-specific mean session initiation frequency of all other users in the same zip code area of
user i, denoted by Sessıon , in the selection equation and time- and location-specific mean content
upload and download frequencies of all other users in the zip code area of user i, denoted by g , and
h , in the main equations, respectively.
Our econometric specification is able to address all three issues required to distinguish causality from
correlation in the social network effect - endogenous group formation, correlated unobservables, and
simultaneity. Hence, our empirical estimates do demonstrate a causal effect of the social network on user
content generation and usage on the mobile Internet. However, we would like to be cautious in our
interpretation. In the absence of controlled variation using natural or field experiments during our sampling
period, we interpret the relationship between social network behavior and user behavior in our paper as
being one that establishes an upper bound on the causal effect of the social network.
5.0 Results In this section, we discuss our results and briefly summarize the key findings from the selection
equation. They show that positive state dependence exists, suggesting that some users incur switching costs
in our context and also there is a positive social network effect in initiating mobile Internet sessions. Further,
user mobile Internet initiation behavior greatly varies by age, implying an inverted U-shaped relationship
between age and mobile media usage with a peak at around approximately 21 years old. These estimates
appear in Appendix B.
In Section 5.1, we present the 3SLS estimation results of content generation and usage equations,
using a 13-week sample. These results shed light on temporal interdependence and to some extent on the
social network effect.16 In Section 5.2, we present the estimation results, using a 5-week sample that
contains data on the communication strength between social network neighbors and data on the
15 Each user’s billing zip code-based content activity variables capture the demand changes around that user only in the fixed location over time. To account for spatial change in demand, we included three additional, location-varying and time-varying average content activity variables based on user i’s top 3 places at which he placed calls (i.e., calling zip code-based content activity variables). The rationale for the inclusion of these variables is that user i and his network neighbors might travel to the same zip code area in a given week, and hence they could be influenced by an exogenous demand shock, arising from that location. Examples include celebrity appearances, concerts, some unusual street incidents, etc. Our results confirm that with the inclusion of an additional three (location- and time-varying content activity) control variables, the lagged network variable estimates remain qualitatively the same as before. Therefore, these results suggest that the impact of correlated unobservables from co-location of users on the social network variable is not a major issue. 16 Recall that we do not observe voice call records during the entire 13-week period, but observe them only over a 5-week period. Thus, in order to measure the amount of content generation and content usage of network neighbors of a given user at a given time period, we define user i’s network neighbors based on 5-week voice call records and treat them as fixed throughout the 13-week period. That is, the group of network neighbors of user i is denoted as n i in the 13-week sample, rather than n i .

16
geographical mobility of users.17 In Section 5.3, we look at the cohort analysis results to gain additional
insights of results through sub-sample analyses. In Section 5.4, we discuss a series of robustness checks that
demonstrate the robustness of our main results. In Section 5.5, we discuss the economic implications of our
results.
5.1 Results Using the Total Sample
Recall that we can observe the content upload and download frequency of users only if they initiate
their mobile Internet sessions. Results show that our estimates for a selection correction term are indeed
positive and statistically significant in content generation and usage equations (the coefficient estimates are
0.0216 and 0.7267, respectively). This suggests that people who more frequently initiate mobile Internet
sessions are more likely to engage in uploading and downloading content as opposed to those who less
frequently initiate mobile Internet sessions. Moreover, results from the selection equations (see Appendix B
for details) show that males and younger users who are prone to uploading or downloading content through
their mobile phones more frequently initiate mobile Internet sessions. These results confirm that controlling
for sample selection bias is crucial in our setting.
The main results from the simultaneous equations of content upload and download using the full
sample are given in Table 3. We find that there is a negative and statistically significant temporal
interdependence between content generation and usage. This finding implies that an increase in content
usage in a previous period does associate with a decrease in content generation in the current period and
vice versa (the coefficient estimates are -0.0091 and -0.0178, respectively). This finding provides evidence
that resource constraint (e.g., time and money constraint) binds at least for some people.
We find positive and statistically significant social network effects in content generation and usage
equations (the coefficient estimates are 0.0115 and 0.0143, respectively). We also find statistically
significant estimates for our control variables like time-period dummies, mean uploading and downloading
frequencies of all other users in user i’s billing zip code variables, etc.
We discuss the impact of each effect using their marginal effects.18 For example, a 1- standard
deviation increase in the frequency of content downloading in the previous period decreases the frequency
of content uploading in the current period by 3.6% when evaluated at the mean. Similarly, a 1- standard
deviation increase in the frequency of content uploading in the previous period decreases the frequency of
content downloading in the current period by 5.1%. Thus, the marginal effect of temporal interdependence
is asymmetric and stronger in content usage than it is in content generation.
In addition, the marginal effect of social network effect is larger in content usage than in content
17 We implemented all models here without the social network variable to alleviate any remaining concerns about endogeneity, even from the use of a lagged social network variable. We find qualitatively the same result between with and without the lagged network variable. Details are available upon request. 18 Given the log-log specification in Equations 4 and 5, the coefficients represent elasticities. In addition to these elasticities, we interpret the coefficients using marginal effects as well as economic implications (see Section 5.5).

17
generation (11.0% and 1.5%, respectively). Recall that this result of lagged social network effect does not
incorporate the communication strength between users when imputing the structure of the social network
for a given user. When we incorporate this information, we can obtain a more accurate measure of the
social network effect on user behavior. This finding is discussed below in Section 5.2.
5.2 Results Using the Communication Strength and Geographical Mobility Sub-Sample
It is possible that a user’s content generation propensity more strongly associates with that of his
family, close friends, or colleagues (whom the user calls more frequently or speaks to for a longer duration)
rather than that of acquaintances (whom the user calls less frequently or speaks to for a shorter duration).
To incorporate the dynamic, weighted social network effect on user behavior, we next present results from
a 3SLS estimation using a 5-week sample that has time-varying data on the extent of communication
strength between users and their network neighbors. In addition, the 5-week sample includes the four
different mobility metrics of users described earlier in Section 3.
We conduct our analyses on both frequency-based and duration-based models in which we
incorporate call frequencies and call durations, respectively, to determine the magnitude of the
communication strength. Our results are robust for the use of either factor (call frequencies and call
duration) as a weight for computing the strength of social network effect. Our results are also robust for the
exclusion of the number of voice calls as a control.
The main results are given in Table 4. As before, the estimates for selection correction terms are
positive and statistically significant in both equations, reassuring that controlling for sample selection bias
is crucial in our setting. Our results show that there exists a negative and statistically significant
interdependence between content usage in the current period and content generation in the previous period.
As an example, the coefficient estimates are -0.0098 and -0.0239, respectively, in a model with a mean-
local mobility variable. This result is consistent, irrespective of the use of different mobility variables. As
before, this finding lends support to the claim that the resource constraint (e.g., time and money constraint)
binds at least for some. These effects are also asymmetric. The marginal effect of temporal interdependence
is stronger in content downloading than in content uploading (-6.8% and -4.3%, respectively, in a model
with a mean- local mobility variable) –namely, the negative impact of a previous period’s content
uploading on the current period’s content downloading propensity is higher than the opposite.
We find that our mobility metrics positively associate with content generation and usage activities of
users. For example, mean -local mobility of a user positively associates with content generation and usage
(the coefficient estimates are 0.0087 and 0.0193, respectively). We find that the marginal effect of mean -
local mobility on content downloading is higher than on content uploading (1.2% and 0.5%, respectively)
when evaluated at the mean, whereas the marginal effect of mean -national mobility on content
downloading and content uploading is similar (0.5% and 0.3%, respectively). In addition, local- mobility
dispersion positively associates with content generation and usage (the coefficient estimates are 0.0057 and

18
0.0328, respectively). We also find that the marginal effect on content downloading is much higher than it
is on content uploading (3.3% and 0.6%, respectively). Similarly, the marginal effect of national- mobility
dispersion on content downloading is higher than the effect on content uploading (1.0% and 0.3%,
respectively). These results suggest that users more frequently engage in content downloading than content
uploading when traveling. Further, in general, the variance of user travel patterns (mobility dispersion) has
a stronger impact on their mobile Internet activities than on the mean (mean mobility).
The relationship between content generation and usage behavior of users and their social networks is
positive and statistically significant (for example, the coefficient estimates are 0.0162 and 0.0348,
respectively, in the model applying the mean -local mobility variable). This result is consistent, irrespective
of the use of different mobility variables. We find that the marginal effect of the social network on content
downloading is much higher than it is on content uploading (26.8% and 1.4%, respectively). In addition, we
find statistically significant estimates for our control variables like time-period dummies, mean uploading,
and downloading frequency of all other users.
5.3 Cohort Analysis Results
We implement four sets of cohort analyses. First, a useful test for the central notion of economic
behavior under resource constraints espoused in this paper is to examine whether users who appear closer to
a binding constraint on resources show a stronger (negative) temporal interdependence between content
generation and usage. Toward this end, we divide the sample based on the age of the user into two cohorts:
“younger” users (below the age of 22) and “older” users (above the age of 22). Results are robust with
respect to this age cutoff point. The assumption is that younger users are more likely to face monetary
constraints compared to older ones due to a lower amount of discretionary income. Hence, we would expect
a greater level of negative temporal interdependence between content generation and usage behavior for
such users. 3SLS estimation results show that this assumption holds true. For example, the marginal effect
of temporal interdependence in content downloading (content uploading) is -8.7% (-4.1%) for the younger
user cohort, whereas it is -2.7% (-2.0%) for the older user cohort. This finding implies that the resource
constraint binds more tightly on younger users than on older users.
Second, we divide the sample based on the location of the user into two cohorts: “urban” users (who
live in 6 major cities in South Korea) and “sub-urban” users (who live in other areas in South Korea). The
premise is that urban users are more likely to have better 3G broadband coverage as well as travel-related
discretionary time via public transportation (i.e., subways or buses) compared to sub-urban users. Hence,
we would expect a higher impact of mean mobility on urban user content generation and usage behavior.
The 3SLS estimation results show that this assumption also holds true. For example, the marginal effect of
mean- local mobility on content downloading (content uploading) is 2.2% (1.8%) in the urban user cohort,
whereas it is 1.8% (0.3%) in the sub-urban user cohort.
Third, we implement a sub-sample analysis by excluding users who either upload or download

19
disproportionately, so as to alleviate potential bias from including these outliers (i.e., UGC junkies or free-
riders). The sub-sample consists of those users whose upload frequency is in a similar range to their
download frequency. To be specific, we include a user into our sub-sample if the absolute difference
between download frequency and upload frequency for the same user is less than a given cutoff value (e.g.,
3, 5 or 10). We thus find qualitatively the same result as for the main result.
Lastly, we run analyses on a sub-sample consisting of only those users who engage in both generation
and usage activities in the same week at least once in the sample, to mitigate the potential bias from
including users who either upload or download, but do not engage in both activities. This sub-sample
constitutes 15.7% of the total sample. We find support for the negative temporal interdependence between
content uploading and downloading behavior. The results for the geographical mobility effect and the social
network effect are qualitatively the same as in our main results.
5.4 Robustness Checks
We did implement a series of robustness checks. Because of the evidence of positive state dependence
from the selection equation results, we conduct tests to check the robustness of the results by estimating the
main equations separately with a lagged dependent variable to control for the state dependence, using
GMM-based dynamic panel data model. We find that the results are qualitatively the same as our main
results (for details, see Table C1 in Appendix C).
To capture unobserved heterogeneity among the users, we also estimate a mixed effect model where
we include a random coefficient for a constant term (i.e., in equation 4 and in Equation 5).
Furthermore, strictly speaking, user content upload and download variables in our sample take on
nonnegative integer values. We thus use various types of linear models (i.e., 3SLS and GMM dynamic
panel data models). However, for count data, linear models do have shortcomings. Hence, one could argue
that we should examine our questions using count data models. However, count data models with fixed
effects are known to suffer from the “incidental parameters problem” except for the Poisson model.
Therefore, we did implement a Poisson- fixed effect model in which the incidental parameter problem is
not a problem (Lancaster 2000, Greene 2007). We find that the results are qualitatively the same as our
main results from 3SLS estimation (for details, see Table C2 in Appendix C).
Since the total amount of money and time resources of a user can potentially vary every week, an
alternative model would be to model the user’s share of content uploads with respect to the user’s total
amount of content uploads and downloads (content share model). Besides the frequency of content uploads
and downloads, costs that users will incur also depend on how many bytes a user uploads and downloads.
Towards this end, we use the amount of bytes uploaded and downloaded for each user instead of frequency
of uploading and downloading (content size model). We find that these results remain the same as for the
3SLS estimation result for our main model (for details, see Tables C3 and C4 in Appendix C).19
19 We also tried alternative specifications for social network effects – lagged cumulative effect and lagged binary
20
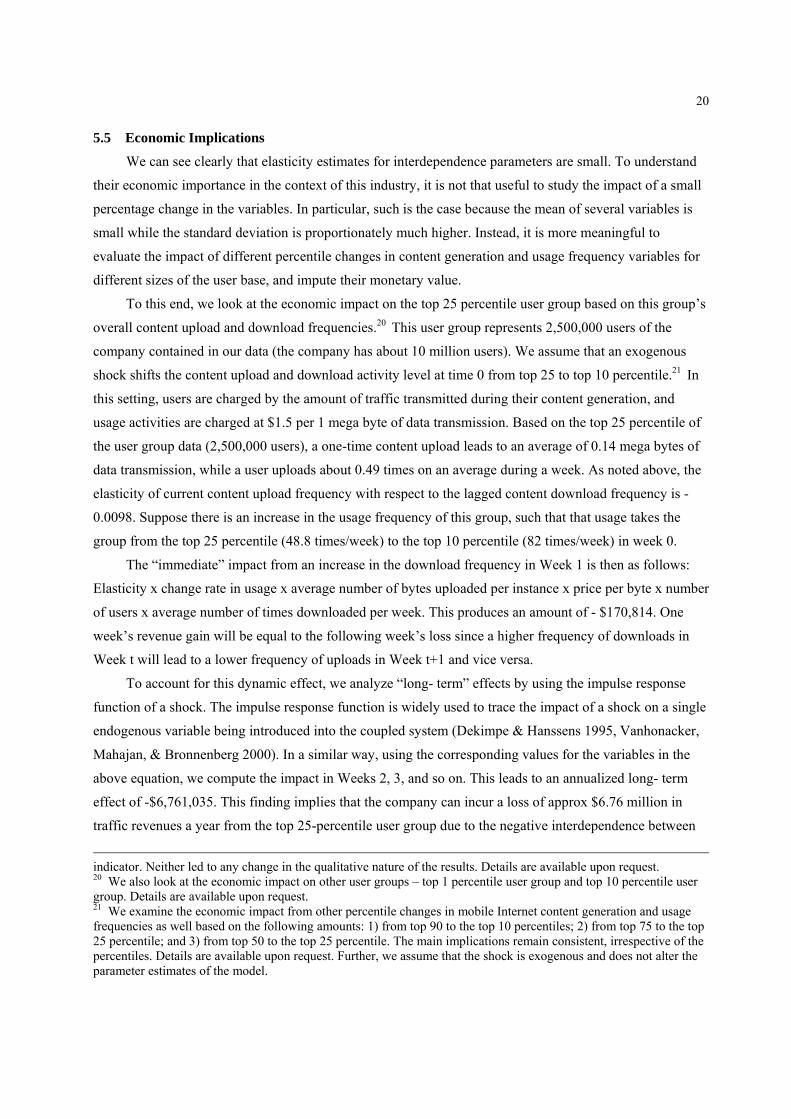
5.5 Economic Implications
We can see clearly that elasticity estimates for interdependence parameters are small. To understand
their economic importance in the context of this industry, it is not that useful to study the impact of a small
percentage change in the variables. In particular, such is the case because the mean of several variables is
small while the standard deviation is proportionately much higher. Instead, it is more meaningful to
evaluate the impact of different percentile changes in content generation and usage frequency variables for
different sizes of the user base, and impute their monetary value.
To this end, we look at the economic impact on the top 25 percentile user group based on this group’s
overall content upload and download frequencies.20 This user group represents 2,500,000 users of the
company contained in our data (the company has about 10 million users). We assume that an exogenous
shock shifts the content upload and download activity level at time 0 from top 25 to top 10 percentile.21 In
this setting, users are charged by the amount of traffic transmitted during their content generation, and
usage activities are charged at $1.5 per 1 mega byte of data transmission. Based on the top 25 percentile of
the user group data (2,500,000 users), a one-time content upload leads to an average of 0.14 mega bytes of
data transmission, while a user uploads about 0.49 times on an average during a week. As noted above, the
elasticity of current content upload frequency with respect to the lagged content download frequency is -
0.0098. Suppose there is an increase in the usage frequency of this group, such that that usage takes the
group from the top 25 percentile (48.8 times/week) to the top 10 percentile (82 times/week) in week 0.
The “immediate” impact from an increase in the download frequency in Week 1 is then as follows:
Elasticity x change rate in usage x average number of bytes uploaded per instance x price per byte x number
of users x average number of times downloaded per week. This produces an amount of - $170,814. One
week’s revenue gain will be equal to the following week’s loss since a higher frequency of downloads in
Week t will lead to a lower frequency of uploads in Week t+1 and vice versa.
To account for this dynamic effect, we analyze “long- term” effects by using the impulse response
function of a shock. The impulse response function is widely used to trace the impact of a shock on a single
endogenous variable being introduced into the coupled system (Dekimpe & Hanssens 1995, Vanhonacker,
Mahajan, & Bronnenberg 2000). In a similar way, using the corresponding values for the variables in the
above equation, we compute the impact in Weeks 2, 3, and so on. This leads to an annualized long- term
effect of -$6,761,035. This finding implies that the company can incur a loss of approx $6.76 million in
traffic revenues a year from the top 25-percentile user group due to the negative interdependence between
indicator. Neither led to any change in the qualitative nature of the results. Details are available upon request. 20 We also look at the economic impact on other user groups – top 1 percentile user group and top 10 percentile user group. Details are available upon request. 21 We examine the economic impact from other percentile changes in mobile Internet content generation and usage frequencies as well based on the following amounts: 1) from top 90 to the top 10 percentiles; 2) from top 75 to the top 25 percentile; and 3) from top 50 to the top 25 percentile. The main implications remain consistent, irrespective of the percentiles. Details are available upon request. Further, we assume that the shock is exogenous and does not alter the parameter estimates of the model.

21
content generation and usage. This $6.76 million constitutes more than 2.6% of the company’s gross annual
revenues accrued from the top 25-percentile user group.22
Our discussion of “long- term” effect is based on shocks that do not incur any monetary expenses
by the company. For example, shocks such as celebrity appearances, concerts, family weddings, social
events, festivals, unusual street incidents, etc., may provide people with opportunities to capture and share
such moments with friends and families using their handheld mobile devices. Other shocks explicitly
generated by the firm may involve that mobile carrier’s marketing actions and policy changes, which can
also stimulate changes in user behavior. Examples include discounted rate plans on Internet usage,
discounts on handsets conditional on certain usage levels, targeted coupons promoting Internet usage, etc.
However, we do not have data on these. Hence, the monetary effect of a shock that is based on the
parameter estimates by the current model would provide only an upper bound of the effect.
6.0 Discussion and Implications Mobile Internet-based content services constitute one of the fastest-growing applications on the web
today. However, very little is known about the interdependence between content generation and content
usage behavior of users. Nor do we know much about the other factors that can drive user behavior on the
mobile Internet. To examine these factors, we present a generalized empirical framework of user behavior
in the mobile Internet space. We analyze that framework using an unprecedented user-level dataset that
contains rich data on user demographics, calling patterns, calling locations and their social networks.
Our data comes from a setting where users enroll in usage-based data pricing. Recently media reports
have pointed out that the major wireless carriers in the US, namely AT&T and Verizon Wireless, are
getting ready to implement a usage-based data pricing scheme for data/Internet usage (Rethink Wireless
2010). These mobile carriers have profited from low fixed-fee penetration pricing. However, these carriers
have seen enormous growth in data traffic, which often outpaces the capacity of their networks. For
example, AT&T has experienced 5,000% growth in data traffic over the past three years, but 40% of that
traffic is consumed by just 3% of its smart-phone users (Rethink Wireless 2010). A global survey of mobile
telecom executives across 50 countries and 6 continents conducted by The Economist in 2010 reveals that
60% of respondents believe usage-based data pricing is the way of the future in mobile data and content
services. Our results based on this usage-based data pricing scheme can provide useful managerial insights
for companies’ contemplating such pricing schemes.
The insights from this study also have managerial implications. First, the asymmetric, negative
temporal interdependence between content generation and usage provides mobile phone companies with
insights on how to stimulate content generation and usage. Our results imply that content generation
requires disproportionately more effort and resources than does content usage. This could stem from
technical complexity in using content generation and uploading functionalities on their phones, lack of prior
22 Since we use high-frequency data, same-period effects may be minimal in our setting.

22
experience in uploading content through mobile devices, reduced uploading speed due to bandwidth
congestion, etc. There is some evidence of technical difficulties’ occurring in user content generation in an
online setting (Stoeckl et al. 2007). Hence, companies could provide easy-to-use content preprocessing
tools and less complicated content uploading procedures for the mobile web. This asymmetric
interdependence could provide mobile phone companies with new ideas regarding differential pricing
strategies for data uploading vs. data downloading and increase user engagement with mobile media.
Further, the provision of monetary incentives might be effective in triggering user content generation
behavior. In many ways, content diffusion in a mobile Internet environment is similar to that in P2P
networks because free-riders can create supply-side constraints. Hence, firms that engage in mobile content
provision and advertising could consider offering distribution referrals as monetary payments to users who
generate and distribute content. Implementation could be delivered through discounts in data transmission
charges given to such users.
Second, the asymmetric association of the extent of user geographical mobility with their content
usage compared to content generation behavior can provide mobile phone companies with additional
insights on targeted mobile advertisements. Previous research on location-based mobile advertising shows
that users find ads distressful when they receive them in home and work locations (Banerjee & Dholakia
2008). Our results suggest that users more frequently engage in content usage compared to content
generation when they are traveling. In addition, the variance of user travel patterns has a stronger impact on
mobile Internet activities than the mean of user travel patterns. Using this precise mobility information,
firms could engage in dynamically personalized mobile advertisements that would be less annoying to users.
Third, our results on the positive effect of the social network on user behavior can provide insights
into how companies can target the right set of users and influence users in mobile Internet space. Hence,
mechanisms designed to update a user instantly on the frequency with which his network neighbors have
downloaded or uploaded a certain type of content can affect the incentives of that user to do the same.
Our paper does have limitations. These limitations arise mainly from the lack of data. For example,
we do not have information about the specific type of content uploaded or downloaded (e.g., photo, audio,
text, etc.) and the destination websites (e.g., social networking sites, mobile portal sites, etc.). Future work
could examine this information. Another area for future research is to study how content generated via
mobile phones diffuses through different kinds of social networks, such as text messaging- based networks,
multi-media content- based networks, and offline location- based spatial networks. We hope that this study
will generate further interest in and engagement with the emerging literature on the economics of user-
generated mobile content and more broadly, in the growth in mobile commerce and the mobile Internet.
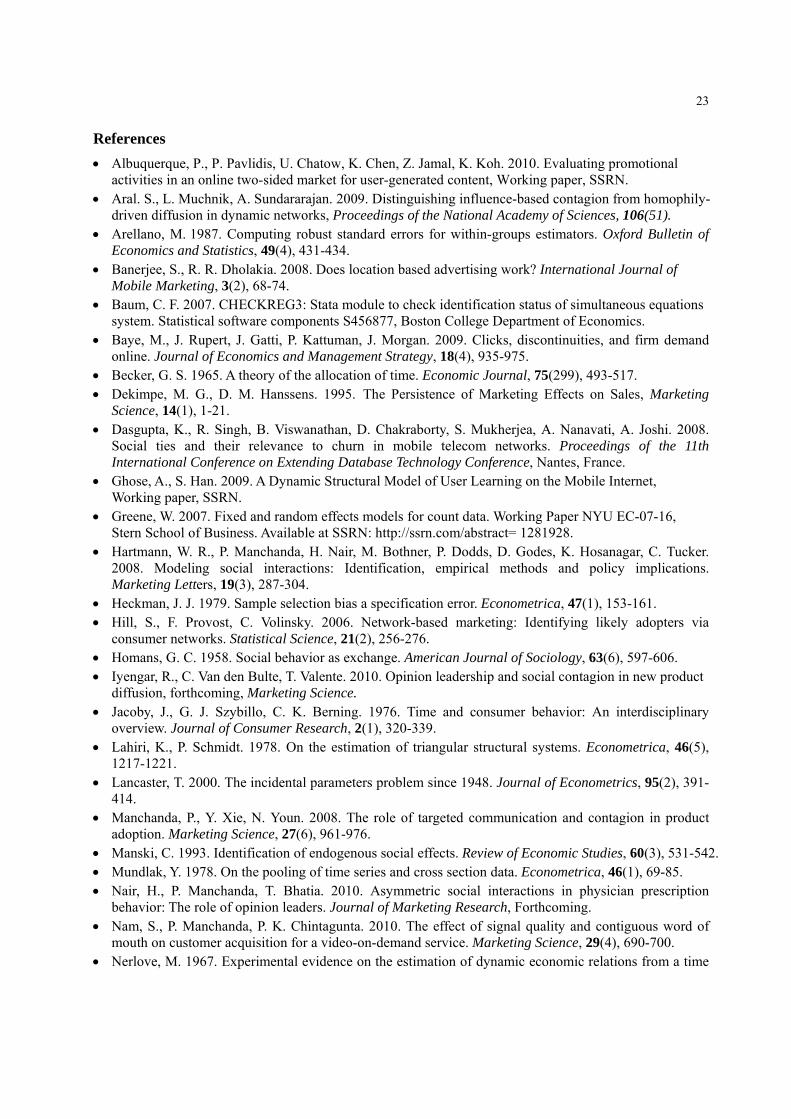
23
References • Albuquerque, P., P. Pavlidis, U. Chatow, K. Chen, Z. Jamal, K. Koh. 2010. Evaluating promotional
activities in an online two-sided market for user-generated content, Working paper, SSRN. • Aral. S., L. Muchnik, A. Sundararajan. 2009. Distinguishing influence-based contagion from homophily-
driven diffusion in dynamic networks, Proceedings of the National Academy of Sciences, 106(51). • Arellano, M. 1987. Computing robust standard errors for within-groups estimators. Oxford Bulletin of
Economics and Statistics, 49(4), 431-434. • Banerjee, S., R. R. Dholakia. 2008. Does location based advertising work? International Journal of
Mobile Marketing, 3(2), 68-74. • Baum, C. F. 2007. CHECKREG3: Stata module to check identification status of simultaneous equations
system. Statistical software components S456877, Boston College Department of Economics. • Baye, M., J. Rupert, J. Gatti, P. Kattuman, J. Morgan. 2009. Clicks, discontinuities, and firm demand
online. Journal of Economics and Management Strategy, 18(4), 935-975. • Becker, G. S. 1965. A theory of the allocation of time. Economic Journal, 75(299), 493-517. • Dekimpe, M. G., D. M. Hanssens. 1995. The Persistence of Marketing Effects on Sales, Marketing
Science, 14(1), 1-21. • Dasgupta, K., R. Singh, B. Viswanathan, D. Chakraborty, S. Mukherjea, A. Nanavati, A. Joshi. 2008.
Social ties and their relevance to churn in mobile telecom networks. Proceedings of the 11th International Conference on Extending Database Technology Conference, Nantes, France.
• Ghose, A., S. Han. 2009. A Dynamic Structural Model of User Learning on the Mobile Internet, Working paper, SSRN.
• Greene, W. 2007. Fixed and random effects models for count data. Working Paper NYU EC-07-16, Stern School of Business. Available at SSRN: http://ssrn.com/abstract= 1281928.
• Hartmann, W. R., P. Manchanda, H. Nair, M. Bothner, P. Dodds, D. Godes, K. Hosanagar, C. Tucker. 2008. Modeling social interactions: Identification, empirical methods and policy implications. Marketing Letters, 19(3), 287-304.
• Heckman, J. J. 1979. Sample selection bias a specification error. Econometrica, 47(1), 153-161. • Hill, S., F. Provost, C. Volinsky. 2006. Network-based marketing: Identifying likely adopters via
consumer networks. Statistical Science, 21(2), 256-276. • Homans, G. C. 1958. Social behavior as exchange. American Journal of Sociology, 63(6), 597-606. • Iyengar, R., C. Van den Bulte, T. Valente. 2010. Opinion leadership and social contagion in new product
diffusion, forthcoming, Marketing Science. • Jacoby, J., G. J. Szybillo, C. K. Berning. 1976. Time and consumer behavior: An interdisciplinary
overview. Journal of Consumer Research, 2(1), 320-339. • Lahiri, K., P. Schmidt. 1978. On the estimation of triangular structural systems. Econometrica, 46(5),
1217-1221. • Lancaster, T. 2000. The incidental parameters problem since 1948. Journal of Econometrics, 95(2), 391-
414. • Manchanda, P., Y. Xie, N. Youn. 2008. The role of targeted communication and contagion in product
adoption. Marketing Science, 27(6), 961-976. • Manski, C. 1993. Identification of endogenous social effects. Review of Economic Studies, 60(3), 531-542. • Mundlak, Y. 1978. On the pooling of time series and cross section data. Econometrica, 46(1), 69-85. • Nair, H., P. Manchanda, T. Bhatia. 2010. Asymmetric social interactions in physician prescription
behavior: The role of opinion leaders. Journal of Marketing Research, Forthcoming. • Nam, S., P. Manchanda, P. K. Chintagunta. 2010. The effect of signal quality and contiguous word of
mouth on customer acquisition for a video-on-demand service. Marketing Science, 29(4), 690-700. • Nerlove, M. 1967. Experimental evidence on the estimation of dynamic economic relations from a time

24
series of cross sections. Econometrica, 39(March), 359-387. • Nickell, S. 1981. Biases in dynamic models with fixed effects. Econometrica, 49(6), 1417-1426. • O’Hara, K., A. Mitchell, A. Vorbau. 2007. Consuming Video on Mobile Devices. Proceedings of the
SIGCHI Conference on Human Factors in Computing Systems, San Jose, California, USA. • Osborne, M. 2007. Consumer Learning, Switching Costs, and Heterogeneity: A Structural Examination,
No 200710, EAG Discussions Papers, Department of Justice, Antitrust Division, http://econpapers.repec.org/RePEc:doj:eagpap:200710.
• Oestreicher-Singer, G., and Sundararajan, A. 2010. The Visible Hand of Social Networks in Electronic Markets. Working Paper, SSRN.
• Puhani, P. 2000. The Heckman correction for sample selection and its critique. Journal of Economic Surveys, 14(1), 53-68.
• Rethink Wireless. 2010. AT&T will use new device formats to introduce usage-based pricing. http://www.rethink-wireless.com/article.asp?article_id=2722.
• Shim, J. P., S. Park, J. M. Shim. 2008. Mobile TV phone: current usage, issues, and strategic implications. Industrial Management and Data Systems, 108(9), 1269-1282.
• Stewart, M. B. 2006. Maximum simulated likelihood estimation of random–effects dynamic probit models with autocorrelated errors. The Stata Journal, 6(2), 256-272.
• Stewart, M. B. 2007. The interrelated dynamics of unemployment and low-wage employment. Journal of Applied Econometrics, 22(3), 511-531.
• Susarla, A., J. Oh, Y. Tan. 2010. Social Networks and the Diffusion of User-Generated Content: Evidence from YouTube. Information Systems Research, Forthcoming.
• Trusov, M., A. V. Bodapati, R. E. Bucklin. 2010. Determining Influential Users in Internet Social Networks. Journal of Marketing Research, 47(4), 643-658.
• Tucker, C. 2008. Identifying formal and informal influence in technology adoption with network externalities. Management Science, 54(12), 2024-2038.
• Van den Bulte, C., G. Lilien. 2001. Medical innovation revisited: Social contagion versus marketing effort. American Journal of Sociology, 106(5), 1409-1435.
• Vanhonacker, W. R., V. Mahajan, B. J. Bronnenberg. 2000. The Emergence of Market Structure in New Repeat-Purchase Categories: The Interplay of Market Share and Retailer Distribution, Journal of Marketing Research, 37(1), 16-31.
• Verbeek, M. 1990. On the estimation of a fixed effects model with selectivity bias. Economics Letters, 34(3), 267-270.
• Verbeek, M., T. Nijman. 1996. Incomplete panels and selection bias, in Mátyás, L., P. Sevestre (Eds.). The Econometrics of Panel Data: A Handbook of the Theory with Applications. Kluwer Academic Publishers, Dordrecht, 449-490.
• Wooldridge, J. M. 2002. Econometric Analysis of Cross section and Panel Data, MIT Press, MA. • Xia, M., Y. Huang, W. Duan, A. B. Whinston. 2007. To share or not to share? An empirical analysis on
user decisions in online sharing communities. Working paper, SSRN. • Zabel, J. E. 1992. Estimating fixed and random effects models with selectivity. Economics Letters, 40(3),
269-272.

25
Figure 1: Aggregate-Level Mobile Internet Activity Frequency Series Plot
Notes: Vertical dotted lines represent Sundays. Mobile Internet activity during weekdays is generally higher than that during weekends except the national holidays (e.g., Day 50 – Children’s day, Day 57 – Buddha’s birthday, Day 83 – Memorial Day).
Figure 2: Individual-Level Mobile Internet Activity Frequency Series Plots
Interdependence between Content Generation and Usage
Mobile Internet Session Initiation and Content Usage
80,000
100,000120,000
1,500
2,000
2,500
Upl
oad
Fre
quen
cyD
ownl
oad
Freq
uenc
y
1 30 60 90
Days
020
4060
8010
0Fr
eque
ncy
0 5 10 15week
upload download
user 9116Plot 1:
020
4060
Freq
uenc
y
0 5 10 15week
user 1927
020
4060
Freq
uenc
y
0 5 10 15week
user 3186Plot 2a: Plot 2b:
Download

26
Table 2: Summary Statistics
Variable Observations Mean Std. dev.
Weekly, User-Specific Content Activity Data Num. of Mobile Internet session Activation 2,340,000 4.00 41.38 Num. of Uploading 610,809 0.27 3.54 Num of Downloading 610,809 22.57 86.80
Weekly, User-Specific Call Data Num. of Calls Made 900,000 11.88 16.32 Call Duration (Hours) 900,000 2.61 5.68
Weekly, User-Specific Geographical Data Mean Local Mobility 900,000 14.04 13.18 Mean National Mobility 900,000 5.91 2.88 Local Mobility Dispersion 900,000 2.85 3.83 National Mobility Dispersion 900,000 0.70 0.80
User Characteristics Age 180,000 30.13 5.91 Sex (1 = Male, 0 = Female) 180,000 0.53 0.50 Handset Age (Months) 180,000 9.63 3.97
Notes: We observe content generation and usage data only when a user starts mobile Internet sessions, thus the number of uploading and the number of downloading are lower than the number of sessions.
Table 3: 3SLS Estimation Results on Content Frequency (Total Sample)
Dependent Variable
Explanatory Variable Coefficient
Log Upload Frequency (t)
Log Download Frequency (t-1) -0.0091 (0.0005)***
Log Upload Frequency by NN (t-1) 0.0115 (0.0042)***
Selection (t) 0.0216 (0.0007)***
Log Download Frequency (t)
Log Upload Frequency (t-1) -0.0178 (0.0073)***
Log Download Frequency by NN (t-1) 0.0143 (0.0047)***
Selection (t) 0.7267 (0.0026)***
Notes: NN refers to network neighbors. Estimates for time-period fixed effects and mean uploading and downloading frequency of all other users in user i’s billing zip code effects are not reported due to brevity. *** denotes significant at 0.01.

27
Table 4: 3SLS Estimation Results on Content Frequency
Dependent Variable
Explanatory Variables Coefficient
Log Upload
Frequency (t)
Log Download Freq. (t-1) -0.0098 (0.0005)***
-0.0098 (0.0005)***
-0.0097 (0.0005)***
-0.0097 (0.0005)***
Log Mean Local Mobility (t) 0.0087 (0.0014)***
Log Mean National Mobility (t) 0.0163 (0.0025)***
Log Local Mobility Dispersion (t) 0.0057 (0.0016)***
Log National Mobility Dispersion (t) 0.0057 (0.0012)***
Log Number of Voice Calls (t) 0.0010 (0.0007)
0.0013 (0.0007)*
0.0018 (0.0007)***
0.0010 (0.0007)
Log Upload Freq. by NN (t-1) 0.0162 (0.0054)***
0.0163 (0.0054)***
0.0163 (0.0054)***
0.0163 (0.0054)***
Selection (t) 0.0118 (0.0004)***
0.0116 (0.0004)***
0.0126 (0.0004)***
0.0130 (0.0004)***
Log Download
Frequency (t)
Log Upload Freq. (t-1) -0.0239 (0.0092)***
-0.0238 (0.0092)***
-0.0234 (0.0091)***
-0.0234 (0.0091)***
Log Mean Local Mobility (t) 0.0193 (0.0057)***
Log Mean National Mobility (t) 0.0218 (0.0098)**
Log Local Mobility Dispersion (t) 0.0328 (0.0065)***
Log National Mobility Dispersion (t) 0.0218 (0.0047)***
Log Number of Voice Calls (t) 0.0385 (0.0027)***
0.0401 (0.0026)***
0.0377 (0.0026)***
0.0356 (0.0028)***
Log Download Freq. by NN (t-1) 0.0348 (0.0057)***
0.0348 (0.0057)***
0.0348 (0.0057)***
0.0348 (0.0057)***
Selection (t) 0.3633 (0.0014)***
0.3635 (0.0014)***
0.3658 (0.0014)***
0.3666 (0.0014)***
Notes: We included each one of the two mean mobility metrics and the two mobility dispersion metrics in our main equations at both the local and national levels. NN refers to network neighbors. Estimates for time-period fixed effects and mean uploading and downloading frequency of all other users in user i’s billing zip code effects are not reported due to brevity. *** denotes significant at 0.01, ** denotes significant at 0.05, * denotes significant 0.1.

28
Appendix A: Table 1. Notations and Variable Descriptions
Session , Whether user i started mobile Internet sessions in week t (1 = Yes, 0 = No)
Social Network Session ,Weighted average number of mobile Internet session initiations by network neighbors of user i at time t-1. That is, ∑ w , , Session ,
n i User i’s social network neighbors based on voice call records (i.e., users called by user i) in week t-1
Session , Whether user i’s social network neighbor m started his/her mobile Internet sessionsin week t-1(1 = Yes, 0 = No)
w , , Normalized number of calls user i made to user m in week t-1, that is, w , , is a fraction of voice calls from user i to user m in week t-1 with respect to the total voice calls originated from user i in week t-1
Age User i’s age
Sex User i’s sex (1 = Male, 0 = Female) Handset Age Months elapsed since user i’s handset was launched in the market
Socıal Network Sessıon Time mean mobile Internet session initiation by social network neighbors of user i
δ Unobservable, user-specific, time-invariant effect (δ IIN 0, σ ) where IIN is independent identical normal
λ Time-period fixed effects
z , Mean mobile Internet session initiation of all other users in user i’s billing zip codeη , Unobservable, individual-specific, time-specific effect (η , IIN 0, σ , σ is set
to 1 for normalization and δ are independent of η , ) θ Initial conditions parameter
Upload , Number of times user i uploaded content in week t Upload , Number of times user i’s network neighbor m uploaded content in week t-1
Download , Number of times user i downloaded content in week t Download , Number of times user i’s network neighbor m downloaded content in week t-1
Mean Mobility , Any one of following two mean mobility metrics - 1) Number of unique zip code-level locations from where user i placed calls in week t and 2) Number of unique province-/state-level locations from where user i placed calls in week t
Mobility Dispersion ,
Any one of following two mobility dispersion metrics - 1) Fraction of geographical deviation from one’s commonly visited places at zip code-level for a user in week t and 2) Fraction of geographical deviation from one’s commonly visited places at province-/state-level for a user in week t
Selection , Selection correction term for user i at time t
g , , h , Mean uploading and downloading frequencies of all other users in user i’s billing zip code area, respectively
β , γ Intercepts
κ , ψ User-specific dummies φ , τ Time-period dummies
η , , ν , , ε , Unobservable, user-specific, time-specific effect, η , IIN 0, σ , ν ,IIN 0, σ and ε , IIN 0, σ
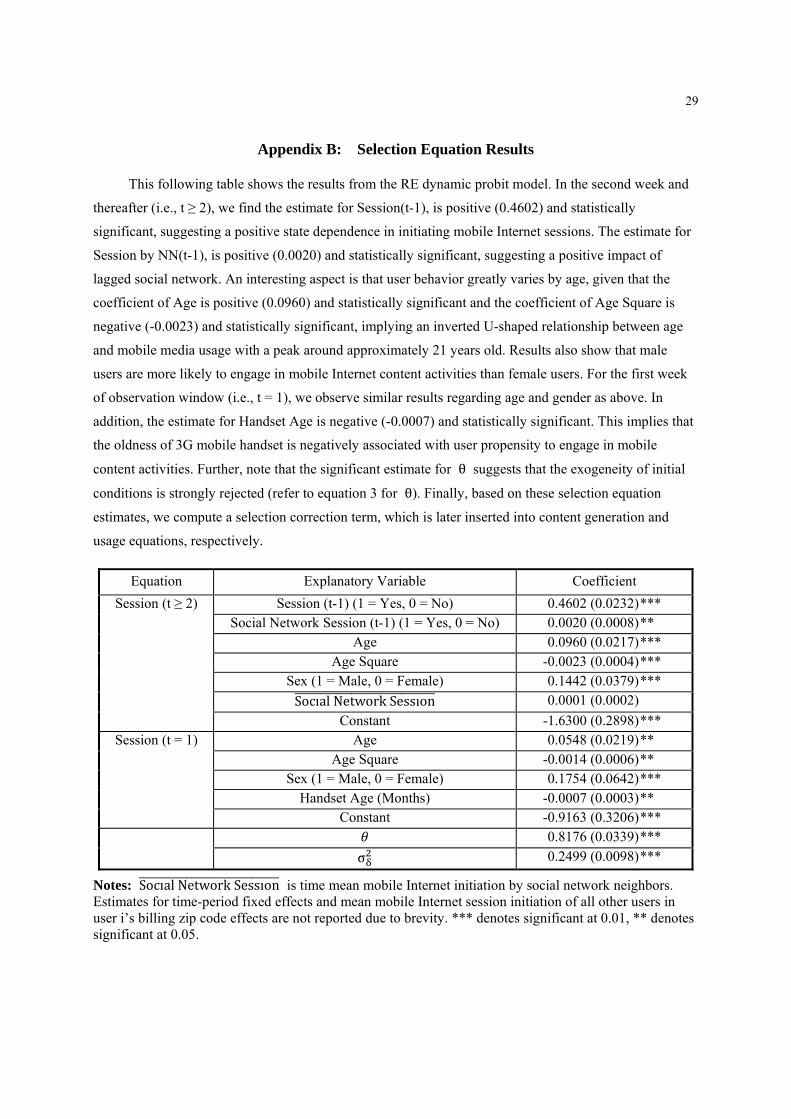
29
Appendix B: Selection Equation Results
This following table shows the results from the RE dynamic probit model. In the second week and
thereafter (i.e., t ≥ 2), we find the estimate for Session(t-1), is positive (0.4602) and statistically
significant, suggesting a positive state dependence in initiating mobile Internet sessions. The estimate for
Session by NN(t-1), is positive (0.0020) and statistically significant, suggesting a positive impact of
lagged social network. An interesting aspect is that user behavior greatly varies by age, given that the
coefficient of Age is positive (0.0960) and statistically significant and the coefficient of Age Square is
negative (-0.0023) and statistically significant, implying an inverted U-shaped relationship between age
and mobile media usage with a peak around approximately 21 years old. Results also show that male
users are more likely to engage in mobile Internet content activities than female users. For the first week
of observation window (i.e., t = 1), we observe similar results regarding age and gender as above. In
addition, the estimate for Handset Age is negative (-0.0007) and statistically significant. This implies that
the oldness of 3G mobile handset is negatively associated with user propensity to engage in mobile
content activities. Further, note that the significant estimate for θ suggests that the exogeneity of initial
conditions is strongly rejected (refer to equation 3 for θ). Finally, based on these selection equation
estimates, we compute a selection correction term, which is later inserted into content generation and
usage equations, respectively.
Equation Explanatory Variable Coefficient Session (t ≥ 2) Session (t-1) (1 = Yes, 0 = No) 0.4602 (0.0232) ***
Social Network Session (t-1) (1 = Yes, 0 = No) 0.0020 (0.0008) ** Age 0.0960 (0.0217) *** Age Square -0.0023 (0.0004) *** Sex (1 = Male, 0 = Female) 0.1442 (0.0379) *** Socıal Network Sessıon 0.0001 (0.0002) Constant -1.6300 (0.2898) ***
Session (t = 1) Age 0.0548 (0.0219) ** Age Square -0.0014 (0.0006) ** Sex (1 = Male, 0 = Female) 0.1754 (0.0642) *** Handset Age (Months) -0.0007 (0.0003) ** Constant -0.9163 (0.3206) *** 0.8176 (0.0339) ***
σ 0.2499 (0.0098) ***
Notes: Socıal Network Sessıon is time mean mobile Internet initiation by social network neighbors. Estimates for time-period fixed effects and mean mobile Internet session initiation of all other users in user i’s billing zip code effects are not reported due to brevity. *** denotes significant at 0.01, ** denotes significant at 0.05.

30
Appendix C: Robustness Check Results
Table C1: GMM-based Dynamic Panel Data Model Results on Content Frequency Dependent Variable
Explanatory Variables Coefficient
Log Upload
Frequency (t)
Log Upload Freq. (t-1) 0.0744 (0.0054)***
0.0748 (0.0057)***
0.0735 (0.0051)***
0.0735 (0.0051)***
Log Download Freq. (t-1) -0.0234 (0.0011)***
-0.0234 (0.0011)***
-0.0234 (0.0011)***
-0.0234 (0.0011)***
Log Mean Local Mobility (t) 0.0127 (0.0038)***
Log Mean National Mobility (t) 0.0190 (0.0076)***
Log Local Mobility Dispersion (t) 0.0068 (0.0040)*
Log National Mobility Dispersion (t) 0.0037 (0.0019)*
Log Number of Voice Calls (t) 0.0040 (0.0019)**
0.0030 (0.0015)**
0.0055 (0.0026)**
0.0045 (0.0016)***
Log Upload Freq. by NN (t-1) 0.0300 (0.0098)***
0.0298 (0.0099)***
0.0301 (0.0098)***
0.0302 (0.0098)***
Log Download
Frequency (t)
Log Download Freq. (t-1) 0.1093 (0.0054)***
0.1109 (0.0055)***
0.1051 (0.0054)***
0.1054 (0.0057)***
Log Upload Freq. (t-1) -0.1840 (0.0157)***
-0.1842 (0.0156)***
-0.1820 (0.0156)***
-0.1823 (0.0156)***
Log Mean Local Mobility (t) 0.0149 (0.0018)***
Log Mean National Mobility (t) 0.0314 (0.0034)***
Log Local Mobility Dispersion (t) 0.0231 (0.0039)***
Log National Mobility Dispersion (t) 0.0112 (0.0030)***
Log Number of Voice Calls (t) 0.0175 (0.0063)***
0.0209 (0.0061)***
0.0357 (0.0077)***
0.0271 (0.0085)***
Log Download Freq. by NN (t-1) 0.0432 (0.0105)***
0.0438 (0.0107)***
0.0428 (0.0106)***
0.0432 (0.0110)***
Notes: We included each one of the two mean mobility metrics and the two mobility dispersion metrics in our main equations at both the local and national levels. NN refers to network neighbors. Estimates for time-period fixed effects and mean uploading and downloading frequency of all other users in user i’s billing zip code effects are not reported due to brevity. *** denotes significant at 0.01, ** denotes significant at 0.05, * denotes significant at 0.1. .

31
Table C2: Alternative Model Results on Content Frequency (Mixed Effect Model and Poisson Fixed Effect Model)
Dependent Variable
Explanatory Variables Coefficient Mixed Effect Model
(with Random Coefficients on Constant Terms) Poisson Fixed Effect Model
Log
Upload Frequency (t)
Log Upload Freq. (t-1) 0.6512(0.0022)***
0.6517(0.0022)***
0.6527(0.0022)***
0.6517(0.0022)***
0.0011(0.0001)***
0.0011 (0.0001)***
0.0011(0.0001)***
0.0010 (0.0001)***
Log Download Freq. (t-1) -0.0069(0.0007)***
-0.0068(0.0007)***
-0.0068(0.0007)***
-0.0068(0.0007)***
-3.6e-4(6.0e-5)***
-3.7e-4 (6.0e-5)***
-3.5e-4(6.0e-5)***
-3.6e-4 (6.0e-5)***
Log Mean Local Mobility (t) 0.0064(0.0017)*** 0.0313
(0.0044)*** Log Mean National Mobility (t) 0.0083
(0.0038)** 0.2621(0.0210)***
Log Local Mobility Dispersion (t) 0.0002(0.0018) 0.0124
(0.0028)***Log National Mobility Dispersion (t) 0.0012
(0.0012)0.0678 (0.0091)***
Log Number of Voice Calls (t) -0.00011(0.00015)
-0.00006(0.00005)
-0.00003(0.00004)
-0.00006(0.00005)
0.0073(0.0006)***
0.0073(0.0006)***
0.0066(0.0008)***
0.0075 (0.0006)***
Log Upload Freq. by NN (t-1) 0.0405(0.0061)***
0.0408(0.0061)***
0.0409(0.0061)***
0.0408(0.0061)***
0.0052(0.0015)***
0.0052(0.0015)***
0.0046(0.0015)***
0.0047 (0.0015)***
Log Download
Frequency (t)
Log Download Freq. (t-1) 0.6671(0.0021)***
0.6673(0.0021)***
0.6672(0.0021)***
0.6673(0.0021)***
5.4e-6 (7.7e-7)***
5.7e-6 (7.7e-7)***
5.3e-6 (7.7e-7)***
5.2e-6 (7.7e-7)***
Log Upload Freq. (t-1) -0.0281(0.0108)***
-0.0279(0.0108)***
-0.0277(0.0108)**
-0.0276(0.0108)***
-0.0011(0.0003)***
-0.0011(0.0003)***
-0.0012(0.0003)***
-0.0012 (0.0003)***
Log Mean Local Mobility (t) 0.0326(0.0067)*** 0.0057
(0.0006)*** Log Mean National Mobility (t) 0.0439
(0.0144)*** 0.0432(0.0020)***
Log Local Mobility Dispersion (t) 0.0092(0.0069) 0.0007
(0.0002)***Log National Mobility Dispersion (t) 0.0104
(0.0045)***0.0120
(0.0009)*** Log Number of Voice Calls (t) 0.0009
(0.0002)***0.0011
(0.0002)***0.0013
(0.0002)*** 0.0010
(0.0002)***0.0010
(0.0001)***0.0010
(0.0001)***0.0011
(0.0001)***0.0011
(0.0001)*** Log Download Freq. by NN (t-1) 0.0275
(0.0037)***0.0283
(0.0037)***0.0285
(0.0037)*** 0.0278
(0.0037)***7.0e-5
(2.7e-5)***7.0e-5
(2.7e-5)***7.0e-5
(2.7e-5)***7.0e-5
(2.7e-5)*** Notes: We included each one of the two mean mobility metrics and the two mobility dispersion metrics in our main equations at both the local and national levels. NN refers to network neighbors. Estimates for time-period fixed effects and mean uploading and downloading frequency of all other users in user i’s billing zip code effects are not reported due to brevity. *** denotes significant at 0.01, ** denotes significant at 0.05.

0
Table C3: GMM-based Dynamic Panel Data Model Results on Content Share Dependent Variable
Explanatory Variables Coefficient
Upload Share (t)
Download Share (t-1) -0.1190 (0.0120)***
-0.1199 (0.0120)***
-0.1199 (0.0120)***
-0.1191 (0.0120)***
Mean Local Mobility (t) 0.0006 (0.0002)***
Mean National Mobility (t) 0.0033 (0.0009)***
Local Mobility Dispersion (t) 0.0002 (0.0001)**
National Mobility Dispersion (t) 0.0004 (0.0002)**
Number of Voice Calls (t) 8.0e-5 (2.0e-5)***
6.0e-5 (2.0e-5)***
7.0e-5 (2.0e-5)***
4.0e-5 (1.0e-5)***
Upload Share by NN (t-1) 0.0797 (0.0047)***
0.0798 (0.0047)***
0.0801 (0.0047)***
0.0800 (0.0047)***
Notes: We included each one of the two mean mobility metrics and the two mobility dispersion metrics in our main equations at both the local and national levels. NN refers to network neighbors. Estimates for time-period fixed effects are not reported due to brevity. *** denotes significant at 0.01.
Table C4: 3SLS Estimation Results on Content Size Dependent Variable
Explanatory Variable Coefficient
Log Upload Size (t) Log Download Size (t-1) -0.0166 (0.0010)***
Log Upload Size by NN (t-1) 0.0027 (0.0039)
Selection (t) 0.0159 (0.0023)***
Log Download Size (t) Log Upload Size (t-1) -0.0477 (0.0033)***
Log Download Size by NN (t-1) 0.0034 (0.0072)
Selection (t) 0.0534 (0.0041)**
Notes: We used 13 week sample. NN refers to network neighbors. Estimates for time-period fixed effects are not reported only due to brevity. *** denotes significant at 0.01, ** denotes significant at 0.05.