US-China Education Review 2014(4B)
70
-
Upload
independent -
Category
Documents
-
view
1 -
download
0
Transcript of US-China Education Review 2014(4B)
US-China
Education Review
B
Volume 4, Number 4, April 2014 (Serial Number 35)
David Publishing Company
www.davidpublishing.com
PublishingDavid
Publication Information: US-China Education Review B (Earlier title: Journal of US-China Education Review, ISSN 1548-6613) is published monthly in hard copy (ISSN 2161-6248) by David Publishing Company located at 240 Nagle Avenue #15C, New York, NY 10034, USA. Aims and Scope: US-China Education Review B, a monthly professional academic journal, covers all sorts of education-theory researches on Higher Education, Higher Educational Management, Educational Psychology, Teacher Education, Curriculum and Teaching, Educational Technology, Educational Economics and Management, Educational Theory and Principle, Educational Policy and Administration, Sociology of Education, Educational Methodology, Comparative Education, Vocational and Technical Education, Special Education, Educational Philosophy, Elementary Education, Science Education, Lifelong Learning, Adult Education, Distance Education, Preschool Education, Primary Education, Secondary Education, Art Education, Rural Education, Environmental Education, Health Education, History of Education, Education and Culture, Education Law, Educational Evaluation and Assessment, Physical Education, Educational Consulting, Educational Training, Moral Education, Family Education, as well as other issues. Editorial Board Members: Asst. Prof. Dr. Güner Tural Associate Prof. Rosalinda Hernandez Prof. Aaron W. Hughey Prof. Alexandro Escudero Prof. Cameron Scott White Prof. Deonarain Brijlall Prof. Diane Schwartz Prof. Ghazi M. Ghaith Prof. Gil-Garcia, Ana Prof. Gordana Jovanovic Dolecek Prof. Grigorios Karafillis Prof. James L. Morrison Prof. Käthe Schneider Prof. Lihshing Leigh Wang Prof. Mercedes Ruiz Lozano Prof. Michael Eskay Prof. Okechukwu Sunday Abonyi Prof. Peter Hills Prof. Smirnov Eugeny Prof. Yea-Ling Tsao Manuscripts and correspondence are invited for publication. You can submit your papers via Web submission, or E-mail to [email protected] or [email protected]. Submission guidelines and Web submission system are available at http://www.davidpublishing.com. Editorial Office: 240 Nagle Avenue #15C, New York, NY 10034, USA Tel: 1-323-984-7526, 323-410-1082 Fax: 1-323-984-7374, 323-908-0457 E-mail: [email protected], [email protected], [email protected] Copyright©2014 by David Publishing Company and individual contributors. All rights reserved. David Publishing Company holds the exclusive copyright of all the contents of this journal. In accordance with the international convention, no part of this journal may be reproduced or transmitted by any media or publishing organs (including various Websites) without the written permission of the copyright holder. Otherwise, any conduct would be considered as the violation of the copyright. The contents of this journal are available for any citation. However, all the citations should be clearly indicated with the title of this journal, serial number and the name of the author. Abstracted/Indexed in: Database of EBSCO, Massachusetts, USA Chinese Database of CEPS, Airiti Inc. & OCLC Chinese Scientific Journals Database, VIP Corporation, Chongqing, P.R.C. Ulrich’s Periodicals Directory ASSIA Database and LLBA Database of ProQuest Excellent papers in ERIC Norwegian Social Science Data Service (NSD), Norway Universe Digital Library Sdn Bhd (UDLSB), Malaysia
Summon Serials Solutions Google Scholar J-GATE Scribd Digital Library Airiti Academic Key Electronic Journals Library (EZB) CiteFactor, USA
Subscription Information: Price (per year): Print $600 Online $480 Print and Online $800 David Publishing Company 240 Nagle Avenue #15C, New York, NY 10034, USA Tel: 1-323-984-7526, 323-410-1082 Fax: 1-323-984-7374, 323-908-0457 E-mail: [email protected]
David Publishing Companywww.davidpublishing.com
DAVID PUBLISHING
D
US-China Education Review
B Volume 4, Number 4, April 2014 (Serial Number 35)
Contents Teacher Education
Prospective Teachers’ Individual Innovativeness and Their Adopted Philosophies of Education 223
Mustafa Ilhan, Bayram Çetin, Seyfettin Arslan
Special Education
The Noumenic Methodology—Its Advancement in Gifted Children Special Education and Effects on Academic and Intellectual Performance of Gifted Children 245
Andrew Alexi Almazán Anaya
Educational Methodology
Opinions of School Administrators and Teachers on the Use of Social Media Platforms and Tools in Education 260
Mehmet Menteşe, Şefika Şule Erçetin
Sociology of Education
The Need for Transformational Leadership in Utilizing Abandoned Mining Holes as a Business Opportunity 268
Andriyansah, Tati Rajati, Fatia Fatimah
Comparative Education
Institutional Expansion of Private Higher Education: Comparison Between China and the US 276
Han Meng-jie, Zhang De-xiang
Education and Culture
On Scarlett’s Persistence in Gone With the Wind 282
Wang Xiao-yan, Tong Li-jun

US-China Education Review B, ISSN 2161-6248 April 2014, Vol. 4, No. 4, 223-244
Prospective Teachers’ Individual Innovativeness and Their
Adopted Philosophies of Education
Mustafa Ilhan
Dicle University,
Diyarbakir, Turkey
Bayram Çetin
Gaziantep University,
Gaziantep, Turkey
Seyfettin Arslan
Marmara University,
Istanbul, Turkey
The purposes of this study are: (a) to develop an instrument for measuring educational philosophies adopted by
prospective teachers; and (b) to identify the correlation between prospective teachers’ individual innovativeness and
their adopted philosophies of education. Based on the survey method, the study was conducted on a total of 310
prospective teachers (191 of them being female and the remaining 119 being male) who studied primary school
teaching at Marmara University during the spring term of the academic year 2011-2012. Expert review was done to
check the content and the face validity of the Philosophy Preference Assessment Scale (PPAS). An exploratory
factor analysis (EFA) was performed in order to check the construct validity of the scale. As a result of the EFA, a
39-item two-factor structure emerged, explaining 35.68% of variance. The emerging factors were called as
“contemporary philosophies of education” (CYPE) and “conventional philosophies of education” (CLPE). As a
result of reliability analysis, it was determined that internal consistency and split-half reliability coefficients were
fairly acceptable. The findings of the item analyses showed that all of the items were discriminatory. In light of
these findings, it can be argued that the scale is reliable and valid and can be used to measure educational
phisolophies adopted by prospective teachers. A canonical correlation analysis was conducted to examine the
correlation between the two data sets, namely “individual innovativeness” and “adopted philosophies of education”.
The former consisted of the variables “resistance to change” (RC), “opinion leadership” (OL), “openness to
experience” (OE), and “risk-taking” (RT), whereas the latter was comprised of the variables CYPE and CLPE.
According to the results obtained from the canonical correlation, it was found that the participants’ individual
innovativeness was significantly correlated with their adopted philosophies of education and that the amount of
shared variance between the two data sets was 55%.
Keywords: individual innovativeness, philosophies of education, prospective teachers
Introduction
We live in a world that requires constant changes and advances in science and technology and training the
type of individuals that can adapt themselves to changes (Un Acikgoz, 2011). Education is an important
element in the process of educating the type of individuals that can catch up with changes (Akkoyunlu &
Mustafa Ilhan, Ph.D. candidate, research assistant, Department of Primary Education, Ziya Gokalp Faculty of Education, Dicle University.
Bayram Çetin, Ph.D., associate professor, Department of Educational Sciences, Gaziantep Faculty of Education, Gaziantep University.
Seyfettin Arslan, Ph.D. candidate, research assisstant, Department of Primary Education, Atatürk Faculty of Education, Marmara University.
DAVID PUBLISHING
D
TEACHERS’ INNOVATIVENESS AND THEIR ADOPTED PHILOSOPHIES OF EDUCATION
224
Kurbanoğlu, 2002; Kuzubasioglu & Celebi, 2009). Education can condition society to change culture and
eliminate potential pains and problems of changing only through the kind of teachers that can comprehend what
change means and know their importance and functions in the process (Dogan, 2004). A teacher’s individual
innovativeness plays a key role in the extent to which he/she can adapt himself/herself to changes and
innovations (Adiguzel, 2012; Hermans, Tondeur, Braak, & Valcke, 2008). Innovativeness has been described
in different ways by different authors: Hurt, Joseph, and Cook (1977) described it as a willingness to change;
Agarwal and Prasad (1998) as the tendency to risk-taking, a quality possessed by not every person; and Berthon,
Hulbert, and Pitt (1999) as broadmindedness, entrepreneurship, willingness to change, and creativeness. Rogers
(2003) adopted a different approach to the matter and based his definition on the word “innovation”. According
to him, innovation is ideas, practices, or objects that are considered new by an individual, a group, or a society.
He maintained that it is only through the concept “innovativeness” that one can explain how these new ideas,
practices, and objects spread throughout and get accepted by a society. Accordingly, he described
innovativeness as one’s tendency to adopt an innovation earlier than other members of a society. All these
considered, innovativeness is an umbrella term that has a number of meanings, like risk-taking (Bhatnagar,
Misra, & Rao, 2000; Cowart, Fox, & Wilson, 2007), ability to cope with ambiguities (Rogers, 2003), openness
to experience (Berthon et al., 1999), facing mistakes (Khasawneh, 2008), creativeness (Lumpkin & Dess, 1996),
and opinion leadership. Similarly, different descriptions by various authors suggest that innovative individuals
are broadminded/entrepreneurial and creative (Berthon et al., 1999), that they can accept innovations in an
easier way and it takes them less time to adopt innovations, and that they are able to cope with ambiguities
(Rogers, 2003). Seeing that teaching is not a stationary profession and teachers need to update themselves in a
constant manner (Erciyes, 2006), it is essential that teachers should possess the skills included under the
umbrella term “individual innovativeness” (Yilmaz & Kocasarac, 2010). Nevertheless, individual,
organizational, or social factors sometimes put obstacles in the way of teachers’ individual innovativeness. In
particular, individual factors, like perception and attitude that form the basis of innovativeness, are among the
micro-level factors in blocking innovativeness (Kılıçer, 2011). Another individual factor in teachers’ individual
innovativeness is their educational beliefs (Clark & Peterson, 1986; Hermans et al., 2008; Higgins & Moseley,
2001; Pajares, 1992; Tobin & McRobbie, 1996). Depending on their educational beliefs, some teachers find it
easier to adapt themselves to innovations while others have more difficulties in catching up with them (Tondeur,
Hermans, Braak, & Valcke, 2008). Their educational beliefs, in turn, are shaped by their adopted philosophies
of education (Pajares, 1992; Rideout, 2006; Sang, Valcke, Braak, & Tondeur, 2009).
Philosophies of education deal with all educational theories and practices from a holistic perspective
(Erden, 1998), attempt to explain educational problems, concepts, ideas, and principles (Brauner & Burns,
1982), and shape educational policies and practices (Klein, 1977). Different educationalists have classified
philosophies of education in different ways. For instance, Wiles and Bondi (2007) grouped these philosophies
under six headings, namely perennialism, essentialism, progressivism, reconstructionism, naturalism, and
existentialism. On the other hand, Apps (1973) used five headings for the classification, namely perennialism,
essentialism, progressivism, reconstructionism, and existentialism. In parallel with this classification, Yilmaz,
Altinkurt, and Cokluk (2011) presented a five-dimensional structure about philosophies of education in their
study on developing a scale for revealing teachers’ educational beliefs. However, the classification that is the
most widely accepted in literature has four headings, namely, perennialism, essentialism, progressivism, and
reconstructionism (Demirel, 2010).

TEACHERS’ INNOVATIVENESS AND THEIR ADOPTED PHILOSOPHIES OF EDUCATION
225
Perennialism is based on idealism and realism (Isichei, 2006). According to this philosophy of education:
1. Human nature and moral values do not change from time to time or from society to society; they remain
the same (Martin & Loomis, 2012; Oliva, 2009). Therefore, the objective of education is to adjust men to the
truth which is eternal, rather than to the contemporary world (Crookees, 2009; Kneller, 1971);
2. Education is a preparation for life (Kuçukoglu & Bay, 2007; Martin & Loomis, 2012). Thus, a school
should not be a copy of life (Kneller, 1971), but a place where culture is passed down to future generations
(Erisen, 2004). From this point of view, perennialism is the oldest and most conservative philosophy of
education (Wiles & Bondi, 2007);
3. The objective is to provide students with an intellectual education (Demirel, 2010). To do this, students
should be made to read classics (Pazmiño, 2008).
Essentialism is based on idealism and realism (San Mateo & Tangco, 2003), too. According to this
philosophy of education:
1. The objectives of education are to educate individuals in accordance with social values, to enable them
to get socialized, and to help them develop mentally (Ornstein & Hunkins, 1998; Ornstein & Lewin, 2006);
2. Since educational system is the protector of social culture (Long, 1987), teachers should be
representatives of social culture and positive role models (Basaran, 2007);
3. It is teachers, not students, that are mainly responsible for the learning/teaching process (Dhawan, 2005).
Therefore, educational process should focus on teacher-centered conventional methods (San Mateo & Tangco,
2003);
4. The essence of the educational process is excellent internalization of subject focus (Strain, 1971). In this
respect, essentialism can be regarded as a subject or a discipline-centered philosophy of education (Kneller,
1971). Subjects introduced into the classroom should not be open to discussion; in contrast, they should stand
the test of time (Demirel, 2010).
Progressivism is based on pragmatism (D. H. Parkerson & J. A. Parkerson, 2008) and considered its
application in education (Sonmez, 2011). According to this philosophy of education:
1. The objectives of education are to improve democratic and social life (Apps, 1973; Ornstein & Hunkins,
1998), to inform students about the changeable nature of concepts, and to enable them to gain an open and
speculative perspective on knowledge (Erden, 1998);
2. The process is student-centered (Gutek, 1988). Therefore, students’ needs and requirements should be
taken into consideration (Dhawan, 2005; Joseph, 2000). A teacher functions as a mentor and guide (Ornstein &
Hunkins, 1998);
3. Education is not a preparation for life; education is life itself (Martin & Loomis, 2012). To ensure this,
the process should include situations that one is likely to encounter in real life (Lee, 2011);
4. The educational process thrives in a democratic environment, which ensures that students will be
affected by one another and that they will be able to express their opinions in a free way (Demirel, 2010;
Dhawan, 2005). In addition, it should include cooperative activities (Erden, 1998; Ergün, 2009), discovery
teaching strategy (Erden, 1998), and problem-solving techniques (Dhawan, 2005; Long, 1987).
Reconstructionism is based on pragmatism (Sonmez, 2011), too. According to this philosophy of
education:
1. Society will change not through policies but through education (Ergün, 2009). Therefore, the objectives
of education are to reconstruct society (Hewitt, 2006; Segall & Wilson, 2004) and to insert real democracy into
TEACHERS’ INNOVATIVENESS AND THEIR ADOPTED PHILOSOPHIES OF EDUCATION
226
social life (Erisen, 2004);
2. A schools is not an institution that pass down cultural heritage to future generations, but a place
responsible for social change (Isichei, 2006; Oliva, 2009). Therefore, teachers should be representatives of
change and reform (Demirel, 2010; Kneller, 1971);
3. The educational process should include such social, political, and economic problems as racism, hunger,
unemployment, and environmental pollution, and make students aware of the problems that threaten humanity
(Gutek, 1998; Martin & Loomis, 2012);
4. The learning/teaching process should draw on project-based learning and teachers should act as research
leaders and project managers (Ornstein & Hunkins, 1998).
It can be seen that perennialism and essentialism rely on idealism and realism. Both philosophies of
education attach importance to content (subjects) in the learning/teaching process. They regard students as
passive recipients of knowledge whereas teachers are accepted as active providers of knowledge. With
reference to the points they have in common, perennialism and essentialism are named “conventional
philosophies of education” (CLPE). On the other hand, progressivism and reconstructionism are based on
pragmatism. Both philosophies of education maintain that the learning/teaching process is student-centered. It
is essential that students should actively participate in the process and that teachers should guide them. With
reference to the points they have in common, progressivism and reconstructionism are called “contemporary
philosophies of education” (CYPE) (Ornstein & Hunkins, 1998).
A review of literature indicates that there are studies on prospective teachers’ adopted philosophies of
education and their individual innovativeness. Some of the studies on their adopted philosophies of education
are focused on whether their adopted philosophies of education and philosophical preferences differ depending
on demographic variables, such as gender, grade, and department (Cetin, Ilhan & Arslan, 2012; Ekiz, 2007;
Kucuk, Yangın, & Bag, 2011). On the other hand, some of the studies on prospective teachers’ philosophical
preferences are focused on the correlation between their adopted philosophical preferences and their identity
functions (Kocak, Ulusoy, & Onen, 2012), their attitudes towards the teaching profession (Cagirgan & Batdal,
2010), their adopted values (Duman, Aykac, & Celik, 2011), the extent to which they use instructional
technologies and the Internet (Duman & Ulubey, 2008), their attitudes towards using computer technologies
(Onen, 2012), the use of computers in the learning process (Ertmer, 1999), learning strategies and learning
styles (Duman, 2008), and their epistemological beliefs (Bicer, Er, & Ozel, 2013). There are fewer studies on
prospective teachers’ individual innovativeness when compared to the ones on their adopted philosophies of
education. Kılıçer (2011) studied the individual innovativeness profiles of prospective computer and
instructional technologies teachers, Adiguzel (2012) explored the correlation between prospective teachers’
individual innovativeness and their moral maturity, Kocak and Onen (2013) analyzed the basic technology
competency of student teachers according to their openness to individual innovations, whereas Cuhadar, Bulbul,
and Ilgaz (2013) explored the relationship between the individual innovativeness of pre-service teachers and
their competencies in techno-pedagogical education. It has been revealed that educational beliefs of teachers
and prospective teachers are shaped by their adopted philosophies of education (Livingston, McClain, &
DeSpain, 1995; Rideout, 2006; Sang et al., 2009) and these educational beliefs play a decisive role in the extent
to which they can adapt themselves to innovations (Clark & Peterson, 1986; Tobin & McRobbie, 1996).
According to Pajares (1992), teachers interpret innovations according to their personal beliefs. In other
words, teachers accept more easily innovations that are in accordance with their personal conceptions of

TEACHERS’ INNOVATIVENESS AND THEIR ADOPTED PHILOSOPHIES OF EDUCATION
227
teaching and learning (Tondeur et al., 2008). Thus, the integration of educational innovations is doomed to fail
unless we understand teachers’ adopted philosophies of education (Trigwell, Prosser, & Taylor, 1994). Seeing
that prospective teachers’ willingness to put innovations into practice is a key factor in educational
development (Ghaith & Yaghi, 1997) and adoption of educational innovations can only be explained when
also educational beliefs of teachers are taken into account (Tondeur et al., 2008), it is important to study the
variables in their willingness to put innovations into practice and to analyze the correlation among the
variables, which may reveal what needs to be done to make educational innovations a success (Trigwell et al.,
1994). The theoretical knowledge suggests a correlation between prospective teachers’ individual
innovativeness and their adopted philosophies of education. Even so, it appears that the literature does not
include any empirical studies on how prospective teachers’ individual innovativeness is correlated with their
adopted philosophies of education. Thus, it is hoped that the present study will fill the gap in the literature. All
things considered, the purpose of the present study is to analyze the correlation between prospective teachers’
individual innovativeness and their adopted philosophies of education empirically. Hopefully, it will fill the
gap in the literature and present what needs to be done to integrate the rapid change in today’s world with
educational environments in a successful way. Based on the purpose of this study, the first step in the study
was to develop the Philosophy Preference Assessment Scale (PPAS), which is used for measuring prospective
teachers’ adopted philosophies of education in a valid and reliable way. The second step was to examine the
relationship between prospective teachers’ individual innovativeness and their adopted philosophies of
education.
Methodology
Population
The population of the study was comprised of a total of 310 prospective teachers (191 being female
(61.60%) and the remaining 119 being male (38.40%)) who studied primary school teaching at Marmara
University. This university is located in the city of Istanbul and attracts students from across Turkey. The
participants were randomly selected and distributed across departments as follows: 64 (20.60%) participants
from the Department of Science Teaching, 47 (15.20%) participants from the Department of Primary School
Math Teaching, 97 (31.30%) participants from the Department of Classroom Teaching, and 102 (32.90%)
participants from the Department of Social Studies Teaching. Their ages varied between 18 and 36, the mean
being 21.48.
Crowley and Lee (1992) argued that a sample with 300 participants is good for factor analysis (as cited in
Akbulut, 2010). In accordance with this argument, it can be said that the number of participants in the study
group is sufficient for a factor analysis. On the other hand, for the reliability of the findings obtained from
canonical correlation analysis, it is recommended that the number of participants to be included in the
population should be 20 times larger than the number of variables in the data sets. The study had four variables
in the data set “individual innovativeness”, namely “resistance to change” (RC), “opinion leadership” (OL),
“openness to experience” (OE), and “risk-taking” (RT), and another two variables in the data set “adopted
philosophies of education”, namely, CYPE and CLPE. The number of variables means that the study should
have at least 120 participants to ensure that the findings are reliable. Therefore, it can be argued that the number
of participants in the present study ensures that the findings are reliable.

TEACHERS’ INNOVATIVENESS AND THEIR ADOPTED PHILOSOPHIES OF EDUCATION
228
Data Collection Instruments
The data were collected through the Individual Innovativeness Scale (IIS) and the PPAS.
The IIS. The IIS is a self-report scale, in which individual innovativeness is measured through
participants’ own responses. It was developed by Hurt et al. (1977) and adapted to Turkish by Kılıçer and
Odabasi (2010). The original version was based on the 7-point Likert type and consisted of 20 items. It has
been tested for validity and reliability purposes by different authors on different samples. They have reported
different findings on the factor structure of the scale.
When Kılıçer and Odabasi (2010) adapted the scale to Turkish, they used the 5-point Likert type and
conducted an exploratory factor analysis (EFA) to analyze the scale’s construct validity. Their analysis
concluded that the scale had four factors that accounted for 52.52% of the total variance. The first factor, which
accounted for 13.67% of the total variance and contained eight items, was called RC. This dimension consisted
of items concerning individuals’ worries about change and innovation in general (Sample item: I think that it is
best to adopt an old lifestyle and to do things through old methods). The second factor, which accounted for
13.61% of the total variance and contained five items, was called OL. This dimension consisted of items
concerning individuals’ characteristics that enable them to lead others (Sample item: My friends often come
and ask for my suggestions or information). The third factor, which accounted for 12.97% of the total variance
and contained five items, was called OE. This dimension consisted of items concerning individuals’ willingness
to look for innovations and experiences (Sample item: While solving a question whose answer is ambiguous, I
often develop new methods). The fourth factor, which accounted for 9.28% of the total variance and contained
two items, was called RT. This dimension tested whether individuals gave up or got motivated when faced with
ambiguities (Sample item: Questions whose answers are ambiguous make me excited).
The internal consistency coefficients calculated by Kılıçer and Odabasi (2010) to test the reliability of the
Turkish version were 0.82, 0.81, 0.73, 0.77, and 0.62 for the whole scale and the sub-scales RC, OL, OE, and
RT respectively. On the other hand, the internal consistency coefficients calculated by the authors of the
present study were 0.82, 0.79, 0.65, 0.80, and 0.51 for the whole scale and the sub-scales RC, OL, OE, and RT
respectively. It is accepted that scales with a reliability coefficient of 0.70 or higher are reliable (Fraenkel,
Wallend, & Hyun, 2012; Nunnaly & Bernstein, 1994), which suggests that the whole scale and the sub-scales
RC and OE had sufficient reliability coefficients. In addition, it is accepted that scales with 10 or fewer items
should have a reliability coefficient of 0.60 and higher (Yurtkoru, Sipahi, & Cinko, 2010) or the correlations
between the items should be between 0.20 and 0.40 (Briggs & Cheek, 1986). In the present study, the
sub-scale OL was reliable, for it had a reliability coefficient higher than 0.60. Although the sub-scale RT had a
reliability coefficient lower than 0.60, the correlation between the items was 0.34, which suggests that it was
also reliable.
The PPAS. The PPAS was developed by the authors themselves. The analyses performed regarding the
development of PPAS and the related results have been presented in the “Findings” section.
Procedure
The data were obtained during the spring term of the academic year 2011-2012. Prior to the administration
of the data collection tools, the participants were informed about the aim of the research. They were also
informed that the collected data were to be used solely for research purposes and not shared with any
institutions or people. Similarly, prior to the administration phase, the participants were reminded that

TEACHERS’ INNOVATIVENESS AND THEIR ADOPTED PHILOSOPHIES OF EDUCATION
229
participation in the research was not compulsory and the sample comprised only volunteering prospective
teachers. The participants were asked to supply their demographic data, such as age, gender, and department in
the first part of the questionnaire. Two different paths can be followed in order to match IIS and PPAS scores
belonging to a certain participant: simultaneous administration of the two scales to pre-service teachers or
applying the measurement instruments to pre-service teachers at certain intervals after noting down their names.
However, it was thought that writing down the participants’ names would prevent pre-service teachers from
giving true responses. For this reason, the first path was followed and both scales were applied to pre-service
teachers at the same time. Most participants took 25-30 minutes to complete the questionnaires.
Data Analysis
The data were analyzed through Statistical Package for Social Sciences (SPSS 17.0). The EFA was
performed in order to check construct validity of PPAS. The reliability of PPAS was examined by means of
internal consistency and split-half methods. In order to determine the items’ discriminatory power, corrected
item total correlations were calculated and the upper and lower score groups each containing 27% of the total
groups were compared with each other.
A canonical correlation analysis was conducted to study the correlation between the prospective teachers’
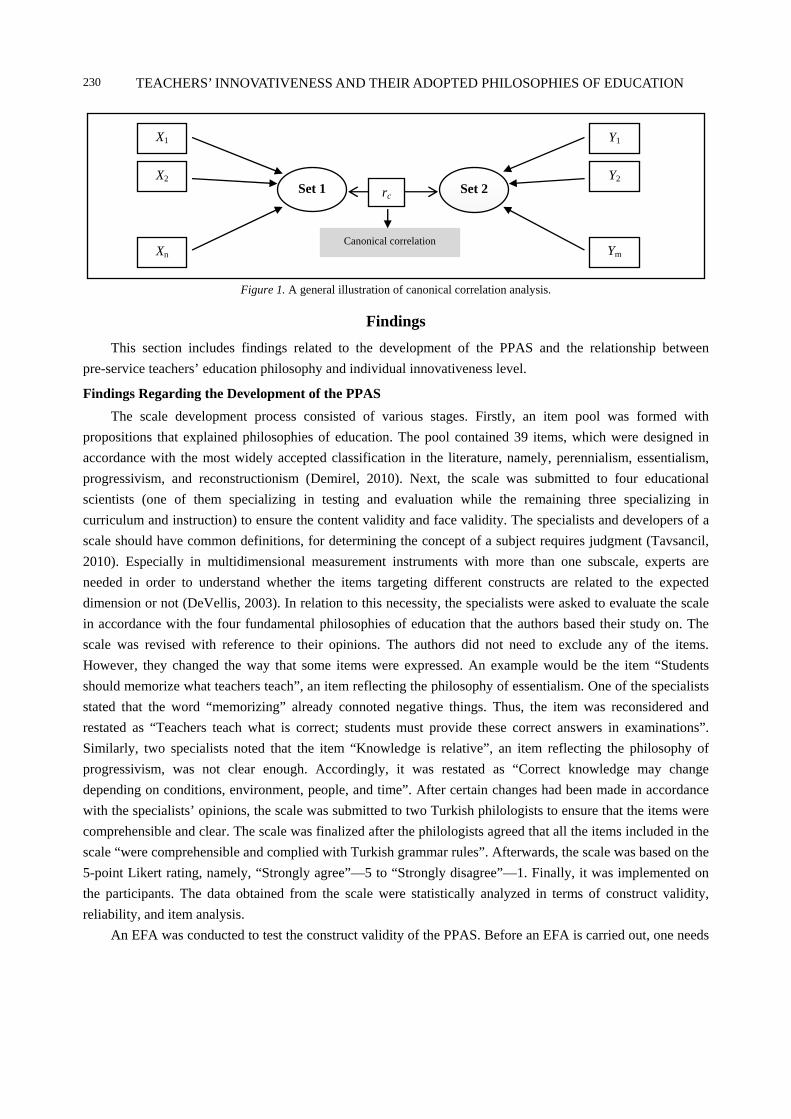
individual innovativeness and their adopted philosophies of education. Canonical correlation analysis (see
Figure 1) is used for studying the correlation between two data sets with at least two variables ((X1, X2, … Xn
and Y1, Y2, … Ym) and (n ≥ 2 and m ≥ 2)) (Bordens & Abbott, 2011). In this method, the correlation between
the two data sets is revealed through one single analysis. In this respect, it enables one to control type-1 error
that can intervene in the measurement (Stangor, 2010). In canonical correlation analysis, the first thing to do is
to derive linear composites that will maximize the correlation between the two data sets (Leech, Barlett, &
Morgan, 2005). These new variables that are derived from the linear composites of the variables are called
canonical variables (Afifi & Clark, 1996). The canonical variables on the right and left hands of the canonical
correlation equation are called a pair of canonical variables (Tabachnick & Fidell, 2007). The correlation
between pairs of canonical variables is called canonical function or canonical root (Sherry & Henson, 2005).
In canonical correlation analysis, the maximum number of pairs of canonical variables is equal to the number
of variables in the set of variable with the fewest variables (J. Cohen, P. Cohen, West, & Aiken, 2003). The
first pair of canonical variables derived from canonical correlation analysis should be calculated in a way that
will maximize the correlation between sets of variables (Afifi & Clark, 1996). Then, the second pair of
canonical variables is derived. The second pair exhibits the maximum correlation between two canonical
variables, not accounted for by the first pair of canonical variables (Stevens, 2009). The canonical correlation
decreases in value with each new function derived from two canonical variables (Hair, Black, Babin, &
Anderson, 2010). In practice, one interprets only the functions with statistically significant differences
between two canonical variables (Tabachnick & Fidell, 2007). Figure 1 presents a general illustration of
canonical correlation analysis.
The purpose of this study is to determine the correlation between the data set “individual innovativeness”,
which was comprised of the weighted combinations of the variables RC, OL, OE, and RT and the data set
“adopted philosophies of education”, which consisted of the weighted combinations of the variables CYPE and
CLPE. The two data sets contained four and two variables respectively, which meant that the maximum number
of pairs of canonical variables was two.
TEACHERS’ INNOVATIVENESS AND THEIR ADOPTED PHILOSOPHIES OF EDUCATION
230
Figure 1. A general illustration of canonical correlation analysis.
Findings
This section includes findings related to the development of the PPAS and the relationship between
pre-service teachers’ education philosophy and individual innovativeness level.
Findings Regarding the Development of the PPAS
The scale development process consisted of various stages. Firstly, an item pool was formed with
propositions that explained philosophies of education. The pool contained 39 items, which were designed in
accordance with the most widely accepted classification in the literature, namely, perennialism, essentialism,
progressivism, and reconstructionism (Demirel, 2010). Next, the scale was submitted to four educational
scientists (one of them specializing in testing and evaluation while the remaining three specializing in
curriculum and instruction) to ensure the content validity and face validity. The specialists and developers of a
scale should have common definitions, for determining the concept of a subject requires judgment (Tavsancil,
2010). Especially in multidimensional measurement instruments with more than one subscale, experts are
needed in order to understand whether the items targeting different constructs are related to the expected
dimension or not (DeVellis, 2003). In relation to this necessity, the specialists were asked to evaluate the scale
in accordance with the four fundamental philosophies of education that the authors based their study on. The
scale was revised with reference to their opinions. The authors did not need to exclude any of the items.
However, they changed the way that some items were expressed. An example would be the item “Students
should memorize what teachers teach”, an item reflecting the philosophy of essentialism. One of the specialists
stated that the word “memorizing” already connoted negative things. Thus, the item was reconsidered and
restated as “Teachers teach what is correct; students must provide these correct answers in examinations”.
Similarly, two specialists noted that the item “Knowledge is relative”, an item reflecting the philosophy of
progressivism, was not clear enough. Accordingly, it was restated as “Correct knowledge may change
depending on conditions, environment, people, and time”. After certain changes had been made in accordance
with the specialists’ opinions, the scale was submitted to two Turkish philologists to ensure that the items were
comprehensible and clear. The scale was finalized after the philologists agreed that all the items included in the
scale “were comprehensible and complied with Turkish grammar rules”. Afterwards, the scale was based on the
5-point Likert rating, namely, “Strongly agree”—5 to “Strongly disagree”—1. Finally, it was implemented on
the participants. The data obtained from the scale were statistically analyzed in terms of construct validity,
reliability, and item analysis.
An EFA was conducted to test the construct validity of the PPAS. Before an EFA is carried out, one needs
Kanonik
X1
X2
Xn
Y1
Y2
Ym
Set 1 Set 2 rc
Canonical correlation
TEACHERS’ INNOVATIVENESS AND THEIR ADOPTED PHILOSOPHIES OF EDUCATION
231
to identify whether the data set is suitable for factor analysis. The Kaiser-Meyer-Olkin (KMO) and Barlett’s
Test of Sphericity are two considerations in deciding whether the sample is suitable for data analysis. In order
for the sample size to be adequate for factor analysis, KMO values must be higher than 0.60 and results of
Bartlett’s Test of Sphericity must be significant (Buyukozturk, 2010). In the present study, the KMO coefficient
and Bartlett’s Test of Sphericity were 0.883 and 4879.799 (p < 0.001; df = 741) respectively. These values
suggest that the data were suitable for factor analysis. Afterwards, a two-factor structure was obtained as a
result of the principal components analysis and oblique rotation. The reason why this rotation technique was
used was that the factors in the scale were correlated with one another. The analyses yielded a two-factor
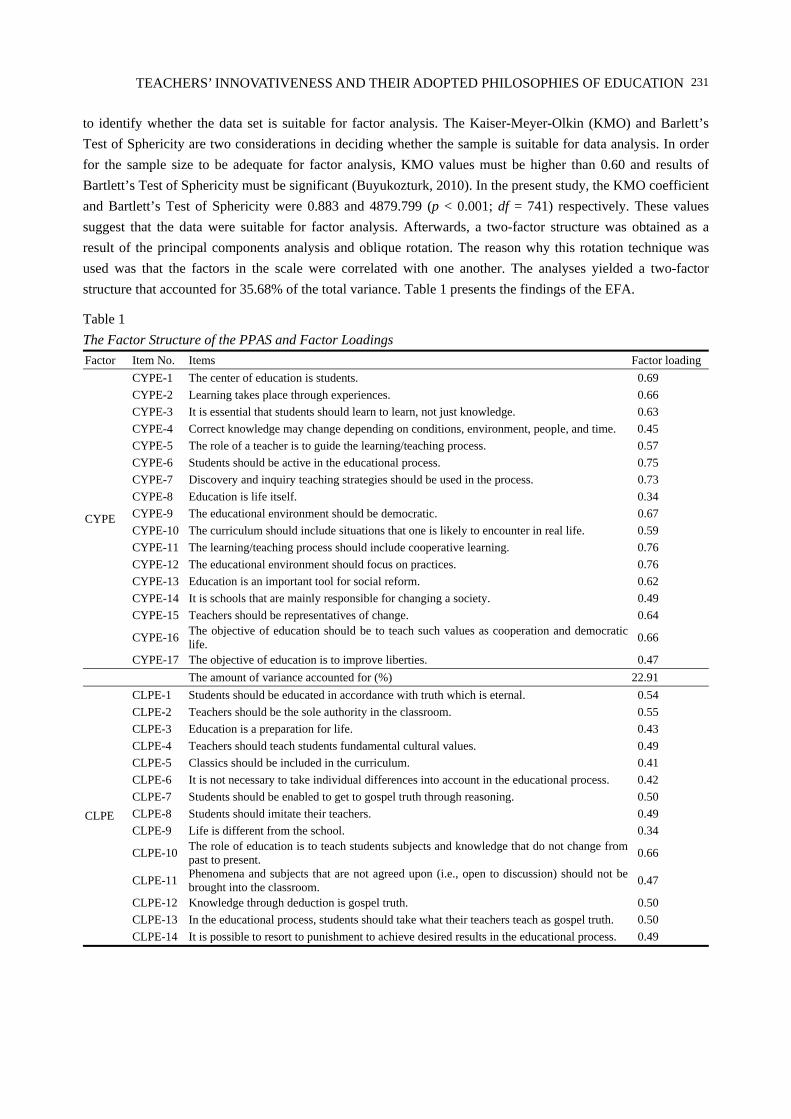
structure that accounted for 35.68% of the total variance. Table 1 presents the findings of the EFA.
Table 1
The Factor Structure of the PPAS and Factor Loadings
Factor Item No. Items Factor loading
CYPE
CYPE-1 The center of education is students. 0.69
CYPE-2 Learning takes place through experiences. 0.66
CYPE-3 It is essential that students should learn to learn, not just knowledge. 0.63
CYPE-4 Correct knowledge may change depending on conditions, environment, people, and time. 0.45
CYPE-5 The role of a teacher is to guide the learning/teaching process. 0.57
CYPE-6 Students should be active in the educational process. 0.75
CYPE-7 Discovery and inquiry teaching strategies should be used in the process. 0.73
CYPE-8 Education is life itself. 0.34
CYPE-9 The educational environment should be democratic. 0.67
CYPE-10 The curriculum should include situations that one is likely to encounter in real life. 0.59
CYPE-11 The learning/teaching process should include cooperative learning. 0.76
CYPE-12 The educational environment should focus on practices. 0.76
CYPE-13 Education is an important tool for social reform. 0.62
CYPE-14 It is schools that are mainly responsible for changing a society. 0.49
CYPE-15 Teachers should be representatives of change. 0.64
CYPE-16 The objective of education should be to teach such values as cooperation and democratic life.
0.66
CYPE-17 The objective of education is to improve liberties. 0.47
The amount of variance accounted for (%) 22.91
CLPE
CLPE-1 Students should be educated in accordance with truth which is eternal. 0.54
CLPE-2 Teachers should be the sole authority in the classroom. 0.55
CLPE-3 Education is a preparation for life. 0.43
CLPE-4 Teachers should teach students fundamental cultural values. 0.49
CLPE-5 Classics should be included in the curriculum. 0.41
CLPE-6 It is not necessary to take individual differences into account in the educational process. 0.42
CLPE-7 Students should be enabled to get to gospel truth through reasoning. 0.50
CLPE-8 Students should imitate their teachers. 0.49
CLPE-9 Life is different from the school. 0.34
CLPE-10 The role of education is to teach students subjects and knowledge that do not change from past to present.
0.66
CLPE-11 Phenomena and subjects that are not agreed upon (i.e., open to discussion) should not be brought into the classroom.
0.47
CLPE-12 Knowledge through deduction is gospel truth. 0.50
CLPE-13 In the educational process, students should take what their teachers teach as gospel truth. 0.50
CLPE-14 It is possible to resort to punishment to achieve desired results in the educational process. 0.49
TEACHERS’ INNOVATIVENESS AND THEIR ADOPTED PHILOSOPHIES OF EDUCATION
232
(Table 1 to be continued)
CLPE
CLPE-15 Expository teaching approach should be used in the educational process. 0.58
CLPE-16 School is not a place for reform. 0.36
CLPE-17 By its very nature, learning involves coercion and strict disciplinary rules. 0.51
CLPE-18 The role of a teacher in the classroom is to convey knowledge. 0.69
CLPE-19 The essence of the educational process is excellent internalization of subject focus. 0.61
CLPE-20 Human mind is inherently empty; all information can be learned later. 0.44
CLPE-21 Teachers teach what is correct; students must provide these correct answers in examinations.
0.69
CLPE-22 Students do not know what is good for them. 0.36
The amount of variance accounted for (%) 12.77
The total amount of variance accounted for (%) 35.68
The EFA concluded that the first factor CYPE, which contained 17 items concerning progressivism and
reconstructionism, accounted for 22.91% of the total variance. The items included in this factor had factor
loadings ranging from 0.34 to 0.76. On the other hand, the second factor CLPE, which contained 22 items
regarding perennialism and essentialism, accounted for 12.77% of the total variance. The items included in this
factor had factor loadings varying between 0.34 and 0.68. It can be argued that the construct validity of the
scale was ensured, seeing that the benchmark value for the amount of variance accounted for in the EFA is 30%
and higher (Bayram, 2009; Buyukozturk, 2010) and the items included in the scale had factor loadings higher
than the 0.30 lower limit (Costello & Osborne, 2005; Martin & Newell, 2004). It is known that perennialism
and essentialism are called CLPE in the literature while progressivism and reconstructionism are named CYPE
(Ornstein & Hunkins, 1998). From this point of view, the first factor, which contained items regarding
progressivism and reconstructionism, was called CPYE, whereas the second one, which contained items
regarding perennialism and essentialism, was named CLPE. The EFA also reported that the correlation between
CYPE and CLPE was -0.15.
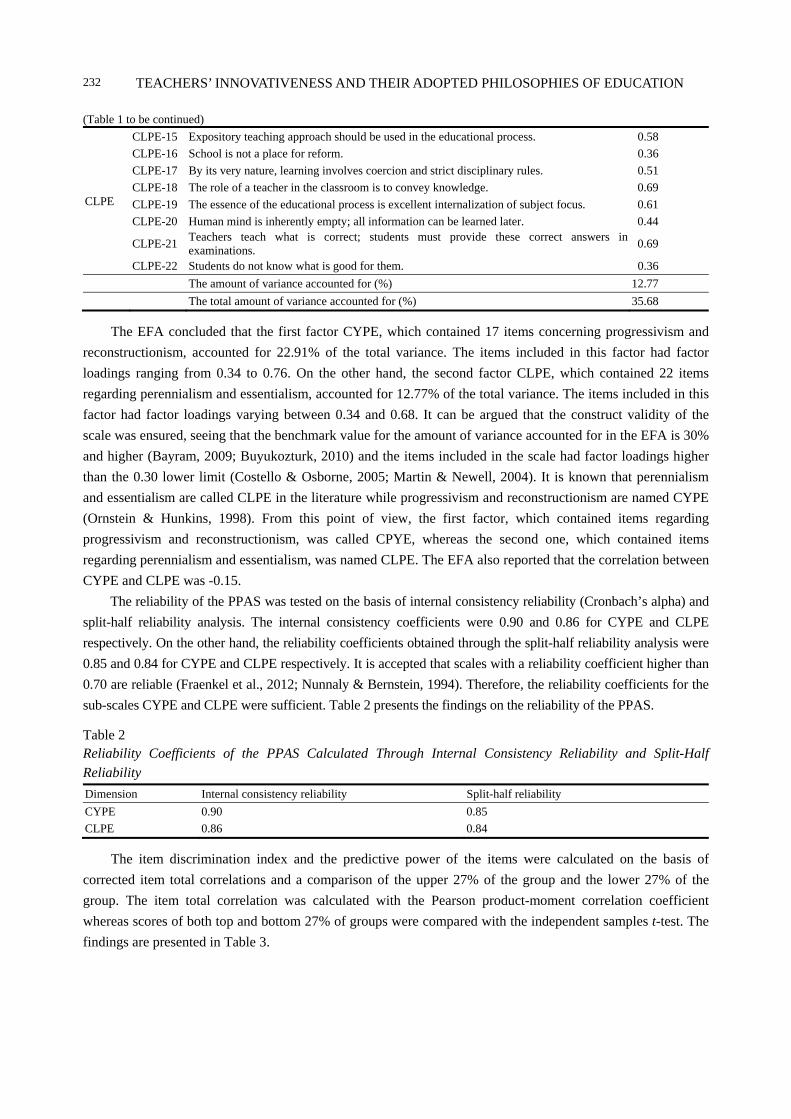
The reliability of the PPAS was tested on the basis of internal consistency reliability (Cronbach’s alpha) and
split-half reliability analysis. The internal consistency coefficients were 0.90 and 0.86 for CYPE and CLPE
respectively. On the other hand, the reliability coefficients obtained through the split-half reliability analysis were
0.85 and 0.84 for CYPE and CLPE respectively. It is accepted that scales with a reliability coefficient higher than
0.70 are reliable (Fraenkel et al., 2012; Nunnaly & Bernstein, 1994). Therefore, the reliability coefficients for the
sub-scales CYPE and CLPE were sufficient. Table 2 presents the findings on the reliability of the PPAS.
Table 2 Reliability Coefficients of the PPAS Calculated Through Internal Consistency Reliability and Split-Half Reliability
Dimension Internal consistency reliability Split-half reliability
CYPE 0.90 0.85
CLPE 0.86 0.84
The item discrimination index and the predictive power of the items were calculated on the basis of
corrected item total correlations and a comparison of the upper 27% of the group and the lower 27% of the
group. The item total correlation was calculated with the Pearson product-moment correlation coefficient
whereas scores of both top and bottom 27% of groups were compared with the independent samples t-test. The
findings are presented in Table 3.
TEACHERS’ INNOVATIVENESS AND THEIR ADOPTED PHILOSOPHIES OF EDUCATION
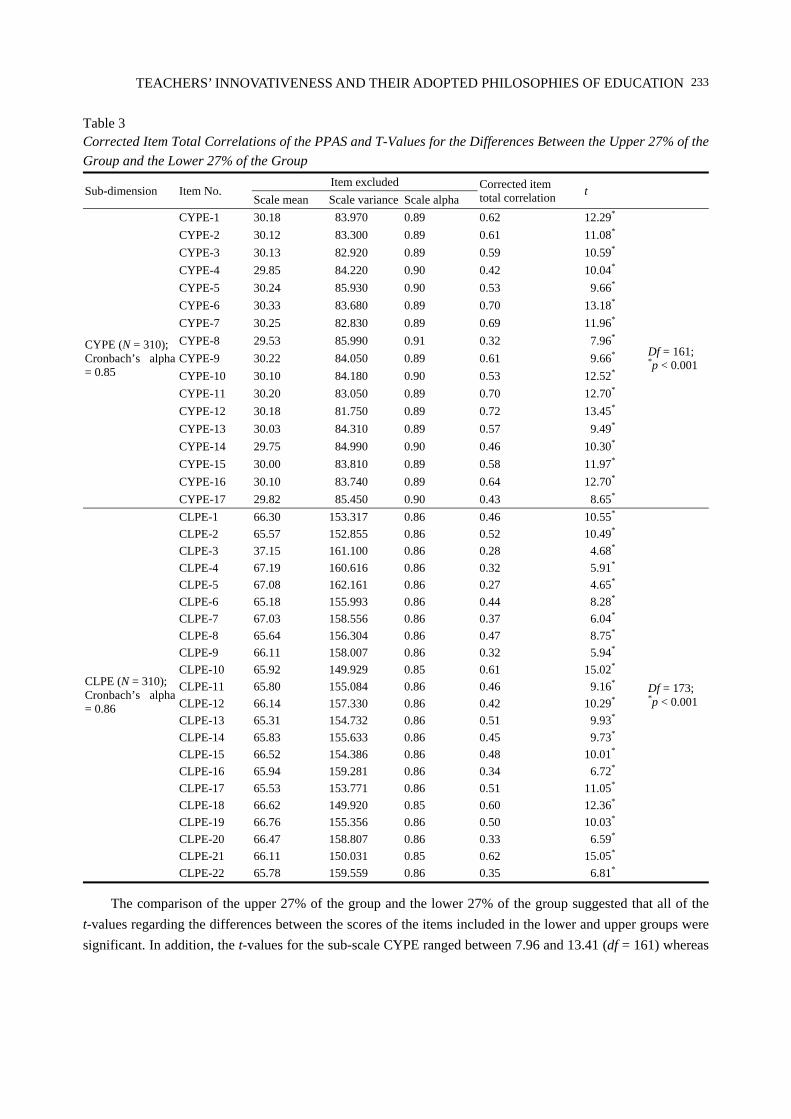
233
Table 3 Corrected Item Total Correlations of the PPAS and T-Values for the Differences Between the Upper 27% of the Group and the Lower 27% of the Group
Sub-dimension Item No. Item excluded Corrected item
total correlation t
Scale mean Scale variance Scale alpha
CYPE (N = 310); Cronbach’s alpha = 0.85
CYPE-1 30.18 83.970 0.89 0.62 12.29*
Df = 161; *p < 0.001
CYPE-2 30.12 83.300 0.89 0.61 11.08*
CYPE-3 30.13 82.920 0.89 0.59 10.59*
CYPE-4 29.85 84.220 0.90 0.42 10.04*
CYPE-5 30.24 85.930 0.90 0.53 9.66*
CYPE-6 30.33 83.680 0.89 0.70 13.18*
CYPE-7 30.25 82.830 0.89 0.69 11.96*
CYPE-8 29.53 85.990 0.91 0.32 7.96*
CYPE-9 30.22 84.050 0.89 0.61 9.66*
CYPE-10 30.10 84.180 0.90 0.53 12.52*
CYPE-11 30.20 83.050 0.89 0.70 12.70*
CYPE-12 30.18 81.750 0.89 0.72 13.45*
CYPE-13 30.03 84.310 0.89 0.57 9.49*
CYPE-14 29.75 84.990 0.90 0.46 10.30*
CYPE-15 30.00 83.810 0.89 0.58 11.97*
CYPE-16 30.10 83.740 0.89 0.64 12.70*
CYPE-17 29.82 85.450 0.90 0.43 8.65*
CLPE (N = 310); Cronbach’s alpha = 0.86
CLPE-1 66.30 153.317 0.86 0.46 10.55*
Df = 173; *p < 0.001
CLPE-2 65.57 152.855 0.86 0.52 10.49*
CLPE-3 37.15 161.100 0.86 0.28 4.68*
CLPE-4 67.19 160.616 0.86 0.32 5.91*
CLPE-5 67.08 162.161 0.86 0.27 4.65*
CLPE-6 65.18 155.993 0.86 0.44 8.28*
CLPE-7 67.03 158.556 0.86 0.37 6.04*
CLPE-8 65.64 156.304 0.86 0.47 8.75*
CLPE-9 66.11 158.007 0.86 0.32 5.94*
CLPE-10 65.92 149.929 0.85 0.61 15.02*
CLPE-11 65.80 155.084 0.86 0.46 9.16*
CLPE-12 66.14 157.330 0.86 0.42 10.29*
CLPE-13 65.31 154.732 0.86 0.51 9.93*
CLPE-14 65.83 155.633 0.86 0.45 9.73*
CLPE-15 66.52 154.386 0.86 0.48 10.01*
CLPE-16 65.94 159.281 0.86 0.34 6.72*
CLPE-17 65.53 153.771 0.86 0.51 11.05*
CLPE-18 66.62 149.920 0.85 0.60 12.36*
CLPE-19 66.76 155.356 0.86 0.50 10.03*
CLPE-20 66.47 158.807 0.86 0.33 6.59*
CLPE-21 66.11 150.031 0.85 0.62 15.05*
CLPE-22 65.78 159.559 0.86 0.35 6.81*
The comparison of the upper 27% of the group and the lower 27% of the group suggested that all of the
t-values regarding the differences between the scores of the items included in the lower and upper groups were
significant. In addition, the t-values for the sub-scale CYPE ranged between 7.96 and 13.41 (df = 161) whereas
TEACHERS’ INNOVATIVENESS AND THEIR ADOPTED PHILOSOPHIES OF EDUCATION
234
those for the sub-scale CLPE varied from 4.65 to 15.05 (df = 173). The correlated item total correlations ranged
from 0.43 to 0.72 and from 0.27 to 0.62 for the items included in the sub-scales CYPE and CLPE respectively.
It is generally accepted that items with a value of 0.30 and higher are suitable for discriminating between the
properties to be measured (Buyukozturk, 2010; Nunnaly & Bernstein, 1994). This criterion was fulfilled by all
the items except for item CLPE-5, which had a corrected item total correlation of 0.27, and item CLPE-3,
which had a corrected item total correlation of 0.28. However, the t-values obtained through the comparison of
the upper 27% of the group and the lower 27% of the group were meaningful also for the items CLPE-3 and
CLPE-5. Therefore, all the items in the scale had satisfying discrimination indices.
All the statistical validity and reliability analyses of the PPAS as well as the analysis of the item
discrimination index suggest that the scale had satisfying psychometric properties to measure prospective
teachers’ philosophical preferences.
Findings Regarding the Relationship Between Prospective Teachers’ Individual Innovativeness and
Their Adopted Philosophies of Education
Canonical correlation analysis was conducted to examine the relationship between prospective teachers’
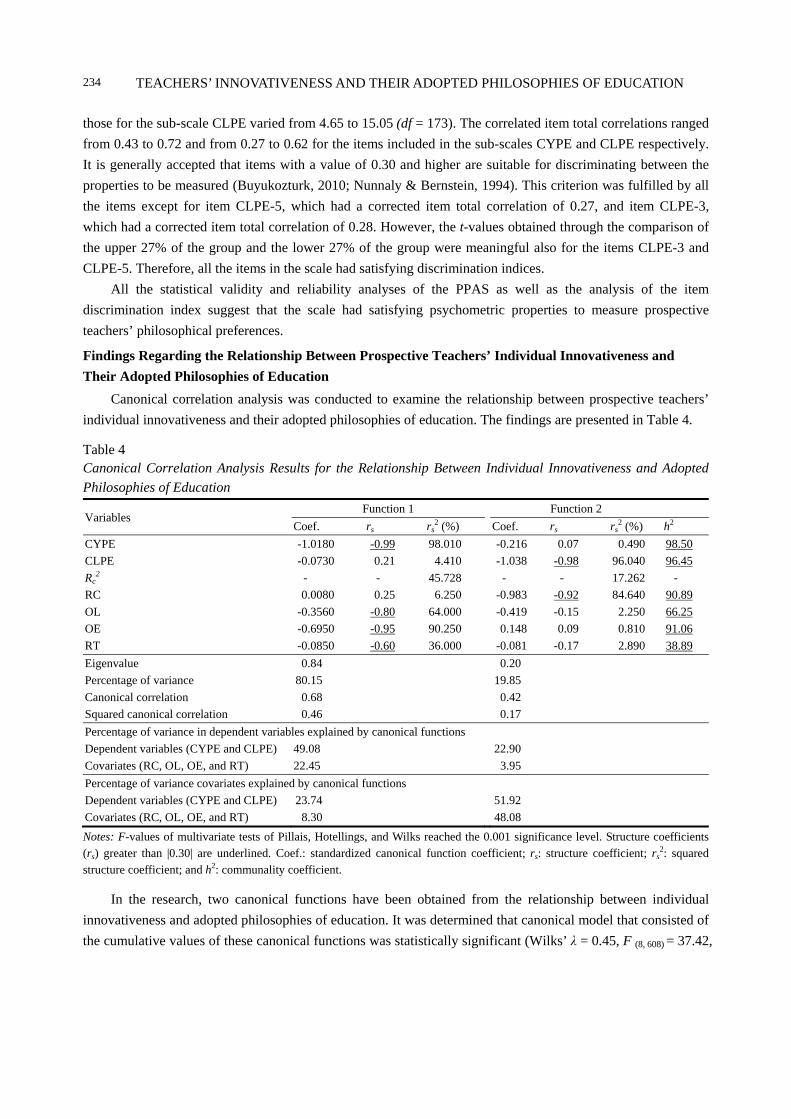
individual innovativeness and their adopted philosophies of education. The findings are presented in Table 4.
Table 4 Canonical Correlation Analysis Results for the Relationship Between Individual Innovativeness and Adopted Philosophies of Education
Variables Function 1 Function 2
Coef. rs rs2 (%) Coef. rs rs
2 (%) h2
CYPE -1.0180 -0.99 98.010 -0.216 0.07 0.490 98.50
CLPE -0.0730 0.21 4.410 -1.038 -0.98 96.040 96.45
Rc2 - - 45.728 - - 17.262 -
RC 0.0080 0.25 6.250 -0.983 -0.92 84.640 90.89
OL -0.3560 -0.80 64.000 -0.419 -0.15 2.250 66.25
OE -0.6950 -0.95 90.250 0.148 0.09 0.810 91.06
RT -0.0850 -0.60 36.000 -0.081 -0.17 2.890 38.89
Eigenvalue 0.84 0.20
Percentage of variance 80.15 19.85
Canonical correlation 0.68 0.42
Squared canonical correlation 0.46 0.17
Percentage of variance in dependent variables explained by canonical functions
Dependent variables (CYPE and CLPE) 49.08 22.90
Covariates (RC, OL, OE, and RT) 22.45 3.95
Percentage of variance covariates explained by canonical functions
Dependent variables (CYPE and CLPE) 23.74 51.92
Covariates (RC, OL, OE, and RT) 8.30 48.08
Notes: F-values of multivariate tests of Pillais, Hotellings, and Wilks reached the 0.001 significance level. Structure coefficients (rs) greater than |0.30| are underlined. Coef.: standardized canonical function coefficient; rs: structure coefficient; rs
2: squared structure coefficient; and h2: communality coefficient.
In the research, two canonical functions have been obtained from the relationship between individual
innovativeness and adopted philosophies of education. It was determined that canonical model that consisted of
the cumulative values of these canonical functions was statistically significant (Wilks’ λ = 0.45, F (8, 608) = 37.42,

TEACHERS’ INNOVATIVENESS AND THEIR ADOPTED PHILOSOPHIES OF EDUCATION
235
and p < 0.001). Wilk’s λ refers to the variance that cannot be accounted for by the canonical variables in the
model. Therefore, “1-λ” represents the amount of variance canonical variables share and can be interpreted in a
similar way to r2 in regression analysis. Wilks’ λ value for the relationship between prospective teachers’
individual innovativeness and their adopted philosophies of education is 0.45. Thus, it can be said that the
amount of shared variance which the individual innovativeness and adopted philosophies of education share is
55%.
The correlation between the data sets in the first canonical function calculated to make the relationship
between individual innovativeness and adopted philosophies of education data sets maximum has been
established as 0.68. According to this, it has been surfaced that individual innovativeness and adopted
philosophies of education share a common variance of 46% in the first canonical function. In the second
canonical function, the canonical correlation value, which is overlooked in the first canonical function and
which sets the maximum relationship between two canonical variables, is calculated. The canonical correlation
value calculated in the second canonical function is 0.42. This result shows that the value of common variance,
which individual innovativeness and adopted philosophies of education share in the second canonical function,
is 17%.
While the variables OL, OE, and RT contributed to the data set “individual innovativeness” by more
than 0.30 in the first canonical function, the variable RC contributed to the same data set by less than 0.30
(see Table 4). In this case, the variables OL, OE, and RT contributed more significantly to the data set
“individual innovativeness” than the variable RC. The criterion of 0.30 for the significance of contributions
made by variables to data set is based on the principle that items with a factor loading of 0.30 and higher are
acceptable in factor analysis (Costello & Osborne, 2005; Martin & Newell, 2004). Whereas the variable
CYPE contributed to the data set “adopted philosophies of education” by more than 0.30 in the first
canonical function, the variable CLPE had a structural coefficient of less than 0.30 (see Table 4). In this case,
the variable CYPE contributed more significantly to the data set “adopted philosophies of education” than
the variable CLPE.
In canonical functions derived from canonical correlation analysis, one can also conclude from the
variables with a structural coefficient of 0.30 or higher whether the correlation between these variables are
positive or negative. In the first function, the variables OL, OE, RT, and CYPE had significant structural
coefficients, all of which had negative signs. Therefore, there was a positive correlation between the
variables OL, OE, RT, and CYPE in the first canonical function, which suggests that the more the
participants adopted CYPE, the higher their OL, OE, and RT levels were. This function was named
“willingness to change (WTC) and CYPE” with a consideration into the variables that contributed
significantly in the first canonical function to the data set they were included in and the theoretical
knowledge about them.
The first canonical function, named WTC and CYPE, had an rs2 value of 45.728 (see Table 4). This
figure suggests that the amount of shared variance between the data sets “individual innovativeness” and
“adopted philosophies of education” in the first canonical function was 45.73%. Figure 2 presents the
structural coefficients concerning the canonical function WTC and CYPE and the canonical correlation
coefficient between the data sets “individual innovativeness” and “adopted philosophies of education” for
this function.

TEACHERS’ INNOVATIVENESS AND THEIR ADOPTED PHILOSOPHIES OF EDUCATION
236
Figure 2. Structural coefficients and canonical correlation value for the canonical function WTC and CYPE.
An analysis of the findings on the second canonical function suggests that the variable RC contributed to
the data set “individual innovativeness” by more than 0.30 whereas the variables OL, OE, and RT contributed to
the same data set by less than 0.30. In this case, the variable RC contributed more significantly to the data set
“individual innovativeness” than the variables OL, OE, and RT. Although the variable OL had a standardized
coefficient higher than 0.30 in the second canonical function, it had a structural coefficient lower than 0.30. This
finding suggests that the variable OL acted as a suppressor variable in the second canonical function. Variables
that significantly contribute to the prediction of the dependent variable due to their high correlation with other
independent variables are called suppressor variables (Tabachnick & Fidell, 2007). Whereas the variable CLPE
contributed to the data set “adopted philosophies of education” by more than 0.30 in the second canonical
function, the variable CYPE contributed to the same data set by less than 0.30. In this case, the variable CLPE
contributed more significantly to the data set “adopted philosophies of education” than the variable CYPE.
Both the variables RC and CLPE, which had significant structural coefficients in the second canonical
function, had negative signs. This finding suggests a positive correlation between the two variables. Therefore,
the more the participants adopted CLPE, the higher their RC levels were. This function was named “RC and
CLPE” with a consideration into the variables that contributed significantly in the second canonical function to
the data set they were included in and the theoretical knowledge about them.
The second canonical function, named RC and CLPE, had an rs2 value of 17.262 (see Table 4). This figure
suggests that the amount of shared variance between the data sets “individual innovativeness” and “adopted
philosophies of education” in the second canonical function was 17.262%. Figure 3 presents the structural
coefficients concerning the canonical function RC and CLPE and the canonical correlation coefficient between
the data sets “individual innovativeness” and “adopted philosophies of education” for this function.
Figure 3. Structural coefficients and canonical correlation value for the canonical function RC and CLPE.
CYPE
CLPE
Set 1 Set 2 0.42
-0.92
-0.15 0.07
-0.98
RT
OE
OL
RC
0.09
-0.17
CYPE
CLPE
Set 1 Set 2 0.68
0.25
-0.80 -0.99
0.21
RT
OE
OL
RC
-0.95
-0.60

TEACHERS’ INNOVATIVENESS AND THEIR ADOPTED PHILOSOPHIES OF EDUCATION
237
According to the findings obtained by the canonical correlation analysis, the amount of shared variance
between the data sets “individual innovativeness” and “adopted philosophies of education” was 55%. In this
respect, the correlation between the two data sets can be expressed in Figure 4.
Figure 4. The amount of shared variance between the data sets “individual innovativeness” and “adopted philosophies of education”.
Discussion and Conclusions
The present study aims to: (a) develop an instrument for measuring educational phisolophies adopted by
prospective teachers; and (b) identify the correlation between prospective teachers’ individual innovativeness
and their adopted philosophies of education.
The first purpose of the research is to develop the PPAS. Expert review was done to check the content and
face validity. EFA was applied in order to maintain the construct validity of the scale. As a result of EFA, a
two-factor structure explaining 35.68% of the total variance was obtained. Considering the nature of the items
in the factors and the theoretical structure, the first factor was named CYPE and while the second factor was
named CLPE. The factor loadings of the items in the scale vary between 0.34 and 0.76. Considering that values
of 30% and over are the criteria for the explained variance rates in the EFA (Bayram, 2009; Buyukozturk,
2010) and the scale items’ factor loads meet the lower limit of 0.30 (Buyukozturk, 2010; Costello & Osborne,
2005), it could be argued that PPAS has satisfactory construct validity. The reliability of the PPAS was
examined by means of internal consistency and split-half methods. The analyses concluded that the internal
consistency and split-half reliability coefficients for the CYPE and CLPE sub-dimensions were fairly
acceptable. An item analysis was conducted in order to determine PPAS items’ predictive and discriminatory
power. Item total correlation was analyzed in the item analysis and the 27% upper and lower level groups were
compared. As the end of the analysis, item total correlations ranged between 0.27 and 0.72 and the differences
between the top and bottom 27% groups were significant for all the items included in the scale. These findings
point to the discriminatory power of all the PPAS items.
The second purpose of the research is to analyze the relationship between prospective teachers’ individual
innovativeness and their adopted philosophies of education. The relationship between prospective teachers’
individual innovativeness and their adopted philosophies of education was examined through canonical
correlation analysis. The analysis yielded two canonical functions, both of which were found to be significant.
55%

TEACHERS’ INNOVATIVENESS AND THEIR ADOPTED PHILOSOPHIES OF EDUCATION
238
The amount of shared variance between the data sets “individual innovativeness” and “adopted philosophies of
education” in the first canonical function was 46%. In this function, there was a positive correlation between
the variable CYPE and the variables OL, OE, and RT. CYPE reflects progressivism and reconstructionism.
According to progressivism, the universe is in a constant state of flux. Therefore, educationalists should be
prepared to update their methods and policies in accordance with the changes in the world. Progressivism also
stipulates that the educational process should focus on teaching ever-changing life, not continuing standards or
unchanging things (Kuçukoglu & Bay, 2007). It is schools that are responsible for social change, according to
reconstructionism, another philosophy on which CYPE rests (Isichei, 2006; Oliva, 2009). Thus, teachers should
be representatives of change and reform (Demirel, 2010; Kneller, 1971). Considering that individuals with a
high tendency to OL, OE, and RT have increased levels of individual innovativeness (Kılıçer & Odabasi, 2010),
the positive correlation between CYPE and OL, OE, and RT appears to be supported by theoretical knowledge
about progressivism and reconstructionism. The amount of shared variance between the data sets “individual
innovativeness” and “adopted philosophies of education” in the second canonical function was 17%. In this
function, there was a positive correlation between the variable CLPE and the variable RC. CLPE reflects
perennialism and essentialism. According to perennialism, it is true that modern life is in a rapid state of flux.
However, “changelessness in a rapid state of flux” is a more essential principle of education (Kuçukoglu & Bay,
2007). Considering theoretical knowledge about perennialism and essentialism, the positive correlation
between CLPE and RC was significant.
There was a positive correlation between the variable CYPE and the variables OL, OE, and RT in the first
canonical function whereas there was a positive correlation between the variables CLPE and RC in the second
one. Considering, in the light of the findings on the first and second canonical functions, that individuals with a
high tendency to OL, OE, and RT and a low tendency to RC have increased levels of individual innovativeness
(Kılıçer & Odabasi, 2010), prospective teachers that adopt CYPE at a higher level than CLPE have a higher
innovativeness level. Thus, an understanding of prospective teachers adopted philosophies of education is an
important factor in supporting their individual innovativeness.
If it is possible to divide the data sets as dependent and independent variables in canonical correlation
analysis, the amount of shared variance between data sets can be interpreted in a similar way to the value r2 in
regression analysis (Sherry & Henson, 2005). Therefore, it can be argued that the prospective teachers’
individual innovativeness was accounted for by their adopted philosophies of education by 55%. This finding
can be supported by the fact that philosophies of education shape prospective teachers’ educational beliefs
(Livingston, McClain, & DeSpain, 1995; Pajares, 1992; Rideout, 2006; Sang et al., 2009) and such individual
factors as beliefs form the basis of innovativeness (Kılıçer, 2011). This finding is also in parallel with other
findings, such as their educational beliefs play a key role in the attitudes of teachers and prospective teachers to
innovative applications (Clark & Peterson, 1986; Tobin & McRobbie, 1996; Van den Berg, Admiraal, & Pilot,
2006) and educational innovations cannot be successful without a consideration into these beliefs (Trigwell et
al., 1994).
Implications for Teacher Educators and Educational Policy Makers
Implications rise for teacher educators in the design and development of teacher education programs when
the relationship between prospective teachers’ individual innovativeness and their adopted philosophies of
education is considered. The correlation between prospective teachers’ individual innovativeness and their
TEACHERS’ INNOVATIVENESS AND THEIR ADOPTED PHILOSOPHIES OF EDUCATION
239
adopted philosophies of education means that if an attempt is made to change teachers’ practice about
educational innovation, it is necessary to know their philosophical preference. In other words, educational
phisolophies adopted by prospective teachers should be known and understood at the start of the innovation
process (Van Driel, Bulte, & Verloop, 2007). Thus, it is expected that activities on increasing the extent to
which prospective teachers adopt CYPE will contribute to the development of their individual innovativeness.
Nevertheless, it is not easy to change prospective teachers’ educational beliefs, for they are well-established
and result from experiences so far (Nespor, 1987; Van Driel, Bulte, & Verloop, 2007). Even so, the fact that
educational beliefs might undergo changes through new knowledge (Austin & Reinhardt, 1999; Becker &
Ravitz, 1999) and concrete experiences in a supportive atmosphere (Nespor, 1987) suggests that activities on
increasing the extent to which prospective teachers adopt CYPE will lead to a change in their educational
beliefs. Such activities may start with providing pre-service teachers with the type of learning experiences that
are arranged in accordance with the principles of progressivism and reconstructionism. Activities that reflect
progressivism and reconstructionism and will increase the extent to which prospective teachers adopt CYPE
might include organizing pre-service education in accordance with prospective teachers’ interests and needs
(Dhawan, 2005), establishing a democratic environment in which they can freely express their opinions
(Dhawan, 2005), including situations they are likely to encounter in real life (Demirel, 2010), making use of
cooperative learning activities (Ergün, 2009), using discovery learning strategy (Erden, 1998) and
problem-solving (Ozmon & Craver, 1999), including social problems (Gutek, 1988), and taking advantage of
project-based teaching (Ornstein & Hunkings, 1998). The positive correlation between CYPE and the variables
OL, OE, and RT suggests that such activities are likely to increase both the extent to which prospective teachers
adopt CYPE and their levels of individual innovativeness.
In summary, those who lead educational policies should be aware that change is not a top-down and
uni-directional process and the applied reforms are not necessarily accepted by teachers. In order for
educational reforms to be successful, initially, teachers should be willing to apply these innovations and the
reforms should not challenge teachers’ educational beliefs (Niederhauser & Stoddart, 2001). Therefore, it is
highly important that teachers generally adopt modern educational philosophies which are in a positive and
significant relationship with individual innovativeness. Considering the fact that pre-service education plays a
functional role in forming changes in pre-service teachers’ philosophy preferences and the educational
philosophies they adopt is a complementary result of the education they receive in this period (Doganay, 2011),
pre-service education programs should be organized in such a way that they support pre-service teachers’
adoption of modern educational philosophies. In this respect, pre-service teachers’ level of adopting various
educational philosophies should be identified in the first year of pre-service teacher education. For the primary
condition for creating change in pre-service teachers’ adopted educational philosophy is to create awareness
into their existing educational beliefs (Gilakjani, 2012). Upon determining the level of pre-service teachers’
traditional and modern education philosophies, longitudinal studies should investigate the effectiveness of
pre-service educational programs and if necessary, changes should be performed in pre-service educational
programs.
Limitations of the Study and Implications for Further Research
All the findings on the validity, reliability, and item analysis performed in order to examine the
psychometric characteristics of the PPAS suggest that it is a valid and reliable instrument that can be used to

TEACHERS’ INNOVATIVENESS AND THEIR ADOPTED PHILOSOPHIES OF EDUCATION
240
measure prospective teachers’ philosophy preferences. However, the results of validity and reliability analysis
must be viewed in light of some limitations on the generality of the results. The participants of the study
consisted of only prospective teachers, which might mean that the validity was proven only on prospective
teachers. Therefore, it is essential that the validity and reliability of the PPAS should be tested on in-service
teachers or on groups, such as administrators and academicians in education. Furthermore, the factor structure
set out in this study can be verified with different samples via the confirmatory factor analysis. The present
study examined the PPAS’s reliability by means of internal consistency and split-half methods. In order to
understand whether the PPAS gives varying results in time, the scale’s test-retest reliability should be analyzed
in future studies. Further studies that will use the PPAS will contribute to the measurement power of the scale.
In the present study, the shared common variance between pre-service teachers’ adopted educational
philosophies and individual innovativeness was found to be 55%. Although it is acknowledged that teachers’
educational beliefs are the most important predictor of individual innovativeness (Clark & Peterson, 1986), the
fact that pre-service teachers’ educational philosophies account for 55% of the total variance can be considered
as a high rate. This might also be caused by failure to include variables that might be related to both educational
philosophy and individual innovativeness and failure to control for the effects of these variables. In other words,
many of the individual, institutional, and social factors (Kılıçer, 2011), which are predictors of pre-service
teachers’ individual innovativeness levels, might be in relation with the educational philosophy they adopt.
Consequently, the 55% variance explained by pre-service teachers’ innovativeness levels might have been
influenced by both educational philosophies and personal, institutional, or social factors which may be related
to individual innovativeness levels. Therefore, future studies should address variables which may be related to
both pre-service teachers’ philosophy preferences and individual innovativeness levels, and after these
variables have been controlled for, analysis of the relationship between philosophy preferences and individual
innovativeness can be recommended. Through such a study, the effect of other factors that interact with the
55% shared variance between pre-service teachers’ educational philosophies and individual innovativeness
levels might be isolated. In addition, carrying out further research on the effect of individual factors other than
educational philosophy, such as problem-solving styles, leadership, group work (Scoot & Bruce, 1994), and
creativity (Pratoom & Savatsomboon) and on institutional and social factors that might be effective over
individual innovativeness levels may contribute to forming a model explaining a significant portion of
pre-service teachers’ individual innovativeness levels. Such a model, in turn, could provide guidance on what
kind of activities can enhance prospective teachers’ individual innovativeness.
Nevertheless, educational beliefs are mainly shaped by cultural factors (Chan, 2003; Louca, Elby,
Hammer, & Kagey, 2004; Sang et al., 2009). Thus, the correlation between the prospective teachers’ individual
innovativeness and their adopted philosophies of education could have been influenced by these cultural factors,
which is another limitation on the part of the present study. Even so, the limitation can be eliminated by further
studies on prospective teachers from different cultures. Hopefully, a restudy of the correlation between
individual innovativeness and adopted philosophies of education through data on prospective students from
different cultures will contribute to the extent to which the findings of the present study can be generalized. In
such a study, the model obtained in the present study for the relationship between prospective teachers’
individual innovativeness and their adopted philosophies of education can be used as a starting point, which
allows the use of a confirmatory approach to analyze the data, for instance, applying structural regression
modeling or path analysis which may be used to test the fit of specific models.
TEACHERS’ INNOVATIVENESS AND THEIR ADOPTED PHILOSOPHIES OF EDUCATION
241
In the present study, the data were obtained from only one university which attracts students from across
the Turkey. Although this university was a degree representative of Turkish higher education system; this may
also be considered as a limitation. Another limitation of the study is that it was based on a quantitative model
with data obtained only through self-report techniques. The limitation should be overcome by qualitative
studies that will provide more detailed information about prospective teachers’ individual innovativeness and
their adopted philosophies of education. Such studies could shed light on the correlation between the two
variables in a more meticulous way and could substantiate the present findings.
References Adiguzel, A. (2012). The relation between candidate teachers’ moral maturity levels and their individual innovativeness
characteristics: A case study of Harran University Education Faculty. Educational Research and Reviews, 7(25), 543-547. Afifi, A., & Clark, V. (2004). Computer-aided multivariate analysis. Boca Raton, F.L.: Chapman & Hall/CRC. Agarwal, R., & Prasad, J. (1998). A conceptual and operational definition of personal innovativeness in the domain of information
technology. Information Systems Research, 9(2), 204-215. Akbulut, Y. (2010). SPSS applications in social studies. Istanbul: Ideal Kultur Publishing. Akkoyunlu, B., & Kurbanoğlu, S. (2002). A study on enabling teachers to develop information literacy skills. Turkish
Librarianship, 16(2), 123-138. Apps, J. W. (1973). Toward a working philosophy of adult education. Syracuse, N.Y.: Syracuse University. Austin, J. R., & Reinhardt, D. (1999). Philosophy and advocacy: An examination of preservice music teachers’ beliefs. Journal of
Research in Music Education, 47(1), 18-30. Basaran, I. E. (2007). Introduction to pedagogy. Ankara: Ekinoks Publishing. Bayram, N. (2009). Data analysis through SPSS in social sciences. Bursa: Ezgi Publishing. Becker, H. J., & Ravitz, J. (1999). The influence of computer and Internet use on teachers’ pedagogical practices and perceptions.
Journal of Research on Computing in Education, 31, 356-384. Berthon, P., Hulbert, J. M., & Pitt, L. F. (1999). To serve or create? Strategic orientations toward customers and innovation.
California Management Review, 42(1), 37-58. Bhatnagar, A., Misra, S., & Rao, H. R. (2000). On risk, convenience and Internet shopping behavior. Communications of the ACM,
43(11), 98-106. Bicer, B., Er, H., & Ozel, A. (2013). The relationship between the epistemological beliefs and educational philosophies of the
teacher candidates adopted. Journal of Theory and Practice in Education, 9(3), 229-242. Bordens, K. S., & Abbott, B. B. (2011). Research design and methods: A process approach. New York, N.Y.: The McGraw-Hill
Companies. Brauner, C. J., & Burns, H. W. (1982). Philosophy of education (Translated by S. Büyükdüvenci). Ankara University Journal of
Faculty of Educational Sciences, 15(2), 291-298. Briggs, S. R., & Cheek, J. M. (1986). The role of factor analysis in the development and evaluation of personality scales. Journal
of Personality, 54, 106-148. Buyukozturk, Ş. (2010). A manual on data analysis in social sciences. Ankara: Pegem Academy Publishing. Cagırgan, G. D., & Batdal, K. G. (2010, November). Prospective primary school math teachers’ philosophical preferences for the
educational process and their attitudes towards the teaching profession. A verbal report presented at The New Trends and Practices in Education Conference, Antalya, Turkey.
Cetin, B., Ilhan, M., & Arslan, S. (2012). An investigation of educational phisolophies adopted by prospective teachers in terms of various variables. The Journal of Academic Social Science Studies, 5(5), 149-170.
Chan, K. W. (2003, December). Preservice teachers’ epistemological beliefs and conceptions about teaching and learning: Cultural implications for research in teacher education. Paper presented at The NZARE AARE Conference, Auckland, New Zealand.
Clark, C. M., & Peterson, P. L. (1986). Teachers’ thought processes. In M. C. Wittrock (Ed.), Handbook of research on teaching. New York, N.Y.: Macmillan.
Coban, A. (2002). An evaluation of prospective classroom teachers’ philosophical preferences for the educational process. Cukurova University Journal of Social Sciences, 26(2), 311-318.
TEACHERS’ INNOVATIVENESS AND THEIR ADOPTED PHILOSOPHIES OF EDUCATION
242
Cohen, J., Cohen, P., West, S. G., & Aiken, L. S. (2003). Applied multiple regression/correlation analysis for the behavioral sciences. London, U.K.: Lawrence Erlbaum Associates, Publishers.
Costello, A. B., & Osborne, J. W. (2005). Best practices in exploratory factor analysis: Four recommendations for getting the most from your analysis. Practical Assessment Research & Evaluation, 10(7), 1-9.
Cowart, K. O., Fox, G. L., & Wilson, A. E. (2007). A structural look at consumer innovativeness and self-congruence in new product purchases. Psychology and Marketing, 25(12), 1111-1130.
Crookees, G. (2009). Values, philosophies and beliefs in TESOL: Making a statement. Cambridge, U.K.: Cambridge University Press.
Cuhadar, C., Bulbul, T., & Ilgaz, G. (2013). Exploring of the relationship between individual innovativeness and techno-pedagogical education competencies of pre-service teachers. Elementary Education Online, 12(3), 797-807.
Demirel, O. (2010). Curriculum development in education from theory to practice. Ankara: Pegem Academy Publishing. DeVellis, R. F. (2003). Scale development: Theory and applications. Newbury Park, C.A.: Sage Publications. Dhawan, M. L. (2005). Philosophy of education. Delhi, India: Isha Books. Dogan, I. (2004). A philosophical and ideological analysis of society and educational problems. Ankara: Pegem Academy
Publishing. Doganay, A. (2011). The effect of pre-service teacher education on the educational philosophies of prospective teachers. Education
and Science, 36(161), 332-348. Duman, B. (2008). A comparison of students’ adopted philosophies of education and their learning strategies and styles. Cukurova
University Journal of Institute of Social Studies, 17(1), 203-224. Duman, B., & Ulubey, Ö. (2008). Prospective teachers’ views on the effects of their adopted philosophies of education on the
extent to which they use instructional technologies and the Internet. Mugla University Journal of Institute of Social Studies, 20, 95-114.
Duman, B., Aykac, N., & Celik, Ö. (2011, September). A study on the correlation between prospective teachers’ preferences as to philosophies of education and their adopted values. A verbal report presented at The 20th National Convention for Educational Sciences, Mehmet Akif Ersoy University, Burdur, Turkey.
Ekiz, D. (2007). An evaluation of prospective teachers’ views on philosophies of education with reference to various programs. Ondokuz Mayis University Journal of Faculty of Education, 24, 1-12.
Erciyes, G. (2006). Teaching as a profession. In M. Yılman (Ed.), Introduction to pedagogy (pp. 119-154). Ankara: Nobel Publishing and Distribution.
Erden, M. (1998). Introduction to the teaching profession. Istanbul: Alkim Publishing. Ergün, M. (2009). The philosophy of education. Ankara: Pegem Academy Publishing. Erisen, Y. (2004). The foundations of philosophies of education. In Ş. Ş. Erçetin (Ed.), From the first day to being a headmaster.
Ankara: Asil Publishing. Ertmer, P. A. (1999). Addressing first- and second- order barriers to change: Strategies for technology integration. Educational
Technology Research and Development, 47(4), 47-61. Fraenkel, J. R., Wallend, N. E., & Hyun, H. H. (2012). How to design and evaluate research in education. New York, N.Y.:
McGraw Hill. Ghaith, G., & Yaghi, H. (1997). Relationships among experience, teacher efficacy, and attitudes toward the implementation of
instructional innovation. Teaching and Teacher Education, 13(4), 451-458. Gilakjani, A. P. (2012). The relationship between teacher pedagogical beliefs and use of computer technology in the classroom.
International Journal of Information and Education Technology, 2(1), 11-18. Gutek, G. L. (1988). Philosophical and ideological perspectives on education. Englewood Cliffs, N.J.: Prentice-Hall. Hair, J. F., Black, W. C., Babin, B. J., & Anderson, R. E. (2010). Multivariate data analysis. Englewood Cliffs,
N.J.: Prentice Hall. Hermans, R., Tondeur, J., Braak, J. V., & Valcke, M. (2008). The impact of primary school teachers’ educational beliefs on the
classroom use of computers. Computers & Education, 54, 1499-1509. Hewitt, T. W. (2006). Understanding and shaping curriculum: What we teach and why. Thousand Oaks, C.A.: Sage. Higgins, S., & Moseley, D. (2001). Teachers’ thinking about information and communications technology and learning: Beliefs and
outcomes. Teacher Development, 5, 191-210. Hult, G. T. M., Hurley, R. F., & Knight, G. A. (2004). Innovativeness: Its antecedents and impact on business performance.
Industrial Marketing Management, 33, 429-438.
TEACHERS’ INNOVATIVENESS AND THEIR ADOPTED PHILOSOPHIES OF EDUCATION
243
Hurt, H. Y., Joseph, K., & Cook, C. D. (1977). Scales for the measurement of innovativeness. Human Communication Research, 4(1), 58-65.
Isichei, F. M. (2006). Philosophy and teacher education: An African perspective. LWATI: A Journal of Contemporary Research, 3, 53-66.
Joseph, P. B. (2000). Conceptualizing curriculum. In P. B. Joseph, S. L. Bravmann, M. Windschitl, E. Mikel, & N. Green (Eds.), Cultures of curriculum (pp. 1-14). Mahwah, N.J.: Lawrence Erlbaum.
Khasawneh, A. M. (2008). Concepts and measurements of innovativeness: The case of information and communication technologies. International Journal of Arab Culture, Management and Sustainable Development, 1(1), 23-33.
Kılıçer, K. (2011). Individual innovativeness profiles of prospective computer and instructional technologies teachers (Unpublished Ph.D. thesis, Anadolu University, Eskisehir, Turkey).
Kılıçer, K., & Odabasi, F. H. (2010). The Individual Innovativeness Scale (IIS): The study of adaptation to Turkish, validity and reliability. Hacettepe University Journal of Education, 38, 150-164.
Klein, D. S. R. (1977). Needed: Educational philosophy as a guide for decision-making in the public schools. Education, 97(3), 290-293.
Kneller, G. F. (1971). Introduction to the philosophy of education. New York, N.Y.: John Wiley and Sons. Kocak, C., & Onen, S. A. (2013). Evaluation of the basic technology competency of teacher candidates according to their personal
innovativeness. AWERProcedia Information Technology & Computer Science, 3, 879-883. Kocak, C., Ulusoy, F. M., & Onen, A. S. (2012, June). A study on prospective teachers’ identity functions and educational beliefs. A
verbal report presented at The 10th National Sciences and Math Teaching Congress, Niğde University, Faculty of Education, Niğde, Turkey.
Kucuk, M., Yangın, S., & Bag, H. (2011, May). A study on prospective classroom teachers’ views on philosophies of education. A verbal report presented at The 10th National Classroom Teaching Symposium, Cumhuriyet University, Sivas, Turkey.
Kuçukoglu, A., & Bay, E. (2007). Philosophical foundations of education. In D. Ekiz (Ed.), Introduction to pedagogy. Istanbul: Lisans Publishing.
Kuzubasioglu, D., & Celebi, N. (2009, May). An evaluation of general high school teachers’ perceptions of factors in change management with a reference to effective schools. A verbal report presented in The 1st International Educational Studies Congress, Sekiz Mart University, Canakkale, Turkey.
Lambert, Z. V., & Durand, R. M. (1975). Some precautions in using canonical analysis. Journal of Market Research, 12, 468-475. Lee, K. M. (2011). Philosopher or philistine? In V. C. X. Wang (Ed.), Assessing and evaluating adult learning in career and
technical education (pp. 23-43). Hershey, P.A.: IGI Global. Leech, N. L., Barlett, K. C., & Morgan, G. A. (2005). SPSS for intermediate statistics; use and interpretation. Mahwah, N.J.:
Lawrence Erlbaum Associates. Livingston, M. J., McClain, B. R., & DeSpain, B. C. (1995). Assessing the consistency between teachers’ philosophies and
educational goals. Education, 116(1), 124-129. Long, H. B. (1987). New perspectives on the education of adults in the United States. New York, N.Y.: Nichols Publishing Co.. Louca, L., Elby, A., Hammer, D., & Kagey, T. (2004). Epistemological resources: Applying a new epistemological framework to
science instruction. Educational Psychologist, 39(1), 57-68. Lumpkin, G. T., & Dess, G. G. (1996). Clarifying the entrepreneurial orientation construct and linking it to performance. Academy
of Management Review, 97, 135-72. Martin, C. R., & Newell, R. J. (2004). Factor structure of the hospital anxiety and depression scale in individuals with facial
disfigurement. Psychology Health and Medicine, 3, 327-336. Martin, D. J., & Loomis, K. S. (2012). Building teachers: A constructivist approach to introducing education. Belmont, C.A.:
Thomson Learning. Nespor, J. (1987). The role of beliefs in the practice of teaching. Journal of Curriculum Studies, 19, 317-328. Niederhauser, D. S., & Stoddart, T. (2001). Teachers’ ınstructional perspectives and use of educational software. Teaching and
Teacher Education, 17, 15-31. Nunnaly, J., & Bernstein, I. (1994). Psychometric theory. New York, N.Y.: McGraw-Hill. Oliva, P. F. (2009). Developing the curriculum. Boston, M.A.: Pearson/Allyn and Bacon. Onen, A. S. (2012). Effects of educational beliefs on attitudes towards using computer technologies. Hacettepe University Journal
of Education, 43, 353-361. Ornstein, A., & Hunkins, F. (1998). Curriculum: Foundations, principles and issues. Boston, M.A.: Allyn and Bacon.
TEACHERS’ INNOVATIVENESS AND THEIR ADOPTED PHILOSOPHIES OF EDUCATION
244
Ornstein, A., & Lewin, D. U. (2006). Foundations of education. Boston, M.A.: Houghton Mifflin. Ozmon, H., & Craver, S. (1995). Philosophical foundations of education. Englewood Cliffs, N.J.: Prentice Hall, Inc.. Pajares, M. F. (1992). Teachers beliefs and educational research: Cleaning up a messy construct. Review of Educational Research,
62, 307-332. Parkerson, D. H., & Parkerson, J. A. (2008). The American teacher: Foundations of education. New York, N.Y.: Routledge. Pazmiño, R. W. (2008). Foundational issues in christian education: An introduction in avengelical perspective. Grand Rapids,
M.I.: Baker Books. Pratoom, K., & Savatsomboon, G. (2012). Explaining factors affecting individual innovation: The case of producer group
members in Thailand. Asia Pacific Journal of Management, 29(4), 1063-1087. Rideout, G. W. (2006). Educational beliefs and the learning environment. Academic Exchange Quarterly, 10(2), 67-71. Rogers, E. M. (2003). Diffusion of innovations. New York, N.Y.: Free Press. San Mateo, R. A., & Tangco, M. G. (2003). Foundation of education II (Historical, philosophical and legal foundation of
education). Quezon: Katha Publishing Co., Inc.. Sang, G., Valcke, M., Braak, J. W., & Tondeur, J. (2009). Investigating teachers’ educational beliefs in Chinese primary schools:
Socioeconomic and geographical perspectives. Asia-Pacific Journal of Teacher Education, 37(4), 363-377. Scoot, S. G., & Bruce, R. A. (1994). Determinants of innovative behavior: A path model of individual innovation in the workplace.
The Academy of Management Journal, 37(3), 580-607. Segall, W. E., & Wilson, A. W. (2004). Introduction to education: Teaching in a diverse society. Lanham, M.D.: Rowman &
Littlefield Publishers. Sherry, A., & Henson, R. K. (2005). Conducting and interpreting canonical correlation analysis in personality research: A
user-friendly primer. Journal of Personality Assessment, 84(1), 37-48. Sonmez, V. (2011). The philosophy of education. Ankara: Anı Publishing. Stangor, C. (2010). Research methods for the behavioral sciences. Boston, M.A.: Houghton Mifflin. Stevens, J. P. (2009). Applied multivariate statistics for the social sciences. New York, N.Y.: Routledge. Strain, J. P. (1971). Modern philosophies of education. Cambridge, M.A.: Harvard University Press. Tabachnick, B. G., & Fidell, L. S. (2007). Using multivariate statistics. Boston, M.A.: Pearson Education, Inc.. Tavsancil, E. (2009). Measuring attitudes and data analysis with SPSS. Ankara: Nobel Publishing and Distribution. Tobin, K., & McRobbie, C. J. (1996). Cultural myths as constraints to the enacted science curriculum. Science Education, 80,
223-241. Tondeur, J., Hermans, R., Braak, J. V., & Valcke, M. (2008). Exploring the link between teachers’ educational belief profiles and
different types of computer use in the classroom. Computers in Human Behavior, 24(6), 2541-2553. Trigwell, K., Prosser, M., & Taylor, P. (1994). Qualitative differences in approaches to teaching first year university science.
Higher Education, 27(1), 75-84. Un Acikgoz, K. (2011). Active learning. Izmir: Kanyilmaz Publishing. Van den Berg, I., Admiraal, W., & Pilot, A. (2006). Design principles and outcomes of peer assessment in higher education. Studies
in Higher Education, 31(3), 341-356. Van Driel, J. H., Bulte, A. M. W., & Verloop, N. (2007). The relationships between teachers’ general beliefs about teaching and
learning and their domain specific curricular beliefs. Learning and Instruction, 17, 156-171. Wiles, J., & Bondi, J. (2007). Curriculum development: A guide to practice. York, U.K.: Charles E. Merrill Publishing Company. Yilmaz, H., & Kocasarac, H. (2010). A new approach to pre-service teacher education: The scheme for innovative teachers and an
evaluation. Ahi Evran University Journal of Faculty of Education, 11(3), 51-64. Yilmaz, K., Altinkurt, Y., & Cokluk, O. (2011). Development of the educational beliefs scale: Validity and reliability.
Educational Sciences in Theory and Practice, 11(1), 343-350. Yurtkoru, S., Sipahi, B., & Cinko, M. (2010). Data analysis through SPSS in social sciences. Istanbul: Beta Publishing.
US-China Education Review B, ISSN 2161-6248 April 2014, Vol. 4, No. 4, 245-259
The Noumenic Methodology—Its Advancement in Gifted
Children Special Education and Effects on Academic
and Intellectual Performance of Gifted Children
Andrew Alexi Almazán Anaya
Talent Attention Center (CEDAT), Ciudad de México, México;
The Institute of Technology and Higher Studies of Monterrey (ITESM), Monterrey, México
It is calculated that 95% of gifted students are lost worldwide, therefore, new special education methodologies and
theories have been researched. One of them widely used in centers for gifted persons in America is the Noumenic
methodology, after which the Intellectual Enhancement Program was designed for increasing the intelligence and
academic performance of the gifted students. After its conception 15 years ago, it has shown reliable results with
gifted children. The objective of this study was to find the quantitative effect of the Noumenic special education
methodology on the academic performance and intelligence in gifted children during a two-year period. Eight
hundred and sixty-eight gifted students from 20 countries were gathered to receive the most intensive model
consisting of 1,640 studying hours per year. The intellectual quotient (IQ) was measured every six-month, as well
as the academic performance level with tests from the Academic Gifted Test (AGT). A correlation was found
between the Noumenic methodology and an increase in the academic performance in general as well as in the
students’ IQ, showing also special patterns of intelligence improvement regarding gender and age. The Noumenic
methodology, also known as the theory of the organization of intelligence, has been the official psychoeducational
model for several of the largest institutions in giftedness in the world for the last four years, and emerged as a
possible solution to the scarceness of special education methodologies designed for gifted students.
Keywords: Noumenic methodology, gifted, special education, gifted education, educational differentiation
Introduction
Currently, there is a worldwide problem in education that the minds of future (gifted students) are without
education programs designed with teaching-learning innovative methods that would let them take advantage of
their capacities and apply them in an effective way for society (Vrignaud, 2006). This has caused the loss of
millions of talented students in the last five decades, who could have been the future scientists, leaders,
philosophers, artists, and investigators in mankind advancement (Pérez-Sánchez, López-Cobeñas, Del Valle, &
Ricote, 2008). According to the World Health Organization (2001), giftedness is defined as a situation present
when a person has an intellectual quotient (IQ) above 130 points (as cited in Dawson & Trapp, 2005), making
their educational and psychological needs different from the average students. Approximately, 66 million
Andrew Alexi Almazán Anaya, Ph.D. candidate, physician, psychologist, director, Research and Psychology Department,
CEDAT; Graduate School of Education, ITESM.
DAVID PUBLISHING
D

THE NOUMENIC METHODOLOGY
246
children in the world are gifted, including one million in Mexico, three million in the United States of America
(USA), and 10 million in China; however, most of them go undetected and do not receive a methodology
designed to improve their educational and psychological development (Dawson & Trapp, 2005; Giessman,
Gambrel, & Stebbins, 2013).
Yet, where are they? Possibly they lost along the educational path and they will remain so unless they are
identified and attended properly. Therefore, it is crucial to detect them on time—a job that starts at home as
well as at school (where the main traits of giftedness are most frequently expressed), the teacher being one of
the main factors that promotes or inhibits educational innovation in the field of giftedness (Elices, Palazuelo, &
Del Caño, 2006). To develop and evaluate education models for gifted students has been considered a
worldwide priority by United Nations Educational, Scientific, and Cultural Organization (UNESCO) for more
than 30 years (Báthory & Joó, 1988; Passow, 1995), yet, in spite of it, few teaching-learning methods were
developed for these brilliant minds. This problem in this field has existed for over 80 years since the genetic
studies of gifted persons were conducted by Terman (1930), who proposed the enrichment and acceleration
program in 1930. Gifted students have different educational needs because of their intellectual characteristics;
however, the educational programs in general do not have procedures to give them an adequate education
(Hettinger-Steiner, 2006). In average schools, the teaching strategies and the training of professors are designed
based on the mean and not for unique students (Hettinger-Steiner, 2006). Not even the teachers have an idea as
to how to adapt an education program to attend these students. In traditional schools, gifted students are at risk
of being misdiagnosed and medicated, worsening the situation of loss of their talent, not counting the bullying
they experience (Archundia, 2010).
In addition, a matter of concern in the occidental world has been the intellectual drowsiness experienced in
the population in general, which effects get worse on gifted persons. This produces a diminishing effect of
4%-5% annually on the IQ and cognitive abilities in great measure for the lack of mental stimulation and the
existence of numerous factors that distract the students from studying (Almazan, 2010). This increases even
more the need for special education methodologies for the gifted children, programs that have very ancient
roots.
The precedents of special education for gifted children go back to ancient Greece, with Plato’s proposal
of a republic of ideas, an utopic idea where the most intelligent individuals were selected to be trained on
public matters and turn them into political leaders of society based on reasoning and intelligence (Weyl, 1970;
Yun-Dai, Ann-Swanson, & Cheng, 2011). Thomas Jefferson pondered this need and considered it
fundamental to recognize individual differences and make the most out of them for the benefit of society by
stating that “There is nothing more unequal than to give equal treatment to unequal people” (Gabriel, 2010, p.
86). Diversity as a base of equality became the keystone of special education of gifted persons (Walsh &
Kemp, 2013; Weyl, 1970).
Countries, like Germany, have been working on special education methods since the 18th century; in
most cases, these attempts went unnoticed. The case of Frederick the Great, king of Prussia, who was
responsible for raising his country as a European power, is well known. Frederick started a project, embraced
later by General Clausewitz (1976) with the San Afra-Meisen Academy, where he assembled 100 gifted
youths to help in the development of military technology and the planning of strategies to increase the
influence of his nation in Europe. The project was based on a method called “magnet school of priority

THE NOUMENIC METHODOLOGY
247
attention”, the former consists of working with gifted students in exclusive groups and making social
interaction among equals in function of their intellectual capacity to eliminate the negative effects caused by
the lack of stimulation that happens when they interact in an average society (González-Geraldo, Del Rincón,
Bonilla-Sánchez, & Sáez, 2013). In the following 200 years, it maintained an enrollment of nearly 1,000 gifted
students evolving into high schools and universities, where great emphasis was placed on mathematics and
physics, under the premise that only under coexistence among equals and an academic demand above normal
will it be possible to lead them into excellence and success (Trapp & Himelstein, 1962).
The results of these policies of “magnet school of priority attention” in this period are evident: rockets,
jets’ motors, submarines, and the principles of nuclear energy were developed, because the most brilliant minds
were allowed to work in teams towards an specific goal to develop their country’s technology (Pallas &
Alexander, 1983).
Afterwards, Prussia created the Landemgymnasium für Hochbegabte (German Federal School for the
Highly Gifted) with a methodology called “pull-out”, to which acceleration and enrichment strategies were
added. It merges the traits of the three models in special education into a hybrid, designed for specialized
education centers with personnel trained to attend gifted children (Vaughn, Feldhusen, & Asher, 1991).
This method was followed by a more drastic one called “full-time ability regrouping” that resumed the
“magnet school of priority attention” with just one change in its teaching-learning strategies based on the model
by competences (Colson, 1980). It takes into consideration the creation of a parallel “social life” in gifted
students where they would be able to develop their interpersonal skills at the same time they keep their
intelligence stimulated. One of its premises states that the education center that implements it must have a
considerable population of gifted students (over 100) to generate the “pull-out” effect, avoiding the social
isolation of the students through a strict psychological surveillance at the same time (Hsu, 2003; Swiatek,
1995).
It is calculated that an average of 95% of gifted students in Mexico and the world are lost (some countries
like Israel with that rate as low as 40% and France as high as 98%), therefore, new methodologies and theories
were researched to improve the educational attention these brilliant minds receive. One of them widely used in
centers for gifted persons in America is the Noumenic methodology (named after the Greek word “nous” that
means intelligence), on which the Intellectual Enhancement Program was designed. After its conception 15
years ago, it has shown reliable results with gifted children. It was created as an innovative and viable
education strategy designed for the most brilliant minds to be applied together with traditional education and
innovative education methods at home or those of a specialized education. This has been applied for several
years in the largest centers of gifted persons in Latin America and the world around to develop their intellectual
abilities by providing the gifted students a special education methodology designed to improve their
intelligence and knowledge of sciences (Archundia, 2010; Almazán, 2013).
The Noumenic methodology is founded on Terman’s (1930) proposal of enrichment, but adding the
innovative psychoeducational techniques to improve the intelligence of gifted students as well as their
emotional and psychological stability (Clements, 2012; Cruz, 2013). Therefore, it was developed following the
techniques from the “pull-out” method developed in Germany, Russia, and Colombia to initially start a weekly
modality similar to the Star project, which consisted of extracurricular classes on advanced themes along with
other gifted students with a weekly periodicity. This modality considers 80 working hours a year. Afterwards,
THE NOUMENIC METHODOLOGY
248
an intensive methodology was designed based on the “full-time ability regrouping” that considers 1,640
studying hours a year, 130% above the national average in Mexico’s education system (Almazán, García-Horta,
Muñoz, Somunano-Spears, Esquivel, & Delgado, 2013).
The Noumenic methodology was originally conceived as a pilot test of a psychoeducational model for the
development of intelligence and academic performance in 1994. It was officially integrated at the Center of
Attention to Talent (CEDAT), the largest institution in Latin America for gifted students, in 2010, and later on,
at several American organizations of superior intelligence. In front of the deficiencies experienced in the world
of sustainable strategies and at the same time effectiveness on gifted children, this program integrated the
enrichment program along with the German “pull-out”. It brings together the original strategies from “magnet
school of priority attention” (designed to work with exclusive groups of gifted children), enrichment (by
adding scientific themes in the academic summary of the students that would not have received until entering
university), and acceleration (the objective is to advance as much as possible without “skipping” the academic
degrees through official certifications) (Almazán, 2010; Hettinger-Steiner, 2006).
The main premise of the Noumenic methodology is that special programs for gifted persons can increase
their capacities even more with the correct and intensive educational strategies. This was demonstrated in China
through an intervention based on the intellectual enhancement for a period of six months, where a permanent
increase of 40% in the mental and processing speed in gifted students was found (Duan, Shi, & Shou, 2010). In
that research study, an evaluation of students’ intellectual capacities that evaluated their performance several
years later was not realized.
It is still unknown what are the quantitative effects on the academic performance and the IQ of the
students after the Noumenic methodology has been applied longer than a semester (the minimum time
recommended to observe educational changes); the latter reflects the level of demand and progress that an
educational program exerts on its students asides the capacity to keep their cognitive capacities stimulated
(Trapp & Himelstein, 1962).
It must be considered that it has not been solved whether the groups of gifted persons attended with the
special education method express an IQ and an academic performance level different from those attended with
the traditional education model (Legendre, 2008). To know this would establish educational policies based on
empirical data that show which are the most successful strategies to attend gifted students, whom, because of
their importance for the development of the nation, are human assets that cannot be wasted. This is a question
posed in this research project to describe the quantitative effects of a specialized education model for high
intelligence students.
Hypothesis: Statistically, there is a significant increase on the academic performance and the IQ in
populations of gifted students attended with the Noumenic special education method.
The objective of the investigation was to describe the measurable increase on the academic performance of
gifted children through the application of the Noumenic methodology and the changes in the intelligence levels
(reflected in the IQ) during a two-year period intensive special education program.
Methodology
This investigation was a qualitative one using all the available information about the application of the
Noumenic methodology and its results on high intelligence students in three of the largest institutions for gifted

THE NOUMENIC METHODOLOGY
249
persons in the world (CEDAT, Mexican School of Gifted Students, and the Alliance for Gifted Persons). A
population of 868 gifted students (2-13 years old) was selected and formed part of the Noumenic methodology
international program in the last two years.
Population
Eight hundred and sixty-eight gifted students from 20 countries (Mexico, USA, Argentina, Germany,
South Africa, Australia, India, China, etc.) were selected for the investigation. To establish their giftedness
condition, all of the participants were previously evaluated to obtain their IQ, and almost all had an IQ above
130 points as reference before the study began (see Table 1).
Table 1 Descriptive Statistics of the Gifted Population Evaluated in January 2012 Regarding Age, IQ, Academic Gifted Test (AGT) Scores, and Gender
N Minimum Maximum Mean Standard deviation
Age of the participants 868 2.05 13.79 7.58 2.74
Age of the male participants 680 2.08 13.79 7.49 2.67
Age of the female participants 188 2.05 13.18 7.71 2.98
Overal IQ 868 117.00 158.00 139.05 9.73
IQ of the male participants 680 117.00 158.00 139.16 9.77
IQ of the female participants 188 128.00 154.00 138.63 9.56
Overall AGT score 868 22.00 100.00 55.84 20.26
AGT score of the male participants 680 22.00 100.00 55.94 20.56
AGT score of the female participants 188 29.20 86.00 55.35 18.79
Notes. Data were obtained during analysis with Statistical Package for Social Sciences (SPSS) and calculation of descriptive statistics. Gender groups did not show differences in all measurements of IQ and AGT scores.
The study counted on 868 voluntary participants aged from 2-13, all of them are gifted students who took
the Noumenic methodology special education program in its intensive modality consisting of 1,640 effective
hours per year (see Table 1). The IQ of the individuals was found in a 118-158 range, with the median placed
on 139 through the Gauss curve effect on the highest scores of IQ that produces a scarcity of individuals when
the punctuation increases. Scores below 130 were accepted as exceptional cases that proved to have all the
other psychological and social characteristics of giftedness. Although the large part of the study population was
Mexican, there was a representation of 30% of foreign students from the USA, China, Australia, South Africa,
among other 15 countries to increase the international application of the results obtained.
The inclusion criteria for all the students subjected to the study were:
1. An IQ above 130 points (intellectual giftedness);
2. Permanence in the institution under six months at the start of the study (January, 2012);
3. To be in a 2-13 years old bracket at the start of the study;
4. To have been diagnosed with intellectual giftedness after August 2011 (due to the semester caducity of
IQ results);
5. Approval of a basic medical evaluation process.
The exclusion criteria (for reducing biases) include:
1. Chronic or long-term medical illness (over one month);
2. Active or recent inner family violence (in the last six months);

THE NOUMENIC METHODOLOGY
250
3. Severe psychological or psychiatric disorders (schizophrenia, depression, limited disorder of personality,
etc.);
4. In the process of receiving educational, psychological, or any other kind of therapy that aliens to the
education institution where they study.
Investigation Tools
Wechsler Preschool and Primary Scale of Intelligence-III (WPPSI-III) and Wechsler tests. The tools
to evaluate the students’ intellectual level were the psychometrics test in the Wechsler scale. This is the largest
international application to evaluate the IQ because of its standardization conducted in 150 countries every
lustrum (Swiatek, 1995). For the purposes of this investigation, the Wechsler Intelligence Scale for Children-IV
(WISC-IV) was used. A test of this scale was designed for ages 6-17, which measures the IQ in ranks of
intellectual giftedness. It is subdivided into 10 subtests that evaluate areas of verbal intelligence, reasoning,
memory, and mental speed (Swiatek, 1995) as a whole. Whereas the WPPSI-III test, which was subdivided into
eight scales, was used on 2-6 years old children. The statistical analysis unit for these tools is the IQ and its
respective percentile in relation to the level of intelligence of the average population.
Standardized academic test for gifted persons. The test that evaluated the students’ academic
performance was the AGT that consists of a series of tests, supported by the Mexican Federation for Intellectual
Giftedness with a “departmental evaluations” style for gifted persons about the academic knowledge acquired
at school and at extracurricular activities expected of a gifted student from the 21st century according to the
World Council for Gifted and Talented Children and UNESCO. This tool is standardized by age, from 4-18, not
academic grades (There is a version for each year, in which the length of the evaluated themes and difficulty
increases as the age of the evaluated students increases). The scale for the 4-year-old students evaluates six
areas while the 18-year-old ones do it with 25 areas of knowledge. Among the subjects evaluated are biology,
astronomy, physics, robotics, algebra and differential calculus, world history, Spanish, redaction, etc., which
are required by the basic education of gifted persons (Ramsay & Richards, 1997).
AGT has an application periodicity of six months, so it is possible to have a time line of the students’
academic performance, and through the use of a “pool” of more than 4,000 possible questions, it eliminates the
Flynn effect: an increase in performance because of the students’ maturity (Van Tassel-Baska, Johnson, &
Avery, 2002). The version used in this study was the one found in Spanish, which lets us know the level of
academic knowledge of each student in the groups and calculate the academic performance in the same way
national academic tests do, but this time for the population of gifted students.
Procedure
The project was implemented for two years in a row at CEDAT (Mexico City) and Mexican School for
Gifted Children (Mexico City), where a team of 40 people (psychologists, educators, pedagogy specialists,
physicians, administrators, and parents) controlled the educational and psychological environment of the
students subjected to the studio to avoid biases.
In October 2011, basic information was collected on the 868 participants (see Table 1). The tools were
initially applied in January 2012 and concluded in August 2013. The participants had the continuous presence
of the investigation team to intervene on the cases that could affect the results, such as bullying.
The WPPSI-III or WISC-IV was applied with a 6-month periodicity. Due to international and national
normativity, the IQ measuring tools were applied only by psychologists certified by the Mexico’s General
THE NOUMENIC METHODOLOGY
251
Direction of Professions. The AGT was applied only two times, at the beginning and at the end of the time
frame of the research to avoid the bias effect of students’ maturity.
Statistical Analysis Method
All the information was analyzed using the SPSS (Version 21) to measure the degree of modification in
the academic performance of the gifted students who received the Noumenic methodology, in comparison to
those who did not, through the scoring grades. The intelligence scores of each participant were obtained every
six-month to relate them with the educational and psychological effects of the Noumenic methodology. T-test
was used to compare the application of the Noumenic methodology before and after as well as to calculate the
difference between the different checking points (every six-month) when revaluation of IQ and the academic
knowledge was conducted. A p < 0.05 reliability level was established for the statistical tests, recommended by
international standards for statistical analysis (Dawson & Trapp, 2005).
International Applications of the Study
The investigation was conducted in a population of 868 gifted students from 20 countries. With this
multinational population, it was guaranteed that the investigation represented people from all continents to
increase the reliability and transnational application of the results obtained. A common problem during the
international, educational investigation with gifted students is the scarceness and difficulty to find them outside
the centers (Hsu, 2003). The investigation was therefore realized in one of the largest institutions for gifted
students in the world with people from all the continents in the world, making it an investigation of
international applications.
Results and Discussion
A population of 868 was used for the study, which has an error rate of 2.79% and a confidence level of
95% for reliability purposes of the results. The female population composed only 21.6% of the gifted group due
to a widely known gender effect on the IQ scores and giftedness identification process (Pallas & Alexander,
1983), which will not be analyzed in this article.
We found out that the gifted children and youngsters subjected to the Intellectual Enhancement Program
have experienced a 9.5% average increase in their IQ after working two years in the program. The average IQ
level of the gifted children at the start of the study in January 2012 was 139 points whereas it had reached 151
points at its conclusion in August 2013. Such an increase was observed in all the tests of intelligence used
across the group. There was a considerable variation on the increase of IQ; some individuals increased only
four points while others had an increase of up to 30 points. When analyzed with the student t-test, a statistically
significant difference was found between the IQ scores obtained every semester, showing a gradual increase
related with the permanence of the gifted population in the Noumenic methodology in the two-year period.
These differences were motivated in great measure by the IQ level at the beginning of the study; those who
started the cycle with an IQ higher than 150 did not increased it beyond 165 at the end of the year while other
students with 130 were able to reach 155 points (see Figures 1 & 2). Suggesting in this way that although the
IQ could increase in gifted population, it has an upper limit that hampers further increases. This score roof
could have been located near 162 in this research, as they were few scores that surpassed this limit although the
IQ test range reached 210. However, possibly it is required a longer educational intervention in order to attain
extremely high scores (located near 170-180) to begin the special educational intervention at younger ages or to
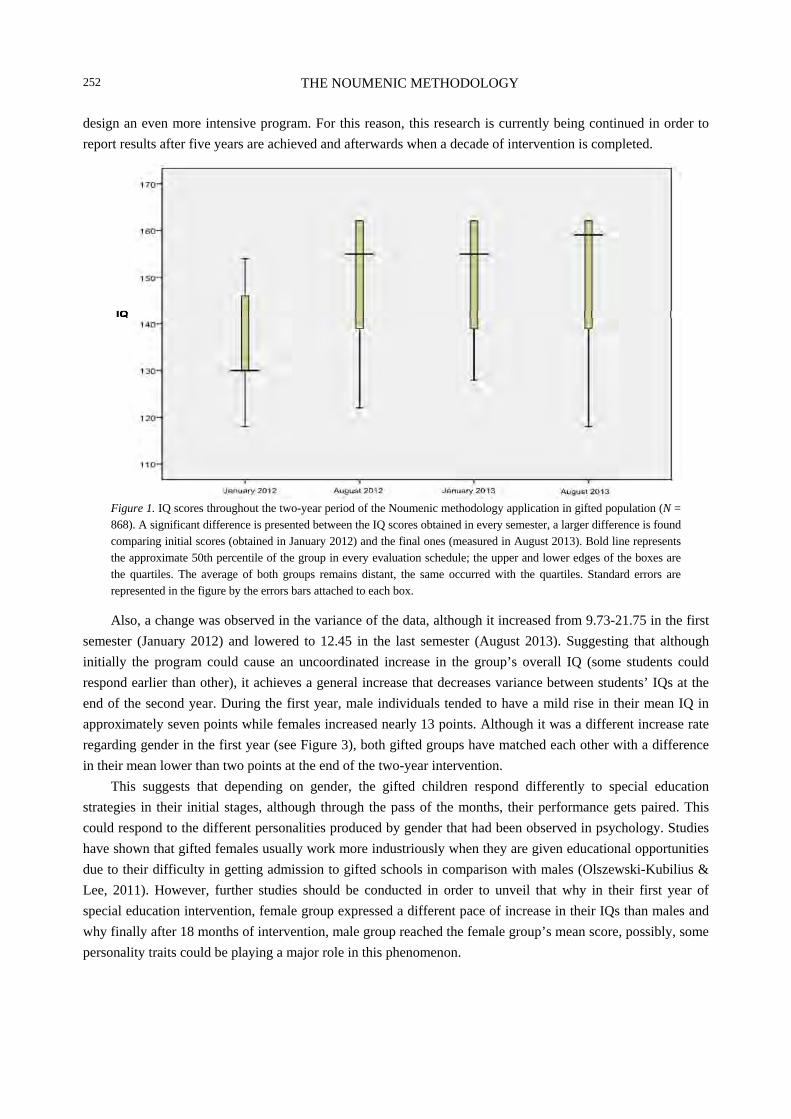
THE NOUMENIC METHODOLOGY
252
design an even more intensive program. For this reason, this research is currently being continued in order to
report results after five years are achieved and afterwards when a decade of intervention is completed.
Figure 1. IQ scores throughout the two-year period of the Noumenic methodology application in gifted population (N = 868). A significant difference is presented between the IQ scores obtained in every semester, a larger difference is found comparing initial scores (obtained in January 2012) and the final ones (measured in August 2013). Bold line represents the approximate 50th percentile of the group in every evaluation schedule; the upper and lower edges of the boxes are the quartiles. The average of both groups remains distant, the same occurred with the quartiles. Standard errors are represented in the figure by the errors bars attached to each box.
Also, a change was observed in the variance of the data, although it increased from 9.73-21.75 in the first
semester (January 2012) and lowered to 12.45 in the last semester (August 2013). Suggesting that although
initially the program could cause an uncoordinated increase in the group’s overall IQ (some students could
respond earlier than other), it achieves a general increase that decreases variance between students’ IQs at the
end of the second year. During the first year, male individuals tended to have a mild rise in their mean IQ in
approximately seven points while females increased nearly 13 points. Although it was a different increase rate
regarding gender in the first year (see Figure 3), both gifted groups have matched each other with a difference
in their mean lower than two points at the end of the two-year intervention.
This suggests that depending on gender, the gifted children respond differently to special education
strategies in their initial stages, although through the pass of the months, their performance gets paired. This
could respond to the different personalities produced by gender that had been observed in psychology. Studies
have shown that gifted females usually work more industriously when they are given educational opportunities
due to their difficulty in getting admission to gifted schools in comparison with males (Olszewski-Kubilius &
Lee, 2011). However, further studies should be conducted in order to unveil that why in their first year of
special education intervention, female group expressed a different pace of increase in their IQs than males and
why finally after 18 months of intervention, male group reached the female group’s mean score, possibly, some
personality traits could be playing a major role in this phenomenon.
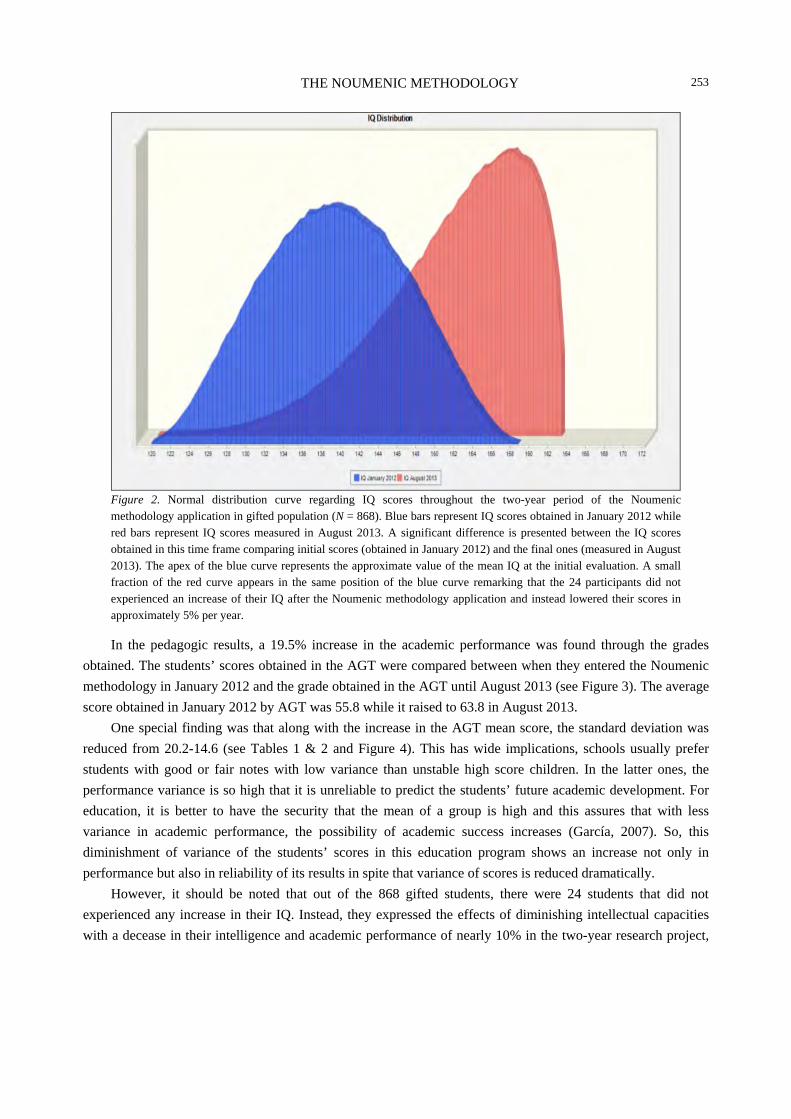
THE NOUMENIC METHODOLOGY
253
Figure 2. Normal distribution curve regarding IQ scores throughout the two-year period of the Noumenic methodology application in gifted population (N = 868). Blue bars represent IQ scores obtained in January 2012 while red bars represent IQ scores measured in August 2013. A significant difference is presented between the IQ scores obtained in this time frame comparing initial scores (obtained in January 2012) and the final ones (measured in August 2013). The apex of the blue curve represents the approximate value of the mean IQ at the initial evaluation. A small fraction of the red curve appears in the same position of the blue curve remarking that the 24 participants did not experienced an increase of their IQ after the Noumenic methodology application and instead lowered their scores in approximately 5% per year.
In the pedagogic results, a 19.5% increase in the academic performance was found through the grades
obtained. The students’ scores obtained in the AGT were compared between when they entered the Noumenic
methodology in January 2012 and the grade obtained in the AGT until August 2013 (see Figure 3). The average
score obtained in January 2012 by AGT was 55.8 while it raised to 63.8 in August 2013.
One special finding was that along with the increase in the AGT mean score, the standard deviation was
reduced from 20.2-14.6 (see Tables 1 & 2 and Figure 4). This has wide implications, schools usually prefer
students with good or fair notes with low variance than unstable high score children. In the latter ones, the
performance variance is so high that it is unreliable to predict the students’ future academic development. For
education, it is better to have the security that the mean of a group is high and this assures that with less
variance in academic performance, the possibility of academic success increases (García, 2007). So, this
diminishment of variance of the students’ scores in this education program shows an increase not only in
performance but also in reliability of its results in spite that variance of scores is reduced dramatically.
However, it should be noted that out of the 868 gifted students, there were 24 students that did not
experienced any increase in their IQ. Instead, they expressed the effects of diminishing intellectual capacities
with a decease in their intelligence and academic performance of nearly 10% in the two-year research project,

THE NOUMENIC METHODOLOGY
254
which would mean an approximate degression of 5% annually (see Figure 2). All of these cases were male
gifted teenagers who began the program after their 12 years old, suggesting that although the Noumenic
methodology is beneficial for gifted students, it could have a maximum age of application. As at the age of 12,
the neuronal plasticity is lower that the one experienced at early childhood and also the negative effect of
average society distractors could be overwhelming for the students that begin the program at an older age
(Almazan, 2010; Trapp & Himelstein, 1962). A future research should be conducted in this field for analyzing
this factor and revealing the effect of age in these IQ modifications.
Figure 3. IQ scores regarding gender (N = 868). A significant difference is presented between IQ scores obtained both in the second and third semesters, a larger difference is found comparing the initial scores (obtained in January 2012) and the final ones (measured in August 2013). The number expresses the mean of each group in every evaluation schedule. The average of both gender groups remains distant in January 2013.
Table 2 Descriptive Statistics of the Gifted Population Regarding IQ, AGT Scores, and Gender Throughout the Two-Year Period of the Intellectual Enhancement Program Application
Mean (Jan. 2012)
Standard deviation (Jan. 2012)
Mean (Aug. 2012)
Standard deviation (Aug. 2012)
Mean (Jan. 2013)
Standard deviation (Jan. 2013)
Mean (Aug. 2013)
Standard deviation (Aug. 2013)
Overall IQ 139.05 9.73 140.30 21.75 146.11 15.13 151.90 12.45 IQ of the male participants
139.16 9.77 140.38 21.92 145.83 15.12 151.97 12.31
IQ of the female participants
138.63 9.56 141.40 21.24 151.40 15.16 150.18 12.73
Mean (Jan. 2012)
Standard deviation (Jan. 2012)
Mean (Sept. 2013)
Standard deviation (Sept. 2013)
Overal AGT scores
55.84 20.26 63.88 14.31
Notes. Data were obtained during analysis with SPSS and calculation of descriptive statistics. Gender groups did not show differences in all measurements of IQ and AGT scores.
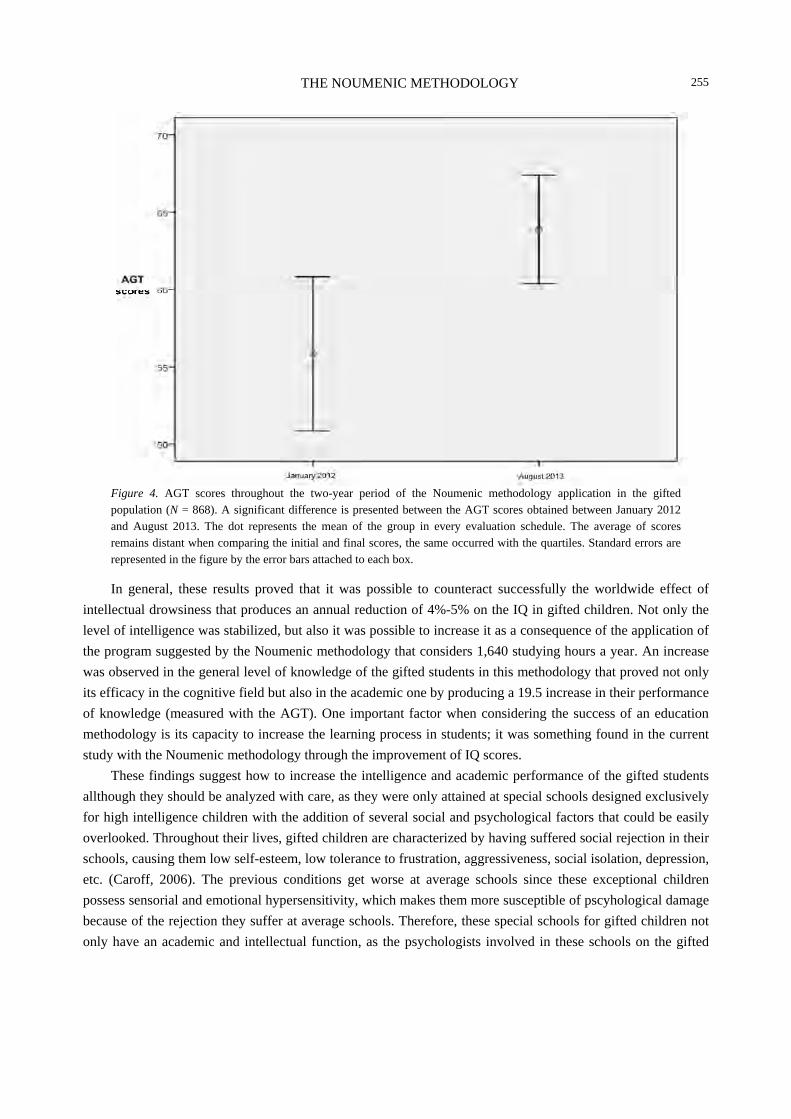
THE NOUMENIC METHODOLOGY
255
Figure 4. AGT scores throughout the two-year period of the Noumenic methodology application in the gifted population (N = 868). A significant difference is presented between the AGT scores obtained between January 2012 and August 2013. The dot represents the mean of the group in every evaluation schedule. The average of scores remains distant when comparing the initial and final scores, the same occurred with the quartiles. Standard errors are represented in the figure by the error bars attached to each box.
In general, these results proved that it was possible to counteract successfully the worldwide effect of
intellectual drowsiness that produces an annual reduction of 4%-5% on the IQ in gifted children. Not only the
level of intelligence was stabilized, but also it was possible to increase it as a consequence of the application of
the program suggested by the Noumenic methodology that considers 1,640 studying hours a year. An increase
was observed in the general level of knowledge of the gifted students in this methodology that proved not only
its efficacy in the cognitive field but also in the academic one by producing a 19.5 increase in their performance
of knowledge (measured with the AGT). One important factor when considering the success of an education
methodology is its capacity to increase the learning process in students; it was something found in the current
study with the Noumenic methodology through the improvement of IQ scores.
These findings suggest how to increase the intelligence and academic performance of the gifted students
allthough they should be analyzed with care, as they were only attained at special schools designed exclusively
for high intelligence children with the addition of several social and psychological factors that could be easily
overlooked. Throughout their lives, gifted children are characterized by having suffered social rejection in their
schools, causing them low self-esteem, low tolerance to frustration, aggressiveness, social isolation, depression,
etc. (Caroff, 2006). The previous conditions get worse at average schools since these exceptional children
possess sensorial and emotional hypersensitivity, which makes them more susceptible of pscyhological damage
because of the rejection they suffer at average schools. Therefore, these special schools for gifted children not
only have an academic and intellectual function, as the psychologists involved in these schools on the gifted
THE NOUMENIC METHODOLOGY
256
education are alert to maintain the emotional stability of the gifted children attended in the programs. As it was
shown by Terman and Oden (1954) that, for this population, one main factor to take special care of in their
special education is the perception that all previous negative experiences will not be present any longer. This
gives them a feeling of security and lets them work on the academic side without distractions from the
emotional field. In the first place, children begin to gain confidence in themselves when they confirm that there
are persons who are similar to them, understand them, and do not intend to hurt them. This improves their
self-confidence importantly; the psychologists help them overcome their fears and reinforce their security
(Weissman, 2006). The emotional factors should be considered as one of the causes of the Noumenic
methodology as it can be observed with more self-confident students who stand up for their ideas, unafraid to
say they are gifted persons, lecture with no hesitation before a large audience, etc.. Therefore, the results of this
research show that the Noumenic methodology works perfectly at special schools for gifted students. The
effects with gifted students at average schools are unknown although possibly it will not produce the same
beneficial results.
Several governments have expressed their concern of the scarcity of extremely high giftedness in their
population produced mainly by the Gaus curve effect. However, with the use of the Noumenic special
education methodology or a similar one, it could be possible to attain to have these special students rising from
the same population of mildly gifted students. The benefits of raising the intelligence and academic
achievement of the mild gifted ones to the levels of the extremely high ones would produce effects not only in
the scientific development, but also in the economic one. The latter produced due to the correlation between the
level of intelligence and gifted populations with the per capita income of that country and therefore with
national richness (Lynn & Vanhanen, 2002).
Conclusions
The Noumenic methodology, also known as the theory of organization of intelligence, has been the
official psychoeducational model for the last lustrum in several of the largest institutions in the world, for
instance, the Mexican Alliance for Giftedness, which was recognized by the World Council of Gifted and
Talented Children for its innovative methods in the education of gifted persons. The Noumenic methodology,
thereby, emerged as a possible solution to the lack of an education methodology designed for gifted students,
which could not only take advantage of their capacities, but also to improve them. Even spreading knowledge
about this innovative method for gifted students could mean an improvement for the most brilliant minds in the
world as a new educational alternative for those who, because of their high level of intelligence, are the
potential scientists, inventors, or leaders, and the only thing they need is to count on an educative methodology
based on investigations designed for them.
The area of giftedness is a very broad field of investigation, unexplored in great part, where it would be
convenient to conduct investigations aimed at knowing this sector of the population. In addition to the positive
effects it will have on the persons in this sector, many benefits would be attained if giftedness is properly
diagnosed and channeled in all of the cases in the education area in function of the contributions this population
would offer to mankind in general (García, 2007; Olszewski & Lee, 2011). In this research, a relationship was
found between the application of the Noumenic methodology and an increase in academic overall performance.
Whereas underachievement, a deleterious factor commonly used to disrupt gifted students’ development at
average schools, in this case at the special schools where this study was performed, was diminished. In addition,

THE NOUMENIC METHODOLOGY
257
an increase of 10% approximately in gifted students’ IQ was found out, one thing that did not happen with the
ones that stay at Mexico and America’s average schools, where the intellectual drowsiness phenomenon tends
to reduce their IQ in 3%-4% approximately due a lack of cognitive stimulation. Paving in this way, a possible
action for stopping the average social negative effects is produced in gifted students due to a lack of
stimulation.
The results reinforce the statement of the Chinese Secretary of Education that the special education models
of the “pull-out” method and “full-time ability regrouping” produce a significant development on the
intellectual level and academic performance of the gifted students after two years of application, in addition to
reducing the loss of talent index in schools, in comparison to what happens with the intensive education
methods (Yun-Dai, Ann-Swanson, & Cheng, 2011).
There are still numerous areas to be investigated in this field of gifted students, for example, academic
success (the possibility that they will enter and conclude university and postgraduate degrees satisfactorily). As
it is widely known that although IQ scores could be reliable for measuring intelligence, they are not fully
predictors for future success, for this reason, other tests similar to the ones of IQ have this capacity. The
potential of future academic success is measured in Mexico with the Academic Admission Test (PAA) and the
Admission Exam to Postgraduate Test (PAEP) designed by the Instituto Tecnológico y de Estudios Superiores
de Monterrey (ITESM). Both standardized tests are used as a reliable indicator of the academic potential of
each student in function of his/her cognitive record, educative preparation, and intellectual capacity, also
predicting the risk of scholar desertion (Tecnológico de Monterrey, 2011). On an international level, the
General Record Examination (GRE) is used as a predictor of the academic potential although with similar
premises by the American and European universities. These tests could be applied in the future to the same or a
larger sample of gifted students to expand the scope of the results obtained.
We still have to analyze the difference on academic and intellectual performance in gifted students who
receive specialized education in comparison to those in traditional schools who do not get this attention. A
comparative study of this type would help solve the question about which are the most effective education
models to increase the gifted students’ academic and intellectual capacities thus guiding the creation of
educative policies related to this area. In addition, the gender difference of the increase of IQ could be also the
central topic of a large-scale research on gifted children.
With the data found in this study, it can be affirmed that the Noumenic methodology has shown
effectiveness to increase the academic and intellectual performance of the gifted students, a matter that had not
been possible to produce along with other strategies applied previously in Mexico and several at USA. This
method has not yet been applied in a larger scale; it includes 3,000 gifted students who have worked in it in
relation to 66 million in the world, including one million brilliant minds available in Mexico, three million in
USA, and 10 million in China. However, if this method is used in a general way in more centers for gifted
students in other continents, it would reflect with a better index of educational success in the future: New
investigators and gifted leaders would allow mankind to progress not only in the scientific area, but also as a
society in general.
References Almazán, A. A. (2010). Hay un deber social para los niños y jóvenes? (Is there a social duty for children and youth?).
HumanidadES-Up, 2(2), 122-139.
THE NOUMENIC METHODOLOGY
258
Almazán, A. A., García-Horta, R., Muñoz, C., Somunano-Spears, D., Esquivel, J., & Delgado, B. (2013). The Intellectual Enhancement Program: Results of an international educative methodology for gifted students. Procedures of The World Educational Research Association Focal Meeting 2013, USA.
Almazán, M. A. (2013). Intellectual enhancement. Excellsus, 3(1), 11-12. Archundia, M. (2010). Bullying, cada vez más graves y agresivos (Bullying, increasingly sever and aggresive). El Universal,
23(8), 2. Báthory, Z., & Joó, A. (1988). L’éducation des surdoués comme probléme: Le cas de la Hongrie (The education of gifted children
as a problem: The case of Hungary). UNESCO Perspectives Revue Trimestrielle de L'éducation, 18(1), 11-24. Caroff, X. (2006). Identification multidimensionnelle du haut potentiel: Mise au point d’une version française des échelles
d’évaluation des caractéristiques de comportement des élèves surdoués (Multidimensional identification of high potential: Development of a French version of the rating scales of behavioral characteristics of gifted). Bulletin de Psychologie, 5(485), 469-480.
Clausewitz, C. (1976). On war. Princeton, N.J.: Princeton University Press. Clements, J. (2012, May 25). Mexican 10-year old girls get admission to college. Hufftington Post, p. 23. Colson, S. (1980). The evaluation of a community-based career education program for gifted and talented students as an
administrative model for an alternative program. Gifted Child Quarterly, 24(3), 101-106. Cruz, A. (2013). México pierde al 96% de sus niños sobredotados antes de la edad adulta (Mexico loses 96% of their gifted
children before adulthood). Tijuana, México: CNN. Dawson, B., & Trapp, R. (2005). Bioestadística médica (Medical biostatistics). Mexico, D.F.: Manual Moderno. Duan, X., Shi, J., & Zhou, D. (2010). Developmental changes in processing speed: Influence of accelerated education for gifted
children. Gifted Education Quarterly, 54(2), 85-91. Elices, J., Palazuelo, M., & Del Caño, M. (2006). El profesor, identificador de necesidades educativas asociadas a alta capacidad
intelectual (The teacher, identifier of needs associated with higher ability). Faísca, 11(13), 23-47. Gabriel, R. (2010). The case of differentiated professional support. Journal of Curriculum and Instruction, 4(1), 86-96. García, B. (2007). El potencial de aprendizaje y los niños superdotados (The learning potential and gifted children) (Doctoral
dissertation, Universidad de Granada). Giessman, J., Gambrell, J., & Stebbins, M. (2013). Minority performance on the Naglieri Ability Test Second Edition versus the
Cognitive Abilities Test: One gifted program’s experience. Gifted Child Quarterly, 57(2), 101-109. González-Geraldo, G., Del Rincón, B., Bonilla-Sánchez, A., & Sáez, J. (2013). Aprendizajes colaterales: Límites y retos del
aprendizaje por competencias (Collateral learning: Limitations and challenges of based-skill learning). Ensayos: Revista de la Facultad de Educación de Albacete, 5(27), 189-202.
Hettinger-Steiner, H. (2006). A microgenetic analysis of strategic variability in gifted and average-ability children. Gifted Child Quarterly, 50(1), 62-74.
Hsu, L. (2003). Measuring the effectiveness of summer intensive physics courses for gifted students: A pilot study and agenda for research. Gifted Child Quarterly, 47(3), 212-218.
Legendre, M. (2008). La notion de competénce au coeur des reformes curriculares: effet e mode ou moteur de changements en profondeur (The concept of competence at the heart of curriculum refirm: Effect mode of changes in depth). In F. Y. Audigier, & G. Tutiaux (Eds.), Compétences et contenus? (Skills and content?) (pp. 27-50). Bruxelles, Belgique: De Boeck.
Lynn, R., & Vanhanen, T. (2002). IQ and the wealth of nations. London, U.K.: Praeger. Olszewski-Kubilius, P., & Lee, S. (2011). Gender and other group differences in performance on off-level test: Changes in the
21st century. Gifted Child Quarterly, 55(1), 54-73. Pallas, A., & Alexander, K. (1983). Sex differences in quantitative SAT performance: New evidence on the differential
coursework hypothesis. American Educational Research Journal, 20(2), 165-182. Passow, H. (1985). L’éducation des surdoués (The education of the gifted). UNESCO Perspectives Revue Trimestrielle de
L'éducation, 16(2), 183-194. Pérez-Sánchez, L., López-Cobeñas, E., Del Valle, L., & Ricote, E. (2008). Más allá del currículo: Programas de enriquecimiento
extraescolar, la experiencia del programa estrella (Beyond the curriculum: School enrichment programs, the program star experience). Faísca, 13(15), 4-29.
Ramsay, S., & Richards, H. (1997). Cooperative learning environments: Effects of academic attitudes of gifted students. Gifted Child Quarterly, 41(4), 160-168.
THE NOUMENIC METHODOLOGY
259
Swiatek, M. (1995). An empirical investigation of the social coping strategies used by gifted adolescents. Gifted Child Quarterly, 39(3), 154-160.
Tecnológico de Monterrey. (2011). Prueba de aptitud académica, manual (Academic aptitude test, manual). México: Editorial Tecnológico de Monterrey.
Terman, L. (1930). Genetic studies of genius. Palo Alto, C.A.: Stanford University Press. Terman, L., & Oden, M. (1954). Major issues in the education of gifted children. Journal of Teacher Education, 5(2), 230-232. Trapp, P., & Himelstein, P. (1962). The exceptional child: Research and theory. New York, N.Y.: Appleton Century Crofts. Van Tassel-Baska, J., Johnson, D., & Avery, L. (2002). Using performance tasks in the identification of economically
disadvantaged and minority gifted learners: Findings from project STAR. Gifted Child Quarterly, 46(2), 110-123. Vaughn, V., Feldhusen, J., & Asher, J. (1991). Meta-analyses and review of research on pull-out programs in gifted education.
Gifted Child Quarterly, 35(2), 92-98. Vrignaud, P. (2006). La scolarisation des enfants intellectuellement précoces en France, présentation des différentes mesures et de
résultats de recherches (Schooling for gifted children in France, presentation of the different measures and findings). Bulletin de Psychologie, 5(485), 439-449.
Walsh, R., & Kemp, C. (2013). Evaluating interventions for young gifted children using single-subject methodology: A preliminary study. Gifted Child Quarterly, 57(2), 110-120.
Weismann, C. (2006). Hétérogénéité ou dysharmonie? Clinique du foncotionnement mental des enfants à haut potentiel (Heterogeneity or disharmony? Clinical mental functioning children with high potential). Bulletin de Psychologie, 5(485), 481-489.
Weyl, N. (1970). The potential role of the gifted in underdeveloped countries. Gifted Child Quarterly, 14(3), 29-35. Yun-Dai, D., Ann-Swanson, J., & Cheng, H. (2011). State of research on giftedness and gifted education: A survey of empirical
studies published during 1998-2010. Gifted Child Quarterly, 55(2), 126-138.
US-China Education Review B, ISSN 2161-6248 April 2014, Vol. 4, No. 4, 260-267
Opinions of School Administrators and Teachers on the Use of
Social Media Platforms and Tools in Education*
Mehmet Menteşe, Şefika Şule Erçetin
Hacettepe University, Ankara, Turkey
In a globalizing world, technology is progressing at breakneck speed. Modern people are now staying away from
static, unshared, and perhaps most importantly, slow technologies and looking for new products for themselves.
One of them is social media. Given the development of social media and the level and frequency of use of these
tools by a new generation who is defined as “digital natives”, it is impossible for the educational approach to be
unaffected by this. Therefore, this study has tried to reveal what opinions school administrators and teachers—as
the main actors of education—held on the use of social media platforms and tools in education.
Keywords: school administrators and teachers, social media and education, social media platforms and tools
Introduction
Dialogues and sharing among individuals on the Internet constitute social media. Thanks to websites and
applications, such as social networks, blogs, micro-blogs, instant messaging programs, chat sites, and forums,
allowing people to share content and information, Internet users have the opportunity to access the content they
are seeking and interested in.
In the 21st century, known as the age of information and technology, information technologies (ITs) have
reshaped interpersonal interaction as well as the teaching-learning process and social, economic, and cultural
life.
In particular, on social networking sites that carry people’s communication mode to different dimensions,
millions of people are located therein with their real identities and are able to share all kinds of information
freely. The fact that effective usage of social networking sites has become so widespread for very different
purposes is part of the educational processes and is of paramount importance as well.
The fact that mostly young people and students constitute the majority of social network users and that
provides users with the opportunity for rich interaction brings to mind the use of these media for educational
purposes. Social networking sites having an importance in the lives of students of any age have aroused great
interest among some educators (Selwyn & Lyndsay, 2009, pp. 79-86).
Social networking sites can be used more easily in comparison with other educational management
systems because they are flexible and user-friendly. Many educators and researchers are creating a
* This paper is produced from the Master’s thesis “Opinions of School Administrators and Teachers on the Use of Social Media
Platforms and Tools in Education” of Mehmet Menteşe, a Ph.D. candidate at the Educational Sciences Department, Faculty of Education, Hacettepe University.
Mehmet Menteşe, Ph.D. candidate, Educational Sciences Department, Faculty of Education, Hacettepe University. Şefika Şule Erçetin, Ph.D., professor, Educational Sciences Department, Faculty of Education, Hacettepe University.
DAVID PUBLISHING
D
ON THE USE OF SOCIAL MEDIA PLATFORMS AND TOOLS IN EDUCATION
261
community by following simpler steps, and the realization of sharing among themselves provides substantial
convenience for communication and feedback. In addition to these mentioned characteristics, social
networking sites also provide benefits to educational organizations for features, such as enriching blended
academic experience and providing a useful support in the evaluation process (Jones, Blackey, Fitzgibbon, &
Chew, 2010, pp.776-782).
The use of social networks enriched by the opportunities provided to users in recent years is becoming
more widespread every day. Given the fact that the large part of social network users are comprised of students,
teachers, and school administrators, the existence of ideas and works for the educational usage of social
networking sites is required to stay abreast of the changing ITs. On the other hand, due to the dense number of
social network users, the importance of their usage by educators both for professional development and
educational context is increasingly understood (Grant, 2008, pp. 3755-3759).
Prensky (2001, pp. 1-6) stated that future generations will be comprised of “digital natives” born in an
environment where today’s technology is present and will grow up with technologies, such as computers, video
games, digital music players, video cameras, cell phones, and the Internet, and learn technologies as if
acquiring their mother tongue. A staff consisting of teachers and education administrators with a command of
technology even if they are unable to fully use its language will be able to provide the training of such a
generation who can use technology like a language and who can operate their minds with the language of the
technology.
In a world where generating information and possessing it have become a power, it has become inevitable
that the traditional role of the teacher should also be changed. It is no longer a teacher’s job to transfer readily
available information but to provide access to information which is rapidly developing and changing.
The teacher-centered education in the traditional system has been replaced with the student-centered
education system. In teacher-centered education, the teacher, who plays the role of supplier of information and
knower of everything, is active in the classroom environment. The method of acquiring information is based on
collecting information and memorizing it. The use of technology is at the level of drilling and practicing. In the
student-centered education system, on the other hand, there exists an environment where interaction is the most
prominent within the classroom. A teacher is in a situation where he/she co-operates and is a learner sometimes;
he/she has developed a sense of inquiry and invention (Odabaşı, 1997, p. 47).
The results of the study carried out by Erçetin and Menteşe (2012, pp. 110-113) on the students’ and the
investigated parents’ opinions of social media also revealed to us that new generation of students known as the
“digital natives” now want a brand-new learning model. It is also teachers that will realize this learning model.
Therefore, instead of running away from the new training model, it seems that a much more constructive and
wise approach to learn and teach how to use the social media platforms and tools is needed to make a positive
impact at different levels.
What teachers and administrators—as the major actors of education—think about this matter is very
important in terms of guiding education. Therefore, the present study is aimed at bringing forward the opinions
of the teachers and the administrators on the use of social media platforms and tools in education and whether
their opinions vary according to personal characteristics.
The answers to the following questions will be sought about the status of this problem:
1. What are the personal characteristics of the teachers and the administrators participating in the study?
2. Is there a relationship between the personal characteristics of the teachers and the administrators and
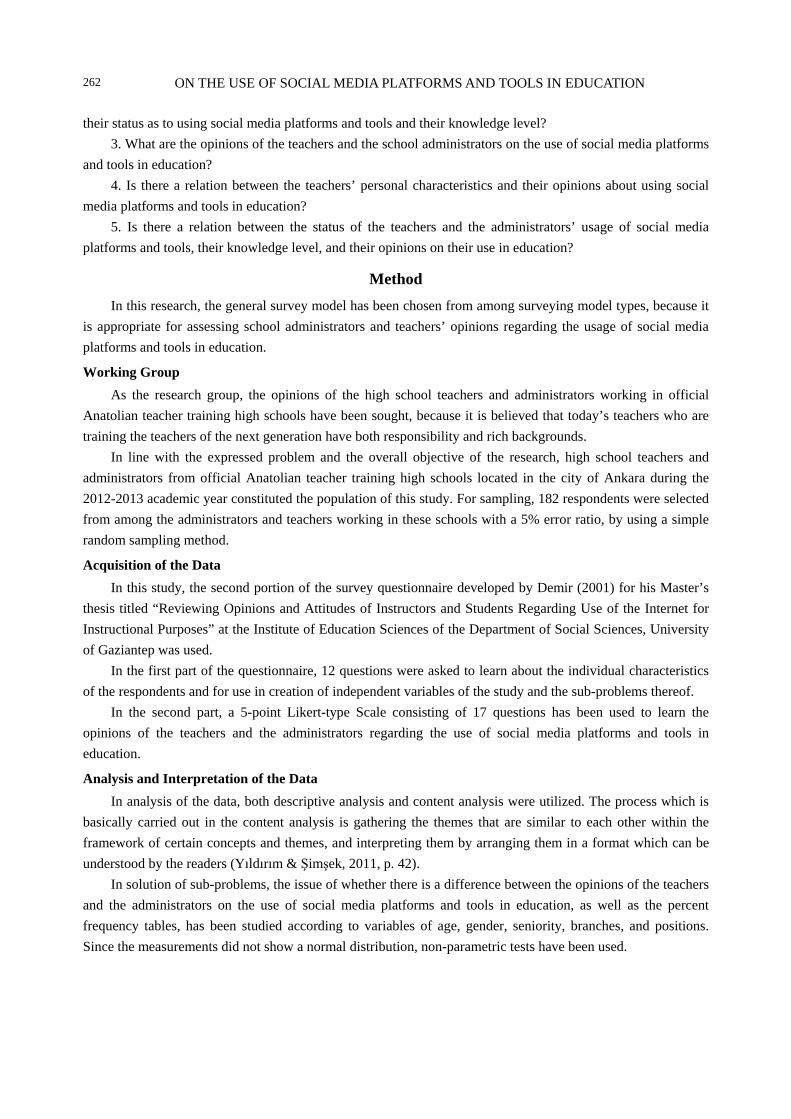
ON THE USE OF SOCIAL MEDIA PLATFORMS AND TOOLS IN EDUCATION
262
their status as to using social media platforms and tools and their knowledge level?
3. What are the opinions of the teachers and the school administrators on the use of social media platforms
and tools in education?
4. Is there a relation between the teachers’ personal characteristics and their opinions about using social
media platforms and tools in education?
5. Is there a relation between the status of the teachers and the administrators’ usage of social media
platforms and tools, their knowledge level, and their opinions on their use in education?
Method
In this research, the general survey model has been chosen from among surveying model types, because it
is appropriate for assessing school administrators and teachers’ opinions regarding the usage of social media
platforms and tools in education.
Working Group
As the research group, the opinions of the high school teachers and administrators working in official
Anatolian teacher training high schools have been sought, because it is believed that today’s teachers who are
training the teachers of the next generation have both responsibility and rich backgrounds.
In line with the expressed problem and the overall objective of the research, high school teachers and
administrators from official Anatolian teacher training high schools located in the city of Ankara during the
2012-2013 academic year constituted the population of this study. For sampling, 182 respondents were selected
from among the administrators and teachers working in these schools with a 5% error ratio, by using a simple
random sampling method.
Acquisition of the Data
In this study, the second portion of the survey questionnaire developed by Demir (2001) for his Master’s
thesis titled “Reviewing Opinions and Attitudes of Instructors and Students Regarding Use of the Internet for
Instructional Purposes” at the Institute of Education Sciences of the Department of Social Sciences, University
of Gaziantep was used.
In the first part of the questionnaire, 12 questions were asked to learn about the individual characteristics
of the respondents and for use in creation of independent variables of the study and the sub-problems thereof.
In the second part, a 5-point Likert-type Scale consisting of 17 questions has been used to learn the
opinions of the teachers and the administrators regarding the use of social media platforms and tools in
education.
Analysis and Interpretation of the Data
In analysis of the data, both descriptive analysis and content analysis were utilized. The process which is
basically carried out in the content analysis is gathering the themes that are similar to each other within the
framework of certain concepts and themes, and interpreting them by arranging them in a format which can be
understood by the readers (Yıldırım & Şimşek, 2011, p. 42).
In solution of sub-problems, the issue of whether there is a difference between the opinions of the teachers
and the administrators on the use of social media platforms and tools in education, as well as the percent
frequency tables, has been studied according to variables of age, gender, seniority, branches, and positions.
Since the measurements did not show a normal distribution, non-parametric tests have been used.
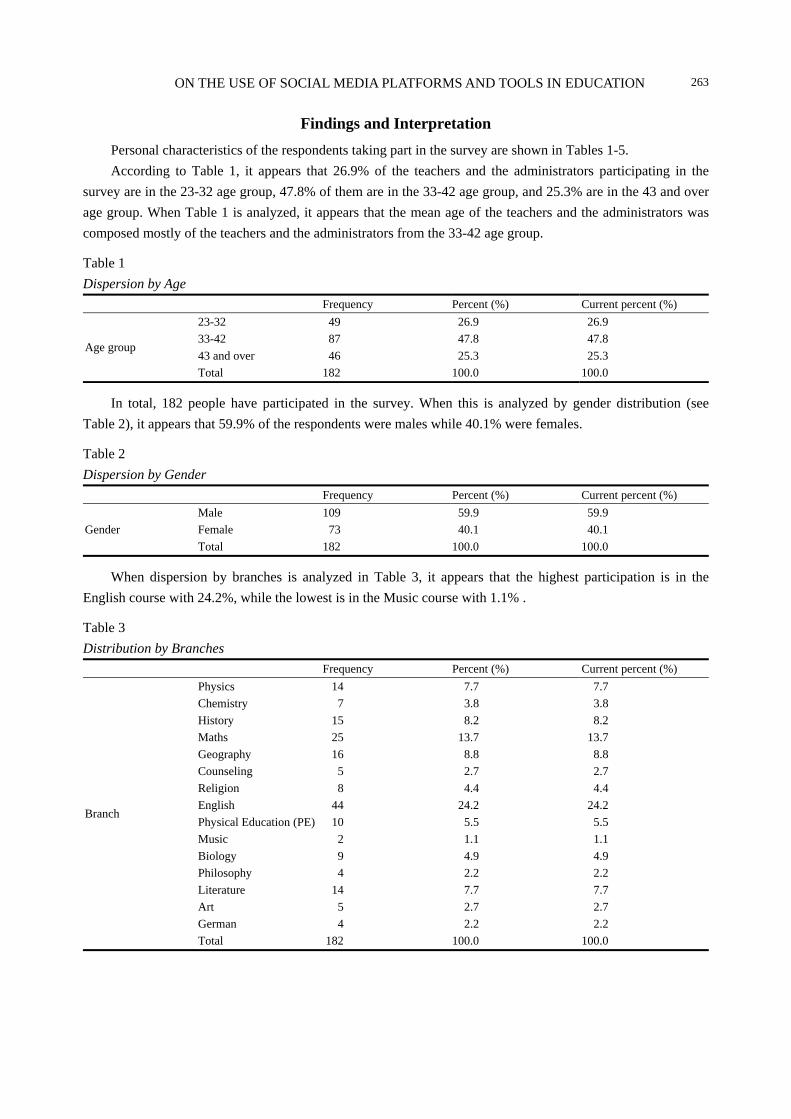
ON THE USE OF SOCIAL MEDIA PLATFORMS AND TOOLS IN EDUCATION
263
Findings and Interpretation
Personal characteristics of the respondents taking part in the survey are shown in Tables 1-5.
According to Table 1, it appears that 26.9% of the teachers and the administrators participating in the
survey are in the 23-32 age group, 47.8% of them are in the 33-42 age group, and 25.3% are in the 43 and over
age group. When Table 1 is analyzed, it appears that the mean age of the teachers and the administrators was
composed mostly of the teachers and the administrators from the 33-42 age group.
Table 1
Dispersion by Age
Frequency Percent (%) Current percent (%)
Age group
23-32 49 26.9 26.9
33-42 87 47.8 47.8
43 and over 46 25.3 25.3
Total 182 100.0 100.0
In total, 182 people have participated in the survey. When this is analyzed by gender distribution (see
Table 2), it appears that 59.9% of the respondents were males while 40.1% were females.
Table 2
Dispersion by Gender
Frequency Percent (%) Current percent (%)
Gender
Male 109 59.9 59.9
Female 73 40.1 40.1
Total 182 100.0 100.0
When dispersion by branches is analyzed in Table 3, it appears that the highest participation is in the
English course with 24.2%, while the lowest is in the Music course with 1.1% .
Table 3
Distribution by Branches
Frequency Percent (%) Current percent (%)
Branch
Physics 14 7.7 7.7
Chemistry 7 3.8 3.8
History 15 8.2 8.2
Maths 25 13.7 13.7
Geography 16 8.8 8.8
Counseling 5 2.7 2.7
Religion 8 4.4 4.4
English 44 24.2 24.2
Physical Education (PE) 10 5.5 5.5
Music 2 1.1 1.1
Biology 9 4.9 4.9
Philosophy 4 2.2 2.2
Literature 14 7.7 7.7
Art 5 2.7 2.7
German 4 2.2 2.2
Total 182 100.0 100.0
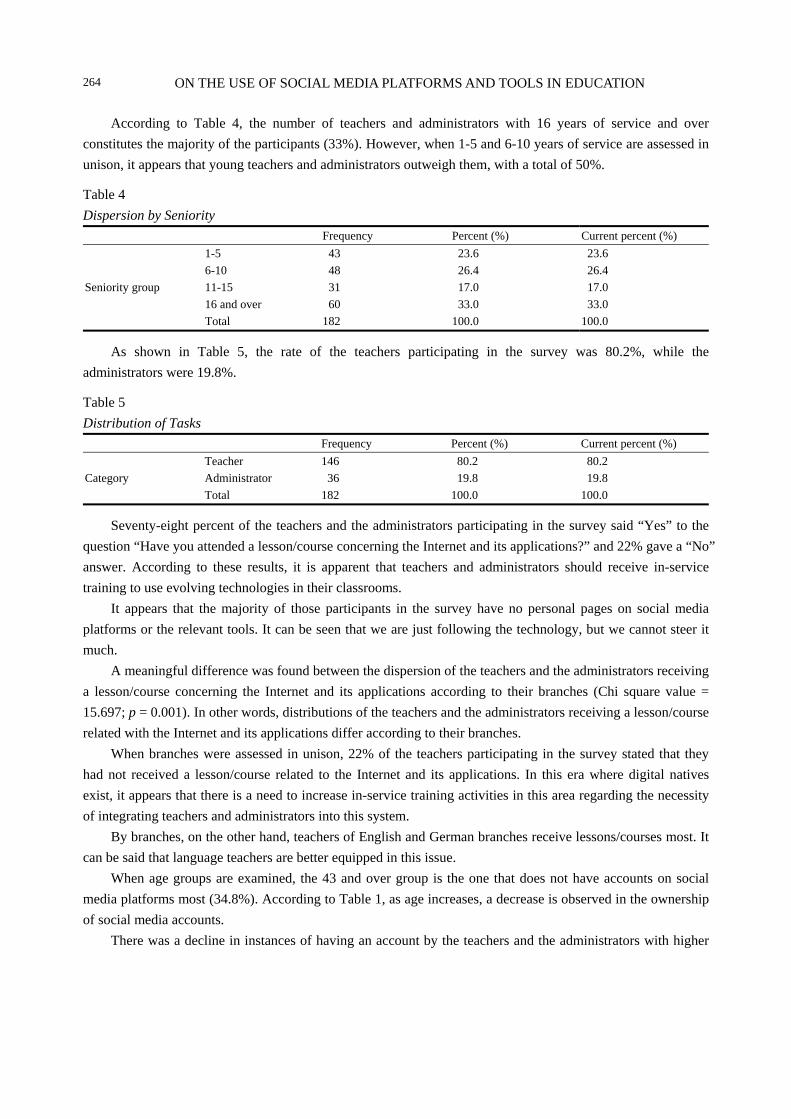
ON THE USE OF SOCIAL MEDIA PLATFORMS AND TOOLS IN EDUCATION
264
According to Table 4, the number of teachers and administrators with 16 years of service and over
constitutes the majority of the participants (33%). However, when 1-5 and 6-10 years of service are assessed in
unison, it appears that young teachers and administrators outweigh them, with a total of 50%.
Table 4
Dispersion by Seniority
Frequency Percent (%) Current percent (%)
Seniority group
1-5 43 23.6 23.6
6-10 48 26.4 26.4
11-15 31 17.0 17.0
16 and over 60 33.0 33.0
Total 182 100.0 100.0
As shown in Table 5, the rate of the teachers participating in the survey was 80.2%, while the
administrators were 19.8%.
Table 5
Distribution of Tasks
Frequency Percent (%) Current percent (%)
Category
Teacher 146 80.2 80.2
Administrator 36 19.8 19.8
Total 182 100.0 100.0
Seventy-eight percent of the teachers and the administrators participating in the survey said “Yes” to the
question “Have you attended a lesson/course concerning the Internet and its applications?” and 22% gave a “No”
answer. According to these results, it is apparent that teachers and administrators should receive in-service
training to use evolving technologies in their classrooms.
It appears that the majority of those participants in the survey have no personal pages on social media
platforms or the relevant tools. It can be seen that we are just following the technology, but we cannot steer it
much.
A meaningful difference was found between the dispersion of the teachers and the administrators receiving
a lesson/course concerning the Internet and its applications according to their branches (Chi square value =
15.697; p = 0.001). In other words, distributions of the teachers and the administrators receiving a lesson/course
related with the Internet and its applications differ according to their branches.
When branches were assessed in unison, 22% of the teachers participating in the survey stated that they
had not received a lesson/course related to the Internet and its applications. In this era where digital natives
exist, it appears that there is a need to increase in-service training activities in this area regarding the necessity
of integrating teachers and administrators into this system.
By branches, on the other hand, teachers of English and German branches receive lessons/courses most. It
can be said that language teachers are better equipped in this issue.
When age groups are examined, the 43 and over group is the one that does not have accounts on social
media platforms most (34.8%). According to Table 1, as age increases, a decrease is observed in the ownership
of social media accounts.
There was a decline in instances of having an account by the teachers and the administrators with higher
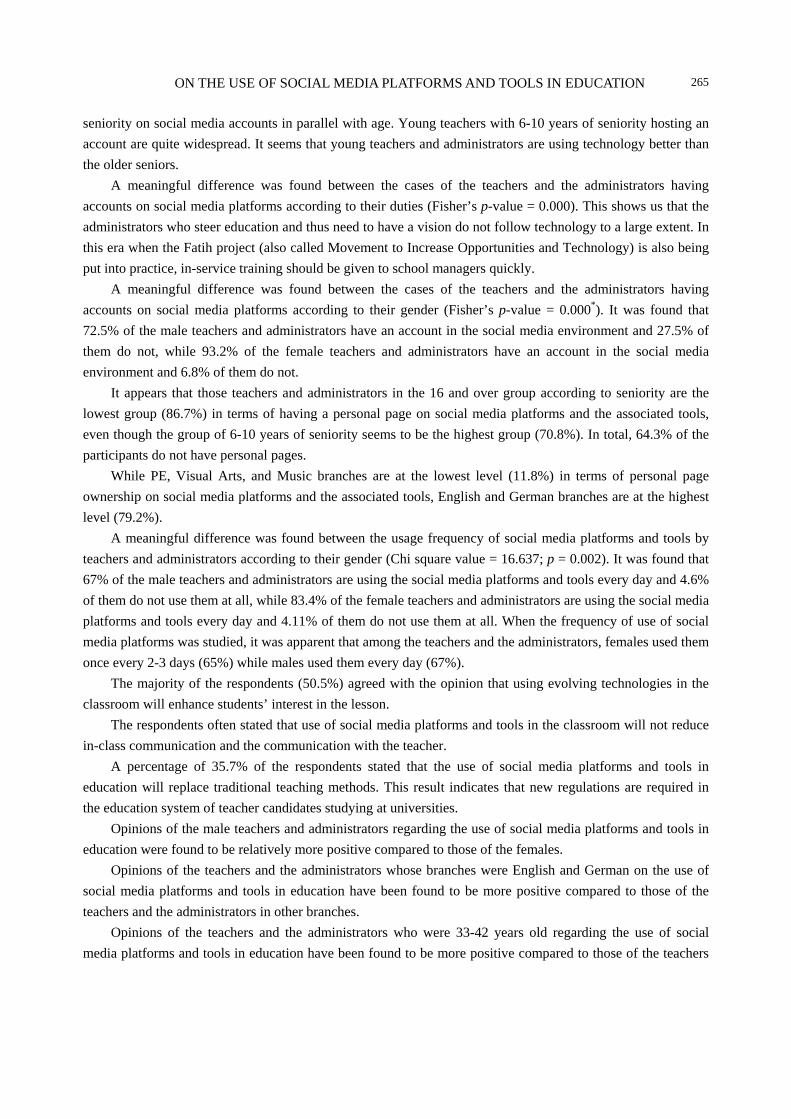
ON THE USE OF SOCIAL MEDIA PLATFORMS AND TOOLS IN EDUCATION
265
seniority on social media accounts in parallel with age. Young teachers with 6-10 years of seniority hosting an
account are quite widespread. It seems that young teachers and administrators are using technology better than
the older seniors.
A meaningful difference was found between the cases of the teachers and the administrators having
accounts on social media platforms according to their duties (Fisher’s p-value = 0.000). This shows us that the
administrators who steer education and thus need to have a vision do not follow technology to a large extent. In
this era when the Fatih project (also called Movement to Increase Opportunities and Technology) is also being
put into practice, in-service training should be given to school managers quickly.
A meaningful difference was found between the cases of the teachers and the administrators having
accounts on social media platforms according to their gender (Fisher’s p-value = 0.000*). It was found that
72.5% of the male teachers and administrators have an account in the social media environment and 27.5% of
them do not, while 93.2% of the female teachers and administrators have an account in the social media
environment and 6.8% of them do not.
It appears that those teachers and administrators in the 16 and over group according to seniority are the
lowest group (86.7%) in terms of having a personal page on social media platforms and the associated tools,
even though the group of 6-10 years of seniority seems to be the highest group (70.8%). In total, 64.3% of the
participants do not have personal pages.
While PE, Visual Arts, and Music branches are at the lowest level (11.8%) in terms of personal page
ownership on social media platforms and the associated tools, English and German branches are at the highest
level (79.2%).
A meaningful difference was found between the usage frequency of social media platforms and tools by
teachers and administrators according to their gender (Chi square value = 16.637; p = 0.002). It was found that
67% of the male teachers and administrators are using the social media platforms and tools every day and 4.6%
of them do not use them at all, while 83.4% of the female teachers and administrators are using the social media
platforms and tools every day and 4.11% of them do not use them at all. When the frequency of use of social
media platforms was studied, it was apparent that among the teachers and the administrators, females used them
once every 2-3 days (65%) while males used them every day (67%).
The majority of the respondents (50.5%) agreed with the opinion that using evolving technologies in the
classroom will enhance students’ interest in the lesson.
The respondents often stated that use of social media platforms and tools in the classroom will not reduce
in-class communication and the communication with the teacher.
A percentage of 35.7% of the respondents stated that the use of social media platforms and tools in
education will replace traditional teaching methods. This result indicates that new regulations are required in
the education system of teacher candidates studying at universities.
Opinions of the male teachers and administrators regarding the use of social media platforms and tools in
education were found to be relatively more positive compared to those of the females.
Opinions of the teachers and the administrators whose branches were English and German on the use of
social media platforms and tools in education have been found to be more positive compared to those of the
teachers and the administrators in other branches.
Opinions of the teachers and the administrators who were 33-42 years old regarding the use of social
media platforms and tools in education have been found to be more positive compared to those of the teachers

ON THE USE OF SOCIAL MEDIA PLATFORMS AND TOOLS IN EDUCATION
266
and the administrators in other age groups.
Opinions of the teachers and the administrators with 6-10 years of seniority regarding the use of social
media platforms and tools in education have been found to be more positive compared to those of the teachers
and the administrators having seniority with different years of service.
Opinions of the teachers regarding the use of social media platforms and tools in education have been
found to be more positive compared to those of the administrators.
Conclusions and Recommendations
According to the findings of the study, the teachers and the school administrators participating in the study
share the views that the use of social media platforms and tools in education will:
(a) Raise the level of education given to students;
(b) Increase the motivation of students;
(c) Not weaken in-class communication and the communication with the teacher;
(d) Make students more social;
(e) Provide a faster and more detailed feedback in exams;
(f) Not increase class absenteeism;
(g) Not reduce the role of the teacher;
(h) Not depress students and school relationship;
(i) Not cause a decrease in the success of students;
(j) Enhance students’ ability to communicate;
(k) Enrich the class environment;
(l) Provide easy access to course materials in and out of class;
(m) Broaden students’ scope of thought;
(n) Replace traditional teaching methods.
In contrast, the teachers and the school administrators participating in the study on the use of social media
platforms and tools in education provided negative feedback, sharing the opinions that:
1. It is not suitable for all courses;
2. It is not suitable for students of all levels;
3. It will be effective only for students with internally highly motivation levels.
The results of the research indicate to us the vital need for school administrators and teachers, who are the
dominant components of the education system, to train themselves according to the learning styles of the digital
natives.
It seems that a much more constructive and wise approach to learn and teach how to use the social media
platforms and tools is needed to make a positive impact at different levels (Erçetin & Menteşe, 2012).
According to the results of the survey, the following recommendations have been formulated for
practitioners and researchers:
1. Training programs should be redesigned according to technological developments regarding the use of
social media platforms and tools in education;
2. The topics regarding the use of social media platforms and tools in education should be added to the
content of the educational technologies course, which is taught to pre-service teachers in universities;
3. Technical infrastructures required for utilization of social media platforms and tools in education should
ON THE USE OF SOCIAL MEDIA PLATFORMS AND TOOLS IN EDUCATION
267
be established at all levels of education;
4. Teachers should be encouraged to use social media platforms and tools in education;
5. In-service training should be arranged for school administrators and teachers so that they receive such
training in practical platforms to develop knowledge and skills for the use of platforms and tools in education;
6. Researches should be carried out on more efficient use of social networks in the educational field.
References Demir, S. (2001). Reviewing opinions and attitudes of instructors and students regarding use of the Internet for instructional
purposes (Master’s thesis, Institute of Education Sciences, Department of Social Sciences, University of Gaziantep). Erçetin, Ş. Ş., & Menteşe, M. (2012). What is happening to the students on social media? Humanity & Social Sciences Journal,
7(2), 110-113. Grant, N. (2008). On the usage of social networking software technologies in distance learning education. In C. Crawford, D.
Willis, R. Carlsen, I. Gibson, K. McFerrin, J. Price, & R. Weber (Eds.), Proceedings of The Society for Information Technology and Teacher Education International Conference (pp. 3755-3759). Chesapeake, V.A.: AACE.
Jones, N., Blackey, H., Fitzgibbon, K., & Chew, E. (2010). Get out of my space! Computers & Education, 54, 776-782. Odabaşı, F. (1997). Öğretim üyelerinin eğitim teknolojisinden yararlanmaları: Değişime direnç mi, meydan okuma mı? (Use of
educational technology by faculty instructors: Is it resistance to change or challenge?). Retrieved August 8th, 2012, from http://home.anadolu.edu.tr/~fodabasi/doc/ty33.swf
Prensky, M. (2001, October). Digital natives, digital immigrants. On the Horizon, 9(5), 1-6. Selwyn, N., & Lyndsay, G. L. (2009). Researching the realities of social software use—An introduction. Learning, Media and
Technology, 34(2), 79-86. Yıldırım, A., & Şimşek, H. (2011). Sosyal bilimlerde nitel araştırma yöntemleri (Qualitative research methods in social sciences)
(8th ed., p. 42). Ankara: Seckin Publishing.
US-China Education Review B, ISSN 2161-6248 April 2014, Vol. 4, No. 4, 268-275
The Need for Transformational Leadership in Utilizing
Abandoned Mining Holes as a Business Opportunity
Andriyansah, Tati Rajati, Fatia Fatimah
Universitas Terbuka, Jakarta, Indonesia
Indonesia is known as a mine-producing country, but only a few of its products can be enjoyed by the surrounding
society. Facts show that a lot of abandoned mining holes are deserted like useless garbage. Transformational
leadership is expected to change negative thought patterns into positive ones with the paradigm “garbage is not
always useless”. Transformational leadership should be applicable in utilizing abandoned mining holes by
educating the society and colleagues in order that the disused mine areas can be productive as independent business
opportunity into the nation’s prosperity.
Keywords: transformational leadership, abandoned mining hole, business opportunity
Introduction
The glory of Indonesia’s tin that was famous in the past left disused holes of tin mining, which were called
as “kulongs” in Belitong language or widely known as “lake”. Kulongs, the abandoned tin mining holes, have
occured since tin mining started and were spread almost in all sub-districts in Bangka Belitung province, in
which the mines are located in the middle of forest and even near the sub-district center.
Mine certainly gives positive and negative impacts on the local area, and so does the tin mine. According
to Latief (2010), positive impact of tin mining is on the economic life of the society. If the result is good, a unit
of unconventional mine (UM) can get 4,000,000 rupiah (Rp) in a day. Workers get high wage, reaching Rp
150,000 per day. Even children collecting the remains of tin sand can earn Rp 40,000 in a day. The amount of
money resulted from unconventional tin mining is very big, so it directly affects the economy of the society.
The citizens can buy goods in big amount so that retail trade develops fast, which promotes the economy
growth. The abandoned mining holes are deserted just as they are. Negative impact of the mining holes
includes the damage of biotic environment. Damage to forest from mines cause severe drought in some areas in
the dry season. Miners keep mining the tin by stealth in the forbidden areas. UMs also damage river basins,
coastal areas, conservation forest, and production forest. The abandoned mining holes are barren, because they
are not reclaimed.
Acknowledgements: It is based on the authors’ paper presented at The International Seminar on Global Education II Indonesia & Malaysia. The authors would like to express their thanks to the Faculty of Economy in Universitas Terbuka (Open University) and UPBJJ-UT Padang that assigned them to attend the international seminar. Next, they would like to thank the Committee of International Seminar on Global Education II Indonesia (Universitas Eka Sakti-Padang) and Malaysia (Universiti Kebangsaan Malaysia) that have given the chance to present the paper in Fakulti Sain Sosial on February 24th-25th, 2014.
Andriyansah, S.E., M.M., Faculty of Economy, Universitas Terbuka. Tati Rajati, Ph.D., Faculty of Teacher-Training and Educational Sciences, Universitas Terbuka. Fatia Fatimah, S.Si., M.Pd., Faculty of Mathematics and Natural Sciences, Universitas Terbuka.
DAVID PUBLISHING
D

TRANSFORMATIONAL LEADERSHIP IN UTILIZING ABANDONED MINING HOLES
269
A leader having visions will change someone’s negative ideas into positive ones stating that the mining
holes are very necessary for the prosperity in the future and the continuity of the next generation. Nowadays,
transformational leaders are suitable to overcome the leadership crisis in some leadership theories that have
been learned. Transformational leadership is firstly suggested by Burns (1978), and if it is related to Belitung
Island, a transformational leader will think positively. For example, he/she can invite tourists to come, enjoy
the scenery, and do research. It should be admitted that the increasing tourism will indirectly change the local
economy life (Andriyansah, Rajati, & Fatimah, 2012). The abandoned tin mining holes, which prove
that men do not care about environment, are probably considered as unprofitable. A leader with visions
will assume that garbage is not always useless, but it can be a blessing to increase the prosperity of the
society.
Discussion
Belitung, which local society calls as Belitong, was known as an island in the eastern sea (lepas pantai
timur) of Sumatera, Indonesia, located between Gaspar Strait and Karimata Strait. Now, Belitung Island is
divided into two administrative regions: Belitung Regency whose capital city is Tanjung Pandan and East
Belitung Regency whose capital city is Manggar.
Because of Laskar Pelangi, the visits of domestic and foreign tourists to Belitung increase after the release
of Laskar Pelangi film. Data in Table 1 show the significant tourist visits during 2008-2012.
Table 1
The Amount of Tourist Visits During 2008-2012
Year Domestic Foreign
2012 110,638 975
2011 82,584 1,309
2010 49,118 1,383
2009 39,499 2,734
2008 29,983 2,053
Note. Source: Central Bureau of Statistics (CBS)-Belitung Regency, 2013.
Right now, tourist visits focus on exotic Belitung beaches and the location of Laskar Pelangi film. It,
indeed, needs hard work to realize creative idea of developing natural tourism into agricultural business
(agribisnis) or agricultural tourism by utilizing the abandoned mining holes as a promising business opportunity,
considering the land gets smaller and job opportunities reduced, unless people create job opportunities by
themselves.
Transformational Leadership
In the authors’ opinion, a leader with transformational leadership is a leader that has abundant dreams to
make surrounding people happy and pleasant. The approach applied by a transformational leader is more
humane and removes the gap between employers and employees. Participative working environment gives
colleagues opportunity to develop personality strength and the openness to the employees will be positive
energy for the improvement. According to O’Leary (2001), transformational leadearship is a leadership style
used by a manager when he/she wants a group to widen the border and has performance that goes far beyond
the status quo or reaches a series of organization’s objectives that are fully new.
TRANSFORMATIONAL LEADERSHIP IN UTILIZING ABANDONED MINING HOLES
270
In Indonesia, Belitung is not the only place that suffers because of the mining process. The object of this
paper is Belitung, because from 2008 until now, Belitung has been phenomenal and becomes a new tourist
destination; however, the environment that has given benefit in life has not been reclaimed yet or left damaged.
According to Mulyono (2009), transformational leadership has the following characteristics:
1. It motivates the followers to realize the importance of work results;
2. It motivates the followers to prioritize the organization’s interest;
3. It motivates the followers to fulfill the higher needs.
If a transformational leader emerges, the abandoned mining holes will possibly give many benefits to
society. Theoretically, according to Bernard (1996), transformational leadership has different characteristics
with other leadership styles. Transformational leaders aim at producing superior results with one or more
behaviors of the following:
1. Individual simulation: Transformational leaders stimulate their employees to be innovative and creative
by asking assumptions, limiting the problems, and approaching the old situation with a new way;
2. Individual consideration: Transformational leaders pay special attention to individual needs in its
fulfillment and improvement they expect by behaving as trainers;
3. Inspirational motivation: Transformational leaders act with the aim of giving motivation and inspiration
to the surrounding people;
4. Idealized influence: Transformational leaders behave as models for their employees. Leaders like this are
usually respected and trusted.
Four factors above become the power to develop leadership style. Concrete action that can be taken is doing
research about kulongs or the abandoned mining holes, especially their benefits in various fields.
Tin Mine
John Francis Loudon—the son of Aleander Loudon, Scotland marine and the founder of the company
Billiton Maatschappij, through the approach of Dutch East India Government, assigned Dr. Croockewit to
research mineral resources in Belitung Island, and Dr. Croockewit arrived there on October 14th, 1850.
Theoretically, John Francis Loundon had applied transformational thought pattern so that disused mines could
be utilized. However, he did not full apply it or probably because theory of transformational leadership has just
been found, so the abandoned mining holes have made the Belitung citizens suffer.
In 1972, Indonesia government founded PN Timah (Tin State Company); however, PN Timah did not last
longer. In 1976, the government established PT Tambang Timah (Tin Mine Company), but until now, Belitung
people still know it as PN Timah even though the name has changed. PT Tambang Timah with the biggest
operation power has mining licence as broad as tens of thousand hectares. Data state that there are 25,000
hectares in Belitung regency and 62,000 hectares in East Belitung, out of the breadth of Belitung Island 483.3
hectares. The location of mines is not only on land, but also offshores. Right now, PT Timah does not operate
anymore.
Twenty-three years ago, the mines were abandoned. On April 29th, 1991, technical services unit of
Belitung ended their operation because possibly the remaining tin is not advantageous anymore for the life of
the state company. It can be imagined that Belitung society was spoiled by the tin company. When PT Timah
stopped the operation, prosperity also diminished. All employees were fired and given severance money, which
local people called as “surprised money”. The name of “shocked money” was caused by two factors: 1. The
TRANSFORMATIONAL LEADERSHIP IN UTILIZING ABANDONED MINING HOLES
271
employees of PT Timah were shocked because the company having given them income stopped the operation;
and 2. PT Timah employees earned quite much money at that time, so they could not spend it well. Even
though history states that PT Timah ever developed well in Belitung Island that is blessed with tin, and now, it
did not operate anymore, which does not mean that the tin excavation or mining in Belitung Island stops.
Until this paper is written (January 1st, 2014), tin is still the livelihood of Belitung people, in which 70% of
Belitung inhabitants mine with different methods from that of PT Timah.
Data of CBS-Belitung Regency (see Table 2) show the decrease, about 2.47% of Belitung society still rely
on tin, and their way or method of tin search is Tambang Karya (TK) mini or small work mine and
“ngelimbang” (looking for tin) that still use very simple tools. The method of “ngelimbang” uses pan or woks
with other tings of the same kind. The significant difference is that PT Timah employs workers, but TK (work
mine) is done individually or involves family members.
Table 2
Excavated Tin During 2008-2012
Year Tin (ton)
2012 5,560
2011 532,800
2010 398,300
2009 620,990
2008 22,475,307
Note. Source: CBS-Belitung Regency, 2013.
Abandoned Mining Holes
The film background with Belitung scenery transforms Belitung into a new tourist destination with its
famous beaches, such as Tanjung Tinggi Beach, Tajung Kelayang Beach, Tanjug Pendam Beach, and other
tourist objects, such as Berahu Hill and many other tourist objects that refresh mind. According to Pearce,
Morrison, and Rutledge (1998), motivation is “the total network of biological and cultural forces that give value
and direction to travel choice behaviour and experience”. The authors try to distinguish between motivation and
destination. Motivation focuses more on understanding the psychological side of each tourist, whereas
destination choice focuses more on the important factors of tourist destination that attract the tourists to come and
how those factors can satisfy the tourists.
Besides beaches, there is still another tourist object that can attract the tourists to come to Belitung—tin
mines! Location of the abandoned tin mines has been ignored so far and is still regarded as secondhand thing that
cannot be used anymore. Kolongs (or kulongs in the local language) deserve to be a Belitung tourist object. There
are some arguments that support this. First, novel Laskar Pelangi was inspired by the difference between local
people and the employees of PN Timah, so it has historical note about tin and the local people. Moreover, Qur’an
(2008) has emphasized:
That is those who remember Allah while standing or sitting or laying, and they think of the sky and earth creation (while saying): “Ye our God, you did not create this uselessly, you are the most holy, then please keep us away from the hell torture”. (p. 191)
It is not late to think that the abandoned mines can be developed into tourist objects, for example,
transforming the mines into green areas with certain management, so that they are not barren anymore.

TRANSFORMATIONAL LEADERSHIP IN UTILIZING ABANDONED MINING HOLES
272
Business Opportunity
It is certain that tin in Belitung will run out as time passes. For tin miners, they are categorized as
“prosperous” if they get tin. A prosperous family is a family that is formed on the basis of legal marriage, can
fulfill material and spiritual needs well, believe in God and obey Him, and have harmonious and balanced
relationship between family, society, and environment (The State Secretariat of Republic of Indonesia, 2009).
Level of a family’s prosperity is categorized into five stages:
1. Stage of pre-prosperous family (PPF): It is the family that does not fulfill one of the six indicators of the
prosperous family-I (PF-I) or indicators of a family’s basic needs;
2. Stage of PF-I: It is the family that can fulfill six indicators of PF-I stage, but does not fulfill one of the
eight indicators of prosperous family-II (PF-II) or indicators of a family’s psychological needs;
3. Stage of PF-II: It is the family that can fulfill six indicators of PF-I stage and eight indicators of PF-II, but
does not fulfill one of the five indicators of prosperous family-III (PF-III) or indicators of a family’s
developmental needs;
4. Stage of PF-III: It is the family that can fulfill six indicators of PF-I stage, eight indicators of PF-II, and
five indicators of PF-III, but does not fulfill one of the two indicators of PF-III plus or indicators of a family’s
self-esteem;
5. Stage of PF III plus: It is the family that can fulfill six indicators of PF-I stage, eight indicators of PF-II,
five indicators of PF-III, and two indicators of PF-III plus.
Data of Belitung that is published by CBS-Belitung Regency in 2013 are shown in Table 3.
Table 3
Category of Prosperous Family (2008-2012)
Year Category
PPF PF-I PF-II PF-III PF-III plus
2012 2,528 2,052 7,369 34,230 541
2011 2,096 4,982 3,854 24,499 487
2010 2,024 4,657 3,559 24,260 42
2009 864 4,979 8,994 23,104 2,529
2008 864 4,973 8,994 23,104 8,019
Note. Source: CBS-Belitung Regency, 2013.
The data show that Belitung society is categorized PF-III in 2012. Characteristic of PF-III is that some of
the family’s income is saved in the form of money or things (for example, livestock, paddy fields, jewelry,
rented house, and others). Besides that, the family get information from newspapers, magazines, radio, or
Internet, which means that family members have an opportunity to access information locally, regionally,
nationally, and internationally through printed media (e.g., newspaper, magazine, and bulletin) or electronical
media (e.g., radio, television, and Internet). These media are not only owned or bought by the family, but also
can be lent to or owned by other people/family or by public. Tin mining is a dilemmatic problem.
Referring to the data, it is clear that the society is prosperous; on the other hand, environment surrounding
the mines shows the picture of poverty that forces the society to keep prosperous and alive. Tin, indeed, affects
the local economy development, statistic facts show minimum job vacancy out of the mines, but local economy
is still growing. Faozan (2010) stated that local economy growth is simply defined as a process of economy
TRANSFORMATIONAL LEADERSHIP IN UTILIZING ABANDONED MINING HOLES
273
activity in a region which makes goods and/or service produced in a region increase and the prosperity of the
society rise in the long term.
The process of economy activity in the region is closely related to tangible or real economy development,
such as development of infrastructures, hospitals, schools, manufactured goods, and production of industrial
goods in the region. Therefore, local economy growth can be described as the development of economy
potentials that can increase economy of the local people. For example, the abandoned mining holes can be
utilized as the area for breeding freshwater fish, like catfish in fish cage (keramba) or breeding them by leaving
them wild. Integrated method focuses on fishery.
The abandoned mining holes as tourist object can be in the form of artificial lake that is equipped with
facilities sufficient and beneficial for the society; moreover, the holes can also be used for educational tourism
so that young generation understands tin mining and its positive and negative effects. Suratmo (2012) stated
that the development of the abandoned tin mining areas can be optimized to be efficient and can add Belitung’s
income. Tourism can become potential that must be developed when mines cannot be relied, and with
governments’ support, Belitung can become the third tourist destination after Bali and Lombok. This is based
on the fact that Belitung has the same beautiful beaches as Bali. For example, Tanjung Tinggi Beach has stone
contour in its seashore.
The utilization of kulongs for fishery and plantation may involve the society as a partner. Besides, it can
help reducing poverty through increasing the income of the society and providing job vacancy, and the
development of core partnership and plasma partnership can give advantages to the company, that is
through the utilization of castor bean as fuel for the operation of mining industry to substitute fossil fuel
and help the society to obtain castor oil cheaply as the substitute of kerosene, which is hardly to obtain
recently.
In general, kulongs with various sizes are filled with ground water, river water, and rain. Potential of
freshwater fish breeding includes kulongs or the abandoned mining holes that are spread in each regency/city.
Kulongs and freshwater swamp approximately reach 1,602 hectares, and 44,000 hectares in Belitung Regency.
Data of PT Tambang Timah in 2000 stated that out of 343 kulongs with the size of 67,714 hectares in Belitung,
only 54 kulongs have been reclaimed, which is the effort of rehabilitating the damaged land resulted from the
mining activities, so that it can function optimally in appropriate with the capabilities (General Directorate of
Land and Social Forestry Rehabilitation, 1997).
Efforts that governments can do are: giving seeds freely to the farmers, utilizing the abandoned mining
areas with the system of production sharing, coaching the farmers and doing mentoring while the production
process is running, conducting modelling project, or employing unemployed people to do reclamation in the
company’s areas with the funding from the company. However, the first step that should be taken is educating
the society in order to change their mind and paradigm from garbage to blessing.
Conclusions
All of us are leaders, so the damaged land should not be abandoned as it is. Central and local governments
should make breakthrough and educate society that the abandoned areas can still be utilized as the Earth still
rotates. Besides that, governments can cooperate with the related institutions to analyze the utilization of the
abandoned mining holes, so the areas are not only used to mine water without producing something productive
for the prosperity of the society.

TRANSFORMATIONAL LEADERSHIP IN UTILIZING ABANDONED MINING HOLES
274
The abandoned tin mining holes can be utilized optimally for tourist object, such as educational tourism
for young generation about positive and negative sides of the tin mining, plantation that can give regional
income, and opening job vacancy for the society or opening fish freshwater breeding that can provide job
vacancy, so that the abandoned mines are not mourned as the damaged land, which, with knowledge, can be
productive land for a source of the economy to the society.
A transformational leader should not be formal like a head of a region, a minister, or a president. A
transformational leader is a person with the leadership skill that can change negative paradigm into positive
paradigm. The authors believe that whatever the leadership style is, there should be three elements that are
closely related and have the same vision—a leader, followers, and an environment where the organization is
located. In the case of the abandoned mining holes, it can change the way of thinking or paradigm,
transforming the garbage to the blessing.
References
Andriyansah, Rajati, T., Fatimah, F. (2012). Novel dan film media pemicu pegnembangan pariwisata dalam menanggulangi
kemiskinan (Novel and film as media of tourism development in poverty reduction). Jurnal Bisnis dan Manajemen (Journal
of Business and Management), 9(1), 16-31.
Benke, B. (2011). Novel Laskar Pelangi laris di Korea Selatan (Novel Laskar Pelangi best-seller in South Korea). Retrieved from
http://suaramerdeka.com/v1/index.php/read/entertainmen/2011/10/05/429
Bernard, M. B. (1996). From transactional to transformational leadership: Learning to share the vision. In S. Richard, M. Porter, L.
W. Bigley, & A. Gregory (Eds.), Motivation and leadership at work (6th ed.). Singapore: McGraw Hill.
Burn, M. J. (1978). Leadership. New York, N.Y.: Harper & Row.
Central Bureau of Statistics (CBS)-Belitung Regency. (2013). Belitung dalam angka 2013 (Belitung in Number 2013). Retrieved
from http://belitungkab.bps.go.id/index.php?r=publikasi/detail&id=116&title=Belitung-Dalam-Angka-2013
Dipanatara, L. (2010). Habis manis, sepah dimakan juga (When the sweetness is gone, the pulp is eaten). Retrieved from http://epan
-wbakie.blogspot.com/
Faozan, H. (2010). Tata kelola pemerintahan daerah yang baik dan pertumbuhan ekonomi lokal yang menimbulkan pembangunan
daerah penulis (Good management of local government and local economy growth triggering regional development). Jurnal
Ilmu Administrasi (Journal of Administration Science), 7(4), 297-307.
General Directorate of Land and Social Forestry Rehabilitation. (1997). Pedoman reklamasi lahan bekas tambang (Guide of
reclamation of the abandoned mining areas). Jakarta: General Directorate of Land and Social Forestry Rehabilitation.
Latief, A. S. (2010, April). Dampak limbah dan bekas tambang timah terhadap lingkungan (Kasus di kecamatan Belinyu kabupaten
Bangka provinsi Bangka Belitung) (Impact of tin waste and the abandoned tin mines on environment (Case in sub-district of
Belinu, Bangka Regency, Bangka Belitung Province)). Jurnal Rekayasa (Journal of Engineering), 5, 112-118.
Mulyono, D. (2009). Educational leadership: Mewujudkan efektivitas kepemimpinan pendidikan (Educational leadership:
Realizing educational leadership effectiveness) (pp. 135-136). Malang: UIN Malang Press.
National Family Planning Coordinating Board. (2011). Batasan dan pengertian MDK (Limmitation and definition of MDK).
Retrieved from http://aplikasi.bkkbn.go.id/mdk/BatasanMDK.aspx
Noviyarto, H. (2012). Pemanfaatan kolong bekas tambang timah sebagai sumber mata pencaharian masyarakat pasca timah: Studi
peraturan daerah kabupaten bangka tengah nomor 26 tahun 2011 tentang pengelolaan dan pemanfaatan kolong (Utilization
of the abandoned tin mine kulong for society’s livelihood after tin mining: Study of local regulation of middle Bangka Regency
No. 26, year 2011 about management and utiliation of kolong). Retrieved from http://hendri-noviyarto.blogspot.com/2012/06
/pemanfaatan-kolong-bekas-tambang-timah.html
O’Leary, E. (2001). Kepemimpinan (Leadership). Edisi Pertama, Yogyakarta: Andi.
Pearce, P. L., Morrison, A. M., & Rutledge, J. L. (1998). Tourism: Bridges across continents. Sydney: McGraw-Hill.
Qur’an. (2008). Surah Ali Imran Trans (p. 191). Bandung: Diponegoro Publishing.
Suratmo, Y. (2012). Belitung, dari tambang ke pariwisata (Belitung, from mines to tourism). Retrieved from http://www.infobisn
isinternasional.com/berita/budaya/14/december/2012/belitong-dari-tambang-ke-pariwisata

TRANSFORMATIONAL LEADERSHIP IN UTILIZING ABANDONED MINING HOLES
275
The State Secretariat of Republic of Indonesia. (2009). Undang-undang Nomor 52 RI tentang perkembangan kependudukan dan
pembangunan keluarga (Act No. 52 of the Republic of Indonesia about population and family development). Jakarta: The
State Secretariat of Republic of Indonesia.
Universitas Bangka Belitung. (2013a). Pemberdayaan kolong bekas galian tambang timah sebagai usaha perikanan terpadu
(Utilization of the abandoned tin mining holes for integrated fish farming). Retrieved from http://fppb.ubb.ac.id/?Page=
artikel_ubb&&id=51
Universitas Bangka Belitung. (2013b). Pemanfaatan lahan pasca tambang timahh (Utilization of the abandoned tin mining areas).
Retrieved from http://www.ubb.ac.id/artikel_pdf.php?nomorurut_artikel=54
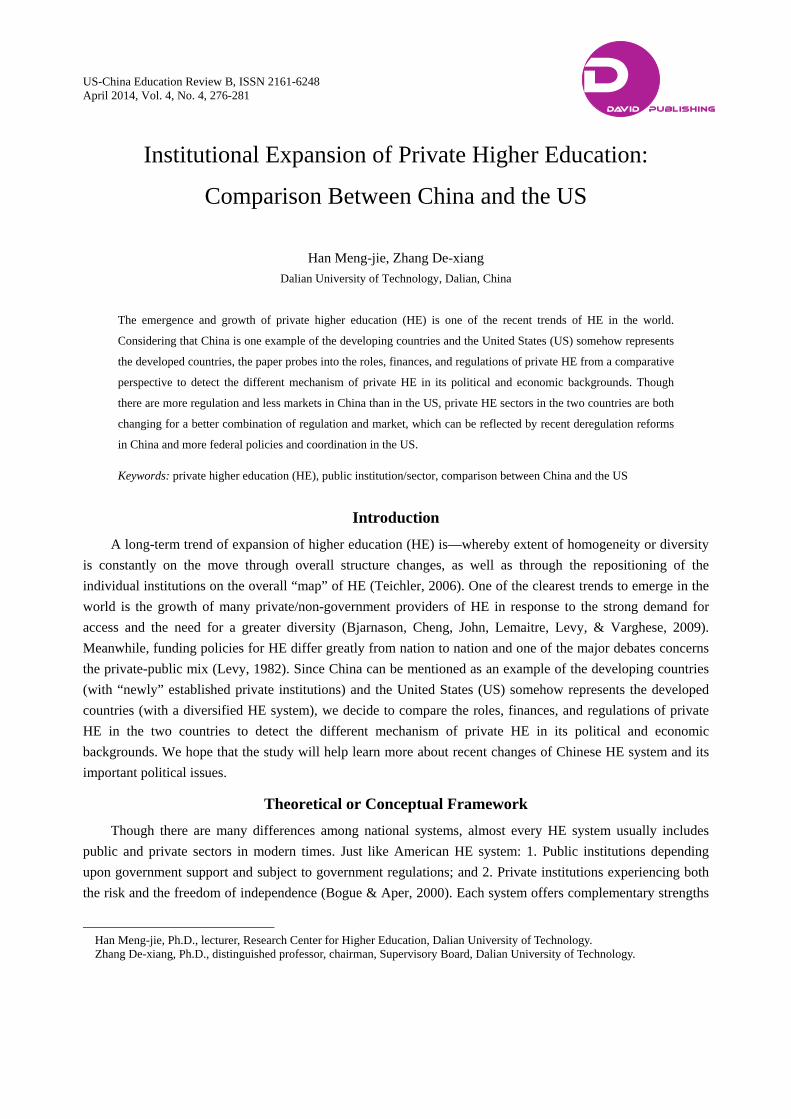
US-China Education Review B, ISSN 2161-6248 April 2014, Vol. 4, No. 4, 276-281
Institutional Expansion of Private Higher Education:
Comparison Between China and the US
Han Meng-jie, Zhang De-xiang
Dalian University of Technology, Dalian, China
The emergence and growth of private higher education (HE) is one of the recent trends of HE in the world.
Considering that China is one example of the developing countries and the United States (US) somehow represents
the developed countries, the paper probes into the roles, finances, and regulations of private HE from a comparative
perspective to detect the different mechanism of private HE in its political and economic backgrounds. Though
there are more regulation and less markets in China than in the US, private HE sectors in the two countries are both
changing for a better combination of regulation and market, which can be reflected by recent deregulation reforms
in China and more federal policies and coordination in the US.
Keywords: private higher education (HE), public institution/sector, comparison between China and the US
Introduction
A long-term trend of expansion of higher education (HE) is—whereby extent of homogeneity or diversity
is constantly on the move through overall structure changes, as well as through the repositioning of the
individual institutions on the overall “map” of HE (Teichler, 2006). One of the clearest trends to emerge in the
world is the growth of many private/non-government providers of HE in response to the strong demand for
access and the need for a greater diversity (Bjarnason, Cheng, John, Lemaitre, Levy, & Varghese, 2009).
Meanwhile, funding policies for HE differ greatly from nation to nation and one of the major debates concerns
the private-public mix (Levy, 1982). Since China can be mentioned as an example of the developing countries
(with “newly” established private institutions) and the United States (US) somehow represents the developed
countries (with a diversified HE system), we decide to compare the roles, finances, and regulations of private
HE in the two countries to detect the different mechanism of private HE in its political and economic
backgrounds. We hope that the study will help learn more about recent changes of Chinese HE system and its
important political issues.
Theoretical or Conceptual Framework
Though there are many differences among national systems, almost every HE system usually includes
public and private sectors in modern times. Just like American HE system: 1. Public institutions depending
upon government support and subject to government regulations; and 2. Private institutions experiencing both
the risk and the freedom of independence (Bogue & Aper, 2000). Each system offers complementary strengths
Han Meng-jie, Ph.D., lecturer, Research Center for Higher Education, Dalian University of Technology. Zhang De-xiang, Ph.D., distinguished professor, chairman, Supervisory Board, Dalian University of Technology.
DAVID PUBLISHING
D

INSTITUTIONAL EXPANSION OF PRIVATE HIGHER EDUCATION
277
to the goals of access, innovation, and quality. In the US, private sector has a history of more than three
centuries, even though it is not clearly privatized in the colonial period till the early 19th century.
Comparatively, private HE has a long history of thousands of years in China, such as Confucius academy in
about 500 Before Christ (B.C.). However, private HE experienced a thriving or weakening period in historical
dynasties. Therefore, private HE sector is always influenced by its social background.
In the study, we will use both qualitative research methods and quantitative research methods to compare
the characteristics of private HE in the two countries, mainly on the share of private HE (institutions and
enrollment) in the national HE system, the financial resources from the tuitions and the government, the
regulation from the government and the extent of autonomy of private HEIs (higher education institutions). We
get the data mainly from the official statistics in the two countries (China Statistical Yearbook 2011 (National
Bureau of Statistics of the People’s Republic of China (PRC), 2011); Chinese Education Statistical Yearbook
2011 (Department of Education of the PRC, 2011); Integrated Postsecondary Education Data System (National
Center for Education Statistics of the US, 2011a); Digest of Education Statistics 2011 (National Center for
Education Statistics of the US, 2011b)). Some other data are from documents, reports, and papers of other
relevant studies. From these, the paper probes into the changes of private HEIs to detect their own mechanism
of private HE in their political and economic backgrounds.
Data Analysis and Comparison
Great changes have taken place in China during the last few decades. After the founding of New China,
the central government reorganized universities and colleges in old times to establish a modern HE system.
Under the influence of the Soviet Union, the Mao government prohibited the development of private HE and
every private college was changed into a public one. It was believed that private colleges and universities are
capitalist or bad things, not socialist. After that, Chinese HE system was completely composed of public
colleges and universities. The government provided almost all the funds to the institutes, as well as the students
(even including their living stipend). The adjustments in the 1950s have greatly changed the Chinese HE
system, and we still can see its deep influenece till now (Han & Song, 2014).
Private HE system has experienced great expansion during the last decades, especially after the 1978
reform and openning up. The first private college was not established in China until 1982, after 30-year
suspension. Gradually, private sector began to revive and has gradually become an indispensable supplement to
public sector. Till 2011, there are 2,409 institutions in China, including 696 private colleges and universities.
Private sector accounts for 28.89% in Chinese HE system (see Figure 1). Comparatively, private sector has
always been the important part of American HE system. What is more, most of the prestigious colleges and
universities in the US are private institutions with a long history, such as Harvard, Yale, Stanford, etc.. In 2010,
There are 2,943 private colleges and universities among 4,599 HE institutions. Private sector accounts for
63.99% in American HE system (see Figure 2). But, these private institutions are usually very small.
As for the enrollment, the majority is public enrollment, not only in China, but also in the US (see Figures
3 & 4). In China, the total enrollment of HE summed up to 23.09 million in 2010, including 5.05 million in
private institutions. The percentage of private sector is only 21.88%. Even though private sector has developed
very fast, it still can not match up with public sector in China. In the US, the total enrollment is 21.02 million,
and 5.87 million is in private sector, which accounts for 35.78%. We can see that the enrollment of private
institutions are much smaller than the number of private institutions in the US.
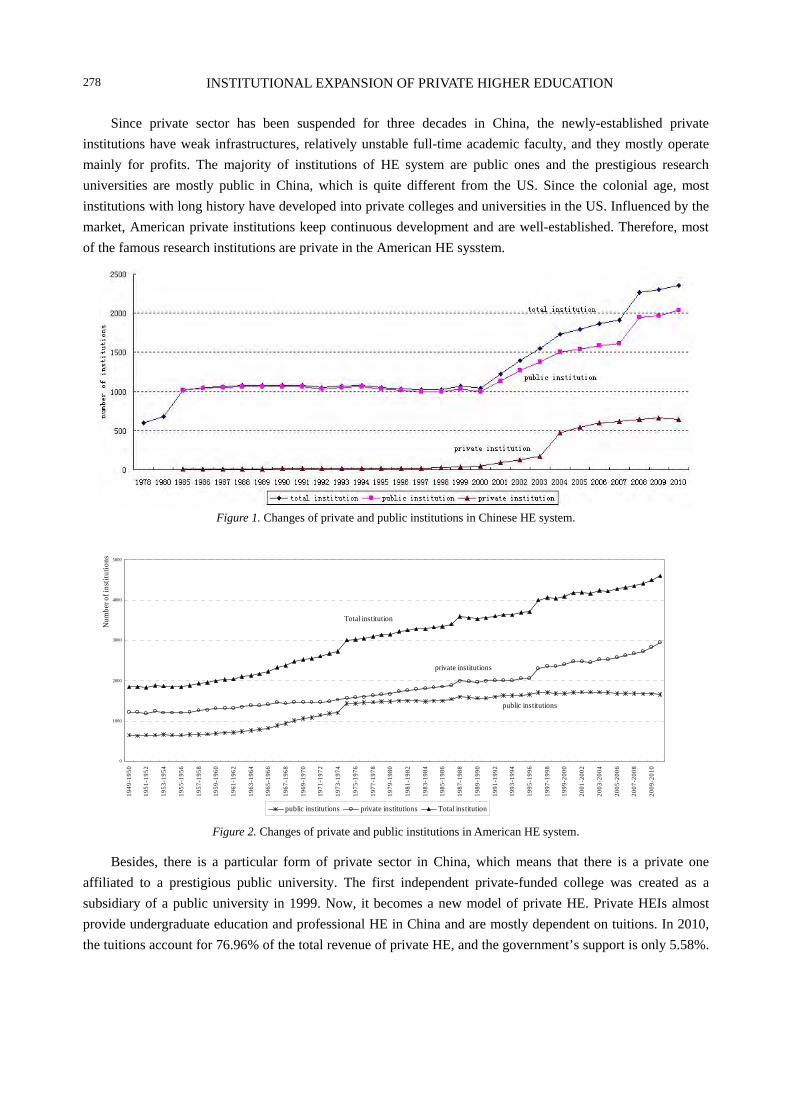
INSTITUTIONAL EXPANSION OF PRIVATE HIGHER EDUCATION
278
Since private sector has been suspended for three decades in China, the newly-established private
institutions have weak infrastructures, relatively unstable full-time academic faculty, and they mostly operate
mainly for profits. The majority of institutions of HE system are public ones and the prestigious research
universities are mostly public in China, which is quite different from the US. Since the colonial age, most
institutions with long history have developed into private colleges and universities in the US. Influenced by the
market, American private institutions keep continuous development and are well-established. Therefore, most
of the famous research institutions are private in the American HE sysstem.
Figure 1. Changes of private and public institutions in Chinese HE system.
public institutions
private institutions
Total institution
0
1000
2000
3000
4000
5000
1949
-195
0
1951
-195
2
1953
-195
4
1955
-195
6
1957
-195
8
1959
-196
0
1961
-196
2
1963
-196
4
1965
-196
6
1967
-196
8
1969
-197
0
1971
-197
2
1973
-197
4
1975
-197
6
1977
-197
8
1979
-198
0
1981
-198
2
1983
-198
4
1985
-198
6
1987
-198
8
1989
-199
0
1991
-199
2
1993
-199
4
1995
-199
6
1997
-199
8
1999
-200
0
2001
-200
2
2003
-200
4
2005
-200
6
2007
-200
8
2009
-201
0
Num
ber o
f ins
titu
tion
s
public institutions private institutions Total institution
Figure 2. Changes of private and public institutions in American HE system.
Besides, there is a particular form of private sector in China, which means that there is a private one
affiliated to a prestigious public university. The first independent private-funded college was created as a
subsidiary of a public university in 1999. Now, it becomes a new model of private HE. Private HEIs almost
provide undergraduate education and professional HE in China and are mostly dependent on tuitions. In 2010,
the tuitions account for 76.96% of the total revenue of private HE, and the government’s support is only 5.58%.
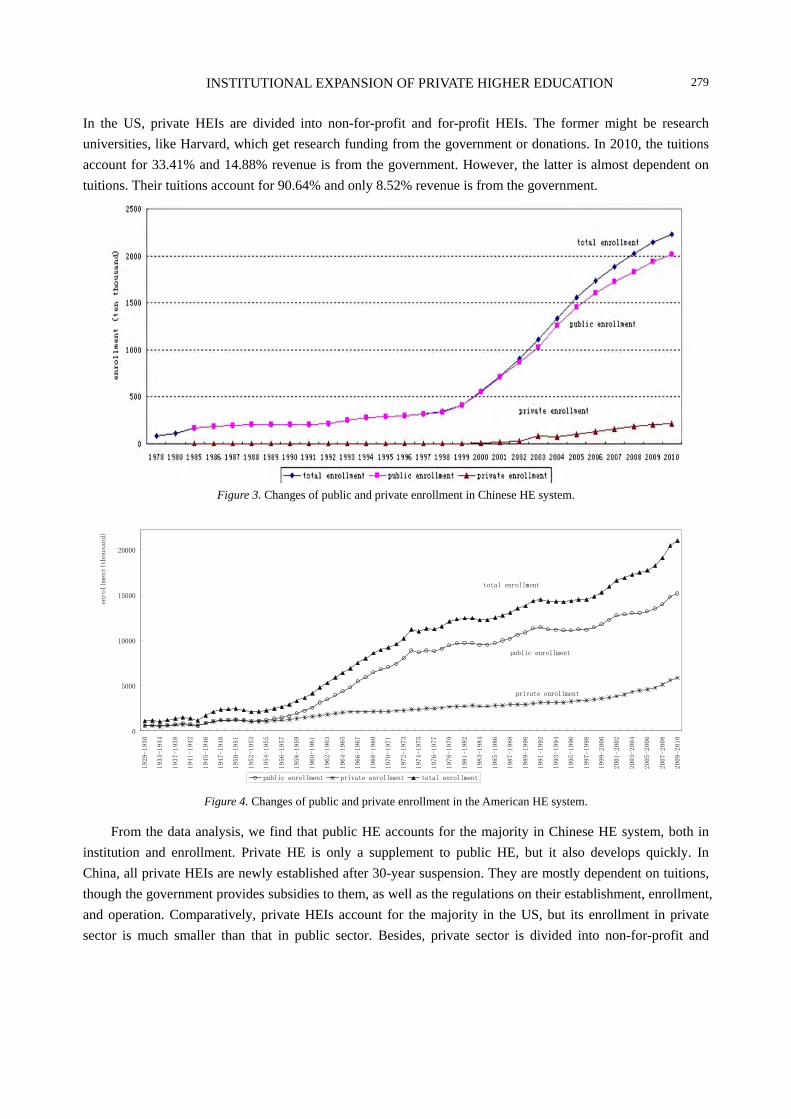
INSTITUTIONAL EXPANSION OF PRIVATE HIGHER EDUCATION
279
In the US, private HEIs are divided into non-for-profit and for-profit HEIs. The former might be research
universities, like Harvard, which get research funding from the government or donations. In 2010, the tuitions
account for 33.41% and 14.88% revenue is from the government. However, the latter is almost dependent on
tuitions. Their tuitions account for 90.64% and only 8.52% revenue is from the government.
Figure 3. Changes of public and private enrollment in Chinese HE system.
public enrollment
private enrollment
total enrollment
0
5000
10000
15000
20000
1929-1930
1933-1934
1937-1938
1941-1942
1945-1946
1947-1948
1950-1951
1952-1953
1954-1955
1956-1957
1958-1959
1960-1961
1962-1963
1964-1965
1966-1967
1968-1969
1970-1971
1972-1973
1974-1975
1976-1977
1978-1979
1981-1982
1983-1984
1985-1986
1987-1988
1989-1990
1991-1992
1993-1994
1995-1996
1997-1998
1999-2000
2001-2002
2003-2004
2005-2006
2007-2008
2009-2010
enr
ollme
nt(
thous
and)
public enrollment private enrollment total enrollment
Figure 4. Changes of public and private enrollment in the American HE system.
From the data analysis, we find that public HE accounts for the majority in Chinese HE system, both in
institution and enrollment. Private HE is only a supplement to public HE, but it also develops quickly. In
China, all private HEIs are newly established after 30-year suspension. They are mostly dependent on tuitions,
though the government provides subsidies to them, as well as the regulations on their establishment, enrollment,
and operation. Comparatively, private HEIs account for the majority in the US, but its enrollment in private
sector is much smaller than that in public sector. Besides, private sector is divided into non-for-profit and

INSTITUTIONAL EXPANSION OF PRIVATE HIGHER EDUCATION
280
for-profit institutions. Many leading research universities in the US are non-for-profit and well-established,
which are usually funded by diversified resources, such as research funding and denotations. However, the
for-profit institutions emerge since the late 20th century, which are operated only for profits and almost
dependent on tuitions revenue.
Discussion and Conclusions
In China, the government supervises the establishment standard of HEIs, the national entrance policy
(such as the national college entrance examination to public institutions as well as private institutions), and the
standardized operation of private colleges. However, too much regulation sometime becomes the barriers to the
development of private HE and reduces the enthusiasm for private organizations or persons to invest in HE.
Comparatively, the American government exerts less regulation on private institutions, which enjoy great
autonomy to decide what to do. On the whole, American private sector operates like an enterprise, especially
those for-profit institutions. American HE is considered to be the most efficient in the world because of its
flexibility. However, its scholars always criticize the commercialization of HE, which might disturb academic
essence and pursuit of knowledge.
The mechanism of private HE is deeply rooted in its political, economic, and social environments. There
are three forces—the government, the market, and the institutions, which influence the changes and
development of HE. It is traditionally “big government and small market” model in China, which means that
the government plays an important role in the development of private HE. But now, the marketization has been
paid much more attention in the course of HE reforms in China. On the contrary, it is traditionally “small
government and big market” model in the US, which means the market is the important force. However, the
government has gradually intervened in the development of private HE in the US. The governments seek to
regulate and monitor private providers of HE because HE should not be left to the vagaries of market forces
(Bjarnason et al., 2009).
Rigid regulation from the government and the mechanism of free market are the two extreme modes of
political economy. However, it is confusing if the regulation from the government and free market are
contradictory. Perhaps the answer is not. The government and the market are equally important in the
coordination of private HE. The important thing is to decide appropriate role of the government and the market.
From the above mentioned, it is obvious that there are more regulation and less free markets in China. On the
contrary, there are less regulation and more free markets in the US. In spite of these, both countries are
changing for a better combination of regulation and market, which can be reflected by recent deregulation
reforms in China and more federal policies and coordination in the US. The common model of private HE will
be appropriate coordination of the government and basic mechanism of market economy.
References Altbach, P. (1998). Gigantic peripheries: India and China in the world knowledge system. In P. Altbach (Ed.), Comparative
higher education: Knowledge, the university and development (pp. 133-146). Greenwich, C.T.: Ablex. Bjarnason, S., Cheng, K. M., John, F., Lemaitre, M. J., Levy, D., & Varghese, N. V. (2009). A new dynamic: Private higher
education. Paris: UNESCO. Bogue, E. G., & Aper, J. (2000). Exploring the heritage of American higher education: The evolution of philosophiy and policy.
Phoenix, A.Z.: Oryx Press. Carpentier, V. (2012). Public-private substitution in higher education: Has cost-sharing gone too far? Higher Education Quarterly,
66(4), 363-390.

INSTITUTIONAL EXPANSION OF PRIVATE HIGHER EDUCATION
281
Department of Education of the PRC. (2011). Chinese education statistical yearbook 2011. Beijing: China Statistics Press. Han, M. J., & Song, W. (2014). The system arrangement of the higher education’s regional structure since the establishment of the
People’s Republic of China and its reflections. Journal of Henan University (Social Science), 54(1), 125-141. (in Chinese) Johnstone, B., Arora, A., & Experton, W. (1998). The financing and management of higher education: A status report on
worldwide reforms (Departmental working paper). Washington, D.C.: World Bank. Jongbloed, B. (2003). Marketisation in higher education, Clark’s triangle and the essential ingredients of markets. Higher
Education Quarterly, 57(2), 110-135. Levy, D. (1982). Private versus public financing of higher education: US policy in comparative perspective. Higher Education,
11(6), 607-628. Levy, D., & Zumeta, W. (2011). Private higher education and public policy: A global view. Journal of Comparative Policy
Analysis, 13(4), 345-349. Marginson, S. (2007). The public/private divide in higher education: A global revision. Higher Education, 53(3), 307-333. National Bureau of Statistics of the PRC. (2011). China statistical yearbook 2011. Beijing: National Bureau of Statistics. National Center for Education Statistics of the US. (2011a). Digest of education statistics 2011. Washington, D.C.: National
Center for Education Statistics. National Center for Education Statistics of the US. (2011b). Integrated postsecondary education data system. Washington, D.C.:
National Center for Education Statistics. Teichler, U. (2006). Changing structures of the higher education systems: The increasing complexity of underlying forces. Higher
Education Policy, 19(4), 447-461. Teixeira, J., Johnstone, B., Rosa, M. J., & Vossensteyn, H. (2006). Cost-sharing and accessibility in higher education: A fairer
deal? Dordrecht: Springer. Varghese, N. (Ed.). (2004). Private higher education (IIEP Policy Forum No. 16). Paris: UNESCO/IIEP.
US-China Education Review B, ISSN 2161-6248 April 2014, Vol. 4, No. 4, 282-285
On Scarlett’s Persistence in Gone With the Wind
Wang Xiao-yan, Tong Li-jun
Changchun University, Changchun, China
Gone With the Wind was written by an American writer Margaret Mitchell (1900-1949). After its publishing, the
novel caused a great stir in the entire America and won a Pulitzer Prize in 1937. The novel is still popular even
nowadays, winning multitudinous readers. With the impact of American Civil War upon the South and suffering of
Scarlett’s family as the background, the story describes the transformation of Scarlett from an innocent girl into a
mature lady. The present paper, first of all, gives a brief introduction of the story. Then, it mainly makes an analysis
of Scarlett’s characters from two aspects: Her persistence towards love for which she sticks to for more than a
decade and her persistent pursuit of a better life for which she does by fair means and foul. The paper concludes
with Scarlett’s motto “Tomorrow is another day”.
Keywords: character, analysis, rebellion, Gone With the Wind
Introduction
Gone With the Wind is Margaret Mitchell’s only novel. It describes Scarlett’s triangular love and depicts
the life of the South during the American Civil War. The heroine, Scarlett, is a well-depicted figure. When the
story begins, Scarlett is only 16-year-old, a proud and attractive princess. She is so young and beautiful that it
seems that she can conquer almost all the young men in the neighborhood, and she enjoys dealing among these
young men. She loves Ashley very much though she does not know him completely. So, when Ashley gets
engaged with Melanie, being angry, she gets married with Charles Hamilton, who is Ashley’s wife’s brother.
Unfortunately, the Civil War destroys all her life profoundly, Hamilton, soon, dies in the war and Scarlett
becomes a widow. What is worse, she losts her beloved mother and has to take care of her ill father, her two
sisters, and other 10 people of the family. Although she is strong and brave enough to make a living in the
wartime, it is extremely difficult for a 19-year-old girl to shoulder the responsibility for the whole family after
the war. But she has no choice, her character and times need her. In order to revitalize her family, she needs
money badly. She goes to Rhett Butler for help, but at that time, he was put in prison. In her desperate despair,
she meets Frank Kennedy, who is her sister’s fiancé and who has a sum of money. For her family and industry,
she gets married with Kennedy. With the money, she paid the taxes, and later on, opens a sawmill and her
business is booming. But during a fight with the soldiers of the North, Kennedy lost his life. Despite of the
opposition of the local people, she finally marries Rhett who really loved her very much from the very
beginning. However, Scarlett still pursues the unreal love towards Ashley and never tries to know Rhett. She
does not realize Rhett’s love until Melanie dies. But it was too late. Rhett determined to leave her without
Acknowledgement: This paper is a part of the result of the research program “The Study of the Female Characters’ Social Position in the Early Stage of 20th Century Foreign Literature ” (2013, No. B137), in which the authors have participated.
Wang Xiao-yan, associate professor, School of Foreign Languages, Changchun University. Tong Li-jun, associate professor, School of Foreign Languages, Changchun University.
DAVID PUBLISHING
D
ON SCARLETT’S PERSISTENCE IN GONE WITH THE WIND
283
hesitation. In the end, Scarlett had to tell herself that tomorrow is another day. What caused Scarlett’s destiny?
The present paper will discuss it by analyzing two aspects of her characters.
Scarlett’s Persistence Towards Love
Scarlet, the heroine in the novel, is a well-portrayed character. Her personality is complicated and
changeable. “She combines egocentrism, rebellion, and independence all into one” (Zhou, 1997, p. 78).
However, for love, she is persistent and never gives up. She thought Ashley was her true love, so she did all she
could to pursuit it. Unlike the common girls, she is determined to act on her own wishes and confronts Ashley
in the belief that he will not be able to resist her assault. But to her great surprise, she is declined by Ashley.
Yet, her stubborn love to Ashley remains until she is 28-year-old. During this period of time, she worries about
Ashley’s safety and keeps her promise to take care of Ashley’s wife Melanie no matter how hard it is. She even
continues to support Ashley’s family after the war. In fact, her so-called love to Ashley is perhaps a 16-year-old
girl’s blind love, because Ashley is the one who denies her, which makes her want him more. Though, in her
life, she experiences three kinds of marriages, in fact, she only loves Ashley Wilkes blindly and later Rhett
Butler truly. For the love to Rhett Butler, she did not realize it until she had lost everything that made life
desirable—Ellen, Gerald, Bonnie, Mammy, Melanie, and Ashley. For Rhett, she has mixed feelings that he is
the man who had strong arms to hold her, a broad chest to pillow her tired head, and jeering laughter to pull her
affairs into proper perspective. Scarlett married Rhett in spite of people’s opposition. After marriage, as Rhett
said, “I wanted to take care of you, to pet you, to give you everything you wanted. I want to marry you and
protect you and give you a free rein in anything that would make you happy” (Margaret, 1999, p. 608).
But unfortunately, Scarlett still can not understand Rhett’s love and can not forget Ashley in her heart even
though she delivers Rhett a beloved daughter. She even goes so far as to embrace Ashley and recall their happy
childhood on one occasion. Rhett cannot stand it and decides to go away. At this moment, she finds out that,
“He (Ashley) never really exited at all, except in my imagination, …I loved something I made up, something
that is just as dead as Melly is” (Margaret, 1999, p. 791).
She senses in Rhett something strong, unyielding, and implacable—all the qualities she had looked for in
Ashley and never found. The one who really helps her, understands her, cares her, and loves her is Rhett. When
she realizes this, she runs out to find Rhett. She wants him know that she loves him and will love him forever,
because he is strong, unscrupulous, passionate, and earthy, like herself. But poor Rhett is so heart-broken that
he can not believe her, and finally left her. A person, sometimes, can not realize the value of something until
he/she loses it, so does Scarlett. She reflects her love with these two men:
She had never understood either of the men she had loved and so she had lost them both. Now she had a fumbling knowledge that, had she ever understood Ashley, she would never have loved him; had she ever understood Rhett, she would never have lost him. She wondered forlornly if she had ever really understood anyone in the world. (Margaret, 1999, p. 807)
But her persistent towards love never leaves her, as she said, “Tomorrow, I will think of some way to get
him back” (Margaret, 1999, p. 808).
Scarlett’s Persistent Pursuit of a Better Life
Before the War, Scarlet is a spoiled, selfish, and untried girl, full of youth, and warm of emotion, who
lives a happy-go-lucky kind of life and needs not to worry about anything. But now, there was nothing left of
ON SCARLETT’S PERSISTENCE IN GONE WITH THE WIND
284
that girl but hunger and hard labour, fear and constant strain. The terror of wars and reconstruction had taken
away all warmth, youth, and softness from her. The war destroyed her peaceful and happy life, her beloved
mother died and her father turned into a childlike old man. What is worse, their Confederate cash becomes
worthless, so she has to face the starvation and shoulder all the burdens for the family. However, unlike most of
the people who do not accept the fact, who fail to realize that their ideal is out of date and must be remolded to
correspond to the new conditions of the social environment, Scarlett is more shrewd and flexible in the new
environment. Unlike her two sisters, she did not stay in the sadness of war, but worked hard to live better,
because she knew that she was no longer the princess of Tara. The lazy and luxury old days in the South have
gone forever, and she is not going to sit down and patiently wait for a miracle to help her. She is going to help
herself. She is going to rush into life and wrest from it for what she wants.
She could not ignore life. She had to live it and it was too brutal, too hostile, for her even to try to gloss over its harshness with smile. (Margaret, 1999, p. 471)
There was no going back and she was going forward throughout the south … and she will never look back. (Margaret, 1999, p. 603)
Breaching her South aristocratic manner, without food, she goes out to find it; without slaves to work in
the cotton field, she labors herself; lacking of money for the tax, she kills a North soldier and gets the money.
She works like a brave warrior, fighting for hunger, fighting for money, and fighting for a better life. At that
time, Scarlett is the daughter, the sister, and the mother, to be exact, the soul and backbone of the family. For
revitalizing her family, she goes to the prison in Atlanta to borrow money from Rhett. For paying the
deliberately raised tax, she lies to Frank, who is her sister’s fiancé (but her sister loves another man), and
marries him. For a better life, she runs a little wood company to earn money, since she strongly believes that a
woman cannot be a lady without money. In fact, at that time in the South, no woman comes out to work except
Scarlett. Even men at that time can not tolerate a woman like Scarlett who defeats them. Her natural talent and
courage to run her business indeed accumulate a lot of money, which will make sure that the family lead a
better life. The hard life after the war makes her more tough and selfish, but what she really wants is not hungry
again and live a better life.
As God as my witness, I will never be hungry again. … I am going to have money enough so the Yankees can never take Tara away from me. And I am going to have a new roof for Tata and new barn and fine mules for ploughing and more cotton than you ever saw. (Margaret, 1999, p. 489)
For her persistent pursuit of a better life and revitalizing her family, Scarlett used fair means and foul. She
should be respected in this aspect, because she has protected her family and her friends. No any other women,
even men can do like her. Not even all the women can do nowadays. That is why Scarlett impressed readers for
so many years.
Conclusions
Scarlett in Gone With the Wind is a well-depicted and miracle character. On the surface, she is a beautiful,
smart, and arrogant daughter of a plantation, but tempered by the Civil War and the experiences of life, her
brave, restless, and persistent nature appears. Before the Civil War, she is a pretty girl, who lives a well-off life.
Influenced deeply by the idea of what a southern woman should do, her desire is to marry Ashley. But the Civil
War shatters her dream, she has to fight for hunger, fight for death, fight for poverty, and shoulder all the

ON SCARLETT’S PERSISTENCE IN GONE WITH THE WIND
285
burdens of the family. After the war, with her “good head for figures” (Jian, 1995, p. 669), she puts all her heart
into making money desperately. She runs her own sawmill, earns money, and revitalizes her family. Through
those years, Scarlett has grown up from an innocent 16-year-old girl into a far-sighted mature woman. She is a
combination of external beauty and internal strength.
For Scarlett, the old South, with its bitter-sweet memories, its old traditions, and its slave system, is gone
with the wind forever. Everything is changing, but there are something unchangeable in Scarlett—her
persistence in love and her persistent pursuit of happiness and a better life. For love, she is no longer a blind
foolish girl, she is clear about what her true love is and will continue to pursue it. Though life is still difficult,
she is determined to meet all the challenges. She bears the motto in her heart, which is also a universal truth to
everybody—“Tomorrow is another day!”.
References Brian, P. (2003). Study guides to Gone With the Wind. Tianjin: Tianjin Science Press. Chang, Y. X. (2002). A survey of American literature. Tianjin: Nankai University Press. Goodale, G. (2011). From “glory” to “gone with the wind” fascination with Civil War endures. The Christian Science Monitor, 4,
11. Gui, Y. Q. (1985). Selected reading in English and American literature. Beijing: Translation Company Press. Jian, Z. (1995). Translation version of Gone With the Wind. Changchun: Changchun Publishing Press. Margaret, M. (1999). Gone with the wind. Xi’an: World Book Publishing Company. Rubinstein, A. T. (1988). American literature: Root and flower. Beijing: Foreign Languages Teaching and Research Press. Shi, J. B. (2004). Survival of the fittest—An analysis of the theme in Gone With the Wind. Journal of Nanjing University of
Science and Technology, 2, 56. Zhou, M. Y. (1997). A comment on Gone With the Wind. Foreign Literature Studies, 4, 78. Zhu. F. (2010). An analysis of Scarlett’s character in Gone With the Wind. Popular Literature, 18, 29.
Call for Papers
US-China Education Review A (Education Practice) (ISSN: 2161-623X) and US-China Education Review B (Education Theory) (ISSN: 2161-6248), the earlier title: US-China Education Review (ISSN: 1548-6613) are professional journals published across the United States by David Publishing Company, USA. These journals are regularly published by China National Publication Import & Export Corporation on commission. If you have the idea of making our journal a vehicle for your research interests, please send electronic version of your paper to us. US-China Education Review A & US-China Education Review B are collected and indexed by the Library of U.S. Congress, on whose official Website (http://catalog.loc.gov) an on-line inquiry can be triggered with its publication number ISSN No. as key words in “Basic Search” column. In addition, these journals are also retrieved by some renowned databases:
Database of EBSCO, ★Massachusetts, USA
Chinese Database of CEPS, ★Airiti Inc. & OCLC, USA
Chinese Scientific Journals ★Database, VIP Corporation, Chongqing, P.R.C. ★ Ulrich’s Periodicals Directory
ASSIA Database and LLBA ★Database of ProQuest
★ Excellent paper in ERIC ★ Norwegian Social Science Data Service (NSD), Database for Statisticson Higher Education (DBH), Norway ★ Universe Digital Library Sdn Bhd (UDLSB), Malaysia ★ Summon Serials Solutions ★ Google Scholar ★ J-GATE
★Scribd Digital Library ★ Airiti ★Academic Key ★ Electronic Journals Library (EZB) ★CiteFactor, USA
Current columns involve Higher Education, Higher Educational Management, Educational Psychology, Teacher Education, Curriculum and Teaching, Educational Technology, Educational Economics and Management, Educational Theory and Principle, Educational Policy and Administration, Sociology of Education, Educational Methodology, Comparative Education, Vocational and Technical Education, Special Education, Educational Philosophy, Elementary Education, Science Education, Lifelong Learning, Adult Education, Distance Education, Preschool Education, Primary Education, Secondary Education, Art Education, Rural Education, Environmental Education, Health Education, History of Education, Education and Culture, Education Law, Educational Evaluation and Assessment, Physical Education, Educational Consulting, Educational Training, Moral Education, Family Education, as well as other issues. David Publishing Company is strived to provide the best platform for researchers and scholars worldwide to exchange their latest findings and results. We admire your achievements, and we understand how important your research impact on other peers in the same interest field and other disciplines, and how delighted you would be when communicating with global professional peers. Your contribution to our journals would be very much welcome! Requirements: (1) Paper must be empirical or theoretical contributions without being published previously; (2) All other scholars’ words or remarks as well as their origins must be indicated if quoted; (3) English title, abstract and key words should be prerequisite; (4) Patterns or forms should conform to the standard listed in our Website; (5) Automatic paper submission system is strongly recommended, while e-mail attachment can be sent through e-mail at [email protected]; [email protected] or [email protected]. Please visit our Website at http://www.davidpublishing.com and http://www.davidpublishing.org for our automatic paper submission systems. Should you have any questions or concerns, please feel free to contact us. Best regards, US-China Education Review A & US-China Education Review B David Publishing Company


![2018 MANAGERIAL FINANCE 4B [MAF412S] - NUST](https://static.fdokumen.com/doc/165x107/63232e1b28c445989106159d/2018-managerial-finance-4b-maf412s-nust.jpg)