Network Working Group G. Chen Internet-Draft China Mobile ...
Upload
khangminh22Category
view
4download
0
Volkswagen Group ChinaDr. Jörg Mull, Executive Vice President, Finance
Morgan Stanley Investor VisitBeijing, January 22nd, 2013

Our Momentum in China
Outlook Market Development
Investments Volkswagen Group China
Driven by Design, Technology and Brand Image
Financial results, challenges and opportunities
2
Content

Introduction of Volkswagen Group China (VGC)
Volkswagen production facilities in China History1985: Founding of Shanghai Volkswagen Automotive Co. (SVW) as joint venture with Shanghai Automotive Industrial Corporation (SAIC). 8 million vehicles produced as of June 2012.
1991: Founding of FAW-Volkswagen Automotive Co. Ltd. (FAW-VW) as second joint venture with First Automotive Work (FAW). 6 million vehicles produced as of June 2012.
2004: Founding of Volkswagen Group China for coordination and management of activities of Volkswagen Group within China.
Today: 17 Volkswagen companies and subsidiaries respectively (including finance and sales companies).
Total investments 1985-2012Planned Investments 2013-2015Employees 2011
€ 15.7 Billion€ 9.8 Billion
48,058
Volkswagen Transmission
Shanghai VolkswagenPowertrain
FAW-Volkswagen(Volkswagen, Audi)
Volkswagen FAW Engine
Volkswagen FAW Platform
Shanghai Volkswagen
Shanghai Volkswagen(Volkswagen, ŠKODA)
Volkswagen AutomaticTransmission
Volkswagen China Investment Company
Beijing
Shanghai
DalianChangchun
Chengdu Nanjing
FAW-Volkswagen
Car production plants
Component plants
Headquarter Volkswagen Group China
3
Yizheng

Volkswagen as a pioneer in China
1986 1987 1988 1989 1990 1991 1992 1993 1994 1995 1996 1997 1998 1999 2000 2001 2002 2003 2004 2005 2006 2007 2008 2009 2010 2012
1985 2011
1985 2011
4

Successful partnership with FAW and SAIC
1991
FAW 60%, VW AG 30%, AUDI AG 10%
1,319,000 units
1985
SAIC Motor 50%, VW AG 50%
1,304,000 units
Foundation
Share
Deliveries 2012
Foundation
Share
Deliveries 2012
5
Volkswagen
Jetta Sagitar Magotan
New Bora CC Golf
Audi
Audi A4L Audi A6L Audi Q3 Audi Q5
Volkswagen
Lavida Santana Passat
Polo Touran Tiguan
Škoda
Fabia Rapid Octavia Superb

VW, VWN
Other Brands
Audi
Locally Produced(‘000 Units)
Import FBU1)
(‘000 Units)
FAW-VW
SVW
Deliveries of Volkswagen in China January to December 2012
Ʃ 189.7 Ʃ 2,622.8
88.4
83.1
18.2
Total Deliveries Region China 2,813
6
995.9 322.7
235.71.068.5
1) incl. Hongkong; Source: Volkswagen Group China

Our Momentum in China
Outlook Market Development
Investments Volkswagen Group China
Driven by Design, Technology and Brand Image
Financial results, challenges and opportunities
7
Content

Q3 2012 GDP reached 7.4% growth year on year, and the economy is now on a path of stable growth
8Source: Deutsche Bank, last update December 2012.
7.4%
Q4/12EQ1/12
7.7%
Q3/12
9.1%
Q2/12
7.6%8.1%
Q4/11
8.9%
Q3/11Q2/11
9.5%
Q1/11
9.7%
Q4/10
9.8%
Q3/10
9.6%
Q2/10
10.3%
Q1/10
11.9%
Q1/13E Q2/13E Q3/13E Q4/13E
7.9%8.2% 8.4% 8.5%
2010 2011 2012 2013(forecast)
CAGR10.3%
CAGR9.2%
CAGR7.7%
CAGR8.2%

After a strong boom in the past years, passenger car market growth in China is stabilizing and will develop further in the future
9
>20.000
+35%+8%
+9%
CAGR >7%*
+54%
CAGR +19%
2020E2013E2012
13.537
2011
12.388
2010
11.457
2009
8.482
2008
5.503
2003
2.266
Total Passenger Car Market –China (incl. HK)(‘000 Units)
* EstimateData Source: Volkswagen Group China / IHS Global Insight

Current 5-year-plan: New growth model with focus on domestic market
11th 5-year-plan 2006-2010
12th 5-year-plan 2011-2015
Multi-National-Companies and infrastructure projects as growth generatorBig growth in manufacturing tradeJobs in cities to keep unemployment lowInternationally comparable price stability and well-adjusted foreign trade balance
Domestic consumption as growth acceleratorMegacities as growth generator Focus on environmental protection and energy efficiencyEncouragement of Chinese innovationsSocial stability due to balanced allocation of prosperity Selective policies for foreign investment as well as globalization of Chinese companies
To date:Focus on export and quantitative growth
Now:Focus on domestic market and qualitative growth
10

Mega and small cities will be the engine of GDP growth
Remark: 6 mega cities in 2010 (Shanghai, Beijing, Chongqing, Shenzhen, Tianjin, Guangzhou)Source: McKinsey Insights China – Macroeconomic model updated April 2012
Distribution by city size2005819 cities
2020865 cities
% of GDP2005 2020
City Level (Urban Population)
Big town (<0.5M)
Small (0.5-1.5M)
Mid-sized (1.5-5.0M)
Big (5-10M)
Mega (10M+)
New cities
3
7
5
6
52
33
169
166
378
46544
202
58
12
3
424
335
85
11
10 1313 2727
2222
2727
1515
1212
2626
1010
2323 2626
11

Zhejiang
Heilongjiang
Jilin Liaoning
Hebei Tianjin
Shandong
Henan
Anhui Jiangsu
Jiangxi
Fujian
Guangdong
Hunan
Hubei
Hainan
Beijing
Shanghai
Inner Mongolia
Shanxi
Guangxi
Yunnan Guizhou
Sichuan
Shaanxi
Ningxia Gansu
Qinghai Tibet
Xinjiang
Chongqing
GDP Growth development is expected to differentiate more strongly between the various Chinese regions
Source: Provincial Government Report
Estimate of Chinese GDP 2012 per Province
Province ExpectedGrowth 2012
Total GDP 2011 (trillion RMB)
Inner Mongolia 15.0% 1.40Guizhou 14.0% 0.56
Chongqing 13.5% 1.00Shaanxi 13.0% 1.20Hainan 13.0% 0.25Anhui 12.6% 1.50
Sichuan 12.0% 2.00Heilongjiang 12.0% 1.10
Tianjin 12.0% 1.10Shanxi 12.0% 1.10
Jilin 12.0% 1.04Gansu 12.0% 0.52Ningxia 12.0% 0.21Qinghai 12.0% 0.16Yunnan 12.0% 0.88Liaoning 11.0% 2.20Hunan 11.0% 1.96Fujian 11.0% 1.75Guanxi 11.0% 1.20Xinjiang 11.0% 0.66
Tibet 11.0% 0.06Henan 10.0% 2.70Hubei 10.0% 1.80Jiangxi 10.0% 1.20
Shangdong 9.5% 4.54Hebei 9.0% 2.40
Guangdong 8.5% 5.30Zhejiang 8.5% 3.18Jiangsu 8%-10% 4.80
Shanghai 8.0% 1.92Beijing 8.0% 1.60
Expected GDP Growth 2012
12-15%
10-12%
8-10%
12

Content
Our Momentum in China
Outlook Market Development
Investments Volkswagen Group China
Driven by Design, Technology and Brand Image
Financial results, challenges and opportunities
13

Go West and Go South Strategy for further growth
Existing production site
New production site
Urumqi
Chengdu
Changchun
NanjingYizheng
Shanghai
NingboFoshan
Beijing
“Go South Strategy”
“Go West Strategy”
14

Further strengthening of partnerships with SAIC and FAW
SAIC FAW
Signing ceremony April 23rd, 2012 in WolfsburgAgreement about Urumqi plant
Signing ceremony April 23rd, 2012 in WolfsburgIntention to extend JV contract with FAW
15

Volkswagen Group China: Planned product portfolio in 2015 with 94 models
Note: number of product models
Commercial Vehicles
CKD 34 FBU 60 94
16

Content
Our Momentum in China
Outlook Market Development
Investments Volkswagen Group China
Driven by Design, Technology and Brand Image
Financial results, challenges and opportunities
17

Volkswagen Passat – Special design elements for Chinese customers
Radiator grill Tail lamps Speaker covering Wheel program
18
Passat USA
Passat China

Latest TSI- and DSG-technologies of Volkswagen Group for China
2010
RecuperationStart-stop
Low rolling friction
Fleet emissions
Future‘s technology
Optimized gearsNew enginegeneration
New TSI generation
Prototypes with innovative Technologies
e-Traction
[CO2/km] [Volume]
19

Content
Our Momentum in China
Outlook Market Development
Investments Volkswagen Group China
Driven by Design, Technology and Brand Image
Financial results, challenges and opportunities
20

Volkswagen Group China reported another strong operating result for the first three quarters of 2012
Source: Volkswagen Group China
1) SVW Group/FAW-VW Group
Deliveries to Customers
Production (100%)1)
Operating profit (quotal)
(’000 Units)
(’000 Units)
(€ m)
1,024
975
395
2008
1,400
1,387
831
2009 2010
1,923
1,914
1,907
2011
2,259
2,202
2,616
Q1-Q32012
2,005
1,953
2,806
21

Challenges in a regulatory environment
Risk of restrictive policies for new car sales in developed Eastern Megacities
Additional megacities like Hangzhou, Shenzhen, Xi'An et al.are expected to introduce similar restriction measures
22
Shanghai
Beijing
Guangzhou
Quota
120k cars/year
240k cars/year
< 120k cars/year(not fixed)
Demanding requirements for fleet consumption
Details for Phase IV still under review

Volkswagen Group China has relevant strategies in place
23
Future growth prospects also coming from less developed regions and Tier 2-3 cities
Production and Dealer network extension will support
Growth in Western and Southern provinces
Different measures in place to realize the ambitious fleet consumption targets
New technologies and products will help to achieve targets
“Go South Strategy”
“Go West Strategy”
Engine andtransmissiontechnology
E-Traction
Vehiclemeasures
TSI
Downsizing
Dual clutch transmission
Recuperation
Start-Stop
Optimal ATM
Weight reduction
Aerodynamic optimization
Reduction of electricconsumption
Hybrid EVs
BEVs
Plug-in hybrid EVs

Additional business opportunities
24
Growing Chinese used car market Financial Services expects increase in retail finance share2)
Volkswagen Financial Services also aims to establish- Mobility packages- Long Term Rental & Fleet Business- Insurance Related & After Sales Services
2010
2.4
2016E2014E2012
+30% p.a.
2018E
20.0
million units
Total Used Car Market forecast1)
Roll out and Implementation of the successful Volkswagen Group used car brand “Das WeltAuto” in the Chinese dealer network
stronger finance demand expected
cash buyer dominance
1) Source: China Automotive Dealer Association 2) Based on the total passenger car sales in the market China
2012 2018

Volkswagen Group China
25
Volkswagen Group China is well positioned to maintain its number one position in the market and seize additional opportunities in the future
Delivered vehicles in million units
0
0,5
1
1,5
2
2,5
3
3,5

Disclaimer
This presentation contains forward-looking statements and information on the business development of the Volkswagen Group. These statements may be spoken or written and can be recognized by terms such as “expects”, “anticipates”, “intends”, “plans”, “believes”, “seeks”, “estimates”, “will” or words with similar meaning. These statements are based on assumptions relating to the development of the economies of individual countries, and in particular of the automotive industry, which we have made on the basis of the information available to us and which we consider to be realistic at the time of going to press. The estimates given involve a degree of risk, and the actual developments may differ from those forecast.
Consequently, any unexpected fall in demand or economic stagnation in our key sales markets, such as in Western Europe (and especially Germany) or in the USA, Brazil or China, will have a corresponding impact on the development of our business. The same applies in the event of a significant shift in current exchange rates relative to the US dollar, sterling, yen, Brazilian real, Chinese renminbi and Czech koruna.
If any of these or other risks occur, or if the assumptions underlying any of these statements prove incorrect, the actual results may significantly differ from those expressed or implied by such statements.
We do not update forward-looking statements retrospectively. Such statements are valid on the date of publication and can be superceded.
This information does not constitute an offer to exchange or sell or an offer to exchange or buy any securities.
26
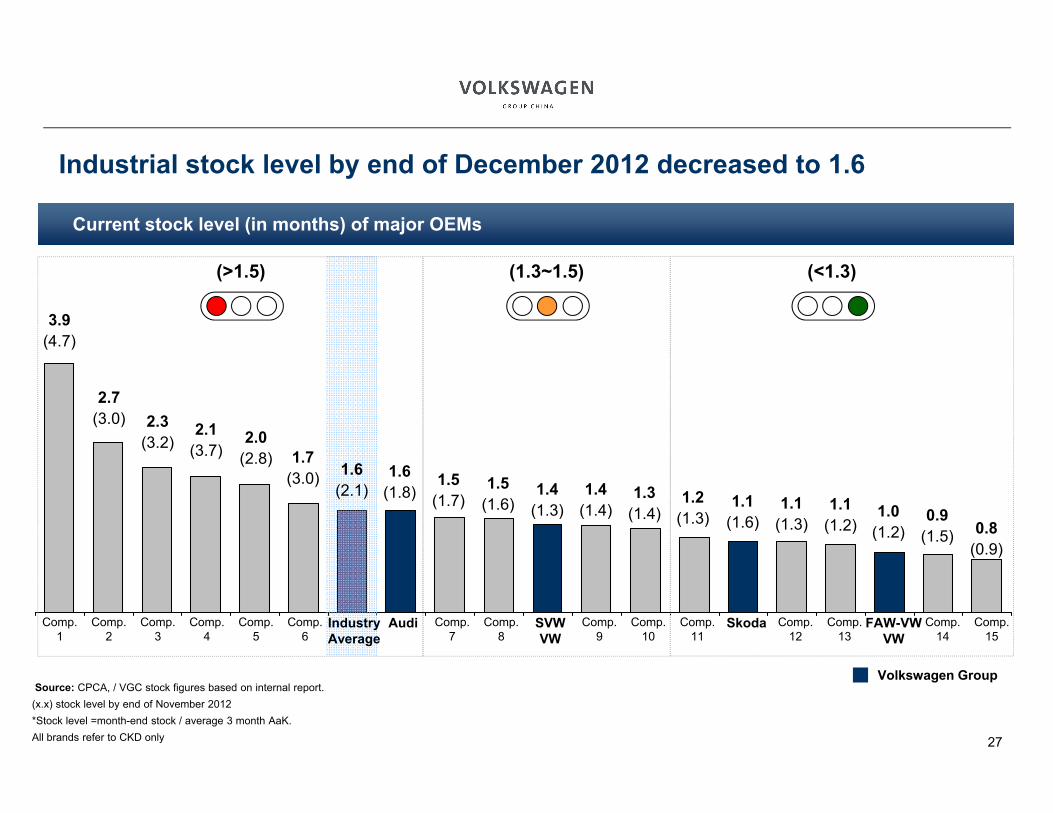
Source: CPCA, / VGC stock figures based on internal report.(x.x) stock level by end of November 2012*Stock level =month-end stock / average 3 month AaK. All brands refer to CKD only
(>1.5) (1.3~1.5)
Volkswagen Group
3.9(4.7)
2.7(3.0) 2.3
(3.2)2.1
(3.7)1.6
(2.1)
2.0(2.8) 1.7
(3.0) 1.6(1.8)
1.5(1.7)
1.5(1.6)
1.4(1.3)
1.4(1.4)
1.3(1.4)
1.2(1.3)
1.1(1.6)
1.1(1.3)
1.0(1.2)
0.9(1.5) 0.8
(0.9)
Audi SkodaComp.6
Comp.5
Comp.15
Comp.9
Comp.12
Comp.3
Comp.10
Comp.8
Comp.1
Comp.14
Comp.4
IndustryAverage
Comp.11
Comp.2
Comp.7
SVW VW
FAW-VW VW
Comp.13
1.1(1.2)
(<1.3)
27
Industrial stock level by end of December 2012 decreased to 1.6
Current stock level (in months) of major OEMs
Copyright © 2022 FDOKUMEN