Urban Sprawl of Wa, Ghana: Socio-Economic Implications for Small-Holder Farmers
12
www.ijird.com January, 2014 Vol 3 Issue 1 INTERNATIONAL JOURNAL OF INNOVATIVE RESEARCH & DEVELOPMENT Page 277 Urban Sprawl of Wa, Ghana: Socio-Economic Implications for Small-Holder Farmers 1. Introduction Land use conflict arises when urban centres begin to sprawl, that is, encroach upon rural and agricultural lands at the periphery. Hence, the sustainability of livelihoods that depend on agricultural lands becomes threatened by the sprawl. The built up area reduces farmland, sand winners scoop the surface soil and farmers are pushed to use marginal lands. The socio-economic implications of this phenomenon in the lives of indigenous farmers are presented in this paper. The planners of emerging urban centers in developing countries particularly Ghana are being cautioned about the possibility of local small-holder farmers becoming urban poor people through the elimination of farming livelihoods (Jedwab, 2011). In terms of provision of income, employment, food security and export earnings, agriculture is the single largest sector in Ghana. Agriculture contributes about half of formal and informal employment and export earnings as well as 23.1 percent of GDP in 2012 (Mongabay, 2013, Government of Ghana, 2013). The services and industry sectors follow agriculture in that order. However, the agricultural sector is dominated by small-holder farmers who are indigenous subsistence peasants. While government of Ghana hopes to modernize the agricultural sector, it also plans to change the structure of Ghana’s economy in favour of services and industry (Government of Ghana, 2010). Normally, services and industry proliferate in urban environment. Therefore, in the next twenty years, Ghana’s government desires to increase the urban share of the population from 52% to 65% between 2010 and 2030. In view of this, there has been re-classification of settlements in Ghana which has changed the status of some rural areas to urban centers while some towns have become municipalities (Government of Ghana, 2010:67). The current urbanization trend in the country called for formulation of the new urban policy adopted in 2012. The urban policy recognizes the importance of urbanization for social and economic progress. It also aims to address hazards associated with haphazard, uncontrolled and uncoordinated urban growth and development (Government of Ghana, 2010:67). The detailed national urban policy contains 12 specific activities. With special reference to this paper, activities four and five are reviewed. Under the fourth activity, the policy seeks to achieve environmental quality in order to improve quality of urban life. Subsection 4.5 deals with the protection of vegetative areas particularly green belts, forest reserves, urban farms, water related environments including wetlands and catchment areas as well as ecologically sensitive area from physical development and urban encroachment (MLGRD, 2012:21-22). Also, subsection 4.7 seeks to use public education and law enforcement to regulate public attitude in relation to degradation (MLGRD, 2012:22). Again, subsection 4.10 considers environmental quality of mining towns and their hinterlands (MLGRD, 2012:24). Activity five pursues effective planning and management of urban growth and sprawl, especially of primate cities and other urban ISSN 2278 – 0211 (Online) Kenneth Peprah Department of Environment and Resource Studies Lecturer, University for Development Studies, Tamale, Ghana Abstract: The paper presents socio-economic implications of urban sprawl for indigenous small-holder farmers in terms of 1). Types and availability of housing, food and water, 2). Possession of livestock and indigenous fowls, electrical appliances and means of transport, 3). Farmers’ involvement in activities that lead to loss of farmland (particularly sand winning) and 4). Farmers’ opinion on the merits and demerits of the urban sprawl. The study methods included a combination of reconnaissance survey, focus group discussion, key informant interviews and a questionnaire survey. It is revealed that there is the land resource market boom which provides higher, quicker and easier to earn income to farmers. The study also confirmed urban encroachment on the farmlands of peripheral communities, increases in social vices as well as the emergence of modern houses, access roads, portable water, grid electricity, increases in business activities and overall development of the peripheral communities. Hence, the majority of farmers prefer the sprawl to their previous solitary traditional situation. Key words: Urban sprawl, socio-economic implications, small-holder farmer, Wa
-
Upload
universityfordevelopmentstudies -
Category
Documents
-
view
5 -
download
0
Transcript of Urban Sprawl of Wa, Ghana: Socio-Economic Implications for Small-Holder Farmers

www.ijird.com January, 2014 Vol 3 Issue 1
INTERNATIONAL JOURNAL OF INNOVATIVE RESEARCH & DEVELOPMENT Page 277
Urban Sprawl of Wa, Ghana: Socio-Economic Implications for Small-Holder Farmers
1. Introduction Land use conflict arises when urban centres begin to sprawl, that is, encroach upon rural and agricultural lands at the periphery. Hence, the sustainability of livelihoods that depend on agricultural lands becomes threatened by the sprawl. The built up area reduces farmland, sand winners scoop the surface soil and farmers are pushed to use marginal lands. The socio-economic implications of this phenomenon in the lives of indigenous farmers are presented in this paper. The planners of emerging urban centers in developing countries particularly Ghana are being cautioned about the possibility of local small-holder farmers becoming urban poor people through the elimination of farming livelihoods (Jedwab, 2011). In terms of provision of income, employment, food security and export earnings, agriculture is the single largest sector in Ghana. Agriculture contributes about half of formal and informal employment and export earnings as well as 23.1 percent of GDP in 2012 (Mongabay, 2013, Government of Ghana, 2013). The services and industry sectors follow agriculture in that order. However, the agricultural sector is dominated by small-holder farmers who are indigenous subsistence peasants. While government of Ghana hopes to modernize the agricultural sector, it also plans to change the structure of Ghana’s economy in favour of services and industry (Government of Ghana, 2010). Normally, services and industry proliferate in urban environment. Therefore, in the next twenty years, Ghana’s government desires to increase the urban share of the population from 52% to 65% between 2010 and 2030. In view of this, there has been re-classification of settlements in Ghana which has changed the status of some rural areas to urban centers while some towns have become municipalities (Government of Ghana, 2010:67). The current urbanization trend in the country called for formulation of the new urban policy adopted in 2012. The urban policy recognizes the importance of urbanization for social and economic progress. It also aims to address hazards associated with haphazard, uncontrolled and uncoordinated urban growth and development (Government of Ghana, 2010:67). The detailed national urban policy contains 12 specific activities. With special reference to this paper, activities four and five are reviewed. Under the fourth activity, the policy seeks to achieve environmental quality in order to improve quality of urban life. Subsection 4.5 deals with the protection of vegetative areas particularly green belts, forest reserves, urban farms, water related environments including wetlands and catchment areas as well as ecologically sensitive area from physical development and urban encroachment (MLGRD, 2012:21-22). Also, subsection 4.7 seeks to use public education and law enforcement to regulate public attitude in relation to degradation (MLGRD, 2012:22). Again, subsection 4.10 considers environmental quality of mining towns and their hinterlands (MLGRD, 2012:24). Activity five pursues effective planning and management of urban growth and sprawl, especially of primate cities and other urban
ISSN 2278 – 0211 (Online)
Kenneth Peprah Department of Environment and Resource Studies
Lecturer, University for Development Studies, Tamale, Ghana
Abstract: The paper presents socio-economic implications of urban sprawl for indigenous small-holder farmers in terms of 1). Types and availability of housing, food and water, 2). Possession of livestock and indigenous fowls, electrical appliances and means of transport, 3). Farmers’ involvement in activities that lead to loss of farmland (particularly sand winning) and 4). Farmers’ opinion on the merits and demerits of the urban sprawl. The study methods included a combination of reconnaissance survey, focus group discussion, key informant interviews and a questionnaire survey. It is revealed that there is the land resource market boom which provides higher, quicker and easier to earn income to farmers. The study also confirmed urban encroachment on the farmlands of peripheral communities, increases in social vices as well as the emergence of modern houses, access roads, portable water, grid electricity, increases in business activities and overall development of the peripheral communities. Hence, the majority of farmers prefer the sprawl to their previous solitary traditional situation. Key words: Urban sprawl, socio-economic implications, small-holder farmer, Wa
www.ijird.com January, 2014 Vol 3 Issue 1
INTERNATIONAL JOURNAL OF INNOVATIVE RESEARCH & DEVELOPMENT Page 278
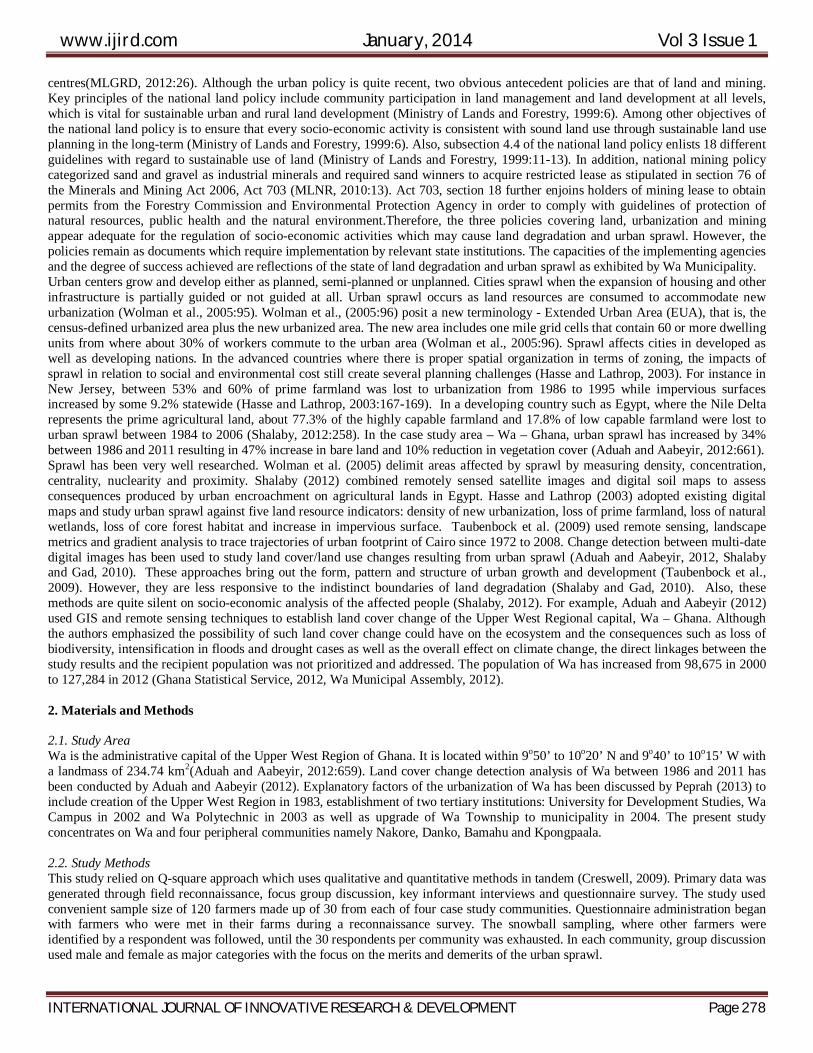
centres(MLGRD, 2012:26). Although the urban policy is quite recent, two obvious antecedent policies are that of land and mining. Key principles of the national land policy include community participation in land management and land development at all levels, which is vital for sustainable urban and rural land development (Ministry of Lands and Forestry, 1999:6). Among other objectives of the national land policy is to ensure that every socio-economic activity is consistent with sound land use through sustainable land use planning in the long-term (Ministry of Lands and Forestry, 1999:6). Also, subsection 4.4 of the national land policy enlists 18 different guidelines with regard to sustainable use of land (Ministry of Lands and Forestry, 1999:11-13). In addition, national mining policy categorized sand and gravel as industrial minerals and required sand winners to acquire restricted lease as stipulated in section 76 of the Minerals and Mining Act 2006, Act 703 (MLNR, 2010:13). Act 703, section 18 further enjoins holders of mining lease to obtain permits from the Forestry Commission and Environmental Protection Agency in order to comply with guidelines of protection of natural resources, public health and the natural environment.Therefore, the three policies covering land, urbanization and mining appear adequate for the regulation of socio-economic activities which may cause land degradation and urban sprawl. However, the policies remain as documents which require implementation by relevant state institutions. The capacities of the implementing agencies and the degree of success achieved are reflections of the state of land degradation and urban sprawl as exhibited by Wa Municipality. Urban centers grow and develop either as planned, semi-planned or unplanned. Cities sprawl when the expansion of housing and other infrastructure is partially guided or not guided at all. Urban sprawl occurs as land resources are consumed to accommodate new urbanization (Wolman et al., 2005:95). Wolman et al., (2005:96) posit a new terminology - Extended Urban Area (EUA), that is, the census-defined urbanized area plus the new urbanized area. The new area includes one mile grid cells that contain 60 or more dwelling units from where about 30% of workers commute to the urban area (Wolman et al., 2005:96). Sprawl affects cities in developed as well as developing nations. In the advanced countries where there is proper spatial organization in terms of zoning, the impacts of sprawl in relation to social and environmental cost still create several planning challenges (Hasse and Lathrop, 2003). For instance in New Jersey, between 53% and 60% of prime farmland was lost to urbanization from 1986 to 1995 while impervious surfaces increased by some 9.2% statewide (Hasse and Lathrop, 2003:167-169). In a developing country such as Egypt, where the Nile Delta represents the prime agricultural land, about 77.3% of the highly capable farmland and 17.8% of low capable farmland were lost to urban sprawl between 1984 to 2006 (Shalaby, 2012:258). In the case study area – Wa – Ghana, urban sprawl has increased by 34% between 1986 and 2011 resulting in 47% increase in bare land and 10% reduction in vegetation cover (Aduah and Aabeyir, 2012:661). Sprawl has been very well researched. Wolman et al. (2005) delimit areas affected by sprawl by measuring density, concentration, centrality, nuclearity and proximity. Shalaby (2012) combined remotely sensed satellite images and digital soil maps to assess consequences produced by urban encroachment on agricultural lands in Egypt. Hasse and Lathrop (2003) adopted existing digital maps and study urban sprawl against five land resource indicators: density of new urbanization, loss of prime farmland, loss of natural wetlands, loss of core forest habitat and increase in impervious surface. Taubenbock et al. (2009) used remote sensing, landscape metrics and gradient analysis to trace trajectories of urban footprint of Cairo since 1972 to 2008. Change detection between multi-date digital images has been used to study land cover/land use changes resulting from urban sprawl (Aduah and Aabeyir, 2012, Shalaby and Gad, 2010). These approaches bring out the form, pattern and structure of urban growth and development (Taubenbock et al., 2009). However, they are less responsive to the indistinct boundaries of land degradation (Shalaby and Gad, 2010). Also, these methods are quite silent on socio-economic analysis of the affected people (Shalaby, 2012). For example, Aduah and Aabeyir (2012) used GIS and remote sensing techniques to establish land cover change of the Upper West Regional capital, Wa – Ghana. Although the authors emphasized the possibility of such land cover change could have on the ecosystem and the consequences such as loss of biodiversity, intensification in floods and drought cases as well as the overall effect on climate change, the direct linkages between the study results and the recipient population was not prioritized and addressed. The population of Wa has increased from 98,675 in 2000 to 127,284 in 2012 (Ghana Statistical Service, 2012, Wa Municipal Assembly, 2012). 2. Materials and Methods 2.1. Study Area Wa is the administrative capital of the Upper West Region of Ghana. It is located within 9o50’ to 10o20’ N and 9o40’ to 10o15’ W with a landmass of 234.74 km2(Aduah and Aabeyir, 2012:659). Land cover change detection analysis of Wa between 1986 and 2011 has been conducted by Aduah and Aabeyir (2012). Explanatory factors of the urbanization of Wa has been discussed by Peprah (2013) to include creation of the Upper West Region in 1983, establishment of two tertiary institutions: University for Development Studies, Wa Campus in 2002 and Wa Polytechnic in 2003 as well as upgrade of Wa Township to municipality in 2004. The present study concentrates on Wa and four peripheral communities namely Nakore, Danko, Bamahu and Kpongpaala. 2.2. Study Methods This study relied on Q-square approach which uses qualitative and quantitative methods in tandem (Creswell, 2009). Primary data was generated through field reconnaissance, focus group discussion, key informant interviews and questionnaire survey. The study used convenient sample size of 120 farmers made up of 30 from each of four case study communities. Questionnaire administration began with farmers who were met in their farms during a reconnaissance survey. The snowball sampling, where other farmers were identified by a respondent was followed, until the 30 respondents per community was exhausted. In each community, group discussion used male and female as major categories with the focus on the merits and demerits of the urban sprawl.

www.ijird.com January, 2014 Vol 3 Issue 1
INTERNATIONAL JOURNAL OF INNOVATIVE RESEARCH & DEVELOPMENT Page 279
3. Results 3.1. Focus Group Discussion 3.1.1. Nakore Male The group was made up of nine members with the average age of 21 years. They were unanimous on the sprawl of Wa engulfing the Nakore community. The sprawl has created a lucrative market for gravels. It takes about two days’ work to quarry a trip which is sold at GH¢40.00i. The youth provide labour for loading constructional sand which is mined from Nakore. A truck load earns GH¢15.00 and it takes about five young men to fill a truck. The land owners earn GH¢10.00 and GH¢20.00 respectively per a load of sand and gravel from the miners. The sand and gravel winning serve as major income generating activity in the community. Sometimes, the youth play middleman role between the hinterland and Wa. The youth buys goats, fowls, maize and groundnuts from villagers and re-sell at higher price in Wa. Also, apprenticeship has increased as many of the youth learn trade/skills in Wa. Another merit of the sprawl is the increase in commodity shops in Nakore. The demerits of the urban sprawl include reduction in farming activities due to loss of farmland to housing infrastructure. Theft is also on the ascendency in the community. 3.1.2. Nakore Female The females who were eight in number revealed an average age of 27 years. They agreed that the sprawl is taking place. Nakore women are benefitting from the sale of gravels. They pay school fees and also increase their clothing stocks from income generated by the sale of gravels. The younger women do not benefit from the sand winning activity. They rather move to periodic markets of the hinterland and purchase maize and groundnuts for re-sale in Wa. Stealing, over speeding vehicles on the community’s non-bitumen surface road and stagnant water of the sand winning pits are their major problems. Another problem is the cost of portable water. The women have to buy domestic water from the two mechanized boreholes at 20 and 10 Ghana pesewas per pan and bucket respectively. 3.1.3. Danko Male The discussion involved six young men with a mean age of 24 years. They wonder whether Danko is still a village or part of the municipality. Electricity supply is extended to a few houses along the untarred road. Several other houses in the community are not connected to the grid. Danko serves as the source of urban water for Wa, that is, underground water is drilled from Danko and supplied to Wa. The large pipelines run through Danko to Wa. Danko rather depends on stand-alone manual boreholes for water. Money is difficult to come by in the community. Sand winners bring their loading labourers from Wa rendering the youth jobless. The only casual job avenue is a labourer in masonry which attracts GH¢10-15 per a day’s work. A labourer would have to work from 8.00 am to 5.00 pm. Cement blocks molding is a contractual job and earns GH¢15-20 per 100 to 120 pieces of blocks made from three bags of cement. 3.1.4. Danko Female Six young women took part in the discussion with the average age of 27 years. The urban sprawl is worsening the already poor sanitary conditions of the community. There are no public latrine and private toilet facilities in the houses. The unemployment situation is being aggravated by the taken over of their farmlands by private estate developers. Burrowed pits created by sand winners get filled with water and prevent them from accessing the remaining farmlands. 3.1.5. Bamahu Male The young men of Bamahu with an average age of 27 years took part in the discussion which centered on merits and demerits of the absorption of Bamahu by Wa. The youth totaling 15 were waiting at the roadside to be casually employed by sand winners. Others are engaged as labourers in mason and carpentry works in the housing construction industry. Barely to the end of the discussion, a truck pulled up and 12 of them were taken on board to load sand. The natives have been able to increase room stocks which are rented by University students. Trading is another source of income in Bamahu. Several commodities, electrical and chemical shops have started an operation to serve the needs of the increasing population. However, the increase in population comes with a lot of vices. Stealing and raping of both female native and female students have been reported. There is also absenteeism of school-going children who offer themselves as labourers in the construction industry. Above all, there is a shortage of farmlands due to sand winning and most importantly the release of farmland for the construction of the university campus (UDS). Older farmers have been rendered jobless. They lack requisite education to be employed by the University as labourers. The older farmers are outdated by the youth with regard to employment in the construction industry. 3.1.6. Bamahu Female Eight of the many women who were in a long queue for registration by the national identification authority formed the discussion group. The average age was 32 years. The women were of the opinion that the sprawl of Wa brings only demerits. They mentioned absence of toilet facilities and the increase in the stench and blight of feaces resulting from increasing human population. There is a further strain on the few boreholes creating water shortages. Also, armed robbery cases are reportedly on the ascendency. Again, the women have been stopped from quarrying stones from land currently acquired and occupied by the university. Therefore, women have been deprived of supplementary income from stones quarrying.

www.ijird.com January, 2014 Vol 3 Issue 1
INTERNATIONAL JOURNAL OF INNOVATIVE RESEARCH & DEVELOPMENT Page 280
3.1.7. Kpongpaala Male The average age was 27 years. The community benefits from the sprawl in terms of connection to the national electricity grid and construction of the access road which is about 70% complete. Some young men are engaged as sand loaders, masons and drivers. They complained about absence of toilet facility and portable water. Some community members rely on water collected in sand winners’ burrowed pits for domestic activities including drinking. Farmlands have been lost to the university and also to sand winning. There is general joblessness of the native people. The community has no school. 3.1.8. Kpongpaala Female The female youth has an average age of 19 years. They were happy about the use of electricity and the road even though untarred. Their main worry is lack of portable water in the community resulting from the breakdown of their manual borehole. Portable water could be purchased from the next community (Bamahu). Otherwise, one would have to trek to sand winning sites to collect stagnant water for free. Dwindling farmland poses another threat to their sustenance in the community. 3.2. Descriptive Statistics The study sought the views of 50% male and 50% females. Table 1 presents the background of the study respondents. The age of respondents ranged from 20 to 81 years. The study communities were dominated by people who professed the Islamic faith. The majority of respondents had no formal education and was married.
Age Frequency Percentage 20-30 35 29.2 31-40 38 31.7 41-50 15 12.5 51-60 12 10.0 61-70 7 5.8 71-80 9 7.5 81+ 4 3.3
Total 120 100.0 Religion
Islam 118 98.3 Christianity 2 1.7
Total 120 100.0 Educational Levels No formal education 82 68.3
Primary 30 25.0 Secondary 7 5.8
Tertiary 1 0.8 Total 120 100.0
Marriage Never married 10 8.3
Married 104 86.7 Widowed 6 5.0
Total 120 100.0 Table 1: Background of the Study Respondents
Table 2 shows household size and heads as well as features of houses used by respondents such as types of walls, floors and roofing. The houses were dominated by traditional ones built with mainly mud or mud brick (no cement and not baked) and often roofed with a mixture of mud and cow dung supported by rafters. There was an appreciable number of houses roofed with zinc/aluminum sheets. The majority of the houses are connected to the national electricity grid. However, majority of respondents do not have access to latrine and defecate in the natural environment.
Household Size Frequency Percentage
1-5 36 30.0 6-10 47 39.2
11-15 25 20.8 16-20 5 4.2 21+ 7 5.8
Total 120 100.0

www.ijird.com January, 2014 Vol 3 Issue 1
INTERNATIONAL JOURNAL OF INNOVATIVE RESEARCH & DEVELOPMENT Page 281
Household Head Male 104 86.7
Female 16 13.3 Total 120 100.0
Walls of the Houses Mud 10 8.3
Bricks (no cement, not baked) 83 69.2 Blocks (cement and sand) 19 15.8
Bricks and blocks 8 6.7 Total 120 100.0
Floors of the Houses Concrete/cement 110 91.7
Mud/gravel 10 8.3 Total 120 100.0
Roofing of the Houses Zinc/aluminum sheets 109 90.8
Thatch/grass 2 1.7 Mud 2 1.7
Zinc and mud 7 5.8 Total 120 100.0
Latrine No latrine/open defecation 111 92.5
In-house latrine 3 2.5 Public latrine 6 5
Total 120 100 Electricity
Connected to electricity grid 103 85.8 No electricity 17 14.2
Total 120 100 Table 2: Features of Household and House of Respondents
Table 3 indicates the types and availability of water and food for respondents. Water consumed by respondents was derived from various sources such as manual borehole (free of charge), a dug-out pond filled with run-off water (free of charge) and mechanized borehole (for sale). Common foods patronized by respondent’s includeTuo Zaafi (TZ) made mainly from maize (Zea Mays), various rice meals (Oryza sativa) and yam (Dioscorea guineensis). Fuels used in cooking included firewood, Liquefied Petroleum Gas, charcoal and combination of firewood and charcoal.
Source of water Frequency Percentage
Borehole 106 88.3 Dug-out pond 7 5.8
Mechanized borehole (for sale) 7 5.8 Total 120 100.0
Types of food TZ – maize 110 91.7
Rice 5 4.2 Yam 5 4.2 Total 120 100.0
Cooking fuels Firewood 101 84.2
Liquefied Petroleum Gas 1 0.8 Charcoal 3 2.5
Firewood and charcoal 15 12.5 Table 3: Types of Water and Food Available to Respondents
Table 4 displays general appearance of farmer-respondents. Types of clothing are categorized into farm clothing, mosque/church wear and usual home wear. The type of foot wears included no footwear/bare footed, bathroom sandals, slippers and farm boots.

www.ijird.com January, 2014 Vol 3 Issue 1
INTERNATIONAL JOURNAL OF INNOVATIVE RESEARCH & DEVELOPMENT Page 282
Clothing Frequency Percentage Farm clothing 39 32.5
Mosques/church wear 31 25.8 Usual home wear 50 41.7
Total 120 100 Foot wear
No foot wear/bare footed 26 21.6 Bathroom sandals 32 26.7
Slippers 50 41.7 Farm boots 12 10.0
Total 120 100 Table 4: General Appearance of Farmer-respondents
Table 5 indicates farmer-respondent possession of livestock such as cattle, goats, sheep and indigenous fowls (guinea fowl, cock and hen).
Possession of Ruminants
and Fowls Cattle (%) Goats (%) Sheep (%) Fowl (%)
1-5 2.5 32.5 22.5 21.7 6-10 - 13.3 14.2 20
11-15 - 8.3 5.8 17.5 16-20 - 7.5 4.2 5 21+ 0.8 8.3 5 20 Zero 96.7 30.1 48.3 15.8 Total 100 100 100 100
Table 5 Farmer Possession of Ruminants and Fowls in Percentages
Table 6 shows other assets ranging from means of transport to household electrical appliances. The respondents were categorized into ‘have’ and ‘have not’.
Possession of means of
transport and electrical appliances ‘Have’ (%) ‘Have not’ (%) Total
Motorbike 63 37 100 Bicycle 48 62 100 Vehicle 0.8 99.2 100
Television 44 56 100 Radio 61 39 100
Mobile/cell phone 66 34 100 Refrigerator 9 91 100
Electric Iron for pressing cloths 4 96 100 Cassette Player 6 94 100
Compact Disc Player 4 96 100 Rice Cooker 2 98 100
Table 6: Possession of Means of Transport and Electrical Appliances
Figure 1 shows how the farmer-respondents perceived themselves in relation to poverty. The majority of respondents (65%) agreed that they were poor, 17.5% claimed not to be poor and another 17.5% was uncertain about their poverty status.

www.ijird.com January, 2014 Vol 3 Issue 1
INTERNATIONAL JOURNAL OF INNOVATIVE RESEARCH & DEVELOPMENT Page 283
Figure 1: Poverty Self-Assessment by Farmer-Respondents
Figure 2: shows that majority of respondents attest to the occurrence of the urban sprawlof Wa.
Figure 2: Farmer Confirmation of the Occurrence of Urban Sprawl
Figure 3 portrays percentage of farmer-respondents who attested to positive indicators of the urban sprawl (yes) and those who did not (no). In each case the ‘no’ stood out clearly than the ‘yes’.
Figure 3: Positive Indicators of the Urban Sprawl on the Peripheral Communities
With regard to the usefulness of the urban sprawl to farmers, Figure 4 shows that majority of farmers agree that the sprawl is beneficial.

www.ijird.com January, 2014 Vol 3 Issue 1
INTERNATIONAL JOURNAL OF INNOVATIVE RESEARCH & DEVELOPMENT Page 284
Figure 4 Farmer Views on the Usefulness of the Urban Sprawl
The threats posed by urban sprawl on the peripheral communities were many. Figure 5 shows negative indicators of the urban sprawl on the communities that surround Wa. Once again, the ‘no’ is more visible than the ‘yes’. The only exception is sand winning as an indicator in which case the ‘yes’ exceeded the ‘no’.
Figure 5: Negative Indicators of Urban Sprawl on the Peripheral Communities
Figure 6 indicates that 62.5% (75 respondents) disagreed with the view that sand winning activity is generally good, 25% (30 respondents) agree that sand winning is beneficial whilst 12.5% (15respondents) remained neutral.
Figure 6: Farmer Assessment of General Usefulness of Sand Winning
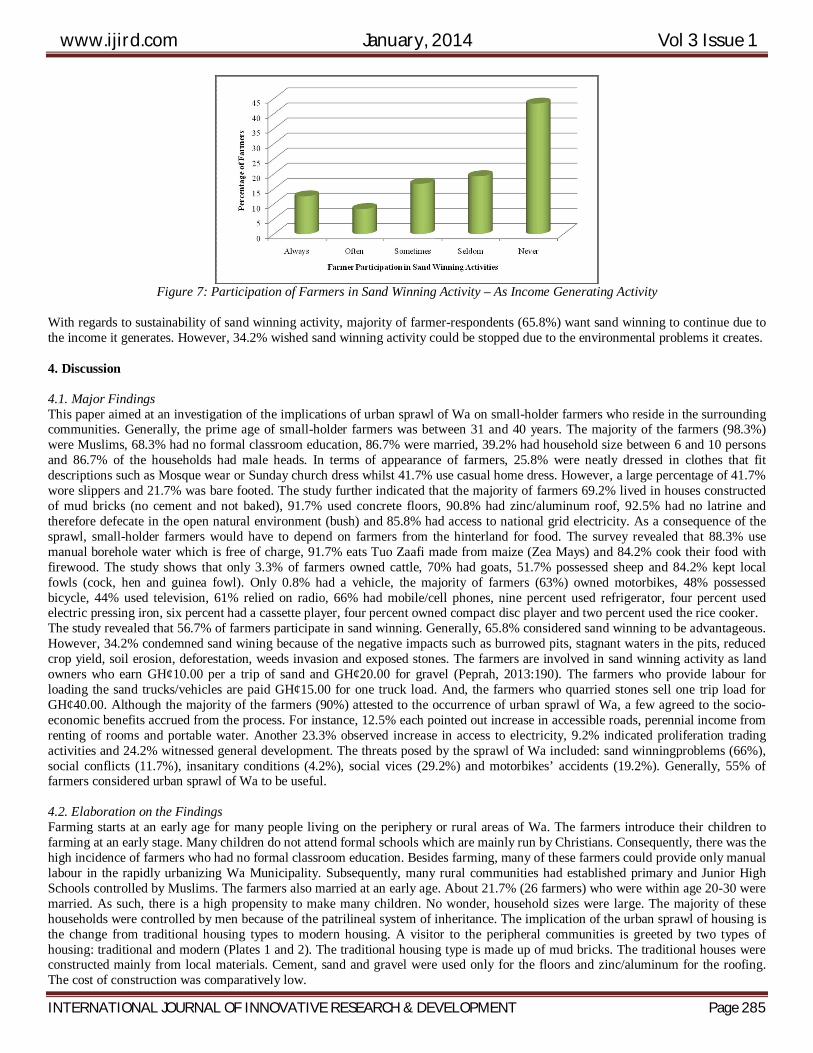
However, some farmers participated in sand winning activity to generate supplementary income. Figure 7 shows that the largest number of farmer-respondents (52) representing 43.3% never played any part in sand winning activity.
www.ijird.com January, 2014 Vol 3 Issue 1
INTERNATIONAL JOURNAL OF INNOVATIVE RESEARCH & DEVELOPMENT Page 285
Figure 7: Participation of Farmers in Sand Winning Activity – As Income Generating Activity
With regards to sustainability of sand winning activity, majority of farmer-respondents (65.8%) want sand winning to continue due to the income it generates. However, 34.2% wished sand winning activity could be stopped due to the environmental problems it creates. 4. Discussion 4.1. Major Findings This paper aimed at an investigation of the implications of urban sprawl of Wa on small-holder farmers who reside in the surrounding communities. Generally, the prime age of small-holder farmers was between 31 and 40 years. The majority of the farmers (98.3%) were Muslims, 68.3% had no formal classroom education, 86.7% were married, 39.2% had household size between 6 and 10 persons and 86.7% of the households had male heads. In terms of appearance of farmers, 25.8% were neatly dressed in clothes that fit descriptions such as Mosque wear or Sunday church dress whilst 41.7% use casual home dress. However, a large percentage of 41.7% wore slippers and 21.7% was bare footed. The study further indicated that the majority of farmers 69.2% lived in houses constructed of mud bricks (no cement and not baked), 91.7% used concrete floors, 90.8% had zinc/aluminum roof, 92.5% had no latrine and therefore defecate in the open natural environment (bush) and 85.8% had access to national grid electricity. As a consequence of the sprawl, small-holder farmers would have to depend on farmers from the hinterland for food. The survey revealed that 88.3% use manual borehole water which is free of charge, 91.7% eats Tuo Zaafi made from maize (Zea Mays) and 84.2% cook their food with firewood. The study shows that only 3.3% of farmers owned cattle, 70% had goats, 51.7% possessed sheep and 84.2% kept local fowls (cock, hen and guinea fowl). Only 0.8% had a vehicle, the majority of farmers (63%) owned motorbikes, 48% possessed bicycle, 44% used television, 61% relied on radio, 66% had mobile/cell phones, nine percent used refrigerator, four percent used electric pressing iron, six percent had a cassette player, four percent owned compact disc player and two percent used the rice cooker. The study revealed that 56.7% of farmers participate in sand winning. Generally, 65.8% considered sand winning to be advantageous. However, 34.2% condemned sand wining because of the negative impacts such as burrowed pits, stagnant waters in the pits, reduced crop yield, soil erosion, deforestation, weeds invasion and exposed stones. The farmers are involved in sand winning activity as land owners who earn GH¢10.00 per a trip of sand and GH¢20.00 for gravel (Peprah, 2013:190). The farmers who provide labour for loading the sand trucks/vehicles are paid GH¢15.00 for one truck load. And, the farmers who quarried stones sell one trip load for GH¢40.00. Although the majority of the farmers (90%) attested to the occurrence of urban sprawl of Wa, a few agreed to the socio-economic benefits accrued from the process. For instance, 12.5% each pointed out increase in accessible roads, perennial income from renting of rooms and portable water. Another 23.3% observed increase in access to electricity, 9.2% indicated proliferation trading activities and 24.2% witnessed general development. The threats posed by the sprawl of Wa included: sand winningproblems (66%), social conflicts (11.7%), insanitary conditions (4.2%), social vices (29.2%) and motorbikes’ accidents (19.2%). Generally, 55% of farmers considered urban sprawl of Wa to be useful. 4.2. Elaboration on the Findings Farming starts at an early age for many people living on the periphery or rural areas of Wa. The farmers introduce their children to farming at an early stage. Many children do not attend formal schools which are mainly run by Christians. Consequently, there was the high incidence of farmers who had no formal classroom education. Besides farming, many of these farmers could provide only manual labour in the rapidly urbanizing Wa Municipality. Subsequently, many rural communities had established primary and Junior High Schools controlled by Muslims. The farmers also married at an early age. About 21.7% (26 farmers) who were within age 20-30 were married. As such, there is a high propensity to make many children. No wonder, household sizes were large. The majority of these households were controlled by men because of the patrilineal system of inheritance. The implication of the urban sprawl of housing is the change from traditional housing types to modern housing. A visitor to the peripheral communities is greeted by two types of housing: traditional and modern (Plates 1 and 2). The traditional housing type is made up of mud bricks. The traditional houses were constructed mainly from local materials. Cement, sand and gravel were used only for the floors and zinc/aluminum for the roofing. The cost of construction was comparatively low.

www.ijird.com January, 2014 Vol 3 Issue 1
INTERNATIONAL JOURNAL OF INNOVATIVE RESEARCH & DEVELOPMENT Page 286
Plate 1: Traditional Houses built with mud bricks (no cement and not baked) at Nakore
(Picture taken on 26th July, 2013) Source: Author
Plate 2: Modern House built with cement blocks at Dankoon the side of the non-bitumen surface road
(Picture taken on 27th July, 2013) Source: Author However, the urban encroachment comes with modern cement block houses, presently, the most ideal housing type for many people in the surrounding communities of Wa. Farmers’ reaction were in several folds: some cover the mud wall with mortar and then paint, others expand the houses by adding more rooms built with cement blocks and those who made huge money from sale of land put up completely new modern houses. In the case of Bamahu and Kpongpaala which are in close proximity to the University, many of the newly created rooms are rented out to students, thereby providing new perennial income. The main advantage of the sprawl is the extension of the national electricity grid to the newly developing areas. The process had benefitted many of the communities surrounding Wa. Access to portable water, particularly manual borehole is another advantage for many peripheral communities. Nonetheless, there were a few who depended on unhygenic sources of water whenever the manual borehole broke down. Due to the fact that the water is free of charge, the Municipal Assembly finds it difficult to repair or maintain the manual boreholes. The solution does not lie in putting charges on the water. Any such move would push many women to use free, but unhygenic sources of water, such as run-off water gathered in the burrowed sand pits. The main staple food comes from maize (Zea Mays) grown by the farmers. With the urban sprawl, many farmers would not be able to feed themselves from their farms because of land degradation by sand winning or complete loss of farmland to housing infrastructure. These two activities also result in depletion of vegetation, particularly tree stocks, thereby reducing women access to firewood. Hence, there is increasing patronage of charcoal brought by villagers from the hinterlands. The sprawl brings new lease of life to the periphery communities, particularly with regards to asset acquisition. The farmers are increasing their stocks of electrical gadgets and they continue to practice traditional livestock and indigenous fowl farming. Livestock rearing is an important aspect of crop farmers’ livelihood. The sale of livestock and fowls provide quick and ready income in times of financial difficulties. The animals are also slaughtered during festive occasions such as Eid al-Adha, Eid al-Fitr, Christmas, New Years’ day and Easter for religious rituals and meat/food.The animal rearing practice follows an extensive culture where the animals roam about in the community looking for pasture. The only exception is cattle rearing which is always carried out under supervision of a herdsman. The mingling of livestock in the activities of the central business district of Wa is a common scene.

www.ijird.com January, 2014 Vol 3 Issue 1
INTERNATIONAL JOURNAL OF INNOVATIVE RESEARCH & DEVELOPMENT Page 287
Hence, the extensive livestock rearing at the periphery communities when fully urbanized would be business as usual. Other assets of the farmers included various means of transport and household appliances. Many farmers rely on motorbikes and bicycles for commuting purposes. The mini bus(passenger vehicle) locally known astrotro is yet to be introduced in the periphery communities. The mini bus services have started carrying students from Wa to the University campus. It represents a new source of investment with the income accruing to its private owners. The use of mobile/cell phones for communication is quite encouraging. However, the use of refrigerators, electric pressing irons and entertainment gadgets are yet to be fully enjoyed. The demand for sand has increased due to proliferation of housing and other infrastructural projects in Wa Municipality. Hence, the sprawl has resulted in an increase in the activities of sand winners. Subsequently, the two land uses (sand winning and farming) compete for space on the same piece of land. The ensuing land use conflict is resolved by which of the two land uses create higher income returns. For some farmers, income from sand winning is higher, quicker and easier to earn than that from farming. The sprawl has taken the native people of Bamahu and Kpongpaala like a storm. These communities are sandwiched between Wa Township and the University Campus. There is a boom in land market as entrepreneurs seek to provide hostels and staff accommodation for students and lecturers many of whom has no accommodation on campus. Overnight, the two communities have become multi-ethnic, multi-income group and myriad of lifestyles. The two communities become hugely populated when the University is in section and depopulated when the institute is in recess. Adaptation by the local people required further research. In the case of Nakore and Danko, the scramble for land is by individuals and affluent emerging middle income group workers developing modern housing infrastructure for their families. 4.3. Linkages between Findings and that of Other Studies More generally urban sprawl of Wa has a lot in common with the sprawl of Romanian cities where there are land price rises and inadequate housing programs resulting in adverse effects on the socio-economic lives of the population in the peripheral communities (Grigorescu et al., 2012). There is a link between the increases in motorbike accidents of the present study and that of Ewing et al. (2003) who revealed direct relationship between urban sprawl and traffic fatalities and pedestrian fatalities in about 448 counties of USA. Bhatta (2010) complements the present study with findings such as the loss of farmland due to urban sprawl which implies loss of fresh local foods, species diversity, habitats, rural economic stability and traditional lifestyles. However, in the case of Bhatta (2010)the loss of farmland is driven by increase in provincial taxes. The desire to make higher, quicker and easier income as well as the fear of losing the land without due compensation drive indigenous farmer-land owners of Wa to dispose of their farmland. 5. Conclusion The study has investigated social and economic implication of urban sprawl for peripheral communities of Wa. The study findings confirm urban encroachment on hitherto rural and agricultural lands. Although, farmlands are being degraded by and lost to sand winning, the degrading activity brings new income considered to be higher, quicker and easier to earn. There is an imminent threat on food security which may affect local staples like maize and yam. Also, certain social problems such as armed robbery and rape are on the ascendancy. Other problems such as conflicts, insanitary conditions and motorbike accidents are increasing. However, the majority of farmers for the time being are comfortable with the emergence of modern houses, access roads, portable water, grid electricity, increases in business activities and overall development of their communities as proceeds of the urban sprawl. For now, the peripheral communities claimed they are better-off with the urban sprawl of Wa. 6. Acknowledgement I wish to thank Anthony N-Yelkabong, Daniel Danyuo and Joseph Kaarafaa teaching and research assistants of the University for Development Studies, Wa Campus. I am equally grateful to the farmer-respondents. 7. References
1. Aduah M. S. and Aabeyir R. (2012), 'Land Cover Dynamics of Wa Municipality, Upper West Region of Ghana', Research Journal of Environmental and Earth Sciences, 4, 6, 658-64 http://maxwellsci.com/print/rjees/v4-58-64.pdf.
2. Bhatta B. (2010), Analysis of Urban Growth and Sprawl from Remote Sensing Data: Advances in Geographic Information Science, (Springer Berlin Heidelberg).
3. Creswell J. W. (2009), Research Design: Qualitative, Quantitative, and Mixed Methods Approaches, (Sage, California). 4. Ewing R., Schieber R. A. and Zegeer C. V. (2003), 'Urban Sprawl as a Risk Factor in Motor Vehicle Occupant and
Pedestrian Fatalities', American Journal of Public Health,93,9, 1541-45 http://ajph.aphapublications.org/doi/abs/10.2105/AJPH.93.9.1541.
5. Ghana Statistical Service (2012), '2010 Population and Housing Census: Summary Report of Final Results', (Accra: Ghana Statistical Service), 1-117.
6. Government of Ghana (2010), 'Medium-Term National Development Policy Framework: Ghana Shared Growth and Development Agenda', (Accra: Government of Ghana), 1-278.
7. Government of Ghana (2013), 'Sustaining Confidence in the Future of the Ghanaian Economy', in S. E. Terkper (ed.), Budget Statement and Economic Policy of the Government of Ghana for the 2013 Financial Year, (Accra: Ministry of Finance and Economic Planning,), 1-57.

www.ijird.com January, 2014 Vol 3 Issue 1
INTERNATIONAL JOURNAL OF INNOVATIVE RESEARCH & DEVELOPMENT Page 288
8. Grigorescu I., Mitrica B., Mocanu I. and Ticana N. (2012), 'Urban Sprawl and Residential Development in the Romanian Metropolitan Areas', Romania Journal of Geography,56,1, 43-59 http://www.rjgeo.ro/atasuri/revue%20roumaine%2056_1/Grigorescu%20et%20al..pdf.
9. Hasse J. E. and Lathrop R. G. (2003), 'Land Resource Impact Indicators of Urban Sprawl', Applied Geography,23, 159-75 10. Jedwab R. (2011), 'Why Is Africa Urbanized But Poor? Evidence from Resource Booms in Ghana and Ivory Coast', JEL, 1-
59. 11. Ministry of Lands and Forestry (1999), 'National Land Policy', (Accra: Government of Ghana), 1-30. 12. MLGRD (2012), 'Ghana National Urban Policy: Action Plan', (Accra: Ministry of Local Government and Rural
Development), 1-50. 13. MLNR (2010), 'National Mining Policy of Ghana', (Accra: Ministry of Land and Natural Resource), 1-34. 14. Mongabay (2013), 'Ghana - The Economy', in R. Butler (ed.), Ghana - Economy,
http://www.mongabay.com/reference/country_studies/ghana/ECONOMY.html). 15. Peprah K. (2013), 'Sand Winning and Land Degradation: Perspective of Indigenous Sand Winners of Wa, Ghana ', Journal of
Environment and Earth Science,3,14, 185-94. 16. Shalaby A. (2012), 'Assessment of Urban Sprawl Impact on the Agricultural Land in the Nile Delta of Egypt Using Remote
Sensing and Digital Soil Map', International Journal of Environment and Sciences,1,4, 253-62. 17. Shalaby A. and Gad A. (2010), 'Urban Sprawl Impact Assessment on the Fertile Agricultural Land of Egypt Using Remote
Sensing and Digital Soil Database, Case Study: Qalubiya Governorate', US-Egypt Workshop on Space Technology and Geo-Information for Sustainable Development (Cairo: National Authority for Remote Sensing and Space Sciences, Egypt), 1-11.
18. Taubenbock H., Wegmann M., Roth A., Mehl H. and Dech S. (2009), 'Analysis of Urban Sprawl at Mega City Cairo, Egypt Using Multisensoral Remote Sensing Data, Landscape Metrics and Gradient Analysis', 33rd International Symposium on Remote Sensing of Environment (Stresa, Italy: http://elib.dlr.de/58840/1/136_H.Taubenbock.pdf).
19. Wa Municipal Assembly (2012), 'The Composite Budget of the Wa Municipal Assembly for the Fiscal Year 2012', (Wa: Ministry of Local Government and Rural Development), 1-109 http://www.mofep.gov.gh/.
20. Wolman H., Galster G., Hanson R., Ratcliffe M., Furdell K. and Sarzynski A. (2005), 'The Fundamental Challenge in Measuring Sprawl: Which Land Should Be Considered?', The Professional Geographer,57,1, 94-105
iUS$1.00 = GH¢2.30 [12-08-2013]