City Limits: Putting the Brakes on Sprawl - THE PEP
43
City Limits: Putting the Brakes on Sprawl MOLLY O’MEARA SHEEHAN Jane Peterson, Editor WORLDWATCH PAPER 156 June 2001 ORLDWATCH NSTITUTE W I W 1776 Massachusetts Ave., NW Washington, DC 20036 www.worldwatch.org © 2001, Worldwatch Institute
-
Upload
khangminh22 -
Category
Documents
-
view
2 -
download
0
Transcript of City Limits: Putting the Brakes on Sprawl - THE PEP

City Limits: Putting the Brakes
on Sprawl
M O L L Y O ’ M E A R A S H E E H A N
Jane Peterson, Editor
W O R L D W A T C H P A P E R 1 5 6
June 2001
O R L D WAT C HN S T I T U T EWIW 1776 Massachusetts Ave., NW
Washington, DC 20036www.worldwatch.org
© 2001, Worldwatch Institute

Table of Contents
THE WORLDWATCH INSTITUTE is an independent, nonprofit envi-ronmental research organization in Washington, DC. Its mission is to fostera sustainable society in which human needs are met in ways that do notthreaten the health of the natural environment or future generations. Tothis end, the Institute conducts interdisciplinary research on emerging glob-al issues, the results of which are published and disseminated to decision-makers and the media.
FINANCIAL SUPPORT for the Institute is provided by the ComptonFoundation, the Geraldine R. Dodge Foundation, the Ford Foundation, theRichard & Rhoda Goldman Fund, the William and Flora Hewlett Foundation,W. Alton Jones Foundation, Charles Stewart Mott Foundation, the Curtis andEdith Munson Foundation, David and Lucile Packard Foundation, John D.and Catherine T. MacArthur Foundation, Summit Foundation, TurnerFoundation, U.N. Environment Programme, U.N. Population Fund, WallaceGenetic Foundation, Wallace Global Fund, Weeden Foundation, and theWinslow Foundation. The Institute also receives financial support from itsCouncil of Sponsors members—Tom and Cathy Crain, James and DeannaDehlsen, Roger and Vicki Sant, Robert Wallace and Raisa Scriabine, and EckartWintzen—and from the many other friends of Worldwatch.
THE WORLDWATCH PAPERS provide in-depth, quantitative and quali-tative analysis of the major issues affecting prospects for a sustainable soci-ety. The Papers are written by members of the Worldwatch Institute researchstaff and reviewed by experts in the field. Regularly published in five lan-guages, they have been used as concise and authoritative references by governments, nongovernmental organizations, and educational institutionsworldwide. For a partial list of available Papers, see back pages.
REPRINT AND COPYRIGHT INFORMATION for one-time academicuse of this material is available by contacting Customer Service, CopyrightClearance Center, at (978) 750-8400 (phone), or (978) 750-4744 (fax), orwriting to CCC, 222 Rosewood Drive, Danvers, MA 01923. Nonacademicusers should call the Worldwatch Institute’s Communication Department at(202) 452-1992, x517, or fax a request to (202) 296-7365.
© Worldwatch Institute, 2001ISBN 1-878071-58-0
Library of Congress Control Number: 2001091467
Printed on paper that is 100 percent recycled, 100 percent post-consumer waste, process chlorine free.
The views expressed are those of the author and do not necessarily represent those of the Worldwatch Institute; of its directors, officers, orstaff; or of its funding organizations.
Introduction . . . . . . . . . . . . . . . . . . . . . . . . . . . . . . . . . . . 5
How Motor Vehicles Take Over Cities . . . . . . . . . . . . . . . . 9
The Costs of Sprawl. . . . . . . . . . . . . . . . . . . . . . . . . . . . . . 18
Three Cities that Chose Livability Over Sprawl . . . . . . . . . 26
Linking Transportation and Land Use Policies . . . . . . . . . 35
Erasing the Incentives to Sprawl . . . . . . . . . . . . . . . . . . . . 42
Restructuring Government Institutions. . . . . . . . . . . . . . . 49
Creating Constituencies for Change . . . . . . . . . . . . . . . . . 54
Appendix . . . . . . . . . . . . . . . . . . . . . . . . . . . . . . . . . . . . . 66
Notes . . . . . . . . . . . . . . . . . . . . . . . . . . . . . . . . . . . . . . . . 71
Tables and Figures
Table 1: Total Population and Share That Is Urban, by World Region,
2000 and 2030 . . . . . . . . . . . . . . . . . . . . . . . . . . . . . . . . . . . 7
Table 2: Indicators of Automobile Dependence in Selected Cities,
by World Region, 1990 . . . . . . . . . . . . . . . . . . . . . . . . . . . . . . . 10
Table 3: Commute to Work in Selected Cities, Early 1990s . . . . . . . . 11
Table 4: Number of Cities with Rail Systems in Operation,
by World Region, 2000 . . . . . . . . . . . . . . . . . . . . . . . . . . . . . . . 15
Table 5: Changes in Portland and Atlanta Regions from mid-
1980s to mid-1990s . . . . . . . . . . . . . . . . . . . . . . . . . . . . . . . . . 32
Table 6: Gasoline Prices, Selected Countries, Fall 2000 . . . . . . . . . . . 48

5
Introduction
Many mornings, in search of work to support his family,Isaac Mburu trudges eight kilometers into Nairobi’s
tourist district on dusty footpaths next to the city’s pavedroads. For three or four hours, he walks alongside speedingvehicles, squinting through brown smog. A 33-year-oldfather of three, Isaac lives in a neighborhood where busesnever go—even if they did, he could not afford the fare. Heis one of the more than 40 percent of Nairobi’s residents whodon’t have bus fare, and one of the 94 percent who cannotbuy a car. Like 55 percent of Nairobians, he inhabits amakeshift slum on the city’s edge.1
Isaac lives in a city built for motor vehicles in a countrywhere most people cannot afford them. Even in wealthiercountries, car-centered cities deepen the disparities betweenrich and poor, shut out the old and young, and endangerpublic health. For example, though the car is the only viablemeans of getting from one place to another in some U.S.cities, roughly one third of the nation is too young, too old,or too poor to drive. Spread-out urban development eats upforests and farmland, paves over watersheds, and inducesvehicle traffic that burns fuel and creates noise and air pol-lution. In Austria, France, and Switzerland, pollution killsmore people than cars do: the number of premature deathsprecipitated by particulate emissions from vehicles is abouttwice the number from traffic accidents, according to areport in The Lancet, a medical journal.2
Sprawling cities harm human and environmental healthin less obvious ways as well. When people drive instead of
ACKNOWLEDGMENTS: Many thanks to Chris Calwell, Bill Drum-heller, Walter Hook, Tanya Imola, James O’Meara (my dad), RutherfordPlatt, and Lou Thompson for reviewing drafts of this paper or the Stateof the World chapter from which it grew. I am also grateful to OscarEdmundo Diaz, Yaakov Garb, Gerhard Metschies, and Paul Steely Whitefor their kind help with data and information. I do not have space hereto list the many people who took time to explain their work to me, sotheir names appear in the endnotes.
Special thanks to colleagues David Roodman, for supervising this pro-ject; Jane Peterson, for enthusiastically editing the final drafts; andMichael Renner, for his comments. Thanks also to librarian Lori Brownand interns Mike Montag and David Ruppert for locating articles andbooks—and to Jonathan Guzman and Joseph Gravely for making sure Igot all that information. I am indebted to art director Liz Doherty, whoably juggled this paper with competing demands, researchers GaryGardner and Lisa Mastny, who reviewed the paper one last time, and tothe communications team of Dick Bell, Denise Warden, LeanneMitchell, and Niki Clark.
Lastly, heartfelt thanks to my husband, Joe Sheehan, for setting up myhome office and boosting my morale.
MOLLY O’MEARA SHEEHAN is a Research Associate at theWorldwatch Institute, where she studies the role of cities and informa-tion technology in solving environmental problems. She is a contribut-ing author of the Institute’s annual books, State of the World and VitalSigns, and regularly writes for the bi-monthly World Watch magazine.Her last contribution to this series was Worldwatch Paper 147,Reinventing Cities for People and the Planet. Molly has a master's degree inEnvironmental Sciences from Johns Hopkins University and a bache-lor’s degree in Biology and Asian Studies from Williams College.
Table 7: Automotive Sector Ranking in Advertising Spending,
United States and World, 1998 . . . . . . . . . . . . . . . . . . . . . . . . . 61
Figure 1: World CO2 Emissions, Total and Transport Sector,
1971–97 . . . . . . . . . . . . . . . . . . . . . . . . . . . . . . . . . . . . . . . . . 25
Figure 2: The Bus System in Curitiba, Brazil . . . . . . . . . . . . . . . . . 34
Figure 3: Automobile Operating Costs, United States, 1985–98 . . . . . 47

segregated communities, depressing landscapes, illness frompolluted air and water, climate change, and economic slip-page—they have also helped citizens create a vision of anurban form that would allow people greater access to jobs,schools, and stores at less cost to the environment. In coun-tries that are already highly urbanized, new constructioncould be encouraged at locations easily reached by a varietyof transportation means, while green space could be reservedfor nature, agriculture, and recreation. Existing car-reliantsuburbs could be retrofitted with bicycle paths, bus lanes,and new forms of transit. Places such as shopping malls thatwere designed for a single use could be rebuilt as town cen-ters where people could both live and work.
Perhaps the greatest opportunity for pursuing the visionof people-centered cities lies in developing countries, wheremuch new urban infrastructure will be built. Successes inplaces like Copenhagen, Denmark; Portland, Oregon, in theUnited States; and Curitiba, Brazil—three cities that havemade tough decisions about transportation and urban devel-opment—are inspiring people across the planet. Satisfyingthe needs of walkers and bikers, centralizing new develop-ment where it can be reached by public transit, and encour-
6 CITY LIMITS 7INTRODUCTION
walking or biking, they expend fewer calories. Doctors in theUnited States have begun to study how relying on a car to get from one place to another may foster obesity andother health risks. The greater amount of vehicle travelrequired in spread-out urban areas also generates carbondioxide, a gas that warms the planet’s atmosphere. Trans-portation is now the fastest-growing source of these climate-altering emissions.3
As Isaac’s story suggests, spread-out cities lacking goodpublic transportation trap people in traffic and diminishtheir productivity. Researchers estimate that every day,Atlanta loses more than $6 million to traffic delays, Bangkokmore than $4 million. But such calculations only valuehours that could have been spent working. It’s harder tomeasure the loss to society of time that could have been usedto care for one’s children, build friendships, or participate incommunity activities. While the car is a symbol of wealth,studies suggest that the high costs of automobile depen-dence can actually erode economic growth. Real estate ana-lysts in the United States have noted that denser cities thatboast alternatives to the car have been better investment betsin recent years than sprawling suburban agglomerations.4
These sorts of problems are bound to intensify unlessgreater effort is made to change direction as the world continues to become more urban. Nearly half of the globalpopulation—2.85 billion people—resided in urban agglom-erations in 2000, almost four times as many as in 1950. Sub-Saharan Africa, where Isaac Mburu lives, is home to theworld’s fastest-urbanizing countries. Demographers estimatethat population growth in the cities and towns of Africa,Asia, and Latin America will account for more than 90 per-cent of the 2.05 billion people they expect to be added toworld population between 2000 and 2030. (See Table 1.)How these cities meet the transportation needs of their citi-zens will affect not only billions of lives, but also world ener-gy demand for years to come.5
At the same time that urbanists, environmentalists, andeconomists have documented the various costs of sprawl—
2000 2030Region Population Urban Share Population Urban Share
(million people) (percent) (million people) (percent)
Asia 3,683 37 4,877 53Africa 784 38 1,406 55Europe 729 75 691 83Latin America 519 75 726 83North America 310 77 372 84
Source: See endnote 5.
TABLE 1
Total Population and Share That is Urban, by WorldRegion, 2000 and 2030

9HOW MOTOR VEHICLES TAKE OVER CITIES8 CITY LIMITS
aging the higher population densities needed for viable pub-lic transportation have led to cleaner air and more vibrantcommunities.
Yet even as this vision is transforming cities and demon-strating its superiority to the prevailing model, powerfulincentives remain for people to continue building and main-taining places that cater to cars. Government institutionsand policies often support car-dependent development.Transportation agencies set up to generate roads create amomentum of their own by rewarding government officialsfor building more roads. Zoning laws often segregate storesand other businesses from homes, making cars virtuallyessential for people to move from home to work or shopping.And various taxes and subsidies hide the true costs of sprawland affect where people live and how they travel from oneplace to another. In Nairobi, for many years, a large fee forregistering bicycles prevented poor people from buyingthem; Isaac Mburu, a bicycle mechanic, had his bicycle con-fiscated by local authorities because he could not pay the fee.
Many private companies have a vested interest in the sta-tus quo. Oil and tire companies, carmakers, road builders,and real estate developers have greatly influenced the waycities developed. Car companies, for example, spend moremoney than any other industry on advertising, in order tosell the idea of a car-centered life (invariably depicted onopen roads) to people who may already cherish elements ofthis vision—a home and a car that will give them door-to-door service. Real estate developers often use money to per-suade local governments to give a green light to theirprojects, even to flout laws designed to protect parks or otherpublic space.
Around the world, people are tackling these institution-al and political barriers, alarmed by clogged roads, dirty air,and deteriorating neighborhoods. Ideas from Copenhagenabout creating safe routes for children to walk or cycle toschool have been picked up and adapted by citizens’ groupsand local officials in the United Kingdom, the United States,and elsewhere, while elements of Curitiba’s network of ded-
icated busways and cycle paths are being replicated inBogotá, Lima, and other Latin American cities. And in asmart growth movement that swept across the United Statesin the 1990s, several states and cities borrowed ideas aboutmetropolitan cooperation from Portland.
In helping to create visions of what they would like theircities to look like, citizens have begun to show businesses howthey might collaborate to create this new urban future. As wit-nessed by a renaissance in light rail construction, the prolifer-ation of privately run car-sharing networks, and thepopularity of newly built neighborhoods that boast stores andoffices within walking distance of homes, the companies thathave responded are thriving. And so are the communities.
How Motor Vehicles Take Over Cities
With the United States leading the way, every worldregion has some metropolitan areas that are harmed
by sprawl—or car-dependent development. The idea ofsprawl and progress became intertwined long ago, and to besure, the ranks of car owners have swollen as more peoplehave amassed the wealth to buy vehicles. But even poorcountries have built car-centric cities. Mainly, it is govern-ment decisions about transportation and housing that havecreated sprawl, although the dynamics have varied dramati-cally from place to place.
While car-dependent cities can be found all over theworld, some of the world’s regions harbor more than others.In studies limited to North America, Europe, Australia, andAsia, the cities sampled in the United States were the mostreliant on automobiles, followed by Australia and thenCanada. The cities with the highest public transit use andlowest fuel consumption were all in Europe and Asia.6 (SeeTables 2 and 3.)
This pioneering research shows that, contrary to expec-tations, wealth is not the main impetus toward car-centered

CITY LIMITS
cities. As a group, the U.S. cities surveyed had 141 percentmore car use per person than the European cities, but 15 per-cent less income per person. An even greater disparity wasseen between wealthy and middle-income cities in Asia. Percapita income in Tokyo was nine times higher than that inKuala Lumpur, Malaysia, but car use per person in KualaLumpur was nearly double that in rail-dense Tokyo.7
Car use tends to be highest in places where no otheroptions exist. Each year, people in the United States drivealmost twice as far per person as Western Europeans do. YetU.S. citizens are not twice as wealthy, nor are they travelingtwice as far with each trip. In fact, each car trip averages aboutthe same length as one taken by a European: 13–15 kilome-ters (km). However, a person living in the United States gen-erally has fewer transportation choices, so he will use a car fortrips that a Western European would take by bike or train.8
If higher car use is not brought on by wealth or longtrips, it is tightly linked to government transportation poli-cies. In many countries, road networks have been expandingfaster than rail systems. Transportation influences the layoutof cities, so places like Atlanta and Nairobi, which have expe-rienced major population growth at a time when govern-
11HOW MOTOR VEHICLES TAKE OVER CITIES10
Transportation MetropolitanRegion Private Car Use Fuel Use Population Density
(km/person) (megajoule/person) (people/hectare)
United States 11,155 64,351 14.2Australia 6,571 39,456 12.2Canada 6,551 39,173 28.5Europe 4,519 25,692 49.9Asia 1,727 12,862 161.9
Sources: See endnote 6.
TABLE 2
Indicators of Automobile Dependence in SelectedCities, by World Region, 1990
Private Public Foot/Bicycle/City Population Vehicle Transit Other
(million) (percent)
North AmericaAtlanta 2.5 95.0 4.7 0.3Portland 1.3 90.3 5.8 3.9Toronto 4.3 64.6 30.1 5.3Vancouver 1.8 81.9 12.4 5.7
Latin AmericaBrasilia 1.8 45.0 53.0 2.0Curitiba 2.2 13.6 71.8 14.6Santiago 4.9 15.8 54.3 29.9Bogota 6.1 8.8 74.8 16.4
EuropeCopenhagen 1.3 43.0 25.0 32.0Amsterdam 1.1 40.0 25.0 35.0Paris 9.5 48.9 36.2 14.9Zurich 0.9 36.0 39.8 24.2
AfricaAbidjan 2.8 15.8 49.1 35.1Nairobi 1.8 16.0 67.5 16.5Lagos 10.3 18.5 53.8 22.4Cairo 9.7 10.5 58.2 31.3
Asia-PacificKuala Lumpur 1.2 57.6 25.5 16.9Jakarta 8.6 41.4 36.3 22.3Manila 9.3 28.0 54.2 17.8Bangkok 6.5 60.0 30.0 10.0Hong Kong 5.8 9.1 74.0 16.9Singapore 3.3 21.8 56.0 22.2Tokyo 27.0 29.4 48.9 21.7Sydney 3.6 69.3 25.2 5.5
Sources: See endnote 6.
TABLE 3
Commute to Work in Selected Cities, Early 1990s

13HOW MOTOR VEHICLES TAKE OVER CITIES12 CITY LIMITS
ments were hurrying to build roads to accommodate cars, aremore spread out than older urban centers.
Government housing policies have also helped to createsprawl, although the dynamics have differed from place toplace. In the United States, governments coupled low-income housing in central cities with incentives for middle-and high-income people to buy houses in suburbs.Developing-country governments, on the other hand, havenot subsidized suburban development in the same way theUnited States has, nor have they provided shelter for low-income families. Thus, whereas Atlanta has sprawling,low-density enclaves of affluent homeowners, Nairobi hassprawling, high-density settlements of destitute squatters. Ineach case, the city is fragmented, motor vehicles clog theroads, and people who need jobs cannot easily reach them.
The role of government policies in shaping cities is bestdocumented in the United States, which has the longest his-tory of car-dependent urbanization. As early as the firstdecade of the twentieth century, a coalition of car makers,road builders, tire manufacturers, and oil companies beganforming to push Congress for a system of government-fund-ed highways. Public disillusionment with privately run rail-roads, the discovery of oil in Texas, and the sense of endlessspace to be conquered on the American continent all con-tributed to the success of this effort.9
The National Interstate and Defense Highway System Actof 1956 launched the nation on a frenzy of highway build-ing. Although the initial goal was to foster better roadsbetween cities, the unintended result was also to build moreroads within cities. (Today, some 36 percent of all federallyaided highway miles are in urban areas.) The governmentpoured tax revenues from gasoline into a fund dedicated toroad building. The tax made users of roads help pay for them,but only partially. The taxes failed to cover the full costs ofconstruction and maintenance, not to mention the costsfrom pollution or accidents. At the same time, its stable fund-ing sheltered the Federal Highway Administration from com-petition with other agencies. Between 1988 and 1999, the
United States spent more than six times the amount ofmoney on highways that it did on public transportation.10
The lure of U.S. federal highway funds skewed the prior-ities of state governments. A state looking to build a highwaywould pay only 10 percent of the bill, while the federal gov-ernment would pony up the rest. Until recently, the state ofGeorgia has plowed billions of dollars into highways, partic-ularly in Atlanta’s northern suburbs, while investing little inAtlanta’s Metropolitan Atlanta Rapid Transit Authority. Withmany miles of highway and few real alternatives to the pri-vate car, Atlanta is one of the most sprawling U.S. cities.11
The U.S. government further boosted suburban develop-ment by underwriting both the expansion of water andsewer lines to outlying areas and the purchase of new homesthere. A new government agency for home loans was creat-ed in 1938, and revamped in 1968 as a private-public enter-prise, the Federal National Mortgage Association (now calledFannie Mae), to buy home loans from the banks that origi-nate them, providing a fresh supply of money for housing.By refusing to back loans in central city neighborhoods andfavoring loans in new suburban developments, the agencyhelped distort urban development.12
Most state laws allowed or even encouraged the creationof new municipalities on the edge of metropolitan areas, sonew suburban towns each had their own ability to tax, zone,and establish school systems. By requiring development onlarge lots, these suburban towns could exclude the poor.People living in these areas could drive to the city to benefitfrom its cultural activities or job opportunities, but were notrequired to give anything back to it.13
Predictably, all these policies sparked a dramatic increasein car dependence. Between 1950 and 1990, the number ofpeople living in 58 U.S. metropolitan areas analyzed byurban specialist David Rusk rose 80 percent, while the landcovered by those metropolitan areas expanded 305 percent—nearly four times as much. Part of the reason that Americansnow guzzle 43 percent of the world’s gasoline production isto wheel around these expansive metropolises.14

Canada, like the United States, is a wealthy country withwide open spaces whose metropolitan areas have surged dur-ing the automobile age, but a tradition of metropolitan coop-eration to link public transportation to land use planning andprovide uniform services across these areas has kept sprawl incheck. Canadian cities spawned suburbs in the early decadesof the twentieth century, and provincial governmentsresponded in the 1950s with an eye to the future health ofthe entire region by creating agencies to coordinate regionaltransportation, land use, and water services. Canadian met-ropolitan areas today have one quarter the number of kilo-meters in urban expressways, three times greater publictransportation use, and 1.8 times greater population densitiesthan metropolitan areas in the United States.15
Since the 1970s, however, Canadian provinces haveexpanded highways and sewers beyond the borders of regionscorresponding to a single metropolitan agency, inviting U.S.-style sprawl. A shift toward political conservatism may be onereason that governments have not responded with a vigorousnew expansion of metropolitan cooperation.16
In contrast to North America, most Western Europeanand Japanese cities were well established before the automo-bile age, and most residents, treasuring their old buildingsand streets, were reluctant to knock them down. People liv-ing in small, densely populated countries with long urbanhistories are more likely to recognize the need to clusterurban development to preserve both the character of thecountryside and the fabric of cities. Moreover, nations with-out ample domestic supplies of oil have been more cautiousin embracing the idea of a car-centered transportation sys-tem. Accordingly, governments in Western Europe and Japanhave given relatively greater support to rail-based publictransportation in urban areas. Western Europe has about onethird of the world’s urban rail systems. (See Table 4.)17
Today, political, economic, and demographic changes inother parts of the world are opening a window of opportu-nity for residents of cities to dramatically reshape them.Under central planning, governments in Central and Eastern
15CITY LIMITS HOW MOTOR VEHICLES TAKE OVER CITIES14
Europe sponsored urban rail and bus systems, but ran theminefficiently. Today, this region is home to some 45 percentof the world’s light rail systems, but they are declining at thesame time that people have gained the freedom to buy cars,and car-biased policies are being adopted. In the first half ofthe 1990s, the number of passengers on public trams, buses,and subways fell 8.5 percent in the Czech Republic and 13percent in Slovakia. Between 1990 and 1996, a quarter ofHungarian towns lost their public transportation systems.18
Governments in Central and Eastern Europe are receiv-ing assistance from Western Europe to improve long-dis-tance transportation links between West and East, includingmajor highways. In much of the industrialized world, thepolitical coalitions that pushed for government road build-ing began to form more than a century ago. Like poorly runtransit systems in Western cities in the early part of the1900s, those in places like Poland and the Czech Republicare no match for cash-rich Western road builders and devel-opers, who are opening large shopping malls, or “hypermar-kets,” on the outskirts of towns. A developer from Long
Region Heavy Rail Light Rail
Western Europe 29 119Eastern Europe/Central Asia 15 166United States and Canada 17 33Latin America 11 6Japan 9 20Other Asia-Pacific 12 8Africa 1 6
Note: Subways, elevated railways, and metros are all heavy rail, operating onrights-of-way from which all other traffic is excluded. Light rail—streetcars,tramways, or trolley cars—runs along tracks at street level that may not be sepa-rated from other traffic for long stretches.
Source: See endnote 17.
TABLE 4
Number of Cities with Rail Systems in Operation, byWorld Region, 2000
17
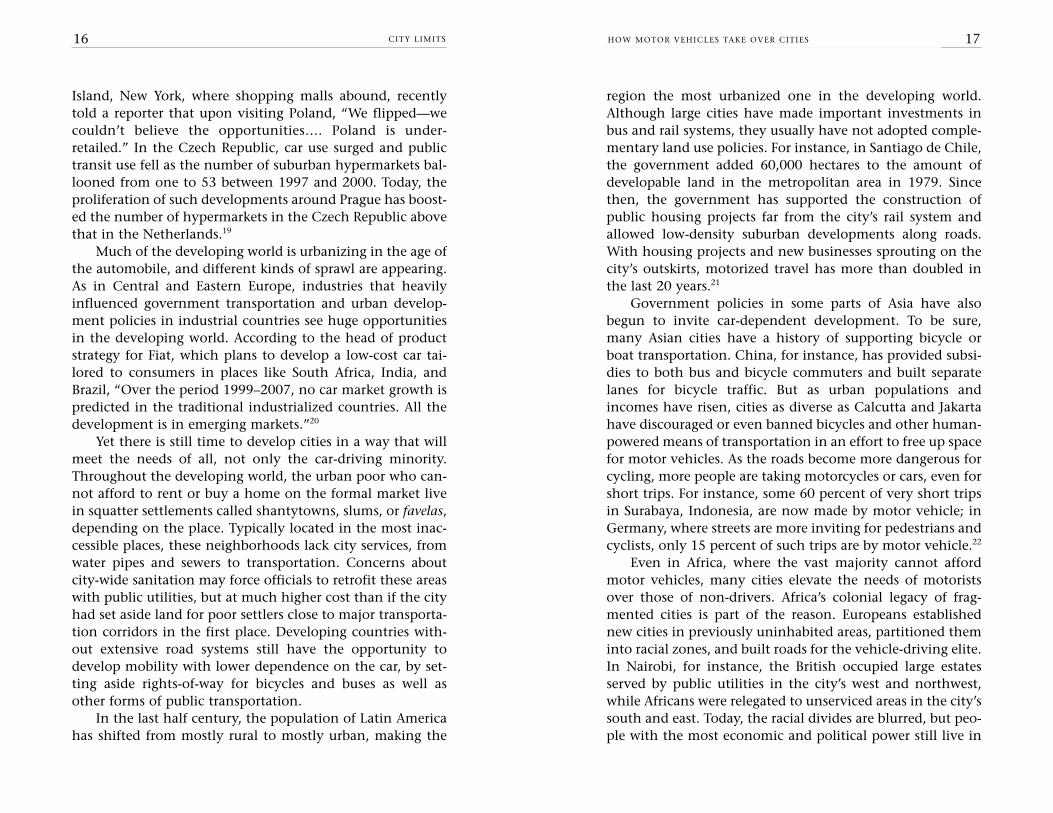
region the most urbanized one in the developing world.Although large cities have made important investments inbus and rail systems, they usually have not adopted comple-mentary land use policies. For instance, in Santiago de Chile,the government added 60,000 hectares to the amount ofdevelopable land in the metropolitan area in 1979. Sincethen, the government has supported the construction ofpublic housing projects far from the city’s rail system andallowed low-density suburban developments along roads.With housing projects and new businesses sprouting on thecity’s outskirts, motorized travel has more than doubled inthe last 20 years.21
Government policies in some parts of Asia have alsobegun to invite car-dependent development. To be sure,many Asian cities have a history of supporting bicycle orboat transportation. China, for instance, has provided subsi-dies to both bus and bicycle commuters and built separatelanes for bicycle traffic. But as urban populations andincomes have risen, cities as diverse as Calcutta and Jakartahave discouraged or even banned bicycles and other human-powered means of transportation in an effort to free up spacefor motor vehicles. As the roads become more dangerous forcycling, more people are taking motorcycles or cars, even forshort trips. For instance, some 60 percent of very short tripsin Surabaya, Indonesia, are now made by motor vehicle; inGermany, where streets are more inviting for pedestrians andcyclists, only 15 percent of such trips are by motor vehicle.22
Even in Africa, where the vast majority cannot affordmotor vehicles, many cities elevate the needs of motoristsover those of non-drivers. Africa’s colonial legacy of frag-mented cities is part of the reason. Europeans establishednew cities in previously uninhabited areas, partitioned theminto racial zones, and built roads for the vehicle-driving elite.In Nairobi, for instance, the British occupied large estatesserved by public utilities in the city’s west and northwest,while Africans were relegated to unserviced areas in the city’ssouth and east. Today, the racial divides are blurred, but peo-ple with the most economic and political power still live in
CITY LIMITS HOW MOTOR VEHICLES TAKE OVER CITIES16
Island, New York, where shopping malls abound, recentlytold a reporter that upon visiting Poland, “We flipped—wecouldn’t believe the opportunities…. Poland is under-retailed.” In the Czech Republic, car use surged and publictransit use fell as the number of suburban hypermarkets bal-looned from one to 53 between 1997 and 2000. Today, theproliferation of such developments around Prague has boost-ed the number of hypermarkets in the Czech Republic abovethat in the Netherlands.19
Much of the developing world is urbanizing in the age ofthe automobile, and different kinds of sprawl are appearing.As in Central and Eastern Europe, industries that heavilyinfluenced government transportation and urban develop-ment policies in industrial countries see huge opportunitiesin the developing world. According to the head of productstrategy for Fiat, which plans to develop a low-cost car tai-lored to consumers in places like South Africa, India, andBrazil, “Over the period 1999–2007, no car market growth ispredicted in the traditional industrialized countries. All thedevelopment is in emerging markets.”20
Yet there is still time to develop cities in a way that willmeet the needs of all, not only the car-driving minority.Throughout the developing world, the urban poor who can-not afford to rent or buy a home on the formal market livein squatter settlements called shantytowns, slums, or favelas,depending on the place. Typically located in the most inac-cessible places, these neighborhoods lack city services, fromwater pipes and sewers to transportation. Concerns aboutcity-wide sanitation may force officials to retrofit these areaswith public utilities, but at much higher cost than if the cityhad set aside land for poor settlers close to major transporta-tion corridors in the first place. Developing countries with-out extensive road systems still have the opportunity todevelop mobility with lower dependence on the car, by set-ting aside rights-of-way for bicycles and buses as well asother forms of public transportation.
In the last half century, the population of Latin Americahas shifted from mostly rural to mostly urban, making the

third of Americans do not have driver’s licenses. Childrenmust rely on their parents to drive them most places, so theylose opportunities to develop the kind of independence (notto mention muscles) enjoyed by children using bikes, publictransportation, and their own two feet. Only 10 percent ofU.S. children aged 5–15 walk to school, a likely factor in bur-geoning child obesity. Women bear a disproportionate shareof the burden for ferrying children and elderly relativesimmobilized by car-based transportation systems to medicalappointments, for example. Even though some 60 percent ofU.S. women work outside the home, women also make twothirds of the trips to take another person someplace.25
Sprawling cities also sharpen existing social divides, byallowing people with resources to put more space betweenthemselves and others. Residents of suburban counties in the United States may enjoy the benefits of the entire met-ropolitan region, but strive to keep poor people out of theircommunity by spurning links to region-wide public trans-portation and passing “snob zoning” laws that forbid thetype of housing that lower-, even middle-income, peoplecould afford. In Atlanta, although roughly 2,580 kilometers(1,600 miles) of rail and bus lines carry half a million peopleeach weekday, these lines do not extend into three of the fivecounties in which the region’s employment is concentrated.“It was planned that way,” said Professor Robert Bullard, co-author of Just Transportation. “In the mid-1960s, a couple ofcounties basically said they didn’t want public transit com-ing into their area because it would bring black people.”Although Atlanta’s suburbs are more racially integratedtoday, they remain segregated by income.26
In the United States, a downward spiral has taken hold inmost sprawling metropolitan areas, where the rich and thepoor live in separate municipalities, each with its own localgovernment and budget. As people have moved to suburbanareas that often exclude low-income people, inner cities havebeen left with a large population of people in poverty. Thesecentral city governments thus have shrinking tax revenue toaddress expanding social problems, and their public services
the areas served by public utilities and travel by car.Decisionmakers thus equate transportation improvementswith widening roads for more motor vehicles. But remark-ably simple innovations such as separate lanes and cross-walks for pedestrians would benefit more people.23
The Costs of Sprawl
As government policies have fostered sprawling cities,some problems with car-dependent development have
become clear. Cities prosper when they can take advantageof their concentration of human talent and energy.Sprawling cities diminish that potential by segregating anddispersing people. Car-dependent development consumesland and other resources, degrading watersheds and air inthe process. And car-centric cities harm economic productiv-ity by increasing social inequities, wasting resources, anddamaging the environment.
People who live in the world’s most sprawling citiesoften need motor vehicles to participate in society in themost elementary ways: working, shopping, going to school,getting medical care. Reviewing a 1995 survey of personaltransportation, the U.S. Department of Transportation foundthat “Americans’ love affair with our cars may actually be amarriage of convenience. Contemporary land use patternsrequire the use of private vehicles, whether or not we lovethose vehicles.” Half of the households in urban areas of theUnited States in 1990 were not within walking distance of apublic transportation route. When cars are essential, beingable to drive is akin to citizenship. In one survey in England,young adults were asked to choose between the right to votein an election and the right to obtain a driving license. Some72 percent chose the license.24
A lack of transportation options also creates age andgender inequities. Although car travel is the only viablemeans of transportation in many U.S. cities, roughly one
19CITY LIMITS THE COSTS OF SPRAWL18

21THE COSTS OF SPRAWL
highest levels of traffic delay per person of 68 U.S. cities sur-veyed. This study calculates that the 4.5 billion hours ofextra travel time and 6.8 billion gallons of fuel burned intraffic delays cost these 68 cities $78 billion in 1999 alone.Transportation researcher Walter Hook has found that citiessuch as Bangkok and Jakarta, which are less densely popu-lated than Paris, Moscow, or Shanghai, suffer worse trafficdelays because they have neither effective public transit sys-tems nor adequate facilities for bicyclists and pedestrians.29
The time people spend in vehicles istime lost not only to work but also toactivities that benefit personal or com-munity health, although these lossesare harder to quantify in economicterms. In the United States, publichealth researchers find that the share ofthe population that is overweight hasgrown in recent decades, as people’slives have become more sedentary andalternatives to driving have beenreduced. Marion Nestle, a New YorkUniversity professor of nutrition, andMichael Jacobson of the Center for Science in the PublicInterest argue that changes in transportation and urbandevelopment are needed to halt the obesity epidemic.30
In his book Bowling Alone, Robert Putnam documentsdiminished civic engagement in U.S. society over the pastseveral decades—and finds that urban sprawl is one likelyculprit. Participation in presidential elections fell by roughlya quarter between 1960 and 1996, and the number of Ropersurvey respondents who said they had attended a publicmeeting on town or school affairs declined by 35 percentbetween 1974 and 1998. This disengagement occurred asmetropolitan areas sprawled and the share of those drivingalone to work grew from 60 percent in 1960 to 91 percent in1995. To link these trends, Putnam cites a recent survey thatfinds less political involvement in homogeneous suburbs,older research showing greater public participation in less
CITY LIMITS20
suffer. As a result, the central neighborhoods become less desir-able places to live, especially for those seeking schools. MyronOrfield notes that as total school enrollment in Minnesota’sTwin Cities metropolitan area fell by 81,000 between 1970 and1990, the central cities and inner suburbs closed 132 schools,while outer suburbs opened 50 new schools.27
When the rich succeed in isolating themselves from thepoor, concentrated poverty may well drag down the econom-ic health of the entire region. Increasingly, metropolitan areasare heralded as the basic units of the global economy.Research in the United States suggests that within these units,the fortunes of one municipality are linked to the fate of theentire metropolis. David Rusk compared U.S. cities that great-ly expanded their jurisdictions to include suburban areasbetween 1960 and 1990 to cities whose boundaries remainedfairly constant while competing suburbs grew up aroundthem. Central cities that incorporated more suburban areasaveraged an “AA” bond rating, whereas cities in the most frag-mented metropolitan regions averaged only an “A” rating.Exploring the interdependence of municipalities in 74 U.S.metropolitan areas, another team of researchers concluded intheir book Regions That Work that inequality between munic-ipalities appears to dampen growth throughout the area: “Justlike having the nicest house in an increasingly distressedneighborhood provides only a relative shield against declin-ing property values, residing in the best gated communitywithin a fragmented and increasingly impoverished regiononly hides the signs of potential and actual collapse.”28
Car-dependent cities are more likely to trap people of allincome levels in traffic, wasting everyone’s time and money.Forty years ago, urban critic Lewis Mumford wrote, “What aneffective network requires is the largest number of alterna-tive modes of transportation, at varying speeds and volumes,for different functions and purposes…. By pushing all formsof traffic onto high speed motor ways, we burden them witha load guaranteed to slow down peak traffic to a crawl.”Today, the Texas Transportation Institute finds that LosAngeles and Atlanta, both car-centric cities, have the two
Car-dependentcities are morelikely to trappeople of allincome levels intraffic, wastingeveryone’s time and money.

23THE COSTS OF SPRAWL22 CITY LIMITS
move vehicles more quickly into areas of low populationdensity. What they neglect to add is that this “solution” sim-ply extends the problem farther and that better roads invitemore cars. Regions in the United States that have built newroads have fared no better at easing congestion and relatedair pollution than those that have not. As Michael Replogle,a transportation specialist at the U.S.-based advocacy groupEnvironmental Defense, points out, “Adding highway capac-ity to solve traffic congestion is like buying larger pants todeal with your weight problem.”34
Although a greater share of the population uses vehiclesin wealthy cities, vehicles tend to be more polluting in urbancenters of the developing world, where two- and three-wheeled vehicles prevail. Most of these are motor scootersand carts powered by simple but dirty “two-stroke” engines,in which much of the fuel goes unburned and is releasedwith the exhaust. A World Bank report suggests that vehicleswith such engines emit more than 10 times the amount offine particulate matter per vehicle-kilometer as a car andonly slightly less than a diesel truck.35
Toxic ingredients in motorcycle and car fumes cause ill-ness, particularly among children, whose developing lungsare especially vulnerable, and among the elderly. Sulfur diox-ide and particulates remain above safe levels in a number ofmajor cities. Alone or in combination, these pollutants gen-erate coughing and lung damage and aggravate existing respiratory problems such as asthma, which is on the rise.Daily particulate levels closely track hospital admissions anddeath rates.36
Vehicles also spew nitrogen oxides, hydrocarbons, car-bon monoxide, and sometimes lead. In sunlight, nitrogenoxides and hydrocarbons react to form ozone, the mainingredient in smog, which harms human health. Wind pat-terns and terrain conspire to trap dirty air above sprawlingcities like Santiago, which exceeded the hourly health stan-dard for ozone 404 times in 1995, or Atlanta, which for sev-eral years has failed to meet national clean air requirements.37
Lives are lost not only to illnesses from vehicular pollu-
fragmented metropolises, and “time diary” studies thatreveal how people spend their time. “American adults aver-age seventy-two minutes every day behind the wheel,”Putnam writes, “more than twice as much as the average par-ent spends with the kids.”31
In addition to eating up more human time and motorfuel, car-centric cities require greater expenditures on trans-portation and other infrastructure—expenses that chip awayat a region’s economic potential. While the up-front cost ofrail is high, cities with effective urban transit spend less ontransportation over the long run. Researchers at Australia’sInstitute for Sustainability and Technology Policy (ISTP), ledby Peter Newman and Jeffrey Kenworthy, found that auto-dependent Australian and U.S. cities spend 12–13 percent oftheir per capita wealth on passenger transport, whereas rail-filled cities in Europe and Asia spend considerably less (8 per-cent in the European cities and 5 percent in Tokyo, HongKong, and Singapore). Robert Cervero, a professor of plan-ning at Berkeley, surveyed 47 U.S. cities to conclude thatgood accessibility between jobs and housing, and well-func-tioning transportation systems were key indicators of eco-nomic health.32
A number of studies in the United States have quantifiedthe extra infrastructure costs required by unfocused develop-ment. Using data from these analyses, Robert Burchell foundthat if 25 million units of new housing in the United Stateswere to be accommodated between 2000 and 2025 in a morespace-efficient way, the nation would preserve more than 1.2million hectares (3 million acres) of land, require 3,000 fewernew miles of state roads, and need 4.7 million fewer waterand sewer “laterals.” The result would be a savings of $250billion, 75 percent in housing and development savings todevelopers and new property buyers.33
Sprawling cities also damage the environment in manyways, harming human health and ultimately affecting theeconomy. Slow-moving traffic in a built-up area dirties theair that many people breathe—so traffic engineers have apoint when they advocate the old solution: widen roads to

tion but also to traffic accidents. Researchers estimate thatnearly a million people, mostly pedestrians, are killed on theworld’s roads each year. In comparing global cities,Australian researchers Newman and Kenworthy found thatcar-dependent cities lost proportionally more people to traf-fic deaths. Despite having greater measures to promote traf-fic safety, cities in the United States, where more peopledrive, had more traffic fatalities per capita than cities indeveloping nations in Asia.38
Not surprisingly, evidence from the United States sug-gests that cars are most likely to kill pedestrians in cities thatcater primarily to motor vehicle traffic and lack sidewalksand crosswalks. In Atlanta, for instance, a rambling citywhere fewer than 1.5 percent of people walk to work, 185pedestrians were killed in 1997 and 1998, making it one ofthe most dangerous U.S. cities to walk in.39
Again, the elderly and children are particularly at risk.People over 65 constitute 12 percent of the U.S. populationbut account for 22 percent of pedestrian deaths and 18 per-cent of driver deaths. Age may impair the vision and reflex-es needed to drive, but car-dependent communities offerolder people few alternatives to driving. As an 80-year-oldLos Angeles resident recently told a reporter: “I have to havemy car. I need it to get to the hospital, or see my family, ortake my wife to a nice dinner. It’s not a luxury. It’s a big partof my life.”40
While improvements in vehicles and fuel have helpedreduce air pollution in industrial nations in the last threedecades, most vehicles continue to emit carbon dioxide, a“greenhouse gas” that warms the planet’s atmosphere.Worldwide, the share of carbon dioxide emissions fromtransportation climbed from 17 percent in 1971 to 23 per-cent in 1997 (see Figure 1), jacked up mainly by road traffic.Motor vehicles accounted for 58 percent of worldwide trans-portation carbon emissions in 1990, but their contributiongrew to 73 percent by 1997.41
By paving over land for roads and parking lots, citiesincrease water problems. Much land in car-dependent cities is
25THE COSTS OF SPRAWL24 CITY LIMITS
lost to pavement, for each car needs as much road as 4–8 bicy-cles, and as much parking space as 20 bicycles. Water qualityand quantity both suffer in proportion to the amount ofpavement that covers a watershed. Suburban development inAtlanta has impaired the health of the Chattahoochee River,which Atlanta uses as a drinking water source. Overloadedsewer systems have spewed raw sewage into the river, killingfish and making the water temporarily unsafe for swimmingor fishing. Sprawling cities increase the risk of floods. Insteadof seeping into the ground as it normally would, rain runs offroads and pavement into channels, where it speeds into riversand streams, causing more severe floods than it would ifplants and soil soaked up some of the deluge.42
Many researchers have tried to quantify the price thatsociety pays for car-dependent transportation systems.Estimates differ because there is no single method for deter-
1971 1975 1980 1985 1990 1994 19970
5,000
10,000
15,000
20,000
25,000Billion Tons
Source: See endnote 41
16.9% 17.7% 17.8% 18.3% 19.3% 19.9% 22.7%
Other CO2
Transport CO2
25
20
15
10
5
World CO2 Emissions, Total and Transport Sector,1971–97
FIGURE 1

27THREE CITIES THAT CHOSE LIVABILITY OVER SPRAWL26 CITY LIMITS
Strøget, to cars in 1962. Storeowners found that the greaternumber of pedestrians on the street stimulated business.Over the next 11 years, adjacent streets were turned over topedestrians. Then the focus turned to reclaiming publicsquares and harborsides from parked cars, and the number of parking spaces in the heart of the city was reduced byroughly 2–3 percent per year, cutting some 600 spacesbetween 1986 and 1996.44
The city also enhanced public transportation, aided byan enduring vision—the “Finger Plan.” The plan, initiated in1947, was for the urban region to develop along rail corridorsextending toward smaller population centers. Copenhagen’scentral city was the “palm,” while urban development alongthe five rail corridors constituted the “fingers.” Green spacebetween the fingers kept the image of a hand from turninginto a paw.45
In addition to maintaining these rail “fingers,” officialsmade walking and bicycling safer and easier, replacing curb-side parking with bicycle lanes and expanding the networkof bicycle lanes from 180 km in 1950 to 293 km in 1995. By1996, the city center had six times as much space devoted topedestrians. Bicycling to and from the city center increasedby some 65 percent between 1970 and 1996.46
In recent years, Copenhagen has built on these successes.For instance, along with other Danish cities, it has adopted a“safe routes to school” program that ensures that studentshave a network of safe walking and cycling paths. And to fur-ther promote transit- and cycle-friendly development, arecent government directive states that new developmentshould occur within one kilometer of a transit station.47
Copenhagen’s changes in the past few decades havemade it far less dependent on motor vehicles. Even thoughthe road network is bigger now than it was in 1970, the totalnumber of kilometers driven by motor vehicles is 10 percentbelow the figure then. A survey of major industrial countriesbetween 1973 and 1992 found that Denmark was the onlyone in which a shift from cars toward buses and rail led to aclear reduction in travel energy use and emissions. In the
mining which costs to include and how to derive them.Nevertheless, numerous U.S. studies have found thatmotorists incur huge costs not covered by fuel taxes, vehicletaxes, or fees for road use. For example, Clifford Cobb foundthat the cost of driving-related air and water pollution, noise,and accidents—at $125 billion—was nearly three timesgreater than the $42 billion paid by drivers. A survey in theUnited Kingdom found that the costs of air emissions, noise,congestion, road damage, and accidents outweighed the taxespaid by drivers by three to one. Various researchers have esti-mated the costs of road transport not covered by drivers to bearound 5 percent of GDP in industrial countries, and evenhigher in some developing-country cities, such as Santiago.43
Three Cities That Chose Livability Over Sprawl
Over the past several decades, political leaders and com-munity activists in different parts of the world have put
the brakes on car-centered urban development. Three suchplaces are Copenhagen, Portland, and Curitiba, where polit-ical leaders have made difficult, even controversial, choicesto give precedence to pedestrians and cyclists, steer newdevelopment to locations easily reached by public trans-portation, and maintain population densities that make pub-lic transportation and cycling possible. These decisions havehelped to revitalize central city locations, improve environ-mental health, and make streets safer for children.
In the 1960s, just as cars were taking over the city, andpublic squares were being commandeered as parking lots,Copenhagen made some crucial choices. Rather than widen-ing the roads to ease congestion, officials proposed closingstreets to cars to improve conditions for pedestrians. Manypeople protested that Scandinavia was too cold for people tolinger outside, arguing “We are Danes, not Italians!” After alengthy debate, the city closed the main shopping street, the

2928 CITY LIMITS THREE CITIES THAT CHOSE LIVABILITY OVER SPRAWL
Over the years, the city government has taken steps topromote alternatives to driving. Both building and trans-portation policies aim to make streets welcoming to pedes-trians and cyclists. To avoid expanses of alienating blankwalls, the city required ground-floor windows in new build-ings, and public art to account for 1 percent of the budget ofnew public buildings. The city’s transportation departmentand police department have teamed up in a “traffic-calming”program to deter speeding on city streets, especially thosenear schools. The city now has 240 kilometers of bikeways,and requires bicycle parking to accompany new construc-tion. When a highway was proposed in 1975 as a link to theeastern suburbs, Portland opted instead for a light rail systemcalled MAX (Metropolitan Area Express).52
Active citizens have influenced these decisions. When ahighway bypass was proposed to cut through farmland tothe west of Portland, two citizens’ groups, 1000 Friends ofOregon and Sensible Transportation Options for People,pointed out that computer models of traffic prediction didnot take into account the benefits of walkable and bikeableneighborhoods. Updating the software, these advocatesshowed that over 20 years, development geared toward tran-sit, pedestrians, and cyclists would result in 18 percent lesshighway congestion than building a new bypass.53
The Portland area is now trying to apply the lessonslearned in revitalizing its downtown to revamping its sub-urbs, which were built with office parks separated from hous-ing developments by wide motorways. The Portland region’slatest plan is to channel the bulk of future growth to nineregional centers that are to be interconnected by light rail. Upto 85 percent of new development is to take place no fartherthan a five-minute walk from a transit stop. The first segmentof the light rail network, opened in 1990, runs east fromdowntown Portland; the second line, opened in 1998, tracesthe city’s western corridor. Without the west-side rail link,planners estimate that they would have needed eight newparking garages and two extra lanes on major highways.54
Portland’s regional government, Metro, consulted exten-
words of one city official, the heart of Copenhagen changed“from a car-oriented to a people-oriented” place.48
As a result, Copenhagen is a safe, healthy, and enjoyableplace for people to live, work, and relax. Cities in the UnitedKingdom are now trying to emulate the Danish safe routes toschool initiative. After a student exchange trip, a 14-year-oldBritish boy remarked: “It was amazing how independent thechildren were in Denmark, compared to Britain. They couldcycle to their basketball training, and to parties, rather thanhaving to get taken by their parents.”49
While people in Copenhagen were mobilizing to pre-serve the character of their city in the 1960s, residents of theU.S. state of Oregon were becoming concerned about theeffect of suburbanization. New houses and businesses werepopping up farther from downtown Portland, which was los-ing vitality as people moved to new opportunities in the sub-urbs. Nature lovers, attracted to Western Oregon by its lushgreenery and woodland, and farmers whose livelihooddepended on the region’s rich soils, formed a coalition toprotect Oregon’s forests and farms from urban sprawl. In1973, the state legislature passed a law requiring all metro-politan areas to create growth boundaries beyond which newurban development would not occur. The boundary for thegreater Portland area, eventually decided on in 1980, encom-passed the city of Portland and 23 neighboring towns inthree counties.50
While the boundary was intended to protect the rurallandscape, it ended up making Portlanders more aware of theurban streetscape. Under the leadership of Mayor NeilGoldschmidt, Portland began to take space from cars andgive it to people. The city tore down a six-lane riverfrontexpressway and replaced it with a park for cyclists and walk-ers, and transformed a large downtown parking lot into apedestrian plaza, Pioneer Courthouse Square, in the heart ofthe shopping district. Even as Portland became more con-sciously urban, city officials maintained a link to nature byenforcing municipal regulations to protect “view corridors”of Mount Hood, 50 miles to the east.51

3130 CITY LIMITS THREE CITIES THAT CHOSE LIVABILITY OVER SPRAWL
car and a pickup truck, parked throughout the city. Memberspay a $100 annual fee, reserve the car they want, walk or biketo pick it up, and receive a monthly bill for the hours usedand miles driven. Steve Gutman, a participant, reports thathe and his wife “share 18 vehicles with 282 people—that’s6.4 percent of one car for each of us.” The Gutmans end updriving about 160 kilometers (100 miles) by car each month,much less than the typical American, and pay only $60 fortransportation, a fraction of the $480 a month it costs toown and operate a relatively new car. And, says Gutman, “onany given day we have, within 10 blocks of our home, ourchoice of four different cars!”58
As in other desirable places, increased demand for hous-ing in Portland has pushed prices up. But, contrary to critics’assertions, Portland’s regional planning has likely eased thepressure. Elsewhere, suburbs put an upper limit on the num-ber of houses per acre, effectively mandating expensivehomes on large lots. Portland’s Metro sets a lower limit on thenumber of houses and requires a mix of housing types tomake housing affordable and keep a 20-year supply of build-able land within the region’s boundary. Still, the target densi-ty of Portland’s latest plan is less than 15 people per hectare,slightly less dense than smaller Ashland, Oregon, and farfrom Manhattan’s 193 people per hectare. Between 1985 and1995, lot prices increased on average 2.85 percent per year inPortland, but rose even faster in some booming places, suchas Phoenix or San Diego, that lacked regional boundaries.59
Between the 1980s and 1990s, according to researcherArthur Nelson, metropolitan Portland and Atlanta have seencomparable growth in population, but Portland has benefit-ed from slower growth in vehicle traffic, reduced commutingtime, cuts in air pollution and fuel use, and an increase inneighborhood quality. Moreover, both job growth andincome growth were higher in Portland. (See Table 5.)60
Another city that opted to invest in quality public spaceand public transportation in the 1970s is Curitiba, Brazil.Like Portland, Curitiba started as a New World frontier town.By 1972, it was reeling from a population surge in the 1950s
sively with residents in formulating its latest plans. Forexample, Metro commissioned a survey in the early 1990sthat asked citizens for their reactions to pictures of differenttypes of streets. Most suburbanites surveyed actually did notfavor the pictures of typical suburbia: wide expressways withlarge shopping mall blocks on either side, marooned in anasphalt sea of parking spaces, and curving residential streetsfronted by two-car garages. The highest-rated residentialscene was in fact a picture of a tree-lined urban street inToronto, with 30 to 40 dwelling units per acre. Based onthese sorts of surveys, Metro developed four scenarios forgrowth to show how the region might accommodate antici-pated population increase, held 182 public meetings withcitizens, made a video available through video rental stores,and sent all residents a questionnaire with maps of the dif-ferent scenarios.55
Initial surveys uncovered double standards. For instance:“I don’t like sprawl, but I don’t want my neighborhood tochange,” or “I like transit, but I mostly drive my car.” Sub-sequent questionnaires explicitly offered a set of trade-offs.Faced with the choice: “Should investments be made in high-ways or transit,” only 14 percent preferred investing in roads.Only 13 percent thought that growth should occur in newareas instead of existing neighborhoods. The resulting planemployed a host of transportation and land use policies, butthe vision, according to Metro’s chairman Mike Burton, couldstill be summed up in just two sentences: “Everyone canalways see Mount Hood. Every child can walk to a library.”56
Although the suburbs within Portland’s growth bound-ary still rely heavily on automobiles, the region’s investmentin transportation choices is already paying dividends.Compared to a number of more sprawling cities in the south-ern and western United States, Portland’s streets are safer forchildren and pedestrians of all ages.57
The growing variety of transportation choices has made“car sharing” possible. Membership-based hourly car rentalservices took root in Europe in the 1980s. Portland’s programboasts a fleet of rental cars, including a hybrid-electric sports

3332 CITY LIMITS THREE CITIES THAT CHOSE LIVABILITY OVER SPRAWL
The city proceeded to manage traffic by improving pub-lic transportation, designating several main roadways radiat-ing from the city center as axes for busways. (See Figure 2.)Zoning laws encouraged high-density buildings along thesethoroughfares. Transfer stations allowed commuters on thefringes of town to switch from smaller, local buses to theexpress buses on the main routes.63
Lerner aimed not only to improve traffic but also tosecure housing locations for poor families. Before the build-ings along the transportation corridors were fully developed,the city bought up strategic land and set it aside for affordablehousing. “These small-scale developments blend into the sur-rounding residential areas,” writes urban analyst JonasRabinovitch. “They integrate rather than isolate low-incomehouseholds into the economy and culture of the larger city.”64
With the streets reconfigured, the city revamped the bussystem with a series of innovations that are now worldfamous. Dedicated busways, extra-large buses for high-densi-ty routes, and tube-shaped shelters where passengers pay theirfare in advance are adaptations from rail systems that addspeed and comfort for relatively little money. In fact, the bussystem cost less than one third of 1 percent of what a subwaywould have cost. And much of the cost has been borne by pri-vate bus companies. The city has paid only for the roads,lighting, bus stops, and staff to monitor the companies. Bythe mid-1990s, although Curitiba had one car for every threepeople, two thirds of all trips in the city were made by bus.65
Looking ahead, Curitiba not only steered growth towardthe areas around transit lines, but also guided it away fromenvironmentally sensitive areas. Stretches of land alongrivers were put off limits to builders and made into parks, apractical option that also eliminated potential economic lossfrom flood damage to buildings. These re-zonings, togetherwith other efforts to protect natural areas and build parks,increased the area of green space per person 100-fold over20 years.66
The city took a host of other steps to make streets saferand easier for pedestrians and cyclists to use. What began
and ’60s that, combined with escalating automobile owner-ship, had brought daunting traffic problems. Under Brazil’smilitary dictatorship, foreign capital was flowing to largeinfrastructure projects such as highways and the hastyassembly of Brasilia, a dazzlingly modern new capital of sky-scrapers and wide motorways that was widely touted as thecity of the future. In line with then-prevalent thinking, anew overpass was expected to ease the Curitibans’ trafficwoes. But the city’s new mayor, Jaime Lerner, an architect,believed that greater use of public transportation could easetraffic while maintaining the character of Curitiba’s streets.61
Lerner pointed out that the overpass would obliterate thecity’s historic main street. And on the eve before demolitionwas to begin, he took a highly controversial step to halt theproject, organizing engineers to block off the street to carsand create a pedestrian mall. Bulldozer operators showed upthe next morning to find the street they were supposed totear up lined with flowerpots and occupied by childrenpainting murals.62
Indicator Portland, Oregon Atlanta, Georgia(percent change)
Population growth +26 +32Job growth +43 +37Income +72 +60Property tax –29 +22Vehicle miles traveled + 2 +17Single occupant vehicle –13 +15Commute time – 9 + 1Air pollution (ozone) –86 + 5Energy consumption – 8 + 11Neighborhood quality +19 – 11
Source: See endnote 60.
TABLE 5
Changes in Portland and Atlanta Regions from mid-1980s to mid-1990s

1990s, “Curitiba is among the world’s greatest cities,” he foundthat many shared his view: “99 percent of Curitibans told poll-sters that they were happy with their town; and 70 percent ofPaulistas, residents of the mobbed megalopolis to the north,said they thought life would be better in Curitiba.”69
The road taken by Brasilia shows what might have hap-pened to Curitiba. The national government planned forBrasilia to have lower-density development that makes publictransportation inefficient, and required residential, commer-cial, and industrial facilities to be separated from each other. Asa result, notes an analyst for the Inter-American DevelopmentBank, “car travel is required for even the simplest of needs” inBrasilia. Curitiba, on the other hand, by promoting develop-ment—including low-income housing—along public trans-portation routes and allowing residences to be located nearstores, created a city in which people do not need to drive.70
The three cities described are by no means utopias.Outlying areas within greater Copenhagen are not as accom-modating to the pedestrian or bicyclist as the center city is.Within its urban growth boundary, Portland has car-depen-dent suburbs and is feeling the housing demand that comeswith success. Curitiba must wrestle with the problem ofsquatter settlements on the outskirts of town. Nonetheless,as a result of decisions to give precedence to public trans-portation and public space, these cities have fared betterthan others in many respects. Public transportation ridershiphas increased faster than population growth, children havebetter access to places they need to go, and the air is cleaner.What is more, their economies are thriving.
Linking Transportation and Land UsePolicies
The stories of Copenhagen, Portland, and Curitiba illus-trate how linking transportation and land use can
enhance the social and economic vitality of cities. And they
3534 CITY LIMITS
with the pedestrianization of the historic main street led to some 650 downtown blocks being set aside as pedestrianthoroughfares. These streets connect to bus stations andparks, which in turn connect to a 150-kilometer network ofbicycle paths.67
As in Copenhagen and Portland, Curitiba’s transporta-tion reforms were part of broader efforts to revitalize the cen-tral city, preserve the environment, and respond to the needsof citizens, particularly children. In Curitiba, the city madethe needs of children central, funding municipal day-carecenters and engaging street children in city projects such asurban gardening.68
When New Yorker writer Bill McKibben wrote in the early
LINKING TRANSPORTATION AND LAND USE POLICIES
The Bus System in Curitiba, Brazil FIGURE 2
bus line
transfer station
bus terminal
direct bus line
K E Y
Source: See endnote 63.
Development is kept close to bus lines,to make walking and cycling practical.

36 CITY LIMITS
offer several important lessons. In many places, however,disconnected transportation investments and land use poli-cies have spurred car-dependent development that has nar-rowed people’s transportation choices, and created a cascadeof harmful effects that were usually unforeseen.
By siting highway interchanges in a certain place, trans-portation planners virtually ensure that car-dependenturban development will sprout there. In the United States,this truth was not realized until after concerted highwaybuilding was under way. As head of the U.S. Bureau of PublicRoads in the 1920s and the force behind the industry-sup-ported Highway Education Board, Thomas HarrisMacDonald spearheaded the coalition of car makers, roadbuilders, tire manufacturers, and oil companies that wouldpush Congress for a system of government-funded high-ways. Later, foreseeing the problems created by car-centeredcities, MacDonald told the American Association of StateHighway Officials in 1947 that they should work to end “thepreferential use of private automobiles” and “promote thepatronage of mass transit.” He warned that “unless thisreversal can be accomplished . . . the traffic problems of thelarger cities may become well nigh insoluble.”71
The transportation engineers who sited U.S. highwaysoften made their decisions in isolation from the planners whozoned land as residential, agricultural, or rural and decided onsuch matters as the height of buildings and width of side-walks. The planners themselves did not anticipate the powerof the roads to transform their plans. But when engineers ranhighways through cities and placed intersections nearby onland zoned for “agriculture,” they ensured that pressurewould build for that land to be rezoned for urban uses.72
This story continues to be played out in different formsaround the world today. In Israel, for instance, when universi-ty professor Yaakov Garb raised concerns about the Trans-Israelhighway pushing Tel Aviv to sprawl eastward, he remembersbeing told: “Look, we have a strong planning system. If plan-ners want there to be development around the highway, thenthey will zone in development, and if they don’t, then they
LINKING TRANSPORTATION AND LAND USE POLICIES 37
won’t.” He and a colleague conducted interviews that revealedotherwise. Planners expected to be able to preserve the landaround the highway for a green corridor. But a prominentdeveloper noted, “Developers see the road as a tremendousasset, an autobahn, with potential at every entry or exit to theroad. And they will do everything to realize this potential.”73
To give people better transportation choices, govern-ments could revise zoning laws to allow homes and stores tobe intermixed, and steer new development toward places eas-ily accessible by public transit. They could also provide safeand attractive streets for pedestrians and bicycles, while mak-ing sure that connections between cycling, rail, bus, and otherforms of transportation, including paratransit, are convenient.
A common theme in the stories of Copenhagen,Portland, and Curitiba is that of people reclaiming streetsand making them safer for children to walk and cycle toschool. Yet sidewalks and crosswalks, a minimum require-ment, are often ignored when government officials are mak-ing investment decisions. Lloyd Wright, who works on LatinAmerican transportation projects at the U.S. Agency forInternational Development, says, “Very often you’re inmeetings where municipalities are talking about a $120 mil-lion highway interchange, and that goes through withoutthe blink of an eye. But when we talk about a $5,000 pedes-trian crossing, it’s like the funds aren’t there.”74
Cities can actively promote walking and cycling by invest-ing in bike paths and racks, slowing cars, and making streetsphysically appealing. Studies of Amsterdam, Bogotá,Morogoro (Tanzania), and Delhi found that these types ofsmall investments could yield great benefits in accessibility, airquality, and traffic safety. The rewards of traffic taming havebeen demonstrated in the Netherlands, where a professor con-ceived of a street called a woonerf, or “living yard,” in 1963.Trees and flowers, planted strategically alongside and withinthe street, and speed bumps to slow cars would make thewoonerf more inviting than a typical street. After a number ofcities tried this idea and met with success, the Dutch govern-ment adopted it nationwide. The concept spread to Germany

3938 CITY LIMITS LINKING TRANSPORTATION AND LAND USE POLICIES
To avoid a similar result, Bogotá initiated a program thatby 2015 will develop the city’s bus service and build a sub-way and bicycle paths so that people can manage to restricttheir private car use for three hours in the morning and threehours in the afternoon. Bogotá is densely populated enoughfor public transportation and cycling to work. Between 1998and 2001, Peñalosa’s administration extended the city’s bicy-cle path network to nearly 200 km and launched a dedicat-ed busway system. Previously, thousands of bus owners pliedthe streets with old, polluting buses. As in Curitiba, the cityof Bogotá commissioned a fleet of cleaner, more efficientbuses, and invited bus operators to bid on them. The citymanages the system, while the owners of the buses make aprofit on their investment. Bogotá’s bus system has theadded advantage of new technologies such as electronic tick-eting, which makes transferring between buses easier, andsatellite-based communications that boost safety by lettingbus drivers call for help when needed.79
One type of public transportation choice that is particu-larly well suited to spread-out metropolitan areas is para-transit. This category embraces a range of vehicles withflexible pick-up and delivery stops—from cycle rickshawsand pedicabs to taxis and shuttle buses. In the developingworld, these services employ people who need jobs and fillgaps left by regular transit routes, which rarely serve slums.The most popular type of service is a minibus or van thattravels a fixed route but stops whenever a passenger wants toget on or off: Nairobi’s matatus, Manila’s jeepneys, andBuenos Aires’ colectivos, for example. Despite the importantniche paratransit fills by meeting the needs of the poor, gov-ernments often try to restrict it to make room for growingcar fleets catering to the privileged.80
Wealthier cities are looking to computer-aided paratran-sit. Advances in electronic navigation, automated dispatch-ing, and communications are making it easier for a centralswitchboard and computer to electronically match driversand riders. Engineers have been applying these innovationsto make “dial-a-ride” taxi services more affordable and effi-
and Austria as the Wohnstrasse or “livable street” in the 1970s,and then to the United Kingdom as “home zones.”75
The most certain way to make streets safer for people andcyclists is to remove motor vehicles altogether, asCopenhagen, Portland, and Curitiba have done in someplaces. Many European cities ban private cars from centralareas. Munich and Vienna, for instance, boast popular com-mercial centers that restrict motor vehicle traffic to ambu-lances, delivery trucks, and cars owned by local residents. Anew residential neighborhood in Freiburg, Germany, banscars entirely; about half of the residents own cars, but theykeep them just outside the development. In fact, about 20car-free communities are in various stages of development inGermany. And since 1994, more than 70 European cities havejoined a Car Free Cities Network to exchange policy ideas.76
Enrique Peñalosa, elected in 1997 as mayor of Bogotá,Colombia, instituted a number of car-free policies. The first,pico y placa (“peak and plate”), takes 40 percent of privatevehicles off the roads during peak morning and afternoontravel times, based on the last number on the license plate.The program reduced round-trip commuting times by up toan hour, cut accidents by 28 percent, and reduced air pollu-tion by 10 percent. Then the city tried a bold car-free exper-iment in February 2000, banning private vehicles from 6:30a.m. to 7:30 p.m. on a Thursday. Newspapers reported clean-er air, no traffic injuries or deaths, and no interruptions inthe city’s usual weekday functioning. Afterwards, a city-widereferendum found that nearly 90 percent of the populationwanted to try it again.77
For a car ban to work, however, there must be other safeand speedy means of getting from one place to another, suchas public transportation or cycling networks. A well-knownexample of a policy failure is Mexico City’s “hoy no circulan”policy that banned use of certain cars on one day each week.Lacking viable transportation choices, many residents justbought an extra car—often an old, highly polluting one—tocircumvent the ban. Thus a policy aimed at reducing pollu-tion ended up worsening the problem.78

4140 CITY LIMITS LINKING TRANSPORTATION AND LAND USE POLICIES
employees and public services must be located in “A” sites.83
Connections to other transport networks are also crucialto making public transportation useful. One of the shortcom-ings of Bangkok’s new Skytrain, an elevated rail system thatopened in 1999, is that it lacks adequate parking for vehiclesand convenient connections to bus routes. In cities such asCopenhagen and Curitiba, connections between cycling andtransit make both these options more attractive. Bicycles areinconvenient for long trips and in bad weather, and buses andtrains are limited to fixed routes. Butbicycles and transit complement eachother when people are able to carrytheir bikes aboard buses or trains, or topark them at stations.84
Efforts to integrate transportationand development are gaining supportfrom architects promoting the “NewUrbanism,” which emphasizes theimportance of urban design andregional planning in creating streets and paths that pedestri-ans and cyclists will want to use. These architects have drawnup local development plans that reward developers for build-ing compact, walkable neighborhoods. A limitation of manyof the projects, however, is that they have not been builtaround existing public transportation networks, so that resi-dents have more attractive streets to walk on near their homebut still must use a car to go most places.85
Many people think communications technologies willmake land use planning less important, but even in the age ofthe Internet, when trips can be more easily replaced by “bits,”there is a need for walkable neighborhoods connected by pub-lic transportation. One reason is that these technologies bythemselves are not likely to reduce the total amount of trans-portation that occurs. Certainly, in some cases, communica-tion will replace transportation—a teleconference, forinstance, might eliminate the need for people to travel to ameeting site. But by connecting far-flung people, communi-cations technologies have historically created the demand for
cient, and even design a form of personal rail transportation.A team at the University of Bristol in the United Kingdomhas been developing a “personal rapid transit” system inwhich electrically powered four-person carriages run along aguideway. Passengers get on at any station, and their carriagestops only at their final destination. Local governments willneed to reform laws governing bus and taxi routes in order toallow these new forms of public transportation to take root.81
The success of any type of public transportation network,from cycling to personal rapid transit, depends on having aminimum number of people within a certain area. Buses ortrains only benefit the environment and the economy whenlots of people use them. Researchers at Australia’s ISTP haveidentified a critical threshold of 30 people per hectare belowwhich public transit is not viable. The U.S. cities they havestudied have, on average, 14 people per hectare, whereas theEuropean cities have 50. A city need not be as crowded asHong Kong’s 300 people per hectare to support effectiveurban transit; for instance, Stockholm’s transit systems workwell with only 53 people per hectare. Recognizing that thesuccess of public transportation depends on population den-sity, places like Copenhagen and Portland are requiring newdevelopment to take place within a minimum distance fromexisting public transportation networks.82
The Netherlands has enshrined the principle of linkingtransportation and land use planning in its national policies.For instance, a 1990 national transport structure plan advo-cates urban planning as a way to solve transportation prob-lems, noting that the government “favours compact ratherthan sprawling cities.” The policy distinguishes accessibility,to be improved through better urban planning, from mobil-ity—which should be constrained to reduce environmentaldamage. A national “ABC” policy ranks potential develop-ment sites, from the most accessible “A” locations in the“Randstad” ring of cities (including Amsterdam, Rotterdam,and Utrecht), which are well served by public transportationand bicycle paths, to relatively remote “C” locations reachedonly by automobile. Companies with a large number of
Buses or trainsonly benefit the environmentand the economywhen lots of people use them.

in areas that local governments have targeted for growth—generally, established communities well served by a variety oftransportation modes. Since the laws were passed, the statehas doubled its spending on programs that improve olderneighborhoods, foster transit use, and make roads safer forpedestrians and cyclists. The share of Maryland’s school con-struction budget devoted to improving existing schoolsjumped from 34 percent in 1995 to 84 percent in 1998.88
Local and national governments can take further steps toremove the obstacles to reusing centrally located land.Clearly, not all land within cities should be developed. As thestories of Copenhagen, Portland, and Curitiba show, parks,pedestrian plazas, and greenways along rivers are essential toimproving the quality of life in a city. However, the “recy-cling” of old buildings, parking lots, and industrial sites hasalso been an important part of the story in these places.
The potential for redevelopment of substantial amountsof vacant land does exist in industrial countries, but it iseven greater in places that are shifting from centrallyplanned to market economies. Abandoned industrial sites, or“brownfields,” account for less than 10 percent of cities suchas Paris or New York, but occupy 28 percent of Krakow and45 percent of St. Petersburg.89
Developers are wary of building on brownfields becausethey do not know whether they are polluted. Local andnational governments can address the concerns of develop-ers—for instance, by changing the tax code to make the costof cleanup deductible, as any other construction expensewould be. Since U.S. states began to provide incentives forbrownfield reuse less than a decade ago, some 40,000 siteshave been transformed, but 450,000–600,000 sites remain.90
In Prague, with over 1,000 hectares of abandoned sites inthe central city and developers building new suburban shop-ping malls, the city is becoming “Swiss-cheesed” in the wordsof Professor Yaakov Garb, whose Anti-Sprawl Campaign inCentral and Eastern Europe assembled developers, local offi-cials, and foreign experts on brownfield redevelopment for aseminar in April 2001. Afterwards, Garb concluded, “What
4342 CITY LIMITS ERASING THE INCENTIVES TO SPRAWL
new transportation. Since 1900 in France, Germany, and theUnited Kingdom, there has been a relatively constant ratio oftransportation to communication, with around six kilometerstraveled per message sent. Dutch researchers studying pastexpectations that telephones, fax machines, and other com-munications tools would substitute for transportation foundthat such projections failed to account for the co-existence ofold and new technologies and the co-evolution of technologyand society.86
Even as communications technology has allowed moredispersed development, it has not done away with the needfor places where people can share ideas directly. “The moretechnology frees us from the tyranny of place and past affil-iation,” writes Joel Kotkin in his book on the influence ofinformation technology on urban form, “the greater theneed for individual places to make themselves more attrac-tive.” Urban centers retain their attractiveness because muchof the creative work demanded by the information economystill occurs mainly in face-to-face exchange, where peoplelive and work in close proximity.87
Erasing the Incentives to Sprawl
Forging a better link between transportation and land useplanning is crucial for local governments wishing to stop
sprawl. It is also important for local and national govern-ments to remove incentives for cities to spread out—such asdeceptive prices that favor motor vehicle-dependent develop-ment. Depending on the city or country and the type of fis-cal incentives in place, a range of actions can be taken.
By subsidizing roads, sewers, and other urban infrastruc-ture, governments make locations more desirable to build onthan they would be otherwise. So by minimizing their spend-ing on new infrastructure in outlying areas, governments canrein in sprawl. The U.S. state of Maryland approved a set of“smart growth” laws in 1997 that require the state to invest

4544 ERASING THE INCENTIVES TO SPRAWLCITY LIMITS
we need to do is to make the brownfields not more expensivethan the greenfields.... The government doesn’t have to payfor all the redevelopment costs, just the difference needed toensure those sites aren’t disadvantaged.”91
Governments can remove another incentive to sprawl bytoppling barriers to credit in central locations. The U.S. gov-ernment has a well-documented history of insuring homeloans in ethnically homogeneous suburban neighborhoodsand refusing to underwrite loans in inner city communities.(See page 51.) This bias has influenced the banks that issueloans for businesses and homes; and the resulting unevenaccess to credit has strongly favored investment in suburbanlocations over inner city neighborhoods.
The U.S. Congress took an important step toward remov-ing the credit incentive to sprawl with the 1977 CommunityReinvestment Act, which required a bank proposing to openor close a branch or merge with another company to showthat it had “[met] the credit needs of its entire community,including low-and moderate-income neighborhoods….” Aspate of bank mergers in the 1990s forced banks to take noteof this law and, as Paul Grogan and Tony Proscio write intheir book Comeback Cities, the effect was dramatic: “It was ifthe flat earth of retail banking had suddenly found itsColumbus. Banks by the hundreds were planting new flags inthe former terra incognita of the inner city.” Total lending inlow-income communities averaged $3 billion a year between1977 and 1989; it soared to $43 billion a year by 1997.92
In recent years, citizens’ groups have argued that homesin centrally located locations should actually be favored oversuburban locations in the United States in banks’ decisionsabout home loans. People who live in neighborhoods wherethey can walk, cycle, or take public transportation generallyspend less on transportation and therefore have more moneyfor housing. David Goldstein of the Natural ResourcesDefense Council has calculated that the average person livingin an urban neighborhood in North Oakland, California, dri-ves half as much as his counterpart in a lower-density suburbin the San Francisco Bay Area—for a transportation savings of
$250 per month, or $3,000 a year. This savings is not account-ed for when banks decide how much money they will lend,so, writes Goldstein, “a family with a modest income can bepriced out of the market for inner city locations and forced tomove to locations that not only require more driving, butactually cost more overall,” when driving expenses are addedto the mortgage payments. In the United States, several non-profit groups have convinced Fannie Mae to lend $100 mil-lion over two years, to allow buyers of “location-efficient”homes in Chicago, Seattle, San Francisco, and Los Angeles toapply their transportation savings to larger home loans.93
Some argue that the most widespread form of local rev-enue in the United States and developing countries, the prop-erty tax, could be reformed to promote development ofvacant lots within urban areas. Most property taxes merge twodistinct taxes, one on buildings and one on land. Solely tax-ing land could promote compact development. Buildings thatrequire space for elevators and stairs are more expensive tobuild per square foot of usable space, so taxes on buildings falldisproportionately on taller structures. Generally, the effect oftaxes on buildings is to raise rents, disperse construction, anddiscourage urban redevelopment. A tax on land value, in con-trast, is relatively benign. The worth of the land under thebuilding depends only on location, so, theoretically, a tax onthe land would neither deter an owner from making improve-ments nor promote spread-out development.94
Governments can also use fiscal techniques to make theprice of different transportation modes better reflect theircost to society. Bicycling imposes few costs to society, so incountries where a bicycle constitutes a serious investment,governments could help to lower the barriers to purchase.When Kenya reduced its tax on bicycles from 80 percent to20 percent between 1986 and 1989, bicycle sales surged by1,500 percent. Governments can also underwrite loans thatallow more people to purchase bicycles. Over the long term,owning a bicycle saves a person money that would otherwisebe spent on public transportation and time that would oth-erwise be spent walking. The city of Lima launched an effort

4746 ERASING THE INCENTIVES TO SPRAWLCITY LIMITS
in 1991 to increase bicycle use from 2 percent to 10 percentby 2020. Lima worked with the national government andthe World Bank to open a $600,000 revolving fund that per-mitted people to apply for credit vouchers redeemable inbicycle shops. Between 1994 and 2000, more than 5,000 peo-ple used the credit system, with more than 4,000 of theapplications coming during the last year, when the creditavailability was better promoted.95
At the same time, the price of driving could be raised toreflect its high cost to society. This notion is gaining currencyin Western Europe, where it is becoming clear, in the words ofDutch transportation analyst Jos Dings, that “trying to reducecar traffic without adjusting the price of driving is like tryingto wipe water out of the cellar with the tap standing open.”An increase in the “variable cost” of operating a vehicle—thecost of each trip—might be more effective in deterring exces-sive use than increasing the “fixed cost” through vehicletaxes, which may actually promote use because once peoplepay for a vehicle, they want to use it as much as possible toget their money’s worth. The taxes on motor fuel, an impor-tant variable cost, are significant throughout Western Europe,so the cost of each trip is relatively high. In the United States,by contrast, the cost of buying a car has risen, while the costof each trip has fallen. (See Figure 3.)96
The most direct way to increase the variable cost of dri-ving is to raise the cost of fuel with a tax. By raising gasolinetaxes, governments can generate funds for public transporta-tion, discourage excessive driving, and encourage develop-ment of alternative fuels and vehicles. Variation in taxesaccount for the wide range of fuel prices worldwide. (SeeTable 6.) Governments could make a fuel tax hike morepalatable by accompanying it with a reduction in the taxeson people’s salaries or savings, or by using it to fund trans-portation alternatives. Experience suggests that a steadyseries of small price adjustments is more readily acceptedthan a sudden increase.97
Many problems caused by driving relate to the size of thevehicle or to the place or time that driving occurs. Targeted
incentives—charging heavy trucks for the extra wear theyimpose on roads, introducing fees for driving on congestedroads at peak travel times, and substituting transit tickets for parking privileges—can more precisely address differentconcerns.
Some governments, particularly in Western Europe, havebegun to adjust road-pricing policies to reflect the high costof truck use. For instance, Iceland, New Zealand, Norway,and Sweden levy a charge on diesel trucks that rises with theweight of the truck and the distance traveled. Six nations—Belgium, Denmark, Germany, Luxembourg, the Netherlands,and Sweden—coordinate their weight-based charges acrossborders. Transportation analysts have proposed that theEuropean Union adopt a unified kilometer-based chargingsystem: all trucks would be outfitted with electronic deviceshooked up to a satellite-based positioning system.98
Another set of policies raises the price of traveling during
Automobile Operating Costs, United States, 1985–98
1985 1988 1991 1994 1997 19980
10
20
30
40
50
60
70
80Cents per mile (1997 cents)
Source: See endnote 96.
Depreciation, insurance, other fees (fixed)
Tires and maintenance (variable)
Gas and oil (variable)
22.6% 13.6% 15.4% 12.0% 12.4% 11.5%
FIGURE 3

48 CITY LIMITS
peak times in order to reduce traffic congestion and delays.Singapore leads the world in using tolls to curb traffic. Formore than 20 years, downtown-bound drivers have paid afee that rises during rush hours; since 1998, the fee has beenautomatically deducted from an electronic card.99
Policies to raise the price of parking a car encourage peo-ple to use other types of transportation. In the United States,parking provided by employers is tax-exempt, an incentiveto drive, but a relatively recent change in federal policyallows employers to give each employee up to $65 permonth for public transportation. States have also changedtheir incentives. The state of Maryland, for instance, passeda law in 2000 that extends tax credits to nonprofit groups
49RESTRUCTURING GOVERNMENT INSTITUTIONS
such as schools and hospitals if they pay for employee tran-sit benefits or benefits equal to the cost of a parking spacethat the employee will not use.100
Governments can further lower the fixed costs of drivingand raise the variable costs by providing incentives for insur-ance companies to offer distance-based car insurance ratherthan flat fees. Typically, insurance is part of the fixed cost ofdriving, but if insurance companies were to base their fees onthe distances that people drive, then the fixed cost of drivingwould decline, and the variable cost would rise. The insurancecompany might add fees per kilometers driven to a lower base-line rate determined by conventional variables, such as age anddriving record. One insurance company in the United States,Progressive Auto Insurance, already offers this type of plan.101
All of these actions—ceasing to subsidize infrastructurefor development on “greenfields,” improving access to cred-it for buying and building in central locations, and adjustingtransportation taxes to reflect their cost to society—affectprice incentives to sprawl. There are often other important“costs” to living or doing business that are higher in a central location that have nothing to do with transportationor land development. In the United States, for example, ifcity neighborhoods do not have good schools, families willlook to the suburbs. And in places as diverse as Detroit,Nairobi, and Manila, fear of crime in the central city impelspeople to move to suburban neighborhoods. One could easily argue that the greatest success of places like Curitiba orCopenhagen or Portland has been in fostering central citiesthat are enjoyable, safe places to live.
Restructuring Government Institutions
Policies to promote urban development around publictransportation and remove incentives to sprawl are far
easier to recommend than to put into practice. Nations andcities face many barriers to rational development, only one
Country Retail Price Tax Tax Share of Price1
(U.S. cents/liter) (percent)
United Kingdom 113 85 76Japan 102 55 54France 96 67 69Italy 95 61 64Brazil 92 60 65Germany 92 61 67Spain 73 42 58India 60 28 47Canada 50 20 41South Africa 50 18 36United States 41 10 25China 40 8 20Russia 33 1 3Indonesia 17 0 0
Note: Unleaded “premium” gasoline pump prices for all countries exceptJapan, Canada and the United States. These exceptions are unleaded “regu-lar” gasoline pump prices. National average prices for all countries exceptBrazil, India, South Africa, China, Russia, and Indonesia, for which capital cityprices are used. 1”Tax Share” may not correspond perfectly to “Retail Price”and “Tax” because they are rounded.Sources: See endnote 97.
TABLE 6
Gasoline Prices, Selected Countries, Fall 2000

5150 RESTRUCTURING GOVERNMENT INSTITUTIONSCITY LIMITS
of which is the structure of government bureaucracies,which tend to bias government decisions toward the statusquo. At the national level, separate agencies for transporta-tion, environment, and land use often have competing agen-das. At the local level, officials of different towns within alarger metropolitan area are more likely to compete witheach other than to cooperate. Further, a lack of funds mayconstrain local governments from taking action to coordi-nate transportation and land use decisions.
One way for governments to correct biases toward roadbuilding would be to reorganize bureaucracies so that deci-sions about transportation, environment, and regional plan-ning are better coordinated. A 1997 study of seven Central andEast European nations found that transport policies often con-tradicted environmental policies. And as more-establishedtransportation ministries held more power than their envi-ronmental counterparts, transport policy priorities were ableto prevail. Countries such as Denmark and the Netherlandswith national agencies for spatial planning and coordinatedtransportation and environment policies have fared better atlinking transportation and land use decisions in order to pre-vent sprawl. Recently, the United Kingdom took a step in thisdirection by forming a new integrated national agency fortransportation, regional planning, and the environment.102
Naturally, an imbalance in the power of agencies dedi-cated to different modes of transportation skews policy. Inthe 1990s, legislation in the United States sought to bridgethe divisions between road building, rail, and transit thathave favored greater highway development. The landmark1991 Intermodal Surface Transportation Equity Act (ISTEA)and its successor, the Transportation Equity Act for the 21stCentury (TEA-21), allowed revenue from gasoline taxes to beused for other transportation projects. But lower-level gov-ernments have been slow to adjust to this change and back-sliding has occurred. The U.S. citizens’ group SurfaceTransportation Policy Project (STPP) has shown that between1992 and 1997, an average of 22 percent of the federal trans-portation funds covered by the new legislation went to pro-
viding alternatives to driving; by 1999, the share had fallento 17 percent.103
Another sort of segmentation of government encouragessquabbling over transportation and land use at the metro-politan level. When new roads, rail stations, stores, industri-al facilities, businesses, or houses are built in one town,transportation is affected throughout the region. A metro-politan area typically shares jobs, people, and traffic, butdoes not usually share an office for land use planning. Bycompeting with each other for development, local govern-ments tend to promote sprawl. Copenhagen, Portland, andCuritiba are all part of metropolitan regions, but these citiestypically have been more powerful than the suburbs sur-rounding them, and higher levels of government have fos-tered regional cooperation.
The United States has many metropolitan areas frag-mented into municipalities with different income levels. In1950, the United States Census Bureau identified 168 metro-politan areas, containing 304 different counties; by 1990, thenumber of counties in those original 168 metropolitan areashad surged to 536. Until the middle of the twentieth centu-ry, developers used restrictive covenants to prevent racialminorities from buying houses in certain areas, and theFederal Housing Administration supported this practice in itsdecisions on insuring home loans. A 1938 manual from theagency stated: “If a neighborhood is to retain stability, it isnecessary that properties shall continue to be occupied bythe same social and racial classes.” The Supreme Courtdeclared racial covenants illegal in 1948, but the notion thatresidential developments should be homogeneous remained.The “private governments” of homeowners’ associationssimply replaced restrictions on race with restrictions onclass, requiring more expensive, single-family homes.104
Among U.S. cities, Portland stands out for its high levelof metropolitan cooperation. Following Oregon’s 1973 lawrequiring growth boundaries around metropolitan areas,municipalities in the Portland region were forced to cooper-ate. The boundary, finally decided on in 1980, encompassed

5352 RESTRUCTURING GOVERNMENT INSTITUTIONSCITY LIMITS
the city of Portland and 23 neighboring towns in three coun-ties. A regional agency, Metro, was created to coordinatetransportation and periodically review the need to expandthe boundary. In the process of drawing the boundary, saysthe current head of Metro, Mike Burton, “we discoveredthere was a common market area, common labor pool, com-mon transportation catchment.” Subsequent laws gavegreater power to Metro, making it the only directly electedregional government in the country. (The members of otherregional agencies formed to coordinate transportation aretypically appointed by municipalities.)105
Metropolitan-wide government structures are more com-mon in Canada, which has had greater success than theUnited States at stemming sprawl. As suburbs grew, Canadaresponded by creating government agencies at the metro-politan level. Comparing Canada to the United States,researchers Tamim Raad and Jeff Kenworthy note: “In theUnited States, planning interventions more frequently servelocal and corporate interests over regional and collectiveones.” On average, U.S. cities have twice as many local gov-ernments per urban dweller as Canadian cities.106
In Toronto, for example, the province of Ontario createdan agency, Metro, in 1953 to coordinate the region’s publictransportation, roads, land use planning, schools, and watersupply. By linking public transportation to intensive landuse, Metro encouraged high levels of public transportationuse. In fact, the Toronto Transit Commission has the highestridership per capita of any metropolitan rail system in North America.107
However, in the decades after Metro was founded,Ontario extended highways and sewer lines outside of theMetro area, inviting sprawl. In the mid-1990s, the provinceproposed merging the six municipalities of Metro and join-ing them to the outlying municipalities, to increase theregion’s “global competitiveness.” Suburbs worried aboutbeing dominated by the city, and vice versa, but the mergerwent through, creating a Greater Toronto Area (GTA).Although the GTA was granted fewer powers than Metro, it
has begun to coordinate public transit, and may eventuallyhelp to stem sprawl.108
Metropolitan cooperation can be helped or hindered bythe global trend toward giving local governments morepower to provide services, including transportation. Localgovernments are closer to the people they represent, makingthem better able to respond to their needs. As mayor ofBogotá, Enrique Peñalosa was able to push through reformsbecause the local, rather than the national, government con-trols decisions about city transportation. That success is anendorsement of a decentralized system. But as economicsprofessor Andrew Reschovsky points out, the strength of adecentralized political system must be tempered “by the real-ization that when urban areas are divided into a number offiscally independent local governments, each local govern-ment has an incentive to exclude those individuals whorequire extra expenditures,” and this fragmentation inhibitscooperation for the betterment of the region.109
Most metropolitan areas already have well-establishedlocal governments, so creating an entirely new level ofregional government may be very difficult politically. Whatis needed, then, is for higher levels of government to provideincentives for local officials to cooperate. In recent years, thenational government in France has been providing a mone-tary bonus to local governments that agree to cede some ser-vices and a portion of their tax revenue to new metropolitanor regional bodies. A similar idea would be for national governments to require metropolitan regions to developintegrated transportation and land use plans in order toreceive funds for transportation projects from national taxdollars. For instance, in the United States, the ISTEA legisla-tion requires transportation funding requests to be coordi-nated by a metropolitan planning organization, but theseentities tend to focus narrowly on transportation. The man-date of these bodies could be expanded to include regionalland use planning. Countries now in the midst of shiftingpower from central to local governments could build theseincentives in from the beginning.110

5554 CREATING CONSTITUENCIES FOR CHANGECITY LIMITS
Similarly, international financial and development agen-cies could require that regional transportation and landplans accompany requests for transportation loans. Just asthe availability of money from the national budget can swaythe priorities of local governments, so, too, can the policiesof international banks. In developing countries, the WorldBank lends over $5 billion for transportation projects, morethan it does for any other sector. Between 1997 and 1999,fully 63 percent of the Bank’s transportation loans went tohighways, with only 15 percent to urban transport, 12 per-cent to rural roads, and 2 percent each to railways and water-ways. A new source of transport funds for Central and EastEuropean countries is the European Union’s Instrument forStructural Policies for Pre-Accession, which will cofinancewith multilateral banks and national governments theextension of highways and high-speed transit from WesternEurope. “By targeting improvements in long-distance linksat the expense of urban transit, this money will distort trans-portation priorities” in Central and Eastern Europe, accord-ing to Magda Stoczkiewicz of CEE Bankwatch Network.111
Creating Constituencies for Change
The problems related to urban sprawl do not lack for tech-nical solutions. Implementing these solutions, however,
is a considerable political challenge. While ideas abound forrevamping government agencies and policies to link trans-portation and land use decisions and remove incentives forsprawl, many people remain committed to the old, car-cen-tered vision. At the same time, people around the world arestarting to use the political process to put a new vision inplace. Acknowledging the trade-offs needed to improve col-lective well-being, they are forging coalitions to convincepolitical leaders to take action in the collective interest.
A clear vision of what people want their communities tobecome can be a powerful agent of change. Copenhagen’s
“Finger Plan,” Portland’s growth boundary, and Curitiba’sradial bus axes are vivid and enduring visions that all canunderstand. Increasingly spread through information-sharing networks, such success stories offer a sense of whatis possible.
A key impetus to sprawl is the shimmering promise ofindividual freedom—having one’s own automobile andhouse in a garden-like setting. In reality, once each personhas an automobile and a suburban home, the dream fades. Asurban critic Lewis Mumford observed, “The ultimate effect ofthe suburban escape in our time is, ironically, a low-gradeuniform environment from which escape is impossible.”112
The tension between individual and collective interestshas long been central to environmental concerns. Althoughthe environmental movement has helped to demonstratethat we live in an interconnected world, many people—Americans in particular—are still loath to discuss the trade-offs between individual freedom and collective well-being.In his book How Cities Work, Alex Marshall notes that tochoose collective well-being over sprawl, Americans mustrecognize that some things can only be bought with politi-cal involvement and good government. “I cannot buy ahealthy, friendly, and harmonious community for my childto grow up in, where people from many walks of life mingle,even if I have the wealth of Bill Gates,” notes Marshall. “Ourproblems and our scarcities stem from scarcities of collectivewealth, not individual wealth.”113
In Portland, the regional government, Metro, made trade-offs between private and public interests clear by engagingcitizens in creating a vision for the region’s future. AntonNelessen, the U.S.-based architect and professor whodesigned the visual preference survey used in Portland, isincreasingly in demand, as other cities in the United Statesand elsewhere begin to engage in a public debate about whattype of development citizens would like to see. Nelessen saysthe survey tells “mayors and city councils and planningboards, you have a license to rethink sprawl. People arealways coming up to us and saying, ‘no one ever asked us

5756 CREATING CONSTITUENCIES FOR CHANGECITY LIMITS
what we thought about this’. They’re delighted to be asked.”Peter Calthorpe and William Fulton document growing pub-lic participation in regional planning in their book, TheRegional City.114
The region around Salt Lake City, Utah, is one place thatis thinking through future development. In 1998, a civicgroup, the Coalition for Utah’s Future, launched “EnvisionUtah” with a series of surveys and workshops. In an exercisecalled “Where Shall We Grow?” citizens analyzed how pro-jected population growth could be accommodated on a mapthat showed both the region’s developed areas and naturalareas prized for beauty or recreation. The participants placedchips on the map that represented the land area needed toadd a million people at the current average density. Peoplequickly realized that if they wanted to preserve parts of theenvironment they cherished, then they would have toaccommodate future population growth in existing neigh-borhoods. Then, in 1999, the Utah state legislature approveda measure to help local governments work together to planfuture growth.115
As a rule, people are only driven to envision a differentsort of urban development when they see that the currentreality is bleak. In 1998, Ted Turner, a longtime Atlantabooster, worried that his hometown had turned into asprawl-plagued “hellhole.” Such concerns have promptedthe search for a new vision, allowing Georgia’s governor tobe elected on an anti-sprawl platform and to create a power-ful new regional agency for transportation and land use.Around the world, the economic, environmental, and socialconsequences of car-dependent development are inspiringpeople to work together to forge new visions.116
Santiago de Chile is another sprawling metropolis wherepeople have begun to develop a vision of what they would liketheir city to be. In the early 1990s, the national governmentproposed the Costanera Norte highway through downtownSantiago, which would have paralleled the Mapocho River,tearing up a historic district, obliterating a low-income com-munity, separating an upper middle class neighborhood from
a scenic view of San Cristobal Hill, creating more air pollution,and making life worse for the city’s pedestrians and cyclists.117
In 1995, some of Santiago’s citizens formed a groupcalled Ciudad Viva to protest the highway project. They col-lected petition signatures and proposed transportationreforms to government leaders. They were aided by anunlikely band of revolutionaries, the Ciclistas Furiosos, agroup of cyclists from all walks of life—lawyers, doctors,laborers, and students—that took to the streets on the firstTuesday of every month to agitate for bicycle lanes on exist-ing roads, new bike paths, and racks for bicycle parking.Patricio Lanfranco, a TV producer who helped to start theCiudad Viva group, said, “We realized that the problem oftraffic is a major problem, but it has a bigger context: Whatkind of city do we want? What kind of quality of life do wewant?” Citizens finally saw results in March 2001, when thegovernment implemented their proposal for dedicated buslanes. Initial surveys found that the creation of the bus lanesdramatically speeded up the flow of traffic, saving com-muters 25–35 minutes per trip.118
In Nairobi, as elsewhere in Africa, the imbalance in trans-portation priorities toward a minority of vehicle drivers hasyet to become a political issue, but concerned citizens havebegun to press for change. Jeff Maganya, who manages theEast Africa Transport Program of an international non-governmental organization (NGO) called the IntermediateTechnology Development Group (ITDG), notes that trans-portation can make or break development projects: “Ifschools, health centers, and water points can be built inaccessible places, it cuts down on the mobility needs of mostpeople.” Working with allies in government and the civilsector, ITDG has helped bring about the cut in the luxury taxon bicycles. Maganya notes that it has been difficult tochange entrenched views: “When we talked to a provincialcommissioner about bicycles, he said, ‘Everybody is going tothe moon. Why are you giving us backward technology?’”Still, his group is reaching out to allies, from internationalagencies to local universities, to create a regional informa-

5958 CREATING CONSTITUENCIES FOR CHANGECITY LIMITS
tion-sharing network and build political momentum.119
Organized citizens have catalyzed coalitions to pressuregovernments and provided well-reasoned alternatives toexisting urban development. (See list of citizens’ groups inthe Appendix.) While some groups have targeted local offi-cials, others have influenced broader national and interna-tional policies. For instance, in the United States, a coalitionof advocates for better transportation choices, STPP, wasinstrumental in drafting the ISTEA legislation that openednew funding options for alternatives to highway building.Another U.S.-based group, the Institute for Transportationand Development Policy (ITDP), has pressured the WorldBank and other international institutions to rethink lendingpolicies that contribute to sprawl. One indication of changeis the World Bank’s new “Urban Transport Strategy,” cur-rently in draft form. Paul Guitink, a senior transport special-ist at the World Bank, points out that the new policy “movesaway from private car use and towards integrating publictransportation with bicycling and walking.” Guitink cau-tions, however, that there is still much progress to be made,and expresses concern that in many projects, “if we talkabout road construction and rehabilitation, we are only talk-ing about the pavement for motorized transport, and notabout providing sidewalks and bicycling facilities.”120
In Western Europe, citizens’ groups have helped awakenthe public to the price incentives that influence transporta-tion choices and contribute to sprawl. Frazer Goodwin of theEuropean Federation for Transport and Environment (T&E)sees his organization’s greatest achievement as “getting onthe political agenda the debate about making the user paythe cost of transportation that is currently paid by society.”Indeed, Western Europe now leads the world in using dis-tance-based pricing for road use and shifting taxes off ofincome and onto fossil fuels.121
Even in the Netherlands, where the government has longfavored coordinated transportation and land use policies, cit-izens are struggling to prevent car-dependent sprawl. In 1999,Milieudefensie, the Dutch branch of Friends of the Earth,
launched an effort to persuade the government to “draw thegreen line” around open spaces, offering three proposals: toraise the price of sprawl through a tax on construction out-side urban areas; to spur regional planning by allowing newconstruction only within areas designated for urban use; andto develop more parks and other green zones in and aroundcities. Some 200 local groups are support-ing this campaign. “I think we hit some-thing deep down inside many people, whoworry...that all the open space is disap-pearing,” says Milieudefensie’s KlaasBreunissen, who is optimistic that thecampaign will convince the DutchParliament to amend the national govern-ment’s latest spatial plan.122
Community groups are especially wellsuited to initiate efforts to reclaim streetsin central cities from cars, thereby makingthose neighborhoods more desirable andlessening the pressure to sprawl. In theUnited Kingdom, citizens’ groups have helped translate theDutch woonerf into the British home zone. Lynn Sloman ofTransport 2000, one of the citizens’ groups, explains theappeal:
When you go to the Netherlands and walk through thesestreets, you see beautifully designed public spaces with a lotof greenery, benches, tables, and play equipment. . . . You seevery young children playing. You see neighbors sitting outeating breakfast together. . . . We didn’t have anything likethat in the UK.
Ever since Sloman’s group teamed with the Children’s PlayCouncil to bring British community groups to the Nether-lands to see these streets, she says, “Dozens of communitygroups around the country have been extremely active in lob-bying for their own streets to be turned into home zones.”123
This idea transfer from the Netherlands to the UnitedKingdom shows how information-sharing networks andcoalitions can multiply people’s efforts. Local officials around
“I think we hitsomethingdeep downinside manypeople, whoworry. . . thatall the openspace is disap-pearing.”

6160 CREATING CONSTITUENCIES FOR CHANGECITY LIMITS
the world formed the International Council for LocalEnvironmental Initiatives in 1990 to share success stories. InAsia, the Sustainable Transport Action Network (SUSTRAN)provides a way for citizens’ groups to share ideas and infor-mation. At a United Nations meeting in New York in April2001, ITDP brought people from SUSTRAN together withpeople from Latin America and Africa who were interested inlaunching similar efforts. Jeff Maganya of ITDG in Nairobiappreciated the chance to hear from people “like the Mayorof Bogotá, who was actually able to make a motorized-trans-port-free place where only bicycles would come. It’s almostimpossible when you haven’t heard something like that toimagine that it can happen.”124
The stories of places like Curitiba and Portland havealready inspired many others. Lloyd Wright, of the U.S.Agency for International Development says, “Curitiba reallystarted a renaissance in the way we look at buses and sus-tainable transportation. . . . If you go across Latin America,you can see there has been a real ripple effect from Curitiba.”Similarly, as sprawl has become a political issue in recent U.S. elections, some 36 states have debated ideas aboutregional planning, from Oregon-style growth boundaries toMaryland-style smart growth incentives. Citizens have formed“1000 Friends” groups, based on the Oregon model, inMaryland, Florida, Iowa, Pennsylvania, Vermont, andWisconsin. A Brookings Institution study documented morethan 400 ballot initiatives on managing growth that passedin the 2000 elections, many supported by coalitions ofurban, suburban, and rural interests.125
To be successful, coalitions have to counter the politicalpower of large automotive and real estate development com-panies, which for many decades have used enormous adver-tising budgets to indoctrinate people into the idea thatsprawling development enhances freedom and prosperity. Tosell the idea of a car-centered life to the public, the automo-tive industry, for example, spends more money than anyother industry on advertising. (See Table 7.) In March 2001,the Wall Street Journal reported that the Ford Motor compa-
ny was taking advertising to a new level by underwriting anew reality TV show featuring Ford’s sport utility vehicles. 126
One way for citizens to counter this political power is todemand greater openness. Cozy relationships betweenindustry and politicians often skew transportation and landuse decisions. Citizens’ groups working to stop sprawl inCentral and Eastern Europe observe that city councilors maybe bribed to approve a new shopping mall, or may resignafter approving a project to become head of its developmentcompany. Walter Hook, director of ITDP, which haslaunched an anti-sprawl campaign in that region with localcitizens’ groups, says they are trying to unveil “the huge con-flicts of interest that are promoting sprawl.”127
Indeed, citizens’ groups have a role to play in exposinghow individuals and companies legally “bribe” politicianswith campaign contributions. In the 2000 U.S. congression-al races, industries with a stake in transportation and landuse decisions contributed some $218 million to political par-ties and candidates—17 percent of the total spent by majorindustry groups—which doesn’t count what they spend onlobbying. Such groups often influence the way that lawmak-ers vote. For example, the auto industry successfully lobbied
U.S. Ad World AdRank Category Spending Rank Category Spending1
(billion dollars) (billion dollars)
1 Automotive 14.1 1 Automotive 9.92 Retail 11.6 2 Personal care 9.63 Movies and media 4.1 3 Food 5.24 Financial 3.9 4 Movies and media 2.45 Medicines 3.6 5 Medicines 1.6
1Excluding United StatesSource: See endnote 126.
TABLE 7
Automotive Sector Ranking in Advertising Spending,United States and World, 1998

6362 CREATING CONSTITUENCIES FOR CHANGECITY LIMITS
the U.S. Congress to halt increases in fuel efficiency stan-dards in the 1990s.128
Coalitions for a new type of urban development need toshow businesses how they can gain. Obviously, bicycle andrail manufacturers will see a role for themselves in a vision ofwalkable neighborhoods connected by cycle paths and pub-lic transportation. Indeed, a resurgence of interest in lightrail in Western Europe has reversed a decades-long decline inthis form of transport, and light rail riders are the fastest-growing segment of public transit users in the United States.The number of Americans riding public transportation ingeneral has risen for five straight years. Automotive, energy,and real estate companies also need to be shown how theycould re-position themselves.129
Automotive companies, for example, could, over time,become sellers of transportation services. With a variety oftransportation choices available, consumers would be able tochoose the best mode for each trip. If cycling and transitwere flourishing, and the price of driving were to reflect itsfull costs, then people would be more likely to choose carsonly when they really made sense. A huge, fuel-guzzlingsport utility vehicle would lose its appeal for a daily urbancommute. Auto companies could woo consumers with theexact type of rental car they needed for a given trip: a small,electric car for city use, a sporty convertible for a romanticweekend getaway, a station wagon for a family vacation, asport utility vehicle for a once-a-year trip to the mountains,or a truck for moving furniture.
This idea is not so farfetched. Privately run car-sharingnetworks, popular in Europe and recently introduced to a fewNorth American cities, give people easy access to a car withoutthe high costs of owning or the hassles of renting. Membersare more likely to use a car only for the trips where it has a sig-nificant advantage over other modes. Even the chairman ofFord has acknowledged the potential of these services, stating:“The idea that everybody must own an individual car will alsovanish in the long run. The manufacturers could offer the carsto the drivers on demand for pay. The day will come when the
notion of car ownership becomes antiquated.”130
At the same time, real estate developers stand to benefitby tapping a market of people who do not want to live inplaces where, in the words of essayist E.B. White, “Every-thing in life is somewhere else, and you get there in a car.”In the United States, some 150 communities designed onNew Urbanist principles, where people can walk or cycle tomany locations, are at some stage of development, and sell-ing at a premium compared to conventional sprawl.131
Perhaps the biggest opportunities for communities toengage the business community in their vision for the futureexists in Latin America, Asia, Africa, and Central and EasternEurope, where people are making major decisions todayabout investment in transportation and development thatwill affect people’s lives for decades to come. PatricioLanfranco, of Ciudad Viva in Santiago, recognizes this. In acity where only 20 percent of people can afford to commuteby car, Ciudad Viva sees a great opportunity for the govern-ment to claim streets for a bus network like Curitiba’s. “Whatwe are saying to business people,” says Lanfranco, “is to getout of the business of private cars. What you have to do ismake or sell mass transportation vehicles, and we are goingto ensure you access to at least 80 percent of the market. It’sa great deal, isn’t it?”132
There is a similar window of opportunity in Central andEastern Europe. Magda Stoczkiewicz of Central and EasternEurope Bankwatch says, “In many towns we still have verygood train and bus systems. It’s still not too late to stop car-dependent development.” An anti-sprawl campaign in thisregion is trying to increase the bargaining power of cities inCzechoslovakia, Hungary, and Poland to attract developersto build the types of things communities would like to seewithin their cities. This group would like to see local officialsresponsible for brownfield sites work with communities todevelop a vision for the future use of the land. After clearlyarticulating these aspirations, officials would let developersoffer their proposals.133
The importance of engaging businesses and appealing to

6564 CREATING CONSTITUENCIES FOR CHANGECITY LIMITS
consumers cannot be overstated. In his book Getting There,Stephen Goddard details the many ways in which both railand road industries manipulated public opinion to influenceU.S. policymakers. Road supporters won by forging coali-tions in the first decades of the twentieth century that “putgovernment engineers and bureaucrats in touch regularlywith auto and rubber executives and engineering profes-sors.” The road interests also prevailed because they wereable to embed in the American psyche the idea that the railswere the transport of the past, run by greedy corporate inter-ests, whereas the roads were depicted as the more democrat-ic and technologically superior transport of the future.134
Stories such as the successes of Curitiba or Copenhagenwould be even more powerful if they could convince busi-nesses of new investment opportunities and reach a broaderaudience of voters and consumers. As Enrique Peñalosa ofBogotá says, “We get a lot of television from the UnitedStates, a lot of car races and highways. But we don’t get manyTV shows from Copenhagen. People would never think thatan advanced country would have people riding around onbikes.” In April 2001, the city of Bremen, Germany, gave thefirst awards in a new program to highlight examples world-wide of businesses and municipalities working together topromote sustainable development.135
With many of the world’s cities increasingly dominatedby highways and motor vehicles, their harsh impact on socialharmony, human health, and the environment are clear. Car-centric development diminishes human and economic poten-tial. Both markets and constituencies exist for cleaner,walkable neighborhoods, efficient transit, and healthierregions. In the United Kingdom, surveys by the Departmentof the Environment found that the percentage of people inter-viewed who were “very worried” about traffic-related smogincreased from 23 percent in 1986 to 40 percent in 1993.Surveys by the Pew Center for Civic Journalism in 1999 foundurban sprawl to be the top local concern of U.S. residents.136
The United States, which created the model of urbansprawl, now has the longest history of dealing with the prob-
lems it has spawned. President Dwight D. Eisenhower, whosigned the 1956 law establishing the national interstate sys-tem, may have been one of the first to recognize the prob-lems. Apparently, Eisenhower had believed the highwayswould go around cities, not through them (when, in fact,local officials had jumped at the chance to get federal fundsfor a public works project). On his way out of Washington,DC, to Camp David, Maryland, in 1959, Eisenhower sawbulldozers cutting a swath of land through the northwestpart of the city and was shocked to learn that the highwayproject was part of his interstate system. By the end of histerm, the president regretfully concluded there was nothinghe could do to reverse the situation, remarking on the waste-fulness of motorists “driving into the central area and takingall the space required to park the cars.”137
Today, as many more people understand that sprawlingcities that cater to the automobile are the result of govern-ment choices to foster road building, car infrastructure, andspread out development, they realize that they could pres-sure their leaders to choose a different future. Cities could bemade more socially cohesive, environmentally healthy, andeconomically vibrant with integrated networks for bicycles,bus, rail, and new types of transit. As excitement builds inBogotá over its new bus system and bike paths, formerMayor Peñalosa reflects: “We are still miles away from wherewe would like to be, but there is a change in mentality thatis incredible. When you have people talking about how theywould like to live, and they think that they have the powerto choose, this is a very important change.”138

67
Umbrella group of NGOs that proposes transport policies to theEuropean Union.
Institute for Transportation and Development Policy (ITDP)115 W. 30th St., Suite 1205New York, NY 10001 USAtel.: (212) 629-8001; fax: (212) 629-8033e-mail: [email protected]: www.itdp.orgWorks with local groups in Eastern Europe, Asia, Africa, and LatinAmerica toward greener and more equitable transportation anddevelopment. Has launched an “Anti-sprawl Campaign” inCentral and Eastern Europe.
International Council for Local Environmental Initiatives (ICLEI)City Hall East Tower 8th FloorToronto, Ontario M5H 2N2 Canadatel.: (416) 392-1462; fax: (416) 392-1478e-mail: [email protected]: www.iclei.orgAn association of local governments, ICLEI helps cities share suc-cess stories.
1000 Friends of Oregon534 SW Third Ave., Suite 300Portland, OR 97204 USAtel.: (503) 497-1000; fax: (503) 223-0073e-mail: [email protected]: www.friends.orgResearches land use policies, educates citizens, and advocatesresponsible planning in Oregon. Website links to similar U.S.groups.
Sustainable Transport Action Network for Asia and the Pacific(SUSTRAN)c/o Pelangi Indonesia, Jl. Danau Tondano No. A-4Jakarta 10210 Indonesiatel.: 62 21 573 5020, 571 9360; fax: 62 21 573 2503e-mail: [email protected] or [email protected]: www.geocities.com/sustrannetNGO network that distributes an electronic newsletter on effortsto improve transportation in the Asia-Pacific region.
66 APPENDIXCITY LIMITS
Appendix
Some Groups that Support Transportation Choices for Livable Cities
Networks of Citizens or Local Authorities
Center for Neighborhood Technology2125 W. North Ave.Chicago, IL 60647 USAtel.: (773) 278-4800; fax: (773) 278-3840website: www.cnt.orgCreated to foster self-sufficient neighborhoods in Chicago, butnow seeks to link economic development with ecologicalimprovement in communities nationwide.
CityNetInternational Organization Centre, 5FPacifico-Yokohama, Minato Mirai, Nishi-kuYokohama 220-0012 Japantel.: 81 45 223 2161; fax: 81 45 223 2162e-mail: [email protected]: www.citynet-ap.orgNetwork of local governments, NGOs, and research institutes inthe Asia-Pacific region.
Congress for the New UrbanismHearst Building5 Third St., Suite 500ASan Francisco, CA 94103 USAtel.: (415) 495-2255; fax: (415) 495-1731e-mail: [email protected]: www.cnu.orgWorks with architects and planners to promote regional planning,walkable neighborhoods, and attractive public spaces.
European Federation for Transport and the Environment34 boulevard de WaterlooB-1000 Brussels, Belgiumtel.: 2 2 502 99 09; fax: 32 2 502 99 08e-mail: [email protected] website: www.t-e.nu/index.htm

6968 APPENDIXCITY LIMITS
Smart Growth NetworkInternational City/County Management Association 777 North Capitol St., NE, Suite 500Washington, DC 20002-4201 USAtel.: (202) 962-3591; fax: (202) 962-3500 e-mail: [email protected] website: www.smartgrowth.orgSponsored by the U.S. Environmental Protection Agency to shareinformation on transportation and land use planning.
Surface Transportation Policy Project (STPP)1100 17th St., NW, 10th FloorWashington, DC 20036 USAtel.: (202) 466-2636; fax: (202) 466-2247e-mail: [email protected]: www.transact.orgAdvocates transportation policies to protect neighborhoods, pro-vide better travel choices, and promote social equity. Keeps a listof U.S. groups working on these issues.
Research Institutes and Journals
Center on Urban and Metropolitan PolicyBrookings Institution1775 Massachusetts Ave., NW Washington, DC 20036 USAtel.: (202) 797-6139; fax: (202) 797-2965e-mail: [email protected] website: www.brookings.edu/es/urban/urban.htmResearches metropolitan cooperation in the United States.
Citistates Group650 Fairhaven Rd.Fairhaven, MD 20779 USAtel.: (301) 855-6482e-mail: [email protected]: www.citistates.comThese U.S. journalists write about metropolitan cooperation.
Danish Town Planning InstitutePeder Skrams Gade 2 BDK-1054 Copenhagen K Denmarktel.: 45 33 13 72 81; fax: 45 33 14 34 35
e-mail: [email protected]: www.byplanlab.dkPromotes urban and regional planning in Denmark.
European Academy of the Urban EnvironmentBismarckallee 46-48D-14193 Berlin, Germanytel.: 49 30 89 59 99 0; fax: 49 30 89 59 99 19e-mail: [email protected]: www.eaue.deStimulates cooperation among European cities on environmentalissues.
Instituto de Pesquisa e Planejamento Urbano de Curitiba (IPPUC)Rua Bom Jesus 669 Cabral, Curitiba, Paraná, Brasil CEP 80035-010 tel.: 55 41 352 1414; fax: 55 41 252 6679 e-mail: [email protected]: www.ippuc.pr.gov.brResearches sustainable urban development in Curitiba, Brazil.
Journal of World Transportation Policy and PracticeLe Frene, 8/10 rue Joseph BaraF-75006 Paris, Francetel.: 33 01 4326 1323; tel/fax: 33 1 0 53 01 28 96e-mail: [email protected]: www.ecoplan.org/wtppPublishes articles on building more environmentally friendlytransportation systems.
Lincoln Institute of Land Policy113 Brattle St.Cambridge, MA 02138-3400 USAtel.: (617) 661-3016 or (800) 526-3873fax: (617) 661-7235 or (800) 526-3944website: www.lincolninst.eduStudies land use economics and taxation in the United States andelsewhere.
Urban Land Institute1025 Thomas Jefferson St., NW, Suite 500 WestWashington, DC 20007 USAtel.: (202) 624-7000; fax: (202) 624-7140

7170 NOTESCITY LIMITS
e-mail: [email protected]: www.uli.orgProvides information and training to real estate developers.
Victoria Transport Policy Institute (VTPI)1250 Rudlin St.Victoria, BC, V8V 3R7 Canada tel. and fax: (250) 360-1560 e-mail: [email protected]: www.vtpi.orgResearches efficient and equitable transportation; keeps a list ofrelevant studies.
Notes1. Isaac Mburu, Nairobi resident, discussion with author, 19 February2001; estimates relating to Nairobi population from Brian Williams, trans-port specialist, United Nations (U.N.) Centre for Human Settlements(Habitat), Nairobi, Kenya, discussion with author, 19 February 2001.
2. U.S. drivers from U.S. Department of Transportation (USDOT), Bureauof Transportation Statistics, Transportation Statistics Annual Report 1997:Mobility and Access (Washington, DC: USDOT Bureau of TransportationStatistics, 1997), p. 157; air pollution from Rita Seethaler, Health Costs Dueto Road Traffic-related Air Pollution: An Impact Assessment Project of Austria,France and Switzerland, Synthesis Report, prepared for the World HealthOrganization (WHO) Ministerial Conference on Environment and Health,London, June 1999, p. 9, and from Nino Künzli et al., “Public-Health Impactof Outdoor and Traffic-Related Air Pollution: A European Assessment,” TheLancet, 2 September 2000, pp. 795–801.
3. Obesity from Gary Taubes, “As Obesity Rates Rise, Experts Struggle toExplain Why,” Science, 29 May 1998, pp. 1367–68; Lori Montgomery,“Suburbia’s Road to Weight Gain: Land-Use Designs Discourage Poundingthe Pavement, Some Say,” Washington Post, 21 January 2001; transportationcontribution to carbon emissions from International Energy Agency (IEA),CO2 Emissions from Fuel Combustion (Paris: Organisation for Economic Co-operation and Development (OECD), 1999); carbon emissions contributingto climate change from J.T. Houghton et al., eds., Climate Change 1995: TheScience of Climate Change, Contribution of Working Group I to the SecondAssessment Report of the Intergovernmental Panel on Climate Change(Cambridge, U.K.: Cambridge University Press, 1996).
4. Atlanta from Tim Lomax et al., 2001 Urban Mobility Study (CollegeStation, TX: Texas Transportation Institute, 2001) on the Internet at<http://mobility.tamu.edu/2001/>; Bangkok from Richard Stren, “Trans-portation and Metropolitan Growth,” in Richard Stren and Mila Freire, TheChallenge of Urban Government: Policies and Practices (Washington, DC: WorldBank Institute, 2001), p. 380; Jonathan D. Miller, Emerging Trends in RealEstate (New York: Lend Lease Real Estate Investments andPricewaterhouseCoopers LLP, October 2000).
5. Table 1 from U.N., Department of Economic and Social Affairs,Population Division, World Urbanization Prospects: The 1999 Revision (NewYork: 2000), Key Findings, <www.undp.org/popin/wdtrends/wdtrends.htm>, viewed 20 January 2001. Global urban population estimates are diffi-cult to make, as the definition of “urban” and the reliability of census datavary from country to country. The U.N. figures cited here are for “urbanagglomerations,” which generally include the population in a city or townas well as that of adjacent suburbs.
6. Led by Peter Newman and Jeffrey Kenworthy, researchers at the

73NOTES72 CITY LIMITS
Institute for Sustainability and Technology Policy (ISTP) at MurdochUniversity in Perth, Australia, have done the most detailed surveys, mea-suring population density, transportation modal share, fuel use, and otherindicators. Table 2 car use from Jeffrey R. Kenworthy and Felix B. Laube,with Peter W. G. Newman, Paul A. Barter, Tamim Raad, Chamlong Poboon,and Benedicto Guia, Jr., An International Sourcebook of Automobile Dependencein Cities 1960–1990 (Boulder, CO: University Press of Colorado, 1999, p.529; fuel use and population density from Peter Newman and JeffreyKenworthy, Sustainability and Cities: Overcoming Automobile Dependence(Washington, DC: Island Press, 1999), pp. 94–95, 70–71. Table 3 metropoli-tan area population estimates for 1995 from U.N., Department of Economicand Social Affairs, Population Division, World Urbanization Prospects: The1996 Revision (New York: U.N., 1998), pp. 144–51; commute to work inAtlanta, Latin America, and Africa from Habitat, Global Urban IndicatorsDatabase, <www.urbanobservatory.org/indicators/database/transport.html>;commute to work in all other cities from Kenworthy and Laube et al., op.cit. this note, p. 529.
7. Newman and Kenworthy, op. cit. note 6, pp. 112–13.
8. L.J. Schipper, M.J. Figueroa, and R. Gorham, People on the Move: AComparison of Travel Patterns in OECD Countries, Institute of Urban andRegional Development, University of California, Berkeley, cited in LeeSchipper and Celine Marie-Lilliu, Transportation and CO2 Emissions: Flexingthe Link—A Path for the World Bank, Environment Department Papers, PaperNo. 69, September 1999, p. 57.
9. Stephen B. Goddard, Getting There: The Epic Struggle between Road andRail in the American Century (Chicago: University of Chicago Press, 1994).
10. History from David Rusk, Inside Game, Outside Game: Winning Strategiesfor Saving Urban America (Washington, DC: Brookings Institution Press,1999), pp. 91–92 ; highway miles in urban areas from USDOT, FederalHighway Administration (FHWA), Office of Highway Policy Information(OHPI), Highway Statistics 1999, <www.fhwa.dot.gov/ohim/hs99>, viewed23 May 2001; highway spending by all levels of government from FHWA,OHPI, Highway Statistics, various years, and from FHWA, OHPI, HighwayStatistics Summary to 1995, <www.fhwa.dot.gov/ohim/summary95>, viewed23 May 2001; transit funding by all levels of government from AmericanPublic Transit Association, “Public Transportation Statistics,”<www.apta.com/stats>, and from Terry Bronson, American Public TransitAssociation phone discussion with author, 25 May 2001.
11. Highway financing from FHWA, “Financing Federal-Aid Highways,”<www.fhwa.dot.gov/reports/fifahiwy>, viewed 23 May 2001; Atlanta fromMargaret Pugh, Moving Beyond Sprawl: The Challenge for Metropolitan Atlanta(Washington, DC: Brookings Institution Center on Urban and MetropolitanPolicy, 2000), p. 22.
12. Sewer investments from David K. Hamilton, Governing MetropolitanAreas: Response to Growth and Change (New York: Garland Publishing, 1999),pp. 151–52; Fannie Mae from Kenneth Jackson, Crabgrass Frontier: TheSuburbanization of the United States (New York: Oxford University Press, 1985).
13. Jackson, op. cit. note 12.
14. U.S. Census data cited in Rusk, op. cit. note 10, pp. 68–69; gasolinefrom U.S. Department of Energy, Energy Information Administration,“World Apparent Consumption of Refined Petroleum Products, 1998,” at<www.eia.doe.gov/pub/international/iea99/table35.xls>, viewed 29 May2001.
15. Tamim Raad and Jeff Kenworthy, “The U.S. and Us,” AlternativesJournal, vol. 24, no. 1, winter (1998), pp. 14–22.
16. Frances Frisken, L.S. Bourne, Gunter Gad, and Robert A. Murdie,“Governance and Social Sustainability: The Toronto Experience,” in MarioPolèse and Richard Stren, The Social Sustainability of Cities (Toronto: TheUniversity of Toronto Press, 2000), pp. 68–97.
17. Difference in policies from Pietro S. Nivola, Laws of the Landscape: HowPolicies Shape Cities in Europe and America (Washington, DC: BrookingsInstitution Press, 1999). Table 4 from Tony Pattison, ed., Jane’s UrbanTransport Systems 2000–2001 (London: Jane’s Information Group, 2000), pp.20–24.
18. Peep Mardiste et al., Blueprints for Sustainable Transportation in Centraland Eastern Europe (Brussels: CEE Bankwatch Network, May 1997).
19. Peter S. Green, “Building Up Central Europe on a Western Base,” NewYork Times, 16 May 2001; Czech Republic from Yaakov Garb, “FightingSprawl: Prague on the Edge,” Sustainable Transport, fall 2000, p. 8, and from“Hypermarkets Coming on Strong in Czech Republic,” Discount Store News,7 February 2000.
20. Tim Burt, “Scope for Real Growth Is Likely in the Long Term,” FinancialTimes, 14 June 2000.
21. Mario Lungo, “Urban Sprawl and Land Regulation in Latin America,”Land Lines, Newsletter of the Lincoln Institute of Land Policy, March 2001,pp. 7–8; Christopher Zegras and Todd Litman, An Analysis of the Full Costsand Impacts of Transportation in Santiago de Chile (Washington, DC, andSantiago de Chile: International Institute for Energy Conservation, 1997)pp. 112–13.
22. Chinese subsidies from Hisashi Kubota and Tetsuo Kidokoro, “Analysisof Bicycle-Dependent Transport Systems in China: Case Study in a Medium-Sized City,” Transportation Research Record, vol. 1441, 1994, pp. 11–15; dis-

7574 NOTESCITY LIMITS
couraging nonmotorized transport from John Whitelegg, “India’s Roads toRuin,” New Scientist, 1 February 1997, p. 51, V. Setty Pendakur, “UrbanTransportation in China: Trends and Issues,” Transportation Research Record,vol. 1372, 1992, p. 7, and Henry T. Dimitriou, A Developmental Approach toUrban Planning (Aldershot, U.K.: Avebury, 1995); Surabaya from “A Breath ofFresh Air for Indonesia,” Sustainable Transport, fall 2000, p. 17.
23. Habitat, Reassessment of Urban Planning and Development Regulations inAfrican Cities (Nairobi: Habitat, 1999); Nairobi from R.A. Obudho, “Nairobi:National Capital and Regional Hub,” in Carole Rakodi, ed., The UrbanChallenge in Africa (Tokyo: U.N. University Press, 1997), and from Diana Lee-Smith and Davinder Lamba, “Social Transformation in a Post-colonial City:The Case of Nairobi,” in Mario Polèse and Richard Stren, eds., The SocialSustainability of Cities (Toronto: University of Toronto Press, 2000).
24. Quote from USDOT, FHWA, Our Nation’s Travel: 1995 NPTS Early ResultsReport (Washington, DC: FHWA, September 1997), p. 34; J. Solomon, ToDrive or Vote: Young Adults’ Culture and Priorities (London: Charter Instituteof Transport, 1998) cited in John Adams, “The Social Implications ofHypermobility,” Project on Environmentally Sustainable Transport: TheEconomic and Social Implications of Sustainable Transportation—Proceedings from the Ottawa Workshop (Paris: OECD, 1998).
25. U.S. population without driver’s license from USDOT, op. cit. note 2, p. 182; children from USDOT, FHWA, op. cit. note 24, p. 29; women fromFHWA, op. cit. this note, p. 16.
26. Atlanta Regional Commission, Regional Transportation Plan Fact Book(December 1998) p. 14, cited in Pugh, op. cit. note 11, p. 22; Bullard quot-ed in David Bollier, How Smart Growth Can Stop Sprawl (Washington, DC:Sprawl Watch Clearinghouse, 1998), p. 18.
27. Joel Hirschhorn, Growing Pains: Quality of Life in the New Economy(Washington, DC: National Governors Association, 2000); Myron Orfield,Metropolitics: A Regional Agenda for Community and Stability (Washington,DC, and Cambridge, MA: Brookings Institution Press and Lincoln Institutefor Land Policy, 1997), pp. 9–10.
28. David Rusk, Cities Without Suburbs (Washington, DC: Woodrow WilsonCenter Press, 1993), pp. 43–45; Manuel Pastor Jr., Peter Dreier, J. EugeneGrigsby III, Marta López-Garza, Regions that Work: How Cities and SuburbsCan Grow Together (Minneapolis: University of Minnesota Press, 2000), p. 99.
29. Lewis Mumford, The City in History (San Diego: Harcourt Brace, 1961),p. 507; Lomax et al., op. cit. note 4; Walter Hook, “Hurdles to EasingCongestion in Asia,” Habitat Debate (Newsletter of U.N. Habitat), vol. 4, no.2 (1998).
30. Marion Nestle and Michael F. Jacobson, “Halting the Obesity Epidemic:
A Public Health Policy Approach,” Public Health Reports, January/February2000, vol. 115, pp. 12–24.
31. Robert D. Putnam, Bowling Alone (New York: Simon and Schuster,2000), pp. 204–15.
32. Jeff Kenworthy et al., Indicators of Transport Efficiency in 37 Cities, Reportto the World Bank, 1997; Newman and Kenworthy, op. cit. note 6, pp. 123–24; Kenworthy et al., op. cit. note 6, pp. 619–20; Robert Cervero,Efficient Urbanization: Economic Performance and the Shape of the Metropolis,Lincoln Institute of Land Policy Working Paper (Cambridge, MA: 2000), p. 18.
33. Robert W. Burchell, “Costs and Benefits of Alternative DevelopmentPatterns: Sprawl Versus Smart Growth,” in Lincoln Institute of Land Policy,Metropolitan Development Patterns: Annual Roundtable 2000 (Cambridge, MA:2000), pp. 47–49.
34. Surface Transportation Policy Project (STPP), An Analysis of theRelationship Between Highway Expansion and Congestion in Metropolitan Areas:Lessons from the 15-year Texas Transportation Institute Study (Washington, DC:1998); Alan Sipress, “Widen the Roads, Drivers Will Come,” Washington Post,4 January 1999; Replogle quoted in David W. Chen, “The Cost of UrbanSprawl: Unplanned Obsolescence,” New York Times, 30 January 2000.
35. Kenneth M. Gwilliam and Surhid Gautam, Pollution from Motorcycles inAsia: Issues and Options, World Bank Infrastructure Notes (Washington, DC:World Bank, April 2000); Peter Gaupp, “Air Pollution in the Third World,”Swiss Review of World Affairs, February 1997; Utpal Chatterjee, “Expert PaintsGloomy Picture of Pollution,” Times of India, 27 April 1998.
36. Ingredients in exhaust from Jack Hollander, ed., The Energy-EnvironmentConnection (Washington, DC: Island Press, 1992); sulfur dioxide and partic-ulate emissions records from U.N. Environment Programme (UNEP) andWHO, Assessment of Urban Air Quality (Nairobi: Global EnvironmentMonitoring System (GEMS), 1998), daily particulate levels from DerekElsom, Smog Alert: Managing Urban Air Quality (London: Earthscan, 1996);long-term exposure to particulates from WHO, “WHO Guidelines for AirQuality,” Fact Sheet No. 187 (Geneva: December 1997) and from J. Raloff,“Clues Hint How Particulates Harm Lungs,” Science News, 24 October 1998.
37. Anthony Faiola, “Santiago’s Children Gasp for Cleaner Air,”Washington Post, 12 July 1998; Atlanta from U.S. Environmental ProtectionAgency (EPA), “The Green Book: Nonattainment Areas for CriteriaPollutants,” <www.epa.gov/oar/oaqps/greenbk>, viewed 24 May 2001; andfrom Georgia Department of Natural Resources, Environmental ProtectionDivision, Air Protection Branch, “Ambient Monitoring Program,”<uam.air.dnr.state.ga.us/amp/>, viewed 24 May 2001.

77NOTES76 CITY LIMITS
38. Traffic deaths from WHO, The World Health Report 1995 (Geneva: 1995),and from Christopher Willoughby, Managing Motorization, Discussion Paper,Transport Division (Washington, DC: World Bank, April 2000), p. ii; costfrom World Bank, “Roads and Highways Overview,” <www.worldbank.org/html/fpd/transport/roads_ss.htm>, viewed 7 June 2000; Newman andKenworthy, op. cit. note 7.
39. Barbara McCann and Bianca DiLille, Mean Streets 2000 (Washington,DC: STPP, June 2000).
40. Pedestrian deaths from ibid.; driver deaths and quote from ScottBowles, “Elderly Die At A Record Pace Behind the Wheel,” USA Today, 1 May2001.
41. Figure 1 from IEA, op. cit. note 3. This figure shows values for carbondioxide. Most Worldwatch publications show values only for the carboncontent of the carbon dioxide gas (those numbers are smaller).
42. Walter Hook and Michael Replogle, “Motorization and Non-MotorizedTransport in Asia,” Land Use Policy, vol. 13, no. 1 (1996), pp. 69–84; Atlantafrom Pugh, op. cit. note 11, and from Robert D. Bullard, Glenn S. Johnson,and Angel O. Torres, Sprawl City: Race, Politics, and Planning in Atlanta(Washington, DC: Island Press, 2000).
43. United States from Mark M. Glickman, “Beyond Gas Taxes: LinkingDriving Fees to Externalities,” (San Francisco: Redefining Progress, March2001); FHWA, Addendum to the 1997 Federal Highway Cost Allocation Study,Final Report (Washington, DC: May 2000), on <www.fhwa.dot.gov/policy/hcas/addendum.htm>, viewed 20 May 2001; Office of TechnologyAssessment, Saving Energy in U.S. Transportation (Washington, DC: U.S.Congress, Office of Technology Assessment, 1994); Todd Litman,“Transportation Cost Survey,” (Victoria, BC: Victoria Transportation PolicyInstitute, 1992); James MacKenzie, Roger Dower, and Donald Chen, TheGoing Rate: What It Really Costs to Drive (Washington, DC: World ResourcesInstitute, 1992); OECD, Reforming Energy and Transport Subsidies:Environmental and Economic Implications (Paris: 1997); James J. Murphy andMark A. Delucchi, “A Review of the Literature on the Social Cost of MotorVehicle Use in the United States,” Journal of Transportation and Statistics,January 1998, pp. 14–42; Clifford Cobb, “The Roads Aren’t Free,” Challenge,May/June 1999; United Kingdom from David Maddison et al., The True Costsof Road Transport (London: Earthscan, 1996); international comparison fromChristopher Willoughby, Managing Motorization, Discussion Paper, TransportDivision (Washington, DC: World Bank, April 2000), p. ii; Santiago fromZegras and Litman, op. cit. note 21, and from Chris Zegras, “Clearing theSkies in Santiago,” Habitat Debate, vol. 4, no. 2 (1998), pp. 23–25.
44. Jans Gehl and Lars Gemzøe, Public Spaces Public Life: Copenhagen 1996(Copenhagen: Arkitektens Forlag, Kunstakademiets Forlag, 1999), pp. 16–29, 40–43.
45. Robert Cervero, The Transit Metropolis: A Global Inquiry (Washington,DC: Island Press, 1998), pp. 132–54.
46. Gehl and Gemzøe, op. cit. note 44.
47. Cervero, op. cit. note 45.
48. Driving from Cervero, op. cit. note 45; reduction in energy use fromLynn Scholl, Lee Schipper, and Nancy Kiang, “CO2 Emissions fromPassenger Transport: A Comparison of International Trends from 1973 to1992,” Energy Policy, vol. 24, no. 1 (1996), p. 24; quote from public officialcited in Gehl and Gemzøe, op. cit. note 44, p. 6.
49. Quote from Daniel Kennedy in “Safe Routes to School Story,”<www.sustrans.org.uk>, viewed 6 May 2001.
50. Richard Moe and Carter Wilkie, Changing Places (New York: Henry Holt,1997), pp. 211–34.
51. Jay Walljasper, “Portland’s Green Peace: At Play In the Fields of UrbanPlanning,” The Nation, 13 October 1997; view corridors from Moe andWilkie, op. cit. note 50, p. 224.
52. Brad Berton, “Projects Preserve City’s Architectural Heritage,” BusinessJournal-Portland, 31 October 1997; William Thompson and John Hughel,“Back from the Brink,” Landscape Architecture, July 1998, pp. 54–86.
53. Moe and Wilkie, op. cit. note 50, p. 229; 1000 Friends of Oregon,“Making the Connections: A Summary of the LUTRAQ Project,” Volume 7,Integrating Land-Use and Transportation Planning for Livable Communities(Portland, OR: February 1997).
54. Metro plans from Metro, “Growth Management,” <www.metro-region.org/growth/gms.html>, viewed 29 May 2001, and from DanMihalopoulos, “Two Ways to Control: Portland’s Boundary Separates theDream Homes from the Ducks,” St. Louis Post-Dispatch, 26 February 1998;proximity to transit from Cervero, op. cit. note 45, pp. 416–23; light railfrom Julian Wolinsky, “Light Rail: One Route to Livable Cities,” Railway Age,July 1999, pp. 47–49.
55. Rusk, op. cit. note 10, pp. 165, 172–73.
56. Trade-offs from Peter Calthorpe and William Fulton, The Regional City(Washington, DC: Island Press, 2001), p. 115; Burton quoted in Rusk, op. cit.note 10, p. 177.
57. Pedestrian safety from McCann and DiLille, op. cit. note 39.
58. Steve Gutman, “CarSharing Portland: A Library With Cars Instead of

79NOTES78 CITY LIMITS
Books,” Orion Afield, Autumn 2000, pp. 10–13.
59. Metro, “Regional Affordable Housing,“ <www.metro-region.org/growth/tfplan/affordable.html>, viewed 29 May 2001; Urban Land Institute,ULI Market Profiles 2000.
60. Arthur C. Nelson, “Regulations to Improve Development Patterns,” inLincoln Institute of Land Policy, op. cit. note 33, p. 78.
61. Curitiba history from Jonas Rabinovitch with Josef Leitman,Environmental Innovation and Management in Curitiba, Brazil, UrbanManagement Programme (UMP) Working Paper Series 1 (Washington, DC:UNDP/UNCHS/International Bank for Reconstruction and Development/World Bank-UMP, 1993).
62. Bill McKibben, Hope: Human and Wild (Boston: Little, Brown andCompany, 1995), pp 63–67.
63. Jonas Rabinovitch, “A Sustainable Urban Transportation System,”Energy for Sustainable Development (Journal of the International EnergyInitiative, July 1995, pp. 11–18; Figure 3 from Rabinovitch with Leitman,op. cit. note 61; zoning laws from Jonas Rabinovitch and John Hoehn, “ASustainable Urban Transportation System: the “Surface Metro” in Curitiba,Brazil,” report of the Environmental and Natural Resources Policy andTraining Project (Madison, WI: University of Wisconsin, Madison, 19 May1995), pp. 35–37.
64. Jonas Rabinovitch, “Innovative Land Use and Public Transport Policy,”Land Use Policy, vol. 13, no. 1 (1996), pp. 51–67.
65. Rabinovitch, op. cit. note 64; Jonas Rabinovitch and Josef Leitman,“Urban Planning in Curitiba,” Scientific American, March 1996, pp. 26–33; City Hall of Curitiba, International Relations Office, e-mail toauthor, 17 June 1998 (e-mail: [email protected]).
66. Flood zoning from Rabinovitch with Leitman, op. cit. note 61, p. 26;City Hall of Curitiba, op. cit. note 65.
67. Rabinovitch with Leitman, op. cit. note 61; City Hall of Curitiba, op.cit. note 65.
68. Environmental education from Rabinovitch with Leitman, op. cit. note61, pp. 44–47; children from McKibben, op. cit. note 62, pp. 86–89.
69. McKibben, op. cit. note 62, p. 61.
70. Deborah Lynn Bleviss, “Urban Transportation: Challenges Facing LatinAmerica,” (Washington, DC: InterAmerican Development Bank, 1999),<www.iadb.org/sds/doc/UrbanTransportBleviss.pdf>, p. 5.
71. Goddard, op. cit. note 9, p. 178.
72. Goddard, op. cit. note 9. Even the world’s earliest cities had some formof planning to organize land use. In response to the Industrial Revolution,zoning was used in Western Europe to preserve the architectural character,light, and air of streets, and separate dirty industries from residences, but itdeveloped furthest in the United States.
73. Yaakov Garb, Floersheimer Institute for Policy Studies, Jerusalem, Israel,phone interview, 1 May 2001; Yaakov Garb and Jonathan Levine, “How theIllusion of Strong Planning Undermines Planning: Anticipating the Trans-Israel Highway’s Land-Use Impacts,” draft manuscript distributed to accom-pany presentation at the conference on “Fifty Years of Planning in Israel:Theory and Practice,” Technion, December 1998.
74. Lloyd Wright, U.S. Agency for International Development, presenta-tion at United Nations Commission on Sustainable Development, NewYork, 18 May 2001.
75. Studies from VNG uitgeverij, The Economic Significance of Cycling: AStudy to Illustrate the Costs and Benefits of Cycling Policy (The Hague: 2000);woonerf from Spiro Kostof, The City Assembled (Boston: Bullfinch Press/LittleBrown and Company, 1992), pp. 240–41.
76. European Commission, European Sustainable Cities (Brussels: 1996);Germany from “They Couldn’t Car Less,” Grist Magazine, 10 March 2000;Car Free Cities Network on the Internet at <www.eurocities.org/networks/netprog.html>, viewed 4 February 1999.
77. Oscar Edmundo Diaz, “Awake at the Wheel: Bogotá’s Response to theTransportation Challenge,” Encompass, vol. 5, no. 3 (February/March 2001),pp. 5–7; Enrique Peñalosa, visiting scholar at New York University, NewYork, discussion with author, 3 May 2001; Steven Ambrus, “Bogotá Takes aBreather,” EcoAmericas, March 2000, p. 10.
78. Haynes C. Goddard, “Using Tradeable Permits to Achieve Sustainabilityin the World’s Largest Cities,” Environmental and Resource Economics, July1997, pp. 63–99, and from Gunnar S. Eskeland and Shantayanan Devarajan,Taxing Bads by Taxing Goods: Pollution Control with Presumptive Charges(Washington, DC: World Bank, 1996).
79. Diaz, op. cit. note 77; Jimmy Weiskopf, “Bogotá Among First LatinAmerican Capitals to Implement Day Restricting Use of Cars,” InternationalEnvironment Reporter, 15 March 2000, pp. 148–49.
80. Robert Cervero, “Paratransit: The Gap Fillers,” Habitat Debate, vol. 4,no. 2 (1998), pp. 8–9.
81. PIARC Committee on Intelligent Transport, “Fighting Traffic with

81NOTES80 CITY LIMITS
Revitalizing Older Communities (Washington, DC: National GovernorsAssociation, 2000), p. 8.
91. Garb, op. cit. note 73.
92. Paul S. Grogan and Tony Proscio, Comeback Cities: A Blueprint for UrbanNeighborhood Revival (Boulder, CO: Westview Press, 2000), pp. 103–26.
93. David B. Goldstein, “Making Housing More Affordable: CorrectingMisplaced Incentives in the Lending System,” (San Francisco: NaturalResources Defense Council, May 1996); Congress for the New Urbanism, op.cit. note 85, Location Efficient Mortgage, <http://locationefficiency.com>,viewed 11 April 2001.
94. David Perry, ed., Building the Public City: The Politics, Governance, andFinance of Public Infrastructure (Thousand Oaks, CA: Sage Publications, 1995);Roy Bahl and Johannes Linn, Urban Public Finance in Developing Countries(New York: Oxford University Press for the International Bank forReconstruction and Development, 1992); Kenneth C. Wenzer, ed., Land-Value Taxation: The Equitable and Efficient Source of Public Finance (Armonk,NY: M.E. Sharpe, 1999).
95. Kenya from VNG uitgeverij, op. cit. note 75, p. 42; Lima from PaulGuitink, Senior Transportation Specialist, World Bank, Washington, DC, dis-cussion with author, 4 May 2001.
96. Jos Dings, Centre for Energy Conservation and EnvironmentalTechnology, Delft, Netherlands, discussion with author 22 February 2001;variable costs from Todd Litman, The Costs of Automobile Dependency(Victoria, BC, Canada: Victoria Transport Policy Institute, 1996); Figure 3from American Automobile Association, Your Driving Costs, 1998 ed., citedin Stacy C. Davis, Transportation Energy Data Book: Edition 19 (Oak Ridge, TN:Oak Ridge National Laboratory, September 1999), pp. 5-14–5-15.
97. Table 6 contains national average prices and taxes for most countriesfrom International Energy Agency (IEA), Monthly Price Statistics: End-User OilProduct Prices and Average Crude Oil Import Costs, October 2000,<www.iea.org/statist/index.htm>, viewed 2 December 2000; for Brazil,India, South Africa, China, Russia, and Indonesia, capital city prices and$.32 untaxed world average price are from Gerhard Metschies, GTZ Fuel PriceSurvey 2000 (Eschborn, Germany: Deutsche Gesellschaft für TechnischeZusammenarbeit (GTZ), forthcoming), with preliminary data from idem,GTZ, e-mail to author, 28 December 2000. Price adjustments from GerhardP. Metschies, Fuel Prices and Taxation: With Comparative Tables for 160Countries (Eschborn, Germany: GTZ, May 1999).
98. Per Kågeson and Jos Dings, Electronic Kilometre Charging for Heavy GoodsVehicles in Europe (Brussels: European Federation for Transport andEnvironment, 1999).
Technology,” The Futurist, September–October 2000, p. 30; personal rapid tran-sit from University of Washington, “Personal Rapid Transit (PRT) Quicklinks,”<faculty.washington.edu/~jbs/itrans/prtquick.htm>, viewed 1 June 2001, andfrom University of Bristol, Advanced Transport Group, “Transport for theFuture,” <atg.fen.bris.ac.uk/ultra.html>, viewed 1 June 2001.
82. Kenworthy et al., op. cit. note 6, pp. 547–50.
83. Quote from Emin Tengström, Towards Environmental Sustainability? AComparative Study of Danish, Dutch and Swedish Transport Policies in aEuropean Context (Aldershot, U.K.: Ashgate Publishing, 1999), pp. 77–85;“ABC” policy from Gary Haq, Towards Sustainable Transport Planning: AComparison between Britain and the Netherlands (Aldershot, U.K.: AveburyPublishing, 1997), p. 99.
84. “Bangkok’s Train, Running on Empty,” The Economist, 23 December2000, p. 46.
85. Congress for the New Urbanism, Charter of the New Urbanism (NewYork: McGraw Hill, 2000); Andres Dvany, Elizabeth Plater-Zyberk, and JeffSpeck, Suburban Nation: The Rise of Sprawl and the Decline of the AmericanDream (New York: Farrar, Straus and Giroux, 2000).
86. Historical ratio from Arnulf Grübler, The Rise and Fall of Infrastructures:Dynamics of Evolution and Technological Change in Transport (New York:Springer-Verlag, 1990), pp. 254–58; past expectations from Frank W. Geelsand Wim A. Smit, “Failed Technology Futures: Pitfalls and Lessons From AHistorical Survey,” Futures, vol. 32 (2000), pp. 867–85.
87. Joel Kotkin, The New Geography: How the Digital Revolution Is Reshapingthe American Landscape (New York: Random House, 2000), p. 7; Peter Hall,Cities in Civilization (New York: Pantheon Books, 1998), p. 963.
88. State of Maryland Smart Growth Program, <www.op.state.md.us/smartgrowth/smartwhat.htm>, viewed 4 January 2001; Lori Montgomery,“Md. Going ‘Beyond the Pavement’; State Shifting Focus From Roads toPedestrians,” Washington Post, 15 September 2000; Edward T. McMahon,“Why Can’t Johnny Walk to School?” Elm Street Writers Group,<www.mlui.org/projects/growthmanagement/elmstreet/mcmahon.html>,viewed 12 April 2001.
89. Estimates from Garb, op. cit. note 73. A recent survey of 70 U.S. citiesfound that, on average, 15 percent of developable urban land was vacant,ranging from undisturbed open space to previously used “brownfields.”Michael A. Pagano and Ann O’M. Bowman, “Vacant Land in Cities: AnUrban Resource,” (Washington, DC: Brookings Institution Center on Urbanand Metropolitan Policy Survey Series, December 2000).
90. Joel S. Hirschhorn, New Mission for Brownfields: Attacking Sprawl By

8382 NOTESCITY LIMITS
99. Pricing from H. William Batt, “Motor Vehicle Transportation andProper Pricing: User Fees, Environmental Fees, and Value Capture,”Ecological Economics Bulletin, First Quarter 1998, pp. 10–14; Singapore fromDavid Weller, “For Whom the Road Tolls: Road Pricing in Singapore,”Harvard International Review, summer 1998, pp. 10–11, and from Charles P.Wallace, “Singapore’s Attempt to Curb Traffic,” San Francisco Chronicle, 7February 1995.
100. Federal laws from Donald C. Shoup, “An Opportunity to ReduceMinimum Parking Requirements,” APA Journal, winter 1995, and fromOffice of Senator Lincoln Chafee, U.S. Congress, “Chafee Touts New‘Commuter Choice’, Employee Benefits,” Capitol Hill Press Releases, 8December 1998; Maryland from Michael Replogle and Lisa Swann, “A PayRaise for Not Driving to Work,” press release (Washington, DC:Environmental Defense, 11 May 2000).
101. Chris Kavalec and James Woods, “Towards Marginal Cost Pricing ofAccident Risk: The Energy, Travel and Welfare Impacts of Pay-at-the-PumpAuto Insurance,” Energy Policy, vol. 27 (1999), pp. 331–42; Todd Litman,“Distance-based Vehicle Insurance as a TDM Strategy,” TransportationQuarterly, vol. 51, no. 3 (1997), pp. 119–137.
102. Mardiste et al., op. cit. note 18.
103. Robert Puentes, Flexible Funding for Transit: Who Uses It? (Washington,DC: Brookings Institution Center on Urban and Metropolitan Policy, May2000); STPP, Changing Direction: Federal Transportation Spending in the 1990s(Washington, DC: March 2000), p. 20; Don Chen, STPP, Washington, DC,discussion with author, 30 August 2000.
104. Quote from Federal Housing Administration 1938 “UnderwritingManual” from Evan McKenzie, Privatopia: Homeowner Associations and theRise of Residential Private Government (New Haven: Yale University Press,1994), pp. 64–65.
105. Mike Burton quoted in Molly O’Meara, “How Mid-Sized Cities CanAvoid Strangulation,” World Watch, September/October 1998, p. 13.
106. Raad and Kenworthy, op. cit. note 15, pp. 15–16.
107. Frisken et al., op. cit. note 16; Raad and Kenworthy, op. cit. note 15, p. 18.
108. Raad and Kenworthy, op. cit. note 15, p. 18; Joe Chidley, “The Fight forToronto: A Proposed Merger Draws Cries of Outrage from Rich and Poor,Right and Left,” MacLean’s, 17 March 1997; Richard Brennan, “ProvinceFights Traffic Gridlock With $250 Million for Transit,” Toronto Star, 10 May2001.
109. Andrew Reschovsky, “The Impact of Decentralization on Cities’ FiscalHealth: Lessons from the United States,” in Shahid Yusuf, Weiping Wu, andSimon Evenett, eds., Local Dynamics in an Era of Globalization (Washington,DC: World Bank, 2000), pp. 148–58.
110. France from Reschovsky, op. cit. note 109.
111. Report on the U.N. International Roundtable on Transportation EnergyEfficiency and Sustainable Development, 5–7 December 1999, Cairo, Egypt;“World Bank Lending for Transport,” <www.worldbank.org/html/fpd/transport/lending.htm>, viewed 7 June 2000; Magda Stoczkiewicz, “TheConditions Attached to Western Money,” T&E Bulletin (newsletter of theEuropean Federation for Transport and Environment, Brussels), May 2000;Magda Stoczkiewicz, Central and Eastern Europe (CEE) Bankwatch Network,Brussels, discussion with author, 2 October 2000.
112. Mumford, op. cit. note 29, p. 486.
113. Alex Marshall, How Cities Work (Austin: University of Texas Press,2000), p. 193 and 195.
114. Anton Nelessen quoted in Ruth Eckdish Knack, “Tony Nelessen’s Do-It-Yourself Neotraditionalism,” Planning, vol. 57, no. 12 (December 1991), p. 18; Calthorpe and Fulton, op. cit. note 56.
115. Calthorpe and Fulton, op. cit. note 56, pp. 128–38.
116. Ted Turner quoted in Sue Anne Presley, “Atlanta’s Booming Growth IsNo Easy Ride,” Washington Post, 4 December 1998; anti-sprawl platformfrom Jill Jordan Sieder, “Traffic Jam: In Atlanta, A Pitched Battle Over Roads,Pollution, and Boundless Urban Sprawl,” U.S. News & World Report, 8February 1999, p. 28; new agency from Russ Bynum, “Ga. Lawmakers OKAnti-Sprawl Agency,” Associated Press, 25 March 1999.
117. Patricio Lanfranco, Ciudad Viva, Santiago de Chile, discussion withauthor, 18 April 2001.
118. Jessica Alexander, “Ciclistas Furiosos Pedal in Protest,” Christian ScienceMonitor, 16 August 2000; John Roach, “Cyclists Plug Santiago Streets toProtest Smog,” Environmental News Network, 2 October 2000; Lanfranco, op. cit. note 117.
119. Jeffrey Maganya, Program Manager for the Transport Program in EastAfrica, Intermediate Technology Development Group (ITDG), Nairobi,Kenya, discussion with author, 8 May 2001.
120. Guitink, op. cit. note 95.
121. Frazer Goodwin, Policy Officer, European Federation for Transport and

8584 NOTESCITY LIMITS
Environment, Brussels, phone discussion with author, 21 September 2000;Western European governments shifting taxes from David Malin Roodman,“Environmental Tax Shifts Multiplying,” in Lester R. Brown et al., Vital Signs2000: The Environmental Trends That Are Shaping Our Future (New York: W.W.Norton & Company, 2000), pp. 138–139.
122. Klaas Breunissen, Milieudefensie, Amsterdam, Netherlands, discussionwith author, 3 April 2001.
123. Lynn Sloman, Assistant Director, Transport 2000, London, UnitedKingdom, discussion with author, 10 October 2000.
124. Maganya, op. cit. note 119.
125. Lloyd Wright, U.S. Agency for International Development, presenta-tion at the U.N. Commission on Sustainable Development, 18 April 2001;38 states from Hirschhorn, op. cit. note 27, p. 64; 1000 Friends from DonaldC. Williams, Urban Sprawl: A Reference Handbook (Santa Barbara, CA: ABC-CLIO, 2000), pp. 170–172; elections and ballot initiatives from Phyllis Myersand Robert Puentes, Growth at the Ballot Box: Electing the Shape ofCommunities in November 2000 (Washington, DC: Brookings Institution,February 2001).
126. Psychology from Keith Bradsher, “Was Freud a Minivan or S.U.V. Kindof Guy?” New York Times, 17 July 2000; Table 7 from “Total Measured U.S.Ad Spending by Category & Media in 1998” and “Measured Ad Spending byCategory,” Advertising Age, <http://adage.com/dataplace/archives/dp409.html>, viewed 19 July 2000; Anna Wilde Mathews, “Ford Motor GetsStarring Role on WB Network,” Wall Street Journal, 21 March 2001.
127. Garb, op. cit. note 19, p. 9; Walter Hook, Executive Director, Institutefor Transportation and Development Policy, New York, discussion withauthor, 28 September 2000.
128. Fred S. McChesney, Money for Nothing: Politicians, Rent Extraction, andPolitical Extortion (Cambridge, MA: Harvard University Press, 1997); HollyBailey, “The Big Winners: A Look at Tax Breaks Won by Special Interests,”Money in Politics Alert, Center for Responsive Politics, Washington, DC, 2August 1999; contributions of real estate, construction, transportation, andoil and gas industries from Center for Responsive Politics, “2000 ElectionOverview,” <www.opensecrets.org/2000elect/storysofar/sectors.asp>, viewed25 May 2001; J.L. Laws, “Boehlert Seeks Bipartisan Bloc to Fight CAFERider,” Energy and Environment Daily, 13 March 2000, pp. 11–12.
129. European Commission, Transport in Figures, <www.europa.eu.int>,viewed 29 January 2001; U.S. from American Public Transit Association(APTA), “For Fifth Straight Year, Public Transportation on the Rise,” pressrelease (Washington, DC: 16 April 2001).
130. Europe from <www.carsharing.net>, viewed 16 May 2001, and fromMary Williams Walsh, “Car Sharing Holds the Road in Germany,” LosAngeles Times, 23 July 1998; U.S. from Fred Bayles, “A Hot Import:Communal Cars for Congested Streets,” USA Today, 21 July 2000; WilliamClay Ford, Jr., Speech at the 5th Annual Greenpeace Business Conference,London, 5 October 2000.
131. E.B. White, One Man’s Meat (New York: Harper & Row, 1944); Congressof the New Urbanism, <www.cnu.org>, viewed 16 May 2001.
132. Lanfranco, op. cit. note 117.
133. Stoczkiewicz, discussion with author, op. cit. note 111; Garb, op. cit.note 73.
134. Goddard, op. cit. note 9, p. 114.
135. Enrique Peñalosa, former mayor of Bogotá, presentation at the UnitedNations, New York, 18 April 2001; Bremen Initiative, “New Partnerships forthe 21st Century,” <www.bremen-initiative.de/news/>, viewed 25 May2001.
136. U.K. from Maddison et al., op. cit. note 43, p. 6; U.S. from Pew Centerfor Civic Journalism, Straight Talk from Americans-2000, Survey conducted byPrinceton Survey Research Associates for the Pew Center for CivicJournalism, February 2000; Haya El Nasser, “Survey Favors ControllingSprawl,” USA Today, 17 October 2000.
137. Eisenhower quoted in Goddard, op. cit. note 9, p. 194.
138. Peñalosa, op. cit. note 135.


![Pep Pac [1962] - Internet Archive](https://static.fdokumen.com/doc/165x107/6333c77d3108fad7760f3690/pep-pac-1962-internet-archive.jpg)