Urban Edge Computing - TUprints
310
Urban Edge Computing Gedeon, Julien (2020) DOI (TUprints): https://doi.org/10.25534/tuprints-00013362 Lizenz: CC-BY-NC-ND 4.0 International - Creative Commons, Attribution Non-commerical, No-derivatives Publikationstyp: Ph.D. Thesis Fachbereich: 20 Department of Computer Science Quelle des Originals: https://tuprints.ulb.tu-darmstadt.de/13362
-
Upload
khangminh22 -
Category
Documents
-
view
2 -
download
0
Transcript of Urban Edge Computing - TUprints
Urban Edge ComputingGedeon, Julien
(2020)
DOI (TUprints): https://doi.org/10.25534/tuprints-00013362
Lizenz:
CC-BY-NC-ND 4.0 International - Creative Commons, Attribution Non-commerical,No-derivatives
Publikationstyp: Ph.D. Thesis
Fachbereich: 20 Department of Computer Science
Quelle des Originals: https://tuprints.ulb.tu-darmstadt.de/13362
Urban Edge Computing
Vom Fachbereich Informatikder Technischen Universität Darmstadt
Dissertation
zur Erlangung des akademischen GradesDoktor-Ingenieur (Dr.-Ing.)
Eingereicht von:Julien Alexander Gedeon
geboren am 4. August 1987 in Frankfurt am Main
Tag der Einreichung: 18.06.2020
Tag der Disputation: 30.07.2020
Erstreferent: Prof. Dr. Max Mühlhäuser
Korreferent: Prof. Dr. Christian Becker
Darmstadt 2020
Hochschulkennziffer D 17
Julien Alexander Gedeon: Urban Edge ComputingDarmstadt, Technische Universität Darmstadt
Jahr der Veröffentlichung der Dissertation auf TUprints: 2020URN: urn:nbn:de:tuda-tuprints-133628URI: https://tuprints.ulb.tu-darmstadt.de/id/eprint/13362Tag der mündlichen Prüfung: 30.07.2020
Veröffentlicht unter CC BY-NC-ND 4.0 International.https://creativecommons.org/licenses/by-nc-nd/4.0
Abstract
The new paradigm of Edge Computing aims to bring resources for storage and com-putations closer to end devices, alleviating stress on core networks and enablinglow-latency mobile applications. While Cloud Computing carries out processing inlarge centralized data centers, Edge Computing leverages smaller-scale resources—often termed cloudlets—in the vicinity of users. Edge Computing is expected to sup-port novel applications (e.g., mobile augmented reality) and the growing number ofconnected devices (e.g., from the domain of the Internet of Things). Today, however,we lack essential building blocks for the widespread public availability of Edge Com-puting, especially in urban environments. This thesis makes several contributionsto the understanding, planning, deployment, and operation of Urban Edge Comput-ing infrastructures. We start from a broad perspective by conducting a thoroughanalysis of the field of Edge Computing, systematizing use cases, discussing poten-tial benefits, and analyzing the potential of Edge Computing for different types ofapplications.
We propose re-using existing physical infrastructures (cellular base stations,WiFi routers, and augmented street lamps) in an urban environment to providecomputing resources by upgrading those infrastructures with cloudlets. On thebasis of a real-world dataset containing the location of those infrastructures andmobility traces of two mobile applications, we conduct the first large-scale mea-surement study of urban cloudlet coverage with four different metrics for coverage.After having shown the viability of using those existing infrastructures in an urbanenvironment, we make an algorithmic contribution to the problem of which loca-tions to upgrade with cloudlets, given the heterogeneous nature (with regards tocommunication range, computing resources, and costs) of the underlying infrastruc-ture. Our proposed solution operates locally on grid cells and is able to adapt to thedesired tradeoff between the quality of service and costs for the deployment. Usinga simulation experiment on the same mobility traces, we show the effectiveness ofour strategy.
Existing mechanisms for computation offloading typically achieve loose cou-pling between the client device and the computing resources by requiring priortransfers of heavyweight execution environments. In light of this deficiency, wepropose the concept of store-based microservice onloading, embedded in a flexi-ble runtime environment for Edge Computing. Our runtime environment oper-ates on a microservice-level granularity and those services are made available ina repository—the microservice store—and, upon request from a client, transferredfrom the store to execution agents at the edge. Furthermore, our Edge Comput-ing runtime is able to share running instances with multiple users and supports theseamless definition and execution of service chains through distributed messagequeues. Empirical measurements of the implemented approach showed up to 13times reduction in the end-to-end latency and energy savings of up to 94 % for themobile device.
We provide three contributions regarding strategies and adaptations of an EdgeComputing system at runtime. Existing strategies for the placement of data andcomputation components are not adapted to the requirements of a heterogeneous(e.g., with regards to varying resources) edge environment. The placement of func-tional parts of an application is a core component of runtime decisions. This prob-lem is computationally hard and has been insufficiently explored for service chains
iii
whose topologies are typical for Edge Computing environments (e.g., with regardsto the location of data sources and sinks). To this end, we present two classes ofheuristics that make the problem more tractable. We implement representativesfor each class and show how they substantially reduce the time it takes to find asolution to the placement problem, while introducing only a small optimality gap.The placement of data (e.g., such captured by mobile devices) in Edge Computingshould take into account the user’s context and the possible intent of sharing thisdata. Especially in the case of overloaded networks, e.g., during large-scale events,edge infrastructure can be beneficial for data storage and local dissemination. Toaddress this challenge, we propose vStore, a middleware that—based on a set ofrules—decouples applications from pre-defined storage locations in the cloud. Wereport on results from a field study with a demonstration application, showing thatwe were able to reduce cloud storage in favor of proximate micro-storage at theedge.
As a final contribution, we explore the adaptation possibilities of microservicesthemselves. We suggest to make microservices adaptable in three dimensions: (i) inthe algorithms they use to perform a certain task, (ii) in their parameters, and (iii) inauxiliary data that is required. These adaptations can be leveraged to trade a fasterexecution time for a decreased quality of the computation (e.g., by producing moreinaccurate or partly wrong results). We argue that this is an important buildingblock to be included in an Edge Computing system in view of both constrainedresources and strict requirements on computation latencies. We conceptualize anadaptable microservice execution framework and define the problem of choosingthe service variant, building upon the design of our previously introduced EdgeComputing runtime environment. For a case study, we implement representativeexamples (e.g., in the field of computer vision and image processing) and outlinethe practical influence of the abovementioned tradeoff.
In conclusion, this dissertation systematically analyzes the field of Urban EdgeComputing, thereby contributing to its general understanding. Our contributionsprovide several important building blocks for the realization of a public Edge Com-puting infrastructure in an urban environment.
iv

Zusammenfassung
Das neue Paradigma des Edge Computing zielt darauf ab, Ressourcen für Daten-speicherung und Berechnungen näher an Endgeräte zu verlagern, um so die Be-lastungen in den Kernnetzen zu verringern und geringe Latenzen für mobile An-wendungen zu ermöglichen. Während bei Cloud Computing die Datenverarbeitungin großen, zentralisierten Rechenzentren erfolgt, nutzt Edge Computing kleinereopportunistische Ressourcen – oftmals als Cloudlets bezeichnet – in der Nähe derBenutzer. Es wird davon ausgegangen, dass Edge Computing sowohl neuartige An-wendungen (z.B. Mobile Augmented Reality) ermöglichen, als auch die wachsendeAnzahl von vernetzen Geräten (z.B. im Umfeld des Internet der Dinge) unterstützenwird. Heute fehlen jedoch wesentliche Bausteine für eine breite, allgemeine Ver-fügbarkeit von Edge Computing, insbesondere in urbanen Umgebungen. Die vor-liegende Dissertation liefert mehrere Beiträge zum Verständnis, zur Planung, zurBereitstellung, sowie zum Betrieb von Urban-Edge-Computing-Infrastrukturen. Wirnehmen zunächst eine breite Perspektive ein, indem wir das Forschungsfeld des Ed-ge Computing eingrenzen, Anwendungsfälle systematisieren, die Vorteile von EdgeComputing diskutieren und dessen Potenzial für verschiedene Arten von Anwen-dungen analysieren.
Wir schlagen vor, bestehende physische Infrastrukturen (Mobilfunk-Basisstatio-nen, WiFi-Router und neuartige Straßenlaternen) in einer städtischen Umgebungzur Bereitstellung von Rechenressourcen zu verwenden, indem diese Infrastruktu-ren mit Cloudlets aufgerüstet werden. Auf Grundlage eines realen Datensatzes, derdie Standorte dieser Infrastrukturen und die Bewegungsdaten zweier mobiler An-wendungen enthält, präsentieren wir erstmals eine groß angelegte Messstudie zurstädtischen Cloudlet-Abdeckung. Diese Analyse führen wir auf Grundlage von vierverschiedenen Metriken für Abdeckung durch. Hierdurch zeigen wir die Machbar-keit der Nutzung dieser bestehenden Infrastrukturen in einer städtischen Umge-bung für die Bereitstellung von Rechenressourcen durch Cloudlets. Basierend aufdiesen Erkenntnissen leisten wir einen algorithmischen Beitrag zur Frage, welcheStandorte mit Cloudlets aufgerüstet werden sollten, unter der Annahme, dass diezugrundeliegenden Infrastrukturen heterogen (in Bezug auf Kommunikationsreich-weite, Ressourcen und Kosten) sind. Unser Ansatz operiert lokal auf Planquadratenund ist in der Lage, sich an einen variierenden Tradeoff zwischen Dienstgüte undKosten anzupassen. Mittels eines Simulationsexperiments, das auf den gleichen vor-her genannten Bewegungsdaten basiert, zeigen wir die Effektivität unseres Ansat-zes.
Bestehende Ansätze für die Auslagerung von Berechnungen sind oft mit einemhohen Aufwand verbunden, weil vor der Ausführung die Übertragung schwerge-wichtiger Ausführungsumgebungen vom Endgerät erforderlich ist, um eine loseKopplung zwischen den Endgeräten und den Rechenressourcen zu erreichen. An-gesichts dieses Mankos schlagen wir das Konzept des Microservice Store Onloadingvor und betten dieses in eine flexible Laufzeitumgebung für Edge Computing ein.Diese Laufzeitumgebung nutzt feingranulare Module, sog. Microservices für die Aus-führung von Berechnungen und hält diese Microservices in einem sog. MicroserviceStore vor. Auf eine Anfrage von Benutzern hin werden die Microservices vom Sto-re direkt auf Agenten am Rande des Netzwerkes übertragen und ausgeführt. DesWeiteren ist die von uns vorgeschlagene Laufzeitumgebung in der Lage, laufendeService-Instanzen zwischen verschiedenen Benutzern zu teilen und ermöglicht über
v
verteilte Nachrichtenwarteschlangen die Definition und Ausführung von verkette-ten Microservices. Empirische Messungen des implementierten Ansatzes zeigten ei-ne bis zu 13-mal geringere Ende-zu-Ende-Latenz sowie Energieeinsparungen vonbis zu 94 % für die mobilen Client-Geräte.
Wir liefern drei Beiträge zu Entscheidungsstrategien und Anpassungen einerEdge Computing-Ausführungsumgebung zur Laufzeit. Bestehende Strategien zurPlatzierung von Daten und Berechnungskomponenten sind nicht an die Anfor-derungen einer (z.B. in Bezug auf Ressourcen) heterogenen Edge-Computing-Umgebung angepasst. Die Platzierung von funktionalen Teilen einer Anwendungist eine Kernentscheidung in Ausführungsumgebungen. Dieses Platzierungsproblemist rechenaufwändig und wurde für Service-Ketten, deren Topologien typisch fürEdge-Computing-Umgebungen sind (z.B. im Hinblick auf die Lage von Datenquel-len und -Senken im Netzwerk), bisher nur unzureichend untersucht. Aufbauendauf dieser Beobachtung stellen wir zwei Klassen von Heuristiken vor, die das Plat-zierungsproblem in Edge Computing besser handhabbar machen. Für jede Klassevon Heuristiken implementieren wir Repräsentanten und zeigen, dass unser Ansatzdie Zeit, die für die Lösung des Platzierungsproblems benötigt wird, erheblich redu-ziert. Zudem weisen die so gefundenen Lösungen nur minimale Abweichungen zuroptimalen Platzierungsentscheidung auf. Die Platzierung von Daten in Edge Com-puting (z.B. solcher, die über mobile Endgeräte erfasst werden) sollte idealerweiseden aktuellen Kontext des Benutzers sowie das Teilen der Daten berücksichtigen.Insbesondere bei überlasteten Netzwerken, z.B. infolge von Großveranstaltungen,können Edge-Computing-Infrastrukturen nützlich für die Speicherung und Ver-teilung von Daten sein. Hierzu schlagen wir vStore vor, eine Middleware, die –basierend auf einer Menge von Regeln – Anwendungen von ihren vordefiniertenSpeicherorten in der Cloud entkoppelt. Wir analysieren die Ergebnisse einer Feld-studie, durchgeführt mit einer Beispielanwendung, und zeigen auf, dass unserAnsatz in der Lage ist, Speicherorte von der Cloud an den Rand des Netzes zuverlagern.
Als abschließenden Beitrag untersuchen wir die Anpassungsmöglichkeiten derMicroservices selbst. Wir schlagen vor, die Microservices in dreierlei Hinsicht anzu-passen: (i) in den Algorithmen, die sie zur Ausführung einer bestimmten Aufgabeverwenden, (ii) in ihren Parametern und (iii) in ggf. für die Ausführung erforderli-chen weiteren (Hilfs-)Daten. Diese Anpassungen können z.B. genutzt werden, umeine schnellere Ausführungszeit im Gegenzug für eine verminderte Qualität der Be-rechnung (z.B. durch ungenauere oder teilweise falsche Ergebnisse) zu erreichen.Wir zeigen auf, dass diese Abwägung ein wichtiger Baustein in Edge-Computing-Umgebungen ist, bedingt sowohl durch die typische Ressourcenknappheit auf dereinen, als auch im Hinblick auf strikte Latenzanforderungen auf der anderen Seite.Wir konzipieren eine Laufzeitumgebung, die anpassbare Microservices unterstützt,und definieren das Problem der Auswahl einer konkreten Dienstvariante, wobei wirauf dem Design der zuvor vorgestellten Edge-Computing-Ausführungsumgebungaufbauen. In einer Fallstudie demonstrieren wir anhand von repräsentativen Bei-spielen (z.B. im Bereich von Computer Vision und Bildverarbeitung) den Prakti-schen Einfluss der oben genannten Abwägungsentscheidung.
Zusammenfassend bietet diese Dissertation eine systematische Analyse des For-schungsfeldes von Urban Edge Computing. Unsere Beiträge liefern wichtige Bau-steine zur Realisierung einer allgemein verfügbaren Edge-Computing-Infrastrukturim urbanen Raum.
vi

Acknowledgments
Completing this thesis would not have been possible without the continuous supportand encouragement of my supervisors, colleagues, family, and friends. Thank youfor having been by my side on this journey.
First of all, there is of course Max, who gave me the chance to pursue myPhD in the Telecooperation group. Despite your busy schedule at times, I couldalways count on your support when I needed it most. Thanks for all the inspiringdiscussions—big and small—and your feedback over the past years. Thanks for cre-ating a working environment where one is able to openly speak their mind. I didnot take this for granted. I am also thankful to Christian Becker for his commentsand his willingness to act as a co-referee for my thesis.
A big thanks goes to Immanuel Schweizer, who inspired me to do research and,ultimately, recruited me. Working at TK has truly been a pleasure. Michael Steinhas been a great colleague in guiding me through the PhD jungle. I’ll always valueyour advice! Big cheers to my other (former) office mates Florian Brandherm, JensHeuschkel, and Martin Wagner.
Thanks to the following people for having inspired my research and fosteredinteresting discussions: Carlos Garcia, Alexander Seeliger, Tim Grube, Florian Volk,Tim Neubacher, Sebastian Wagner, Katharina Keller, and Patrick Felka. Sorry to thefolks in A316 for my countless interruptions and rants. Speaking of A316, thanksto Jörg Daubert and Rolf Egert for maintaining a healthy supply of refreshmentsup there. A big thanks has to go to the people who keep TK running, sometimeswithout being noticed and acknowledged enough: Elke Halla, Elke Reimund, FabianHerrlich, and Sebastian Alles.
Supervising and working with gifted students has been an amazing part of mytime at TK. Following the saying “If you are the smartest person in the room, youprobably are in the wrong room”, we learned from each other and realized amaz-ing ideas! In this regard, special thanks go out to Disha Bhat, Ali Karpuzoglu, JeffKrisztinkovics, Nicolas Himmelmann, Karolis Skaisgiris, Alexandra Skogseide, Mar-tin Wagner and Sebastian Zengerle.
Believe it or not, I managed to maintain a social life outside the PhD bubble.Thanks to all of my friends for supporting me, listening to my annoying complaints,and lifting me up again every time. A special thanks to Katharina Bina, HannaBarysevich, and Alice Pairault. You all are amazing! Last, but not least, a big thanksgoes out to my family.
vii

Author’s Publications
Large parts of the content of this dissertation have been published in journals or aspart of the proceedings of peer-reviewed international conferences and workshops.In the following, we list all authored and co-authored publications of the author ofthis dissertation.
Main Publications
[Ged+17] Julien Gedeon, Christian Meurisch, Disha Bhat, Michael Stein, LinWang, and Max Mühlhäuser. “Router-based Brokering for SurrogateDiscovery in Edge Computing”. In: Proc. of the International Con-ference on Distributed Computing Systems Workshops (ICDCS Work-shops). 2017, pp. 145–150.
[Ged+18a] Julien Gedeon, Jens Heuschkel, Lin Wang, and Max Mühlhäuser. “FogComputing: Current Research and Future Challenges”. In: Proc. of1.GI/ITG KuVS Fachgespräche Fog Computing. 2018, pp. 1–4.
[Ged+18b] Julien Gedeon, Nicolás Himmelmann, Patrick Felka, Fabian Her-rlich, Michael Stein, and Max Mühlhäuser. “vStore: A Context-AwareFramework for Mobile Micro-Storage at the Edge”. In: Proc. of the In-ternational Conference on Mobile Computing, Applications and Services(MobiCASE). 2018, pp. 165–182.
[Ged+18c] Julien Gedeon, Jeff Krisztinkovics, Christian Meurisch, Michael Stein,Lin Wang, and Max Mühlhäuser. “A Multi-Cloudlet Infrastructure forFuture Smart Cities: An Empirical Study”. In: Proc. of the 1st Interna-tional Workshop on Edge Systems, Analytics and Networking (EdgeSys).ACM. 2018, pp. 19–24.
[Ged+18d] Julien Gedeon, Michael Stein, Jeff Krisztinkovics, Patrick Felka,Katharina Keller, Christian Meurisch, Lin Wang, and Max Mühlhäuser.“From Cell Towers to Smart Street Lamps: Placing Cloudlets on Ex-isting Urban Infrastructures”. In: Proc. of the 2018 IEEE/ACM Sympo-sium on Edge Computing (SEC). IEEE. 2018, pp. 187–202.
[Ged+18e] Julien Gedeon, Michael Stein, Lin Wang, and Max Mühlhäuser. “OnScalable In-Network Operator Placement for Edge Computing”. In:Proc. of the 27th International Conference on Computer Communica-tion and Networks (ICCCN). IEEE. 2018, pp. 1–9.
[Ged+19a] Julien Gedeon, Florian Brandherm, Rolf Egert, Tim Grube, and MaxMühlhäuser. “What the Fog? Edge Computing Revisited: Promises,Applications and Future Challenges”. In: IEEE Access 7 (2019),pp. 152847–152878.
[Ged+19b] Julien Gedeon, Martin Wagner, Jens Heuschkel, Lin Wang, and MaxMühlhäuser. “A Microservice Store for Efficient Edge Offloading”. In:Proc. of the IEEE Global Communications Conference (GLOBECOM).2019, pp. 1–6.
[Ged+20] Julien Gedeon, Sebastian Zengerle, Sebastian Alles, Florian Brand-herm, and Max Mühlhäuser. “Sunstone: Navigating the Way Throughthe Fog”. In: Proc. of the International Conference on Fog and EdgeComputing (ICFEC). 2020, to appear.
ix

[Ged17] Julien Gedeon. “Edge Computing via Dynamic In-network Process-ing”. In: International Conference on Networked Systems (Netsys’17):PhD Forum. 2017, pp. 1–2.
[GS15] Julien Gedeon and Immanuel Schweizer. “Understanding Spatial andTemporal Coverage in Participatory Sensor Networks”. In: Proc. ofthe 40th IEEE Local Computer Networks Conference Workshops (LCNWorkshops). 2015, pp. 699–707.
Co-Authored Publications
[Heu+19] Jens Heuschkel, Philipp Thomasberger, Julien Gedeon, and MaxMühlhäuser. “VirtualStack: Green High Performance Network Pro-tocol Processing Leveraging FPGAs”. In: Proc. of the IEEE GlobalCommunications Conference (GLOBECOM). 2019, pp. 1–6.
[Mar+19] Karola Marky, Andreas Weiß, Julien Gedeon, and Sebastian Günther.“Mastering Music Instruments through Technology in Solo LearningSessions”. In: Proc. of the 7th Workshop on Interacting with Smart Ob-jects (SmartObjects ’19). 2019, pp. 1–6.
[Meu+17a] Christian Meurisch, Julien Gedeon, Artur Gogel, The An Binh Nguyen,Fabian Kaup, Florian Kohnhäuser, Lars Baumgärtner, Milan Schmit-tner, and Max Mühlhäuser. “Temporal Coverage Analysis of Router-Based Cloudlets Using Human Mobility Patterns”. In: Proc. of theIEEE Global Communications Conference (GLOBECOM). IEEE. 2017,pp. 1–6.
[Meu+17b] Christian Meurisch, Julien Gedeon, The An Binh Nguyen, FabianKaup, and Max Mühlhäuser. “Decision Support for ComputationalOffloading by Probing Unknown Services”. In: Proc. of the 26th In-ternational Conference on Computer Communication and Networks(ICCCN). IEEE. 2017, pp. 1–9.
[Meu+17c] Christian Meurisch, The An Binh Nguyen, Julien Gedeon, FlorianKohnhäuser, Milan Schmittner, Stefan Niemczyk, Stefan Wullkotte,and Max Mühlhäuser. “Upgrading Wireless Home Routers as Emer-gency Cloudlet and Secure DTN Communication Bridge”. In: Proc. ofthe 26th International Conference on Computer Communication andNetworks (ICCCN). IEEE. 2017, pp. 1–2.
[Sch+12] Immanuel Schweizer, Christian Meurisch, Julien Gedeon, RomanBärtl, and Max Mühlhäuser. “Noisemap: multi-tier incentive mech-anisms for participative urban sensing”. In: Proc. of the 3rd Interna-tional Workshop on Sensing Applications on Mobile Phones. Phone-Sense ’12. ACM. 2012, 9:1–9:5.
[Wan+19] Lin Wang, Lei Jiao, Jun Li, Julien Gedeon, and Max Mühlhäuser.“MOERA: Mobility-agnostic Online Resource Allocation for EdgeComputing”. In: IEEE Transactions on Mobile Computing 18.8 (2019),pp. 1843–1856.
x

Contents
1 INTRODUCTION 11.1 General Related Work . . . . . . . . . . . . . . . . . . . . . . . . . . . . . 41.2 Overview of Contributions and Thesis Structure . . . . . . . . . . . . . 5
I BACKGROUND & ANALYSIS 7
2 A TAXONOMY OF EDGE COMPUTING 92.1 Terminology . . . . . . . . . . . . . . . . . . . . . . . . . . . . . . . . . . . 11
3 CHARACTERISTICS OF EDGE COMPUTING 153.1 Promises, Benefits, and Drawbacks . . . . . . . . . . . . . . . . . . . . . 153.2 Access Technologies and Communication Patterns . . . . . . . . . . . . 193.3 Device Ecosystem . . . . . . . . . . . . . . . . . . . . . . . . . . . . . . . . 203.4 Stakeholders and Business Models . . . . . . . . . . . . . . . . . . . . . . 213.5 Enabling Technologies . . . . . . . . . . . . . . . . . . . . . . . . . . . . . 22
3.5.1 Offloading Mechanisms . . . . . . . . . . . . . . . . . . . . . . . . 223.5.2 Lightweight Virtualization . . . . . . . . . . . . . . . . . . . . . . 233.5.3 Software-Defined Networking . . . . . . . . . . . . . . . . . . . . 253.5.4 Network Function Virtualization . . . . . . . . . . . . . . . . . . 26
4 CLASSIFICATION AND ANALYSIS OF APPLICATIONS 274.1 Methodology . . . . . . . . . . . . . . . . . . . . . . . . . . . . . . . . . . . 27
4.1.1 Components of Edge Applications . . . . . . . . . . . . . . . . . 274.1.2 Classification Scheme . . . . . . . . . . . . . . . . . . . . . . . . . 30
4.2 Application Survey . . . . . . . . . . . . . . . . . . . . . . . . . . . . . . . 314.2.1 Mobile Device Augmentation . . . . . . . . . . . . . . . . . . . . 314.2.2 Infrastructure Augmentation . . . . . . . . . . . . . . . . . . . . . 354.2.3 IoT Device Augmentation . . . . . . . . . . . . . . . . . . . . . . . 404.2.4 Human Augmentation . . . . . . . . . . . . . . . . . . . . . . . . . 42
4.3 Summary . . . . . . . . . . . . . . . . . . . . . . . . . . . . . . . . . . . . . 444.4 Conclusion and Requirements . . . . . . . . . . . . . . . . . . . . . . . . 48
4.4.1 Remaining Thesis Outline . . . . . . . . . . . . . . . . . . . . . . 49
xi
II INFRASTRUCTURAL SUPPORT 51
5 COVERAGE ANALYSIS OF URBAN CLOUDLETS 535.1 Introduction . . . . . . . . . . . . . . . . . . . . . . . . . . . . . . . . . . . 535.2 A Multi-Cloudlet Urban Environment . . . . . . . . . . . . . . . . . . . . 54
5.2.1 Cellular Base Stations . . . . . . . . . . . . . . . . . . . . . . . . . 555.2.2 Routers . . . . . . . . . . . . . . . . . . . . . . . . . . . . . . . . . . 565.2.3 Street Lamps . . . . . . . . . . . . . . . . . . . . . . . . . . . . . . 57
5.3 Related Work . . . . . . . . . . . . . . . . . . . . . . . . . . . . . . . . . . . 575.3.1 Urban Cloudlets . . . . . . . . . . . . . . . . . . . . . . . . . . . . 575.3.2 Coverage . . . . . . . . . . . . . . . . . . . . . . . . . . . . . . . . . 58
5.4 Datasets . . . . . . . . . . . . . . . . . . . . . . . . . . . . . . . . . . . . . . 595.4.1 Access Point Locations . . . . . . . . . . . . . . . . . . . . . . . . 595.4.2 Mobility Traces . . . . . . . . . . . . . . . . . . . . . . . . . . . . . 61
5.5 Coverage Metrics . . . . . . . . . . . . . . . . . . . . . . . . . . . . . . . . 645.5.1 Spatial Coverage . . . . . . . . . . . . . . . . . . . . . . . . . . . . 645.5.2 Point Coverage . . . . . . . . . . . . . . . . . . . . . . . . . . . . . 665.5.3 Path Coverage . . . . . . . . . . . . . . . . . . . . . . . . . . . . . 665.5.4 Time Coverage . . . . . . . . . . . . . . . . . . . . . . . . . . . . . 66
5.6 Coverage Analysis . . . . . . . . . . . . . . . . . . . . . . . . . . . . . . . . 675.6.1 Methodology . . . . . . . . . . . . . . . . . . . . . . . . . . . . . . 675.6.2 Spatial Coverage . . . . . . . . . . . . . . . . . . . . . . . . . . . . 685.6.3 Point, Path, and Time Coverage . . . . . . . . . . . . . . . . . . . 72
5.7 Conclusion . . . . . . . . . . . . . . . . . . . . . . . . . . . . . . . . . . . . 75
6 URBAN CLOUDLET PLACEMENT 776.1 Introduction and Problem Statement . . . . . . . . . . . . . . . . . . . . 776.2 Related Work . . . . . . . . . . . . . . . . . . . . . . . . . . . . . . . . . . . 786.3 System Model . . . . . . . . . . . . . . . . . . . . . . . . . . . . . . . . . . 80
6.3.1 Basic Definitions . . . . . . . . . . . . . . . . . . . . . . . . . . . . 806.3.2 Problem Definition . . . . . . . . . . . . . . . . . . . . . . . . . . . 82
6.4 Placement Strategy . . . . . . . . . . . . . . . . . . . . . . . . . . . . . . . 836.4.1 Complexity Considerations . . . . . . . . . . . . . . . . . . . . . . 86
6.5 Evaluation . . . . . . . . . . . . . . . . . . . . . . . . . . . . . . . . . . . . 866.5.1 Setup . . . . . . . . . . . . . . . . . . . . . . . . . . . . . . . . . . . 866.5.2 Results . . . . . . . . . . . . . . . . . . . . . . . . . . . . . . . . . . 886.5.3 Discussion . . . . . . . . . . . . . . . . . . . . . . . . . . . . . . . . 91
6.6 Conclusion and Future Work . . . . . . . . . . . . . . . . . . . . . . . . . 93
III CONTROL & EXECUTION 95
7 EDGE COMPUTING FRAMEWORK 977.1 Introduction . . . . . . . . . . . . . . . . . . . . . . . . . . . . . . . . . . . 977.2 Related Work . . . . . . . . . . . . . . . . . . . . . . . . . . . . . . . . . . . 99
7.2.1 Computation Offloading . . . . . . . . . . . . . . . . . . . . . . . 997.2.2 Microservices . . . . . . . . . . . . . . . . . . . . . . . . . . . . . . 1017.2.3 Serverless Computing . . . . . . . . . . . . . . . . . . . . . . . . . 103
7.3 Microservice-Based Edge Onloading . . . . . . . . . . . . . . . . . . . . . 1037.3.1 Microservice Definition and Structure . . . . . . . . . . . . . . . 104
xii

7.3.2 Service Chaining . . . . . . . . . . . . . . . . . . . . . . . . . . . . 1077.4 Functional Concept . . . . . . . . . . . . . . . . . . . . . . . . . . . . . . . 107
7.4.1 Microservice Store . . . . . . . . . . . . . . . . . . . . . . . . . . . 1087.4.2 Controller . . . . . . . . . . . . . . . . . . . . . . . . . . . . . . . . 1097.4.3 Edge Agent . . . . . . . . . . . . . . . . . . . . . . . . . . . . . . . 1117.4.4 Message Queues . . . . . . . . . . . . . . . . . . . . . . . . . . . . 112
7.5 Implementation Details . . . . . . . . . . . . . . . . . . . . . . . . . . . . 1137.5.1 Demo Microservices . . . . . . . . . . . . . . . . . . . . . . . . . . 115
7.6 Evaluation . . . . . . . . . . . . . . . . . . . . . . . . . . . . . . . . . . . . 1177.6.1 Experimental Setup . . . . . . . . . . . . . . . . . . . . . . . . . . 1177.6.2 Store-Based Microservice Onloading . . . . . . . . . . . . . . . . 1187.6.3 Performance of Chained Services . . . . . . . . . . . . . . . . . . 124
7.7 Conclusion and Outlook . . . . . . . . . . . . . . . . . . . . . . . . . . . . 126
IV STRATEGIES & ADAPTATIONS 127
8 OPERATOR PLACEMENT 1298.1 Introduction . . . . . . . . . . . . . . . . . . . . . . . . . . . . . . . . . . . 1298.2 Related Work . . . . . . . . . . . . . . . . . . . . . . . . . . . . . . . . . . . 1318.3 System Model and Problem Formulation . . . . . . . . . . . . . . . . . . 133
8.3.1 Underlay Network . . . . . . . . . . . . . . . . . . . . . . . . . . . 1348.3.2 Operator Graphs . . . . . . . . . . . . . . . . . . . . . . . . . . . . 1348.3.3 Operator Placement . . . . . . . . . . . . . . . . . . . . . . . . . . 1348.3.4 Cost Model . . . . . . . . . . . . . . . . . . . . . . . . . . . . . . . 1358.3.5 Problem Formulation . . . . . . . . . . . . . . . . . . . . . . . . . 1368.3.6 Edge-Fog-Cloud Architecture . . . . . . . . . . . . . . . . . . . . 136
8.4 Heuristic Approach . . . . . . . . . . . . . . . . . . . . . . . . . . . . . . . 1378.4.1 Placement Restriction . . . . . . . . . . . . . . . . . . . . . . . . . 1388.4.2 Operator Pinning . . . . . . . . . . . . . . . . . . . . . . . . . . . . 1398.4.3 Operator Colocation . . . . . . . . . . . . . . . . . . . . . . . . . . 1408.4.4 Strategies for Combining Heuristics . . . . . . . . . . . . . . . . 140
8.5 Testbed Implementation . . . . . . . . . . . . . . . . . . . . . . . . . . . . 1418.6 Evaluation . . . . . . . . . . . . . . . . . . . . . . . . . . . . . . . . . . . . 142
8.6.1 Experimental Settings . . . . . . . . . . . . . . . . . . . . . . . . . 1428.6.2 Performance Analysis . . . . . . . . . . . . . . . . . . . . . . . . . 1448.6.3 Optimality Gap . . . . . . . . . . . . . . . . . . . . . . . . . . . . . 1478.6.4 Discussion . . . . . . . . . . . . . . . . . . . . . . . . . . . . . . . . 149
8.7 Conclusion and Outlook . . . . . . . . . . . . . . . . . . . . . . . . . . . . 151
9 CONTEXT-AWARE MICRO-STORAGE 1539.1 Introduction . . . . . . . . . . . . . . . . . . . . . . . . . . . . . . . . . . . 1539.2 Background and Related Work . . . . . . . . . . . . . . . . . . . . . . . . 156
9.2.1 Context-Awareness . . . . . . . . . . . . . . . . . . . . . . . . . . 1569.2.2 Mobile Storage . . . . . . . . . . . . . . . . . . . . . . . . . . . . . 156
9.3 Context-Aware Storage at the Edge . . . . . . . . . . . . . . . . . . . . . 1589.3.1 Motivation and Use Cases . . . . . . . . . . . . . . . . . . . . . . 1589.3.2 Problem Definition and Requirements . . . . . . . . . . . . . . . 160
9.4 System Design and Implementation . . . . . . . . . . . . . . . . . . . . . 1619.4.1 vStore Framework . . . . . . . . . . . . . . . . . . . . . . . . . . . 162
xiii
9.4.2 Storage Nodes . . . . . . . . . . . . . . . . . . . . . . . . . . . . . 1669.4.3 Master Node . . . . . . . . . . . . . . . . . . . . . . . . . . . . . . 1669.4.4 Configuration . . . . . . . . . . . . . . . . . . . . . . . . . . . . . . 1679.4.5 Demo Application . . . . . . . . . . . . . . . . . . . . . . . . . . . 167
9.5 Experience Report . . . . . . . . . . . . . . . . . . . . . . . . . . . . . . . . 1699.5.1 Experimental Setup . . . . . . . . . . . . . . . . . . . . . . . . . . 1699.5.2 Usage Patterns and Storage Decisions . . . . . . . . . . . . . . . 1709.5.3 Discussion . . . . . . . . . . . . . . . . . . . . . . . . . . . . . . . . 171
9.6 Conclusion and Future Work . . . . . . . . . . . . . . . . . . . . . . . . . 173
10 MICROSERVICE ADAPTATIONS 17510.1 Introduction . . . . . . . . . . . . . . . . . . . . . . . . . . . . . . . . . . . 17510.2 Background and Related Work . . . . . . . . . . . . . . . . . . . . . . . . 177
10.2.1 Service Adaptation . . . . . . . . . . . . . . . . . . . . . . . . . . . 17710.2.2 Approximate Computing . . . . . . . . . . . . . . . . . . . . . . . 178
10.3 Adaptable Microservices for Edge Computing . . . . . . . . . . . . . . . 18010.4 Case Study . . . . . . . . . . . . . . . . . . . . . . . . . . . . . . . . . . . . 183
10.4.1 Implementation and Test Environment . . . . . . . . . . . . . . 18310.4.2 Microservices . . . . . . . . . . . . . . . . . . . . . . . . . . . . . . 18410.4.3 Microservice Chains . . . . . . . . . . . . . . . . . . . . . . . . . . 18610.4.4 Execution Time Estimation . . . . . . . . . . . . . . . . . . . . . . 18610.4.5 Impact of Service Variants . . . . . . . . . . . . . . . . . . . . . . 190
10.5 Integration into an Edge Computing Framework . . . . . . . . . . . . . 19310.6 Conclusion and Outlook . . . . . . . . . . . . . . . . . . . . . . . . . . . . 194
V EPILOGUE 197
11 CONCLUSION 19911.1 Summary . . . . . . . . . . . . . . . . . . . . . . . . . . . . . . . . . . . . . 19911.2 Future Work . . . . . . . . . . . . . . . . . . . . . . . . . . . . . . . . . . . 201
11.2.1 Discovery . . . . . . . . . . . . . . . . . . . . . . . . . . . . . . . . 20111.2.2 Security, Privacy, and Trust . . . . . . . . . . . . . . . . . . . . . . 20211.2.3 Business Models . . . . . . . . . . . . . . . . . . . . . . . . . . . . 203
11.3 Outlook . . . . . . . . . . . . . . . . . . . . . . . . . . . . . . . . . . . . . . 204
BIBLIOGRAPHY 205
APPENDICES 251
A ACCESS POINT LOCATION ESTIMATION FROM WARDRIVING 253
B TOSCA EXTENSION FOR THE DESCRIPTION OF MICROSERVICES 257
C TOSCA EXTENSION FOR THE DESCRIPTION OF SERVICE CHAINS 261
D TOSCA DESCRIPTION OF THE WORD COUNT SERVICE CHAIN 265
E DETAILED EXECUTION TIMES OF MICROSERVICES 267
xiv

F PYOMO ILP MODEL FOR OPERATOR PLACEMENT 269
G PROBLEM SIZES FOR THE OPERATOR PLACEMENT EVALUATION 273
H QUESTIONS OF THE SURVEY ON MOBILE STORAGE 275
I IMPLEMENTATION DETAILS OF VSTORE 281
J EXAMPLE CLASS DIAGRAM OF AN ADAPTABLE MICROSERVICE 283
K WISSENSCHAFTLICHER WERDEGANG DES VERFASSERS 285
xv

List of Figures
1.1 Overview of thesis structure . . . . . . . . . . . . . . . . . . . . . . . . . 6
2.1 Centralized and decentralized computing paradigms . . . . . . . . . . 9
3.1 Edge Computing device ecosystem . . . . . . . . . . . . . . . . . . . . . 213.2 Stakeholders in Edge Computing . . . . . . . . . . . . . . . . . . . . . . 22
4.1 Application components . . . . . . . . . . . . . . . . . . . . . . . . . . . 284.2 Categories of applications . . . . . . . . . . . . . . . . . . . . . . . . . . 304.3 Contributions of parts II–IV . . . . . . . . . . . . . . . . . . . . . . . . . 50
5.1 A multi-cloudlet urban infrastructure . . . . . . . . . . . . . . . . . . . 555.2 Darmstadt city cloudlet dataset . . . . . . . . . . . . . . . . . . . . . . . 595.3 Coverage metrics . . . . . . . . . . . . . . . . . . . . . . . . . . . . . . . . 655.4 Analysis of spatial coverage . . . . . . . . . . . . . . . . . . . . . . . . . 695.5 Scenario-based evaluation of spatial k-coverage . . . . . . . . . . . . . 715.6 Scenario-based coverage analysis of path, point, and time coverage
for the mobility traces . . . . . . . . . . . . . . . . . . . . . . . . . . . . . 73
6.1 Grid model for the cloudlet placement problem . . . . . . . . . . . . . 846.2 Grid cell sizes for evaluation . . . . . . . . . . . . . . . . . . . . . . . . . 886.3 Placement evaluation for a grid cell size of 50 m . . . . . . . . . . . . 896.4 Placement evaluation for a grid cell size of 100 m . . . . . . . . . . . 906.5 Choosing K by quality-to-cost ratio . . . . . . . . . . . . . . . . . . . . . 91
7.1 Comparison of approaches . . . . . . . . . . . . . . . . . . . . . . . . . . 1047.2 CSAR structure for the object detection microservice . . . . . . . . . . 1057.3 Illustration of branching in a microservice chain . . . . . . . . . . . . 1087.4 Overview of the controller’s functionalities . . . . . . . . . . . . . . . . 1097.5 Edge agent and its interfaces . . . . . . . . . . . . . . . . . . . . . . . . 1117.6 Prototype implementation . . . . . . . . . . . . . . . . . . . . . . . . . . 1147.7 Example results produced by the microservices . . . . . . . . . . . . . 1167.8 Demo microservice chain for the evaluation . . . . . . . . . . . . . . . 1177.9 End-to-end latency . . . . . . . . . . . . . . . . . . . . . . . . . . . . . . 119
xvii

7.10 Energy consumption . . . . . . . . . . . . . . . . . . . . . . . . . . . . . 1217.11 Impact of the store location on the latency . . . . . . . . . . . . . . . . 1227.12 Comparison with local execution . . . . . . . . . . . . . . . . . . . . . . 1237.13 Performance comparison of chained services . . . . . . . . . . . . . . . 124
8.1 3-tier architecture of edge, fog, and cloud nodes . . . . . . . . . . . . 1378.2 Heuristics for operator placement . . . . . . . . . . . . . . . . . . . . . 1388.3 Flowchart denoting the sequence of placement heuristics . . . . . . . 1418.4 Testbed implementation . . . . . . . . . . . . . . . . . . . . . . . . . . . 1428.5 Operator graph topologies used in the evaluation . . . . . . . . . . . . 1458.6 Evaluation results on the resolution time . . . . . . . . . . . . . . . . . 1468.7 Evaluation results on the optimality gap . . . . . . . . . . . . . . . . . 1488.8 Time-cost tradeoff for the heuristics . . . . . . . . . . . . . . . . . . . . 1498.9 Performance and optimality gap for greedy cloud placements . . . . 1508.10 Placement locations . . . . . . . . . . . . . . . . . . . . . . . . . . . . . . 150
9.1 Comparison of storage approaches . . . . . . . . . . . . . . . . . . . . . 1589.2 Measured cellular bandwidth during a football match . . . . . . . . . 1599.3 Survey results about the context-dependence of choosing storage
services and using multiple storage services . . . . . . . . . . . . . . . 1609.4 System architecture . . . . . . . . . . . . . . . . . . . . . . . . . . . . . . 1619.5 Context aggregator . . . . . . . . . . . . . . . . . . . . . . . . . . . . . . 1639.6 Example of rule matching . . . . . . . . . . . . . . . . . . . . . . . . . . 1669.7 Storage node hierarchy . . . . . . . . . . . . . . . . . . . . . . . . . . . . 1669.8 Screenshots of the demo application . . . . . . . . . . . . . . . . . . . . 1689.9 Node locations and usage heatmaps . . . . . . . . . . . . . . . . . . . . 1699.10 Number of placements per storage node type . . . . . . . . . . . . . . 172
10.1 Variants of adaptable microservices . . . . . . . . . . . . . . . . . . . . 18210.2 Microservice chains used for the evaluation . . . . . . . . . . . . . . . 18710.3 Face blurring chain: correlation matrix of variants . . . . . . . . . . . 19010.4 Correlation matrices for the individual service variants of the face
anonymization chain . . . . . . . . . . . . . . . . . . . . . . . . . . . . . 19110.5 Mesh reconstruction chain: correlation matrix of variants . . . . . . 19210.6 Correlation matrices for the individual service variants of the mesh
reconstruction chain . . . . . . . . . . . . . . . . . . . . . . . . . . . . . . 19210.7 Integration of adaptable microservices into an Edge Computing
framework . . . . . . . . . . . . . . . . . . . . . . . . . . . . . . . . . . . . 193
11.1 Results of combined discovery methods . . . . . . . . . . . . . . . . . . 202
I.1 Class diagram of the vStore framework . . . . . . . . . . . . . . . . . . 281I.2 Database scheme of the SQLite database on the mobile client . . . . 282
J.1 UML class diagram of the adaptable face detection microservice . . 283
xviii

List of Tables
2.1 Comparison of Cloud Computing with Edge Computing . . . . . . . . 12
4.1 Systematic overview of surveyed use cases . . . . . . . . . . . . . . . . . 45
5.1 Characteristics of access point types . . . . . . . . . . . . . . . . . . . . . 565.2 Number of collected access points . . . . . . . . . . . . . . . . . . . . . . 615.3 Mobile application traces . . . . . . . . . . . . . . . . . . . . . . . . . . . 625.4 Parameters for data filtering . . . . . . . . . . . . . . . . . . . . . . . . . 685.5 Evaluation scenarios . . . . . . . . . . . . . . . . . . . . . . . . . . . . . . 68
6.1 Notation of the placement model . . . . . . . . . . . . . . . . . . . . . . 826.2 Evaluation parameters . . . . . . . . . . . . . . . . . . . . . . . . . . . . . 876.3 Number of cloudlets placed for a grid cell size of 50 m . . . . . . . . . 926.4 Number of cloudlets placed for a grid cell size of 100 m . . . . . . . . 92
7.1 Comparison of offloading systems . . . . . . . . . . . . . . . . . . . . . . 1027.2 Overview of speedup . . . . . . . . . . . . . . . . . . . . . . . . . . . . . . 1187.3 Overview of energy savings . . . . . . . . . . . . . . . . . . . . . . . . . . 120
8.1 Notation of the INOP problem . . . . . . . . . . . . . . . . . . . . . . . . 1338.2 Underlay network . . . . . . . . . . . . . . . . . . . . . . . . . . . . . . . . 1438.3 Properties of nodes . . . . . . . . . . . . . . . . . . . . . . . . . . . . . . . 1438.4 Input sizes for the operator graphs . . . . . . . . . . . . . . . . . . . . . 144
9.1 Detail scores per contextual property . . . . . . . . . . . . . . . . . . . . 1659.2 Placement rules . . . . . . . . . . . . . . . . . . . . . . . . . . . . . . . . . 1719.3 Total number and sharing ratio of data types . . . . . . . . . . . . . . . 1719.4 Placement results by location and data type . . . . . . . . . . . . . . . . 172
10.1 Examples of approaches for approximate computing . . . . . . . . . . 18110.2 Overview of service variants . . . . . . . . . . . . . . . . . . . . . . . . . 18410.3 Instance types used for benchmarking . . . . . . . . . . . . . . . . . . . 18810.4 Execution time estimation result for the face detection microservice . 18910.5 Execution time estimation result for the object detection microservice 189
xix

E.1 Execution times of microservices . . . . . . . . . . . . . . . . . . . . . . . 267
G.1 Number of operator graphs per input size . . . . . . . . . . . . . . . . . 273
xx

List of Algorithms
1 GSCORE . . . . . . . . . . . . . . . . . . . . . . . . . . . . . . . . . . . . . . 852 Storage matching . . . . . . . . . . . . . . . . . . . . . . . . . . . . . . . . 165
xxi


Listings
7.1 TOSCA description of a microservice . . . . . . . . . . . . . . . . . . . . 1067.2 Example of a microservice chain route . . . . . . . . . . . . . . . . . . . 113A.1 accesspoint.rb source code file . . . . . . . . . . . . . . . . . . . . . . . . 253F.1 model.py source code file . . . . . . . . . . . . . . . . . . . . . . . . . . . 269
xxiii

CHAPTER 1
Introduction
Chapter Outline1.1 General Related Work . . . . . . . . . . . . . . . . . . . . . . 4
1.2 Overview of Contributions and Thesis Structure . . . . . . 5
The present era of digitalization leads to a plethora of networked devices thatcapture, forward, and process vast amounts of data. For one part, these are personaldevices, such as smartphones, smartwatches, on-body sensors, and head-mounteddisplays. The other part are small-scale sensors and actuators from the domain ofthe so-called Internet of Things (IoT). Recent studies by Cisco suggest that the num-ber of devices connected to the Internet will reach 28.5 billion by 20201 and 500billion by 20302. It is often necessary or beneficial to carry out the processing ofdata outside those end devices, e.g., by performing computation offloading. Thereare three main reasons for this:
(i) The devices might have insufficient processing power to deliver satisfactoryresults in terms of quality of the computation result or the execution time.Albeit being equipped with powerful hardware, many devices remain inade-quate for demanding tasks like video analytics. They also might lack special-ized components that are indispensable for the task at hand, e.g., a GPU unitor FPGA.
(ii) Many of the devices are battery-powered. Form factor limitations and designrequirements limit the size and, hence, the capacity of the battery. At the sametime, battery life is a crucial factor for user satisfaction. Therefore, carryingout computationally intensive tasks that quickly drain the battery remainsimpractical.
1https://www.cisco.com/c/en/us/solutions/collateral/service-provider/visual-networking-index-vni/white-paper-c11-741490.pdf (accessed: 2019-12-06)
2https://www.cisco.com/c/dam/en/us/products/collateral/se/internet-of-things/at-a-glance-c45-731471.pdf (accessed: 2019-12-06)
1

2 Chapter 1. Introduction
(iii) Computations might be carried out collaboratively or require data originatingfrom different sources. In case that transferring this data is inefficient, e.g.,because of its size and/or the network connectivity, offloading the computa-tion instead of the data provides a viable alternative.
For a long time, Cloud Computing was the predominant way to provide data pro-cessing services. Cloud Computing offers virtually unlimited resources that are con-centrated in large data centers. Depending on the service model, providers of CloudComputing infrastructure largely abstract away many operational and managementproblems from their users. Resources are virtualized and users can make use of alarge pool of shared resources. Flexible pay-as-you-go models allow for seamlessand economically viable scaling to one’s needs. However, this service model alsohas some inherent drawbacks. Since Cloud Computing infrastructures are typicallylocated far away from their clients (in some cases on another continent), there issometimes a substantial end-to-end latency when accessing services hosted in thecloud. Furthermore, even today, bandwidth in core networks—those are transitedwhen accessing cloud services—remains a scarce resource [Vul+15].
Until recently, these drawbacks of Cloud Computing had little practical impact.On the one hand, most data was both produced and consumed in the cloud, e.g.,by applications in the domain of big data processing [Ji+12]. In such applications,data producers and consumers are predominantly well-connected clients, often lo-cated in datacenters themselves. On the other hand, applications for mobile deviceswere also carried out in the cloud because they were not latency-critical. This land-scape has changed drastically today. New generations of personal devices (e.g.,smartphones and augmented reality headsets) as well as small-scale sensors andactuators (e.g., from the IoT domain [Gub+13]) collect vast amounts of data atthe edge of the network. With regards to the usage of this data, we can make thefollowing observations:
(i) In many cases, the data is only relevant locally, i.e., it is not only gathered atthe edge of the network but also consumed there.
(ii) The raw data and/or the result of processing is ephemeral, i.e., its temporalrelevance is limited. Oftentimes, right after being transferred for processing,it can be discarded.
Prominent examples for applications whose data behave in such a way are real-timevideo analytics [Yi+17], cognitive assistance applications [Che+17b], mobile gam-ing [LS17], and autonomous driving [Lee+16]. For such applications, the draw-backs of Cloud Computing become more striking. For use cases with stringent re-quirements on the latency (e.g., to make real-time decisions in autonomous driv-ing), Cloud Computing fails to deliver the required quality of service. In addition,today’s core networks do not offer the bandwidth to support data transfers from thegrowing number of IoT devices and sensors.
These shortcomings of Cloud Computing in this changing landscape of devicesand applications have led to the emergence of Edge Computing. Edge Computingis the concept of leveraging resources in close proximity to end devices—in a sensebringing the cloud closer to the edge of the network [Cha+14]. Tightly coupled withEdge Computing is the concept of cloudlets [Sat+09], micro data centers that offerproximate computing resources. Compared to the cloud, these resources are oftenleveraged opportunistically, i.e., users only make use of resources in their surround-ings for a limited amount of time. Furthermore, resources are more heterogeneous,

3
ranging from data center grade server hardware to single-board computers. Insteadof relying on large, centralized resources in the cloud, the idea of Edge Computingis to make use of many decentralized resources in the vicinity of end devices. Typ-ically, these resources are located in the access network, at the (wireless) gateway,or within 1-hop distance to the gateway, providing latencies in the range of single-digit milliseconds. Because many clients are highly mobile (e.g., a user’s phone),they frequently need to migrate their data and computations between the resourcesat the edge—a stark contrast to rather static cloud deployments. Besides a reducedlatency, processing data at the edge avoids using expensive links to distant cloudinfrastructures. These characteristics make Edge Computing a crucial enabler fornew classes of low-latency, high-bandwidth applications.
While some private, on-premise deployments of Edge Computing exist (e.g., inthe context of Industrial IoT), today we are far from having public Edge Computinginfrastructures available. This is especially true for urban environments. The visionof a smart city [Sch+11; Sch+16b] promises the usage of ICT3 to provide liveableurban environments and cope with problems such as pollution or safety. Smartcities feature a dense network of highly interconnected mobile people and things.Future applications such as connected cars that drive autonomously and exchangedata with devices in their surroundings are already being imagined. Such exam-ples have strict requirements in terms of bandwidth and latency that make EdgeComputing indispensable. However, we still lack essential building blocks for therealization of those applications. For one part, the requirements of individual typesof applications are not well understood. Hence, the potential benefits of using EdgeComputing remain unclear in many cases. Second, we lack the resources to carryout computations at the edge. While our urban spaces are filled with hardware thatcould host small-scale cloudlets, those are not made available today. Doubts remainabout the practicability of having a dense, city-wide pool of computing resourcesto serve highly mobile users at any time. Third, the characteristics of Edge Com-puting differ from current Cloud Computing deployment models, and therefore,established mechanisms for the operation and management of infrastructure andapplications cannot be applied to Edge Computing. Examples include the place-ment problem of data and computations, how to virtualize and share resources,and how to schedule access to those resources.
This thesis presents contributions in the field of Urban Edge Computing that closesome of these gaps. Section 1.2 outlines our contributions in detail. The contribu-tions provide answers to the following questions:
• What are the characteristics, benefits, and drawbacks of Edge Computing?
• What are the possible application domains for Edge Computing? Which ofthe benefits of Edge Computing are especially crucial for what types of appli-cations?
• How and where can we provide ubiquitous computing resources in an urbanenvironment?
• What is the granularity in which computations should be offloaded?
• Where should computations be carried out at the edge?
• How can edge resources be used in a (cost-)efficient way?
3Information and communications technology

4 Chapter 1. Introduction
• Can the edge be used as a distributed storage for user data?
• How do we need to adapt computing services in view of strict user require-ments and constrained edge resources?
1.1 General Related Work
The contributions of this thesis are set in the field of Edge Computing. This sec-tion intends to present general related work that introduces Edge Computing andsimilar concepts to the unfamiliar reader. Related work specific to the individualcontributions of this thesis is reviewed in sections 5.3, 6.2, 7.2, 8.2, 9.2, and 10.2.
The challenge to augment the capabilities of (mobile) devices by leveraging ex-ternal resources has been envisioned for a long time in the field of pervasive comput-ing [Sat01]. With the advent of Cloud Computing, such resources became widelyavailable to realize this vision. Since then, Mobile Cloud Computing (MCC) [FLR13]has been the predominant way to offload computations.
An important conceptual enabler for the move towards Edge Computing wasthe introduction of cloudlets [Sat+09; Sat11]. In these initial publications outliningthe concept, cloudlets have been defined as small-scale but resource-rich computingresources in the proximity of (mobile) users. They have been further described as amiddle-tier between end devices and the cloud [Sat+14]. This notion of a middle-tier that is close to end users and devices led to the notion of Edge Computing[Sat17; Shi+16].
As we will further discuss in Chapter 2, other concepts exist, whose definitionssometimes lack a clear distinction from Edge Computing. Two of the most notableare Fog Computing and Mobile Edge Computing (MEC). Yi et al. [Yi+15; YLL15]define the concept of Fog Computing and use the term interchangeably with EdgeComputing. Mahmud et al. [MKB18a] present a taxonomy of Fog Computing anddefine Fog Computing as an intermediate layer between IoT devices and the cloud.Mobile Edge Computing refers to the placement of computing resources in the radioaccess network [Bec+14; Mao+17; Abb+18]. Since this network is typically closeto the end user, we see Mobile Edge Computing as one possible realization of EdgeComputing.
Given the timeliness and broadness of the topic, various surveys explore thefield of Edge Computing. Yousefpour et al. [You+19] present an extensive surveyof publications related to Edge Computing and Fog Computing. Shi et al. [Shi+16]present several case studies and outline future challenges in Edge Computing. Sim-ilarly, Varghese et al. [Var+16] define motivations, opportunities, and challengesof Edge Computing. The survey of Li et al. [Li+18] focuses on architecture andmanagement issues. Managing resources in an edge environment is a crucial build-ing block. In this domain, Hong and Varghese [HV19] review publications andclassify architectures, infrastructures, and algorithms for resource management inEdge Computing and Fog Computing. Further specialized surveys shed light onEdge Computing from the perspective of networking [Lua+16] or security [RLM18;YQL15; Sto+16].
No previous work provides a comprehensive overview and classification of appli-cations that can benefit from Edge Computing. A comparison between cloudlets andCloud Computing can be found in [Pan+15]; it is however limited to very few appli-cation scenarios. Existing works are either limited to a specific application domain,

1.2. Overview of Contributions and Thesis Structure 5
e.g., IoT [Has+18; Hec+18; Yu+18], or smart city applications [Per+17a; Tal+17].Other classifications lack prominent examples like augmented reality [Pul+19]. Wewill close this gap with our application survey in Chapter 4.
1.2 Overview of Contributions and Thesis Structure
This thesis makes several contributions to the understanding, planning, deploy-ment, and operation of a public Edge Computing infrastructure in an urban envi-ronment. An important characteristic of the Urban Edge Computing environmentis its heterogeneity in two dimensions. First, several devices that capture and/orconsume data are involved. For many of our experimental studies, we use mobilephones, however the results are applicable to other devices. These could range fromsmall sensors and actuators to connected cars. Common to them is the need to per-form computations or store data outside of the device. Second, we also consider thecompute infrastructure to be heterogeneous, ranging from close-by equipment co-located with one’s access gateway to resources in the transit network to the cloud.Contrary to previous works, we consider these heterogeneity characteristics to pro-vide an integrated solution for Urban Edge Computing, ranging from the placementof physical resources to the adaptation of the runtime environment.
This thesis is structured into five parts. Figure 1.1 provides a complete overviewof the structure of this thesis. The core contributions that provide building blocksfor an Urban Edge Computing system are highlighted with a green background.
PART I contributes to the general understanding of the field of Edge Computing intwo ways. First, we refine the definition of Edge Computing (Chapter 2) andanalyze its characteristics, including advantages and drawbacks (Chapter 3).Second—based on the observation that it remains unclear which applicationscould benefit from certain aspects of Edge Computing—we present an exten-sive survey of application use cases in Chapter 4. We present a systematicway to break down applications by identifying four critical building blocksof applications (data consolidation, filtering & pre-processing, computationoffloading, and data storage & retrieval). We then propose to classify appli-cations according to the notion of augmentation, and for representative ex-amples, we map the requirements of each application to how well they can beserved by Edge Computing. The abstract notion of application building blocksallows us to generalize our findings and draw conclusions about the suitabil-ity of employing Edge Computing for certain types of applications. This partconcludes with the definition of requirements for Urban Edge Computing thatwill be addressed in the remaining parts of the thesis.
PART II examines the physical infrastructure for Urban Edge Computing, i.e., whichinfrastructures can be leveraged in an urban environment to provide proxi-mate computing resources. To this end, we suggest placing cloudlets on cellu-lar base stations, WiFi routes, and augmented street lamps. Chapter 5 showsthe viability of this idea by conducting a large-scale study of urban cloudletcoverage based on datasets captured in a major city. In Chapter 6, we presenta placement strategy that decides which of those infrastructures to upgradewith cloudlets, taking into account their heterogeneity in terms of cost, com-munication range, and resources.
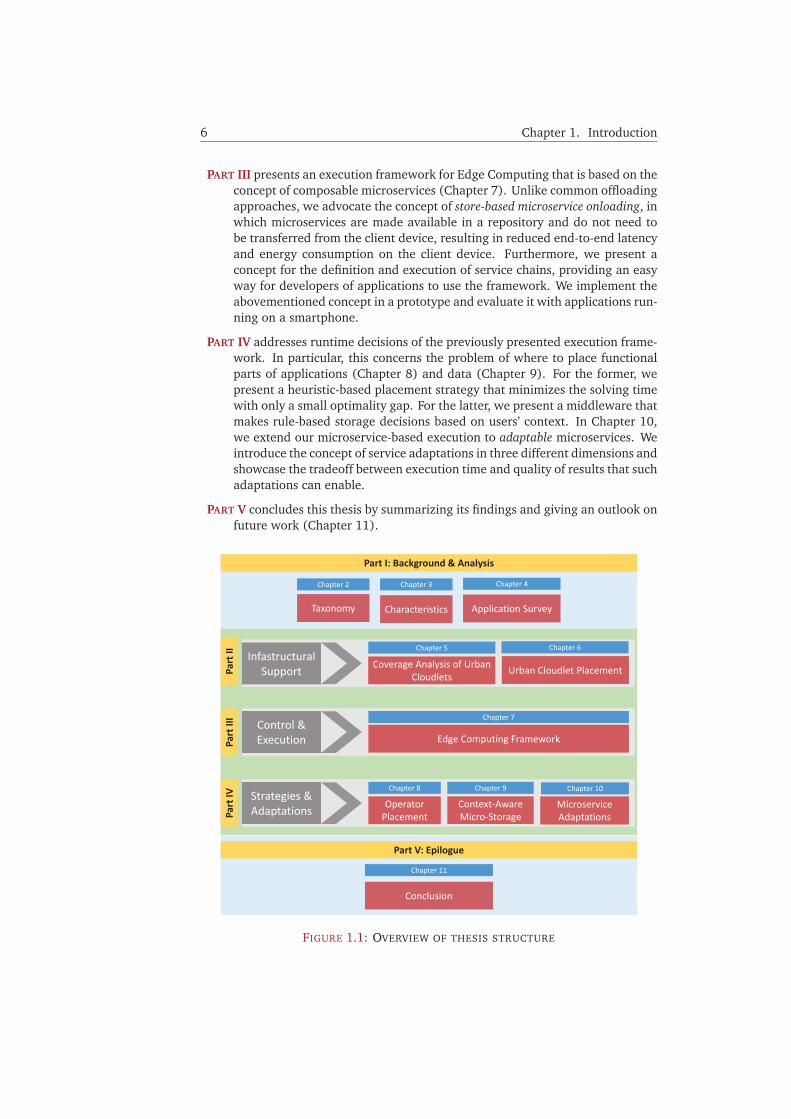
6 Chapter 1. Introduction
PART III presents an execution framework for Edge Computing that is based on theconcept of composable microservices (Chapter 7). Unlike common offloadingapproaches, we advocate the concept of store-based microservice onloading, inwhich microservices are made available in a repository and do not need tobe transferred from the client device, resulting in reduced end-to-end latencyand energy consumption on the client device. Furthermore, we present aconcept for the definition and execution of service chains, providing an easyway for developers of applications to use the framework. We implement theabovementioned concept in a prototype and evaluate it with applications run-ning on a smartphone.
PART IV addresses runtime decisions of the previously presented execution frame-work. In particular, this concerns the problem of where to place functionalparts of applications (Chapter 8) and data (Chapter 9). For the former, wepresent a heuristic-based placement strategy that minimizes the solving timewith only a small optimality gap. For the latter, we present a middleware thatmakes rule-based storage decisions based on users’ context. In Chapter 10,we extend our microservice-based execution to adaptable microservices. Weintroduce the concept of service adaptations in three different dimensions andshowcase the tradeoff between execution time and quality of results that suchadaptations can enable.
PART V concludes this thesis by summarizing its findings and giving an outlook onfuture work (Chapter 11).
Control & Execution
Strategies & Adaptations Operator
PlacementContext-Aware Micro-Storage
Microservice Adaptations
Chapter 8 Chapter 9 Chapter 10
Edge Computing Framework
Chapter 7
Part
IIPa
rt II
IPa
rt IV
Infastructural Support Urban Cloudlet Placement
Chapter 5
Coverage Analysis of Urban Cloudlets
Chapter 6
Part I: Background & Analysis
Part V: Epilogue
Taxonomy
Chapter 2
Characteristics
Chapter 3
Application Survey
Chapter 4
Conclusion
Chapter 11
FIGURE 1.1: OVERVIEW OF THESIS STRUCTURE

Part I
Background & AnalysisThe first part of this thesis provides a detailed introduction and analysisof the field of Edge Computing.
Our first contributions consist of a taxonomy (Chapter 2) and analysisof Edge Computing characteristics (Chapter 3), thereby contributing tothe general understanding of Edge Computing and the refinement of itsdefinition.
Based on the identified characteristics, Chapter 4 performs a systematicsurvey of Edge Computing use cases, proposing a classification schemeand analyzing potential applications with regards to the previously de-fined characteristics of Edge Computing. Following the insights of thissurvey of the Edge Computing landscape, this part concludes with thedefinition of requirements for Urban Edge Computing.
This part is largely based on [Ged+19a]. Verbatim copies of text from this publication are printed ingray color throughout this part of the thesis. Tables and figures taken or adapted from this publicationare marked with † in their caption.
7


CHAPTER 2
A Taxonomy of Edge Computing
Throughout the history of computing, a constant back-and-forth swinging betweencentralized and decentralized computing approaches has been observed [PA97]. Wemap this general observation to major milestones that have led to today’s computinglandscape, outlining four major eras in Figure 2.1. The first transition towardsdecentralized computing was the move from centralized mainframes to personalcomputers.
Cloud Computing. In the mid-2000s, we saw a major disruption with the ad-vent of Cloud Computing. Cloud Computing offers abundant virtualized resourcesin large data centers. These resources can be used with flexible pricing models,often on a pay-as-you-go basis. Scaling in and out according to current demandscan be done at a moment’s notice and therefore removes the problem of over- orunderprovisioning of resources.
We argue that Cloud Computing belongs to the category of centralized ap-
FIGURE 2.1: CENTRALIZED AND DECENTRALIZED COMPUTING PARADIGMS†
9
10 Chapter 2. A Taxonomy of Edge Computing
proaches because computing power is concentrated in a few distant locations(compared to the number of clients that use it). Leveraging cloud resources foroffloading from mobile devices is termed Mobile Cloud Computing (MCC) [FLR13]for which a variety of frameworks exist [Cue+10; Chu+11; Kos+12; Kem+10].Emerging classes of applications that require fast processing of large data gener-ated from client devices and surrounding sensors have led to the latest distributedcomputing paradigm, termed Edge Computing.
Edge Computing. Edge Computing is the concept of placing and using storageand computing resources close to the (mobile) devices that produce and consumethe data (see Definition 2.1). One contrasting approach is Cloud Computing, wheresaid resources are located at data centers. Edge Computing is carried out usingresources on edge nodes or edge devices. Similarly, the term cloudlet [Sat+09] hasbeen coined to denote small-scale data centers close to users.
Entities in Edge Computing. In the context of computation offloading, nodes thatare leveraged to perform computations are called surrogates (see Section 3.5.1).Edge sites are the physical environments where the edge resources are located. Werefer to an edge system or edge framework to denote the entirety of resources at theedge, their clients, and control entities responsible for managing the resources.
Relationship between Edge Computing and Cloud Computing. It is importantto note that Edge Computing aims not to be a replacement for Cloud Computing,but to complement it [Vil+16b]. This makes sense if we assume that every appli-cation needs access to three basic resources: (i) computation, (ii) communication,and (iii) storage. The need for computation and storage resources is well-served byCloud Computing; in fact, the reason for the success of Cloud Computing is its capa-bility to provide resource elasticity, which means that resources can be scaled in andout in order to instantly fit the customers’ needs. On the downside, Cloud Comput-ing cannot offer any guarantees w.r.t. the communication part because data centersare located away from the consumer, and typically, neither the cloud provider northe user has full control over the transit network. Edge Computing solves this issuein the sense that it adds scalability in the network dimension, i.e., more users can beserved with low-latency links when adding more edge sites (e.g., at users’ wirelessgateways). However, because of the limited resources at individual edge sites, EdgeComputing cannot offer the same overall elasticity as Cloud Computing. Further-more, realizing scalability in any of the three resource dimensions requires muchmore complex management in view of the dynamics in the network (e.g., causedby user mobility or sudden local changes in demands).
For these reasons, in practice, we expect an interplay of Cloud Computing andEdge Computing. Edge Computing offers the additional scalability required forprocessing locally relevant tasks in an environment with a large number of datagenerators and consumers. Complex, long-running, and data-driven tasks that arenot time-critical will benefit more from the abundance of scalable resources in thecloud. Similarly, Edge Computing will most likely not be able to replace the cloudfor the long-term storage of data because of the limited capabilities of edge devices.However, user-facing time-critical tasks may benefit from a reduced latency in thecritical path when using infrastructure at the edge, and this might also includethe caching of ephemeral data on edge devices. In addition to the latency benefit,

2.1. Terminology 11
caching data at the edge has the potential to reduce bandwidth usage in the corenetwork.
Differences in resources and their distribution. While Cloud Computing of-fers virtually unlimited resources in geo-distributed data centers, resources in EdgeComputing are locally clustered around its consumers. These computing nodes aremore heterogeneous w.r.t. to their available resources and are often leveraged op-portunistically. Especially if we consider non-redundant, consumer-grade devicesfor computations, the availability and reliability of resources at the edge might belimited. However, Edge Computing can make the communication more reliable, inthe sense that it can offer an alternative if network links to the cloud break down.This is especially interesting for disaster scenarios where Edge Computing can offeran alternative infrastructure to keep critical tasks alive. Edge resources can oftenbe accessed within one hop from the wireless gateway that users are connected to.Ideally, Edge Computing systems can support user mobility, e.g., by migrating userdata and computations to the next proximate location. In addition, wireless gate-ways can provide additional contextual information to the application, somethingnot available in Cloud Computing.
Computation offloading and virtualization. Another major difference is thegranularity of offloading. In Cloud Computing, we see large parts of applicationsbeing moved to remote resources, while at the edge, offloading is more fine-grainedand needs a more careful decision of what to offload. Individually offloaded com-ponents at the edge are often part of a processing pipeline consisting of severalof those components that do not necessarily run on the same edge device. Ad-ditionally, we can observe that because of limited resources at the edge and thehigher user dynamics, virtualization technologies used for Edge Computing tendto be more lightweight. For example, containers are often used instead of virtualmachines (see Section 3.5.2).
Loose coupling. We define the loose coupling between clients and the comput-ing and communication infrastructure as another important characteristic of EdgeComputing. This is an especially important characteristic in Urban Edge Computing,where the computing resources are shared among multiple users and applications.Other concepts that are sometimes referred to as Edge Computing deploy static re-sources on-premise for one particular user and application. Those deployments,however, do not face the same challenges, e.g., with regards to network coverageand connectivity, device and data mobiltiy, or scaling.
Summary. To conclude this section, Table 2.1 summarizes the differences betweenEdge Computing and Cloud Computing.
2.1 Terminology
For the remainder of this thesis, we will use the terms Edge Computing and UrbanEdge Computing as described in Definition 2.1. Besides the term Edge Computing,other terminology that denotes similar concepts exist, most notably the term FogComputing [Yi+15; Bon+12; Ged+18a]. Fog Computing is a term originally coined

12 Chapter 2. A Taxonomy of Edge Computing
TABLE 2.1: COMPARISON OF CLOUD COMPUTING WITH EDGE COMPUTING †
Cloud Computing Edge Computing
Proximity to
client deviceslow high
End-to-end latency high low
Infrastructure centralized data centers decentralized cloudlets
Heterogeneity of
computing hardwarelow high
Number of computing
resource locationsfew many
Resources at
individual locationsmany few
Geo-distribution of
computing resourceslocally clustered widespread
Availability & reliability
of resourceshigh varying
Virtualization heavyweight lightweight
Connection to resources long-thin short-fat
Access to resources through core networktypically via 1-hop
wireless gateway
Applications data-driven user-driven
Offloading granularitycomputationally intensive
mostly entire applicationsand latency-critical parts
by Cisco [Bon+12] in the context of their IOx platform, envisioning to leverageuntapped processing power in network middleboxes when those are either over-provisioned or not running at full load.
While the terms edge and fog both allude to the same concept—processing dataclose to end devices—it is worth noticing that there is a broad spectrum of (some-times blurry) definitions and arguments in trying to define the differences betweenthe two. One possible distinction is that Fog Computing extends the cloud towardsthe edge, while Edge Computing originates from the need of end devices to of-fload computations. However, the exact definitions remain an ongoing discussionin academia [Mar+17; VR14]. Closely tied to the concept of Fog Computing areCloudlets. Cloudlets have been described as a middle-tier [Sat+14] that extendsthe cloud towards the edge [Ver+12a; Lew+14].
Mobile Edge Computing (MEC)—more recently termed Multi-Access EdgeComputing—refers to the colocation of resources at the Radio Access Networks(RAN), e.g., at cellular base stations [Abb+18]. This can therefore be consideredas a special case of Edge Computing, mostly from the point of view of mobilenetwork operators. Especially with the advent of the fifth generation of cellularnetworks (5G), MEC deployments are expected to gain more importance [Hu+15b;Nun+15].

2.1. Terminology 13
Other hybrid terms exist, notably Mist Computing [Pre+15] and Osmotic Com-puting [Vil+16b]. The former can be thought of being similar to Fog Computingbut closer to the edge devices, while the latter advocates a seamless migration ofservices from data centers to the edge.
DEFINITION 2.1: EDGE COMPUTING AND URBAN EDGE COMPUTING
Edge Computing denotes the general concept of placing computing and/or com-munication resources close to the action scene, e.g., in proximity of users, sen-sors, or actuators. We refer to Urban Edge Computing as the application of thisconcept in an urban environment.


CHAPTER 3
Characteristics of Edge Computing
Chapter Outline3.1 Promises, Benefits, and Drawbacks . . . . . . . . . . . . . . 15
3.2 Access Technologies and Communication Patterns . . . . . 19
3.3 Device Ecosystem . . . . . . . . . . . . . . . . . . . . . . . . . 20
3.4 Stakeholders and Business Models . . . . . . . . . . . . . . . 21
3.5 Enabling Technologies . . . . . . . . . . . . . . . . . . . . . . 22
In this chapter, we analyze the characteristics of Edge Computing. We startby analyzing what the potential benefits and drawbacks of Edge Computing are(Section 3.1). We then discuss the characteristics of “the edge” in terms of commu-nication (Section 3.2), the involved devices (Section 3.3), and stakeholders (Sec-tion 3.4). Lastly, we review enabling technologies for Edge Computing in Sec-tion 3.5.
3.1 Promises, Benefits, and Drawbacks
As outlined in the previous chapter on the taxonomy of Edge Computing, the gen-eral idea is to move storage and processing capabilities from the cloud closer tothe clients and towards the origin of the data, often by opportunistically using theinfrastructure in a highly dynamic mobile environment. This potentially brings anumber of advantages, the most important of which we describe in the following:
ADVANTAGE I: LOWER LATENCY | As we will discuss in Chapter 4, many types ofapplications have stringent requirements on the end-to-end latency, i.e., theoverall time from requesting a service (e.g., a computation) to obtaining theresult. One important factor on this critical path is the network delay. CloudComputing infrastructures are geographically widely distributed across datacenters, and the user typically has little to no control over where the requests
15
16 Chapter 3. Characteristics of Edge Computing
will be processed. Hence, it is not uncommon for requests to be directed todistant data centers.
Many works have presented empirical measurements of network latenciesand motivated Edge Computing based on those numbers [Che+17b; Ged+17;Sat+09]. For instance, in [Sat+09] the authors measure the mean networkround-trip times between New York and Berkeley to be 85 ms. If we nowimagine an application that needs to process a video scene in near real-timewith a delay constraint of less than 50 ms, the mere network latency alreadyviolates this constraint. Even by optimizing transit networks, physical lowerbounds remain. In contrast, the access delay to a nearby wireless gatewayin the case of WiFi is typically in the order of magnitude of a few millisec-onds. Chen et al. [Che+17b] have conducted extensive empirical studies us-ing a cognitive assistance application and conclude that using the cloud overa cloudlet adds around 100–200 ms of latency. Besides the physical lowerbounds of transmissions, the network jitter, i.e., the variation in delay is an-other issue for latency-critical Edge Computing applications. This variance iscaused, e.g., by different load levels in the network and makes guaranteeinga latency close to the lower bound impossible.
ADVANTAGE II: LESS BANDWIDTH UTILIZATION IN THE CORE NETWORK | In the cur-rent landscape of billions of mobile devices that generate data, we observethat captured data often only is of limited spatial and temporal relevance.As an example, we can imagine an intelligent scheduling scheme for trafficlights that is based on reported sensor data from vehicles [BB14]. In thisexample, the data is relevant only for the time the vehicles are in the vicin-ity of the traffic light. Applications often do not consume every individualsensor reading, but data that is derived from those individual readings, e.g.,aggregate or filtered values, inferred events, or outliers. If, however, all rawvalues would be streamed to the cloud for analysis, this might overload thecore network. This is especially relevant since wide-area network bandwidthremains a scarce resource [Vul+15]. The same holds true for many of today’swireless access networks, e.g., as motivated in [Wan+18b]. Especially large,continuous data streams can be a burden on backhaul networks. Distributedprocessing and aggregation of data streams along the path to the consumercan help to mitigate this. In the domain of Wireless Sensor Networks this isa popular approach [Fas+07] that can easily be mapped to aggregation byintermediate edge nodes.
Besides aggregation, Edge Computing can also offer storage capabilities[May+17] that take into account contextual information for the decision onwhere to store the data [Ged+18b]. For example, at large-scale events withoverloaded mobile networks, edge nodes can provide storage to share dataamong people that are close-by. Chapter 9 will present our contribution ofa context-aware edge storage framework. Other works have investigatededge storage for caching [Zha+15a] or buffering of IoT data [Psa+18]. It isworth noticing that most of these works assume the data to be short-lived.However, storing non-ephemeral data on unreliable edge nodes requiresreplication mechanisms, as demonstrated in [MRS19]. The savings in datatransfers to the cloud when using Edge Computing has been demonstrated inpractice with various use cases, from document synchronization [Hao+17]to mobile gaming [Var+17]. For example, Hao et al. [Hao+17] demonstrate
3.1. Promises, Benefits, and Drawbacks 17
a reduction in data transfers to the cloud of up to 90% in an application fordocument synchronization.
ADVANTAGE III: ENERGY SAVINGS AND INCREASED ENERGY EFFICIENCY | Mobile de-vices have an inherently limited battery life. Advances in battery technologyhave not kept pace with the increased processing capabilities of modern mo-bile devices [AS13; KAB13]. Furthermore, their small form factors limit thesize of the battery. Battery life is an important factor for the overall user satis-faction [Hav11] and remains an important constraint for many applications,e.g., mobile gaming [Hua+14]. Carrying out compute-intensive tasks on thedevice is detrimental to the device’s battery life and, thus, has a negativeimpact on the user’s experience. This factor is even more crucial for small-scale sensors that are deployed in the environment and designed to never beserviced. In this case, the battery life equals the lifetime of the device. There-fore, moving the computations away from the devices is beneficial for theirbattery life. This has been shown for both cloud [KL10] and edge [Hu+16]infrastructures.
Saving energy is not only important for end devices, but also for edge nodeson which the computations take place [RAD18]. Besides the advantage ofreduced operational cost, Edge Computing nodes are often enclosed in tightphysical spaces and therefore, heat dissipation must be limited. Hence, manyworks have presented energy-efficient mechanisms for resource allocation[You+17], offloading [Nan+17; Zha+18d], and data delivery [Jay+14] inEdge Computing. Xiao et al. [XK17] suggest cooperative offloading, in whichedge nodes forward tasks among each other. The authors study the tradeoffbetween quality of experience for users and the fog nodes’ energy efficiencyand present a cooperation strategy for optimal workload allocation.
The previous examples have outlined the partial benefit from the point ofview of mobile devices and edge nodes. However, it is important to note thatto analyze the overall energy benefit of Edge Computing, we need a moreholistic view. While offloading might save battery life on the mobile device,this does not answer the question of whether the chosen edge resources aremore energy-efficient compared to Cloud Computing infrastructures. As oneapproach, Jalali et al. [Jal+16] take into account the energy efficiency ofthe access network that is used when performing Edge Computing. The au-thors conclude that micro data centers at the edge can indeed be more energyefficient than Cloud Computing. They further identify the processing of con-tinuous data streams as an ideal edge application, especially when those datastreams are on end user premises and have a low access rate (e.g., videosurveillance). Boukerche et al. [BGG19] survey energy-efficient offloadingin Mobile Cloud Computing from the perspective of both the mobile deviceand the cloud infrastructure. The authors consider different types of deploy-ments and especially mention the possible energy overhead of the offloadingprocess.
ADVANTAGE IV: BETTER PRIVACY AND DATA PROTECTION | In Cloud Computing, userstypically have little control over their data and where exactly it is processed.Yet, users’ end devices generate more and more data at the edge, many ofwhich is personalized and privacy-sensitive, e.g., in healthcare-related appli-cations. As users become more sensitive to privacy issues, they might not be

18 Chapter 3. Characteristics of Edge Computing
willing to accept the current practice of how data is processed. For example,Davies et al. [Dav+16] outline how privacy concerns hinder user acceptanceof IoT deployments.
Edge Computing offers the opportunity to act as a privacy-enabling mediatorbetween the user’s data and cloud-based services, especially when users haveaccess to edge infrastructures that are within their trust domain or that areoperated by trusted providers. Since Edge Computing resources are offeredon-site, providers are subject to local laws and regulations. Depending on thelocation, this can give certain assurances, e.g., with regards to data protectionlaws. Furthermore, following the same argument, Edge Computing providerscan typically be held accountable more easily than (foreign) Cloud Comput-ing providers. Edge Computing allows the application of privacy-preservingmechanisms (e.g., as proposed in [Shi+11]) early in the processing chain andclose to the data source, hence reducing the impact of potentially untrustwor-thy processing entities that subsequently handle the data. The fact that in apublic Edge Computing infrastructure, multiple providers would be involvedfurther strengthen the benefits with regards to privacy and anonymity. Pro-tocols like cMix [Cha+16] have shown that anonymous communication canonly be broken if all parties cooperate to do so. We argue that this is anunrealistic scenario in a multi-provider Edge Computing infrastructure.
Besides data from individuals, data collected in public spaces is also relevantto privacy. For example, a camera mounted on top of a road intersection cap-tures video streams that are used to optimize traffic and dynamically adapt thetraffic lights. This application may be realized in different processing steps,e.g., detecting cars in individual lanes, aggregating their number, computinga strategy to optimize the traffic, and so forth. To preserve drivers’ privacy, theblurring of license plates would be a critical task that has to be carried out atthe edge before transferring the video streams for further analysis. Similarly,Basudan et al. [BLS17] present an encryption scheme to ensure privacy whenmonitoring road conditions. Other works explore privacy-preserving publish-subscribe mechanisms at the edge [Wan+17] or how edge infrastructures canhelp in the dissemination of information containing certificate revocations[Alr+17].
While many of these potential benefits are acknowledged in literature, less attentionhas been directed to the possible drawbacks of Edge Computing. In particular, weconsider the following aspects to be problematic:
DRAWBACK I: UNRELIABLE DEVICES | Because Edge Computing relies on small-scale, often consumer-grade devices that are used opportunistically as edgenodes, their reliability cannot compete with advanced measures for reliabil-ity in data center environments, such as UPS1, emergency power systems,redundant cooling, redundant network connections and high-speed intercon-nections that enable large-scale replication. Edge Computing must thereforeeither be tolerant of failures or mitigate the effects via replication schemes,e.g., by replicating stored data across edge nodes [MRS19].
DRAWBACK II: LOW INDIVIDUAL COMPUTING POWER | The computing power of in-dividual edge nodes is usually much lower compared to a cloud data center.
1uninterruptible power supply
3.2. Access Technologies and Communication Patterns 19
For latency-tolerant heavy computations, such as neural network training, thecloud will remain the predominant deployment model.
DRAWBACK III: LIMITED SCALE-OUT CAPABILITIES | Since the capacity at each edgesite is limited, it is much more difficult to scale out edge applications with highdemands in a small area. Because data centers are designed to serve largegeographical areas, local spikes in demand, e.g., during an event, are small incomparison to the total demand. In contrast, Edge Computing infrastructuremay be overwhelmed in such a situation as the area over which extra demandcan be distributed while still fulfilling good quality of service might be limited.
DRAWBACK IV: HIGH OPERATIONAL EXPENSES | Edge Computing is likely to be moreexpensive than traditional Cloud Computing, which benefits much more fromeconomies of scale. Cost benefits of large-scale data centers [Gre+08] thatcannot be exploited in Edge Computing include rental cost, energy cost, andpersonnel cost. Data centers are often built in places with low taxes, low landcosts, and low energy prices. They concentrate vast amounts of homogeneousservers and networking hardware in one easy to reach location. Cloudlets,however, must be geographically much closer to their clients, which preventsstrategic positioning in low-price areas. Also, due to the distribution overmany small-scale locations, the maintenance is much more complex. For EdgeComputing to be economically viable, the resulting higher cost must be com-pensated by lower data transmission costs or other benefits, like increasedprivacy or the need for ultra-low latency.
DRAWBACK V: CONCERNS ABOUT SECURITY AND TRUST | The idea to opportunisti-cally leverage devices in one’s surroundings to carry out computations andstore data naturally raises concerns about such a system’s security and trust-worthiness. According to [Muk+17], existing mechanisms for the cloud can-not be applied to edge environments. Roman et al. [RLM18] survey thesecurity threats and corresponding challenges in Edge Computing and FogComputing. To make Edge Computing pervasive, unified trust models andauthentication mechanisms across stakeholder boundaries are required.
3.2 Access Technologies and Communication Pat-terns
We now turn our attention to the typical access technologies and communicationpatterns in Edge Computing. While Cloud Computing is accessed through wiredbackhaul connections, one characteristic of Edge Computing is that clients are typ-ically connected to the edge resources through wireless gateways. We expect edgeresources to be either colocated on those gateways or within 1-hop distance. Toconnect to wireless gateways, client devices use different access technologies. Themost common are WiFi [Ged+17] or cellular [SBD18] connections. In this domain,we can observe development in two aspects:
(i) NEW COMMUNICATION STANDARDS EMERGE | One example of emerging stan-dards are 5G networks that are expected to be deployed soon. 5G not onlypromises much higher bandwidth and lower latencies compared to current

20 Chapter 3. Characteristics of Edge Computing
cellular networks, but it will also provide additional services like context-awareness on the network access layer [Ban+14]. Other future wireless ac-cess technologies include millimeter wave [Aba+] and visible light communi-cation [JLR13]. These (future) technologies will contribute to a widespreadcoverage of high-speed wireless access points.
(ii) NOVEL GATEWAY DEVICES | Existing access technologies will be embedded intonew devices that can act as gateways. One example in the urban space arestreet lamps, as we will describe in Chapter 5. While today only providinglighting, emerging smart lamp posts are designed to offer colocated accessand computing resources. A second example is to leverage computing re-sources present on modern cars [Hou+16]. It has also been suggested toplace computing resources on UAVs2 [Sat+16; JSK18b].
Besides the wireless access technologies, we can also distinguish Edge Com-puting systems by their communication patterns. Generally speaking, our comput-ing world consists of humans and various things that are connected. Dependingon which entities communicate with whom, different terminology is used, such asMachine-to-Machine (M2M), Device-to-Device (D2D), Car-to-Infrastructure (C2I),Car-to-Car (C2C), etc. The important distinction between all those terms is whetherwe have autonomous communication between devices or human actors in the loop.
3.3 Device Ecosystem
One of the most striking characteristics of Edge Computing is the heterogeneity ofdevices that are involved in the capture and processing of data. The number ofmobile devices and sensors that capture data has dramatically increased in recentyears. One prominent example are today’s smartphones. According to a recentstudy3, the number of mobile broadband subscriptions has reached 6 billion as oftoday and will grow to over 8 billion by 2024. Similarly, the IoT aims to connect avariety of objects such that these are able to communicate with each other [AIM10].Other end devices include smartwatches, smart glasses, and personal on-body sen-sors. Common to all of them is that they generate large amounts of data that needfurther processing to provide additional services. This need for processing has beenone of the most important aspects for the development of Edge Computing.
In Edge Computing, not only end devices are heterogeneous, but also the de-vices on which the computations are carried out. Every device in the vicinity of themobile client that has spare resources to perform computations can be consideredfor Edge Computing. This can range from consumer-grade hardware to hardwaredesigned for data centers. For example, small-scale single-board computers such asRaspberry Pis have been used in Edge Computing [Pah+16; BZ17] as well as homerouters [Meu+15] or compact setups with more powerful hardware [RAD18]. Inbetween end-user locations and cloud data centers, we can also leverage networkmiddleboxes that have additional computing capacity available. This was the initialuse case for Cisco’s vision of Fog Computing [Bon+12]. As we move closer to theedge of the network, we expect to find devices with fewer resources but in greater
2unmanned aerial vehicle3https://www.ericsson.com/en/mobility-report/reports/june-2019 (accessed: 2020-03-22)

3.4. Stakeholders and Business Models 21
TAXI
FIGURE 3.1: HETEROGENEOUS EDGE COMPUTING DEVICE ECOSYSTEM†
number. This reverses as we move closer to the cloud because most locations at theedge of the network cannot physically accommodate the resources found in a datacenter.
In summary, the ecosystem of devices is very heterogeneous, both in terms oftheir functions and form factors, but also regarding their capabilities and computingpower. Figure 3.1 depicts this heterogeneous ecosystem of devices that are involvedin Edge Computing, ranging from sensors and consumer devices to more powerfulcomputing infrastructure as we move towards the core network. The heterogeneityin Edge Computing is a main requirement that planning and runtime decisions (e.g.,with regards to the placement and assignment of resources) need to consider.
3.4 Stakeholders and Business Models
In the previous sections, we discussed Edge Computing’s heterogeneity w.r.t. ap-plications and devices. The variety of stakeholders is another dimension of het-erogeneity in Edge Computing. Stakeholders in this context are individual usersor organizations that (i) use services deployed at the edge, (ii) operate edge infra-structure, or (iii) benefit from edge deployments. Figure 3.2 shows an example ofthree stakeholders (the user of a service, the service provider, and the infrastructureprovider). The figure also shows their (partially overlapping) interests.
Users have certain requirements and expectations regarding the quality of ser-vice delivered by applications. Notable examples are a low (perceived) latency andhigh service availability. For many future use cases, leveraging Edge Computing tomeet those demands will be indispensable. Service providers in turn are responsiblefor ensuring that their services can meet these demands to satisfy their customers.For infrastructure providers (e.g., ISPs and operators of cellular networks) EdgeComputing can be an opportunity to generate additional revenue. This, for exam-ple, can be achieved by either offering (virtualized) resources at the access networkor renting out space for server colocation at those access gateways. Besides com-mercial offerings, we can also imagine that Edge Computing infrastructures will beoffered free of charge. For example, cities could provide those as a service to their

22 Chapter 3. Characteristics of Edge Computing
CustomerSatisfaction
ensure serviceavailability
e cientinfrastructure
utilization
InfrastructureProvider
high qualityof service
ServiceProvider
User
FIGURE 3.2: STAKEHOLDERS IN EDGE COMPUTING †
citizens [Mot+13]. Similarly, private citizens could offer resources for free. Thiskind of sharing economy has already been seen for providing WiFi connectivity[EFP10]. Therefore, offering computing power could be a next step.
The diverse ownership of edge resources and the lack of a unified business modelis also one of the major reasons why finding appropriate business models for EdgeComputing remains a challenge (see Section 11.2.3).
3.5 Enabling Technologies
A number of enabling technologies have lately fostered the development of EdgeComputing. For example, encapsulating and moving parts of an application wouldbe difficult without lightweight virtualization standards. The most important ofthose enabling technologies are summarized in this section.
3.5.1 Offloading Mechanisms
Computation offloading—sometimes also named cyber foraging [Bal+02; BF17]—is the process of running an application or parts thereof outside the client device[Kum+13; MB17] on a so-called surrogate. Surrogates are computing resourcesthat execute tasks on a client’s behalf [GC04]. The motivation for computationoffloading can be twofold. The first reason is related to the limited resources ofmobile devices. Either the device does not have enough resources, or the resourceswould only be able to produce an inaccurate or unsatisfiable result. In many cases,offloading to powerful surrogates can reduce the execution time [KYK12] of thetask. The other benefit of offloading is related to energy considerations, as pointedout in Section 3.1. In this regard, computation offloading can help to save energyon a mobile device and hence prolong its battery life, as demonstrated in [KL10;LWX01]. Furthermore, the parallel execution of offloaded tasks can greatly im-prove the system’s scalability [Kos+12]. Kumar et al. [Kum+13] and Sharifi et al.[SKK12] provide extensive surveys on computation offloading.

3.5. Enabling Technologies 23
Offloading decisions. To perform offloading, it needs to be decided what to of-fload, when to offload and where to offload to. What to offload is typically deter-mined by a component—the application profiler—that automatically partitions theapplications into offloadable and non-offloadable parts [Cue+10; Chu+11]. Theparts that are to be offloaded can also be specified manually, e.g., through annota-tions made by the developer. When and where to offload is decided by schedulingmechanisms, e.g., as presented in [DH15]. It is worth mentioning that deciding ifsomething should be offloaded requires taking the overhead into account. Offload-ing typically also means that the logic and in some cases the execution environ-ment has to be transferred to the surrogates, which in turn consumes energy andincurs additional latency. This is especially true for low-quality wireless connec-tions. Therefore, the offloading decision should be based on a careful tradeoff andideally take contextual information (e.g., remaining battery, network conditions,and QoS requirements) into account [Zho+17]. This is a well-studied optimiza-tion problem. As an example, the work of Chen et al. [Che+16] focuses on theoffloading decision itself. Miettinen and Nurminen [MN10] analyze the critical fac-tors for energy-efficient offloading. Many applications [Alt+16; Azi+17; Zha+17]take into account the different characteristics of edge and cloud and hence, offloaddelay-tolerant tasks to the cloud and time-critical tasks to the edge.
Offloading granularities and offloading targets. Offloading can be done in dif-ferent granularities, e.g., entire virtual machines [Shi+13], threads [Gor+12], orpieces of code [Cue+10]. Most of the existing approaches are aimed at MCC, i.e.,the surrogates are located in the cloud. One notable exception is Paradrop [LWB16],a platform for the deployment and orchestration of containerized applications onWiFi access points. Golkarifard et al. [Gol+19] present a framework that supportsboth cloud and edge offloading for wearable computing applications. As an alter-native approach for offloading, we will present the concept of a microservice storein Chapter 7.
3.5.2 Lightweight Virtualization
Offloading computations requires the packaging of application logic and/or execu-tion environments into units that can be re-used across runtime instances. Com-puting resources in Edge Computing typically feature multi-tenancy, i.e., they areshared among multiple applications. Therefore, offloaded applications typically runin virtualized environments. Virtualization serves two main purposes: flexibilityand isolation. However, virtualization entails a tradeoff that needs to be balancedcarefully in Edge Computing environments. On the one hand, virtualized environ-ments should have little overhead in terms of management complexity and startuptime when comparing them to processes running on a shared operating system. Onthe other hand, given the multi-tenant nature of virtualized environments, securityand privacy considerations dictate strong isolation between different applicationson the same edge device. The type of virtualization environment furthermore de-termines which techniques for application migration can be used [Pul+18].
Virtual machines. The seminal paper that introduced cloudlets [Sat+09] envi-sioned virtual machines (VMs) as the virtualization layer. However, virtual ma-chines encapsulate entire operating systems, and while they provide good isolation,
24 Chapter 3. Characteristics of Edge Computing
they incur a large overhead in terms of size and startup time. Hence, in practice, twoviable virtualization technologies have emerged for Edge Computing [Mor+18a]:containers and unikernels.
Container-based virtualization. Containers do not need a separate guest operat-ing system for each application. Instead, this technology uses virtualization on theoperating system level. The operating system, its kernel, and libraries are sharedand, hence, the isolation is weaker compared to VMs. However, this weaker isola-tion is traded for enhanced performance, e.g., by a lower startup time and smallersize of application images. Ramalho and Neto [RN16] and Felter et al. [Fel+15]have analyzed the performance difference between containers and VMs in detail,outlining, e.g., the superior performance of containers with regards to disk andnetwork throughput. Using containers also simplifies the management of hardwareresources, since only one OS has to be maintained. A container engine provides aformat for bundling applications and an interface to control the execution of con-tainerized applications. An important feature of container-based virtualization isthat components can be reused across different containers. Often, a so-called baseimage is used, on top of which additional components and dependencies are loaded.Consequently, the image of a containerized application is rather small, as both thebase image and additional dependencies are typically loaded upon the container’sinvocation. This allows shipping applications as smaller, portable units comparedto virtual machines. These are desirable properties that make containers a viablevirtualization technology for Edge Computing [PL15].
Besides access to virtualized resources like CPU or memory, the container enginecan also provide applications with network connectivity, both internally as well asmapped to the operating system’s ports. From a technical perspective, Linux-basedcontainer engines use two main features of the kernel to realize containerized appli-cations: cgroups to control resource utilization and namespaces to provide isolation.In practice, Docker4 has emerged as the de-facto standard container platform, al-though others exist, e.g., LXC/LXD5, OpenVz6, Rocket7, and podman8. One advan-tage of Docker is the easy syntax of the Dockerfile through which container imagesare defined. In addition, powerful tools for the orchestration of Docker containersexist, most notably Docker Swarm9 and Kubernetes10. Consequently, Docker hasbeen used in various approaches for implementing Edge Computing prototypes,e.g., [LWB16; BZ17].
Unikernels. While recent efforts have been directed towards shrinking the size ofcontainers [Tha+18], unikernels are an even more lightweight approach to virtu-alization than containers [Mad+13; MS13]. Contrary to containers, which shareall of the operating system’s libraries, unikernels can be considered an isolatedbootable image that can run on bare metal or a type-1 hypervisor. The differ-ence to virtual machine images is that unikernels do not contain a complete op-erating system and its libraries. Instead, only the parts required to execute the
4https://www.docker.com/ (accessed: 2019-08-09)5https://linuxcontainers.org/ (accessed: 2019-08-09)6https://openvz.org/ (accessed: 2019-08-09)7https://coreos.com/rkt/ (accessed: 2019-08-09)8https://podman.io/ (accessed: 2019-08-09)9https://docker.com/products/orchestration (accessed: 2019-08-09)
10https://kubernetes.io/ (accessed: 2019-08-09)

3.5. Enabling Technologies 25
functionality are included, hence they are often referred to as library operating sys-tems. Everything required to run the application is compiled into the unikernel’simage. At runtime, unikernels run as a single-process and have no distinction be-tween user space and kernel space. This architecture leads to a very fast boot timeand execution speed of unikernels, since many management functionalities suchas context switching, scheduling, and the management of virtual memory are non-existent. Furthermore, their reduced attack surface (since no unused componentsand libraries are included) makes them more secure. Due to their restrictions, e.g.,no forking is supported, not every application can immediately be packed into aunikernel. Some projects like Unik11 aim to automate unikernel compilation anddeployment, but in general, this is highly specific to the particular unikernel, and aunified orchestration of unikernels remains challenging. The unikernel landscape israpidly evolving, with new projects constantly emerging. At the time of writing, Mi-rageOS12, Rumprun13, OSv14, ClickOS15, and HalVM16 are among the most popularand active unikernel projects. Some works have already applied unikernels to EdgeComputing environments. Cozzolino et al. [CDO17] have suggested unikernels foredge offloading. Wu et al. [Wu+18] advocate the concept of a rich unikernel tosupport various applications. As a proof-of-concept, the authors integrated Androidsystem libraries into a OSv unikernel.
3.5.3 Software-Defined Networking
Software-Defined Networking (SDN) has emerged from the paradigm of active net-working [BCZ97]. The basic idea of SDN is to separate the control plane (i.e., thepart that determines the behavior of network functions) from the data plane (i.e.,the entities that forward data) of the network [Kre+15]. SDN brings advantagesfrom the management and operation’s perspective of computer networks. For ex-ample, the management of networks is simplified because devices do not have tobe configured independently and manually. Instead, configurations are performedthrough a (logically) centralized control entity. Users can specify rules in a high-level way, which are then translated by the controller and applied to network devicesvia protocols like OpenFlow. These protocols can be used to perform managementfunctionalities in the network, such as defining flows or network slices.
Future potential of SDN. While SDN today is mainly used to control the forward-ing of data, future implementations of the general concept can be a crucial enablerfor Edge Computing because of two main reasons. First, SDN abstracts away com-plex management tasks from the user. For example, the control plane could be re-sponsible for the placement and orchestration of services. Users would just specifywhat service they request, and the decision where to instantiate it would be takencare of by policies at the control plane. Similarly, the controller’s global view canbe leveraged for service discovery and to collect measurement data on the state ofthe network. Second, the capability of SDN to dynamically reconfigure the networkis crucial in dynamic edge environments. For instance, these dynamics are related
11https://github.com/solo-io/unik (accessed: 2019-08-09)12https://mirage.io/ (accessed: 2019-08-09)13https://github.com/rumpkernel/rumprun (accessed: 2019-08-09)14http://osv.io/ (accessed: 2019-08-09)15http://cnp.neclab.eu/projects/clickos/ (accessed: 2019-08-09)16https://github.com/GaloisInc/HaLVM (accessed: 2019-08-09)

26 Chapter 3. Characteristics of Edge Computing
to user mobility or changes in service demands. In case of necessary migrations,e.g., due to intermittent connectivity to unreliable compute nodes, SDN-enablednetworks can push new flow rules to the network in order to redirect traffic. Fur-thermore, SDN can also help to provide guarantees on the quality of service deliv-ered by edge services, e.g., by reserving bandwidth on network links. Few workshave already applied some principles of SDN to edge environments. For example,Heuschkel et al. [Heu+17] present a protocol to extend software-defined controlbeyond the core network to the end devices. Bi et al. [Bi+18] show how user mo-bility can be realized by decoupling mobility control and data forwarding throughSDN. An extensive overview of how Edge Computing can benefit from SDN can befound in [BOE17].
3.5.4 Network Function Virtualization
Network Function Virtualization (NFV) is the concept of decoupling network func-tions from the dedicated hardware appliances they are typically deployed on. In-stead, the concept of NFV aims at deploying those functions as software compo-nents atop of virtualized infrastructures. Examples for such network functions in-clude deep packet inspection (DPI), firewalls, software-defined radios (SDR), andnetwork address translation (NAT), among others. Because all the functions arebuilt in software and run on virtualized hardware, making changes to them is veryfast and easy. One popular example of an NFV platform is ClickOS [Mar+14]. Acomprehensive survey about the current state of NFV can be found in [Mij+16].
Future potential of NFV. The main benefit of NFV for network operators and ser-vice providers is to make the deployment and operation of their network more cost-efficient [Haw+14]. Moving towards virtualized network functions is also interest-ing in view of new network technologies. For example, Abdelwahab et al. [Abd+16]show how NFV can help to fulfill the requirements of 5G networks. Hence, there isa big interest in NFV as a business model.
At the same time, we can observe a kind of “chicken-or-egg problem” when ask-ing the question of why no widespread edge infrastructure is available yet, e.g., atthe radio access network (RAN). Taking the example of a RAN, a network operatorcurrently might not see a business opportunity for Edge Computing because veryfew novel applications that would benefit from it (and users willing to pay to use theservice) exist. Similarly, the lack of an Edge Computing infrastructure hinders thedevelopment of such applications. NFV has the potential to break this vicious cycleand become a crucial enabler for Edge Computing. Standardized server hardwareis already being deployed and virtualized by network operators. Therefore, thefoundation to run Edge Computing already is there, albeit for a different reason.In addition, should other stakeholders, e.g., cloud infrastructure providers, makeincreased efforts to enter the Edge Computing market, this competition is likely toaccelerate the adoption of Edge Computing in the NFV environment.

CHAPTER 4
Classification and Analysis of Applications
Chapter Outline4.1 Methodology . . . . . . . . . . . . . . . . . . . . . . . . . . . . 27
4.2 Application Survey . . . . . . . . . . . . . . . . . . . . . . . . 31
4.3 Summary . . . . . . . . . . . . . . . . . . . . . . . . . . . . . . 44
4.4 Conclusion and Requirements . . . . . . . . . . . . . . . . . 48
This chapter reviews and analyzes the application landscape that revolvesaround Edge Computing. First, in Section 4.1, we present a systematic methodol-ogy for the analysis of applications. More specifically, we introduce four kinds ofcomponents that applications are comprised of and suggest to classify applicationsaccording to the notion of augmentation. As a second contribution, using the intro-duced methodology and the characteristics of Edge Computing (see Chapter 3), wetake a detailed look at possible applications for Edge Computing. Section 4.2 an-alyzes representative use cases for each category of applications and discusses themapping between an individual application’s characteristics and how well they canbe served by executing the application or parts thereof at the edge. This helps toget a clearer picture of how the challenges differ for different application types andwhere using Edge Computing can truly be beneficial. From the results of this sur-vey, we summarize key observations in Section 4.3 and conclude with requirementsthat will be addressed in the remainder of this thesis in Section 4.4.
4.1 Methodology
4.1.1 Components of Edge Applications
Applications that make use of Edge Computing do so by offloading data or computa-tions to resources at the edge. In addition to this general distinction, we can further-more take a data-centric perspective and investigate how data is transformed and
27

28 Chapter 4. Classification and Analysis of Applications
processed. Based on these two aspects, we define the following four componentsthat applications can use: (i) data consolidation, (ii) filtering & pre-processing,(iii) data storage & retrieval, and (iv) computation offloading. They are visualizedin Figure 4.1. While the first two concern the flow of data and describe how datais transformed, the latter two indicate what happens with the data. Those compo-nents allow to cover a wide range of applications for which Edge Computing is rel-evant, e.g., for overcoming devices’ limitations (through offloading), enabling col-laboration (through sharing of data), or for coping with high-volume data streams(through consolidation and filtering). Besides applications being distributed, thecomponents are also subject to distribution themselves, which entails further chal-lenges, e.g., where to place them. Concrete implementations of the componentsmay have different levels of complexity, and applications can combine multiple ofthose components.
(a) Data consolidation (b) Filtering & pre-processing
(c) Computation offloading (d) Data storage & retrieval
FIGURE 4.1: APPLICATION COMPONENTS†
4.1.1.a Data consolidation
Data consolidation combines data from multiple sources and reduces it to a smaller,often more meaningful joint representation. As an example, consolidating data inthe context of complex event processing (CEP) [CM12] has the potential to savebandwidth if consolidation operations are placed at the network edge before thestreams of data are transferred further [SS13; Gov+14]. One example of data con-solidation is averaging sensor data, e.g., providing an average temperature readingover a certain time.
Executing data consolidation tasks at the edge instead of in the cloud has the po-
4.1. Methodology 29
tential to greatly reduce end-to-end latency and required bandwidth. The amountof bandwidth savings depends not only on the relation between the input band-width and the output bandwidth of the data consolidation task but also on thetask’s location in the network. For example, averaging sensor data on-site mightrequire orders of magnitude less overall bandwidth than averaging the data in thecloud. Furthermore, tight latency requirements might make consolidation in thecloud infeasible in some cases.
4.1.1.b Filtering & pre-processing
The purpose of this component is twofold: discarding irrelevant data (data filter-ing) and transforming the data or its representation (pre-processing). Since notall data is equally important, bandwidth savings can be achieved by discarding ir-relevant data before it is transmitted for further processing. A simple example isthresholding of temperature readings in an application where an alarm should beraised when a certain value is exceeded. In such an application, temperature read-ings are irrelevant as long as they are within the normal range and thus need not betransmitted. Besides saving bandwidth, reducing data locally can also help to saveenergy and reduce local storage needs [Gau+13]. In pre-processing, data is trans-formed from one representation to another. Besides discarding data, which couldbe interpreted as a special case of such a transformation, other examples are theaggregation of data streams over time, data compression, data alteration, or bridg-ing between formats. For instance, real-time video analysis, a likely “killer app” forEdge Computing [Ana+17; LQB18], has the potential to save vast amounts of band-width by only forwarding results of the analysis, e.g., the number of objects in theframe, instead of entire video streams. To give a practical example, a video streammay be encoded to a lower bitrate or faces in the video stream could be blurredfor privacy reasons. Powers et al. [Pow+15] demonstrate the use of cloudlets topre-process data for a face recognition application. Both of these aspects can savebandwidth, depending on the ratio of data discarded and how much data is re-duced by the pre-processing. Furthermore, in the case of time-critical data streamprocessing applications, distributing such operations entirely at the edge can reduceend-to-end latencies substantially [Nar+19; Car+15].
4.1.1.c Computation offloading
Computation offloading is the process of executing a task outside the client deviceon a remote resource. This task is often resource-intensive. The client transfers theinput data and in some cases the code and execution environment and retrieves theresult. For example, offloading computation-intensive neural networks [Li+16a;Hu+17; LZC18] or rendering operations [Shi+19] from a mobile device could de-crease the execution time and save battery energy. We refer the reader to Sec-tion 3.5.1 for a more detailed description of this concept.
4.1.1.d Data storage & retrieval
Applications might want to store data outside of the device for several reasons. First,additional external storage helps to overcome the device’s storage limitations. Sec-ond, data often needs to be shared across different users and applications. When-ever data is only of local relevance, leveraging the edge, i.e., storing the data on

30 Chapter 4. Classification and Analysis of Applications
close-by devices, is beneficial for access latencies and bandwidth utilization in thenetwork. Often, this data will be contextual data and short-lived information cap-tured by the user. Storage can either be ephemeral, i.e., short-lived, or permanent.In the latter case and if we consider unreliable devices, replication is required. Ifdata is replicated, the client needs to make a decision from where to retrieve it,ideally considering the abovementioned metrics of latency and bandwidth. Sec-tion 4.2.1.c presents several examples of approaches related to data storage andretrieval.
4.1.2 Classification Scheme
TAXI
FIGURE 4.2: CATEGORIES OF APPLICATIONS†
To categorize the vast amount of proposed applications for Edge Computing, weclassify them into four categories. Contrary to previous works whose classificationsare rather enumerative, our classification starts from the very purpose of Edge Com-puting, i.e., to bring data and computations closer to where data is generated andresults of the computations are needed. To do so, we define four categories aroundthe notion of augmentation, as depicted in Figure 4.2. We use the term augmen-tation to denote the intertwining of the physical world with the digital world. Atthe top level, a common categorization of the physical world divides it into animateand inanimate objects. Looking at their interaction with the digital world, the abil-ity to actively and consciously influence the latter is largely restricted to a subset ofthe animate world, i.e., humans. Therefore, our classification starts from the dis-tinction between humans and things. For humans, we further distinguish betweenseparate (mobile) devices used and/or carried by the user (mobile device augmen-tation, Section 4.2.1) and devices that are interwoven to a higher degree with theuser, e.g., devices that are worn or connected and affect the user’s body function(human augmentation, Section 4.2.4). For things, following the widespread IoT ter-minology, Section 4.2.3 defines one category as IoT device augmentation. However,we also want to stress the benefits of Edge Computing in enhancing the smartnessof public spaces and larger environments as opposed to single devices in closedownership. Therefore, we also define the category of infrastructure augmentation(Section 4.2.2). We acknowledge that some use cases may be considered to belong

4.2. Application Survey 31
to more than one category; however, we share this issue with the vast majority ofcategorizations in every domain. Nevertheless, we argue that our classification hasthe advantage of being simple, inclusive, and at the same time open to fit futureapplications.
4.2 Application Survey
For each of the categories defined in Section 4.1.2, we describe representative usecases and analyze the benefits of Edge Computing with regards to the four advan-tages as defined in Section 3.1. Note that regarding energy-saving and energy effi-ciency, we only consider the potential energy saving and hence battery life prolon-gation of end devices as this is often more relevant than the total energy footprint.Energy savings in network equipment are sufficiently represented by the bandwidthcriterion.
We do not restrict our analysis to papers where Edge Computing has been pro-posed or that are currently associated with Edge Computing use cases but includeothers for which at least some benefits of Edge Computing apply. Furthermore,following our taxonomy discussed in Section 2.1, we also include literature thatrelates to Fog Computing. This helps to get a comprehensive overview of potentialuse cases for Edge Computing. At the end of this section, we summarize our find-ings for the most pertinent use cases. Those references that appear in Table 4.1 aremarked with an asterisk (*) throughout the following subsections.
4.2.1 Mobile Device Augmentation
The applications outlined in this section are specifically targeted at the consumer’smobile devices, such as smartphones, tablets, or head-mounted devices. Specif-ically, we look into mobile gaming (Section 4.2.1.a) and emerging virtual/aug-mented reality applications (Section 4.2.1.b). In addition, new applications andusage patterns require appropriate strategies for data storage and caching (Sec-tion 4.2.1.c).
4.2.1.a Mobile gaming
In gaming, we observe the trend towards (i) more mobile games (i.e., games playedon a connected handheld device), (ii) more games that interact with the player’s en-vironment or other players in proximity, and (iii) business and deployment modelsbased on Gaming as a Service (GaaS). As described in [CCL14], GaaS is the conceptof providing scalability and overcoming hardware limitations through modulariza-tion of the game. For example, certain functionality (e.g., rendering) is migratedfrom the mobile device and offloaded to a server. Functionalities like rendering arecomputationally intensive, and hence, offloading them can significantly improvebattery life.
Most games are highly interactive and, thus, players expect crisp responsiveness.The responsiveness is influenced by the computation and communication time ofthe offloaded components and—in some cases—by the latency to other players.Pantel and Wolf [PW02] claim that depending on the type of game, only 50 ms–100 ms of delay is tolerable. As analyzed by Choy et al. [Cho+12], the cloud will beunable to meet the latency requirements of gaming applications (assuming a target

32 Chapter 4. Classification and Analysis of Applications
latency of 80 ms). To solve this issue, the authors propose to extend the cloudinfrastructure with local content delivery servers to serve users’ demands. Thishas led big companies to extend their data centers towards the edge. Plumb andStutsman [PS18]* demonstrate how exploiting Google’s edge network can reducethe latency for massively multiplayer online games. Specifically, they define an areaof interest latency as the latency between players that interact in the virtual world.The authors report an improved mean latency from 52 ms to 39 ms and for the 99th
percentile an improvement from 110 ms to 91 ms. As shown before, this can makethe difference between an enjoyable experience and an unplayable game.
For these reasons, extending the infrastructure for mobile gaming to the edgemakes sense. In addition, tasks like rendering typically require only small data asinput (e.g., the user’s position, field of view or current action) while the size of thereturned data (in this example the rendered object) is much larger. This observationmatches the asymmetric down- and uplink bandwidth that end users today have incellular networks. Messaoudi et al. [MKB18b]* present a general framework foroffloading parts of a modularized game engine. Lin and Shen [LS17]* extend cloudgaming with fog nodes that are responsible for rendering game videos and stream-ing them to nearby players. Similarly, the work of Kämäräinen et al. [Käm+14]supports the deployment of game services in hybrid (public, enterprise, private)cloud infrastructures. Using local processing, they were able to almost halve thedelay. Furthermore, their results indicate that connecting to a cloud via WiFi is lessdetrimental to the device’s energy consumption compared to 4G cellular networks.
Cai et al. [Cai+18]* investigate a scenario in which neighboring players co-operate in a game. They advocate cloudlets in the vicinity of players to reducebandwidth and latency bottlenecks, and also consider the energy dimension, bothfor the mobile device and the overall energy cost for data transmission. In manygames, players are mobile, e.g., when the game requires them to interact with theirenvironment or visit different locations. Hence, the issue of migrating offloadedparts of the game arises. Braun et al. [Bra+17b] propose an application-level mi-gration technique for latency-sensitive gaming applications. The server is trans-parently live-migrated during gameplay. The authors argue that the advent of 5Gnetworking will provide ultra-low latency and high-bandwidth to mobile devices.Hence, it would make sense to locate edge game servers at those locations.
4.2.1.b Augmented reality and virtual reality
Augmented reality (AR) and virtual reality (VR) have gained enormous traction dueto the advent of new consumer devices such as the Microsoft HoloLens or HTC Vive.In augmented reality, virtual objects are integrated into the environment [Azu97].Augmented reality applications extend the user’s real-world view by inserting vir-tual objects into the environment, related to one’s context and movement. Virtualreality (VR) is defined by creating a sense of presence in simulated environments[Ste92]. Both variants are typically interfaced to the user via a head-mounted dis-play (HMD). Applications leveraging VR and AR mainly fall into the categories ofinformation (e.g., in retail [Cho+16] or for tourist guidance [Tal+17]), education[Wu+13], and entertainment [Tho12]. Common to all of them is that computation-ally heavy tasks need to be carried out in order to render and understand a scene.
AR/VR applications are subject to stringent real-time demands on their respon-

4.2. Application Survey 33
siveness. For head-tracked VR, it has been shown that the JND1 for latency discrim-ination is 15 ms [Man+04]. Especially in VR, motion sickness can occur if the delaybetween tracking the movement and rendering the scene exceeds this value.
Because high-framerate 3D rendering is computationally demanding, manyheadsets carry out those tasks on a standalone computer, connected to the head-set through a cable. Removing this cable is desirable for the user experience, butchallenging due to the high data rates a wireless channel must guarantee. Someattempts have been made by using new wireless communication technologies suchas mmWave [Aba+] or by partitioning the computations between the HMD and therendering server [CCK18]. The latter is required because computational capacity(especially GPU) remains limited on end devices. At the same time, the stringentlatency requirements prohibit offloading to the cloud. Hence, the challenge is todesign good offloading strategies to nearby rendering servers while coping withcurrent wireless communication technologies. Braud et al. [Bra+17a] have ana-lyzed these challenges with a focus on mobile users. Furthermore, as outlined in[Tri+19], battery life and latency form a tradeoff.
Despite these challenges, a few solutions to leverage Edge Computing in AR andVR have been proposed. Elbamby et al. [Elb+18] have envisioned a combination ofEdge Computing for computation and mmWave for communication as a crucial en-abler for wireless VR. Lai et al. [Lai+17]* have presented the idea of a cooperativerenderer. The authors base their system on the observation that less-predictablescene updates are typically more lightweight, and therefore, those are rendered atthe edge. For highly predictable scene changes, pre-rendered frames are fetchedfrom nearby locations. In addition, compression and panoramic frames are usedto reduce the load on the wireless link. Similarly, Shi et al. [Shi+19]* have pre-sented a rendering scheme that saves more than 80 % of bandwidth and thereforeenables the delivery of VR content over 4G wireless links. Liu et al. [LH18] havepresented DARE, a novel network protocol that enables mobile users to dynami-cally change their AR configuration. Specifically, it adapts to changes in networkconditions and load on edge nodes—both crucial in dynamic edge environments.Tirelli et al. [Tri+19] have used an approach based on NFV. They have developeda framework for live video augmentation by extracting and injecting video streamsfrom or into network flows.
Besides partitioning workload only between the end device and one edge node,some workloads benefit from distributed processing across several cloudlets. For ex-ample, Bohez et al. [Boh+15]* reconstruct 3D maps from the depth cameras of ARheadsets. They do this by partitioning sub-models across geographically distributedcloudlets.
Gaming with VR/AR is a popular application scenario, and due to its specificcharacteristics, we review existing work independent from Section 4.2.1.a. Viita-nen et al. [Vii+18] have presented a rendering scheme for real-time VR gamingthat saves energy and computational load on the end device. The rendered viewsare encoded as HEVC2 frames and transmitted based on the user’s field of vision. In[Zha+17], the authors have explored the scalability issue of massively multiplayergames and present a hybrid approach in which changes in the local view of a playerare processed at the edge, while global game updates are performed in the cloud.In addition, colocating multiple players that share a similar view on the same edge
1just noticeable difference2High Efficiency Video Coding
34 Chapter 4. Classification and Analysis of Applications
node increases the efficiency of the proposed system. Zao et al. [Zao+14] havedeveloped an AR game with a brain-computer-interface that processes EEG3 brainactivity in real-time. Classifying those readings into game actions is a computation-ally intensive task. The authors use a combination of Edge Computing and CloudComputing for this. While the classification is done at the edge, the underlyingmodels in the cloud are continuously adapted according to the sensor readings.
In summary, AR and VR applications are two of the most relevant use cases forEdge Computing, as they combine four important characteristics that benefit fromedge deployments: strict constraints on the latency, high-bandwidth data, compu-tationally intensive tasks, and battery-powered end devices.
4.2.1.c Data storage, content delivery, and caching
Virtually all connected applications need to store or retrieve data from outside theclient device. At the beginning of this section, this was defined as one of the compo-nents that applications use. We now describe in detail the possible types of storageand caching services that can be offered at the edge.
Content Delivery Networks (CDN) [Dil+02] distribute content caches acrossdata centers in different geographic regions to provide highly available and per-formant content retrieval for users. Ericsson forecasted back in 2013 that in 2019,50 % of mobile traffic would be video traffic [Eri13]. Hence, content delivery net-works today to a large extent serve video traffic [MJ16]. This demand for video notonly means users have high expectations for the service quality, but also that large-volume data is a huge burden for infrastructure providers and hence, an importantincentive to place caches within the access network [Bec+14]. Ahlehagh and Dey[AD14]* have proposed both reactive and proactive caching strategies for videocontent at the radio access network. Bastug et al. [BBD14] have investigated therole of proactive caching in 5G networks. Another example is the retrieval of web-sites [Zhu+13]*. Zeydan et al. have [Zey+16] proposed proactive content cachingbased on content popularity in 5G networks. Approaches like [App+10] assumea global knowledge of the content popularity for each location. Because edge en-vironments typically feature user mobility, these approaches have limitations withregards to their scalability. A solution to this might be collaborative approaches aspresented in [LYS16]*, where base stations collaborate in replicating content to im-prove the overall cache hit ratio. Tran et al. [Tra+17]* have presented a strategyfor collaborative caching and processing of on-demand video streams.
Up until today, little research has linked content storage and caching to thedomain of Edge Computing. Drolia et al. [Dro+17] have presented Cachier, acaching system for image recognition applications. It balances the load between theedge and the cloud and exploits the spatio-temporal properties of requests. Psaraset al. [Psa+18]* have advocated the placement of local storage on WiFi accesspoints to buffer IoT data prior to cloud synchronization. Lujic et al. [LMB17]* haveproposed a storage management framework for edge analytics. The goal of theframework is to balance the quantity of stored data and the resulting quality of thedata analytics, given limited storage capacities at the edge. Such caches can also beused for the distribution of mobile apps and app updates [Bha+15b]*,[Bha+15a]*.
As end devices generate more data, the path of data dissemination changes to a“Reverse CDN” [Sch+17]*, [MSM17]*, i.e., the decision is where to store data gener-
3Electroencephalography

4.2. Application Survey 35
ated by those end devices in the network. This decision depends on where the datais to be used and shared. Therefore, contextual information, such as the user’s lo-cation is useful to make this decision. For example, we can imagine sharing contentfrom large-scale events or tourist sites. In Chapter 9, we will present a frameworkthat uses contextual information of the user to make storage decisions. Simoens etal. [Sim+13] have presented GigaSight, a framework for the decentralized collec-tion of videos through cloudlets. Before the videos are indexed and made available,cloudlets remove privacy-sensitive information from the video. The authors haveconducted experiments, measuring the throughput and energy consumption and,based on the results, modeled a tradeoff for the allocation of resources between thecloudlets performing the different computation steps.
Compared to low-latency processing tasks, the benefits of Edge Computing forstorage and caching are less striking and require careful decision-making. Further-more, using edge nodes for storage can raise the question of resilience in view oftheir inferior reliability [MRS19] compared to large data centers. However, in caseswhere data has to be transferred away from end devices, e.g., because it is to beshared, and if that data is only relevant in a certain (geographic) area, Edge Com-puting can save bandwidth if the data is kept in proximity. As an example, Hao etal. have presented EdgeCourier [Hao+17]*, a framework for live document syn-chronization. The authors have demonstrated the reduction in network bandwidthusage by performing incremental synchronization at edge nodes. Another exampleis the work of Hu et al. on face recognition [Hu+17]. They have observed thatonly a subset of biometric features is relevant to identify a face. The paper suggestsextracting those features at the cloud and retaining only those at the edge necessaryto perform the recognition.
As soon as personal user data is involved, privacy and data security become rel-evant. The Databox project [Cha+15]*, [Mor+16]* aims at providing a personaldata management framework. It enables individuals to manage their personal dataand make that data available to others, while retaining control over its usage. Mostimportantly and in contrast to today’s approaches, data is not handed over to thirdparties. Instead, access and processing is mediated through the Databox. The au-thors envision a distributed system of personal Databoxes, hosted on a variety ofdevices, e.g., wireless gateways, lamp posts, and cars. The Databox consists ofseveral components that are logically separated and can run on different physicaldevices. Access to different sources of data is also logically separated to provideadditional security. The project is a good example of how edge infrastructure canhelp to preserve data security and privacy. However, as noted in [Per+17b]*, sev-eral challenges remain, such as capturing one’s privacy preferences, implementingshared ownership of data, or how to approach risk-benefit negotiations for sharingdata.
4.2.2 Infrastructure Augmentation
In the following, we refer to infrastructure as basic services and facilities that webuild our lives upon. This basic infrastructure encompasses everything from ourelectrical grid (see Section 4.2.2.a) up to emergency services (see Section 4.2.2.d).This infrastructure is especially important and challenging in urban areas as thetrend of growing urbanization brings new challenges, such as traffic, pollution, andsafety [LR17]. The term smart cities [Sch+11] has been used to describe conceptsthat use information technology to augment infrastructure in urban areas. Schlei-

36 Chapter 4. Classification and Analysis of Applications
cher et al. [Sch+16b] define a smart city as a reactive system that makes decisionsbased on massive amounts of data. Smart cities connect people and objects in or-der to create services that enhance the quality of life for citizens of urban envi-ronments [Zhe+14a]. Furthermore, monitoring and large-scale data analysis canprovide valuable information for municipalities and policymakers, e.g., to plan traf-fic and transportation (see Section 4.2.2.b). The raw data is collected from sensorsthat are deployed in the environment. Besides static deployments, humans can alsobe incentivized to serve as data providers [Sch+12], e.g., by providing sensor datathrough their phones [CFB14]. One application domain where this approach hasproven useful is in monitoring the environment (see Section 4.2.2.c).
Previous works in the domain of smart cities have proposed to integrate thecaptured information through Cloud Computing [Heo+14; PLM17]. However, theyhave not considered the potential benefits of using nearby cloudlets, especially foranalytics on high-volume data. A prominent example are video streams from cam-eras that are ubiquitously present in today’s cities. While tolerable delays for smartcity applications vary greatly [Zan+14], the mere number of sensors will preventcloud-based solutions from scaling. Perera et al. [Per+17a] have further surveyeddifferent types of smart city applications that benefit from edge deployments, witha focus on the communication between devices.
4.2.2.a Smart grids
Energy grids are currently in a state of transformation towards so-called smart grids,driven by ecological, economical and political goals. Two important characteristicsof a smart grid are (i) information and communication technology is embeddedinto the energy grid, (ii) its decentralized nature (in contrast to today’s strictly hi-erarchical organization), and (iii) a shift towards prosumers that both consume andproduce energy. A smart grid is envisioned to support a distributively organizedcontrol structure instead of being one large energy grid with central control acrossall tiers. In particular, this structure is envisioned to consist of multiple cells, whichcan be controlled individually [How+17].
As a way to realize the next evolutionary step of cellular energy grids, a holonicapproach has been suggested [NB12]. Holons represent entities in a system thatare simultaneously a part and a whole. Consequently, a hierarchically organizedsystem structure (called Holarchy) emerges, where on different levels, holons existthat encompass other holons, while being part of higher-level holons themselves.
Implementing a Holarchy is challenging, given that it requires components formonitoring and automated control [Fre+13]*. To establish such a concept, EdgeComputing is a suitable paradigm as it supports data aggregation and filtering,which are both essential to realize the concept of holons. For instance, local con-sumers can optimize the control of the appliances in their smart homes to reducetheir electricity bills [AMM15]. Simultaneously, this goal may conflict with the pro-cess of balancing demand and supply in the overall grid. These problems can nowbe addressed either locally, using the local controllers responsible for managing in-dividual holons, or the higher level holons can address the issue as they have alarger view on the network.
The decision-making in smart grids must solve complex optimization problems,like optimally controlling distributed energy sources. One way to tackle the com-plexity of these problems is to reduce the problem size and, consequently, speed upthe optimization process. Edge Computing devices can be used as local controllers

4.2. Application Survey 37
for holons, which are capable of executing optimization algorithms. Examples ofsuitable algorithms are presented in [PSM10]*. Moreover, such optimization tasksneed to be performed quickly, as demand and supply deviations in the grid cancontribute to the destabilization of the whole energy grid. Edge Computing de-vices facilitate low-latency communication and hence, using Edge Computing, theseproblems can quickly be addressed locally, without the need to send the necessaryinformation to a cloud service or a central control center.
Although not obvious at first glance, smart grids contain sensitive data with re-gard to one’s privacy. For example, the authors of [Rei+12] have shown that thereadings from smart meters can reveal the individual home appliances by analyzingthe aggregated smart meter readings. Edge Computing devices in combination withsmart energy storage technology can address this problem by scheduling the charg-ing of the storage and the consumption of the appliances in a way such that thedevices only use the electricity that is currently stored in the home. Consequently,the power consumption profile of the house itself appears to the outside only as thecharging behavior of the local energy storage device.
4.2.2.b Smart transportation & connected cars
In big cities, optimizing traffic conditions is a crucial task as it results in a tremen-dous impact on one’s quality of life. Like in other types of smart city applications,many primary sensors for traffic-related applications are cameras, whose videostreams require further processing. For example, we can think of a smart trafficlight that adapts its signal cycles to the actual traffic conditions in certain lanes ofthe intersection [Gha+16]*. While energy is not an issue in these scenarios (sincesensors are fixed deployments and connected to a permanent power source), thisuse case requires complex tasks like object recognition (to identify cars) and track-ing that might not be feasible given weak built-in hardware. Analysis of live feedscan also be used to detect traffic anomalies [Ana+17] or to recognize license plates[Yi+17]. The traffic light example can also be linked to emergency response usecases, e.g., to help making way for an ambulance by setting traffic lights to free upthe route and warn others about the approaching vehicle [Nun+15]*. In the latteruse case, time criticality clearly becomes more important. This is also the case forthe detection of immediate road hazards, e.g., as shown in [CDO19]*.
Long-term analysis of urban data can be used to detect and improve flawedurban planning or to identify areas where dangerous situations regularly occur[Zhe+11]*,[Sat+17]*. In these use cases, the long-term analysis would most likelybe carried out in the cloud due to the larger amount of available resources. How-ever, we argue that data collection on such a big scale would not be possible withoutEdge Computing, due to necessary pre-processing steps (e.g., encoding a video toa lower bitrate or aggregating measurements). Qi et al. [QKB17]* have intro-duced an Edge Computing platform using on-board computers on public transportvehicles. The platform collects data (e.g., by intercepting WiFi probe packets fromphones) to gain insights that help public transport operators to devise better plans(e.g., by identifying popular stations and assessing vehicle occupancy). Such infor-mation can be sensitive as it allows to identify and track individuals. Hence, in thiscase, the edge infrastructure could also be in charge of performing the anonymiza-tion of sensitive data. Besides static planning, this high-volume data could also beused for real-time updates, e.g., to provide passengers with predicted arrival times.This data could be distributed to edge nodes at the relevant location (e.g., to the
38 Chapter 4. Classification and Analysis of Applications
corresponding WiFi hotspots at a stop). The location-awareness of edge nodes canalso be used for applications like toll collection [Aba+15] or finding parking spaces[Vil+15b; Awa+19].
Besides improvements in the planning of city traffic, we see a trend towardsvehicles themselves being equipped with more sensing and computing capabilities.In many cases, these components are not isolated but transform the vehicle into aconnected car that can interact with its environment and other vehicles. Such carscan form vehicular ad hoc networks (VANET) [HL08] that communicate with eachother or through some close-by infrastructure—often termed roadside unit (RSU).Besides RSU, UAVs have also been proposed as a means to relay communicationsbetween cars and/or infrastructure [Men+17]. Datta et al. [DBH15]* have pre-sented an infrastructure with a Fog Computing layer, located at RSUs and M2M-gateways. The type of data and its importance varies in such networks [Sch+08],from simple information services (e.g., information about current traffic conditions)to critical, safety-related events (e.g., warnings about emergency situations or sud-den breaking of cars ahead). An example of the latter is the work of Cozzolinoet al. [CDO19]* that uses an edge infrastructure for black ice road fingerprinting.Liu et al. [Liu+18] have demonstrated that complex tasks, such as recognizingattacks in ridesharing services can be done with little energy impact on the enddevice. Edge Computing can also be an important enabler for autonomous driv-ing, e.g., by disseminating data from RSUs to vehicles [Yua+18]*, or by processinginformation like point clouds captured by LIDAR sensors [Qiu+18]*. Besides suchlatency-critical and compute-intensive tasks, edge capabilities can also be used forearly data aggregation to save core network bandwidth. In this domain, Lochertet al. [Loc+08] have presented an aggregation scheme for VANET traffic informa-tion. As outlined in [BOE17], strong security mechanisms need to be in place ifedge nodes are involved in the control of vehicles in order to make such systems re-silient against attacks. Raya and Hubaux [RH05] have provided a detailed analysisof threats and security architectures in VANETs.
4.2.2.c Environmental monitoring & waste management
Pollution is one of the main problems in growing urban areas, with drastic im-pacts on people’s health. As of today, many kinds of pollution are only measured atvery few locations and/or estimated via models based on historical data [ZLH13]*,[Zhe+14b]*. Hence, they often fail to provide an accurate and actionable viewon current situations. However, accurate, real-time information is crucial, both forpolicymakers and citizens to make informed decisions (e.g., for patients with respi-ratory diseases or for decisions to restrict traffic). Dutta et al. [Dut+17]* presentAirSense, a crowdsensing-based air quality monitoring system. Especially for suchopportunistic sensing campaigns, where the location of the data is unknown a pri-ori and constantly changing, the deployment of Edge Computing resources is bothbeneficial (because the data is typically high-volume and can be aggregated locally)and challenging (because of the geographic dispersion and the users’ mobility).
While environmental data, in general, has a rather low rate of data generation[SBH16], scalability remains an issue [MAŽ18]*. Edge Computing can ensure thescalability of a large-scale sensing system by processing the data close-by and keep-ing the results within the sensing area. Aggregated or coarse-grained data (e.g.,by reducing the temporal resolution) can be sent to the cloud, while the raw sen-sor readings are processed at the edge. Aazam et al. [AH14] have advocated data

4.2. Application Survey 39
trimming to reduce unnecessary transfers to the cloud by using a smart gatewaythat sensing nodes are connected to. Edge infrastructures have also been used toopportunistically deploy different sensing tasks [Tsa+17]. Zheng et al. [Zha+18b]have presented an allocation scheme for sensing tasks on Edge Computing nodes.The authors outline the benefits of an edge deployment w.r.t scalability, bandwidthrequirements, and better utilization of edge nodes’ computing power.
Similar to air pollution, noise pollution is a big problem with adverse effects onpeople’s health. Maisonneuve et al. [Mai+09]* and Schweizer et al. [Sch+12]* haveproposed deployments in which citizens measure noise through their mobile phonesand upload the measurements to a cloud-based service for access and analytics. Be-sides the potential benefits of edge deployments w.r.t. latency and bandwidth, wealso need to consider the privacy aspect. Whenever data is collected by volunteers,privacy has to be guaranteed, otherwise people might not be willing to participatein sensing campaigns. Measurements must inherently contain the users’ locations,and hence, this would allow tracking user locations. By processing such data atthe edge, data can be anonymized early or, alternatively, noise can be introducedinto the raw data, such that it does not impact the results, but cannot be linkedback to an individual. Here, the distributed nature of an Edge Computing infra-structure itself can be exploited. Marjanovic et al. [MAŽ18] have demonstratedhow partitioning data and distributing its processing can help in reducing privacythreats.
Waste management is a complex process in today’s cities and includes the collec-tion, transportation, processing, and disposal of waste. Optimizing these processescan save a city tremendous amounts of money and resources. One way is to optimizethe transport routes of garbage collection trucks. Normally, these operate at fixedschedules, as no real-time information about filling levels of waste containers isavailable [Nuo+06]. Sensors mounted on trash containers could report their fillinglevels and infer if they need emptying. Based on aggregated data from a neighbor-hood, the garbage trucks’ routes can be optimized. Furthermore, municipalities canprovision different sizes of garbage trucks in order to optimize the collection process[AZM15]*. Cloud-based solutions have been proposed [Per+14b]*, [Aaz+16]*,[Med+15]*, however, aggregating the sensor readings at the edge would save band-width. This becomes more important if data is annotated with photos or voicemessages, as suggested in [Med+15]. Latency and privacy, however, are less of aconcern in this use case.
4.2.2.d Emergency response & public safety
Detecting emergency situations can be done by inferring events from sensor sources.As soon as an emergency is detected, first responders need to be alerted and directedto the scene. To do so, platforms provide situational awareness and connect firstresponders to the required data sources. Chung et al. [Chu+13]* have presenteda cloud-based platform, while Aazam and Huh [AH15]* have extended this idea toincorporate an intermediate fog layer that is capable of pre-processing the data andovercoming delay problems. Depending on the type of incident, the appropriateemergency departments are notified. Mobile base stations can furthermore serve tonotify citizens about a threat. For example, Sapienza et al. [Sap+16] outline a usecase where a fire is detected based on sensor readings and video analysis, and thisinformation is forwarded to car navigation systems in order to alert people.
A distributed infrastructure of edge devices can furthermore be leveraged as an
40 Chapter 4. Classification and Analysis of Applications
emergency infrastructure in case of disasters. In case of a breakdown of the com-munication infrastructure, cloudlets hosted on private devices like routers can actas emergency devices, providing both computation and communication capabilities[Meu+17c]*. Satyanarayanan et al. [Sat+13]* outline a potential use case for suchemergency cloudlets in disaster recovery, in which responders take photographs thatneed to be stitched together in order to obtain a complete overview of the area.
Efforts to increase public safety (e.g., by either preventing or quickly detectingcrimes) mostly rely on surveillance. In many cases, the raw data consists of videostreams, which are then analyzed. Canzian et al. [CS15] have presented a hierar-chical classifier system for surveillance applications. As the authors point out, thecharacteristics of the tasks—distributed sources and tasks as well as a high compu-tational complexity—make it necessary to leverage distributed and heterogeneousprocessing nodes. This definition perfectly reflects the Edge Computing landscape.Chen et al. [Che+17a]* have presented a system for real-time surveillance andtracking of vehicles to detect speeding using a drone. Similarly, Xu et al. [XGR18]use a geo-distributed Fog Computing infrastructure for vehicle tracking. Mihale-Wilson et al. [MFH19] have investigated the protective effect of street lamps if theyare augmented with functionalities such as video surveillance and gunshot detec-tion via microphones. Their results suggest an increase in safety in areas wheresuch lamps were installed. Just-in-time indexing of video streams across severalcloudlets has been demonstrated in [Sat+17]*. A practical use case for just-in-timevideo indexing could be the search for a missing person.
Because all these use cases involve multiple streams of high-volume data andheavy computations, edge deployments are beneficial in terms of latency and band-width. Besides offloading computations, data pre-processing is also relevant tosome security-related applications. For example, Stojmenovic [Sto12]* has pro-posed to partition tasks for biometric identification between the mobile device andthe cloud.
In all those use cases—especially when video streams are involved—the citi-zen’s privacy is exposed, and personal information is analyzed. Contrary to otheruse cases, the privacy-critical information is not incidentally contained in the rawdata, but it is the reason for capturing it in the first place. Hence, the positive im-pact of Edge Computing in this application domain is limited. At the very best, wecould envision enforcing policies to delete personal information once it has beenprocessed by a trusted edge node.
4.2.3 IoT Device Augmentation
The IoT refers to connected objects that are able to interact with each other andhence, extend the Internet to the physical world [AIM10]. Originally closely tiedto RFID4 technology [Wan06], today the IoT encompasses all kinds of sensors, ma-chines, and appliances. An extensive survey about the IoT and its enabling tech-nologies can be found in [AlF+15]. The data volume and latency requirements offuture IoT devices will likely be challenging to transfer and process at central clouds[PM17; San+14]. In this section, we focus on IoT deployments in three settings:homes and buildings (Section 4.2.3.a), industrial applications (Section 4.2.3.b),and agriculture and farming (Section 4.2.3.c).
4Radio Frequency Identification
4.2. Application Survey 41
4.2.3.a Smart home & smart building
The terms smart home and smart building describe the concept of collecting datawithin a building and using it to automate and optimize various aspects of thebuilding. The IoT offers great potential to lower energy/water consumption and in-crease security and comfort through coordinated management of HVAC5 systems,lighting, electrical outlets, and various connected devices [Cas14]. Examples forsuch devices are smart locks, surveillance cameras, TVs, household appliances, orenvironmental sensors. These devices and building systems produce large amountsof sensitive personal data streams [Shi+16]. One example of a smart home task isthe aggregation and pre-processing of home video surveillance streams [San+14]*.Such a case was examined by Abdallah et al. [AXS17]* in a prototype system. Theirresults indicate that storing all sensor data in the cloud has a negative impact onthe available bandwidth in the home, pointing to Edge Computing as a solution.
Edge Computing could also be used for the aggregation of IoT data, and thus,enable cooperation between devices by using sensors and physical capabilities ofmultiple devices to complete a task [Yi+15; Pan+16]. Such a task could be send-ing a robot vacuum cleaner with a camera to check on suspicious motion throughvideo analysis. Vallati et al. [Val+16] have envisioned an MEC architecture for smarthomes that builds on LTE with device-to-device communication for data locality andlow latency. Storing and processing smart home data in-home could also resolvethe issue of transferring privacy-critical data [Per+17b; Mor+16] and opens up thepossibility to combine data from IoT devices with personal data from other servicesto provide higher-order, yet privacy-aware services. As proposed in [Fer+18]*, EdgeComputing and Fog Computing could also provide the missing link between variousbuilding subsystems that are usually implemented independently. Thus, the result-ing integration and interoperability between the individual subsystems, combinedwith data analysis at the edge, could enable new smart services, like the activationof smart devices when solar power is available.
4.2.3.b Industrial Internet of Things
One goal of the Industrial Internet of Things (IIoT)6 is to improve quality control inmanufacturing and increase productivity [Wan+18a]*, [LGS17]*. Collecting andanalyzing vast amounts of data from production processes can be a tool to findinefficiencies and optimize production processes [LGS17]*,[AZH18]*. However,since it is often impractical to store and analyze all collected data at the cloud inreal-time, Fu et al. [Fu+18]* suggest to pre-process, aggregate, and store time-sensitive data on edge nodes, while storing less time-sensitive data in the cloud forlater analysis. Early detection of mechanical problems with production machineshas the potential to prevent both machine failures and production quality issues[Oye17]*.
Monitoring machines produces large amounts of real-time data that lends itselfto being analyzed at the edge to monitor machine health or to predict tool wearand service intervals in real-time [Oye17]*, [Wu+17a]*. Another goal of the IIoTis to enable the production of highly customizable products on dynamically sched-uled production lines, which can also profit from the low-latency property of EdgeComputing [Wan+18a]*. Lin et al. [LY18]* have presented a further application
5Heating, Ventilation, and Air Conditioning6We use IIoT synonymously with industry 4.0 / advanced manufacturing

42 Chapter 4. Classification and Analysis of Applications
of Edge Computing for IIoT, namely the real-time scheduling of logistics in highlyautomated warehouses.
4.2.3.c Agriculture & farming
Smart farming (or precision farming) targets the management of crop and livestock.Many applications in this domain revolve around automation, e.g., for wateringcrops or feeding livestock. Monitoring of environmental parameters and tracking ofanimals can furthermore ensure a timely reaction if abnormal events are detected.A delayed reaction can cause damages and production losses [ADH18]* and canimpact the entire supply chain. More complex tasks include the use of machinelearning methods for yield prediction or disease detection [Lia+18]*.
Pastor et al. [Pas+18] have presented a system for distributed computing inagriculture that includes three layers: things (i.e., the individual sensors and sub-systems), edge (responsible for the control of subsystems), and fog (providing localstorage and analytics). Tasks carried out at the local edge and fog layer includedata filtering, classification, and detection of events. The primary reason for carry-ing out those tasks at nearby layers is latency, as the system tries to optimize itselfin real-time. Another example of a layered system can be found in [Car+17]*,where Raspberry Pi computers are deployed as sensors in the environment and onanimals to monitor temperature and movement. This data is processed at an edgelayer on the farm itself, whereas cloud infrastructure is used to collect long-termstatistics. Besides a strong focus on the communication technologies at the edgelayer, the work of Ahmed et al. [ADH18] proposes a hierarchical structure of fognodes and suggests to carry out computations at local gateways. As one of only afew approaches, it also considers the energy aspect of this local processing. How-ever, their main arguments for edge processing are reduced latency and bandwidthlimitations.
Wolfert et al. [Wol+17] see big data analytics as a major disruption for farmingand have identified real-time analytics of agricultural data as a key challenge. Theyemphasize the issue of data quality, i.e., errors in the raw data make operationssuch as denoising and transformation necessary before further processing. Fromthe perspective of saving upstream bandwidth, edge deployments are beneficial insuch use cases. Similarly, Ivanov et al. [IBD15] have observed that many of thesensor data gathered in smart farming contain redundancies that need to be fusedbefore being pushed to a centralized entity.
While a number of edge-enabled systems exist, we observe that most are closed,hybrid deployment, i.e., the intermediate edge layer is deployed on-premise and notpart of a public Edge Computing infrastructure.
4.2.4 Human Augmentation
Human augmentation is the process of improving the well-being and capabilities ofhumans. This augmentation can be done by oneself, e.g., through quantifying, ana-lyzing, and subsequently influencing one’s behavior (Section 4.2.4.a), or in the con-text of healthcare-related applications (Section 4.2.4.b). Moreover, Section 4.2.4.cshows how human cognition can be augmented or assisted.
Privacy and data security are critical concerns in these types of applications dueto the intimate nature of the data. As shown by Fereidooni et al. [Fer+17], today’scloud-based services fail to provide data integrity, authenticity, and confidentiality.

4.2. Application Survey 43
However, those factors are critical for the acceptance of such services. Besides thetrustworthiness of the nodes that store or process the data, fine-grained access con-trol policies for the remote access and forwarding (e.g., a physician can forward apatient’s data to a pharmacy) should also be implemented. To realize this, we canimage a network of federated, trusted edge nodes across different organizations.
4.2.4.a Quantified self
With new affordable personal devices, people have gained an interest in collectingand analyzing data about their own bodies and behaviors. This concept is com-monly referred to as the quantified self [NS14]. Besides getting a deeper under-standing of oneself, this data can also be useful in many health-related aspects, e.g.,for personalized medicine or preventive medicine [Swa12]. Users are often inter-ested in aggregate values, such as the total walking distance for a single day. Suchaggregation can be performed at the edge. If the users wish to rely on cloud ser-vices, only those aggregated values are sent to the cloud. Aggregating and storingdata is an important use case for personal fitness trackers that count steps, monitorone’s heart rate, or analyze sleep patterns. This type of wearable fitness technologyis a big part of the quantified self community today [Gil16].
Schmidt et al. [Sch+15]* present a digital fitness coach to support individu-als in achieving fitness goals. The system generates training plans and is able toadapt them, e.g., depending on a user’s movements. Among other data, data fromtracking devices is used. Bajpai et al. [Baj+15]* use heart-rate readings from wear-able sensors to track physical activity, map the activity to calorie consumption, andestimate the cardio-respiratory fitness of a person.
4.2.4.b Precision medicine
The umbrella term E-Health describes applications that make use of informationsystems in order to improve people’s treatments and overall health. The concept ofconnected health [Shi+16] describes how different actors (e.g., patients, hospitals,and physicians) are linked in order to improve their services. In this section, wesummarize the above concepts as precision medicine. It has been noted that health-care is one of the prominent applications for future information technologies [BZ11]and that cloud-based healthcare can help to reduce the overall costs of healthcare[Ala+10]. For a detailed survey of healthcare-related applications, we refer thereader to Kraemer et al. [Kra+17]. Bui et al. [BZ11] have identified three require-ments for healthcare applications: (i) interoperability, (ii) reliability and boundedlatency, and (iii) privacy, authentication, and integrity. Edge Computing can helpwith the latter two. As an example, latency is especially critical if the application istied to a cognitive process or a time-critical control loop (see Section 4.2.4.c).
By monitoring the parameters of a patient and combining information fromhealth sensors with other ambient sensors, health-related issues can be detected.One example is fall detection for stroke patients [Cao+15]*. To perform these tasks,large amounts of raw data have to be analyzed or complex features need to be ex-tracted [Gia+15]. Often the monitoring is part of a sense-process-actuate loop, i.e.,whenever an event or anomaly is detected in the monitoring phase, a (timely) ac-tion has to be taken. For telesurgery, latencies below 200 ms are optimal [Xu+14]*.Such constraints can be challenging when relying on distant clouds. For other ap-plications such as ECG monitoring, delays in the order of several seconds might be

44 Chapter 4. Classification and Analysis of Applications
acceptable [AG10]*. For less critical parameters, storing aggregate values for laterretrieval is sufficient. Amraoui and Sethom [AS16]* have presented an architecturefor patient monitoring in Wireless Body Area Networks (WBAN) that makes use ofcloudlets for close-by processing of sensor data. Hybrid edge-cloud systems alsoexist, e.g., Althebyan et al. [Alt+16] have presented a scalable health monitoringsystem that uses both Cloud Computing and Edge Computing. Similarly, Azimi etal. [Azi+17] have developed a 3-tier system, in which tasks are partitioned amongthe tiers. For example, the training procedure for machine learning algorithms iscarried out in the cloud, whereas the resulting classifiers are deployed closer to thesensors.
4.2.4.c Cognitive assistance
The idea of cognitive assistance comes from the vision of augmenting human cogni-tion through computing systems [Sat04]. These types of applications are, for exam-ple, useful to assist the elderly who suffer from deteriorating senses or for patientswith neurological diseases, such as Alzheimer’s. Applications that aim to assist orsubstitute the cognitive tasks of humans should preferably not be slower than hu-mans. This is challenging, given that for instance, humans recognize familiar facesin the order of a few hundred milliseconds [RCR11]*. Even more challenging, rec-ognizing human voices takes 4 ms [Agu+10]*. These tasks are also computationallyintensive and hence require to offload the processing. Ha et al. [Ha+14]* have pre-sented a system for wearable cognitive assistance. The system uses Google Glassto capture live video and performs real-time scene interpretation using differentcomponents, such as activity inference, face recognition, and motion classifiers.
4.3 Summary
Table 4.1 summarizes prominent use cases from the previous Section 4.2 and showshow the promised benefits of Edge Computing (see Section 3.1) are applicable tothem. For this, we use the following semantics:
+ + Edge Computing is absolutely necessary to ensure the requirements,and these cannot be fulfilled by relying on the cloud. Furthermore,local processing cannot ensure the expected quality of experience.
+ Edge Computing is beneficial and improves the quality of the serviceand/or its experience for the users.
◦ The benefit of Edge Computing heavily depends on the concrete sce-nario and context in which the application operates.
– Edge Computing brings no real-world benefit or the attribute is notrelevant for the application. For example, even though Edge Com-puting might improve the latency in absolute numbers, this might notbe critical in applications where the computation or actuation takesfar longer than the communication.
The last four columns of the table indicate which of the components as definedin Section 4.1.1 are used by that use case.

4.3. Summary 45
TABLE 4.1: SYSTEMATIC OVERVIEW OF SURVEYED USE CASES†
Late
ncy
Ban
dwid
th
Ener
gy
Priv
acy
Con
soli
dati
on
Filt
erin
g
Stor
age
Offl
oadi
ng
Mobile Device AugmentationGaming
Scene rendering [MKB18b; LS17] + + + + – � � � �
Collaboration of neighboringplayers [Cai+18; PS18]
+ + + + – � � � �
AR/VR
Rendering [Shi+19] + + + + + – � � � �
Hybrid rendering [Lai+17] + + + + – � � � �
Reconstruction of 3D maps+ + + + – � � � �
[Boh+15]
Content delivery
Video streams [AD14] – + – – � � � �
Website delivery [Zhu+13] – ◦ – – � � � �
Applications and updates– + – – � � � �
[Bha+15b; Bha+15a]Collaborative caching[LYS16; Tra+17]
+ – ◦ ◦ � � � �
Storage
Storage for edge analytics+ + ◦ ◦ � � � �
[LMB17]Reverse CDN [Sch+17; Ged+18b][Psa+18; MSM17]
◦ + ◦ + � � � �
Document synchronization– + – ◦ � � � �
[Hao+17]Personal data storage[Cha+15; Mor+16; Per+17b]
◦ ◦ ◦ + � � � �
Infrastructure AugmentationSmart Grids
Monitoring and control [Fre+13] ◦ + ◦ + � � � �
Scheduling distributed energyresources [PSM10]
+ ◦ – ◦ � � � �
Traffic & Transportation
Adaptive traffic light [Gha+16] – ◦ – + � � � �
Detection of road hazards [CDO19] ◦ ◦ – – � � � �
Traffic planning– ◦ – ◦ � � � �
[Zhe+11; Sat+17; QKB17]Emergency vehicle routeclearance [Nun+15]
– + – – � � � �
Autonomous Driving
Disseminating data to+ + + – ◦ � � � �
vehicle [DBH15; Yua+18]Processing LIDAR data [Qiu+18] + + + – – � � � �
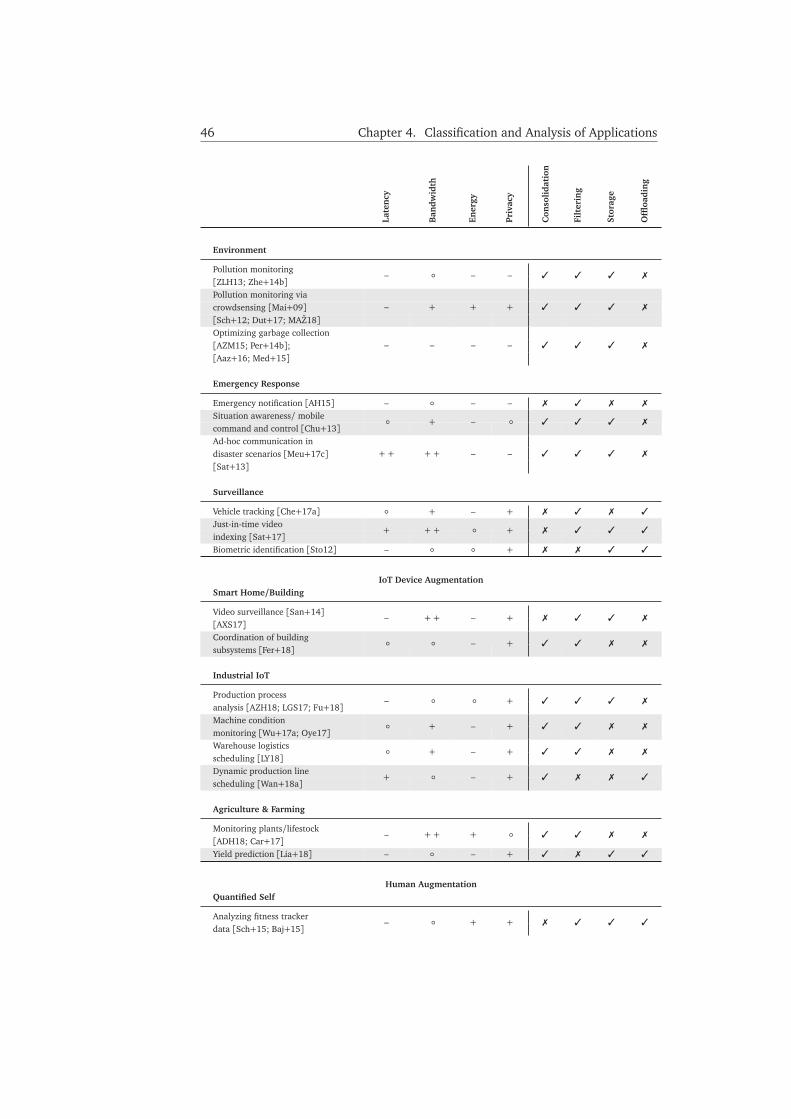
46 Chapter 4. Classification and Analysis of Applications
Late
ncy
Ban
dwid
th
Ener
gy
Priv
acy
Con
soli
dati
on
Filt
erin
g
Stor
age
Offl
oadi
ng
Environment
Pollution monitoring– ◦ – – � � � �
[ZLH13; Zhe+14b]Pollution monitoring viacrowdsensing [Mai+09][Sch+12; Dut+17; MAŽ18]
– + + + � � � �
Optimizing garbage collection– – – – � � � �[AZM15; Per+14b];
[Aaz+16; Med+15]
Emergency Response
Emergency notification [AH15] – ◦ – – � � � �
Situation awareness/ mobilecommand and control [Chu+13]
◦ + – ◦ � � � �
Ad-hoc communication in+ + + + – – � � � �disaster scenarios [Meu+17c]
[Sat+13]
Surveillance
Vehicle tracking [Che+17a] ◦ + – + � � � �
Just-in-time videoindexing [Sat+17]
+ + + ◦ + � � � �
Biometric identification [Sto12] – ◦ ◦ + � � � �
IoT Device AugmentationSmart Home/Building
Video surveillance [San+14]– + + – + � � � �
[AXS17]Coordination of buildingsubsystems [Fer+18]
◦ ◦ – + � � � �
Industrial IoT
Production process– ◦ ◦ + � � � �
analysis [AZH18; LGS17; Fu+18]Machine conditionmonitoring [Wu+17a; Oye17]
◦ + – + � � � �
Warehouse logistics ◦ + – + � � � �scheduling [LY18]Dynamic production linescheduling [Wan+18a]
+ ◦ – + � � � �
Agriculture & Farming
Monitoring plants/lifestock– + + + ◦ � � � �
[ADH18; Car+17]Yield prediction [Lia+18] – ◦ – + � � � �
Human AugmentationQuantified Self
Analyzing fitness tracker– ◦ + + � � � �
data [Sch+15; Baj+15]

4.3. Summary 47
Late
ncy
Ban
dwid
th
Ener
gy
Priv
acy
Con
soli
dati
on
Filt
erin
g
Stor
age
Offl
oadi
ng
Precision Medicine
Fall detection [Cao+15] – + + + � � � �
Patient monitoring with WBAN[AS16]
◦ + ◦ + � � � �
Remote surgery [Xu+14] + + – ◦ � � � �
Analyzing ECG features [AG10] – ◦ – + � � � �
Cognitive Assistance
Face recognition [RCR11] + + ◦ + � � � �
Speech recognition [Agu+10] + + ◦ ◦ + � � � �
Wearable cognitive+ + + + + � � � �
assistance [Ha+14]
From this analysis, we conclude this chapter by summarizing the main observa-tions:
OBSERVATION I: DIVERSE OBJECTIVES | The motivations to use Edge Computingare very diverse. Consequently, most use cases only profit from a subset ofthe potential benefits. The heterogeneity of objectives and use cases meansthat there is no “one size fits all” solution when it comes to the question if anapplication should be moved to the edge.
OBSERVATION II: NOT INDISPENSABLE FOR MOST APPLICATIONS | While most of thepresented applications can benefit from one or more aspects of Edge Comput-ing, resulting in higher quality of service or user satisfaction, few applicationscannot fundamentally function without Edge Computing.
Thus, economical considerations are important to determine if Edge Comput-ing is sensible for a given use case. The fact that there are no established busi-ness models and ubiquitous infrastructures for Edge Computing yet preventsmost of these applications from being moved to the edge today. However,once Edge Computing infrastructures are widely available, a large number ofapplications are likely to use it.
OBSERVATION III: “KILLER APPS” DO EXIST | We identified some applications forwhich Edge Computing is indispensable, either regarding latency (e.g., ren-dering for AR/VR) or bandwidth (e.g., the processing of several video streamsor LIDAR data). Furthermore, Edge Computing can provide an emergencycommunication and computing infrastructure, thus creating a more resilientoverall public infrastructure.
OBSERVATION IV: CROSS-LAYER APPLICATION DESIGN |Many works propose layeredsystem architectures, where applications are split between the layers. Whilethe number and naming of the layers differ (the common ones being: local,edge, cloud, and sometimes intermediate fog layers), the common motivationis to exploit the favorable characteristics of each layer. How to efficientlypartition applications across layers is still an ongoing field of research.

48 Chapter 4. Classification and Analysis of Applications
OBSERVATION V: OFFLOADING OBJECTIVES | There are two common motivationsfor offloading. First, offloading can accelerate latency-critical computationson devices with low computing power. Latency reductions are especially use-ful for demanding real-time computations, especially for mobile gaming, AR,VR, and autonomous driving. The second motivation for offloading is to saveenergy on battery-constrained devices. Furthermore, energy benefits are usu-ally only viewed from the perspective of the end devices, and the effect onthe overall energy footprint remains unclear, e.g., when taking into accountthe energy efficiency of the edge surrogates or network middleboxes.
OBSERVATION VI: BANDWIDTH IS CRITICAL FOR INFRASTRUCTURE AUGMENTATION
AND IOT DEVICES | Applications in the domain of infrastructure augmenta-tion and IoT devices tend to have little demand for computation offloading.However, nearly all of our surveyed applications in these two categories im-plement the consolidation and filtering components. Compared to the cloud,Edge Computing can achieve large bandwidth savings for applications thatprocess big ephemeral data. Thus, while latency tends to be only a minorissue in those use cases, they can profit from the bandwidth-saving aspect ofEdge Computing.
OBSERVATION VII: PRIVACY HAS GREAT POTENTIAL | There is a clear division be-tween applications where the privacy-protecting aspect of Edge Computingis relevant and those where it is not. The privacy aspect can be of tremen-dous relevance for sensor data that contains trade secrets or sensitive personaldata. There is great untapped potential for research in this direction to fullyexploit the privacy benefits of Edge Computing.
4.4 Conclusion and Requirements
In chapters 2–4, we have provided a detailed description and analysis of the fieldof Edge Computing, starting from a taxonomy (Chapter 2), analyzing its character-istics (Chapter 3), and providing a detailed survey of Edge Computing applications(Chapter 4). From these findings, this chapter derives requirements for Urban EdgeComputing and outlines how those are addressed in the remainder of this thesis.
REQUIREMENT I (RQ-1): DENSE NETWORK OF MICRO DATA CENTERS | Existing datacenter infrastructures will not be able to fulfill the requirement of providingproximate computing resources. This is especially true if we consider mobileusers in an urban area. Those users have demanding requirements in terms ofresources and mobility (as they change their position frequently). To providegood quality of service to those users, we need new types of dense cloudletinfrastructures in our surroundings.
REQUIREMENT II (RQ-2): DYNAMIC COMPOSITION OF APPLICATIONS | In most cases,it is beneficial to offload only certain parts of an application, e.g., those thatare the most compute-intensive or have the most impact on the device’s bat-tery life. Hence, to enable fine-grained offloading of application functionality,edge-enabled applications should be composed of modular parts. Followingthe paradigm of microservices, these parts can be dynamically composed andoffloaded at runtime.

4.4. Conclusion and Requirements 49
REQUIREMENT III (RQ-3): LOW-OVERHEAD OFFLOADING | Offloading applicationsor part thereof incurs an overhead, e.g., by having to transfer the offloadableparts from a (mobile) device to the surrogate. Ideally, this overhead should below, both to save energy and bandwidth. This can, for instance, be achievedby pre-provisioning or caching offloaded services.
REQUIREMENT IV (RQ-4): SHARING OF SERVICES AT RUNTIME | While Cloud Com-puting infrastructures are able to offer highly scalable and elastic resources,this is more challenging in an edge environment because the resources at in-dividual cloudlet locations are limited. Based on the observation that we op-erate in a highly dynamic environment (with regards to changes in demands,user locations, and network conditions) and resources at a single edge loca-tion are limited, running service instances should be shared among differentclient applications. To realize this, services should be implemented as stan-dardized and reusable components. Sharing services avoids over- and un-derprovisioning of resources, and hence, allows for a more efficient usage ofresources.
REQUIREMENT V (RQ-5): SOPHISTICATED PLACEMENT DECISION FOR COMPUTING
FUNCTIONALITIES AND DATA | The dynamic composition of (shared) appli-cations means that for each component, we need to make an informeddecision—e.g., based on available resources, data location, and networkconnections—on where to place it on available (edge) resources. In additionto functional components, data captured by (mobile) users should be placedin a way that takes into account the user’s context and facilitates sharing.
REQUIREMENT VI (RQ-6): DYNAMIC SERVICE ADAPTATIONS AT RUNTIME | A singlefunctionality can be implemented in a number of ways, with varying impacton the quality of the computation and the resulting runtime of the service.In a dynamic edge environment, where pipelined services are shared amongdifferent applications, services should be adaptable to tradeoff those charac-teristics to optimally meet users’ demands. Besides the integration of mecha-nisms that control the execution of service variants, this also requires supportfor application developers for the definition and assessment of service vari-ants.
4.4.1 Remaining Thesis Outline
The contributions of parts II–IV are structured following a bottom-up approach andaddress the requirements defined above, as shown in Figure 4.3. We begin with theinfrastructure (Part II), followed by the execution framework for Edge Computing(Part III) and, lastly, the strategies and runtime adaptations that can be appliedduring the system’s execution (Part IV).
Chapters 5 and 6 address RQ-1 by investigating the deployment of cloudlets ona city-scale infrastructure. The Edge Computing framework presented in Chapter 7is based on the paradigm of independent and composable microservices (RQ-2).Provisioning of services is done through a microservice store, avoiding costly (prior)transfers of executables from the client devices to surrogates (RQ-3). The proposedEdge Computing framework also allows the sharing of running service instances(RQ-4).
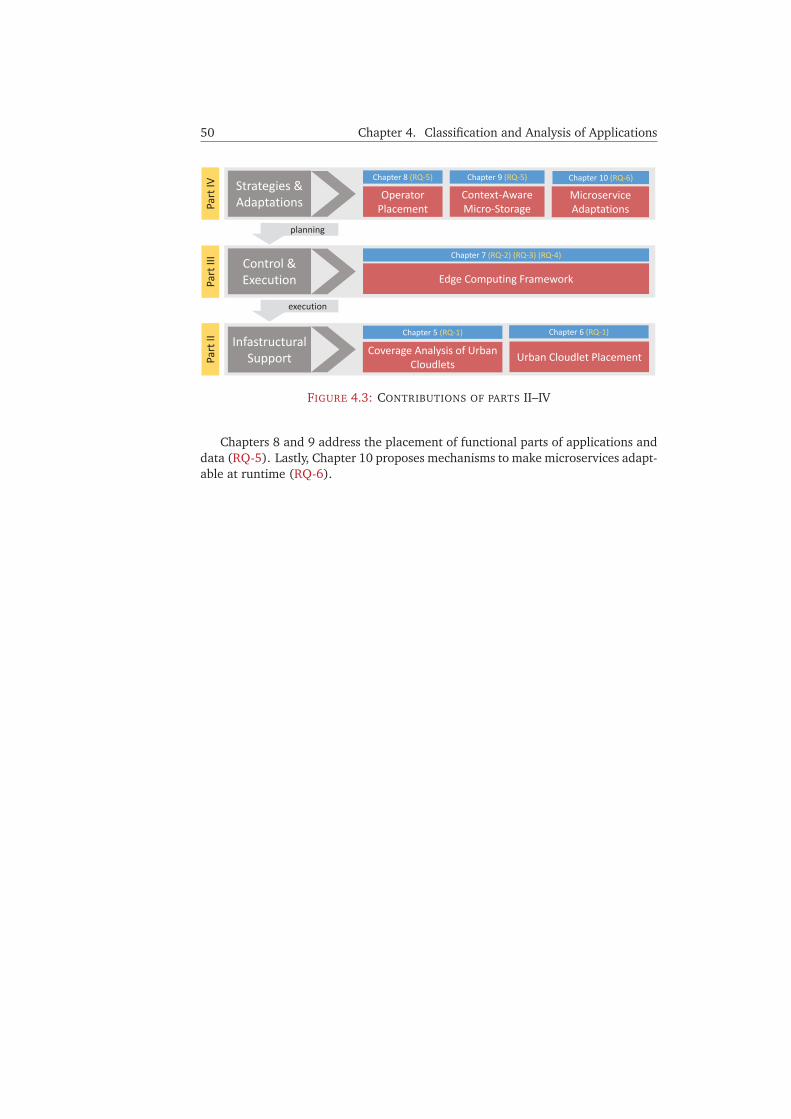
50 Chapter 4. Classification and Analysis of Applications
Infastructural Support
Control & Execution
Strategies & Adaptations Operator
PlacementContext-Aware Micro-Storage
Microservice Adaptations
Chapter 8 (RQ-5) Chapter 9 (RQ-5) Chapter 10 (RQ-6)
Edge Computing Framework
Chapter 7 (RQ-2) (RQ-3) (RQ-4)
Part
IVPa
rt II
IPa
rt II
Urban Cloudlet Placement
Chapter 5 (RQ-1)
Coverage Analysis of Urban Cloudlets
planning
execution
Chapter 6 (RQ-1)
FIGURE 4.3: CONTRIBUTIONS OF PARTS II–IV
Chapters 8 and 9 address the placement of functional parts of applications anddata (RQ-5). Lastly, Chapter 10 proposes mechanisms to make microservices adapt-able at runtime (RQ-6).

Part II
Infrastructural Support
Infrastructural Support
Control & Execution
Strategies & Adaptations
In this part, we investigate the physical infrastructural support requiredfor Urban Edge Computing, i.e., the actual deployment environment ofcloudlets in an urban area. The infrastructure presented in this part isthe basis to provide Edge Computing services. The concepts presentedin the subsequent parts of the thesis are deployed on top of this infra-structure. In detail, this part addresses two problems.
First—based on the observation that building new infrastructure fromscratch is costly—Chapter 5 analyzes how we can leverage existing in-frastructure resources in a city to place cloudlets. This chapter is largelybased on the publications [Ged+18c; Ged+18d].
Second, given urban infrastructures for a potential placement of cloudlets,Chapter 6 investigates the problem of where to place cloudlets on het-erogeneous infrastructures. This chapter in turn is in large parts basedon the work published in [Ged+18d].
In this part, text segments that are verbatim copies of [Ged+18c] or [Ged+18d] are printed in browncolor and gray color, respectively. Tables and figures taken or adapted from these publications are markedwith † ([Ged+18d]) and †† ([Ged+18c]) in their caption.Contribution statement: The student Jeff Krisztinkovics helped in the collection of access point dataand implemented parts of the functionality for the computation of coverage in the context of his Bache-lor’s thesis [Kri19].
51


CHAPTER 5
Coverage Analysis of Urban Cloudlets
Chapter Outline5.1 Introduction . . . . . . . . . . . . . . . . . . . . . . . . . . . . 53
5.2 A Multi-Cloudlet Urban Environment . . . . . . . . . . . . . 54
5.3 Related Work . . . . . . . . . . . . . . . . . . . . . . . . . . . . 57
5.4 Datasets . . . . . . . . . . . . . . . . . . . . . . . . . . . . . . . 59
5.5 Coverage Metrics . . . . . . . . . . . . . . . . . . . . . . . . . 64
5.6 Coverage Analysis . . . . . . . . . . . . . . . . . . . . . . . . . 67
5.7 Conclusion . . . . . . . . . . . . . . . . . . . . . . . . . . . . . 75
5.1 Introduction
One of the important building blocks and a recurring term used in the descriptionof Edge Computing deployments is the concept of cloudlets—small-scale data cen-ters that offer proximate resources for storage and computations (see Chapter 2).Cloudlets can therefore be considered as the infrastructural basis which our othercontributions build upon. Most importantly, cloudlets will be responsible for host-ing the execution and control environment for Edge Computing applications (seeChapter 7).
Previous research has addressed various problems that often relate to runtime is-sues of cloudlet deployments, for instance offloading mechanisms (e.g., [Cue+10])and programming models (e.g., [Hon+13]). However, little attention has been paidto the question of where to deploy cloudlets on a city-scale. A dense deploymentof cloudlets is one of the requirements we have identified for Urban Edge Com-puting (see RQ-1 in Section 4.4). Cloudlets require resources to be deployed andoperated. Besides power and network connectivity, we require physical space toinstall (additional) hardware that serves as cloudlets. In this chapter, we refer to
53

54 Chapter 5. Coverage Analysis of Urban Cloudlets
locations where such resources are available as infrastructure. Contrary to a datacenter environment, where the abovementioned resources are inherently present,this is not the case in an urban environment, making the deployment of cloudletsmore challenging. Because newly building those resources is costly, this chapterinvestigates if we can leverage existing urban infrastructures for the placement ofcloudlets and hence, provide infrastructural support for Edge Computing applica-tions. More specifically, we suggest to co-locate cloudlets with wireless access pointsat three types of existing infrastructures present in cities: (i) cellular base stations,(ii) commercial off-the-shelf WiFi routers, and (iii) smart street lamps. We arguethat those infrastructures are viable locations to deploy cloudlets. In Section 5.2,we describe them in more detail and study their particular characteristics.
After reviewing related work in Section 5.3, the following sections investigatewhether these infrastructures are sufficient to provide coverage in an urban area,given that realistically, only a fraction of them will be upgraded to host cloudlets. Toanswer this question, we perform a systematic coverage analysis (Section 5.6), usingfour different coverage metrics, as defined in Section 5.5. The different coveragemetrics allow us to quantify the quality of service that can be expected for differentapplication use cases. In order to base our analysis on realistic data, we collected alarge body of data (see Section 5.4) for a German city, containing locations of theinfrastructures and user traces from mobile applications. The results of the coverageanalysis based on these datasets serve two purposes:
• We are able to show that leveraging urban infrastructures has the potentialto enable a city-wide deployment of cloudlets. A cloudlet deployment thatcovers large parts of a city is furthermore an important enabler for futuresmart city applications, like the ones presented in Section 4.2.2.
• The result of the analysis can serve as an aid for planning a cloudlet deploy-ment, e.g., by estimating the number of cloudlets for a target coverage. Fur-thermore, it allows for the identification of regions without coverage whereinfrastructure resources must be deployed in order to provide Edge Comput-ing services.
5.2 A Multi-Cloudlet Urban Environment
In this section, we present three types of infrastructures that are able to accom-modate cloudlets. We assume that these infrastructures host wireless access pointsto which users can connect and hence, access the resources and services providedby the cloudlets. Before describing them in detail, we first describe the generalcharacteristics and requirements of such infrastructures.
For our urban scenario, we consider cloudlets to be hosted on three types ofinfrastructure: cellular base stations, routers, and street lamps. We specificallyinvestigate those types of infrastructure because they are ubiquitously present inurban spaces. Figure 5.1 illustrates an environment of different access point types,with cell towers in purple, routers in green, and smart street lamps colored in or-ange. Common to all these three types of access points is their dense deployment inurban spaces and their function as a wireless connectivity gateway to mobile users.For cellular base stations and routers, we can further assume a powerful backhaulconnection in terms of bandwidth and ample physical space at the point of presenceto co-locate additional hardware.

5.2. A Multi-Cloudlet Urban Environment 55
FIGURE 5.1: A MULTI-CLOUDLET URBAN INFRASTRUCTURE†
Mobile users in the vicinity of these cloudlets can then make use of them to off-load data and computations. The different types of access points are heterogeneousin several ways. First, due to different wireless access technologies, their communi-cation ranges vary. A cellular base station can cover a wider area than a WiFi routerin an urban environment. With the advent of new communication technologies,we expect to see other kinds of deployments, e.g., small-scale cellular base stations(so-called femtocells [CAG08]) on street lamps. Second, due to the varying phys-ical space available for hardware installations at the access points, the resultingcomputing power colocated at one access point will differ. For example, installingserver-grade hardware is difficult in the restricted space of street lamps, while thisis likely the predominant deployment model for cloudlets at the Radio Access Net-work, i.e., at the location of cell towers. Depending on the resources they provideand the underlying business model, installing cloudlets incurs varying costs. Chap-ter 6 will describe how this heterogeneity makes the decision challenging, whichaccess points to equip with cloudlets.
Lastly, we have different stakeholders that own or operate the infrastructure,ranging from ISPs and mobile network operators to businesses, municipalities, orprivate citizens. We refer the reader to Section 3.4 and Section 11.2.3 for a moreextensive discussion on stakeholders and (future) business models for Edge Com-puting. Regardless of the underlying business model for the usage of cloudlets, weargue that the use of existing infrastructure as well as future infrastructures, suchas lamp posts in the context of smart cities, allows a cost-effective placement ofcloudlets, since it avoids the construction of new access points. Table 5.1 summa-rizes the characteristics of each cloudlet type.
5.2.1 Cellular Base Stations
Each major city today features widespread cellular coverage, albeit at varying qual-ity and speed. Even though some areas still lack satisfying coverage and connec-tion speeds, cellular base stations represent a viable location for the deploymentof cloudlets if we want to cover large areas. First, existing radio access networkshave a high-bandwidth backlink on-site. In the case of cloudlets, this could beimportant if there is the need to retrieve large amounts of data from the cloud.Furthermore, this is an important asset to perform quick intra-network handoverand enable distributed computations. Second, at most cellular stations, there is

56 Chapter 5. Coverage Analysis of Urban Cloudlets
TABLE 5.1: CHARACTERISTICS OF ACCESS POINT TYPES†
Cellular Routers Street lamps
base stations
Density low high high
mobile network ISP, businessesOwnership
provider or privatemunicipality
Access3G, 4G, 5G WiFi
WiFi, Femtocells,
technology LoRa, mmWave
Communication range high low low-medium
Computationalhigh low–medium low
resources
enough physical space available to install massive computing resources in the formof server-grade hardware. Another advantage of cellular base stations is their highreliability [EZB17].
Leveraging resources co-located with the radio access network is commonly re-ferred to as Mobile Edge Computing (MEC) and seen as a viable deployment modelto make Edge Computing available [Li+16b; Abb+18; SBD18]. This deploymentmodel is predicted to gain importance with the advent of the new 5G cellular stan-dards [Nun+15; Hu+15b] because those offer processing capabilities within thenetwork. For network operators and cellular service providers, Mobile Edge Com-puting is a future business opportunity, as they will be able to rent out computationalresources located at base stations.
5.2.2 Routers
Next, we consider commercial off-the-shelf WiFi routers. In urban areas, the densityof WiFi routers is very high. This includes both privately-owned devices as well aspublic access points offered by businesses like cafes or restaurants. The latter is aservice increasingly valued by customers. Using WiFi routers as cloudlets is advan-tageous, given their ubiquity. Performing computations on the routers themselveshas been investigated before (see Section 5.3.1), but they also offer the possibilityto co-locate rather powerful hardware in the local network they are connected to.
While the motivation for businesses to provide cloudlets might be to enhanceservice for their customers, the incentives for private citizens are less obvious. Wecan, however, make two observations in this regard. First, several initiatives alreadypromote the sharing of ones WiFi to give others internet access (e.g., Freifunk1 inGermany). We argue that going one step further—from providing free access tofree computations and/or storage—is the next logical step. Second, the incentiveto provide a cloudlet could also come from one’s internet service provider. Forinstance, service providers could install equipment and applications at the users’premises and compensate them with a reduced subscription bill.
1https://freifunk.net/ (accessed: 2019-10-30)

5.3. Related Work 57
5.2.3 Street Lamps
Besides service providers, businesses, and private citizens, municipalities also havean inherent interest in enabling services that lead to smarter cities. For this reason,we envision cloudlets to be placed on lamp posts. A lamp post is a viable location toplace a cloudlet for two reasons: First, there is a large number deployed in every city,sometimes with the distance between two lamp posts being only a couple of meters.Therefore, especially in densely populated areas, they can very well complementcell towers and routers to provide dense coverage. Second, from the perspectiveof users moving on a city street, the wireless signal is less obstructed compared toWiFi access points that are typically placed in buildings.
Upgrading lamp posts to host cloudlets might seem to incur a huge investmentat first, since wireless access points and uplink networks are typically not readilyavailable. However, we can observe a trend that municipalities around the worldare currently in the process of updating their street lighting, mostly due to energyconsiderations. According to the Humble Lamppost project2, 75 % of lamp posts inEurope are over 25 years old and consume between 20 % and 50 % of a city’s en-ergy budget. Therefore, investments to upgrade lamp posts to LED-based lightingwill quickly amortize due to the energy savings of LED lamps. In the process ofupgrading, additional functionalities, such as sensory capabilities, network connec-tivity, and computing resources can be installed to turn traditional street lamps intosmart street lamps. A number of commercial products are already available, e.g.,the SM!GHT3 lamp by the German company EnBW. These efforts towards smartstreet lamps furthermore have resulted in a DIN standard [DIN18].
We argue that in view of this trend, installing additional hardware to providecomputing resources is a negligible additional investment, compared to the overallcost of upgrading the street lamps. It should however be noted, that upgradingstreet lamps might also require changes in the entire electric infrastructure thatpowers the lamps. For instance, today most lamps do not feature a switch that couldcontrol the power supply of different components. Instead, lamps are centrallyturned on and off.
In conclusion, this section presented three types of available infrastructures intoday’s cities that meet the requirements to be equipped with cloudlets: dense de-ployment, physical space and power supply for additional hardware, and wirelessnetwork connectivity.
5.3 Related Work
5.3.1 Urban Cloudlets
To the best of our knowledge, previous works have not considered the combineduse of different types of cloudlet infrastructures in an urban area. Providing of-floading capabilities at the radio access network (RAN) has been investigated in anumber of publications [Bec+14; Mao+17; Abb+18], with the special case of so-called femtocells [CAG08], which are less expensive to deploy and operate. WiFirouters have been suggested as Edge Computing devices, either as hosts for thecomputations themselves [Meu+15], as a joint infrastructure for computations and
2https://eu-smartcities.eu/initiatives/78/description (accessed: 2019-10-30)3https://smight.com/en/ (accessed: 2019-10-30)

58 Chapter 5. Coverage Analysis of Urban Cloudlets
bridging communications [Meu+17c], or to perform auxiliary functions in an EdgeComputing system, e.g., the discovery of Edge Computing nodes [Ged+17].
Some works [BMV10; Lee+13] investigate the interplay between WiFi and cel-lular connections. Balasubramanian, Mahajan, and Venkataramani [BMV10] studythe availability of 3G and WiFi networks in a city and suggest two different switchingmechanisms—for delay-tolerant and delay-sensitive applications— to complement3G connections with WiFi networks. In an empirical study, the authors comparethroughput and loss rates for both network types and argue that WiFi networks canhelp to reduce costs and alleviate stress on cellular networks. Lee et al. [Lee+13]conduct a quantitative study on the savings of traffic and battery power when of-floading 3G traffic through WiFi. The authors also consider applications where longdelays (in the order of 100 seconds) are tolerable. However, as we have argued inSection 3.1 and Chapter 4, these are not realistic assumptions for applications thatwill be deployed at the edge. Similarly, Dimatteo et al. [Dim+11] have shown thata small number of WiFi access points are sufficient to serve delay-tolerant applica-tions.
Visions for offloading infrastructures also include the use of vehicles [Wan+16;GZG13; Hou+16] and drones to host cloudlets [Sat+16; JSK18a]. While someworks have proposed to make existing street lamps smarter [Jia+18], to the best ofour knowledge, our contributions in [Ged+18c; Ged+18d]were the first to considerstreet lamps for hosting cloudlets.
5.3.2 Coverage
The term coverage is most widely used in the context of Wireless Sensor Networks(WSNs) [HT05]. Consequently, the problem of coverage has been studied exten-sively in this context, as analyzed in various surveys [Wan11; MHS17; MA10;GD08]. In WSNs, coverage describes how well an area of interest can be monitored[MHS17; Wan11] by sensors or people [GS15]. Coverage is therefore an aspectand a metric for the quality of service the network of sensors is able to deliver.
Several established definitions of coverage exist, for example, sweep coverage[Li+11] or barrier coverage [Liu+08]. However, many of those definitions cannotmeaningfully be applied to analyze cloudlet coverage in an urban scenario. For in-stance, barrier coverage denotes the singular detection of a target inside an area.This is not a sensible metric for our application domain because we want mobileusers to have a continuous connection to cloudlets and not just at a single point intime. Close to our definitions of coverage that will be introduced in Section 5.5, thework of Fan et al. [FJ10] proposes three different definitions of coverage, namelyarea, point, and path coverage. We adapt those to our urban cloudlet context andwill add time coverage as another metric for coverage. In our urban cloudlet sce-nario, coverage indicates the connection to an access point on which a cloudlet isco-located, and hence, is a metric for how well offloading demands of mobile userscan be served by cloudlets.
A very limited number of works have investigated coverage in the context ofcloudlet deployments for Edge Computing. Syamkumar et al. [SBD18] analyzethe deployment characteristics of cell towers w.r.t. the population distribution anddensity in the US. Other works have investigated the coverage of WiFi access pointsin case studies related to computational offloading, but only considered one typeof coverage, e.g., spatial [Bur+15], point [Mot+13], or temporal [Meu+17a] cov-erage. As an exception, Lee et al. [Lee+13] consider both spatial and temporal

5.4. Datasets 59
(a) Administrative cityboundary†
(b) Inner city area† (c) Access point locations on a sam-ple section of the city center
FIGURE 5.2: DARMSTADT CITY CLOUDLET DATASET
coverage for WiFi access points. Similar to what we describe in the related workabout the cloudlet placement problem (see Section 6.2), Liao et al. [Lia+11] as-sume that we can freely place cloudlets to optimize their coverage. In contrast, thischapter is intended to provide an empirical study on the coverage of existing accesspoint infrastructure.
To conclude the analysis of related work, none of the existing works have jointlyconsidered the three types of cloudlet infrastructure (cellular base stations, routers,street lamps), both for the coverage analysis with four types of coverage (spatial,point, path, and time coverage) and the placement of cloudlets on those infrastruc-tures.
5.4 Datasets
We investigate the placement of cloudlets in the city of Darmstadt (Germany), amajor city with a population of about 150 000. To do so, we use real-world data forboth the location of access points and the traces of mobile users as described here-inafter. The official administrative boundary of the city is depicted in Figure 5.2(a).We restrict our analysis in the remainder of the paper to the inner city area (span-ning an area of 15.57 km2) as shown in Figure 5.2(b) because most of the accesspoint data gathered lies within that boundary. This is especially true for the routers,which were collected by volunteers. Furthermore, the inner city area allows us tostudy the interplay between all three types of infrastructure, not all of which mightbe available with the same density in more rural areas.
5.4.1 Access Point Locations
In total, we collected the locations of nearly 50 000 access points throughout the cityfor the different types of access points. Figure 5.2(c) shows a typical distributionof cell towers (purple), routers (green), and lamp posts (orange) on an exemplarysmall section of Darmstadt. We now describe the origin and extent of the accesspoint location data.

60 Chapter 5. Coverage Analysis of Urban Cloudlets
5.4.1.a Cellular Base Stations
The Bundesnetzagentur (Federal Network Agency) is the regulating body in Ger-many in charge of authorizing and supervising the operation of radio installations.A map of all transmitting stations, including cell towers, can be accessed throughtheir website4. However, the website does not provide a feature to export the data.Thus, we performed a manual crawl using the network panel of the Google Chromebrowser developer tool. We issued a query of all the cell towers within the city andparsed the resulting JSON data that contains their GPS locations.
5.4.1.b WiFi Routers
We followed a so-called wardriving approach to collect information about WiFi net-works in the city and used this data to estimate the position of routers within thecity. Using a modified version of WiFiAnalyzer5, an open source Android application,volunteers walked around the city and collected the signals from available WiFi ac-cess points. We used the raw data from two volunteering campaigns, conducted inMarch 2016 and February 2018. In total, 27 participants—mostly students—wereinvolved. We made the dataset and the source code of the tools publicly availableto the research community6. More details about the collection process are given inExplanation 5.1. It is important to note that this dataset might include some wrongor inaccurate data. This is due to the nature of the wardriving approach. GPSreceivers only operate with a certain accuracy and calculating the distance to anaccess point from the received signal strength is based on an approximative model.However, we argue that overall, this gives a reasonable estimation of the availablerouters to place cloudlets. More importantly, the data was collected while walkingor driving through the city and not inside buildings or private locations, thereforereflecting the usage context of a mobile user who wishes to perform opportunisticoffloading.
EXPLANATION 5.1: DATA COLLECTION THROUGH WARDRIVING
Wardriving is “the act of moving around a specific area and mapping the pop-ulation of wireless access points for statistical purposes” [Hur04]. We obtainedraw measurements from the aforementioned Android application, containingsignaling information from the access point, such as their SSID and BSSID.Furthermore, based on the received signal strength indicator (RSSI), the appli-cation estimates the user’s distance to the access point. We collect this raw mea-surement data from every participant. Before further processing, we performa lookup on the router’s MAC address, i.e., the reported BSSID, and manuallyeliminate all entries from manufacturers that do not produce routers. The posi-tions of the access points were then estimated via multilateration from multiplemeasurements of the same access point.
4http://emf3.bundesnetzagentur.de/karte/ (accessed: 2019-11-16)5https://github.com/VREMSoftwareDevelopment/WiFiAnalyzer (accessed: 2019-11-01)6https://github.com/Telecooperation/darmstadt-wifi (accessed: 2019-11-07)

5.4. Datasets 61
For multilateration, a mini-mum of 3 measurements isrequired (trilateration). Thefigure on the right illustratesthis for 3 users u1, u2, u3 thatreport distances d1, d2, d3 tothe access point, with the pos-sible location of the accesspoint being in the hatched redarea. We use an iterativeapproximation algorithm, im-plemented in Ruby, to find avalid location, i.e., one wherethe circles representing thedistances intersect. The rele-vant part of the source codecan be found in Appendix A.
u1 u2
u3
d1
d2
d3
5.4.1.c Street Lamps
We obtained a database export of the position of all street lighting installations inDarmstadt from e-netz südhessen GmbH7, the company in charge of managing thecity’s electrical infrastructure. The dataset includes different types of street lighting,such as lights hung via cables over streets, but we only include fixed lamp posts forour further analysis of cloudlet coverage and placement, as they provide enoughspace and a safe enclosure to install additional hardware for cloudlets.
To conclude the description of the access point datasets, Table 5.2 summarizesthe number and density of each access point type for the entire administrative cityboundary and the inner city area (see Figures 5.2(a) and 5.2(b)).
TABLE 5.2: NUMBER OF COLLECTED ACCESS POINTS†
Cellular Routers Street lamps
base stations
Administrative boundary 205 34 699 14 331
Density per km2 1.7 284.0 117.3
Inner city 66 31 974 5608
Density per km2 4.5 2194.5 384.9
5.4.2 Mobility Traces
Several important types of coverage take into account the user’s position. Therefore,we need realistic mobility traces that reflect where in the city we have demands foroffloading. While a lot of research exists about mobility models [Zhu+15; Jar+03;YLN03], we want to base most parts of our analysis on real-world mobility traces.
7https://www.e-netz-suedhessen.de/ (accessed: 2019-11-07)

62 Chapter 5. Coverage Analysis of Urban Cloudlets
TABLE 5.3: MOBILE APPLICATION TRACES†
Kraken.me Ingress CrowdSenSim
Users 205 1401 2499
Data points 437 417 520 409 431 001
Paths 11 930 47 915 44 150
For our analysis, we use data from two mobile applications, Kraken.me and Ingress,described in Sections 5.4.2.a and 5.4.2.b. The former is a persona tracking frame-work while the latter is a mobile AR game. The datasets allow us to model whereoffloading capacities will be required in the future. For instance, upcoming ver-sions of the Ingress game might require more sophisticated processing for AR thatcannot be handled by the mobile device itself. Additionally, we include simulatedmobility data generated with CrowdSenSim (see Section 5.4.2.c), a tool designedfor simulating crowdsensing applications.
The three datasets differ with respect to the mobility patterns they represent. Inaddition, they feature locations both inside buildings and outside. We believe thatcombining them in our analysis allows our findings to be applied to more than oneapplication use case. For example, Kraken.me records the daily activities of users,i.e., for a large fraction of time users are at home or work, while Ingress directsusers to specific locations in the city.
From the raw data, we first perform trace analysis [Pan+13a] in order to obtainmeaningful representations for the analysis (e.g., paths with sufficient lengths) andto reduce redundant data (e.g., data points that are very close to each other). Inaddition, this step also removes data points that are obviously erroneous. For ex-ample, some user devices in the Kraken.me applications reported wrong positions(outside Germany although the campaign took place only there) and timestamps(outside of the campaign duration). Further details and criteria for filtering the rawdata are described in Explanation 5.2. Table 5.3 summarizes the resulting numberof distinct users, data points, and paths after this pre-processing.
EXPLANATION 5.2: LOCATION DATA PRE-PROCESSING
We apply the following pre-processing steps to the raw location data obtainedfrom our datasets:
• Data points not contained within the inner city area of Darmstadt (seeFigure 5.2(b)) are discarded.
• We remove data points with invalid timestamps, i.e., locations that aretimestamped outside the range of when the measurements are knownto have happened. Not doing so would lead to a wrong construction ofpaths.
• In the case when the user has not moved between two consecutive (basedon the timestamps) points, we remove the second data point.
• We define a speed threshold as the maximum plausible travel speed be-tween two points. This serves to remove unrealistic (in terms of travelspeed) path segments.
5.4. Datasets 63
• To reduce the overall size of the datasets (and hence, make the compu-tations on them more efficient) we introduce a distance threshold. Espe-cially in datasets that have a high temporal resolution and where usersare not constantly on the move, many consecutive data points will onlyslightly differ in their position. If the distance between two consecutivedata points is below this threshold, the second point is removed.
• To analyze the coverage of entire paths rather than individual data points,we need to aggregate a series of data points to a path. We define the timethreshold as the maximum time difference that two consecutive pointscan have if they are part of one path. For greater time differences, a newpath is constructed. This mechanism therefore does not remove any datapoints but is used to generate paths from data points. Without this pre-processing step, all data points from one user would belong to one pathonly. Instead, the time threshold allows to model a continuous activityfrom the user (e.g., traveling between points of interest) during whichwe want to measure the cloudlet coverage.
• For the same reason, if the number of data points per path is below acertain minimum, the entire path is discarded.
• We define the minimum path extension for each path as the minimumarea of the path’s bounding box. This is done to eliminate paths withinsufficient spatial extension (e.g., users who are circulating in a smallarea in or around their homes) that would distort the analysis, especiallywhen comparing different coverage metrics. The minimum path exten-sion therefore allows discarding user activity that is not relevant to thecoverage analysis, e.g., when a user is staying within the boundaries ofhis home environment and therefore covered by the home access point.
5.4.2.a Kraken.me
Kraken.me [SS14] is a tracking framework that records users’ activities and gathersdata from various soft and hard sensors on mobile devices in order to provide per-sonal assistance. During the development, a user study was conducted for severalweeks using Android phones. Participants of the study were mostly students anduniversity research staff. For our evaluations, we use a reduced dataset that onlycontains the timestamped positions along with a unique user ID. The data is tem-porally fine-grained with user positions being reported every 30 to 60 seconds onaverage.
5.4.2.b Ingress
Ingress8 is a popular mobile AR game and the predecessor of Pokémon Go. Playersvisit portals at physical locations in the city. Portals are located at places of inter-est throughout the city, e.g., prominent buildings, landmarks, or transport stations.Each player needs to visit and interact with multiple portals, which leads to a con-stant movement of the player in the real world. Consequently, the users’ positionsare recorded implicitly by their interaction at the portals. In total, there are 724
8https://www.ingress.com/ (accessed: 2019-11-05)

64 Chapter 5. Coverage Analysis of Urban Cloudlets
portals located in the inner city area of Darmstadt. The current state of the gameand player activity is visible on the Ingress Intel Map website9.
We used game data gathered by a crawling tool provided by the authors of[Fel+18]. The crawler uses an automation tool for web browsers to request changesin the game state every second. It is important to note that changes include the po-sition updates from players at portals. Because the user locations are only recordedat the portals and not between, the data is more coarse-grained in terms of tempo-ral resolution compared to the Kraken.me data. However, the positions are still agood indicator for offloading demands related to other applications, since portalsare often located at points of interest in the city.
5.4.2.c CrowdSenSim
Lastly, to extend the number of available data points for our analysis, we use artifi-cial mobility traces generated with CrowdSenSim [Fia+17], a discrete-event simu-lator for mobile crowdsensing. CrowdSenSim generates user traces in urban areaswhere users roam around the city and randomly take turns onto streets. The sim-ulator uses a uniform mobility algorithm10 We set the simulation parameters suchthat several simulations are carried out for 7 days with 2500 users. The minimumand maximum travel times per path were set to 30 minutes and 720 minutes, re-spectively.
5.5 Coverage Metrics
For our analysis of urban cloudlet coverage, we consider four different metrics forcoverage: spatial, point, path, and time coverage. These metrics are depicted inFigure 5.311 and differ in the data they require to be assessed. Spatial coverage iscompletely independent of individual user locations. Point coverage requires a setof user locations and path coverage an (implicit or explicit) ordering of those. Pointand path coverage allow to more accurately model actual demand patterns becauseusers are not uniformly distributed throughout an area. Additionally, to computethe time coverage, user locations must include a timestamp at each location. Thesedifferent coverage metrics allow the modeling of different offloading requirements,depending on the applications and user demands. For instance, point coverage canmodel how well singular offloading demands at certain locations can be served,while path and time coverage model applications that require continuous (withrespect to distance and time traveled) availability of services offered by cloudlets.
5.5.1 Spatial Coverage
Spatial coverage quantifies the spatial extent of the cloudlets’ communicationranges in relation to the total area. Consequently, spatial coverage gives only anindication of how well an area is covered by cloudlets and does not consider userlocations. It is defined as the ratio between the union of the communication ranges
9https://www.ingress.com/intel (accessed: 2019-11-05)10details can be found in the manual of the simulator: https://crowdsensim.gforge.uni.lu/ftp/manual1.1.pdf
(accessed: 2020-05-17)11the communication ranges in the figure are illustrative and not drawn to scale

5.5. Coverage Metrics 65
TotalArea
CoveredAreas
SpatialCoverage
A(Covered Area)
A(Total Area)
(a) Spatial coverage
PointCoverage
| || | + | |
UncoveredPoint
CoveredPoint
(b) Point coverage
PathCoverage
∑ l(cp ) ∑ l(cp ) + ∑ l(up )
Uncovered PathSegment (up)
Covered PathSegment (cp)
up1up2 cp1 cp2
i
i i
(c) Path coverage
UncoveredTime Span
Covered Time Span
TimeCoverage
∑ l( ) ∑ l( ) + ∑ l( )
(d) Time coverage
FIGURE 5.3: COVERAGE METRICS†
of cloudlets and the total size of the area, as shown in Figure 5.3(a). Formally,given a function A that represents the area, spatial coverage can be defined as
Spatial Coverage =A(covered area)
A(total area)(5.1)
5.5.1.a k-coverage
Spatial coverage can be generalized to k-coverage. Instead of only considering if anarea is covered by the range of one access point, k-coverage models the simultane-ous coverage by k access points. Hence, we define k-coverage as follows: An area issaid to be k-covered iff it intersects with the communication ranges of at least k− 1other access points. The reason one might want to expand the analysis to k > 1 isto explore the possibility of choosing between multiple cloudlets to optimize userexperience in terms of connection bandwidth or resources. This choice could forinstance be based on application requirements, e.g., a real-time application wouldchoose the cloudlet with the lowest overall latency. As another example, in areaswhere many users are present, one cloudlet might not be sufficient to satisfy alloffloading demands of users within its range.

66 Chapter 5. Coverage Analysis of Urban Cloudlets
EXPLANATION 5.3: SPATIAL k-COVERAGE
k = 1k = 2k = 3
Following this definition, ourpreviously introduced exam-ple of spatial coverage wouldequal to k = 1. This figure il-lustrates examples for k = 1,k = 2, and k = 3 at differentintersections of the cloudlets’communication ranges.
5.5.2 Point Coverage
Point coverage indicates how many recorded location points of a mobile user arewithin the communication range of a cloudlet, as depicted in Figure 5.3(b). Thiscoverage metric can therefore be used to model how many user requests at thecaptured distinct points can be served by a cloudlet. Given a set C P of coveredpoints and a set U P of uncovered points, point coverage is defined as
Point Coverage =|C P|
|C P|+ |U P| (5.2)
5.5.3 Path Coverage
Since users also move between the distinct points at which their position is recorded,path coverage (see Figure 5.3(c)) takes into account the paths of users. This allowsus to model use cases where users need continuous connectivity to a cloudlet, e.g.,when continuously processing video streams. By segmenting the entire paths intoparts that are covered and uncovered, path coverage is defined as the ratio betweenthe length of covered segments and the total path length. Because the path is notexplicitly recorded but constructed with individual user locations (e.g., capturedperiodically by a phone’s GPS receiver), path coverage makes the assumption thatusers move on a straight line between two subsequent locations. As a further simpli-fication, we only consider segments between two covered points. From the previousdefinition of uncovered points and covered points, we therefore obtain n coveredpath segments (cpi) and m uncovered path segments (upj). Given l as a functionfor the length of a segment, we can hence define path coverage as
Path Coverage =
∑ni=1 l(cpi)∑n
i=1 l(cpi) +∑m
j=1 l(upj)(5.3)
5.5.4 Time Coverage
On their paths, users might travel at different speeds, and thus, might be on a pathsegment for different durations. Time coverage (sometimes also referred to as tem-poral coverage) takes this into account, as shown in Figure 5.3(c). This metric works

5.6. Coverage Analysis 67
in a similar way as path coverage, but instead of the length of the path segmentsconsiders their duration. Time coverage is therefore defined as the ratio betweenthe total time a user is on a connected path segment and the total travel time of thepath. This metric allows to model how long users can be connected to a cloudletand therefore—similar to path coverage—can represent the perceived quality of theservice in a more fine-grained way. Given the previous definition of covered and un-covered segments, and a function t that computes the duration path segments, timecoverage is defined as
Time Coverage =
∑ni=1 t(cpi)∑n
i=1 t(cpi) +∑m
j=1 t(upj)(5.4)
5.6 Coverage Analysis
We now analyze the coverage of urban cloudlets according to the metrics definedin Section 5.5 and by using the datasets presented in Section 5.4.
5.6.1 Methodology
Development environment and setup: We import the datasets into a PostgreSQL12
relational database. The database system uses the PostGIS extension13 thatenables the representation of spatial data and provides functions that operateon spatial data (e.g., computing the intersection or union of shapes). We useseveral scripts for the data pre-processing and the computation of coverage.The scripts are written in the Ruby programming language, with some aux-iliary functions implemented using the PL/pgSQL programming language.For the pre-processing of the raw data (see Explanation 5.2), we use theparameters as shown in Table 5.4. We base all following analyses on thispre-processed subset.
Evaluation scenarios: To reflect different deployment models and economicallymotivated scenarios, we define six scenarios (named SC1–SC6) with a vary-ing number of access points for each type. Table 5.5 summarizes the differentevaluation scenarios. For each scenario, the relative and absolute (in brack-ets) number of access points per type are shown. The scenarios are meant toprovide an exemplary combination of percentages for the upgrade of accesspoints, motivated by different underlying deployment models and constraints.For instance, by incentivizing private individuals to provide computing capa-bilities at their home routers, the number of devices is likely to increase, asreflected in SC4. Similarly, network operators and municipalities are likelyto be subject to different cost constraints and economic goals. For instance,network operators might choose to upgrade their cell towers based on theaverage user density or demands at certain points in the city. Subsidies orregulatory action might be another way to influence the deployment. We re-flect such variance by choosing 75 % (SC1 and SC2), 50 % (SC3 and SC4),and 25 % (SC5 and SC6) as the percentages for the cell towers. For the streetlamps, 5 % (SC4), 10 % (SC2 and SC5), 25 % (SC1 and SC3), and 50 % (SC6)
12https://www.postgresql.org/ (accessed: 2019-11-06)13https://postgis.net/ (accessed: 2019-11-06)
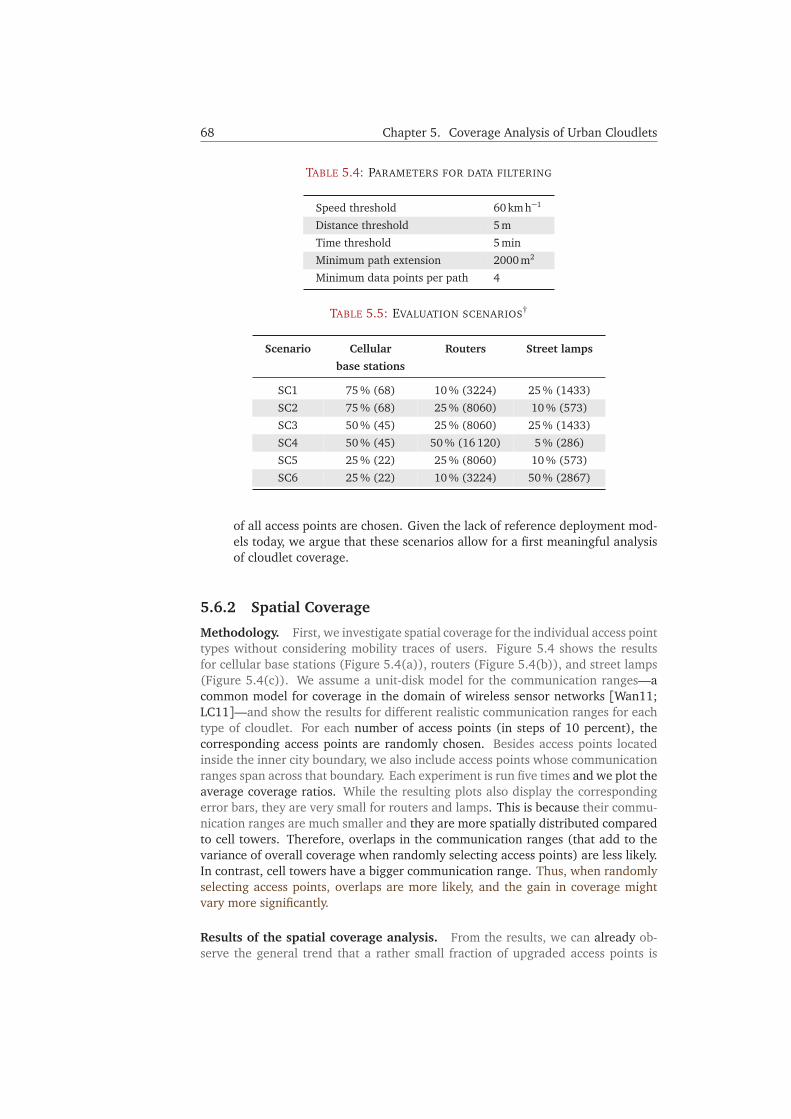
68 Chapter 5. Coverage Analysis of Urban Cloudlets
TABLE 5.4: PARAMETERS FOR DATA FILTERING
Speed threshold 60 kmh−1
Distance threshold 5m
Time threshold 5 min
Minimum path extension 2000 m2
Minimum data points per path 4
TABLE 5.5: EVALUATION SCENARIOS†
Scenario Cellular Routers Street lamps
base stations
SC1 75 % (68) 10 % (3224) 25 % (1433)
SC2 75 % (68) 25 % (8060) 10 % (573)
SC3 50 % (45) 25 % (8060) 25 % (1433)
SC4 50 % (45) 50 % (16 120) 5 % (286)
SC5 25 % (22) 25 % (8060) 10 % (573)
SC6 25 % (22) 10 % (3224) 50 % (2867)
of all access points are chosen. Given the lack of reference deployment mod-els today, we argue that these scenarios allow for a first meaningful analysisof cloudlet coverage.
5.6.2 Spatial Coverage
Methodology. First, we investigate spatial coverage for the individual access pointtypes without considering mobility traces of users. Figure 5.4 shows the resultsfor cellular base stations (Figure 5.4(a)), routers (Figure 5.4(b)), and street lamps(Figure 5.4(c)). We assume a unit-disk model for the communication ranges—acommon model for coverage in the domain of wireless sensor networks [Wan11;LC11]—and show the results for different realistic communication ranges for eachtype of cloudlet. For each number of access points (in steps of 10 percent), thecorresponding access points are randomly chosen. Besides access points locatedinside the inner city boundary, we also include access points whose communicationranges span across that boundary. Each experiment is run five times and we plot theaverage coverage ratios. While the resulting plots also display the correspondingerror bars, they are very small for routers and lamps. This is because their commu-nication ranges are much smaller and they are more spatially distributed comparedto cell towers. Therefore, overlaps in the communication ranges (that add to thevariance of overall coverage when randomly selecting access points) are less likely.In contrast, cell towers have a bigger communication range. Thus, when randomlyselecting access points, overlaps are more likely, and the gain in coverage mightvary more significantly.
Results of the spatial coverage analysis. From the results, we can already ob-serve the general trend that a rather small fraction of upgraded access points is

5.6. Coverage Analysis 69
0.1 0.2 0.3 0.4 0.5 0.6 0.7 0.8 0.9
1
10 20 30 40 50 60 70 80 90 100
Cove
rage
rat
io
Percentage of selected access points
r = 300mr = 400m
r = 500mr = 600m
r = 700mr = 800m
r = 900mr = 1000m
(a) Cellular base stations
0.1 0.2 0.3 0.4 0.5 0.6 0.7 0.8 0.9
1
10 20 30 40 50 60 70 80 90 100
Cove
rage
rat
io
Percentage of selected access points
r = 10mr = 20m
r = 30mr = 40m
r = 50mr = 60m
r = 70mr = 80m
(b) Routers
0.1 0.2 0.3 0.4 0.5 0.6 0.7 0.8 0.9
1
10 20 30 40 50 60 70 80 90 100
Cove
rage
rat
io
Percentage of selected access points
r = 10mr = 20m
r = 30mr = 40m
r = 50mr = 60m
r = 70mr = 80m
(c) Street lamps
FIGURE 5.4: ANALYSIS OF SPATIAL COVERAGE†
70 Chapter 5. Coverage Analysis of Urban Cloudlets
sufficient to provide good spatial coverage. This is especially true for routers be-cause of their sheer number. Assuming a rather conservative communication rangeof 40 m, already 20 percent of routers lead to almost 60 percent spatial coverage.For street lamps, the numbers are smaller because we have fewer lamp posts com-pared to routers. The same 20 percent result in about 30 percent coverage for streetlamps.
The increase in coverage for routers and street lamps is slower from a certainpoint on because with increasing numbers, we get more spatial overlap in the com-munication range and, thus, less gain in overall coverage. In comparison, there arefar fewer cell towers. However, cell towers have a much greater communicationrange today. Figure 5.4(a) shows three consequences of this. First, the coverageis lower for a small percentage of selected access points compared to routers andlamps. Second, adding more cell towers keeps increasing the overall coverage moresignificantly compared to routers and lamps, and third, intersections in the commu-nication ranges lead to high values in the error bars for small percentages.
Spatial k-coverage. We now examine spatial k-coverage with the scenarios de-fined earlier. We again assume a unit-disk model for the communication rangesand select them randomly between the following ranges. For cellular base stations,the communication ranges are randomly chosen within a range of 300 to 1000 me-ters. Some works suggest an average communication range between 50 and 60meters for WiFi routers [Mot+13; Bur+15]. However, in our urban scenario, thismight vary greatly (e.g., due to obstacles or different building structures); there-fore, for cloudlets on routers, we choose a range between 20 and 70 meters. Inour analysis, we assume that in the near future, cloudlets on street lamps will beequipped with WiFi for communication. Because the wireless signal from the ac-cess points on street lamps is less obstructed compared to routers, we increase therange to 30–80 meters. Note that the lower value of the range is disproportionallyhigher because we assume the immediate surroundings of the lamp to be free oflarge obstructions (e.g., because in the deployment, the access points are mountedat a certain height). We use a uniform continuous distribution for all communica-tion ranges and run each experiment 5 times. The results are shown in Figure 5.5.For each scenario, the bars represent the coverage per access point type.
In Figure 5.5(a) we consider 1-coverage, i.e., we assume an area to be covered ifit is within the range of at least one access point. For 1-coverage, one can thereforethink of this figure as a combination of the values shown in Figures 5.4(a)–5.4(c).As with our previous results, we see that a relatively small number of access pointsalready provides good coverage. However, this significantly differs for the differenttypes of access points. For instance, using only a small number of street lamps (asin scenario SC4) is clearly not viable in practice because of low coverage. Figures5.5(b) and 5.5(c) show the results for k = 2 and k = 3, respectively. The biggestdrop in coverage for increased values of k occurs with the street lamps, since theyare spaced out more evenly and therefore, overlaps in the communication ranges oc-cur less often. Since the communication ranges of cellular base stations and routersoften overlap, we see that for k = 2 (Figure 5.5(b)) we still get good coverage.For k = 3 (Figure 5.5(c)), we can observe that routers lose the least coverage of all,possibly because of their generally higher degree of overlap. In future work, insteadof randomly selecting access points, one might want to optimize the selection for adesired target value of k.
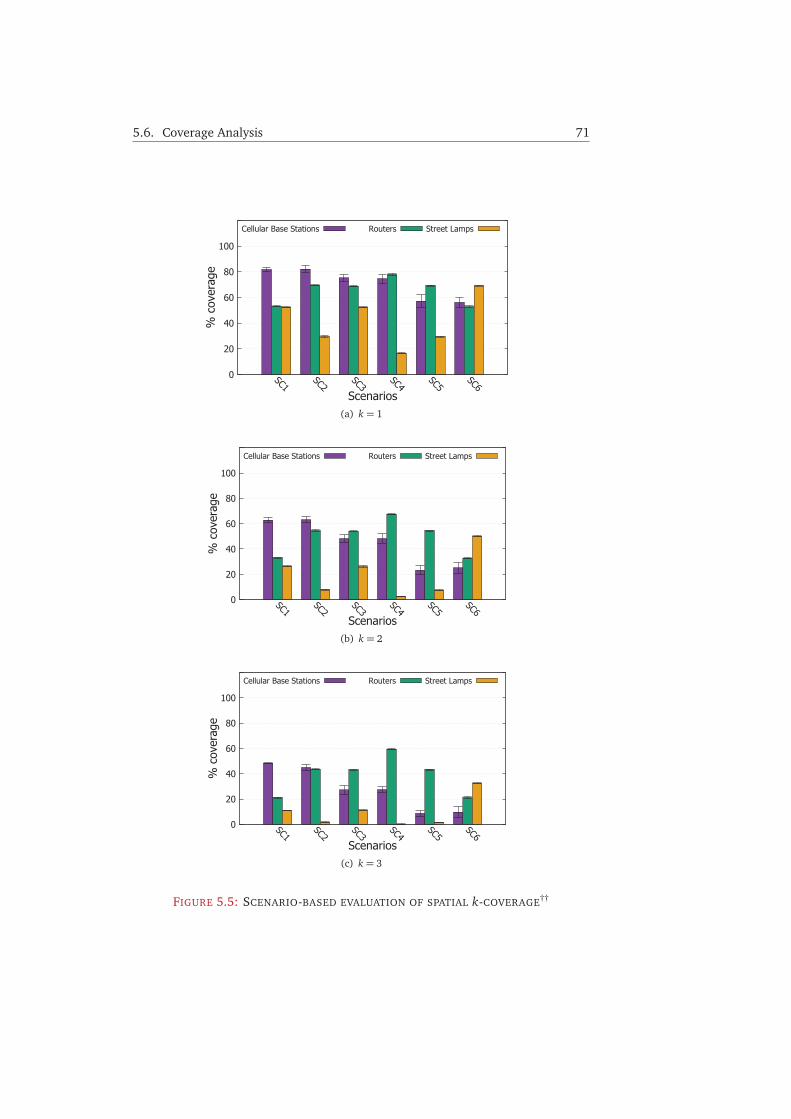
5.6. Coverage Analysis 71
0
20
40
60
80
100
SC1SC2
SC3SC4
SC5SC6
% c
over
age
Scenarios
Cellular Base Stations Routers Street Lamps
(a) k = 1
0
20
40
60
80
100
SC1SC2
SC3SC4
SC5SC6
% c
over
age
Scenarios
Cellular Base Stations Routers Street Lamps
(b) k = 2
0
20
40
60
80
100
SC1SC2
SC3SC4
SC5SC6
% c
over
age
Scenarios
Cellular Base Stations Routers Street Lamps
(c) k = 3
FIGURE 5.5: SCENARIO-BASED EVALUATION OF SPATIAL k-COVERAGE††
72 Chapter 5. Coverage Analysis of Urban Cloudlets
Summary of the spatial coverage analysis & outlook. From the analysis of spa-tial coverage, we can already see that deploying cloudlets is feasible for large-scalecoverage within a city and that only a fraction of access points are required toachieve reasonable coverage. We expect the overall coverage ratio to be even betterwhen taking into account the cover metrics that are based on mobility traces, i.e.,point, path, and time coverage.
5.6.3 Point, Path, and Time Coverage
Methodology. While the results of Section 5.6.2 give an indication of how well anarea is covered, one might argue that this does not necessarily represent the cloudletcoverage a mobile user experiences, since actual user locations are not uniformlydistributed throughout the area. In addition, users are mobile and change theirlocation frequently. Therefore, we now consider the mobility traces described inSection 5.4.2 and evaluate their point, path, and time coverage (as defined in Sec-tion 5.5). This analysis allows for more realistic insights regarding future offload-ing demands that could be served by cloudlets. For the communication ranges, weagain use a uniform continuous distribution and a unit-disk model, randomly se-lecting within the following values according to the access point type: cellular basestations 300–1000 m, WiFi routers and street lamps 10–80 m.
Determining the combined coverage of access points. Figure 5.6 plots the re-sults for the three datasets. In each of the plots, we evaluate the point, path, andtime coverage per scenario. The individual bars are stacked to represent the com-bined coverage we obtain from multiple types of access points. The stacking rep-resents the additional coverage we gain by adding the subsequent type of accesspoint. We assume that as the first type of access point, street lamps will be chosen,since—giving the underlying business model of municipalities providing services totheir citizens—they will incur the lowest costs for users. Furthermore, because mostof our location traces are not inside buildings but outside, street lamps are likely tobe closest and therefore the best-connected cloudlets for users in many cases. Thenext part of the bar represents how much coverage routers add to points, paths, ortime spans not covered by those lamps. Since our model assumes cell towers to bethe most expensive type, they are used last to fill the gap that cannot be covered byother types of access points. It is important to note that the height of the stack, i.e.,the overall coverage would not change if we were to use another order of accesspoints (say, if we would first assume coverage by routers and then add street lampsand cell towers).
Differences between coverage metrics. Surprisingly, the variance between thedifferent types of coverage (i.e., path, point, and time coverage) is very small. Whilethere are variances within a dataset with respect to the distance and difference intimes between the data points, this averages out, i.e., we get nearly identical valuesfor the different metrics of coverage. For datasets with a coarser temporal resolu-tion, such as Ingress, we can, however, observe a lower time coverage compared tothe other metrics.
Overall, this result shows that even if we have limited data (e.g., sparse locationdata for parts of a user’s movement), this averages out over the whole dataset andhence, users will most likely also have a connection to a cloudlet for most of the
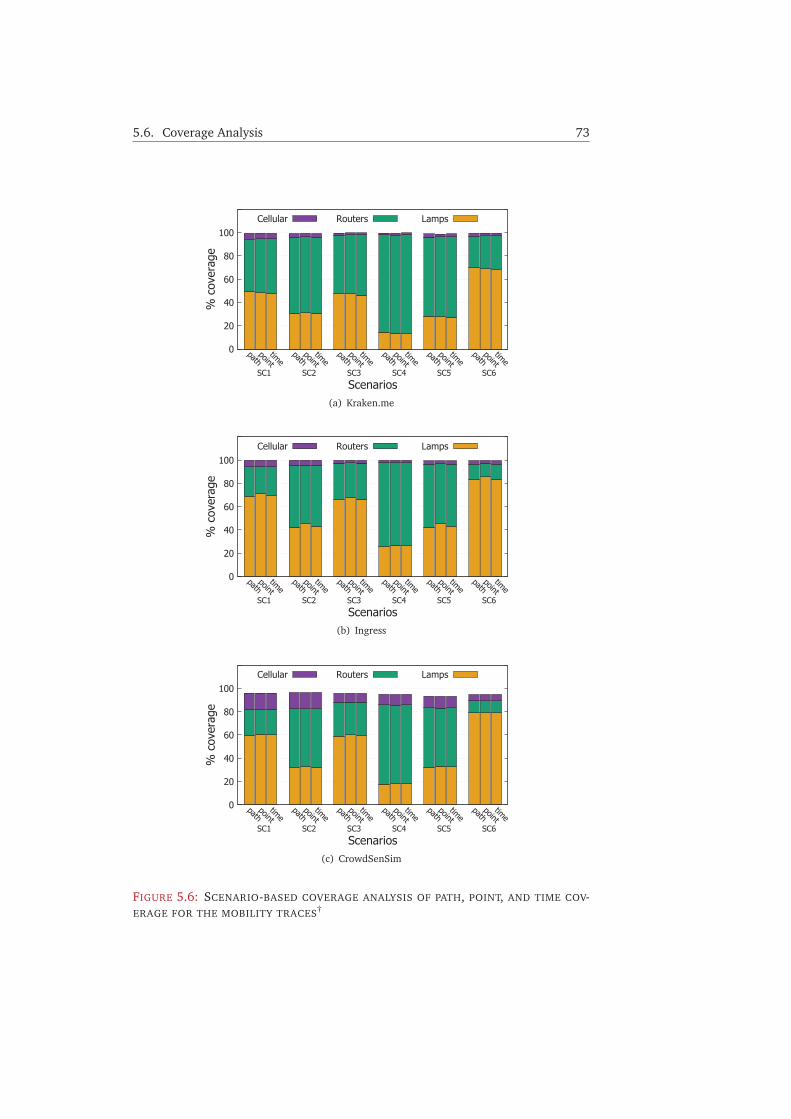
5.6. Coverage Analysis 73
0
20
40
60
80
100
pathpoint
timepath
pointtime
pathpoint
timepath
pointtime
pathpoint
timepath
pointtime
% c
over
age
Scenarios
Cellular Routers Lamps
SC6SC5SC4SC3SC2SC1
(a) Kraken.me
0
20
40
60
80
100
pathpoint
timepath
pointtime
pathpoint
timepath
pointtime
pathpoint
timepath
pointtime
% c
over
age
Scenarios
Cellular Routers Lamps
SC6SC5SC4SC3SC2SC1
(b) Ingress
0
20
40
60
80
100
pathpoint
timepath
pointtime
pathpoint
timepath
pointtime
pathpoint
timepath
pointtime
% c
over
age
Scenarios
Cellular Routers Lamps
SC6SC5SC4SC3SC2SC1
(c) CrowdSenSim
FIGURE 5.6: SCENARIO-BASED COVERAGE ANALYSIS OF PATH, POINT, AND TIME COV-ERAGE FOR THE MOBILITY TRACES†
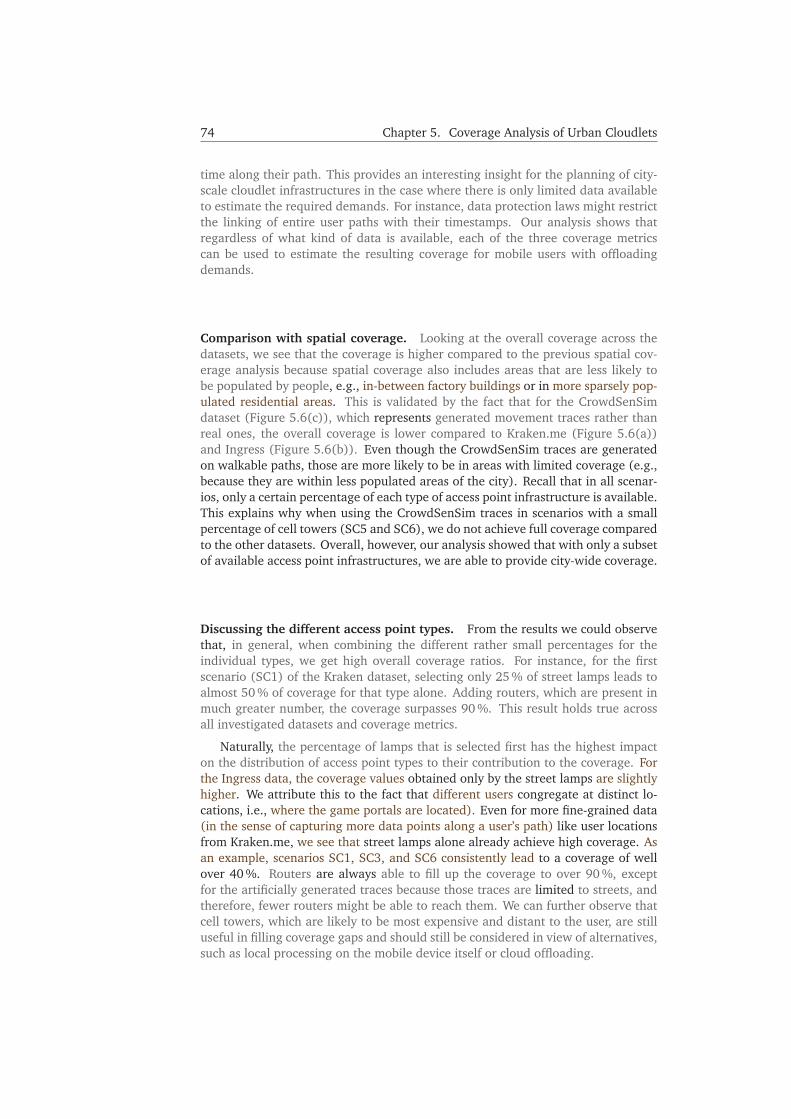
74 Chapter 5. Coverage Analysis of Urban Cloudlets
time along their path. This provides an interesting insight for the planning of city-scale cloudlet infrastructures in the case where there is only limited data availableto estimate the required demands. For instance, data protection laws might restrictthe linking of entire user paths with their timestamps. Our analysis shows thatregardless of what kind of data is available, each of the three coverage metricscan be used to estimate the resulting coverage for mobile users with offloadingdemands.
Comparison with spatial coverage. Looking at the overall coverage across thedatasets, we see that the coverage is higher compared to the previous spatial cov-erage analysis because spatial coverage also includes areas that are less likely tobe populated by people, e.g., in-between factory buildings or in more sparsely pop-ulated residential areas. This is validated by the fact that for the CrowdSenSimdataset (Figure 5.6(c)), which represents generated movement traces rather thanreal ones, the overall coverage is lower compared to Kraken.me (Figure 5.6(a))and Ingress (Figure 5.6(b)). Even though the CrowdSenSim traces are generatedon walkable paths, those are more likely to be in areas with limited coverage (e.g.,because they are within less populated areas of the city). Recall that in all scenar-ios, only a certain percentage of each type of access point infrastructure is available.This explains why when using the CrowdSenSim traces in scenarios with a smallpercentage of cell towers (SC5 and SC6), we do not achieve full coverage comparedto the other datasets. Overall, however, our analysis showed that with only a subsetof available access point infrastructures, we are able to provide city-wide coverage.
Discussing the different access point types. From the results we could observethat, in general, when combining the different rather small percentages for theindividual types, we get high overall coverage ratios. For instance, for the firstscenario (SC1) of the Kraken dataset, selecting only 25 % of street lamps leads toalmost 50 % of coverage for that type alone. Adding routers, which are present inmuch greater number, the coverage surpasses 90 %. This result holds true acrossall investigated datasets and coverage metrics.
Naturally, the percentage of lamps that is selected first has the highest impacton the distribution of access point types to their contribution to the coverage. Forthe Ingress data, the coverage values obtained only by the street lamps are slightlyhigher. We attribute this to the fact that different users congregate at distinct lo-cations, i.e., where the game portals are located). Even for more fine-grained data(in the sense of capturing more data points along a user’s path) like user locationsfrom Kraken.me, we see that street lamps alone already achieve high coverage. Asan example, scenarios SC1, SC3, and SC6 consistently lead to a coverage of wellover 40 %. Routers are always able to fill up the coverage to over 90 %, exceptfor the artificially generated traces because those traces are limited to streets, andtherefore, fewer routers might be able to reach them. We can further observe thatcell towers, which are likely to be most expensive and distant to the user, are stilluseful in filling coverage gaps and should still be considered in view of alternatives,such as local processing on the mobile device itself or cloud offloading.

5.7. Conclusion 75
5.7 Conclusion
In this chapter, we have examined the question of whether it is feasible to upgradeexisting urban infrastructures to host cloudlets for a city-wide coverage. Specifi-cally, we proposed placing cloudlets in an urban space using existing access pointinfrastructures, namely, cell towers, routers, and street lamps. We described thecharacteristics of these different types of infrastructure and gathered a large datasetof real-world data for access point locations and mobility traces. To analyze the cov-erage of urban cloudlets, we used these datasets and defined four different metricsfor coverage. The results of this coverage analysis demonstrated that by using onlya relatively small subset of access points present on infrastructure to host cloudlets,we are able to achieve a city-wide cloudlet coverage.
This is especially true for the coverage analysis of the mobility traces, where mo-bile users are within the communication range of a cloudlet-enabled access pointmost of the time. The results of this analysis enable different stakeholders (e.g., mu-nicipalities and network operators) to estimate the number of cloudlets required toachieve a certain degree of coverage and hence, can serve as a planning tool for fu-ture deployments. For existing deployments, it can identify areas that lack coverage(globally or for individual access point types or application traces). The developedmethod can serve as a basis for future analysis based on other data. For instance,instead of a unit-disk communication range, more sophisticated models for wirelesssignal propagation could be used to obtain a more realistic coverage estimation. Asan example, for cell towers these models would come from measurements carriedout by the network operators. Today, unfortunately, this kind of data is hard toobtain for public usage due to confidentiality reasons.
Our analysis demonstrated the feasibility of leveraging urban cloudlets. It istherefore the basis to examine the placement, i.e., to answer the question whereexactly the cloudlets should be placed. In the following Chapter 6, we will addressprecisely this problem.


CHAPTER 6
Urban Cloudlet Placement
Chapter Outline6.1 Introduction and Problem Statement . . . . . . . . . . . . . 77
6.2 Related Work . . . . . . . . . . . . . . . . . . . . . . . . . . . . 78
6.3 System Model . . . . . . . . . . . . . . . . . . . . . . . . . . . 80
6.4 Placement Strategy . . . . . . . . . . . . . . . . . . . . . . . . 83
6.5 Evaluation . . . . . . . . . . . . . . . . . . . . . . . . . . . . . 86
6.6 Conclusion and Future Work . . . . . . . . . . . . . . . . . . 93
6.1 Introduction and Problem Statement
In the previous Chapter 5, we motivated the usage of existing urban infrastruc-tures for the placement of cloudlets. We showed that placing cloudlets on thoseinfrastructures can potentially achieve a high coverage. We demonstrated this withreal-world data and four different coverage metrics. Furthermore, the methodologywe presented can serve as a planning tool, e.g., to estimate the number of requiredaccess points for a certain percentage of coverage, or to identify uncovered areas.
However, the question remains of where to place those cloudlets, i.e., whichinfrastructure locations to equip with a cloudlet to serve the users’ demands. Up-grading every access point with a cloudlet may not be feasible economically, andhence, decisions to equip a subset of all available access points have to be made.This problem is challenging for two reasons. First, the costs and the quality of ser-vice form a natural tradeoff. The quality of service can, for instance, be modeledas the amount of offloading demands that can be served by cloudlets. Second, aswe have introduced in Section 5.2, the access point infrastructures we consider arehighly heterogeneous, making the placement problem challenging. This chapteraddresses this problem and proposes a strategy for the placement of heterogeneous
77
78 Chapter 6. Urban Cloudlet Placement
urban cloudlets. For the placement decision of cloudlets in this chapter, we considerheterogeneity in three aspects:
(i) COSTS | The different potential operators of a city cloudlet infrastructure andthe heterogeneous hardware that can be used for cloudlets will lead to dif-ferent cost structures and business models under which they operate. Ourproblem model (Section 6.3) accurately reflects the real-world economics ofsuch deployments by capturing both fixed and variable costs.
(ii) RESOURCES | Besides economic considerations, the physical environment ofthe access points dictate what type of cloudlet hardware can be placed ata given access point. This can range from small, embedded computers toserver-grade hardware comparable to data centers.
(iii) COMMUNICATION RANGE | The different types of wireless access technologieshave varying communication—and hence—coverage ranges. For instance,cell towers mounted on buildings have a higher coverage rate compared toWiFi routers.
After reviewing related work in Section 6.2, we define our system model forthe placement problem in Section 6.3. Following these definitions, this chapter willaddress the cloudlet placement problem by proposing a placement strategy (Sec-tion 6.4) that is suitable for the described heterogeneous scenario. The proposedstrategy runs in polynomial time and, hence, makes the problem tractable for largeinstances. Furthermore, it is able to trade the quality of service for costs, depend-ing on different underlying economic considerations. Using the same real-worlddata introduced in Section 5.4, we will show how our approach outperforms twobaseline strategies for placement (Section 6.5).
6.2 Related Work
Placing cloudlets on urban infrastructures faces the challenge of heterogeneity withregards to coverage, costs, and resources. In general, placement strategies canbe optimized towards different metrics, e.g., the overall costs, or how much userdemand can be served. In the scenario we outlined, placement strategies need toselect existing locations for the placement instead of defining an optimal location.This is because we want to reuse existing infrastructure in order to minimize costsincurred by building new access points.
While there is abundant research on the placement of (virtualized) computingresources, both for homogeneous environments like data centers [MPZ10; PY10]and in the context of cloudlets and Edge Computing (see Section 8.2), the ques-tion of where to place cloudlets on available urban infrastructures has rarely beenexamined. Because urban infrastructures are highly heterogeneous, most existingplacement strategies are unable to model the inherent tradeoffs (e.g., of costs versuscoverage) in such environments. Consequently, they are not able to make sensibleplacement decisions.
Cloudlet placement. Three works [Xu+15; Xu+16; JCL17] study the placementof cloudlets in wireless metropolitan area networks (WMANs) and jointly proposesolutions for the user-to-cloudlet allocation problem, but they do not consider the
6.2. Related Work 79
costs of cloudlets. Fan and Ansari [FA17] consider the costs for renting a hostingfacility and cloudlet servers but their model does not capture variable costs perrequest—a crucial decision factor for the placement, given that the infrastructureis owned and operated by different stakeholders with varying business models (seeSection 3.4). Similarly, Ren et al. [Ren+18] consider costs but assume that eachcloudlet is able to meet all request demands within a region. We argue that thisis not a realistic assumption, given the vast number of users and Edge Computingapplications in an urban setting.
Xu et al. [Xu+15; Xu+16] present a greedy heuristic to minimize the averageaccess delay of mobile users to a cloudlet. Ma et al. [Ma+17] operate on a similarmodel but use Particle Swarm Optimize (PSO) as a metaheuristic to outperformgreedy approaches. Jia et al. [JCL17] devise two algorithms to minimize the re-sponse time: Heaviest-AP First (HAF) and Density-Based Clustering (DBC). The for-mer places cloudlets on the access points where user workloads are the heaviest,while the latter places cloudlets according to user-dense regions.
The authors in [SBD18] analyze a large dataset of cell tower locations in theUS. Without considering the costs or computing resources, they investigate the dis-tance reduction to data centers when cell towers of a certain category—classifiedaccording to the estimated residential population—are upgraded with micro datacenters.
Yao et al. [Yao+17] investigate the cost-aware deployment of cloudlets that areheterogeneous with respect to costs and resource capacities. They adopt a greedystrategy that iteratively chooses cloudlets with the minimum unit cost of resources.Compared to our model, they make assumptions that we argue are not realistic, e.g.,that there is no spatial overlap in the deployment of cloudlets and that the entirearea is covered by access points. Even though the authors consider heterogeneouscloudlets, they are not linked to real-world infrastructure. In contrast, we considerthree different types of infrastructure, each with specific characteristics.
Usage of WiFi or cellular access points. Caselli et al. [CPS15] focus on the plan-ning of a cloudlet network that consists of cellular base stations only. Bulut et al.[BS13; BS16] have studied the deployment of WiFi access points; however, theyconsider only the access dimension and not the actual computations. This meansthat in their model, there is no capacity constraint for the placement of an accesspoint. Furthermore, the authors do not model the cost of the deployment and as-sume that access points can be freely placed—the latter assumption can also befound in [Yin+17]. Mohan et al. [Moh+18] follow a hybrid approach where exist-ing edge cloudlets are considered and new ones are freely placed. While the authorsconsider both WiFi and cellular access, they fail to model resource heterogeneity fordifferent types of cloudlets. In contrast to that, we assume that we cannot influencethe placement of the access points but instead have to choose a subset of the exist-ing ones while taking into account the costs of cloudlet placement. In [BS13], theauthors present a greedy algorithm for the access point placement that maximizesthe offloading ratio, i.e., how much overall offloading can be achieved. This met-ric is extended to consider the satisfaction of individual users in [BS16]. Besidesplacing access points in areas with high overall demand, the presented placementstrategy tries to enable offloading for each user equally.

80 Chapter 6. Urban Cloudlet Placement
Choosing the best access point. The work of Yang et al. [Yan+16] presents amethod to rank access points in order to determine on which access points cloudletsshould be placed. Their ranking function only considers the network features of theaccess point and ignores the cost dimension. Furthermore, the network model in-sufficiently reflects the characteristics of Edge Computing. For instance, the authorsconsider a metric of closeness centrality, defined as the average distance from an ac-cess point to all other access points. Zhao et al. [Zha+18e] also consider this metricbesides others. Given that ideally in edge deployments, the flow of data is limited tothe distance from the end device to the closest cloudlet and there is no dependencyon other computing resources, we believe this metric does not accurately representa placement utility in a typical Edge Computing scenario.
Summary. In conclusion, we could identify two major drawbacks of existingworks in the domain of cloudlet placement: (i) failing to capture the relevantdimensions of heterogeneity for urban cloudlets (i.e., fixed and variable costs,coverage, and available computing resources), and (ii) making assumptions thatare unrealistic for a real-world deployment (e.g., being able to freely place accesspoints). Furthermore, no previous works have used extensive real-world data toevaluate their findings. In contrast, we jointly use location data of urban infrastruc-ture and user traces captured from mobile applications (see Section 5.4) for theevaluation of our placement algorithm.
6.3 System Model
6.3.1 Basic Definitions
We consider a set AP = {ap1, . . . , apn} of n access points located in a 2-dimensionalplane. Each access point ap ∈ AP is of one type ti = T ype(ap), ti ∈ {t1, . . . , tn} andhas a unit-disk communication range of radius rap. Following our dataset of urbancloudlets (see Section 5.4.1), we use cellular base stations, WiFi routers, and smartstreet lamps as access point types in this chapter. If an access point is chosen to beupgraded to host a cloudlet, it can provide a certain amount of resources Rap, whichfor instance, can be modeled as the available CPU cycles of the cloudlet hardware.Our model reflects both fixed expenses and variable operational costs. This is acommon abstraction found in economics (often termed CAPEX1 and OPEX2). Indetail, we consider the following two costs:
(i) FIXED COSTS | A fixed cost of C F ixap occurs when an access point is upgraded.This could either be the cost of upgrading hardware or fixed costs for runningthe cloudlet for a certain amount of time, e.g., the costs for energy.
(ii) VARIABLE COSTS | Variable costs of CVarap occur per unit of computing re-sources used on the access point’s cloudlet.
We introduce a binary decision variable xap ∈ {0, 1} to model the placement ofcloudlets on access points. xap = 1 if a cloudlet is placed on access point ap ∈AP, 0 otherwise. From the mobility traces, we have m user locations, denoted asU = {u1, . . . , um}. Each user requests a workload wu. We further define d(ap, u)
1capital expenditures2operational expenditures

6.3. System Model 81
as the Euclidean distance between an access point ap and a user location u. Wecharacterize the association of a user to a cloudlet-enabled access point by yu,ap ∈{0, 1}. If user u offloads the computations to a cloudlet present at access point ap,yu,ap = 1, otherwise yu,ap = 0.
A placement p is therefore defined as the assignment of the variables xap andyu,ap. We denote all possible placements with �. Our placement algorithm deter-mines a placement for a fixed number of K cloudlets that are given as input, i.e.,
∑ap∈AP
xap = K , K ∈ �. (6.1)
Placements are subject to a number of constraints. Obviously, users can only makeuse of a cloudlet at an access point if they are within its communication range andthe access point has been equipped with a cloudlet, hence,
d(ap, u)≤ rap∀u ∈ U ,∀ap ∈ AP : yu,ap = 1 (6.2)
andxap ≥ yu,ap∀u ∈ U ,∀ap ∈ AP. (6.3)
We further assume that user demands cannot be fragmented. We make this as-sumption because fragmenting demands may result in other overhead, such as syn-chronization between the cloudlets, if parts of the same application are offloadedto more than one cloudlet. Hence, as a simplification, all workload demand fromone user is offloaded to exactly one cloudlet and cannot be divided:
∑ap∈AP
yu,ap = 1,∀u ∈ U (6.4)
Placement decisions also need to consider the resource constraints on the cloudlets.Because user-to-cloudlet assignments should not overload the cloudlet, we have
∑u∈U
yu,ap ·wu ≤ Rap,∀ap ∈ AP. (6.5)
To evaluate how good a placement decision is, we take into account two factors:the costs and the overall quality of service. Costs include the fixed cost for deployinga cloudlet as well as the variable cost for each unit of resources that is offloaded.Hence, the total costs of a placement can be formulated as
C(p) =∑
ap∈AP
C F ixap · xap
︸ ︷︷ ︸F ixed Costs
+∑
ap∈AP
∑u∈U
yu,ap · CVarap ·wu
︸ ︷︷ ︸Variable Costs
. (6.6)
We model the quality of service as the ratio of how much user demand can beoffloaded to the cloudlets, i.e.,
Q(p) =
∑u∈U
∑ap∈AP yu,ap
m. (6.7)
Compared with our previously introduced definitions of coverage (see Section 5.5),this is a variant of point coverage. However, for a point to be covered, in addition
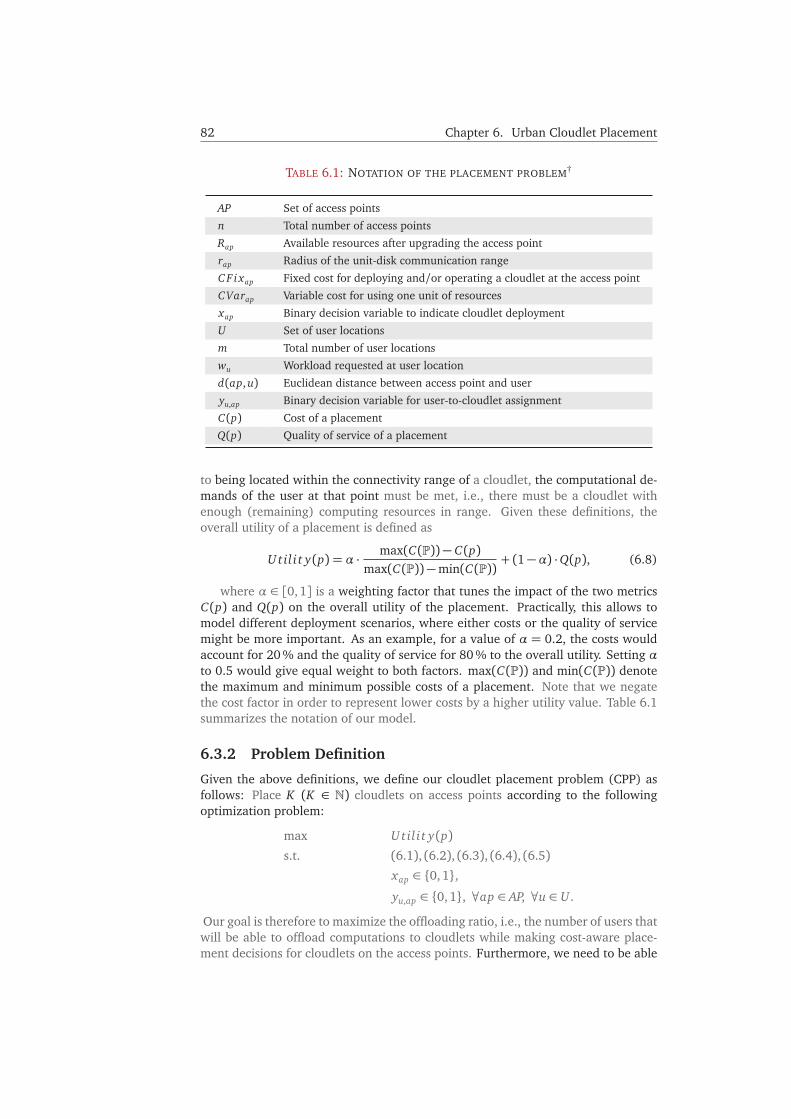
82 Chapter 6. Urban Cloudlet Placement
TABLE 6.1: NOTATION OF THE PLACEMENT PROBLEM†
AP Set of access points
n Total number of access points
Rap Available resources after upgrading the access point
rap Radius of the unit-disk communication range
C F ixap Fixed cost for deploying and/or operating a cloudlet at the access point
CVarap Variable cost for using one unit of resources
xap Binary decision variable to indicate cloudlet deployment
U Set of user locations
m Total number of user locations
wu Workload requested at user location
d(ap, u) Euclidean distance between access point and user
yu,ap Binary decision variable for user-to-cloudlet assignment
C(p) Cost of a placement
Q(p) Quality of service of a placement
to being located within the connectivity range of a cloudlet, the computational de-mands of the user at that point must be met, i.e., there must be a cloudlet withenough (remaining) computing resources in range. Given these definitions, theoverall utility of a placement is defined as
U til i t y(p) = α · max(C(�))− C(p)max(C(�))−min(C(�)) + (1−α) ·Q(p), (6.8)
where α ∈ [0,1] is a weighting factor that tunes the impact of the two metricsC(p) and Q(p) on the overall utility of the placement. Practically, this allows tomodel different deployment scenarios, where either costs or the quality of servicemight be more important. As an example, for a value of α = 0.2, the costs wouldaccount for 20 % and the quality of service for 80 % to the overall utility. Setting αto 0.5 would give equal weight to both factors. max(C(�)) and min(C(�)) denotethe maximum and minimum possible costs of a placement. Note that we negatethe cost factor in order to represent lower costs by a higher utility value. Table 6.1summarizes the notation of our model.
6.3.2 Problem Definition
Given the above definitions, we define our cloudlet placement problem (CPP) asfollows: Place K (K ∈ �) cloudlets on access points according to the followingoptimization problem:
max U til i t y(p)s.t. (6.1), (6.2), (6.3), (6.4), (6.5)
xap ∈ {0, 1},yu,ap ∈ {0, 1}, ∀ap ∈ AP, ∀u ∈ U .
Our goal is therefore to maximize the offloading ratio, i.e., the number of users thatwill be able to offload computations to cloudlets while making cost-aware place-ment decisions for cloudlets on the access points. Furthermore, we need to be able

6.4. Placement Strategy 83
to compute placements for large problem instances. However, doing so is not prac-tically feasible if we want to find the optimal solution for the CPP. We can model theCPP as a combination of two well-known problems: The Metric Facility Location andk-Median problem. The metric facility location problem describes the problem offinding a minimum-cost solution for opening facilities that are connected to cities.Costs occur for opening a facility and for the connection of a facility to a city. The k-median problem is a variation in which there are no costs for opening a facility andthe number of opened facilities is upper-bounded by k. Jain and Vazirani [JV01]have shown that these problems are NP-hard. By setting cities to be users and facil-ities the cloudlets that need to be placed, we can construct an equivalent problem.The costs for opening a facility translate to the fixed costs for placing a cloudlet onan access point, while the costs for connecting a facility to a city can be mapped tothe variable costs that have to be paid for processing user demands at the cloudlet.Hence, we can conclude that the CPP is also NP-hard. We will show in Section 6.4.1that nonetheless, our proposed approach finds a solution in polynomial time.
6.4 Placement Strategy
To make the cloudlet placement problem more tractable, we propose GSCORE (Grid-Score), a cloudlet placement algorithm described in this section. The main idea ofGSCORE is to perform cloudlet placement locally instead of on a global scale. To doso, we consider placement decisions on the level of grid cells, which divide the entirearea. Grid cells may contain several access points on which cloudlets can be placed.Depending on the size of the grid cell, the communication range of an access pointmight span over multiple grid cells. Furthermore, to reduce complexity, we consideronly aggregated demands in each grid cell, i.e., the sum of all user demands.
We divide the area to be covered by cloudlets into grid cells G = {g1, . . . , g j}with uniform edge length gs. Based on the user locations and the request size ofeach user, we can then compute the total size of the requests per grid wg =
∑wu
for every user u located in that grid cell. Figure 6.1 shows an example of an areain the city that is divided into 9 grid cells g1, . . . , g9 (|G| = 9). It illustrates work-loads w1, . . . , w4, represented by data points of user locations in that grid cell. Inreal-world deployments, the request sizes of the grids might be determined by mea-surements from network providers that are able to estimate the number of users andthe offloading traffic they generate. Our algorithm operates solely on the knowl-edge of the individual grid cells. For each grid cell, a local decision is made to placea certain number of cloudlets on the available access points in that grid cell. First,we make a decision on where to place cloudlets and later assign the individual userrequests to the cloudlets to evaluate the system utility as defined earlier.
(i) CLOUDLET PLACEMENT | The pseudocode of GSCORE is shown in Algorithm 1.Its main loop iterates over the grid cells until the desired number K ofcloudlets have been placed (lines 1–27). The cells are traversed in decreas-ing order of request sizes, i.e., we begin with the cells that have the highestrequest sizes wg (line 2). Next, for each of the access points located in thatcell, a score is computed (lines 4–12). The score reflects the tradeoff betweencost considerations and quality of service. A cost-to-resource ratio cr (line5) is computed and a cost factor f actorcr (line 8) normalizes the costs-to-resource ratio, taking into account the maximum and minimum cr values of
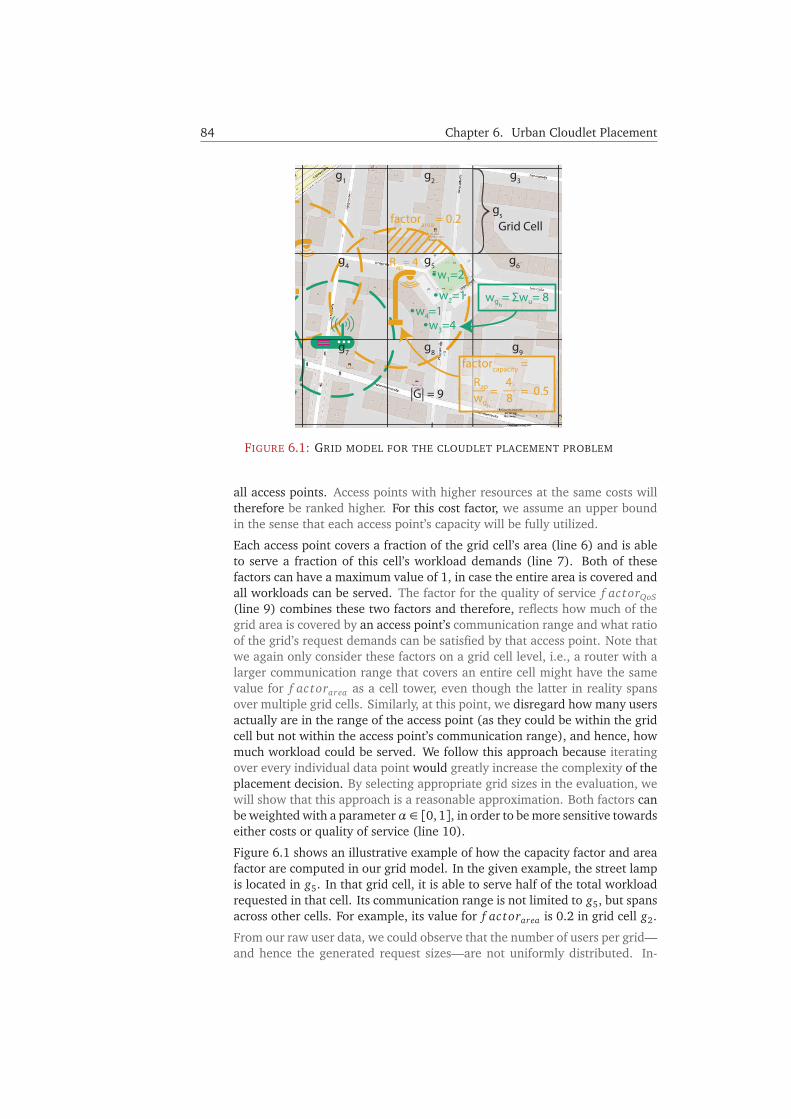
84 Chapter 6. Urban Cloudlet Placement
g1
g4 g6g5
g3
g8 g9g7
g2
gs
• w1=2
• w2=1
• w3=4• w4=1
factorarea = 0.2 Grid Cell
|G| = 9
Rap= 4
factorcapacity =
Rap 4— = — = 0.5wgh 8
wgh= Σwu= 8
FIGURE 6.1: GRID MODEL FOR THE CLOUDLET PLACEMENT PROBLEM
all access points. Access points with higher resources at the same costs willtherefore be ranked higher. For this cost factor, we assume an upper boundin the sense that each access point’s capacity will be fully utilized.
Each access point covers a fraction of the grid cell’s area (line 6) and is ableto serve a fraction of this cell’s workload demands (line 7). Both of thesefactors can have a maximum value of 1, in case the entire area is covered andall workloads can be served. The factor for the quality of service f actorQoS(line 9) combines these two factors and therefore, reflects how much of thegrid area is covered by an access point’s communication range and what ratioof the grid’s request demands can be satisfied by that access point. Note thatwe again only consider these factors on a grid cell level, i.e., a router with alarger communication range that covers an entire cell might have the samevalue for f actorarea as a cell tower, even though the latter in reality spansover multiple grid cells. Similarly, at this point, we disregard how many usersactually are in the range of the access point (as they could be within the gridcell but not within the access point’s communication range), and hence, howmuch workload could be served. We follow this approach because iteratingover every individual data point would greatly increase the complexity of theplacement decision. By selecting appropriate grid sizes in the evaluation, wewill show that this approach is a reasonable approximation. Both factors canbe weighted with a parameterα ∈ [0,1], in order to be more sensitive towardseither costs or quality of service (line 10).
Figure 6.1 shows an illustrative example of how the capacity factor and areafactor are computed in our grid model. In the given example, the street lampis located in g5. In that grid cell, it is able to serve half of the total workloadrequested in that cell. Its communication range is not limited to g5, but spansacross other cells. For example, its value for f actorarea is 0.2 in grid cell g2.
From our raw user data, we could observe that the number of users per grid—and hence the generated request sizes—are not uniformly distributed. In-

6.4. Placement Strategy 85
Algorithm 1 GSCORE †
1: while∑n
i=0 xi < K do
2: gh ← G.getHighestRequestSize()3: S = �4: for ap ∈ AP located in gh do
5: cr ← C F ixap+CVarap ·Rap
Rap
6: f actorarea ← |A(ap)∩A(gh)||A(gh)|7: f actorcapaci t y ← Rap
wgh
8: f actorcr ← max(cr)−crmax(cr)−min(cr)
9: f actorQoS ← f actorarea+ f actorcapaci t y
2
10: scoreap ← α · f actorcr + (1−α) · f actorQoS
11: S ← S ∪ {scoreap}12: end for13: n← �ln(wgh
wg) + ln(gs) +
K|G| �
14: placedCap ← 015: for k ∈ [0, numToPlace] do16: scoreap ← max(S)17: xap = 118: placedCap ← placedCap+ Rap19: S ← S \ {scoreap}20: AP ← AP \ {ap}21: end for22: if (wgh
− placedCap)> 2 · wg then23: wgh
← wgh− (placedCap · ln(wgh
))24: else25: wgh
← wgh− placedCap
26: end if27: end while
stead, we see few grid cells with substantially higher request sizes than theaverage. This will result in many access points being placed in those cells,even if they are not enough to satisfy the total user demands of that grid. Atthe same time, this reduces the number of (potentially more cost-effective)access points that could be placed for satisfying a larger offloading ratio inother grids. To mitigate this behavior, we compute the number of cloudletsto be placed in a grid cell, as shown in line 13 by the variable n. This for-mula normalizes the impact of cells with exceptionally high request sizes bytaking ln(
wghwg). This normalization factor was determined empirically, given
the distribution of requests across the grid cells. Note that this factor can beadapted to other datasets with different request patterns. However, we arguethat in practice, it is in general realistic to assume non-uniform request sizesacross grid cells, due to, e.g., users congregating at popular public places. Inaddition, we also factor in the size of the grid cell (in the sense that we allowmore cloudlets to be placed in larger grids) and the ratio of K to the number of

86 Chapter 6. Urban Cloudlet Placement
grid cells. According to this function, the corresponding number of cloudletswith the highest scores will be added to the grid cell (lines 15–21).
After having placed the corresponding number of cloudlets in a grid cell, itsworkload demand is adjusted in the following way: We assume each cloudletwill be used to full capacity. In addition, we again take into account the char-acteristics of the request size distribution to ensure that grid cells containinga smaller workload will also be iterated over. Hence, if the workload of agrid remains larger than two times the average workload (line 22), we adjustthe new workload request estimation of the grid by multiplying the placedcapacity of the cloudlets with the logarithm of the original request demand(line 23). Similar to the normalization factor for the number of access pointsto choose in line 13, we determined this value empirically.
(ii) USER-TO-CLOUDLET ASSIGNMENT | To compute the utility value (see Equa-tion (6.8)), we now assign the requests of individual users with the followingstrategy: since the fixed costs have already been determined by the place-ment strategy, for each request, we choose the cloudlet with the lowest vari-able costs per resource unit that is within the range of the user. Note thatfor future work, other more sophisticated strategies could be used (see Sec-tion 6.6).
6.4.1 Complexity Considerations
In Section 6.3.2, we stated that the CPP is NP-hard. Contrary to that, our proposedplacement strategy runs in polynomial time. The outer while-loop (lines 1–27) runsat most K-times. Within each iteration of the loop, we have to traverse the entireset of (remaining) access points to compute the score for the placement candidates(lines 4–12), giving a total (worst case) complexity of O(|AP|). In addition, thesecond inner loop (lines 15–21) runs n-times. All other operations within the loopsrun in constant time O(1). This also applies to the selection condition in line 4 thatincludes only access points located in the grid gh. Spatial indices in the database canbe used to retrieve access points that are within a geographic region in linear time[Ngu09]. Hence, the total time complexity of GSCORE is given as O(K · (|AP|+ n)).
6.5 Evaluation
6.5.1 Setup
We built a simulation tool in the Ruby programming language to evaluate our place-ment strategy. We use the filtered data for access point locations and user locationsas described in Section 5.4. We use the values listed in Table 6.2 as our experimentalsettings for the modeling of access point attributes. The values reflect the hetero-geneity of our access point infrastructure and different deployment characteristics.It is important to note that even within one type of access point, we consider thevalues for the communication range, resources, and costs to be variable. The onlyexception are the costs for using street lamps, which we assume to be fixed be-cause they are operated by a single stakeholder, the municipality (see Table 5.1).Section 5.2 detailed how the different types of cloudlets are able to host varyingcomputing resources according to the physical space and deployment models. In

6.5. Evaluation 87
TABLE 6.2: EVALUATION PARAMETERS†
Cellular Routers Street lamps
base stations
Communication randomrandom (10,70) random (20,80)
range (m) (300,1000)
randomResources
(2000,5000)random(5,100) random(5,50)
Fixed costrandom
random(1,100) 100(1000, 10 000)
Variable cost random(5,10) random(1,5) 1
Section 5.6.2, we have furthermore investigated sensible values for the communi-cation range of different types of cloudlets. From these considerations we derivethe values for the communication range and resources listed in Table 6.2.
To model the workload that users want to offload, we take the data points fromall three datasets presented in Section 5.4.2. Even though they were captured overa period of time, for the evaluation, we assume they jointly represent demand spotsof mobile users throughout the city at a single point in time. This simplification al-lows us to generate sufficient demands, since we only have a limited number of datapoints. Each data point is assigned a requested workload of 1 or 2 units. We conductour experiments with two different grid cell sizes of 50 meters and 100 meters fortheir edge lengths. Heatmaps of these two setups that visualize the total number ofrequests per grids are shown in Figures 6.2(a) and 6.2(b). Darker red squares rep-resent grid cells with high demands, while blue ones are areas with low demands.As the access point locations, we use the dataset presented in Section 5.4.1.
We compare our placement approach with two alternative strategies for cloudletplacement, one that randomly selects cloudlet locations and one that solely op-timizes costs. Both of these strategies do not operate on grids, but make globaldecisions for the placement.
Random (RND): This approach randomly selects K access points where cloudletsare placed on. Obviously, the distribution of the K selected access points withrespect to their type will follow the one of the dataset, meaning that we willhave few expensive locations (i.e., cell towers), and a high number of routersand street lamps. They will however not necessarily be located in areas wherethe coverage has a high impact on the QoS, i.e., areas with a large number ofusers. Instead, cloudlets are likely to be spread evenly throughout the city.
Greedy Cost-Aware (GC): This strategy tries to minimize the overall costs by iter-atively selecting the access points with the lowest overall costs, defined as thesum of fixed and variable costs, assuming the placed cloudlet will be used tofull capacity. Similar to RND, this will disregard the geographic distributionof user workloads and might penalize choices that have higher costs but agood costs-to-resource ratio. We therefore expect this approach to performworse than RND in terms of the delivered quality of service. However, for verycost-restricted deployment models, this will lead to the insight of how muchoffloading is possible.

88 Chapter 6. Urban Cloudlet Placement
(a) Grid cell size of 50m (b) Grid cell size of 100m
FIGURE 6.2: GRID CELL SIZES FOR EVALUATION†
6.5.2 Results
Figures 6.3 and 6.4 display the results of our placement strategy for grid cell sizesof 50 m and 100 m, respectively. For each grid cell size, we evaluate the placementstrategies with values 0.2, 0.5, and 0.8 for α. Recall that α= 0.5 equally weighs thefactors for costs and quality of service in the overall utility, while lower values of αput more emphasis on the quality of service and vice-versa. For K , we use valuesfrom 1000 to 30 000. Recall that the total number of access points is about 37 000,hence, our evaluation aims to cover a reasonable range from upgrading very fewup to nearly all access points. Besides the overall utility, the plots include the twocomponents of the utility function, i.e., the values for the costs and QoS. As definedin Equation (6.8), higher values denote lower costs and better QoS.
Overall, we see that our proposed GSCORE algorithm surpasses RND and GC ineach evaluated scenario for both the overall utility and the QoS part of the utilityfunction. Even though barely visible in the graphs, GSCORE leads to a very small in-crease in the cost factor (in most cases around 1–2%) compared to the other strate-gies. However, the gain in terms of QoS when using GSCORE to place cloudlets ismuch higher. Take as an example the results for K = 10000 and α = 0.2. Irre-spective of the grid size, GSCORE achieves a QoS value that is three times highercompared to GC. Therefore, the essential benefit that GSCORE provides is that ittrades a small fraction of cost increase for a much greater increase in the quality ofservice. Consequently, for smaller values of α, the gain in the overall utility whenusing GSCORE is higher. Since it takes into account the values of α for the scoring,GSCORE can be tuned to adapt to different deployment and business models forcloudlets.
Regarding the different grid cell sizes, we observe only a small difference be-tween sizes of 50 m and 100 m. For 50 m, GSCORE gains a little in the overall utility.This is because smaller grid cells allow for a more accurate placement decision,since an access point located within a grid cell is likely to cover more of the areaof that cell. Compared to larger cells, this leads to less cases where an access pointis chosen that only covers a fraction of the cell’s area, and, consequently, is able toserve fewer users. However, smaller grid sizes result in iterating over more grids,
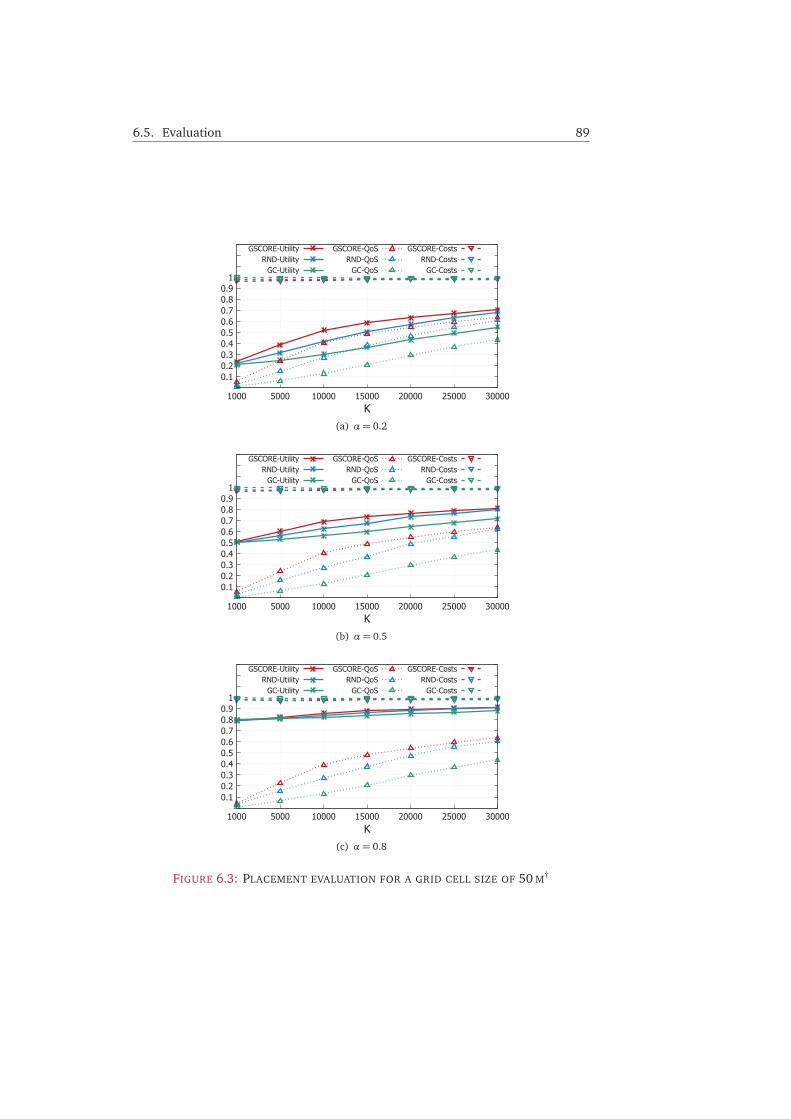
6.5. Evaluation 89
0.1 0.2 0.3 0.4 0.5 0.6 0.7 0.8 0.9
1
1000 5000 10000 15000 20000 25000 30000K
GSCORE-UtilityRND-Utility
GC-Utility
GSCORE-QoSRND-QoS
GC-QoS
GSCORE-CostsRND-Costs
GC-Costs
(a) α= 0.2
0.1 0.2 0.3 0.4 0.5 0.6 0.7 0.8 0.9
1
1000 5000 10000 15000 20000 25000 30000K
GSCORE-UtilityRND-Utility
GC-Utility
GSCORE-QoSRND-QoS
GC-QoS
GSCORE-CostsRND-Costs
GC-Costs
(b) α= 0.5
0.1 0.2 0.3 0.4 0.5 0.6 0.7 0.8 0.9
1
1000 5000 10000 15000 20000 25000 30000K
GSCORE-UtilityRND-Utility
GC-Utility
GSCORE-QoSRND-QoS
GC-QoS
GSCORE-CostsRND-Costs
GC-Costs
(c) α= 0.8
FIGURE 6.3: PLACEMENT EVALUATION FOR A GRID CELL SIZE OF 50 M†

90 Chapter 6. Urban Cloudlet Placement
0.1 0.2 0.3 0.4 0.5 0.6 0.7 0.8 0.9
1
1000 5000 10000 15000 20000 25000 30000K
GSCORE-UtilityRND-Utility
GC-Utility
GSCORE-QoSRND-QoS
GC-QoS
GSCORE-CostsRND-Costs
GC-Costs
(a) α= 0.2
0.1 0.2 0.3 0.4 0.5 0.6 0.7 0.8 0.9
1
1000 5000 10000 15000 20000 25000 30000K
GSCORE-UtilityRND-Utility
GC-Utility
GSCORE-QoSRND-QoS
GC-QoS
GSCORE-CostsRND-Costs
GC-Costs
(b) α= 0.5
0.1 0.2 0.3 0.4 0.5 0.6 0.7 0.8 0.9
1
1000 5000 10000 15000 20000 25000 30000K
GSCORE-UtilityRND-Utility
GC-Utility
GSCORE-QoSRND-QoS
GC-QoS
GSCORE-CostsRND-Costs
GC-Costs
(c) α= 0.8
FIGURE 6.4: PLACEMENT EVALUATION FOR A GRID CELL SIZE OF 100 M†

6.5. Evaluation 91
and hence, a greater computational overhead to make the placement decision. Weleave the exploration of this tradeoff for future work and plan to further investigatehow other grid cell sizes perform.
As we can also see, for larger values of K , the difference between GSCORE andRND becomes smaller because with increasing K , there naturally is a greater overlapin the subset of the chosen access points. This can be seen in the result plots if welook at the results for K = 30000 and compare this value with the total number ofaccess points in the inner city boundary (37 648). The results for small values ofK (e.g., K = 1000) behave similarly. In that case, there is less overlap but so fewcloudlets selected such that not many user demands can be met, regardless of theplacement strategy. GSCORE performs best for input sizes between K = 5000 andK = 20 000 or in other words, between about 13 % and 53 % of all available accesspoints. We therefore believe this placement strategy can be viable in practice, sincein a real-world deployment, one would neither upgrade very few (because therewould be no substantial gain for users) nor nearly all access points (because ofpractical limitations in terms of costs). Furthermore, we argue that GSCORE wouldperform even better compared to RND if the environment is more heterogeneousthan in our evaluation setup, e.g., if cloudlets on street lamps are owned by differentoperators and therefore have different costs associated with them. Note that ournotion of placing K cloudlets can easily be adapted to match other constraints, suchas the total costs. Instead of K denoting the number of access points, K could forexample model the maximum allowed fixed costs of the deployment.
6.5.3 Discussion
1000 5000 10000 15000 20000 25000 30000
(Q(p
)*) /
C(p
)
K
= 0.5 = 0.2
= 0.5 = 0.2
gs = 100m gs = 50m
FIGURE 6.5: CHOOSING K BY QUALITY-TO-COST RATIO†
To further investigate practical insights on how to choose a suitable K , we ana-lyze the quality-to-cost ratio for different values of K . Instead of using the normal-ized utility (see Equation (6.8)), we consider the absolute costs C(p) and for thequality of service, we weight the absolute workload values by our QoS part of theutility. Hence, the ratio is given as
Q(p) ·∑wu
C(p)(6.10)
The reason for considering the absolute costs in this analysis is to give insightson suitable values of K under real-world constraints, e.g., a fixed budget. Figure 6.5plots the value for this ratio for different values of K . For this analysis, we use the
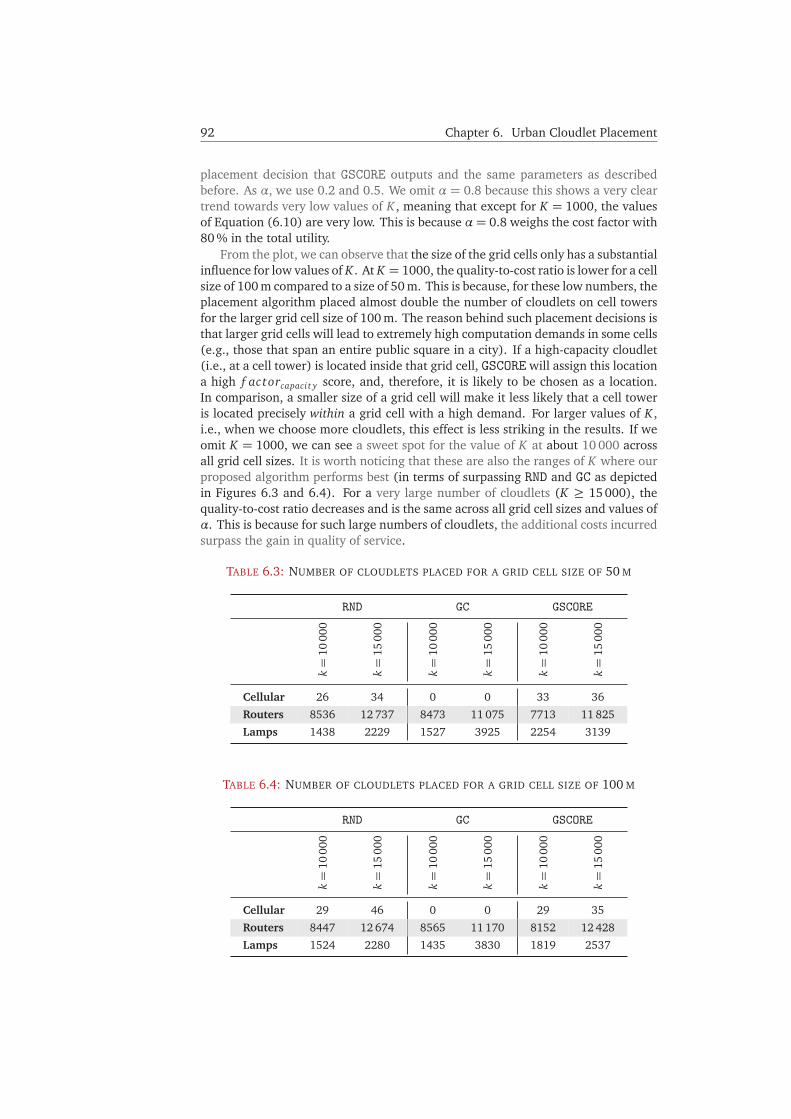
92 Chapter 6. Urban Cloudlet Placement
placement decision that GSCORE outputs and the same parameters as describedbefore. As α, we use 0.2 and 0.5. We omit α = 0.8 because this shows a very cleartrend towards very low values of K , meaning that except for K = 1000, the valuesof Equation (6.10) are very low. This is because α = 0.8 weighs the cost factor with80 % in the total utility.
From the plot, we can observe that the size of the grid cells only has a substantialinfluence for low values of K . At K = 1000, the quality-to-cost ratio is lower for a cellsize of 100 m compared to a size of 50 m. This is because, for these low numbers, theplacement algorithm placed almost double the number of cloudlets on cell towersfor the larger grid cell size of 100 m. The reason behind such placement decisions isthat larger grid cells will lead to extremely high computation demands in some cells(e.g., those that span an entire public square in a city). If a high-capacity cloudlet(i.e., at a cell tower) is located inside that grid cell, GSCORE will assign this locationa high f actorcapaci t y score, and, therefore, it is likely to be chosen as a location.In comparison, a smaller size of a grid cell will make it less likely that a cell toweris located precisely within a grid cell with a high demand. For larger values of K ,i.e., when we choose more cloudlets, this effect is less striking in the results. If weomit K = 1000, we can see a sweet spot for the value of K at about 10 000 acrossall grid cell sizes. It is worth noticing that these are also the ranges of K where ourproposed algorithm performs best (in terms of surpassing RND and GC as depictedin Figures 6.3 and 6.4). For a very large number of cloudlets (K ≥ 15000), thequality-to-cost ratio decreases and is the same across all grid cell sizes and values ofα. This is because for such large numbers of cloudlets, the additional costs incurredsurpass the gain in quality of service.
TABLE 6.3: NUMBER OF CLOUDLETS PLACED FOR A GRID CELL SIZE OF 50 M
RND GC GSCORE
k=
1000
0
k=
1500
0
k=
1000
0
k=
1500
0
k=
1000
0
k=
1500
0
Cellular 26 34 0 0 33 36
Routers 8536 12 737 8473 11 075 7713 11 825
Lamps 1438 2229 1527 3925 2254 3139
TABLE 6.4: NUMBER OF CLOUDLETS PLACED FOR A GRID CELL SIZE OF 100 M
RND GC GSCORE
k=
1000
0
k=
1500
0
k=
1000
0
k=
1500
0
k=
1000
0
k=
1500
0
Cellular 29 46 0 0 29 35
Routers 8447 12 674 8565 11 170 8152 12 428
Lamps 1524 2280 1435 3830 1819 2537
6.6. Conclusion and Future Work 93
Lastly, we look at how the placement strategies differ with regards to the numberof cloudlets placed on each type of access point. We investigate this for values of K =10 000 and K = 15000, the two K that lead to good quality-to-cost ratios for bothgrid cell sizes. Tables 6.3 and 6.4 show the numbers of placements for grid cell sizesof 50 m and 100 m, respectively. Obviously, for RND, the distribution of cloudlets onthe three types follows exactly the distribution of available access points (compareTable 5.2). We see that GC always avoids placing cloudlets on cell towers, due totheir high cost. Compared to RND, GSCORE places more cloudlets on cell towers, inorder to increase the quality of service. Note that if we would drastically increasethe user demands, this would increase the number of cloudlets placed cell towers,since cloudlets on routers and lamps would not be able to cope with the demands.Across both grid cell sizes, we further observe that for K = 10000, GSCORE placesmore cloudlets on lamps and less on routers, compared to GC. The reason for this isthat for street lamps, we assume costs to be homogeneous, while for routers, thosevary (see Table 6.2). Similar to the placement decisions on cell towers, GSCOREagain trades a potential (small) increase in cost for greater improvement on thequality of service.
6.6 Conclusion and Future Work
In this chapter, we presented GSCORE, a placement algorithm to decide which urbanaccess point infrastructures to equip with cloudlets. We showed that GSCORE is ableto capture the heterogeneous characteristics of the urban cloudlet infrastructureand outperforms two baseline algorithms, RND and GC, while running in polynomialtime. It does so by making decisions on grid cells of fixed sizes and is able to tradea small portion of cost for a substantially higher gain in the number of users thatcan offload computations. This tradeoff can furthermore be adjusted to capturedifferent underlying business models and incentive mechanisms. We envision thefollowing possible directions for future work:
OTHER DIMENSIONS OF HETEROGENEITY | Besides cost, resources, and communi-cation ranges, future work could consider other dimensions for the hetero-geneity of access points, such as the available bandwidth or other networkproperties.
ASSIGNMENT OF USERS TO CLOUDLETS | In Section 5.5.1.a, we have shown thatusers might have connectivity to more than one cloudlet at a given location.In our placement strategy, we have assumed that user requests will be di-rected to the cheapest available cloudlet. However, other factors could beconsidered. For instance, users with high mobility could induce a frequentchange of cloudlets, leading to a high overhead when migrating data or com-putations.
DYNAMIC GRID CELL SIZES | Instead of uniform grid cell sizes, they could be varied,e.g., according to the workloads requested in the grid. This can serve thepurpose to further optimize the placement strategy. For instance, neighboringgrid cells with low demands could be merged to one, saving computation timefor the placement decision, while at the same time not having a large impacton the overall quality of service.

Part III
Control & Execution
Infrastructural Support
Control & Execution
Strategies & Adaptations
Part II examined the physical infrastructure for Edge Computing in anurban environment. On top of this infrastructure, we can now buildthe software platform for the execution of services at the edge. Sucha platform manages the resources provided by the physical infrastruc-ture, e.g., the cloudlets, and—through user-facing interfaces—receivesrequests for Edge Computing services and directs them to available re-sources.
In this part, we propose a control and execution framework for EdgeComputing that is based on the concept of composable microservices.Chapter 7 will present this framework and details a novel approachto computation offloading by onloading parts of applications througha microservice store. The evaluation shows how this approach enableslow-latency and energy-efficient execution of services at the edge.
95


CHAPTER 7
Edge Computing Framework1
Chapter Outline7.1 Introduction . . . . . . . . . . . . . . . . . . . . . . . . . . . . 97
7.2 Related Work . . . . . . . . . . . . . . . . . . . . . . . . . . . . 99
7.3 Microservice-Based Edge Onloading . . . . . . . . . . . . . . 103
7.4 Functional Concept . . . . . . . . . . . . . . . . . . . . . . . . 107
7.5 Implementation Details . . . . . . . . . . . . . . . . . . . . . 113
7.6 Evaluation . . . . . . . . . . . . . . . . . . . . . . . . . . . . . 117
7.7 Conclusion and Outlook . . . . . . . . . . . . . . . . . . . . . 126
7.1 Introduction
The preceding Part II of this thesis investigated the physical resources in an ur-ban environment that are necessary to perform Edge Computing. Because of themultitude of users and applications in the context of Urban Edge Computing, com-putations in the context of Urban Edge Computing should not run directly on thoseresources without an intermediate control and execution layer. Besides enablingmulti-tenancy of clients and applications, such a layer should be responsible formanaging resources and the lifecycle of applications at the edge. Most importantly,this includes mechanisms for clients to perform computation offloading, i.e., tomake parts of their applications available for remote execution. Furthermore, thecontrol layer makes runtime decisions, e.g., where to place computations based onavailable resources and application requirements.
There are many previous works that propose frameworks for computation of-floading, with varying granularity of the offloading units, e.g., the offloading of
1Parts of this chapter are verbatim copies from [Ged+19b]. Those text segments are printed in graycolor. Tables and figures taken or adapted from this publication are marked with † in their caption.
97
98 Chapter 7. Edge Computing Framework
methods [Cue+10], threads [Gor+12] or virtual machines [Shi+13]. Some aim atoffloading to cloud infrastructures [BGG19; Chu+11; Shi+14], while others specif-ically target Edge Computing [LWB16; Mor+17; Jia+19]. Other works focus on theoffloading decision itself [Che+16], or on security aspects [Bha+16].
Common to all of them is the tight coupling between mobile clients and theoffloading infrastructure with regards to the offloading units. Mobility of thoseoffloading units is realized by either (i) embedding the code and execution envi-ronments into virtual machines or containers that are transferred from the clientto the surrogates that execute them, or (ii) pre-provisioning the offloading units onthe surrogates. In the first case, this requires energy for the transmissions and thesetransfers add to the end-to-end latency, i.e., the time it takes from the service requestto return the result to the user. For devices like smartphones, both of these factorsare critical. Mobile users are often faced with unreliable, low-bandwidth mobilenetworks and limited battery life. Performing traditional offloading hence has anegative impact on these factors and thus affects the overall quality of experience.The second case—where offloadable units are pre-provisioned on the surrogate—ispractically infeasible in an Edge Computing environment, where we are faced withlimited resources on the surrogate and frequently changing demand patterns.
Many approaches that propose microservice-based execution environments fallshort in their efficiency when multiple microservices and users are involved. Morespecifically, many lack mechanisms for the definition and deployment of chainedmicroservices, i.e., a set of microservices that are executed subsequently. In addition,current approaches do not support the sharing of service instances between multipleusers and applications and therefore cannot use the overall resources efficiently.
In this chapter, we propose the novel concept of onloading functionality to edgesurrogates through a microservice store. The microservice store is a repository towhich developers can submit their code in the form of containerized applications.Onloading fetches services from this repository and transfers them to agents thatexecute them. This stands in contrast to client-based offloading, where client de-vices transfer the services. Our system performs onloading on a microservice-basedgranularity. Microservices are an increasingly popular software development pat-tern with many advantages, e.g., higher agility and flexibility in the developmentof individual services. Developers of edge applications can leverage externally de-veloped microservices from the microservice store as building blocks for their appli-cations. At runtime, the applications request the instantiation of microservices anddo not need to transfer code blocks and execution environments to the surrogate.Microservice instantiation can also be customized, e.g., by overriding the defaultlifetime of the service, and composed to form a chained execution of services. Mi-croservices in the store can therefore be thought of as a blueprint. We define sucha blueprint with the help of a common language for the orchestration of cloud ser-vices. Through the reuse of services for different applications, our approach alsoallows for a system-wide management of resources, e.g., by deciding which servicesare kept active, given request patterns from applications.
Orthogonal to existing frameworks for computation offloading, the concept ofServerless Computing has recently surfaced. While Serverless Computing partly re-moves the need for transferring code prior to its execution, it is mainly aimed atCloud Computing applications and therefore lacks many aspects that are beneficialin an Edge Computing environment, such as the sharing of function instances orfine-grained control over the placement decision.
In summary, this chapter makes the following contributions:
7.2. Related Work 99
• After reviewing related work in Section 7.2, we propose a programmingmodel for Edge Computing based on the concept of microservices (Sec-tion 7.3). The model allows developers the definition and composition ofedge-enabled applications. As an alternative to current offloading mecha-nisms, we propose a new mechanism for executing computations at the edge,coined store-based microservice onloading.
• We design the functional concept of a distributed Edge Computing frameworkthat integrates the abovementioned concepts (Section 7.4) and leverages acustomized repository for the provisioning of microservices, reducing expen-sive transfers from the client device to the surrogates.
• We realize our concepts in a prototype implementation called flexEdge (Sec-tion 7.5) and show the benefits w.r.t. end-to-end latency, energy savings onthe client device, and efficiency of the service chaining (Section 7.6).
7.2 Related Work
Our contributions presented in this chapter aim at providing an efficient mecha-nism (with regards to end-to-end latency and energy consumption on the client) tocarry out computations outside a client device. In addition, execution frameworksfor Edge Computing should follow a modular structure that allows the reuse of(i) application components, and (ii) running instances of those components acrossapplications. Such a reusable and modular structure is beneficial from the point ofview of developers (as it shortens the development time of edge-enabled applica-tions), and given the typically constrained resources at Edge Computing nodes. Inlight of these requirements, we review related work in the domains of computationoffloading (Section 7.2.1), microservices (Section 7.2.2), and Serverless Computing(Section 7.2.3).
7.2.1 Computation Offloading
Computation offloading is the process of remotely executing an application or partsof this application [Kum+13]. This concept is sometimes also referred to as cy-ber foraging [Bal+02]. As detailed in Section 3.5.1, computation offloading is animportant building block for Edge Computing, as it enables the carrying out of com-putations outside the end device.
Sharifi et al. [SKK12] review this general concept and summarize research chal-lenges. Balan and Flinn [BF17] argue that challenges like server setup and main-tenance are still not solved in current cyber foraging systems. We believe our ap-proach at least partly frees developers from these burdens, as our Edge Computingplatform is responsible for the instantiation and management of services. Othershave focused on the simplicity for the developer to adapt applications for offload-ing. For example, Balan et al. [Bal+07] present a domain-specific language for theeasy partitioning of applications.
According to Lewis et al. [Lew+14], three important questions need to be an-swered in computation offloading: what to offload, where to offload to, and whento offload. To these three well-established questions, we add a fourth by investi-gating how to offload, i.e., we propose an alternative to prevailing offloading mech-anisms. Flores et al. [Flo+15] analyze the different components of an offloading

100 Chapter 7. Edge Computing Framework
system (e.g., code profilers and decision engines) and the practical limitations ofcurrent offloading approaches (e.g., with regards to the postulated energy benefitfor mobile devices).
A variety of offloading frameworks have been proposed. Common to most ofthem is that code—and in some cases the entire execution environment—has to betransferred from the client device to the surrogate, e.g., as done in [KB10]. Sur-rogate is an umbrella term used for devices that execute code or applications onbehalf of others [SKK12]. Other works, e.g., Wu et al. [Wu+17b] focus only on theefficiency on the surrogate side and not from the point of view of the client device.Furthermore, contrary to our approach, not many approaches offer the possibilityfor seamless execution of service chains, i.e., executing services subsequently with-out transmitting intermediate results to the client or to a control entity. In somecases [Cue+10; Chu+11] chaining is only implicitly enabled by the decisions ofpartitioning mechanisms. Some works focus on the speedup that offloading canprovide [KYK12], while the main goal of others is to reduce the energy consump-tion [Cue+10; MN10], or the monetary cost in cloud offloading [Shi+14]. We canfurther distinguish offloading systems by the granularity in which applications orparts thereof are offloaded. Coarser-grained approaches offload entire virtual ma-chines [Shi+13; SF05], while finer-grained approaches offload code parts [Kos+12;Cue+10], functions [Mor+17], or threads [Gor+12; Chu+11].
Cuervo et al. [Cue+10] present MAUI, an offloading framework for mobilephones that focuses on the energy benefit of offloading. Offloadable parts of an ap-plication are defined by code annotations. These annotations are static and made bythe developer on a method-level granularity. Other works like CloudAware [OBL16]also require developer annotations for the offloading and operate on a method-level (e.g., ThinkAir by Kosta et al. [Kos+12]). We argue that annotations onsuch fine-grained units (e.g., single methods of applications) are cumbersome forthe developer. In contrast, our framework flexEdge only requires the developer torequest for a certain functionality provided by a microservice. Deploying applica-tions in MAUI has a large overhead because two versions of the application needto be deployed, one locally and one on the surrogate. At runtime, the executioncan then be switched between those two versions. This is done by an optimizationengine that decides which annotated methods are offloaded. Compared to that,we use microservices that do not need to be present in the client version of theapplication. MAUI is also less flexible in the sense that it only supports the .NETcommon language runtime.
In contrast to partitioning via manual annotations, CloneCloud [Chu+11] auto-matically partitions the application. Hence, the offloading decision is made withoutdeveloper involvement. A static analyzer identifies possible choices for code parts tobe migrated. Then, a dynamic profiler constructs possible execution trees with asso-ciated costs. An optimization solver then makes the offloading decision at runtime.CloneCloud supports only Java applications on the Dalvik VM. AIOLOS [Ver+12b]also works exclusively on the Dalvik VM. Similar to MAUI, CloneCloud requires acomplete clone VM on the surrogate. The application state has to be synchronizedbetween the VMs, adding to the overhead of this solution. Similarly, the work ofGordon et al. [Gor+12] that uses distributed shared memory for offloading requiressynchronization between endpoints. Besides only providing offloading function-ality, Thinkair [Kos+12] also supports the parallelization of tasks and automaticscaling across several VMs.
Similar to our proposed approach, some other works [LWB16; Mor+17; Bha+16]

7.2. Related Work 101
also employ a repository for offloadable parts that are then transferred to surro-gates. Paradrop [LWB16] is a platform for the dynamic orchestration of third-partyservices at the edge. Contrary to our work, the authors do however not consider theaspect of energy savings for the mobile device. CloudPath [Mor+17] is restrictedto stateless functions. Both Paradrop and CloudPath do not allow the chaining ofservices. The work of Bhardwaj et al. [Bha+16] focuses on the security aspect ofonloading.
Some previous works are restricted to a specific application domain, e.g.,Odessa [Ra+11] builds on top of an existing stream processing framework. Mazzaet al. [MTC17] present a concept for a cloud-based offloading mechanism for smartcity applications that jointly manages computation and communication resources.However, the authors provide no implementation details and evaluation of theproposed concept.
To summarize this section, Table 7.1 compares the most relevant existing ap-proaches for offloading. For each approach, we list the evaluation metrics they use,the granularity of offloading, which transfers or pre-provisionings are necessary,and whether service composition and instance reuse is supported. The bottom rowof the table also shows how our approach compares to the existing ones.
7.2.2 Microservices
Microservices are a way to develop and deploy software as independent parts, incontrast to monolithic software [Fow14]. It is widely recognized that this offersmany benefits regarding DevOps [BHJ16]; [KLT16]. The term DevOps summarizesdifferent practices that use agile methods in order to achieve short development cy-cles and automated delivery of software [Ebe+16]. Dragoni et al. [Dra+17] providea more in-depth introductory survey about the general concept of microservices.
Although the granularity of a microservice is not clearly defined [HAB17;HB16], microservices are typically characterized as small parts of an applicationwith limited responsibilities, often restricted to performing a single task. Since thoseparts are developed and maintained independently, the concept of microservicesallows for the reuse of components and supports multiple programming languagesacross the components of an application. Hence, developers can choose the mostappropriate programming language and set of tools for the individual task. Further-more, individual parts can be scaled more easily [Jam+18; Dra+18]. The conceptof developing applications as microservices also brings new challenges and con-cerns [TLP17; STH18], e.g., with regards to an increased operational complexityand testing efforts.
Microservices have been used in practice for applications in Cloud Computing[Vil+15a; Vil+16a], IoT [SLM17; BGT16], and smart cities [KJP15]. Our proposedEdge Computing framework operates on a microservice-level granularity. The sepa-ration of multiple offloadable parts has advantages in the context of Edge Comput-ing. For example, different application parts might have different resource require-ments that cannot be met by all edge surrogates. To support different programminglanguages, we require our microservices to be shipped as containers. This conceptof delivering microservices as containers had previously been suggested in [Sil16]and [Ala+18].
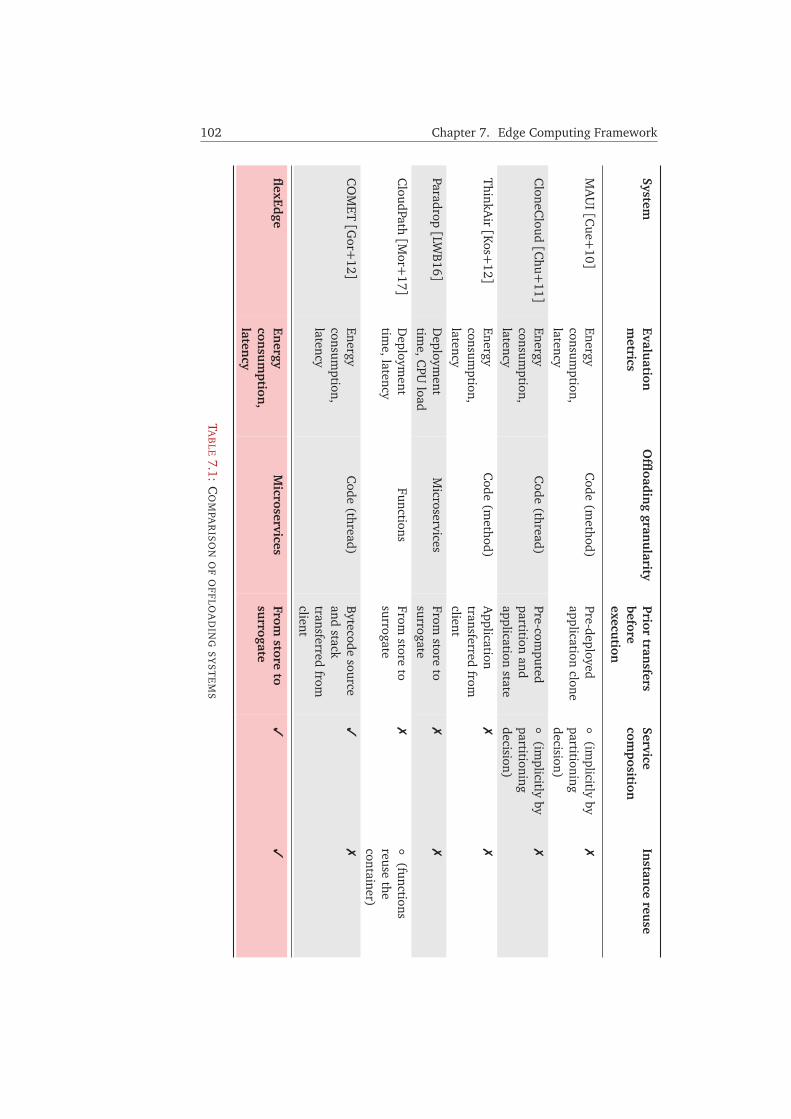
102 Chapter 7. Edge Computing FrameworkSystem
Evaluation
metrics
Offl
oading
granu
larityPrior
transfers
beforeexecu
tion
Servicecom
positionIn
stance
reuse
MA
UI[C
ue+10]
Energyconsum
ption,latency
Code
(method)
Pre-deployedapplication
clone◦
(implicitly
bypartitioningdecision)
�
CloneC
loud[C
hu+11]
Energyconsum
ption,latency
Code
(thread)Pre-com
putedpartition
andapplication
state
◦(im
plicitlyby
partitioningdecision)
�
ThinkAir[Kos+
12]Energyconsum
ption,latency
Code
(method)
Application
transferredfrom
client
��
Paradrop[LW
B16]
Deploym
enttim
e,CPU
loadM
icroservicesFrom
storeto
surrogate�
�
CloudPath
[Mor+
17]D
eployment
time,latency
FunctionsFrom
storeto
surrogate�
◦(functions
reusethe
container)
CO
MET[G
or+12]
Energyconsum
ption,latency
Code
(thread)B
ytecodesource
andstack
transferredfrom
client
��
flexEdge
Energy
consu
mption
,laten
cy
Microservices
Fromstore
tosu
rrogate�
�
TA
BLE
7.1:C
OM
PAR
ISO
NO
FO
FF
LOA
DIN
GS
YS
TE
MS

7.3. Microservice-Based Edge Onloading 103
7.2.3 Serverless Computing
Serverless Computing—sometimes called Function as a Service (FaaS)—is a deliv-ery model for computing services that—similar to our framework—automaticallymanages the provisioning, execution, and scaling of services [Bal+17]. These ser-vices are implemented as stateless functions and often referred to as lambda func-tions [Hen+16].
Serverless Computing is predominantly a way to deliver Cloud Computing ser-vices. This is reflected by various commercial offerings, such as Amazon’s AWSLambda2 or Google’s Cloud Functions3. Recently, Cicconetti et al. [CCP19] pro-posed a serverless platform that extends to the edge. However, they retain certaininefficient communication mechanisms, such as every request being passed througha dispatcher without direct client-to-surrogate communication. As of today, becauseof its scalability, Serverless Computing is mostly used for tasks that are massivelyparallel [Jon+17].
While Serverless Computing overlaps with our approach in the sense that code ismade available on the computing infrastructure prior to being requested, there aresome fundamental conceptual differences. For example, in Serverless Computingthere is no sharing of service instances across different users. Another differenceis that in current commercial offerings, users of Serverless Computing platformshave virtually no control over the underlying mechanisms from an operational per-spective. For example, the lifetime of the service instance is fixed by the serverlessprovider [Hel+19] and placements are agnostic towards dependencies on otherservices or data [Wan+18c]. Some serverless runtimes like Snafu [Spi17] do notconsider the chaining of functions and heterogeneity of the hardware on which theyare executed.
In contrast, our Edge Computing framework allows for a flexible definitionand adaptation (via monitoring of requests) of the instance’s lifetime (see Sec-tion 7.4.2.b). Furthermore, the placement decisions for data (see Chapter 9) andcomputations (see Chapter 8) we propose later in this thesis take into account theheterogeneity of Edge Computing hardware and networks.
7.3 Microservice-Based Edge Onloading
We envision edge-enabled applications to rely on a repository of microservices (themicroservice store) in order to avoid the (prior) transfer of code and execution en-vironments. Instead of prior transfers over potentially low-bandwidth connections,microservices are fetched from the microservice store, which is assumed to be well-connected to the controller. Figure 7.1 contrasts these two approaches of tradi-tional computation offloading (Figure 7.1(a)) versus our proposed approach (Fig-ure 7.1(b)).
Traditional offloading includes the transfer of the application logic and exe-cution environment in conjunction with the request of the client (step 1 in Fig-ure 7.1(a)). Note that instead of issuing the request to the controller, it could alsobe directed to an agent directly. This, however, does not impact the benefit of ourproposed approach. For a better comparison, the figure contrasts the cases whereboth approaches include a controller. Contrary to current offloading approaches,
2https://aws.amazon.com/lambda/ (accessed: 2020-03-05)3https://cloud.google.com/functions (accessed: 2020-03-05)

104 Chapter 7. Edge Computing Framework
Edge Agent
Client Controller
Edge Agent
. . .
(1) Service request
(2) Placement & instantiation of
service
(3) Return servicelocation
ce r
(a) Traditional offloading
Edge Agent
Client
MicroserviceStore
Controller
Edge Agent
. . .
(1) Service request
(2) Fetch service from store
(3) Placement & instantiation of service
(4) Return servicelocation
(b) Store-based onloading
FIGURE 7.1: COMPARISON OF APPROACHES
we propose the novel concept of store-based microservice onloading, with support forchained functions and for the sharing of service instances between multiple users.Similar to previous works [Esp+17; Bha+16], we define onloading as pulling a re-quested service from a backend and instantiating it on a target surrogate. In ourapproach (depicted in Figure 7.1(b)), a client first issues a request for a service (step1). Because we want to decouple the mobile device from the agents, requests formicroservices are sent to the controller. Contrary to the traditional approach, themicroservice is fetched from the store (step 2) and instantiated on an edge agent(step 3). Alternatively, the controller can omit the former two steps if the requestedservice is already running. The controller then forwards the service location (e.g.,the IP address and port number from which it can be accessed) to the client (step4). Details about the functioning of the individual steps will be described in moredetail in Section 7.4.
7.3.1 Microservice Definition and Structure
Our onloading units are microservices, i.e., independent parts of an application.These services carry out tasks that often are computationally intensive and that canbe composed into more complex applications. The functionality provided by a mi-croservice is not linked to a specific application and microservices are independentin the sense that they can be executed autonomously. From an operations point ofview, the individual services are developed and maintained independently from theapplications that use them.
In our system, a microservice is composed of its code and the metadata thatis required for the target execution environment (e.g., for building a container)and the management of the service by our Edge Computing framework. Both partsare packaged and shipped as a CSAR4 file, an established TOSCA standard for thepackaging of cloud services (see Explanation 7.1). Using this standard allows forthe integration of our microservices into other runtime environments, e.g., as pro-vided by the OpenTOSCA initiative5. Figure 7.2 shows an example of the unpacked
4Cloud Service Archive5https://www.opentosca.org/ (accessed: 2020-05-27)

7.3. Microservice-Based Edge Onloading 105
object_detection.zip
|-object_detection
|-decorators
|-object_detection
|-services
|-utils
|-app.py
|-Dockerfile
|-requirements.txt
|-object_detection.yaml
|-TOSCA-Metadata
|-TOSCA.meta
FIGURE 7.2: CSAR STRUCTURE FOR THE OBJECT DETECTION MICROSERVICE
file and folder structure of a microservice that performs object detection (see Sec-tion 7.5.1). Files and folders related to the microservice code are colored in brown,with the exception of the file that provides the entry point for the microservice exe-cution (app.py), colored in pink. In this example, we ship the service as a Dockercontainer and the two required files to build the container are colored in turquoise(Dockerfile and requirements.txt).
Files that contain metadata for our Edge Computing framework are shown inred. The file TOSCA.meta contains entry information for processing the file thatserves to describe the service (object_detection.yaml). For the description ofmicroservices, we extend the TOSCA standard.
EXPLANATION 7.1: TOSCA AND CSARThe Topology and Orchestration for Cloud Application (TOSCA) language is anOASIS (Organization for the Advancements of Structured Information Stan-dards) standard for the description of cloud services and applications. It allowsto model entities and their dependencies in YAML, a human-readable descrip-tion language. TOSCA furthermore describes a file format to package descrip-tions. These so-called CSAR files (Cloud Service Archive) are ZIP files thatcontain TOSCA description files, the service itself, and additional data.
Specifically, we use the TOSCA Simple Profile v1.16 as a basis. This standardfor service description is aimed at describing cloud services and, therefore, missesseveral properties that are relevant in the context of our Edge Computing frame-work. Specifically, we add properties that are required to make informed placementdecisions (e.g., by considering the resource requirements of services), manage thelifecycle of services (e.g., by specifying how long they should remain active andon which ports they run), and select the appropriate services (e.g., by defining thetypes of data they operate on). In summary, we add the following properties to theTOSCA standard for the description of microservices:
RESOURCE REQUIREMENTS | These are the requirements in terms of computingresources required by the microservice, e.g., memory.
6http://docs.oasis-open.org/tosca/TOSCA-Simple-Profile-YAML/v1.1/TOSCA-Simple-Profile-YAML-v1.1.html (accessed: 2020-03-12)

106 Chapter 7. Edge Computing Framework
SERVICE CATEGORY |Microservices belong to a specific category in a hierarchy (seeSection 7.4.1). This attribute defines which category the service belongs to.Child categories are separated from parent categories by a forward slash (/).
INPUT AND OUTPUT TYPES | With these attributes, the microservice specifies whichdata types are taken as input and what type of data is returned.
LIFECYCLE MANAGEMENT | The attribute alive_time defines the default time thata microservice should stay active on the edge agent. Contrary to commonserverless platforms, where the lifetime is either limited to a single functionexecution or fixed by the provider (e.g., AWS Lambda currently has a maxi-mum function lifetime of 15 minutes7), this default lifetime can be overriddenby the client in order to adapt it to the application and expected request pat-terns. In addition, we support the idea of polling to monitor a microservice’sactivity and prevent early shutdowns or unnecessary restarts. The microser-vice can send an alive message to its agent to notify it of its activity status.This message in turn resets the alive timer of this microservice to prevent itsautomatic shutdown, thus allowing for more efficient use of resources andavoidance of cold starts (see Section 7.4.2.b for details).
EXECUTION ENVIRONMENT | We also include properties that are specific to the exe-cution environment in which the service will be run. In our prototype imple-mentation, we use Docker containers to ship and execute the microservices(see Section 7.5). Additional properties allow defining the port numbers ofthe container and network bridges.
The full TOSCA extension for the description of microservices can be found in Ap-pendix B. These properties are required by both the client (e.g., to choose an ap-propriate service according to the category and input/output types), and the EdgeComputing framework (e.g., to make placement decisions based on resource re-quirements). An exemplary microservice description is shown in Listing 7.1.
LISTING 7.1: TOSCA DESCRIPTION OF A MICROSERVICE
t o s c a _ d e f i n i t i o n s _ v e r s i o n :t o s ca_ s imp le_p ro f i l e _ fo r_mi c ro se r v i c e s_1_0_0
d e s c r i p t i o n : Template f o r a o b j e c t de t e c t i on a p p l i c a t i o n .topology_template:
node_templates:o b j e c t _ d e t e c t i o n :
type: to sca . nodes . m i c ro se rv i c e s . docker_conta inerp r o p e r t i e s :
id : od01name: o b j e c t _ d e t e c t i o ncon ta ine r_por t : 5000mem_requirement: 1000d i r e c t o r y : o b j e c t _ d e t e c t i o ninput s : [ image ]outputs : [ image ]category : / images/ computer_vis ion / o b j e c t _ d e t e c t i o na l i v e_ t ime : 1800
7information taken from https://aws.amazon.com/lambda/faqs/ (accessed: 2020-06-01)
7.4. Functional Concept 107
7.3.2 Service Chaining
Applications often offload more than one of their components. In many cases, thesecomponents are executed subsequently, i.e., the output of one service is the input forthe next service [Car+16; CDO19; BI14]. Therefore, services often form a servicechain or service pipeline—we use these two terms interchangeably. This workflowis common to many types of Edge Computing applications, such as the processingof sensor data (e.g., first the raw values are filtered according to a threshold, thenthe values are aggregated), or in video analytics (e.g., first the frame is compressed,then objects in the frame are detected and annotated before aggregating the countof each object). We reflect this common workflow for Edge Computing applicationsby providing application developers the means to not only request the execution ofan individual service, but of entire service chains.
Requesting the execution of a service chain is done by submitting a chain descrip-tion file to the controller, which parses it and makes the services available on theedge agents (see Section 7.4.2 for details). Similar to the description file of a singlemicroservice, the chain description is implemented as an extension to the TOSCAstandard. The complete extension can be found in Appendix C. In the chain descrip-tion file, the individual microservices and their properties are listed. Microservicesare referenced by their store identifier. With this identifier, the properties of the in-dividual service as defined earlier can be retrieved, e.g., for the controller to makeplacement decisions (see Section 7.4.2.a). In addition, new attributes are intro-duced for the service chain. Normally, instances of a microservice can be sharedamong multiple clients. If a client wants to use a service instance exclusively, i.e.,enforce the creation of a new instance, the attribute new_instance can be set for thatmicroservice. A requirements array indicates which input is required for other mi-croservices. This also allows for branching of services, i.e., processing flows whereone service requires the output of more than one service, or where the output ofone service is used as input for more than one service. Furthermore, the attributesfirst_in_chain and last_in_chain indicate if a service is first or last in the chain. Fig-ure 7.3 shows an example of such a branched microservice chain. Next to eachmicroservice, an excerpt of the TOSCA description containing the relevant parts forthe chaining functionality is shown. In Section 7.4.4, we will detail how we realizechained services using distributed message queues.
7.4 Functional Concept
While the previous Section 7.3 described our general approach to microservice-based onloading of services and service chains, this section describes the functionalconcepts and components that are required to realize this approach. We present thedesign of flexEdge, a distributed Edge Computing framework. The main componentsof flexEdge were shown in Figure 7.1(b). In the following subsections, we describethem in detail.
From the developer’s point of view, flexEdge largely abstracts away most oper-ational concerns such as placement, lifecycle management, and communication ofmicroservices. From the end user’s point of view, flexEdge can leverage proximatecomputing resources to offer low-latency computing services.

108 Chapter 7. Edge Computing Framework
Microservice A
Microservice B
Microservice C
Microservice D
first_in_chain: true last_in_chain: false
first_in_chain: false last_in_chain: false
input: Microservice A
first_in_chain: false last_in_chain: false
input: Microservice A
first_in_chain: false last_in_chain: true
input: Microservice B input: Microservice C
FIGURE 7.3: ILLUSTRATION OF BRANCHING IN A MICROSERVICE CHAIN
7.4.1 Microservice Store
The microservice store serves as the repository where services are uploaded to andmade available by developers. The microservice store is modeled as a database andthe microservices and their attributes are the records contained in the database.When a controller needs to instantiate a microservice on an agent, it requests thecorresponding service from the store.
An entry for a microservice consists of a unique ID, the service name, a descrip-tion, the category of the service, the types of its inputs and outputs, and the CSARfile into which the service is packaged. While the ID in the store is unique to one mi-croservice (defined, for instance, manually by assigning a set of IDs to a developer,or automatically using UUIDs), the services themselves can be distributed in twoways. First, in larger-scale implementations, the microservice store would likelybe partitioned across multiple databases. Second, since the microservice store onlyprovides a blueprint for the controller, multiple instances of one service can be activeon different agents at runtime. The unique ID described here is a global identifierthat developers use to request the execution of a particular service.
To model the different categories of microservices, we chose a hierarchical,inheritance-based model because it allows for a compact and natural representa-tion. Furthermore, this approach corresponds to the object-oriented paradigm thatis common knowledge among developers. A category may be the child of a parentcategory and the parent of several subcategories. For example, the category of ourobject detection microservice (see Section 7.5.1) can be seen in Listing 7.1. This mi-croservice belongs to the category object_detection, which in turn is a subcategory ofthe categories computer_vision and images. The information about the category, theinputs, and the outputs are especially important since they serve as the basis for oursecond microservice addressing scheme that is based on the semantic descriptionand allows for an automatic selection of services (see Section 7.4.2.a).
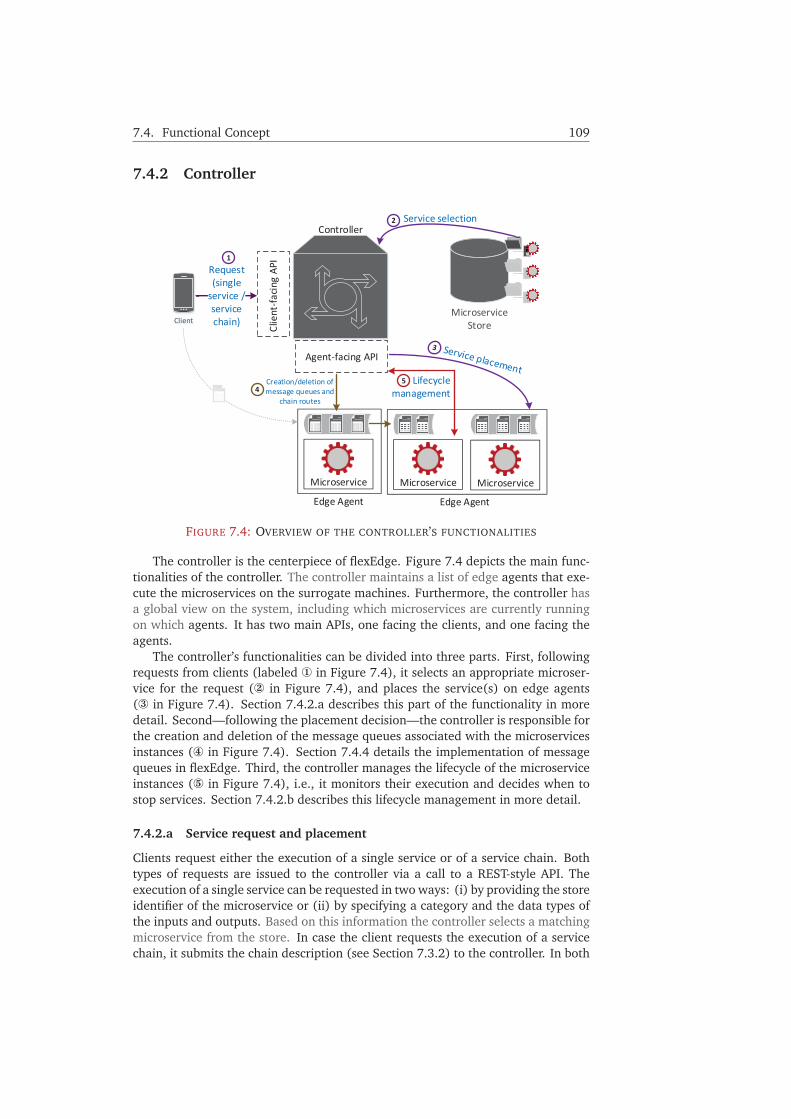
7.4. Functional Concept 109
7.4.2 Controller
Clie
nt-fa
cing
API
Request(single
service / service chain)
Controller
Agent-facing API
MicroserviceStore
Microservice
Edge Agent
Microservice Microservice
Edge Agent
1
4Creation/deletion of message queues and
chain routes
2 Service selection
Client
5 Lifecycle management
FIGURE 7.4: OVERVIEW OF THE CONTROLLER’S FUNCTIONALITIES
The controller is the centerpiece of flexEdge. Figure 7.4 depicts the main func-tionalities of the controller. The controller maintains a list of edge agents that exe-cute the microservices on the surrogate machines. Furthermore, the controller hasa global view on the system, including which microservices are currently runningon which agents. It has two main APIs, one facing the clients, and one facing theagents.
The controller’s functionalities can be divided into three parts. First, followingrequests from clients (labeled � in Figure 7.4), it selects an appropriate microser-vice for the request (� in Figure 7.4), and places the service(s) on edge agents(� in Figure 7.4). Section 7.4.2.a describes this part of the functionality in moredetail. Second—following the placement decision—the controller is responsible forthe creation and deletion of the message queues associated with the microservicesinstances (� in Figure 7.4). Section 7.4.4 details the implementation of messagequeues in flexEdge. Third, the controller manages the lifecycle of the microserviceinstances (� in Figure 7.4), i.e., it monitors their execution and decides when tostop services. Section 7.4.2.b describes this lifecycle management in more detail.
7.4.2.a Service request and placement
Clients request either the execution of a single service or of a service chain. Bothtypes of requests are issued to the controller via a call to a REST-style API. Theexecution of a single service can be requested in two ways: (i) by providing the storeidentifier of the microservice or (ii) by specifying a category and the data types ofthe inputs and outputs. Based on this information the controller selects a matchingmicroservice from the store. In case the client requests the execution of a servicechain, it submits the chain description (see Section 7.3.2) to the controller. In both

110 Chapter 7. Edge Computing Framework
cases, the controller sends a response back to the client, detailing the location ofthe service(s) (i.e., the corresponding agent IP addresses and exposed ports), andthe queue name where requests can be issued to.
Conceptually, our approach of selecting services relies on mechanisms that aresimilar to UDDI8 [Cur+02]. UDDI is a specification for the discovery of web ser-vices that consists of three main elements: white pages (containing the name andmeta information about the service), yellow pages (describing the category of theservice), and green pages (containing technical information about the service andfurther details on how to access it). Mapped to our functional design, white pagesand yellow pages are represented by the attributes of the service as saved in thedatabase record of the microservice store (i.e., the name, description, and categoryof the service), while technical details (comparable to green pages) are containedin the TOSCA description file (e.g., specifying the container runtime or the ports).
After receiving requests, the controller needs to decide (i) if running instancesof services should be reused and (ii) on which agents to place new microserviceinstances. For these placement decisions, different approaches can be employed.This chapter is intended to describe the overall design of our microservice execu-tion mechanism, and hence, concrete placement algorithms are beyond the scope ofthis chapter. The controller’s global view (e.g., w.r.t. the resources available on theagents and where microservices are running) and the description of the services(e.g., their resource requirements) enable the implementation of different place-ment strategies on the controller. Chapter 8 will present a strategy that could beimplemented at a controller for the placement of microservices.
7.4.2.b Service lifecycle management
When a microservice is requested, we can distinguish between a warm start and acold start. A cold start of a microservice happens when the microservice to be usedis not yet running on the agent. In a cold start—following the placement decisionof the controller—the microservice has to be transferred from the store to the agentand then started on the agent. In contrast, a warm start of a microservice happenswhen the client uses an already running instance of a microservice. In this case,the process of transferring the service from the store and starting the service will beskipped, i.e., step 2 and step 3 in Figure 7.1(b).
Besides the placement of microservices, the controller is also responsible forterminating services. By default, this is done after the default alive time specifiedin the service description has elapsed. The framework also offers the possibility tooverride this at the time of service instantiation. In that case, microservices reportto the controller when they are being actively used, e.g., when a certain number ofrequests have arrived in a time frame. The exact timing is left at the discretion of themicroservice developers, who need to actively implement this feature. Wheneverthe controller receives such a polling message from the service, the service lifetime isreset to the initial value. Timer tasks running on the controller regularly terminateservices whose lifetimes have expired. This mechanism allows for a flexible man-agement of the service lifetime. This dynamic termination strategy is in contrast,e.g., to the current practice in Serverless Computing, where function instances areterminated after a fixed time. Manner et al. [Man+18] have investigated influenc-ing factors on the cold start latency in the domain of Serverless Computing. They
8Universal Description, Discovery, and Integration

7.4. Functional Concept 111
furthermore concluded that there is a significant difference between the latencythat the user perceives versus the actual, billed duration. In Edge Computing, wheremany offloaded application components represent user-facing functionality (e.g., inthe domain of rendering or computer vision), this insight is especially important.
Clearly, lifecycle management incurs a tradeoff. Terminating services too early(i.e., when clients still frequently request them) means more cold starts, and hence,higher end-to-end latencies as will be shown in Section 7.6.2.a. On the other hand,keeping services active consumes scarce resources on the edge agents. We leave theexploration of this tradeoff for future work.
7.4.3 Edge Agent
The edge agent is a background service that runs on the surrogates and enablesthe actual execution of microservices. It does so by providing two interfaces: (i) anorthbound interface to the controller, and (ii) a southbound interface to the exe-cution environment. We borrow this terminology from the domain of SDN (seeSection 3.5.3), where it is used to denote the distinction between interfaces to ahigh-level control entity (northbound), and the execution of the controller’s poli-cies (southbound). In our system, the definition of these interfaces serves to decou-ple the control functionalities, e.g., placement and monitoring, from the concreteexecution environment on the agent.
The edge agent is designed to be extensible in order to support different execu-tion environments. One example of such an execution environment is the containerplatform Docker (see Explanation 7.2 in Section 7.5 for details). The agent man-ages the execution environment for the microservices (e.g., by issuing commandsto the Docker command line interface for the starting and stopping of containers)and interacts with the controller for their lifecycle management (e.g., it receivesrequests from the controller to stop a running service). The agent reacts to instan-tiation requests coming from the controller. If the corresponding container image(see Section 7.5 for details about the container runtime) does not exist on the agentyet, it will be built upon requesting the service. Future invocations of microserviceinstances will use the pre-built image unless the client sends a force_rebuild flag.Figure 7.5 illustrates the role of the edge agent with the example of Docker as anexecution environment.
Surr
ogat
e
southboundinterface
Edge Agent
northboundinterface
Controller
FIGURE 7.5: EDGE AGENT AND ITS INTERFACES

112 Chapter 7. Edge Computing Framework
7.4.4 Message Queues
Because we envision applications to be broken up into individual microservices,these microservices need a way to communicate, (i) with the client to receive inputsand deliver results, and (ii) between each other to realize service chains (i.e., theresult of one microservice is forwarded as input to the next microservice).
In flexEdge, we realize this communication through distributed message queues.Distributed message queues function through a message broker that relays messagesbetween senders and receivers, often allowing for publish-subscribe communica-tion patterns [Eug+03], which have been used extensively, e.g., in the IoT domain[Sil+16; Wan+12]. In our dynamic edge environment, using message queues isadvantageous for the following reasons:
(i) ASYNCHRONOUS COMMUNICATION |Message queues provide an asynchronouscommunication mechanism. Hence, clients are able to issue non-blocking re-quests to the queue and do not have to wait for the completion of the request,enabling them to continue to execute local parts of an application. In contrast,other offloading frameworks use synchronous communication patterns. As anexample, MAUI [Cue+10] uses RPCs9 between the clients and the surrogates.
(ii) DECOUPLING | Having a message broker in-between the clients and the mi-croservice instances decouples those two entities. This naturally supports thedesign of our system, in which microservice instances can be shared amongdifferent clients. The decoupling furthermore facilitates future optimizationsof our system. For instance, supporting the scaling out of instances can bedone by dynamically re-assigning requests to queues that correspond to dif-ferent service instances. In comparison, many other offloading frameworks,e.g., [LWB16; Chu+11; Kos+12] cannot leverage these advantages, as theyexpect a direct relationship between the client and the offloaded functionality.
(iii) ADDITIONAL GUARANTEES | Depending on the message broker that is used,it can offer additional guarantees, such as delivery guarantees. Those arerelevant, for instance, when an edge node fails and requests need to be re-transmitted to other service instances.
In our design of the message queue concept, each microservice is associated witha request queue, addressed by a unique name. Furthermore, each service chain hasa distinct result queue, to which the result of the last service in the chain is pushed.The message queues are distributed in the sense that each agent runs a messagebroker that maintains the message queues of each service running on that agent.After the controller has made placement decisions for the individual services of thechain, it constructs a route, containing the chain’s structure. This route is a pythondictionary that is passed through the entire service chain in the message header,such that microservices in the pipeline know to which queue they should publishtheir results. In detail, the chain route contains the following information: (i) thechain’s first message queue where the client pushes requests (denoted by the keystart), (ii) the IP addresses of the agents where a given service is placed (sinceeach agent has its own message broker), (iii) ports (container-internal and exposedto the host) that the service listens to, (iv) the previous and next message queues(denoted by the keys prev and next) (v) the identifier of the result queue (denotedby the key result), and (vi) a unique identifier of the chain (chain_id).
9remote procedure calls

7.5. Implementation Details 113
Listing 7.2 shows an example of such a route (serialized to JSON), consist-ing of three service instances in the following order: image_compression_1 →super_resolution_1→ mesh_construction_1.
LISTING 7.2: EXAMPLE OF A MICROSERVICE CHAIN ROUTE
{’ s t a r t ’ : ’ image_compression_1 ’ ,’ r e s u l t ’ : ’ resu l t_27fceda6−d5ea−4461−bbd2−5cb8ae4cdb0f ’ ,’ image_compression_1 ’ :
{’ agent ’ : ’ 18.189.1.228 ’ ,’ po r t s ’ : [{ ’ c on ta ine r_por t ’ : 5000 , ’ hos t_por t ’ : 59203 , ’
�→ pro toco l ’ : ’ t cp ’ } ] ,’ next ’ : [ ’ super_ re so lu t ion_1 ’ ] ,’ prev ’ : [ ]} ,
’ super_ re so lu t ion_1 ’ :{’ agent ’ : ’ 18.189.1.228 ’ ,’ po r t s ’ : [{ ’ c on ta ine r_por t ’ : 5000 , ’ hos t_por t ’ : 61712 , ’
�→ pro toco l ’ : ’ t cp ’ } ] ,’ next ’ : [ ’ mesh_construct ion_1 ’ ] ,
’ prev ’ : [ ’ image_compression_1 ’ ]} ,
’ mesh_construct ion_1 ’ :{’ agent ’ : ’ 18.189.1.228 ’ ,’ po r t s ’ : [{ ’ c on ta ine r_por t ’ : 5000 , ’ hos t_por t ’ : 56974 , ’
�→ pro toco l ’ : ’ t cp ’ } ] ,’ next ’ : [ ’ r e su l t_27fceda6−d5ea−4461−bbd2−5cb8ae4cdb0f ’ ] ,
’ prev ’ : [ ’ super_ re so lu t ion_1 ’ ]} ,
’ r e su l t_27fceda6−d5ea−4461−bbd2−5cb8ae4cdb0f ’ :{’ agent ’ : ’ 18.189.1.228 ’} ,
’ cha in_ id ’ : ’ 25 ce f7c f −5a73−41a4−a677−760dd3c7ef2a ’}
7.5 Implementation Details
We realize a prototype implementation of our proposed concept. This section de-scribes further technical details about the implementation. Figure 7.6 shows anoverview of the implemented system and its components. Our implementationconsists of (i) a centralized controller, to which clients submit requests for the ex-ecution of microservices, (ii) edge agents that run the containerized microservices,and (iii) the microservice store. The controller and the agents are implemented asPython applications. For the containerization of microservices, we use Docker (seeExplanation 7.2).
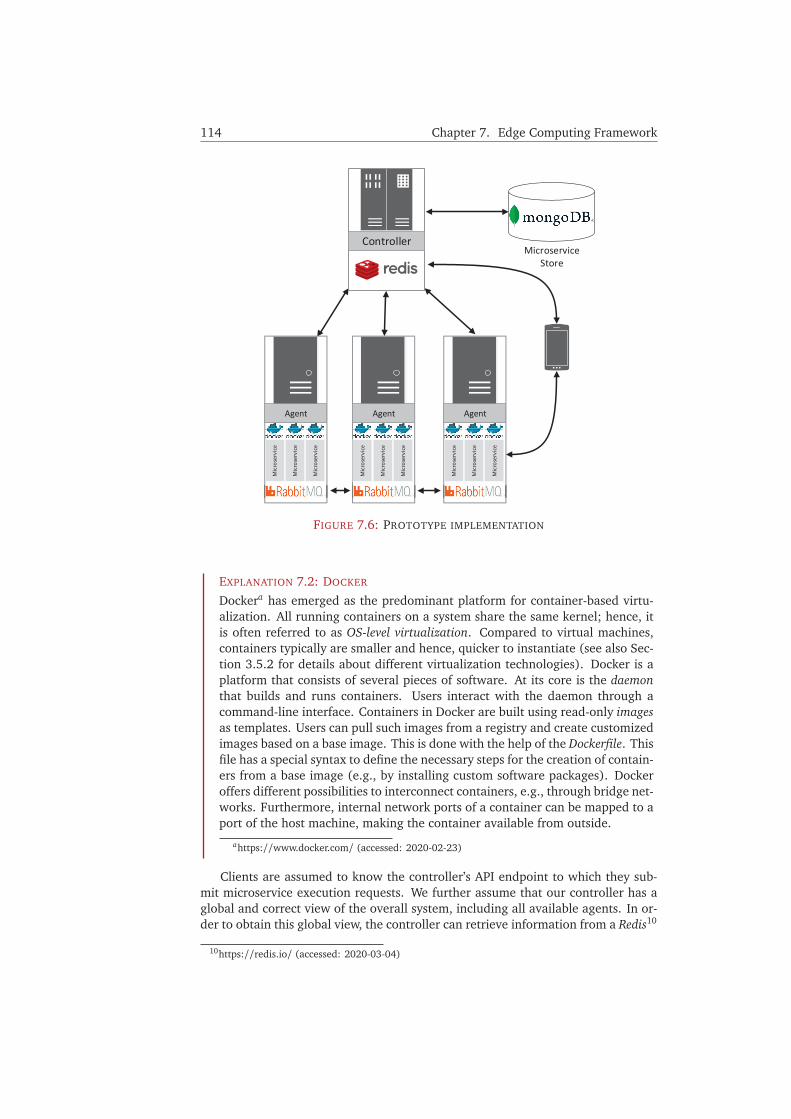
114 Chapter 7. Edge Computing Framework
MicroserviceStore
Agent
Microservice
Microservice
Microservice
Agent
Microservice
Microservice
Microservice
Agent
Microservice
Microservice
Microservice
Controller
FIGURE 7.6: PROTOTYPE IMPLEMENTATION
EXPLANATION 7.2: DOCKER
Dockera has emerged as the predominant platform for container-based virtu-alization. All running containers on a system share the same kernel; hence, itis often referred to as OS-level virtualization. Compared to virtual machines,containers typically are smaller and hence, quicker to instantiate (see also Sec-tion 3.5.2 for details about different virtualization technologies). Docker is aplatform that consists of several pieces of software. At its core is the daemonthat builds and runs containers. Users interact with the daemon through acommand-line interface. Containers in Docker are built using read-only imagesas templates. Users can pull such images from a registry and create customizedimages based on a base image. This is done with the help of the Dockerfile. Thisfile has a special syntax to define the necessary steps for the creation of contain-ers from a base image (e.g., by installing custom software packages). Dockeroffers different possibilities to interconnect containers, e.g., through bridge net-works. Furthermore, internal network ports of a container can be mapped to aport of the host machine, making the container available from outside.
ahttps://www.docker.com/ (accessed: 2020-02-23)
Clients are assumed to know the controller’s API endpoint to which they sub-mit microservice execution requests. We further assume that our controller has aglobal and correct view of the overall system, including all available agents. In or-der to obtain this global view, the controller can retrieve information from a Redis10
10https://redis.io/ (accessed: 2020-03-04)

7.5. Implementation Details 115
instance. This in-memory key-value store is kept updated with information aboutagents and the current state of the system (e.g., which microservice instances andresources are currently available). To parse the microservice descriptions, we adaptthe TOSCA parser from the OpenStack project11, so that it is able to parse our exten-sions for the definitions of microservices and service chains (see Section 7.3.1 andSection 7.3.2). Following a client request and a placement (see Section 7.4.2.a),the requested services are either newly instantiated or existing ones are reused andrequests redirected to them. In the first case, the controller creates a new, uniqueinstance name for that service, composed of its name (as found in the TOSCA de-scription) concatenated with a sequential numbering. This unique instance name isrequired by clients, agents, and the controller to address the service instance. Thecontroller also creates network port mappings between the internal ports of the mi-croservice container and the host system. To do so, the controller assigns a hostport from the range of 50001 to 61999 (since those fall into the range of so-calleddynamic ports as defined in RFC633512 and hence, do not conflict with any well-known system ports). When assigning a host port, the controller also takes intoaccount the already running microservices on the agent, as to avoid port conflicts.
All REST-style APIs are implemented using Flask13, a lightweight web frame-work for Python. The edge agents also run as dockerized Python applications onthe surrogates. The microservice store is connected to the controller and realized inMongoDB14, a document-oriented database. Each microservice is stored as a docu-ment in a MongoDB collection. Each document has a unique ID (the store ID of themicroservice that can be used to reference it), its name, a textual description, inputand output types, and the category. Because microservices can have a substantialsize, we enable GridFS in the database system to store the CSAR files of the mi-croservices15. The document of a microservice contains a reference to the GridFSdocument where the corresponding CSAR file is stored. Categories for microser-vices are defined in a separate collection. Each document stored there contains areference to a parent category (unless it belongs to a root category), allowing us tomodel hierarchies of service categories.
To realize the message queues, we use RabbitMQ16, an open-source messagebroker. Each agent runs an instance of the message broker. It is responsible forcreating and deleting message queues for each microservice running on that agent.For each microservice, a message queue is created to which requests for that serviceare sent. This request queue is addressed by the same identifier as the correspondingmicroservice instance. The result queue for a service chain is maintained on theagent that executes the first service in the chain. The identifier for the result queueis generated with a UUID17.
7.5.1 Demo Microservices
To evaluate our system, we developed three microservices. We have made themavailable for the research community18. All microservices were implemented in
11https://github.com/openstack/tosca-parser (accessed: 2019-04-08)12https://tools.ietf.org/html/rfc6335 (accessed: 2020-05-13)13https://palletsprojects.com/p/flask/ (accessed: 2020-03-04)14https://www.mongodb.com/ (accessed: 2020-02-24)15MongoDB currently limits the size of regular documents to 16MB16https://www.rabbitmq.com/ (accessed: 2020-03-10)17Universally unique identifier18https://github.com/Telecooperation/flexEdge-microservices (accessed: 2019-11-18)

116 Chapter 7. Edge Computing Framework
(a) Object detection input image (b) Object detection result image
(c) Face detection input image (d) Face detection result image
FIGURE 7.7: EXAMPLE RESULTS PRODUCED BY THE MICROSERVICES
Python, use Flask and Bottle19 to implement a REST-based API, and were shippedas Docker containers.
(i) OBJECT DETECTION | Using TensorFlow, we performed object detection on animage. The microservice returns the original image including the detectedobjects, enclosed by rectangles and labeled with the name of the object anda confidence value. The microservice code was adapted from the TensorFlowObject Detection API20 and we used the ssd_mobilenet_v1_coco model trainedon the COCO dataset. Figures 7.7(a) and 7.7(b) show example input andoutput images for this microservice.
(ii) FACE DETECTION | Using OpenCV and a LBP Cascade classifier, our secondmicroservice detects faces in an image and returns the original image withthe faces enclosed by rectangles. An example of the output produced by thisservice (with Figure 7.7(c) as input) can be seen in Figure 7.7(d)21
(iii) WORD COUNT | Lastly, we used a simple word count application that countsthe number of words in a given text file. This application served as a simplebenchmarking tool for our experiments.
19https://bottlepy.org/ (accessed: 2020-03-30)20https://github.com/tensorflow/models/tree/master/research/object_detection (accessed: 2019-
11-18)21Pictures are taken from the WIDER FACE dataset: http://shuoyang1213.me/WIDERFACE/ (ac-
cessed: 2020-02-20)

7.6. Evaluation 117
7.5.1.a Service chain
In addition, for the performance evaluation of our chaining mechanism (see Sec-tion 7.6.3), we considered a simple chain for benchmarking. The service chain takestext as input and at the first stage, a service just echoes back the input into the nextqueue. The second service splits up the text into individual words. The third servicecounts the number of individual words. Finally, the last service echoes back the re-sult of the word count. Figure 7.8 illustrates this demo chain of microservices. TheTOSCA description file that describes the chain can be found in Appendix D.
FIGURE 7.8: DEMO MICROSERVICE CHAIN FOR THE EVALUATION
7.6 Evaluation
We evaluate the store-based onloading approach of our proposed Edge Computingframework with regards to end-to-end latency (Section 7.6.2.a) and energy con-sumption (Section 7.6.2.b). We also provide some further discussion on the loca-tion of the microservice store (Section 7.6.2.c) and the performance and energyimpact when executing the services on a mobile device (Section 7.6.2.d). Finally,we show the efficiency of our approach to chaining microservices and compare itwith a state-of-the-art serverless platform (Section 7.6.3).
7.6.1 Experimental Setup
As an edge node, we use a Lenovo ThinkCentre M920X Tiny with an Intel Corei7-8700 and 16 GB RAM running Ubuntu 18.04. This device is a consumer-gradedesktop computer that has a small form factor and hence, is an ideal example of anEdge Computing surrogate that might be deployed in practice. The edge node isconnected via Gigabit Ethernet to a Linksys WRT 1900 AC wireless access point thatat the same time serves as a 802.11nac gateway for the mobile device. Besides WiFiconnectivity, we also conduct our experiments using a 4G cellular network in orderto cover the different types of wireless connections that client devices encounter.We use the network of the carrier Deutsche Telekom with an advertised maximumbandwidth of 300/50 Mbit/s (down/up). The controller and the microservice storeare colocated on the same machine, a Citrix Xen VM. The VM uses 1 Core of anAMD Opteron 6380 (clocked at a maximum of 3.4 GHz), has 8 GB of RAM andruns Ubuntu 16.04. This VM runs in the same backend network as the edge node.
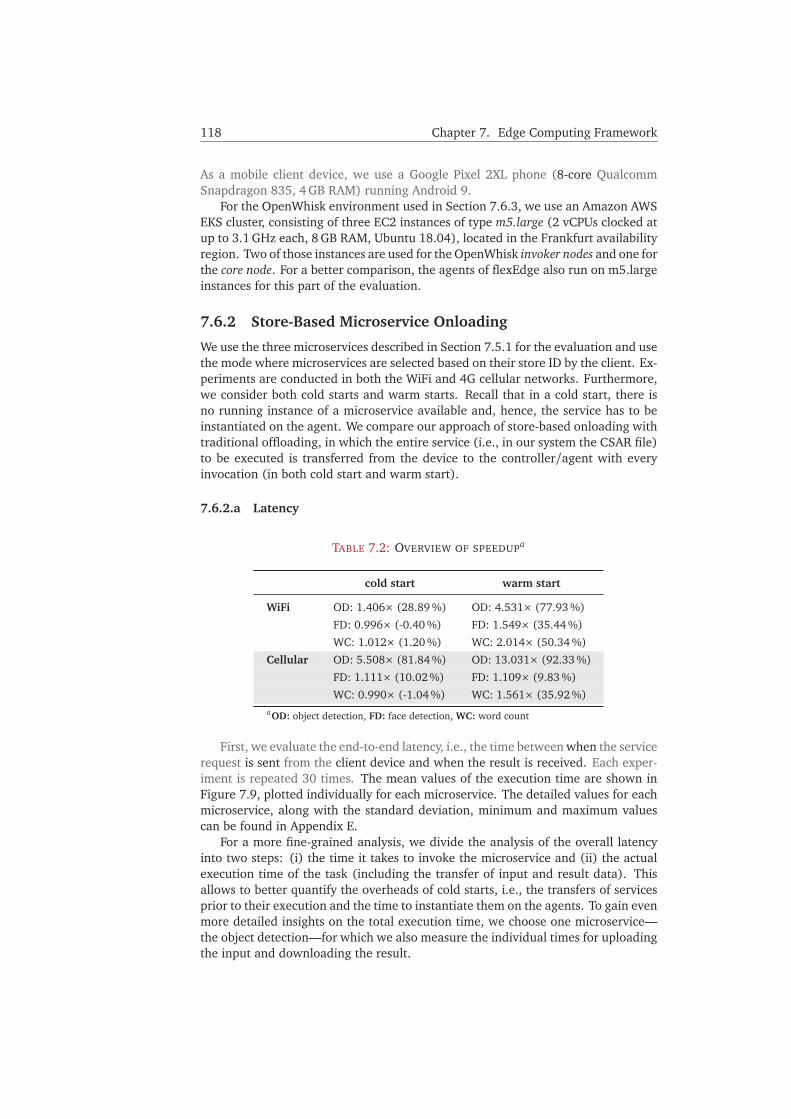
118 Chapter 7. Edge Computing Framework
As a mobile client device, we use a Google Pixel 2XL phone (8-core QualcommSnapdragon 835, 4 GB RAM) running Android 9.
For the OpenWhisk environment used in Section 7.6.3, we use an Amazon AWSEKS cluster, consisting of three EC2 instances of type m5.large (2 vCPUs clocked atup to 3.1 GHz each, 8 GB RAM, Ubuntu 18.04), located in the Frankfurt availabilityregion. Two of those instances are used for the OpenWhisk invoker nodes and one forthe core node. For a better comparison, the agents of flexEdge also run on m5.largeinstances for this part of the evaluation.
7.6.2 Store-Based Microservice Onloading
We use the three microservices described in Section 7.5.1 for the evaluation and usethe mode where microservices are selected based on their store ID by the client. Ex-periments are conducted in both the WiFi and 4G cellular networks. Furthermore,we consider both cold starts and warm starts. Recall that in a cold start, there isno running instance of a microservice available and, hence, the service has to beinstantiated on the agent. We compare our approach of store-based onloading withtraditional offloading, in which the entire service (i.e., in our system the CSAR file)to be executed is transferred from the device to the controller/agent with everyinvocation (in both cold start and warm start).
7.6.2.a Latency
TABLE 7.2: OVERVIEW OF SPEEDUPa
cold start warm start
WiFi OD: 1.406× (28.89 %) OD: 4.531× (77.93 %)
FD: 0.996× (-0.40 %) FD: 1.549× (35.44 %)
WC: 1.012× (1.20 %) WC: 2.014× (50.34 %)
Cellular OD: 5.508× (81.84 %) OD: 13.031× (92.33 %)
FD: 1.111× (10.02 %) FD: 1.109× (9.83 %)
WC: 0.990× (-1.04 %) WC: 1.561× (35.92 %)aOD: object detection, FD: face detection, WC: word count
First, we evaluate the end-to-end latency, i.e., the time between when the servicerequest is sent from the client device and when the result is received. Each exper-iment is repeated 30 times. The mean values of the execution time are shown inFigure 7.9, plotted individually for each microservice. The detailed values for eachmicroservice, along with the standard deviation, minimum and maximum valuescan be found in Appendix E.
For a more fine-grained analysis, we divide the analysis of the overall latencyinto two steps: (i) the time it takes to invoke the microservice and (ii) the actualexecution time of the task (including the transfer of input and result data). Thisallows to better quantify the overheads of cold starts, i.e., the transfers of servicesprior to their execution and the time to instantiate them on the agents. To gain evenmore detailed insights on the total execution time, we choose one microservice—the object detection—for which we also measure the individual times for uploadingthe input and downloading the result.
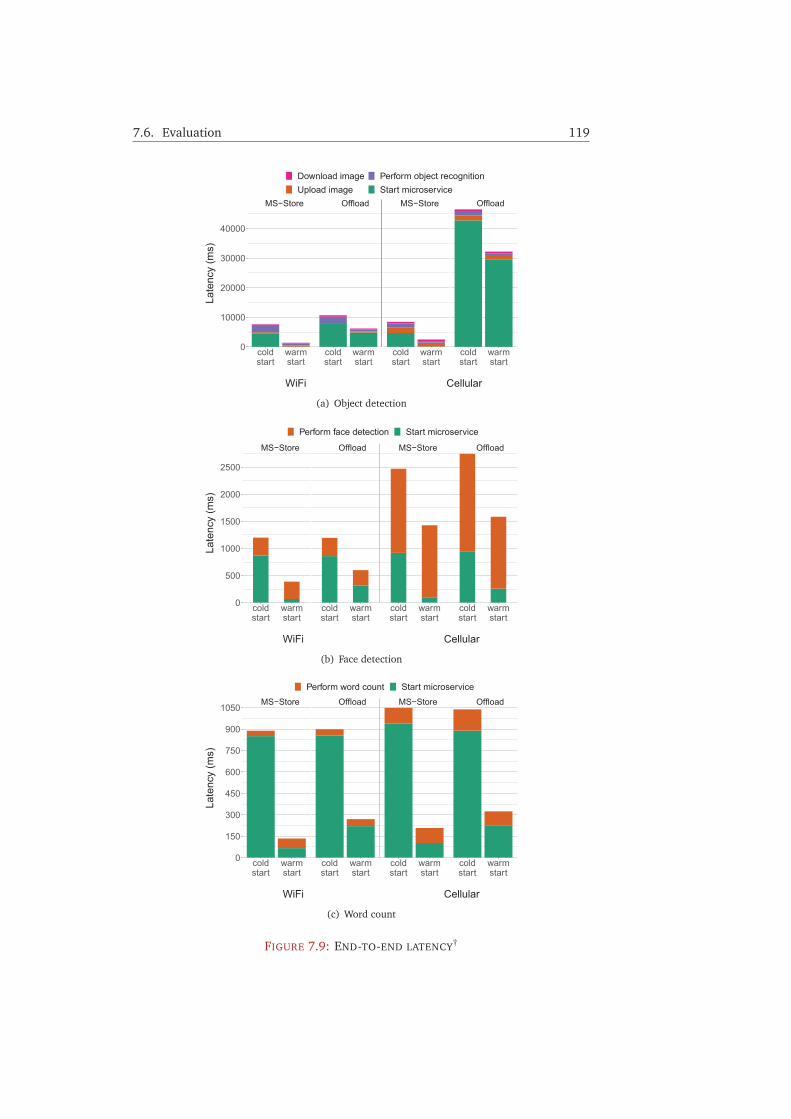
7.6. Evaluation 119
MS−Store Offload MS−Store Offload
coldstart
warmstart
coldstart
warmstart
coldstart
warmstart
coldstart
warmstart
0
10000
20000
30000
40000
WiFi Cellular
Late
ncy
(ms)
Download image Perform object recognitionUpload image Start microservice
(a) Object detection
MS−Store Offload MS−Store Offload
coldstart
warmstart
coldstart
warmstart
coldstart
warmstart
coldstart
warmstart
0
500
1000
1500
2000
2500
WiFi Cellular
Late
ncy
(ms)
Perform face detection Start microservice
(b) Face detection
MS−Store Offload MS−Store Offload
coldstart
warmstart
coldstart
warmstart
coldstart
warmstart
coldstart
warmstart
0
150
300
450
600
750
900
1050
WiFi Cellular
Late
ncy
(ms)
Perform word count Start microservice
(c) Word count
FIGURE 7.9: END-TO-END LATENCY†
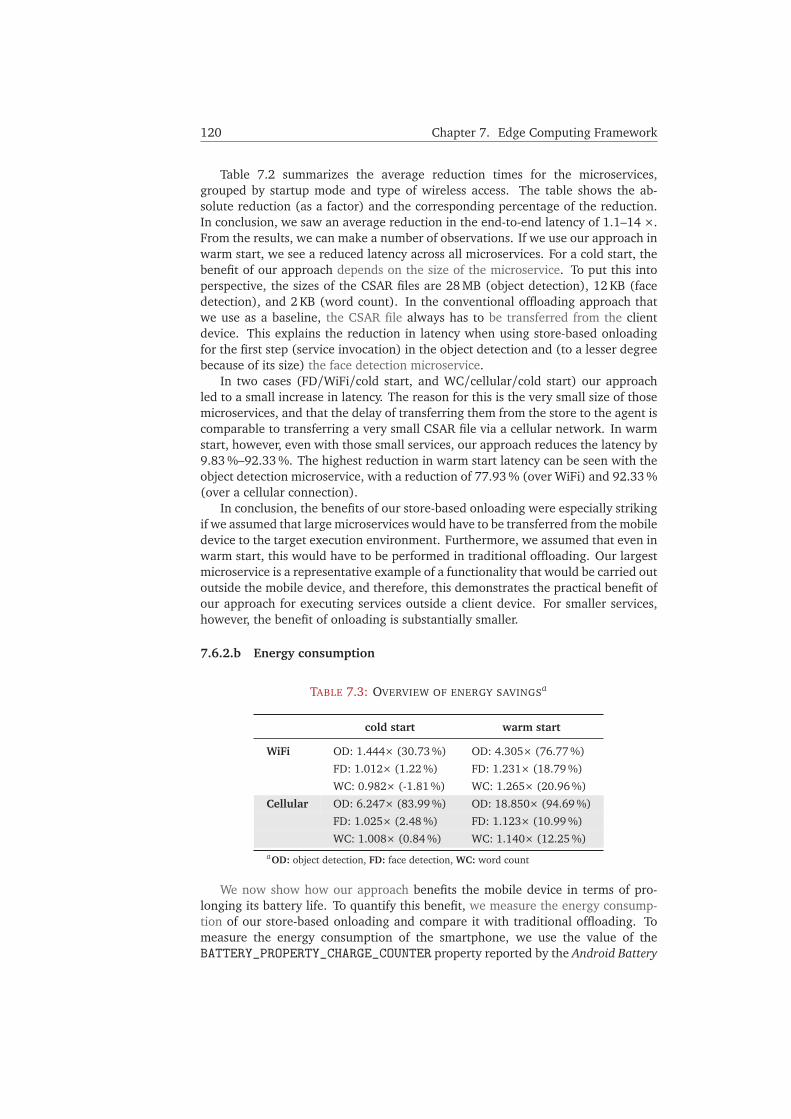
120 Chapter 7. Edge Computing Framework
Table 7.2 summarizes the average reduction times for the microservices,grouped by startup mode and type of wireless access. The table shows the ab-solute reduction (as a factor) and the corresponding percentage of the reduction.In conclusion, we saw an average reduction in the end-to-end latency of 1.1–14 ×.From the results, we can make a number of observations. If we use our approach inwarm start, we see a reduced latency across all microservices. For a cold start, thebenefit of our approach depends on the size of the microservice. To put this intoperspective, the sizes of the CSAR files are 28 MB (object detection), 12 KB (facedetection), and 2 KB (word count). In the conventional offloading approach thatwe use as a baseline, the CSAR file always has to be transferred from the clientdevice. This explains the reduction in latency when using store-based onloadingfor the first step (service invocation) in the object detection and (to a lesser degreebecause of its size) the face detection microservice.
In two cases (FD/WiFi/cold start, and WC/cellular/cold start) our approachled to a small increase in latency. The reason for this is the very small size of thosemicroservices, and that the delay of transferring them from the store to the agent iscomparable to transferring a very small CSAR file via a cellular network. In warmstart, however, even with those small services, our approach reduces the latency by9.83 %–92.33 %. The highest reduction in warm start latency can be seen with theobject detection microservice, with a reduction of 77.93 % (over WiFi) and 92.33 %(over a cellular connection).
In conclusion, the benefits of our store-based onloading were especially strikingif we assumed that large microservices would have to be transferred from the mobiledevice to the target execution environment. Furthermore, we assumed that even inwarm start, this would have to be performed in traditional offloading. Our largestmicroservice is a representative example of a functionality that would be carried outoutside the mobile device, and therefore, this demonstrates the practical benefit ofour approach for executing services outside a client device. For smaller services,however, the benefit of onloading is substantially smaller.
7.6.2.b Energy consumption
TABLE 7.3: OVERVIEW OF ENERGY SAVINGSa
cold start warm start
WiFi OD: 1.444× (30.73 %) OD: 4.305× (76.77 %)
FD: 1.012× (1.22 %) FD: 1.231× (18.79 %)
WC: 0.982× (-1.81 %) WC: 1.265× (20.96 %)
Cellular OD: 6.247× (83.99 %) OD: 18.850× (94.69 %)
FD: 1.025× (2.48 %) FD: 1.123× (10.99 %)
WC: 1.008× (0.84 %) WC: 1.140× (12.25 %)aOD: object detection, FD: face detection, WC: word count
We now show how our approach benefits the mobile device in terms of pro-longing its battery life. To quantify this benefit, we measure the energy consump-tion of our store-based onloading and compare it with traditional offloading. Tomeasure the energy consumption of the smartphone, we use the value of theBATTERY_PROPERTY_CHARGE_COUNTER property reported by the Android Battery
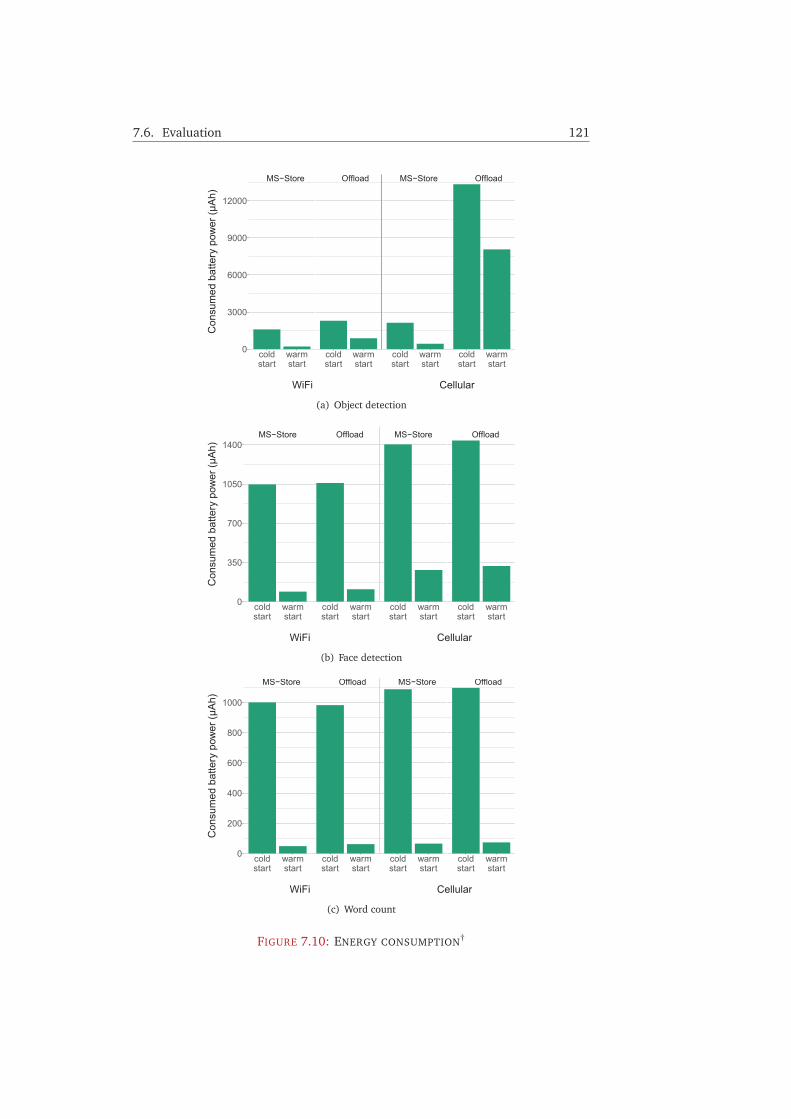
7.6. Evaluation 121
MS−Store Offload MS−Store Offload
coldstart
warmstart
coldstart
warmstart
coldstart
warmstart
coldstart
warmstart
0
3000
6000
9000
12000
WiFi Cellular
Con
sum
ed b
atte
ry p
ower
(μAh
)
(a) Object detection
MS−Store Offload MS−Store Offload
coldstart
warmstart
coldstart
warmstart
coldstart
warmstart
coldstart
warmstart
0
350
700
1050
1400
WiFi Cellular
Con
sum
ed b
atte
ry p
ower
(μAh
)
(b) Face detection
MS−Store Offload MS−Store Offload
coldstart
warmstart
coldstart
warmstart
coldstart
warmstart
coldstart
warmstart
0
200
400
600
800
1000
WiFi Cellular
Con
sum
ed b
atte
ry p
ower
(μAh
)
(c) Word count
FIGURE 7.10: ENERGY CONSUMPTION†
122 Chapter 7. Edge Computing Framework
Manager. This property can be accessed via the Android developer API and providesthe remaining battery capacity in μAh. By preliminary testing, we found that thephone’s operating system updates the battery manager every 1.5 seconds. A singlerun in our experiments (i.e., executing a microservice once) can however take lessthan a second. Therefore, we consider the difference in battery capacity across allruns and divide this delta with the number of experiments to get an estimation ofthe consumed power for a single execution.
Figure 7.10 shows the results of the consumed battery power for a single exe-cution, averaged from all 30 measurements. Comparing the results with those ofthe latency evaluation in the preceding Section 7.6.2.a, we can observe a correla-tion between the reductions in the end-to-end latency and the power consumption.Similarly, how big the benefit of our approach is depends both on the size of the mi-croservice and whether it is invoked in cold or warm start. When invoking a servicein warm start, we see a reduction in the energy consumption for all microservices.How big this reduction is depends on the size of the microservice. In the traditionaloffloading approach, transferring a larger microservice CSAR file consumes moreenergy, as can be seen in the example of the object detection. For a cold start invo-cation, the energy savings also depend on the size of the microservice, but overall,the benefits are less striking (in this case, the mobile device has to wait for the in-stantiation and keep the connection open and hence, energy is consumed in themeantime). For one case—the word count microservice invoked in cold start overa WiFi connection—we found a negligible increase in energy consumption whenusing our approach. We attribute this to measurement inaccuracies in the internalbattery manager software.
As in the previous section, we summarize the average savings of our approachin Table 7.3. If we compare this table with Table 7.2, we can see that the results aresimilar, i.e., our approach is most beneficial with the object detection microservice,which is the largest in size. In conclusion, this part of the evaluation showed thatoverall our approach is able to save battery life for the mobile device.
7.6.2.c Microservice store location
Object detection
Face detection Word count
0
5000
10000
15000
20000
Late
ncy
(ms)
Locationcolocatedlocal networkAWS IrelandAWS US East
FIGURE 7.11: IMPACT OF THE STORE LOCATION ON THE LATENCY†
In the previous experiments, the microservice store was assumed to be colocatedat the controller and close to the agents (more specifically, in the same local area

7.6. Evaluation 123
network). However, if we envision a large-scale deployment of our system, we canmake two observations. First, we would not have a single controller but multipledistributed controllers. Those could for example form a hierarchy, in which eachcontroller is responsible for one (geographic) region. Second, a single controller isunlikely to be hosted on hardware that has the capacity to host all microservices.Hence, in practice, we would not only see a decoupling of the controller and themicroservice store, but multiple instances of those two entities. Having the mi-croservice store not colocated at the controller potentially incurs a big performancepenalty, e.g., when the store is located in a distant cloud infrastructure.
We now quantify the impact of the microservice store location on the cold startlatency and derive recommendations for a large-scale deployment of flexEdge. Weconsider the microservice store to be (i) colocated on the controller, (ii) in the samelocal network, and (iii) in two cloud locations. For the latter, we use Amazon AWSEC2 instances located in the availability regions US East and Ireland. In the exper-iment, the controller and the agent are both located in Darmstadt, Germany.
The results are shown in Figure 7.11. Depending on the size of the microservice,the store location greatly affects the latency. While a store located in the samenetwork has a relatively small impact on the latency, using Cloud services increasesthe latency by 33 % (AWS Ireland) up to 200 % (AWS US East). Hence, for a viabledeployment, the microservice store should be close to the controller and agents soas not to jeopardize the benefits of our offloading scheme. However, in practice,the microservice store, controller and agents would likely be well-connected viawired networks, compared to more unreliable (and sometimes metered) wirelessnetworks that mobile clients use. Hence, even with additional network hops totransfer the microservices to the agents, our approach is beneficial for the overalllatency.
7.6.2.d Comparison with local execution
0
2000
4000
6000
0
500
1000
1500
local store local store
Late
ncy
(ms)
Con
sum
ed b
atte
r y p
ower
(μAh
)
Latency Energy consumption
FIGURE 7.12: COMPARISON WITH LOCAL EXECUTION†
We now compare the difference in end-to-end execution latency and energyconsumption if a service is executed locally on the mobile phone. For this, we usethe object detection as an example and implement a version of this microservice for
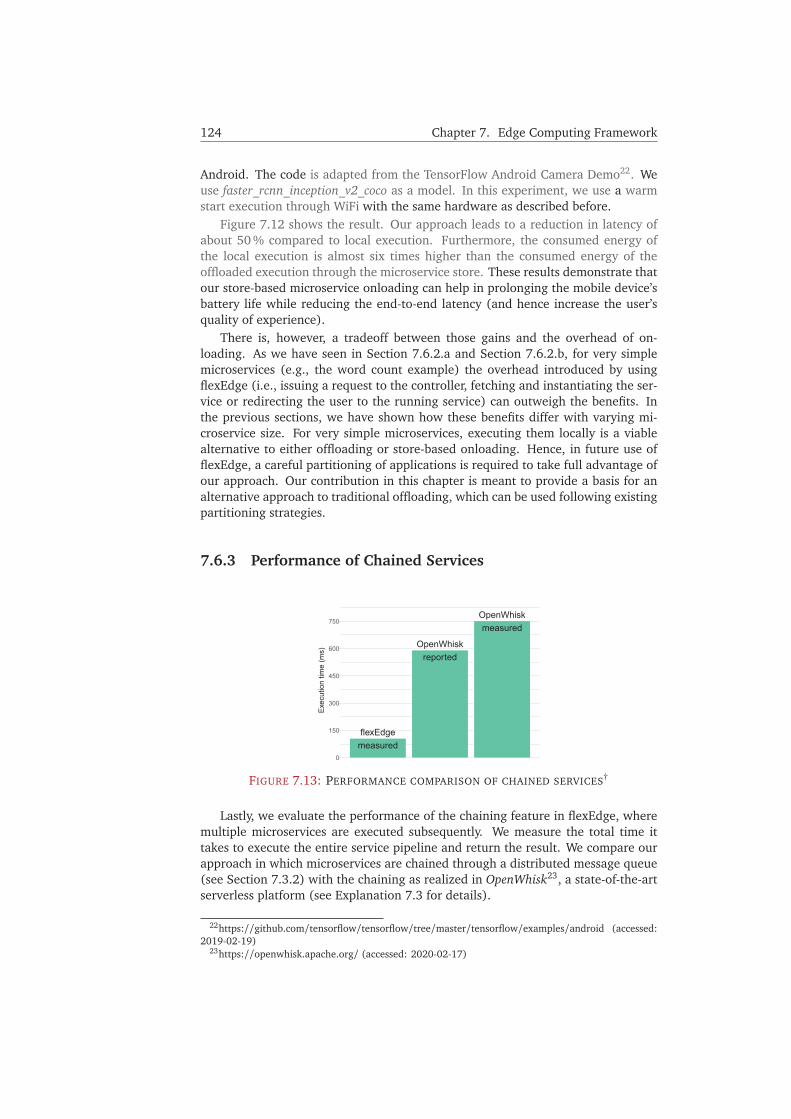
124 Chapter 7. Edge Computing Framework
Android. The code is adapted from the TensorFlow Android Camera Demo22. Weuse faster_rcnn_inception_v2_coco as a model. In this experiment, we use a warmstart execution through WiFi with the same hardware as described before.
Figure 7.12 shows the result. Our approach leads to a reduction in latency ofabout 50 % compared to local execution. Furthermore, the consumed energy ofthe local execution is almost six times higher than the consumed energy of theoffloaded execution through the microservice store. These results demonstrate thatour store-based microservice onloading can help in prolonging the mobile device’sbattery life while reducing the end-to-end latency (and hence increase the user’squality of experience).
There is, however, a tradeoff between those gains and the overhead of on-loading. As we have seen in Section 7.6.2.a and Section 7.6.2.b, for very simplemicroservices (e.g., the word count example) the overhead introduced by usingflexEdge (i.e., issuing a request to the controller, fetching and instantiating the ser-vice or redirecting the user to the running service) can outweigh the benefits. Inthe previous sections, we have shown how these benefits differ with varying mi-croservice size. For very simple microservices, executing them locally is a viablealternative to either offloading or store-based onloading. Hence, in future use offlexEdge, a careful partitioning of applications is required to take full advantage ofour approach. Our contribution in this chapter is meant to provide a basis for analternative approach to traditional offloading, which can be used following existingpartitioning strategies.
7.6.3 Performance of Chained Services
flexEdgemeasured
OpenWhiskreported
OpenWhiskmeasured
0
150
300
450
600
750
Exec
utio
n tim
e (m
s)
FIGURE 7.13: PERFORMANCE COMPARISON OF CHAINED SERVICES†
Lastly, we evaluate the performance of the chaining feature in flexEdge, wheremultiple microservices are executed subsequently. We measure the total time ittakes to execute the entire service pipeline and return the result. We compare ourapproach in which microservices are chained through a distributed message queue(see Section 7.3.2) with the chaining as realized in OpenWhisk23, a state-of-the-artserverless platform (see Explanation 7.3 for details).
22https://github.com/tensorflow/tensorflow/tree/master/tensorflow/examples/android (accessed:2019-02-19)
23https://openwhisk.apache.org/ (accessed: 2020-02-17)

7.6. Evaluation 125
EXPLANATION 7.3: OPENWHISK
Apache OpenWhisk is a serverless cloud platform that executes functions inresponse to requests or events (triggers). Its general architecture resemblesflexEdge, e.g., invoker nodes in OpenWhisk are similar to flexEdge agents, andthe OpenWhisk core node performs similar functions as our controller. Open-Whisk executes actions, which are stateless functions that can be written indifferent languages, in containers that can be managed with different frame-works (e.g., Kubernetes or Mesos). Each invocation of an action produces aninvocation record that contains the function’s results as well as metadata aboutthe invocation, e.g., the execution time. Both function inputs and outputs aremapped to key-value pairs. The subsequent invocation of different functions iscalled action sequence in OpenWhisk.
Comparison of approaches. OpenWhisk stores every intermediate result of anaction (OpenWhisk terminology for a function) in an auxiliary database. For thenext function in the chain, the controller has to first fetch this result before passingit as input to the subsequent function. Furthermore, OpenWhisk limits the size ofthe data that can be passed in this way to 1 MB. For a lot of applications, this wouldclearly not be sufficient. In case the size of the result exceeds the maximum value,results have to be stored in auxiliary storage and a reference to the storage locationcan be returned by the action. Selecting suitable means for ephemeral storage inserverless platforms is an ongoing field of research [Kli+18]. Even disregarding thisrestriction, we expect our approach to be much faster because intermediate resultsare not passed through the controller or temporarily stored. Instead, each serviceis given its chain successor as input and directly pushes the intermediate result intothe input message queue of that successor.
Performance comparison. As a benchmark to compare the chaining of services,we use the word count chain as described in Section 7.5.1.a. For the input, we use apre-generated filler text with a size of 683 KB. For both flexEdge and OpenWhisk, weuse a warm start invocation of services. Figure 7.13 compares the averaged total ex-ecution times of 10 runs. For OpenWhisk, we perform two measurements. First, westart the chain via a blocking command line request and record the execution timewith the Unix time command (labeled OpenWhisk measured in the plot). Second,OpenWhisk itself collects statistics about the runtime of actions (labeled OpenWhiskreported in the plot). The slight differences in measurements occur because Open-Whisk only starts measuring once the first action is invoked. Our measurementsinclude the overhead of OpenWhisk’s own message queue, to which requests aresent before the action is invoked.
Result interpretation. The results clearly show the advantage of our chaining ap-proach, with an execution time of the pipeline that is almost six times faster com-pared to the reported execution times by OpenWhisk. For our own measurementsof the OpenWhisk execution time, the difference is almost 7×. Since the payload ofmessages in our experiment does not exceed 1 MB (which would cause OpenWhiskto move the results to auxiliary storage), the reduction in execution time is solelydue to the fact, that our approach does not move intermediate results to the con-troller before passing them to the next microservice. Note that in our experiment

126 Chapter 7. Edge Computing Framework
here, we considered only two agents/invokers that along with the controller werecolocated in the same local backend network. In more large-scale deployments thismight not be the case, rendering the advantage of our approach even more im-portant. The actual impact of function chaining is intertwined with the placementdecision of the services in the chain. For example, in our experiment reported here,we noticed that while our approach placed all microservices on the same agent (ac-cording to the colocation strategy presented in Section 7.4.2.a), OpenWhisk placedthe echo and word count actions on a different invoker than the split action. It isworth noticing, however, that OpenWhisks offers additional features that we didnot consider, such as automatic scaling of service instances, and integration withother services, e.g., databases and push notifications.
7.7 Conclusion and Outlook
In this chapter, we presented flexEdge, a flexible framework for the execution ofmicroservices at the edge. Most notably, we introduced the concept of store-basedonloading to avoid expensive transferring or pre-provisioning of offloadable code.Instead, microservices are fetched from a microservice store and running serviceinstances can be shared across clients. We demonstrated the benefits that this ap-proach has with regards to end-to-end latency and energy consumption on the clientdevice. Using our approach, we could achieve a maximum reduction in energy con-sumption of 94 % and up to 13× lower end-to-end latency. This maximum benefitwas measured for a microservice that performs object detection, representing a real-istic use case for Edge Computing (because of its computational complexity and pos-sible usage in many recognition applications). In addition, providing microservicesthrough a store has other advantages that were not considered in detail and whichwe leave for future work, such as reusability. For smaller (in terms of their size)microservices the benefit of our approach was reduced drastically, leading to theconclusion that—similar to current practices in offloading frameworks—onloadingalso requires a careful tradeoff w.r.t. which services to execute outside the client de-vice. We furthermore demonstrated that our approach of using distributed messagequeues to realize function chaining outperforms a popular platform for ServerlessComputing.
Although flexEdge provides the basis for executing microservices at the edge, weonly touched briefly on a number of decisions that need to be taken at the controller.Some of those decisions will be addressed later in Part IV of this thesis. For instance,Chapter 8 will present a placement strategy for functional parts of applications. Thisstrategy can be implemented for the placement of microservices into the frameworkthat we have proposed in this section. Chapter 10 shows how microservices can beadapted at runtime by providing different service variants. Future work shouldinvestigate instance lifetime management in more detail, especially the tradeoffbetween cold start latencies and resource utilization. Furthermore, if we assumemultiple instances of a microservice are running, efficient strategies for the user-to-instance assignment are required.

Part IV
Strategies & Adaptations
Infrastructural Support
Control & Execution
Strategies & Adaptations
The preceding Part III introduced an Edge Computing framework basedon the concept of composable microservices. In this part, we proposestrategies and adaptations that can be implemented into such an EdgeComputing framework. Such mechanisms are invoked, e.g., when ser-vices are requested or changes in the execution environment requireactions such as the re-placement of services.
Two chapters (Chapter 8 and Chapter 9) are concerned with placementstrategies, while Chapter 10 adapts the microservices of our Edge Com-puting framework at runtime.
Chapter 8 presents a heuristic approach for the operator placement prob-lem, i.e., where to place functional parts of an application. Chapter 9extends the placement problem to data captured at the edge and pro-poses a novel approach for providing micro-storage capabilities at theedge by taking into account the user’s context.
While Chapters 8 and 9 make planning decisions, Chapter 10 adds thedimension of runtime adaptations to our Edge Computing framework.To realize this, we re-model our previously introduced concept of mi-croservices, adding service variants and making them adaptable at run-time, e.g., to trade runtime for computation quality.
127


CHAPTER 8
Operator Placement1
Chapter Outline8.1 Introduction . . . . . . . . . . . . . . . . . . . . . . . . . . . . 129
8.2 Related Work . . . . . . . . . . . . . . . . . . . . . . . . . . . . 131
8.3 System Model and Problem Formulation . . . . . . . . . . . 133
8.4 Heuristic Approach . . . . . . . . . . . . . . . . . . . . . . . . 137
8.5 Testbed Implementation . . . . . . . . . . . . . . . . . . . . . 141
8.6 Evaluation . . . . . . . . . . . . . . . . . . . . . . . . . . . . . 142
8.7 Conclusion and Outlook . . . . . . . . . . . . . . . . . . . . . 151
8.1 Introduction
In the previous Part III, we have introduced a control and execution frameworkfor Edge Computing. This framework provides the basis to manage the lifecycle ofedge deployments. Most notably for this section, the framework has to make thedecision on where to place (connected) components of an application, given a setof networked nodes that make a certain amount of resources available. This sectionwill be focused on precisely that decision.
Placing topologies of processing units onto network topologies has been widelyresearched, e.g., in the context of complex event processing (CEP), and labeled op-erator placement. Operators in a broad context are functional components, oftenlightweight, that carry out a specific task. Operators can be further characterizedby certain properties, such as their resource requirements and required bandwidth(e.g., for forwarding the result of a computation). In the majority of cases, opera-tors do not stand alone, but are part of an operator graph, i.e., a chain of multiple
1Large parts of this chapter are verbatim copies from [Ged+18e]. Those text segments are printed ingray color. Tables and figures taken or adapted from this publication are marked with † in their caption.
129
130 Chapter 8. Operator Placement
operators. The edges in such a graph represent the logical flow of data betweenoperators for subsequent computing steps.
For these reasons, the lightweight microservices of our Edge Computing frame-work as defined in Section 7.3.1, can be considered as one example of operators.Another example would be function-as-a-service instances (see Section 7.2.3) orapplication-level remote application procedure calls (RPCs). In this section, wewill therefore examine the placement of microservices in the terminology of theestablished problem domain of operator placement. While this includes some re-strictions on our model, e.g., w.r.t. the topology of operator graphs (see Section 8.2and Section 8.3.2) the placement strategies presented in this chapter can be appliedto a number of applications in the domain of Edge Computing, e.g., in streaminganalytics where data originates from sensors at the edge.
The motivation for this chapter stems from the fact that solving large instancesof the operator placement problem optimally is computationally hard [EL16] and,thus, unfeasible in practice. However, in many cases, placement decisions have tobe made quickly. For instance, offloading computations often happens on-demand,when a certain service is requested. Delays in the placement decision slow downthe overall provisioning process for that service, which can lead to unsatisfactoryexperiences for users. Being able to make placement decisions quickly also allowsfor frequent reconfiguration. For instance, this is required in case of user mobilityor changes in service demands. Therefore, reducing the time it takes to computean assignment of operators to network nodes is crucial in large-scale dynamic en-vironments.
While the general operator placement problem has been extensively researched,some of the existing works consider homogeneous environments, e.g., the place-ment of operators or network functions in data centers, and focus on the optimiza-tion of either resource consumption of computing nodes or on network metrics.However, we have seen that this does not represent an Edge Computing environ-ment, where available resources and network conditions are heterogeneous in var-ious aspects. When mapped to such a heterogeneous environment, the placementproblem becomes more challenging.
Overview of approach. Following the discussion from Section 2.1, we want toinclude all resources on the continuum between end users and the cloud in ourmodel. To model the difference between very proximate resources and those furtherin the core network, we introduce an architecture as a reference model that consistsof three tiers: edge, fog, and cloud nodes. The nodes typically differ across thetiers in terms of placement cost, link quality, and computational capacity. Becausethese tiers help us to capture various (edge) computing devices, we summarize theproblem this chapter addresses with the general term in-network operator placementproblem (INOP).
We propose a heuristic approach that works by modifying the input to an ILPmodel that represents the INOP problem. More specifically, we introduce con-straints on the placement decisions that reduce the solution space, and hence, thesolving time. These constraints exploit the characteristics of the individual tiersof our edge-fog-cloud architecture and the topologies of both the network and theoperator graphs. To this end, we define three general heuristic approaches: (i)restricting the placement of a certain operator to a subset of nodes, (ii) fixing theplacement of an operator to exactly one node (pinning), and (iii) enforcing the
8.2. Related Work 131
colocation of operators on the same nodes. For each of our heuristic approaches,we implement example instances to demonstrate the feasibility of this approach.Besides the individual heuristics, we also investigate their combination. We showthat this approach considerably reduces the time required to compute a placementdecision while only leading to a small optimality gap.
Summary of contributions. In summary, this chapter provides three main con-tributions:
• We define a model for the heterogeneous in-network operator placementproblem (Section 8.3). We formulate this problem in the context of a 3-tierarchitecture consisting of edge, fog, and cloud nodes.
• We propose an approach for reducing the solving time of the placement prob-lem by using heuristics that modify the original placement problem. Sec-tion 8.4 introduces three general classes of such heuristics: (i) placementrestriction, (ii) operator pinning, and (iii) operator colocation.
• For each of these classes, we implement representative instances in a testbed(Section 8.5). Furthermore, besides applying the heuristics individually, wesuggest three combinations of them. We evaluate our approach with respectto the reduction in the solving time of the problem and the introduced opti-mality gap (Section 8.6).
8.2 Related Work
The problem of operator placement has been studied extensively, especially in thecontext of (distributed) stream processing [Che+03; Ste97] and (distributed) com-plex event processing (CEP) [CM12; CM13]. Lakshmanan et al. [LLS08] survey andclassify placement strategies for stream processing systems. The authors present ageneral definition of the placement problem, in which operators in a logical flowgraph are assigned to processing nodes in a physical topology. Besides operators,a logical flow graph contains data sources (termed producers) and sinks (termedconsumers). Our model (see Section 8.3) shares these basic characteristics in itsdefinitions of operator graphs and an underlay network. In addition, the surveyprovides an analysis regarding which of the surveyed approaches is applicable inwhich domain. Hirzel et al. [Hir+13] survey different optimization mechanismsfor stream processing. Among the optimization mechanisms, placement is definedas assigning operators to hosts and cores. An important observation of the surveyis that placement trades communication costs for resource utilization when severaloperators are placed on the same host. In the colocation heuristic we will intro-duce in Section 8.4.3, we will consider this observation to enforce the colocation ofcertain operators.
Network-awareness. We can distinguish between network-agnostic [Che+03;Pen+15] and network-aware approaches [Pie+06; RDR10; ZA08]. The former donot consider network characteristics (e.g., the latency and available bandwidth onthe links), while the latter do. Considering network characteristics is crucial in theEdge Computing scenarios we examine because delays have a considerable impacton the delivered quality-of-service. It therefore makes sense to consider both the

132 Chapter 8. Operator Placement
network and the resource dimension (i.e., how many resources are available atspecific nodes and what the costs of placing functionality on the nodes are). Ourproposed model considers both the network and the resource dimension in theoperator placement problem.
Pietzuch [Pie+06] and Rizou [RDR10] present approaches to minimize the net-work usage. However, they do not consider the differences in placement costsor constraints such as available bandwidth on the network links. Carabelli et al.[Car+12] present a linear programming relaxation for a placement problem thatminimizes the bandwidth-delay product.
Homogeneous vs. heterogeneous environments. Similar to our work, Cardelliniet al. [Car+16] provide a comprehensive model for the operator placement prob-lem. However, in their scalability analysis of the problem, only a homogeneousenvironment is considered. Nardelli et al. [Nar+19] consider a heterogeneousenvironment to place components of a stream processing system. However, theauthors do not model the different locations of data sources and sinks along theedge–cloud continuum. Similarly, Sharma et al. [Sha+11] investigate the taskplacement problem in an heterogeneous environment that is limited to CloudComputing infrastructure.
Unrealistic assumptions for Edge Computing environments. Several workssuch as [ZA08] and [Hua+11] do not allow the placement of multiple operators onone node, or consider an equal number of operators and nodes [MK16]. We arguethat these are unrealistic assumptions for Edge Computing scenarios. Especiallythe first is in stark contrast to multi-tenant Edge Computing environments (seeSection 3.5.2). Others assume uniform capacity of the processing nodes [EL16] orrestrict the underlying topology, e.g., to a tree topology [SP15]. In contrast, ourheuristics do not have these restrictions.
Comparable approaches. User-defined constraints for the placement are intro-duced in [TLL14], but no network costs are taken into account. Furthermore, theconstraints have to be specified manually by the user. In contrast, our approachautomatically generates placement constraints from a given problem input and thecharacteristics of our 3-tiers of edge, fog, and cloud nodes. Closest to ours is thework of Bahreini and Grosu [BG17]. The authors propose a heuristic approachto the placement problem of multi-component edge applications. Contrary to ourproblem formulation, they take into account user mobility but do not model threetiers of data source and link locations—something we argue is crucial to capturethe real-world characteristics of edge applications.
Comparison to similar problems. The problem of operator placement has somesimilarities to the virtual network embedding (VNE) problem, e.g., the placementof virtual network functions [Coh+15]. Similarly, Even, Rost, and Schmid [ERS16]investigate the problem of placing SDN functions. However, virtual network em-bedding mostly deals with the placement of virtual networks or virtual networkfunctions in data center environments [Wan+15]. Compared to the problem we ad-dress in this chapter, the infrastructure on which the network functions are placedis more homogeneous w.r.t. the resources they offer. In contrast to that, we address

8.3. System Model and Problem Formulation 133
TABLE 8.1: NOTATION OF THE INOP PROBLEM
V Set of underlay nodes
SRC Set of data sources
SNK Set of data sinks
E Set of underlay edges
G = (V ∪ SRC ∪ SNK , E) Underlay graph
Cv Node capacity
Be Link bandwidth
O Set of operators
wo Operator workload
F Set of edges in the operator graph
fo1,o2Bandwidth requirement of data flow between operators
H = (O ∪ SRC ∪ SNK , F) Operator graph
xo,v Binary decision variable for operator placement
yu,vo1,o2
Binary decision variable for routing of operator flows
α Cost weight factors
po,v Placement cost
P Aggregated placement costs
qu,v Link cost
Q Total link cost
the heterogeneity of nodes on the different tiers (edge, fog, and cloud). Further-more, existing work on VNF placement considers only one data source [Lui+15],whereas our operator graphs can have multiple data sources.
In some peer-to-peer networks, dedicated nodes, referred to as brokers exist.Brokers are intermediaries and relay information between regular nodes in the net-work (e.g., to implement discovery mechanisms). Placing such brokers is oftendone w.r.t. to the latency when the given brokers are overloaded [GES08].
Summary. In conclusion, related work in the domain of operator placementcomes mostly from the domains of (distributed) stream processing and (distributed)complex event processing. It is worth noting that—same as our model—works fromthis domain assume a restricted topology of the operator graph(s), in the sense thatthey are acyclic. While we adopt these limitations, our approach differs in thesense that we operate on a network of nodes in a 3-tier architecture of edge, fog,and cloud nodes. Based on this architecture, we define placement constraints in aheterogeneous (w.r.t. resources and connection characteristics) network topology.
8.3 System Model and Problem Formulation
In this section, we describe the formal model for the in-network operator placement(INOP) problem. Based on the introduced model, we formulate the placement prob-lem with an integer linear program (ILP). A summary of the notation can be foundin Table 8.1.
134 Chapter 8. Operator Placement
8.3.1 Underlay Network
We define the underlay network as the joint representation of networked nodes onwhich computations can be carried out, the producers and consumers of data (here-inafter termed sources and sinks), and the physical interconnections between them.This definition is in line with common models for the placement problem in streamprocessing systems (see [LLS08]). Hence, the underlay models our infrastructurefor computation and communication. We model the underlay network as an undi-rected graph G = (V ∪ SRC ∪ SNK , E), where V is the set of nodes that can hostoperators. In addition, there are two special types of nodes that represent sourcesthat emit data to be processed (SRC) and sinks where the result of the processing isto be delivered (SNK). These nodes can for example represent sensors, or actuatorsat the start and end of an execution pipeline, following the model of CEP and streamprocessing. E = {⟨u, v⟩ |u,v∈V∪SRC∪SNK} denotes the set of links interconnecting thenodes.
Each node v ∈ V has a capacity Cv , which denotes the maximum computationalload that node v can handle. We can easily model the case where the node isnot part of the computing infrastructure (for example, where it just represents aforwarding middlebox) by setting Cv = 0 for that particular node. For each linke = ⟨u, v⟩ ∈ E, we consider that its capacity is upper-bounded by its bandwidthBe. Note that multiple data streams (e.g., from different operator graphs, see nextSection 8.3.2) may be routed through one underlay link, and therefore, the upperbound applies to the aggregated data flows on that link. We assume that routingin the network is according to shortest paths, which is in line with current datacommunication networks.
8.3.2 Operator Graphs
In our in-network processing scenario, data is generated by the sources nodes,processed by a well-defined series of operators and ultimately transferred to datasinks. Operator graphs are linear sequences and can have multiple source and sinknodes. We model this logical flow of data as an operator graph, which is a directedacyclic graph (DAG) H = (O∪ SRC ∪ SNK , F), where O is the set of operators, andSRC and SNK the same set of data sources and sinks as defined in Section 8.3.1.F ⊆ {⟨o1, o2⟩ |o1,o2∈O∪SRC∪SNK} represents the data flows between the operators,sources and sinks. Note that H can also be used to represent multiple operatorgraphs by including them as edge-disjoint subgraphs into H. Each operator o ∈ O ischaracterized by a workload wo, which represents the computational capacity thatis required to execute the operator. For each flow ⟨o1, o2⟩ ∈ F , fo1,o2
denotes theaverage bandwidth requirement for the transfer of data between nodes in the oper-ator graph. For the placement, we assume that there is at least one link from eachsource node that satisfies this source’s outgoing bandwidth demand, i.e.,
∀src ∈ SRC ∃(src, o) ∈ E : Be ≥ fsrc,o (8.1)
8.3.3 Operator Placement
The INOP problem aims to make decisions on the placement of operators from anoperator graph on the underlay nodes, i.e., the actual computing resources. Tocapture the structure of this decision-making, we use binary decision variables asfollows. We introduce xo,v ∈ {0,1}, which characterizes the placement decision of
8.3. System Model and Problem Formulation 135
each operator o ∈ O to every underlay node v ∈ V . We set xo,v = 1 if operator ois placed on node v; otherwise xo,v = 0. Every placement decision is unique andoperator workload cannot be fragmented, i.e., an operator can only be placed onexactly one node. We model this through the following constraint:
∑v∈V
xo,v = 1,∀o ∈ O. (8.2)
In addition, operators have to be placed subject to node capacity constraints, i.e.,∑o∈O
xo,vwo ≤ Cv ,∀v ∈ V. (8.3)
For a pair of operators o1 ∈ O and o2 ∈ O, where ⟨o1, o2⟩ ∈ F and each underlaylink ⟨u, v⟩ ∈ E, we introduce indicating variables yu,v
o1,o2∈ {0,1} to represent whether
flow ⟨o1, o2⟩will be routed through underlay link ⟨u, v⟩. Note that in practice, manyinstances of this variable are zero, because it has to be set for every possible com-bination of flows between operators and underlay links. However, modeling theproblem in such a way is practical for ILP solvers in order to aggregate the con-sumed bandwidth on an underlay link. The bandwidth constraints for the underlaylinks should not be violated, i.e.,
∑⟨o1,o2⟩∈F
yu,vo1,o2
fo1,o2≤ Bu,v ,∀⟨u, v⟩ ∈ E. (8.4)
As we adopt shortest-path-based routing in the underlay network, yu,vo1,o2
actuallydepends on both xo1,v and xo2,v . More specifically, for all ⟨o1, o2⟩ ∈ F , we have
xo1,u =∑v∈V
yu,vo1,o2
and xo2,v =∑u∈V
yu,vo1,o2
. (8.5)
8.3.4 Cost Model
The objective of the INOP problem is to make placement decisions to achieve cost-effectiveness. We consider two types of costs, namely, placement costs and linkcosts. Because we want to address the placement problem in the context of dif-ferent stakeholders (see Section 3.4), we assume heterogeneous costs for placingoperators on nodes. Besides representing different underlying business models ofthe stakeholders, the heterogeneous placement costs can also model varying tech-nical efforts that are required to execute a certain operator. This is also dependenton both the operator and the underlay node. Hence, for a given operator o ∈ O anda given node v ∈ V , the placement cost is given by po,v . With this definition, theaggregated placement cost is given by
P =∑o∈O
∑v∈V
po,v xo,v . (8.6)
For each link ⟨u, v⟩ ∈ E in the network, a cost qu,v is associated with that link. Thiscost attribute can be used to represent quality-of-service (QoS) attributes such aslatency or the monetary cost for using the link. These link costs occur whenever

136 Chapter 8. Operator Placement
data flows on the (logical) edges of the operator graph use a physical link in theunderlay. The total link costs are therefore given by
Q =∑
⟨u,v⟩∈E
∑⟨o1,o2⟩∈F
qu,v · yu,vo1,o2
. (8.7)
We believe that the above two cost types are both practical and generic enoughto capture a wide range of real-world performance metrics. To model tradeoffsbetween the two costs, we introduce a parameter α ∈ [0,1] to weigh the differentcosts. Given these definitions, the total cost for a placement decision is given by
Cost = αP + (1−α)Q. (8.8)
EXAMPLE 8.1: PLACEMENT EXAMPLE
n1
SRC
n3
n2
n4
n5
n6
SNK
SRC 01 02 03 SNK
Und
erla
y N
etw
ork
Ope
rato
r G
raph
This figure shows a simple instance ofthe placement problem. Source-sinkpinnings are shown by the solid redlines. Blue dashed lines represent apossible result as returned by a place-ment algorithm. In our evaluation, wewill consider a more complex under-lay network as well as different typesof operator graphs.
8.3.5 Problem Formulation
Based on the presented model, we formulate the INOP problem as follows: For agiven underlay network and operator graphs2 find an assignment for each operatorto an underlay node, such that the cost function (8.8) is minimal. An example ofan outcome for a placement decision is shown in Example 8.1. More formally, weformulate the problem with the following integer linear program (ILP).
min Cost
s.t. (8.2), (8.3), (8.4)xo,v ∈ {0, 1}, ∀o ∈ O, ∀v ∈ V.
This ILP model is the basis for our evaluation of placement approaches. Section 8.5will detail how we expressed the INOP problem in a testbed implementation usinga modeling language for optimization problems.
8.3.6 Edge-Fog-Cloud Architecture
Contrary to previous works in this domain, we examine the placement problemspecifically in the context of in-network processing, where we consider the networkto be in a 3-tier architecture, consisting of edge, fog and cloud nodes. This dis-tinction follows the (sometimes subtle) distinction between edge and fog that is
2Recall that our model of operator graphs as described in Section 8.3.2 allows to represent multipleoperator graphs using the set notation of one DAG.

8.4. Heuristic Approach 137
CLOUD
FOG
EDGE
CLOUDCLOUDCLOUD
FIGURE 8.1: 3-TIER ARCHITECTURE OF EDGE, FOG, AND CLOUD NODES
commonly found in literature (see Section 2.1). It is important to note that thetiers include computing nodes as well as data sources and sinks, since those canalso be located in different tiers. Cloud nodes represent data center infrastructureswhile fog nodes are middleboxes or gateways for end devices. Edge nodes are theend devices or devices in immediate proximity of the user. These different types ofnodes allow us to model the different characteristics of the devices encountered inthe respective tiers, e.g., with regards to their capacity and network connectivity.For our placement heuristics, we can further leverage the specifics of these 3 tiers.Note that contrary to, e.g., the definitions of MEC3, we model powerful resourcesat gateways to be in the fog tier. As an example, depending on the locations of thesources and the sinks, we can restrict the placement of operators to a certain subsetof underlay nodes, such as underlay nodes in a certain tier. Figure 8.1 shows the3-tier architecture with example devices in each tier.
EXPLANATION 8.1: NETWORK TOPOLOGY
We assume cloud nodes to be fully connected, fog nodes to resemble aLAN/WAN topology, and edge nodes to have a connection to at least one fognode that acts as a gateway for this edge node. Edge nodes are organized inclusters, depending on which fog node they are connected to. Furthermore,edge nodes have a probability to be connected to more than one fog node andan ad-hoc connection probability to other edge nodes.
8.4 Heuristic Approach
To reduce the solving time of the placement problem, i.e., the time it takes to com-pute a placement, we propose an approach in which we modify the original probleminput. We use an ILP solver to compute both the optimal solution and a solution
3Mobile Edge Computing, see Section 2.1
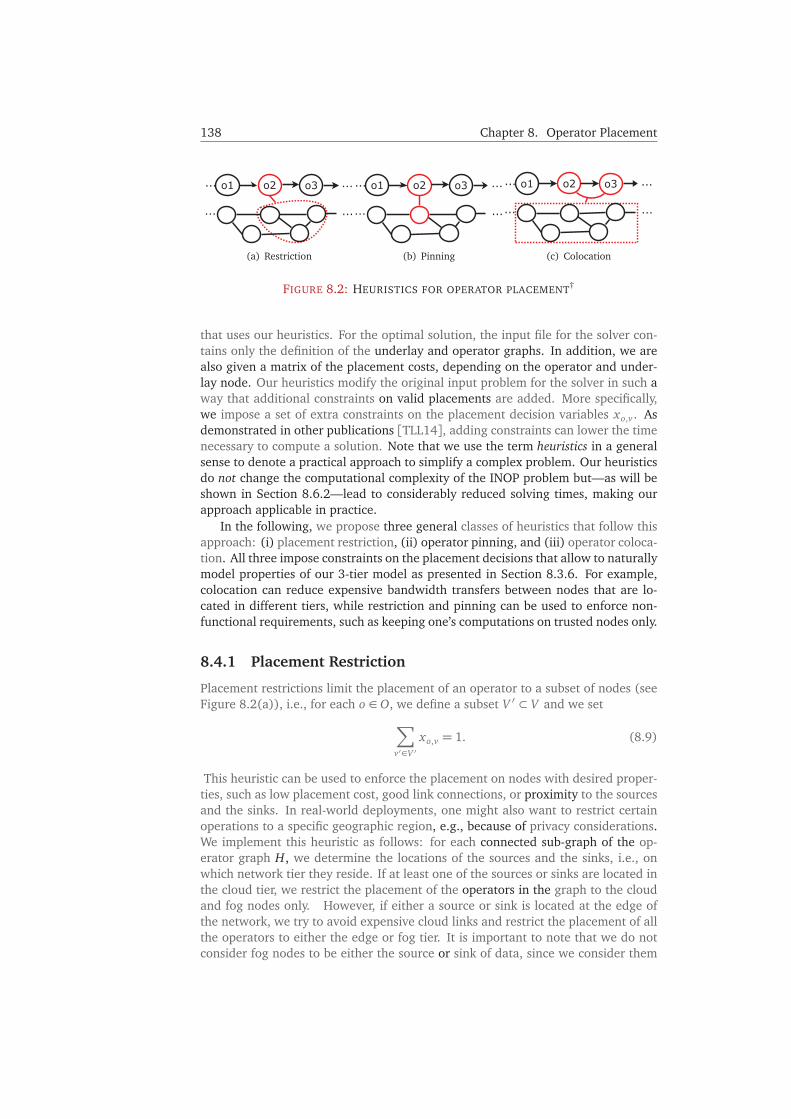
138 Chapter 8. Operator Placement
(a) Restriction (b) Pinning (c) Colocation
FIGURE 8.2: HEURISTICS FOR OPERATOR PLACEMENT†
that uses our heuristics. For the optimal solution, the input file for the solver con-tains only the definition of the underlay and operator graphs. In addition, we arealso given a matrix of the placement costs, depending on the operator and under-lay node. Our heuristics modify the original input problem for the solver in such away that additional constraints on valid placements are added. More specifically,we impose a set of extra constraints on the placement decision variables xo,v . Asdemonstrated in other publications [TLL14], adding constraints can lower the timenecessary to compute a solution. Note that we use the term heuristics in a generalsense to denote a practical approach to simplify a complex problem. Our heuristicsdo not change the computational complexity of the INOP problem but—as will beshown in Section 8.6.2—lead to considerably reduced solving times, making ourapproach applicable in practice.
In the following, we propose three general classes of heuristics that follow thisapproach: (i) placement restriction, (ii) operator pinning, and (iii) operator coloca-tion. All three impose constraints on the placement decisions that allow to naturallymodel properties of our 3-tier model as presented in Section 8.3.6. For example,colocation can reduce expensive bandwidth transfers between nodes that are lo-cated in different tiers, while restriction and pinning can be used to enforce non-functional requirements, such as keeping one’s computations on trusted nodes only.
8.4.1 Placement Restriction
Placement restrictions limit the placement of an operator to a subset of nodes (seeFigure 8.2(a)), i.e., for each o ∈ O, we define a subset V ′ ⊂ V and we set
∑v′∈V ′
xo,v = 1. (8.9)
This heuristic can be used to enforce the placement on nodes with desired proper-ties, such as low placement cost, good link connections, or proximity to the sourcesand the sinks. In real-world deployments, one might also want to restrict certainoperations to a specific geographic region, e.g., because of privacy considerations.We implement this heuristic as follows: for each connected sub-graph of the op-erator graph H, we determine the locations of the sources and the sinks, i.e., onwhich network tier they reside. If at least one of the sources or sinks are located inthe cloud tier, we restrict the placement of the operators in the graph to the cloudand fog nodes only. However, if either a source or sink is located at the edge ofthe network, we try to avoid expensive cloud links and restrict the placement of allthe operators to either the edge or fog tier. It is important to note that we do notconsider fog nodes to be either the source or sink of data, since we consider them
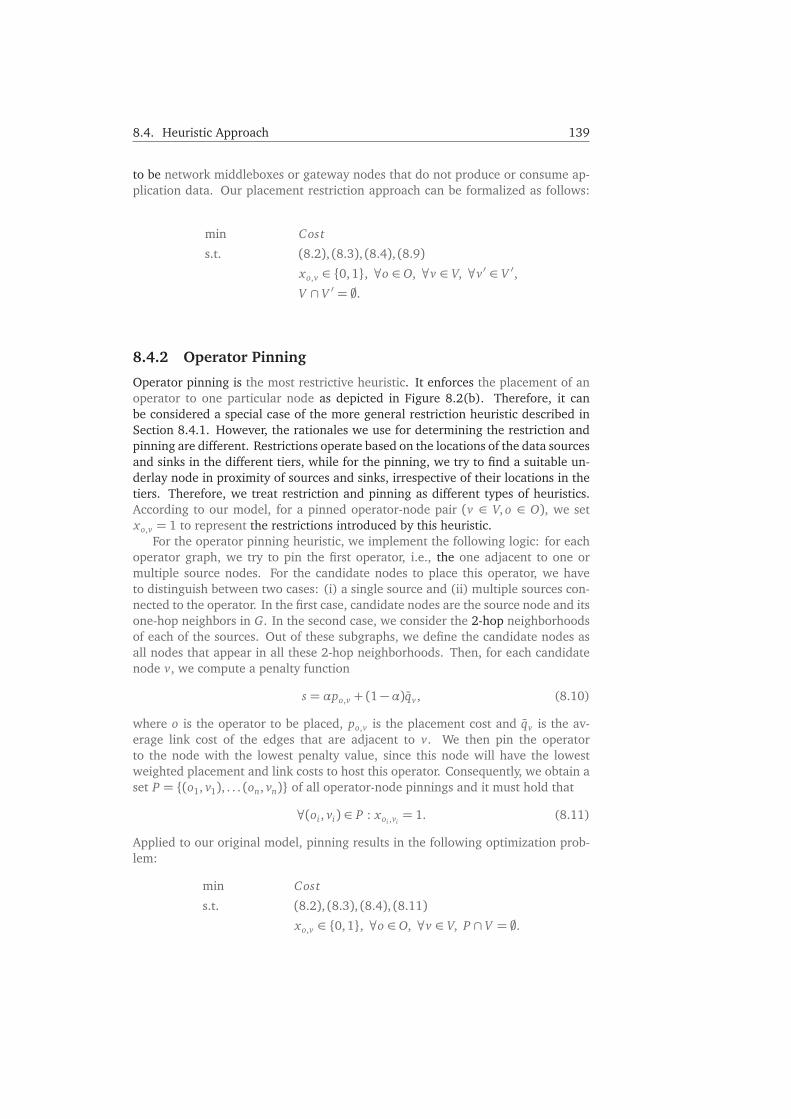
8.4. Heuristic Approach 139
to be network middleboxes or gateway nodes that do not produce or consume ap-plication data. Our placement restriction approach can be formalized as follows:
min Cost
s.t. (8.2), (8.3), (8.4), (8.9)xo,v ∈ {0, 1}, ∀o ∈ O, ∀v ∈ V, ∀v′ ∈ V ′,V ∩ V ′ = �.
8.4.2 Operator Pinning
Operator pinning is the most restrictive heuristic. It enforces the placement of anoperator to one particular node as depicted in Figure 8.2(b). Therefore, it canbe considered a special case of the more general restriction heuristic described inSection 8.4.1. However, the rationales we use for determining the restriction andpinning are different. Restrictions operate based on the locations of the data sourcesand sinks in the different tiers, while for the pinning, we try to find a suitable un-derlay node in proximity of sources and sinks, irrespective of their locations in thetiers. Therefore, we treat restriction and pinning as different types of heuristics.According to our model, for a pinned operator-node pair (v ∈ V, o ∈ O), we setxo,v = 1 to represent the restrictions introduced by this heuristic.
For the operator pinning heuristic, we implement the following logic: for eachoperator graph, we try to pin the first operator, i.e., the one adjacent to one ormultiple source nodes. For the candidate nodes to place this operator, we haveto distinguish between two cases: (i) a single source and (ii) multiple sources con-nected to the operator. In the first case, candidate nodes are the source node and itsone-hop neighbors in G. In the second case, we consider the 2-hop neighborhoodsof each of the sources. Out of these subgraphs, we define the candidate nodes asall nodes that appear in all these 2-hop neighborhoods. Then, for each candidatenode v, we compute a penalty function
s = αpo,v + (1−α)qv , (8.10)
where o is the operator to be placed, po,v is the placement cost and qv is the av-erage link cost of the edges that are adjacent to v. We then pin the operatorto the node with the lowest penalty value, since this node will have the lowestweighted placement and link costs to host this operator. Consequently, we obtain aset P = {(o1, v1), . . . (on, vn)} of all operator-node pinnings and it must hold that
∀(oi , vi) ∈ P : xoi ,vi= 1. (8.11)
Applied to our original model, pinning results in the following optimization prob-lem:
min Cost
s.t. (8.2), (8.3), (8.4), (8.11)xo,v ∈ {0,1}, ∀o ∈ O, ∀v ∈ V, P ∩ V = �.
140 Chapter 8. Operator Placement
8.4.3 Operator Colocation
While our model naturally allows for operators to be colocated on one node, thisheuristic enforces the colocation of certain operators to one underlay node. For-mally, we define a pair of operators (o1 ∈ O, o2 ∈ O), and it must hold true that∃v ∈ V , xo1,v = xo2,v = 1. As an example, Figure 8.2(c) depicts the colocationof operators o2 and o3. The colocation of operators requires a tradeoff betweenplacement costs and communication costs. Consider a scenario where operator o1precedes operator o2. Colocating these two operators on one underlay node is mostlikely beneficial to the overall utility of the system if operator o2 is lightweight interms of resource utilization and placement costs, and the communication betweeno1 and o2 requires high bandwidth. To model this, we compute a score for each pairof neighboring operators o1 and o2, i.e., ⟨o1, o2⟩ ∈ F , defined by
s =fo1,o2
α(po1,v + po2,v + wo1+ wo2
), (8.12)
where fo1,o2is the bandwidth of the flow between the two operators, po,v denotes
the average placement cost of the operator (across all underlay nodes) and wo theworkload of the operator. Since colocation does not restrict the set of nodes onwhich the colocated operators can be placed, we choose the sum of the averageplacement cost across all underlay nodes to represent the impact of the costs. Notethat this can be replaced by other metrics, such as the median value or a certainpercentile. The score will favor the colocation of operators with high bandwidthdemands, while taking into account their placement costs and workload. We thenselect no operator pairs with the highest score to colocate. Empirically, we deter-mined no = �|O|/5� to be an appropriate value. Mapped to our optimization prob-lem, we then get a set OC = {(o1, o2), . . . (on, on+1)} for which the following musthold:
∀(oi , oj) ∈ OC : ∃v ∈ V, xoi ,v = xoj ,v = 1 (8.13)
Our modified problem for the colocation of operators can therefore be defined asfollows:
min Cost
s.t. (8.2), (8.3), (8.4), (8.13)xo,v ∈ {0,1}, ∀o ∈ O, ∀v ∈ V, OC ∩ V = �.
8.4.4 Strategies for Combining Heuristics
While the three heuristics described above can be applied individually, we can thinkof ways to combine them, i.e., to apply more than one heuristic for a given inputproblem. Figure 8.3 shows a flowchart that describes the different possible ways ofcombining our heuristics. We first have the option to pin certain operators to an un-derlay node. Then, the more general, i.e., less restrictive, heuristics restriction andcolocation can be applied independently. It is important to note that these combina-tions do not work in isolation but influence each other and might be contradictory.This is especially true for the pinning heuristic. We consider the following threecombinations of heuristics:

8.5. Testbed Implementation 141
FIGURE 8.3: FLOWCHART DENOTING THE SEQUENCE OF PLACEMENT HEURISTICS†
COMB-1: PINNING → RESTRICTION | As the first combination, we apply pinningand then restriction of operators. Note that the restrictions will not be appliedto already pinned operators, because this might lead to contradictions, e.g.,the pinning computes the placement of an operator to a node which is not inthe set of possible nodes according to the restriction heuristic.
COMB-2: PINNING → COLOCATION | For this combination, we first apply pinningand additionally the colocation of operators. Similar to COMB-1, operatorsthat are pinned will not be in the candidate set considered for colocation. Forexample, consider that the pinning heuristic fixes the placement of an oper-ator o1 on a node A, and the colocation heuristic enforces the colocation ofoperators o1 and o2, but the capacity of node A is less than the workload of o1and o2 combined. Therefore, when pinning is applied before other heuristics,we do not consider the pinned operators for other heuristics applied after-ward.
COMB-3: RESTRICTION� COLOCATION | Lastly, we leave out the pinning heuristicand combine restriction with colocation. Contrary to the previous combina-tions, this does not require the exclusion of operators from the heuristic thatis applied second and, hence, the two heuristics can be applied in arbitraryorder.
8.5 Testbed Implementation
To evaluate our placement heuristics, we built a simulation-based testbed. Itsmain components are implemented in Python. Figure 8.4 shows the compo-nents of the testbed. The main component that carries out the simulations(simulation.py) takes a configuration file as input. This file specifies thesimulation parameters, such as the sizes or properties of input graphs. Accord-ingly, a graph generator (graphgen.py) is responsible for creating underlay

142 Chapter 8. Operator Placement
and operator graph inputs. Our proposed heuristics are implemented in sepa-rate source files (heuristics_restriction.py, heuristics_pinning.py,and heuristics_colocation.py) and the heuristic’s functionalities called fromthe main simulation component.
We used Pyomo4 as a tool to model the ILP problem in Python. The filemodel.py implements our model as defined in Section 8.3. The complete sourcecode of the model can be found in Appendix F. Another component of our sim-ulation utilities (solver.py) is responsible for interacting with the concrete ILPsolver. It submits the (modified) problem to the solver and parses the results (i.e.,the placement decisions and the time the solver took). Pyomo features support fordifferent solvers. For our evaluation, we used the GNU Linear Programming Kit5
(GLPK) as a solver for the ILP problem.
FIGURE 8.4: TESTBED IMPLEMENTATION
8.6 Evaluation
Using our implemented testbed as described in the previous Section 8.5, we nowevaluate our approach. We first describe our experimental setup (Section 8.6.1).Our evaluation quantifies the gain in resolution time for the placement (Sec-tion 8.6.2) and the optimality gap of the heuristic-based solutions (Section 8.6.3).We further discuss and compare our results in Section 8.6.4.
8.6.1 Experimental Settings
8.6.1.a Underlay network
For our evaluation, we define three network underlays of different sizes. Their char-acteristics are shown in Table 8.2. To take into account the different characteristicsof nodes and connections in the different tiers, Table 8.3 summarizes the values weset for the capacity, link costs, and available bandwidth. The parameters for theunderlay networks were chosen such as to represent the differences in the devices’characteristics on each tier. Recall that the link cost property can be used to modeldifferent properties related to the usage of that particular link, e.g., the latency.
4https://www.pyomo.org/ (accessed: 2019-11-13)5https://www.gnu.org/software/glpk/ (accessed: 2019-11-13)
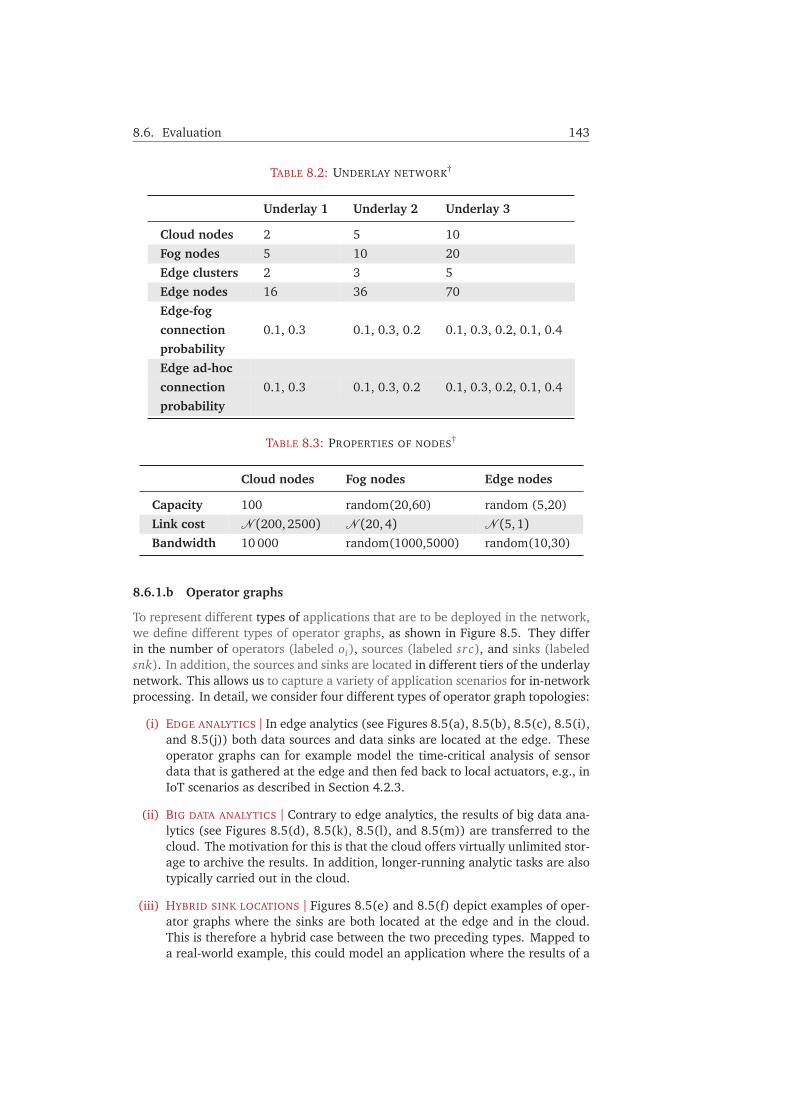
8.6. Evaluation 143
TABLE 8.2: UNDERLAY NETWORK†
Underlay 1 Underlay 2 Underlay 3
Cloud nodes 2 5 10
Fog nodes 5 10 20
Edge clusters 2 3 5
Edge nodes 16 36 70
Edge-fog
connection 0.1, 0.3 0.1, 0.3, 0.2 0.1, 0.3, 0.2, 0.1, 0.4
probability
Edge ad-hoc
connection 0.1, 0.3 0.1, 0.3, 0.2 0.1, 0.3, 0.2, 0.1, 0.4
probability
TABLE 8.3: PROPERTIES OF NODES†
Cloud nodes Fog nodes Edge nodes
Capacity 100 random(20,60) random (5,20)
Link cost � (200, 2500) � (20,4) � (5, 1)Bandwidth 10 000 random(1000,5000) random(10,30)
8.6.1.b Operator graphs
To represent different types of applications that are to be deployed in the network,we define different types of operator graphs, as shown in Figure 8.5. They differin the number of operators (labeled oi), sources (labeled src), and sinks (labeledsnk). In addition, the sources and sinks are located in different tiers of the underlaynetwork. This allows us to capture a variety of application scenarios for in-networkprocessing. In detail, we consider four different types of operator graph topologies:
(i) EDGE ANALYTICS | In edge analytics (see Figures 8.5(a), 8.5(b), 8.5(c), 8.5(i),and 8.5(j)) both data sources and data sinks are located at the edge. Theseoperator graphs can for example model the time-critical analysis of sensordata that is gathered at the edge and then fed back to local actuators, e.g., inIoT scenarios as described in Section 4.2.3.
(ii) BIG DATA ANALYTICS | Contrary to edge analytics, the results of big data ana-lytics (see Figures 8.5(d), 8.5(k), 8.5(l), and 8.5(m)) are transferred to thecloud. The motivation for this is that the cloud offers virtually unlimited stor-age to archive the results. In addition, longer-running analytic tasks are alsotypically carried out in the cloud.
(iii) HYBRID SINK LOCATIONS | Figures 8.5(e) and 8.5(f) depict examples of oper-ator graphs where the sinks are both located at the edge and in the cloud.This is therefore a hybrid case between the two preceding types. Mapped toa real-world example, this could model an application where the results of a

144 Chapter 8. Operator Placement
processing pipeline are required for immediate actuation at the edge and alsoarchived in the cloud.
(iv) HYBRID SOURCE LOCATIONS | Besides hybrid sink locations, the sources of thedata could also be located at different tiers, as shown in Figures 8.5(g) and8.5(h). This type of operator graph models applications that require bothdata sourced at the edge (e.g., contextual data from the environment) andfrom the cloud (e.g., retrieved from large databases) for their computations.
TABLE 8.4: INPUT SIZES FOR THE OPERATOR GRAPHS†
Operator Source Sink
Graphs / Sources Sinks locations locations
Operators (Edge / (Edge /Cloud) (Cloud)
gs1 5 / 17 8 6 8 / 0 4 / 2
gs2 6 / 20 10 8 10 / 0 4 / 4
gs3 7 / 24 11 9 10 / 1 4 / 5
gs4 8 / 28 14 11 11 / 3 5 / 6
gs5 9 / 32 15 12 12 / 3 6 / 6
gs6 10 / 35 17 15 13 / 4 8 / 7
gs7 11 / 39 19 16 15 / 4 9 / 7
gs8 12 / 44 20 17 16 / 4 10 / 4
gs9 13 / 47 21 19 17 / 4 12 / 4
gs10 14 / 50 22 20 17 / 5 12 / 5
gs11 15 / 54 25 22 20 / 5 13 / 6
From these different types of operator graphs, we generate varying input prob-lem sizes by combining different types of operator graphs. In total, we consider 11different operator graph inputs, labeled gs1 through gs11. Their properties, suchas the number of operators, sources, and sinks are summarized in Table 8.4. Ap-pendix G details which operator graphs are contained in the different inputs. Theoperators were assigned a random workload between 2 and 5. The required band-width between the operators varies between 5 and 20. Placement costs are alsorandomly generated within the range of 10 to 30. We perform the evaluation usingevery combination of underlay size and operator graphs described above. For everycombination, we report the average results of 5 simulation runs. We set α = 0.5,meaning that placement and link costs are weighted equally.
8.6.2 Performance Analysis
First, we analyze the performance of our proposed heuristics, i.e., the reductionin solving time for the placement problem. Figure 8.6 shows the results of thisanalysis for the different underlay network sizes. The overhead, i.e., the time ittakes to compute the placement constraints of the heuristics and apply them to theinitial mode, is included in the measurement times reported in this section.

8.6. Evaluation 145
src
src
o1 o2 o3 snk
EDGE EDGE
(a) Edge analytics #1
sr c
sr c
o1 o2 o3snk
EDGE EDGE
(b) Edge analytics #2
(c) Edge analytics #3
src
src
o1 o2 o3
snk
EDGE CLOUD
snk
(d) Big data analytics #1
src
src
o1 o2 o3
snk
snk
EDGE
CLOUD
EDGE
(e) Hybrid sink locations #1
src o1 o2 o3
EDGE
o4
src
src
snk
snk
CLOUD
EDGE
(f) Hybrid sink locations #2
src o1 o2 o3
EDGE
o4
src
src
CLOUDsnk
snk
CLOUD
EDGE
(g) Hybrid source locations #1
sr co1 o2 o3
EDGE
sr c
sr cCLOUDsnk
snk
CLOUD
EDGE
(h) Hybrid source locations #2
(i) Edge Analytics #4
src o1 o2 o3 s4n
EDGE EDGE
ok
(j) Edge analytics #5 (k) Big data analytics #2
src o1 o2 o3 s4n
EDGE CLOUD
ok
(l) Big data analytics #3 (m) Big data analytics #4
FIGURE 8.5: OPERATOR GRAPH TOPOLOGIES USED IN THE EVALUATION†
Except for applying the colocation heuristic alone, all the approaches reducedthe resolution time, regardless of the size of the underlay network or operator graphinput size. Colocation alone can increase the resolution time because it can makethe modified problem more complicated to solve. All our other approaches consid-erably reduce the resolution time. For the different problem input sizes, we wereable to achieve decreases of 20 to about 95 percent on average. It is important to

146 Chapter 8. Operator Placement
(a) Underlay 1
(b) Underlay 2
(c) Underlay 3
FIGURE 8.6: EVALUATION RESULTS ON THE RESOLUTION TIME†

8.6. Evaluation 147
emphasize three general observations:
(i) There is a general trend of a larger decrease in resolution time as the sizeof the problem input increases, meaning that for larger problem instances—as likely in dense Urban Edge Computing environments—we expect our ap-proaches to be even more beneficial.
(ii) We achieve the reduction in resolution time by specifying simple (in the sensethat they are easy to determine and naturally consider the characteristics andtopologies of Edge Computing environments) placement constraints.
(iii) The savings in resolution time can have a substantial impact in practice,changing unacceptable delays in the provisioning of services to much shorter,acceptable delays. As an example, for one problem instance of gs7 in Under-lay1, an optimal solution was computed in 19.15 s, while our best heuristic(in this case the combination of pinning and restriction) led to a solving timeof 0.81 s. Included in that time are 0.03 s it took to compute the heuristic andapply it to the original problem input.
Out of the implemented approaches, applying pinning together with restrictionwas the fastest most of the time. However, we will see in the next subsections thatthis is also the approach that introduces the largest optimality gap. Pinning alonegives us less benefit for the resolution time because only the first few operators arepinned. Furthermore, fixing the first operator might add complexity for the place-ment of the remaining operators in the graph. When also applying colocation afterpinning, the resolution time is lowered because fewer reasonable placement optionsare available. In our experiments, restriction and restriction alongside colocationperformed similarly w.r.t. the benefit in resolution time.
8.6.3 Optimality Gap
Applying our heuristics will inherently lead to a decrease in the system utility, i.e.,the value of the cost function (Equation (8.8)) will increase. However, given thebenefits regarding the resolution time, this is a tradeoff one might be willing to ac-cept in practice. Especially in highly dynamic scenarios, reconfiguring placementdecisions is time-critical due to quick changes in network characteristics. In addi-tion, other implementations of placement restrictions might represent other place-ment constraints, e.g., some nodes might be excluded due to privacy concerns. Insuch cases, the optimal solution might not be applicable in practice at all. In thissection, we analyze the optimality gap of our implementation, i.e., we quantify theincrease of the cost function for our approaches compared to solving the problemoptimally.
In Figure 8.7, we plot this optimality gap. The maximum average increase wecan observe is only slightly above 20 % but, in general, it is much lower on average(usually below 5 %). The highest increase is observed whenever pinning is involvedsince it does not consider the link cost that it might imply for the operators placedlater on. The cost difference is the lowest for the colocation heuristic alone becausewe have more nodes than operators to choose from. Therefore, even though we en-force the colocation of operators, we can find a node that has a combined placementcost close to the optimum. Restriction alone and restriction combined with coloca-tion perform only slightly worse. This is because compared to colocation alone, notall nodes are considered for the placement.
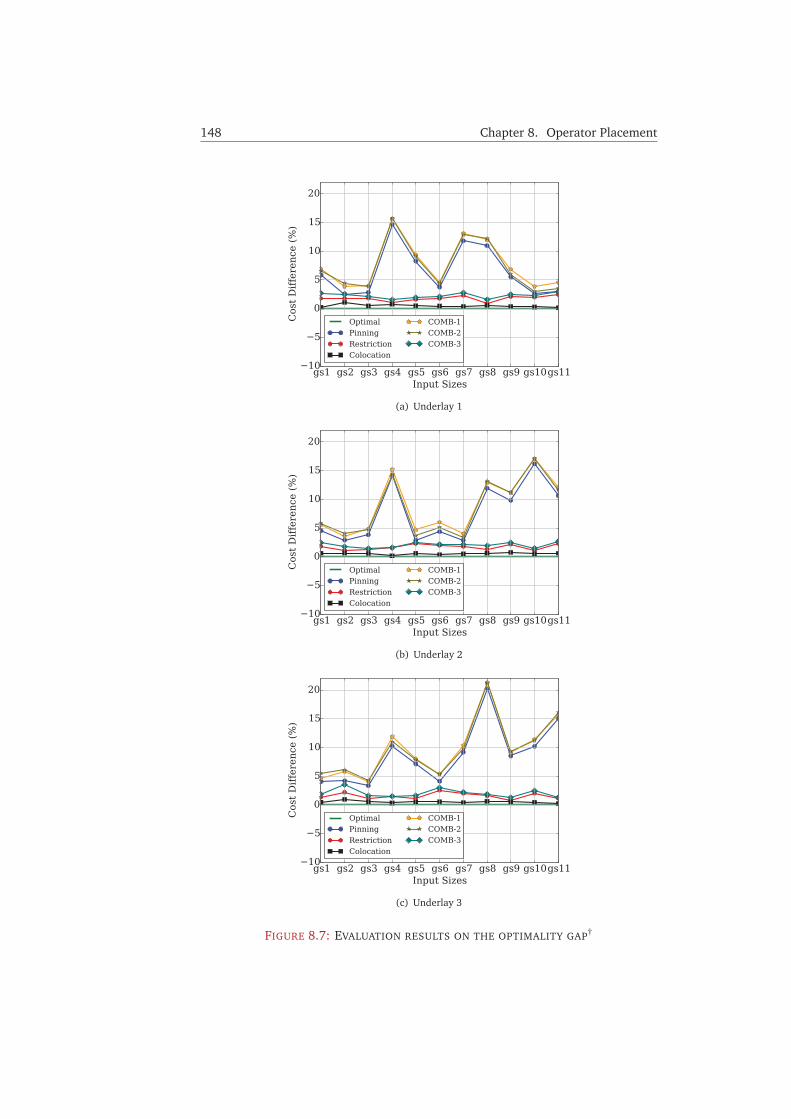
148 Chapter 8. Operator Placement
(a) Underlay 1
(b) Underlay 2
(c) Underlay 3
FIGURE 8.7: EVALUATION RESULTS ON THE OPTIMALITY GAP†

8.6. Evaluation 149
8.6.4 Discussion
8.6.4.a Time-cost tradeoff
Based on the results obtained, we now discuss the tradeoff between the saving inresolution time and the cost overhead of our heuristics.
Figure 8.8 depicts this tradeoff with the resolution time on the x-axis and thecost overhead on the y-axis. Each dot represents one result for the different graphsizes. The size of each dot represents the size of the underlay network. Since thecolocation heuristic alone often increases the resolution time, sometimes dramat-ically and therefore does not offer a good tradeoff, we omit it in the plot. Fromthe figure, we can first observe the scalability of our approach since there is a trendtowards a bigger saving in resolution time for larger underlay sizes. Second, we cansee the tradeoff between the cost optimality gap and saving in time. For instance,COMB-1 leads to good results in terms of time saving but also has one of the high-est optimality gaps and a large variance in the optimality gap. Applying restrictionalone consistently leads to low cost, however, there is more variance in the savingin resolution time. If we apply restriction and colocation (COMB-3), the results aresimilar, but for larger underlay sizes, we can see a slight benefit using COMB-3. Thesimilarity of these two is an interesting observation, as we imagine this to be highlydependent on the actual implementation of the colocation heuristic and we plan toexamine this in future work. Compared to these, pinning and COMB-2 were foundto be the weakest in terms of the tradeoff.
FIGURE 8.8: TIME-COST TRADEOFF FOR THE HEURISTICS†
8.6.4.b Comparison with greedy cloud placement
We also compare our results with a greedy algorithm for operator placement. Thisalgorithm places every operator on cloud nodes only and chooses the cloud nodewith the lowest placement cost for each operator. This is the current practice onewould employ to place cloud services without considering the edge or fog as pos-sible tiers for carrying out processing. We plot the results of this greedy placementstrategy for the largest underlay network (Underlay 3) in Figure 8.9.
We observe that while the saving in resolution time is comparable to our heuris-tics (with a maximum saving of around 90 %), the greedy algorithm performs muchworse in terms of cost. For larger graph sizes, the costs are three to four times higherthan the optimal solution. This is mainly because for the greedy solution, link costs

150 Chapter 8. Operator Placement
are substantially higher since all data has to be transferred to the cloud, even foroperator graphs where data sources and sinks all reside in the edge tier. Comparedto that, when applying our heuristics, we saw a maximum increase in the total costsof way below 10 % on average.
FIGURE 8.9: PERFORMANCE AND OPTIMALITY GAP FOR GREEDY CLOUD PLACEMENTS†
8.6.4.c Dissecting the placement decisions
FIGURE 8.10: PLACEMENT LOCATIONS†
Figure 8.10 shows how the implemented heuristics influence the placement de-cisions with respect to the different tiers, i.e., how many operators are placed on thecloud, fog, or edge tier. Recall that for two heuristics—restriction and pinning—asubset of placement decisions will be constrained to a certain tier. The plot serves toillustrates both the differences in how the heuristics function in terms of restrictingplacement decisions, and how the heuristics affect the non-constrained placementsas computed by the solver. We plot the number of operators on different tiers forthe largest problem instance (Underlay 3, gs11, see Table 8.4 and Table 8.2 fordetails).
From the results, we can make the following observations: compared to theoptimal solution, pinning is more aggressive in terms of placing operators on the

8.7. Conclusion and Outlook 151
edge, i.e., close to where most of our data sources are located. Since restrictionalways allows the placement on fog nodes (regardless of the location of data sourcesand sinks), we can clearly see a trend towards fog placement when applying therestriction heuristic either alone or in combination (COMB-1 and COMB-3). Inthe case of COMB-3, we see nearly the same outcome as with restriction alone.When combining pinning and restriction (COMB-1), we get the highest number ofcloud placements. If colocation is applied alone this leads to nearly the same resultsas the optimal solution. Recall, however, that this increases the resolution timein most cases. With applying colocation after pinning (COMB-1), we see a slightshift towards cloud placements since after pinning, we might have fewer placementpossibilities—especially on the fog tier.
8.7 Conclusion and Outlook
This chapter studied the problem of placing operators (i.e., functional part of appli-cations) in a 3-tier in-network topology, consisting of edge, fog, and cloud nodes.We modeled the in-network operator placement (INOP) problem as an ILP model.To reduce the solving time of this computationally hard problem, we presented anapproach that modifies the original problem by introducing constraints to the ILPmodel. First, we introduced three general classes of heuristics to generate suchconstraints. Then, for each of these classes, we implemented sample representa-tives to demonstrate their feasibility. By evaluating our approach, we were able toconsiderably decrease the solving while only introducing a small optimality gap.
Our findings can be applied to a variety of practical problems in the emerg-ing domain of Edge Computing, one of which is the placement of microservices.Hence, this approach can be integrated in the placement decision logic of an EdgeComputing framework as presented in Chapter 7.
We envision the following research directions for future work:
OTHER VARIANTS OF HEURISTICS | For each of the proposed heuristics, we imple-mented one sample representative. Future work should explore other vari-ants, e.g., by extending the pinning heuristic to more operators, or definingother metrics for the colocation score.
MORE GENERAL GRAPH TOPOLOGIES |We assumed directed, acyclic graphs in whichdata sources and sinks were pinned to the underlay network. This follows themodel currently found in distributed complex event processing and streamprocessing applications. Future work should extend this model to more gen-eral graph topologies, e.g., such that cycles are allowed. In addition, an ex-tended model should include dynamic re-assignments of source-sink map-pings between the underlay network and operator graphs, therefore allowingfor a better representation of applications with mobile data source and sinks.
REDUCING THE COMPUTATIONAL COMPLEXITY | Our method was able to consider-ably reduce the solving time for the INOP problem. However, from the pointof view of computational complexity, it remains a hard problem. Future workshould examine heuristics that can reduce the general computational com-plexity of the INOP problem.


CHAPTER 9
Context-Aware Micro-Storage1
Chapter Outline9.1 Introduction . . . . . . . . . . . . . . . . . . . . . . . . . . . . 153
9.2 Background and Related Work . . . . . . . . . . . . . . . . . 156
9.3 Context-Aware Storage at the Edge . . . . . . . . . . . . . . 158
9.4 System Design and Implementation . . . . . . . . . . . . . . 161
9.5 Experience Report . . . . . . . . . . . . . . . . . . . . . . . . . 169
9.6 Conclusion and Future Work . . . . . . . . . . . . . . . . . . 173
9.1 Introduction
The previous chapter investigated the placement of functional parts of applica-tions (termed operators). In this chapter, we extend this placement problem todata, i.e., the problem of where information gathered by users at the edge shouldbe stored. Similar to the placement of application components, today most datagathered by end devices is stored in Cloud Computing infrastructures, partly be-cause of the devices’ limited capacity [ASH15]. This data flow—from the edge to acloud location—is opposite to the trend of implementing content delivery networks(CDNs) throughout the Internet. While CDNs aim at providing cache servers forthe delivery of content originating from the cloud [Dil+02; VP03], we investigatethe opposite data flow from the edge to the cloud. This has been referred to as aReverse CDN [Sch+17; MSM17]. An example of devices that capture data at theedge are mobile phones. Mobile phones nowadays feature a variety of differentapplications. Data captured by or sent to those applications is usually stored on
1Large parts of this chapter are verbatim copies from [Ged+18b]. Those text segments are printed ingray color. Tables and figures taken or adapted from this publication are marked with † in their caption.The work was awarded Best Paper at the 2018 MobiCASE conference.
153
154 Chapter 9. Context-Aware Micro-Storage
distant servers, i.e., in Cloud Computing infrastructures. In any case, the storagelocation is inflexible because it is predefined by the application or cloud infrastruc-ture provider. Furthermore, we see a plethora of different applications that servethe same or similar purpose (e.g., Dropbox, Google Drive, and OneDrive for cloud-based data storage). Although users sometimes use different services to store thesame data, the different applications remain isolated from one another and there-fore hinder the sharing of data across them. Besides using various applications forthe same purpose, the way mobile data is stored and accessed today is completelydecoupled from how the data is actually used and what the current usage contextsof users and their intentions are. One example is that users often share content withothers at public events, where networks tend to be overloaded. As we will illustratelater, this sharing often happens between users who are present at the same event.
As a result, we are faced with congested networks and high latencies whenretrieving data stored at distant locations. Retrieving locally relevant data fromdistant Cloud Computing infrastructures furthermore incurs big stress on networkbandwidth—one of the main motivations for Edge Computing (see Section 3.1). Insummary, we can derive the following drawbacks and limitations from the currentstate of the art:
DRAWBACK I: HIGH RETRIEVAL LATENCIES | For data such as video, this has a di-rect impact on the perceived quality of service and therefore is undesirable.In addition, for many mission-critical applications such as virtual reality orassisted driving, the latencies to cloud infrastructures are prohibitive.
DRAWBACK II: HIGH CORE NETWORK BANDWIDTH UTILIZATION | Despite often beingretrieved only in a locally restricted area, all data is first sent to the cloud,thus creating high bandwidth utilization and possible bottlenecks in the corenetwork. This is going to worsen as more large-volume data, such as video,will be generated in the future.
DRAWBACK III: TIGHT COUPLING AND CUMBERSOME SHARING | Applications use pre-defined storage locations, unable to consider where the data will be retrieved.Furthermore, no unified interface is provided for sharing data across differentapplications and users. While approaches to overcome this drawback couldbe realized in cloud infrastructures, a novel approach to proximate edge com-puting creates the opportunity for offering a unified solution that addressesthis drawback.
The emergence of Edge Computing provides an opportunity to overcome thesedrawbacks, by not only providing computing, but also storage capabilities. Unnec-essary transfers to the cloud and congestions in transit networks can be avoided ifdata is stored close to where it actually is retrieved. However, as of today, the ques-tions of how and where to provide storage capabilities for mobile devices at theedge has not been addressed. This chapter closes this gap by presenting a concepttermed vStore (virtual store).
Overview of concept. vStore is designed as a middleware that abstracts fromconcrete storage locations and—based on the current usage context and intentionsof the user—chooses the most suitable storage location. The decision where tostore data is made based on rules that can either be pushed globally to the frame-work or created individually by users. From a networking point of view, vStore

9.1. Introduction 155
reduces the bandwidth utilization in the core network and the latency when re-trieving nearby copies of requested data. From the user perspective, vStore providescontext-awareness and facilitates the sharing and reuse of data across locations andapplications. Furthermore, by pushing updated storage rules to the client devices,vStore enables network operators and businesses to provide better quality of expe-rience for their customers by providing proximate cloudlet storage and reacting tochanges in the network utilization. When making storage decisions, vStore takesthe following into account:
• Type of data, such as photo, video, contacts, etc.
• Usage context as provided by the client. This can include information liketime, location, ambient noise level, and network conditions.
• User intention, such as private use or sharing of data.
• Available storage locations and their properties (e.g. their location in thenetwork).
Instead of solely relying on either local (i.e., on the mobile device itself) or cloud-based storage, we also consider storage locations in the access network or locatedat the user’s wireless gateways. As we have shown in Chapter 5, upgrading suchgateways can provide a city-wide coverage of cloudlets. In vStore, we considerthe heterogeneity of those cloudlet nodes in order to optimize the placement de-cision. To this end, we implement our framework for Android devices and deploystorage nodes in a city to demonstrate the feasibility and key functionalities of ourapproach. To the best of our knowledge, this is the first framework that providesthe functionality to abstract storage locations and enables storage decisions basedon rules that take into account the current context of the user and heterogeneousedge infrastructures.
Summary of contributions. In summary, this chapter makes the following con-tributions:
• We propose the concept of a middleware that decouples applications fromstorage infrastructure, motivated by a user study and network measurements(Section 9.3).
• We design and implement vStore, a framework that integrates this conceptand supports context-aware micro storage on heterogeneous cloudlets (Sec-tion 9.4). The framework makes storage decisions based on contextual in-formation from the client device and a set of rules that can either be definedglobally or customized by the client.
• We conduct a field study in which participants used a demo application formobile storage. Section 9.5 reports on the insights from this study. The resultsshow that context-based rules are able to reduce the amount of data stored inthe cloud. From the obtained insights, we derive future work in Section 9.6.

156 Chapter 9. Context-Aware Micro-Storage
9.2 Background and Related Work
9.2.1 Context-Awareness
We aim to build a framework that makes storage decisions based on rules that takeinto account the current context of the user. Context is any information that char-acterizes a current situation [Dey01] and according to Abowd [Abo+99], a systemis context-aware if it uses context to provide relevant information and/or servicesto its users. In our system, contextual information should influence the storagedecision. Examples of relevant context include from where the user retrieves thecontent, where one is located, or what the network conditions are alike. In general,we can distinguish between low-level context (i.e., raw and unprocessed sensordata) and high-level context that is inferred from (often multiple) low-level contextinformation.
Capturing contextual information on mobile devices. As mobile devices todayfeature a multitude of built-in sensors, they are able to capture diverse contextualinformation. The most prominent contextual information is the location. However,it is easy to see how we can extend this to more sophisticated context. Especiallyfusing data from hard sensors (e.g., a GPS receiver or microphone) with data fromsoft sensors (e.g., one’s calendar entries) can generate meaningful higher-level con-text. As an example, assume a user is located at a certain geo-coordinate. Adding alist of point-of-interests, we might derive that he or she is at a sports stadium. Fur-ther addition of microphone readings then might derive whether a sporting eventis currently in progress. We will later describe how vStore uses this kind of contextinformation to make storage decisions.
Usage of contextual information for data placement. Contextual informationcan be leveraged for making data placement decisions. This is commonly done inCDNs. Besides economic considerations [CZZ13], CDNs typically consider proper-ties of the network (e.g., the topology or link quality) to make placement decisions[Sal+18; Bas+03]. As user-centric context, CDNs consider the location distributionof requests [Sce+11] in order to minimize access delays and bandwidth costs. Thesame holds true for recent approaches that aim at providing storage infrastructureat the edge. As an example, DataFog [GXR18] and FogStore [GR18; May+17] bothperform replication based on spatial locality of data requests.
9.2.2 Mobile Storage
Augmenting (mobile) devices’ storage capabilities has mostly been done throughCloud Computing. Research in this direction has for instance proposed specializedfile systems that are optimized for the wireless characteristics of device-to-cloudtransfers [Don+11]. Following this idea, application-level file systems that con-sider Edge Computing infrastructure have been developed [Sco+19] but they donot allow fine-grained placement decisions for data based on contextual properties.Tang et al. [Tan+15] suggest uploading data to multiple storage services. However,they only consider cloud storage services. Psaras et al. [Psa+18] suggest bufferingdata at WiFi access points prior to cloud synchronization.
9.2. Background and Related Work 157
Complementing cloud storage. Some previous works have proposed to comple-ment cloud storage with an additional layer at the edge of the network. The decisionwhere to store the data is often based on location alone [SMT10], or data is syn-chronized with cloud storage infrastructures [HL16; Psa+18]. Other than location,network information, and usage patterns of files have been taken into account tomake storage decisions [Baz+13; Han+17]. In our work, we do not limit ourselvesto these but provide a general concept that operates on rules, which can incorpo-rate whatever contextual information can be gathered by the devices. The Databoxproject [Per+17b; Cha+15; Mor+16] proposes a privacy-preserving intermediatelayer between the user’s data and the cloud that acts as a mediator to control theusage of the data.
Caching. Several approaches have been proposed for caching data, either ina hierarchical way [Dur+15] or collaboratively determined by content popular-ity [CP15]. Other works combine caching with prefetching strategies based onpredicted mobility [Zha+15a] or for specific applications, e.g., video streaming[Tra+17]. By definition, caching is non-persistent and in our approach, we needhigher retention times of the data (e.g., to enable sharing). Hao et al. [Hao+17]present EdgeCourier, a system that uses edge devices to synchronize documents.The authors demonstrate the bandwidth saving but such a use case disregards theaspect of sharing data between multiple users. Breitbach et al. [Bre+19] haveinvestigated the joint placement of data and computations in Edge Computing en-vironments. While our approach focuses on data captured by users, they target IoTapplications that require large amounts of data as inputs. The authors propose anapproach to decouple the placement of such data from the actual tasks, optimizingthe tradeoff between execution time and data management overhead.
Peer-to-peer approaches. Using peer-to-peer approaches for storage has beenproposed in [MRS19; Yan+10; CLP17]. Pure ad-hoc approaches as presented in[Pan+13b] are not feasible in practice, as our client devices are assumed to be highlymobile and, thus, cannot guarantee spatial locality of the data. Furthermore, if weassume cellular connections, they typically have a low uplink bandwidth, makingthe retrieval of data slow for other peers. Yang et al. [Yan+10] assume that the dataoriginates from the cloud and is replicated at cloudlets at the edge. This is oppositeto the data flow of a reverse CDN as we assume it to be the case in our use cases.Confais, Lebre and Parrein [CLP17] extend the design of the IPFS protocol [Ben14]to support edge and fog nodes. Monga et al. [MRS19] present a federated storefor streams of data blocks that emphasizes on reliability. None of these approacheshowever enable the same flexible context-aware placement as our rule-based ap-proach.
Replication. Some works have investigated replication strategies that are builton top of heavyweight distributed data storage systems (Apache Cassandra) [GR18;May+17; GXR18], making the practical deployment on constrained edge nodesquestionable. When replicating data, issues w.r.t. consistency can arise [Mor+18c;Mor+18d]. This is beyond the scope of our concept system, and we assume allstored data to be immutable.
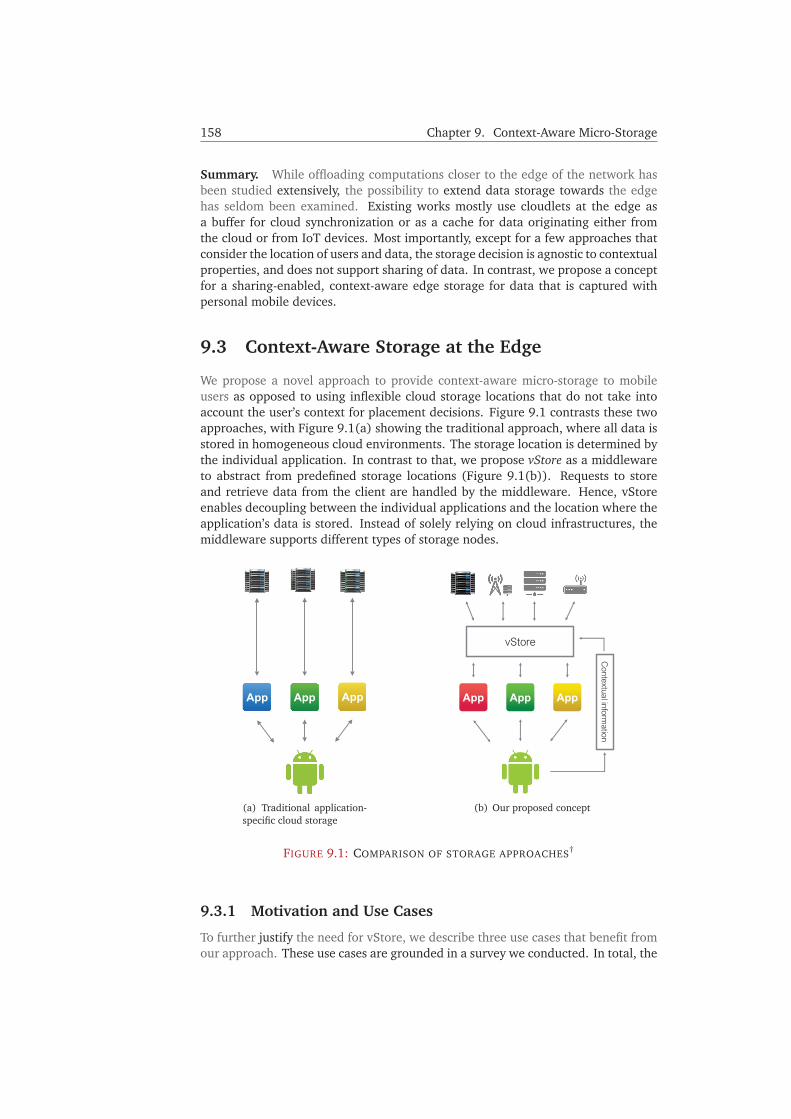
158 Chapter 9. Context-Aware Micro-Storage
Summary. While offloading computations closer to the edge of the network hasbeen studied extensively, the possibility to extend data storage towards the edgehas seldom been examined. Existing works mostly use cloudlets at the edge asa buffer for cloud synchronization or as a cache for data originating either fromthe cloud or from IoT devices. Most importantly, except for a few approaches thatconsider the location of users and data, the storage decision is agnostic to contextualproperties, and does not support sharing of data. In contrast, we propose a conceptfor a sharing-enabled, context-aware edge storage for data that is captured withpersonal mobile devices.
9.3 Context-Aware Storage at the Edge
We propose a novel approach to provide context-aware micro-storage to mobileusers as opposed to using inflexible cloud storage locations that do not take intoaccount the user’s context for placement decisions. Figure 9.1 contrasts these twoapproaches, with Figure 9.1(a) showing the traditional approach, where all data isstored in homogeneous cloud environments. The storage location is determined bythe individual application. In contrast to that, we propose vStore as a middlewareto abstract from predefined storage locations (Figure 9.1(b)). Requests to storeand retrieve data from the client are handled by the middleware. Hence, vStoreenables decoupling between the individual applications and the location where theapplication’s data is stored. Instead of solely relying on cloud infrastructures, themiddleware supports different types of storage nodes.
(a) Traditional application-specific cloud storage
App AppApp
vStore
Contextual inform
ation
(b) Our proposed concept
FIGURE 9.1: COMPARISON OF STORAGE APPROACHES†
9.3.1 Motivation and Use Cases
To further justify the need for vStore, we describe three use cases that benefit fromour approach. These use cases are grounded in a survey we conducted. In total, the

9.3. Context-Aware Storage at the Edge 159
survey had 51 participants. The participants were aged 16–40 and mostly studentsand researchers. This survey helped to (i) understand current usage patterns andchallenges encountered by mobile users w.r.t. data storage and retrieval and (ii)derive requirements for our storage framework. In the following, we highlight es-sential insights about how people capture, use, and share data generated with theirphones. All survey questions can be found in Appendix H. Throughout this section,questions are referenced by their number as listed in the appendix (e.g., Q1).
9.3.1.a Sharing data at an event
Especially during large-scale events, cellular networks are often congested [Frö+16].A prominent example are football matches. Figure 9.2 shows measurements of theavailable cellular bandwidth during a match at the Commerzbank Arena, a sta-dium in Frankfurt (Germany) with a capacity of 51 500 spectators. We measuredthe available bandwidth to a cloud location using the iperf2 tool. Compared tothe average bandwidth available in the stadium when no match takes place, wecan clearly see that the network quality decreases tremendously. At some distinctevents, such as goals occurring in the match, the network collapses almost en-tirely. At half-time, the network became entirely unavailable. In such cases, edgecloudlets (that for instance are deployed on several WiFi access points) can be use-ful to provide users with storage services. Besides the obvious use case of storingdata in the cloud for later use or sharing with people not present at the event, amore interesting use case for edge storage arises when data is to be shared amongpeople present at the very same event. This type of sharing has been examinedbefore in the context of video streaming [Dez+12] but not with the support of EdgeComputing infrastructure.
In our survey, over 50 percent of the participants stated that they at least oc-casionally share data such as pictures at an event (Q17). About 20 percent of thetime, sharing is done with other people attending the same event (Q20). Only 4percent of our participants have never experienced congested connections duringevents (Q18).
FIGURE 9.2: MEASURED CELLULAR BANDWIDTH DURING A FOOTBALL MATCH†
2https://iperf.fr/ (accessed: 2020-03-09)

160 Chapter 9. Context-Aware Micro-Storage
9.3.1.b Context-aware storage across applications
In our survey, we questioned participants whether the storage services they chooseto use depend on (i) whether the data is intended for private or public use, (ii) theircurrent location, and (iii) the date and time of data capture. The results of thosequestions are depicted in Figure 9.3(a). We can clearly observe that the major-ity of users base the decision on where to store their data to a great extent onthese three contextual properties. Following this result, these contextual proper-ties, among others, will be used by our framework to make storage decisions. Fur-thermore, some users upload the same data to more than one storage service (seeFigure 9.3(b)). With regards to this result, vStore offers the opportunity to providea unified interface through which users access different storage services.
Public/private
Current location
Time
0,0 % 25,0 % 75,0 % 100,0 %
11,8 %
9,8 %
3,9 %
33,3 %
21,6 %
5,9 %
7,8 %
17,6 %
25,5 %
43,1 %
49,0 %
51,0 %
3,9 %
2,0 %
13,7 %
Strongly Agree Agree Undecided Disagree Strongly Disagree
50,0 %
of participants
(a) Usage of storage services depending on contextual properties
0,0 % 25,0 % 75,0 % 100,0 %
Very frequently Frequently Occasionally Rarely Very rarely Never
50,0 %
of participants
2,0% 7,8% 23,5% 25,5% 25,5% 15,7%
(b) Upload of the same data to multiple storage services
FIGURE 9.3: SURVEY RESULTS ABOUT THE CONTEXT-DEPENDENCE OF CHOOSING STOR-AGE SERVICES AND USING MULTIPLE STORAGE SERVICES†
9.3.1.c Getting suggestions for data related to one’s current context
When at a certain location or when performing a certain activity, users often searchfor information related to that specific context. With the capability to query ourframework for data that is similar to one’s usage context, we can provide users withthis kind of information. Coming back to the example of an event, over 78 percentof our surveyed participants at least sometimes retrieve data related to an eventthey attend (Q19). Furthermore, retrieving context-aware information is a crucialbuilding block for augmented reality applications, as shown in [Mül+17].
9.3.2 Problem Definition and Requirements
From the use cases described above, we define the problem we want to tackle asfollows: given data that is captured by mobile users and contextual information,determine a location where the data should be stored. Besides the device itself andcloud storage, various storage locations at the edge should be considered. Storage

9.4. System Design and Implementation 161
locations should best reflect the future retrieval patterns (e.g., where and when)of the data. Furthermore, the decision should also consider whether the data isintended for private use or sharing.
In order to provide context-aware micro-storage as we envisioned, the systemshould fulfill the following requirements: (i) storage location agnosticism, (ii) open-ness to extensions (e.g., allowing to incorporate more contextual properties) andthird-party applications, and (iii) extensibility to implement new rules for storagedecisions. In the next section, we will describe the design of a system that realizesour concept and outline how it fulfills these requirements.
9.4 System Design and Implementation
In this section, we describe the design of our system and its individual components.Figure 9.4 shows a high-level overview of our system. Our proposed concept iscomposed of several building blocks: (i) the vStore framework that provides inter-faces to applications and storage nodes, and makes storage decisions, (ii) individualstorage nodes on which data can be stored, and (iii) a master node that maintainsa global view on the storage locations of data items. In addition, context providersprovide contextual information for the storage decisions and an external configura-tion file defines basic settings for the operation of the framework. In the followingsubsections, we will explain those building blocks in more detail, and present ademo application that makes use of vStore on Android phones.
vStoreFramework
ContextAggregator DB Helper
Uploader
ContextProvider
.store() .get()
Application
Matching Engine
Configuration File
Node Manager
Downloader
MasterNode
StorageNode
StorageNode
Config DownloaderRules
……Storage
Node
FIGURE 9.4: SYSTEM ARCHITECTURE†

162 Chapter 9. Context-Aware Micro-Storage
9.4.1 vStore Framework
The central contribution of this chapter is the concept of vStore, a framework thatprovides interfaces to applications in order to store and retrieve data while ab-stracting from a concrete storage location. The framework collects current contex-tual information, maintains a list of available storage nodes and—based on a set ofrules—makes the decision where to store the data. For each data item to be stored,a unique identifier is generated that is later used to retrieve specific data acrossstorage nodes. The framework is implemented as a Java Library for the Androidoperating system. Figure I.1 in Appendix I shows the complete class diagram of theimplementation.
9.4.1.a Context aggregator and context provider
The task of the context aggregator is to collect the different kinds of contextualinformation. It supports different types of contexts that can be supplied by contextproviders. As a general way to supply contextual information, context providerscan use a key-value representation of the data in a JSON file. This is a commonway to represent contextual information in the IoT domain [Per+14a]. Contextproviders can push contextual information to the context aggregator via a messagebus. Alternatively, through an API that must be provided by the context provider, thecontext aggregator can pull the currently available contextual information from theprovider. Besides this general interface, the context aggregator has built-in supportfor various contextual information provided by the APIs of the Android operatingsystem. In Figure 9.5, the architecture of the aggregator is summarized.
To gather contextual information from the mobile phones, we rely on threeproviders of such information: First, we make use of AWARE3, an open sourceframework for context instrumentation on Android phones. Second, the GooglePlaces API provides a list of places that surround the user, their type, and the like-lihood of the users being located at those places. Third, the Android ConnectivityAPI provides information about the network connectivity of the device. In the fol-lowing, we list the different types of context supported by the context aggregatorand how they are acquired in our implementation:
LOCATION | A plugin for AWARE provides location information using the GoogleFused Location API4.
PLACES | Whenever a new location is available, we query Google’s Places API5 foran updated list of places. We group the large number of place types providedby this API into three groups, namely points of interest (POI), events (such asstadiums, city halls, and night clubs) and social places (such as restaurants,cafes, and bars).
NOISE | The ambient noise level is measured by an AWARE plugin through thephone’s microphone. By configuring a threshold, we can determine if thecurrent environment should be considered as loud or silent.
3https://www.awareframework.com (accessed: 2020-03-27)4https://developers.google.com/location-context/fused-location-provider (accessed: 2020-03-21)5https://developers.google.com/places/web-service/intro (accessed: 2020-03-21)

9.4. System Design and Implementation 163
ACTIVITY | The user activity is provided by another plugin that internally uses theGoogle Awareness API to identify the user’s current activity (e.g., idle, driving,or walking).
NETWORK | We use Android’s ConnectivityManager and TelephonyManager to fetchdetails about the user’s current connectivity state (e.g. to what kind of net-work the user is currently connected to).
DATE AND TIME | The time and date as reported by the phone’s operating system.
Context Aggregator
Activity
Environment Noise
Location
Places Service
Broadcast(push)
Content Resolver(pull)
Network
Connectivity ManagerTelephony Manager
ContextProvider
FIGURE 9.5: CONTEXT AGGREGATOR†
9.4.1.b Node manager
As outlined at the beginning of this section, the core of our concept is to make asensible placement decision for data, given different available storage nodes. Thenode manager maintains a list of all available storage nodes. When storage nodesare added to the framework, their type, location and bandwidth need to be speci-fied. Available nodes can then be queried according to these properties. Before anode is stored in the internal database of vStore, the node manager checks if thenode is reachable. Node information can be updated and deleted through an API.
9.4.1.c Rules
In our framework, rules are used to make the storage decision and are evaluated bythe matching engine, as described in Section 9.4.1.d. Rules can either be definedglobally by a configuration file that is remotely pulled (see Section 9.4.4) or createdindividually by users. In detail, our rules consist of three parts that will be evaluatedin the following order during the matching:
(i) METADATA PROPERTIES | These denote for which MIME type and file size therule should be applied during the matching process.
(ii) CONTEXT FILTERS | Context filters determine which contextual properties mustbe fulfilled for the rule to be applied. Any of the aforementioned contextualinformation can be specified here. Depending on the type of context, differentfilter operations can be used. For example, using the places context, we candefine a binary filter that checks if a user is at a certain location. A contrastingexample is the date and time, or noise levels, where we can specify a certainrange or threshold value.
164 Chapter 9. Context-Aware Micro-Storage
(iii) STORAGE DECISION LAYERS | The decision layers determine which storagenodes are chosen. Rules can include many of those layers, ordered by pri-ority. Each layer defines constraints on the storage node, such as availablebandwidth or distance to the user. A decision layer can also point to one spe-cific storage node. In this case, the file will be stored on that specified node.Optionally, and for future work on replication, we also include the definitionof a minimum number of replicas.
The way we define rules follows the Event Condition Action (ECA) paradigm. Wechose to follow the ECA principles for the design of our rules because ECA rules area common structure in the domain of active databases [PD99; HS02]. Mapped toour implementation, an event represents the storage request of a file. Conditionsare the contextual filters of the rule that have to be fulfilled, and the action is theselection of storage nodes by the decision layers.
9.4.1.d Matching engine
The matching engine is the main part of the framework. Given a file f , the currentcontext C , and a set of available storage nodes N and rules R, it decides on whichstorage node the file will be saved. Hence, this storage decision function can beformalized as:
( f × C × N × R)→ N
The matching process consists of four main steps. The pseudocode is shown inAlgorithm 2. As a first step, only rules that match file metadata (type and size) areconsidered (line 1). For instance, a rule that only applied to image files would notbe evaluated further if the data the user wants to store is a document. The sameapplies if a rule specifies that it should only be applied to files of a certain size. Next,all contextual filters as defined by the rule have to match the context that is given atthe time of evaluating the rule. Only those rules are triggered and evaluated further(lines 2–6).
In the third step of the matching process, for each of the remaining rules thatsatisfy the metadata and context filters, a detail score s ∈ �, 0 ≤ s ≤ 1 is computedto determine the rule that most accurately describes the current context. Two fac-tors influence this score: (i) how many contextual filters are defined in the rule, and(ii) for continuous filters (i.e., that operate on a certain range) how narrow the filteris. For instance, a rule that triggers within 150 meters of a point of interest wouldbe assigned a higher score than one triggering within 500 meters. For each con-textual property, we define a maximum value to which the property can contributeto the overall detail score. A higher value means that this contextual property isconsidered to be more important. Table 9.1 shows the maximum detail score percontextual property and whether it is discrete (i.e., a binary filter that describesif a contextual property is present or not) or continuous (i.e., a range of possiblevalues). In the latter case, a function maps the size of the range to the maximumallowed detail score. The total detail score is then given by the sum of all scoresper contextual property. According to this metric, the most detailed rule is cho-sen to be executed (line 7). We chose these maximum detail scores such that theyemphasize use cases that require location context (including places) and the dateand time. For example, this allows to accurately represent use cases as described inSection 9.3.1.a.
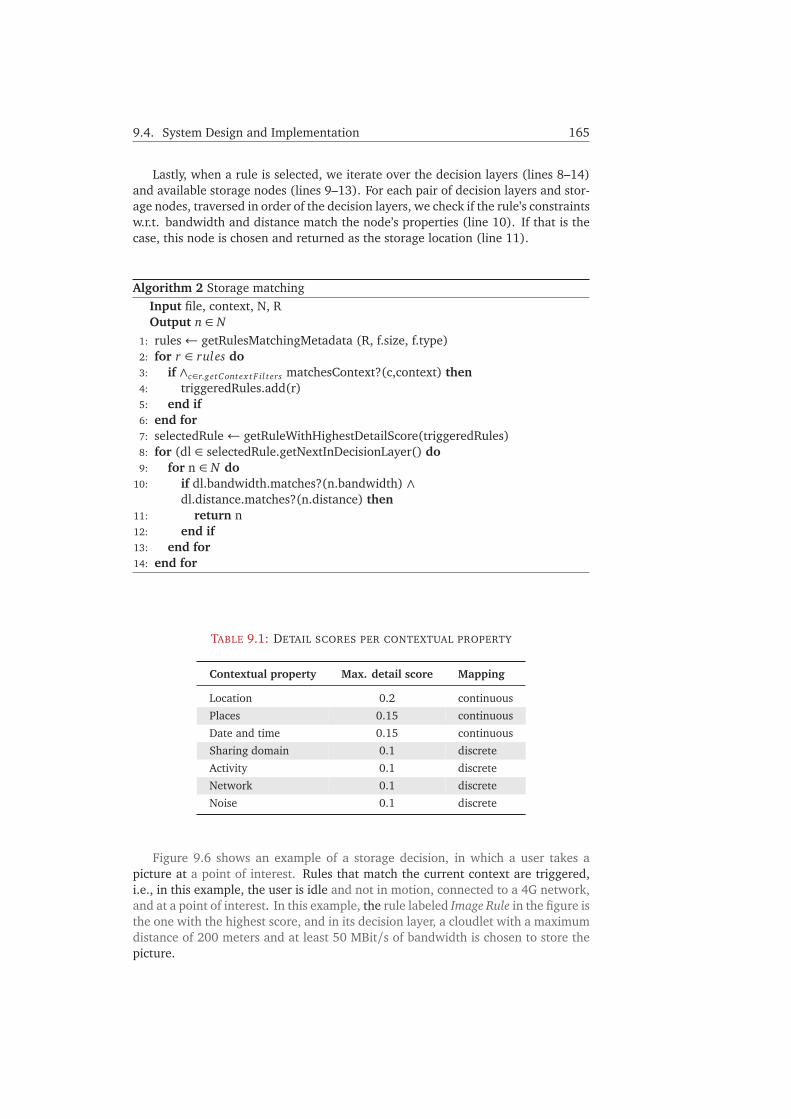
9.4. System Design and Implementation 165
Lastly, when a rule is selected, we iterate over the decision layers (lines 8–14)and available storage nodes (lines 9–13). For each pair of decision layers and stor-age nodes, traversed in order of the decision layers, we check if the rule’s constraintsw.r.t. bandwidth and distance match the node’s properties (line 10). If that is thecase, this node is chosen and returned as the storage location (line 11).
Algorithm 2 Storage matchingInput file, context, N, ROutput n ∈ N
1: rules ← getRulesMatchingMetadata (R, f.size, f.type)2: for r ∈ rules do3: if ∧c∈r.getContex tF il ters matchesContext?(c,context) then4: triggeredRules.add(r)5: end if6: end for7: selectedRule ← getRuleWithHighestDetailScore(triggeredRules)8: for (dl ∈ selectedRule.getNextInDecisionLayer() do9: for n ∈ N do
10: if dl.bandwidth.matches?(n.bandwidth) ∧dl.distance.matches?(n.distance) then
11: return n12: end if13: end for14: end for
TABLE 9.1: DETAIL SCORES PER CONTEXTUAL PROPERTY
Contextual property Max. detail score Mapping
Location 0.2 continuous
Places 0.15 continuous
Date and time 0.15 continuous
Sharing domain 0.1 discrete
Activity 0.1 discrete
Network 0.1 discrete
Noise 0.1 discrete
Figure 9.6 shows an example of a storage decision, in which a user takes apicture at a point of interest. Rules that match the current context are triggered,i.e., in this example, the user is idle and not in motion, connected to a 4G network,and at a point of interest. In this example, the rule labeled Image Rule in the figure isthe one with the highest score, and in its decision layer, a cloudlet with a maximumdistance of 200 meters and at least 50 MBit/s of bandwidth is chosen to store thepicture.

166 Chapter 9. Context-Aware Micro-Storage
Latitude: Longitude:
Place: Activity:
Network:
48.8583701 2.2922926 POI Still 4G
Context
CloudletDistance: 200m
Bandwidth: 50MBit/s
CloudletDistance: 5km
Bandwidth: 25MBit/s
4G eNodeBvStore
Framework
…Image Rule
vStore amework
…mage Rule
FIGURE 9.6: EXAMPLE OF RULE MATCHING† FIGURE 9.7: STORAGE NODE HIERARCHY†
9.4.2 Storage Nodes
Storage nodes are the devices that are available to store the data. In a real-worlddeployment, a storage node could be hosted on a variety of devices, either close-by or distant to the user. To take into account this heterogeneity, vStore definesdifferent types of storage nodes as depicted in Figure 9.7. Besides cloud nodes, weconsider cloudlets, gateway nodes, and nodes in the core network. Gateway nodesare devices to which users have a direct wireless connection, such as WiFi accesspoints or cellular base stations. In addition, we also consider private clouds as atype of storage nodes, i.e., deployments that are owned by end users themselves.One example of such a system is ownCloud6. Including this kind of nodes is sensiblefor the definition of storage rules aimed at the storage of private data, i.e., data thatis not shared among different users of the framework.
Storage nodes are registered to the global configuration file (see Section 9.4.4)and master node (see Section 9.4.3) with their available bandwidth and location.For our prototype implementation, we use the geographic locations of the nodes,assuming that physical proximity correlates with network latency. We note that forfuture work, network coordinates (such as Vivaldi coordinates [Dab+04]) couldgive a more realistic estimation of the quality of the connection to the storage nodes.
9.4.3 Master Node
When a file is saved through the framework, a global identifier (using an UUID)is generated. This UUID acts as an identifier when requesting a previously storedfile. The clients that originally uploaded the file to the framework keep a recordof the nodes their file was stored on. In addition, for each storage decision, themaster node keeps a record that contains the mapping of the UUID to the storagenode(s) on which the file is stored. This is required for two reasons: (i) in thecase of sharing the file, other clients do not know the storage location a priori, and(ii) in the case of replication and failure of one storage node, clients need a list ofall storage nodes that have copies of the file. Recall that the implementation of ourconcept does not consider mutable data and therefore, common challenges found indistributed file systems, such as providing consistency guarantees, are beyond thescope of our contribution. Existing works like the Google File System [GGL03] havedeveloped mechanisms where a master node interacts with several storage nodes
6https://owncloud.org (accessed: 2020-03-27)
9.4. System Design and Implementation 167
and provides fault tolerance and consistency guarantees. We leave the integrationof such concepts into our approach for future work.
9.4.4 Configuration
The framework can be configured externally. This mainly serves two purposes:(i) initially retrieving available storage nodes, and (ii) including global rules for theplacement decision. Defining global rules that are available on all devices is impor-tant for users who do not wish to specify custom rules. This ensures that at leastsome basic storage decisions can be made. Furthermore, this could allow serviceproviders to update rules, e.g., in order to react to changes in network conditionsor node availability.
To this end, for simplicity reasons, the framework uses a central configurationfile that can be pulled from a cloud location. This provides a mechanism for re-trieving and updating available storage nodes and rules. In the future, we envisionthe configuration of the framework to be managed in a distributed way and to bepushed to the devices whenever new information is available. This would for in-stance enable users who have the same or similar context to share custom rules theyhave defined.
9.4.5 Demo Application
To conduct our field study (see Section 9.5) we developed an application for theAndroid platform that uses our framework. This application provides users the pos-sibility to store, view, and retrieve files; similar to applications for cloud storage.The functionality allows to represent use cases as described in Section 9.3.1. In de-tail, the application allows users to (i) store their data on a storage node determinedby the matching engine of the framework (enabling context-awareness as requiredfor use cases like the one described in Section 9.3.1.a), (ii) define whether this datashould be accessible publicly or not (allowing sharing of data, see Section 9.3.1.b),(iii) view and create custom storage rules, and (iv) retrieve context-related datafrom other users (see Section 9.3.1.c). Information about locally stored files, avail-able storage rules, and nodes is stored in an SQLite database7. The database schemeis shown in Figure I.2 of Appendix I.
Figure 9.8 depicts the main screens of the application. The application’s mainscreen shows a summary of all current contextual information available (Figures9.8(a) and 9.8(b)). The user’s files are shown in a grid-layout as seen in Fig-ure 9.8(c). For files that are photos or videos, a thumbnail is shown to previewthe contents of the file. Tapping the file opens it in the default application for thatfile type. On the same screen, users can also add new files, by tapping one of the twopink buttons in the lower part of the screen. The left button (depicting a shield) isused to add private files (i.e., files that cannot be retrieved by other users) while theright one is used to add files that are to be shared. Besides their own files, users canalso retrieve files based on contextual queries (e.g., files that were captured nearbyor at similar places). Figure 9.8(d) shows an example of contextually similar files.The pink icon in the lower right corner allows users to customize the context filters,i.e., users can choose which contextual properties should be queried. Note that inorder to save bandwidth, initially, only thumbnails are downloaded. The entire file
7https://www.sqlite.org/index.html (accessed: 2020-03-27)
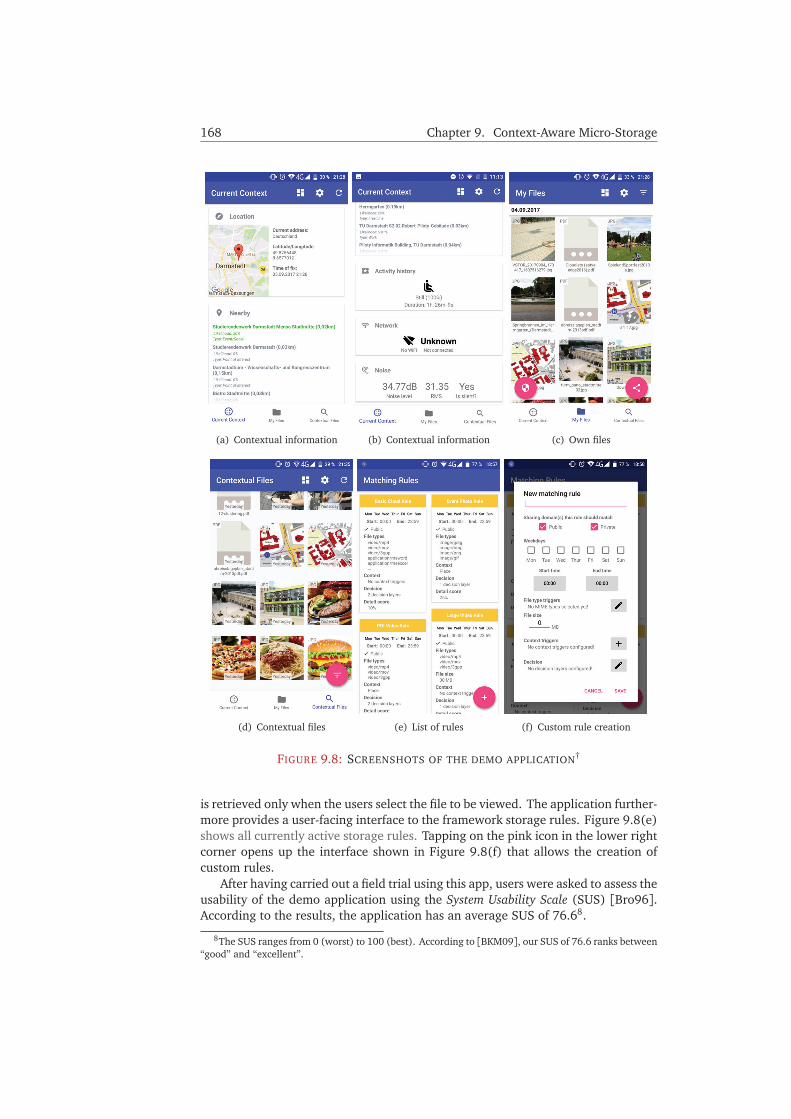
168 Chapter 9. Context-Aware Micro-Storage
(a) Contextual information (b) Contextual information (c) Own files
(d) Contextual files (e) List of rules (f) Custom rule creation
FIGURE 9.8: SCREENSHOTS OF THE DEMO APPLICATION†
is retrieved only when the users select the file to be viewed. The application further-more provides a user-facing interface to the framework storage rules. Figure 9.8(e)shows all currently active storage rules. Tapping on the pink icon in the lower rightcorner opens up the interface shown in Figure 9.8(f) that allows the creation ofcustom rules.
After having carried out a field trial using this app, users were asked to assess theusability of the demo application using the System Usability Scale (SUS) [Bro96].According to the results, the application has an average SUS of 76.68.
8The SUS ranges from 0 (worst) to 100 (best). According to [BKM09], our SUS of 76.6 ranks between“good” and “excellent”.

9.5. Experience Report 169
9.5 Experience Report
In this section, we report on experiments we conducted using the demo applicationwe described in Section 9.4.5. We show the feasibility of our approach by deploy-ing several storage nodes and conduct a field study by defining sample rules andevaluating the resulting storage decisions that vStore made. The results of the fieldstudy allow us to gain further insights on which contextual properties, and thereforewhich kinds of rules, are relevant in practice.
9.5.1 Experimental Setup
Storage nodes. We deployed a total of six storage nodes in the area of Darm-stadt, Germany. The maps shown in Figure 9.9 visualize our deployment. Fig-ure 9.9(a) shows an overview of the area with the location of the storage nodesand Figure 9.9(b) zooms in on the city center with a heatmap depicting wheremost of the data was captured. For a rapid deployment, we used a RaspberryPi(version 3, model B) to host the storage nodes and MongoDB as a database to storethe data. A NodeJS server implements the storage service and acts as an interfacebetween MongoDB and the vStore framework. To simulate different types of stor-age nodes we would have in a large-scale deployment, we set different node typesin our system: two cloudlets, one gateway, one cloud node, one core net node, andone private cloud.
(a) Overview (b) City center
FIGURE 9.9: NODE LOCATIONS AND USAGE HEATMAPS†
Rules. We defined several global rules that were pushed to the phones in our fieldtrial of vStore. The most relevant are listed in Table 9.2. Note that we omit the de-tailed description of other rules that were active and mostly used to test certainfeatures (e.g., one rule triggered at an exact location placed the storage on thephone only). The table shows the contextual properties that have to match accord-ing to the rule, as well as the detail score of the rule. The bottom row furthermorereports how often the rule was executed in our field trial.
The POI Photo Rule is executed when a user is near a point of interest and wantsto upload a photo. It is applied to files of any size and only for data that is to beshared, reaching a detail score of 25 %. The decision layer first attempts to save
170 Chapter 9. Context-Aware Micro-Storage
the file on a gateway node within 5 km of the user’s location, otherwise, a cloudletwithin 20 km is used. The Social Photo Rule is executed at locations that are taggedsocial according to the places API. This rule has the same contextual filters as theprevious POI photo rule and the same detail score. We define these two rules tobe able to evaluate them separately, according to the different place contexts. TheDriving Rule is applied when the context aggregator reports the user’s activity asdriving. This rule would also be triggered if a user is aboard a train or bus. Any fileuploaded in this context will not be stored on nearby cloudlets since the user mightonly drive by a nearby POI without the intention of sharing or retrieving relateddata. Therefore, we define this rule such that files will be stored in the cloud. TheEvent Photo Rule combines two different contextual filters. First, a user has to be ata place that is of the type event. Second, a certain noise level has to be captured.We determined this value empirically by comparing readings of the AWARE noiseplugin with perceived ambient noise levels. The resulting threshold of 20 dB seemsto point towards calibration errors of the plugin, but this value seemed to representloud environments. The rule stores photos that are to be shared on a cloudlet withina radius of 30 km. The Basic Cloud Rule is used as a fallback due to the low detailscore, should no other rule yield a result. It then checks if a core net node with abandwidth of 10 GBit/s is available to upload the data. If this is not the case, thefile will be stored in the cloud. To evaluate the storage of private files, we createthe Basic Private Rule. This rule stores all files that are not intended for sharing ona private storage node.
Users. We distributed the demo application to six participants and configured theframework with the aforementioned rules. The participants were asked to use theapplication to capture various kinds of data (e.g., photos, videos, contacts) andstore them using the demo application described in Section 9.4.5.
9.5.2 Usage Patterns and Storage Decisions
We now look at how users used the application, i.e., which types of data they storedand which storage decisions were made based on the rules we defined. The bottomrow of Table 9.2 shows how many times each rule was triggered. All our definedrules were triggered during the user study. We can observe that the Basic Cloud Rulewas triggered the most, however, data was stored on cloud nodes only for 29.3 %of all data. This is because the cloud rule has a very low detail score. In manycases, other rules that relate to the user’s location or define proximity to a point ofinterest, have a more detailed score and therefore those are the ones that determinethe placement. We can think of the cloud rule as a fallback, in case there is no mostlikely place (e.g., when we are not sure where the user is).
The resulting placement decisions for the different file types that users capturedduring our study are shown in Table 9.4. The results are listed per individual storagenode. In total, users stored 178 files using vStore, most of which were photos. Outof those, 35.9 % were stored on cloudlets, 19.3 % on gateway nodes, and 2.7 %on core net nodes. In contrast to this, without vStore, users would likely have alltheir photos uploaded to distant cloud infrastructures. These numbers confirm thebenefits that can be obtained in future Edge Computing environments.
Table 9.3 lists the sharing ratio for each type of data, i.e., whether users markedthe data to be publicly shared on the storage nodes or for their private use. Fromthe results, we can observe that the sharing ratio heavily depends on the data type.
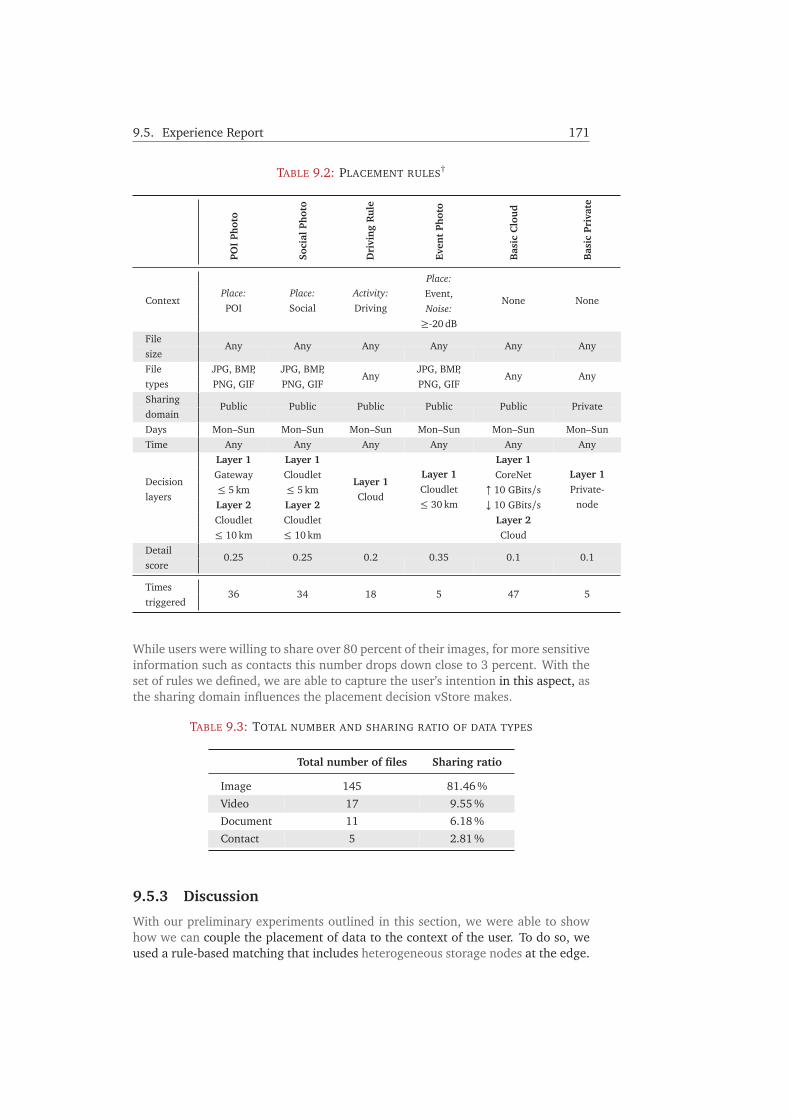
9.5. Experience Report 171
TABLE 9.2: PLACEMENT RULES†
POI
Phot
o
Soci
alPh
oto
Dri
vin
gR
ule
Even
tPh
oto
Bas
icC
lou
d
Bas
icPr
ivat
e
ContextPlace: Place: Activity:
Place:
None NonePOI Social Driving
Event,Noise:≥-20 dB
Filesize
Any Any Any Any Any Any
File JPG, BMP, JPG, BMP,Any
JPG, BMP,Any Any
types PNG, GIF PNG, GIF PNG, GIFSharingdomain
Public Public Public Public Public Private
Days Mon–Sun Mon–Sun Mon–Sun Mon–Sun Mon–Sun Mon–SunTime Any Any Any Any Any Any
Decision
Layer 1 Layer 1
Layer 1Layer 1
Layer 1Layer 1
layers
Gateway Cloudlet
CloudCloudlet
CoreNetPrivate-≤ 5 km ≤ 5 km
≤ 30 km↑ 10 GBits/s
nodeLayer 2 Layer 2 ↓ 10 GBits/sCloudlet Cloudlet Layer 2≤ 10 km ≤ 10 km Cloud
Detailscore
0.25 0.25 0.2 0.35 0.1 0.1
Timestriggered
36 34 18 5 47 5
While users were willing to share over 80 percent of their images, for more sensitiveinformation such as contacts this number drops down close to 3 percent. With theset of rules we defined, we are able to capture the user’s intention in this aspect, asthe sharing domain influences the placement decision vStore makes.
TABLE 9.3: TOTAL NUMBER AND SHARING RATIO OF DATA TYPES
Total number of files Sharing ratio
Image 145 81.46 %
Video 17 9.55 %
Document 11 6.18 %
Contact 5 2.81 %
9.5.3 Discussion
With our preliminary experiments outlined in this section, we were able to showhow we can couple the placement of data to the context of the user. To do so, weused a rule-based matching that includes heterogeneous storage nodes at the edge.

172 Chapter 9. Context-Aware Micro-Storage
TABLE 9.4: PLACEMENT RESULTS BY LOCATION AND DATA TYPE
Type of Data
Image Video Document Contact ΣSt
orag
elo
cati
onGateway 28 3 0 2 33
Cloudlet 1 35 6 1 0 42
Cloudlet 2 17 1 0 0 18
CoreNet 4 1 2 0 7
Cloud 43 3 7 3 56
Private Node 4 0 1 0 5
Phone 14 3 0 0 17
The results showed that our rules were able to capture usage contexts that ledto placement decisions closer to the edge, e.g, on cloudlets or gateway nodes. Fig-ure 9.10 summarizes the number of times a file was saved on each type of storagenode in our field trial. From the figure, we can observe that—in line with the rela-tionship between Cloud Computing and Edge Computing described in Chapter 2—in practice, Edge Computing will complement Cloud Computing, as suggested bythe near equal number of cloud locations that were chosen compared to cloudlets.In Table 9.4, we can observe that our storage rules were able to represent natu-ral choices for data storage locations. As an example, for videos, cloudlets were themost used storage destination, while for documents (data that has lower bandwidthand latency requirements, and likely lower spatio-temporal access correlations) thecloud was storage location most often used. Having appropriate storage rules andaccurate contextual information therefore allows to make these decisions automat-ically.
FIGURE 9.10: NUMBER OF PLACEMENTS PER STORAGE NODE TYPE
However, the accuracy of contextual descriptions remains an issue. For instance,files were sometimes saved using an incorrect context, due to the fact that the con-text is not updated in real-time. Keeping an accurate context on a mobile phone

9.6. Conclusion and Future Work 173
remains a trade-off between accuracy and energy consumption. In addition, muchwork still needs to be done in order to correctly recognize higher-level context.
Nevertheless, our user study exemplified the usage of cloudlets, especially ifthey are located at the edge of the network and close-by to mobile users. Thisis especially true in the context of sharing data locally. For this use case, vStoreoffers the possibility to define rules that are triggered when a user is at a certainlocation or point of interest. As outlined in Section 9.3.1.a, many people todayshare data at events, some of them even with people present at the same event. Ourresults further demonstrated a general high sharing ratio, irrespective of ongoingevents (see Table 9.3). For the future, we envision storage cloudlets to be deployedthroughout city areas, some of which will be co-located at the radio access networkor act as gateway nodes themselves (e.g., WiFi hotspots during events).
Of course, appropriate rules are required to make the framework beneficial inpractical use. We enable users to define custom rules for representing their usageintentions. In addition to custom rules, the framework allows for global rules tobe configured. In our field trial, we could see that even with just a basic set ofglobal rules, these were often executed when making the placement decisions. Infuture use of the system, infrastructure providers could set these global rules, e.g.,to specify local cloudlets on gateway nodes when regular networks are overloaded.
9.6 Conclusion and Future Work
In this chapter, we have extended the placement problem in Edge Computing fromfunctional application parts to data that users capture with their mobile devices. Wehave motivated the need for context-aware micro-storage for mobile users with a userstudy and by measurements of available cellular network bandwidth during a large-scale event. The user study gave valuable insights about usage patterns of mobileusers with regards to data storage. We then presented the concept of vStore (virtualstore), a framework that implements the building blocks for enabling micro-storageat the edge of the network. Our concept (i) enables the decoupling of storage loca-tion from predefined cloud locations, (ii) leverages small-scale cloudlets at the edgeof the network to provide proximate storage locations, (iii) uses various contextualinformation to make the placement decision, and (iv) allows for cross-applicationsharing of data. A set of global and local rules allows different stakeholders (e.g.,end users or infrastructure providers) to define custom rules that are evaluatedwhen making the decision where to store the data. The concept of context-awarestorage decisions allow to better support various use cases, e.g., sharing data atevents through proximate storage cloudlets (see Section 9.3.1.a). As the numberof consumer devices that generate data increases, storing and retrieving data fromnearby cloudlets saves scarce core network bandwidth. The concept presented inthis chapter therefore is an important building block for Edge Computing in thecontext of data-centric applications.
We conducted a field study of our system using an application for the Androidplatform through which users could capture and upload data. Furthermore, userswere able to retrieve data related to their current usage context. We deployeddifferent storage nodes in a major city and through the implementation of exampledecision rules we were able to show how this framework can complement existingcloud-based storage infrastructures. Specifically, we showed we could reduce thenumber of times that files were saved in the cloud. This could be achieved based

174 Chapter 9. Context-Aware Micro-Storage
on rules that contain context mappings (e.g., one’s location and sharing intention).The framework presented here opens up a lot of opportunities for future work.
We make all components of the framework9,10,11 and the demo application12 pub-licly available as open source to encourage future research. In particular, we suggestinvestigating the following in future work:
REPLICATION | Our framework assumes a single location where the data will bestored. However, in view of two aspects, it makes sense to include replicationstrategies: (i) edge cloudlets are typically more unreliable compared to CloudComputing infrastructures, and (ii) user mobility requires data migration inorder to maintain the benefits of proximate retrieval.
CDN INTEGRATION | This chapter has explored the data flow of a reverse CDN, i.e.,data flows from end devices that capture data towards storage locations. Inconjunction with replication, future work needs to include CDN functionalityin the framework, e.g., mechanisms for the end devices to efficiently retrievedata.
AUTOMATIC RULE GENERATION | Rules in our framework are either created by theend user or pushed globally to the devices. Creating sensible rules requires theanticipation of future usage and request patterns (e.g., where and when datawill be requested). For future work, we envision automatic rule generation.Especially techniques in the domain of machine learning could contribute tothis, e.g., by learning from a large body of usage patterns.
9https://github.com/Telecooperation/vstore-framework (accessed: 2020-02-12)10https://github.com/Telecooperation/vstore-master (accessed: 2020-02-12)11https://github.com/Telecooperation/vstore-node (accessed: 2020-02-12)12https://github.com/Telecooperation/vstore-android-filebox (accessed: 2020-02-12)

CHAPTER 10
Microservice Adaptations
Chapter Outline10.1 Introduction . . . . . . . . . . . . . . . . . . . . . . . . . . . . 175
10.2 Background and Related Work . . . . . . . . . . . . . . . . . 177
10.3 Adaptable Microservices for Edge Computing . . . . . . . . 180
10.4 Case Study . . . . . . . . . . . . . . . . . . . . . . . . . . . . . 183
10.5 Integration into an Edge Computing Framework . . . . . . 193
10.6 Conclusion and Outlook . . . . . . . . . . . . . . . . . . . . . 194
10.1 Introduction
The previous two chapters have investigated strategies for the placement of func-tional application parts (Chapter 8) and data (Chapter 9). The concepts presentedin those two chapters can be leveraged to adapt an Edge Computing system atruntime, e.g., by re-placing parts of applications or changing the storage locationof data. This chapter introduces another dimension of adaptation, building onflexEdge, our concept for an Edge Computing execution framework that was in-troduced in Chapter 7. In flexEdge, individual parts of applications are realized asmicroservices, and can be composed into more complex services, forming a pro-cessing chain of subsequent microservices. This is also the predominant executionmodel, e.g., in Serverless Computing (see Section 7.2.3).
While we are able to adapt the management of the services, e.g., through theplacement of services (see Chapter 8), the services themselves and their internalfunctioning remains non-adaptable. More specifically, microservices are imple-mented to deliver a functionality in one particular way and cannot vary how thefunctionality is provided, e.g., by providing different variants of a microservice.Those variants may, for instance, differ in the algorithms they use to perform a
175
176 Chapter 10. Microservice Adaptations
task. As another example, some services need additional auxiliary data, which canalso be varied (e.g., by using different pre-trained models for machine learningapplications).
Overview of concept. Different variants of a microservice potentially have an im-pact on two metrics: (i) the computational complexity, reflected in the executiontime and resource demand of a request, and (ii) the quality of result (QoR). Thelatter can be defined and measured in different ways, e.g., by the accuracy of theresult, i.e., its deviation from a (numeric) optimum, or by the (subjective) percep-tion of a user. Overall, these two metrics form a tradeoff, in the sense that moreaccurate results typically require more computational effort, which leads to higherexecution times and/or increased resource demands. On the other hand, if we arewilling to sacrifice computational quality, we can perform the same tasks with fewerresources.
This observation is especially remarkable in the context of Edge Computing,if we recall some of its characteristics. On the one hand, computing resourcesavailable in Edge Computing are less powerful compared to their cloud counter-parts, making efficient computing an important requirement to cope with scarceresources. Similarly, achieving resource elasticity is more challenging in Edge Com-puting, since the total available resources at a given location are much more lim-ited. On the other hand, many edge applications have stringent requirements onthe overall latency. At the same time, such mission-critical applications can be flex-ible regarding the quality of the computation result. Examples can be found in thedomain of image or video processing, and for recognition tasks. To illustrate thepractical impact of inaccurate computations, Chippa et al. [Chi+13] surveyed dif-ferent kinds of applications and found that, on average, applications spent 83 % oftheir runtime on computations that are error-tolerant.
Current Edge Computing frameworks, however, do not consider this tradeoffbetween computation effort and the quality of the computation result, and hence,miss out on this optimization opportunity. In this chapter, we present the novelconcept of adaptable microservices. We re-define microservices as blueprints for thedelivery of a particular functionality that can be adapted w.r.t. (i) the algorithmsthey use to perform a task, (ii) parameters, and (iii) auxiliary data required for thecomputation. The possible variants are implemented within the program code ofa microservice and can be selected upon its instantiation. Additionally, through acontrol channel, the current variant of a service instance can be changed at runtime.The selection of the specific variant can be made according to certain requirements,e.g., a maximum tolerable execution time or a minimum quality of result. Further-more, by having service variants with varying resource requirements, service vari-ants are a way to bring the much-valued resource elasticity of Cloud Computingto the domain of Edge Computing. Service variations are applied to an individualmicroservice, but they also have to be considered in the context of a microservicechain. For example, changing a variant of one microservice might have a dispropor-tionate impact on the overall quality or execution time of the entire service chain.
We propose to include this concept of adaptable microservices in an Edge Com-puting framework. In such a system, clients would submit an abstract definition ofthe desired microservice or service chain with their individual requirements regard-ing execution time and QoR to a controller, which would in turn have to make thefollowing decisions: (i) which service variant to choose for instantiation in each step

10.2. Background and Related Work 177
of the chain, and (ii) the assignment of user requests to service instances (since mul-tiple services in different variants might be available). Furthermore, the controllermight choose to change the variant of a particular microservice at runtime, e.g.,switch the algorithm with which the service performs its task. Especially in caseswhere microservice instances are shared between multiple microservice chains, thisbecomes a non-trivial optimization problem, because users that share (parts of) achain might have conflicting optimization goals.
Summary of contributions. This chapter is intended to open up another dimen-sion of adaptability in Edge Computing and presents an initial concept and casestudy for adaptable microservices. In summary, the contributions of this chapter arethreefold:
• We propose the concept of adaptable microservices in the context of an EdgeComputing environment (Section 10.3). To do so, we revise our previouslyproposed concept of microservices. We define the adaptability of microser-vices in three dimensions (algorithms, parameters, and auxiliary data).
• In a first explorative study, we demonstrate the practical impact of servicevariants using representative examples. First, we study how accurately wecan profile the execution times of service variants, using different hardwaresetups and features (Section 10.4.4). Second, we evaluate the impact of thevariants for single microservices and for service chains (Section 10.4.5).
• We present a concept for the integration of adaptable microservices into anexisting Edge Computing framework (Section 10.5), detailing several com-ponents required for the orchestration of those service variants across edgesurrogates and users.
10.2 Background and Related Work
Our contribution explores microservice adaptations in the context of Edge Com-puting. Some previous works explore the adaptation of services in other contexts(Section 10.2.1). We also review related work in the domain of approximate com-puting (Section 10.2.2).
10.2.1 Service Adaptation
Adaptation of services has been explored in the context of service-oriented archi-tectures (SOA) and Web Services (WS) [Pap03]. Chang et al. [CLK07] present asurvey of common adaptation methods in service-oriented computing. Hirschfeldand Kawamura [HK06] define adaptability in three dimensions: what (e.g., compu-tation/behavior or communication), when (e.g., at compile time or runtime), andhow (e.g., composition or transformation). Service adaptations can for instance berealized using adaptation templates [Kon+06]. Moser et al. [MRD08] propose toadapt WS-BPEL1 services. Contrary to our approach, they do not change the inter-nal working of the service but replace one service with another. Besides adaptingthe services, some have investigated the dynamic selection of adaptation strategies,e.g., in [PS11].
1Web Service Business Process Execution Language

178 Chapter 10. Microservice Adaptations
From a software engineering point of view, variants of services can be realizedusing Software Product Lines (SPL). SPLs are a development approach for reusableand interchangeable software [McG+02]. SPLs are characterized by their variabil-ity [vBS01] and this variability can for instance be represented with feature models[BD07]. Olaechea et al. [Ola+12] present a language and tools for the model-ing of SPLs, supporting multiple optimization goals. Based on such feature models,Sanchez et al. [SMR13] present a heuristic-based method for the selection of an op-timal configuration. Dynamic software product lines are capable of adapting, e.g.,to user requirements or resource constraints [Hal+08]. As an example, Weckesseret al. [Wec+18] examine the reconfiguration of dynamic software product lines.Reconfiguration is done based on consistency properties and learned performance-influence models. The authors however do not consider service chains, and hence,cannot capture the interdependencies of adapting multiple services in a servicechain.
More recent works have proposed adaptations for microservices and in the con-text of the IoT. Kannan et al. [Kan+19] present GrandSLAM, a microservice execu-tion framework aimed at maximizing the throughput and reducing SLA2 violations.They do not modify the microservices themselves but instead change the requestdistributions by (i) reordering requests and (ii) batching requests. It is worth not-ing that these techniques can be used in conjunction with our proposed approach.Mendonça et al. [Men+18] discuss the tradeoff between generality and reusabil-ity in self-adaptive microservices. Bhattacharya and De [BD17] survey adaptationtechniques in computation offloading, considering only the degree of concurrencyand workload heterogeneity as variations in the applications. Some works presentadaptation models for specific applications, e.g., streaming analytics [Zha+18a], orto realize fault tolerance [Zho+15]. Others adapt the granularity of the servicesand not the underlying functionalities [HB16]. In contrast, we present a generalconcept for the adaptation of the internal functioning of microservices.
10.2.2 Approximate Computing
Approximate computing trades computation quality for a reduction in the requiredeffort to perform that computation [Mit16]. The motivation to use approximatecomputing stems from the fact that in many problem domains of science and en-gineering, exact results are not required, but only results that are good enough.Examples can be found in the domain of digital signal processing, multimedia, anddata analytics. Besides algorithmic resilience, users are also tolerant of inaccurateresults. Examples are search results in information retrieval or the quality of imagesand video streams. In addition, the usage context might also influence the requiredcomputation quality [MFP20].
General related work & surveys. At the top level, we can distinguish betweenhardware and software approaches for approximate computing [Mor+18b]. Xuet al. [XMK16] classify approximate computing approaches into three layers:(i) program, (ii) architecture, and (iii) circuit. According to this classification, ourapproach of adaptable microservices falls into the first category. Moreau et al.[Mor+18b] present a taxonomy for approximate computing techniques. Besidesthe distinction between hardware and software techniques, the authors suggest
2Service Level Agreement

10.2. Background and Related Work 179
classifying techniques according to (i) architectural visibility, (ii) determinism, and(iii) granularity. The survey from Mittal [Mit16] focuses only on the hardwareaspect of approximate computing. The author reviews approximate computingtechniques for different processing units (e.g., CPU, GPU, or FPGA) and possibleapplications. In addition, examples of quality metrics for different applications arepresented. Regarding savings from approximate computing, related works considerboth the aspects of energy-saving [HO13; MSC15] and a reduction in the execu-tion time [Agr+16]. Gao et al. [Gao+17] show how approximate computing isbeneficial on the hardware level in terms of saving resources and increasing secu-rity. As for energy savings, Moreau et al. [MSC15] note that battery technology isadvancing slowly for mobile devices. This is in line with one of the main reasonsfor performing Edge Computing (see Section 3.1), i.e., saving energy on mobiledevices.
Hardware-level approximate computing. Hardware approaches work by intro-ducing imprecise logic components [Gup+11; Ye+13] or using techniques like volt-age overscaling [Moh+11]. In Edge Computing, we cannot implement approximatecomputing on a hardware level, given that we opportunistically leverage existing,heterogeneous devices over which we have no direct control. Hence, we need tomove the concept of approximate computing to the software layer, i.e., modifyingthe way that applications work.
Application-level approximate computing. One example for application-levelapproximate computing is FoggyCache [Guo+18]. The authors propose to reusecomputation results across devices, based on the observation that similar contex-tual properties map to the same or similar outcome. Perez et al. [PBC17] haveexamined the latency-accuracy tradeoff in MapReduce jobs when applying approx-imate computing. Chippa et al. [Chi+13] conduct a study in which they analyzethe resilience of different applications to result-inaccuracies. As demonstrated in[Agr+16], different approximate computing techniques can be combined. The au-thors use loop perforation, reduced precision computation, and relaxed synchro-nization on applications from the domains of digital signal processing, robotics,and machine learning. Their results suggest that up to 50 % in execution time canbe saved while producing acceptable results.
Programming frameworks. Park et al. [Par+14] present a framework for ap-proximate programming. Developers can specify accuracy constraints through an-notations and based on those, the framework automatically identifies operationsthat are safe to approximate. Extensions to programming languages that supportspecific data types to represent the characteristics of approximate computing havebeen introduced in [BMM14] and [Sam+11]. Other works have demonstrated thepotential impact of approximate computing in different application domains, e.g.,iterative methods [Zha+14], image compression [AKL18], rendering [WD10], arti-ficial neural networks [Zha+15b], and deep learning [Che+18a].
Edge- & IoT-related. Few previous works exist that apply approximate comput-ing to domains that are related to Edge Computing. Zamari et al. [Zam+17] com-bine approximate computing with Edge Computing in an IoT scenario where sensordata is to be sent to the cloud for analytics. In-transit edge nodes contribute to the

180 Chapter 10. Microservice Adaptations
analytics by carrying out intermediate computations. This is coupled with approx-imate computing techniques on a software level, such as reducing the number ofiterations or skipping certain parameter values. Wen et al. [Wen+18] employ asimilar approach. They present ApproxIoT, combining approximate computing (byusing only samples of a raw data stream) with hierarchical processing. Schäfer etal. [Sch+16a] introduce several metrics for the quality of computation (QoC), forexample, speed, precision, reliability, costs, and energy. They extend their Taskletsystem [Edi+17]—an offloading middleware for distributed computing—to provideexecution guarantees w.r.t. these QoC metrics. Compared to our adaptations, theydo so not by modifying the internal functioning of the computation unit but bycontrolling their distribution across the surrogates. For example, constraints areapplied on which machines tasklets can be executed, and computations are carriedout in parallel or redundantly. Another difference to our approach is that taskletsare more fine-grained, in the sense that they consist of application subroutines in-stead of entire services.
Microservices & mobile devices. Gholami et al. [Gho+19] propose the usageof different versions of a microservice (lightweight or heavyweight), primarily forthe purpose of scaling the application. They demonstrate how this multi-versioningcan be included in Docker containers. In a broader context, Pejovic et al. [Pej18]outline the challenges for approximate computing on mobile devices with a focuson the users’ needs. Similarly, Machidon et al. [MFP20] have noted that the field ofapproximate computing for mobile devices still lags behind its counterparts in thedesktop and server environment. Using the example of mobile video decoding, theauthors demonstrate how the acceptable quality degradation can vary according tothe user’s current context.
Summary. Table 10.1 summarizes the landscape of related work in approximatecomputing by listing representative examples. The bottom row of the table alsoshows how our approach compares to the existing ones. Compared to previousapproaches, we propose three general adaptations to the internal functioning ofapplication components. The tradeoff between result quality and execution timeis especially relevant in Edge Computing applications such as image processing orrecognition tasks. While some works have investigated the automatic selection ofvariants in the context of SPLs [SMR13], this has not been investigated in the con-text of Edge Computing. In Section 10.5, we will present a concept for the integra-tion of such a variant selection in an Edge Computing framework.
10.3 Adaptable Microservices for Edge Computing
In the remainder of this chapter, we use the term service adaptation to refer to theinternal functioning of the services. This definition stems from the observation thata particular functionality can be implemented in different ways, leading to manypossible service variants between which we can switch at runtime. This adaptationis orthogonal to other runtime optimizations that can be taken to provide certainguarantees, e.g., the scaling of microservices or their migration. Compared to costlymigration and (re-)placement strategies, we believe that our approach is a sensiblealternative because it allows for a quick reconfiguration of instance variants and,therefore, service instances can be kept active for a longer period of time.

10.3. Adaptable Microservices for Edge Computing 181
Ref
eren
ceTy
peof
appr
oach
Des
crip
tion
Focu
s
[Gup+
11;Y
e+13]
hard
war
e/
logi
cde
sign
usag
eof
impr
ecis
elo
gic
com
pone
nts
savi
ngs
inen
ergy
and
requ
ired
area
[Moh+
11]
hard
war
e/
pow
erm
an-
agem
ent
perf
orm
ing
volt
age
over
scal
ing
trad
eoff
betw
een
ener
gyco
nsum
ptio
nan
der
ror
rate
s
[Par+
14]
soft
war
e/
fram
ewor
kde
term
inin
gop
erat
ions
that
are
safe
toap
prox
imat
e,ba
sed
onsp
ecifi
edac
cu-
racy
cons
trai
nts
ener
gysa
ving
san
dre
duct
ion
inpr
o-gr
amm
eref
fort
[Guo+
18]
soft
war
e/
gene
ral
reus
eof
cach
edco
mpu
tati
onre
sult
sac
ross
devi
ces
redu
ctio
nin
late
ncy
and
ener
gyco
n-su
mpt
ion
[Zam+
17;W
en+
18]
soft
war
e/
appl
icat
ion-
spec
ific
com
bine
appr
oxim
ate
com
puti
ngw
ith
edge
anal
ytic
sof
IoT
data
spee
dup-
accu
racy
trad
eoff
[Sch+
16a]
soft
war
e/
gene
ral
cont
rolli
ngth
edi
stri
buti
onof
com
puti
ngun
its
acro
sssu
rrog
ates
prov
idin
gqu
alit
yof
com
puta
tion
(QoC
)gu
aran
tees
[Gho+
19]
soft
war
e/
gene
ral
mul
ti-v
ersi
onin
gof
soft
war
ew
ith
diff
er-
ent
Doc
ker
cont
aine
rsad
apt
soft
war
eto
diff
eren
tpe
rfor
man
cere
quir
emen
ts
[MFP
20]
soft
war
e/
appl
icat
ion-
spec
ific
dow
nsam
plin
gof
vide
ore
solu
tion
onm
obile
devi
ces
ener
gysa
ving
sw
ith
acce
ptab
lequ
alit
yde
grad
atio
n
Sect
ion
10.3
soft
war
e/
gene
ral
prov
ide
mic
rose
rvic
ead
apta
bilit
yin
thre
edi
men
sion
str
adeo
ffbe
twee
nre
sult
qual
ity
and
exe-
cuti
onti
me
TAB
LE10
.1:
EX
AM
PLE
SO
FA
PP
RO
AC
HE
SF
OR
AP
PR
OX
IMAT
EC
OM
PU
TIN
G

182 Chapter 10. Microservice Adaptations
Contrary to previous approaches, our concept of adaptable microservices com-bines the following three characteristics: (i) we adapt the internal functioning of amicroservice, i.e., we operate on the application level and adaptations are imple-mented in the program code of the microservices, (ii) we propose adaptations inthree general dimensions, and (iii) we envision a control entity that automaticallyselects and changes the service variants at runtime. This section focuses on the firsttwo characteristics and presents our conceptual model. Section 10.5 details theintegration into an Edge Computing framework that controls the variant execution.
We propose to make microservices adaptable in the following three dimensions:
(i) ALGORITHMS | A task can typically be performed by a variety of algorithms.Those not only differ in their runtime complexity, and hence, result in varyingexecution time, hardware requirements, and energy consumption, but also intheir suitability for different applications. Taking the example of compressingan image, some compression algorithms are better suited for photographswhile others perform better on vector graphics.
(ii) PARAMETERS | Parameters are variable inputs to the microservice that influ-ence its execution behavior. We model parameters as key-value pairs. Param-eters can, for example, customize the algorithm that is used. Taking the sameexample of image compression, the desired image quality would be a param-eter for such a microservice. Parameters can also be used to explicitly limitthe execution time of a microservice, e.g., via loop perforation3 [Sid+11].
(iii) AUXILIARY DATA | Some algorithms require auxiliary data to function. Thisdata is often retrieved from external sources. An example in the domain ofmachine learning are pre-trained models. This auxiliary data can also influ-ence the execution time and the computation result. For example, in recog-nition tasks performed by neural networks, more complex models producemore accurate results, but require more computing resources or take longerto complete the task.
Algorithm
aux. data
Parameters
FIGURE 10.1: VARIANTS OF ADAPTABLE MICROSERVICES
Figure 10.1 visualizes the concept of adaptable microservices. A given servicemight be variable in one or more of these dimensions. We define the possible
3loop perforation refers to skipping certain iterations in a loop or breaking the loop after a numberof iterations.
10.4. Case Study 183
combinations of all three adaptation dimensions as service variants (denoted withV1, V2, V3 in the figure).
DEFINITION 10.1: SERVICE VARIANTS
Given a set of implemented algorithms � , parameters � , and auxiliary data� for a microservice, a service variant VarM of a microservice M is defined asVarM ⊆� ×� ×� with pi = vi , i = 1 . . . n as values for the parameters. Notethat � and � are finite sets, whereas � typically is an uncountable set, e.g.,in case the parameters contain real numbers.
We assume that there are no variants across a service chain that are mutuallyexclusive. Should one want to consider this case, constraint solvers can be for se-lecting valid variants [BSC10]. We further assume that each of the variants is im-plemented in the microservice. For example, if a microservice can be implementedusing different algorithms, all those algorithms are included in the source code ofthe service. At any given time, a service maps its current variant to an internal statethat determines how it is executed when requests are processed.
The different service variants impact the result of the computation in two ways.First, the execution time varies, e.g., when less complex algorithms are invoked orloop iterations are skipped. Naturally, this leads to a reduced energy consumptionof the surrogate which executes the microservice. Second, service variants impactthe quality of result (QoR). Depending on the application, QoR needs to be defineddifferently. We can divide QoR-metrics into two categories: (i) user-centered and(ii) numeric. For user-centered metrics, techniques like questionnaires or focusgroups can be used to assess the perceived quality of result. Note that this mightnot only vary from one user to another but also might depend on the usage context(as noted in [MFP20]). As a numeric metric, we can for example quantify the errorin the computation, i.e., the deviation from a numeric optimum or the accuracy ofthe result.
10.4 Case Study
In a first case study, we build a test environment to demonstrate our concept (Sec-tion 10.4.1). We implement six different microservices (Section 10.4.2) that areadaptable in different aspects, and with those, we construct two microserviceschains (Section 10.4.3). First, we study how accurately we can construct a modelto estimate the execution time of those services (Section 10.4.4). The resultsalso allow us to identify which features (e.g., hardware characteristics) are themost relevant for such a model. Then, we demonstrate the practical impact ofthe different service variants on the execution time and (where applicable) QoR(Section 10.4.5).
10.4.1 Implementation and Test Environment
For the implementation, we partly rely on concepts and components of flexEdge(see Chapter 7). The microservices follow the design that was presented in Sec-tion 7.3.1. Microservices are executed on the agents of flexEdge (see Section 7.4.3).We implement the possibility to select the microservice variant at the start of theservice by passing arguments to the Docker CLI that are then parsed by the service

184 Chapter 10. Microservice Adaptations
at its start. For the case study, we manually select the microservice variant to studyits impact and do not rely on the flexEdge controller. Future work will incorporatethe specification of user constraints and the automatic selection and adaptation ofservice variants by the controller (see Section 10.6).
In addition to the queue that holds requests, each microservice instance is ex-tended with a control queue, which also uses RabbitMQ as a message broker. Mes-sages are published to this queue to trigger a change in a service variant. Similarly,through a REST-style API, the microservices can be queried to retrieve which vari-ant is currently active. To provide this interface, each microservice implements anabstract Microservice Manager class. This implementation is then connected to alistener for the control queue in order to parse incoming requests. As an example,Figure J.1 in Appendix J shows a UML class diagram for this functionality of theface detection microservice.
We use a similar setup as described in Section 7.6.1. The controller and mi-croservice store run on the same hardware as described there. We also use the sameLenovo ThinkCentre M920X Tiny as one edge agent node. In addition, for differentexperiments we use different AWS EC2 virtual machines. Requests are issued froma computer in the same local network as the controller, agent, and microservicestore.
10.4.2 Microservices
We implement the following adaptable microservices, as summarized in Table 10.2:
TABLE 10.2: OVERVIEW OF SERVICE VARIANTS
MicroserviceVariants
Algorithms Parameters Auxiliary Data
Face {LBP-Classifier, {scale-factor,
detection Haar-Classifier} min-neighbors } �{faster_rcnn_inception_v2_
coco, ssd_mobilenet_v1_coco,
ssd_mobilenet_v1_fpn,Object
ssd_mobilenet_v1_ppn,detection
ssd_mobilenet_v2_coco,
ssd_resnet50_v1_fpn,
� �
ssdlite_mobilenet_v2_coco}Image {compression-
compression�
quality} �Image {Gaussian blur,
blurring Median blur} {kernel-size} �Image {psnr-large, psnr-small,,
upscaling� �
noise-cancel,gans}3D mesh re- {meshrcnn,pixel2mesh,
construction� �
sphereinit,voxelrcnn}

10.4. Case Study 185
(i) FACE DETECTION | This microservice was introduced in Section 7.5.1. Its vari-ants differ in algorithms and parameters. For the algorithms, we can usetwo different types of cascade classifiers available in OpenCV4: (i) LBP and(ii) Haar. In general, LBP is faster but produces less accurate results. The mi-croservice furthermore expects two parameters: (i) scale-factor and (ii) min-neighbors. The first parameter determines the scaling between two levels ofup- or downscaling (because both algorithms work only on predefined modeldimensions). The second parameter min-neighbors specifies the minimumnumber of neighbors for candidate rectangles for those to be retained. Highervalues for this parameter lead to fewer faces being detected but at the sametime, this also decreases the number of false-positives.
(ii) OBJECT DETECTION | This microservice was also introduced in Section 7.5.1.The microservice uses different auxiliary data with pre-trained tensorflowmodels5. The models differ in their execution speed and mean average pre-cision. In total, we use six different models.
(iii) IMAGE COMPRESSION | Using the image encoding function of OpenCV, thismicroservice compresses a given input image using JPEG. JPEG is a lossycompression method. As the only variation, the compression quality can bespecified as a parameter.
(iv) IMAGE BLURRING | Given an input image and an array of rectangular regions,this microservice blurs the given regions of the image. To perform the opera-tion, we use OpenCV’s blur function. The blurring can be performed by twodifferent algorithms: (i) Gaussian blur and (ii) median blur. The Gaussianblur is a linear filter that is faster but does not preserve edges in the origi-nal image. In contrast, the median blur is a non-linear filter that is able topreserve edges. For both algorithms, a kernel size is used as a parameter todetermine the size of the convolution matrix.
(v) IMAGE UPSCALING | This microservice produces an upscaled image of the inputimage. It also aims at enhancing the quality of the upscaled image by usingResidual Dense Networks (RDN). We use an existing Keras6-based implemen-tation7 as a basis for our microservice. We use four different pre-trained mod-els that are variants of auxiliary data: psnr-large, psnr-small, noise-cancel, andgans. Except for the gans model (which quadruples the resolution), thesemodels double the original image resolution.
(vi) 3D MESH RECONSTRUCTION | This microservice aims at reconstructing a 3Dmesh representation of an object in a (2D) picture. Gkioxari et al. [GJM19]showed how this can be achieved using convolutional neural networks. Weuse the author’s published code8 as the basis for our microservice. Four dif-ferent models are used as auxiliary data. Some reconstruct only the shape ofthe object while others use voxels to achieve a more realistic representationof the object.
4see https://docs.opencv.org/2.4/doc/user_guide/ug_traincascade.html (accessed: 2020-04-06)5https://github.com/tensorflow/models/blob/master/research/object_detection/g3doc/detection_model_zoo.md
(accessed: 2020-04-22)6https://keras.io/ (accessed: 2020-04-21)7https://github.com/idealo/image-super-resolution (accessed: 2020-04-16)8https://github.com/facebookresearch/meshrcnn (accessed: 2020-04-16)
186 Chapter 10. Microservice Adaptations
10.4.3 Microservice Chains
From the microservices described in the previous Section 10.4.2, we construct twoservice chains. These service chains represent prominent applications in the do-mains of computer vision, recognition, and machine learning. Service chains withdifferent variants can also represent use cases in which data is pre-processed fora more efficient offloading (termed offload shaping [Hu+15a]) of subsequent mi-croservices, e.g., as investigated in [Li+15].
(i) FACE ANONYMIZATION | Given an image as input, this chain anonymizes facesby blurring them. First, the original image is compressed. Afterward, a facedetection is performed, outputting detected faces as rectangular coordinatesto the next service. As a final step, the image blurring microservices blurs theregions returned by the face detection microservice. An illustrative exampleof this service chain is shown in Figure 10.2(a).
(ii) 3D MESH RECONSTRUCTION OF UPSCALED IMAGES | This microservice chainfirst performs an upscaling of an input image and then reconstructs a 3D meshfrom the upscaled image. Figure 10.2(b) illustrates an example execution ofthis chain.
10.4.4 Execution Time Estimation
First, we study how accurately we can model the execution time of the microservicesand which features are relevant for creating a model of the execution time that is asaccurate as possible. In an Edge Computing framework where adaptable microser-vices are integrated (see Section 10.5), this step would be performed offline andserve as base knowledge for runtime decisions. It would allow, for instance, to esti-mate the execution time of a request and based on this estimation, make decisionsabout the placement or user-to-instance assignments.
Methodology and experimental setup. To estimate the execution time of mi-croservices, we build regression models using supervised learning methods. We usethree variants of estimators implemented in scikit-learn9, a machine learning libraryfor Python: (i) decision trees regressor, (ii) random forest regressor, and (iii) ex-tra tree regressor. For each estimated model, the R2-score is computed to assess itsquality. This metric gives an indication of how accurate the model is.
To analyze the impact of different underlying hardware configurations, we runthis evaluation on different AWS EC2 instances types as summarized in Table 10.3.They differ in CPU and memory configuration and are optimized for either general-purpose, computing, or memory-intensive applications. For each instance type, werun benchmarks of the face detection and object detection microservice. Duringthe execution of the microservices, we also record statistics on available hardwareresources and system load. Those will serve as possible features to build a modelof the execution time (for instance, to be able to predict the execution time givendifferent load levels on the system).
For the face detection, we use the two different face detection algorithms, LBPand Haar [Kad+14]. The scale-factor parameter is varied from 1.0 to 1.9 in 0.1increments and values for min-neighbors are varied from 1 to 10. We use 46 160
9https://scikit-learn.org (accessed: 2020-04-13)

10.4. Case Study 187
ImageCompression
FaceDetection
ImageBlurring
(a)
Face
anon
ymiz
atio
n
ImageUpscaling
3D MeshReconstruction
(b)
3Dm
esh
reco
nstr
ucti
onof
upsc
aled
imag
es
FIG
UR
E10
.2:
MIC
RO
SE
RV
ICE
CH
AIN
SU
SE
DF
OR
TH
EE
VA
LUAT
ION

188 Chapter 10. Microservice Adaptations
TABLE 10.3: INSTANCE TYPES USED FOR BENCHMARKING
Type vCPUs Clock rate Memory Remarks
t2.micro 1 2.5 GHza 1 GB general-purpose
t2.small 1 2.5 GHza 2 GB general-purpose
t2.medium 2 2.3 GHzb 4 GB general-purpose
t2.large 2 2.3 GHzb 8 GB general-purpose
t2.xlarge 4 2.3 GHzb 16 GB general-purpose
t2.2xlarge 8 2.3 GHzb 32 GB general-purpose
c5.large 2 3.4 GHzc 4 GB compute-optimized
c5.xlarge 4 3.4 GHzc 8 GB compute-optimized
c5.4xlarge 16 3.4 GHzc 32 GB compute-optimized
r5d.large 2 3.1 GHzd 16 GB memory-optimized
r5d.2xlarge 8 3.1 GHzd 64 GB memory-optimizedaIntel Xeon FamilybIntel Broadwell E5-2695v4c Intel Xeon Platinum 8124Md Intel Xeon Platinum 8175
different images from the WIDER FACE10 dataset. For the object detection, we usetwo different models (ssd_mobilenet_v1_coco and faster_rcnn_inception_v2_coco) onthe val2017 dataset included in the Coco Dateset11.
For each instance type, we list the combination of features and regression meth-ods that lead to the highest R2-score. Features can be properties related to thevariant of the microservice (e.g., a parameter) or attributes of the machine where itis executed. Table 10.4 shows the results for the face detection and Table 10.5 theresults for the object detection. In the table, the features are ordered in decreasingorder of importance, i.e., to what extent they contribute to the prediction of theexecution time.
Impact of the machine types. From the results, we can observe that especiallywith the more powerful machines, we can achieve high R2-scores and, hence, a highaccuracy of the model. For less powerful types of machines, e.g., the t2.micro andt2.small, we get much lower scores. This is likely due to a greater variance in execu-tion times that happens because t2-type instances are so-called burstable instances,i.e., if the system is overloaded, the CPU performance of the virtual machine is tem-porarily increased. Since this is likely to happen with the least powerful types weused, the high variance of execution times is due to the constant on-off switchingof the performance boost.
Differences in estimators and features. As a second observation, in all but onecase (face detection on a c5.4xlarge instance), the extra tree regressor led to thehighest R2-score. We can also observe great differences in the most relevant fea-tures for the execution time estimation. These differences can both be seen within
10http://shuoyang1213.me/WIDERFACE/ (accessed: 2020-04-25)11http://cocodataset.org/ (accessed: 2020-04-25)
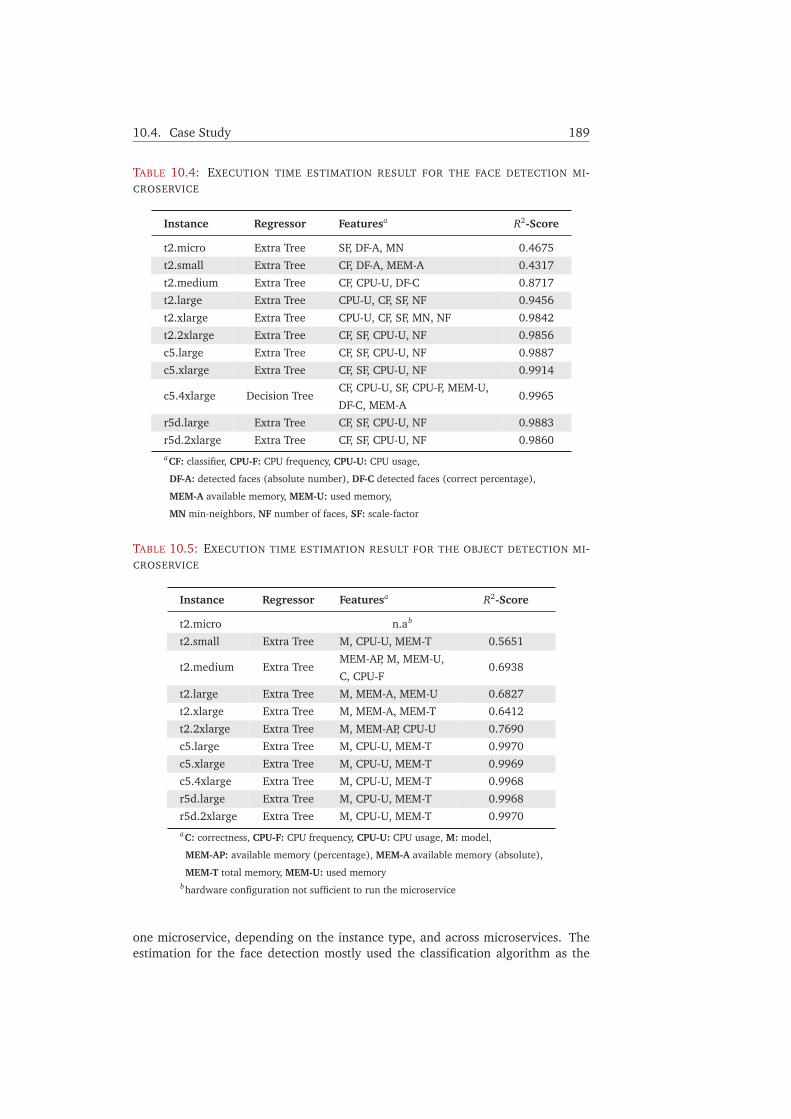
10.4. Case Study 189
TABLE 10.4: EXECUTION TIME ESTIMATION RESULT FOR THE FACE DETECTION MI-CROSERVICE
Instance Regressor Featuresa R2-Score
t2.micro Extra Tree SF, DF-A, MN 0.4675
t2.small Extra Tree CF, DF-A, MEM-A 0.4317
t2.medium Extra Tree CF, CPU-U, DF-C 0.8717
t2.large Extra Tree CPU-U, CF, SF, NF 0.9456
t2.xlarge Extra Tree CPU-U, CF, SF, MN, NF 0.9842
t2.2xlarge Extra Tree CF, SF, CPU-U, NF 0.9856
c5.large Extra Tree CF, SF, CPU-U, NF 0.9887
c5.xlarge Extra Tree CF, SF, CPU-U, NF 0.9914
c5.4xlarge Decision TreeCF, CPU-U, SF, CPU-F, MEM-U,
0.9965DF-C, MEM-A
r5d.large Extra Tree CF, SF, CPU-U, NF 0.9883
r5d.2xlarge Extra Tree CF, SF, CPU-U, NF 0.9860aCF: classifier, CPU-F: CPU frequency, CPU-U: CPU usage,
DF-A: detected faces (absolute number), DF-C detected faces (correct percentage),
MEM-A available memory, MEM-U: used memory,
MN min-neighbors, NF number of faces, SF: scale-factor
TABLE 10.5: EXECUTION TIME ESTIMATION RESULT FOR THE OBJECT DETECTION MI-CROSERVICE
Instance Regressor Featuresa R2-Score
t2.micro n.ab
t2.small Extra Tree M, CPU-U, MEM-T 0.5651
t2.medium Extra TreeMEM-AP, M, MEM-U,
0.6938C, CPU-F
t2.large Extra Tree M, MEM-A, MEM-U 0.6827
t2.xlarge Extra Tree M, MEM-A, MEM-T 0.6412
t2.2xlarge Extra Tree M, MEM-AP, CPU-U 0.7690
c5.large Extra Tree M, CPU-U, MEM-T 0.9970
c5.xlarge Extra Tree M, CPU-U, MEM-T 0.9969
c5.4xlarge Extra Tree M, CPU-U, MEM-T 0.9968
r5d.large Extra Tree M, CPU-U, MEM-T 0.9968
r5d.2xlarge Extra Tree M, CPU-U, MEM-T 0.9970aC: correctness, CPU-F: CPU frequency, CPU-U: CPU usage, M: model,
MEM-AP: available memory (percentage), MEM-A available memory (absolute),
MEM-T total memory, MEM-U: used memorybhardware configuration not sufficient to run the microservice
one microservice, depending on the instance type, and across microservices. Theestimation for the face detection mostly used the classification algorithm as the

190 Chapter 10. Microservice Adaptations
most relevant feature. With more powerful hardware, the classifier, the scale-factorparameter, and the current CPU usage are consistently ranked the most relevantfeatures, while for less powerful machines, the min-neighbors parameter and thenumber of detected faces were included in the features.
Contrary to the face detection microservices, for the object detection, we can seea clearer division of relevant features depending on the instance type. While for t2-type instances, the available memory is always a highly ranked feature (except forthe t2.small instance), this changes in favor of the CPU utilization for c-type and r-type machines. Another difference is that the t2-type instances lead to significantlylower accuracies of the model, as shown by the R2-score.
Summary. In summary, this analysis of execution time estimators has shown thatwe are able to accurately profile the different variants of microservice. This is animportant building block for the selection and adaptation of suitable microservicevariants at runtime. However, we could also observe that this estimation has to betuned to the individual microservice w.r.t. the selection of the hardware and fea-tures that are used for the estimation. This further motivates our design presentedin Section 10.5, in which the offline model is periodically updated with runtimestatistics from the execution environment.
10.4.5 Impact of Service Variants
We now study the impact of the different microservice variants. To do so, we mea-sure the correlation between different variables that relate to the service variantsand the outcomes of the computations. Most importantly, we want to assess thechange in execution time. In addition, for the face detection algorithm and, con-sequently, for the face anonymization service chain, we also analyze the impact onthe quality of the result.
To measure the pairwise correlation between variables, we use the Kendall rankcorrelation coefficient throughout this section. Contrary to other metrics for corre-lation, such as the Pearson correlation coefficient, it has the advantage that it doesnot assume a linear relationship between variables.
face detection
algorithm
min-neigbors
given faces
detected faces
correctnes
compression quality
blurring algorithm
execution time
face detectionalgorithm 1.00 0.00 0.00 -0.10 -0.10 0.00 0.00 -0.68
min-neighbors 1.00 0.00 -0.16 -0.26 0.00 0.00 -0.08
given f 1.00 0.65 0.27 0.00 0.00 0.09
detected 1.00 0.70 0.02 0.00 0.16
correctness 1.00 0.04 0.00 0.16
compression quality 1.00 0.00 0.05
blurring algorithm 1.00 0.05
execution time 1.00
FIGURE 10.3: FACE BLURRING CHAIN: CORRELATION MATRIX OF VARIANTS
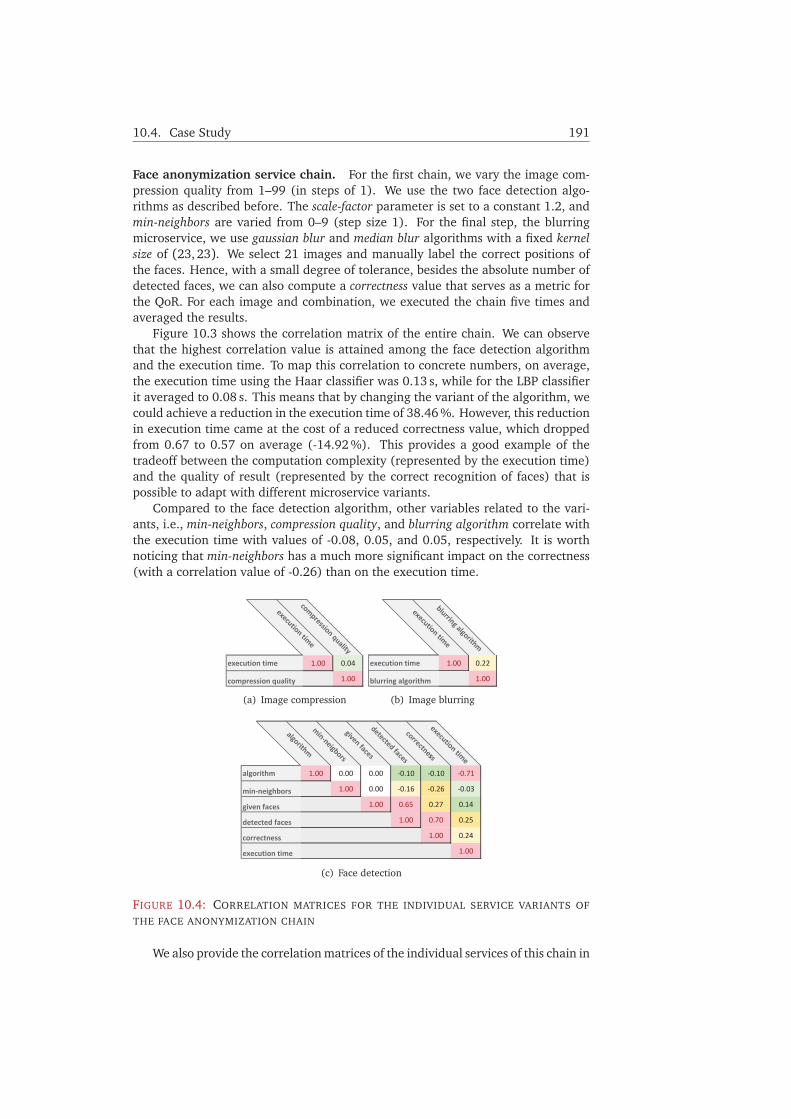
10.4. Case Study 191
Face anonymization service chain. For the first chain, we vary the image com-pression quality from 1–99 (in steps of 1). We use the two face detection algo-rithms as described before. The scale-factor parameter is set to a constant 1.2, andmin-neighbors are varied from 0–9 (step size 1). For the final step, the blurringmicroservice, we use gaussian blur and median blur algorithms with a fixed kernelsize of (23,23). We select 21 images and manually label the correct positions ofthe faces. Hence, with a small degree of tolerance, besides the absolute number ofdetected faces, we can also compute a correctness value that serves as a metric forthe QoR. For each image and combination, we executed the chain five times andaveraged the results.
Figure 10.3 shows the correlation matrix of the entire chain. We can observethat the highest correlation value is attained among the face detection algorithmand the execution time. To map this correlation to concrete numbers, on average,the execution time using the Haar classifier was 0.13 s, while for the LBP classifierit averaged to 0.08 s. This means that by changing the variant of the algorithm, wecould achieve a reduction in the execution time of 38.46 %. However, this reductionin execution time came at the cost of a reduced correctness value, which droppedfrom 0.67 to 0.57 on average (-14.92 %). This provides a good example of thetradeoff between the computation complexity (represented by the execution time)and the quality of result (represented by the correct recognition of faces) that ispossible to adapt with different microservice variants.
Compared to the face detection algorithm, other variables related to the vari-ants, i.e., min-neighbors, compression quality, and blurring algorithm correlate withthe execution time with values of -0.08, 0.05, and 0.05, respectively. It is worthnoticing that min-neighbors has a much more significant impact on the correctness(with a correlation value of -0.26) than on the execution time.
execution time
compression quality
execution time 1.00 0.04
compression quality 1.00
(a) Image compression
execution time
blurring algorithm
execution time 1.00 0.22
blurring algorithm 1.00
(b) Image blurring
algorithm
min-neigbors
given faces
detected faces
correctnes
execution time
algorithm 1.00 0.00 0.00 -0.10 -0.10 -0.71
min-neighbors 1.00 0.00 -0.16 -0.26 -0.03
given fac 1.00 0.65 0.27 0.14
detecte 1.00 0.70 0.25
correctness 1.00 0.24
execution time 1.00
(c) Face detection
FIGURE 10.4: CORRELATION MATRICES FOR THE INDIVIDUAL SERVICE VARIANTS OF
THE FACE ANONYMIZATION CHAIN
We also provide the correlation matrices of the individual services of this chain in

192 Chapter 10. Microservice Adaptations
Figure 10.4. Comparing Figure 10.4 with Figure 10.3 demonstrates the differencein correlation of a single microservice versus when this microservice is integratedinto a chain. As an example, when executed alone, the blurring algorithm has acorrelation value of 0.22 with the execution time but in the entire chain, this valuedrops to 0.05. A similar change in the correlation score can be observed for the facedetection algorithm (-0.68 to -0.71).
3D mesh reconstruction of upscaled images. For both the image upscaling and3D mesh reconstruction microservice, we use the four different variants as listed inTable 10.2. As input data, we used 5 images from a dataset depicting furniture12.Because the mesh reconstruction microservices offers GPU support, we execute thisservice chain on an AWS EC2 p2.xlarge instance (Xeon E5-2686 v4, 61 GB RAM,Nvidia K80 GPU).
Figure 10.5 shows the correlation matrix for the entire chain and Figure 10.6the matrices for the individual microservices. Note that for this microservice chain,we leave the exploration of suitable QoR-metrics for future work and focus on theexecution times.
upscaling model
mesh construction model
input resolution
output resolution
execution time
upscaling model 1.00 0.00 0.00 0.46 0.28
mesh construction model 1.00 0.00 0.00 -0.07
input resolution 1.00 0.00 0.41
output resolution 1.00 0.26
execution time 1.00
FIGURE 10.5: MESH RECONSTRUCTION CHAIN: CORRELATION MATRIX OF VARIANTS
execution time
model
input resolution
output resolution
execution time 1.00 0.28 0.41 0.26
model 1.00 0.00 0.46
input resolution 1.00 0.60
output resolution 1.00
(a) Image upscaling
execution time
model
input resolution
output resolution
execution time 1.00 0.04 0.49 0.55
model 1.00 0.00 0.00
input resolution 1.00 0.60
output resolution 1.00
(b) 3D mesh reconstruction
FIGURE 10.6: CORRELATION MATRICES FOR THE INDIVIDUAL SERVICE VARIANTS OF
THE MESH RECONSTRUCTION CHAIN
The results show that the variants of the upscaling model have more influ-ence than the different mesh reconstruction models (correlation scores of 0.28 and-0.07). As an example, the psnr-small model for image upscaling has an average
12https://www.kaggle.com/akkithetechie/furniture-detector/data (accessed: 2020-04-24)

10.5. Integration into an Edge Computing Framework 193
execution time of 11.55 s while the psnr-large model averages to 58.94 s. The meanvalues for the noise-cancel and gans models are 63.93 s and 36.36 s, respectively.This means that by selecting another variant of an image upscaling model, we canreduce the execution time up to 81.93 %. In comparison, the differences for theaverage execution times of the mesh construction models are smaller (41.26 s formeshrcnn, 42.01 s for pixel2mesh, 43.12 s for sphereint, and 44.38 s for voxelrcnn).Hence, here the maximum difference in execution time only amounts to 7.03 %.Naturally, there is also a strong correlation (0.41 and 0.26) of the execution timewith the input and output resolution of the upscaled images.
10.5 Integration into an Edge Computing Framework
request queue
control queue
Microservice Store
Reso
urce
&
plan
ning
laye
rRu
ntim
e co
ntro
lla
yer
Exec
utio
nla
yer
V2V1
V3Offline profiler
Variant selection & adaptation
Edge agent
Controller
V1
1
2
34V1
V2
Execution time estimations
exec
utio
n tim
e st
atist
ics
varia
ntad
apta
tion
FIGURE 10.7: INTEGRATION OF ADAPTABLE MICROSERVICES INTO AN EDGE COMPUT-ING FRAMEWORK
Starting from the basis of our microservice-based Edge Computing frameworkflexEdge (see Chapter 7), this section presents the conceptual design for the integra-tion of service variants into the framework, including new control and monitoringfunctionalities. Hence, this chapter serves as a blueprint for future work to includeour presented concepts into a production-grade Edge Computing system.

194 Chapter 10. Microservice Adaptations
Overview of system design. Figure 10.7 shows an overview of our proposed inte-gration concept. Components that are additions to the original flexEdge frameworkare marked with a yellow star. We structure the design of our system into three lay-ers: (i) a resource and planning layer that provides the adaptable microservices andprofiling of the services, (ii) the runtime control layer that manages the variants ofthe services, and (iii) the execution layer, where the service variants run on the edgeagents.
Profiling and monitoring of adaptive services. Variants of a microservice are in-cluded in its implementation. For each variant, an offline profiler creates a model toestimate the execution time, given different input sizes. This information serves asa basis for the controller for choosing suitable variants at the start of a microserviceor change the variants of running services. Given the heterogeneity of executionenvironments, not all possible hardware configurations and runtime characteris-tics (e.g., the current resource usages on the agents) can be considered. Hence,this information is gradually updated at runtime with collected statistics from theagents.
Changing service variants. During the execution of a microservice, its variant canbe changed. This is done through a dedicated control queue associated with eachmicroservice instance. As an example, in Figure 10.7, the service variant is changedfrom V1 to V2. This adaptation at runtime can be done for a number of reasons,e.g., when a constraint on the execution time cannot be met, a service might beinstructed by the controller to switch to a variant that produces less accurate butfaster results.
Control flow. Users can submit their requests for the execution of a service with aconstraint on the execution time or the quality of result (shown as � in Figure 10.7).Based on these constraints and the information from the profiler, a suitable servicevariant is selected (step �), instantiated (step �), and can then take user requests(step �). Note that for simplicity reasons, the figure only depicts a single microser-vice. For service chains, the decision-making process is made across all servicesin the respective chain. Besides further algorithmic contributions (e.g., w.r.t. mi-croservice placement and user-to-instance assignments), this will require scalablemonitoring and control mechanisms (see Section 10.6).
10.6 Conclusion and Outlook
In this chapter, we have revised our previously defined concept of microservices.Based on three properties of Edge Computing and its applications—constrained re-sources, tight constraints on the execution time, and flexibility regarding the qualityof the computations—we proposed the general concept of adaptable microservices.Specifically, we defined microservices to be adaptable in three aspects, related tothe internal functioning of the microservices.
In an initial study, we first studied how accurately we can estimate the executiontime of an individual service. This is an important building block for an integratedcontrol system that selects service variants at runtime and assigns users to differentservice variants.

10.6. Conclusion and Outlook 195
Adaptable microservices allow trading the quality of computations for lowerresource utilization (manifested for example in a reduced execution time). Sec-tion 10.4.5 has demonstrated this for prominent real-world use cases in the domainof recognition and computer vision tasks. For such complex tasks, we showed thatswitching to an other microservice variant can substantially reduce the executiontime. Alternatively, the less complex variant could be run on less powerful hard-ware. Compared to Cloud Computing, clustering vast amounts of resources in onelocation is not possible to the same extent in Edge Computing (e.g., because oflimited physical space at points of presence). For this reason, elasticity is typicallylower in Edge Computing. The proposed concept of microservice variants can helpin mitigating this limited elasticity by adapting the services to the limitations of theexecution infrastructure and not vice versa.
As the next step, control mechanisms for the automatic selection and change ofservice variants at runtime need to be implemented in our Edge Computing frame-work flexEdge, as conceptualized in Section 10.5. In particular, we identify thefollowing aspects as a roadmap for future work:
HIERARCHICAL MONITORING AND CONTROL | To ensure that application-specificconstraints w.r.t. the execution time and result quality are met, the executionof service chains needs to be monitored. Given the highly distributed natureof the surrogates, having only one centralized controller does not meet thescalability requirements of Edge Computing. Hence, we envision hierarchicalmonitoring and control mechanisms.
VARIANT SELECTION AND ADAPTATION | Based on continuous monitoring of the ex-ecution environment, the available resources on the surrogates, and user re-quirements, future work will investigate strategies for the selection and adap-tation of service variants. This is a challenging optimization problem, espe-cially when microservice instances are shared across users that specify differ-ent execution constraints.
NETWORK CONTROL LAYER | In a distributed Edge Computing system, not only theresources on the edge nodes and the microservices’ complexity influence theexecution time but also the network conditions and types of connections be-tween the nodes (e.g., when the microservices of one service chain run on dif-ferent nodes). Future work should take this into consideration in two aspects:First, fine-grained monitoring of network conditions can help in making run-time decisions for the placement and assignment of microservices. Second,we can extend the control itself to the network layer, e.g., by reserving band-width on links or using SDN to control the data flow between edge nodes.
DEFINING AND WEIGHTING MULTIPLE QOR METRICS | As we have noted, the qualityof a computation can be defined in different ways. However, the interplay be-tween user-perceived QoR and mathematical metrics for QoR is not well un-derstood yet. Furthermore, it remains unclear how both types of QoR shouldbe weighted if they are part of one service chain.
DEFINING SERVICE VARIANTS THROUGH SPLS | Software product lines allow for ageneral modeling of application variants. Using this established techniquewould also make it possible to model more complex dependencies betweenvariants (e.g., when certain combinations of variants are mutually exclusive).

196 Chapter 10. Microservice Adaptations
ONLINE REFINEMENT OF EXECUTION TIME MODELS | We have built offline regres-sion models for the execution time estimation of microservices. Such modelscannot, however, take into account all possible hardware and input data thatwill occur once a service is deployed. Therefore, the models should be re-fined at runtime with statistics that are collected on the edge nodes duringthe execution of microservices.
Part V
EpilogueIn the last part of this dissertation, we conclude by summarizing ourcontributions and outlining future research directions.
197


CHAPTER 11
Conclusion
Chapter Outline11.1 Summary . . . . . . . . . . . . . . . . . . . . . . . . . . . . . . 199
11.2 Future Work . . . . . . . . . . . . . . . . . . . . . . . . . . . . 201
11.3 Outlook . . . . . . . . . . . . . . . . . . . . . . . . . . . . . . . 204
11.1 Summary
Edge Computing is an emerging paradigm that brings storage and processing capa-bilities closer to the ever-increasing number of (mobile) end devices, sensors, andactuators. It therefore introduces a new middle-tier between end devices and dis-tant Cloud Computing infrastructures. This brings several advantages comparedto the state-of-the-art Cloud Computing paradigm, such as a reduced latency orbandwidth savings in the core network. This in turn enables upcoming applica-tions, such as augmented reality, IoT data analytics, and collaborative gaming. Onemajor challenge towards the widespread availability of Edge Computing is the de-ployment of elastic, proximate computing resources. For two reasons, we envisionsuch resources to be deployed in urban areas first: (i) the proposed applications foredge computing typically involve densely interconnected people and things, and(ii) both Cloud Computing providers and operators of cellular networks are in theprocess of deploying general-purpose hardware in or close to the access network,naturally preferring regions with a large number of potential customers.
In this thesis, we have presented contributions in the field of Urban Edge Comput-ing, i.e., Edge Computing in an urban environment. This environment is character-ized by its heterogeneity in different aspects, which we have considered throughoutthe contributions of this thesis. First, Edge Computing features a variety of devices,data sources, and consumers. Those are connected using different wireless access
199

200 Chapter 11. Conclusion
technologies (e.g., WiFi or cellular networks). Second, a variety of applications re-quire computation and storage capabilities, each with individual requirements, e.g.,with regards to processing latency or data locality. Third, the infrastructure for EdgeComputing, i.e., the resources that will be used to host data and computations, arehighly heterogeneous in their capacity, cost, and ownership.
This thesis consisted of four main parts that made contributions to the under-standing, planning, deployment, and operation of Edge Computing. Our focus onurban Edge Computing is especially emphasized by Part II, in which we considerurban infrastructures, such as street lamps, as infrastructural resources for EdgeComputing deployments. The contributions presented in the other parts of thisthesis are relevant beyond urban infrastructures.
We now conclude this thesis by summarizing the contributions made in thoseparts.
PART I | The first part provided a detailed background and analysis of the stateof the art in Edge Computing. We provided a taxonomy (Chapter 2) of EdgeComputing and analyzed its characteristics (Chapter 3). In Chapter 4, we per-formed a systematic survey of use cases for Edge Computing and proposed aclassification scheme for Edge Computing applications. Part I therefore con-tributes to the general understanding of the field of Edge Computing, refinesits definition in an urban context, and highlights important (future) use cases.
PART II | In the second part, we examined the infrastructures in an urban environ-ment on which we can place cloudlets—small-scale proximate data centers—to offer Edge Computing resources to (mobile) users. In Chapter 5, we per-formed a systematic analysis of the coverage that can be achieved using theexisting access point infrastructure in a city, while Chapter 6 proposed a place-ment strategy for heterogeneous cloudlets on those access points. This parthence provided insights for the design and planning of the physical infra-structure (in terms of hardware and communication capabilities) for EdgeComputing in an urban environment.
PART III | Part III focused on the actual execution of computations at the edge. Torealize this, Chapter 7 proposed an Edge Computing framework that is basedon computation onloading through a microservice store. The framework is analternative approach to state-of-the-art offloading approaches, in which theoffloadable parts of the applications are either pre-provisioned on the edgenodes or transferred from the client device to the surrogate. Furthermore, thereuse of microservice instances at runtime allows for an efficient use of edgeresources. We have shown how our approach is beneficial in terms of reducedend-to-end latency and battery savings for the client device. The contributionsin this part lay the basis for the efficient execution of application parts at theedge.
PART IV | Lastly, Part IV presented strategies and adaptations to make runtimedecisions in an Urban Edge Computing system. In Chapter 8, we proposedan approach for the scalable placement of operators, i.e., functional parts ofapplications. Given the complexity of the problem, we suggested placementheuristics that reduce the solving time of the problem, while introducing onlya small optimality gap. The reduction in solving time in practice leads to afaster provisioning of services for users, increasing the quality of experience
11.2. Future Work 201
and allowing for fast reconfigurations of placements. Chapter 9 in turn in-vestigated the placement of data. More specifically, we proposed the conceptof context-aware micro storage at the edge of the network. We realized thisconcept and developed vStore, an open-source framework targeted at mo-bile users. Our concept makes rule-based storage decisions, leverages prox-imate storage nodes to save core network bandwidth, and allows for cross-application sharing of data. Chapter 10 revised the previously introducedconcept of microservices by making them adaptable at runtime. We intro-duced the notion of service variants that can dynamically be selected to tradeoff execution time and quality of results. Given the different latency require-ments of applications and varying computing resources in Edge Computing,this tradeoff allows to adapt an Edge Computing execution system to thosecharacteristics. Furthermore, the concept of service variants allows to shrinkthe gap in resource elasticity between Edge Computing and Cloud Computing.
The contributions made in the individual parts can stand for themselves andshould be viewed independently. However, in a broader context, parts II–IV can beconsidered building blocks for an overall Urban Edge Computing system. Part IIprovides the substrate on which a distributed Edge Computing runtime (Part III)operates. The runtime in turn relies on mechanisms presented in Part IV for itsdecision-making (e.g., where to place data and carry out computations).
11.2 Future Work
This thesis made distinctive improvements in the field of Edge Computing. We can,however, imagine several remaining obstacles that hinder the widespread availabil-ity of Edge Computing in urban spaces as envisioned in this thesis. In this chapter,we outline some open questions and possible future research directions.
11.2.1 Discovery
On several occasions, we have highlighted the opportunistic and highly distributednature of Urban Edge Computing, in which users leverage various storage and com-puting resources owned by different stakeholders in their surroundings. One man-ifestation of this aspect is that surrogates will be spread throughout the entire net-work, inside different Internet autonomous systems (AS) [HB96] that are ownedand operated by different stakeholders. This in itself poses challenges, e.g, withregards to interoperability and revenue models (see Section 11.2.3). Even if weassume a future standardized Edge Computing infrastructure with roaming andaccounting models across stakeholders, the challenge of discovering available sur-rogates remains.
Service discovery is a well-established problem in the domains of pervasive com-puting and web services and, hence, various solutions have been proposed [Hel02;ZMN05]. For different reasons they are not applicable in an Edge Computing envi-ronment, where we require a loose coupling between users and surrogates in orderto achieve a seamless migration of services (e.g., because of user mobility). InEdge Computing, we need discovery mechanisms that work on a global scale andyet remain scalable. Broadcast protocols and approaches that rely on centralizeddatabases clearly do not fulfill these requirements. Several proposed approaches in
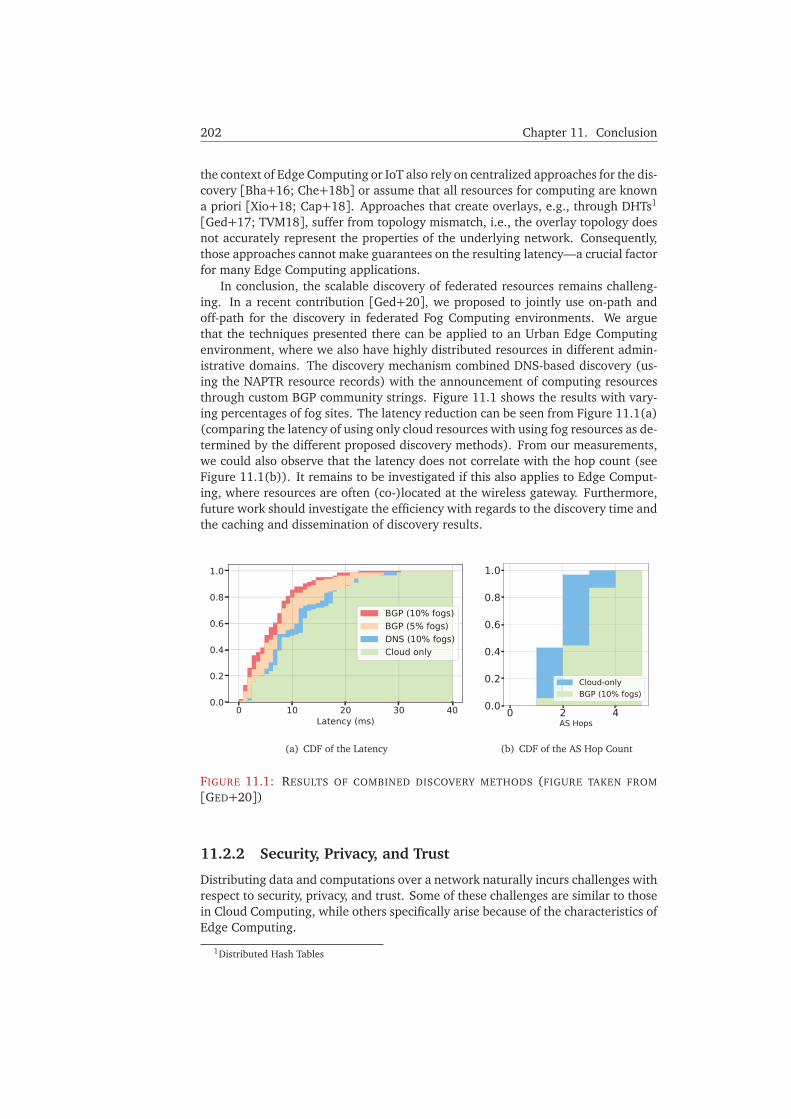
202 Chapter 11. Conclusion
the context of Edge Computing or IoT also rely on centralized approaches for the dis-covery [Bha+16; Che+18b] or assume that all resources for computing are knowna priori [Xio+18; Cap+18]. Approaches that create overlays, e.g., through DHTs1
[Ged+17; TVM18], suffer from topology mismatch, i.e., the overlay topology doesnot accurately represent the properties of the underlying network. Consequently,those approaches cannot make guarantees on the resulting latency—a crucial factorfor many Edge Computing applications.
In conclusion, the scalable discovery of federated resources remains challeng-ing. In a recent contribution [Ged+20], we proposed to jointly use on-path andoff-path for the discovery in federated Fog Computing environments. We arguethat the techniques presented there can be applied to an Urban Edge Computingenvironment, where we also have highly distributed resources in different admin-istrative domains. The discovery mechanism combined DNS-based discovery (us-ing the NAPTR resource records) with the announcement of computing resourcesthrough custom BGP community strings. Figure 11.1 shows the results with vary-ing percentages of fog sites. The latency reduction can be seen from Figure 11.1(a)(comparing the latency of using only cloud resources with using fog resources as de-termined by the different proposed discovery methods). From our measurements,we could also observe that the latency does not correlate with the hop count (seeFigure 11.1(b)). It remains to be investigated if this also applies to Edge Comput-ing, where resources are often (co-)located at the wireless gateway. Furthermore,future work should investigate the efficiency with regards to the discovery time andthe caching and dissemination of discovery results.
(a) CDF of the Latency (b) CDF of the AS Hop Count
FIGURE 11.1: RESULTS OF COMBINED DISCOVERY METHODS (FIGURE TAKEN FROM
[GED+20])
11.2.2 Security, Privacy, and Trust
Distributing data and computations over a network naturally incurs challenges withrespect to security, privacy, and trust. Some of these challenges are similar to thosein Cloud Computing, while others specifically arise because of the characteristics ofEdge Computing.
1Distributed Hash Tables
11.2. Future Work 203
Mainly due to the high (geographic) distribution of resources, Edge Computingincreases the likelihood of physical attacks on the infrastructure. Not only a fewdata centers, but a multitude of edge sites need to be secured. These edge sites aresometimes located in unguarded places, such as roadside units or street lamps, mak-ing them susceptible to theft and sabotage. Hence, ensuring the physical integrityof edge sites remains challenging.
Aside from the physical security of edge sites, securing the execution environ-ment is another crucial factor in both Edge Computing and Cloud Computing. EdgeComputing typically makes use of lightweight virtualization technologies (see Sec-tion 3.5.2). The security aspect of those different virtualization technologies issubject to discussion within the research community [Man+17; CMD16]. Otherchallenges include securing the users’ data and network security [YQL15]. As anexample for the latter, Stojmenovic et al. [Sto+16] describe a stealthy man-in-the-middle attack in a Fog Computing scenario. Roman et al. [RLM18] survey furthersecurity threats and challenges. Following the aftermath of a successful attack,Wang et al. [WUS15] discuss future challenges in forensics for Fog Computing.
Users of Edge Computing deployments have to trust the execution environment.In contrast to Cloud Computing, this execution environment might span over mul-tiple administrative domains, including devices that are privately owned (see Sec-tion 3.3). Trust can encompass multiple aspects. First, edge nodes should not revealprivacy-sensitive information. Second, if we envision the deployment of an EdgeComputing system as described in Chapter 7, we need to guarantee the securityand integrity of the services provided, especially if those are shared between mul-tiple applications and the user has no control over which service will be invoked.Furthermore, users should be able to trust the correctness of the computation. Fewinitial works in this direction exist. For example, Ruan et al. [RDU18] propose atrust management framework to assess trust for computations and devices in anMEC-IoT environment. Zhang et al. [Zha+18c] analyze the data security and pri-vacy threats in Edge Computing. Others have focused on these issues solely in thecontext of the IoT [Vas+15; Per+15].
11.2.3 Business Models
Unlike for current Cloud Computing offerings, in Edge Computing it remains un-clear what the predominant business models will be. In their review about the pastresearch on cyber foraging, Balan and Flin [BF17] raise the question of who shouldprovide surrogates for offloading, naming application providers, users, and third-party infrastructure providers as possible candidates. Aijaz et al. [AAA13] shedlight on the business perspective of data offloading from the point of view of devicemanufacturers, service providers, and hotspot operators. Others have argued thatEdge Computing needs the same flexible pay-as-you-go services models as CloudComputing [Ahm+17].
Edge Computing as we have envisioned it throughout this thesis is dynamic andmust be carried out in cooperative ways, e.g., mobile users must switch to othercloudlets. Hence, to realize the full potential of Edge Computing, different stake-holders and competitors must work together (e.g., to regulate data transit and en-abling handover of users and services). Ideally, users should be able to seamlesslymigrate their data and computations independent of who owns the underlying infra-structure. Besides new business models and technical standards, this also requiresnovel accounting mechanisms [Rez+18]. We believe this is one of the main reasons

204 Chapter 11. Conclusion
that no widespread infrastructure for Urban Edge Computing is available today.If we also consider privately owned devices for Edge Computing, the question of
business models shifts to incentive mechanisms. Previous works in this aspect havefocused on sharing the access network, e.g., sharing one’s broadband connectionvia WiFi [Shi+15; MPP10]. Sharing the additional resources available at or colo-cated with home gateways could be a next step. Some recent works have begunto investigate incentive mechanisms for offloading in Edge Computing [Zen+18;Liu+17] but those are mainly theoretical results that still are to be validated withpractical studies.
11.3 Outlook
Although Edge Computing is not ubiquitously and openly present today, novel ap-plications such as mobile augmented reality and assisted driving will drive the needfor low-latency processing over fast wireless connections in the near future, espe-cially when those applications work cooperatively.
We are just beginning to see how infrastructure is changing to support such ap-plications. Novel communication standards such as 5G are being deployed, offeringunprecedented wireless bandwidth and ultra-low latency connectivity for mobiledevices. At the same time, the computing resources at the edge change and nowinclude more general-purpose, virtualized computing hardware, resembling the in-frastructure found in the Cloud Computing environment. Owners of these resources(e.g., mobile network operators) therefore can leverage this flexibility to offer addi-tional services, e.g., general-purpose computing for edge applications. EstablishedCloud Computing providers are also offering new services for proximate comput-ing resources (e.g., Amazon’s lambda@edge2 or Microsoft’s announcement of AzureEdge Zones3) in an attempt to enter the emerging Edge Computing market. Both ofthese trends—enhanced wireless access technologies and more proximate general-purpose computing resources— lay important technological groundworks for thepractical adoption of Edge Computing.
In the 2019 edition4 of their “Hype Cycle for Emerging Technologies”, Gartnerassessed edge analytics at the “peak of inflated expectations”. How deep the dropfrom this peak will be before Edge Computing reaches the “plateau of productiv-ity” will depend on a number of factors. Some of those remain open questions,especially w.r.t. business models (see Section 11.2.3) and compatibility betweendifferent Edge Computing providers, while this dissertation contributed solutionsw.r.t. technical questions for Edge Computing.
2https://aws.amazon.com/lambda/edge/ (accessed: 2020-06-12)3https://docs.microsoft.com/en-us/azure/networking/edge-zones-overview (accessed:
2020-06-12)4https://www.gartner.com/en/documents/3956015/hype-cycle-for-emerging-technologies-2019
(accessed: 2020-06-11)

Bibliography
[AAA13] Adnan Aijaz, Hamid Aghvami, and Mojdeh Amani. “A survey on mo-bile data offloading: technical and business perspectives”. In: IEEEWireless Communnications 20.2 (2013), pp. 104–112.
[Aaz+16] M. Aazam, M. St-Hilaire, C. Lung, and I. Lambadaris. “Cloud-basedsmart waste management for smart cities”. In: Proc. of the 2016 IEEE21st International Workshop on Computer Aided Modelling and Designof Communication Links and Networks (CAMAD). 2016, pp. 188–193.
[Aba+] Omid Abari, Dinesh Bharadia, Austin Duffield, and Dina Katabi. “En-abling High-Quality Untethered Virtual Reality”. In: Proc. of the 14thUSENIX Symposium on Networked Systems Design and Implementation(NSDI), pp. 531–544.
[Aba+15] Omid Abari, Deepak Vasisht, Dina Katabi, and Anantha Chan-drakasan. “Caraoke: An E-Toll Transponder Network for SmartCities”. In: Proc. of the 2015 ACM Conference on Special InterestGroup on Data Communication (SIGCOMM). 2015, pp. 297–310.
[Abb+18] Nasir Abbas, Yan Zhang, Amir Taherkordi, and Tor Skeie. “MobileEdge Computing: A Survey”. In: IEEE Internet of Things Journal 5.1(2018), pp. 450–465.
[Abd+16] S. Abdelwahab, B. Hamdaoui, M. Guizani, and T. Znati. “Networkfunction virtualization in 5G”. In: IEEE Communications Magazine54.4 (2016), pp. 84–91.
[Abo+99] Gregory D. Abowd, Anind K. Dey, Peter J. Brown, Nigel Davies,Mark Smith, and Pete Steggles. “Towards a Better Understanding ofContext and Context-Awareness”. In: Proc. of the First InternationalSymposium on Handheld and Ubiquitous Computing (HUC). 1999,pp. 304–307.
[AD14] H. Ahlehagh and S. Dey. “Video-Aware Scheduling and Caching inthe Radio Access Network”. In: IEEE/ACM Transactions on Networking22.5 (2014), pp. 1444–1462.
205

206 Bibliography
[ADH18] Nurzaman Ahmed, Debashis De, and Iftekhar Hussain. “Internet ofThings (IoT) for Smart Precision Agriculture and Farming in RuralAreas”. In: IEEE Internet of Things Journal 5.6 (2018), pp. 4890–4899.
[AG10] Alvaro Alesanco and Jose García. “Clinical Assessment of WirelessECG Transmission in Real-Time Cardiac Telemonitoring”. In: IEEETransactions on Information Technology in Biomedicine 14 (2010),pp. 1144–1152.
[Agr+16] Ankur Agrawal, Jungwook Choi, Kailash Gopalakrishnan, SuyogGupta, Ravi Nair, Jinwook Oh, Daniel A. Prener, Sunil Shukla, Vi-jayalakshmi Srinivasan, and Zehra Sura. “Approximate computing:Challenges and opportunities”. In: Proc. of the IEEE InternationalConference on Rebooting Computing (ICRC). 2016, pp. 1–8.
[Agu+10] Trevor R. Agus, Clara Suied, Simon J. Thorpe, and Daniel Pressnitzer.“Characteristics of human voice processing”. In: Proc. of the Interna-tional Symposium on Circuits and Systems (ISCAS). 2010, pp. 509–512.
[AH14] M. Aazam and E. Huh. “Fog Computing and Smart Gateway BasedCommunication for Cloud of Things”. In: Proc. of the 2014 Inter-national Conference on Future Internet of Things and Cloud. 2014,pp. 464–470.
[AH15] M. Aazam and E. Huh. “E-HAMC: Leveraging Fog computing foremergency alert service”. In: Proc. of the 2015 IEEE InternationalConference on Pervasive Computing and Communication Workshops(PerCom Workshops). 2015, pp. 518–523.
[Ahm+17] E. Ahmed, A. Ahmed, I. Yaqoob, J. Shuja, A. Gani, M. Imran, and M.Shoaib. “Bringing Computation Closer toward the User Network: IsEdge Computing the Solution?” In: IEEE Communications Magazine55.11 (2017), pp. 138–144.
[AIM10] Luigi Atzori, Antonio Iera, and Giacomo Morabito. “The Internet ofThings: A survey”. In: Computer Networks 54.15 (2010), pp. 2787–2805.
[AKL18] Haider A. F. Almurib, Thulasiraman Nandha Kumar, and FabrizioLombardi. “Approximate DCT Image Compression Using Inex-act Computing”. In: IEEE Transactions on Computers 67.2 (2018),pp. 149–159.
[Ala+10] Firat Alagöz, André Calero Valdez, Wiktoria Wilkowska, MartinaZiefle, Stefan Dorner, and Andreas Holzinger. “From Cloud Comput-ing to Mobile Internet, from User Focus to Culture and Hedonism -The Crucible of Mobile Health Care and Wellness Applications”. In:Proc. of the 5th International Conference on Pervasive Computing andApplications (ICPCA). 2010, pp. 38–45.
[Ala+18] M. Alam, J. Rufino, J. Ferreira, S. H. Ahmed, N. Shah, and Y. Chen.“Orchestration of Microservices for IoT Using Docker and Edge Com-puting”. In: IEEE Communications Magazine 56.9 (2018), pp. 118–123.

Bibliography 207
[AlF+15] A. Al-Fuqaha, M. Guizani, M. Mohammadi, M. Aledhari, and M.Ayyash. “Internet of Things: A Survey on Enabling Technologies,Protocols, and Applications”. In: IEEE Communications Surveys &Tutorials 17.4 (2015), pp. 2347–2376.
[Alr+17] A. Alrawais, A. Alhothaily, C. Hu, and X. Cheng. “Fog Computing forthe Internet of Things: Security and Privacy Issues”. In: IEEE InternetComputing 21.2 (2017), pp. 34–42.
[Alt+16] Qutaibah Althebyan, Qussai Yaseen, Yaser Jararweh, and MahmoudAl-Ayyoub. “Cloud support for large scale e-healthcare systems”. In:Annales des Télécommunications 71.9-10 (2016), pp. 503–515.
[AMM15] Sereen Althaher, Pierluigi Mancarella, and Joseph Mutale. “Auto-mated demand response from home energy management systemunder dynamic pricing and power and comfort constraints”. In: IEEETransactions on Smart Grid 6.4 (2015), pp. 1874–1883.
[Ana+17] G. Ananthanarayanan, P. Bahl, P. Bodík, K. Chintalapudi, M. Philipose,L. Ravindranath, and S. Sinha. “Real-Time Video Analytics: The KillerApp for Edge Computing”. In: Computer 50.10 (2017), pp. 58–67.
[App+10] David Applegate, Aaron Archer, Vijay Gopalakrishnan, SeungjoonLee, and K. K. Ramakrishnan. “Optimal Content Placement for aLarge-scale VoD System”. In: Proc. of the 2010 ACM Conference onEmerging Networking Experiments (CoNEXT). 2010, 4:1–4:12.
[AS13] Sameer Alawnah and Assim Sagahyroon. “Modeling SmartphonesPower”. In: Proc. of Eurocon. 2013, pp. 369–374.
[AS16] Aymen El Amraoui and Kaouthar Sethom. “Cloudlet Softwarizationfor Pervasive Healthcare”. In: Proc. of the 30th International Confer-ence on Advanced Information Networking and Applications (AINA)Workshops. 2016, pp. 628–632.
[ASH15] Nazanin Aminzadeh, Zohreh Sanaei, and Siti Hafizah Ab Hamid.“Mobile storage augmentation in mobile cloud computing: Taxon-omy, approaches, and open issues”. In: Simulation Modelling Practiceand Theory 50 (2015), pp. 96–108.
[Awa+19] K. S. Awaisi, A. Abbas, M. Zareei, H. A. Khattak, M. U. Shahid Khan,M. Ali, I. Ud Din, and S. Shah. “Towards a Fog Enabled Efficient CarParking Architecture”. In: IEEE Access 7 (2019), pp. 159100–159111.
[AXS17] Raef Abdallah, Lanyu Xu, and Weisong Shi. “Lessons and experiencesof a DIY smart home”. In: Proc. of the Workshop on Smart Internet ofThings. SmartIoT ’17. 2017, 4:1–4:6.
[AZH18] Mohammad Aazam, Sherali Zeadally, and Khaled A Harras. “Deploy-ing fog computing in industrial internet of things and industry 4.0”.In: Transactions on Industrial Informatics 14.10 (2018), pp. 4674–4682.
[Azi+17] Iman Azimi, Arman Anzanpour, Amir M. Rahmani, Tapio Pahikkala,Marco Levorato, Pasi Liljeberg, and Nikil D. Dutt. “HiCH: HierarchicalFog-Assisted Computing Architecture for Healthcare IoT”. In: ACMTransactions on Embedded Computing Systems 16.5 (2017), 174:1–174:20.
208 Bibliography
[AZM15] T. Anagnostopoulos, A. Zaslavsky, and A. Medvedev. “Robust wastecollection exploiting cost efficiency of IoT potentiality in SmartCities”. In: Proc. of the 2015 International Conference on Recent Ad-vances in Internet of Things (RIoT). 2015, pp. 1–6.
[Azu97] Ronald Azuma. “A Survey of Augmented Reality”. In: Presence 6.4(1997), pp. 355–385.
[Baj+15] A. Bajpai, V. Jilla, V. N. Tiwari, S. M. Venkatesan, and R. Narayanan.“Quantifiable fitness tracking using wearable devices”. In: Proc. ofthe 37th Annual International Conference of the IEEE Engineering inMedicine and Biology Society (EMBC). 2015, pp. 1633–1637.
[Bal+02] Rajesh Krishna Balan, Jason Flinn, Mahadev Satyanarayanan,Shafeeq Sinnamohideen, and Hen-I Yang. “The case for cyber forag-ing”. In: Proc. of the 10th ACM SIGOPS European Workshop. 2002,pp. 87–92.
[Bal+07] Rajesh Krishna Balan, Darren Gergle, Mahadev Satyanarayanan, andJames Herbsleb. “Simplifying Cyber Foraging for Mobile Devices”. In:Proc. of the 5th International Conference on Mobile Systems, Applica-tions and Services. MobiSys ’07. 2007, pp. 272–285.
[Bal+17] Ioana Baldini, Paul C. Castro, Kerry Shih-Ping Chang, Perry Cheng,Stephen Fink, Vatche Ishakian, Nick Mitchell, Vinod Muthusamy, Ro-dric Rabbah, Aleksander Slominski, and Philippe Suter. “ServerlessComputing: Current Trends and Open Problems”. In: Research Ad-vances in Cloud Computing. 2017, pp. 1–20.
[Ban+14] B. Bangerter, S. Talwar, R. Arefi, and K. Stewart. “Networks and de-vices for the 5G era”. In: IEEE Communications Magazine 52.2 (2014),pp. 90–96.
[Bas+03] Harpal S. Bassali, Krishnanand M. Kamath, Rajendraprasad B.Hosamani, and Lixin Gao. “Hierarchy-aware algorithms for CDNproxy placement in the Internet”. In: Computer Communications 26.3(2003), pp. 251–263.
[Baz+13] Sobir Bazarbayev, Matti A. Hiltunen, Kaustubh R. Joshi, William H.Sanders, and Richard D. Schlichting. “PSCloud: a durable context-aware personal storage cloud”. In: Proc. of the 9th Workshop on HotTopics in Dependable Systems (HotDep). 2013, 9:1–9:6.
[BB14] M. Bani Younes and A. Boukerche. “An Intelligent Traffic Lightscheduling algorithm through VANETs”. In: Proc. of the 39th An-nual IEEE Conference on Local Computer Networks Workshops. 2014,pp. 637–642.
[BBD14] E. Bastug, M. Bennis, and M. Debbah. “Living on the edge: The role ofproactive caching in 5G wireless networks”. In: IEEE CommunicationsMagazine 52.8 (2014), pp. 82–89.
[BCZ97] Samrat Bhattacharjee, Kenneth L. Calvert, and Ellen W. Zegura. “Anarchitecture for active networking”. In: Proc. of the 7th IFIP Interna-tional Conference on High Performance Networking (HPN’97). 1997,pp. 265–279.

Bibliography 209
[BD07] Danilo Beuche and Mark Dalgarno. “Software product line engineer-ing with feature models”. In: Overload Journal 78 (2007), pp. 5–8.
[BD17] Arani Bhattacharya and Pradipta De. “A survey of adaptation tech-niques in computation offloading”. In: Journal of Network and Com-puter Applications 78 (2017), pp. 97–115.
[Bec+14] Michael Till Beck, Martin Werner, Sebastian Feld, and Thomas Schim-per. “Mobile Edge Computing: A Taxonomy”. In: Proc. of the Sixth In-ternational Conference on Advances in Future Internet (AFIN). 2014,pp. 48–54.
[Ben14] Juan Benet. “IPFS - Content Addressed, Versioned, P2P File System”.In: CoRR abs/1407.3561 (2014), pp. 1–11.
[BF17] Rajesh Krishna Balan and Jason Flinn. “Cyber Foraging: Fifteen YearsLater”. In: IEEE Pervasive Computing 16.3 (2017), pp. 24–30.
[BG17] Tayebeh Bahreini and Daniel Grosu. “Efficient placement of multi-component applications in edge computing systems”. In: Proc. of the2nd ACM/IEEE Symposium on Edge Computing (SEC). 2017, 5:1–5:11.
[BGG19] Azzedine Boukerche, Shichao Guan, and Robson E. De Grande. “Sus-tainable Offloading in Mobile Cloud Computing: Algorithmic Designand Implementation”. In: ACM Computing Surveys 52.1 (2019), 11:1–11:37.
[BGT16] B. Butzin, F. Golatowski, and D. Timmermann. “Microservices ap-proach for the internet of things”. In: Proc. of the 2016 IEEE 21st Inter-national Conference on Emerging Technologies and Factory Automation(ETFA). 2016, pp. 1–6.
[Bha+15a] Ketan Bhardwaj, Pragya Agarwal, Ada Gavrilovska, Karsten Schwan,and Adam Allred. “AppFlux: Taming App Delivery via Streaming”.In: Proc. of USENIX Conference on Timely Results in Operating Systems(TRIOS). Oct. 2015, pp. 1–14.
[Bha+15b] Ketan Bhardwaj, Pragya Agrawal, Ada Gavrilovska, and KarstenSchwan. “AppSachet: Distributed App Delivery from the Edge Cloud”.In: Proc. of the 7th International Conference on Mobile Computing, Ap-plications and Services (MobiCASE). 2015, pp. 89–106.
[Bha+16] K. Bhardwaj, M. Shih, P. Agarwal, A. Gavrilovska, T. Kim, and K.Schwan. “Fast, Scalable and Secure Onloading of Edge FunctionsUsing AirBox”. In: Proc. of the 2016 IEEE/ACM Symposium on EdgeComputing (SEC). 2016, pp. 14–27.
[BHJ16] Armin Balalaie, Abbas Heydarnoori, and Pooyan Jamshidi. “Microser-vices Architecture Enables DevOps: Migration to a Cloud-Native Ar-chitecture”. In: IEEE Software 33.3 (2016), pp. 42–52.
[Bi+18] Yuanguo Bi, Guangjie Han, Chuan Lin, Qingxu Deng, Lei Guo, andFuliang Li. “Mobility Support for Fog Computing: An SDN Approach”.In: IEEE Communications Magazine 56.5 (2018), pp. 53–59.
[BI14] Benjamin Billet and Valérie Issarny. “From Task Graphs to ConcreteActions: A New Task Mapping Algorithm for the Future Internet ofThings”. In: Proc. of the 11th IEEE International Conference on MobileAd Hoc and Sensor Systems (MASS). 2014, pp. 470–478.

210 Bibliography
[BKM09] Aaron Bangor, Philip Kortum, and James Miller. “Determining WhatIndividual SUS Scores Mean: Adding an Adjective Rating Scale”. In:Journal of Usability Studies 4.3 (2009), pp. 114–123.
[BLS17] Sultan Basudan, Xiaodong Lin, and Karthik Sankaranarayanan. “APrivacy-Preserving Vehicular Crowdsensing-Based Road Surface Con-dition Monitoring System Using Fog Computing”. In: IEEE Internet ofThings Journal 4.3 (2017), pp. 772–782.
[BMM14] James Bornholt, Todd Mytkowicz, and Kathryn S. McKinley. “Uncer-tain <T>: A First-order Type for Uncertain Data”. In: Proc. of the19th International Conference on Architectural Support for Program-ming Languages and Operating Systems (ASPLOS). Ed. by Rajeev Bal-asubramonian, Al Davis, and Sarita V. Adve. 2014, pp. 51–66.
[BMV10] Aruna Balasubramanian, Ratul Mahajan, and Arun Venkataramani.“Augmenting Mobile 3G Using WiFi”. In: Proc. of the 8th InternationalConference on Mobile Systems, Applications, and Services. MobiSys ’10.2010, pp. 209–222.
[BOE17] Ahmet Cihat Baktir, Atay Ozgovde, and Cem Ersoy. “How Can EdgeComputing Benefit From Software-Defined Networking: A Survey,Use Cases, and Future Directions”. In: IEEE Communications Surveysand Tutorials 19.4 (2017), pp. 2359–2391.
[Boh+15] Steven Bohez, Jaron Couvreur, Bart Dhoedt, and Pieter Simoens.“Cloudlet-based Large-scale 3D Reconstruction Using Real-time Datafrom Mobile Depth Cameras”. In: Proc. of the 6th International Work-shop on Mobile Cloud Computing (MCS). 2015, pp. 8–14.
[Bon+12] Flavio Bonomi, Rodolfo A. Milito, Jiang Zhu, and Sateesh Addepalli.“Fog computing and its role in the internet of things”. In: Proc. of the1st Workshop on Mobile Cloud Computing (MCC). 2012, pp. 13–16.
[Bra+17a] Tristan Braud, Farshid Hassani Bijarbooneh, Dimitris Chatzopoulos,and Pan Hui. “Future Networking Challenges: The Case of MobileAugmented Reality”. In: Proc. of the 37th IEEE International Con-ference on Distributed Computing Systems (ICDCS). 2017, pp. 1796–1807.
[Bra+17b] P. J. Braun, S. Pandi, R. Schmoll, and F. H. P. Fitzek. “On the studyand deployment of mobile edge cloud for tactile Internet using a 5Ggaming application”. In: Proc. of the 2017 14th IEEE Annual ConsumerCommunications Networking Conference (CCNC). 2017, pp. 154-1-59.
[Bre+19] Martin Breitbach, Dominik Schäfer, Janick Edinger, and ChristianBecker. “Context-Aware Data and Task Placement in Edge ComputingEnvironments”. In: Proc. of the 2019 IEEE International Conference onPervasive Computing and Communications (PerCom). 2019, pp. 1–10.
[Bro96] John Brooke. “SUS-A quick and dirty usability scale”. In: Usabilityevaluation in industry 189.194 (1996), pp. 4–7.
[BS13] Eyuphan Bulut and Boleslaw K. Szymanski. “WiFi access point de-ployment for efficient mobile data offloading”. In: Mobile Computingand Communications Review 17.1 (2013), pp. 71–78.

Bibliography 211
[BS16] E. Bulut and B. Szymanski. “Rethinking offloading WiFi access pointdeployment from user perspective”. In: Proc. of the 12th IEEE Interna-tional Conference on Wireless and Mobile Computing (WiMob). 2016,pp. 1–6.
[BSC10] David Benavides, Sergio Segura, and Antonio Ruiz Cortés. “Auto-mated analysis of feature models 20 years later: A literature review”.In: Information Systems 35.6 (2010), pp. 615–636.
[Bur+15] V. Burger, M. Seufert, F. Kaup, M. Wichtlhuber, D. Hausheer, and P.Tran-Gia. “Impact of WiFi offloading on video streaming QoE in ur-ban environments”. In: Proc- of the International Conference on Com-munication Workshops (ICC Workshops). 2015, pp. 1717–1722.
[BZ11] Nicola Bui and Michele Zorzi. “Health care applications: a solutionbased on the internet of things”. In: Proc. of the 4th International Sym-posium on Applied Sciences in Biomedical and Communication Tech-nologies (ISABEL). 2011, 131:1–131:5.
[BZ17] Paolo Bellavista and Alessandro Zanni. “Feasibility of Fog ComputingDeployment based on Docker Containerization over RaspberryPi”. In:Proc. of the 18th International Conference on Distributed Computingand Networking (ICDCN). 2017, pp. 1–10.
[CAG08] V. Chandrasekhar, J. G. Andrews, and A. Gatherer. “Femtocell net-works: a survey”. In: IEEE Communications Magazine 46.9 (2008),pp. 59–67.
[Cai+18] W. Cai, F. Chi, X. Wang, and V. C. M. Leung. “Toward MultiplayerCooperative Cloud Gaming”. In: IEEE Cloud Computing 5.5 (2018),pp. 70–80.
[Cao+15] Yu Cao, Songqing Chen, Peng Hou, and Donald Brown. “FAST: A fogcomputing assisted distributed analytics system to monitor fall forstroke mitigation”. In: Proc. of the 10th IEEE International Conferenceon Networking, Architecture and Storage (NAS). 2015, pp. 2–11.
[Cap+18] Justin Cappos, Matthew Hemmings, Rick McGeer, Albert Rafetseder,and Glenn Ricart. “EdgeNet: A Global Cloud That Spreads by LocalAction”. In: Proc. of the IEEE/ACM Symposium on Edge Computing(SEC). 2018, pp. 359–360.
[Car+12] Ben W. Carabelli, Andreas Benzing, Frank Dürr, Boris Koldehofe,Kurt Rothermel, Georg S. Seyboth, Rainer Blind, Mathias Bürger,and Frank Allgöwer. “Exact convex formulations of network-orientedoptimal operator placement”. In: Proc. of the 51th IEEE Conference onDecision and Control (CDC). 2012, pp. 3777–3782.
[Car+15] V. Cardellini, V. Grassi, F. L. Presti, and M. Nardelli. “On QoS-awarescheduling of data stream applications over fog computing infrastruc-tures”. In: Proc. of the 2015 IEEE Symposium on Computers and Com-munication (ISCC). 2015, pp. 271–276.
[Car+16] Valeria Cardellini, Vincenzo Grassi, Francesco Lo Presti, and MatteoNardelli. “Optimal operator placement for distributed stream process-ing applications”. In: Proceedings of the 10th ACM International Con-ference on Distributed and Event-based Systems (DEBS). 2016, pp. 69–80.

212 Bibliography
[Car+17] Marcel Caria, Jasmin Schudrowitz, Admela Jukan, and Nicole Kem-per. “Smart farm computing systems for animal welfare monitoring”.In: Proc. of the 40th International Convention on Information andCommunication Technology, Electronics and Microelectronics (MIPRO).2017, pp. 152–157.
[Cas14] Marco Casini. “Internet of things for Energy efficiency of buildings”.In: International Scientific Journal Architecture and Engineering 2.1(2014), pp. 24–28.
[CCK18] Eduardo Cuervo, Krishna Chintalapudi, and Manikanta Kotaru. “Cre-ating the perfect Illusion: What will it take to Create Life-Like VirtualReality Headsets?” In: Proc. of the 19th International Workshop onMobile Computing Systems & Applications (HotMobile). 2018, pp. 7–12.
[CCL14] W. Cai, M. Chen, and V. C. M. Leung. “Toward Gaming as a Service”.In: IEEE Internet Computing 18.3 (2014), pp. 12–18.
[CCP19] Claudio Cicconetti, Marco Conti, and Andrea Passarella. “Low-latencyDistributed Computation Offloading for Pervasive Environments”. In:Proc. of the 2019 IEEE International Conference on Pervasive Computingand Communications (PerCom). 2019, pp. 1–10.
[CDO17] Vittorio Cozzolino, Aaron Yi Ding, and Jörg Ott. “FADES: Fine-Grained Edge Offloading with Unikernels”. In: Proc. of the Workshopon Hot Topics in Container Networking and Networked Systems (Hot-ConNet). 2017, pp. 36–41.
[CDO19] Vittorio Cozzolino, Aaron Yi Ding, and Jörg Ott. “Edge ChainingFramework for Black Ice Road Fingerprinting”. In: Proc. of the 2ndInternational Workshop on Edge Systems, Analytics and Networking(EdgeSys). 2019, pp. 42–47.
[CFB14] Francesco Calabrese, Laura Ferrari, and Vincent D. Blondel. “UrbanSensing Using Mobile Phone Network Data: A Survey of Research”.In: ACM Compututing Surveys 47.2 (2014), 25:1–25:20.
[Cha+14] Hyunseok Chang, Adiseshu Hari, Sarit Mukherjee, and T. V. Laksh-man. “Bringing the cloud to the edge”. In: Proc. of the IEEE INFOCOMWorkshops. 2014, pp. 346–351.
[Cha+15] Amir Chaudhry, Jon Crowcroft, Heidi Howard, Anil Madhavapeddy,Richard Mortier, Hamed Haddadi, and Derek McAuley. “PersonalData: Thinking Inside the Box”. In: Proc. of the 5th Decennial AarhusConference on Critical Alternatives. CA ’15. 2015, pp. 29–32.
[Cha+16] David Chaum, Farid Javani, Aniket Kate, Anna Krasnova, Joeri deRuiter, Alan T Sherman, and D Das. “cMix: Anonymization by high-performance scalable mixing”. In: Proc. of USENIX Security. 2016,pp. 1–19.
[Che+03] Mitch Cherniack, Hari Balakrishnan, Magdalena Balazinska, DonaldCarney, Ugur Cetintemel, Ying Xing, and Stanley B. Zdonik. “ScalableDistributed Stream Processing”. In: Proc. of the First Biennial Confer-ence on Innovative Data Systems Research (CIDR). 2003, pp. 1–12.

Bibliography 213
[Che+16] Xu Chen, Lei Jiao, Wenzhong Li, and Xiaoming Fu. “Efficient Multi-User Computation Offloading for Mobile-Edge Cloud Computing”. In:IEEE/ACM Transactions on Networking 24.5 (2016), pp. 2795–2808.
[Che+17a] Ning Chen, Yu Chen, Xinyue Ye, Haibin Ling, Sejun Song, and Chin-Tser Huang. “Smart City Surveillance in Fog Computing”. In: Advancesin Mobile Cloud Computing and Big Data in the 5G Era. Ed. by Con-standinos X. Mavromoustakis, George Mastorakis, and Ciprian Dobre.Springer International Publishing, 2017, pp. 203–226.
[Che+17b] Zhuo Chen, Wenlu Hu, Junjue Wang, Siyan Zhao, Brandon Amos,Guanhang Wu, Kiryong Ha, Khalid Elgazzar, Padmanabhan Pil-lai, Roberta L. Klatzky, Daniel P. Siewiorek, and Mahadev Satya-narayanan. “An empirical study of latency in an emerging class ofedge computing applications for wearable cognitive assistance”. In:Proc. of the Second ACM/IEEE Symposium on Edge Computing (SEC).2017, 14:1–14:14.
[Che+18a] Chia-Yu Chen, Jungwook Choi, Kailash Gopalakrishnan, Viji Srini-vasan, and Swagath Venkataramani. “Exploiting approximate com-puting for deep learning acceleration”. In: Proc. of the 2018 Design,Automation & Test in Europe Conference & Exhibition (DATE). 2018,pp. 821–826.
[Che+18b] B. Cheng, G. Solmaz, F. Cirillo, E. Kovacs, K. Terasawa, and A. Ki-tazawa. “FogFlow: Easy Programming of IoT Services Over Cloud andEdges for Smart Cities”. In: IEEE Internet of Things Journal 5.2 (2018),pp. 696–707.
[Chi+13] Vinay K. Chippa, Srimat T. Chakradhar, Kaushik Roy, and AnandRaghunathan. “Analysis and characterization of inherent applicationresilience for approximate computing”. In: Proc. of the 50th AnnualDesign Automation Conference (DAC). 2013, 113:1–113:9.
[Cho+12] Sharon Choy, Bernard Wong, Gwendal Simon, and Catherine Rosen-berg. “The Brewing Storm in Cloud Gaming: A Measurement Studyon Cloud to End-user Latency”. In: Proc. of the 11th Annual Workshopon Network and Systems Support for Games. NetGames ’12. 2012, 2:1–2:6.
[Cho+16] Junguk Cho, Karthikeyan Sundaresan, Rajesh Mahindra, Jacobus Vander Merwe, and Sampath Rangarajan. “ACACIA: Context-aware EdgeComputing for Continuous Interactive Applications over Mobile Net-works”. In: Proc. of the 12th International on Conference on EmergingNetworking Experiments and Technologies (CoNEXT). 2016, pp. 375–389.
[Chu+11] Byung-Gon Chun, Sunghwan Ihm, Petros Maniatis, Mayur Naik, andAshwin Patti. “CloneCloud: elastic execution between mobile deviceand cloud”. In: Proc. of the 6th European Conference on Computer Sys-tems (EuroSys). 2011, pp. 301–314.
[Chu+13] Chit Chung, Dennis Egan, Ashish Jain, Nicholas Caruso, Colin Misner,and Richard Wallace. “A Cloud-Based Mobile Computing ApplicationsPlatform for First Responders”. In: Proc. of the 7th IEEE InternationalSymposium on Service-Oriented System (SOSE). 2013, pp. 503–508.
214 Bibliography
[CLK07] S. H. Chang, H. J. La, and S. D. Kim. “A Comprehensive Approachto Service Adaptation”. In: Proc. of the IEEE International Conferenceon Service-Oriented Computing and Applications (SOCA ’07). 2007,pp. 191–198.
[CLP17] B. Confais, A. Lebre, and B. Parrein. “An Object Store Service for aFog/Edge Computing Infrastructure Based on IPFS and a Scale-OutNAS”. In: Proc. of the 2017 IEEE 1st International Conference on Fogand Edge Computing (ICFEC). 2017, pp. 41–50.
[CM12] Gianpaolo Cugola and Alessandro Margara. “Processing Flows of In-formation: From Data Stream to Complex Event Processing”. In: ACMComputing Surveys 44.3 (2012), 15:1–15:62.
[CM13] Gianpaolo Cugola and Alessandro Margara. “Deployment strate-gies for distributed complex event processing”. In: Computing 95.2(2013), pp. 129–156.
[CMD16] T. Combe, A. Martin, and R. Di Pietro. “To Docker or Not to Docker: ASecurity Perspective”. In: IEEE Cloud Computing 3.5 (2016), pp. 54–62.
[Coh+15] R. Cohen, L. Lewin-Eytan, J. S. Naor, and D. Raz. “Near optimal place-ment of virtual network functions”. In: Proc. of the 2015 IEEE Con-ference on Computer Communications (INFOCOM). 2015, pp. 1346–1354.
[CP15] Zhen Cao and Panagiotis Papadimitriou. “Collaborative contentcaching in wireless edge with SDN”. In: Proc. of the 1st Workshop onContent Caching and Delivery in Wireless Networks (CCDWN@CoNEXT).2015, 6:1–6:7.
[CPS15] Alberto Ceselli, Marco Premoli, and Stefano Secci. “Cloudlet networkdesign optimization”. In: Proc. of the 14th IFIP Networking Conference.2015, pp. 1–9.
[CS15] Luca Canzian and Mihaela van der Schaar. “Real-time stream min-ing: online knowledge extraction using classifier networks”. In: IEEENetwork 29.5 (2015), pp. 10–16.
[Cue+10] Eduardo Cuervo, Aruna Balasubramanian, Dae-ki Cho, Alec Wolman,Stefan Saroiu, Ranveer Chandra, and Paramvir Bahl. “MAUI: makingsmartphones last longer with code offload”. In: Proc. of the ACM In-ternational Conference on Mobile Systems, Applications, and Services(MobiSys). 2010, pp. 49–62.
[Cur+02] Francisco Curbera, Matthew J. Duftler, Rania Khalaf, William Nagy,Nirmal Mukhi, and Sanjiva Weerawarana. “Unraveling the Web Ser-vices Web: An Introduction to SOAP, WSDL, and UDDI”. In: IEEE In-ternet Computing 6.2 (2002), pp. 86–93.
[CZZ13] Xuejun Cai, Shunliang Zhang, and Yunfei Zhang. “Economic analy-sis of cache location in mobile network”. In: Proc. of the 2013 IEEEWireless Communications and Networking Conference (WCNC). 2013,pp. 1243–1248.
Bibliography 215
[Dab+04] Frank Dabek, Russ Cox, M. Frans Kaashoek, and Robert Tappan Mor-ris. “Vivaldi: A decentralized network coordinate system”. In: Proc. ofthe ACM SIGCOMM 2004 Conference on Applications, Technologies, Ar-chitectures, and Protocols for Computer Communication. 2004, pp. 15–26.
[Dav+16] Nigel Davies, Nina Taft, Mahadev Satyanarayanan, Sarah Clinch, andBrandon Amos. “Privacy Mediators: Helping IoT Cross the Chasm”.In: Proc. of the 17th International Workshop on Mobile Computing Sys-tems and Applications. HotMobile ’16. 2016, pp. 39–44.
[DBH15] S. K. Datta, C. Bonnet, and J. Haerri. “Fog Computing architecture toenable consumer centric Internet of Things services”. In: Proc. of the2015 International Symposium on Consumer Electronics (ISCE). 2015,pp. 1–2.
[Dey01] Anind K. Dey. “Understanding and Using Context”. In: Personal andUbiquitous Computing 5.1 (2001), pp. 4–7.
[Dez+12] Niloofar Dezfuli, Jochen Huber, Simon Olberding, and Max Mühlhäuser.“CoStream: in-situ co-construction of shared experiences throughmobile video sharing during live events”. In: Proc. of the 2012 ACMannual conference on Human Factors in Computing Systems ExtendedAbstracts (CHI EA). 2012, pp. 2477–2482.
[DH15] Han Deng and I-Hong Hou. “Online scheduling for delayed mobileoffloading”. In: Proc. of the IEEE Conference on Computer Communi-cations (INFOCOM). 2015, pp. 1867–1875.
[Dil+02] J. Dilley, B. Maggs, J. Parikh, H. Prokop, R. Sitaraman, and B. Weihl.“Globally distributed content delivery”. In: IEEE Internet Computing6.5 (2002), pp. 50–58.
[Dim+11] Savio Dimatteo, Pan Hui, Bo Han, and Victor O. K. Li. “Cellular TrafficOffloading through WiFi Networks”. In: Proc. of the IEEE 8th Interna-tional Conference on Mobile Adhoc and Sensor Systems (MASS). 2011,pp. 192–201.
[DIN18] DIN. Integrated multi-functional Humble Lamppost (imHLa). NormDIN SPEC 91347. 2018.
[Don+11] Yuan Dong, Haiyang Zhu, Jinzhan Peng, Fang Wang, Michael P. Mes-nier, Dawei Wang, and Sun C. Chan. “RFS: a network file systemfor mobile devices and the cloud”. In: Operating Systems Review 45.1(2011), pp. 101–111.
[Dra+17] Nicola Dragoni, Saverio Giallorenzo, Alberto Lluch-Lafuente, ManuelMazzara, Fabrizio Montesi, Ruslan Mustafin, and Larisa Safina. “Mi-croservices: Yesterday, Today, and Tomorrow”. In: Present and UlteriorSoftware Engineering. 2017, pp. 195–216.
[Dra+18] Nicola Dragoni, Ivan Lanese, Stephan Thordal Larsen, Manuel Maz-zara, Ruslan Mustafin, and Larisa Safina. “Microservices: How ToMake Your Application Scale”. In: Proc. of the 11th InternationalAndrei P. Ershov Informatics Conference (PSI). 2018, pp. 95–104.
216 Bibliography
[Dro+17] Utsav Drolia, Katherine Guo, Jiaqi Tan, Rajeev Gandhi, and PriyaNarasimhan. “Cachier: Edge-Caching for Recognition Applications”.In: Proc. of the 37th IEEE International Conference on Distributed Com-puting Systems (ICDCS). 2017, pp. 276–286.
[Dur+15] Francisco Rodrigo Duro, Francisco Javier García Blas, Daniel Higuero,Oscar Pérez, and Jesús Carretero. “CoSMiC: A hierarchical cloudlet-based storage architecture for mobile clouds”. In: Simulation Mod-elling Practice and Theory 50 (2015), pp. 3–19.
[Dut+17] Joy Dutta, Chandreyee Chowdhury, Sarbani Roy, Asif Iqbal Middya,and Firoj Gazi. “Towards Smart City: Sensing Air Quality in City Basedon Opportunistic Crowd-sensing”. In: Proc. of the 18th InternationalConference on Distributed Computing and Networking (ICDCN). ICDCN’17. 2017, 42:1–42:6.
[Ebe+16] Christof Ebert, Gorka Gallardo, Josune Hernantes, and Nicolás Ser-rano. “DevOps”. In: IEEE Software 33.3 (2016), pp. 94–100.
[Edi+17] Janick Edinger, Dominik Schäfer, Martin Breitbach, and Chris-tian Becker. “Developing distributed computing applications withTasklets”. In: Proc. of the 2017 IEEE International Conference onPervasive Computing and Communications Workshops (PerCom Work-shops). 2017, pp. 94–96.
[EFP10] Elias C. Efstathiou, Pantelis A. Frangoudis, and George C. Polyzos.“Controlled Wi-Fi Sharing in Cities: A Decentralized Approach Rely-ing on Indirect Reciprocity”. In: IEEE Transactions on Mobile Comput-ing 9.8 (2010), pp. 1147–1160.
[EL16] R. Eidenbenz and T. Locher. “Task allocation for distributed streamprocessing”. In: Proc. of the 35th Annual IEEE International Conferenceon Computer Communications (INFOCOM). 2016, pp. 1–9.
[Elb+18] M. S. Elbamby, C. Perfecto, M. Bennis, and K. Doppler. “Toward Low-Latency and Ultra-Reliable Virtual Reality”. In: IEEE Network 32.2(2018), pp. 78–84.
[Eri13] Ericsson. “Ericsson Mobility Report”. In: (2013), pp. 1–28. URL:https : / / metis2020 . com / res / docs / 2013 / ericsson -
mobility-report-june-2013.pdf.
[ERS16] Guy Even, Matthias Rost, and Stefan Schmid. “An Approximation Al-gorithm for Path Computation and Function Placement in SDNs”. In:Proc. of the 23rd International Colloquium on Structural Informationand Communication Complexity (SIROCCO). 2016, pp. 374–390.
[Esp+17] F. Esposito, A. Cvetkovski, T. Dargahi, and J. Pan. “Complete edgefunction onloading for effective backend-driven cyber foraging”. In:Proc. of the 2017 IEEE 13th International Conference on Wireless andMobile Computing, Networking and Communications (WiMob). 2017,pp. 1–8.
[Eug+03] Patrick Th. Eugster, Pascal Felber, Rachid Guerraoui, and Anne-MarieKermarrec. “The many faces of publish/subscribe”. In: ACM Comput-ing Surveys 35.2 (2003), pp. 114–131.

Bibliography 217
[EZB17] Ahmed Elmokashfi, Dong Zhou, and Džiugas Baltrünas. “Adding theNext Nine: An Investigation of Mobile Broadband Networks Availabil-ity”. In: Proc. of the 23rd Annual International Conference on MobileComputing and Networking (MobiCom). 2017, pp. 88–100.
[FA17] Qiang Fan and Nirwan Ansari. “Cost Aware cloudlet Placement forbig data processing at the edge”. In: Proc. of the IEEE InternationalConference on Communications (ICC). 2017, pp. 1–6.
[Fas+07] Elena Fasolo, Michele Rossi, Jörg Widmer, and Michele Zorzi. “In-network aggregation techniques for wireless sensor networks: A sur-vey”. In: IEEE Wireless Communications 14.2 (2007), pp. 70–87.
[Fel+15] Wes Felter, Alexandre Ferreira, Ram Rajamony, and Juan Rubio. “Anupdated performance comparison of virtual machines and Linux con-tainers”. In: Proc. of the 2015 IEEE International Symposium on Per-formance Analysis of Systems and Software (ISPASS). 2015, pp. 171–172.
[Fel+18] Patrick Felka, Artur Sterz, Katharina Keller, Bernd Freisleben, andOliver Hinz. “The Context Matters: Predicting the Number of In-gameActions Using Traces of Mobile Augmented Reality Games”. In: Proc.of the 17th International Conference on Mobile and Ubiquitous Multi-media. MUM 2018. 2018, pp. 25–35.
[Fer+17] H. Fereidooni, T. Frassetto, M. Miettinen, A. Sadeghi, and M. Conti.“Fitness Trackers: Fit for Health but Unfit for Security and Privacy”.In: Proc. of the 2017 IEEE/ACM International Conference on ConnectedHealth: Applications, Systems and Engineering Technologies (CHASE).2017, pp. 19–24.
[Fer+18] Francisco-Javier Ferrández-Pastor, Higinio Mora, Antonio Jimeno-Morenilla, and Bruno Volckaert. “Deployment of IoT edge and fogcomputing technologies to develop smart building services”. In:Sustainability 10.11 (2018), pp. 1–23.
[Fia+17] Claudio Fiandrino, Andrea Capponi, Giuseppe Cacciatore, DzmitryKliazovich, Ulrich Sorger, Pascal Bouvry, Burak Kantarci, FabrizioGranelli, and Stefano Giordano. “CrowdSenSim: a Simulation Plat-form for Mobile Crowdsensing in Realistic Urban Environments”. In:IEEE Access 5 (2017), pp. 3490–3503.
[FJ10] Gaojun Fan and Shiyao Jin. “Coverage Problem in Wireless SensorNetwork: A Survey”. In: Journal of Networks 5.9 (2010), pp. 1033–1040.
[Flo+15] Huber Flores, Pan Hui, Sasu Tarkoma, Yong Li, Satish Narayana Sri-rama, and Rajkumar Buyya. “Mobile code offloading: From conceptto practice and beyond”. In: IEEE Communications Magazine 53.3(2015), pp. 80–88.
[FLR13] Niroshinie Fernando, Seng Wai Loke, and J. Wenny Rahayu. “Mobilecloud computing: A survey”. In: Future Generation Computer Systems29.1 (2013), pp. 84–106.
[Fow14] Martin Fowler. Microservices - a definition of this new architecturalterm. https://martinfowler.com/articles/microservices.html. Accessed: 2019-03-04. 2014.

218 Bibliography
[Fre+13] Sylvain Frey, Ada Diaconescu, David Menga, and Isabelle Demeure.“A holonic control architecture for a heterogeneous multi-objectivesmart micro-grid”. In: Proc. of the IEEE 7th International Conferenceon Self-Adaptive and Self-Organizing Systems. 2013, pp. 21–30.
[Frö+16] Alexander Frömmgen, Jens Heuschkel, Patrick Jahnke, Fabio Cuozzo,Immanuel Schweizer, Patrick Eugster, Max Mühlhäuser, and Alejan-dro P. Buchmann. “Crowdsourcing Measurements of Mobile NetworkPerformance and Mobility During a Large Scale Event”. In: Proc. of the17th International Passive and Active Measurement Conference (PAM).2016, pp. 70–82.
[Fu+18] Jun-Song Fu, Yun Liu, Han-Chieh Chao, Bharat K Bhargava, andZhen-Jiang Zhang. “Secure data storage and searching for indus-trial IoT by integrating fog computing and cloud computing”. In:Transactions on Industrial Informatics 14.10 (2018), pp. 4519–4528.
[Gao+17] Mingze Gao, Qian Wang, Md Tanvir Arafin, Yongqiang Lyu, and GangQu. “Approximate Computing for Low Power and Security in the In-ternet of Things”. In: IEEE Computer 50.6 (2017), pp. 27–34.
[Gau+13] E. I. Gaura, J. Brusey, M. Allen, R. Wilkins, D. Goldsmith, and R.Rednic. “Edge Mining the Internet of Things”. In: IEEE Sensors Journal13.10 (2013), pp. 3816–3825.
[GC04] Sachin Goyal and John Carter. “A Lightweight Secure Cyber ForagingInfrastructure for Resource-Constrained Devices”. In: Proc. of the 6thIEEE Workshop on Mobile Computing Systems and Applications (WM-CSA). 2004, pp. 186–195.
[GD08] Amitabha Amitava Ghosh and Sajal K. Das. “Coverage and connec-tivity issues in wireless sensor networks: A survey”. In: Pervasive andMobile Computing 4.3 (2008), pp. 303–334.
[Ged+17] Julien Gedeon, Christian Meurisch, Disha Bhat, Michael Stein, LinWang, and Max Mühlhäuser. “Router-based Brokering for SurrogateDiscovery in Edge Computing”. In: Proc. of the International Con-ference on Distributed Computing Systems Workshops (ICDCS Work-shops). 2017, pp. 145–150.
[Ged+18a] Julien Gedeon, Jens Heuschkel, Lin Wang, and Max Mühlhäuser. “FogComputing: Current Research and Future Challenges”. In: Proc. of1.GI/ITG KuVS Fachgespräche Fog Computing. 2018, pp. 1–4.
[Ged+18b] Julien Gedeon, Nicolás Himmelmann, Patrick Felka, Fabian Her-rlich, Michael Stein, and Max Mühlhäuser. “vStore: A Context-AwareFramework for Mobile Micro-Storage at the Edge”. In: Proc. of the In-ternational Conference on Mobile Computing, Applications and Services(MobiCASE). 2018, pp. 165–182.
[Ged+18c] Julien Gedeon, Jeff Krisztinkovics, Christian Meurisch, Michael Stein,Lin Wang, and Max Mühlhäuser. “A Multi-Cloudlet Infrastructure forFuture Smart Cities: An Empirical Study”. In: Proc. of the 1st Interna-tional Workshop on Edge Systems, Analytics and Networking (EdgeSys).ACM. 2018, pp. 19–24.

Bibliography 219
[Ged+18d] Julien Gedeon, Michael Stein, Jeff Krisztinkovics, Patrick Felka,Katharina Keller, Christian Meurisch, Lin Wang, and Max Mühlhäuser.“From Cell Towers to Smart Street Lamps: Placing Cloudlets onExisting Urban Infrastructures”. In: Proc. of the 2018 IEEE/ACMSymposium on Edge Computing (SEC). IEEE. 2018, pp. 187–202.
[Ged+18e] Julien Gedeon, Michael Stein, Lin Wang, and Max Mühlhäuser. “OnScalable In-Network Operator Placement for Edge Computing”. In:Proc. of the 27th International Conference on Computer Communica-tion and Networks (ICCCN). IEEE. 2018, pp. 1–9.
[Ged+19a] Julien Gedeon, Florian Brandherm, Rolf Egert, Tim Grube, and MaxMühlhäuser. “What the Fog? Edge Computing Revisited: Promises,Applications and Future Challenges”. In: IEEE Access 7 (2019),pp. 152847–152878.
[Ged+19b] Julien Gedeon, Martin Wagner, Jens Heuschkel, Lin Wang, and MaxMühlhäuser. “A Microservice Store for Efficient Edge Offloading”. In:Proc. of the IEEE Global Communications Conference (GLOBECOM).2019, pp. 1–6.
[Ged+20] Julien Gedeon, Sebastian Zengerle, Sebastian Alles, Florian Brand-herm, and Max Mühlhäuser. “Sunstone: Navigating the Way Throughthe Fog”. In: Proc. of the International Conference on Fog and EdgeComputing (ICFEC). 2020, to appear.
[Ged17] Julien Gedeon. “Edge Computing via Dynamic In-network Process-ing”. In: International Conference on Networked Systems (Netsys’17):PhD Forum. 2017, pp. 1–2.
[GES08] Pawel Garbacki, Dick H. J. Epema, and Maarten van Steen. “Broker-placement in latency-aware peer-to-peer networks”. In: ComputerNetworks 52.8 (2008), pp. 1617–1633.
[GGL03] Sanjay Ghemawat, Howard Gobioff, and Shun-Tak Leung. “TheGoogle file system”. In: Proc. of the 19th ACM Symposium on Operat-ing Systems Principles (SOSP). 2003, pp. 29–43.
[Gha+16] B. Ghazal, K. ElKhatib, K. Chahine, and M. Kherfan. “Smart trafficlight control system”. In: Proc. of the 2016 Third International Confer-ence on Electrical, Electronics, Computer Engineering and their Appli-cations (EECEA). 2016, pp. 140–145.
[Gho+19] Sara Gholami, Alireza Goli, Cor-Paul Bezemer, and Hamzeh Khazaei.“A Framework for Satisfying the Performance Requirements of Con-tainerized Software Systems Through Multi-Versioning”. In: Proc. ofthe International Conference on Performance Engineering (ICPE). 2019,pp. 1–11.
[Gia+15] Tuan Nguyen Gia, Mingzhe Jiang, Amir-Mohammad Rahmani, TomiWesterlund, Pasi Liljeberg, and Hannu Tenhunen. “Fog Computing inHealthcare Internet of Things: A Case Study on ECG Feature Extrac-tion”. In: Proc. of the 2015 IEEE International Conference on Computerand Information Technology; Ubiquitous Computing and Communica-tions; Dependable, Autonomic and Secure Computing; Pervasive Intelli-gence and Computing. 2015, pp. 356–363.
220 Bibliography
[Gil16] James N Gilmore. “Everywear: The quantified self and wearable fit-ness technologies”. In: New Media & Society 18.11 (2016), pp. 2524–2539.
[GJM19] Georgia Gkioxari, Justin Johnson, and Jitendra Malik. “Mesh R-CNN”.In: Proc. of the 2019 IEEE/CVF International Conference on ComputerVision (ICCV). 2019, pp. 9784–9794.
[Gol+19] Morteza Golkarifard, Ji Yang, Zhanpeng Huang, Ali Movaghar, andPan Hui. “Dandelion: A Unified Code Offloading System for WearableComputing”. In: IEEE Transactions on Mobile Computing 18.3 (2019),pp. 546–559.
[Gor+12] Mark S. Gordon, Davoud Anoushe Jamshidi, Scott A. Mahlke, Zhuo-qing Morley Mao, and Xu Chen. “COMET: Code Offload by MigratingExecution Transparently”. In: Proc. of the 13 USENIX Symposium onOperating Systems Design and Implementation (OSDI). 2012, pp. 93–106.
[Gov+14] Nithyashri Govindarajan, Yogesh Simmhan, Nitin Jamadagni, andPrasant Misra. “Event Processing Across Edge and the Cloud forInternet of Things Applications”. In: Proc. of the 20th InternationalConference on Management of Data. COMAD ’14. 2014, pp. 101–104.
[GR18] Harshit Gupta and Umakishore Ramachandran. “FogStore: A Geo-Distributed Key-Value Store Guaranteeing Low Latency for StronglyConsistent Access”. In: Proc. of the 12th ACM International Conferenceon Distributed and Event-based Systems. DEBS ’18. 2018, pp. 148–159.
[Gre+08] Albert Greenberg, James Hamilton, David A Maltz, and Parveen Pa-tel. “The cost of a cloud: research problems in data center networks”.In: ACM SIGCOMM Computer Communication Review 39.1 (2008),pp. 68–73.
[GS15] Julien Gedeon and Immanuel Schweizer. “Understanding Spatial andTemporal Coverage in Participatory Sensor Networks”. In: Proc. ofthe 40th IEEE Local Computer Networks Conference Workshops (LCNWorkshops). 2015, pp. 699–707.
[Gub+13] Jayavardhana Gubbi, Rajkumar Buyya, Slaven Marusic, and Marimu-thu Palaniswami. “Internet of Things (IoT): A vision, architectural el-ements, and future directions”. In: Future Generation Computer Sys-tems 29.7 (2013), pp. 1645–1660.
[Guo+18] Peizhen Guo, Bo Hu, Rui Li, and Wenjun Hu. “FoggyCache: Cross-Device Approximate Computation Reuse”. In: Proc. of the 24th An-nual International Conference on Mobile Computing and Networking(MobiCom). 2018, pp. 19–34.
[Gup+11] Vaibhav Gupta, Debabrata Mohapatra, Sang Phill Park, Anand Raghu-nathan, and Kaushik Roy. “IMPACT: imprecise adders for low-powerapproximate computing”. In: Proc. of the 2011 International Sympo-sium on Low Power Electronics and Design (ISLPED). IEEE/ACM, 2011,pp. 409–414.
Bibliography 221
[GXR18] Harshit Gupta, Zhuangdi Xu, and Umakishore Ramachandran.“DataFog: Towards a Holistic Data Management Platform for theIoT Age at the Network Edge”. In: Proc. of the USENIX Workshop onHot Topics in Edge Computing (HotEdge 18). 2018, pp. 1–6.
[GZG13] Lin Gu, Deze Zeng, and Song Guo. “Vehicular cloud computing: Asurvey”. In: Proc. of the Global Communications Conference Workshops(GLOBECOM Workshops). 2013, pp. 403–407.
[Ha+14] Kiryong Ha, Zhuo Chen, Wenlu Hu, Wolfgang Richter, PadmanabhanPillai, and Mahadev Satyanarayanan. “Towards Wearable CognitiveAssistance”. In: Proc. of the 12th Annual International Conference onMobile Systems, Applications, and Services. MobiSys ’14. 2014, pp. 68–81.
[HAB17] S. Hassan, N. Ali, and R. Bahsoon. “Microservice Ambients: An Archi-tectural Meta-Modelling Approach for Microservice Granularity”. In:Proc.of the 2017 IEEE International Conference on Software Architec-ture (ICSA). 2017, pp. 1–10.
[Hal+08] S. Hallsteinsen, M. Hinchey, S. Park, and K. Schmid. “Dynamic Soft-ware Product Lines”. In: Computer 41.4 (2008), pp. 93–95.
[Han+17] Dong Han, Ye Yan, Tao Shu, Liuqing Yang, and Shuguang Cui. “Cog-nitive Context-Aware Distributed Storage Optimization in MobileCloud Computing: A Stable Matching Based Approach”. In: Proc.of the 37th IEEE International Conference on Distributed ComputingSystems (ICDCS). 2017, pp. 594–604.
[Hao+17] Pengzhan Hao, Yongshu Bai, Xin Zhang, and Yifan Zhang. “Edge-courier: an edge-hosted personal service for low-bandwidth docu-ment synchronization in mobile cloud storage services”. In: Proc. ofthe Second ACM/IEEE Symposium on Edge Computing (SEC). 2017,7:1–7:14.
[Has+18] Najmul Hassan, Saira Gillani, Ejaz Ahmed, Ibrar Yaqoob, and Muham-mad Imran. “The Role of Edge Computing in Internet of Things”. In:IEEE Communications Magazine 56.11 (2018), pp. 110–115.
[Hav11] Matti Haverila. “Mobile phone feature preferences, customer satis-faction and repurchase intent among male users”. In: AustralasianMarketing Journal (AMJ) 19.4 (2011), pp. 238–246.
[Haw+14] H. Hawilo, A. Shami, M. Mirahmadi, and R. Asal. “NFV: state of theart, challenges, and implementation in next generation mobile net-works (vEPC)”. In: IEEE Network 28.6 (2014), pp. 18–26.
[HB16] Sara Hassan and Rami Bahsoon. “Microservices and Their DesignTrade-Offs: A Self-Adaptive Roadmap”. In: Proc. of the IEEE Interna-tional Conference on Services Computing (SCC). 2016, pp. 813–818.
[HB96] J. Hawkinson and T. Bates. RFC1930: Guidelines for creation, selection,and registration of an Autonomous System (AS). Internet Requests forComments. 1996. URL: https://www.rfc-editor.org/info/rfc1930.
222 Bibliography
[Hec+18] Melanie Heck, Janick Edinger, Dominik Schäfer, and ChristianBecker. “IoT Applications in Fog and Edge Computing: Where Are Weand Where Are We Going?” In: Proc. of the 27th International Confer-ence on Computer Communication and Networks (ICCCN) Workshops.2018, pp. 1–6.
[Hel+19] Joseph M. Hellerstein, Jose M. Faleiro, Joseph Gonzalez, JohannSchleier-Smith, Vikram Sreekanti, Alexey Tumanov, and ChenggangWu. “Serverless Computing: One Step Forward, Two Steps Back”.In: Proc. of the 9th Biennial Conference on Innovative Data SystemsResearch (CIDR). 2019.
[Hel02] S. Helal. “Standards for service discovery and delivery”. In: IEEE Per-vasive Computing 1.3 (2002), pp. 95–100.
[Hen+16] Scott Hendrickson, Stephen Sturdevant, Tyler Harter, Venkatesh-waran Venkataramani, Andrea C. Arpaci-Dusseau, and Remzi H.Arpaci-Dusseau. “Serverless Computation with OpenLambda”. In:Proc. of the 8th USENIX Workshop on Hot Topics in Cloud Computing(HotCloud 2016). 2016, pp. 1–7.
[Heo+14] Taewook Heo, Kwangsoo Kim, Hyunhak Kim, Changwon Lee, JaeHong Ryu, Youn Taik Leem, Jong Arm Jun, Chulsik Pyo, Seung-MokYoo, and JeongGil Ko. “Escaping from ancient Rome! Applicationsand challenges for designing smart cities”. In: Transactions on Emerg-ing Telecommunications Technologies 25.1 (2014), pp. 109–119.
[Heu+17] Jens Heuschkel, Michael Stein, Lin Wang, and Max Mühlhäuser.“Beyond the core: Enabling software-defined control at the networkedge”. In: Proc. of the 2017 International Conference on NetworkedSystems (NetSys). 2017, pp. 1–6.
[Heu+19] Jens Heuschkel, Philipp Thomasberger, Julien Gedeon, and MaxMühlhäuser. “VirtualStack: Green High Performance Network Pro-tocol Processing Leveraging FPGAs”. In: Proc. of the IEEE GlobalCommunications Conference (GLOBECOM). 2019, pp. 1–6.
[Him17] Nicolás Himmelmann. “Context-Aware Virtual Storage Frameworkfor Mobile Devices”. Bachelor’s Thesis. Technische Universität Darm-stadt, Department of Computer Science, 2017.
[Hir+13] Martin Hirzel, Robert Soulé, Scott Schneider, Bugra Gedik, andRobert Grimm. “A catalog of stream processing optimizations”. In:ACM Computing Surveys 46.4 (2013), 46:1–46:34.
[HK06] Robert Hirschfeld and Katsuya Kawamura. “Dynamic service adapta-tion”. In: Software Practice and Experience 36.11-12 (2006), pp. 1115–1131.
[HL08] H. Hartenstein and L. P. Laberteaux. “A tutorial survey on vehicularad hoc networks”. In: IEEE Communications Magazine 46.6 (2008),pp. 164–171.
[HL16] Zijiang Hao and Qun Li. “Poster Abstract: EdgeStore: IntegratingEdge Computing into Cloud-Based Storage Systems”. In: Proc. of theIEEE/ACM Symposium on Edge Computing (SEC). 2016, pp. 115–116.

Bibliography 223
[HO13] Jie Han and Michael Orshansky. “Approximate computing: An emerg-ing paradigm for energy-efficient design”. In: Proc. of the 18th IEEEEuropean Test Symposium (ETS). 2013, pp. 1–6.
[Hon+13] Kirak Hong, David J. Lillethun, Umakishore Ramachandran, BeateOttenwälder, and Boris Koldehofe. “Mobile fog: a programmingmodel for large-scale applications on the internet of things”. In: Proc.of the 2nd ACM Workshop on Mobile Cloud Computing (MCC). 2013,pp. 15–20.
[Hou+16] X. Hou, Y. Li, M. Chen, D. Wu, D. Jin, and S. Chen. “Vehicular FogComputing: A Viewpoint of Vehicles as the Infrastructures”. In: IEEETransactions on Vehicular Technology 65.6 (2016), pp. 3860–3873.
[How+17] Shaun Howell, Yacine Rezgui, Jean-Laurent Hippolyte, Bejay Jayan,and Haijiang Li. “Towards the next generation of smart grids: Se-mantic and holonic multi-agent management of distributed energyresources”. In: Renewable and Sustainable Energy Reviews 77 (2017),pp. 193–214.
[HS02] Thomas Heimrich and Günther Specht. “Enhancing ECA Rules for Dis-tributed Active Database Systems”. In: Proc. of the Web, Web-Services,and Database Systems, NODe 2002 Web and Database-Related Work-shops. Vol. 2593. Lecture Notes in Computer Science. 2002, pp. 199–205.
[HT05] Chi-Fu Huang and Yu-Chee Tseng. “The Coverage Problem in a Wire-less Sensor Network”. In: Mobile Networks and Applications 10.4(2005), pp. 519–528.
[Hu+15a] Wenlu Hu, Brandon Amos, Zhuo Chen, Kiryong Ha, Wolfgang Richter,Padmanabhan Pillai, Benjamin Gilbert, Jan Harkes, and MahadevSatyanarayanan. “The Case for Offload Shaping”. In: Proceedings ofthe 16th International Workshop on Mobile Computing Systems andApplications (HotMobile). 2015, pp. 51–56.
[Hu+15b] Y.C. Hu, M. Patel, D. Sabella, N. Sprecher, and V. Young. “MobileEdge Computing: A key technology towards 5G”. In: ETSI Whitepaper(2015), pp. 1–28.
[Hu+16] Wenlu Hu, Ying Gao, Kiryong Ha, Junjue Wang, Brandon Amos, ZhuoChen, Padmanabhan Pillai, and Mahadev Satyanarayanan. “Quan-tifying the Impact of Edge Computing on Mobile Applications”. In:Proc. of the 7th ACM SIGOPS Asia-Pacific Workshop on Systems (AP-Sys). 2016, 5:1–5:8.
[Hu+17] Pengfei Hu, Huansheng Ning, Tie Qiu, Yanfei Zhang, and Xiong Luo.“Fog Computing Based Face Identification and Resolution Scheme inInternet of Things”. In: IEEE Transactions on Industrial Informatics13.4 (2017), pp. 1910–1920.
[Hua+11] Y. Huang, Z. Luan, R. He, and D. Qian. “Operator Placement with QoSConstraints for Distributed Stream Processing”. In: Proc. of the 7th In-ternational Conference on Network and Service Management (CNSM).2011, pp. 309–315.

224 Bibliography
[Hua+14] Chun-Ying Huang, Cheng-Hsin Hsu, De-Yu Chen, and Kuan-Ta Chen.“Quantifying User Satisfaction in Mobile Cloud Games”. In: Proc. ofthe Workshop on Mobile Video Delivery. MoViD’14. 2014, pp. 1–6.
[Hur04] Chris Hurley. WarDriving: drive, detect, defend: a guide to wireless se-curity. Syngress Publishing, 2004.
[HV19] Cheol-Ho Hong and Blesson Varghese. “Resource Management inFog/Edge Computing: A Survey on Architectures, Infrastructure, andAlgorithms”. In: ACM Computing Surveys 52.5 (2019), 97:1–97:37.
[IBD15] Stepan Ivanov, Kriti Bhargava, and William Donnelly. “PrecisionFarming: Sensor Analytics”. In: IEEE Intelligent Systems 30.4 (2015),pp. 76–80.
[Jal+16] Fatemeh Jalali, Kerry Hinton, Robert Ayre, Tansu Alpcan, and RodneyS. Tucker. “Fog Computing May Help to Save Energy in Cloud Com-puting”. In: IEEE Journal on Selected Areas in Communications 34.5(2016), pp. 1728–1739.
[Jam+18] P. Jamshidi, C. Pahl, N. C. Mendonça, J. Lewis, and S. Tilkov. “Mi-croservices: The Journey So Far and Challenges Ahead”. In: IEEE Soft-ware 35.3 (2018), pp. 24–35.
[Jar+03] Amit P. Jardosh, Elizabeth M. Belding-Royer, Kevin C. Almeroth, andSubhash Suri. “Towards realistic mobility models for mobile ad hocnetworks”. In: Proc. of the Ninth Annual International Conference onMobile Computing and Networking (MOBICOM). Ed. by David B. John-son, Anthony D. Joseph, and Nitin H. Vaidya. 2003, pp. 217–229.
[Jay+14] Prem Prakash Jayaraman, João Bártolo Gomes, Hai-Long Nguyen,Zahraa Said Abdallah, Shonali Krishnaswamy, and Arkady B. Za-slavsky. “CARDAP: A Scalable Energy-Efficient Context Aware Dis-tributed Mobile Data Analytics Platform for the Fog”. In: Proc. Ad-vances in Databases and Information Systems (ADBIS). 2014, pp. 192–206.
[JCL17] M. Jia, J. Cao, and W. Liang. “Optimal Cloudlet Placement and Userto Cloudlet Allocation in Wireless Metropolitan Area Networks”. In:IEEE Transactions on Cloud Computing 5.4 (2017), pp. 725–737.
[Ji+12] C. Ji, Y. Li, W. Qiu, U. Awada, and K. Li. “Big Data Processing inCloud Computing Environments”. In: Proc. of the 2012 12th Inter-national Symposium on Pervasive Systems, Algorithms and Networks.2012, pp. 17–23.
[Jia+18] G. Jia, G. Han, A. Li, and J. Du. “SSL: Smart Street Lamp Based onFog Computing for Smarter Cities”. In: IEEE Transactions on IndustrialInformatics 14.11 (2018), pp. 4995–5004.
[Jia+19] Congfeng Jiang, Xiaolan Cheng, Honghao Gao, Xin Zhou, and JianWan. “Toward Computation Offloading in Edge Computing: A Sur-vey”. In: IEEE Access 7 (2019), pp. 131543–131558.
[JLR13] Aleksandar Jovicic, Junyi Li, and Tom Richardson. “Visible light com-munication: opportunities, challenges and the path to market”. In:IEEE Communications Magazine 51.12 (2013), pp. 26–32.

Bibliography 225
[Jon+17] Eric Jonas, Qifan Pu, Shivaram Venkataraman, Ion Stoica, and Ben-jamin Recht. “Occupy the Cloud: Distributed Computing for the99%”. In: Proc. of the 2017 Symposium on Cloud Computing. SoCC’17. ACM, 2017, pp. 445–451.
[JSK18a] S. Jeong, O. Simeone, and J. Kang. “Mobile Edge Computing viaa UAV-Mounted Cloudlet: Optimization of Bit Allocation and PathPlanning”. In: IEEE Transactions on Vehicular Technology 67.3 (2018),pp. 2049–2063.
[JSK18b] Seongah Jeong, Osvaldo Simeone, and Joonhyuk Kang. “Mobile EdgeComputing via a UAV-Mounted Cloudlet: Optimization of Bit Alloca-tion and Path Planning”. In: IEEE Transactions on Vehicular Technology67.3 (2018), pp. 2049–2063.
[JV01] Kamal Jain and Vijay V. Vazirani. “Approximation algorithms formetric facility location and k-Median problems using the primal-dualschema and Lagrangian relaxation”. In: Journal of the ACM 48.2(2001), pp. 274–296.
[KAB13] Ayat Khairy, Hany H. Ammar, and Reem Bahgat. “Smartphone En-ergizer: Extending Smartphone’s battery life with smart offloading”.In: Proc. of the 9th International Wireless Communications and MobileComputing Conference (IWCMC). 2013, pp. 329–336.
[Kad+14] K. Kadir, M. K. Kamaruddin, H. Nasir, S. I. Safie, and Z. A. K. Bakti.“A comparative study between LBP and Haar-like features for FaceDetection using OpenCV”. In: Proc. of the 4th International Confer-ence on Engineering Technology and Technopreneuship (ICE2T). 2014,pp. 335–339.
[Käm+14] T. Kämäräinen, M. Siekkinen, Y. Xiao, and A. Ylä-Jääski. “Towardspervasive and mobile gaming with distributed cloud infrastructure”.In: Proc. of the 2014 13th Annual Workshop on Network and SystemsSupport for Games. 2014, pp. 1–6.
[Kan+19] Ram Srivatsa Kannan, Lavanya Subramanian, Ashwin Raju, JeongseobAhn, Jason Mars, and Lingjia Tang. “GrandSLAm: Guaranteeing SLAsfor Jobs in Microservices Execution Frameworks”. In: Proc. of the 14thEuroSys Conference. 2019, 34:1–34:16.
[KB10] Mads Darø Kristensen and Niels Olof Bouvin. “Scheduling and devel-opment support in the Scavenger cyber foraging system”. In: Pervasiveand Mobile Computing 6.6 (2010), pp. 677–692.
[Kem+10] Roelof Kemp, Nicholas Palmer, Thilo Kielmann, and Henri E. Bal.“Cuckoo: A Computation Offloading Framework for Smartphones”.In: Proc. of the 2nd International Conference on Mobile Computing,Applications and Services (MobiCASE). 2010, pp. 59–79.
[KJP15] A. Krylovskiy, M. Jahn, and E. Patti. “Designing a Smart City Internetof Things Platform with Microservice Architecture”. In: Proc. of the2015 3rd International Conference on Future Internet of Things andCloud. 2015, pp. 25–30.
[KL10] Karthik Kumar and Yung-Hsiang Lu. “Cloud Computing for MobileUsers: Can Offloading Computation Save Energy?” In: IEEE Computer43.4 (2010), pp. 51–56.
226 Bibliography
[Kli+18] Ana Klimovic, Yawen Wang, Christos Kozyrakis, Patrick Stuedi, JonasPfefferle, and Animesh Trivedi. “Understanding Ephemeral Storagefor Serverless Analytics”. In: Proc. of the 2018 USENIX Annual Techni-cal Conference (USENIX ATC). 2018, pp. 789–794.
[KLT16] H. Kang, M. Le, and S. Tao. “Container and Microservice Driven De-sign for Cloud Infrastructure DevOps”. In: Proc. of the 2016 IEEE In-ternational Conference on Cloud Engineering (IC2E). 2016, pp. 202–211.
[Kon+06] Woralak Kongdenfha, Régis Saint-Paul, Boualem Benatallah, andFabio Casati. “An Aspect-Oriented Framework for Service Adapta-tion”. In: Proc. of the 4th International Conference on Service-OrientedComputing (ICSOC). 2006, pp. 15–26.
[Kos+12] Sokol Kosta, Andrius Aucinas, Pan Hui, Richard Mortier, and XinwenZhang. “ThinkAir: Dynamic resource allocation and parallel execu-tion in the cloud for mobile code offloading”. In: Proc. of the IEEEConference on Computer Communications (INFOCOM). 2012, pp. 945–953.
[Kra+17] F. A. Kraemer, A. E. Braten, N. Tamkittikhun, and D. Palma. “Fog Com-puting in Healthcare–A Review and Discussion”. In: IEEE Access 5(2017), pp. 9206–9222.
[Kre+15] Diego Kreutz, Fernando M. V. Ramos, Paulo Jorge Esteves Veríssimo,Christian Esteve Rothenberg, Siamak Azodolmolky, and Steve Uhlig.“Software-Defined Networking: A Comprehensive Survey”. In: Pro-ceedings of the IEEE 103.1 (2015), pp. 14–76.
[Kri19] Jeff Krisztinkovics. “Cloudlet-Abdeckung im urbanan Raum”. Bache-lor’s Thesis. Technische Universität Darmstadt, Department of Com-puter Science, 2019.
[Kum+13] Karthik Kumar, Jibang Liu, Yung-Hsiang Lu, and Bharat K. Bhargava.“A Survey of Computation Offloading for Mobile Systems”. In: MobileNetworks and Applications 18.1 (2013), pp. 129–140.
[KYK12] Dejan Kovachev, Tian Yu, and Ralf Klamma. “Adaptive ComputationOffloading from Mobile Devices into the Cloud”. In: Proc. of the 10thIEEE International Symposium on Parallel and Distributed Processingwith Applications (ISPA). 2012, pp. 784–791.
[Lai+17] Zeqi Lai, Y. Charlie Hu, Yong Cui, Linhui Sun, and Ningwei Dai. “Fu-rion: Engineering High-Quality Immersive Virtual Reality on Today’sMobile Devices”. In: Proc. of the 23rd Annual International Conferenceon Mobile Computing and Networking. MobiCom ’17. 2017, pp. 409–421.
[LC11] Changlei Liu and Guohong Cao. “Spatial-Temporal Coverage Opti-mization in Wireless Sensor Networks”. In: IEEE Transactions on Mo-bile Computing 10.4 (2011), pp. 465–478.
[Lee+13] K. Lee, J. Lee, Y. Yi, I. Rhee, and S. Chong. “Mobile Data Offloading:How Much Can WiFi Deliver?” In: IEEE/ACM Transactions on Net-working 21.2 (2013), pp. 536–550.

Bibliography 227
[Lee+16] Eun-Kyu Lee, Mario Gerla, Giovanni Pau, Uichin Lee, and Jae-HanLim. “Internet of Vehicles: From intelligent grid to autonomous carsand vehicular fogs”. In: International Journal of Distributed SensorNetworks 12.9 (2016), pp. 1–14.
[Lew+14] G. Lewis, S. Echeverría, S. Simanta, B. Bradshaw, and J. Root. “Tac-tical Cloudlets: Moving Cloud Computing to the Edge”. In: Proc. ofthe 2014 IEEE Military Communications Conference. 2014, pp. 1440–1446.
[LGS17] Prasanth Lade, Rumi Ghosh, and Soundar Srinivasan. “Manufactur-ing analytics and industrial internet of things”. In: Intelligent Systems32.3 (2017), pp. 74–79.
[LH18] Qiang Liu and Tao Han. “DARE: Dynamic Adaptive Mobile Aug-mented Reality with Edge Computing”. In: Proc. of the 2018 IEEE26th International Conference on Network Protocols (ICNP). 2018,pp. 1–11.
[Li+11] M. Li, W. Cheng, K. Liu, Y. He, X. Li, and X. Liao. “Sweep Coverage withMobile Sensors”. In: IEEE Transactions on Mobile Computing 10.11(2011), pp. 1534–1545.
[Li+15] Jiwei Li, Zhe Peng, Bin Xiao, and Yu Hua. “Make smartphones lasta day: Pre-processing based computer vision application offloading”.In: Proc. of the 12th Annual IEEE International Conference on Sensing,Communication (SECON). 2015, pp. 462–470.
[Li+16a] D. Li, T. Salonidis, N. V. Desai, and M. C. Chuah. “DeepCham: Col-laborative Edge-Mediated Adaptive Deep Learning for Mobile ObjectRecognition”. In: Proc. of the 2016 IEEE/ACM Symposium on EdgeComputing (SEC). 2016, pp. 64–76.
[Li+16b] Hongxing Li, Guochu Shou, Yihong Hu, and Zhigang Guo. “MobileEdge Computing: Progress and Challenges”. In: Proc. of the 4th IEEEInternational Conference on Mobile Cloud Computing, Services, and En-gineering (MobileCloud). 2016, pp. 83–84.
[Li+18] Chao Li, Yushu Xue, Jing Wang, Weigong Zhang, and Tao Li. “Edge-Oriented Computing Paradigms: A Survey on Architecture Designand System Management”. In: ACM Computing Surveys 51.2 (2018),39:1–39:34.
[Lia+11] L. Liao, W. Chen, C. Zhang, L. Zhang, D. Xuan, and W. Jia. “Two BirdsWith One Stone: Wireless Access Point Deployment for Both Coverageand Localization”. In: IEEE Transactions on Vehicular Technology 60.5(2011), pp. 2239–2252.
[Lia+18] Konstantinos Liakos, Patrizia Busato, Dimitrios Moshou, Simon Pear-son, and Dionysis Bochtis. “Machine Learning in Agriculture: A Re-view”. In: Sensors 18.8 (2018), pp. 1–29.
[Liu+08] Benyuan Liu, Olivier Dousse, Jie Wang, and Anwar Saipulla. “StrongBarrier Coverage of Wireless Sensor Networks”. In: Proc. of the 9thACM International Symposium on Mobile Ad Hoc Networking and Com-puting. MobiHoc. 2008, pp. 411–420.

228 Bibliography
[Liu+17] Yang Liu, Changqiao Xu, Yufeng Zhan, Zhixin Liu, Jianfeng Guan, andHongke Zhang. “Incentive mechanism for computation offloading us-ing edge computing: A Stackelberg game approach”. In: ComputerNetworks 129 (2017), pp. 399–409.
[Liu+18] Liangkai Liu, Xingzhou Zhang, Mu Qiao, and Weisong Shi. “Safe-ShareRide: Edge-Based Attack Detection in Ridesharing Services”. In:Proc. of the 2018 IEEE/ACM Symposium on Edge Computing (SEC).2018, pp. 17–29.
[LLS08] Geetika T. Lakshmanan, Ying Li, and Rob Strom. “Placement strate-gies for internet-scale data stream systems”. In: IEEE Internet Com-puting 12.6 (2008), pp. 50–60.
[LMB17] Ivan Lujic, Vincenzo De Maio, and Ivona Brandic. “Efficient Edge Stor-age Management Based on Near Real-Time Forecasts”. In: Proc. of the1st IEEE International Conference on Fog and Edge Computing (ICFEC).2017, pp. 21–30.
[Loc+08] Christian Lochert, Björn Scheuermann, Christian Wewetzer, AndreasLübke, and Martin Mauve. “Data Aggregation and Roadside UnitPlacement for a VANET Traffic Information System”. In: Proc. of the5th International Workshop on Vehicular Ad Hoc Networks (VANET).2008, pp. 58–65.
[LQB18] Peng Liu, Bozhao Qi, and Suman Banerjee. “EdgeEye: An edge serviceframework for real-time intelligent video analytics”. In: Proc. of the1st International Workshop on Edge Systems, Analytics and Networking(EdgeSys). 2018, pp. 1–6.
[LR17] Maroš Lacinák and Jozef Ristvej. “Smart City, Safety and Security”.In: Procedia Engineering 192 (2017), pp. 522–527.
[LS17] Yuhua Lin and Haiying Shen. “CloudFog: Leveraging Fog to ExtendCloud Gaming for Thin-Client MMOG with High Quality of Service”.In: IEEE Transactions on Parallel and Distributes Systems 28.2 (2017),pp. 431–445.
[Lua+16] Tom H Luan, Longxiang Gao, Zhi Li, Yang Xiang, Guiyi We, and LiminSun. “A view of fog computing from networking perspective”. In:CoRR abs/1602.01509 (2016).
[Lui+15] M. C. Luizelli, L. R. Bays, L. S. Buriol, M. P. Barcellos, and L. P. Gaspary.“Piecing together the NFV provisioning puzzle: Efficient placementand chaining of virtual network functions”. In: Proc. of the IFIP/IEEEInternational Symposium on Integrated Network Management (IM).2015, pp. 98–106.
[LWB16] Peng Liu, Dale Willis, and Suman Banerjee. “ParaDrop: EnablingLightweight Multi-tenancy at the Network’s Extreme Edge”. In: Proc.of the IEEE/ACM Symposium on Edge Computing (SEC). 2016, pp. 1–13.
[LWX01] Zhiyuan Li, Cheng Wang, and Rong Xu. “Computation offloading tosave energy on handheld devices: a partition scheme”. In: Proc. of the2001 International Conference on Compilers, Architectures and Synthe-sis for Embedded Systems (CASES). 2001, pp. 238–246.

Bibliography 229
[LY18] Chun-Cheng Lin and Jhih-Wun Yang. “Cost-efficient deployment offog computing systems at logistics centers in industry 4.0”. In: Trans-actions on Industrial Informatics 14.10 (2018), pp. 4603–4611.
[LYS16] Jiayi Liu, Qinghai Yang, and Gwendal Simon. “Optimal and PracticalAlgorithms for Implementing Wireless CDN Based on Base Stations”.In: Proc. of the IEEE 83rd Vehicular Technology Conference (VTC). 2016,pp. 1–5.
[LZC18] En Li, Zhi Zhou, and Xu Chen. “Edge Intelligence: On-Demand DeepLearning Model Co-Inference with Device-Edge Synergy”. In: Proc. ofthe 2018 Workshop on Mobile Edge Communications. MECOMM’18.2018, pp. 31–36.
[Ma+17] Longjie Ma, Jigang Wu, Long Chen, and Zhusong Liu. “Fast algorithmsfor capacitated cloudlet placements”. In: Proc. of the 21st IEEE Inter-national Conference on Computer Supported Cooperative Work in De-sign (CSCWD). 2017, pp. 439–444.
[MA10] Raymond Mulligan and Habib M. Ammari. “Coverage in WirelessSensor Networks: A Survey”. In: Network Protocols & Algorithms 2.2(2010), pp. 27–53.
[Mad+13] Anil Madhavapeddy, Richard Mortier, Charalampos Rotsos, DavidScott, Balraj Singh, Thomas Gazagnaire, Steven Smith, Steven Hand,and Jon Crowcroft. “Unikernels: Library Operating Systems for theCloud”. In: Proc. of the 18th International Conference on ArchitecturalSupport for Programming Languages and Operating Systems. ASPLOS’13. 2013, pp. 461–472.
[Mai+09] Nicolas Maisonneuve, Matthias Stevens, Maria E. Niessen, and LucSteels. “NoiseTube: Measuring and mapping noise pollution with mo-bile phones”. In: Proc. of the 4th International ICSC Symposium. 2009,pp. 215–228.
[Man+04] Katerina Mania, Bernard D. Adelstein, Stephen R. Ellis, and MichaelI. Hill. “Perceptual Sensitivity to Head Tracking Latency in VirtualEnvironments with Varying Degrees of Scene Complexity”. In: Proc. ofthe 1st Symposium on Applied Perception in Graphics and Visualization.APGV ’04. 2004, pp. 39–47.
[Man+17] Filipe Manco, Costin Lupu, Florian Schmidt, Jose Mendes, SimonKuenzer, Sumit Sati, Kenichi Yasukata, Costin Raiciu, and FelipeHuici. “My VM is Lighter (and Safer) than your Container”. In: Proc.of the 26th Symposium on Operating Systems Principles (SOSP). 2017,pp. 218–233.
[Man+18] Johannes Manner, Martin EndreB, Tobias Heckel, and Guido Wirtz.“Cold Start Influencing Factors in Function as a Service”. In: Proc.of the 2018 IEEE/ACM International Conference on Utility and CloudComputing Companion (UCC). 2018, pp. 181–188.
[Mao+17] Yuyi Mao, Changsheng You, Jun Zhang, Kaibin Huang, and KhaledBen Letaief. “A Survey on Mobile Edge Computing: The Communica-tion Perspective”. In: IEEE Communications Surveys and Tutorials 19.4(2017), pp. 2322–2358.
230 Bibliography
[Mar+14] João Martins, Mohamed Ahmed, Costin Raiciu, Vladimir AndreiOlteanu, Michio Honda, Roberto Bifulco, and Felipe Huici. “ClickOSand the Art of Network Function Virtualization”. In: Proc. of the 11thUSENIX Symposium on Networked Systems Design and Implementation(NSDI). 2014, pp. 459–473.
[Mar+17] Eva Marín-Tordera, Xavier Masip-Bruin, Jordi Garcia Almiñana, Ad-mela Jukan, Guang-Jie Ren, and Jiafeng Zhu. “Do we all really knowwhat a fog node is? Current trends towards an open definition”. In:Computer Communications 109 (2017), pp. 117–130.
[Mar+19] Karola Marky, Andreas Weiß, Julien Gedeon, and Sebastian Günther.“Mastering Music Instruments through Technology in Solo LearningSessions”. In: Proc. of the 7th Workshop on Interacting with Smart Ob-jects (SmartObjects ’19). 2019, pp. 1–6.
[May+17] Ruben Mayer, Harshit Gupta, Enrique Saurez, and Umakishore Ra-machandran. “FogStore: Toward a distributed data store for Fog com-puting”. In: IEEE Fog World Congress. 2017, pp. 1–6.
[MAŽ18] M. Marjanovic, A. Antonic, and I. P. Žarko. “Edge Computing Architec-ture for Mobile Crowdsensing”. In: IEEE Access 6 (2018), pp. 10662–10674.
[MB17] Pavel Mach and Zdenek Becvar. “Mobile Edge Computing: A Surveyon Architecture and Computation Offloading”. In: IEEE Communica-tions Surveys and Tutorials 19.3 (2017), pp. 1628–1656.
[McG+02] John D. McGregor, Linda M. Northrop, Salah Jarrad, and Klaus Pohl.“Guest Editors’ Introduction: Initiating Software Product Lines”. In:IEEE Software 19.4 (2002), pp. 24–27.
[Med+15] Alexey Medvedev, Petr Fedchenkov, Arkady Zaslavsky, TheodorosAnagnostopoulos, and Sergey Khoruzhnikov. “Waste Management asan IoT-Enabled Service in Smart Cities”. In: Proc. Internet of Things,Smart Spaces, and Next Generation Networks and Systems - 15th In-ternational Conference, NEW2AN 2015, and 8th Conference, ruSMART2015. 2015, pp. 104–115.
[Men+17] Hamid Menouar, Ismail Güvenç, Kemal Akkaya, A. Selcuk Uluagac,Abdullah Kadri, and Adem Tuncer. “UAV-Enabled Intelligent Trans-portation Systems for the Smart City: Applications and Challenges”.In: IEEE Communications Magazine 55.3 (2017), pp. 22–28.
[Men+18] Nabor C. Mendonça, David Garlan, Bradley R. Schmerl, and JavierCámara. “Generality vs. reusability in architecture-based self-adaptation:The case for self-adaptive microservices”. In: Proc. of the 12th Eu-ropean Conference on Software Architecture: Companion Proceedings,(ECSA). 2018, 18:1–18:6.
[Meu+15] Christian Meurisch, Alexander Seeliger, Benedikt Schmidt, ImmanuelSchweizer, Fabian Kaup, and Max Mühlhäuser. “Upgrading wirelesshome routers for enabling large-scale deployment of cloudlets”. In:Proc. of the 7th International Conference on Mobile Computing, Appli-cations, and Services (MobiCASE). 2015, pp. 12–29.
Bibliography 231
[Meu+17a] Christian Meurisch, Julien Gedeon, Artur Gogel, The An BinhNguyen, Fabian Kaup, Florian Kohnhäuser, Lars Baumgärtner, MilanSchmittner, and Max Mühlhäuser. “Temporal Coverage Analysis ofRouter-Based Cloudlets Using Human Mobility Patterns”. In: Proc.of the IEEE Global Communications Conference (GLOBECOM). IEEE.2017, pp. 1–6.
[Meu+17b] Christian Meurisch, Julien Gedeon, The An Binh Nguyen, FabianKaup, and Max Mühlhäuser. “Decision Support for ComputationalOffloading by Probing Unknown Services”. In: Proc. of the 26th In-ternational Conference on Computer Communication and Networks(ICCCN). IEEE. 2017, pp. 1–9.
[Meu+17c] Christian Meurisch, The An Binh Nguyen, Julien Gedeon, FlorianKohnhäuser, Milan Schmittner, Stefan Niemczyk, Stefan Wullkotte,and Max Mühlhäuser. “Upgrading Wireless Home Routers as Emer-gency Cloudlet and Secure DTN Communication Bridge”. In: Proc. ofthe 26th International Conference on Computer Communication andNetworks (ICCCN). IEEE. 2017, pp. 1–2.
[MFH19] Cristina Mihale-Wilson, Patrick Felka, and Oliver Hinz. “The Brightand the Dark Side of Smart Lights? The Protective Effect of SmartCity Infrastructures”. In: Proc. of the Hawaii International Conferenceon System Sciences (HICSS). 2019, pp. 3345–3354.
[MFP20] Octavian Machidon, Tine Fajfar, and Veljko Pejovic. “ImplementingApproximate Mobile Computing”. In: Proc. of the 2020 Workshop onApproximate Computing Across the Stack (WAX). 2020, pp. 1–3.
[MHS17] Shaimaa M. Mohamed, Haitham S. Hamza, and Iman Aly Saroit.“Coverage in mobile wireless sensor networks (M-WSN): A survey”.In: Computer Communications 110 (2017), pp. 133–150.
[Mij+16] R. Mijumbi, J. Serrat, J. Gorricho, N. Bouten, F. De Turck, and R.Boutaba. “Network Function Virtualization: State-of-the-Art and Re-search Challenges”. In: IEEE Communications Surveys Tutorials 18.1(2016), pp. 236–262.
[Mit16] Sparsh Mittal. “A Survey of Techniques for Approximate Computing”.In: ACM Computing Surveys 48.4 (2016), 62:1–62:33.
[MJ16] Kianoosh Mokhtarian and Hans-Arno Jacobsen. “Coordinated cachingin planet-scale CDNs: Analysis of feasibility and benefits”. In: Proc. ofthe IEEE Conference on Computer Communications (INFOCOM). 2016,pp. 1–9.
[MK16] N. Mohan and J. Kangasharju. “Edge-Fog cloud: A distributed cloudfor Internet of Things computations”. In: Proc. of the 2016 Cloudifica-tion of the Internet of Things (CIoT). 2016, pp. 1–6.
[MKB18a] Redowan Mahmud, Ramamohanarao Kotagiri, and Rajkumar Buyya.“Fog Computing: A Taxonomy, Survey and Future Directions”. In: In-ternet of Everything: Algorithms, Methodologies, Technologies and Per-spectives. Ed. by Beniamino Di Martino, Kuan-Ching Li, Laurence T.Yang, and Antonio Esposito. Springer Singapore, 2018, pp. 103–130.

232 Bibliography
[MKB18b] F. Messaoudi, A. Ksentini, and P. Bertin. “Toward a Mobile GamingBased-Computation Offloading”. In: Proc. of the 2018 IEEE Interna-tional Conference on Communications (ICC). 2018, pp. 1–7.
[MN10] Antti P. Miettinen and Jukka K. Nurminen. “Energy Efficiency of Mo-bile Clients in Cloud Computing”. In: Proc. of the 2nd USENIX Work-shop on Hot Topics in Cloud Computing (HotCloud). 2010.
[Moh+11] Debabrata Mohapatra, Vinay K. Chippa, Anand Raghunathan, andKaushik Roy. “Design of voltage-scalable meta-functions for approxi-mate computing”. In: Proc. of the 2011 Design, Automation & Test inEurope Conference & Exhibition (DATE). 2011, pp. 950–955.
[Moh+18] Nitinder Mohan, Aleksandr Zavodovski, Pengyuan Zhou, and JussiKangasharju. “Anveshak: Placing Edge Servers In The Wild”. In: Proc.of the 2018 Workshop on Mobile Edge Communications (MECOMM).2018, pp. 7–12.
[Mor+16] Richard Mortier, Jianxin Zhao, Jon Crowcroft, Liang Wang, Qi Li,Hamed Haddadi, Yousef Amar, Andy Crabtree, James Colley, TomLodge, et al. “Personal data management with the databox: What’sinside the box?” In: Proc. of the 2016 ACM Workshop on Cloud-AssistedNetworking. 2016, pp. 49–54.
[Mor+17] Seyed Hossein Mortazavi, Mohammad Salehe, Carolina SimoesGomes, Caleb Phillips, and Eyal de Lara. “Cloudpath: a multi-tiercloud computing framework”. In: Proc. of the Second ACM/IEEESymposium on Edge Computing (SEC). 2017, 20:1–20:13.
[Mor+18a] Roberto Morabito, Vittorio Cozzolino, Aaron Yi Ding, Nicklas Beijar,and Jörg Ott. “Consolidate IoT Edge Computing with Lightweight Vir-tualization”. In: IEEE Network 32.1 (2018), pp. 102–111.
[Mor+18b] Thierry Moreau, Joshua San Miguel, Mark Wyse, James Bornholt,Armin Alaghi, Luis Ceze, Natalie D. Enright Jerger, and Adrian Samp-son. “A Taxonomy of General Purpose Approximate Computing Tech-niques”. In: Embedded Systems Letters 10.1 (2018), pp. 2–5.
[Mor+18c] Seyed Hossein Mortazavi, Bharath Balasubramanian, Eyal de Lara,and Shankaranarayanan Puzhavakath Narayanan. “Pathstore, A DataStorage Layer For The Edge”. In: Proc. of the 16th Annual InternationalConference on Mobile Systems, Applications, and Services. MobiSys ’18.ACM, 2018, pp. 519–519.
[Mor+18d] Seyed Hossein Mortazavi, Bharath Balasubramanian, Eyal de Lara,and Shankaranarayanan Puzhavakath Narayanan. “Toward SessionConsistency for the Edge”. In: Proc. of the USENIX Workshop on HotTopics in Edge Computing (HotEdge 18). 2018, pp. 1–6.
[Mot+13] Vinícius F. S. Mota, Daniel F. Macedo, Yacine Ghamri-Doudane, andJosé Marcos S. Nogueira. “On the feasibility of WiFi offloading in ur-ban areas: The Paris case study”. In: Proc. of the IFIP Wireless Days(WD). 2013, pp. 1–6.
[MPP10] Lefteris Mamatas, Ioannis Psaras, and George Pavlou. “Incentives andAlgorithms for Broadband Access Sharing”. In: Proc. of the 2010 ACMSIGCOMM Workshop on Home Networks. HomeNets ’10. 2010, pp. 19–24.

Bibliography 233
[MPZ10] X. Meng, V. Pappas, and L. Zhang. “Improving the Scalability of DataCenter Networks with Traffic-aware Virtual Machine Placement”. In:Proc. of the 29th IEEE International Conference on Computer Commu-nications (INFOCOM). 2010, pp. 1154–1162.
[MRD08] Oliver Moser, Florian Rosenberg, and Schahram Dustdar. “Non-Intrusive Monitoring and Service Adaptation for WS-BPEL”. In: Proc.of the 17th International Conference on World Wide Web. WWW ’08.2008, pp. 815–824.
[MRS19] Sumit Kumar Monga, Sheshadri K. R, and Yogesh Simmhan. “Elf-Store: A Resilient Data Storage Service for Federated Edge and FogResources”. In: Proc. of the 2019 IEEE International Conference on WebServices (ICWS). 2019, pp. 336–345.
[MS13] Anil Madhavapeddy and David J. Scott. “Unikernels: Rise of theVirtual Library Operating System”. In: Queue 11.11 (2013), 30:30–30:44.
[MSC15] Thierry Moreau, Adrian Sampson, and Luis Ceze. “Approximate Com-puting: Making Mobile Systems More Efficient”. In: IEEE PervasiveComputing 14.2 (2015), pp. 9–13.
[MSM17] Hassnaa Moustafa, Eve M. Schooler, and Jessica McCarthy. “ReverseCDN in Fog Computing: The lifecycle of video data in connected andautonomous vehicles”. In: Proc. of the IEEE Fog World Congress (FWC).2017, pp. 1–5.
[MTC17] D. Mazza, D. Tarchi, and G. E. Corazza. “A Unified Urban MobileCloud Computing Offloading Mechanism for Smart Cities”. In: IEEECommunications Magazine 55.3 (2017), pp. 30–37.
[Muk+17] M. Mukherjee, R. Matam, L. Shu, L. Maglaras, M. A. Ferrag, N. Choud-hury, and V. Kumar. “Security and Privacy in Fog Computing: Chal-lenges”. In: IEEE Access 5 (2017), pp. 19293–19304.
[Mül+17] Florian Müller, Sebastian Günther, Azita Hosseini Nejad, NiloofarDezfuli, Mohammadreza Khalilbeigi, and Max Mühlhäuser. “Cloud-bits: supporting conversations through augmented zero-query searchvisualization”. In: Proc. of the 5th Symposium on Spatial User Interac-tion (SUI). 2017, pp. 30–38.
[Nan+17] Yucen Nan, Wei Li, Wei Bao, Flávia Coimbra Delicato, Paulo F. Pires,Yong Dou, and Albert Y. Zomaya. “Adaptive Energy-Aware Compu-tation Offloading for Cloud of Things Systems”. In: IEEE Access 5(2017), pp. 23947–23957.
[Nar+19] Matteo Nardelli, Valeria Cardellini, Vincenzo Grassi, and FrancescoLo Presti. “Efficient Operator Placement for Distributed Data StreamProcessing Applications”. In: IEEE Transactions on Parallel and Dis-tributed Systems 30.8 (2019), pp. 1753–1767.
[NB12] Ebisa Negeri and Nico Baken. “Architecting the smart grid as a ho-larchy”. In: Proc. of the 1st International Conference on Smart Gridsand Green IT Systems. 2012, pp. 1–6.
[Ngu09] Thanh Nguyen. “Indexing PostGIS databases and spatial Query per-formance evaluations”. In: International Journal of Geoinformatics 5(2009), pp. 1–9.

234 Bibliography
[NS14] Dawn Nafus and Jamie Sherman. “Big data, big questions| this onedoes not go up to 11: the quantified self movement as an alterna-tive big data practice”. In: International journal of communication 8(2014), pp. 1784–1794.
[Nun+15] Swaroop Nunna, Apostolos Kousaridas, Mohamed Ibrahim, MarkusDillinger, Christoph Thuemmler, Hubertus Feussner, and ArminSchneider. “Enabling Real-Time Context-Aware Collaboration through5G and Mobile Edge Computing”. In: Proc. of the 2015 12th Interna-tional Conference on Information Technology - New Generations. 2015,pp. 601–605.
[Nuo+06] Teemu Nuortio, Jari Kytöjoki, Harri Niska, and Olli Bräysy. “Improvedroute planning and scheduling of waste collection and transport”. In:Expert Systems with Applications 30.2 (2006), pp. 223–232.
[OBL16] Gabriel Orsini, Dirk Bade, and Winfried Lamersdorf. “CloudAware: AContext-Adaptive Middleware for Mobile Edge and Cloud ComputingApplications”. In: Proc. of the 2016 IEEE 1st International Workshopson Foundations and Applications of Self* Systems (FAS*W). 2016,pp. 216–221.
[Ola+12] Rafael Olaechea, Steven Stewart, Krzysztof Czarnecki, and DerekRayside. “Modelling and Multi-Objective Optimization of QualityAttributes in Variability-Rich Software”. In: Proc. of the 4th Inter-national Workshop on Nonfunctional System Properties in DomainSpecific Modeling Languages. NFPinDSML ’12. 2012, pp. 1–6.
[Oye17] Emmanuel Oyekanlu. “Predictive edge computing for time series ofindustrial IoT and large scale critical infrastructure based on open-source software analytic of big data”. In: Proc. of the 2017 IEEE Inter-national Conference on Big Data (Big Data). 2017, pp. 1663–1669.
[PA97] Daniel A. Peak and M. H. Azadmanesh. “Centralization/decentraliza-tion cycles in computing: Market evidence”. In: Information & Man-agement 31.6 (1997), pp. 303–317.
[Pah+16] Claus Pahl, Sven Helmer, Lorenzo Miori, Julian Sanin, and Brian Lee.“A Container-Based Edge Cloud PaaS Architecture Based on Raspber-ryPi Clusters”. In: Proc. of the 4th IEEE International Conference on Fu-ture Internet of Things and Cloud Workshops (FiCloud). 2016, pp. 117–124.
[Pan+13a] Gang Pan, Guande Qi, Wangsheng Zhang, Shijian Li, Zhaohui Wu,and Laurence Tianruo Yang. “Trace Analysis and Mining for SmartCities: Issues, Methods, and Applications”. In: IEEE CommunicationsMagazine 51.6 (2013).
[Pan+13b] R. K. Panta, R. Jana, F. Cheng, Y. R. Chen, and V. A. Vaishampayan.“Phoenix: Storage Using an Autonomous Mobile Infrastructure”. In:IEEE Transactions on Parallel and Distributed Systems 24.9 (2013),pp. 1863–1873.
[Pan+15] Zhengyuan Pang, Lifeng Sun, Zhi Wang, Erfang Tian, and ShiqiangYang. “A Survey of Cloudlet Based Mobile Computing”. In: Proc. of theInternational Conference on Cloud Computing and Big Data (CCBD).2015, pp. 268–275.
Bibliography 235
[Pan+16] Jianli Pan, Lin Ma, Ravishankar Ravindran, and Peyman TalebiFard.“HomeCloud: An edge cloud framework and testbed for new ap-plication delivery”. In: Proc. of the 23rd International Conference onTelecommunications (ICT). 2016, pp. 1–6.
[Pap03] Mike P. Papazoglou. “Service-Oriented Computing: Concepts, Charac-teristics and Directions”. In: Proc. of the Fourth International Confer-ence on Web Information Systems Engineering. WISE ’03. 2003, pp. 3–12.
[Par+14] Jongse Park, Xin Zhang, Kangqi Ni, Hadi Esmaeilzadeh, and MayurNaik. Expax: A framework for automating approximate programming.Tech. rep. Georgia Institute of Technology, 2014, pp. 1–17.
[Pas+18] Francisco Javier Ferrández Pastor, Juan Manuel García Chamizo,Mario Nieto-Hidalgo, and José Mora-Martínez. “Precision Agricul-ture Design Method Using a Distributed Computing Architecture onInternet of Things Context”. In: Sensors 18.6 (2018), pp. 1–21.
[PBC17] Juan F. Pérez, Robert Birke, and Lydia Y. Chen. “On the latency-accuracy tradeoff in approximate MapReduce jobs”. In: Proc. of the2017 IEEE Conference on Computer Communications (INFOCOM).2017, pp. 1–9.
[PD99] Norman W. Paton and Oscar Díaz. “Active Database Systems”. In: ACMComputing Surveys 31.1 (1999), pp. 63–103.
[Pej18] Veljko Pejovic. “Towards Approximate Mobile Computing”. In: Get-Mobile: Mobile Computing and Communications 22.4 (2018), pp. 9–12.
[Pen+15] Boyang Peng, Mohammad Hosseini, Zhihao Hong, Reza Farivar, andRoy Campbell. “R-Storm: Resource-Aware Scheduling in Storm”. In:Proc. of the 16th ACM/IFIP/USENIX Annual Middleware Conference(Middleware). 2015, pp. 149–161.
[Per+14a] Charith Perera, Arkady B. Zaslavsky, Peter Christen, and DimitriosGeorgakopoulos. “Context Aware Computing for The Internet ofThings: A Survey”. In: IEEE Communications Surveys & Tutorials 16.1(2014), pp. 414–454.
[Per+14b] Charith Perera, Arkady B. Zaslavsky, Peter Christen, and DimitriosGeorgakopoulos. “Sensing as a service model for smart cities sup-ported by Internet of Things”. In: Transactions on Emerging Telecom-munications Technologies 25.1 (2014), pp. 81–93.
[Per+15] Charith Perera, Rajiv Ranjan, Lizhe Wang, Samee Ullah Khan, andAlbert Y. Zomaya. “Big Data Privacy in the Internet of Things Era”.In: IT Professional 17.3 (2015), pp. 32–39.
[Per+17a] Charith Perera, Yongrui Qin, Júlio Cezar Estrella, Stephan Reiff-Marganiec, and Athanasios V. Vasilakos. “Fog Computing for Sus-tainable Smart Cities: A Survey”. In: ACM Computing Surveys 50.3(2017), 32:1–32:43.
236 Bibliography
[Per+17b] Charith Perera, Susan Wakenshaw, Tim Baarslag, Hamed Haddadi,Arosha K. Bandara, Richard Mortier, Andy Crabtree, Irene Ng, DerekMcAuley, and Jon Crowcroft. “Valorising the IoT databox: creatingvalue for everyone”. In: Transactions on Emerging TelecommunicationsTechnologies 28.1 (2017), pp. 1–17.
[Pie+06] Peter Pietzuch, Jonathan Ledlie, Jeffrey Shneidman, Mema Rous-sopoulos, Matt Welsh, and Margo Seltzer. “Network-Aware OperatorPlacement for Stream-Processing Systems”. In: Proc. of the 22ndInternational Conference on Data Engineering (ICDE). 2006, pp. 1–12.
[PL15] Claus Pahl and Brian Lee. “Containers and Clusters for Edge Cloud Ar-chitectures - A Technology Review”. In: Proc. of the 3rd InternationalConference on Future Internet of Things and Cloud. 2015, pp. 379–386.
[PLM17] Riccardo Petrolo, Valeria Loscrí, and Nathalie Mitton. “Towards asmart city based on cloud of things, a survey on the smart city visionand paradigms”. In: Transactions on Emerging TelecommunicationsTechnologies 28.1 (2017).
[PM17] Jianli Pan and James McElhannon. “Future edge cloud and edge com-puting for internet of things applications”. In: IEEE Internet of ThingsJournal 5.1 (2017), pp. 439–449.
[Pow+15] Nathaniel Powers, Alexander Alling, Kiara Osolinsky, Tolga Soyata,Meng Zhu, Haoliang Wang, He Ba, Wendi B. Heinzelman, Jiye Shi,and Minseok Kwon. “The Cloudlet Accelerator: Bringing Mobile-Cloud Face Recognition into Real-Time”. In: Proc. of the 2015 IEEEGlobecom Workshops. 2015, pp. 1–7.
[Pre+15] J. S. Preden, K. Tammemäe, A. Jantsch, M. Leier, A. Riid, and E. Calis.“The Benefits of Self-Awareness and Attention in Fog and Mist Com-puting”. In: Computer 48.7 (2015), pp. 37–45.
[PS11] B. Pernici and S. H. Siadat. “Selection of Service Adaptation StrategiesBased on Fuzzy Logic”. In: Proc. of the 2011 IEEE World Congress onServices. 2011, pp. 99–106.
[PS18] Jared N. Plumb and Ryan Stutsman. “Exploiting Google’s Edge Net-work for Massively Multiplayer Online Games”. In: Proc. of the 2ndIEEE International Conference on Fog and Edge Computing (ICFEC).2018, pp. 1–8.
[Psa+18] Ioannis Psaras, Onur Ascigil, Sergi Rene, George Pavlou, AlexanderAfanasyev, and Lixia Zhang. “Mobile Data Repositories at the Edge”.In: Proc. of the USENIX Workshop on Hot Topics in Edge Computing(HotEdge). 2018.
[PSM10] Michael Angelo A. Pedrasa, Ted D. Spooner, and Iain F. MacGill. “Co-ordinated scheduling of residential distributed energy resources tooptimize smart home energy services”. In: IEEE Transactions on SmartGrid 1.2 (2010), pp. 134–143.
[Pul+18] C. Puliafito, E. Mingozzi, C. Vallati, F. Longo, and G. Merlino. “Vir-tualization and Migration at the Network Edge: An Overview”. In:Proc. of the 2018 IEEE International Conference on Smart Computing(SMARTCOMP). 2018, pp. 368–374.
Bibliography 237
[Pul+19] Carlo Puliafito, Enzo Mingozzi, Francesco Longo, Antonio Puliafito,and Omer Rana. “Fog Computing for the Internet of Things: A Sur-vey”. In: ACM Transactions on Internet Technology 19.2 (2019), 18:1–18:41.
[PW02] Lothar Pantel and Lars C. Wolf. “On the Impact of Delay on Real-timeMultiplayer Games”. In: Proc. of the 12th International Workshop onNetwork and Operating Systems Support for Digital Audio and Video.NOSSDAV ’02. 2002, pp. 23–29.
[PY10] J. T. Piao and J. Yan. “A Network-aware Virtual Machine Placementand Migration Approach in Cloud Computing”. In: Proc. of the 9thInternational Conference on Grid and Cloud Computing (GCC). 2010,pp. 87–92.
[Qiu+18] Hang Qiu, Fawad Ahmad, Fan Bai, Marco Gruteser, and RameshGovindan. “AVR: Augmented Vehicular Reality”. In: Proc. of the 16thInternational Conference on Mobile Systems, Applications, and Services.MobiSys ’18. 2018, pp. 81–95.
[QKB17] Bozhao Qi, Lei Kang, and Suman Banerjee. “A vehicle-based edgecomputing platform for transit and human mobility analytics”. In:Proc. of the Second ACM/IEEE Symposium on Edge Computing (SEC).2017, 1:1–1:14.
[Ra+11] Moo-Ryong Ra, Anmol Sheth, Lily B. Mummert, Padmanabhan Pil-lai, David Wetherall, and Ramesh Govindan. “Odessa: enabling inter-active perception applications on mobile devices”. In: Proc. of ACMMobiSys. 2011, pp. 43–56.
[RAD18] Thomas Rausch, Cosmin Avasalcai, and Schahram Dustdar. “PortableEnergy-Aware Cluster-Based Edge Computers”. In: Proc. of the 2018IEEE/ACM Symposium on Edge Computing (SEC). 2018, pp. 260–272.
[RCR11] Meike Ramon, Stéphanie Caharel, and Bruno Rossion. “The speed ofrecognition of personally familiar faces”. In: Perception 40 (2011),pp. 437–449.
[RDR10] Stamatia Rizou, Frank Dürr, and Kurt Rothermel. “Solving the multi-operator placement problem in large-scale operator networks”. In:Proc. of the 19th International Conference on Computer Communica-tions (ICCCN). 2010, pp. 1–6.
[RDU18] Yefeng Ruan, Arjan Durresi, and Suleyman Uslu. “Trust Assessmentfor Internet of Things in Multi-access Edge Computing”. In: Proc. ofthe 32nd IEEE International Conference on Advanced Information Net-working and Applications (AINA). 2018, pp. 1155–1161.
[Rei+12] Andreas Reinhardt, Paul Baumann, Daniel Burgstahler, Matthias Hol-lick, Hristo Chonov, Marc Werner, and Ralf Steinmetz. “On the accu-racy of appliance identification based on distributed load meteringdata”. In: Proc. of the 2nd IFIP Conference on Sustainable Internet andICT for Sustainability (SustainIT). 2012, pp. 1–9.
[Ren+18] Yongzheng Ren, Feng Zeng, Wenjia Li, and Lin Meng. “A Low-CostEdge Server Placement Strategy in Wireless Metropolitan Area Net-works”. In: Proc. of the 27th International Conference on ComputerCommunication and Networks (ICCCN). 2018, pp. 1–6.
238 Bibliography
[Rez+18] Alex Reznik, Anthony Sulisti, Alexander Artemenko, Yonggang Fang,Danny Frydman, Fabio Giust, HuaZhang Lv, Saad Ullah Sheikh, YifanYu, and Zhou Zheng. MEC in an Enterprise Setting: A Solution Outline.Tech. rep. ETSI, 2018.
[RH05] Maxim Raya and Jean-Pierre Hubaux. “The Security of Vehicular AdHoc Networks”. In: Proc. of the 3rd ACM Workshop on Security of AdHoc and Sensor Networks. SASN ’05. 2005, pp. 11–21.
[RLM18] Rodrigo Roman, Javier López, and Masahiro Mambo. “Mobile edgecomputing, Fog et al.: A survey and analysis of security threats andchallenges”. In: Future Generation Computer Systems 78 (2018),pp. 680–698.
[RN16] Flavio Ramalho and Augusto Neto. “Virtualization at the networkedge: A performance comparison”. In: Proc. of the 17th IEEE Inter-national Symposium on A World of Wireless, Mobile and MultimediaNetworks (WoWMoM). 2016, pp. 1–6.
[Sal+18] Mohammad A. Salahuddin, Jagruti Sahoo, Roch H. Glitho, HalimaElbiaze, and Wessam Ajib. “A Survey on Content Placement Algo-rithms for Cloud-Based Content Delivery Networks”. In: IEEE Access6 (2018), pp. 91–114.
[Sam+11] Adrian Sampson, Werner Dietl, Emily Fortuna, Danushen Gnanapra-gasam, Luis Ceze, and Dan Grossman. “EnerJ: approximate data typesfor safe and general low-power computation”. In: Proc. of the 32ndACM SIGPLAN Conference on Programming Language Design and Im-plementation (PLDI). 2011, pp. 164–174.
[San+14] Nay Myo Sandar, Sivadon Chaisiri, Sira Yongchareon, and VeronicaLiesaputra. “Cloud-Based Video Monitoring Framework: An Ap-proach Based on Software-Defined Networking for Addressing Scal-ability Problems”. In: Proc. of Web Information Systems Engineering(WISE) Workshops. 2014, pp. 176–189.
[Sap+16] Marco Sapienza, Ermanno Guardo, Marco Cavallo, Giuseppe LaTorre, Guerrino Leombruno, and Orazio Tomarchio. “Solving CriticalEvents through Mobile Edge Computing: An Approach for SmartCities”. In: Proc. of the 2016 IEEE International Conference on SmartComputing, (SMARTCOMP). 2016, pp. 1–5.
[Sat+09] Mahadev Satyanarayanan, Paramvir Bahl, Ramón Cáceres, and NigelDavies. “The Case for VM-Based Cloudlets in Mobile Computing”. In:IEEE Pervasive Computing 8.4 (2009), pp. 14–23.
[Sat+13] M. Satyanarayanan, G. Lewis, E. Morris, S. Simanta, J. Boleng, andK. Ha. “The Role of Cloudlets in Hostile Environments”. In: IEEE Per-vasive Computing 12.4 (2013), pp. 40–49.
[Sat+14] Mahadev Satyanarayanan, Zhuo Chen, Kiryong Ha, Wenlu Hu, Wolf-gang Richter, and Padmanabhan Pillai. “Cloudlets: At the leadingedge of mobile-cloud convergence”. In: Proc. of the 6th InternationalConference on Mobile Computing, Applications and Services (Mobi-CASE). 2014, pp. 1–9.

Bibliography 239
[Sat+16] Arjuna Sathiaseelan, Adisorn Lertsinsrubtavee, Adarsh Jagan, Pra-kash Baskaran, and Jon Crowcroft. “Cloudrone: Micro Clouds in theSky”. In: Proc. of the 2nd Workshop on Micro Aerial Vehicle Networks,Systems, and Applications for Civilian Use (DroNet). 2016, pp. 41–44.
[Sat+17] Mahadev Satyanarayanan, Phillip B. Gibbons, Lily B. Mummert, Pad-manabhan Pillai, Pieter Simoens, and Rahul Sukthankar. “Cloudlet-based just-in-time indexing of IoT video”. In: Proc. of the Global Inter-net of Things Summit (GIoTS 2017). 2017, pp. 1–8.
[Sat01] Mahadev Satyanarayanan. “Pervasive computing: vision and chal-lenges”. In: IEEE Personal Communications 8.4 (2001), pp. 10–17.
[Sat04] M. Satyanarayanan. “Augmenting Cognition”. In: IEEE Pervasive Com-puting 3.2 (2004), pp. 4–5.
[Sat11] Mahadev Satyanarayanan. “Mobile computing: the next decade”. In:Mobile Computing and Communications Review 15.2 (2011), pp. 2–10.
[Sat17] Mahadev Satyanarayanan. “The Emergence of Edge Computing”. In:IEEE Computer 50.1 (2017), pp. 30–39.
[SBD18] Meenakshi Syamkumar, Paul Barford, and Ramakrishnan Durairajan.“Deployment Characteristics of "The Edge" in Mobile Edge Comput-ing”. In: Proc. of the 2018 Workshop on Mobile Edge Communications(MECOMM). 2018, pp. 43–49.
[SBH16] Farzad Samie, Lars Bauer, and Jörg Henkel. “IoT Technologies for Em-bedded Computing: A Survey”. In: Proc. of the 11th IEEE/ACM/IFIPInternational Conference on Hardware/Software Codesign and SystemSynthesis. CODES ’16. 2016, 8:1–8:10.
[Sce+11] Salvatore Scellato, Cecilia Mascolo, Mirco Musolesi, and Jon Crow-croft. “Track Globally, Deliver Locally: Improving Content DeliveryNetworks by Tracking Geographic Social Cascades”. In: Proc. of the20th International Conference on World Wide Web. WWW’11. 2011,pp. 457–466.
[Sch+08] E. Schoch, F. Kargl, M. Weber, and T. Leinmüller. “Communication pat-terns in VANETs”. In: IEEE Communications Magazine 46.11 (2008),pp. 119–125.
[Sch+11] Hans Schaffers, Nicos Komninos, Marc Pallot, Brigitte Trousse,Michael Nilsson, and Alvaro Oliveira. “Smart Cities and the FutureInternet: Towards Cooperation Frameworks for Open Innovation”.In: Proc. of the Future Internet Assembly 2011: Achievements andTechnological Promises. 2011, pp. 431–446.
[Sch+12] Immanuel Schweizer, Christian Meurisch, Julien Gedeon, RomanBärtl, and Max Mühlhäuser. “Noisemap: multi-tier incentive mech-anisms for participative urban sensing”. In: Proc. of the 3rd In-ternational Workshop on Sensing Applications on Mobile Phones.PhoneSense ’12. ACM. 2012, 9:1–9:5.

240 Bibliography
[Sch+15] Benedikt Schmidt, Sebastian Benchea, Rüdiger Eichin, and ChristianMeurisch. “Fitness Tracker or Digital Personal Coach: How to Per-sonalize Training”. In: Adjunct Proc. of the 2015 ACM InternationalJoint Conference on Pervasive and Ubiquitous Computing and Proc. ofthe 2015 ACM International Symposium on Wearable Computers. Ubi-Comp/ISWC’15 Adjunct. 2015, pp. 1063–1067.
[Sch+16a] Dominik Schäfer, Janick Edinger, Justin Mazzola Paluska, SebastianVanSyckel, and Christian Becker. “Tasklets: "Better than Best-Effort"Computing”. In: Proc. of the 25th International Conference on Com-puter Communication and Networks (ICCCN). 2016, pp. 1–11.
[Sch+16b] Johannes M. Schleicher, Michael Vögler, Schahram Dustdar, andChristian Inzinger. “Enabling a smart city application ecosystem:Requirements and architectural aspects”. In: IEEE Internet Computing20.2 (2016), pp. 58–65.
[Sch+17] Eve M. Schooler, David Zage, Jeff Sedayao, Hassnaa Moustafa, An-drew Brown, and Moreno Ambrosin. “An Architectural Vision for aData-Centric IoT: Rethinking Things, Trust and Clouds”. In: Proc. ofthe 37th IEEE International Conference on Distributed Computing Sys-tems (ICDCS). 2017, pp. 1717–1728.
[Sco+19] Domenico Scotece, Nafize R. Paiker, Luca Foschini, Paolo Bellavista,Xiaoning Ding, and Cristian Borcea. “MEFS: Mobile Edge File Sys-tem for Edge-Assisted Mobile Apps”. In: Proc. of the 20th IEEE Inter-national Symposium on "A World of Wireless, Mobile and MultimediaNetworks" (WoWMoM). 2019, pp. 1–9.
[SF05] Ya-Yunn Su and Jason Flinn. “Slingshot: deploying stateful servicesin wireless hotspots”. In: Proc. of the 3rd International Conference onMobile Systems, Applications, and Services (MobiSys). 2005, pp. 79–92.
[Sha+11] Bikash Sharma, Victor Chudnovsky, Joseph L. Hellerstein, Rasekh Ri-faat, and Chita R. Das. “Modeling and synthesizing task placementconstraints in Google compute clusters”. In: Proc. of the ACM Sympo-sium on Cloud Computing (SOCC). 2011, pp. 1–14.
[Shi+11] Elaine Shi, T.-H. Hubert Chan, Eleanor G. Rieffel, Richard Chow, andDawn Song. “Privacy-Preserving Aggregation of Time-Series Data”.In: Proc. of the Network and Distributed System Security Symposium(NDSS). 2011, pp. 1–17.
[Shi+13] Muhammad Shiraz, Saeid Abolfazli, Zohreh Sanaei, and AbdullahGani. “A study on virtual machine deployment for application out-sourcing in mobile cloud computing”. In: The Journal of Supercom-puting 63.3 (2013), pp. 946–964.
[Shi+14] Cong Shi, Karim Habak, Pranesh Pandurangan, Mostafa Ammar,Mayur Naik, and Ellen Zegura. “COSMOS: Computation Offloadingas a Service for Mobile Devices”. In: Proc. of the 15th ACM Inter-national Symposium on Mobile Ad Hoc Networking and Computing.MobiHoc ’14. 2014, pp. 287–296.

Bibliography 241
[Shi+15] Jinghao Shi, Liwen Gui, Dimitrios Koutsonikolas, Chunming Qiao,and Geoffrey Challen. “A Little Sharing Goes a Long Way: The Casefor Reciprocal Wifi Sharing”. In: Proc. of the 2nd International Work-shop on Hot Topics in Wireless. HotWireless ’15. 2015, pp. 6–10.
[Shi+16] Weisong Shi, Jie Cao, Quan Zhang, Youhuizi Li, and Lanyu Xu. “EdgeComputing: Vision and Challenges”. In: IEEE Internet of Things Jour-nal 3.5 (2016), pp. 637–646.
[Shi+19] Shu Shi, Varun Gupta, Michael Hwang, and Rittwik Jana. “Mobile VRon Edge Cloud: A Latency-driven Design”. In: Proc. of the 10th ACMMultimedia Systems Conference. MMSys ’19. 2019, pp. 222–231.
[Sid+11] Stelios Sidiroglou-Douskos, Sasa Misailovic, Henry Hoffmann, andMartin C. Rinard. “Managing performance vs. accuracy trade-offswith loop perforation”. In: Proc. of the SIGSOFT/FSE’11 19th ACMSIGSOFT Symposium on the Foundations of Software Engineering(FSE-19) and ESEC’11: 13th European Software Engineering Confer-ence (ESEC-13). 2011, pp. 124–134.
[Sil+16] Ana Cristina Franco da Silva, Uwe Breitenbücher, Kálmán Képes,Oliver Kopp, and Frank Leymann. “OpenTOSCA for IoT: Automatingthe Deployment of IoT Applications based on the Mosquitto MessageBroker”. In: Proc. of the 6th International Conference on the Internetof Things (IOT). 2016, pp. 181–182.
[Sil16] Alan Sill. “The Design and Architecture of Microservices”. In: IEEECloud Computing 3.5 (2016), pp. 76–80.
[Sim+13] Pieter Simoens, Yu Xiao, Padmanabhan Pillai, Zhuo Chen, KiryongHa, and Mahadev Satyanarayanan. “Scalable crowd-sourcing of videofrom mobile devices”. In: Proc. of the 11th International Conference onMobile Systems, Applications, and Services (MobiSys). 2013, pp. 139–152.
[SKK12] M. Sharifi, S. Kafaie, and O. Kashefi. “A Survey and Taxonomy ofCyber Foraging of Mobile Devices”. In: IEEE Communications SurveysTutorials 14.4 (2012), pp. 1232–1243.
[SLM17] L. Sun, Y. Li, and R. A. Memon. “An open IoT framework based onmicroservices architecture”. In: China Communications 14.2 (2017),pp. 154–162.
[SMR13] Luis Emiliano Sanchez, Sabine Moisan, and Jean-Paul Rigault. “Met-rics on feature models to optimize configuration adaptation at runtime”. In: Proc. of the 1st International Workshop on CombiningModelling and Search-Based Software Engineering, (CMSBSE). 2013,pp. 39–44.
[SMT10] Patrick Stuedi, Iqbal Mohomed, and Doug Terry. “WhereStore:Location-based Data Storage for Mobile Devices Interacting withthe Cloud”. In: Proc. of the 1st ACM Workshop on Mobile Cloud Com-puting & Services: Social Networks and Beyond. MCS ’10. 2010, 1:1–1:8.
242 Bibliography
[SP15] Fabrice Starks and Thomas Peter Plagemann. “Operator placementfor efficient distributed complex event processing in MANETs”. In:Proc. of the 11th IEEE International Conference on Wireless and MobileComputing (WiMob). 2015, pp. 83–90.
[Spi17] Josef Spillner. “Snafu: Function-as-a-Service (FaaS) Runtime Designand Implementation”. In: CoRR abs/1703.07562 (2017), pp. 1–15.
[SS13] O. Saleh and K. Sattler. “Distributed Complex Event Processing in Sen-sor Networks”. In: Proc. of the 2013 IEEE 14th International Confer-ence on Mobile Data Management. 2013, pp. 23–26.
[SS14] Immanuel Schweizer and Benedikt Schmidt. “Kraken.Me: Multi-device User Tracking Suite”. In: Proc. of the 2014 ACM InternationalJoint Conference on Pervasive and Ubiquitous Computing: AdjunctPublication. UbiComp ’14 Adjunct. 2014, pp. 853–862.
[Ste92] Jonathan Steuer. “Defining Virtual Reality: Dimensions DeterminingTelepresence”. In: Journal of Communication 42.4 (1992), pp. 73–93.
[Ste97] Robert Stephens. “A Survey of Stream Processing”. In: Acta Informat-ica 34.7 (1997), pp. 491–541.
[STH18] Jacopo Soldani, Damian Andrew Tamburri, and Willem-Jan van denHeuvel. “The pains and gains of microservices: A Systematic greyliterature review”. In: Journal of Systems and Software 146 (2018),pp. 215–232.
[Sto+16] Ivan Stojmenovic, Sheng Wen, Xinyi Huang, and Hao Luan. “Anoverview of Fog computing and its security issues”. In: Concurrencyand Computation: Practice and Experience 28.10 (2016), pp. 2991–3005.
[Sto12] Milos Stojmenovic. “Mobile Cloud Computing for Biometric Applica-tions”. In: Proc. of the 15th International Conference on Network-BasedInformation Systems (NBiS 2012). 2012, pp. 654–659.
[Swa12] Melanie Swan. “Health 2050: The Realization of PersonalizedMedicine through Crowdsourcing, the Quantified Self, and the Partic-ipatory Biocitizen”. In: Journal of Personalized Medicine 2.3 (2012),pp. 93–118.
[Tal+17] Tarik Taleb, Sunny Dutta, Adlen Ksentini, Muddesar Iqbal, and HannuFlinck. “Mobile Edge Computing Potential in Making Cities Smarter”.In: IEEE Communications Magazine 55.3 (2017), pp. 38–43.
[Tan+15] Haowen Tang, Fangming Liu, Guobin Shen, Yuchen Jin, and Chuanx-iong Guo. “UniDrive: Synergize Multiple Consumer Cloud StorageServices”. In: Proc. of the 16th Annual Middleware Conference. Mid-dleware ’15. ACM, 2015, pp. 137–148.
[Tha+18] Jörg Thalheim, Pramod Bhatotia, Pedro Fonseca, and Baris Kasikci.“CNTR: Lightweight OS Containers”. In: Proc. of the 2018 USENIXAnnual Technical Conference (ATC). 2018, pp. 199–212.
[Tho12] Bruce H. Thomas. “A Survey of Visual, Mixed, and Augmented RealityGaming”. In: Computers in Entertainment 10.1 (2012), 3:1–3:33.

Bibliography 243
[TLL14] Cory Thoma, Alexandros Labrinidis, and Adam J. Lee. “Automatedoperator placement in distributed Data Stream Management Systemssubject to user constraints”. In: Workshops Proc. of the 30th Interna-tional Conference on Data sEngineering Workshops (ICDE Workshops).2014, pp. 310–316.
[TLP17] Davide Taibi, Valentina Lenarduzzi, and Claus Pahl. “Processes, Mo-tivations, and Issues for Migrating to Microservices Architectures:An Empirical Investigation”. In: IEEE Cloud Computing 4.5 (2017),pp. 22–32.
[Tra+17] T. X. Tran, P. Pandey, A. Hajisami, and D. Pompili. “Collaborativemulti-bitrate video caching and processing in Mobile-Edge Com-puting networks”. In: Proc. of the 2017 13th Annual Conference onWireless On-demand Network Systems and Services (WONS). 2017,pp. 165–172.
[Tri+19] Marco Trinelli, Massimo Gallo, Myriana Rifai, and Fabio Pianese.“Transparent AR Processing Acceleration at the Edge”. In: Proc.of the 2nd International Workshop on Edge Systems, Analytics andNetworking (EdgeSys). 2019, pp. 30–35.
[Tsa+17] P. Tsai, H. Hong, A. Cheng, and C. Hsu. “Distributed analytics in fogcomputing platforms using tensorflow and kubernetes”. In: Proc. ofthe 2017 19th Asia-Pacific Network Operations and Management Sym-posium (APNOMS). 2017, pp. 145–150.
[TVM18] G. Tanganelli, C. Vallati, and E. Mingozzi. “Edge-Centric DistributedDiscovery and Access in the Internet of Things”. In: IEEE Internet ofThings Journal 5.1 (2018), pp. 425–438.
[Val+16] Carlo Vallati, Antonio Virdis, Enzo Mingozzi, and Giovanni Stea.“Mobile-edge computing come home connecting things in futuresmart homes using LTE device-to-device communications”. In: IEEEConsumer Electronics Magazine 5.4 (2016), pp. 77–83.
[Var+16] B. Varghese, N. Wang, S. Barbhuiya, P. Kilpatrick, and D. S. Nikolopou-los. “Challenges and Opportunities in Edge Computing”. In: Proc. ofthe 2016 IEEE International Conference on Smart Cloud (SmartCloud).2016, pp. 20–26.
[Var+17] Blesson Varghese, Nan Wang, Dimitrios S. Nikolopoulos, and Rajku-mar Buyya. “Feasibility of Fog Computing”. In: CoRR abs/1701.05451(2017), pp. 1–8.
[Vas+15] Emmanouil Vasilomanolakis, Jörg Daubert, Manisha Luthra, VangelisGazis, Alexander Wiesmaier, and Panayotis Kikiras. “On the Securityand Privacy of Internet of Things Architectures and Systems”. In: Proc.of the 2015 International Workshop on Secure Internet of Things (SIoT).2015, pp. 49–57.
[vBS01] J. van Gurp, J. Bosch, and M. Svahnberg. “On the notion of variabilityin software product lines”. In: Proc. of the Working IEEE/IFIP Confer-ence on Software Architecture. 2001, pp. 45–54.
244 Bibliography
[Ver+12a] Tim Verbelen, Pieter Simoens, Filip De Turck, and Bart Dhoedt.“Cloudlets: Bringing the Cloud to the Mobile User”. In: Proc. of the3rd ACM Workshop on Mobile Cloud Computing and Services (MCS).2012, pp. 29–36.
[Ver+12b] Tim Verbelen, Pieter Simoens, Filip De Turck, and Bart Dhoedt. “AIO-LOS: Middleware for improving mobile application performancethrough cyber foraging”. In: Journal of Systems and Software 85.11(2012), pp. 2629–2639.
[Vii+18] M. Viitanen, J. Vanne, T. D. Hämäläinen, and A. Kulmala. “Low La-tency Edge Rendering Scheme for Interactive 360 Degree Virtual Re-ality Gaming”. In: Proc. of the 2018 IEEE 38th International Conferenceon Distributed Computing Systems (ICDCS). 2018, pp. 1557–1560.
[Vil+15a] M. Villamizar, O. Garcés, H. Castro, M. Verano, L. Salamanca, R.Casallas, and S. Gil. “Evaluating the monolithic and the microservicearchitecture pattern to deploy web applications in the cloud”. In:Proc.of the 2015 10th Computing Colombian Conference (10CCC).2015, pp. 583–590.
[Vil+15b] Felix Jesús Villanueva, David Villa, Maria J. Santofimia, Jesús Barba,and Juan Carlos López. “Crowdsensing smart city parking monitor-ing”. In: Proc. of the 2nd IEEE World Forum on Internet of Things (WF-IoT). 2015, pp. 751–756.
[Vil+16a] M. Villamizar, O. Garcés, L. Ochoa, H. Castro, L. Salamanca, M. Ver-ano, R. Casallas, S. Gil, C. Valencia, A. Zambrano, and M. Lang. “Infra-structure Cost Comparison of Running Web Applications in the CloudUsing AWS Lambda and Monolithic and Microservice Architectures”.In: Proc. of the 2016 16th IEEE/ACM International Symposium on Clus-ter, Cloud and Grid Computing (CCGrid). 2016, pp. 179–182.
[Vil+16b] Massimo Villari, Maria Fazio, Schahram Dustdar, Omer F. Rana, andRajiv Ranjan. “Osmotic Computing: A New Paradigm for Edge/CloudIntegration”. In: IEEE Cloud Computing 3.6 (2016), pp. 76–83.
[VP03] Athena Vakali and George Pallis. “Content Delivery Networks: Statusand Trends”. In: IEEE Internet Computing 7.6 (2003), pp. 68–74.
[VR14] Luis M. Vaquero and Luis Rodero-Merino. “Finding Your Way in theFog: Towards a Comprehensive Definition of Fog Computing”. In: SIG-COMM Computer Communication Review 44.5 (2014), pp. 27–32.
[Vul+15] Ashish Vulimiri, Carlo Curino, P. Brighten Godfrey, Thomas Jungblut,Jitu Padhye, and George Varghese. “Global Analytics in the Face ofBandwidth and Regulatory Constraints”. In: Proc. of the 12th USENIXSymposium on Networked Systems Design and Implementation (NSDI).2015, pp. 323–336.
[Wag19] Martin Wagner. “A Microservice-Based Offloading Architecture forEdge Computing”. Master’s Thesis. Technische Universität Darmstadt,Department of Computer Science, 2019.

Bibliography 245
[Wan+12] Zhaoran Wang, Yu Zhang, Xiaotao Chang, Xiang Mi, Yu Wang, KunWang, and Huazhong Yang. “Pub/Sub on stream: a multi-core basedmessage broker with QoS support”. In: Proc. of the 6th ACM Interna-tional Conference on Distributed Event-Based Systems (DEBS). 2012,pp. 127–138.
[Wan+15] Lin Wang, Antonio Fernández Anta, Fa Zhang, Jie Wu, and ZhiyongLiu. “Multi-resource energy-efficient routing in cloud data centerswith network-as-a-service”. In: Proc. of the 2015 IEEE Symposium onComputers and Communication (ISCC). 2015, pp. 694–699.
[Wan+16] C. Wang, Y. Li, D. Jin, and S. Chen. “On the Serviceability of Mo-bile Vehicular Cloudlets in a Large-Scale Urban Environment”. In:IEEE Transactions on Intelligent Transportation Systems 17.10 (2016),pp. 2960–2970.
[Wan+17] Qixu Wang, Dajiang Chen, Ning Zhang, Zhe Ding, and Zhiguang Qin.“PCP: A Privacy-Preserving Content-Based Publish-Subscribe SchemeWith Differential Privacy in Fog Computing”. In: IEEE Access 5 (2017),pp. 17962–17974.
[Wan+18a] Jiafu Wan, Baotong Chen, Shiyong Wang, Min Xia, Di Li, andChengliang Liu. “Fog computing for energy-aware load balancingand scheduling in smart factory”. In: Transactions on Industrial Infor-matics 14.10 (2018), pp. 4548–4556.
[Wan+18b] J. Wang, Z. Feng, Z. Chen, S. George, M. Bala, P. Pillai, S. Yang,and M. Satyanarayanan. “Bandwidth-Efficient Live Video Analyticsfor Drones Via Edge Computing”. In: Proc. of the 2018 IEEE/ACMSymposium on Edge Computing (SEC). 2018, pp. 159–173.
[Wan+18c] Liang Wang, Mengyuan Li, Yinqian Zhang, Thomas Ristenpart, andMichael M. Swift. “Peeking Behind the Curtains of Serverless Plat-forms”. In: Proc. of the 2018 USENIX Annual Technical Conference(ATC). 2018, pp. 133–146.
[Wan+19] Lin Wang, Lei Jiao, Jun Li, Julien Gedeon, and Max Mühlhäuser.“MOERA: Mobility-agnostic Online Resource Allocation for EdgeComputing”. In: IEEE Transactions on Mobile Computing 18.8 (2019),pp. 1843–1856.
[Wan06] Roy Want. “An Introduction to RFID Technology”. In: IEEE PervasiveComputing 5.1 (2006), pp. 25–33.
[Wan11] Bang Wang. “Coverage Problems in Sensor Networks: A Survey”. In:ACM Computing Surveys 43.4 (2011), 32:1–32:53.
[WD10] Shaoxuan Wang and Sujit Dey. “Rendering Adaptation to AddressCommunication and Computation Constraints in Cloud Mobile Gam-ing”. In: Proc. of the Global Communications Conference (GLOBECOM).2010, pp. 1–6.
[Wec+18] Markus Weckesser, Roland Kluge, Martin Pfannemüller, MichaelMatthé, Andy Schürr, and Christian Becker. “Optimal reconfigurationof dynamic software product lines based on performance-influencemodels”. In: Proc. of the 22nd International Systems and SoftwareProduct Line Conference (SPLC). 2018, pp. 98–109.
246 Bibliography
[Wen+18] Zhenyu Wen, Do Le Quoc, Pramod Bhatotia, Ruichuan Chen, andMyungjin Lee. “ApproxIoT: Approximate Analytics for Edge Comput-ing”. In: Proc. of the 38th IEEE International Conference on DistributedComputing Systems (ICDCS). 2018, pp. 411–421.
[Wol+17] Sjaak Wolfert, Lan Ge, Cor Verdouw, and Marc-Jeroen Bogaardt. “BigData in Smart Farming – A review”. In: Agricultural Systems 153(2017), pp. 69–80.
[Wu+13] Hsin-Kai Wu, Silvia Wen-Yu Lee, Hsin-Yi Chang, and Jyh-ChongLiang. “Current status, opportunities and challenges of augmentedreality in education”. In: Computers & Education 62 (2013), pp. 41–49.
[Wu+17a] Dazhong Wu, Shaopeng Liu, Li Zhang, Janis Terpenny, Robert X. Gao,Thomas Kurfess, and Judith A. Guzzo. “A fog computing-based frame-work for process monitoring and prognosis in cyber-manufacturing”.In: Journal of Manufacturing Systems 43 (2017), pp. 25–34.
[Wu+17b] Song Wu, Chao Niu, Jia Rao, Hai Jin, and Xiaohai Dai. “Container-Based Cloud Platform for Mobile Computation Offloading”. In: Proc.of the 2017 IEEE International Parallel and Distributed Processing Sym-posium (IPDPS). 2017, pp. 123–132.
[Wu+18] Song Wu, Chao Mei, Hai Jin, and Duoqiang Wang. “Android Uniker-nel: Gearing mobile code offloading towards edge computing”. In:Future Generation Computer Systems 86 (2018), pp. 694–703.
[WUS15] Y. Wang, T. Uehara, and R. Sasaki. “Fog Computing: Issues and Chal-lenges in Security and Forensics”. In: Proc. of the 2015 IEEE 39th An-nual Computer Software and Applications Conference. 2015, pp. 53–59.
[XGR18] Zhuangdi Xu, Harshit Gupta, and Umakishore Ramachandran.“STTR: A System for Tracking All Vehicles All the Time At the Edge ofthe Network”. In: Proc. of the 12th ACM International Conference onDistributed and Event-based Systems. DEBS ’18. 2018, pp. 124–135.
[Xio+18] Ying Xiong, Yulin Sun, Li Xing, and Ying Huang. “Extend Cloud toEdge with KubeEdge”. In: Proc. of the IEEE/ACM Symposium on EdgeComputing (SEC). 2018, pp. 373–377.
[XK17] Yong Xiao and Marwan Krunz. “QoE and power efficiency tradeofffor fog computing networks with fog node cooperation”. In: Proc. ofthe IEEE Conference on Computer Communications (INFOCOM). 2017,pp. 1–9.
[XMK16] Qiang Xu, Todd Mytkowicz, and Nam Sung Kim. “Approximate Com-puting: A Survey”. In: IEEE Design & Test 33.1 (2016), pp. 8–22.
[Xu+14] Song Xu, Manuela Pérez, Kun Yang, Cyril Perrenot, Jacques Fel-blinger, and Jacques Hubert. “Determination of the latency effects onsurgical performance and the acceptable latency levels in telesurgeryusing the dV-Trainer® simulator”. In: Surgical endoscopy 28.9 (2014),pp. 2569–2576.

Bibliography 247
[Xu+15] Z. Xu, W. Liang, W. Xu, M. Jia, and S. Guo. “Capacitated cloudletplacements in Wireless Metropolitan Area Networks”. In: Proc. ofthe 40th IEEE Conference on Local Computer Networks (LCN). 2015,pp. 570–578.
[Xu+16] Zichuan Xu, Weifa Liang, Wenzheng Xu, Mike Jia, and Song Guo.“Efficient Algorithms for Capacitated Cloudlet Placements”. In:IEEE Transactions on Parallel and Distributed Systems 27.10 (2016),pp. 2866–2880.
[Yan+10] Zhi Yang, Ben Y. Zhao, Yuanjian Xing, Song Ding, Feng Xiao, and YafeiDai. “AmazingStore: available, low-cost online storage service usingcloudlets”. In: Proc. of the 9th international conference on Peer-to-peersystems (IPTPS). 2010, pp. 1–5.
[Yan+16] G. Yang, Q. Sun, A. Zhou, S. Wang, and J. Li. “Poster Abstract: AccessPoint Ranking for Cloudlet Placement in Edge Computing Environ-ment”. In: Proc. of the 2016 IEEE/ACM Symposium on Edge Computing(SEC). 2016, pp. 85–86.
[Yao+17] Hong Yao, Changmin Bai, Muzhou Xiong, Deze Zeng, and ZhangjieFu. “Heterogeneous cloudlet deployment and user-cloudlet associa-tion toward cost effective fog computing”. In: Concurrency and Com-putation: Practice and Experience 29.16 (2017), pp. 1–9.
[Ye+13] Rong Ye, Ting Wang, Feng Yuan, Rakesh Kumar, and Qiang Xu. “Onreconfiguration-oriented approximate adder design and its applica-tion”. In: Proc. of the IEEE/ACM International Conference on Computer-Aided Design (ICCAD). 2013, pp. 48–54.
[Yi+15] Shanhe Yi, Zijiang Hao, Zhengrui Qin, and Qun Li. “Fog Computing:Platform and Applications”. In: Proc. of the Third IEEE Workshop onHot Topics in Web Systems and Technologies (HotWeb 2015). 2015,pp. 73–78.
[Yi+17] S. Yi, Z. Hao, Q. Zhang, Q. Zhang, W. Shi, and Q. Li. “LAVEA: Latency-Aware Video Analytics on Edge Computing Platform”. In: Proc. of the2017 IEEE 37th International Conference on Distributed ComputingSystems (ICDCS). 2017, pp. 2573–2574.
[Yin+17] Hao Yin, Xu Zhang, Hongqiang Harry Liu, Yan Luo, Chen Tian,Shuoyao Zhao, and Feng Li. “Edge Provisioning with Flexible ServerPlacement”. In: IEEE Transactions on Parallel and Distributed Systems28.4 (2017), pp. 1031–1045.
[YLL15] Shanhe Yi, Cheng Li, and Qun Li. “A Survey of Fog Computing: Con-cepts, Applications and Issues”. In: Proc. of the 2015 Workshop onMobile Big Data (Mobidata). 2015, pp. 37–42.
[YLN03] Jungkeun Yoon, Mingyan Liu, and Brian Noble. “Sound Mobility Mod-els”. In: Proc. of the 9th Annual International Conference on MobileComputing and Networking (MOBICOM). Ed. by David B. Johnson,Anthony D. Joseph, and Nitin H. Vaidya. 2003, pp. 205–216.
[You+17] C. You, K. Huang, H. Chae, and B. Kim. “Energy-Efficient ResourceAllocation for Mobile-Edge Computation Offloading”. In: IEEE Trans-actions on Wireless Communications 16.3 (2017), pp. 1397–1411.

248 Bibliography
[You+19] Ashkan Yousefpour, Caleb Fung, Tam Nguyen, Krishna Kadiyala, Fate-meh Jalali, Amirreza Niakanlahiji, Jian Kong, and Jason P. Jue. “AllOne Needs to Know about Fog Computing and Related Edge Comput-ing Paradigms: A Complete Survey”. In: Journal of Systems Architec-ture 98 (2019), pp. 289–330.
[YQL15] Shanhe Yi, Zhengrui Qin, and Qun Li. “Security and Privacy Issues ofFog Computing: A Survey”. In: Proc. of the 10th International Confer-ence on Wireless Algorithms, Systems, and Applications (WASA). 2015,pp. 685–695.
[Yu+18] W. Yu, F. Liang, X. He, W. G. Hatcher, C. Lu, J. Lin, and X. Yang. “ASurvey on the Edge Computing for the Internet of Things”. In: IEEEAccess 6 (2018), pp. 6900–6919.
[Yua+18] Q. Yuan, H. Zhou, J. Li, Z. Liu, F. Yang, and X. S. Shen. “Toward Effi-cient Content Delivery for Automated Driving Services: An Edge Com-puting Solution”. In: IEEE Network 32.1 (2018), pp. 80–86.
[ZA08] Qian Zhu and Gagan Agrawal. “Resource Allocation for DistributedStreaming Applications”. In: Proc. of the 2008 International Confer-ence on Parallel Processing (ICPP). 2008, pp. 414–421.
[Zam+17] Ali Reza Zamani, Ioan Petri, Javier Diaz Montes, Omer F. Rana, andManish Parashar. “Edge-Supported Approximate Analysis for LongRunning Computations”. In: Proc. of the 5th IEEE International Confer-ence on Future Internet of Things and Cloud (FiCloud). 2017, pp. 321–328.
[Zan+14] Andrea Zanella, Nicola Bui, Angelo Paolo Castellani, Lorenzo Vange-lista, and Michele Zorzi. “Internet of Things for Smart Cities”. In: IEEEInternet of Things Journal 1.1 (2014), pp. 22–32.
[Zao+14] John K. Zao, Tchin Tze Gan, Chun Kai You, Sergio Jose RodriguezMendez, Cheng En Chung, Yu-Te Wang, Tim R. Mullen, and Tzyy-PingJung. “Augmented Brain Computer Interaction Based on Fog Comput-ing and Linked Data”. In: Proc. of the 2014 International Conferenceon Intelligent Environments. 2014, pp. 374–377.
[Zen+18] M. Zeng, Y. Li, K. Zhang, M. Waqas, and D. Jin. “Incentive MechanismDesign for Computation Offloading in Heterogeneous Fog Comput-ing: A Contract-Based Approach”. In: Proc. of the 2018 IEEE Interna-tional Conference on Communications (ICC). 2018, pp. 1–6.
[Zey+16] Engin Zeydan, Ejder Bastug, Mehdi Bennis, Manhal Abdel Kader,Ilyas Alper Karatepe, Ahmet Salih Er, and Mérouane Debbah. “Bigdata caching for networking: moving from cloud to edge”. In: IEEECommunications Magazine 54.9 (2016), pp. 36–42.
[Zha+14] Qian Zhang, Feng Yuan, Rong Ye, and Qiang Xu. “ApproxIt: An Ap-proximate Computing Framework for Iterative Methods”. In: Proc.of the 51st Annual Design Automation Conference 2014 (DAC). 2014,97:1–97:6.
Bibliography 249
[Zha+15a] Feixiong Zhang, Chenren Xu, Yanyong Zhang, K. K. Ramakrishnan,Shreyasee Mukherjee, Roy D. Yates, and Thu D. Nguyen. “EdgeBuffer:Caching and prefetching content at the edge in the MobilityFirst fu-ture Internet architecture”. In: Proc. of the 16th IEEE InternationalSymposium on A World of Wireless, Mobile and Multimedia Networks(WoWMoM). 2015, pp. 1–9.
[Zha+15b] Qian Zhang, Ting Wang, Ye Tian, Feng Yuan, and Qiang Xu. “Approx-ANN: an approximate computing framework for artificial neural net-work”. In: Proc. of the 2015 Design, Automation & Test in Europe Con-ference & Exhibition (DATE). 2015, pp. 701–706.
[Zha+17] Wuyang Zhang, Jiachen Chen, Yanyong Zhang, and Dipankar Ray-chaudhuri. “Towards efficient edge cloud augmentation for virtualreality MMOGs”. In: Proc. of the Second ACM/IEEE Symposium on EdgeComputing (SEC). 2017, 8:1–8:14.
[Zha+18a] Ben Zhang, Xin Jin, Sylvia Ratnasamy, John Wawrzynek, and EdwardA. Lee. “AWStream: adaptive wide-area streaming analytics”. In: Proc.of the 2018 Conference of the ACM Special Interest Group on Data Com-munication (SIGCOMM). 2018, pp. 236–252.
[Zha+18b] D. Zhang, Y. Ma, Y. Zhang, S. Lin, X. S. Hu, and D. Wang. “A Real-Timeand Non-Cooperative Task Allocation Framework for Social SensingApplications in Edge Computing Systems”. In: Proc. of the 2018 IEEEReal-Time and Embedded Technology and Applications Symposium(RTAS). 2018, pp. 316–326.
[Zha+18c] J. Zhang, B. Chen, Y. Zhao, X. Cheng, and F. Hu. “Data Security andPrivacy-Preserving in Edge Computing Paradigm: Survey and OpenIssues”. In: IEEE Access 6 (2018), pp. 18209–18237.
[Zha+18d] J. Zhang, X. Hu, Z. Ning, E.C.H. -. Ngai, L. Zhou, J. Wei, J. Cheng, andB. Hu. “Energy-Latency Tradeoff for Energy-Aware Offloading in Mo-bile Edge Computing Networks”. In: IEEE Internet of Things Journal5.4 (2018), pp. 2633–2645.
[Zha+18e] Lei Zhao, Wen Sun, Yongpeng Shi, and Jiajia Liu. “Optimal Placementof Cloudlets for Access Delay Minimization in SDN-Based Internetof Things Networks”. In: IEEE Internet of Things Journal 5.2 (2018),pp. 1334–1344.
[Zhe+11] Yu Zheng, Yanchi Liu, Jing Yuan, and Xing Xie. “Urban Computingwith Taxicabs”. In: Proc. of the 13th International Conference on Ubiq-uitous Computing. UbiComp ’11. 2011, pp. 89–98.
[Zhe+14a] Yu Zheng, Licia Capra, Ouri Wolfson, and Hai Yang. “Urban Comput-ing: Concepts, Methodologies, and Applications”. In: ACM Transac-tions on Intelligent Systems and Technology 5.3 (2014), 38:1–38:55.
[Zhe+14b] Yu Zheng, Tong Liu, Yilun Wang, Yanmin Zhu, Yanchi Liu, and EricChang. “Diagnosing New York City’s Noises with Ubiquitous Data”.In: Proc. of the 2014 ACM International Joint Conference on Pervasiveand Ubiquitous Computing. UbiComp ’14. 2014, pp. 715–725.

250 Bibliography
[Zho+15] S. Zhou, K. Lin, J. Na, C. Chuang, and C. Shih. “Supporting ServiceAdaptation in Fault Tolerant Internet of Things”. In: Proc. of the 2015IEEE 8th International Conference on Service-Oriented Computing andApplications (SOCA). 2015, pp. 65–72.
[Zho+17] B. Zhou, A. V. Dastjerdi, R. N. Calheiros, S. N. Srirama, and R. Buyya.“mCloud: A Context-Aware Offloading Framework for Heteroge-neous Mobile Cloud”. In: IEEE Transactions on Services Computing10.5 (2017), pp. 797–810.
[Zhu+13] J. Zhu, D. S. Chan, M. S. Prabhu, P. Natarajan, H. Hu, and F. Bonomi.“Improving Web Sites Performance Using Edge Servers in Fog Com-puting Architecture”. In: Proc. of the 2013 IEEE 7th International Sym-posium on Service-Oriented System Engineering. 2013, pp. 320–323.
[Zhu+15] Wen-Yuan Zhu, Wen-Chih Peng, Ling-Jyh Chen, Kai Zheng, and Xi-aofang Zhou. “Modeling User Mobility for Location Promotion inLocation-based Social Networks”. In: Proc. of the 21th ACM SIGKDDInternational Conference on Knowledge Discovery and Data Mining(KDD). 2015, pp. 1573–1582.
[ZLH13] Yu Zheng, Furui Liu, and Hsun-Ping Hsieh. “U-Air: When Urban AirQuality Inference Meets Big Data”. In: Proc. of the 19th ACM SIGKDDInternational Conference on Knowledge Discovery and Data Mining.KDD ’13. 2013, pp. 1436–1444.
[ZMN05] F. Zhu, M. W. Mutka, and L. M. Ni. “Service discovery in pervasivecomputing environments”. In: IEEE Pervasive Computing 4.4 (2005),pp. 81–90.
Appendices
251

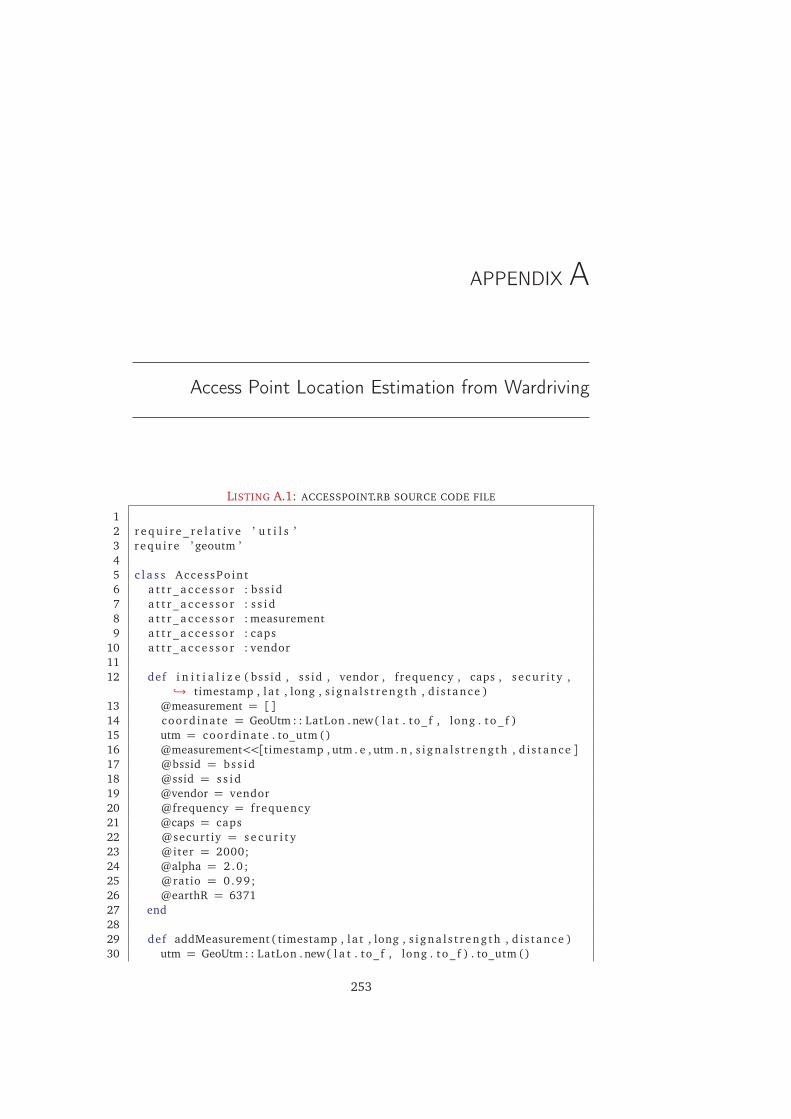
APPENDIX A
Access Point Location Estimation from Wardriving
LISTING A.1: ACCESSPOINT.RB SOURCE CODE FILE
12 r e q u i r e _ r e l a t i v e ’ u t i l s ’3 r equ i r e ’ geoutm ’45 c l a s s AccessPo in t6 a t t r _ a c c e s s o r : b s s id7 a t t r _ a c c e s s o r : s s i d8 a t t r _ a c c e s s o r : measurement9 a t t r _ a c c e s s o r : caps
10 a t t r _ a c c e s s o r : vendor1112 def i n i t i a l i z e ( bss id , s s id , vendor , frequency , caps , s e c u r i t y ,
�→ timestamp , l a t , long , s i g n a l s t r e n g t h , d i s t ance )13 @measurement = []14 coord inate = GeoUtm : : LatLon . new( l a t . to_f , long . t o _ f )15 utm = coord inate . to_utm ()16 @measurement<<[timestamp , utm . e , utm . n , s i g n a l s t r e n g t h , d i s t ance ]17 @bssid = bs s id18 @ssid = s s i d19 @vendor = vendor20 @frequency = f requency21 @caps = caps22 @securt iy = s e c u r i t y23 @iter = 2000;24 @alpha = 2 .0 ;25 @ratio = 0.99;26 @earthR = 637127 end2829 def addMeasurement ( timestamp , l a t , long , s i g n a l s t r e n g t h , d i s t ance )30 utm = GeoUtm : : LatLon . new( l a t . to_f , long . t o _ f ) . to_utm ()
253

254 Appendix A. Access Point Location Estimation from Wardriving
31 @measurement<<[timestamp , utm . e , utm . n , s i g n a l s t r e n g t h , d i s t ance ]32 end3334 def d i s t ( x_1 , x_2 , y_1 , y_2 )35 re turn Math . s q r t ( ( x_1 . t o _ f − x_2 . t o _ f )∗∗2 + ( y_1 . t o _ f − y_2 .
�→ t o _ f )∗∗2 )36 end3738 def e s t i m a t e P o s i t i o n39 numOfMeasurementPoints = @measurement . s i z e40 i f numOfMeasurementPoints < 341 re turn f a l s e42 end43 l a t s = []44 longs = []45 @measurement . each do |mm|46 gps = GeoUtm : :UTM. new( ’ 32U ’ , mm[1 ] , mm[2 ] , e l l i p s o i d =
�→ GeoUtm : : E l l i p s o i d : :WGS84)47 l a t l o n g = gps . t o _ l a t _ l o n48 l a t s << l a t l o n g . l a t . t o _ f49 longs << l a t l o n g . lon . t o _ f50 end51 avg la t = l a t s . i n j e c t {|sum , l a t | sum + l a t } / l a t s . s i z e52 avglong = longs . i n j e c t {|sum , long | sum + long } / longs . s i z e5354 newmm = []55 @measurement . each do |mm|56 gps = GeoUtm : :UTM. new( ’ 32U ’ , mm[1 ] , mm[2 ] , e l l i p s o i d =
�→ GeoUtm : : E l l i p s o i d : :WGS84)57 l a t l o n g = gps . t o _ l a t _ l o n58 l a t = l a t l o n g . l a t59 long = l a t l o n g . lon60 i f d i s t ance ( l a t , long , avg la t , avglong ) > 1061 newmm << mm62 end63 end6465 @measurement = newmm66 numOfMeasurementPoints = @measurement . s i z e67 re turn n i l i f numOfMeasurementPoints == 06869 de l t a = [0 .0 ,0 .0 ]70 alpha = @alpha71 utm_star t = GeoUtm : :UTM. new( ’ 32U ’ ,@measurement [0 ] [1 ] ,
�→ @measurement [0 ] [2 ] )72 re s = [0 .0 ,0 .0 ]73 f o r i t e r in 0 . . @iter74 de l t a = [0 .0 ,0 .0 ]75 @measurement . each do |mm|76 d = d i s t ( re s [0 ] ,mm[1 ] . to_ f , r e s [1 ] ,mm[2 ] . t o _ f )77 d i f f = [ ( (mm[1 ] . to_ f−r e s [0 ]) ∗78 ( alpha ∗ (d−mm[4 ] . t o _ f ) / [mm[4 ] . to_ f , d ] . max) ) ,79 ((mm[2 ] . to_ f−r e s [1 ]) ∗80 ( alpha ∗ (d−mm[4 ] . t o _ f ) / [mm[4 ] . to_ f , d ] . max) ) ]
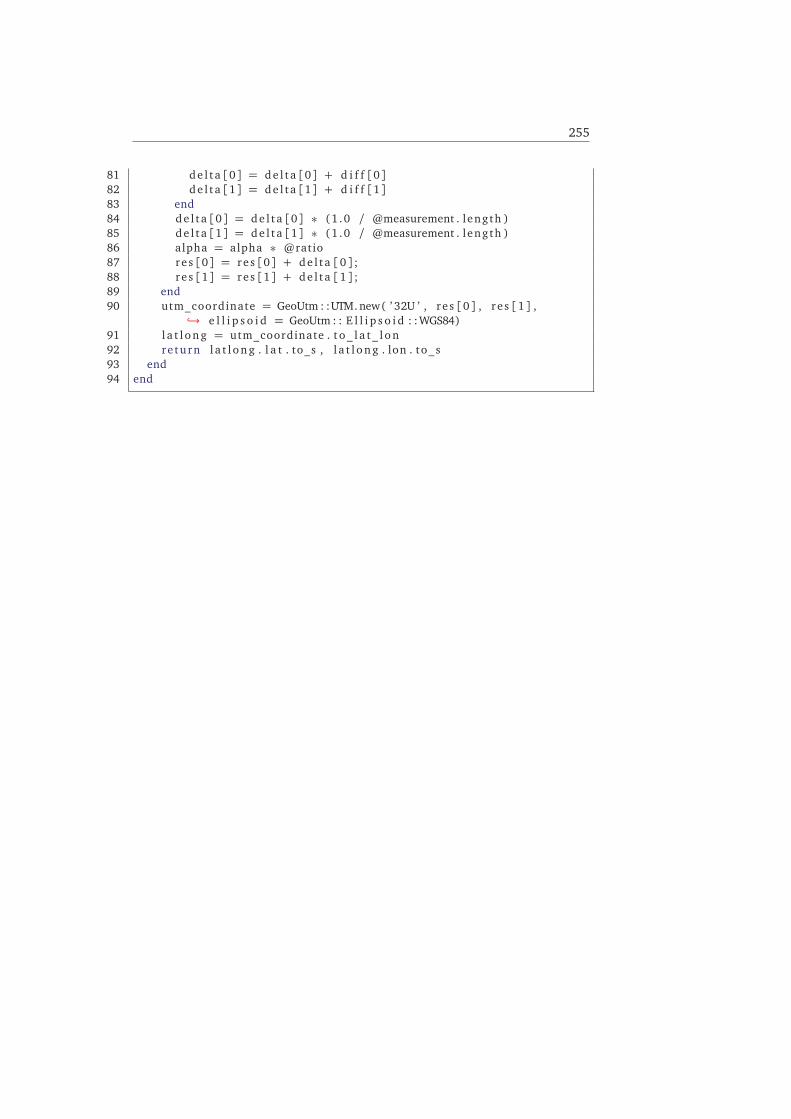
255
81 de l t a [0] = de l t a [0] + d i f f [0]82 de l t a [1] = de l t a [1] + d i f f [1]83 end84 de l t a [0] = de l t a [0] ∗ (1 .0 / @measurement . length )85 de l t a [1] = de l t a [1] ∗ (1 .0 / @measurement . length )86 alpha = alpha ∗ @ratio87 re s [0] = r e s [0] + de l t a [0 ] ;88 re s [1] = r e s [1] + de l t a [1 ] ;89 end90 utm_coordinate = GeoUtm : :UTM. new( ’ 32U ’ , r e s [0 ] , r e s [1 ] ,
�→ e l l i p s o i d = GeoUtm : : E l l i p s o i d : :WGS84)91 l a t l o n g = utm_coordinate . t o _ l a t _ l o n92 re turn l a t l o n g . l a t . to_s , l a t l o n g . lon . to_s93 end94 end


APPENDIX B
TOSCA Extension for the Description of Microservices1
##################################################################
# The content of this file reflects TOSCA microservices Profile in
# YAML version 1.0.0. It describes the definition for TOSCA
# microservice types including Node Type, Relationship Type,
# Capability Type and Interfaces.
##################################################################
t o s c a _ d e f i n i t i o n s _ v e r s i o n :t o s ca_ s imp le_p ro f i l e _ fo r_mi c ro se r v i c e s_1_0_0
##################################################################
# Node Type.
# A Node Type is a reusable entity that defines the type of one or
# more Node Templates.
##################################################################
node_types:to sca . nodes . m i c ro se rv i c e s :
derived_from: tosca . nodes . Rootd e s c r i p t i o n : Base type fo r mic ro se rv i ce d e f i n i t i o n s .p r o p e r t i e s :
id :type: s t r i n gd e s c r i p t i o n : ID of t h i s mic ro se rv i ce
name:type: s t r i n gd e s c r i p t i o n : Name of t h i s mic ro se rv i ce
mem_requirement:d e s c r i p t i o n : Required memory in MB fo r t h i s mic ro se rv i ce .type: i n t e g e r
input s :
1Contribution statement: I led the idea generation and design of the flexEdge framework. Theframework itself was implemented by Martin Wagner as part of this Master thesis [Wag19]. The TOSCAextension shown here is taken from this implementation.
257
258 Appendix B. TOSCA Extension for the Description of Microservices
d e s c r i p t i o n : a l i s t of inpu t s t h i s mic rose rv i ce accep t stype: to sca . data types . m i c ro se rv i c e_ inpu t srequ i red: f a l se
outputs :d e s c r i p t i o n : a l i s t of outputs t h i s mic rose rv i ce accep t stype: to sca . data types . mic rose rv i ce_outpu t srequ i red: f a l se
category :d e s c r i p t i o n : the category path to which t h i s mic ro se rv i ce
belongs totype: s t r i n grequ i red: true
a l i v e_ t ime :d e s c r i p t i o n : the time in seconds a f t e r which t h i s
mic ro se rv i ce w i l l be stoppedtype: i n t e g e rrequ i red: f a l sed e f a u l t : 300
w a i t _ f o r _ s t a r t :d e s c r i p t i o n : de f ine s i f an agent should wait f o r a s t a r t
message sent by the mic ro se rv i cetype: booleanrequ i red: f a l sed e f a u l t : f a l se
mul t ip le_user_suppor t :d e s c r i p t i o n : de f ine s i f the mic ro se rv i ce suppor ts mu l t ip l e
user stype: booleanrequ i red: f a l sed e f a u l t : f a l se
to sca . nodes . m i c ro se rv i c e s . docker_conta iner :derived_from: tosca . nodes . m i c ro se r v i c e sd e s c r i p t i o n : Base type fo r docker con ta ine r mic rose rv i ce
d e f i n i t i o n s .p r o p e r t i e s :
bridge_network:d e s c r i p t i o n : Name of the user−def ined br idge network , to
which t h i s mic ro se rv i ce should connecttype: s t r i n grequ i red: f a l se
con ta ine r_por t :d e s c r i p t i o n : Por t of the conta iner / a p p l i c a t i o ntype: to sca . data types . network . PortDefrequ i red: f a l se
con ta ine r_po r t s :d e s c r i p t i o n : L i s t of por t s of the conta ine r / a p p l i c a t i o ntype: to sca . data types . m i c r o s e r v i c e _ p o r t _ l i s trequ i red: f a l se
hos t_por t :d e s c r i p t i o n : Por t which w i l l be exposed on the host , a
random port w i l l get exposed i f i t i s not def inedtype: to sca . data types . network . PortDefrequ i red: f a l se

259
hos t_por t s :d e s c r i p t i o n : L i s t of por t s which w i l l be exposed on the
host , random por t s w i l l get exposed i f i t i s notdef ined
type: to sca . data types . m i c r o s e r v i c e _ p o r t _ l i s trequ i red: f a l se
d i r e c t o r y :d e s c r i p t i o n : Name of the d i r e c to ry , in which the d o c k e r f i l e
i s loca tedtype: s t r i n grequ i red: true
to sca . nodes . m i c ro se rv i c e s . un ikerne l :derived_from: tosca . nodes . m i c ro se r v i c e sd e s c r i p t i o n : Base type fo r un ike rne l mic rose rv i ce d e f i n i t i o n s .
##################################################################
# Relationship Type.
# A Relationship Type is a reusable entity that defines the type
of
# one or more relationships between Node Types or Node Templates.
##################################################################
r e l a t i o n s h i p _ t y p e s :to sca . r e l a t i o n s h i p s . docker_bridge_network:
derived_from: tosca . r e l a t i o n s h i p s . Rootd e s c r i p t i o n : Re la t i onsh ip to s e t up a docker user−def ined
br idge networkp r o p e r t i e s :
name:type: s t r i n gd e s c r i p t i o n : Name of t h i s br idge network
##################################################################
# Data Type.
# A Datatype is a complex data type declaration which contains
# other complex or simple data types.
##################################################################
data_types :to sca . data types . m i c ro se r v i c e_ i o :
derived_from: tosca . data types . Roottype: s t r i n gd e s c r i p t i o n : a datatype fo r de f in ing the type of an input or
outputc o n s t r a i n t s :
- v a l i d _ v a l u e s : [ number , in teger , f l o a t , s t r i ng , t e x t _ f i l e ,image , l i s t ]
to sca . data types . m i c ro se rv i c e_ inpu t s :derived_from: tosca . data types . Roottype: l i s td e s c r i p t i o n : a l i s t of cons t ra ined s t r i n g s to de f ine the input s
of a mic ro se rv i ceentry_schema:
type: to sca . data types . m i c ro se r v i c e_ i o

260 Appendix B. TOSCA Extension for the Description of Microservices
tosca . data types . mic rose rv i ce_outpu t s :derived_from: tosca . data types . Roottype: l i s td e s c r i p t i o n : a l i s t of cons t ra ined s t r i n g s to de f ine the
outputs of a mic ro se rv i ceentry_schema:
type: to sca . data types . m i c ro se r v i c e_ i o
to s ca . data types . m ic ro se rv i ce_por t :derived_from: tosca . data types . Rootd e s c r i p t i o n : d e s c r i p t i o n fo r a port , c o n s i s t i n g of the port
number , protoco l , and a d e s c r i p t i o n s t r i n gp r o p e r t i e s :
por t :type: to sca . data types . network . PortDefrequ i red: true
pro toco l :type: s t r i n grequ i red: trued e f a u l t : tcpc o n s t r a i n t s :
- v a l i d _ v a l u e s : [ tcp , udp ]d e s c r i p t i o n :
type: s t r i n grequ i red: f a l se
to sca . data types . m i c r o s e r v i c e _ p o r t _ l i s t :derived_from: tosca . data types . Rootd e s c r i p t i o n : a l i s t of por t d e s c r i p t i o n s to de f ine mul t ip l e
por t stype: l i s tentry_schema:
type: to s ca . data types . m i c ro se rv i c e_por t
##################################################################
# Group Type.
# Group Type represents logical grouping of TOSCA nodes that have
# an implied membership relationship and may need to be
# orchestrated or managed together to achieve some result.
##################################################################
group_types:to sca . groups . docker_bridge_network:
derived_from: tosca . groups . Rootd e s c r i p t i o n : Group type to s e t up a docker user−def ined br idge
networkp r o p e r t i e s :
name:type: s t r i n gd e s c r i p t i o n : Name of t h i s br idge network

APPENDIX C
TOSCA Extension for the Description of Service Chains1
##################################################################
# The content of this file reflects TOSCA microservices Profile in
# YAML version 1.0.0. It describes the definition for TOSCA
# microservice chain types including Node Type, Relationship Type,
# Capability Type and Interfaces.
##################################################################
t o s c a _ d e f i n i t i o n s _ v e r s i o n :to s ca_ s imp le_p ro f i l e _ fo r_mic ro se rv i c e_cha in s_1_0_0
##################################################################
# Node Type.
# A Node Type is a reusable entity that defines the type of one or
# more Node Templates.
##################################################################
node_types:tosca . nodes . cha ined_microserv i ce :
derived_from: tosca . nodes . Rootd e s c r i p t i o n : base type fo r chained mic ro se r v i c e sp r o p e r t i e s :
s t o r e _ i d :type: s t r i n gd e s c r i p t i o n : s t o r e ID of mic ro se rv i ce to use , has
higher p r i o r i t y than semantic d e s c r i p t i o nrequ i red: f a l se
semant i c_desc r ip t i on :type: to s ca . data types . s emant i c_desc r ip t i ond e s c r i p t i o n : semantic d e s c r i p t i o n of mic ro se rv i ce
to use , has lower p r i o r i t y than IDrequ i red: f a l se
1Contribution statement: I led the idea generation and design of the flexEdge framework. Theframework itself was implemented by Martin Wagner as part of this Master thesis [Wag19]. The TOSCAextension shown here is taken from this implementation.
261

262 Appendix C. TOSCA Extension for the Description of Service Chains
agent:type: s t r i n gd e s c r i p t i o n : address of agent to run the s e r v i c e onrequ i red: f a l se
f i r s t _ i n _ c h a i n :type: booleand e f a u l t : f a l serequ i red: trued e s c r i p t i o n : i s t h i s mic ro se rv i ce the f i r s t in the
chain ( ge t s the input from the c l i e n t )l a s t _ i n _ c h a i n :
type: booleand e f a u l t : f a l serequ i red: trued e s c r i p t i o n : i s t h i s mic ro se rv i ce the l a s t in the
chain ? ( re tu rn s the output fo r the c l i e n t )f o r c e _ r e b u i l d :
type: booleand e f a u l t : f a l serequ i red: f a l sed e s c r i p t i o n : should t h i s mic rose rv i ce con ta ine r be
b u i l t anew?p o l l i n g :
type: booleand e f a u l t : f a l serequ i red: f a l sed e s c r i p t i o n : does t h i s mic ro se rv i ce support p o l l i n g
f o r a c t i v i t y ?new_instance:
type: booleand e f a u l t : f a l serequ i red: f a l sed e s c r i p t i o n : should the c rea t i on of a new ins t ance
f o r t h i s mic ro se rv i ce be enforced ?a l i v e_ t ime :
type: i n t e g e rrequ i red: f a l sed e s c r i p t i o n : overwr i te the a l i v e time of the
mic ro se rv i ce i t s e l fc a p a b i l i t i e s :
output:type: to sca . c a p a b i l i t i e s . mic roserv i ce_outputva l i d_ sour ce_ type s : [ to sca . nodes .
cha ined_microserv i ce ]requirements:
- input :c a p a b i l i t y : to sca . c a p a b i l i t i e s . mic rose rv i ce_outputnode: to sca . nodes . cha ined_microserv i cer e l a t i o n s h i p : to sca . r e l a t i o n s h i p s . m i c ro se r v i c e s .
output_ inputoccurrences : [ 0 , UNBOUNDED ]
263
##################################################################
# Relationship Type.
# A Relationship Type is a reusable entity that defines the type
# of one or more relationships between Node Types or Node
# Templates.
##################################################################
r e l a t i o n s h i p _ t y p e s :to sca . r e l a t i o n s h i p s . m i c ro se rv i c e s . output_ input :
derived_from: tosca . r e l a t i o n s h i p s . Rootv a l i d _ t a r g e t _ t y p e s : [ to sca . c a p a b i l i t i e s .
mic roserv i ce_output ]
##################################################################
# Capability Type.
# A Capability Type is a reusable entity that describes a kind of
# capability that a Node Type can declare to expose.
##################################################################
c a p a b i l i t y _ t y p e s :to sca . c a p a b i l i t i e s . mic roserv i ce_output :
derived_from: tosca . c a p a b i l i t i e s . Root
##################################################################
# Data Type.
# A Datatype is a complex data type declaration which contains
# other complex or simple data types.
##################################################################
data_types :to sca . data types . m i c ro se r v i c e_ i o :
derived_from: tosca . data types . Roottype: s t r i n gd e s c r i p t i o n : a datatype fo r de f in ing the type of an input or
outputc o n s t r a i n t s :
- v a l i d _ v a l u e s : [ number , in teger , f l o a t , s t r i ng , t e x t _ f i l e, image , l i s t ]
to sca . data types . m i c ro se rv i c e_ inpu t s :derived_from: tosca . data types . Roottype: l i s td e s c r i p t i o n : a l i s t of cons t ra ined s t r i n g s to de f ine the
input s of a mic rose rv i ceentry_schema:
type: to sca . data types . m i c ro se r v i c e_ i o
tosca . data types . mic rose rv i ce_outpu t s :derived_from: tosca . data types . Roottype: l i s td e s c r i p t i o n : a l i s t of cons t ra ined s t r i n g s to de f ine the
outputs of a mic ro se rv i ceentry_schema:
type: to sca . data types . m i c ro se r v i c e_ i o
to s ca . data types . s emant i c_desc r ip t i on :derived_from: tosca . data types . Root

264 Appendix C. TOSCA Extension for the Description of Service Chains
d e s c r i p t i o n : semantic d e s c r i p t i o n fo r a mic ro se rv i ce fromthe s t o r e
p r o p e r t i e s :ca tegory :
type: s t r i n grequ i red: true
i nput s :type: to sca . data types . m i c ro se rv i c e_ inpu t srequ i red: f a l se
outputs :type: to sca . data types . mic rose rv i ce_outpu t srequ i red: f a l se
##################################################################
# Group Type.
# Group Type represents logical grouping of TOSCA nodes that have
# an implied membership relationship and may need to be
# orchestrated or managed together to achieve some result.
##################################################################
group_types:to sca . groups . docker_bridge_network:
derived_from: tosca . groups . Rootd e s c r i p t i o n : Group type to s e t up a docker user−def ined br idge
networkp r o p e r t i e s :
name:type: s t r i n gd e s c r i p t i o n : Name of t h i s br idge network
APPENDIX D
TOSCA Description of the Word Count Service Chain1
t o s c a _ d e f i n i t i o n s _ v e r s i o n :to s ca_ s imp le_p ro f i l e _ fo r_mic ro se rv i c e_cha in s_1_0_0
d e s c r i p t i o n : Desc r ip t i on of the mic ro se rv i ce chain used fo r theeva lua t ion .
topology_template:node_templates:
wordsp l i t :type: to sca . nodes . cha ined_microserv i cep r o p e r t i e s :
s t o r e _ i d : 5d1f4c1c53b89fd219f084c8f i r s t _ i n _ c h a i n : f a l sel a s t _ i n _ c h a i n : f a l sef o r c e _ r e b u i l d : f a l sep o l l i n g : f a l se
requirements:- input : echo1
wordcount:type: to sca . nodes . cha ined_microserv i cep r o p e r t i e s :
s t o r e _ i d : 5d1f4c2853b89fd219f084ccf i r s t _ i n _ c h a i n : f a l sel a s t _ i n _ c h a i n : f a l sef o r c e _ r e b u i l d : f a l sep o l l i n g : f a l se
requirements:- input : wordsp l i t
1Contribution statement: I led the idea generation and design of the flexEdge framework. Theframework itself was implemented by Martin Wagner as part of this Master thesis [Wag19]. The TOSCAdescription shown here is taken from this implementation.
265

266 Appendix D. TOSCA Description of the Word Count Service Chain
echo1:type: to sca . nodes . cha ined_microserv i cep r o p e r t i e s :
s t o r e _ i d : 5d1f4eac53b89fd219f084d6f i r s t _ i n _ c h a i n : truel a s t _ i n _ c h a i n : f a l se
echo2:type: to sca . nodes . cha ined_microserv i cep r o p e r t i e s :
s t o r e _ i d : 5d1f4eac53b89fd219f084d6f i r s t _ i n _ c h a i n : f a l sel a s t _ i n _ c h a i n : true
requirements:- input : wordcount

APPENDIX E
Detailed Execution Times of Microservices
This appendix provides the detailed execution times of the microservices, as evalu-ated in Section 7.6.2.a. Table E.1 lists the average (AVG), standard deviation (SD),minimum (MIN) and maximum (MAX) values for all evaluation conditions. Allvalues are given in milliseconds.
TABLE E.1: EXECUTION TIMES OF MICROSERVICES
Microservice
Object detection Face detection Word count
WiF
iM
S-St
ore
cold
star
t AVG 7578.1 1199.6 888.53
SD 164.61 52.34 47.72
MIN 7300 1116 841
MAX 8104 1350 1021
WiF
iM
S-St
ore
war
mst
art AVG 1371 387.47 134.43
SD 175.93 38.19 41.11
MIN 1208 310 34
MAX 2060 470 178
WiF
iO
ffloa
dco
ldst
art AVG 10657.2 1194.77 899.37
SD 255.05 48.38 67.59
MIN 10143 1107 837
MAX 11161 1295 1164
WiF
iO
ffloa
dw
arm
star
t AVG 6212.6 600.17 270.7
SD 315.67 70.76 110.83
MIN 5745 477 161
MAX 7146 719 460
267

268 Appendix E. Detailed Execution Times of Microservices
Microservice
Object detection Face detection Word count
Cel
luar
MS-
Stor
eco
ldst
art AVG 8438.5 2472.2 1049.3
SD 641.21 370.78 55.8
MIN 7565 1944 945
MAX 9957 3696 1211
Cel
luar
MS-
Stor
ew
arm
star
t AVG 2470.5 1429.13 208.13
SD 447.92 197.46 27.11
MIN 1942 1203 156
MAX 4016 2158 286
Cel
luar
Offl
oad
cold
star
t AVG 46475.23 2747.43 1038.5
SD 15628.61 777.2 67.7
MIN 27095 1690 874
MAX 84904 5077 1185
Cel
luar
Offl
oad
war
mst
art AVG 32192.97 1584.97 324.83
SD 10004.54 233.81 42.26
MIN 21776 1285 249
MAX 64972 2163 460

APPENDIX F
Pyomo ILP Model for Operator Placement
LISTING F.1: MODEL.PY SOURCE CODE FILE
1 from __future__ import d i v i s i o n2 from pyomo . environ import ∗3 from i t e r t o o l s import product45 def c rea te_abs t rac t_mode l ( ) :6 model = AbstractModel ()78 model .OPERATORS = Set ()9 model .NODES = Set ()
10 model .OPEDGES = Set ( with in=model .OPERATORS ∗ model .OPERATORS)11 model .NODEEDGES = Set ( with in=model .NODES ∗ model .NODES)1213 model . operator_workload = Param(model .OPERATORS, with in=
�→ NonNegat iveIntegers )14 model . node_capaci ty = Param(model .NODES, with in=
�→ NonNegat iveIntegers )15 model . opera to r_da ta ra te = Param(model . OPEDGES, with in=
�→ NonNegat iveIntegers )1617 model . p lacement_cost = Param(model .OPERATORS, model .NODES,
�→ within=NonNegativeReals )18 model . d = Param(model .NODES ∗ model .NODES, with in=
�→ NonNegat iveIntegers )19 model . b = Param(model .NODEEDGES, with in=NonNegat iveIntegers )2021 model . p innings = Set ( with in=model .OPERATORS ∗ model .NODES)22 model . p inn ing_opt ions = Set ( with in=model .OPERATORS ∗ model .
�→ NODES)23 model . ex c lu s i on s = Set ( with in=model .OPERATORS ∗ model .NODES)24 model . c o l o c a t i o n s = Set ( with in=model .OPERATORS ∗ model .
�→ OPERATORS)
269

270 Appendix F. Pyomo ILP Model for Operator Placement
2526 model . paths = Set ( with in=model .NODES ∗ model .NODES ∗ model .
�→ NODEEDGES)2728 model . x = Var (model .OPERATORS, model .NODES, domain=Binary ,
�→ within=Binary , i n i t i a l i z e=0)29 model . y = Var (model .OPERATORS, model .OPERATORS, model .NODES,
�→ model .NODES, domain=Binary , wi th in=Binary , i n i t i a l i z e�→ =0)
3031 model . wr = Param( with in=NonNegativeReals , d e f a u l t=0.5)32 model .wd = Param( with in=NonNegativeReals , d e f a u l t=0.5)3334 def ob j_expres s ion (model ) :35 r = 036 d = 037 f o r o in model .OPERATORS:38 f o r n in model .NODES:39 r += (model . p lacement_cost [o , n] ∗ model . x [o , n ] )40 f o r ( i , j ) in model .OPEDGES:41 f o r (u , v ) in product (model .NODES, model .NODES) :42 d += model . d[u , v ] ∗ model . y [ i , j , u , v ]43 re turn (model . wr ∗ r ) + (model .wd ∗ d)44 model . OBJ = Objec t i ve ( ru l e=ob j_expres s ion )4546 def p inn ing_ru le (model , o , u) :47 re turn model . x [o , u] == 148 model . PinningRule = Cons t ra in t (model . pinnings , ru l e=
�→ p inn ing_ru le )4950 def p inn ing_opt ions (model , o) :51 i f not model . p inn ing_opt ions :52 re turn Cons t ra in t . F e a s i b l e53 re turn sum(model . x [o , n] f o r (o , n) in model . p inn ing_opt ions
�→ ) == 154 model . P inningOptions = Cons t ra in t (model .OPERATORS, ru l e=
�→ pinn ing_opt ions )5556 def c o l o c a t i o n _ c o n s t r a i n t (model , o , p , n) :57 re turn model . x [o , n] == model . x [p , n]58 model . Colocat ionRule = Cons t ra in t (model . co loca t ions , model .
�→ NODES, ru l e=c o l o c a t i o n _ c o n s t r a i n t )5960 def e x c l u s i o n _ r u l e (model , o , u) :61 re turn model . x [o , u] == 062 model . Exc lus ionRule = Cons t ra in t (model . exc lus ions , ru l e=
�→ e x c l u s i o n _ r u l e )6364 def r u l e _ c a p a c i t y (model , u) :65 re turn sum(model . operator_workload [o ] ∗ model . x [o , u] f o r o
�→ in model .OPERATORS) <= model . node_capaci ty [u]66 model . Capac i t yCons t ra in t = Cons t ra in t (model .NODES, ru l e=
�→ r u l e _ c a p a c i t y )67

271
68 def rule_uniqueplacement (model , i ) :69 re turn sum(model . x [ i , n] f o r n in model .NODES) == 170 model . P lacementConstra int1 = Cons t ra in t (model .OPERATORS, ru l e=
�→ rule_uniqueplacement )7172 def network_rule1 (model , i , j , u) :73 re turn sum(model . y [ i , j , u , v ] f o r v in model .NODES) == model
�→ . x [ i , u]74 model . NetworkConstraint1 = Cons t ra in t (model . OPEDGES, model .
�→ NODES, ru l e=network_rule1 )7576 def network_rule2 (model , i , j , v ) :77 re turn sum(model . y [ i , j , u , v ] f o r u in model .NODES) == model
�→ . x [ j , v ]78 model . NetworkConstraint2 = Cons t ra in t (model . OPEDGES, model .
�→ NODES, ru l e=network_rule2 )7980 def l i n k _ r u l e (model , a , b) :81 subse t_paths = []82 f o r u , v , c , d in model . paths :83 i f ( c , d) == (a , b) :84 subse t_paths . append ( tup le ((u , v ) ) )85 i f not subse t_paths :86 re turn Cons t ra in t . F e a s i b l e87 e l s e :88 re turn sum(sum(model . opera to r_da ta ra te [ j , k ] ∗ model . y
�→ [ j , k , u , v ] f o r j , k in model .OPEDGES) f o r u , v in�→ subse t_paths ) <= model . b [a , b ]
89 model . LinkRule = Cons t ra in t (model .NODEEDGES, ru l e=l i n k _ r u l e )9091 re turn model


APPENDIX G
Problem Sizes for the Operator Placement Evaluation
This appendix details how the input sizes for the evaluation of the operator place-ment heuristics (see Section 8.6) are constructed. Table G.1 shows how many op-erator graphs of each type (following the numbering a–m as in Figure 8.5) arecontained in the input sizes g1–g11.
TABLE G.1: NUMBER OF OPERATOR GRAPHS PER INPUT SIZE
Input sizes
gs1
gs2
gs3
gs4
gs5
gs6
gs7
gs8
gs9
gs10
gs11
Ope
rato
rgr
aphs
a 2 2 2 2 2 2 2 2 2 2 2
b 1 1 1
c 1 1 1 1 1
d 1 1 1 1 1 1 1 1 1 1
e 1 1 1 1 1 1 1 1 1 1 1
f 1
g 1 1 1 1 1 1 1 1
h 1 1 1 1 1 1
i 1 1 1 1
j 1 1 1 1 2 2 2 2 2 2 2
k 1 1 1 1 1 1 1 1 1
l 1 1 1 1 1 1 1 1 1 1 1
m 1 1
273

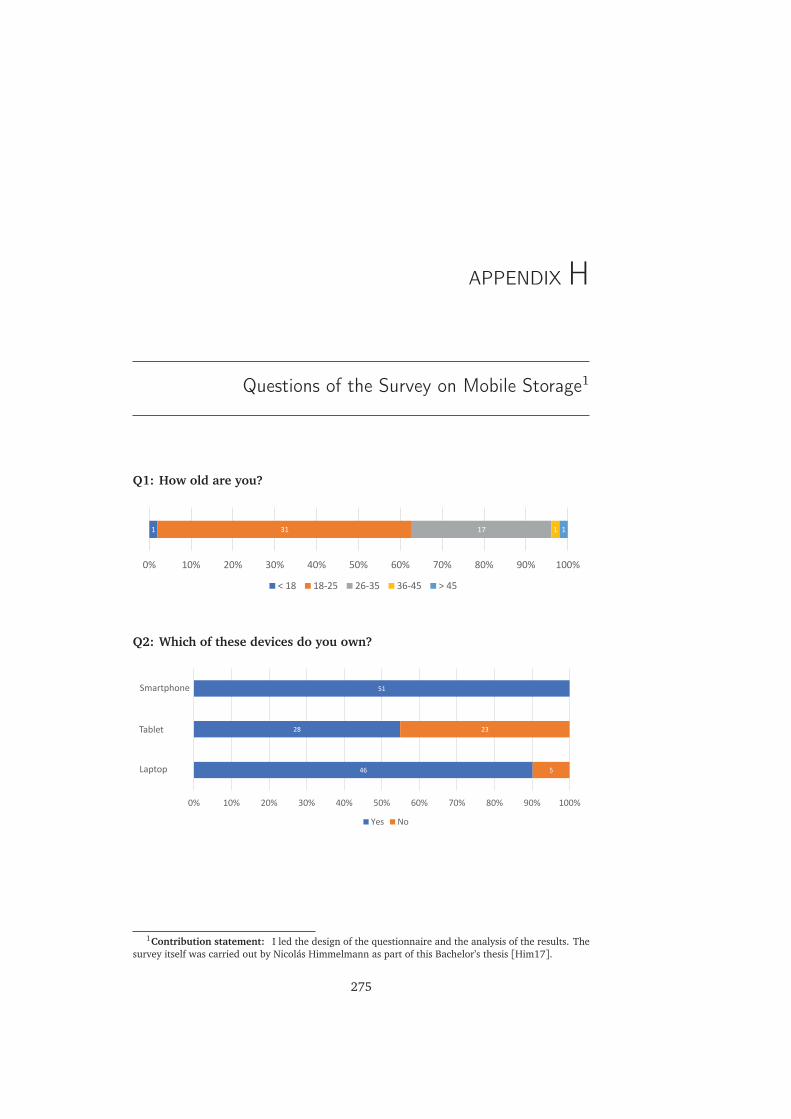
APPENDIX H
Questions of the Survey on Mobile Storage1
Q1: How old are you?
1 31 17 1 1
0% 10% 20% 30% 40% 50% 60% 70% 80% 90% 100%
< 18 18-25 26-35 36-45 > 45
Q2: Which of these devices do you own?
Smartphone
Tablet
Laptop
0% 10% 20% 30% 40% 50% 60% 70% 80% 90% 100%
Yes No
46 5
28 23
51
1Contribution statement: I led the design of the questionnaire and the analysis of the results. Thesurvey itself was carried out by Nicolás Himmelmann as part of this Bachelor’s thesis [Him17].
275
276 Appendix H. Questions of the Survey on Mobile Storage
Q3: How often do you use your smartphone on an average day?
24 17 10
0% 10% 20% 30% 40% 50% 60% 70% 80% 90% 100%
Very frequently Frequently Occasionally Rarely Very rarely Never
Q4: How often do you use your other mobile devices (e.g., laptop or tablet)on an average day?
15,7% 39,2% 31,4% 11,8% 2%
0 10 20 30 40 50
Very frequently Frequently Occasionally Rarely Very rarely Never
Q5: What is your monthly data plan?
4 3 2 12 9 9 3 4 5
0% 10% 20% 30% 40% 50% 60% 70% 80% 90% 100%
< 200MB 200-300MB 301-500MB Up to 1GB Up to 2GB
Up to 3GB Up to 4GB More than 4GB I don't know
Q6: How often do you exceed this data plan?
5 6 11 10 19
0% 10% 20% 30% 40% 50% 60% 70% 80% 90% 100%
Almost always Often Sometimes Seldom Never

277
Q7: How often do you use public WiFi networks?
0 % 1 23 24 5
67 267 367 467 567 867 067 %67 967 167 2667
Very frequently Frequently Occasionally Rarely Very rarely Never
Q8: How often do you capture data of the following types with your mobiledevice?
0% 10% 20% 30% 40% 50% 60% 70% 80% 90% 100%
Several times per day Daily Several times per week Occasionally Seldom Never
2 3 5 24 15 2
4 5 7 15 12 8
3 2 9 16 16 5
1 6 7 10 23 4
8 8 17 14 4Photo
Video
Document
Contact
Other
Q9: How often do you share data of the following types with your mobiledevice?
Phot V
i VdeD t cu
mVcundu
0
%
1
1
2
3
4
5
6
03
07
03
18
03
01
18
11
01
03
2
07
08
08
07
0
89 089 189 789 389 489 %89 589 689 289 0889
St vt rnl uhD t s pt r ony i nhly St vt rnl uhD t s pt r wt t k OddnshVcnlly St loVD Nt vt r
CaVuV
Ouat r

278 Appendix H. Questions of the Survey on Mobile Storage
Q10: Which of the following services do you use?
Snapchat
Twi er
1
1
2
3
4
4
5
13
38
1
3
3
6
2
8
3
1
3
6
2
9
2
2
4
5
6
3
5
11
17
1
3
1
3
1
2
3
14
4
11
6
2
2
6
45
39
18
43
8
35
34
37
16
3
0% 10% 20% 30% 40% 50% 60% 70% 80% 90% 100%
Several times per day Daily Several times per week Occasionally Seldom Never
OneDrive
Dropbox
Google Drive
OwnCloud
Q11: Which of these services I use depends on whether I want to share thedata or store it for private use.
7 26 13 3 2
0% 10% 20% 30% 40% 50% 60% 70% 80% 90% 100%
Strongly Agree Agree Undecided Disagree Strongly Disagree
Q12: Which of these services I use depends on my current location.
7 26 1 77 6
30 730 230 %30 430 630 530 830 930 130 7330
Strongly Agree Agree Undecided Disagree Strongly Disagree

279
Q13: Which of these services I use depends on the time of the day or the dayof the week.
7 77 2 61 3
0% 60% 70% 40% 20% 50% 30% 10% 80% 90% 600%
Strongly Agree Agree Undecided Disagree Strongly Disagree
Q14: How often do you upload the same data (e.g., a photo or a document) tomore than one service?
0 % 01 02 02 3
45 045 145 245 %45 645 745 845 345 945 0445
Very frequently Frequently Occasionally Rarely Very rarely Never
Q15: If so, for which purpose?
2
38
20
49
13
31
0% 10% 20% 30% 40% 50% 60% 70% 80% 90% 100%
Yes No
Backup of the data
Sharing the data with others
Other
Q16: How often do you experience considerable delays when retrieving filesin mobile networks?
On cellular
In Wi 2 16 20 9 3 1
1 8 19 10 11 2
0% 10% 20% 30% 40% 50% 60% 70% 80% 90% 100%
Very frequently Frequently Occasionally Rarely Very rarely Never
1 8 19 10 11 2
2 16 20 9 3 1

280 Appendix H. Questions of the Survey on Mobile Storage
Q17: How often do you share data at an event?
0 % 12 3 14 2
56 156 456 756 056 256 856 %56 356 956 1556
Very frequently Frequently Occasionally Rarely Very rarely Never
Q18: Did you experience times where the network was overloaded at an event?
5 66 10 9 1
%2 6%2 1%2 5%2 3%2 4%2 0%2 7%2 8%2 9%2 6%%2
Almost always Often Sometimes Seldom Never
Q19: Do you retrieve data related to this event (e.g., photos/videos) while youare there?
5 61 56 65 0
19 619 519 %19 219 319 019 419 719 819 6119
Almost always Often Sometimes Seldom Never
Q20: How often do you share data with others that are also present at thesame event?
5 6 10 91 90
0% 90% 10% 50% 20% 30% 60% 40% 70% 80% 900%
Almost always Often Sometimes Seldom Never

APPENDIX I
Implementation Details of vStore1
FIGURE I.1: CLASS DIAGRAM OF THE VSTORE FRAMEWORK
1Contribution statement: I led the idea generation and design of the vStore framework. Theframework itself was implemented by Nicolás Himmelmann as part of this Bachelor’s thesis [Him17].The figures in this appendix are taken from this thesis.
281

282 Appendix I. Implementation Details of vStore
FIGURE I.2: DATABASE SCHEME OF THE SQLITE DATABASE ON THE MOBILE CLIENT

APPENDIX J
Example Class Diagram of an Adaptable Microservice1
FIGURE J.1: UML CLASS DIAGRAM OF THE ADAPTABLE FACE DETECTION MICROSER-VICE
1Contribution statement: I led the idea generation and design of the system for adaptable microser-vices. The student assistant Karolis Skaisgiris was involved in developing a prototype implementation.The class diagram shown in this appendix is taken from this implementation.
283


APPENDIX K
Wissenschaftlicher Werdegang des Verfassers
2007–2013 Studium der Informatik an der TU DarmstadtAbschluss: Bachelor of Science
2013–2015 Studium der Informatik an der TU DarmstadtAbschluss: Master of Science
2016–2020 Wissenschaftlicher Mitarbeiter am Fachgebiet Telekooperationdes Fachbereichs Informatik an der TU Darmstadt
285