3 Related work - TUprints
139
3 RELATED WORK - 63 - 3 Related work Having discussed necessary basic technologies and information visualization techniques in Chap- ter 2, we need to turn our attention now to requirements for the research work to be carried out in connection with the present thesis. A number of related projects will be presented and ana- lyzed in this context. The deficits found in existing applications will be used to define new re- quirements, leading, in the end, to the formulation of more detailed objectives of this thesis. The projects presented in the following have in common, that they provide a framework for applications, which map database content to visual content using three-dimensional metaphors. They are presented from a rather conceptual view without going into very much technical detail. In section 3.7 we will comment on some interesting and relevant technical achievements of the projects described. The order in which the projects are presented roughly reflects their chronol- ogy. 3.1 Metaphoric Information Visualization Systems The following information visualization systems have in common, that they use a fixed and well- specified graphical 3D metaphor to map information objects to. The described, systems, how- ever, allow for configurable definition of the mapping from information objects to visual proper- ties of the graphical metaphorical objects. 3.1.1 Virgilio Virgilio ([Paradiso,1996] [Paradiso,1997] [L'Abbate,1998]) is a VR-based system for the visualiza- tion of large and complexly structured data records that represent the result of a query to a data- base or an information retrieval system. Virgilio was the first project (1996) to deal with the mapping of content from a relational database to three-dimensional real-world metaphors. The architecture was designed to make the system independent of any specific database schema, query submitted, or metaphor selected. With the help of a database management tool predefined database queries are initially given a tree structure reflecting the structure of the data to be visual- ized. A structure of this kind consists of recursively nested nodes of the „set_of“ and „record“ types. While a „set_of“ nodes in Virgilio represents an unordered set of elements of the same type, the „record“ nodes stand for a list of elements of any type. The predefined „visual world objects“ (also referred to as "virtual world objects") are stored in a database, from which the scene that is to be constructed is put together by the Scene Construc- tor module. These objects are of a specific type and able to represent an item of data by means of a visual attribute (e.g. color). The visual objects can be either of the „accessory“ type, if they represent precisely one item of data, or of one of the two container types, i.e. „classifier“ and
-
Upload
khangminh22 -
Category
Documents
-
view
2 -
download
0
Transcript of 3 Related work - TUprints

3 RELATED WORK
- 63 -
3 Related work Having discussed necessary basic technologies and information visualization techniques in Chap-ter 2, we need to turn our attention now to requirements for the research work to be carried out in connection with the present thesis. A number of related projects will be presented and ana-lyzed in this context. The deficits found in existing applications will be used to define new re-quirements, leading, in the end, to the formulation of more detailed objectives of this thesis.
The projects presented in the following have in common, that they provide a framework for applications, which map database content to visual content using three-dimensional metaphors. They are presented from a rather conceptual view without going into very much technical detail. In section 3.7 we will comment on some interesting and relevant technical achievements of the projects described. The order in which the projects are presented roughly reflects their chronol-ogy.
3.1 Metaphoric Information Visualization Systems The following information visualization systems have in common, that they use a fixed and well-specified graphical 3D metaphor to map information objects to. The described, systems, how-ever, allow for configurable definition of the mapping from information objects to visual proper-ties of the graphical metaphorical objects.
3.1.1 Virgilio Virgilio ([Paradiso,1996] [Paradiso,1997] [L'Abbate,1998]) is a VR-based system for the visualiza-tion of large and complexly structured data records that represent the result of a query to a data-base or an information retrieval system. Virgilio was the first project (1996) to deal with the mapping of content from a relational database to three-dimensional real-world metaphors. The architecture was designed to make the system independent of any specific database schema, query submitted, or metaphor selected. With the help of a database management tool predefined database queries are initially given a tree structure reflecting the structure of the data to be visual-ized. A structure of this kind consists of recursively nested nodes of the „set_of“ and „record“ types. While a „set_of“ nodes in Virgilio represents an unordered set of elements of the same type, the „record“ nodes stand for a list of elements of any type.
The predefined „visual world objects“ (also referred to as "virtual world objects") are stored in a database, from which the scene that is to be constructed is put together by the Scene Construc-tor module. These objects are of a specific type and able to represent an item of data by means of a visual attribute (e.g. color). The visual objects can be either of the „accessory“ type, if they represent precisely one item of data, or of one of the two container types, i.e. „classifier“ and

3.1 METAPHORIC INFORMATION VISUALIZATION SYSTEMS
- 64 -
„aggregator“. Classifier objects are a set of objects of the same kind. The number of objects sub-ject to the classifier is not arbitrary. Instead, there is an upper limit (maximum) and a lower limit (minimum), after which a classifier is no longer credible to viewers (e.g. a building with 5000 stories). Similarly, there is an average number of objects typically grouped together with the clas-sifier. Aggregators can contain any number of visual objects of different types, including classifi-ers. In addition, there are visual objects of the decorator type, which do not represent data and serve only the purpose of enriching the scene optically, e.g. a flower vase.
FIGURE 33 The Virgilio Prototype
The user can direct one of the predefined queries to the underlying database and determine the desired type of visualization. A selection is made from a number of structurally consistent map-pings (predefined in a configuration database). The concept of "structural preservation" relates to the tree structure of the database query and is guaranteed by the fact that nodes of the „set_of“ type can be mapped only to visual objects of the classifier type and record nodes only to aggregators. A partially implemented prototype of the Virgilio approach operates on the basis of a music database and visualizes its content in the form of a building with floors, hallways, and rooms, in which posters and CDs of artists can be viewed (see Figure 33). The source text was written for an SGI system and the OpenInventor toolkit was used to render 3D scenes. The concepts developed in the Virgilio project found further use in a number of subsequent projects.
3.1.2 cyber:gallery The cyber:gallery [Müller,1999] is a virtual gallery dynamically generated from the content of an art database in a manner analogous to Virgilio in the form of the real-world metaphor of a build-ing with several floors, corridors, and rooms. This virtual gallery is an electronic platform on the WWW for the exhibition of and the trade in art objects, particularly paintings. The objective is for cyber:gallery to become established as an e-commerce portal for use by artists and art buy-ers and for it to bring both parties together on the global Internet. The aim of the project was to develop a runnable and fully functional system that can be used on the Internet and adapted for commercial use without a great deal of additional effort.
A management tool with which any application data schema can be created ensures that the sys-tem can be applied to other scenarios. If, for instance, photographs were to be exhibited in the virtual gallery instead of paintings, the metaschema could contain characteristics such as expo-sure time, selected aperture setting, and type of lens instead of canvas size and selected style of

3 RELATED WORK
- 65 -
painting. From a conceptual standpoint the principle of Visual Objects used in the Virgilio pro-jects was used again in a modified form. The Scene Constructor implemented in Java and pre-sent as an applet in the clients' web browser uses so-called „visual classes“ in its configurable design algorithm. These are Java classes (floors, corridors, rooms, doors, paintings, etc.), which are able to compute their visual representation independently in a runtime situation and insert it into the virtual scene or delete it from there. New metaphors can be added to the system by im-plementing further Visual Classes of this kind.
Using the parameterable design algorithm both exhibitors and end users can configure the struc-ture and appearance of the gallery in accordance with their own needs. The cyber:gallery system redesigns the exhibition for each user in accordance with his or her specifications. Thus, it can be determined in a runtime situation how paintings are to be distributed over the various floors, corridors, and rooms (see Figure 34). As a rule, artists are distributed by floors, i.e. there is only one artist on each floor. The corridors divide an artist's work up into artistic styles or periods, and the paintings located in a given room are all in the same motif category. Since navigating in virtual worlds is often problematic for inexperienced users, the system provides navigation assis-tance in the form of a site map. The latter indicates the user's position in the gallery and the di-rection he or she is looking in, but it can also be used to jump directly to a desired position. The site map also provides information on the paintings contained in the rooms.
FIGURE 34 The cyber:gallery System
In order to limit network loads as much as possible and reduce the time needed for the initial design process a room with seven paintings is assembled and added to the scene only at the point in time when users wants to enter the room in question and is deleted again when they leave the room. The system also provides users with an art search engine, enabling them to limit the number of exhibited paintings in accordance with individually specified criteria. By way of example, an interior decorator could have only those painting shown that do not exceed certain

3.2 3D INTERACTION ELEMENTS
- 66 -
dimensions or an amateur art lover could carry out searches for paintings of a specific style or containing certain motifs.
3.2 3D interaction elements
3.2.1 Three dimensional widgets In [Conner,1992] it was observed that the 3D components of user interfaces were highly under-developed. Direct interaction with 3D objects had been limited to gestural picking, manipulation with linear transformations, and simple camera motion. Furthermore, there are no toolkits for building 3D user interfaces.
Therefore they presented a concept and a system, which they called 3D widgets encapsulating geometry and behavior. 3D widgets are defined as "an encapsulation of geometry and behavior used to control or display information about application objects". These 3D widgets are first class objects present in the same environment as the 3D application development environment. This integration of widgets and application objects provided a higher bandwidth between inter-face and application than existed in more traditional UI toolkit-based interfaces at this time. The intention was to allow user-interface designers to build highly interactive 3D environments more easily than it was possible by the preceding tools.
The first implementation of the system using these widgets was based on the UGA system pre-sented in [Zeleznik,1991].
UGA supports the geometric components of widgets through its rich modeling environment. The system supports the behavioral aspects of widgets through one-way constraints called de-pendencies. An object can be explicitly related to another object by using a dependency. Since widgets are first-class objects in UGA, they can use this dependency mechanism as easily as ap-plication objects can. Therefore, the behaviors of these widgets may be defined using complex control methods and user input techniques.
3D Widgets can furthermore be rapidly prototyped, modified, and combined into more compli-cated systems of widgets. A close integration with the surrounding application environment al-lows rich forms of interaction and feedback within the sample applications provided by [Con-ner,1992].
3.2.2 Interactive, animated 3D widgets In 1998 Döllner and Hinrichs extend the concept presented in [Conner,1992] by Conner et al. significantly by introducing the concept of interactive, animated 3D widgets [Döllner,1998].
The authors observe, that as 3D applications become increasingly larger it leads to problems in the specifications. Furthermore, if time- and event-dependencies are merged with geometric modeling, complex animations and interactions cannot be modeled independently and hierarchi-cally since their specifications are dispersed throughout the static scene description.
Therefore, an object-oriented architecture for animated, interactive 3D widgets is presented with the intention to reduce the complexity of building 3D applications. 3D widgets encapsulate ge-ometry and behavior into high-level building blocks based on two different types of graphs, ge-

3 RELATED WORK
- 67 -
ometry graphs and behavior graphs. The 3D widgets construct internal geometry graphs and behavior graphs, and perform operations on these graphs through high-level interfaces, which hide details and raise the level of abstraction. Furthermore, they define so-called object ports, which are used to link together different 3D widgets. A visual language for the description of 3D widgets also allows the application developer to interactively construct 3D applications.
The main features of the architecture presented are:
• Graphics objects are separated from geometry nodes making it easy to create dependencies between geometry and animation. Graphics objects can be shared throughout the whole ap-plication. Application-specific graphics objects allow developers to embed their own data structures directly into the graphics toolkit.
• Geometry and behavior of a 3D widget are expressed through geometry nodes and behavior nodes. Since behavior nodes are treated as first-class objects, general and reusable behavior components can be designed separately and independent of a specific geometry class. The time management features allow the design of complex time flows.
• 3D widgets introduce a new abstraction level at which 3D applications are developed. The construction and the maintenance of hierarchical object networks are completely encapsu-lated into the 3D widgets, which represent geometry graph patterns and behavior graph pat-terns in a compact way.
• The ways 3D widgets can be combined are defined by their ports (interfaces), which offer the prerequisites for the visual programming with 3D widgets.
The prototypical system implementing the described concepts was realized in MAM/VRS (now VRS). The Virtual Rendering System (VRS) supports the rendering libraries OpenGL, POV Ray, RenderMan, and Radiance. The Modeling Animation Machine (MAM) is an ongoing project, which offers a framework for implementing interaction and animation strategies. As an API the developers can choose between a C++ and a Tcl (Tool Command Language) API. Using the interpretative Tcl language allows for rapid prototyping of 3D applications and ensures portabil-ity across different operating system platforms. More Information about MAM and VRS can be found at http://www.vrs3d.org/.
In conclusion, the object-oriented architecture for interactive, animated 3D widgets presented in [Döllner,1998] provided an early framework for the rapid development of large 3D applications.
3.3 Object oriented 3D toolkits In the last few years several object-oriented 3D graphics toolkits have been proposed, e.g. GRAMS, Open Inventor, GROOP, TBAG, Obliq-3D, and finally Java 3D. These toolkits intro-duce object-oriented concepts applied to 3D graphics. These toolkits concentrate more on 3D graphics than on user interface construction. In contrast, the 3D widgets approach complements these object-oriented concepts by an object-oriented design for behavioral modeling.
3.3.1 Open Inventor The Open Inventor Toolkit was introduced in [Strauss,1992] and provides geometric node classes based on the OpenGL rendering library. Open Inventor is an object-oriented 3D toolkit offering a comprehensive solution to interactive graphics programming problems. It presents a

3.3 OBJECT ORIENTED 3D TOOLKITS
- 68 -
programming model based on a 3D scene database that dramatically simplifies graphics pro-gramming. It includes a rich set of objects such as cubes, polygons, text, materials, cameras, lights, trackballs, handle boxes, 3D viewers, and editors that speed up programming time and extend 3D programming capabilities.
Open Inventor has the following characteristic features:
• is built on top of OpenGL • defines a standard file format for 3D data interchange (.iv) • introduces a simple event model for 3D interaction • provides animation objects called Engines • provides high performance object picking • is window system and platform independent • is a cross-platform 3D graphics development system • supports PostScript printing • encourages programmers to create new customized objects
In the past SGI has received numerous requests for a GNU/Linux version of Open Inventor. By making this toolkit open-source SGI is therefore making it available on Linux and at the same time enabling the large user community to study, understand and enhance Open Inventor. Ear-lier 2002 SGI released the source code of the OpenGL sample implementation to the open source community, clearing the way for high-quality OpenGL implementations on Linux. (http://www.sgi.com/software/inventor/)
FIGURE 35 An Open Inventor sample application
Back in December 1996 the (by then) relatively small company TGS Software acquired Portable Graphics, Inc., a subsidiary of Evans & Sutherland and an Open Inventor licensee. Since then TGS has pioneered in developing new versions of Open Inventor on multiple platforms (Includ-ing MS Windows).
Today Open Inventor from TGS (http://www.tgs.com/) is the most widely used object-oriented, cross-platform 3D graphics API for C++ and Java developers. The new Open Inven-tor takes advantage of technological advances to better meet the needs of developers and cus-

3 RELATED WORK
- 69 -
tomers. With a full compliment of robust components for rapid application development, Open Inventor has become an even more powerful graphic display system for real-time 3D visualiza-tion. Open Inventor allows developers to increase productivity by reducing time to market and optimizing their development costs and resources. Open Inventor in its current version supports a number of impressive 3D graphic features, such as:
• Advanced multi-pipe capabilities (with Multi-Pipe extension) • Volume rendering (with VolumeViz extension) • Large model visualization • Ability to handle large data sets • Real-Time interaction • Server software that generates 3D images over a network
Open Inventor gives the developer a choice of development language, either C++ or Java, and also provides the flexibility of running the developed application on many different platforms. This cross-platform capability makes Open Inventor a fast, flexible, and high performing API for developing interactive, object-oriented 3D applications (http://www.tgs.com/).
Sample application areas for the TGS Open Inventor include Business Graphics, Cartography, Chemistry, Engineering, Virtual Reality and VRML, AEC and Simulations, Mechanical CAE and CAD, Architectural Design, Medical and Scientific Imaging, Geophysical Sciences, Scientific Data Visualization, and Animation. Figure 35 depicts an example CAD application including the visualization of the structure of an engine part.
By now, Open Inventor is the de facto standard for development of cross-platform (IRIX, So-laris, HP-UX, AIX, Linux, and Windows) 3D graphics applications in C++ and Java. It is a powerful object-oriented toolkit with over 450 classes and an intuitive and easy-to-use program-ming interface that allows for rapid prototyping and development of graphics applications.
Open Inventor's extensible architecture allows developers to add entirely new objects. Since Open Inventor was designed specifically to use OpenGL for graphics rendering, it is highly op-timized to take advantage of OpenGL accelerators. Open Inventor provides the power and func-tionality of OpenGL at an object-oriented level. Instead of writing tedious low-level calls to specify vertices, objects are described in a scene hierarchy. Open Inventor's optimized rendering automatically takes advantage of OpenGL features like display lists, texture objects, and vertex arrays. Open Inventor is a very high-level API, reducing the programming time required of low-level APIs significantly.
3.3.2 GRAMS The GRAMS system, which stands for Graphical Application Modeling Support system, intro-duced in [Egbert,1992] appears to be one of the first toolkits with rendering-independent 3D graphics.
The authors observe that much work had been devoted to improving image quality and reducing rendering time, but less work to making graphics easy to use in a broad set of applications. Ad-dressing this “ease of use” issue was one of the principal motivations in developing the system [Egbert,1992].
There were several problems of graphic systems of that time. On the one hand was the disregard for applications for purposes of system efficiency resulting in the fact that applications had to work at the renderers level rather than at their natural application level. On the other hand sys-

3.3 OBJECT ORIENTED 3D TOOLKITS
- 70 -
tem components were too tightly coupled for reasons of efficiency, cost, and storage require-ments. This approach, however, discouraged experimentation with new algorithms and ideas. Given the rate at which computer graphics were expanding and improving, it was clearly not desirable or feasible to alter an entire system to upgrade a single component.
Grams is a three-dimensional graphics system that raises the abstraction level at which the appli-cation programmer and the end user interact with the system in the image-generation process. The complete GRAMS system was built entirely from scratch instead of building it on top of some existing standard or system. This allowed the authors to concentrate on the needs of appli-cation users and design the system in a way that people other than graphics specialists could use it, while at the same time the system did not preclude high-quality graphics techniques or addi-tion of new functionality.
Figure 36 displays a logical division of the overall system into three components: the application, graphics, and rendering layers. Grams defines the graphics layer and the interfaces between it and the other two layers. It does not formally define the application and rendering layers. An over-view of the graphics layer and its object-oriented aspects as well as a more detailed discussion of the three layers is available in [Egbert,1992].
FIGURE 36 The logical layers of the GRAMS system [EGBERT,1992]
Grams assists the application user in the image-generation process. The graphics layer lets the application provide modeling objects close to the level of abstraction at which the user thinks. Users are freed from low-level graphics details and can focus on their application data. The pre-sented system greatly reduced the code and complexity involved in doing the modeling. It also demonstrated other system capabilities including transparency and texture mapping. [Eg-bert,1992]
In addition to providing an easy-to-use graphics system, GRAMS was extensible at all levels. The well-defined interface between the three layers let programmers add new functionality to any level without altering the other levels - a capability other systems lacked at that time. The authors observed that treating entities as distinct objects in a computer graphics system is a very natural way of thinking. Thus, designing a computer graphics system around the object-oriented para-digm makes intuitive sense. By combining graphics with object orientation the authors had been able to overcome many of the problems in existing graphics systems.
GRAMS was implemented in C++ on an IBM RS6000 and consisted of approximately 18000 lines of code.
3 RELATED WORK
- 71 -
3.3.3 GROOP The authors of [Koved,1993] detected an increasing need to provide tools for application programmers that were easier to learn and use, yet retain flexibility for a wide range of modeling, animation, visualization and Virtual Reality applications. The challenge was to define intuitive programming interfaces for programmers who have a rudimentary understanding of 3-D geome-try, yet have no prior knowledge of computer generated graphics.
The GROOP system (GRaphics using Object-Oriented Programming), which was introduced by Koved and Wooten in [Koved,1993], is a toolkit for animated 3D computer graphics. The basic metaphor is derived from theater or motion pictures - a scene - composed of a stage (display), actors (3D objects), lights and a camera. For the novice, simple animated models can be quickly constructed by creating objects, adding them to a scene, and applying transformations (scale, rotate and translate) to generate animation. To simplify learning and provide consistency, an ob-ject-oriented language with inheritance is employed, yielding code reuse and permitting the con-struction of reusable 3D objects with behavior [Koved,1993].
GROOP was designed to be independent of graphics systems and operating environments. The system is divided into two major components - scene construction/animation, and rendering. Scenes contain 3D objects, lights and a camera. Scenes are renderer independent. Therefore, different renderers can be used to display the same scene description. The current implementa-tion uses the Graphics Library (GL) for rendering. However, a new Display object using a differ-ent graphics package, having the same functional interface as the GLwindow renderer object, would be able to display the same set of scenes. This separation of the scene from displays makes it possible to quickly port applications from one system to another, even when the render-ing software is different.
The approach of the GROOP system is similar to Grams (see section 3.3.2), which uses an ob-ject-oriented language, C++, and also separates the specification of geometry from that of ren-dering, permitting an application to select from a number of different renderers. The primary differences between Grams and GROOP are in the class hierarchy and the approach the authors have taken to extensibility, 3D object construction, optimization and definition of objects with behavior.
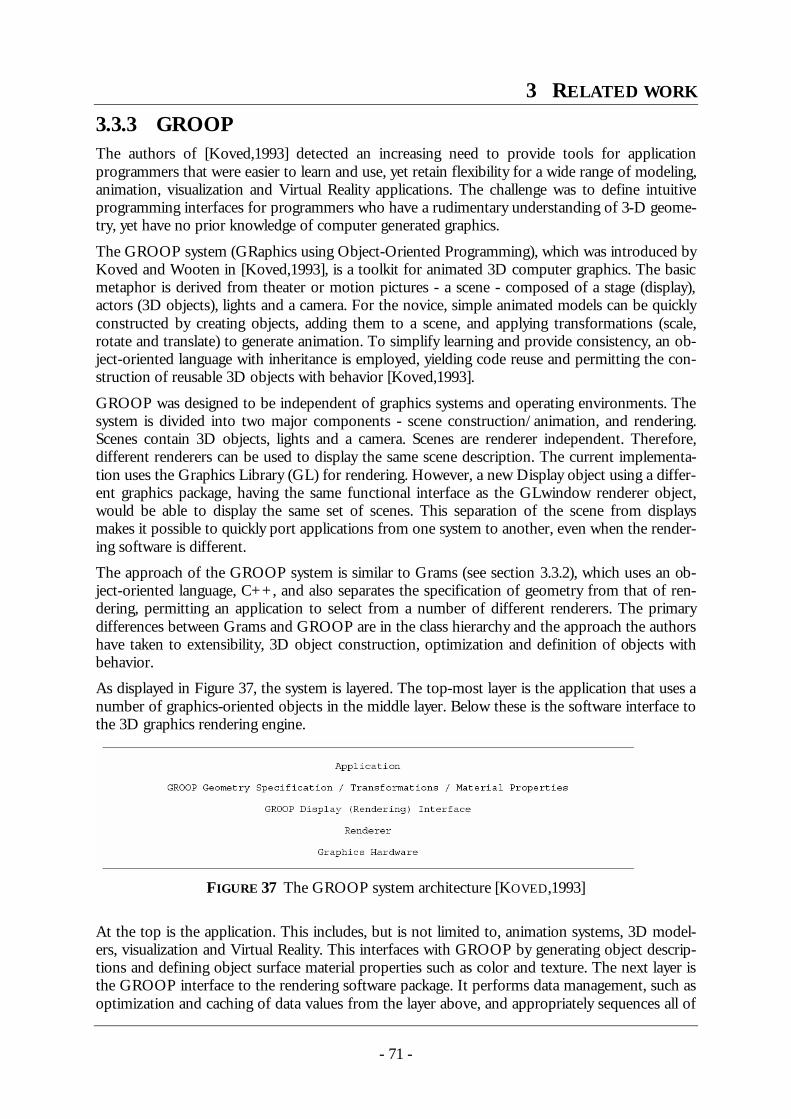
As displayed in Figure 37, the system is layered. The top-most layer is the application that uses a number of graphics-oriented objects in the middle layer. Below these is the software interface to the 3D graphics rendering engine.
FIGURE 37 The GROOP system architecture [KOVED,1993]
At the top is the application. This includes, but is not limited to, animation systems, 3D model-ers, visualization and Virtual Reality. This interfaces with GROOP by generating object descrip-tions and defining object surface material properties such as color and texture. The next layer is the GROOP interface to the rendering software package. It performs data management, such as optimization and caching of data values from the layer above, and appropriately sequences all of

3.3 OBJECT ORIENTED 3D TOOLKITS
- 72 -
the calls to the rendering software. The renderer and graphics hardware are typically provided by systems manufacturers and/or third party vendors.
GROOP was designed to be embedded in a variety of applications rather than being a domain specific tool. Hence, it does not have a specific user interfaces, such as a 3D modeler, animation classes, Virtual Reality or scientific visualization functions. Instead, these can be added to suit the application needs.
The GROOP system is also extensible in a number of ways. Additional graphics primitives and geometric objects can be built on top of the base classes provided by the toolkit. Furthermore, GROOP is not tied to any specific file formats, renderers or application domains. New domain or application specific classes can be created and can inherit directly from GROOP, or multiple inheritance mechanisms can be used to create composite behavior.
3.3.4 TBAG TBAG [Elliot,1994] is a toolkit for rapid prototyping of interactive, animated 3D graphics pro-grams, based on the two well-known design principles of graphical ADTs (abstract data types), and explicit functions of time. TBAG attempts to make parameterized geometric models as easy to express as mathematical formulas, by providing a set of high-level graphical ADTs, functions, and operators for constructing graphical values. These types include points, vectors, planes, col-ors, transforms, geometry, and sound. Values of these types are immutable, ensuring that differ-ent uses of a value, even ones occurring in parallel, cannot interfere with each other.
A single type of entity, the so-called "constrainable", represents modeling animation parameters of all types, user interaction, and even entire animations. Constrainables explicitly represent func-tions of time, to be sampled automatically by TBAG, thus relieving application programmers from involvement with frame generation and input device “motion events”. Functions and op-erators that have been defined to work on basic types, including TBAG’s high level graphical types, are automatically overloaded to work on constrainables over those types, producing new constrainables. The result is an almost invisible syntax for constructing interactive animations [Elliot,1994].
Other features of TBAG are lights, shadows, and sound integrated with geometry in a consistent manner. Furthermore, velocity, gravitational and spring forces, etc., can be specified with ODE's (ordinary differential equations), which are formulated as equality expressions involving the con-strainable derivatives. Finally, TBAG transparently supports networked distribution. There has been much work done to extend the might of numerical constraint solvers. TBAG, however, shows how to take a simple and efficient constraint solver, apply it uniformly to a multitude of types (including very high level types), make it support a continuous time model, and provide an almost invisible syntactic interface to it. Future work plans to merge these two research paths.
A variety of applications have been written using the TBAG system. In [Elliot,1994] the applica-tions SoundScape, EagleWatcher, ColorView, and MortgageTool are presented to demonstrate the different aspects and capabilities of the TBAG system.

3 RELATED WORK
- 73 -
3.3.5 Obliq 3D The authors of [Najork,1995] describe a 3D animation system called Obliq-3D14 consisting of an animation library and an embedded interpreted language. The animation library, called ANIM3D, is implemented in Modula-3. It uses the X Window System as the underlying window system, and MPEX (Digital's extension of PEX) as the underlying graphics library. Support for other window systems (e.g., Microsoft Windows NT) and graphics libraries (e.g., OpenGL) is also available. ANIM3D is well suited to interconnect with an embedded language. As a language, Obliq [Cardelli,1995] was chosen, an object-oriented, lexically scoped, untyped, interpreted lan-guage. The Obliq interpreter is designed to be both easy to extend and easy to embed into Modula-3 programs.
The resulting embedded language was then called Obliq-3D. It provides all of the features of standard Obliq, plus extra modules that support the construction of 3D animations.
By using Obliq-3D, the size of typical 3D animations decreased from about 2,000 lines of Modula-3 to 70 lines of Obliq, and the part of the design cycle time devoted to running a new visualization on a DECstation 5000/200 decreased from over 7 minutes to about 10 seconds [Najork,1995].
Obliq-3D is founded on three basic concepts:
• Graphical objects for constructing scenes
• Time-variant properties for animating various aspects of a scene
• Callbacks for providing interactive behavior.
Graphical objects include geometric shapes (spheres, cones, cylinders, etc.), light sources, cam-eras, groups for composing complex graphical objects out of simpler ones, and roots for display-ing graphical objects on the screen. The class hierarchy for the graphical objects (GO) is shown in the figure:
FIGURE 38 Graphic object class hierarchy in Obliq-3D
14 http://www.research.compaq.com/SRC/3D-animate/

3.3 OBJECT ORIENTED 3D TOOLKITS
- 74 -
Properties describe attributes of graphical objects, such as their color, size, location, or orientation. A property consists of a name that determines what attribute is affected and a value that deter-mines how it is affected. Property values are not simply scalar values, but rather functions that take a time and return a value. Thus, property values form the basis for animation.
Graphical objects are reactive, that is, they can respond to user events. Events are handled by call-backs. Associated with each graphical object is a callback stack for each event type (e.g., mouse clicks, keystrokes, mouse movement). The programmer can define or redefine the reactive be-havior of a graphical object by pushing a new callback onto the appropriate stack. The previous behavior of the graphical object can easily be reestablished by popping the stack.
These concepts provide a simple yet powerful framework for building animations. The system provides fast turnaround by incorporating an interpretive language that allows the user to modify the code of a program even at run time.
TBAG (see section 3.3.4) has many similarities with Obliq-3D: Both systems distinguish between values that define geometry and values that define attributes (such as color); both allow the user to impose a hierarchical structure on the geometry of the scene; both systems treat light sources like any other geometric primitive; and both systems have the notion of time-varying values. TBAG, however, allows for a more general class of constraints than Obliq-3D, and it provides support for building distributed, collaborative applications. But, like Open Inventor, TBAG does not have an embedded interpreted language [Najork,1995].
3.3.6 Java 3D Java 3D is a client-side application programming interface (API) developed at Sun Microsystems for rendering interactive 3D graphics using the Java programming language [Sun,1998].
Since the OpenGL API is written in the C programming language, and hence not directly call-able from Java, a number of open source and independent programming efforts have provided simple Java wrappers over the OpenGL API that allow Java programmers to call OpenGL func-tions, which are then executed in native code that interacts with the rendering hardware. One of the most popular is GL4Java, which can be found at http://www.jausoft.com/gl4java/.
However, there are few advantages to using a Java wrapper over OpenGL, as opposed to coding in C and calling OpenGL directly. Although programmers can use the more friendly Java APIs, they must incur the overhead of repeated calls through the Java Native Interface (JNI) to call the native OpenGL libraries.
Java 3D relies on OpenGL or DirectX to perform native rendering, while the 3D scene descrip-tion, application logic, and scene interactions reside in Java code. When Sun set out to design Java 3D, although they did not have the resources or industry backing to replace OpenGL, they wanted to leverage more of Java’s strengths as an object-oriented programming language instead of merely delegating to a procedural language such as C. While OpenGL’s level of description for a 3D scene consists of concepts, such as points, lines, and triangles, Java 3D can describe a scene as collections of objects within a graph. By raising the level of description and abstraction, Java 3D not only applies OOP principles to the graphics domain, but also introduced scene op-timizations that can compensate for the overhead of calling through JNI [Selman,2002].
The foremost strength of Java 3D for Java developers is that it allows them to program in 100 percent Java. In any larger 3D application, the rendering code will make up for only a fraction of the total application. It is therefore very attractive to have all the application code, and user inter-face code in an easily portable language, such as Java.

3 RELATED WORK
- 75 -
Furthermore, by allowing the programmer to describe the 3D scene using coarser-grained graphical objects, as well as by defining objects for elements such as appearances, transforms, materials, lights, etc., code is more readable, maintainable, reusable, and easier to write. Java 3D uses a higher level scene description model, the scenegraph, which allows scenes to be easily de-scribed, transformed, and reused.
Java 3D also includes a view model designed for use with head-mounted displays (HMDs) and screen projectors. By insulating the programmer from much of the complex trigonometry re-quired for such devices, Java 3D eases the transition from a screen-centric rendering model to a projected model, where rendering in stereo allows for greater realism. Java 3D additionally in-cludes built-in support for sampling 3D input devices and rendering 3D spatial sound.
Although Java 3D includes many optimizations, a skilled developer using OpenGL and native C code will probably achieve higher performance than a Java programmer using Java 3D. If abso-lute rendering performance is the top-priority for an application then it might be better using OpenGL or another native rendering API.
One particular problem, inherent in Java, which can be noticeable in performance critical appli-cations, is the impact of the Java garbage collector (GC). The Java runtime, the Java 3D runtime, and the application code all create objects. All these objects will eventually become garbage, and be collected by the Java Virtual Machine (JVM) GC. While the GC is running there may be an appreciable system slowdown, resulting in several rendered frames being dropped. If garbage collection occurs in the middle of a critical animation sequence, the realism of the rendered scene may be lowered for the user.
FIGURE 39 The Java 3D fly through example
Another limitation is that the Java client-side APIs, and especially Java 3D, can be difficult to distribute to end users. While the biggest group of end users run Windows, Sun has had limited success getting Java 2 (JRE 1.2) deployed on the Windows platform. Java 2 is required for Java 3D, although Microsoft’s JVM does not support Java 2. This means that end users are required to download Sun’s Java 2 implementation, install it, and then download Java 3D and install it, all

3.4 SOFTWARE COMPONENTS FOR 3D GRAPHICS
- 76 -
prior to running your application. If an application is deployed as an applet, the installation proc-ess is potentially more complex as some end users will have to manually copy or edit configura-tion files before they can view the applet. In addition a suitable version of OpenGL or DirectX must be installed and configured for the end user’s hardware and drivers. At present Microsoft does not ship any JVM with Windows XP.
The Java 3D API fills an important gap in 3D graphics APIs between content creation plus scripting and low-level pipeline based rendering systems. With careful design and implementa-tion, performance of Java 3D applications can rival native OpenGL applications and will exceed JNI based Java wrappers over OpenGL.
In conclusion, Java 3D introduces abstractions over OpenGL/Direct3D and includes many fea-tures that will bring 3D applications to market faster. While absolute performance is sometimes a requirement, 3D graphics hardware, processor, and memory availability are advancing so rapidly that any disparity between Java/Java3D and C/OpenGL is shrinking for all but the most mem-ory-intensive applications [Selman,2002].
3.4 Software components for 3D graphics
3.4.1 OLAP Explorer The OLAP Explorer was developed in the context of a "Diplom" thesis written in 2000. The application is aimed at visualizing increasingly complex database management systems (DBMS) that document corporate activities. In particular, the OLAP Explorer is intended to react suitably to market changes. According to [Lang,2000] the commercial success of companies is becoming increasingly dependent on effective systems for planning, analysis, and controlling that make relevant company data available to a broad group of users. Figure 40 shows the OLAP explorer viewing the sample sales database shipping with Microsoft SQL Server using a bar chart.
FIGURE 40 The OLAP Explorer

3 RELATED WORK
- 77 -
The OLAP Explorer runs on a multidimensional database and visualizes the results of different multidimensional database queries and operations (e.g., slicing, dicing, rollup, and drilldown) in the form of three-dimensional chart components using VRML and therefore handles multiple views on the underlying data in parallel (2D or 3D). It implements a visual component architec-ture, in which any visualization technique and interaction behavior can be implemented in the form of a plug-in component and added as an additional data view to the system. The OLAP Explorer framework exactly defines the interfaces for the plug-in modules (visual components) to implement.
3.4.2 Jamal In [Rudolph,1999,1] a system called Jamal is presented consisting of a Player JavaBean and Cus-tomizer which creates and manages interactive JavaBean Frameworks from declarative XML descriptions. The system was built upon the design principles of components and extensibility. As an XML DTD for the description of components the BML15 (Bean Markup Language) was used, which was developed at IBM Watson Research Center.
The present implementation uses Java3D for it's rendering but allows interaction between Java Components and Java Native Interface (JNI) bound native Components, of any type. One such test implementation using Jamal is a physics simulation framework built using components from MathEngine16 components.
However, the design principles abstracted from the first Jamal implementation are not strictly Java-dependent, and especially not dependent on a Java3D rendering basis, but the features of Java and it's ability to bind to native code make the combination of Java and Java layered native code a well suited implementation environment for Jamal. In particular, Java has an effective concept of Interfaces and JavaBeans provides a well-known Component model.
The Jamal implementation and many examples have been demonstrated at several X3D meetings in Palo Alto in 1999. Current plans are to modify the player to use a standardized core X3D node framework for rendering, maintaining the same declarative XML description syntax for describing interactive Frameworks, and therefore preserving the interoperability with other non-core Components. By using a simple Component Interface model any given Framework can be extended transparently to provide arbitrary features and capabilities according to the unique ex-pressive needs of particular worlds and pieces, now and in the future. [Rudolph,1999,1].
15 http://www.alphaworks.ibm.com/tech/bml 16 http://www.mathengine.com

3.4 SOFTWARE COMPONENTS FOR 3D GRAPHICS
- 78 -
FIGURE 41 The Jamal architecture and a sample implementation [RUDOLPH,1999,1]
The Jamal Architecture is illustrated in Figure 41 and consists of a Jamal Player, which parses and realizes interactive JavaBean frameworks from particular BML documents. The player is itself a Bean and functions as a realizer and manager framework for the set of all BML-defined interactive frameworks, the specific case of interest being interactive 3D worlds. It operates as either a standalone application, an applet, or as an embedded object in another application or applet. An important feature of the player, and Beans in general, is that it supports in it's inter-face the presentation of auxiliary objects for dynamic self-modification, including a Customizer for modifying the framework globally. The Customizer displays the BML document of the origi-nal playing world, and can fetch other BML documents to add to the world and modify the be-havior of the live world. The ability to add and modify a world by a very simple and compact XML message is very powerful, especially in the case of multi-user worlds. The Player/Customizer provides a 'rehearsal' environment for interactive worlds with the 'script' be-ing the current state of the BML document corresponding to the world. Since XML is not par-ticularly readable it would be very useful for sets of tools and manipulators to be developed op-erating on views of the world and it's interactions and events, and then writing out XML docu-ments to manage the Player/Customizer rehearsal 'stage' [Rudolph,1999,1]. On the right side of Figure 41 an example application using the Jamal architecture is depicted. It shows a WindChime Entity under the influence of a variable magnitude and simulated directional wind. Sound Com-ponents are associated with the various collisions of the WindChime objects. These actions are all triggered through XML messages which dynamically compose and connect the runtime com-ponents within the PlayerBean via the Customizer.
The only requirement on components able to be manipulated in Jamal and the Jamal player is to support reflection. Java supported this feature from version 1.1 upward. The implementation presented in [Rudolph,1999,1] uses Java 1.2 and Java3D as 3D rendering environment. Since Java can bind to native code via the JNI components usable by Jamal also include native classes (e.g., in the Physics simulation based on MathEngine SDK). Additional capabilities open up if the classes used are themselves JavaBeans with implied reflection features.
3 RELATED WORK
- 79 -
3.4.3 X3D Components In December 1999 at an X3D design meeting of the Web3D consortium some ideas related to the use of Components in general, and Components for X3D/VRML in particular were dis-cussed and it was agreed that some concrete proposals and examples had to be worked out to set the stage for possible implementations. The result was posted in [Rudolph,1999,2] on the Web3D Web site.
The author of [Rudolph,1999,2] states that a successful strategy for building interactive 3D ap-plications (and component applications in general) is to define a Component Interface Model as well as a declarative syntax for expressing the management of dynamic properties of Compo-nents and the event wiring of sets of Components, which follow the Interface model. The de-clarative syntax should furthermore include grammar for the expression of "set" and "get" prop-erties, method invocations, registration of names, event publishing and subscription, and for defining new Components via a declarative extension mechanism.
Another useful feature for X3D components is the definition of named collections or so-called profiles of Component Interfaces, which represent key capabilities. The design goals for such profiles are diverse.
The first two of these areas for definition, namely the Component Interface Model and the de-clarative syntax for component description, was explored in the first implementation of a de-clarative components framework called Jamal (see section 3.4.2). The Component model sug-gested JavaBeans/CORBA-Components, and the declarative syntax used to be BML: Bean Markup Language developed at the IBM Watson Research Center [Weerawarana,1999]. The cur-rent version of BML includes a declarative extension mechanism, which is equivalent in design (although not in expression) to the concept of Facade presented in the Jamal paper. Although the declarative syntax used is Java, it is not difficult to imagine an extension of similar grammar to components in any language supporting some sort of internal 'reflection' or equivalent avail-able service.
The author further states that the choice of a 'Core Profile' and a 'VRML97 Profile' are very good first choices. There has also been some mention of a GEOVrml Profile, and also a Multi-User Profile. For the purposes of illustrating Component Interface design and the correspon-dence of declarative syntax and Component Interface design, the familiar VRML97 Profile has been chosen as an example. This choice was based on the familiarity with the application do-main, and follows the current focus of the X3D design team on a declarative XML expression for the VRML97 node set.
The central design proposition is that there is a natural isomorphism able to be defined between the representations of X3D abstractions in a variety of forms:
• PROTO interface (known from VRML)
• XML document
• JavaBean Interface
• IDL interface.
The key translation is between the PROTO concept of 'field', 'eventIn' and 'eventOut', and 'ex-posedField', and the specific design pattern of named interface signatures. A consistent map from the PROTO interface to a JavaBean/CORBA Components style Interface is given in more detail in [Rudolph,1999,2].

3.4 SOFTWARE COMPONENTS FOR 3D GRAPHICS
- 80 -
3.4.4 Three Dimensional Beans In [Dörner,2000] the concept of so called 3D Beans is introduced by Dörner and Grimm, which means 3D application components using the JavaBeans component model. The need for such a component architecture has been derived from a lack of convenient authoring capabilities for 3D applications in general and the great success of component architectures for applications with 2D GUIs. However, the requirements for such 3D components are quite different than the well-known features of traditional 2D components. With 3D components more complex relations between components are necessary on a geometrical level (e.g., attaching objects to each) and on a semantic level (e.g., defining transformation hierarchies). Furthermore, the authoring environ-ment should support the interactive administration of such relationships.
To tackle this and other problems [Dörner,2000] presents the 3D Beans model and an according authoring environment (the 3D Beanbox). Similar to other component technologies, two roles are distinguished: the 3D Bean author and application author using the Beanbox, both having different requirements upon the architecture and the use of 3D Beans. Furthermore, there is a requirement that 3D Beans and non-3D Beans should be usable in the same environment. This means the 3D Beanbox has to provide a way of displaying 2D Beans. In turn, the traditional Beanbox should also be able to display 3D Beans, leading to the fact that 3D Beans also need a 2D representation. As a requirement for interaction with a 3D Bean on a semantic level the 3D Beans need to support the same features for customization and event handling used in traditional component models and authoring environments.
Since the 3D Beanbox has to enable the 3D beans to have 3D graphics representations and in-ter-component relations, they use a kind of visual container to encapsulate a Java 3D scene graph with the possibility to extend this scene graphs with visual containers from other 3D Beans. This leads to each 3D Bean having two different kinds of interfaces: the traditional component inter-faces (for compatibility with traditional component environments) and an additional interface for accessing the 3D scene graph part encapsulated in the Bean. Both interfaces are available to the 3D Beanbox. In order to have a convenient interface between behavior and visual appearance description it is necessary distinguish between task-level behavior that has no direct effect on the graphical repre-sentation of the 3D Bean and guidance-level behavior that is directly connected with the embed-ded scene graph elements and is part of the visual container. A scheduler instance is necessary to dispatch events and enable communication between the two behavior parts. As an author may wish to modify or exchange parts of the scene graph (e.g., when visually highlighting a certain part) a geometry controller has been conceived that makes these kind of actions available for the task-level behavior and also for other components that can access this functionality via the tradi-tional interface. The architecture of a 3D Bean is depicted in Figure 42. [Dörner,2000]

3 RELATED WORK
- 81 -
FIGURE 42 3D Bean Architecture
The architecture of a 3D Beanbox comprises the following entities in addition to the ones of a traditional component authoring environment:
• A 3D Beanbox scene graph
• A 3D Bean loader that inserts 3D Beans at a suitable position in the Beanbox scenegraph
• A non-3D Bean loader that equips a traditional Bean with a default 3D representation (e.g., a surface with the 2D interface mapped on one side)
• A controller that switches between geometric editing and semantic editing (event handling, method invocations, property sheets) and according editors
• A scene graph controller instance that manipulates the Beanbox scene graph and allows grouping, attaching and detaching of 3D Beans with each other
• An application writer that extracts the current scene graph together with the necessary Bean classes in order to build up the application.
The Java3D based implementation makes it possible to insert 3D Bean containers to a Java3D scene graph at Beanbox runtime (Figure 43). The access to a 3D Bean external interface is therefore achieved through a Java3D Branchbox (the only Java3D container node type).
FIGURE 43 Inserting 3D Beans into the 3D Beanbox

3.4 SOFTWARE COMPONENTS FOR 3D GRAPHICS
- 82 -
With 3D Beans the traditional component idea is transferred to authoring of 3D content for the WWW with the goal to make 3D authoring more efficient and easier.
The major advantages of the 3D Beans concept is that 3D content can be created in a virtual environment more directly and efficiently using pre-fabricated components that fit together and can be customized at runtime. The author is supported by a Bean authoring environment that itself uses information from the 3D Beans and can already execute them during authoring. [Dörner,2000]
3.4.5 Vrmlets Vrmlets are the building blocks of a component architecture for visualization systems developed in the framework of a "Diplom" degree thesis at GMD. The designation is a portmanteau word combining the two elements "VRML" and "applets", something [Nelz,1999] does not explain. In actual fact, however, Vrmlets combine Java and VRML. Software components are program parts whose functions can be accessed via standardized inter-faces. The use of software components makes the programming of complex applications more effective. Instead of having to create a full range of functionality each time new applications are developed, it is pieced together in modular fashion with existing and time-tested components. As a result, better systems can be expected while reducing development time and costs. The soft-ware components designed for use in visualization systems are referred to as Virtual Reality components (VR components). Vrmlets are VR components implemented in Java and VRML, consisting of a semantic layer and a and visualization layer.
The modeling of a car will be used in the following to illustrate the concepts of "object-oriented programming" and "components". There are large numbers of cars with different features, ac-cessories, and designs. Cars differ, for instance, in color, the number of doors they have, and the size of their engines. Despite all the differences there is a set of operations that can be applied to every instance in the class "cars", e.g. opening a door or starting an engine. Vrmlets take this into account by distinguishing between a semantic layer and a visualization layer. The semantic layer codes the logic of the application and controls its behavior. The visualization layer, on the other hand, determines the specific appearance of the component. The two layers are loosely coupled with one another, making it possible to change the visualization. The semantic layer and the visualization layer are encapsulated in the component and appear externally as a unit. The repre-sentation in the visualization layer is written in VRML, while the semantic layer is written in Java. The semantic layer carries the VRML description of the visual representation. In a runtime situation it can be exchanged for another visualization having the same interface with the seman-tic layer. The two layers are connected to one another via EAI. Complex virtual worlds can be created by combining Vrmlets. The component model makes it easy to add new Vrmlets, even at run time.
In addition to a component architecture, [Nelz,1999] also develops a multiuser infrastructure for VRML. This infrastructure, called „MUTech“, makes it possible for several users share the same virtual reality environment at the same time. MUTech maintains a local copy of the joint status of the application on each client. The system guarantees the consistency of replicated status in-formation through synchronization. Changes in a copy of the distributed status on one of the clients are immediately forwarded to all other clients. MUTech employs the principle of spatial partitioning, widely used in visual applications. In this process a scene is divided up into spatial areas (districts and zones), guaranteeing the scalability of the architecture. Each object is located

3 RELATED WORK
- 83 -
in at least one zone, but in one and only one district. MUTech uses the above-described vrmlets to describe the virtual world and for synchronization of the distributed status.
3.4.6 Contigra The name Contigra stands for "Component OrieNted Threedimensional Interactive GRaphical Applications". Contigra introduces a 3D component framework, which is mainly independent of implementation issues and allows easy, declarative interdisciplinary authoring of 3D applications [Dachselt,2001,2]. Contigra was built from the motivation to tackle the problems of dependency on specific 3D formats, the lack of design standards and missing concept of reuse in the field of 3D applications.
Similar to other component architectures it uses structured documents to describe the interfaces, assembly and configuration of the 3D components. The architecture uses XML to declaratively describe potentially complex 3D scenes built from 3D components. Using XML as description language has the advantage that hierarchical scene graphs can easily be described, transforma-tions can be applied using DOM and XML, and interoperability with other web technologies.
The Contigra framework defines 3 markup languages defined with XML-Schema:
• CONTIGRA SceneGraph: This schema is defined as an extension to X3D. It allows the implementation of a 3D component in terms of geometry and behavior, which are described separately. The set of nodes to use in the scene graph is extendible. Through XSLT or DOM the scene graph can be transformed to any other 3D scene graph format. In addition to the scene graph description there is a set of resource files (sound, textures, scripts etc.), which are referenced in a homogeneous way.
• CONTIGRA SceneComponent: This component description language defines the 3D components interfaces separately from their scene graph implementation. This ensures that the Contigra components are well suited for deployment, distribution and search. A Scene-Component description language document can contain different sections, such as rich com-ponent description, functionality, configurable parts, deployment, and authoring information. High-Level parameters can be defined by the component interface in order to hide scene graph field details. Other components can be embedded and pointers to scene graph docu-ments and available editors are included.
• CONTIGRA Scene: This is a high level configuration language for integration of Contigra components. Scene documents represent declarative descriptions of interactive 3D virtual environments. They contain a hierarchical structure of configured component instances, connections between the instances, and general scene parameters, such as cameras, lights etc.
In the first step the 3D components themselves are described using the SceneGraph and Scene-Component schemas.After distribution the components can be independently deployed. An in-tuitive GUI for deploying Contigra components is under development. This tool uses the Conti-gra Scene format as exchange format for complete 3D environments. All documents can be fi-nally transformed into a running 3D application either at configuration time or on the fly in a web browser plug in.
The overall architecture is depicted in Figure 44.

3.5 SUPPORT FOR THE DESIGN PROCESS
- 84 -
FIGURE 44 The CONTIGRA Architecture
The major achievements of the Contigra system are platform independence, abstraction to spe-cific 3D formats, component model, and a declarative approach well suited for visual tool sup-port.
More details on the Contigra 3D component framework can be found in [Dachselt,2001,1], [Dachselt,2001,2], and [Braig,2000].
3.5 Support for the design process
3.5.1 WidgetEdit In [Geiger,1998] an integrated design tool (WidgetEdit) for fast and efficient development of 3D widget geometry and behavior is presented. The resulting widgets are independent Open Inven-tor based widgets usable in arbitrary application environments.
The development of the tool is motivated by still existing technical constraints and lack of tools to support the design of interfaces for 3D applications limiting their practical applicability. Fur-thermore, the decreasing costs and increasing performance of 3D graphics hardware will lead to a growing importance of design approaches to 3D applications. The field is still lacking tools, standardized interaction elements, and design guidelines.
Typical examples for 3D widgets are handle-boxes and virtual trackballs (as used in Open Inven-tor). Since few standard 3D widgets exist, the implementation of even simple 3D interfaces re-quires the development of application specific 3D widgets.
The presented WidgetEdit tool has the goal to significantly simplify the creation of new 3D wid-gets. WidgetEdit uses the direct manipulation paradigm allowing to design widget geometry and interaction behavior in a consistent manner within an integrated design environment. To achieve this goal a number of techniques for efficient spatial arrangement of objects were integrated into

3 RELATED WORK
- 85 -
WidgetEdit that simplify the creation of widget geometry. WidgetEdit also provides a number of predefined interaction techniques that simplify the creation of widget interaction behavior. [Gei-ger,1998]
As there are still no standards for 3D widget design the characteristic iterative design process is best supported by interactive design tools for which 3 main design aspects can be identified:
• Structural design: defines the logic behind the users dialog with the application, which is de-scribed independently from geometry and interaction behavior.
• Widget geometry design: defines the geometry and graphical attributes of the 3D widgets, which typically consist of several geometric primitives to which different interaction tech-niques can be attached later in the design process. Additional functions include, e.g., relative object positioning, feedback specification, and attaching interaction behavior to objects.
• Interaction behavior design: specifies the actions that a user can perform with a 3D widget. Interaction behaviors are invoked when the user manipulates graphical components of a 3D widget through input devices. Interaction behavior can also be used to provide the user with addition visual or auditive feedback on his actions, such as e.g., selection highlighting.
WidgetEdit is based on an earlier development called AnimEdit ([Geiger,1996] and [Pa-elke,1997]), an interactive editor for the design of animated 3D objects that integrates the speci-fication of animation methods and animation parameters into the graphical modeling process.
WidgetEdit uses a four-phase design model depicted in Figure 45 to support the functionality described above and to address the special design requirements of 3D widgets.
FIGURE 45 The application design phases
Geometry Design Phase:
To support geometry design for 3D widgets, WidgetEdit provides the user with a set of prede-fined 3D-primitives (e.g., sphere, cube, cone, cylinder), standard 3D editor functionality (e.g. copy, paste, group, ungroup, manipulate) and a set of functions for relative positioning of com-ponents.
Interaction Behavior Design Phase:
3.5 SUPPORT FOR THE DESIGN PROCESS
- 86 -
In this phase WidgetEdit offers a set of predefined interaction techniques that can be attached to selected geometric parts of the 3D widget. These interaction techniques are implemented as re-usable Open Inventor components (classes and nodes) that cover both direct and indirect inter-action.
Conversion and Packaging Phase:
In this phase the internal description of the widgets geometry and behavior is converted into a portable format that allows to reuse the resulting widget in multiple applications. The use of Open Inventor’s dynamic shared object (DSO) mechanism allows to create a new node for the 3D widget that encapsulates both the widgets geometry and its interaction behavior.
Application Integration Phase:
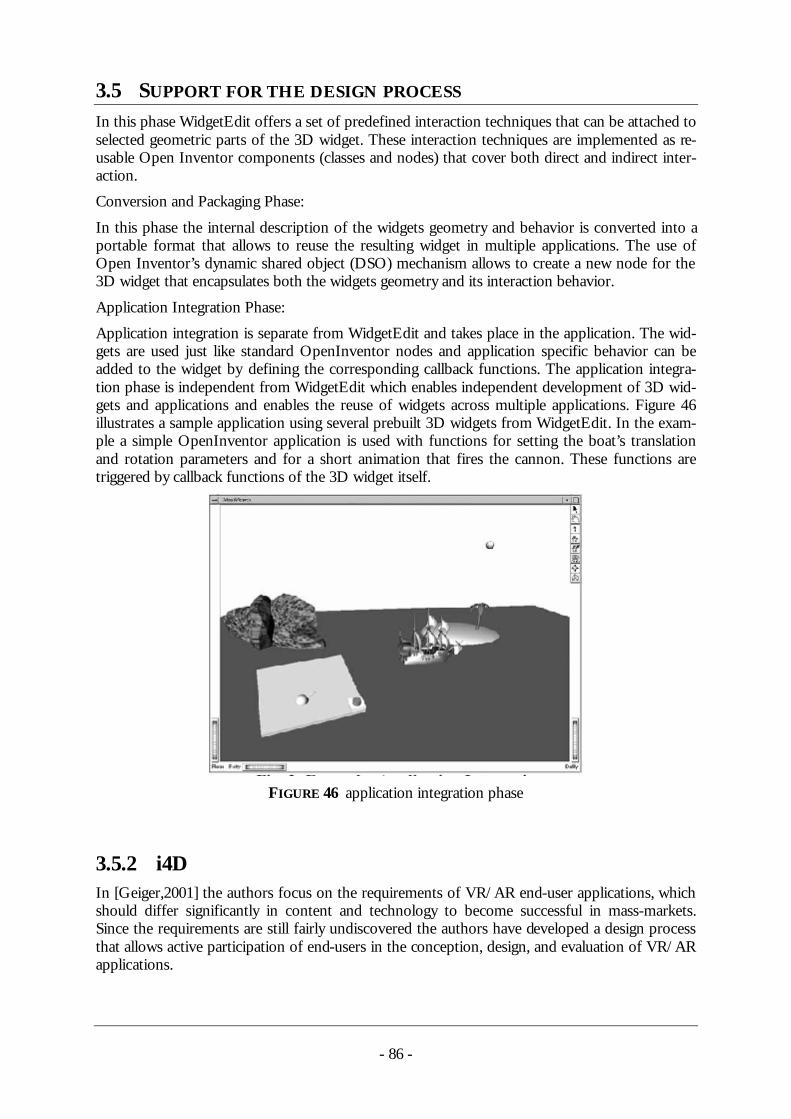
Application integration is separate from WidgetEdit and takes place in the application. The wid-gets are used just like standard OpenInventor nodes and application specific behavior can be added to the widget by defining the corresponding callback functions. The application integra-tion phase is independent from WidgetEdit which enables independent development of 3D wid-gets and applications and enables the reuse of widgets across multiple applications. Figure 46 illustrates a sample application using several prebuilt 3D widgets from WidgetEdit. In the exam-ple a simple OpenInventor application is used with functions for setting the boat’s translation and rotation parameters and for a short animation that fires the cannon. These functions are triggered by callback functions of the 3D widget itself.
FIGURE 46 application integration phase
3.5.2 i4D In [Geiger,2001] the authors focus on the requirements of VR/AR end-user applications, which should differ significantly in content and technology to become successful in mass-markets. Since the requirements are still fairly undiscovered the authors have developed a design process that allows active participation of end-users in the conception, design, and evaluation of VR/AR applications.

3 RELATED WORK
- 87 -
Furthermore a complete framework for the structured, component based design of animated VR/AR is presented that can be used in various types of applications, from desktop VR to aug-mented reality scenarios. The approach includes 3 factors:
• a design methodology for interactive VR/AR content
• high level tools for the design of visual 3D components
• a number of relevant application scenarios with the above concepts applied to
The design methodology introduced in [Geiger,2001] combines scenarios, hierarchical decompo-sition, and iterative prototyping with a conceptual actor model that fits the dynamic and proac-tive content of smart 3D environments. The actor based model was chosen because of identified deficiencies of other known models, e.g. books, slides etc. In this model all components of a virtual environment are viewed as actors roles specified by the designer. From a technical view the model is even powerful enough to support agent-based virtual environments.
The design requirements for this system - called i4D – implementing a 3D animation library for ‘smart’ virtual environments are
• an actor based metaphor supporting high level design aspects
• extendible architecture based on a component model
• independence from operating systems and graphics APIs
• efficient yet easy design support using an API, scripting interface and appropriate visual tools
An i4D scene is defined by a number of actors placed on stages. These actors can be lights, cam-eras, 3D objects, or software elements without visual appearance. Actors perform their actions (animations, messages, sound) by modifying their attributes over time. A stage is viewed by a number of cameras and displayed on a monitor. The assignment of monitors, cameras, stages and actors can be changed interactively at runtime. Similar to scene graphs, actors can be hierar-chically structured. In opposite to scene graphs attributes are parts of i4d actors (e.g. color, trans-formation, etc.). Since actors can be 3D objects, cameras, or lights the architecture allows to build e.g., intelligent virtual cameras based on cinematographic knowledge or smart spot lights that automatically highlight important parts of the scene.
The complete animation system was designed to run seamlessly with various systems (e.g., simu-lation systems, multi agent systems) even across networks. The framework therefore allows to manage different components in a flexible way at runtime and provide structured and open inter-faces to existing component technologies, such as Microsoft COM. i4D worlds can be saved in an XML compliant format for reuse in other projects.
To ensure i4D’s independence of operating system and graphic API it consists of 2 parts. The main part consists of a platform/graphics library independent management system called I-layer. The other layer I0-layer encapsulates platform and library specific code. An adaptation of the system to a specific environment only requires a modification of the IO-Layer.
To support rapid prototyping a script binding (e.g., for Tcl/Tk, Python, Perl) is implemented to allow the an interactive design of the virtual environment without recompiling the application. Based on this binding a visual editor for design of i4D scenes was also developed, which can save and restore i4D worlds in an XML format (Figure 47).

3.5 SUPPORT FOR THE DESIGN PROCESS
- 88 -
FIGURE 47 The i4D systems visual editor
The component based architecture (Figure 48) for the i4D system requires the management of various issues like selection, parametrization, and execution of components.
FIGURE 48 i4D architecture
The functionality of this management unit includes:
• Platform dependent layer: A major part of the management unit was developed independ-ently from existing standard libraries and only a small part provides the functionality to ac-cess specific base libraries.
• Message Handler: Access to components is basically provided using structured messages.
• Repository Unit: All used objects and object types that are presently available in the system are registered by storing their name, unique identifier and access path.
• Component Loader: This unit allows the insertion of new objects and object types into the system and to delete them.
• Execution Unit: This unit handles the execution of all actions that appear in the system in-cluding time consuming functions (e.g., animations) and instant modifications of system ele-ments.

3 RELATED WORK
- 89 -
• Virtual Time Unit: By providing a virtual time component the i4D execution unit has full control over all actions in the system.
3.6 Other related work In this section several other systems and publications dealing with the information visualization process to some more or less generic level are presented. Most of these systems are a combina-tion of the concepts presented in the preceding section using different approaches and could not be included into this thesis in more detail due to spatial restrictions. Some of them, however, are worth mentioning to get a more complete overview of work related to the topic of this thesis and because they impose a significant contribution in one ore more sub areas of the field of in-formation visualization.
Since information visualization is today recognized as an increasingly important sub discipline of Human Computer Interaction (HCI) [Myers,1996], it focuses on advanced graphical techniques and mechanisms designed to support the presentation of the structure of information and to improve the cognitive efficiency of accessing large and structured data repositories. In its tradi-tional and often printed form, information visualization has been used in areas such as the dis-play of numerical data collections (e.g., bar charts, pie charts, surface charts, etc.), geographic data (e.g., color encoded maps) [Bertin,1983][Tufte,1983][Tufte,1990], or combinatorial relations (e.g., graph drawing). With the era of computer based approaches came such systems as the In-formation Visualizer [Card,1993] or Dynamic Queries [Shneiderman,1994], which have added the dimension of interactivity and some new visualization techniques (e.g., 3D).
Other information visualization systems, such as APT [Mackinlay,1986] or SAGE [Roth,1994,3] have dealt with the aspects of automatic generation of visualizations based on the semantics of the underlying data rather than only on the visualization part (e.g., APT automatically visualizes functional dependencies in a relational database). Other work on the automatic generation of graph drawings takes into account certain graph characteristics (such as planarity), drawing style, aesthetic criteria (e.g., area minimization, display symmetry) [Cruz,1994] [Battista,1994].
Other approaches to information visualization having a more declarative nature allow the user or developer to specify what the presentation space looks like but do not specify how the display is generated from the specification. These approaches mostly combine descriptions of constraints with formalisms, such as grammars [Cruz,1987] [Golin,1991] [Weitzman,1993]. More recent work on declarative and constraint based generation of information visualization but with a strong focus on generating animations is found in [Takahashi,1998] and [Takahashi,1994].
One of the areas in which information visualization has been adopted quite early is the field of databases. Visualization was introduced there for displaying the schema and the database in-stances as well as to perform visual queries [Batini,1991]. Early work to be named in this context is QBE [Zloof,1976] and ISIS [Goldman,1985]. More recent work is represented by the G+ [Cruz,1987] and Hy+ [Consens,1992] systems an QBD* [Angelaccio,1990]. Many of these sys-tems implement a repeatable two-step process of first specifying the query and then visualizing the results, which allows only sets of predefined visualizations. As encountered in most informa-tion visualization systems, database systems do not support the specification of visualizations according to the applications or end users requirements.

3.6 OTHER RELATED WORK
- 90 -
3.6.1 Starlight The Starlight Information Visualization System [Risch,1997] (http://starlight.pnl.gov/) by Pa-cific Northwest National Laboratory (Starlight) is an information system that couples advanced information modeling and management functionality with a visualization-oriented user interface. Starlight’s approach makes existing relationships among information items visible in the system and enables various forms of information access, exploitation, and control. Starlight longs to combine several novel and conventional information visualization capabilities into a single, inte-grated, information system supporting a broad range of analytical functions. Furthermore, Star-light’s visualization tools use a common XML-based information model capable of effectively capturing multiple types of relationships that may exist among information of various types. To-gether, these features enable a flexible visual analysis of a wide variety of information types re-sulting in a system capable of both accelerating and improving understanding of the contents of large, complex information repositories.
FIGURE 49 The Starlight Information Visualization System
Within Starlight, interactive information based graphics are a key concept of the user interface, enabling users to graphically manipulate the information at hand and to quickly customize the information displays based on their individual requirements.
Starlight information graphics are classified into the two categories of non-spatial information graph-ics, which are spatial representations (or "spatializations") of non-spatial information such as text and numeric data and inherently spatial information graphics, which display information containing intrinsic spatial coordinates, e.g., geospatial or CAD data. The Starlight system is able to integrate these two types of information so that they may be analyzed together (see Figure 49).
3.6.2 OpenDX OpenDX [Thompson,1998] is the open source version of the IBM Visualization Data Explorer (http://www.research.ibm.com/dx/). The Visualizations Data Explorer from IBM was discon-

3 RELATED WORK
- 91 -
tinued with the last version being 3.1.4B and went open source immediately afterward. It is now available for a multitude of platforms.
Open Visualization Data Explorer (OpenDX) general software framework for scientific data visualization developed at IBM T.J. Watson Reseach Center. The package uses an extended data-flow client-server execution model and simplifies the implementation of visualization applica-tions with potentially multiple simultaneous views on disparate data sets for correlative visual display. The server process is entirely responsible for all calculations within the data visualization process. OpenDX is based on a powerful unified data model that describes and provides consis-tent access mechanisms for arbitrary data sets to be analyzed independent of shape, rank, type, mesh structure or dependency or aggregation. Therefore, regular, irregular structures and un-structured data are uniformly supported by this data model.
Visualization techniques have been applied to gain new insights into data using OpenDX in sev-eral areas such as science, engineering, medicine and business. OpenDX offers a rich set of tools for manipulation, transformation, processing, realizing, rendering, and animating data. It sup-ports multiple geometrical analysis methods such as points, lines, areas, volumes, images or geo-metric primitives in any combination.
FIGURE 50 An example for an OpenDX application
Figure 50 displays an example for an OpenDX based application for visualizing stratospheric ozone depletion and the phenomenon called the polar ozone vortex [Treinish,1995].
Data Explorer is deployed as a set of API’s and corresponding tools and is therefore application domain independent and easily adapts to new applications and data. The object-oriented graphi-cal user interface is intuitive to learn and easy to use.
3.6.3 Other frameworks and systems Some other significant work in addition to the described systems in the area of 3D widgets shall be in short referred to. In [Schönhage,2000] Schönhage et. al. describe a system, which takes a 2D visualization of a real business process and provides an according 3D visualization composed

3.6 OTHER RELATED WORK
- 92 -
on the basis of a set of lower level 3D gadgets (UI elements). For each gadget the requirements and design trade-offs are discussed and the usability of their behaviors (e.g., brushing, grouping, drill-down) is tested. This work significantly narrows down the purpose of the 3D user interface elements by providing a very restricted and well-known application scenario to get a set of very crisp requirements matched by a clear set of behaviors.
Other well recognized work in the 3D widget area is presented by Zeleznik et. al. in [Ze-leznik,1993]. Using former experience in manual 3D widget design on the unified graphics archi-tecture (UGA), the authors have developed an interactive toolkit for support visual programming of geometry and behavior of interactive 3D models. The toolkit provides a set of core 3D widget primitives for constructing interactive behaviors defined by constrained affine transformations and an interactive 3D tool to combine them to potentially complex widgets. The clear bias of this work is on conceptual structure of 3D widgets, selection criteria for the widget primitives, and constraint relationships among the primitives.
Preceding their work on i4D, Geiger et. al., have also described a design environment for 3D widget construction in [Geiger,1998] that enables fast and efficient development of both 3D widget geometry and behavior. The resulting 3D widgets are independent OpenInventor com-ponents that can be used in arbitrary applications.
In the area of information visualization frameworks the work of Kreuseler et al [Kreuseler,2000] can be mentioned, in which the concepts of a scalable information visualization framework are described. Aiming at enabling users to explore heterogeneous information spaces at an arbitrary level of detail, this work uses preprocessing techniques, combinations of various graphical inter-faces to implement dynamic hierarchy computation and user controllable hierarchy refinement. It furthermore introduces a novel Focus+Context visualization technique for complex graph structures and a graphical interface that uses textual similarity measures to automatically layout the information in 3D space.
Another work in the area of information visualization frameworks is [Bender,2000] by Bender et al. The authors observe that several specific system implementations in the information visualiza-tion area have the drawback of being highly dependent and limited to a restricted number of users. Therefore, they propose a functional development framework for general web-based in-formation visualization systems. To demonstrate the frameworks features, two practical visuali-zation tasks have been applied and evaluated.
In [Trapp,1997] a prototype for a Web based visualization service is introduced using the tech-nologies of VRML and Java. The service delivers VRML worlds to a client upon request, in a similar fashion to a HTTP server delivering HTML files. The prototype solves principal technical problems and serves as a feasibility study for an open service provided to WWW users and a platform independent access to visualization methods.
In [Zeleznik,1991] Zeleznik et al present an object oriented interactive modeling and animation framework, which can be used to integrate various simulation and animation techniques. The presented system clearly focuses on modeling 3D object animations over time. Animations can be described in various ways including scripting, gestural, and behavioral specification. The paper also deals with issues in interaction modeling. The object oriented system architecture uses mechanisms such as data dependency networks, lazy evaluation, and caching to facilitate interac-tion performance.
Stevens et. al. present an architecture for an extensible toolkit for the development of 3D inter-faces and 3D widgets [Stevens,1994]. The toolkit allows the combination of directly manipulative 3D primitives through a visual programming language to create complex constraint-based behav-ior. It supports building, encapsulating, and parameterizing complex 3D objects. The constraints

3 RELATED WORK
- 93 -
are resolved on the basis of a dynamic object model using delegation. The toolkit has been used in the areas of scientific visualization, 3D widgets, and mathematical diagrams.
The Alice system, presented in [Conway,1994] by Conway et. al., is a rapid prototyping system for the creation of 3D graphics simulations in virtual reality environments. The presented system uses the Python script language to implement the interaction behavior. This offers users a richer set of design options than a traditional compiled language API.
The NCSA VisBench [Heiland,2001] (NCSA Visbench, http://visbench.ncsa.uiuc.edu) provides a software environment for visualizing massively distributed and large data sets. It is a compo-nent based visualization system providing access to back-end visualization services. Client appli-cations are available for several desktop operating systems, CAVE or other immersive environ-ments, and for completely Web-based environments. Collaborative clients support shared data exploration and analysis for distributed work.
3.6.4 3D Game engines The following descriptions of 3D game engines is based on articles presented on http://www.angelfire.com/indie/jetstream/. The two engines presented are free representatives for a type of application frameworks mainly designed for use in 3D computer game develop-ment. Their underlying concepts, however, are powerful and general enough to be used in vari-ous application scenarios with demand for real time 3D visualization.
3.6.4.1 Fly 3D Fly3d17 is a 3D game engine being written as a companion to the 2nd volume of [Watt,2003], which was released in early 2003. The current version is Fly3D 2.0.
Fly3D differs in its approach to creating games from most other 3D engines. Whereas most en-gines expect you to provide your own game shell, Fly3D has been designed to allow you to plug in your game elements into an editor. This editor produces a .fly file that is then loaded directly by the engine. The result is that you don't have to worry about creating code to load a level, place entities or setting their default properties. Some might see this as a restriction, but in my experi-ence having this functionality saves a lot of time and lets you get on with the task of creating your game.
Fly3D achieves this plug-in functionality by isolating game code in separate DLL files. It's possi-ble to create a game using Fly3D without typing one line of code through the DLL's provided with the engine. You can simply define the level to use and create a few entities in the editor, and you have your game. It's really that simple. Fly 3D provides a full C++ API for crating own game plug-in DLLs.
Fly3D is heavily biased towards creating indoor Quake style games. Unlike any other download-able 3D engine it provides a fully functional BSP/PVS renderer. PVS stands for Potentially Visi-ble Set, and is the culling technology used by some of the latest games, like Quake 3. It allows a game to display complex indoor environments at maximum speed. Fly3D even includes a Quake 3 map converter, so any Quake 3 level editor can be used to make maps. Of course Fly3D is not limited to creating just FPS. Fly3D also includes support for large terrain rendering, allowing you to create pretty much any game. 17 http://www.fly3d.com.br

3.7 ANALYSIS AND DISCUSSION
- 94 -
Another area where Fly3D excels is in its support tools. It comes with a Microsoft Visual Studio 6 plug-in, a Quake 3 map converter and a general purpose editor to piece game elements to-gether. Fly3D also comes with an exporter for 3D Studio Max 3 and 4, allowing to create game models and levels using Max.
Fly3D furthermore provides an outstanding selection of collision detection methods which allow for robust collisions for moving models, their bounding boxes, or rays.
The source code to the engine will be released with the book and the engine can be used free of charge and royalty free in own projects.
3.6.4.2 The Nebula Device The Nebula Device18 (TND) by Radon Labs GmbH is a free, open source engine released by Radon Labs, a German games development team currently working on Nomads. TND is unique in that although it is the basis for a commercial project, Radon Labs have decided not only to give it away for free, but also to give away the source code. The major benefit of this approach is free advertising. Secondly, opening up the code not only forces a team to write nice, clean code, but also allows others to provide constructive comments and improvements.
For game developers, TND offers a very capable 3D engine, with a number of interesting fea-tures (pulled directly from the Radon Labs web page):
• it's completely free • an integrated scripting system • a channel based animation system • modern architecture • powerful console
For the developer the fact that TND can be used with absolutely no cost is a big bonus. All Ra-don Labs asks is that you leave some copyright information intact.
The Nebula Device comes with an integrated scripting system, and the examples that come with the package to demonstrate a good selection of the engines capabilities using TCL scripts (with a very basic C++ application as a general launching point). The engine, however, is not limited to TCL. The latest version of TND supports Python and Lua as well.
TND is unsupported by its authors, which means documentation is scarce. TND's script com-mands all have a short description in some automatically generated API documentation, but there is very little documentation for the C++ side, and few examples. While you can get quite a bit of support on the message boards (with the TND developers themselves regularly answer questions), this can be a frustratingly slow way to move forward with a project.
3.7 Analysis and discussion In this section the concepts, techniques, frameworks, and applications described within the last chapters are assessed for their general applicability, reusability and bias for supporting the design and implementation of information visualization applications. In the section that follows this one
18 http://www.radonlabs.de/

3 RELATED WORK
- 95 -
the requirements and goals of the present thesis are derived from the particularities and deficien-cies observed in the projects analyzed.
Fixed Metaphor Systems
Many of the presented visualization systems (especially the techniques from chapter 2) use a fixed visual metaphor such as the cone tree or the perspective wall. Due to this fixed metaphor it is implied that the data sets and their mapping to the parts of the visual metaphor are themselves also quite restricted.
As an example, the LyberWorld application (see section 2.9.2.6) helps users carry out searches in large document collections. The underlying idea can be used in different contexts, but is particu-larly well suited for document management. The use of LyberSphere, however, presupposes the existence of data with weighted relations (relevances) between objects. As such, it cannot be used for arbitrary data structures. The mechanism for mapping to the three-dimensional visual meta-phors LyberTree, LyberSphere, and LyberRoom is specifically designed to visualize a search process and the related context and is, thus, not configurable or adjustable, but rather rigid in structure. For this reason information visualization applications using fixed visual metaphors are not well suitable for the task of generically mapping underlying data to visual metaphors.
Extensions to existing scene graphs such as VRML
The Server Side Include, SQL Runtime Node and Trigger Server (see section 2.7) mechanisms are very general technologies that can be used in principle for the realization of any visualization applications. Both the implementation of the SSI mechanism and the trigger server are based on extensions of the Informix Dynamic Server (IDS) database system, the so-called „DataBlades“. They can be used together in a single DBMS. Each of the three mechanisms includes the realiza-tion of a prototype scenario for the purpose of implementation testing. However, the various mechanisms were never used jointly in a single scenario; they also failed to see further use in other projects. This may be a result of the fact that the implementation carried out was specifi-cally for VRML and required the execution of Java code on clients so that a new implementation would have been necessary for use with X3D, for instance. In addition, it would seem to make sense to export the data needed for a scene from the database all at one time and to insert it in the scene, instead of generating special VRML nodes in the scene during the mapping process, which then access the database once again in the runtime situation to display the data. A sound scenario, on the other hand, would be the generation of a scene with the help of the SSI mecha-nism containing SQL Runtime Nodes and External Sensor nodes so that the scene is persis-tently synchronized with the database. In the case of the SSI mechanism, part of the process of mapping data to visual objects is explicitly coded in the syntax of the SQLServer-Includes nodes. This makes later changes difficult.
While these mechanisms can be quite useful in very special cases of information visualization applications and can furthermore be quite powerful when used together in one application sce-nario, they are not synchronized to each other to function as a whole. They could, however, be used when implementing higher-level 3D component frameworks.
Metaphoric Systems
The Virgilio system takes a generic approach that has found use in other past projects. The ap-proach deals primarily with the modeling of structured queries and the automatic finding of structurally sustainable mappings to visual metaphors. The modeling of visual objects and exten-sion of the system with new objects of this kind is looked at in less detail. The breakdown of visual objects into the classifier, aggregator, accessory and decorator type categories was taken from object-oriented design, but seems arbitrary in connection with visual objects. E.g., in

3.7 ANALYSIS AND DISCUSSION
- 96 -
addition to restrictions on numbers for the inclusion relation of classifier objects, restrictions to certain instances of other visual objects would be possible as well. Multiple roles for a visual ob-ject should also be considered, e.g., being a classifier and at the same time an accessory. The pro-totype implementation of the Virgilio system for the SGI platform has not seen any further use.
Systems like Virgilio, which concentrate on the automatic generation of mappings for visual metaphor, were mainly researched at the University of Bari, Italy [Paradiso,1996] [Paradiso,1997] [L'Abbate,1998]. The problem can be subsumed as follows: Given a data structure and a set of visual objects with visual and structural properties and visual and structural constraints, try to find a mapping that maps the data structure to an corresponding set of visual objects. However, since the properties and constraints for the visual objects are already chosen with some seman-tics for the upcoming mapping task in the back of mind, the outcome will be quite predictable. Furthermore the application designer does not have any (declarative) control over the resulting mapping other than some simple rules. Experiments with the Virgilio system have shown, how-ever, that desirable general automatic mapping results are very hard to achieve by a set of simple rules. Because the problem seems very complex a system would definitely need some "intelli-gent" approach taking into account the users profile to achieve controllable results.
The cyber:gallery system uses a different metaphoric approach for the realization of generic information visualization systems in which the mapping of the database content to visual meta-phors is implemented in the form of a parameterable scene construction algorithm. Each visual object is able to add its own visual representation to the virtual scene or to remove it from there. In addition, it has information on what kinds of visual objects and how many can be contained in it (i.e. can occur in the tree structure directly below it). The overall mapping rule is distributed over the entire tree structure of the visual objects in the form of scene construction methods. This approach is very flexible, but requires considerable effort, when the system is to be ex-tended by further new visual objects, given that the scene construction strategy has to be newly implemented in each case. A further technical disadvantage of the systems implementation is that scene construction is carried out on the client in a runtime situation by means of Java interpreta-tion. On the one hand, this can lead to performance problems on the client; on the other, the scene graph is generated redundantly in this way, i.e. once by the scene constructor component as a tree structure of the visual objects in Java and again in the VRML viewer as a VRML node.
Since the scene construction algorithm is hard coded in this approach, the mapping of data to the visual metaphor is limited through the construction algorithms set of parameters. This is, however, a first step towards an arbitrary definition of a mapping to a given visual metaphor. It is only a semi-declarative approach because only the list of parameters could be declared.
Object Oriented 3D toolkits
The OO 3D toolkits presented in an earlier section are all settled above the functionality of well-known graphic libraries such as OpenGL or Direct3D. They typically introduce higher-level graphical concepts like scene graphs and mechanisms for animation, interaction and object be-havior. By using such concepts the design and implementation of 3D visualization applications is dramatically simplified compared to using a 3D graphic library. However, all these toolkits and frameworks merely support the structured definition of the presentation space to which informa-tion can be potentially mapped. No description for any information mapping nor is any concept for data binding given.
Therefore these toolkits are very well suited to implement interactive, animated 3D visualization applications but do not support the process of information visualization. On the other hand the toolkits can be used to provide a sound basis for building an information visualization frame-work, such as the one presented throughout this thesis.

3 RELATED WORK
- 97 -
3D interaction elements
The projects and publications presented under the category of 3D interaction elements mainly addresses the problem that – unlike the 2D GUI domain – in 3D there exist no standard interac-tion elements with corresponding metaphors like the typical 2D widgets (buttons, menus, etc.). These concepts also clearly concentrate on the user interaction side and the graphical representa-tion within the presentation space of an application. While providing the potential to encapsulate behavior, which could be characterized as information binding, they do neither present the abil-ity to describe the information mapping process nor do they provide any standard interface de-scriptions for data mapping. 3D widgets can be viewed at as a higher level grouping of elements found in the OO 3D toolkits, such as geometry, animation, and interaction with the goal to in-troduce well-usable and reusable graphical components to users of 3D applications.
3D Components
3D Component frameworks, such as e.g. Vrmlets or Contigra components, as presented in an earlier section are also a very generic and high-level approach to the realization of visualization applications. These components mostly introduce architecture to encapsulate appearance and behavior of 3D objects plus a runtime environment to embed and execute the components. As an internal representation these components often encapsulate scene graphs and scripts or be-havioral code. These 3D components expose interfaces to the outside environment, which are definable by the component developer. An application developer then typically builds complex applications using these components together in the application environment. The aforemen-tioned 3D widgets could, e.g., be built using such a component framework (which is actually done by Contigra).
Here, too, the actual information mapping process was given little attention. Every 3D compo-nent contains its own visual representation – or in the case of Vrmlets an SQL statement which exports a string representation of this kind from a database. However, it is not clear from a con-ceptional standpoint how it is determined what kind of data is mapped to what kinds of different components. A subsequent Diploma thesis took up this problem and developed the use of Vrmlets further. Using a Prolog interpreter and taking quantity constraints into account, a map-ping rule was found that automatically maps an underlying database structure to a virtual exhibi-tion tower. This, however imposed the same problems mentioned earlier for the Virgilio system, which is using similar techniques.
Support for the design process
The tools presented under this section provide a design environment for creating 3D applica-tions from 3D components or widgets using a visual environment and intuitive visual tools. These can be understood as support tools for given 3D component frameworks or widget archi-tectures.
Conclusion
After having taken a closer look at the presented systems and performing a high-level analysis of the supported features, it can be stated that most systems have a clear bias to supporting the visualization aspect of information visualization applications rather than the information visualization aspect or the mapping aspect. They clearly focus on objects within the presentation space (PO). The work in the area of OO 3D toolkits concentrates on providing efficient data structures to model the presentation space including behavior and interaction. They provide support for visu-alization on a level above graphic APIs. This is also true for the work on 3D component frame-works and 3D widgets. They, however, introduce a further level of abstraction by encapsulating appearance and behavior within components, allowing the application designer to use the de-
3.7 ANALYSIS AND DISCUSSION
- 98 -
fined interfaces without having to cope with scene details. The 3D game engines provide even higher level concepts by pre-defining certain components within a given component framework, especially suited for the use in 3D games.
Although other systems, like the described fixed metaphor systems, the metaphoric systems, or the automatic visualization generators describe the mappings between information space and presentation space, they either hardcode them or provide a parametric or constraint based ap-proach, imposing severe constraints to the mapping. These systems therefore lack the ability of freely defining the mapping process.
Again other systems define the mapping rules but constrain them to certain features of the pres-entation space like animation in [Takahashi,1998].
General (declarative) definition of mapping of information on these scene graphs or components is possible but not directly supported by any specific mechanisms. It can be said that these frameworks describe the targets of the information visualization function (the presentation ob-jects) but not the sources and the transition between the two.
Most of the systems presented also don’t use the concept of data sources. They either depend on the application programmer to interface the data source (e.g. a DBMS) or depend on given data sources fixedly connected with the environment. Clearly, none of the approaches supports all types of data sources (relational DBMS, e-mail, Web pages etc.) in a generic way.
Some mechanisms of e.g. 3D components are also required within a broader information visualization framework as presented in this thesis like providing an abstraction for the decoupling of visual semantics and the visual appearance of presentation objects. All pieces of our formal information visualization model need to be defined separately in order to be able to exchange any of them. For example in an application it might be desirable to keep the presentation objects due to the familiarity of the user with the visual appearance and also keep the underlying data source, but exchanging the mapping definition for expressing a different scenario. The generation of the presentation space resulting from applying the IVIS function to the in-formation space is not in all cases desired to be performed in one single step. In many applica-tion scenarios, like e.g. cone trees or fisheye view, the resulting presentation space can become fairly large bearing a huge computation load on the target machine. Some of the presented works, like the 3D components, at least provide a development environment suitable for the definition of such visual scaling mechanisms. However none of the presented concepts directly supports such features.
As already mentioned some systems are potentially able to define and use 3D widgets, in which case it would be highly desirable to have interactions with visual objects, which not only manipu-late the visual attributes of these objects but have an impact on the information space itself. In a 3D GUI this would be surely needed since the semantics of the 3D widgets would be defined to control the potentially persistent state of the application. None of the systems, including the 3D widget approaches generally supports such mechanisms. All 3D widget models simply provide visual state information by exposing correspondent interfaces.
Since all these systems concentrate strongly on the presentation side they are also only extendible on this side with a reasonable effort. The effort of adding the feature of a general mapping mechanism or generic data binding mechanism would need significant effort in programming new entities.
At last, although the feature of animation is supported by some of the systems it is again only used in the presentation space. No mechanisms are provided to map logical series of information

3 RELATED WORK
- 99 -
(e.g., time series) to subsequent states of visual objects (e.g., animation sequences). The only sys-tem supporting this is described in [Takahashi,1994].
Having analyzed the features and deficits of the presented systems we are now ready to explore the requirements on a generic information visualization system.
3.8 Derived requirements and objective In the analysis it was shown that the systems described in the preceding chapters describe vari-ous concepts and mechanisms supporting different aspects of the development of 3D informa-tion visualization applications. It was furthermore observed that all these systems rather support the visualization part of the information visualization process than the mapping of data to the presentation space. It would therefore require a considerable effort in time and resources to de-velop a complete information visualization application using any of these systems; the mapping of the information objects and their structure (see section 1.4.2) to the presentation objects would have to be hard coded for every application. We have experienced this in our own pro-jects, namely LyberWorld, cyber:gallery, OLAP explorer and a couple of experimental but un-published applications. Each of these applications required a considerable amount of redesign and new programming to achieve the desired functionality resulting in long development phases, even though the systems are only prototypes.
Therefore, the distinct objective of this thesis is to provide concepts, mechanisms, and tools to support the full process of information visualization (as introduced in detail in the next chapter) with a declarative approach including descriptions of the information space, presentation space and mapping functions between them. All experience from own projects and from observing state of the art visualization techniques as well as related work in the area of 3D IVIS frame-works should be considered. More practically spoken, the system provided should be able to support the design and development of all the above scenarios (and all future scenarios) in such a way, that there is a significant improvement in development time and resources spent in com-parison to a hard coded solution or the usage of the presented frameworks. In other words: it should go significantly beyond the existing state of the art approaches.
In order to achieve this objective, our experience from the past and careful analysis of the system features of well-known related systems (section 3.7) have shown that at least the following re-quirements must be given special consideration:
• Declarative approach to mapping: The structured information space, the presentation space as well as the mapping from information objects to presentation objects should have a declarative description, complying to well-known standards as far as possible. This en-sures broad API and tool support, to leverage a fast and efficient development proc-ess and facilitate an exchangeability of the descriptions across different applications. Furthermore, this approach makes the descriptions independent of the actual imple-mentation environment.
• Abstraction from the data source: The system should be able to visualize any kind of data, existing in any structured form. This should be independent not only of the DBMS but also of the data schema used.
• Separation of the mapping definition from the object and scene description: This objective cannot be fully achieved, since the data is presented in the form of object features and the

3.8 DERIVED REQUIREMENTS AND OBJECTIVE
- 100 -
mapping definition has to somehow refer to these target features. However, mapping to the entire 3D scene as in the case of the SSI mechanism should be generally avoided. We will later see how the encapsulation of the variable object features in an Interface leads to an improvement in the ease of application and clarity of the mapping definition.
• Decoupling of visual semantics and visual appearance: The visualization objects must be inter-changeable while retaining their semantics and functionality. This can be achieved through encapsulated visual objects reusing the same interface definition.
• Dynamic generation of scene segments: Since the construction of a 3D scene based on a complete set of data may take a very long time to complete and the performance of a 3D viewer drops off in the case of very large and complex scenes, it should be possi-ble to break the scene down into a number of smaller scene segments. The latter are then called up as needed by means of user interaction in the scene or predefined pro-gram behavior.
• User interaction at the semantic level: Interaction should not be limited only to actions and reactions in the scene. The actions of the user must also be able to have an effect at the application level, if the information visualization system is used, for instance, to create a graphical user interface (GUI).
• Persistence and active data: The interaction discussed in the previous item should be able to result in a change of values in the data repository. These changes must be stored permanently and be visible to other users. For this purpose a mechanism such as that of the trigger server (see section 2.7) is desirable so that changes in the database can be directly propagated to all clients who can then visualize the changed items of data.
• Extendibility: Extendibility must be guaranteed at all levels of the mapping definition. There should be a possibility to connect new data sources to the system. Independ-ence of any specific data schema has already been mentioned. It should be possible to define new visual objects and their interfaces. It must be possible to combine existing visual objects in various combinations to form different new worlds. Finally, it would be desirable for existing mapping definitions to be extendible by adding further map-ping rules.
• Generic, manually configurable mapping menchanism: The mapping of an item of data to a given feature of a visual object should be freely selectable and restricted only by a data type check. An individual item of data should be mappable to several attributes and to different objects. The process of defining a mapping rule should be an intuitive, man-ual operation. It must be possible to modify established mapping definitions by means of the same kind of intuitive operation.
• Animation: Underlying data should be mappable directly to attributes of visual objects (such as color, size, and position) as well as to time-related changes of such attributes. This makes particularly good sense when the original data is available in chronologi-cally structured form, e.g. the quarterly results of a company.
The requirements for a generic information visualization system could be expanded at will. The requirements listed above are among the most important. A complete solution and the realiza-tion of all items would go far beyond the framework of this work. In Chapters 4 and 5 a number of these requirements are taken up, various solutions discussed, and a corresponding implemen-tation realized.

4 MODELING AND DESIGN
- 101 -
4 Modeling and design In this chapter a system is designed and modeled that will be able to comply with most of the requirements outlined in the previous chapter. In an initial step a theory and conceptual model behind information visualization is presented. Next, the general information visualization proc-ess is presented at an abstract level based on these theoretical concepts. After that the general model is delineated on the basis of a number of requirements and the IVIS system model is de-scribed. Finally, the IVIS system model is broken down into different components and an analy-sis carried out as to how these components will be able to satisfy the desired requirements.
4.1 Information Visualization: Theory and Model The main topic of this work is the support of the information visualization process for struc-tured information spaces. Since this is a rather new field within the area of computer science there is still a lack of a clear terminology. Within this section we will present an appropriate ter-minology on which our information visualization model is based.
This model is based on the work presented in [Wünsche,1997] and the information model in [Wendt,1991], which both present a sound basis for the information visualization terminology, model and the concepts.
For much used and often recurring terms symbols are introduced (e.g., ISP for Information
Space), which are described in terms of set theory. This formalization approach not only helps to keep things short but also aims at bringing more clarity to the subject. That means e.g., ISP is a
representative of the propositions stated in the corresponding definition.
4.1.1 Information In order to be able to define the term information visualization it is perceived to start with un-derstanding the term information.
The term “Information” is used across many different scientific domains, which makes it hard to find a coherent definition, especially if all the different views regarding the term are considered. Moreover, compliant with the spirit of the information age, completely new scientific branches and studies arise, such as “international information management”, “information resource man-agement”, and “information ethics” [Capurro,1995].
The view and the definitions presented in this chapter could therefore be categorized as subjec-tive. However, they have been developed in such a way, that they are not restricted to this work

4.1 INFORMATION VISUALIZATION: THEORY AND MODEL
- 102 -
or even the domain of information visualization, but can also be used in other, similar problem domains.
In 1948 Shannon already presented a complete theory to determine the effectiveness of a techni-cal medium to transmit electrical signals. Based on this theory Wiener later introduced the terms information, entropy and negentropy. Since this information term is used in a very broad fash-ion, the scientific branch of the information theory based on Shannons approaches is often called Shannon’s Theory or Theory of Communication.
The theory of communication deals with exactly defined electrical signals that occur with a cer-tain probability. This means that no propositions concerning the content, the meaning or the purpose of the signals are stated, i.e., the theory of communication deals with the quantitative aspect of messages [Philippow,1987] [Wendt,1991].
However, the scientific branch of information visualization deals with qualitative aspects of in-formation, which means that the theoretical part of this thesis should not be based on Shannon’s communication theory. A more appropriate view on the information-term with respect to in-formation visualization is given by Wendt in [Wendt,1991]. All statements marked with (*) were taken directly from [Wendt,1991], subsequently modified according to the goals of this thesis, and finally formalized and clustered into definitions.
The starting point for defining the information term is the following definition:
Definition 1: Information is everything knowable. Information can be stored, transported, and processed (*)
The term Information can be further subdivided into perceived, communicated, received, deducted, and lost information (see Figure 51(*))
Percieved information
Communicated information
Deducted information
Received information Perception
Interpretation
Lost information
Processing
Forgetting
FIGURE 51 The Information-Term (*)
The following definitions concern these different types of information:
Definition 2: Perceived information is Information, which is gained through sensual perception. (*)
Definition 3: Communicated information is the result of the interpretation of the perception. (*)
Definition 4: Received information is composed of perceived information and communicated information. Thus it is possible to omit the communicated information but never the perceived information. (*)
Definition 5: Deducted information is additional information, which is gained through the available informa-tion. (*)
Definition 6: Lost information is information which disappears (e.g., out of the human memory). (*)
In [Schumann,1997] information is furthermore classified into presentable information and non-presentable information. Presentable information includes, e.g., pictures, video, sound and 3D-models represented in a format that allows a direct output on an appropriate display device. In order to make non-presentable information visible it has to go through the process of visualiza-

4 MODELING AND DESIGN
- 103 -
tion before being actually presented. This implies a mapping of the information to a visually pre-sentable form.
Definition 7: Presentable information is data that can be directly output to a display device.
Definition 8: Non-Presentable information must go through the process of visualization to become presentable information.
In order to communicate information it must be represented by an matter-energy pattern, called Data, which leads to the next definition.
Definition 9: Data is a set of matter-energy patterns representing communicated information. (*)
It is highly desirable to use easily reproducible patterns in computer science, which can be identi-fied and recognized. An example would be the holes in a punch-card or bit-patterns in a com-puters working memory.
Data itself has in most cases some kind of order or structure described by a data model. Data models are typically used to describe data within a database including their relations. Well known examples for data models are the relational data model, the hierarchical model, and the network model.
In many cases the terms Data and Information are used assuming the same meaning. If, for ex-ample, we take the word “Example” and the ASCII code as a data interpretation rule, the word “Example” can be represented through data in the form of a matter-energy pattern in the form of a sequence of bits and bytes in the memory of a computer as displayed in Figure 52.
Data (as Bits) Interpretation (ASCII)
Information
1000101 E 1111000 x 1100001 a 1101101 m 1110000 p 1101100 l 1100101 e
Example
FIGURE 52 Data and Information
In this case the word “Example” is data as well as information depending on the point of view. This also implies that if we speak of information in the remaining parts of this work, the type of storage (the matter-energy pattern) is not relevant. On the other hand we clearly use the term data if their meaning – expressed through interpretation rules – is unknown or not relevant. In the field of scientific visualization the term data is commonly used, while in the field of informa-tion visualization the term information is characteristic.
Having defined these basic terms w e can now proceed with the important definition of a mes-sage.
Definition 10: A message is sent data, which is perceived and interpreted by a recipient during the transmission process.(*)

4.1 INFORMATION VISUALIZATION: THEORY AND MODEL
- 104 -
In toady’s world of computers messages are typically contained within documents. The term document has been defined in numerous ways by different authors. We will use the definition presented by Steinmetz in [Steinmetz,1993]:
Definition 11: A Document is a set of structured information, which can be incorporated by different types of media and can be generated and recalled at presentation time.
Since we have already encountered the term Information Object several times throughout the text, we shall define the term object as follows:
Definition 12: Objects are the primary and enumerable components of the structure, which is provided by the process of recognition as experience. (*)
Recognition is the interpretation of sensory stimulus (perception). For example, the stimulation of the eye retina through the light reflected by a cat let us recognize a cat with the help of em-pirically attained interpretation rules. Thereby, the structure is the structure of the physical world the cat exists in.
In [Wendt,1991] the object term is classified even further by a classification schema, in which any object fits. An outside-world object is perceived by our sensory organs, all other objects are inner-world objects. A concrete object is perceived through continuous properties; otherwise it is an ab-stract object. Outside-world objects are always concrete because it has continuous properties (e.g., color, size, etc.), while inner-world objects can be either concrete or abstract. Abstract objects are Terms, like e.g. the term "Example". Concrete objects can be further separated into artifacts (e.g., a house or a cat) and processes (e.g., sleepwalking in the outside world or mental training in the inner world). Figure 53 depicts the Object term.
Object
outer-world inner-world
abstract concrete
terms processes artifacts
FIGURE 53 The Object term (*)
Having defined the terms Data, Information, and Object we can proceed with the important definition of an Information-Object.
Definition 13: An Information-Object IO is a concrete object, which encapsulates information-representing data.
This encapsulation of data is mostly necessary due to the structure of information processing systems, such as computers, humans or cats. Typical examples for an IO are a file within a file system or an instance of a class in an object oriented programming environment.
This definition of an information object implies that an IO has continuous properties with the set of real numbers R as a reference set. Furthermore, there are first-order predicates, such as
“IO is a file in a computers file system”. This leads us to the definition of an Attribute:

4 MODELING AND DESIGN
- 105 -
Definition 14: An Attribute of an information object IO is a set of continuous properties or first-order predi-cates connected to an IO. The function attrib returns all attributes for a given set of objects: attrib ({IO1, …, IOn}) = {A1, … , Ak} ∀i:ó:j: Ai=Aj with i≠j, i,j,k,n∈¥
In particular, the function attrib can be used to return a single information objects attributes: attrib({IO})={A1, … , Ak.}. In the field of information visualization the term Metadata is often used referring to the attributes of the IO’s, e.g., a web page or a GIF image. We will speak of attributes in this case.
Definition 15: An Attribute Set A is the set of attributes of a given set of objects:
A = attrib ({IO1, …, IOn}) n∈¥
To lay out the ground for the definition of information visualization we need to further define the terms Information Set, Information Structure, and Information Space. Sets will be repre-sented by Blackboard-Letters such as M.
Definition 16: The Information Set I is a discrete set of information objects:
I = {IO1,…,IOn} ∀i:ó:j: IOi=IOj with i≠j , n,i,j∈¥ and|I|< ∞
The information set is a finite set of unique information objects. Otherwise the process of visual-izing this information could take infinitely long time, which is of course highly undesirable.
Consequently follows:
Definition 17: The attribute set AI is the set of all attributes of a given information set I : AI = attrib(I)
The term information structure is defined as follows:
Definition 18: An Information Structure IS is a set of relations describing all possible dependencies between
the information objects IO of a given information set I with:
( )kn
k
IIS ∪2=
℘⊆ , k∈N, n∈¥
This means that an information structure can contain any subset of any possible n-fold Cartesian product of I (a relation). In other words, all possible relationships between any number of in-
formation objects is expressed.
The information structure IS is also a finite set, since the information visualization process could
otherwise take an infinitely long time.
It is also important to understand that an information structure IS is the result of a cognitive
process of a human being, rather than simply existing within a set. This implies that the contents of an IS have to be recognized or derived, meaning that the definition of an IS is never unique

4.1 INFORMATION VISUALIZATION: THEORY AND MODEL
- 106 -
but can differ from application to application. It is therefore very important for the field of in-formation visualization to explicitly define or derive the underlying information structure IS.
Definition 19: An Information Space ISP is defined by an information set I and an information structure
IS:
ISP = {I, IS} with |I|�1 and |IS|�0
The cardinality of an information space ISP is defined through the cardinality of the correspond-
ing information set I.
Definition 20: The cardinality of an information space ISP is equal to the cardinality of the underlying in-
formation set I: |ISP| = |I| with ISP = {I, IS}
The dimension of an information space ISP is defined in terms of the attributes of I. Definition 21: The dimension of an information space ISP is equal to the cardinality of the attribute set AI:
dim(ISP) = |AI|
It is worth noting that the cardinality of IS can be equal to zero, meaning that for the informa-
tion space ISP with such an empty information structure IS there is no description of any rela-
tions between the information objects. It follows that an information set I can be viewed as an
information space ISP allowing for different approaches describing an information space. A
discussion on the boundaries of such an information space is fairly philosophical. Since the set of all information existing in our world, which we might call information universe, is potentially infi-nite, the task of information visualization clearly needs to assume a definition of boundaries of an ISP, given by the finite definition of I. These boundaries typically are a result of (user) re-
quirements, e.g., all paintings in a gallery or all major league baseball game results of the past 12 years. In a technical sense these boundaries are often expressed through user queries to some data storage, e.g., a database management system. It is therefore in many cases very important to be able to recall on which basis the ISP was defined, because the mapping from the information
universe to the information space is potentially not invertible.
This leads to an important constraint in addition to the definition of an information space given in Definition 19: The ISP is a subset of the information universe. It is represented through (elec-
tronic) data.
It is also worth noting that the cardinality (the number of information objects) as well as the di-mension (the number of attributes in the underlying information set) have been defined for an information space.

4 MODELING AND DESIGN
- 107 -
An example shall demonstrate the presented concepts:
A file system on a computer contains a directory (IO1). This directory in turn contains two files, one html file (IO2), and one GIF image file (IO3). For every file or directory the attrib-utes ‘Author’ and ‘File type’ are defined.
The information set is therefore:
I = {IO1, IO2, IO3}
The information structure IS is based on a single 2-fold relation R with the following seman-
tics:
R = {(a,b)| b is child of a}
and following this semantic, the set contains only one relation:
IS = {{( IO1, IO2), ( IO1, IO3)}} ⊆ I2
The information space and the associated attribute set is therefore:
ISP = {I, IS} = {{IO1, IO2, IO3}, {{( IO1, IO2), ( IO1, IO3)}} }
AI = attrib(I) = {Author, File type}
dim(ISP) = |AI| = 2
|ISP| = |I| = 3
The files themselves are represented by data; in this case a pattern of bits on a computers hard disk (a matter-energy pattern). The file content of e.g. the html file is information because it can be learned and displayed; the content is knowable. All files contain explicit meta data, such as the author, as well as implicit metadata, such as the file size, access rights, etc. These metadata are the attributes of the information objects. The maximum number of attributes of any information object determines the dimension of the information space, which exists implicitly with the exis-tence of an information object.
The number of information objects in an information set are context dependent. In this example simply all files in the file system were considered. In another scenario it might be the case that the user task is to show all HTML files within a file system. The information set would then con-tain less objects.
If, e.g. a GIF image file is displayed in an image viewer, the file is turned into messages. After archiving the file (making it not directly accessible any more) it stops being messages but be-comes data. If the image file is retrieved from the archive it is again turned into information.
4.1.2 Visualization After thorough examination of the ‘information’ part we shall take a closer look at the ‘visualiza-tion’ part of information visualization. Since there are many parallels between the classical scien-

4.1 INFORMATION VISUALIZATION: THEORY AND MODEL
- 108 -
tific visualization and the younger field of information visualization, we first take a look at a well-known approach to scientific visualization.
In Brodlie’s book about scientific visualization [Brodlie,1992] the process of visualization is de-scribed in 3 steps:
1. Construction of an empirical model. From the given data set an internal model is derived, which describes this data (e.g., a mathematical function).
2. Representation as an abstract visualization object. The empirical model is internally represented through visualization techniques (e.g., a colored 3D geographical map).
3. Realization of the visualization object. Graphical output of the visualization object to a graphical output device (e.g., a graph plotter).
Taking a closer look at this stepwise process, one might already suspect that it closely resembles our informal description of information visualization from chapter 1. It, however, uses a differ-ent terminology.
The second step of visualization defines a mapping between the empirical model and a visualiza-tion object. In the context of information visualization we use instead the term Presentation Space, which contains a set of Presentation Objects. Since the mapping in the second step results in presentable information, the third step can be referred to as presentation. In our case we will use the term visualization, which includes the presentation as a final step. The field of visualiza-tion can be separated into scientific data visualization [Brodlie,1992] [Earnshaw,1992] and infor-mation visualization with distinct concepts, terminology, and goals.
We can now define the important term of the presentation object:
Definition 22: A presentation object PO is a logical unit in the process of presentation.
In numerous multimedia related publications (e.g., [Otto,1996] [Steinmetz,1993]) the terms Me-dia Object and Multimedia Object are introduced. The more abstract term Presentation Object shall, however, be used in the context of this thesis.
The terms Presentation Set and Presentation Space are consequently defined:
Definition 23: The Presentation Set P is a discrete set of presentation objects:
P = {PO1, … , POn} ∀i:ój: POi=POj with i≠j n,i,j∈¥ and|P|< ∞
A presentation set also contains attributes:
Definition 24: The attribute set AP is the set of all attributes of a given presentation set P:
AP = attrib(P)
Definition 25: A Presentation Space PS is defined by a non-empty presentation set P and a set of functions
F:
PS = {P, F} with |P|>1, |F|�0, F = {F1, … , Fn}, n∈¥

4 MODELING AND DESIGN
- 109 -
Definition 26: The dimension of a presentation space PS is equal to the cardinality of the attribute set AP :
dim(PS) = |AP|
It is worth noting that the definition of PS does not include any structural information on the
POi as in the case of information spaces. Instead, a more abstract approach of defining the se-mantics in a presentations space in terms of a set of functions was chosen. The functions within this set can, e.g., be expressed through a mathematical term, a script, or a computer program. This approach is very generic, since any presentation scenario can be expressed through the at-tributes of the POi and the functions. In particular, a structure across the presentation objects can be described (e.g., a hierarchical structure using a ‘child’ attribute) but also translation and orientation in 3D space or collisions of the POi.
If we furthermore bear in mind that the arguments as well as the return values of these functions can be arbitrary objects, it should not be a surprise that even the whole features of interactive presentations can be expressed. In this case the arguments of the interactivity functions would contain (among others) user interaction events (event objects). Interactivity functions could not only modify the (visual) attributes of a presentation object but also refer to the underlying infor-mation space offering, e.g., the possibility of keeping the information space and the presentation space in sync.
4.1.3 Information Visualization We can now proceed with the formal definition of information visualization in terms of the con-cepts defined in the preceding sections.
Definition 27: Information Visualization is a function IVIS, which maps an information space ISP to a
presentation space PS.
IVIS(ISP, ASISEL, Mapping) = PS with:
ISP = {ISEL, IS}
ISEL ⊆ I : a selection of information objects,
ASISEL ⊆ attrib(ISEL) : a selection of attributes of ISEL
Mapping : a description of the mapping function
Within a given information space ISP it in most cases neither necessary to visualize the complete
set of information objects I nor the complete set of attributes AI of the selected information
objects. Therefore, a subset of I with the name ISEL as well as a subset ASISEL of the attributes of
ISEL has been defined. These subsets select the set of information objects and attributes actually
used for the information visualization mapping process ensuring that IVIS is a total function in the mathematical sense. Let us recall the mathematical definition of a function in terms of the set theory:

4.1 INFORMATION VISUALIZATION: THEORY AND MODEL
- 110 -
“A total function f from X to Y is a subset of the Cartesian product X × Y which satisfies the following two properties:
1. functional: if (x,y1) and (x,y2) are both elements of f, then y1 = y2.
2. total: if x is any element of X, then there exists at least one element y of Y such that (x,y) is in f. “
This means that selecting the proper subset of an information set I and a proper subset of the
attributes in attrib(I) makes sure that IVIS matches the totality criterion. The functionality crite-
rion must be matched in order for the information visualization process to work. No two com-binations of information objects and attributes can be mapped to the same PO, Attribute, func-tion combination or else the information visualization would not be unique and therefore the results would be undefined.
Two other criteria for the function IVIS are the surjectivity and the injectivity, which shall be further investigated together with their potential implications on the IVIS function and the in-formation visualization process.
The definitions are respective:
“A function f: X ? Y is called injective or one-to-one or an injection if for every y in the codomain Y there is at most one x in the domain X with f(x) = y. Put another way, given x and x' in X, if f(x) = f(x'), then it follows that x = x'. ”
and
“A function f: X ? Y is called surjective or onto or a surjection if for every y in the codo-main Y there is at least one x in the domain X with f(x) = y. Put another way, the range f(X) is equal to the codomain Y. “
In other words, a function is injective if every element of the codomain is at most once targeted by the mapping. It is called surjective if every element of the codomain is targeted (at least once) by the mapping. By definition a function is called bijective if it is injective and surjective. Every function has an inverse relation, which maps the elements of the codomain to the elements of the domain. The inverse relation of a bijective function is also a function, called inverse function (often denoted as f –1 ).
Since IVIS is a function, it has at least by definition an inverse relation. An inverse IVIS relation would allow a mapping from the presentation space PS to the underlying information space ISP
which can be useful if modifications on the presentation objects (e.g., through user interaction) have to be synchronized with the information space. In contrast to simple interactions (i.e. inter-actions that only affect the presentation objects), such interactions impact the underlying infor-mation structure and implicitly also the mapping expressed by the IVIS function.
In the case of IVIS being only injective it would simply mean that not all presentation objects in the presentation space would have to be targets of an information mapping, potentially leaving some presentation objects and their attributes unused. But on the other hand it is ensured that every presentation object used for mapping information to is only targeted once. This in turn means, that the inverse relation can be easily calculated, since it is uniquely determinable how any given presentation object originated from the information space.
If, in turn, the IVIS function were only surjective it would mean that all objects within the pres-entation space are potentially targeted by multiple elements of the information space at once

4 MODELING AND DESIGN
- 111 -
(e.g., a PO attribute equals to the sum of two attributes from the information space). In this case an inverse function cannot be calculated for each case. One possibility to define the inverse rela-tion would be to use the set of functions F within PS to store the calculations for an inverse
mapping. It would also mean that potentially multiple elements of the information space would have to be modified.
If, furthermore, the function IVIS is even bijective the existing inverse mapping function IVIS-1 could be automatically calculated.
In the case an inverse mapping of modifications of the presentation space to the information space is required it is therefore desirable to define the IVIS function as a bijective or at least in-jective function.
The parameter Mapping of the IVIS function is a description for the calculation scheme of the function, which can be given in any computationally complete language, e.g., Lambda-Calculus, computer programs, or XSLT style sheets (which we will choose for this thesis) or at least in a form powerful enough to generally describe a function, e.g., closed mathematical formulae. Of course this mapping calculation scheme has to be described in a way that is compatible with the input arguments from the information space. Furthermore it has to produce the calculated func-tion values to the satisfaction of the requirements of the application it is implemented in. In summary this means that the presentation technique (such as Fisheye View or Cone Tree) is de-fined within the Mapping parameter and should satisfy the users requirements as closely as possi-ble.
The selection of the subset of attributes ASISEL can be viewed as a scaling operation on the in-
formation space ISP, since the dimension of the ISP to be displayed is reduced if
|ASISEL |<|AISEL |.
The question remains, which information objects IOi and which attributes Ai should be selected for the IVIS function. Furthermore, a mapping technique has to be chosen in correspondence with the user requirements:
The selected IO’s are represented by ISEL , which is a subset of I. The selection of these informa-
tion objects is typically performed by the user with some support from the application.
After reducing the information set, the attribute set has to be redefined as AISEL=attrib(ISEL). The
user then typically selects the corresponding subset ASISEL⊆attrib(ISEL). If |ASISEL |<|AISEL |
the dimension of the information space is reduced by (|AISEL |-|ASISEL |). This does, however
not imply that the dimension of the presentation space PS is also reduced.
Reflecting on the three-step model for scientific visualization presented earlier in section 4.1.2, we can now directly relate these steps with the process of information visualization:

4.1 INFORMATION VISUALIZATION: THEORY AND MODEL
- 112 -
Step Scientific Visualization Information Visualization 1 Construction of an em-
pirical model Construction of ISP and PS
2 Representation as ab-stract visualization ob-ject
Application of the IVIS function
3 Realization of the ab-stract visualization ob-ject
Presentation
The abstract process model for information visualization is illustrated in Figure 54.
Information Universe
Information Structure IS Information Set Ι
Information Space ISP
Presentation Space PS
IVIS
Perception
Mental Structure
Interaction
FIGURE 54 The abstract information visualization model
In the majority of related work in the scientific field of information visualization it is viewed as a part of Human Computer Interaction (HCI). Many publications have stated the goals of infor-mation visualization. Some of the most common ones are
• Display of an information structure
• Minimizing the costs of extracting information objects from large information spaces.

4 MODELING AND DESIGN
- 113 -
Both goals go along with the necessity for an efficient layout of the presentation space in order to make access to the information space as cognitively efficient as possible for a user. This allows the user to efficiently extract required information. The process of information visualization can therefore be helpful in building up cognitive structures in the users brain. If the layout of the presentation space closely resembles the cognitive structures in a users mind, the presentation will feel familiar, intuitive, and easy to use. For this reason metaphors are used, which make it easier for the user to access the presentation space based on a familiarity with the metaphoric objects. The field of information visualization therefore has also close ties to cognitive science. Since this thesis does not cope with particular visualization techniques but rather with the proc-ess of information visualization, we can neglect this (although interesting) connection herein.
To conclude this theory section a short example including all the above concepts is given:
A file system contains a directory with three files, one HTML file and two image files. The di-rectory shall be IO1, the HTML file IO2, and the image files respectively IO3 and IO4. The di-rectory shall have the attributes 'Creator' and ' Creation Time'. The files shall have the attrib-utes 'Creator', 'Creation Time', and 'File Type'.
The task is to visualize the directory and all image files within the directory including their at-tributes 'Creator' and 'File Type' using the cone tree technique explained in section 2.9.2.2.
The information structure IS is based on a single 2-fold relation R with the semantics
R = {(a, b)| b is child of a}.
It is therefore
I = {IO1, IO2, IO3, IO4}, AI= {'Creator', 'Creation Time', 'File Type'} , IS = {{( IO1, IO2), (
IO1, IO3), ( IO1, IO4)}}.
The resulting information space ISP would have the dimension and the cardinality dim(ISP)
= 3, |ISP|=4.
Now the information space is narrowed down by selecting the image files and the required at-tributes:
ISEL = {IO1, IO3, IO4}, ASISEL = {'Creator', 'File Type' }
dim(ISP) = 2, IS = {{( IO1, IO3), ( IO1, IO4)}}, |ISP|=3.
The parameter Mapping includes the program code of the cone tree visualization function written in Qbliq:
Mapping = " let rec ConeTree = proc (tree) let r = GroupGO_New(); let node = SphereGO_New([0,0.5,0],0.1); r.add(node); SurfaceGO_SetColor(node,color_hsv(real_float(tree[0]) * 0.01,1.0,1.0)); if #(tree) > 1 then let cone = ConeGO_New([0,0,0],[0,0.5,0],0.25); r.add(cone); SurfaceGO_SetTransmissionCoeff(cone,0.8); SurfaceGO_SetColor(cone,"gray"); end;

4.2 THE INFORMATION VISUALIZATION PROCESS
- 114 -
for i = 1 to #(tree)-1 do let angle = 2.0 * math_pi * real_float(i) / real_float(#(tree) - 1); let ctr = [math_sin(angle)*0.25, 0, math_cos(angle)*0.25]; let edge = LineGO_New(ctr,[0,0.5,0]); r.add(edge); LineGO_SetColor(edge,"gray"); let child = ConeTree(tree[i]); r.add(child); GO_SetTransform(child,Matrix4_Translate(Matrix4_Scale(Matrix4_Id, 0.5,0.5,0.5),ctr[0],-0.25,ctr[2])); end; r; end;"
IVIS(ISP, ASISEL, Mapping) = PS.
IVIS({{IO1, IO3, IO4}, {{( IO1, IO3), ( IO1, IO4)}}},{'Creator', 'File Type' }, "let rec Cone-Tree= proc (tree) … "}
Since the cone tree technique visualizes the connections between nodes as lines (2 lines) and the nodes as spheres at the endpoints of these lines (3 nodes) it is |PS|=5.
The abstract model for information visualization described in this chapter will form the basis for the information visualization process model in the next section.
4.2 The information visualization process In [Card,1999,1] Card, McKinlay, and Schneiderman introduced an informal reference model for information visualization as depicted in Figure 55, which gives a very high level view on the in-formation visualization process.
Raw Data Tranformed Data
Visual Structure Views
Interaction
FIGURE 55 Reference Model for Information visualization
The model assumes a repository of raw data, which exist in a proprietary a form (e.g., relational database tables or XML files). The raw data could also exist in a completely unstructured form. To achieve a visualization of this data, they have to first undergo a set of transformations. It is on the one hand possible, for example, that derived data is to be visualized (e.g., aggregated val-ues). On the other hand the data has to be normalized to allow for a mapping to visual proper-ties. The first-step transformation result is a set of transformed data in a unified structure. In the next step this data set is mapped to the corresponding visual structure. On the basis of this visual structure, a set of views can now be generated, which allow a user to navigate through the dis-

4 MODELING AND DESIGN
- 115 -
play. A user interaction can have an impact on different levels of the transformation process. The user can adjust his view on the data, change the visual structure, or even affect the data transformation. The cyclic arrows in the diagram refer to the fact that the processes involved in the distinct steps have an iterative nature and can therefore occur repeatedly before the next step is taken.
Figure 56 displays the general information visualization process from an abstract viewpoint. In accordance with the abstract information visualization model and the reference model presented in the preceding sections it consists of four phases, i.e. data mining, filtering, mapping (and presentation), as well as an interaction cycle that can have an effect on the first three areas.
Raw Data from: • Experiments • Test series • Simulations • Stock quotes • Production Data • …
Data Mining Data Store
Filtering, e.g., through Search Queries (SQL,
XPATH etc.)
Mapping
Explorative Analysis
Display as: • Images • Tables • Charts • Animations • 3D-Scenes • …
Rendering
Interaction Cycle
Data
Information
Information Universe ISP
Selection of ISEL and ASISEL
IVIS(ISP, ASISEL, Mapping)
PS
FIGURE 56 The general information visualization process
4.2.1 Data mining and archiving Every visualization process begins with the collection of data. A large number of different sources are possible for the generation or extraction of data. On the one hand, data may be in-volved that has a physical representation such as the results of scientific experiments and meas-urement series. But it can also be more abstract in nature, i.e. the results of interrelating different factors and source data, such as in the case of the production data of a company or stock prices. The final category is made of data obtained as a result of searches and extraction from other data sources (e.g. the Internet).
In this first step there is no selection in accordance with any criteria. Instead, the data generated or found is collected and archived as is. This can take place, for instance, simply in the form of file storage on data media. Database management systems (DBMS's) are particularly well suited
4.2 THE INFORMATION VISUALIZATION PROCESS
- 116 -
for this purpose, since they ensure efficient data management and guarantee rapid and concur-rent access to the data. In most cases the data from different divisions of a company (produc-tion, marketing, sales, etc.) is gathered and processed separately. If data is centrally collected in a single large DBMS, the latter is then referred to as a „data warehouse“. The entire process of data acquisition and archiving described in this section is referred to as „data mining“, which is, however, not the common meaning of this term throughout all scientific communities.
Speaking in terms of the abstract information visualization model, this first step is equivalent to the construction of the initial information space ISP from objects of the information universe
(Information universe → ISP). Since the collected and derived data represents explicit informa-
tion as well as structural information we define both, the information set I and the information
structure IS. By expressing the intention to use this data as arguments to the IVIS function they
become information because we want to potentially communicate them. At this stage all attrib-utes A of the information objects IOi are represented by the attribute set AI of the information
set.
4.2.2 Filtering The fact that computers are able to generate large amounts of data as well as to store and man-age the data but only limited amounts of information can be displayed on a computer screen leads to the problem of having to limit databases to relevant data subsets. If the quantity of data is too large there is a lack of clarity, even if it would be favorable for the evaluation of an ex-periment to record all processes in as much detail as possible. Thus, mechanisms are needed to reduce the amount of data to be presented. Another factor motivating the need for filter mecha-nisms is the fact that raw data from scientific experiments is usually not available in a form that lends itself immediately to graphical representation and, instead, often has to be processed and converted into a suitable format. This applies in particular to abstract data and to circumstances which, by their very nature, do not lend themselves to direct graphical presentation.
If data has been collected in a relational database the realization of a filter able to reduce the amount of data to a subset relevant to a certain question is relatively easy. The application can limit the amount of data through the use of a query language (e.g., SQL) to any given subset. Most query languages use a declarative approach, which merely describes the set of data being looked for. The way in which information is extracted from the data storage device and supplied to the application is left up to the implementation of the data storage facility, such as a DBMS. If queries are predefined by the application programmer and their complexity is hidden in the ap-plication, then end users will be able to find the needed data without any specific knowledge of the underlying data structures.
In terms of the formal information model this step represents the selection of information ob-jects IO from the information set I with the goal to form the subset ISEL (I → ISEL). This subset
includes all information objects, which are to be actually used for mapping to the presentation space by the IVIS function. Furthermore, as a result of selecting a subset of information objects the set of available attributes of information objects is also changes to AISEL. The filtering proc-

4 MODELING AND DESIGN
- 117 -
ess also represents the selection of a subset ASISEL of AISEL , i.e. all attributes of the remaining set
of information objects, which are to be mapped to the presentation space by the IVIS function.
In the case of a relational database an application would use an SQL SELECT statement to se-lect a set of rows (the information objects) with a given subset of fields (the attributes).
Referring to Brodlie's the three-step visualization model presented in section 4.1.2 the steps of data mining and filtering would be equal to the first step of constructing an empirical model
4.2.3 Mapping Once a specifically filtered subset of data exists the next step in the information visualization pipeline is the mapping of the information. What is meant here is not the output of data to graphics hardware (rendering), but rather the allocation of datatypes to certain graphics represen-tations. For basic computer datatypes such as numeric values (int, float, real, etc.) and strings this is relatively easy as a rule. After all, these datatypes can be allocated to a corresponding text on the screen. However, in the case of these simple datatypes the possibility already exists to map semantic factors to additional graphical representations and their attributes (e.g. color). This en-hances clarity and understanding when, e.g., measurement series are mapped to a function graph instead of being presented merely as columns of figures.
Specifically created datatypes and abstract object definitions require mapping to suitable graphi-cal representations. The concept of hierarchy must be introduced, since it can be used for the mapping process in addition to the information content of the data objects. Expressed in very general terms, hierarchies are ordered relations to a set of objects. Individual objects can have several objects above them in a hierarchy (i.e. in reference to ordered relations) as well as objects that follow them. The ordered relations are not fixed, but the objects must be comparable with regard to this criterion. If the individual objects have only one superordinate object, then the hierarchy can be seen as a tree structure; otherwise as a directed graph. All objects that can be reached from the top element with the same number of steps belong to one level. These levels as well as the relations between the different levels can be used for the mapping process.
One-dimensional visual structures are typically used for time lines and text documents, particu-larly as part of more complex visual structures. As already indicated, simple datatypes such as numbers or strings can easily be presented as text in a linear array (i.e. in one dimension) on the screen. Two-dimensional structures are used when space is exhausted in the first dimension, e.g., at the end of a line in a text document. The topology of two-dimensional structures is particu-larly well suited for the presentation of geographical maps or graphs for simple mathematical functions. Tables, trees, and graphs are all two-dimensional structures. In most cases the data to be visualized has more than two attributes for which a way must be found of mapping them to the degrees of freedom of the two dimensions. In this case the user can usually decide which of the n attributes are to be mapped to the two vertical axes. 3D visualization is suitable for physical data, the nature of which is three-dimensional (e.g. flow and volume visualization, CT data). Any further dimension offers the additional possibility of mapping a further attribute of the data to be visualized to the newly acquired axis. In this way three-dimensional scatterplots that depict mathematical functions with two arguments as curved surfaces can be used. More than anything, the third dimension offers the possibility of reproducing the world around us in a manner corre-sponding to human perception.
According to [Crossley,1997] three-dimensional, interactive, multimedia information sources offer an intuitive and natural way of experiencing complex ideas and concepts. They provide a

4.2 THE INFORMATION VISUALIZATION PROCESS
- 118 -
more rapid route to understanding. Interacting with information stored in electronic form through 3D scenes and sound simulates the way we move around in the "real world" and gives us an impression of depth and perspective. This accommodates natural human capacities to deal with objects in space and to attribute meaning to spatial distances as well as to easily learn spa-tially structured information. Despite these clear advantages it is an open question as to when 3D visualization justifies the much greater computational power required compared with visual 2D structures and when the use of 3D merely constitutes a kind of "overkill". If time is interpreted as a fourth dimension it can be used to depict changes of data in the course of time (e.g. in the form of simulations and animations).
If the data to be visualized is abstract in nature or has more complex structures (compound datatypes), it can also be mapped to visual metaphors. The latter could be 2D icons or also more abstract concepts such as different floors in a virtual 3D scene. However, metaphors should be used cautiously. By way of example, certain colors may have different intuitive meanings in dif-ferent cultures.
Using the terms of our formal information visualization model this step is equivalent to applying the function IVIS to the selected information objects ISEL and the chosen attribute subset ASISEL.
As a result the presentation space PS is generated, which can now be displayed on a graphical
output device. Applying the IVIS function is in the three-step model of scientific visualization correspondent with the second step of representation of the empirical model as abstract visuali-zation object. If we include the output to a display device into the process of mapping we would also cover the third step of the 3-step model.
4.2.4 The interaction cycle According to [Dix,1998] the quality of visualization concepts can be greatly increased by adding even very simple means of interaction. Based on the visualization diagram in Figure 11 there are three important ways in which user interaction effects and can influence the process of visualiza-tion.
1. In many simulations (e.g. training simulations for pilots) users can actively intervene in the simulation process and control it. The consequence of this is that interaction changes the parameters of functions the simulation is based on and, as such, influences the flow of the data produced. In simulation software scenarios data is usually not stored in a da-tabase, since there are very many parameters that are not needed for later evaluation.
2. Another place where user interaction can have an effect is the filter process. In the case of so-called "visual query tools" users can change or restrict the displayed area simply by clicking on visual representations on the screen. The software translates user interaction into corresponding SQL statements, the database results to be changed, and then to a changed screen depiction. InfoCrystal [Spoerri,1993] is an example of a tool of this kind.
3. Finally, user interaction can have an effect on the logical mapping of data to visual struc-tures. By way of example, users can switch back and forth between depictions of data in tables and bar charts by means of simple interaction mechanisms. The amount of infor-mation presented stays the same, only the form of presentation is changed in the last step (rendering).

4 MODELING AND DESIGN
- 119 -
Within the formal model the process of information visualization was defined as a function mapping from the information space to the presentation space. The presentation space PS was
defined through a set of presentation objects and a set of functions F. It has already been men-
tioned, that F hasn’t been constrained in any way within the definition, making this feature on
the one hand extremely powerful by giving complete freedom for the semantics of these func-tions, on the other hand it was not at all specified how these functions could be used. This topic is shortly discussed in the last chapter (Outlook to future work). However, it has already been suggested that these functions could be used to support interactivity within information visuali-zation applications. Since these functions result from the mapping function IVIS they can be defined in terms of any part of the information space (or its attributes). This means the func-tions could potentially be used for handling user interaction events and have objects from the information space as targets. This would allow the user to interact with the information through interactive manipulation of visual metaphors.
4.3 The IVIS system model The IVIS system model19 of a generic information visualization framework illustrated in Figure 5720 is derived from the abstract information visualization model presented in section 4.1 and derived process model from section 4.2.
Application Data
REPOSITORY
Application Schema Modeler
Schema Constructor
3D Modeler
3D IVIS Modeler
IVIS Interpreter
3D Viewer
3D Descr. Format
3D Format
3D Format
Data Schema
Data Format
IVIS Description
FIGURE 57 The IVIS system model
What is involved is essentially a somewhat stricter version of the general information visualiza-tion processes depicted in Figure 56. Requirements were specified and restrictions formulated
19 The abbreviation IVIS stands for information visualization 20 The diagram shown in Figure 57 was made by Gerald Jäschke [Jäschke,2000]

4.4 SYSTEM REQUIREMENTS
- 120 -
with regard to the technologies to be used in the system. One requirement is that all descriptions of data and processes must be in XML notation.
An administrator tool called the Application Schema Modeler serves the purpose of modeling an application data schema, which can be archived in the system in the form of an XML docu-ment. This application data schema is designed by the administrator and used to construct the application database schema with the help of the Schema Constructor or it is extracted directly as a subset from an existing database schema. A designer uses a 3D modeler (e.g. 3D Studio MAX from Kinetix Inc., www.kinetix.com) to design visual objects, which are also stored in the system in the form of X3D files. Both the XML description of the Data Schema as well as the X3D Scene Descriptions of the visual objects are used by an IVIS designer which creates a model between the data schema and the visual objects with the help of the so-called 3D IVIS Modeler. The type of model and the form of the description of the model are not specified. However, it is supposed to be made up of the X3D descriptions of the IVIS Objects used, which are enriched with additional instructions for the mapping mechanism. What these instructions for the mapping definition look like remains an open question here. The last component, and an important one, is the IVIS Interpreter, which imports the IVIS Description and executes the mapping process. In this connection the IVIS Interpreter makes use of X3D descriptions con-tained in the IVIS Description as well as specific database content. After the modeling process is completed the IVIS Interpreter has the entire scene description in pure X3D. Now it has to be decided whether the IVIS Interpreter is supposed to show the X3D scene directly in an X3D viewer or whether the scene will be shown with one of the alternatives, i.e. Java3D or VRML. For Java3D there is a package called X3DLoader and there are stylesheets for the transformation of VRML from X3D and vice versa. It would also be conceivable to convert the X3D descrip-tion of the scene to the scene description format of a proprietary 3D render engine. Our choice of VRML was founded on a comparison between several web based 3D realtime rendering tech-nologies. A further requirement for the system is the automatic installation of the necessary 3D viewer component. An installation process is preferred in which no user interaction is needed. These requirements are fulfilled only by the X3D viewer, realized as an applet, and Parallel Graphics Cortona VRML Client, so that the job automatically fell to them.
The design and implementation of the prototype developed in this thesis make use of the foun-dations of the described IVIS model, develop previously unspecified areas further, and imple-ment a number of theoretical mechanisms. The focuses are on data extraction, specifications of the modeling process, and execution of the modeling process.
4.4 System Requirements In the following section a few of the requirements listed in Chapter 3 are taken up and discussed in more detail. In Section Error! Reference source not found. mechanisms and components are specified which provide solutions to the problems indicated.
4.4.1 Decoupling of information and visualization This requirement is based on the following consideration. On the one hand, programmers and database administrators generally do not possess the artistic abilities of a designer. On the other hand, a designer does not normally have knowledge of data modeling and database administra-

4 MODELING AND DESIGN
- 121 -
tion. The process of mapping definitions of information to visual objects needs to take place in two subsequent phases. In a first step a designer constructs visual objects (possibly on the basis of the instructions of a programmer or database administrator) that specify in what context these objects are to be used later. At this stage the designer only needs to know how many and what kind of visual attributes the objects are to be able to represent.
In a second phase the database specialist uses the objects constructed previously by the designer to map information to the visual attributes of these objects and in this way to construct a virtual scene. So that these two phases can be gone through again and again, i.e. in a cycle, the visual objects must have an interface that defines changeable visual attributes and the datatypes that can be mapped to them. Thus, the visual appearance of an object can change, while the interface stays the same, or an existing interface is extended. When using objects a database specialist does not need to worry about their visual appearance. He sees only object names and interfaces and maps suitable datatypes to the interfaces. Section 5.3.1 discusses these IVIS Objects.
4.4.2 Independence of data format The IVIS model provides for independence of the DBMS used as well as of specific application data schemata. Implementation then goes a step further and requires the data to be visualized in XML. The underlying motivation to take this step is the fact that any kind of structured data can be noted in XML. As such, this requirement is an extension and not a restriction as might appear to be the case at first sight. Various mechanisms and tools exist for the conversion of database content to XML and are discussed in detail in Section 5.3.2. Thus, with the help of the IVIS sys-tem it is possible to visualize not only data stored in a DBMS but any data existing in some struc-tured form. Instead of having to incorporate hierarchically structured data into a relational data-base schema, all that is needed is for it to be noted in XML and it can then be used as a database for the IVIS system. Web page content can be directly used as input for visualization, since it is already available in valid XML. The same applies to any other file formats, tables, and lists avail-able in some kind of structured form.
As is made clear in the next section, the mapping mechanism needs to know the schema of the underlying data. Section 5.3.2 presents a Data Extractor component, extendible by adding mod-ules that convert specific formats to XML. These modules are also responsible for generating or providing the schema for the data in question.
4.4.3 Generic mapping mechanism Only two alternatives presented themselves for the realization of a generic mapping mechanism in the context of this thesis: either the development of a new mapping description language and the implementation of a related interpreter, or the use of a an existing language that is general enough and powerful enough to carry out the desired mapping process. Since the data used for the visualization was in XML notation and the visual objects were in X3D (i.e. an application of XML), the use of XSLT - a computationally complete language21 - with broad tool support, to describe the mapping process, was a sound choice.
The mapping process is described by an XSLT stylesheet, which users of the mapping tool should be able to put together graphically on the basis of simple, intuitive operations. If a 21 A very elegant proof for the computational completeness of XSLT can be found on the TMML Home Page at http://www.unidex.com/turing

4.4 SYSTEM REQUIREMENTS
- 122 -
graphical object is used in a mapping rule the user first selects the name of the desired IVIS ob-ject from a list. After that the X3D description of the IVIS object is inserted directly as output elements in the desired place in the XSLT stylesheet. However, only the interface definitions of the object are visible to the user here. The actual X3D description should be hidden from the user in the background. XSLT instructions, such as the loop statement <xsl:for-each>, can be placed around the IVIS object in order to instantiate the object a number of times. This is followed by the actual mapping definition. The schema of the data to be visualized is presented in a tree structure. The user of the mapping tool should be able to select an element or attribute from the tree structure representation of the schema and allocate it via the interface definition of an IVIS object to any given visual feature. A type check can be carried out at this point which rejects maps when the datatype of a source data item does not match the visual feature type of a target object. This is the case, for instance, if the user tries to map a string to a VRML color value, consisting of three floating decimal numbers between zero and one. If the map has been fully specified, the XSLT stylesheet is applied in the form of a document object model (DOM) to the data available to the system. The result is a X3D scene description, which can be con-verted to VRML for representation purposes with the help of X3D2VRML stylesheets. The IVIS model does not make any statement as to whether the mapping process is carried out on the server or on the client. However, the mapping process should be carried out on the server in order to avoid the scene graph redundancy on the client referred to above.
The precise technical realization is described in the specifications of the mapping definition in Section 5.3.3 and in the framework of the implementation of the IVIS Mapping Definition Tool in Chapter 5.4.3. A few more requirements with regard to the mapping process should be listed here. The mapping definition should support variables so that a number of similar objects can be instantiated along a spatial axis. Without running variables all positioning information for the objects contained in the scene would have to be included in the database, as in the case of the SSI mechanism. The user should be able to undo and change mapping definitions after they have been made. It would also make sense for a visual feature to be able to represent not only the content of an individual item of data but also the sum or the product of any amount of data. A kind of formula editor with which expressions of any level of complexity can be put together from the different elements and attributes of the data schema would be desirable. In this way, e.g., a scale factor could also be integrated into the mapping process very easily.
4.4.4 Persistence The scenes generated in the execution of the mapping process can be interactive. If it is possible for the user to manipulate the objects created on the basis of the database in a runtime situation of the VRML scene, then a mechanism must also be provided for mapping changes of this kind back to the database. It is only in this way that the database can be kept consistent with the visu-alization. However, synchronization mechanisms, such as those of the Trigger Server, are also needed, if several users are to visualize the same content and the multiple virtual scenes are to be synchronizer w.r.t. their content. The writing back of changed data values to the database is only possible if the underlying IVIS mapping function is bijective or at least injective (see section 4.1.3). If the changeable visual property of an object represents, e.g., the product of two data values, the two factors cannot be reconstructed after a change.
The sense of writing scene changes back to the database (the information space) can be ques-tioned, since the information visualization process is generally viewed as a unidirectional process within this thesis. It would make sense, for instance, to visualize corporate data in the form of three-dimensional bar charts. However, it would unfamiliar for a database administrator to up-

4 MODELING AND DESIGN
- 123 -
date the content of a database by changing the height of the bars in a 3D bar chart. For one thing, not all imaginable query statements can be represented in the form of visual operations and, on the other hand, in changing the height of a bar there is no scale that would make it pos-sible to enter values with a precision of several places after the decimal point. A scenario that justifies the support of bidirectional mapping is, e.g., the automatic generation of a three-dimensional graphical user interface that stores its status in memory on closing the application.
If bidirectional mappings are to be supported by the information visualization system then in-formation on the source of the data must be stored in some form together with the visual ob-jects that represent this data. Since no new implementations are to be necessary in connection with a later migration from VRML to X3D, and the X3D core profile supports neither script nor proto nodes, this additional information on the origin of the data cannot be kept in the scene itself. Instead, an XML document is generated in addition to the scene which contains all VRML nodes in the scene that have been uniquely named by the DEF mechanism. For each of these nodes a list of IVIS Source References (ISRs) is saved, which specifies the exact location of the original item of data in the source document DOM. The syntax of these ISR expressions is pre-sented in Section 5.3.4.
4.4.5 Instantiation and animation In the detailed description of the mapping definition given later in Section 5.3.3 the requirement is expressed that it should be possible to instantiate a number of similar IVIS Objects with dif-ferent attributes along a spatial axis. This can be easily done with an XSLT loop expression such as <xsl:for-each> in combination with a running variable. Since instantiation processes of this kind frequently occur, it would make sense to introduce a kind of parameterable macro mechanism. In this way the user would only have to employ a single element with a number of parameters in the XSLT-mapping definition such as the loop variable to be used and the desired step size. These macro instructions would be replaced by a number of XSLT instructions before the actual mapping process is carried out.
A macro mechanism of this kind would make particularly good sense in connection with the definition of animations. Animations require a complex interaction of the X3D nodes TimeSensor, Interpolator and of those nodes whose data fields are intended to un-dergo time changes. A number of different interpolator nodes exist for some of the X3D datatypes (interpolation does not make sense, for instance, in the case of Boolean values or inte-gers) and a user without a detailed knowledge of VRML/X3D will not be able to describe an animation of this kind with the means provided by XSLT. Here it would be of considerable help to the user to be able to insert a ready-to-use animation macro into the mapping definition. The only parameter that has to be set is whether or not the animation is to be started automatically after the scene is loaded or only by an external event. A further parameter determines the length of an animation cycle. If the user selects an element or attribute from the data schema for the interface definition of an IVIS object in an animation macro, the program should check to see whether an interpolator node exists for the selected datatype and, if need be, ask the user whether or not the data is to be displayed in animated mode. If the user decides in favor of dis-playing the data in animated mode, the program will automatically carry out the complex links between the TimeSensor, the Interpolator and the target nodes before the mapping process is executed. The details of the realization of this macro mechanism are specified in Section 5.3.5.

4.4 SYSTEM REQUIREMENTS
- 124 -
4.4.6 Constraint modeling A number of different constraints can be identified for the process of narrowing down the range of possible mapping definitions and the execution of mapping processes. For instance, a type check can be carried out during the mapping definition. If visual objects are allowed to contain each other a check can be carried out to see whether structural requirements have been violated. By way of example, it would make sense for a room to contain tables and chairs. Conversely, it should not be possible to place rooms inside tables and chairs. Further constraints (e.g. number limits) can be defined that would only take effect when the mapping process is executed. For example, the condition could be defined for a table that a maximum of five chairs can be placed around it.
Two alternatives exist for the realization of constraints of this kind. Either they are noted as part of the visual objects or in the form of a separate, external description of the entire scene. In ac-cordance with strict object-oriented design these constraints must be viewed as attributes of the visual objects and, as such, should be noted as part of these. However, this approach is not vi-able here, since in practice it would involve a great deal of additional work and inflexibility in creating new visual objects. If, for instance, a new visual object is designed in the form of a chair, the work is not limited only to the new chair, but also includes changes in all existing objects that are in some way connected with this new chair (e.g. all tables the new chair could be placed at). If a visual object is used in another context, this produces a complex of far-reaching changes. If, on the other hand, constraints are laid down in a separate external description, the visual objects can be used flexibly and in any context.
For the program realized in this thesis the system user has sole responsibility for the sensible placement of objects and logical inclusion relations. The introduction of constraints is taken up in Chapter 7 as a possible further research topic.
5 ARCHITECTURE AND IMPLEMENTATION
- 125 -
5 Architecture and implementation The following chapter deals with the details of the architecture and implementation of a generic IVIS framework as called for in the previous chapters. First the architectural requirements are discussed that are to be imposed on the architecture and implementation of the prototype. After that the system architecture is presented and explained and the involved objects are more or less formally specified. Finally, there is a discussion of important details regarding the implementa-tion of individual software components as well as their use.
5.1 Architectural requirements A requirement imposed on any software system is good performance. Excessively long response times should be avoided so as not to frustrate the user with long and unproductive waiting times. Particularly in the case of information retrieval systems with visual user interfaces it is desirable to have an interactive information dialogue between the user and the application, which can be manipulated directly by visualized means [Hemmje,2000].
What is involved in the realization of the framework desired in Chapters 1.2 and 3.3 is a distrib-uted system with a client/server architecture. As is customary in systems of this kind solutions for the problems of consistency and synchronization are required for the implementation of the Store object as a server component (Chapter 5.4.5).
Since the user interfaces of the architectures end-user tools have a broad range of functions, there is a need for simple and intuitive handling and user interface instructions. It would make sense to have separate user modes for naive users and for experts. In the expert mode users could have access to the full mapping process in addition to simplified macro instructions, while the macro mode would enable naive users, not familiar with the detailed concepts of the in-volved languages, to use the system without having to deal with the confusing complexities of the full expressiveness.
For example, in the IVIS Mapping Definition Tool (introduced in the next section) the user has a choice of a number of alternatives that can be used in the mapping definition (IVIS Objects, attributes and elements from the application data schema, variables, extension methods for vari-ables, macros, XSLT instructions). Of the numerous options that exist, the user should always be offered only those that make sense and can be used in the current context.

5.2 SYSTEM ARCHITECTURE
- 126 -
5.2 System Architecture The following is an architectural diagram illustrating the interaction of the many components needed for the realization of the generic visualization framework. Here more attention will be given to the mechanisms of communication between the components than to the details of the implementation. The latter are discussed in detail in section 5.3
DBMS
IVIS Object Modeler
VRML Viewer
IVIS MappingDefinit ion Tool
VRML Viewer
IVIS Scripting DefinerWeb Cl ient or
Application
VRML Viewer
IVIS Data ExtractionDefiner
Applications in the Client Layer
IVIS Data MappingServer Object
Application ScriptingGenerator
Data ExtractionServer Object
IVIS Store Server Object
IVIS Object(XML)
Files in the File-System
IVIS ExtractionContext(XML)
Server-Components
IVIS MappingDefinition
(XSL+XML)
Mapping Data(XML)
Data Schema(XDR)
HTTP-Protokol-Layer
ASP-Layer
FIGURE 58 Architectural diagram of the generic visualization framework
Figure 58 displays the architecture of the generic visualization framework. At the top of the dia-gram IVIS tools are shown which serve the purpose of creating and storing files on the IVIS server as indicated at the bottom of the diagram. The client applications involved are the IVIS Object Modeler, the IVIS Mapping Definition Tool, the IVIS Scripting Definer, a web client, other applications intended to illustrate 3D information visualization, as well as the IVIS Data Extraction Definer. All these applications are not limited to being run only on the server. In-stead, several instances of these tools can be run simultaneously on several computers. The client applications communicate with the IVIS server via the HTTP protocol.
A number of objects exist on the server for users, each in their own storage areas. These objects are implemented as separate components with designated interfaces. On initialization of a ses-sion by the ASP layer an IVIS Data Mapping Server Object, an Application Scripting Genera-tor Object, an Data Extraction Server Object and an IVIS Store Server Object are created for each user. The client applications can now carry out special commands to the server components in the form of HTTP requests coded in URL. In this connection the server executes ASP pages which, in turn, have access to the objects that belong to a session. All instances of accessing the different files in the server file system are carried out via the IVIS Store Object. With the help of an appropriate synchronization primitive the IVIS Store Object must see to it that file manage-

5 ARCHITECTURE AND IMPLEMENTATION
- 127 -
ment on the server is carried out consistently (see Section 5.4.5). The most important file formats stored in the server file system by the IVIS Store Object are the descriptions of the IVIS Objects (.ivo), the IVIS Mapping Definitions (.imd), the IVIS Extraction Context (.ivx), the IVIS Map-ping Data Files (.ivd), as well as their schemata (.xdr). In addition, the Store has a directory of X3D primitives that can be used in the IVIS Object Modeler. Another directory contains pure XSLT stylesheets that can be used for the execution of the mapping process and are generated by the IVIS Mapping Definition Tool from the Mapping Descriptions. A last directory may contain XSLT stylesheets for general use, e.g. the X3D2VRML stylesheet.
Given that the linkages between the different components are very complex and the mapping process may seem somewhat confusing at first, the use of the framework is broken down into different phases and explained in detail in the following. This makes the complex interaction of the individual components more transparent.
1. The selection of data to be visualized stands at the beginning of every visualization process. The user employs the Data Extraction Definer for this. A module for the extraction of data from a relational database was developed in the context of a study project and is presented in Section 5.4.2. The Data Extraction Definer accesses the relational DBMS and stores the SQL statement selected by the user as well as the database URL in an IVIS Extraction Con-text file. The Data Extraction Server Object can export this information in a runtime situa-tion to convert the selected relational set of records to XML and provide a suitable XDR schema. Alternatively, the Data Extraction Definer can take over these tasks and place the source data in XML (Mapping Data .ivd) and the data schema in XDR in the Store in order to save computation time in a runtime mapping process.
2. In the next step a designer develops the visual objects. The latter can be made up of other existing IVIS Objects in the Store or of X3D primitives. Alternatively, X3D fragments can be used that are created with external 3D modelers (e.g. 3D-Studio Max) and loaded from a data medium on the client computer to the IVIS Object Modeler. The specifications for the IVIS Objects are given in Chapter 5.3.1. A description of the IVIS Object Modeler and its use follows in Chapter 5.4.1. After interfaces have been defined for the visual object and placed in the Store the IVIS Mapping Definition Tool (IMDT) comes into play. The IMDT has access to the IVIS Objects via the Store. If necessary the IMDT imports a Data Extrac-tion Definition File and generates the XML source document as well as the related XDR schema with the help of the Data Extraction Server Object, in case this was not done be-forehand by the Data Extraction Definer. The mapping definitions created with the IMDT are inserted as IVIS Mapping Description files (.imd) in the Store.
3. When the 3D scene is in a runtime situation certain interaction options are desirable. This is the case for objects whose visual attributes are changeable and are to be persistently stored in the database. Another important interaction option is to show or hide objects in the scene. Since the X3D core profile does not provide for Script nodes, interactive behavior of this kind has to be implemented with JavaScript methods that access the X3D viewer from the outside. The purpose of the components IVIS Scripting Definer and Application Scripting Generator is to automatically generate the JavaScript Code needed for interactive options. These components were implemented only in part for this thesis due to time constraints.
4. The last component, and one not previously described, is the application that carries out the actual information visualization process, e.g. a web client. Via an ASP page call up with a coded command in a URL the IVIS Data Mapping Server Object (IDMSO) on the server executes a mapping process kept in the Store to deliver back an entire VRML scene or parts

5.3 DESCRIPTION FORMATS AND SCHEMATA
- 128 -
thereof. The IDMSO needs access to all the filetypes kept in the Store. In addition, it must be able to carry out callups to other server components, such as the Application Scripting Generator and the Data Extraction Server Object. Direct communication between the ob-jects "living" in a storage area of a session is easily possible.
5.3 Description formats and Schemata Descriptions of objects posed in the preceding subchapters are presented and realized in the following sections. All concepts are explained by example rather than by its actual formal specifications, since on the one hand these specifications would be quite lengthy and on the other hand it would make the textual explanations unnecessarily complicated for the reader.
Since all concepts within the given architecture are described using XML, the actual formal specifications are noted using DTD grammar notation.
5.3.1 IVIS Objects IVIS Objects serve the purpose of decoupling visualization and information as described and called for in Section 3.8. In terms of the formal information visualization model introduced in chapter 4 these objects are equivalent to the presentation objects PO of the presentation space PS.
They are constructed with the help of a tool called IVIS Object Modeler, the implementation of which is discussed in Section 5.4.1. An IVIS object is an object in XML notation and consisting of a visual part described in X3D and an interface definition. The interface serves the purpose of encapsulating visual properties to which elements and attributes of the data schema can be allocated in later use in the IVIS Mapping Definition Tool22. A valid IVIS object has the follow-ing form: <?xml version="1.0" encoding="UTF-8"?> <!DOCTYPE IVISObject PUBLIC "../Dtd/IVISObject.dtd"> <IVISObject Name="AnimBox"> <Interface> <DataDestination Name="BoxPosition" DataType="SFVec3f" Path=".//*[@DEF='IVISRef1']/@translation" TestValue="0 0 0" MFSize="0"/> <DataDestination Name="BoxColor" DataType="SFColor" Path=".//*[@DEF='IVISRef2']/@diffuseColor" TestValue="1 1 1" MFSize="0"/> </Interface> <X3D> <Scene> <Transform DEF="IVISRef1" translation="0 0 0">
22 The IVIS Mapping Definition Tool is the implementation of a tool with which the mapping definition described in Section 4.4.3 can be carried out.

5 ARCHITECTURE AND IMPLEMENTATION
- 129 -
<children> <Shape> <geometry> <Box size="1 1 1"/> </geometry> <appearance> <Appearance> <material> <Material DEF="IVISRef2" diffuseColor="0 0 0"/> </material> </Appearance> </appearance> </Shape> </children> </Transform> </Scene> </X3D> </IVISObject>
The example represents a simple X3D box shape whose diffuse color and 3D translation proper-ties are exposed as bindable to data (so called data destinations).
A valid IVIS object must be in compliance with an expanded X3D document type definition (DTD)23, describing both the traditional visual structure of the X3D object and the structure of the interface definition. The actual formal specification of an IVIS object in DTD notation is identical with the current DTD for the X3D draft standard (http://www.web3D.org/TaskGroups/x3d/translation/x3d-compromise.dtd) with the addition of the following passage:
<!ELEMENT IVISObject (Interface, X3D) > <!ATTLIST IVISObject Name CDATA #IMPLIED> <!ELEMENT Interface ( DataDestination* ) > <!ELEMENT DataDestination EMPTY> <!ATTLIST DataDestination Name CDATA #REQUIRED DataType CDATA #REQUIRED MFSize CDATA #IMPLIED Path CDATA #REQUIRED TestValue CDATA #REQUIRED >
Nodes of this kind, whose visual attributes are to be externally visible and changeable, must be uniquely designated in the X3D description so that they can be referenced from the interface. This is realized through the DEF mechanism, which requires a unique designator for every node named. The interface consists of a number of DataDestination elements. A DataDestination has a name and the following attributes, which specify the target attribute in the X3D description in greater detail:
23 The full DTD for the upcoming X3D standard can be found at http://www.web3d.org/TaskGroups/x3d/translation/x3d-compact.dtd

5.3 DESCRIPTION FORMATS AND SCHEMATA
- 130 -
• Path: The path attribute contains an Xpath expression which returns the changeable element when applied to the X3D root element of the document object model (DOM).
• DataType: This attribute contains the X3D data type of changeable elements. This value can be used for a type check, if an element or attribute of the data schema is al-located to the DataDestination with the IVIS Mapping Definition Tool.
• MFSize: The numerical value of the MFSize attribute determines how many entries are to be contained in the X3D MultiField datatype specified by the Xpath expression. If the DataType is a MultiField datatype and the value of MFSize is zero, this means that what is involved is a number of data values not yet known at the time of the mapping definition. An example of a case like this is given by the coordinates of an open poly-gon (IndexedFaceSet), which are a list of SFVec3f values and, as such, of the MFVec3f type. Without knowing in advance how many corners an open polygon will have, the corner coordinates can be concatenated in this way as a string in a loop and allocated to the DataDestination as an expression. The MFSize value has no signifi-cance for DataDestinations with a SingleField datatype.
• TestValue: Since the IVIS Object Modeler is not yet connected to any source data, test values can be entered with the TestValue attribute, with the help of which the appear-ance of the object currently constructed can be tested with different values for all DataDestinations.
5.3.2 Application data schemata and data extraction Every application is to be able to define and use its own proprietary application data format or to fall back on an existing database system and schema. The use of XML for the uniform descrip-tion of the application data schema was proposed in Section 4.4.2. However, this procedure re-quires the design of a component that is able to convert structured data of any kind to XML format and to generate a related XDR schema. It needs to be possible to extend this DataEx-tractor component with modules, each of which converts a specific data format (relational, ob-ject-relational, and multidimensional database schemata, proprietary file formats) to XML nota-tion. The implementation of the DataExtractor tool described in Section 5.4.2 realizes a module of this kind for the conversion of a relational database schema to XML.
In the formal information visualization model these XML schema definitions and their instances generated by actual data are derived from the concept of information objects IO of the informa-tion set I and their structure resembles the information structure IS. Both, object properties and
structural information can be used to actually map onto the presentation space.
Since the information stored in a relational database is always in the form of rows and columns in tables as well as relations between tables, a schema of this kind can easily be mapped to XML. A fixed XDR schema can be formulated for this purpose consisting of tables, rows, columns, and fields and able to read and represent any relational database schema. In addition to convert-ing the data and generating the schema oneself, there is the option of falling back on existing solutions. There are various mechanisms at various levels for returning relational database con-tent in XML notation. For one thing the latest DBMS versions (e.g. SQL Server 2000) can pro-duce XML directly with the help of an extended SQL syntax. It is even possible to create a

5 ARCHITECTURE AND IMPLEMENTATION
- 131 -
schema definition. Another option is extended ODBC and JDBC24 implementations that are able to convert back and forth between relational result sets and XML. In this case the schema defini-tion is either fixed or automatically generated. It is not possible to define a schema. A further possibility is the use of a recent version (2.4 and later) of Microsoft's ActiveX Data Objects (ADO). The implementation of the DataExtractor tool makes use of ADO. Here the problem arises that the returned XML fragments are not in conformity with the generated schema. This problem and a way of resolving it are discussed in Section 5.4.2.
5.3.3 Mapping definition As was mentioned in Section 4.4.3, XSLT is used for the formulation of mapping rules.
Derived from the concepts used in our formal information visualization model this is equivalent to the Mapping argument of the IVIS function. This argument was only required to have the abil-ity to describe the calculation scheme of mathematical functions in a notation compatible with the other arguments of the IVIS function. Since XSLT is a computationally complete language and the other arguments are described in XML notation, this seems like a natural choice.
First of all the stylesheet is used to go to the document root with the data to be visualized. All the following Xpath expressions are then relative to the document root or the current number of context nodes. Output elements can be placed in almost any location of the stylesheet, e.g. tags such as:
<InsertDataHere></InsertDataHere>
If data from the original XML document, to which the stylesheet for the transformation process is being applied, is to be inserted into the document to be produced, the following XSLT instruc-tion can be used:
<InsertDataHere> <xsl:value-of select=’XPath expression’/> </InsertDataHere>
As a result, the content of the element or attribute selected by the XPath expression relative to the current number of context nodes in the original source document is inserted as the content of the „InsertDataHere“ element. Similarly, new attributes can be added to elements in a dynamic mode, based on the existence of specific source data:
<InsertDataHere> <xsl:attribute name=’NewAttribute’> <xsl:value-of select=’XPath expression’/> </xsl:attribute> </InsertDataHere>
As previously indicated, the IVIS Mapping Definition Tool can be used to insert entire IVIS Objects into the XSLT stylesheet. The current X3D draft ISO standard, which will very proba-bly become an ISO standard, models all visual properties of the X3D nodes as attributes. If ex-isting attributes are to be filled with data, a special abbreviated notation has to be used, since a nesting of element tags in the following form is not permitted:
24 ODBC and JDBC stand for „Open Database Connectivity“ and „Java Database Connectivity“ and provide an
interface for standardized access to different DBMSs.

5.3 DESCRIPTION FORMATS AND SCHEMATA
- 132 -
<InsertDataHere Attribute=’<xsl:value-of select=’XPath expression’/>’> </InsertDataHere>
Instead, the abbreviated notation of opening and closing braces is used („{“ and „}“), corre-sponding to the use of the <xsl:value-of> instruction:
<InsertDataHere Attribute=’{XPath expression}’> </InsertDataHere>
Individual IVIS Objects can be instantiated with the means described thus far. If several objects are to be instantiated in a loop, it is necessary to use running variables that define the position of the objects, since they would otherwise all be created in the same place in the generated scene. The use of the <xsl:variable> instruction would seem appropriate for this purpose. How-ever, this is not possible in practice, since a value assigned to an XSL variable (e.g. in a <for-each> instruction) cannot be changed and what is involved in this construction is, in reality, a constant.
To get around this problem XSLT scripting extensions are used, which are supported by any XSLT processor in its own form and syntax. For the implementation section of this thesis the syntax of the script extensions of the XSLT processor of Microsoft's XML SDK was used, which permits the use of VBScript and JavaScript as script languages. The methods imple-mented in JavaScript for the management of variables can be easily adapted for use in other script languages and by other XSLT processors. The following example (see Figure 59) shows the instantiation of X3D lettering in different colors along the X axis. The source data consists of a list of <Record Name=’’, r=’’, g=’’, b=’’> elements. 01 <?xml version="1.0" encoding="UTF-8"?> 02 <xsl:stylesheet xmlns:msxsl="urn:schemas-microsoft-com:xslt" 03 xmlns:user="http://mycompany.com/mynamespace" 04 version="1.0"> 05 06 <msxsl:script language="JScript" implements-prefix="user"> 07 <![CDATA[ 08 var i = new Array(1000); 09 for(j=0; j<i.length; j++) { i[j]=0 }; 10 11 function set_i(x,y) { i[x]=y; return i[x]; } 12 function get_i(x) { return i[x]; } 13 function inc_i(x,y) { i[x]=i[x]+y; return i[x]; } 14 function dec_i(x,y) { i[x]=i[x]-y; return i[x]; } 15 ]]> 16 </msxsl:script> 17 18 <xsl:template match="/"> 19 <xsl:for-each select="Record"> 20 <Transform translation="0,0,{user:get_i(0)}" DEF="IVISRef3"> 21 <children><Shape> 22 <appearance><Appearance> 23 <material> 24 <Material 25 diffuseColor="{@r}{@g}{@b}" 26 emissiveColor="1, 0, 0" 27 DEF="IVISRef1"/> 28 </material> 29 </Appearance></appearance> 30 <geometry>

5 ARCHITECTURE AND IMPLEMENTATION
- 133 -
31 <Text string="{@name}" DEF="IVISRef0"/> 32 </geometry> 33 </Shape></children> 34 </Transform> 35 <xsl:variable name="DummyVar1" select="user:add_i(0,2)"/> 36 </xsl:for-each> 37 </xsl:template> 38 39 </xsl:stylesheet>
FIGURE 59 Example of an XSLT mapping definition
An XSLT stylesheet is a valid XML document (line 1). Lines 2-4 contain the stylesheet root ele-ment and the namespace declarations for the XSLT script extensions. Lines 8-14 contain the script code for variable management in the form of a CDATA section in the <msxml:script> element, which uses the previously declared user namespace as an at-tribute. The meaning of this namespace will become clear in connection with the use of the ex-tension methods. The script code creates an array of string variables that are set to zero on ini-tialization and can be addressed via their index. In the implementation part, the user interface of the IVIS Mapping Definition Tool hides the extension methods from the user and addresses variables via user-defined names. Methods are given for setting and exporting as well as increas-ing and decreasing variable values (lines 11-14).
Line 18 selects the root element of the source document. With the <xsl:for-each> instruc-tion in the next line an iteration is carried out over all <Record> elements relative to the root of the source document. For every existing <Record> element an X3D scene graph is in-serted in the target document (lines 20-34). In lines 25 and 31 the attribute values of the current record element with the described abbreviated notation of the <xsl:value-of> instruction are inserted in the attributes of the X3D scene. Callups of the extension methods cannot take place at an arbitrary position in the stylesheet, but rather only in those places where XPath expressions or XSL method callups are possible. Callups of this kind occur in lines 20 and 35. For this purpose the user namespace prefix is prepositioned in front of the method callup. In line 35 the declaration of the dummy variable merely serves the purpose of making possible the callup of an extension method, without inserting an element in the target document. The callup of the user:get_i(0)method in line 20 exports the value of the variable with the index zero and writes it to the X position of the translation attribute in the superordinate trans-form node. The user:add_i(0,2) method in line 35 increases the value of the variable zero by two in every cycle of the <xsl:for-each> loop.
If a scale factor is to be integrated into the mapping process or if several elements and attributes of the source document are to be linked by more complex formulae based on the four arithmetic operations, the use of extension methods is not necessary for this purpose. Instead, the mathe-matical methods contained in the Xpath specifications can be used. In this way the prices of products can, for instance, be summed up in a shopping basket and exported along with, e.g., the German VAT (which is currently at 16%):
<Text string="{ (@product1price + @product2price) * 1.16 }"/>
In connection with the implementation of the IVIS Mapping Definition Tool, a description of which is given in Chapter 5.3.3, it is explained how the user interface hides the stylesheet that underlies the mapping process from the user. For this purpose the XSL instructions can be re-placed by intuitively comprehensible designations so that the user does not have to be familiar with the XSL syntax to use the mapping tool. In addition, it is possible to define macros (short-

5.3 DESCRIPTION FORMATS AND SCHEMATA
- 134 -
cuts) for recurrent complex instruction sequences. They are replaced by the corresponding XSL instruction sequences before the mapping process takes place. The specifications for this macro mechanism are given in Section 5.3.5.
5.3.4 References to the source data (IVIS Source Reference) The ISR mechanism was discussed in Section 4.4.4 in the context of the persistence requirement.
In terms of the formal information visualization model used throughout this thesis, these ISR's can be viewed as additional attributes for presentation objects used for remembering references to the attributes of the information objects. These could then be used by the functions in the function set F of the PS to perform operations on the information space in correspondence with
the manipulation of presentation objects through interaction. This topic, however, is not thor-oughly handled within the scope of this thesis. It will be of some importance in our future work on properly supporting the information visualization process.
In the following the syntax of IVIS Source References is specified. An IVIS Source Reference must unambiguously identify a specific attribute of a X3D object in the virtual scene as well as the precise position of the original item of data in the document object model (DOM) of the underlying XML document. Since in X3D only the nodes can be uniquely named via the DEF mechanism (and not the attributes), several ISR expressions can belong to a single named node, if data is allocated to different visual properties of an object. The ISR expressions are stored as an attribute of uniquely named nodes, which have visual attributes, enriched by source data. The ISR attribute is a list of expressions in the following form:
DataDestinatioName:DestAttributeName[DataTypeComponent] {ISRAnchorRef}:SourceAttributeName
The DataDestinationName is taken from the DataDestination definition of the Interface of an IVIS Object and is an important, human-readable designator. A designation of this kind is neces-sary, since the automatically generated, unique designators of nodes in a scene are not of impor-tance for the human reader (e.g. IVISRef42). If the user, for instance, selects a red sphere in the virtual scene with his mouse in the IVIS Mapping Definition Tool, he can be offered a list of visual properties of the selected object, generated from database content. A changeable property can be selected from this list of meaningful designators (e.g. SphereRadius, SphereColor, etc. ).
The unique designator of the target node in the scene must not be listed explicitly, since the ISR attribute belongs specifically to this target node, which has one or more changeable visual prop-erties. In the case of several changeable properties they are distinguished from one another by means of the DestinationAttributeName. Two different ISR expressions can belong to a single X3D transform node, one with „translation“ and the other with „scale“ as the DestAttribu-teName. Since target attributes may possibly be combined X3D data types, DataTypeCompo-nent indicates what component of the datatype was generated from the database content. The R and G values of an SFColor attribute can be set at one, while the B value is designated by the expression „emissiveColor[@BVal]“ as a changeable value inserted from a database. Thus, the changeable component of a visual property (target attribute) is precisely specified in the virtual scene.
To identify the position of the source data in the document object model (DOM) of the underly-ing XML document, all nodes of the XML source document are equipped with unique designa-tors, so-called ISRAnchorReferences, before the mapping process is executed. In this way the

5 ARCHITECTURE AND IMPLEMENTATION
- 135 -
source data is unambiguously identified in the untransformed DOM of the XML source docu-ment in a runtime situation of the VRML scene. Since it is not known in advance, whether the application data schema to be visualized is modeled by elements or attributes (or a mixture of the two), the option must also be provided for referencing different attributes of an individual node in the XML document. This is the purpose of the optional SourceAttributeName.
5.3.5 Higher level instructions (macro definitions) As indicated in connection with the specifications of the mapping definition, it makes sense to define abbreviations for frequently recurring, complex instruction sequences. By way of example, for the instantiation of several objects along a spatial axis an <xsl:for-each> instruction must be used, coupled with a running variable that increases with every loop cycle. This process can easily be automated and included in a parameterable macro. In that case the user will only need to use a single Instantiate macro element with the attributes Variable, InitValue, and StepSize instead of the complete XSLT instruction sequence. The Variable attribute gives the variable which is initialized at the InitValue and increased by the StepSize value with each loop cycle.
Macros are also used for more complex tasks, in addition to the mere replacement of long in-struction sequences by single commands. This is the case, for instance, with animations, which a user would not be able to put together himself without knowledge of X3D/VRML. The follow-ing example shows how the radius of a sphere can be animated. In this context it becomes clear that complex linkages of X3D nodes are necessary in addition to the simple replacement of in-structions. The radius of the VRML Sphere node is an unchangeable value so that it must be used for animation purposes as the child of a Transform node whose scale values determine the size of the sphere (line 16 in Figure 60). For an animation in VRML a TimeSensor node that fires Events at regular intervals has to be used in combination with an Interpolator node for an interpolatable datatype. The Interpolator node contains a number of Keys and the same number of values (Values) which the node interpolates in accordance with a given Key value. To create an animation only the time value of an active TimeSensor has to be sent to the Key value of an Interpolator. The calculated value of the Interpolator node will then be connected with a changeable value in the scene so that an animation is created. 01 <!-- extension methods as in (1-17)--> 02 <xsl:template match="/AnimationData"> 03 <Animate> 04 <IVISObject Name="AnimSphere"> 05 <Interface><DataDestination Name="SphereScale" 06 DataType="SFVec3f" 07 Path=".//*[@DEF='IVISa14']/@scale" 08 TestValue="1 1 1" 09 MFSize="0" 10 XVal="Scale/@X" YVal="Scale/@Y" ZVal="Scale/@Z"> 11 <Animation AnimationTime="{6}" 12 Loop="TRUE" KeyCount="{Scale}"/> 13 </DataDestination></Interface> 14 <X3D> 15 <Scene> 16 <Transform DEF="IVISa14" scale="1 1 1"> 17 <children><Shape> 18 <geometry> 19 <Sphere radius="1"/> 20 </geometry>

5.3 DESCRIPTION FORMATS AND SCHEMATA
- 136 -
21 <appearance><Appearance> 22 <material> 23 <Material diffuseColor="1 1 1"/> 24 </material> 25 </Appearance></appearance> 26 </Shape></children> 27 </Transform> 28 </Scene> 29 </X3D> 30 </IVISObject> 31 </Animate> 32 </xsl:template>
FIGURE 60 Use of animate macros
Figure 60 explains the use of animate macros. The Animate element can be used anywhere in a valid mapping definition (lines 3 and 31). For any DataDestination below the Animate ele-ment the user óf the corresponding tool can be asked (in connection with the allocation of an element or attribute from the data schema) whether an animation of the value is desired, to the extent that an interpolatable datatype is involved. If this is the case an Animation element (lines 11 and 12) is added to the DataDestination. This element contains information on the length of the animation cycle, whether the animation is to be started automatically and repeated endlessly after being loaded and over which element in the data schema the animation loop iter-ates in order to set the KeyValues for the Interpolator node and the step size for the Keys. The values for the X, Y, and Z component in line 10 are based on values provided by the user, when he allocates elements or attributes from the data schema to the Interface.
The following Figure 61 demonstrates how the animate macro is replaced by XSLT instruction sequences with the help of additional information in the Animation elements to get the de-sired animation in X3D after application of the XSLT mapping definition: 01 <xsl:template match="/AnimationData"> 02 <!-- X3D-description of the IVIS Object 03 (lines 16-27 of Figure 60) --> 04 <xsl:variable name="Var1" 05 select="user:set_i(997, (1 div (count(Scale)-1)))"/> 06 <xsl:variable name="Var2" select="user:set_str_i(999, '')"/> 07 <xsl:for-each select="Scale"> 08 <xsl:variable name="Var3" select=" 09 user:set_str_i(999, 10 concat(user:get_i(999), string(@X)))"/> 11 <!-- Analogous also concatenation der @Y and @Z values --> 12 <xsl:variable name="Var9" select=" 13 user:set_str_i(998, 14 concat(user:get_i(998), user:get_i(996)))"/> 15 <xsl:variable name="Var10" select=" 16 user:add_i(996, user:get_i(997))"/> 17 </xsl:for-each> 18 <TimeSensor DEF="TiS0" cycleInterval="6" loop="TRUE"/> 19 <PositionInterpolator DEF="SI0" 20 key="{user:get_i(998)}" 21 keyValue="{user:get_i(999)}"/> 22 <ROUTE fromNode="TiS0" fromField="fraction_changed" 23 toNode="SI0" toField="set_fraction"/> 24 <ROUTE fromNode="SI0" fromField="value_changed"

5 ARCHITECTURE AND IMPLEMENTATION
- 137 -
25 toNode="IVISa14" toField="scale"/> 26 </xsl:template>
FIGURE 61 The mapping stylesheet after replacement of the animate macros
Line 3 incorporates the content of the X3D section of the IVIS Object unchanged. The Key-Values of an Interpolator node must always lie between zero and one. The instruction in line 5 calculates the step size for the KeyValues and inserts it in variable 997. The KeyCount value that was given by the user is used in the corresponding DataDestination (line 12 in Figure 14). Since the same variable indexes are used for the replacement of all DataDestinations, the string that concatenates the KeyValues has to be erased. This happens in line 6. After that a <for-each> instruction (lines 7-17) iterates over the element given in KeyCount to concatenate both the KeyValues as well as the Keys of the Interpolator node as a string. The X, Y, and Z values of the scale constitute the KeyValues and are collected as a string of the MFVec3f type in the variable 999 (lines 8-11). The concat method used in line 10 is part of the XSLT language. Lines 12-16 calculate (with the help of the step size stored in variable 997) a series of Key values between zero and one which are inserted in variable 998. This is followed by an X3D TimeSensor node, which accesses the information given in the Animation node of the Interface with regard to the length of the animation cycle and repetition of the animation. Line 19 contains an Interpolator node that matches the animated datatype. What is involved in the present example is a PositionInterpolator for the datatype SFVec3f. For the attributes Key and KeyValue the values of the concatenated strings are used in variables 998 and 999. This is followed by two X3D instructions for forwarding the event in the scene. The ROUTE instruc-tion in line 22 forwards the time values generated by the TimeSensor to the Interpolator node. The latter calculates a current KeyValue value which the second ROUTE instruction in line 24 directly allocates to the scale value of the Transform node uniquely named as „IVIS-Refa14“. 01 <?xml version="1.0" encoding="UTF-8"?> 02 <X3D> 03 <Scene> 04 <Transform DEF="IVISNode1" scale="1, 1, 1"> 05 <children> 06 <Shape> 07 <geometry> 08 <Sphere radius="1"/> 09 </geometry> 10 <appearance> 11 <Appearance><material> 12 <Material diffuseColor="1 1 1"/> 13 </material></Appearance> 14 </appearance> 15 </Shape> 16 </children> 17 </Transform> 18 <TimeSensor DEF="TiS0" cycleInterval="6" loop="TRUE"/> 19 <PositionInterpolator DEF="SI0" 20 key="0, 0.2, 0.4, 0.6, 0.8, 1" 21 keyValue="1 1 1 , 2 3 1 , 1 2 4 , 3 2 3 , 2 4 2 , 1 1 1"/> 22 <ROUTE fromNode="TiS0" fromField="fraction_changed" 23 toNode="SI0" toField="set_fraction"/> 24 <ROUTE fromNode="SI0" fromField="value_changed" 25 toNode="IVISNode1" toField="scale"/>

5.4 SYSTEM COMPONENTS
- 138 -
26 </Scene> 27 </X3D>
FIGURE 62 The X3D scene after application of the mapping stylesheet
The above Figure 62 displays the finished X3D scene description after application of the map-ping stylesheet from Figure 61 to the DOM of a source document. The Key and KeyValue at-tributes of the PositionInterpolator node are filled out with the values from the source document (lines 20 and 21). The current values of the Interpolator node are allocated in a run-time situation to the scale attribute of the Transform node in line 4 so that the desired animation is realized.
In this chapter we have presented an abstract model for information visualization in terms of the set theory. On the basis of this abstract information visualization model and in resemblance of Schneiderman’s reference model, a general information visualization process model has been derived describing the steps involved in transforming structured data into a visualization that can be percieved by humans. From this process model a system model for an information visualiza-tion system supporting these steps is derived. Several formal specifications and description for-mats have finally been introduced in this chapter, which will directly be usable within an imple-mentation of such a generic framework as presented in the next section Error! Reference source not found..
5.4 System Components After the detailed discussion of the architecture of the implementation prototype and the mechanisms of communication between its components given in the preceding section, now individual tools as well as server components are presented and their implementations examined more closely.
5.4.1 IVIS Object Modeler Since the format for the description of IVIS Objects has already been specified and the purpose of the IVIS Object Modeler tool has already been discussed, the primary focus of attention here is on how this tool is used.
Figure 63 displays the user interface of the IVIS Object Modeler. With the „New IVIS Object“ button a new IVIS Object, consisting of a root element with a Name attribute as well as an In-terface and an X3D root element as child elements, is generated in the „Object“ treeview. There are several alternatives for putting together the X3D description of the object in the treeview. On the one hand, X3D primitives and existing IVIS Objects can be inserted in the Scene ele-ment or in children elements of group nodes through the „Primitives“ and „IVIS Objects“ win-dows on the right-hand side. The content of these two windows is imported via the server's IVIS Store Server Object and can be added to at will. In this way the entire X3D node population can easily be made available as files on the server. On the other hand, any valid X3D can be im-ported from a client computer data medium using the „Load X3D“ button. In both cases the IVIS Object Modeler tool explicitly shows all visual attributes of the X3D nodes in the tree view.

5 ARCHITECTURE AND IMPLEMENTATION
- 139 -
FIGURE 63 The IVIS Object Modeler
If the user drags a visual attribute of a X3D node with the mouse and drops it on the Interface element or, alternatively, if he clicks on an attribute of this kind with the right mouse button, the dialogue displayed in Figure 64 will open. On the basis of the information entered in this dia-logue, e.g. name and test values to be used, a DataDestination element is created in the Inter-face. The X3D datatype of the selected attribute will be used automatically.
FIGURE 64 The Data Destination Dialog of the IVIS Object Modeler

5.4 SYSTEM COMPONENTS
- 140 -
The user can give individual nodes meaningful names with the „Add IVIS Name“ button. Only nodes that have been given a name here can later be hidden or shown in the scene in a runtime situation. The „to VRML“ button inserts the X3D description currently contained in the tree-view in the VRML preview window. However, this button does not have to be used explicitly, since all actions resulting in visual changes (such as the insertion or deletion of nodes and the changing of DataDestination TestValues) are internally coupled with an update of the preview windows. The „Save VRML“ button stores the scene currently shown in the Preview window in VRML format on the client hard disk. The generated IVIS Object is saved as an XML document (.ivo) on server in Store with the „Save Object“ button.
5.4.2 IVIS Data Extraction Definer If the data to be visualized is not yet available in the form of an XML document, such as is the case, for instance, with web content, the structured application data of whatever format must first be converted to XML. This purpose is served by the IVIS Data Extraction Definer dis-played in Figure 65.
In the context of a study project on the application scenario of the corpograms, which will latter be described in section 6.1.4, a module was implemented involving the conversion of relational database content to XML. The conversion is carried out in the Data Extraction Server Object with the help of Microsoft's ADO. A detailed description of this process is given in section 5.4.5. The IVIS Data Extraction Definer (IDED) serves to define a view of the database. First of all the user of the tool (the 3D IVIS Modeler, see Figure 57) selects the desired database with the help of the „Select DB Source“ button. The IDED offers the user a list of all databases regis-tered on the system as ODBC data sources. These can be both relational database systems (such as MS SQL Server, Sybase or Oracle) as well as file-based databases (such as MS Access, DBase, Excel or Foxpro). With the „Show DB schema“ button the user can look at all the tables present in the database. The user enters SQL instructions in the „SQL Console“ and checks the results with the „Execute SQL“ button until he or she has defined the desired view. The „Save to IVIS“ button saves the database URL and the SQL instruction together in an IVIS Extraction Context (.ivx) file on the server which can then be used later for the actual conversion by the Data Extraction Server Object.

5 ARCHITECTURE AND IMPLEMENTATION
- 141 -
FIGURE 65 The IVIS Data Extraction Definer
For other kinds of data sources, e.g. multidimensional databases, new modules must be provided in each case for the IVIS Data Extraction Definer and for extraction by the Data Extraction server Object.
5.4.3 IVIS Mapping Definition Tool The most important part of the IVIS Mapping Definition Tool (IMDT) is the Mapping treeview in the center of the user interface (see Figure 66). To create a new Mapping Definition an XML source document must first be loaded. This is done with the „Load XML“ button below the schema treeview. If the XML source document is already loaded and internally represented as a DOM structure the user can then create a new Mapping Definition or load an existing one („New“ and „Load“ buttons below the Mapping treeview). The „Open IVIS Project“ button on the lower right makes it possible to select an XML source document and a Mapping Definition file back to back. The Mapping treeview is directly coupled with an internal DOM representa-tion; i.e. methods exist that make it is possible to identify a DOM element unambiguously for every treeview element and vice versa.
The Mapping Definition can now be put together from the various elements that are available in the Schema treeview and the four selection boxes on the right. Every XSLT mapping stylesheet consists routinely of an <xsl:template> element. In the Mapping treeview only the at-tributes (i.e. the leaves of the tree) can be edited. First of all the user has to determine what ele-

5.4 SYSTEM COMPONENTS
- 142 -
ments of the source document are to be selected from the template element. To do this he can edit the match attribute of the template element by double clicking with the mouse and entering the desired XPath expression manually. The Schema browser on the left simplifies this process and gives users who are not familiar with the Xpath syntax a chance to work with the tool. Users need only select the desired target attribute in the Mapping treeview and then select an element or attribute of the schema by double clicking on it. The XPath expression is gener-ated automatically and inserted in the selected attribute of the Mapping treeview. With two radio buttons below the Schema browser the user can determine whether the Xpath generation should be absolute (with regard to the root of the schema definition) or relative. On selection of the relative method the current context node in the Mapping treeview is found and the computation of the XPath expression carried out relative to it.
FIGURE 66 The IVIS Mapping Definition Tool
The content of the four selection boxes on the right side is context dependent, i.e. it is directly dependent on the selection of an element or attribute in the Mapping treeview. The distinction described in section 5.1 between the functionality of mode for experts and that of a mode for naive users is not realized in the current version of this project. The user has access to the full range of expressions in the XSLT language in the „Instructions“ selection box on the upper left-hand side. In accordance with the XSLT element selected in the Mapping treeview only those instructions are shown in the „Instructions“ selection box that are permitted as child elements by the XSLT specifications. Hiding the use of XSLT as a mapping language from the user can be effected by mapping XSLT instruction names one-to-one to other “friendly” names. These ali-

5 ARCHITECTURE AND IMPLEMENTATION
- 143 -
ases are then shown in the Mapping treeview and in the „Instructions“ selection box instead of traditional XSLT instructions.
The user can insert IVIS Objects from the upper right „IVIS Objects“ selection box anywhere in the Mapping treeview (e.g. in an <xsl:for-each> instruction). As can be seen in Figure 66 an element with the title „IVIS Object“ (followed by the name of the specific object) is inserted in the Mapping treeview. The DataDestinations of the Interface definition as well as the mean-ingful designators assigned to them in the IVIS Object Modeler are shown as child elements (in the example „SphereScale“). The IMDT automatically initializes the components of the X3D datatypes with the TestValues given in the IVIS Object Modeler. Datatypes and information on size specification in the case of multifields are kept in internal data structures. The user can edit and define the attributes of the DataDestinations manually or select elements and attributes from the Schema browser. Through a combination of the two alternatives the user can put to-gether complex formulae consisting of several elements of the data schema and mathematical functions (*, DIV, +, -).
The user of the IMDT can enter any variable name in the „Variables“ selection box. The alloca-tion of variable names to indexes for JavaScript variable management extension functions is saved in Store (in XML notation) together with the IVIS Mapping Description (.imd) and re-stored when a Mapping Definition is loaded. Variables can be used directly as values in the DataDestination attributes of IVIS Objects and manipulated via the instructions listed in the select box. Variables can be set, deleted, increased, decreased, and concatenated. The IMDT in-terprets the variable content as numerical values or as strings, depending on the context.
The last select box on the lower right hand side contains the macro instructions. In the course of this thesis only the „Instantiate“ and the „Animate“ macros were implemented. It will have to be the aim of ensuing projects to provide a macro-based language so comprehensive that the use of individual XSLT instructions will become superfluous. When a macro is selected it is placed with its specific attributes in the mapping treeview. Before the IMDT carries out the mapping process the macros are replaced by XSLT instruction sequences, as described in section 5.3.5.
Any fragments of the mapping treeview can be copied and moved to a different location by dragging and dropping them with the right and/or left mouse button (or alternatively with the „Copy“ and „Paste“ buttons). However elements can be moved only within one level, since ex-changing an element for its parent element would not be desirable and also not permitted in all cases. Through a special copy mode the user is able to copy the content of an existing Interface of an IVIS Object to a newly added IVIS Object with an identical or extended Interface defini-tion. Allocation of elements from the various select boxes and the Schema browser treeview to an attribute of the mapping definition always takes place in the same way. First of all the user selects the target attribute in the mapping definition. Then an element is inserted in one of the various select boxes in the mapping definition by double clicking. A drag-and-drop function would be desirable for this process, but was not realized in the framework of this thesis for time reasons. However, it could easily be implemented.
Finally, a description is to be given here of what happens when the user activates the „Preview“ button and triggers the mapping process. The source code for the mapping process (gener-ateAndApplyStylesheet method) has not been printed here for reasons of space and clarity, instead, only an overview is given of the sequence of actions carried out.
1. Check if a DOM representation of the mapping treeview exists (MappingEditorDOM).

5.4 SYSTEM COMPONENTS
- 144 -
2. If this is the case, clone the DOM in question. The following replacements are carried out on the cloned DOM, since the mapping treeview is to remain unchanged.
3. Remove all macros from the mapping definition and replace them by XSLT instruction sequences.
4. Iterate in a loop over all IVIS Objects. For every existing IVIS Object :
a. For very DataDestination in the Interface :
i. Find the item to be replaced in the X3D tree section of the current IVIS Object on using the Xpath expression.
ii. Replace the content of the identified item (with consideration given to the datatype) with the inputs made in the Mapping treeview.
b. Remove the Interface definition of the current IVIS Object from the mapping defi-nition
5. Replace all variable instructions (IncVar, DecVar, SetVar, GetVar, SetStrVar, ConcatVar) with corresponding XSLT instructions and the JavaScript extension methods for variable management.
6. Remove empty attributes of XSLT instructions and X3D nodes to keep the X3D descrip-tion as compact as possible. The X3D viewer replaces attributes of X3D nodes that have been left out with default values when the scene is loaded.
7. Store the now pure XSLT stylesheet on the hard disk (or alternatively save it in the Store) and use the IVIS Data Mapping Server Object for the execution of the mapping process.
8. Apply the generated mapping stylesheet on the DOM of the source document: an X3D document is created that is enriched by additional IVIS attributes (IVIS Source Reference - ISR).
9. Assign unique designators for all named nodes in the X3D DOM (IVISRefX).
10. Generate an XML list of named nodes that is needed for the realization of interaction op-tions and persistence.
11. Remove IVIS Source Reference attributes in order to preserve valid X3D.
12. Apply the X3D2VRML stylesheet to the X3D DOM
13. Render the resultant VMRL string in a separate Preview window.
5.4.4 IVIS Scripting Definer The IVIS Scripting Definer is a tool that makes it possible to specify different information sources for an application scenario. This is necessary so that the IVIS Application Scripting Generator component on the server described in section 5.4.5 can generate the Script Code needed for the desired interaction and object behavior. In an initial prototype implementation the Script Code was generated for fixed-definition interactive behavior. In later versions it should be possible to select a number of types of interactive behavior from a multiple-choice select box and to combine them.

5 ARCHITECTURE AND IMPLEMENTATION
- 145 -
FIGURE 67 The IVIS Scripting Definer
The user interface of the IVIS Scripting Definer currently consists only of a number of fields that can be filled via a file dialogue and a „Generate“ button that transmits the indicated file names to the IVIS Application Scripting Generator component on the server and initiates Script generation there. The first file with the designation „VrmlNodeFile“contains a list of all nodes that have been given an appropriate designation in the IVIS Object Modeler. This list is generated as the next-to-the-last step of the generateAndApplyStylesheet method of the IVIS Mapping Definition Tool (or alternatively in the IVIS Data Mapping Server Object on the server) (see Chapter 5.4.3). The „TimeSensorFile“ file is generated in the same way and con-tains a list of the names of all TimeSensor nodes contained in the scene that are generated automatically for animations. The third field with the designation „HTML Source“ takes in a file that is a template for the HTML page to be generated. It contains the VRML viewer and other control elements such as a treeview which is recognized by the IVIS Data Mapping Server Ob-ject on the basis of a unique designator and filled with the tree structure of the named VRML nodes. The „HTML destination“ indicates under what name the HTML file, enriched with Script Code, is to be stored. In a later version the Data Mapping Server Object will return the generated HTML page via an ASP callup directly to a web client. The last field with the designa-tion „Source Data“ specifies the source file with the data to be visualized, the elements of which are assigned unique designators that can be referenced by the IVIS Source References (ISRs) for the realization of persistence.
In the current version a Script Code is generated that makes it possible to show or hide the named VRML nodes by clicking on them in the treeview. In later versions it should be possible to select from a large number of different types of interaction behavior for the objects via a se-lect box. In addition, all the information entered should be stored in a kind of project file which the Data Mapping Server Object can use to generate HTML pages dynamically in a runtime situation.
5.4.5 IVIS Server components The last section of this chapter discusses specific implementations of the individual IVIS server components depicted in Figure 58.

5.4 SYSTEM COMPONENTS
- 146 -
IVIS Store Object (ISO): The ISO manages access to all files belonging to the IVIS system. They are stored separately in the file system of the web server in accordance with the different IVIS file formats. There is a separate directory on the server for each of the following file for-mats: descriptions of IVIS Objects (.ivo), IVIS Mapping Definitions (.imd), IVIS Extraction Context (.ivx), IVIS Mapping Data Files (.ivd), Schemata (.xdr), X3D Primitives (.x3d), IVIS Mapping Stylesheets (.ims) and stylesheets for general use (.xsl). Since several instances of the different client tools of the distributed system are able to access the files managed by Store si-multaneously in read and/or write mode, the ISO has to synchronize the access instances. The use of a DBMS is an easy solution for problems of this kind, since it takes over the management of concurrent access attempts by several clients. Even easier solutions can be employed for the implementation of the ISO. The operating system file manager provides very easy-to-use syn-chronization options by permitting multiple parallel read access to a single file, whereas a write access takes place exclusively. For read access clients can use a URL which they receive in the ISO as a result of a method callup, to the extent that there is no currently ongoing write access to the file to be read. In such a case the client must wait with its read operation until the write operation is completed. The client tools write files to the server file system through „Uploads“ via the FTP protocol. To do this the client calls up the method generateTempFileName of the ISO with an IVIS filetype and the name of the file to be stored as the parameter and in this way gets a temporary unique file name back as a return value. From this moment on the file to be written is locked for all further write or read access attempts. This guarantees that at any given point in time only one client can access a file in write mode and the reading clients always receive the latest version of a file. If the client has ended its FTP upload it informs the ISO by means of the indicateFileTransmitted(tempFileName) method callup. The ISO copies the temporary file present in the FTP root directory with the right name into the directory provided for the IVIS filetype and releases the file again for further read and write access at-tempts.
IVIS Data Extraction Object (IDEO): The IDEO reads an IVIS Extraction Context file in and uses the information it contains regarding the database URL, the database name, and the desired SQL instruction. The database is accessed by executing the SQL instruction on Microsoft's ActiveX Data Objects (ADO) and returns an ADO ResultSet. This ResultSet can easily be converted via the ADO method callup ADO_RS.save(DOM, adPersistXML) into an XML file with integrated XDR schema (inline). The ADO XML methods, at the time of imple-mentation in the beta phase, do not provide a valid XDR schema and no XML in conformity with the schema. For this reason the IDEO must first of all carry out a few manipulations of the schema as well of the DOM of the source document before the ISO is able to save them to the server as separate files.
IVIS Data Mapping Object (IDMO): The IDMO reads in the files that are part of a given pro-ject, executes the mapping definition, and delivers the resultant VRML scene back to the client. A project consists of an XML source document (.ivd), which is referenced to a related schema (.xdr), as well as an IVIS mapping definition (.imd), or, alternatively, an XSLT mapping stylesheet (.xsl) which has been precomputed by the IVIS Mapping Definition Tool. The execu-tion of the mapping process takes place analogous to the steps indicated in section 5.3.3. If a precomputed mapping stylesheet is used then only the last three steps need to be executed. This results in a slight savings in computing time. The application can indicate via a Boolean flag whether changes in the database (persistence) are to be possible or not. In this case the nodes of the DOM source document are assigned unique designators before the mapping process is car-ried out and the necessary ISR lists are generated.

5 ARCHITECTURE AND IMPLEMENTATION
- 147 -
IVIS Application Scripting Generator (IASG): The IASG was not fully implemented in the course of this project. As described in section 5.4.4, the IASG tool generates JavaScript Code, which finds a uniquely named treeview in the HTML source file and fills it with the tree structure of the X3D nodes designated in the IVIS Object Modeler. If the user clicks on the correspond-ing objects in a runtime situation of the VRML scene or on the named elements in the treeview, they are hidden or shown in the scene. In addition, the IVIS Source Reference values (ISR) are inserted in a text field when the user positions the mouse pointer above an object equipped with a TouchSensor. Persistence is thus very easy to achieve. The showing and hiding of VRML ob-jects is realized by means of JavaScipt methods, with the help of which the objects in the scene can be manipulated via the VRML Automation Object Model for Cortona ActiveX Control.

6.1 APPLICATION SCENARIOS
- 148 -
6 Evaluation of application scenarios
In this chapter a number of application scenarios are introduced, which have been implemented using the information visualization framework presented in the preceding chapters. An experi-mental performance analysis based on simulation and a series of measurements during the simu-lation will be carried out on these scenarios. The measured values will then be analyzed and in-terpreted.
Since the implemented IVIS framework and the generated applications can be observed as appli-cations adhering to the Model-View-Controller (MVC) paradigm, the following performance analysis will give us an indication if it is generally feasible to apply this paradigm to the develop-ment of 3D information visualization applications.
Throughout this chapter four different 3D application scenarios have been chosen, which are introduced in the following sections.
6.1 Application scenarios Within the upcoming sections these chosen scenarios are shortly explained, justified, and dis-cussed with respect to the applicability of the information visualization framework implemented in the course of this thesis.
6.1.1 Bar chart The first scenario generates the well-known metaphor of the bar chart with two variable axis dimensions spread across two spatial dimensions and a value axis with the values mapped to the height of the bars spread along the third spatial dimension. The bar chart scenario therefore maps numerical information objects – in our case yearly company turnover - to visual attributes of presentation objects (height of bars).
This scenario was mainly chosen for its simplicity in display as well as for its straightforward mapping of numerical values to bar heights. The argument is that if you first produce a highly complex piece of software including the framework itself and several tools, it should not only be suitable for complex scenarios. In other words, if the system wouldn’t even do the job on a sim-ple bar chart there would definitely be something dread wrong. Furthermore, the bar chart is a well-known and established abstract visual metaphor.
For this application scenario the IVIS Mapping Definition Tool was used to reproduce the visu-alization originally used within the OLAP Explorer tool (see section 3.4.1). However, the data

6 EVALUATION OF APPLICATION SCENARIOS
- 149 -
here is not read out of a multidimensional database by an MDX instruction (Microsoft’s equiva-lent to the SQL query language on relational data) as in the case of the OLAP Explorer. Instead, it is stored in a matrix in XML notation. The visualization is effected with three-dimensional bars, arrayed in a two-dimensional matrix. The height of the bars represents the values contained in the source matrix. This is done with the help of two nested <xsl:for-each> instructions, iterating first over the rows and then inside the rows over the columns of the matrix.
FIGURE 68 The bar chart application scenario
A simplified IVIS Mapping Definition is given in the following, which carries out the desired mapping function: 01 <xsl:template match="/Barchart"> 02 <xsl:for-each select="Record"> 03 <xsl:sort select="@name"/> 04 <IVISObject Name="BarchartText"> 05 <Interface> 06 <DataDestination Name="Text" DataType="MFString" 07 MFStringValues="{@name}"/> 08 <DataDestination Name="TextColor" DataType="SFColor"/> 09 <DataDestination Name="Position" DataType="SFVec3f" 10 XVal="-2" YVal="0" ZVal="{user:get_i(2)}"/> 11 </Interface> 12 </IVISObject> 13 <IVISObject Name="BarchartLines"> 14 <Interface> 15 <DataDestination Name="Color" DataType="SFColor"/> 16 <DataDestination Name="Points" DataType="MFVec3f"/> 17 <DataDestination Name="Position" DataType="SFVec3f"/> 18 </Interface> 19 </IVISObject> 20 <xsl:for-each select="Column"> 21 <IncVar VarName="XTrans" StepSize="2"/> 22 <IVISObject Name="Bar">

6.1 APPLICATION SCENARIOS
- 150 -
23 <Interface> 24 <DataDestination Name="BarchartColor"/> 25 <DataDestination Name="BarchartPosition" 26 XVal="{user:get_i(3)}" YVal="{0.5}" 27 ZVal="{user:get_i(2)}"/> 28 <DataDestination Name="BarchartScale" 29 XVal="{1}" YVal="{@value}" ZVal="{1}"/> 30 </Interface> 31 </IVISObject> 32 </xsl:for-each> 33 <SetVar VarName="XTrans" Value="0"/> 34 <IncVar VarName="ZTrans" StepSize="2"/> 35 <xsl:if test="position()=last()"> 36 <xsl:for-each select="Column"> 37 <IncVar VarName="XVar" StepSize="2"/> 38 <IVISObject Name="BarchartText"></IVISObject> 39 <IVISObject Name="BarchartLines"></IVISObject> 40 </xsl:for-each> 41 </xsl:if> 42 </xsl:for-each> 43 </xsl:template>
Line 1 selects the root of the source document. Line 2 iterates over all existing lines of the matrix and sorts in accordance with the name attributes of the lines (line 3). For every existing line the name of the line (BMW, Opel, Porsche, VW) and the delimiting lines are exported (IVIS Objects in lines 4 and 12). The variable with the index 2 serves the purpose of positioning on the Z axis. It corresponds to a variable with the name „ZTrans“ in the IMDT (see ZVal definition in line 10). For every current line from line 20 onwards an iteration is carried out over all existing col-umns. In every loop cycle the XSLT processor increases the variable „XTrans“ by two (line 21). It is accessed by the JavaScript extension methods for variable management via the index 2. The individual bars are placed in the loop on the basis of an IVIS Object (lines 22-31). Positioning is carried out by the variables XTrans and ZTrans (lines 26 and 27). The height of the bar de-termines the scale value at which the Value attribute of the current column of the source matrix is set (line 29). When the internal loop has been completed the XSLT processor sets the Xtrans variable back to zero and increases the ZTrans variable by two (lines 33 and 34). After this a check is carried out to determine whether the external loop is in the last cycle (line 35) and if this is the case the name and delimiting lines for the columns are exported (Jan, Feb, Mar, Apr, May).
The application of the described stylesheets to the following source data produces the visualiza-tion displayed in Figure 68 . <?xml version='1.0'?> <Barchart xmlns:="x-schema:Barchart.xdr"> <Record name="BMW"> <Column name="Jan" value="1.3" /> <Column name="Feb" value="4.2" /> <Column name="Mar" value="3.6" /> <Column name="Apr" value="2.1" /> <Column name="May" value="1.1" /> </Record> <Record name="VW"> ... </Record> ... </Barchart>

6 EVALUATION OF APPLICATION SCENARIOS
- 151 -
6.1.2 Organigram (organizational chart) Secondly we chose the organigram as a scenario. This metaphor represents an organizational chart, which visualizes the hierarchy within an organization (e.g., a company) as a set of icons connected by a hierarchy graph. It can therefore be viewed as a mixed metaphor, containing elements of an abstract metaphor as well as of a real world metaphor. An organigram has several features, which make it interesting as a test scenario for the general information visualization mapping process. First of all it does not only map attributes of information objects to visual at-tributes of presentation objects but also maps structural information (the hierarchy information) to presentation objects. This is visualized by connection lines between the hierarchy levels. This means that not only the information space is involved in the information visualization mapping function but also the information structure. Furthermore the organigram metaphor uses com-pound data types consisting of simple data elements, such as the names of employees, as well as complex data elements, such as two-dimensional images of the employees.
In the preceding bar-chart scenario the underlying mapping stylesheet was provided in full (even if in simplified form). The same type of detailed description is not given in the following. In-stead, a description is given of the specific problems involved and selected solutions for the sce-nario in question.
An Organigram is a visual representation of the management structures of a company. Com-pany employees are represented by nodes and the relations between the persons in question are represented as connecting lines between the nodes. A graph or a tree structure is produced in accordance with the kinds of relations depicted. Although our example lays out the graph in a plane, it is positioned within a 3D space and could also easily be laid out in 3D, like, e.g., in seen in section 2.9.2.2 in the cone tree visualization In the present application scenario the connect-ing lines represent relations to superiors. The source document consists of a list of persons of the following form:
<person type="institute director"> <name>Neuhold</name> <projects></projects> <boss></boss> <picref>Neuhold.jpg</picref> </person>
Figure 69 displays an Organigram (organization chart) with a number of persons from the IPSI Institute in Darmstadt. The institute director is at the highest level. Department heads are at the next lower level. Those below them are project managers. The persons at the lowest level are students.

6.1 APPLICATION SCENARIOS
- 152 -
FIGURE 69 The Organigram application scenario
The mapping stylesheet in the present application example is considerably more complex than that of the preceding bar chart scenarios and requires extensive use of JavaScript extension methods due to a number of XSLT constraints. For the placement of individual persons an <xsl:for-each> instruction iterates over the list of all persons. In order to rule out an in-tersection of connecting lines the previously unsorted list of employees is sorted by employee type. After this the sorted list is sorted a second time in accordance with a further criterion, i.e. the name of the superior, and, finally, it is sorted a third time in accordance with a third criterion, i.e. in alphabetical order. The number of employees at a given level must be known for the placement of the person nodes. This can be easily determined via the XSL method count(XPath-Expression). In accordance with the level, the number of employees on a given level, and the position on a level the exact position of the person currently being processed can be determined.
Since it is not possible to make use of previously processed nodes in XSLT and the XSLT method position() gives the position of the current element in the unsorted context node set, a complicated process has to be gone through to reconstruct the position of the superior. The name of the current superior is temporarily stored in a variable via the Java Script extension methods. After this the original unsorted list is sorted once again in accordance with the above-named criteria and this process is continued until the node of the superior who is being looked for has been reached. In this process the superior's position at the level he is located on is noted. In this way the position of the superior is reconstructed and the connecting line can be drawn. Aside from the sorting processes, the runtime of the algorithm presented for the construction of

6 EVALUATION OF APPLICATION SCENARIOS
- 153 -
the organigram (organization chart) is quadratic and cannot be further optimized on the basis of XSLT constraints.
6.1.3 cyber:gallery The third experimental scenario is that of the cyber:gallery system, which our group has devel-oped as described in more detail in section 3.1.2. The main reason for choosing this scenario was our familiarity with the implementation details. Since we already knew how much effort it was in implementing the 3D visualization part of the application we could very well estimate the time savings of using such a information visualization framework instead. This scenario involves a real world visual metaphor of a multi-floor gallery building, which imposes a much larger set of map-ping rules since every information entity and every piece of structural information can trigger the generation of potentially complex visual compositions of objects (rooms with doors and paint-ings hanging on the walls etc.). The metaphor makes intense use of elements of a multidimen-sional information structure and uses compound data types with multimedia data elements on the presentation side.
Here a description is given of how the cyber:gallery visualization can be realized in less time with the help of the IVIS Mapping Definition Tool.
FIGURE 70 The cyber:gallery application scenario

6.1 APPLICATION SCENARIOS
- 154 -
If the cyber:gallery visualization is reproduced with the means realized in this thesis an impor-tant feature of the system is lost. The scene construction algorithm is no longer configurable in a runtime situation. Instead, for every possible distribution of the artworks on floors, corridors, and in rooms different mapping stylesheets must be defined from which the user of the system can choose in a runtime situation. The structure of the IVIS Mapping Description needed for the construction of the cyber:gallery is simple in comparison to the preceding examples. The XML source document consists of a list of artwork elements with a number of described attrib-utes , e.g. the name of the artist, the title, the motif, the style, the dimensions, the price of the artwork, as well as a brief description. With the help of an <xsl:for-each> instruction the mapping stylesheet iterates over the entire list of artworks and sorts in accordance with different criteria and subcriteria, independent of the attributes mapped to the graphical representations of floors, corridors, and rooms. The artwork elements are processed in the following sequence:
# Motive Style Artist
01 Landscape Abstract Hans Bäurele 02 Landscape Abstract Hans Bäurele 03 Landscape Abstract Leo Leonhard 04 Landscape Abstract Ingrid Neuhold 05 Landscape Abstract Ingrid Neuhold 06 Landscape Expressionism Hans Bäurele 07 Landscape Expressionism Hans Bäurele 08 Landscape Expressionism Hans Bäurele 09 Landscape Expressionism Ingrid Neuhold 10 Landscape Impressionism Hans Bäurele 11 Landscape Impressionism Ingrid Neuhold 12 Portrait Abstract Hans Bäurele 13 Portrait Abstract Hans Bäurele
FIGURE 71 Artwork elements sorted in accordance with three criteria
The stylesheet must be able to determine in each loop cycle whether in the current element the value of an attribute that was selected as a sort criterion (and thus as a decision-making criterion for the distribution of the artworks among the floors, corridors, and rooms) has changed in comparison to the previous element. If the value of the third criterion has changed (e.g. in lines 3, 4, 6, 9, etc. in Figure 71) the artwork currently being processed will be exhibited in a new room. If the value of the second criterion (lines 6, 10 and 12) changes, a new corridor must be generated. A change of the first criterion (line 12) results in the generation of a new floor. When a new corridor is generated a new room is generated as well, and when a new floor is generated a new corridor and a new room are generated as well. To register these changes in attribute values the variable management provided by Script extensions is used, since both the XPath axis pre-ceding:: as well as the XSL method position() operate on the unsorted set of elements. At the end of each loop cycle the current values of the criterion attributes are temporarily stored in variables and compared with the new values in the next cycle. The processing of an Artwork element automatically results in an increase in the XTrans variable in order to place the paint-ings next to one another. If the value of the third criterion attribute changes the current room is closed and the XTrans variable increased by the double value to start a new room. When gen-erating a new corridor the previous corridor and the room last worked on must be closed. Then the Xtrans variable is set back to zero and the ZTrans variable increased by the corridor width and the distance between two corridors. The same applies to a new floor. In this case the last room, the current corridor, and the previous floor are completed, before the XTrans and

6 EVALUATION OF APPLICATION SCENARIOS
- 155 -
ZTrans variables are set back to zero and the YTrans variable increased by the height of the floor.In the generation of the rooms, corridors, and floors IVIS Objects were used for individual wall, floor, and ceiling elements. However, an entire room can also be modeled as an IVIS Ob-ject which can then be placed anywhere in the scene using eight vertex coordinates.
6.1.4 Corpogram The last scenario deals with so called Corpograms, which are a new type of business diagrams our information visualization group at IPSI has been experimenting with lately. These 3D dia-grams provide an overview of the economical situation of a company based on a set of well-established economic key figures and thereby showing the economic situation of a company at a glance. This is possible by mapping the historical economic key-figure data to animated 3D-Objects representing a company’s entire economical situation.
The product is targeted for professional analysts, but it also offers better information for small investors. The latter often base their investment decisions only on the stock price, which repre-sents the price for the share but not the value of the company. Most small investors are not able to evaluate the fundamental value of a company due to the complex matter. Our decision sup-port tool offers added information for professional analysts and small investors, which is picked up visually similar to a chart.
Corpograms technology is based on findings of cognitive psychology. A variety of visual meta-phors are implemented to enable intuitive representation of relevant data and the relations be-tween them. The Corpogram (see picture) is logically divided into different sections, which are intuitively merged into a meaningful context by the analyst. E.g. an entire Corpogram occurs stable, if the respective company is in a healthy condition while another one with high debts is in a financially „tilted“ position. This is due to the fact that long term and short term debt values represent the basis of a corpogram on which other elements are set on top. If the basis is tilted the whole corpogram gets tilted. The data and their relations are absorbed in parallel. Unlike conventional diagrams, animation easily transports dynamical aspects, such as trends. While each element of a Corpogram represents a key figure, the time axis is expressed by the position. Com-peting companies are shown in a virtual race and can therefore be analyzed over the temporal development. Since the information is seen and needs not to be read, it is picked up easy and effectively at a glimpse. Coherences are transported together with the data.
FIGURE 72 An annotated Corpogram

6.1 APPLICATION SCENARIOS
- 156 -
Figure 72 displays a corpogram annotated with the economic key figures represented by its spe-cific parts. These key figures displayed by a corpogram are number of employees, profit, net-sales, return on equity, long term debt, short term debt, liquidity, total equity, and total assets.
By juxtaposing corpograms companies can easily be compared with one another and the resul-tant information used for financial analysis.
Since Corpograms have a potentially complex visual structure and are assembled using graphical primitives such as cylinders and spheres, there is a potentially complex many-to-many mapping between the information attributes and the visual attributes of the presentation objects including several mathematical calculations taking place before the information is being mapped to the destination objects.
While the first three application examples were relatively easy to realize, the fourth is a more complex application scenario that was realized in the course of a study project parallel to this thesis and strongly influenced the development of the tools presented. The following is a critical discussion of the use and handling of the tools developed in the present project.
The data used was taken from corporate balance sheets and income statements and was available in structured form in commercially available databases. In the first step the data to be visualized via the „IVIS Data Extraction Definer“ was selected and saved in XML format. Then the graphical structure of a corpogram was defined in the „IVIS Object Modeler“. Here the struc-ture of the IVIS design procedure proved to be disadvantageous. First of all, the requirement of having to fully define the graphical elements in order to map data to them brings problems with it. To begin with, the design of the corpogram has to be exactly defined in advance, i.e. the de-veloper must have a precise mental picture in advance. It would be better to have an iterative design procedure in which graphical elements are selected alternately and then immediately asso-ciated with data. A second problem occurs in connection with later changes in the graphical rep-resentation. It is not possible to remove elements or to add others.
A scaling function would have been practical in mapping data to attributes of the graphical ele-ments. Since balance sheet figures are in the millions and billions very large figures occur which have to be reduced by manual division to manageable sizes. This has to be done for each value the same way to ensure the comparability of the figures.
The biggest problem encountered in connection with corpograms and their realization using VRML was animations. To increase or decrease the size of spheres or cylinders in VRML they have to be scaled, since their attributes are not accessible to the outside through interfaces. This can only be achieved by scaling the entire coordinate system of the objects (transform nodes). However, all subordinate coordinate systems are scaled in the process as well (something not desired). If parallel and independent VRML transform nodes are used instead, a scaled object will penetrate another if the latter is not either transformed manually or automatically trans-formed by complex calculations, taking into account that the position and/or size of objects no longer depends on one value but on all the other values as well. This stands in contradiction to the design objective of corpograms, but was the only possible way to realize corpograms using VRML.

6 EVALUATION OF APPLICATION SCENARIOS
- 157 -
FIGURE 73 The corpogram application scenario
The instantiation function makes it possible to visualize several companies from one database parallel to one another and in this way to make a sectoral comparison. The point in time of the visualized data is mapped to the position of the entire corpogram. As a result, the companies engage in a virtual race in time, a fact which facilitates the discovery of trends and gives the user an intuitive notion of the time axis. Another possibility would be to show the fiscal year as a number. But in that case users would constantly shift their attention from the corpogram to reading the number.
6.2 Preliminary performance distribution analysis The following performance distribution analysis based on the four previously discussed proto-type application scenarios was carried out locally on a Pentium III system with 500MHz and an accelerated graphics card (Riva TNT2 chipset) under Windows 98. The results may vary slightly depending on system speed and graphics card performance; what is important, however, are the relative percentage time values for the individual steps of the mapping process and not the abso-lute values. The overall time of the mapping process was measured as well as the individual times for the necessary steps in the process. These are the generation of the pure XSLT stylesheets (removal of the Interfaces of IVIS Objects and replacement of the macros), the execution of the
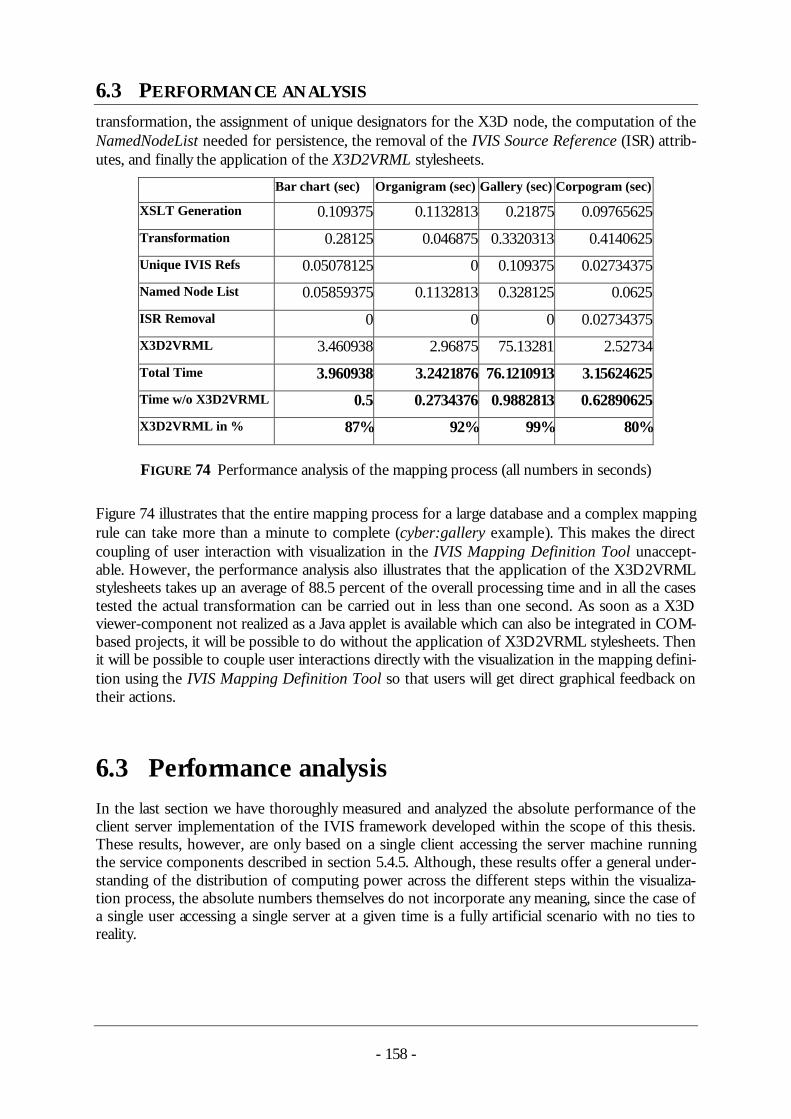
6.3 PERFORMANCE ANALYSIS
- 158 -
transformation, the assignment of unique designators for the X3D node, the computation of the NamedNodeList needed for persistence, the removal of the IVIS Source Reference (ISR) attrib-utes, and finally the application of the X3D2VRML stylesheets.
Bar chart (sec) Organigram (sec) Gallery (sec) Corpogram (sec)
XSLT Generation 0.109375 0.1132813 0.21875 0.09765625
Transformation 0.28125 0.046875 0.3320313 0.4140625
Unique IVIS Refs 0.05078125 0 0.109375 0.02734375
Named Node List 0.05859375 0.1132813 0.328125 0.0625
ISR Removal 0 0 0 0.02734375
X3D2VRML 3.460938 2.96875 75.13281 2.52734
Total Time 3.960938 3.2421876 76.1210913 3.15624625
Time w/o X3D2VRML 0.5 0.2734376 0.9882813 0.62890625
X3D2VRML in % 87% 92% 99% 80%
FIGURE 74 Performance analysis of the mapping process (all numbers in seconds)
Figure 74 illustrates that the entire mapping process for a large database and a complex mapping rule can take more than a minute to complete (cyber:gallery example). This makes the direct coupling of user interaction with visualization in the IVIS Mapping Definition Tool unaccept-able. However, the performance analysis also illustrates that the application of the X3D2VRML stylesheets takes up an average of 88.5 percent of the overall processing time and in all the cases tested the actual transformation can be carried out in less than one second. As soon as a X3D viewer-component not realized as a Java applet is available which can also be integrated in COM-based projects, it will be possible to do without the application of X3D2VRML stylesheets. Then it will be possible to couple user interactions directly with the visualization in the mapping defini-tion using the IVIS Mapping Definition Tool so that users will get direct graphical feedback on their actions.
6.3 Performance analysis In the last section we have thoroughly measured and analyzed the absolute performance of the client server implementation of the IVIS framework developed within the scope of this thesis. These results, however, are only based on a single client accessing the server machine running the service components described in section 5.4.5. Although, these results offer a general under-standing of the distribution of computing power across the different steps within the visualiza-tion process, the absolute numbers themselves do not incorporate any meaning, since the case of a single user accessing a single server at a given time is a fully artificial scenario with no ties to reality.

6 EVALUATION OF APPLICATION SCENARIOS
- 159 -
6.3.1 Goal The goal of the performance analysis of this section is to find out how well our client/server implementation of the information visualization framework (and especially the server compo-nents) performs with multiple users accessing it, which is a far more realistic scenario than single user access. Furthermore, it is a goal to find out how the application behaves with different re-sources, such as processors or additional memory. This breaks down to taking a set of measure-ments in a well-defined test environment.
However, it has to be understood that the implemented components were not programmed un-der the intention to make them ready-to-ship as compared to a professional product but were implemented as a proof-of-concept prototype for the concepts presented throughout this thesis. Therefore, on the absolute performance measures there will naturally be some room for im-provement. The measurements taken on the given prototype system should be looked at in a relative manner. This means the trends and relative comparisons of values will be of more sig-nificance than the absolute numbers to draw conclusions from the performance behavior.
The next two sections will provide a brief understanding of performance testing and web appli-cation stress testing in general and the usage of the Microsoft Web Application Stress (WAS) tool in particular. The contents are based on the online articles [Ching,2001,1] and [Ching,2001,3].
6.3.2 Metrics of performance testing Performance testing of a Web site can be defined as the process of understanding how a Web application and its operating environment respond at various user load levels. In general, the measurement of latency, throughput, and utilization of the Web application is performed while simulating attempts by multiple virtual users to simultaneously access the site. One of the main objectives of performance testing is to maintain a Web application with low latency, high throughput, and low utilization. These concepts are explained in the following.
Latency is often called response time. From a client's perspective, it is the delay experienced between the time of a client request and the time the server's response is received at the client. It is usually measured in units of time, such as seconds or milliseconds. In certain testing tools, such as the Microsoft Web Application Stress (WAS) tool, latency is best represented by the metric "time to last byte" (TTLB), which calculates the time between sending out a page request and receiving the last byte of the complete page content. In other words, latency increases as the inverse of unutilized capacity. Typically, it increases slowly at low levels of user load but increases rapidly as more capacity is utilized. Figure 75 displays such typical characteristics of latency ver-sus user load.
Latency
User Load FIGURE 75 Latency vs. user load

6.3 PERFORMANCE ANALYSIS
- 160 -
The sudden increase in latency is often caused by the maximum utilization of one or more sys-tem resources. For example, most Web servers can be configured to start up a fixed number of threads to handle concurrent user requests. If the number of concurrent requests is greater than the number of available threads, any incoming requests will be placed in a queue and will have to wait to be processed. Any time spent in a queue adds time to the overall latency.
Latency can be divided into two major types: network latencies and application latencies. Net-work latency refers to the time it takes for data to travel from one server to another (e.g., from a database server to an application server). Application latency is the time required for data to be processed within a server. The measurement of such latencies becomes especially important in distributed server environments, such as web farms with load balancing or DBMS clusters.
Reducing application latencies is mostly considered more as an art than a science because the complexity of distributed server applications can make analyzing performance data and perform-ance tuning very challenging. In many cases, multiple software components interact on the server side to respond to a given request. Latency can be introduced by any of the multiple compo-nents. Multiple ways of approaching these problems are discussed in [Ching,2001,1].
Throughput refers to the number of client requests processed within a given unit of time. Typi-cally, the unit of measurement is requests per second or pages per second. Alternatively, throughput may also be measured in terms of visitors per day or page views per day, which is often applied in the area of market research.
The throughput of a Web site is often measured and analyzed at different stages of the design, development, and deployment of an application. For example, in the process of capacity plan-ning, throughput is one of the key parameters for determining the hardware and system require-ments of a Web site [Ching,2001,2]. Throughput also plays an important role in identifying per-formance bottlenecks and improving application and system performance. Independent on whether a load balanced Web farm uses a single server or multiple servers, the throughput statis-tics will show similar characteristics across various user load levels. Figure 76 displays the typical characteristics of throughput versus user load.
Throughput
User Load
FIGURE 76 Throughput versus user load
At the initial stages of increasing load the throughput of a typical Web application increases pro-portionally. However, due to limited system resources, throughput cannot be increased indefi-nitely. It will eventually reach a peak, and the overall performance of the site will start degrading with increased load. Maximum throughput, illustrated by the peak of the graph, is the maximum number of user requests that can be supported concurrently by the site in the given unit of time.
There are various ways and tools to measure web site throughput. Web performance testing tools should indicate throughput of the site. For example, the Microsoft Web Application Stress tool shows the requests per second of the overall test script in its test report. With performance

6 EVALUATION OF APPLICATION SCENARIOS
- 161 -
monitoring tools (such as Performance Logs and Alerts in Microsoft Windows 2000), it is possi-ble to monitor and record the various performance counters such as "Web Service\Get Re-quests/second", "Web Service\Post Requests/second" or "Active Server Pages\Requests/second", if the application uses Active Server Pages. It is furthermore possible to generate the throughput measurements directly from Web server log files.
In many cases it might seem confusing to compare the throughput metrics for a Web site to the published metrics of other sites. The value of maximum throughput varies from site to site, since it heavily depends on the complexity of the application. For example, a Web site consisting largely of static HTML pages may be able to handle many more requests per second than a site serving dynamic pages. As with any statistic, throughput metrics can be manipulated by selec-tively ignoring portions of the data. For example, a Web site may have included separate data for all the supporting files on a page, such as graphics files. Another site's published measurements might treat the overall page as one unit. As a result, throughput values are most useful for com-parisons within the same site, using a common measuring methodology and set of metrics.
In many ways, throughput and latency are related, as two different ways of looking at the same problem. In general, sites with high latency will have low throughput. To improve throughput, the same criteria should be analyzed as needed to reduce latency. Moreover, measurement of throughput without consideration of latency is misleading because latency often rises under load before throughput peaks. In other words, peak throughput may occur at a latency that is unac-ceptable from an application usability standpoint. This suggests that performance reports include a cut-off value for latency (e.g.,"200 requests/second @ 4 seconds maximum latency").
Utilization refers to the usage level of various system resources, such as the server's CPU(s), memory, network bandwidth, etc. It is usually measured as a percentage of the maximum avail-able level of the specific resource.
A typical graph for utilization versus user load for a Web server is displayed in Figure 77.
Utilization
User Load
FIGURE 77 Utilization versus user load
Utilization usually increases proportionally to increasing user load. However, it will top off and remain nearly constant when the load continues to build up.
If a specific system resource tops off at 100-percent utilization, it's very likely that this resource has become the performance bottleneck of the application. Upgrading the resource with higher capacity would allow greater throughput and lower latency—thus better performance. If the measured resource does not top off close to 100-percent utilization at all, it is likely because one or more of the other system resources have already reached their maximum usage levels.
To locate bottlenecks is often a long and painful process of running performance tests against each of the suspected resources, and then verifying if performance is improved by increasing the capacity of the resource. In some cases, performance of the site will start decreasing to an unac-ceptable level long before the major system resources, such as CPU and memory, are maximized.
6.3 PERFORMANCE ANALYSIS
- 162 -
Therefore, monitoring the CPU or memory utilization alone may not always indicate the true capacity level of the server farm with acceptable performance.
6.3.3 Web Application performance testing In general, Web based applications are expected to support a large number of concurrent users. In order to perform stress testing on the given application, we need a general understanding of web testing methodology.
The first task in performance testing is to use a tool to apply stress to the web application and measure the maximum requests per second that the web application server can handle. This is a quantitative measurement. The second task is to determine which resource prevents the requests per second from going higher, such as CPU, memory, or backend dependencies (e.g., a DBMS or LDAP directories). This second task is generally considered more of an art than a simple measurement.
A load test is often referred to as a stress test. The goal of load testing is to find out the correspond-ing latency, throughput, resource utilization, and other measurements at varying levels of user load. When modeling user load, it is desirable to simulate real user actions, either from the server log files of an existing Web site or based on marketing information of similar businesses.
The first step in a load test usually involves defining a test script with the estimated percentage of each type of user activity (e.g., 55% Category Browsing , 19% Item Detail, 12% Keyword Search, 10% Home Page, 4% Shopping).
The so-called "think time" is a random amount of time between the completion of one request and the submission of the next. The often used parameter of "bandwidth throttling" simulates the slower connections that many target users have (e.g., 128 kilobits per second (Kbps) ISDN speed as a compromise between analog modems and broadband connections).
Once the test script is defined, a performance testing tool such as Microsoft WAS can be used to simulate concurrent user requests. Typically, for each test run, the number of users varies. For example, one could simulate 50, 100, 200, 300, 400, 500, and 1000 concurrent users. In general, the selection of how many users to simulate depends on the general performance of the applica-tion and the Web server (farm) configuration. Often some initial short tests are helpful to deter-mine the appropriate range of numbers for a given application.
The final results of a load test are the performance measurements (such as latency, throughput, and utilizations) at these various user load levels. Based on the collected performance data, it is possible to generate data charts similar to those displayed in Figure 75, Figure 76, and Figure 77, and therefore to understand how an application and system would behave at different load lev-els.
In many cases, the web server's processing power is the bottleneck. Increasing the stress to the point where the requests per second start to decrease allows determining the maximum perform-ance that the web application can achieve. Increasing the stress is accomplished by increasing the so-called Stress level (e.g., the threads) imposed on an application server by a stress-testing tool. Increasing the number of client machines accessing an application will also produce a greater stress level.
On an application server so-called performance monitors such as the Windows "System: % Total Processor Time" and "Web Service: Connection Attempts/sec" as well as "Active Server Pages: Requests Queued" counters can be watched. If the processors are running at high percentage then they are most likely the bottleneck. If furthermore the requests queued by the server fluctu-

6 EVALUATION OF APPLICATION SCENARIOS
- 163 -
ate considerably during the stress and the processor utilization remains relatively low, this is an indication that the client tool is calling a server side component that is receiving more calls than it can handle. In this case, the server side component would be the bottleneck.
According the Microsoft Web Application Stress Test Tutorial [Microsoft,2003] some of the common problems known to be encountered with Web application stress testing are:
• Having an invalid test platform. This means the testing environment doesn't match the actual production servers, which will run the application every day.
• Having an invalid testing script. This means that the program (script) applying stress to the application server doesn't accurately simulate the real production request behavior.
• Thread safety issues with unstable server side (COM) components resulting in unstable ap-plication behavior under stress (e.g., resource deadlocks).
• Server Page script errors and global server state issues. This will probably lead to invalid test results, since the experiment doesn't mach production conditions.
• Insufficient processor power and/or scripts that are too complex for the test environment hardware. This also leads to invalid or at least imprecise test results since the tests are not reproducible under controlled conditions.
More information on general web stress testing can be found under the Microsoft TechNet WAS tool site25 and on the Microsoft TechNet web site.
6.3.4 The Microsoft Web Application Stress tool As we have seen in the previous section Performance testing is an essential element in success-fully deploying a Web application. In order to simulate that type of usage for a Web application it is common to work with a testing tool that can simulate such user loads. Many Web perform-ance testing tools are available on the market today. In general, such tools enable a small number of client computers to simulate a large number of users, concurrently requesting predefined pages or URLs of a Web site. Each of these virtual users simulates the exact communication protocols between a real Web browser and the Web server.
In the context of this thesis we have chosen to use the freely available Microsoft Web Applica-tion Stress (WAS) tool. WAS can be downloaded free of charge from http://www.microsoft.com/technet/itsolutions/intranet/downloads/webstres.asp. It is also available from the Microsoft Windows 2000 Resource Kit CD.
The Microsoft WAS tool is designed to realistically simulate multiple browsers requesting pages from a web site. This tool can be used to gather performance and stability information about web applications. It simulates a large number of requests using a relatively small number of client machines. The approach of the WAS tool is to create an environment that is as close to produc-tion as possible so that developers can find and eliminate problems in the web application prior to deployment.
The Microsoft WAS tool was chosen for the following reasons:
• It is free of charge. As already stated it is freely downloadable from the WAS web site. Al-though there is no official support for the tool, it is possible to find useful information on the MSDN web site. A good resource is a knowledge base that provides in-depth answers to
25 http://www.microsoft.com/technet/itsolutions/intranet/downloads/webstres.asp

6.3 PERFORMANCE ANALYSIS
- 164 -
the most frequently asked questions regarding performance testing. Furthermore, there is an e-mail alias for sending support requests to Microsoft.
• It is simple to use. WAS supports easy generation of test scripts by recording or manually. A script can be recorded by browsing through a web site with a browser, by importing the URLs from a servers log file, or by selection of files in a web server's directory. Alternatively, all URLs can be typed in manually to create a test script.
WAS can run a test script using an arbitrary number of client computers, which are controlled by one centralized master client. In this case, the master client performs the following steps At the beginning of each test:
• Set up communication with all the other clients.
• Distribute the test data to all clients.
• Initiate the test in all clients simultaneously.
• Collect the test results and reports from all clients.
This distributed testing feature is particularly useful in performance testing big Web farms that require the use of many client computers in order generate enough load for realistic stress testing scenarios
WAS can simulate Web browser requests for any standard Web server compliant with the HTTP protocol 1.0 or 1.1 standards, regardless of the platform on which the server is running. The tool has intuitive functions for generating test scripts and offers the following useful features:
• Allows the creation of multiple user accounts for sites that require authentication.
• Allows the storage of cookies and Active Server Pages session information for each user.
• Supports randomized or sequential data set for use in specifying name-value pairs.
• Supports bandwidth throttling and randomized delay ("think time") to support more realistic scenarios.
• Supports the Secure Sockets Layer (SSL) protocol.
• Allows the grouping of URLs and specification of hit percentage for each group.
• Provides an object model that can be manipulated through COM/ActiveX compliant appli-cations, such as Microsoft Visual Basic or VBScript to start, stop, and configure test scripts programmatically.
There are, however known limitations to the functionality of WAS. Besides the current known bugs and issues, which are listed on the WAS Web site, the following features are not supported by WAS:
• The ability to modify the parameters of a URL, based on results returned from previous re-quests. These URL parameters can be modified only at the time of script definition but not at script execution time.
• The ability to run or simulate client-side logic.
• The ability to specify a fixed number of test cycles for the duration of the test.
• The ability to run tests simultaneously against multiple Web servers with different IP ad-dresses or domain names. Although it is possible to use multiple master clients to test against multiple Web servers simultaneously, it will then be necessary to consolidate the data from multiple WAS databases if all test results as a whole shall be correlated.
6 EVALUATION OF APPLICATION SCENARIOS
- 165 -
• The ability to support redirection of pages to another server with a different IP address or domain name.
• The ability to record SSL pages directly from a Web browser. Although WAS supports test-ing against SSL pages it does not support recording them. It is required to manually turn on SSL support for each designated URL after script recording is complete.
Whenever a new test script is created one or more configuration steps must be completed:
• Adjust script items and their properties. This includes tasks such as removing unnecessary script items, specifying think time for script items, setting up parameter values for script items, or setting up SSL for script items.
• Adjust test script settings. In most cases it will be necessary to modify some settings of a test script in order to run per-formance tests as required. Many parameters of the test script can be modified in this step including target web server, concurrent connections and stress level, test run time, fixed or random request delay, suspend times, bandwidth throttling, and some other script settings.
• Set up page groups and hit percentages. In WAS, it is possible organize sets of script items into so-called page groups. This feature al-lows grouping all page elements (including the HTML files, graphic files, style sheets, etc.) or multiple related pages into one logical unit. A different hit percentage can be specified for each page group, thus controlling which page or related pages would be requested more or less frequently. This feature allows the definition of usage scenarios for a web application like catalog browsing or shopping carts. These scenario-bound page groups can then be run in the percentage expected for a given site. Alternatively, page groups can be specified during the recording time of a script.
• Set up user accounts. For testing Web sites that require personalization and authentication, WAS provides a feature called 'Users', which can be used to store multiple records for user name, pass-word, and cookie information. When a test starts, all users are divided among the threads given by the stress-level setting. As requests are made, each thread uses the user name, password, and cookie from a new user from the pool allocated to that thread. If WAS has been configured for fewer users than threads, some threads will not have users—any au-thenticated pages will fail, and any interaction with cookies will be disabled. Therefore, whenever testing personalized Web sites, it is very important to have more users than threads. In theory, there is no limit to the number of users that can be created in WAS. However, because each user requires memory and resources on the clients, tests might take longer to be started and stopped if a huge user list is used. User and password lists can also be imported from formatted text files.
• Set up clients. WAS can use multiple client computers to load test a Web site. When a test starts, WAS will automatically communicate with all the defined clients, transfer all test information (including the script items, page groups, and users definitions) to them, start and stop the test in them, and then collect the test results from them. One of the computers is used as a master client. This should be the client that is used to record and configure test scripts.
• Set up performance counters. WAS can integrate with the Windows NT Performance Monitor interface to simplify test data collection. Performance Monitor counters can be stored with each script and WAS

6.3 PERFORMANCE ANALYSIS
- 166 -
will collect their data with the other information it collects. The WAS Help file includes a comprehensive list of the common performance counters.
Figure 78 displays some of the settings of the Microsoft WAS tool configurable by the GUI.
FIGURE 78 The Microsoft WAS tool
After the set up and configuration steps for the test scripts, they are ready to run on the client computers. This is done by a simple button clicking operation on the WAS GUI. After complet-ing the execution of the test scripts they are typically examined for various network or configura-tion errors, such as IP socket errors or HTTP protocol errors. While the test is being run, vari-ous performance-related system counters should be monitored and recorded, including counters to track system throughput, latency (response time), and resource utilization.
Microsoft’s tutorial on the WAS tool includes detailed information on installation, scripting, per-formance counters, settings, and reporting. It also provides general guidelines for using WAS and describes common Web testing problems. The tutorial is located at the Microsoft TechNet Site WAS tool site [Microsoft,2003]. The following paragraphs describe our setup to perform the tests for this thesis.
6.3.5 Test configuration In this section we will define the server hardware platform, network configuration and WAS settings used for performance testing the IVIS server components. This includes the server as well as the client machines. To stress test the IVIS Web server application that calls server side IVIS component, we ported the application onto three different server platforms in an isolated network environment.

6 EVALUATION OF APPLICATION SCENARIOS
- 167 -
WAS Application Settings
Figure 79 displays the WAS settings used to perform the tests. All variables in the settings are kept constant except the 'Concurrent Connections' settings, which include Stress Level and Stress Multiplier. The Stress Level (threads) times the Stress Multiplier (sockets per thread) represents the effective stress level for each system. These settings are changed for every trial of the tests. All tests are run for 5 minutes, which is a sufficient length of time in this case. One may want to increase the Test Run Time if the application is complex. The number of hits on each page should therefore be observed to decide on this type of adjustment. Request delays and throttle bandwidth setups are not used. For these tests, we wanted to simulate LAN connections with no slow links such as modem or ISDN connections, since the performance of the IVIS server components themselves is to be tested and not the Web server's performance.
FIGURE 79 WAS application settings
Test scripts
We configured 4 Active Server Pages (ASPs), each embedding the IVIS server components serv-ing one of the 4 test application scenarios to be called by the WAS tool clients.
Performance monitor counters
We configured WAS to collect the performance monitor counter data listed below, which are described in the subsequent paragraphs.
• System: Percentage of Total Processor Time

6.3 PERFORMANCE ANALYSIS
- 168 -
• Memory: Available Bytes
• Thread: Context Switches per Second (Total)
• Web Service: Get Requests per Second
• Web Service: Post Requests per Second
• Active Server Page: Requests per Second
• Active Server Page: Requests Queued
System, Percentage of Total Processor Time: This measures the amount of time that the processor is busy. When a processor is consistently running over 75 percent usage, it has become a system bottleneck.
Memory, Available Bytes: This indicates the amount of available physical memory.
Thread, Context Switches per Second (Total): This is the rate of switches from one thread to another. Thread switches can occur either inside a single process or across processes. A thread switch may occur when either one thread asks another for information or a thread that is ready to run preempts a higher priority thread. If there is too much context switching (i.e., more than 2000 switches per second), the stress level (thread count) should be lowered and stress multiplier (sockets per thread) increased instead.
Web Service, Get Requests per Second: The rate that HTTP requests are made using the GET method. Get requests are generally used for basic file retrievals or image maps, though they can be used with forms.
Active Server Page, Requests per Second: The number of requests executed per second.
Active Server Page, Requests Queued: The number of requests waiting for service from the queue. If the number of Requests Queued fluctuates considerably during stress and processor utilization remains relatively low, this is an indication that the script is calling a server Component Object Model (COM) component (such as the IVIS server components) that is receiving more calls than it can handle. In this case, the server COM component is the bottleneck.
User accounts and client machines
We created 600 user accounts in the WAS client machines to simulate access to the servers. Since it is not necessary to authenticate against the application server and there is no application state kept by the web server this setting simply ensures that there are more users than threads. The maximum setting for the number of threads is 600.
We installed the WAS tool clients on four machines, named 'pc-lyre', 'pc-harmonica', 'pc-belltree', and 'pc-melodeon'. pc-lyre was a DELL desktop with a 666-Mhz processor and 128 MB of RAM. pc-harmonica was a 667-Mhz DELL Precision workstation with 512 MB of RAM. pc-belltree had two 200-Mhz processors and 130 MB of RAM, and pc-melodeon had two 500-Mhz processors and 2 GB of RAM. To stress a powerful server, either one powerful client or several less powerful clients are set up to provide the load. We followed the general guideline of using the less powerful clients first and adding resources as needed, based on performance moni-tor results. The most frequent resource bottleneck that was observed on the client side was in processor utilization. According to the Microsoft WAS usage guidelines, if a client experienced processor utilization of 75 percent or more, we added another client machine to serve in the test. Furthermore, client side browser caching was disabled on all client machines, since WAS uses the Internet explorer COM component to simulate server access.

6 EVALUATION OF APPLICATION SCENARIOS
- 169 -
Server hardware platform configurations
The test was performed in an isolated local area network (LAN) lab environment. The XML data files and ASPs were deployed to three hardware platforms. Each platform ran on the Microsoft Windows 2000 Advanced Server, Service Pack 2, operating system. The hardware resources and services loaded on each system are listed in Figure 80. The system configurations were checked, the paging file set to a minimum size of 2 times RAM size, and all unnecessary server services were stopped. Furthermore, the server side ASP caching feature was disabled for the IIS web server ensuring that the measured values reflect the real response times from the IVIS server components.
Platform 1 Platform 2 Platform 3
Processors x86 Family 6 Model 11 Stepping 1 GenuineIntel, 1 x 1126 MHz
x86 Family 6 Model 11 Step-ping 1 GenuineIntel, 2 x 1126 MHz
x86 Family 6 Model 11 Step-ping 1 GenuineIntel, 2 x 1126 MHz
Total Physical Memory
1,965,816 KB 1,965,816 KB 3,931,632 KB
Total Virtual Memory
4,895,726 KB 4,895,726 KB 9,791,452 KB
Operating Sys-tem
Microsoft Windows 2000 Advanced Server Version 5.0.2195 Service Pack 2 Build 2195
Microsoft Windows 2000 Advanced Server Version 5.0.2195 Service Pack 2 Build 2195
Microsoft Windows 2000 Advanced Server Version 5.0.2195 Service Pack 2 Build 2195
Network 1 x 100 Mbps NIC 1 x 100 Mbps NIC 1 x 100 Mbps NIC
Hard Drive 155 GB SCSI RAID 5 155 GB SCSI RAID 5 155 GB SCSI RAID 5 Services Alerter, Computer
Browser, Event Log, Server, Workstation, Li-cense Logging Service, TCP/IP NetBIOS Helper, Messenger, MS SQL Server, MS SQL Server OLAP Service, Net Logon, NT LM Security Support Provider, Plug and Play, Protected Storage, Remote Procedure Call Locator, Remote Procedure Call Service, Spooler, Windows Internet Name Service
Alerter, Computer Browser, Platform 2 NIC Management Agents, Platform 2 Remote Monitor Service, Platform 2 Enhanced IMD Idle Screen, Event Log, Server, Work-station, TCP/IP NetBIOS Helper, Messenger, MS SQL Server, Net Logon, NT LM Security Support Provider, Plug and Play, Protected Stor-age, Remote Procedure Call Locator, Remote Procedure Call Service, Smart CD Server, Schedule, SNMP, Spooler, Platform 2 System Shutdown Service
Alerter, Computer Browser, CA-Unicenter, CA-Unicenter WorldView Agent, CA-Unicenter (NR-Server), CA-Unicenter (Remote), CA-Unicenter (Transport), Event Log, Server, Workstation, TCP/IP NetBIOS Helper, Messenger, MS SQL Server, Net Logon, Plug and Play, Protected Storage, Remote Procedure Call Service, Spooler, TNG DB Server
FIGURE 80 Server Hardware Configurations
The network configuration
The testing servers are set up within an isolated internal network, as illustrated in Figure 81. The server test environment consists of four client machines, two Web application servers, and one 100 megabit per second (Mbps) Ethernet switch. While the Web application servers run the spe-cific scenarios using IVIS server components, the client machines are all installed with WAS, which simulates and sends concurrent user requests to the Web servers..

6.3 PERFORMANCE ANALYSIS
- 170 -
It is worth noting that it is preferable to use switches other than Ethernet hubs, which might become a performance bottleneck under high user load.
Client 1
Client 2
Client 3
Client 4
Platform 1
Platform 2
Platform 3
100 Mbps Switch
FIGURE 81 Network configuration of the testing environment
6.3.6 Test scenario In our testing scenario for the IVIS server components we performed 61 trial runs in this Web application test against each application scenario (Bar chart, Organigram, cyber:gallery, and Cor-pogram). Of these 61 trials on each scenario 33 trials were run against the Platform 1, 11 against the Platform 2, and 17 against the Platform 3. The load was increased stepwise throughout the trials by increasing the “threads” parameter (concurrent connections) and often multiple trials were run with the same load in order to check the stability and reproducibility of the resulting values. More trials were run on the Platform 1 because it was the first server to test. Therefore, Platform 1 was used to find an appropriate pattern for the test data so naturally more data than needed was collected. Once the data pattern was established and understood, fewer data points were needed to achieve the desired results.
During all test trials we disabled the final translation step that converts the X3D results to dis-playable VRML97, since we are not interested in viewing the results in an appropriate browser. This gave us the pure performance results for the IVIS server components generation of X3D simulating the scenario of directly being able to display X3D in a browser.
6.3.7 Result Form A WAS trial report always contains nine sections: Summary, Overview, Script Settings, Test Cli-ents, Result Codes, Page Summary, Page Groups, Page Data, and Performance Counters. These values are stored in a file based relation DBMS format (MS Access). The Summary report in-cludes a great deal of important information with respect to the trial. To further examine the details of a trial, the results from one of the other eight sections of the report can be reviewed.
The Result Codes should be examined first as shown in this example:

6 EVALUATION OF APPLICATION SCENARIOS
- 171 -
Result Codes Code Description Count ============================================================ 200 OK 10038
In this case the clients received all pages. If any pages are not found by WAS there will be an additional line in the Result Codes report as displayed below:
Result Codes Code Description Count ============================================================ 200 OK 932 404 Not Found 39042
These results indicate that the trial is not valid and that some URLs are not configured correctly. This means that modifications will have to be performed on the WAS configuration. Our test reports include only valid trial results.
The values of the performance counters “Requests per Second” and “Time to Last Byte (TTLB)” are addressed in detail in section 6.3.8, in which the data is analyzed. Performance monitor results are not presented in the summary reports.
During the trials we closely observed the client machine’s status using performance monitor out-put. However, these counters can also be used to find the cause of a system bottleneck. The WAS tool's report on the performance counters lists the average, minimum, 25th percentile, 50th percentile, 75th percentile, and maximum of the analyzed data.
In the next section the maximum number of requests per second that the Web server running the IVIS server components can handle is analyzed. Furthermore, the server side resource bot-tlenecks will be discussed on the basis of the collected data and system respond times will be presented.
6.3.8 Analysis and interpretation The first goal of this analysis was to find the maximum requests per second that every of the application scenarios can handle. The second goal was to find out the possible source of any performance bottlenecks caused by system resources, such as CPU, memory, or backend de-pendencies. The time-to-last-byte (TTLB) data, which show how fast an application server can present the data to clients, are also offered in this section.
Throughput (Maximum Requests per Second)
To find out the throughput in terms of maximum requests a server running each scenario can handle per second, the "requests per second" are noted for each trial. An increased server stress load is accomplished by increasing the Stress Level (threads) setting in the WAS tool. The result-ing graphs for the number of threads and requests per second for the 4 applications for the Plat-form 1 are presented in the figures below.
Figure 82 represents 33 trials of the Platform 1 Server for all four application scenarios. An aver-age was calculated to represent trials with the same load (threads), which leads to 10 distinct val-ues (bars) for the incremental steps in user load. The load (or number of connecting threads) increased stepwise from 2 to 500, and the requests per second (RPS) maximized at an average

6.3 PERFORMANCE ANALYSIS
- 172 -
value of 9 for the Bar Chart scenario, 17.4 for the Organigram scenario, 5.07 for the cyber:gallery scenario, and 12.22 for the Corpogram scenario. The total maximum values for the four scenar-ios were 11.35 (Bar Chart), 22.08 (Organigram), 7.54 (cyber:gallery), and 13.71 (Corpogram), respectively. The RPS value reached its maximum value at a user load of 10 concurrently con-necting threads except for the Organigram scenario where the maximum value was reached at 20 concurrent connections. With higher load the RPS value decreased.
In all 4 scenarios, at user loads beyond 50 concurrent connections, the system irregularly hung and caused high standard deviations in the RPS values, even among the values for the same load.
Throughput, Platform 1, "Bar Chart"
1.66
2.62
4.54
9.00
7.036.51 6.48 6.29
4.595.35
0
1
2
3
4
5
6
7
8
9
10
2 3 5 10 20 50 100 200 300 500
Concurrent Connections
RP
S
Throughput, Platform 1, "Organigram"
2.383.18
7.31
16.97 17.40
11.75
7.40
9.82
3.89 4.59
0
2
4
6
8
10
12
14
16
18
20
2 3 5 10 20 50 100 200 300 500
Concurrent Connections
RP
S
Throughput, Platform 1, "cyber:gallery"
0.961.24
2.69
5.07
3.27 3.123.67
2.15
3.62
1.83
0
1
2
3
4
5
6
2 3 5 10 20 50 100 200 300 500
Concurrent Connections
RP
S
Throughput, Platform 1, "Corpogram"
1.35
3.293.81
12.22
8.96
6.70
4.68 4.375.61
4.47
0
2
4
6
8
10
12
14
2 3 5 10 20 50 100 200 300 500
Concurrent Connections
RP
S
FIGURE 82 Throughput vs. user load for Platform 1 and the four application scenarios
Figure 83 represents 11 trials of the Platform 2 Server for the four applications. An average was calculated to represent trials with the same load (threads), which leads to 9 distinct values (bars) for the incremental steps in user load. The load (or number of connecting threads) increased stepwise from 1 to 400, and the requests per second (RPS) maximized at an average value of 43.78 for the Bar Chart scenario, 70.83 for the Organigram scenario, 28.93 for the cyber:gallery scenario, and 58.54 for the Corpogram scenario. The total maximum values for the four scenar-ios were 44.22 (Bar Chart), 71.53 (Organigram), 29.26 (cyber:gallery), and 58.54 (Corpogram), respectively. The RPS value reached a saturation value at a user load of 100 concurrently con-necting threads. With higher load the RPS value increased only by relatively small amounts or even decreased as in the case of the Organigram and cyber:gallery scenarios.
The fluctuation in RPS values encountered on Platform 1 at high user load was not experienced on Platform 2. The standard deviation across a set of RPS values with the same load did not increase significantly at high user loads.

6 EVALUATION OF APPLICATION SCENARIOS
- 173 -
Throughput, Platform 2, "Bar Chart"
2.796.38
9.79
16.84
33.26
43.54 42.30 43.78 43.63
05
101520253035404550
1 4 5 10 50 100 200 300 400
Concurrent Connections
RP
SThroughput, Platform 2, "Organigram"
4.6410.86
14.24
35.77
54.33
66.79 69.25 70.8363.96
0
10
20
30
40
50
60
70
80
1 4 5 10 50 100 200 300 400
Concurrent Connections
RP
S
Throughput, Platform 2, "cyber:gallery"
1.96 2.846.28
10.81
19.64
27.1728.93
23.50
27.57
0
5
10
15
20
25
30
35
1 4 5 10 50 100 200 300 400
Concurrent Connections
RP
S
Throughput, Platform 2, "Corpogram"
2.04 4.03 6.69
19.79
45.42
54.72
44.71
57.47 58.54
0
10
20
30
40
50
60
70
1 4 5 10 50 100 200 300 400
Concurrent Connections
RP
S
FIGURE 83 Throughput vs. user load for Platform 2 and the four application scenarios
Figure 84 represents 17 trials of the Platform 3 Server for the four applications. An average was calculated to represent trials with the same load (threads), which leads to 13 distinct values (bars) for the incremental steps in user load. The load (or number of connecting threads) increased stepwise from 1 to 400, and the requests per second (RPS) maximized at an average value of 76.08 for the Bar Chart scenario, 125.87 for the Organigram scenario, 35.54 for the cyber:gallery scenario, and 105.53 for the Corpogram scenario. The total maximum values for the four scenar-ios were 82.52 (Bar Chart), 141.28 (Organigram), 38.24 (cyber:gallery), and 122.99 (Corpogram), respectively. The RPS value roughly reached a saturation value at a user load of 50 concurrently connecting threads. With higher load the RPS value increased only by relatively small amounts or even decreased.
The fluctuation in RPS values encountered on Platform 1 at high user load was also not experi-enced on Platform 3. The standard deviation across a set of RPS values with the same load did not increase significantly at high user loads.
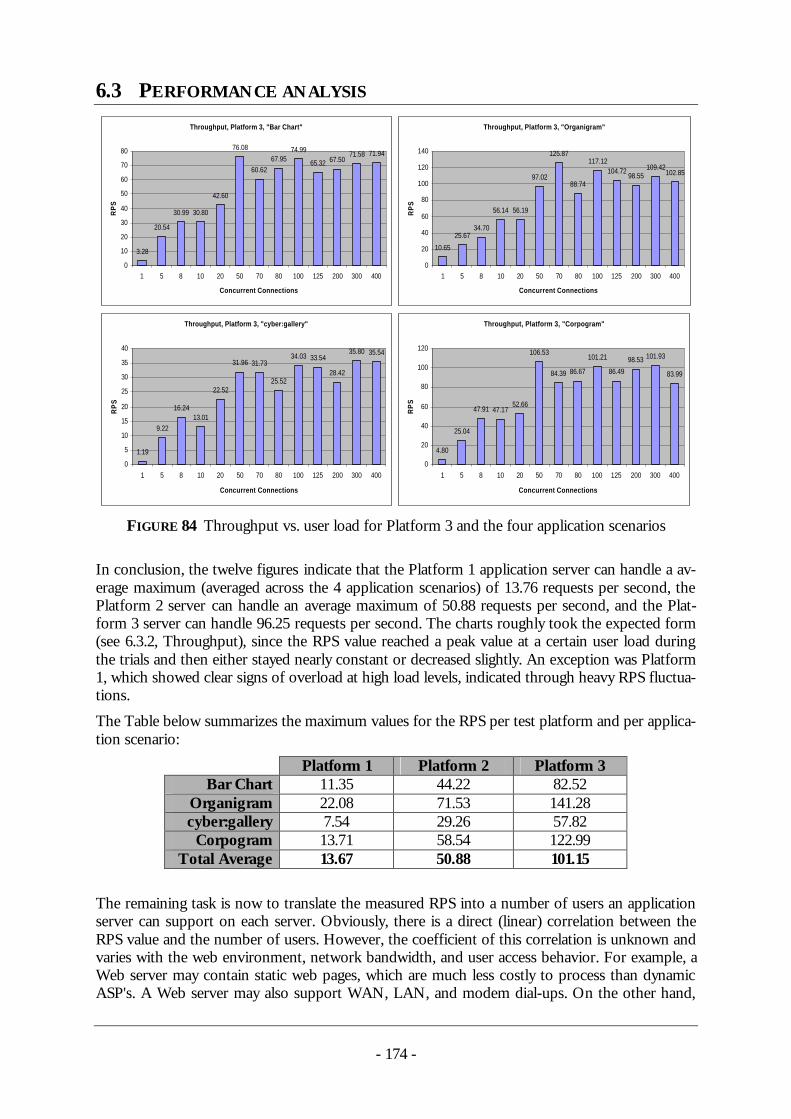
6.3 PERFORMANCE ANALYSIS
- 174 -
Throughput, Platform 3, "Bar Chart"
3.28
20.54
30.99 30.80
42.60
76.08
60.6267.95
74.99
65.32 67.5071.58 71.94
0
10
20
30
40
50
60
70
80
1 5 8 10 20 50 70 80 100 125 200 300 400
Concurrent Connections
RP
S
Throughput, Platform 3, "Organigram"
10.65
25.6734.70
56.14 56.19
97.02
125.87
88.74
117.12104.72
98.55109.42
102.85
0
20
40
60
80
100
120
140
1 5 8 10 20 50 70 80 100 125 200 300 400
Concurrent Connections
RP
S
Throughput, Platform 3, "cyber:gallery"
1.19
9.22
16.2413.01
22.52
31.96 31.73
25.52
34.03 33.54
28.42
35.80 35.54
0
5
10
15
20
25
30
35
40
1 5 8 10 20 50 70 80 100 125 200 300 400
Concurrent Connections
RP
S
Throughput, Platform 3, "Corpogram"
4.80
25.04
47.91 47.1752.66
106.53
84.39 86.67
101.21
86.49
98.53 101.93
83.99
0
20
40
60
80
100
120
1 5 8 10 20 50 70 80 100 125 200 300 400
Concurrent Connections
RP
S
FIGURE 84 Throughput vs. user load for Platform 3 and the four application scenarios
In conclusion, the twelve figures indicate that the Platform 1 application server can handle a av-erage maximum (averaged across the 4 application scenarios) of 13.76 requests per second, the Platform 2 server can handle an average maximum of 50.88 requests per second, and the Plat-form 3 server can handle 96.25 requests per second. The charts roughly took the expected form (see 6.3.2, Throughput), since the RPS value reached a peak value at a certain user load during the trials and then either stayed nearly constant or decreased slightly. An exception was Platform 1, which showed clear signs of overload at high load levels, indicated through heavy RPS fluctua-tions.
The Table below summarizes the maximum values for the RPS per test platform and per applica-tion scenario:
Platform 1 Platform 2 Platform 3 Bar Chart 11.35 44.22 82.52
Organigram 22.08 71.53 141.28 cyber:gallery 7.54 29.26 57.82
Corpogram 13.71 58.54 122.99 Total Average 13.67 50.88 101.15
The remaining task is now to translate the measured RPS into a number of users an application server can support on each server. Obviously, there is a direct (linear) correlation between the RPS value and the number of users. However, the coefficient of this correlation is unknown and varies with the web environment, network bandwidth, and user access behavior. For example, a Web server may contain static web pages, which are much less costly to process than dynamic ASP's. A Web server may also support WAN, LAN, and modem dial-ups. On the other hand,

6 EVALUATION OF APPLICATION SCENARIOS
- 175 -
users do not generate continuous access behavior to web site applications. Typically, they request pages, read them, and then generate a follow-up page request. Therefore, the ratio of request time to reading time depends heavily on the server page type and the user access behavior.
What can be deducted from the maximum value of RPS is the ratio of server capacities compa-rable under similar environments. If, e.g., a client uses the Platform 1 as a server supporting 100 LAN users in a given time, and assume that a maximum of 14 RPS is equivalent to 100 LAN users connecting to Platform 1, then (under the same conditions) it could be stated that Platform 2 will support 357 users (50 maximum RPS) and Platform 3 will support 721 users.
Utilization (Resource Bottleneck)
To find out the actual resource bottleneck of our IVIS Web application, the cause for the peak in RPS has to be determined. Any of the system resources such as memory or CPU could be the cause. Therefore, we will take a closer look to recorded resource utilization during the trials.
First of all, a memory bottleneck can be excluded because the minimum value for available work-ing memory for the trials carried out on Platform 1 and Platform 2 was 2 GB and for Platform 3 was 4 GB. Since these capacities allowed for large amounts of unused RAM during the trials, memory is clearly not the bottleneck.
The average percentage of total CPU processing time across all four applications for Platform 1 was within the range from 16% to 66%; for Platform 2 in the range from 9% to 55%, and for Platform 3 from 22% to 60%. Not one server reached an average of more than 66% CPU proc-essing time during any of the trials. Therefore the processor can also be excluded as the bottle-neck.
The so-called “Active Server Pages: Requests Queued” performance counter indicates the num-ber of requests waiting for service from the queue at the web application server. In the WAS tool tutorial [Microsoft,2003] it is stated that:
"If the Requests Queued fluctuate considerably during the stress and the proces-sor utilization remains relatively low, this is an indication that the script is calling a server COM component that is receiving more calls than it can handle. In this case, the server COM component is the bottleneck."
This, however, is only true if the Active Server Pages are not very complex. During our tests we have observed these kinds of fluctuations. The "Requests Queued" rose and fluctuated consid-erably during phases of maximum load, while processor utilization dropped or stayed constant. Therefore, the bottleneck is likely to be the IVIS server COM components. Since the main work-load in our application scenarios lies in transforming and generating the visual 3D objects this is quite an expected result, which confirms that we are really testing the performance of the infor-mation visualization process performed by the server components and not doing some web server product testing. Figure 85, Figure 86, and Figure 87 illustrate this circumstance for the "Bar Chart" scenario on all 3 test platforms.
As displayed in Figure 85 for the Platform 1 tests, the number of threads increased from 1 to 100 and the requests queued remained close to zero until trial 10. At that point, the number of threads was 50 and the requests queued went up to 23 and remained high, following the number of threads, while the average processor time dropped from 54 to 11 percent.

6.3 PERFORMANCE ANALYSIS
- 176 -
Utilization (CPU), Platform 1, "Bar Chart"
37.43 38.51
45.3449.33
37.20 35.22 36.20 37.27
29.7732.66
0
10
20
30
40
50
60
2 3 5 10 20 50 100 200 300 500
Concurrent Connections
Avg
. % T
ota
l Ser
ver
CP
U T
ime
Utilization (Req. Queued), Platform 1, "Bar Chart"
0.00 0.00 0.00 0.01 0.0023.36
61.97
142.67
307.04
474.54
0
50100
150200
250
300350
400450
500
2 3 5 10 20 50 100 200 300 500
Concurrent Connections
Avg
. AS
P R
equ
ests
Qu
eued
FIGURE 85 Platform 1 Server Utilization (Bar Chart)
On the Platform 2 tests shown in Figure 86, the number of threads increased from 1 to 400 and the requests queued remained low until trial number 8. Then the number of threads increased to 200 and the requests queued went up to 135 and remained high following the number of threads, while the average processor time dropped from 47 to 9 percent.
Utilization (CPU), Platform 2, "Bar Chart"
29.56
45.16
34.7440.27
47.70
32.9928.08
17.65 18.50
0
10
20
30
40
50
60
1 4 5 10 50 100 200 300 400
Concurrent Connections
Avg
. % T
ota
l CP
U T
ime
Utilization (Req. Queued), Platform 2, "Bar Chart"
0.00 0.33 0.00 0.00 3.86 10.36
137.23
222.64
295.15
0
50
100
150
200
250
300
350
1 4 5 10 50 100 200 300 400
Concurrent Connections
Avg
. AS
P R
equ
ests
Qu
eued
FIGURE 86 Platform 2 Server Utilization (Bar Chart)
On the Platform 3 Server tests charted in Figure 87, the number of threads increased from 1 to 400 and the requests queued remained low until trial 9. Then the number of threads was 80 and the requests queued went up to 30 and remained high following the number of threads, while the average processor time remained slightly above 40 percent.
Utilization (CPU), Platform 3, "Bar Chart"
33.41
40.8335.86
43.4538.13
49.59
41.4846.78 47.16
42.78 42.99 42.8447.66
0
10
20
30
40
50
60
1 5 8 10 20 50 70 80 100 125 200 300 400
Concurrent Connections
Avg
. % T
otal
Ser
ver
CP
U T
ime
Utilization (Req. Queued), Platform 3, "Bar Chart"
0.00 0.07 0.00 0.01 0.04 6.4222.08 30.79
46.0471.31
125.45
218.54
312.46
0
50
100
150
200
250
300
350
1 5 8 10 20 50 70 80 100 125 200 300 400
Concurrent Connections
Avg
. AS
P R
eque
sts
Que
ued
FIGURE 87 Platform 3 Server Utilization (Bar Chart)

6 EVALUATION OF APPLICATION SCENARIOS
- 177 -
Within the scope of the performance evaluation we did not further investigate, which server side IVIS component was causing the bottleneck, since the components call each other several times during the process of 3D generation. The problem with such an evaluation is that some compo-nents are generally slower than others and it also depends how the object is embedded into the surrounding ASP page. For example, a database access component (such as ADO) could cause a dramatic bottleneck if it is performing a complex or poorly designed SQL query, which of course does not mean that the object itself is slow but that the way it is being used is inefficient.
A probable cause for the queueing of ASP requests is the way the web server handles requests. At startup the web server creates a thread pool with a limited number of threads, which assuma-bly depends on several system resources including CPU power and RAM. Whenever a thread is needed for processing incoming requests it can be taken from the pool until the pool is empty. Threads that are no longer needed are given back to the pool. This saves thread creation and initialization times throughout the life span of an application. As soon as the thread pool is ex-hausted the system has to build up a queue for requests waiting for a free thread to be assigned to them.
To make things even more complex, the threads in our case call server side objects, which are managed using a similar concept of a limited object pool. At certain times these objects that are being executed concurrently by the active threads are busy delivering the results back to the cli-ent over the network, which results in a high IO load but in a relatively low CPU load. The out-come of this architecture are possible and unpredictable fluctuations in the throughput of the entire system depending on the user load.
More details on Web application performance bottlenecks can be found in the article titled Micro-soft Support WebCast: Problem Isolation with Web-based Applications [MicrosoftKB325162], available on Microsoft’s TechNet. Furthermore, the section on “Monitoring Web Applications” in the Micro-soft Internet Information Server (IIS) 4.0 Resource Kit is an excellent resource to examine before performing a web stress test.
Latency (Time To Last Byte)
The last issue we have tested is the actual time the IVIS framework components need to return the (X3D) results to the clients. The "Time To Last Byte" (TTLB) parameter returned by the WAS tool is a direct measure for this time.
Since the speed for each page being returned is different it makes sense to calculate an average TTLB value. For each trial we calculated the average TTLB value by directly querying the WAS database using an SQL statement.
The Latency in terms of TTLB values for Platform 1 for all four scenarios are displayed in Figure 88. The values are averaged whenever a trial was executed multiple times with the same user load. The TTLB value grew overproportionally high at high user load and in some trials we en-countered invalid TTLB’s, which means that no request was handled at all during a 5 minutes trial. In the charts we have omitted all invalid TTLB values. This behavior corresponds to the unpredictable behavior of the respective throughput charts towards the end of the graph. At these points the system “hung” and response times suddenly increased dramatically.

6.3 PERFORMANCE ANALYSIS
- 178 -
Avg. Time To Last Byte, Platform 1, "Bar Chart"
1.24 1.02 1.02 1.07 2.908.63
28.6734.55
48.69
90.71
0
1020
30
4050
60
70
8090
100
2 3 5 10 20 50 100 200 300 500
Concurrent Connections
TT
LB
(se
c.)
Avg. Time To Last Byte, Platform 1, "Organigram"
0.93 0.83 0.69 0.62 1.23 4.5115.69
20.64
62.03
103.39
0
20
40
60
80
100
120
2 3 5 10 20 50 100 200 300 500
Concurrent Connections
TT
LB
(se
c.)
Avg. Time To Last Byte, Platform 1, "CyberGallery"
2.12 2.37 2.01 2.11 6.18 16.7136.12
95.39 95.42
299.91
0
50
100
150
200
250
300
350
2 3 5 10 20 50 100 200 300 500
Concurrent Connections
TT
LB
(se
c.)
Avg. Time To Last Byte, Platform 1, "Corpogram"
1.59 0.82 1.19 0.83 2.417.97
24.22 26.19
51.46
106.09
0
20
40
60
80
100
120
2 3 5 10 20 50 100 200 300 500
Concurrent Connections
TT
LB
(se
c.)
FIGURE 88 Latency on Platform 1 server
The Latency in terms of TTLB values for Platform 2 for all four scenarios are displayed in Figure 89. The values are averaged whenever a trial was executed multiple times with the same user load. The TTLB value grew overproportionally high at high user load, which corresponds to the behavior of the respective throughput charts towards the end of the graph. At these points the system throughput degraded and response times increased significantly. The irregular server “freezes” as on Platform 1 was not experienced.

6 EVALUATION OF APPLICATION SCENARIOS
- 179 -
Avg. Time To Last Byte, Platform 2, "Bar Chart"
0.39 0.61 0.51 0.611.60
2.38
4.38
6.84
9.72
0
2
4
6
8
10
12
1 4 5 10 50 100 200 300 400
Concurrent Connections
TT
LB
(sec
.)
Avg. Time To Last Byte, Platform 2, "Organigram"
0.21 0.37 0.33 0.290.93
1.55
2.93
4.04
5.95
0
1
2
3
4
5
6
7
1 4 5 10 50 100 200 300 400
Concurrent Connections
TT
LB
(sec
.)
Avg. Time To Last Byte, Platform 2, "cyber:gallery"
0.461.43 0.86 0.84
2.77 3.52
7.15
12.06
15.90
0
24
6
8
10
12
14
16
18
1 4 5 10 50 100 200 300 400
Concurrent Connections
TT
LB
(sec
.)
Avg. Time To Last Byte, Platform 2, "Corpogram"
0.520.96 0.77 0.50
1.10
2.00
5.07 5.29
6.16
0
1
2
3
4
5
6
7
1 4 5 10 50 100 200 300 400
Concurrent Connections
TT
LB
(sec
.)
FIGURE 89 Latency on Platform 2 server
The Latency in terms of TTLB values for Platform 3 for all four scenarios are displayed in Figure 90. The values are averaged whenever a trial was executed multiple times with the same user load. The TTLB value grew overproportionally high at high user load, which corresponds to the behavior of the respective throughput charts towards the end of the graph. At these points the system throughput degraded and response times increased significantly. The irregular server “freezes” as on Platform 1 was not experienced.
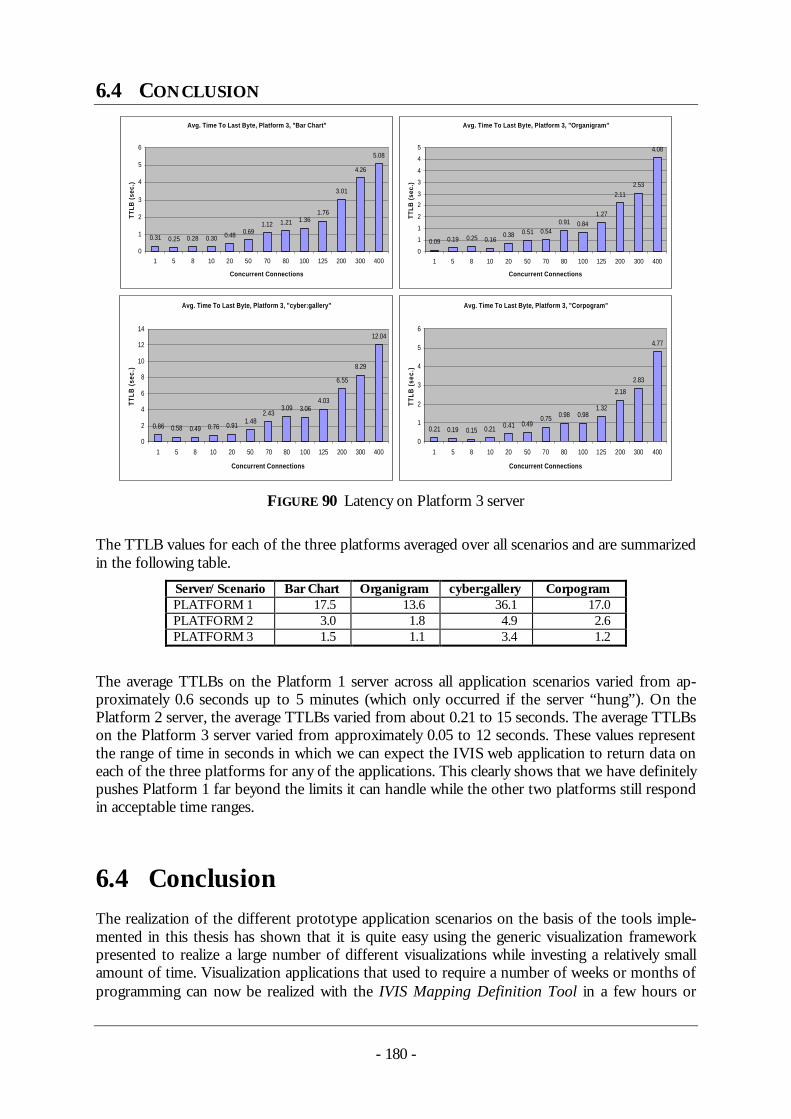
6.4 CONCLUSION
- 180 -
Avg. Time To Last Byte, Platform 3, "Bar Chart"
0.31 0.25 0.28 0.30 0.48 0.691.12 1.21 1.36
1.76
3.01
4.26
5.08
0
1
2
3
4
5
6
1 5 8 10 20 50 70 80 100 125 200 300 400
Concurrent Connections
TTLB
(se
c.)
Avg. Time To Last Byte, Platform 3, "Organigram"
0.09 0.19 0.25 0.160.38 0.51 0.54
0.91 0.841.27
2.112.53
4.08
0
1
1
2
2
3
3
4
4
5
1 5 8 10 20 50 70 80 100 125 200 300 400
Concurrent Connections
TTLB
(se
c.)
Avg. Time To Last Byte, Platform 3, "cyber:gallery"
0.86 0.58 0.49 0.76 0.911.48
2.433.09 3.06
4.03
6.55
8.29
12.04
0
2
4
6
8
10
12
14
1 5 8 10 20 50 70 80 100 125 200 300 400
Concurrent Connections
TTLB
(se
c.)
Avg. Time To Last Byte, Platform 3, "Corpogram"
0.21 0.19 0.15 0.21 0.41 0.490.75 0.98 0.98
1.32
2.18
2.83
4.77
0
1
2
3
4
5
6
1 5 8 10 20 50 70 80 100 125 200 300 400
Concurrent Connections
TTLB
(se
c.)
FIGURE 90 Latency on Platform 3 server
The TTLB values for each of the three platforms averaged over all scenarios and are summarized in the following table.
Server/Scenario Bar Chart Organigram cyber:gallery Corpogram PLATFORM 1 17.5 13.6 36.1 17.0 PLATFORM 2 3.0 1.8 4.9 2.6 PLATFORM 3 1.5 1.1 3.4 1.2
The average TTLBs on the Platform 1 server across all application scenarios varied from ap-proximately 0.6 seconds up to 5 minutes (which only occurred if the server “hung”). On the Platform 2 server, the average TTLBs varied from about 0.21 to 15 seconds. The average TTLBs on the Platform 3 server varied from approximately 0.05 to 12 seconds. These values represent the range of time in seconds in which we can expect the IVIS web application to return data on each of the three platforms for any of the applications. This clearly shows that we have definitely pushes Platform 1 far beyond the limits it can handle while the other two platforms still respond in acceptable time ranges.
6.4 Conclusion The realization of the different prototype application scenarios on the basis of the tools imple-mented in this thesis has shown that it is quite easy using the generic visualization framework presented to realize a large number of different visualizations while investing a relatively small amount of time. Visualization applications that used to require a number of weeks or months of programming can now be realized with the IVIS Mapping Definition Tool in a few hours or
6 EVALUATION OF APPLICATION SCENARIOS
- 181 -
days and without an extensive knowledge of programming languages and techniques. This state-ment has been derived from experience with the cyber:gallery application scenario, which has formerly been fully implemented without the help of a framework by using Java, ASP and VRML as technologies. The effort for developing the database driven 3D visualization compo-nents in the original cyber:gallery application with the effort of constructing the similar scenario using the framework presented in this thesis (section 6.1.3) has been subjectively compared and estimated by the involved software developers to be roughly at a factor of 10. However, in this case it has to be taken into account that the developers of the cyber:gallery scenario already had lots of experience with this particular application representing a factor that cannot easily be esti-mated. These rough estimations are of course by no means a replacement for a comprehensive user evaluation with several developers of 3D information visualization applications. Such an evauation, however, is far beyond the scope of an engineering related thesis and has to be left open for future work.
The work carried out on the corpogram scenario also showed that generic tools involve a very fundamental problem. The general nature of such tools results in having to invest considerably more programming effort when very special problems are to be solved with constantly changing requirements (e.g. corpograms). In cases like this the question arises as to whether it would make more sense to adapt a generic application such that the additional programming effort would not be necessary or to develop a specialized solution. This question is very fundamental in nature and cannot be given a general answer here. A thorough user evaluation with application developers is needed at this point.
With respect to the performance evaluation several conclusions can be drawn in summary:
• The IVIS applications built with the framework behave roughly linear with increasing system hardware resources, such as additional CPU’s and RAM.
• Taking the complexity of the visualization of the results into account, the tested applica-tions (which are assumably to some degree representative) impose an acceptable request delay on the user and can handle an acceptable amount of concurrent users, if compared to modern complex web applications, such as e-banking or e-commerce.
• The performance measurements really represented the computation work of the IVIS server components, since all server side caching facilities were turned off purposely.
As an overall conclusion of all these tests it can be stated that the implementation of the IVIS server components behaves very well with the given system resources of memory and number of CPUs. This indicates that an Model-View-Controller-style implementation of the Information Visualization process as developed throughout this thesis seems to be practically applicable to 3D visualization spaces with respect to performance issues, even with the mapping from infor-mation to presentation objects being potentially more complex than in the well-known 2D case.

7.1 SUMMARY
- 182 -
7 Summary and outlook for future work
7.1 Summary The last chapter is a summary of the problems discussed in this thesis as well as of the solutions elaborated and, at the same time, a look ahead to further conceptual and technological develop-ments that will produce changes in the implemented system in the future. On the technological side this applies in particular to the conversion from VRML to X3D and the use of XML Schema instead of XDR. In the final section problems are referred to which were previously mentioned but which it was not possible to discuss in detail or to implement in the framework of this thesis. These problems serve as a basis for the formulation of recommendations for future projects.
On the theoretical side the abstract model presented in chapter 4 will have to be extended to cope with user interactions, since this is an important feature of information visualization.
In the scope of this thesis a generic 3D information visualization framework was designed and implemented on the basis of an abstract model for information visualization. This framework, in the form of in a client/server environment, provides a number of tools that can be used intui-tively. With these tools the user can define visual objects and enrich them with interfaces, define mapping processes between structured application data schemata and visual objects, and execute these mappings of server components. The resultant VRML scenes can be visualized on any clients (e.g. web browsers). The following requirements were taken into account with regards to system design and implementation (see section 4.4):
• Decoupling of information and visualization • Independence of data schema • Generic mapping mechanism • Persistence • Instantiation and animation behavior (macro instructions)

7 SUMMARY AND OUTLOOK FOR FUTURE WORK
- 183 -
7.2 Outlook
7.2.1 Extension of the abstract Information Visualization model The abstract information visualization model presented in chapter 4 defines information visualization formally as a mathematical function, mapping an information space to a presentation space. Although in Figure 56 the user of an information visualization application reacts to the perception of the displayed presentation with an interaction, this concept has been given less priority within the model and also the implementation. In the explanation of the IVIS function it has been stated that there is always an inverse relation mapping objects from the presentation space to the information space. In the case of IVIS being an injective or even bijective function this relation can even be calculated. Such an inverse mapping would be needed if the user interactions (as reactions to the state of the presentation space) should be reflected in the information space. In other words, interaction with a visual object would have a meaning in the information domain. The user could virtually interact with information through visual interactions. The set of functions given in the definition of the presentation space is the key to the definition of interactive behavior on multiple levels. Since we made no restrictions on the form of these functions, they give complete freedom to access any resources within the given model. Especially interaction events could be of interesting as arguments.
Technically these functions could be represented by (client-side) scripts or programs written in some programming language, which have access to the underlying information model since they have been generated by the IVIS function taking information objects as arguments.
These issues related to interactive information visualization have to be investigated further on an abstract level as well as on the design and implementation level. Some of the ongoing research is aimed at the interactive element in information visualization.
7.2.2 Switching from VRML to X3D In section 6.2 it was shown that around 90 percent of the time needed for the mapping process is taken up by the transformation from X3D to VRML, which is currently needed for visualiza-tion purposes. It can be expected that existing efficient VRML browsers will be able to visualize X3D as soon as X3D becomes the official standard. The information visualization system pre-sented here was designed such that as of that point in time it will be possible to continue to use it without application of the X3D2VRML stylesheets, but otherwise unchanged.
The concept of X3D core profiles and profile extensions were presented in section 2.2.2. They will make it possible in the future to expand the X3D standard to include new geometric objects and freely definable object behavior. By using profile extensions of this kind it will be possible to implement mechanisms such as the Runtime Node and the TriggerSensor nodes of the Trigger Server in a manner that is in conformity with X3D and to use them as part of the IVIS system. Since Script nodes are not part of the X3D core profiles and it is currently not known whether and when the first X3D viewers will support the entire VRML97 profile, an alternative route was chosen for object behavior and interaction in this project. User interactions are registered in a component connected to the 3D viewer by means of callback methods and the object behavior is controlled externally (currently by the EAI). In the transformation from VRML to X3D only the viewer component needs to be replaced. The communication between the viewer and the

7.3 FUTURE WORK
- 184 -
component which registers and controls interactions and object behavior takes place through the Scene Authoring Interface (SAI). The latter is based strongly on the size and strength of the EAI and was developed as part of the X3D standard.
7.2.3 Switching from XDR to XML Schema Since XML Schema is now an official W3C recommendation this will have an effect on two things in the IVIS framework. On the one hand, X3D can be described by an XML Schema definition (instead of by a DTD) and, on the other, the application data schemata can be in XML Schema definition notation. The current X3D proposal describes the concept of profiles. How-ever, a real application of this concept will be possible only with the help of schemata, since DTDs are neither extendible nor modular and, as such not combinable. This means that anyone who defines a profile extension could adjust the existing X3D DTD to his or her requirements in a very complex process and send it to an X3D viewer together with the scene, but it would never be possible to combine two X3D scenes with different profile extensions. With the inheritance mechanisms of XML Schema it will be possible to derive new profiles from the original X3D schema definitions and to combine them in any desired manner.
The use of XML Schema also opens up the possibility of mixing different source data formats for the description of application data schemata. The view of the data does not have to be mod-eled by SQL instructions and can be defined in a later step by a combination of different existing XML schema descriptions. No significant changes are required for using the schema definition in the Schema browser treeview of the IVIS Mapping Definition Tool. It is necessary only to make adjustments to a new syntax.
7.3 Future work In conclusion, proposals have been formulated here for future work based on needs identified in the course of completing this work. As a result of time constraints and the limited length of a thesis it was not possible to discuss these needs in any detail here. The following items are listed in the order of importance and volume of work:
• Usability evaluation: Although a thorough performance analysis of the implemen-tation of the presented concepts has been performed, which shows that executing mappings from information spaces to potentially complex 3D presentation spaces is feasible, the main focus of the presented framework lies in the area of supporting the development process of IVIS applications. Therefore, it is required to test the developed IVIS framework including all tools for its usability in the rapid devel-opment of more or less complex IVIS application scenarios. It seems, however, obvious that such a usability evaluation would be quite a time and resource con-suming endeavor and therefore beyond the scope of an engineering related work.
• New mapping language instead of XSLT: Certainly the most difficult but also most challenging task to be recommended for a future project is the development and use of a new mapping language to replace XSLT and the implementation of a related interpreter. In the development of the prototype application scenarios (particularly in connection with the realization of corpograms) it became clear that the general nature of XSLT can also be a disadvantage for such special

7 SUMMARY AND OUTLOOK FOR FUTURE WORK
- 185 -
applications. A language developed specifically for mapping application data to visual metaphors would greatly facilitate the development of a mapping tool, the extendibility of the latter by adding macros, the introduction of new object behavior, as well as checking the inclusion relations of visual objects.
• Achievement of sub-linear behavior with increasing user-load. This could be achieved through intelligent caching algorithms within the server components of the IVIS framework. In this way, the system could leverage from the fact that con-current requests are similar to each other and to preceding requests.
• Interface design: Easy and intuitive handling of the implemented tools was called for in the requirement analysis. This is given in principle, but it can be further im-proved by adding a drag-and-drop function. It should be taken into account, how-ever, that as a result of using a drag-and-drop function the option is lost in the IVIS Mapping Definition Tool of providing a context-dependent selection of only those alternatives that are appropriate to the element currently selected in the mapping editor.
• Data type check: In mapping the definition of attributes and elements of the appli-cation data schema to the visual attributes of objects all the information needed for the datatype check is available in the IVIS Mapping Definition Tool. On the one hand, the DataDestination definitions in the Interface of the IVIS Objects contain datatype information and, on the other, the IVIS Data Extractor provides type in-formation in the application data schema. A datatype check can also take place in connection with the mapping of attributes or elements of the application data schema to visual attributes of IVIS objects. Here it needs to be taken into account, however, that only triples of floating number values are allowed for a multifield of the MFColor type, but that these can initially be put together in a string and then transmitted all at once. This would also require the introduction of a strict system of type classification for variable management.
• Implementation of further DataExtractor modules: Given that the application of the tools implemented in this thesis requires that the data used be in XML, the structured data in question must first be converted to XML. The Data Extraction Definer application is used for this purpose. In the course of this thesis it has been mentioned a number of times that it will be necessary to develop other extraction modules (e.g. for multidimensional DBMS) in addition to the module implemented for the extraction of relational database content.
• Definition and implementation of further macros: Only the „Instantiate“ and the „Animate“ macros were implemented in the framework of the present project. It must be the aim of future projects to provide a language large enough that the use of individual XSLT instructions will become superfluous. There is a need first of all to identify frequently recurring instruction sequences and concepts that will make it possible to realize any desired mapping rule. In addition to the traditional Instantiate macro there must be loop constructions that first instantiate the objects and then check the truncation condition and vice versa. Constructions would be conceivable in a further stage of development that would check additional trunca-tion criteria in every loop cycle.

7.3 FUTURE WORK
- 186 -
• Complete implementation of the Scripting Generator: As a result of time con-straints it was possible to implement only the initial stages of the IVIS Scripting Definer and the Application Scripting Generator. The current implementation gen-erates JavaScript code for use in web browsers which makes it possible to hide ob-jects in the scene by clicking on them. In addition to the VRML viewer the gener-ated HTML page contains a treeview control which shows all the objects named in the scene in a tree structure. By clicking on the object designations in this treeview the objects in the scene can be made visible again. The IVIS Scripting Definer should offer a rich selection of interaction options and object behaviors, from which the user can select.
• Nested object structures and constraint language: In the current version of the IVIS Mapping Definition Tool it is not possible to position elements as children of IVIS Object elements. As such, it is not possible to nest IVIS Objects in one another nor can XSLT instructions, macros, or variables be inserted in the tree structure of the mapping definition below an IVIS Object. This could be made possible in fu-ture versions by placing the subordinate elements in the Children field of a su-perordinate X3D group node. In this way the Constraint modeling described in section 4.4.6 would be used to check the validity of the inclusion relations of ob-jects.

8 APPENDICES
- 187 -
8 Appendices
8.1 Figures FIGURE 1 EXAMPLE OF MARKUP USING HTML......................................................................................... 13 FIGURE 2 AN XML DOCUMENT AS DOM STRUCTURE .............................................................................. 22 FIGURE 3 AXIS DIMENSIONS OF XPATH EXPRESSIONS ............................................................................... 24 FIGURE 4 XPATH EXPRESSIONS AND THEIR ABBREVIATIONS...................................................................... 25 FIGURE 5 A TREE DIAGRAM FOR A HIERARCHICAL WEB SITE STRUCTURE ................................................... 34 FIGURE 6 A TREEVIEW ............................................................................................................................ 35 FIGURE 7 A TREEMAP VISUALIZATION IN WINSURFER.............................................................................. 37 FIGURE 8 THE CHEOPS PRINCIPLE ............................................................................................................ 37 FIGURE 9 CHEOPS: DISPLAYING THE COMPRESSION .................................................................................. 38 FIGURE 10 ELASTIC WINDOWS FOR THE DISPLAY OF A WWW DOCUMENT HIERARCHY ................................ 40 FIGURE 11 NAVIGATING A HIERARCHY WITH THE HYPERBOLIC BROWSER.................................................... 41 FIGURE 12 THE CONCEPT OF THE FRACTAL VIEW LAYOUT ........................................................................... 43 FIGURE 13 THE WEBTOC DISPLAY............................................................................................................ 44 FIGURE 14 A DOCUMENT MAP USING THE MAPDISPLAY .............................................................................. 45 FIGURE 15 THE NEWSMAP NEWS BROWSER............................................................................................... 46 FIGURE 16 THE DOCUMENT LENS FROM XEROX PARC ............................................................................ 47 FIGURE 17 CONE TREE PRINCIPLE: A) ROOT NODE; B) CHILD NODES; C) 1ST RECURSION LEVEL..................... 47 FIGURE 18 CONE TREE DISPLAY OF A GIVEN TREE STRUCTURE. ................................................................... 48 FIGURE 19 THE PERSPECTIVE WALL .......................................................................................................... 49 FIGURE 20 A SELF-ORGANIZING INFORMATION SPACE WITH HYPERSPACE ................................................... 50 FIGURE 21 THE HOTSAUCE BROWSER........................................................................................................ 50 FIGURE 22 THE LYBERTREE ...................................................................................................................... 52 FIGURE 23 THE LYBERSPHERE .................................................................................................................. 52 FIGURE 24 INTERACTION IN HYPERBOLIC SPACE ......................................................................................... 53 FIGURE 25 THE 3 MODELS FOR DISPLAYING HYPERBOLIC SPACE.................................................................. 53 FIGURE 26 THE INFORMATION CUBE ......................................................................................................... 54 FIGURE 27 FILE SYSTEM NAVIGATOR FROM SGI ........................................................................................ 55 FIGURE 28 NAVIGATION IN H3 .................................................................................................................. 55 FIGURE 29 A NAVIGATION SEQUENCE IN H3............................................................................................... 56 FIGURE 30 THE INTERFACE OF DOCUMENT FINDER .................................................................................... 57 FIGURE 31 HYPERBOLIC BROWSER WITH THUMBNAIL IMAGES AS NODES .................................................... 58 FIGURE 32 SELECTED TECHNIQUES FROM THE FIELD OF INFORMATION VISUALIZATION [DÄßLER,1999]........ 59 FIGURE 33 THE VIRGILIO PROTOTYPE........................................................................................................ 64 FIGURE 34 THE CYBER:GALLERY SYSTEM .................................................................................................. 65 FIGURE 35 AN OPEN INVENTOR SAMPLE APPLICATION ............................................................................... 68 FIGURE 36 THE LOGICAL LAYERS OF THE GRAMS SYSTEM [EGBERT,1992] ................................................ 70 FIGURE 37 THE GROOP SYSTEM ARCHITECTURE [KOVED,1993]................................................................ 71 FIGURE 38 GRAPHIC OBJECT CLASS HIERARCHY IN OBLIQ-3D..................................................................... 73 FIGURE 39 THE JAVA 3D FLY THROUGH EXAMPLE ...................................................................................... 75 FIGURE 40 THE OLAP EXPLORER ............................................................................................................. 76 FIGURE 41 THE JAMAL ARCHITECTURE AND A SAMPLE IMPLEMENTATION [RUDOLPH,1999,1]...................... 78 FIGURE 42 3D BEAN ARCHITECTURE ......................................................................................................... 81

8.1 FIGURES
- 188 -
FIGURE 43 INSERTING 3D BEANS INTO THE 3D BEANBOX........................................................................... 81 FIGURE 44 THE CONTIGRA ARCHITECTURE ............................................................................................ 84 FIGURE 45 THE APPLICATION DESIGN PHASES ............................................................................................ 85 FIGURE 46 APPLICATION INTEGRATION PHASE ............................................................................................ 86 FIGURE 47 THE I4D SYSTEMS VISUAL EDITOR ............................................................................................ 88 FIGURE 48 I4D ARCHITECTURE .................................................................................................................. 88 FIGURE 49 THE STARLIGHT INFORMATION VISUALIZATION SYSTEM ........................................................... 90 FIGURE 50 AN EXAMPLE FOR AN OPENDX APPLICATION ............................................................................ 91 FIGURE 51 THE INFORMATION-TERM (*) ................................................................................................... 103 FIGURE 52 DATA AND INFORMATION ....................................................................................................... 104 FIGURE 53 THE OBJECT TERM (*) .............................................................................................................. 105 FIGURE 54 THE ABSTRACT INFORMATION VISUALIZATION MODEL ............................................................. 113 FIGURE 55 REFERENCE MODEL FOR INFORMATION VISUALIZATION .......................................................... 115 FIGURE 56 THE GENERAL INFORMATION VISUALIZATION PROCESS ............................................................ 116 FIGURE 57 THE IVIS SYSTEM MODEL....................................................................................................... 120 FIGURE 58 ARCHITECTURAL DIAGRAM OF THE GENERIC VISUALIZATION FRAMEWORK............................... 127 FIGURE 59 EXAMPLE OF AN XSLT MAPPING DEFINITION .......................................................................... 134 FIGURE 60 USE OF ANIMATE MACROS ...................................................................................................... 137 FIGURE 61 THE MAPPING STYLESHEET AFTER REPLACEMENT OF THE ANIMATE MACROS ............................ 138 FIGURE 62 THE X3D SCENE AFTER APPLICATION OF THE MAPPING STYLESHEET ........................................ 139 FIGURE 63 THE IVIS OBJECT MODELER .................................................................................................. 140 FIGURE 64 THE DATA DESTINATION DIALOG OF THE IVIS OBJECT MODELER ........................................... 140 FIGURE 65 THE IVIS DATA EXTRACTION DEFINER .................................................................................. 142 FIGURE 66 THE IVIS MAPPING DEFINITION TOOL .................................................................................... 143 FIGURE 67 THE IVIS SCRIPTING DEFINER ................................................................................................ 146 FIGURE 68 THE BAR CHART APPLICATION SCENARIO ................................................................................ 150 FIGURE 69 THE ORGANIGRAM APPLICATION SCENARIO ............................................................................ 153 FIGURE 70 THE CYBER:GALLERY APPLICATION SCENARIO .......................................................................... 154 FIGURE 71 ARTWORK ELEMENTS SORTED IN ACCORDANCE WITH THREE CRITERIA ..................................... 155 FIGURE 72 AN ANNOTATED CORPOGRAM................................................................................................. 157 FIGURE 73 THE CORPOGRAM APPLICATION SCENARIO............................................................................... 158 FIGURE 74 PERFORMANCE ANALYSIS OF THE MAPPING PROCESS (ALL NUMBERS IN SECONDS) .................... 159 FIGURE 75 LATENCY VS. USER LOAD........................................................................................................ 161 FIGURE 76 THROUGHPUT VERSUS USER LOAD .......................................................................................... 162 FIGURE 77 UTILIZATION VERSUS USER LOAD............................................................................................ 163 FIGURE 78 THE MICROSOFT WAS TOOL .................................................................................................. 167 FIGURE 79 WAS APPLICATION SETTINGS ................................................................................................. 169 FIGURE 80 SERVER HARDWARE CONFIGURATIONS................................................................................... 171 FIGURE 81 NETWORK CONFIGURATION OF THE TESTING ENVIRONMENT .................................................... 172 FIGURE 82 THROUGHPUT VS. USER LOAD FOR PLATFORM 1 AND THE FOUR APPLICATION SCENARIOS ......... 174 FIGURE 83 THROUGHPUT VS. USER LOAD FOR PLATFORM 2 AND THE FOUR APPLICATION SCENARIOS ......... 175 FIGURE 84 THROUGHPUT VS. USER LOAD FOR PLATFORM 3 AND THE FOUR APPLICATION SCENARIOS ......... 176 FIGURE 85 PLATFORM 1 SERVER UTILIZATION (BAR CHART) ................................................................... 178 FIGURE 86 PLATFORM 2 SERVER UTILIZATION (BAR CHART) ................................................................... 178 FIGURE 87 PLATFORM 3 SERVER UTILIZATION (BAR CHART) ................................................................... 178 FIGURE 88 LATENCY ON PLATFORM 1 SERVER ......................................................................................... 180 FIGURE 89 LATENCY ON PLATFORM 2 SERVER ......................................................................................... 181 FIGURE 90 LATENCY ON PLATFORM 3 SERVER ......................................................................................... 182

8 APPENDICES
- 189 -
8.2 References [Ahlberg,1995] C. Ahlberg and E. Wistrand. IVEE: An environment for automatic creation of dy-
namic queries applications. Conference Companion, CHI 95, ACM May 1995, pp 15-16.
[Ames,1997] Ames, A.L.; Nadeau, D.R.; Moreland, J.L. The VRML 2.0 Source-book. New York: John Wiley & Sons; ISBN 0-0741-16507-7, 1997
[Andrews,1994,1] Keith Andrews and Michael Pichler. Hooking up 3-space: Three-dimensional models as fully edged hypermedia documents. In Proc. of East-West International Confer-ence on Multimedia, Hypermedia, and Virtual Reality, Moscow. Institute for Infor-mation Processing and Computer Supported New Media (IICM), Graz Univeristy ofTechnology, Sep. 1994.
[Andrews,1994,2] Keith Andrews. Spatial metaphors for information systems. Position paper for ECHT'94, Sep. 1994
[Andrews,1995] Keith Andrews. Visualising cyberspace: Information visualisation in the harmony internet browser. In Proc. of First IEEE Symposium on Information Visualization, Atlanta, GA, pages 97-104, Oct. 1995.
[Andrews,1996,1] Keith Andrews and Andreas Sandberg. Reinventing the wheels ...? usability prob-lems on the world-wide web. Technical report, Graz University of Technology. http://homepage.mac.com/juggle5/WORK/publications/Usability_and_Web.html
[Andrews,1996,2] Keith Andrews, Michael Pichler, and Peter Wolf. Towards rich information land-scapes for visualising structured web space. In Proc. of 2nd IEEE Symposium on Information Visualization, InfoVis'96, San Francisco, CA, Oct. 1996.
[Angelaccio,1990] M. Angelaccio, T. Catarci, and G. Santucci. : A Fully Visual Query System. Journal of Visual Languages and Computing, 1:255-273, 1990.
[Appleman,2000] Appleman D. COM/ActiveX-Komponenten mit Visual Basic 6 entwickeln. Markt&Technik; ISBN: 3-8272-5470-1, 1999
[Baartse,2000] Baartse, M.; Blair, R.; Bolognese, L.; Professional ASP XML. Wrox Press Ldt., Birmingham (UK); ISBN: 1-861004-02-8, 2000
[Batini,1991] C. Batini, T. Catarci, M. F. Costabile, and S. Levialdi. Visual Query systems. Technical Report RAP.04.91, Università degli Studi di Roma, La Sapienza, Dipartimento di Informatica e Sistemistica, March 1991.
[Battista,1994] G. Di Battista, P. Eades, R. Tamassia, and I. G. Tollis. Algorithms for drawing graphs: an annotated bibliography. Comput. Geom. Theory Appl., 4:235-282, 1994.
[Beaudoin,1996] L. Beaudoin, Marc-Antoine Parent, and L C. Vroomen. Cheops: A compact explorer for complex hierarchies. 1996. http://www.crim.ca/hci/cheops/paper.html
[Bederson,1996] Bederson B.; Hollenz, D.; Perlin, K.; Pad++: A Zoomable Graphical Sketchpad for Exploring Alternate Interface Physics. Journal of Visual Languages and Computing 7, pp. 3-31, 1996
[Bender,2000] Michael Bender, Ralf Klein, Andreas Disch, and Achim Ebert, A Functional Frame-work for Web-Based Information Visualization Systems, IEEE TRANSACTIONS ON VISUALIZATION AND COMPUTER GRAPHICS, VOL. 6, NO. 1, JANU-ARY-MARCH 2000
[Bertin,1983] J. Bertin. Semiology of Graphics. The University of Wisconsin Press, Madison, Wisconsin, 1983.
[Blaxxun,2001] Blaxxun Homepage (2001), Blaxxun3D X3D-Viewer. http://www.blaxxun.de

8.2 REFERENCES
- 190 -
[Braig,2000] Braig, A.; Dachselt, R., An Abstract Component Framework for Interactive Three-dimensional Graphical Applications (only abstract in English). In Proceedings of the Workshop "Grafiktag 2000" (GI-Annual Conference), Berlin, Germany, 19. Septem-ber 2000
[Bransford,1979] Bransford, J. (1979). Human cognition: Learning, understanding, and remembering. Belmont, CA: Wadsworth.
[Bredenfeld,2000] A. Bredenfeld, E. Ihler and O. Vogel: GENVIS - Model-based Generation of Data Visualizers, Technology of object oriented Languages and System, 2000
[Brinkschulte,1996] Brinkschulte, U.; Siomanolakis, M.; Vogelsang, H. Visualization and Manipulation of Structured Information. Proc. IEEE Visual Information Systems 96, pp. 512-517, 1996
[Brodlie,1992] K.W. Brodlie et al. Scientific Visualization. Springer-Verlag, 1992.
[Brunk,1997] Brunk, C., Kelly, J. & Kohavi, R. (1997), MineSet: an integrated system for data mining, in D. Heckerman, H. Mannila, D. Pregibon & R. Uthurusamy, eds,`Proceedings of the third international conference on Knowledge Discov-ery and Data Mining', AAAI Press, pp. 135-138. http://mineset.sgi.com.
[Buschmann,1997] Frank Buschmann, Regine Meunier, Hans Rohnert, Peter Sommerlad, Pattern Ori-ented Software Architecture Volume 1: A System of Patterns, John Wiley & Sons, Inc., 1997
[Capurro,1995] R.Capurro, K.Wiegerling, and A. Brellochs. Informationsethik. Universit. atsverlag Konstanz, 1995.
[Card,1993] S. K. Card, G. G. Robertson, and J. D. Mackinlay. The Information Visualizer: an Information Workspace. In Proceedings of the ACM Conference on Human Computer Interaction, pages 181-183, 1993.
[Card,1996] Stuart K. Card, George G. Robertson William York, "The WebBook and the Web Forager: An Information Workspace for the World-Wide Web." In Human Factors in Computing Systems: Proceedings of the CHI '96 Conference. New York: ACM, 1996.
[Card,1999,1] Card, Mackinlay, Shneidermann.: „Readings in Information Visualization“, Morgan Kaufmann Publishers, San Francisco 1999
[Card,1999,2] Card, S.K.; Mackinlay, J.D.; Shneiderman, B. Readings in Information Visualization - using vision to think. Morgan Kaufman Publisers, Inc.; San Francisco, California, 1999
[Cardelli,1995] L. Cardelli, "A language with distributed scope," 22nd Ann. ACM Symp. Principles of Programming Languages, pp. 286-297, Jan. 1995.
[Carey,1997] Carey, R.; Bell, G. The Annotated VRML 2.0 Reference Manual Addison Wessley, Developers Press, 1997
[Carriere,1995] Jeromy Carriere and Rick Kazman. Interacting with huge hierarchies: Beyond cone trees. In Proceedings of the IEEE Symposium on Information Visualization, pages 74–81, oct 1995.
[Ching,2001,1] Aaron Ching and Allen Wagner, Understanding Performance Testing, Duwamish Online, Microsoft Developer Network, February 2001
[Ching,2001,2] Aaron Ching, Paul Johns, and Steve Kirk, Capacity Planning, Duwamish Online, Microsoft Developer Network, February 2001
[Ching,2001,3] Aaron Ching, Pedro Silva, and Allen Wagner, Performance Testing with the Web Application Stress Tool, Duwamish Online, Microsoft Developer Network, January 2001

8 APPENDICES
- 191 -
[Conner,1992] D. Conner, S. Snibbe, K. Herndon, D. Robbins, R. C. Zeleznik, A. van Dam, Three-Dimensional Widgets. Computer Graphics (1992 Symposium on Interactive 3D Graphics), Vol. 25, No. 2, March 1992, pp. 183-188.
[Consens,1992] M. P. Consens, I. F. Cruz, and A. O. Mendelzon. Visualizing Queries and Querying Visualizations. ACM SIGMOD RECORD, Special Issue on Advanced User Interfaces, 21(1), March 1992.
[Conway,1994] M. Conway, R. Pausch, R. Gossweiler, and T. Burnette, "Alice: A rapid prototyping system for building virtual environments," Conf. Companion, CHI '94, pp. 295-296, Apr. 1994.
[Craik,1972] Craik, F., & Lockhart, R. (1972). Levels of processing: A framework for memory research. Journal of Verbal Thinking and Verbal Behavior, 11, 671-684.
[Crossley,1997] Crossley, M.; Davies, N.J.; Taylor-Hendry, R.J.; McGrath A.J. Three-dimensional Internet developments. BT Techno1 J Vol 15 No. 2 April 1997
[Cruz,1987] I. F. Cruz, A. O. Mendelzon, and P. T. Wood. A Graphical Query Language Supporting Recursion. In ACM-SIGMOD Intl. Conf. on Management of Data, pages 323-330, 1987.
[Cruz,1994] I. F. Cruz and R. Tamassia. How to visualize a graph: Specification and algorithms. In IEEE Symposium on Visual Languages (VL '94), 1994. Available on the WWW at URL http://www.cs.brown.edu/people/rt/gd-tutorial.html.
[Cruz,1996] Isabel F. Cruz. Tailorable information visualization. In ACM Computing Surveys 28A(4). Association for Computing Machinery, Inc., 1996. http://www.cs.brown.edu/people/ifc/hci/newcruz.html
[Dachselt,2001,1] Dachselt, R., Contigra - Towards a Document-based Approach to 3D Components; Proceed-ings of the Workshop "Structured Design of Virtual Environments and 3D-Components" of the ACM Web3D 2001 Symposium, Paderborn, 19. February 2001
[Dachselt,2001,2] Dachselt, R., CONTIGRA: A High-Level XML-Based Approach to Interactive 3D Compo-nents; Conference Abstracts and Applications, SIGGRAPH 2001, Los Angeles, August 2001
[Däßler,1996] Rolf Däßler, Sven Knauer, Frank Lochter, and Hartmut Palm. Im ug: Visuelle voll-textrecherche im www. iX, page 134 f.f., 11 1996.
[Däßler,1997] Rolf Däßler. Information visualization. 1997. http://fabdp.fh-potsdam.de/infoviz/paper/uom0595/tut.html
[Däßler,1999] Rolf Däßler. Informationsvisualisierung: Stand,Kritik,Perspektiven, in: Metho-den/Strategien der Visualisierung in Medien, Wissenschaft und Kunst,Wissenschaftlicher Verlag Trier (WVT), 1999, http://fabdp.fh-potsdam.de/daessler/paper/InfoVis99.pdf
[DBWORK] Homepage of the Enterprise Technology Working Group of the Web3D Consortium: http://www.web3d.org/WorkingGroups/dbwork
[DCD,1998] Document Content Description for XML , Submission to the World Wide Web Con-sortium 31-July-1998, http://www.w3.org/TR/NOTE-dcd
[DeLine,1993] R. DeLine, "Alice: A rapid prototyping system for three-dimensional interactive graphical environments," Univ. of Virginia, Dept. of Computer Science, May 1993.
[Dieberger,1997] Andreas Dieberger. Navigation metaphors and social navigation in information spaces. Position paper for CHI'97 workshop on Navigation in Information Spaces, 1997. http://www.lcc.gatech.edu/ dieberger/CHI97 navigation workshop.html
[Dix,1998] Dix, A.; Ellis, G. Starting Simple - adding value to static visualisation through sim-ple interaction. Proceedings of Advanced Visual Interfaces - ACM Press. pp. 124-134, 1995
[Döllner,1998] J. Döllner, K. Hinrichs: Interactive, Animated 3D Widgets. In IEEE Proceedings of Computer Graphics International ’98, pp. 278-286, 1998.

8.2 REFERENCES
- 192 -
[Dörner,2000] Ralf Dörner, Paul Grimm: Three-dimensional Beans - creating Web content using 3D components in a 3D authoring environment. Web3D 2000 Conference pp. 69-74, 2000
[Earnshaw,1992] R. A. Earnshaw and N. Wiseman. An Introductory Guide to Scientic Visualization. Springer-Verlag, 1992.
[Eckel,1998] Eckel, B. Thinking in Java. Prantice-Hall PTR, New Jersey 07458, 1998
[Egbert,1992] P. K. Egbert, W. J. Kubitz, Application Graphics Modeling Support Through Object -Orientation, Computer, October 1992, pp. 84-91
[Elliot,1994] C. Elliot, G. Schechter, R. Yeung, S. Abi-Ezzi SunSoft, Inc. TBAG: A High Level Framework for Interactive, Animated 3D Graphics Applications. Proceedings of SIGGRAPH ‘94, pp. 421-434.
[Engesser,1993] Engesser, H.; Claus, V. DUDEN Informatik. Bibliographisches Institut & F.A. Brockhaus AG; ISBN: 3-411-05232-5, 1993
[Englberger,1995] Hermann Englberger. Computergestützte informationsvisualisierung. Eine Klassifi-kation aktueller Techniken und ihrer Einsatzpotentiale für die unternehmung. Master's thesis, Technische Universit. at München, Fakultät für Informatik, Nov. 1995. http://www11.informatik.tu-muenchen.de/publications/da/englberger95.html
[Fairchild,1988] K.M. Fairchild, S.E. Poltrock, and G.W. Furnas. Semnet: Three-dimensional graphic representation of large knowledge bases. Cognitive Science and its Applications for Human-Computer Interaction, pages 201-233, 1988. Lawrence Erlbaum Associates.
[Foley,1990] Foley, van Dam, Feiner, and Hughes. Computer Graphics: Principles and Practice. Addison-Wesley Publishing Company, 2 edition, 1990.
[Furnas,1981] G. W. Furnas. The fisheye view:a new look at structured files. Technical report, Bell Laboratories, 1981. Technical Memorandum 81-11221-9, October 12.
[Furth,1998] Massari, A., Saladini, L., Sisinni, F., Napolitano, W., Hemmje, M., Paradiso, A., Leissler, M. (1998); Virtual Reality Systems For Browsing Multimedia, In: Furth, B. (ed.): Handbook of Multimedia Computing
[Gates,1996] Bill Gates, Nathan Myhrvold, and Peter Rinearson. The Road Ahead, Penguin USA (Paper),November 1996
[Geiger,1996] Geiger, C.; Hunstock, R. and Paelke, V.(1996): "Rapid Prototyping of Animated 3D Objects" in: Proc. of the Euromedia 1996 Conference, SCS, London, Dec. 1996
[Geiger,1998] C. Geiger, V. Paelke, R. Zelder: An integrated designtool for 3D widgets; IASTED International Conference on Computer Graphics and Imaging, Nova Scotia, Halifax, Canada, June 1st to 3rd, 1998
[Geiger,2000,1] C. Geiger, C. Reiman, W. Rosenbach: Design of Reusable Components for Interac-tive 3D Environments. In Proceedings of the Workshop on Guiding Users through Interactive Experiences, Paderborn, April 13-14, 2000.
[Geiger,2000,2] C. Geiger, V. Paelke, C. Reimann, W. Rosenbach: A Framework for the Structured Design of VR/AR Content, Proc. of the ACM Symposium on Virtual Reality Soft-ware & Technology, VRST 2000, Seoul, Korea, 2000
[Geiger,2001] C. Geiger,V. Paelke, C. Reimann, W. Rosenbach: Structured Design of Interactive Virtual and Augmented Reality Content, International Workshop on Structured De-sign of Virtual Environments and 3D-Components at the Web3D 2001 Conference, Paderborn, Germany, February 19th, 2001, http://www.c-lab.de/web3d/VE-Workshop/
[George,1991] George G. Robertson, Jock D.Mackinlay, and Stuart K. Card. Cone trees: Animated 3d Visualizations of hierarchical information. In ACM SIGCHI Conf. on Human Factors in Computing Systems, pages 189-194, 1991.

8 APPENDICES
- 193 -
[George,1994,1] George G. Robertson, Jock D. Mackinley, and Stuart K. Card. Information visualisa-tion using 3d interactive animation. Postition Paper for CHI'94, Workshop on the Challenges of 3D Interaction, 1994.
[George,1994,2] George G. Robertson, Jock Mackinlay, and Stuart K. Card. United states patent 5,295,243 for 'display of hierarchical three-dimensional structures with rotating sub-structures', 15. Mar. 1994. http://www.uspto.gov/
[Gibson,1984] William Gibson. Neuromancer. US Paperback Ace Book, July 1984 ISBN 0-441-56956-0 (later ISBN: 0-441-56959-5)
[Goldman,1985] K. Goldman, S.A.Goldman, P. Kanellakis, and S. Zdonik. ISIS: Interface for a Semantic Information System. In ACM-SIGMOD Intl. Conf. on Management of Data, pages 328-342, 1985
[Golin,1991] E. J. Golin. A Method for the Specification and Parsing of Visual Languages. Technical Report CS-90-19, Brown University, May 1991.
[Gross,1997] M. H. Gross, T. C. Sprenger, and J. Finger. Visualizing information on a sphere. Technical report, Department of Computer Science, Federal Institute of Technology, Z. urich, Switzerland.
[Hartmann,1996] Jed Hartmann and Josie Wernecke. The VRML 2.0 Handbook, Building Moving Worlds on the Web. Addison-Wesley Publishing Company, 1996.
[Hawking,1998] Stephen Hawking. A Brief History of Time. Bantam Doubleday Dell Pub (Trd Pap); 10th anniv edition (September 1, 1998)
[Heiland,2001] Randy W. Heiland, M. Pauline Baker, Danesh K. Tafti. VisBench: A Framework for Remote Data Visualization and Analysis, In: Lecture Notes in Computer Science, Volume 2074 / 2001: Computational Science - ICCS 2001: International Confer-ence, San Francisco, CA, USA, May 28-30, 2001, Proceedings, Part II, p. 718
[Hemmje,1992] Hemmje, M., Böcker, H.-D., Thiel, U. (1992). Expeditionen in Informationsräume: Zur Konzeption eines graphischen Informationssystems auf der Basis dreidimensio-naler Visualisierungen. In: Zimmermann, H.H., Luckhardt, H.-D., Schulz, A. (eds.): Proc. des 3. Internationalen Symposiums für Informationswissenschaft (ISI'92), (pp. 94-101), Saarbrücken, November 1992. Konstanz: Universitätsverlag Konstanz, 1992
[Hemmje,1994] Hemmje, M., A Visualization User Interface with Full Text Retrieval, in proceedings of SIGIR 94. ACM Press, 1994.
[Hemmje,1997] M. Hemmje, C. Kunkel, and A. Willet. Eine grafische Benutzerschnittstelle für ein Volltext Retrievel System auf der Basis interaktiver dreidimensionaler Visualisie-rung. Gesellschaft für Mathematik und Datenverarbeitung (GMD), Institut für Integ-rierte Publikations- und Informationssysteme (IPSI), 1997.
[Hemmje,2000] Hemmje,M.; Unterstützung von Information-Retrieval-Dialogen mit Informations-systemen durch interaktive Informationsvisualisierung. Dissertation, Sankt Augustin; GMD-Report, to appear, 2000
[Hopcroft,1992] John. E. Hopcroft and Jeffrey D. Ullman. Einführung in die Automatentheorie, For-male Sprachen und Komplexitätstheorie. ADDISON-WESLEY, 1992.
[Horvath,1996] Peter Horvath. Online Recherche. Vieweg, 1996.
[Huitt,2003] W. Huitt, The Information Processing Approach. http://chiron.valdosta.edu/whuitt/col/cogsys/infoproc.html, Feb. 2003
[Jäschke,2000] Jäschke, G. Konstruktion virtueller Informationsräume. Ein Software System zwi-schen Automatismus und freier Gestaltung am Beispiel eines online Kongress-Informationssystems. Diplomarbeit, Fachbereich Mathematik/Informatik, Universität Bremen, März 2000

8.2 REFERENCES
- 194 -
[Jern,1996] Jern, Mikael, Information Visualization - Trends in the late 90s. Proc. GraphiCon'96, pp. 91-131, 1996
[Johnson,2000] Brian Johnson, TreeViz for Macintosh, http://www.cs.umd.edu/hcil/pubs/treeviz.shtml
[Jungmeister,1992] Jungmeister, W.-A. and Turo, D. 1992. Adapting treemaps to stock portfolio visuali-zation, University of Maryland, Center for Automation Research technical report CAR-TR-648 (also CS-TR-2996, SRC-TR-92-120).
[Kandogan,1996] Eser Kandogan and Ben Shneiderman. Elastic windows: Improved spatial layoutand rapid multiple window operations. In ACM AVI'96 Advanced Visual Interfaces, pages 29{28, May 1996.
[Koenen,1997,1] Rob Koenen. Mpeg-4 overview. Technical report, ISO, 7 1997. http://drogo.cselt.stet.it/mpeg/standards/mpeg-4.htm
[Koenen,1997,2] Rob Koenen. Mpeg-7: Context and objectives (ver. 4). Technical report, ISO, 7 1997. http://drogo.cselt.stet.it/mpeg/standards/mpeg-7.htm
[Koffler,1998] Koffler M. Visual Basic 6 - Programmiertechniken, Datenbanken, Internet. Addiso-Wesley; ISBN: 3-8273-1704-8, 1998
[Koike,1993] Hideki Koike and Hirotaka Yoshihara. Fractal approaches for visualizing huge hier-archies. In Proceedings of the 1993 IEEE Symposium on Visual Languages, pages 55{60. IEEE/CS, 1993. http://roma.vogue.is.uec.ac.jp/ koike/papers/vl93/vl93.html
[Koved,1993] L. Koved, W. L. Wooten, GROOP: An object-oriented toolkit for animated 3D graphics. ACM SIGPLAN NOTICES OOPSLA’93, Vol. 28, No. 10, October 1993, pp. 309-325
[Kreuseler,1998] Matthias Kreuseler, KOAN - Kontextuelle Informationsvisualisierung, http://www.informatik.uni-rostock.de/~mkreusel/koan/koanframe.html
[Kreuseler,2000] Matthias Kreuseler , Norma López , Heidrun Schumann, A Scalable Framework for Information Visualization, University of Rostock, Dept. of Computer Science, 18051 Rostock, Germany, Proceedings of the IEEE Symposium on Information Visualiza-tion 2000 (InfoVis'00)
[L’Abbate,2000] L’Abbate, Marcello, Unterstützung der Konstruktion von strukturierten Anfragen als Grundlage der Metapherdefinition für interaktive Informationsvisualisierungssyste-me. Diplomarbeit, Fachbereich Informatik, TU Darmstadt, März 2000
[L'Abbate,1998] L'Abbate, M.; Hemmje, M. VIRGILIO - The Metaphor Definition Tool. GMD Re-port 15, May 1998
[Lamping,1995] John Lamping, Ramana Rao, and Peter Pirolli, editors. A Focus+Context Technique Based on Hyperbolic Geometry for Visualizing Large Hierarchies. http://www.acm.org/sigchi/chi95/Electronic/documnts/papers/jl bdy.htm
[Lamping,1996] John Lamping and Ramana Rao, editors. Vi-sualizing Large Trees Using the Hyper-bolic Browser. http://www.acm.org/sigchi/chi96/proceedings/videos/Lamping/hb-video.html
[Lang,2000] Lang, J. Entwurf und Implementierung eines Werkzeuges zur intelligenten Navigati-on und Visualisierung von multimedialen OLAP Datenbanken. Diplomarbeit, Fach-bereich Informatik, TU Darmstadt, April 2000
[Leissler,1997] Leissler, M.; Hemmje, M. Portierung und Erweiterung der Relevanzkugelmetapher um interaktive Informationsvisualisierungsmechanismen. Sankt Augustin: GMD-Studien Nr. 321, ISBN 3-88457-321-7, 1997

8 APPENDICES
- 195 -
[Leissler,1999] Leissler, M., Hemmje, M., Neuhold, E. (1999); Supporting Image-Retrieval by Data-base Driven Interactive 3D Information-Visualization, Proceedings of the VIS-UAL'99, Third International Conference on Visual Information Systems - Berlin (u.a.): Springer , 1999. (Lecture notes in computer science ; 1614), Amsterdam, The Netherlands, June 2-4, 1999
[Leissler,2000] Leissler, M., Hemmje, M., Neuhold, E. (2000) Automatic Updates of Interactive Information Visualization User Interfaces through Database Triggers, Advances in Visual Information Management: Visual Database Systems published by Kluwer Academic Publishers, 2000
[Leitner,1994] Sebastian Leitner. So lernt man lernen (Angewandte Lernpsychologie - ein Weg zum Erfolg). Weltbild Verlag GmbH, 1994.
[Lochter,1996] Frank-Axel Lochter, Rolf D. a¡ler, and Paul Morin. Interaktive exploration, 3d-visualisierung raumbezogener objekte im internet. iX, page 76., 10 1996.
[Logkue,1996] Ishantha Logkue and Stephen A. Gilbert. Structuring information with mental mod-els: A tour of boston. In Proc. CHI96.
[Mackinlay,1986] J. D. Mackinlay. Automatic Design of Graphical Presentations. Technical Report STAN-NCS-86-1138, Department of Computer Science, Stanford University, 1986.
[Martin,2000] Martin, D.; Birbeck, M.; Kay, M., ... Professional XML. Wrox Press Ldt., Birming-ham (UK); ISBN: 1-861003-11-0, 2000
[McCahill,1994] Mark P. McCahill, Thomas Erickson, A Preliminary Design for a 3-D Spatial User Interface for Internet Gopher http://www.pliant.org/personal/Tom_Erickson/GopherVR.html
[Microsoft,2003] Microsoft Web Application Stress Tutorial. http://www.microsoft.com/technet/itsolutions/intranet/downloads/webtutor.asp
[MicrosoftKB325162] Microsoft Knowledge Base Article – 325162, Support WebCast: Problem Isolation with Web-Based Applications
[Miller,1997] Nancy Miller, Beth Hetzler, Grant Nakamura, Paul Whitney. The Need For Metrics In Visual Information Analysis. Workshop on New Paradigms in Information Visu-alization and Manipulation in conjunction with the Sixth ACM International Confer-ence on Information and Knowledge Management (CIKM '97), November 13-14, 1997, Las Vegas Nevada, ACM Press
[Minas,1996] M. Minas, L. Shklar. Visualizing information repositories on the world-wide web. In J. Krause, M. Herfurth, J. Marx, editors, Herausforderungen an die Informations-wirtschaft (Proc. 5th Interanational Symposium for Information Science, ISI'96, Berlin), pages 297-309. Universitätsverlag Konstanz, Oct. 1996.
[Misue,1991] K. Misue and K. Sugiyama. Multi-viewpoint perspective display methods: Formu-lation and application to compound graphs. In 4th Intl. Conf. on Human-Computer-Interaction, volume 1, pages 834-838, Stuttgart, Germany, Sep. 1991. Elsevier.
[Mukherjea,1995,1] Sougata Mukherjea and James D. Foley. Showing the context of nodes in the world-wide web. In ACM SIGCHI 1995, Denver, Colorado, May 1995. http://www.acm.org/sigchi/chi95/Electronic/documnts/shortppr/sm2bdy.htm
[Mukherjea,1995,2] Sougata Mukherjea, James D. Foley, and Scott Hudson. Visualizing complex hyper-media networks through multiple hierarchical views. In ACM SIGCHI 1995, Denver, Colorado, May 1995. http://www.acm.org/sigchi/chi95/Electronic/documnts/papers/sm bdy.htm http://www.cc.gatech.edu/gvu/people/Phd/sougata/chi95/sm bdy.html
[Mulberry,2000] Mulberry Technologies, Inc. (2000), XSLT and XPath Quick Reference. http://www.mulberrytech.com

8.2 REFERENCES
- 196 -
[Müller,1998] Müller, U.; Leissler, M; Hemmje, M. Entwurf und Implemen-tierung eines generi-schen Mechanismus zur dynamischen Einbettung multimedialer Daten in VRML-Szenen auf der Basis eines objektrelationalen DBMS. GMD Research Series, No. 23/1998
[Müller,1999] Müller, A.; Leissler, M.; Hemmje, M.; Neuhold, E. Towards the Virtual Internet Gallery. In: Proceedings of International Conference on Multimedia ICMCS, Band 2, Los Alamitos: IEEE, S. 214-219, 1999
[Munzner,1995] Tamara Munzner and Paul Burchard. Visualizing the structure of the world wide web in 3d hyperbolic space. In Proceedings of the VRML '95 Symposium (San Diego, CA, December 14-15, 1995), pages 33-38. ACM SIGGRAPH, 1995.
[Munzner,1997] Tamara Munzner. H3: Laying out large directed graphs in 3d hyperbolic space. In Proceedings of the 1997 IEEE Symposium on Information Visualization, October 20-21 1997, Phoenix, AZ, USA.
[Murtaugh,1996] Michael Murtaugh, Elastic Catalogue, http://ic.media.mit.edu/icSite/icprojects/ElasticCatalog.html
[Myers,1996] B. Myers, J. Hollan, and I. Cruz(eds.). Strategic Directions in Human Computer Interaction. ACM Computing Surveys, 28(4), 1996.
[Najork,1995] Marc A. Najork and Marc H. Brown. Case study: Cone trees with shadows. In: IEEE Transactions on Visualization and Computer Graphics, Volume 1, Number 2, June 1995, pages 175-193
[Najork,1995] M. Najork, M. Brown, Obliq-3D: A High-Level, Fast-Turn-around 3D Animation System. IEEE Transactions on Visualization and Computer Graphics, Vol 1, No. 2, Juni 1995, pp. 175-192
[Nation,1997] David A. Nation. Visualizing websites using a hierarchical table of contents browser: Webtoc. In Proc. of 3rd Conference on Human Factors and the Web, 1997. ftp://ftp.cs.umd.edu/pub/hcil/Demos/WebTOC/Paper/WebTOC.htm
[Nelz,1999] Nelz, J., Leissler, M., Hemmje, M. (1999); Entwurf und Implementierung einer VR-Komponenten-Architektur für Visuelle Multiuser-Anwendungen, GMD Research Series, No. 17/1999
[Noik,1993] Emanuel G. Noik. Exploring large hyperdocuments: Fisheye views of nested net-works. In Hypertext '93:The 1993 ACM Conference on Hypertext and Hypermedia, pages 14-18, Seattle WA, Nov. 1993.
[North,1999] North, S.; Hermans, P. SAMS Teach Yourself XML in 21 Days. Sams, Indianapolis, Indiana (USA); ISBN: 1-57521-396-6, 1999
[Otto,1996] Katja Otto. Wissensbasierte präsentationsdarstellung. Preprints aus dem Fachbereich Informatik, Universit. at Rostock, Albert-Einstein-Str. 21, 18059 Rostock, 1996.
[Paelke,1997] Paelke, V. (1997): "Interactive Design of Animated 3D Objects", Diploma Thesis, University of Paderborn, Germany, April 1997
[Paradiso,1996] Paradiso, A.; Lorenzo, S.; Hemmje, M. Architecture and System Specification of VIRGILIO. Arbeitspapiere der GMD 991, May 1996
[Paradiso,1997] Paradiso, A.; Hemmje, M.: A Generic Refinement of the Virgilio System's Desing and a Prototypical Architecture. Arbeitspapiere der GMD 1093, September 1997
[ParallelGraphics,2001] Parallel Graphics Homepage (2001), Cortona VRML Browser. http://www.parallelgraphics.com
[Pfefferer,1996] Leo Pfefferer. Objektzentrierte Visualisierung mehrdimensionaler Daten als Erweite-rung konventioneller Datenbankmodelle. Herbert Utz Verlag Wissenschaft München, 1996.
[Philippow,1987] Eugen Philippow. Taschenbuch Elektrotechnik. VEB Verlag Technik Berlin, 1987.
8 APPENDICES
- 197 -
[Rekimoto, 1993] Jun Rekimoto and Mark Green, "The Information Cube: Using Transparencty in 3D Information Visualization" , Proceedings of the Third Annual Workshop on Informa-tion Technologies & Systems (WITS'93), pp. 125-132, 1993.
[Risch,1997] J. S. Risch, D. B. Rex, S. T. Dowson, T. B. Walters, R. A. May, and B. D. Moon, The STARLIGHT Information Visualization System, Proceedings of the IEEE Con-ference on Information Visualization, IEEE CS Press, pp. 42--49, 1997. (http://starlight.pnl.gov/)
[Risse,1998] Risse, T., Leissler, M. , Hemmje M., Aberer, K. (1998) Supporting Dynamic Infor-mation Visualization With VRML and Databases. Proceedings of CIKM '98, Work-shop on New Paradigms in Information Visualization and Manipulation, Bethesda, November 1998
[Robertson,1993] G.G. Robertson S.Card und J.D.MacKinlay, Information Visualization using 3D interactive animation In: Communication of the ACM 3 (1993), 57-71
[Roehl,1997] Roehl, B.; Couch, J.; Reed, C.; Rohaly, T.; Brown G. Late Night VRML 2.0 with Java. Ziff-Davis Press, Emeryville / CA 94608,1997
[Roth,1990] Roth, S.F. and Mattis, J.A. Data Characterization for Intelligent Graphics Presenta-tion, in Proceedings of the CHI'90 Conference (Seattle, April 1990), ACM Press, pp. 193-200
[Roth,1994,1] Roth, S.F., Kolojejchick, J., Mattis, J., and Goldstein, J., Interactive Graphic Design Using Automatic Presentation Knowledge, Proceedings of the Conference on Human Factors in Computing Systems (SIGCHI ‘94), Boston, MA, April 1994, pp. 112-l 17.
[Roth,1994,2] S. F. Roth, J. Kolojejchick, J. Mattis, and J. Goldstein. Interactive graphic design using automatic presentation knowledge. Proceedings CHI'94 Human Factors in computing Systems, ACM, April 1994, pp. 112-117.
[Roth,1994,3] S. P. Roth, J. Kolojejchick, J. Mattis, and J. Goldstein. Interactive Graphic Design Using Automatic Presentation Knowledge. In ACM SIGCHI '94, pages 112-117, 1994.
[Roth,1996] Roth S. et al. “Visage: A User Interface Environment for Exploring Information,” Proceedings Information Visualization 96, IEEE Computer Society Press.
[Rudolph,1999,1] M. Rudolph: Jamal: Components Frameworks and Extensibility. http://www.web3d.org/TaskGroups/x3d/lucidActual/jamal/Jamal.html, 1999.
[Rudolph,1999,2] M. Rudolph: X3DComponents. Web3D Consor-tium, http://www.web3d.org/TaskGroups/x3d/lucidActual/X3DComponents/X3DComponents.html, 1999.
[Sarkar,1992] Sarkar, M.; Brown, M. H. Graphical Fisheye Views of Graphs. In: Proceedings of Human Factors in Computing Systems (CHI 92), ACM Press, pp. 83-91, New York 1992
[Schönhage,2000] B. Schönhage, A. van Ballegooij, A. Eliens: 3D Gadgets for Business Process Visu-alization - A Case Study. In Proceedings of the Web3D-VRML 2000 fifth sympo-sium on the Virtual Reality Modeling Language, Seiten 131-138, 2000.
[Schumann,1997] H. Schumann S. Lange, U. Rauschenbach. Alternatives for the presentation of infor-mation in a mobile environment. 1997.
[Selman,2002] Daniel Selman, Java 3D Programming, Manning Publications Co., March 2002
[Shneiderman,1992] B. Shneiderman. Tree visualization with tree-maps: A 2-d space filling approach. ACM Transaction on Graphics, Jan. 1992.
[Shneiderman,1994] B. Shneiderman. Dynamic Queries for Visual Information Seeking. IEEE Software, 11(6):70-77, 1994.

8.2 REFERENCES
- 198 -
[Shneiderman,1996] Ben Shneiderman. The eyes have it: A task by data type taxonomy for information visualization. Proc. IEEE Symposium on Visual Languages '96, IEEE, pages 336-343, Sep. 1996. os Alamos, CA.
[Shout3D,2001] Shout3D Homepage (2001), Shout X3D-Viewer. http://www.eyematic.com/products_shout3d.html
[Spoerri,1993] Spoerri, Anselm, InfoCrystal: A visual tool for information retrieval. Proc. IEEE Visualization `93, pp. 150-157, 1993
[Sprenger,1997] T. C. Sprenger, M. H. Gross, A. Eggenberger, and M. Kaufmann. A framework for physically-based information visualization. In 8th EG Workshop on ViSC. Boulogne sur Mer, 28-30 April, 1997.
[Springmeyer,1996] Rebecca Springmeyer, Nancy Werner, Jeffery Long, and Lawrence Livermore. Min-ing scientific data archives through metadata generation. In First IEEE Metadata Conference, NOAA Auditorium, Silver Spring, Maryland, April 16-18 1996.
[Srinivasan,1997] Sriram Srinivasan. Advanced Perl Programming. OReilly and Asscociates, Inc., first edition, 1997. ISBN: 1-56592-220-4 http://www.ora.com/catalog/advperl/
[Steinmetz,1993] Ralf Steinmetz. Multimedia Technologie, Einführung und Grundlagen. Springer Verlag, 1993.
[Stevens,1994] M. Stevens, R. C. Zeleznik, J. F. Hughes, An Architecture for an Extensible 3D In-terface Toolkit. Proceedings of UIST’94, pp. 59-67.
[Strauss,1992] P. Strauss, R. Carey, An object-oriented 3D graphics toolkit. SIGGRAPH’92 Proceedings, Vol. 26, No. 2, pp. 341-349.
[Sun,1998] Sun Microsystems, Inc., Java 3D API Specification, Version 1.1, Feb. 1998
[Takahashi,1994] Takahashi, Miyashita, Matsuoka, Yonezawa, A Framework for Constructing Anima-tions via Declarative Mapping Rules, Proceedings of IEEE Symposium on Visual Languages, St. Louis, pp.314-322, 1994.
[Takahashi,1998] S. Takahashi, S. Matsuoka, K. Miyashita, H. Hosobe, T. Kamada. A Constraint-Based Approach for Visualization and Animation. Constraints , 3(1), 61-86, 1998
[Teittinen,1994] Marko Teittinen, Winsurfer ™ for Windows, http://www.cs.umd.edu/hcil/pubs/winsurfer.shtml
[Tesler,1992] Joel Tesler and Steve Strasnick. Fsn: The 3d _le system navigator. Technical report, Silicon Graphics, Inc., Mountain View, CA, 1992.
[Thompson,1998] David Thompson, Jeff Braun, Ray Ford, OpenDX: Paths to Visualization, Vis Inc., 1998
[Trapp,1997] J.C. Trapp and H.-G. Pagendarm, A Prototype for a WWW-based Visualization Service, Proc. Eighth Eurographics Workshop Visualization in Scientific Computing, 1997.
[Treinish,1995] Lloyd A. Treinish, Visualization of Stratospheric Ozone Depletion and the Polar Vortex, IBM Thomas J. Watson Research Center Yorktown Heights, NY, http://www.research.ibm.com/dx/proceedings/cart/ozone.htm
[Tufte,1983] E. R. Tufte. The Visual Display of Quantitative Information. Graphics Press., Cheshire, Conn., 1983.
[Tufte,1990] E. R. Tufte. Envisioning Information. Graphics Press., Cheshire, Conn., 1990
[Turo,1994] David Turo. Hierarchical visualization with treemaps: Make sense of pro basketball data. ACM CHI '94 Conference Companion, pp 441-442.
[Tversky,1993] Tversky, O. J., Snibbe, S. S. and Zeleznik, R., Cone Trees in the UGA Graphics System: Suggestions for a More Robust Visualization Tool, Technical Report CS-93-07, Brown University, 1993.
8 APPENDICES
- 199 -
[W3C,1998] XML-Data. W3C Note 05 Jan 1998, http://www.w3.org/TR/1998/NOTE-XML-data/
[W3C,1999,1] W3 Consortium (1999), XML Path Language (XPath) Version 1.0 -W3C Recom-mendation. http://www.w3.org/TR/1999/REC-xpath-19991116.htm
[W3C,1999,2] W3 Consortium (1999), XSL Transformations (XSLT) Version 1.0 -W3C Recom-mendation. http://www.w3.org/TR/1999/REC-xslt-19991116.htm
[W3C,2000] W3 Consortium (2000), Extensible Markup Language (XML) Ver-sion 1.0 (Second Edition) - W3C Recommendation. http://www.w3.org/TR/2000/REC-xml-20001006.htm
[Wall,1996] Larry Wall, Thom Christiansen, and Randal L. Schwartz. Programming Perl. OReilly and Associates, Inc., second edition, 1996. ISBN: 1-56592-149-6 http://www.ora.com/catalog/pperl2/pover.html
[Watsen,1998] Watsen, K. and Zyda, M., “Bamboo – A Portable System for Dynamically Extensi-ble, Real-Time, Networked, Virtual Environments”, Proc. IEEE Virtual Reality An-nual International Symposium (VRAIS’98), Atlanta, March 1998
[Watt,2003] Alan Watt, Fabio Policarpo, 3D Games (Volume 2), Addison Wesley, 2003
[Web3D,1997] Web3D Consortium (1997), VRML97 Specification, ISO/IEC14772-1:1997. http://www.web3d.org/technicalinfo/specifications/vrml97/index.htm
[Weerawarana,1999] Sanjiva Weerawarana, Matthew Duftler and Joseph Kesselman, Bean Markup Lan-guage http://www.alphaworks.ibm.com/aw.nsf/techmain/62258CBABEB860F8882566F300703F81?OpenDocument, IBM Watson Research Center, 1999
[Weitzman,1993] L. Weitzman and K. Wittenburg. Relational Grammars for Interactive Design. In IEEE Symposium on Visual Languages, pages 4-11, 1993.
[Wendt,1991] Siegfried Wendt. Nichtphysikalische Grundlagen der Informatinstechnik. Springer-Verlag, 1991.
[Wood,1995] Andrew Wood, Nick Drew, Russell Beale, Bob Hendley, Hyperspace: Web Brows-ing with Visualisation. Proceedings of 3rd International WWW conference, Darm-stadt, Germany. 1995.
[Wünsche,1997] Wünsche, Veikko.Visualisierung strukturierter Informationen mit VRML. Diplomar-beit, Universität Rostock, Fachbereich Informatik, November 1997
[XDR,1998] XML-Data reduced. DRAFT Last update: 3 July 1998 Version 0.21. http://www.ltg.ed.ac.uk/~ht/XMLData-Reduced.htm
[Zeleznik,1991] R. C. Zeleznik et al., An object-oriented framework for the integration of interactive animation techniques. Proceedings of SIGGRAPH’ 91, Vol. 25, No. 4, pp. 105-112.
[Zeleznik,1993] R. C. Zeleznik et al., An Interactive 3D Toolkit for Constructing 3D Widgets. Pro-ceedings of SIGGRAPH’93, pp. 81-84.
[Zloof,1976] M. M. Zloof. Query-By-Example : Operations on the Transitive Closure. Technical Report RC 5526 (Revised), IBM, Yorktown Hts., N.Y., 1976.

8.2 REFERENCES
- 200 -
Curriculum Vitae Martin Leissler born on the 17th of April 1969 in Washington D.C., U.S.A. Married, 2 Children (4 and 1 years)
Address: Hugenottenallee 15, 63263 Neu Isenburg Nationality: U.S., German Telefon: +49 160 7248069 e-mail: [email protected]
Professional Experience
09/1997 – 8/2003 Fraunhofer Gesellschaft - IPSI, Darmstadt (formerly GMD) Scientific Associate
Candidate for doctorate degree in engineering (graduation pre-sumably end of 2003)
Design and development of software in the areas of visualization, multimedia, graphical user interfaces, DBMS, and WWW. Since 2000 management of EU and government funded as well as in-dustry related research projects. Since 2001 acquisition of gov-ernment and industry funded research projects. Member of the institutes executive committee since 9/2001.
Management of the foundation of an IPSI spin-off company, crea-tion of a business plan and financial plan, coordination of an out-sourced country-wide market study.
Guidance of university courses and supervision of several di-ploma theses at the Darmstadt University of Technology. Numer-ous scientific publications.
08/2000 – 12/2001 GLOBIT – Global Information Technology GmbH, Darmstadt IT Consultant (freelance, sideline job)
Consulting and planning for the implementation of a distributed media asset management system for the largest German TV-Broadcast company (ARD).
05/1997 – 08/1997 GLOBIT – Global Information Technology GmbH, Darmstadt Software developer
Development of components for Web-based congress and trade fair information systems with database back-end.
08/1994 – 04/1997 GMD – German National Research Center for Information Technology, Darmstadt Temporary scientific student worker (during studies)
Design and development of distributed 3D visualization applica-tions and virtual TV-studio software.

8 APPENDICES
- 201 -
02/1996 – 12/1996 BITservice GmbH, Bad Homburg Technical support assistant (during studies)
Analysis of hardware and software bugs. Installation and configu-ration of PC-systems and networks, on-site service.
1993 AUDIOS GmbH, Langen Software developer (during studies)
Development of commercial computer games in assembler.
Education at University
8/2003 Submission of complete Ph.D. Thesis “A Generic Framework for the Development of 3D Information Visualization Applications”
Ph.D. Degree (Doctorate degree in engineering) presumably achieved end of 2003
10/1989 – 04/1997 Darmstadt University of Technology Computer Science (CS faculty is ranked 2nd nationwide in 2004 Spiegel ranking).
‘Diplom’ in Computer Science (~M.S.) with average mark of 1.7 (on a scale from 1=’very good’ to 5=’failed’)
Major Courses: Operating Systems, Computer Graphics, Soft-ware Engineering, Coding Theory Minor Courses: Software Ergonomics, Cognitive Psychology
Military Service
07/1988 – 09/1989 Basic military service in Wetzlar und Herborn, Germany
Education at School
1979 – 1988 Freiherr-Vom-Stein Gymnasium in Frankfurt, Germany
1978 – 1979 Elementary school in Frankfurt, Germany
1975 – 1977 German School of Washington D.C., USA
1974 – 1975 Elementary school in Rome, Italy