Taxation, foreign aid and political governance: figures to the facts of a celebrated literature
Upload
khangminh22Category
view
1download
0
MSDs facts and figures overview: prevalence, costs and demographics of MSDs in Europe Draft National Report: France
European Agency for Safety and Health at Work – EU-OSHA 1
ISSN: 1831-9343
Work-related musculoskeletal disorders – Facts and figures Synthesis report (of 10 national reports)
European Agency for Safety and Health at Work
Work-related MSDs: Facts and Figures — Synthesis report of 10 EU Member States reports
European Agency for Safety and Health at Work – EU-OSHA 2
Author: Iñigo Isusi (IKEI).
Project management: Lorenzo Munar (EU-OSHA).
This report was commissioned by the European Agency for Safety and Health at Work (EU-OSHA). Its contents, including any opinions and/or conclusions expressed, are those of the author(s) alone and do not necessarily reflect the views of EU-OSHA.
ISBN 978-92-9479-148-1
doi:10.2802/443890
More information on the European Union is available on the internet (http://europa.eu).
Cataloguing data can be found on the cover of this publication.
Luxembourg: Publications Office of the European Union, 2020 © European Agency for Safety and Health at Work, 2020
Reproduction is authorised provided the source is acknowledged.
Europe Direct is a service to help you find answers to your questions about the European Union
Freephone number (*):
00 800 6 7 8 9 10 11
(*) Certain mobile telephone operators do not allow access to 00 800 numbers, or these calls may be billed.

Work-related MSDs: Facts and Figures — Synthesis report of 10 EU Member States reports
European Agency for Safety and Health at Work – EU-OSHA 3
Table of contents List of figures and tables ......................................................................................................................... 4
Summary ................................................................................................................................................ 7
1 Introduction ................................................................................................................................ 13
1.1 Background ................................................................................................................................ 13
1.2 Causes and consequences of MSDs: a framework .................................................................. 14
1.2.1 Main sources of information on MSDs ............................................................................ 14 1.2.2 A multidimensional model of MSDs ................................................................................ 14
2 Prevalence of MSDs .................................................................................................................. 16
2.1 Self-reported MSDs ................................................................................................................... 16
2.2 MSD-related occupational diseases and accidents at work ...................................................... 23
2.2.1 Reported/recognised MSD-related occupational diseases ............................................ 24 2.2.2 MSD-related accidents at work ....................................................................................... 43
3 Impact of MSDs ......................................................................................................................... 46
3.1 Austria ........................................................................................................................................ 46
3.2 Finland ....................................................................................................................................... 48
3.3 France ........................................................................................................................................ 49
3.4 Germany .................................................................................................................................... 49 3.5 Hungary ..................................................................................................................................... 53
3.6 Netherlands ............................................................................................................................... 53
3.7 Spain .......................................................................................................................................... 55
3.8 Sweden ...................................................................................................................................... 56
4 Risk factors for MSDs ................................................................................................................ 58
4.1 Physical factors at work ............................................................................................................. 58 4.1.1 Denmark ......................................................................................................................... 58
4.1.2 Finland ............................................................................................................................ 59
4.1.3 France ............................................................................................................................. 59
4.1.4 Germany ......................................................................................................................... 61
4.1.5 Netherlands ..................................................................................................................... 61
4.1.6 Spain ............................................................................................................................... 63 4.1.7 Sweden ........................................................................................................................... 65
4.2 Organisational and psychosocial risk factors ............................................................................ 66
4.2.1 Austria ............................................................................................................................. 66
4.2.2 Sweden ........................................................................................................................... 66
4.2.3 France ............................................................................................................................. 67 4.2.4 Italy ................................................................................................................................. 72
4.2.5 Netherlands ..................................................................................................................... 74
5 Prevention of MSDs ................................................................................................................... 78
Work-related MSDs: Facts and Figures — Synthesis report of 10 EU Member States reports
European Agency for Safety and Health at Work – EU-OSHA 4
List of figures and tables Figure 1: Theoretical framework of work-related MSDs .................................................................. 15
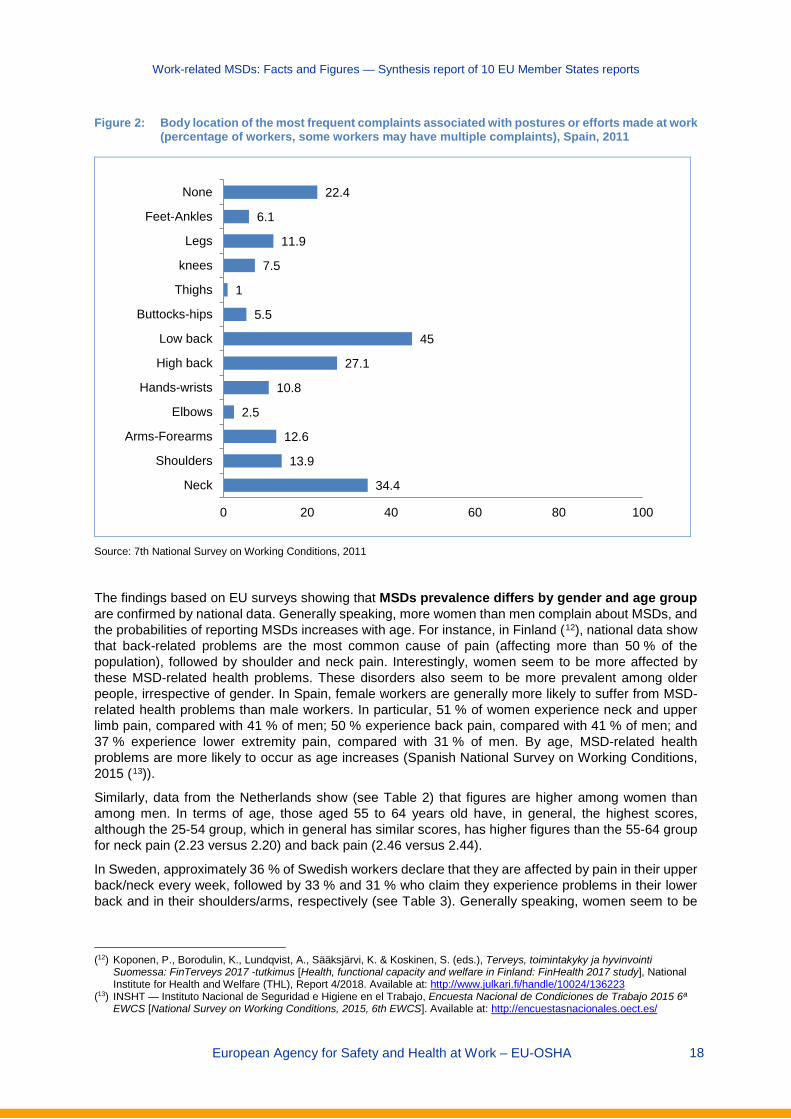
Figure 2: Body location of the most frequent complaints associated with postures or efforts made at work (percentage of workers, some workers may have multiple complaints), Spain, 2011 ................................................................................................................................. 18
Figure 3: Newly granted sickness compensation, distributed by type of diagnosis, 2003-2017......... ......................................................................................................................................... 30
Figure 4: Distribution of new recognised MSD-related occupational diseases by gender and age, France, 2016 .................................................................................................................... 32
Figure 5: Incidence rate of occupational diseases resulting in sick leave and caused by physical factors (group 2), by economic sectors, Spain, 2017 ...................................................... 41
Figure 6: Distribution (%) of work accidents by type of disease, Sweden, 2017 ............................ 44
Figure 7: Percentage of workers exposed to extra physical efforts, by economic sector, Spain, 2011 ................................................................................................................................. 65
Figure 8: Workers’ perception of psychosocial risks for health and security at work, Italy, 2014 ... 73
Table 1: Percentage of employees affected by MSDs during work in the past 12 months and percentage of them undergoing medical treatment because of the MSD, by type of MSDs, Germany, 2012 ................................................................................................................... 16
Table 2: Percentages of workers (excluding self-employed) experiencing complaints (pain/discomfort) affecting different parts of the body in the past 12 months, by gender and age, Netherlands, 2017 (from 1, never, to 5, multiple times, for a sustained period of time) ................................................................................................................................ 17
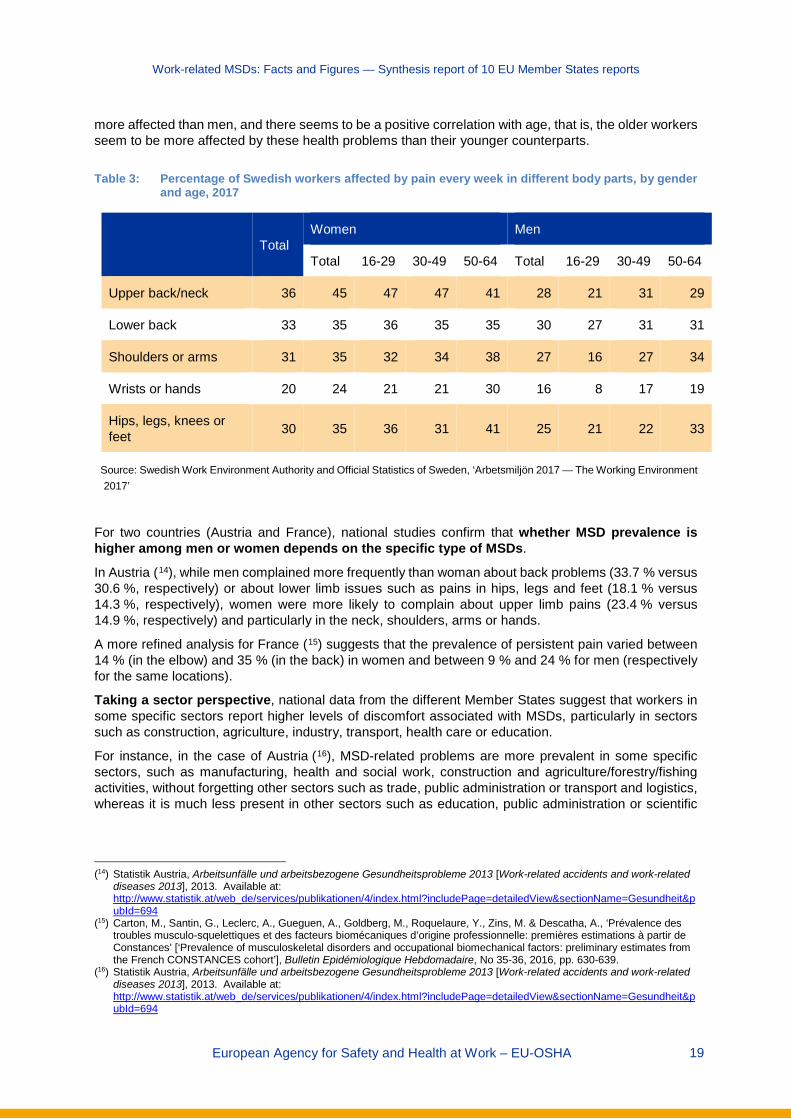
Table 3: Percentage of Swedish workers affected by pain every week in different body parts, by gender and age, 2017 ......................................................................................................... 19
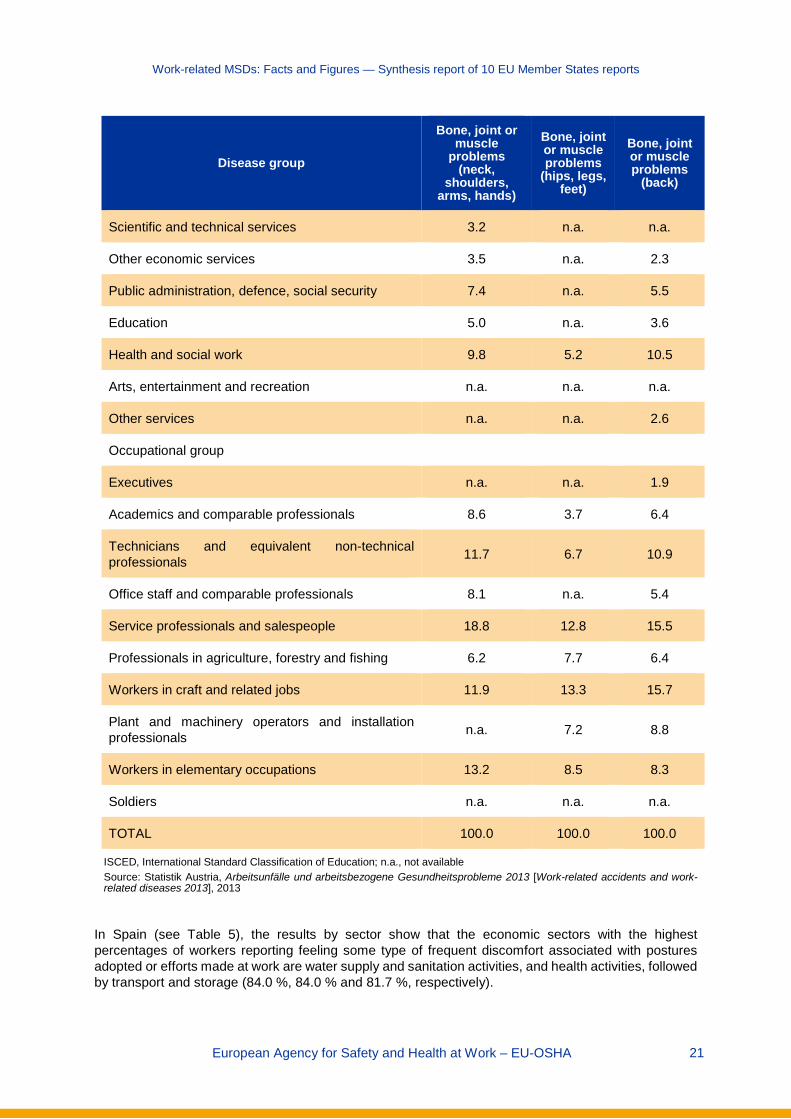
Table 4: Percentages of workers with a work-related MSD, by type of MSD and individual characteristics, level of education, economic sector and occupational group in Austria, 2013 .................................................................................................................................... 20
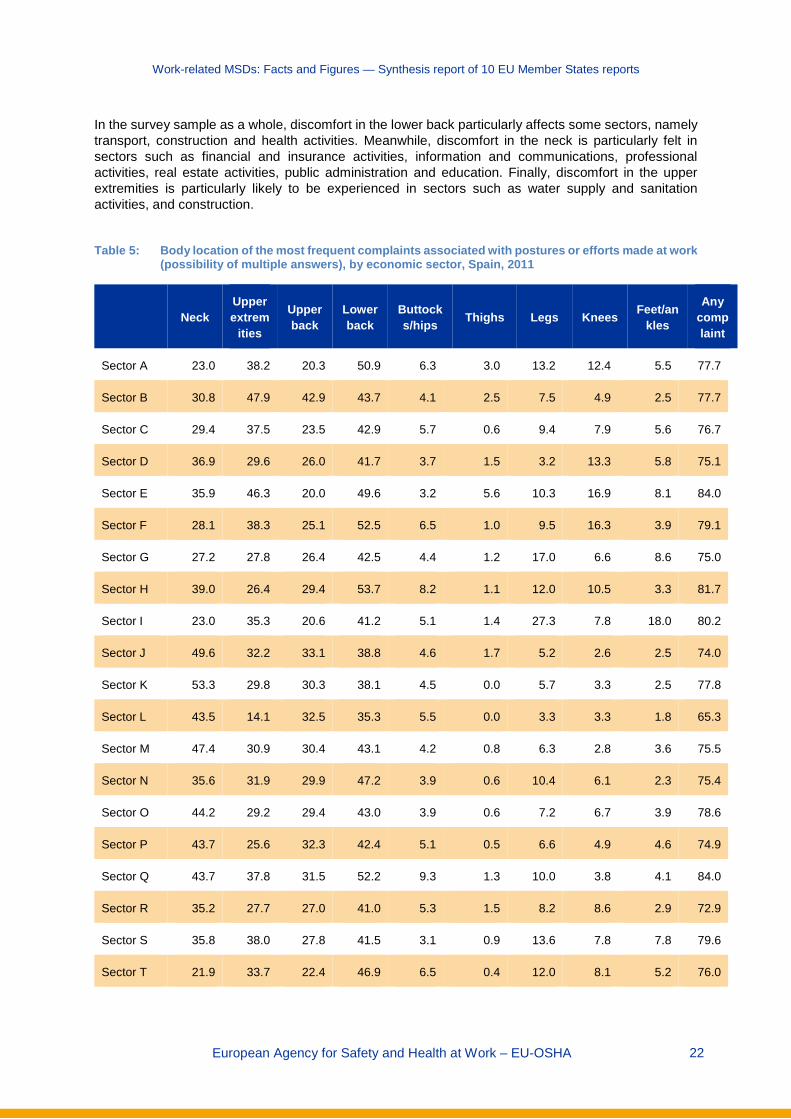
Table 5: Body location of the most frequent complaints associated with postures or efforts made at work (possibility of multiple answers), by economic sector, Spain, 2011 ....................... 22
Table 6: Percentage of temporary and non-temporary agency workers with health complaints during or immediately after work, in Germany, 2012 .......................................................... 23
Table 7: Number of workers affected by MSDs reported as occupational diseases, by group of diseases, Denmark, 2013-2016 .......................................................................................... 24
Table 8: Number of workers affected by MSDs reported as occupational diseases by part of the body affected, Denmark, 2013-2016 ................................................................................... 25
Table 9: Recognised occupational diseases and Incidence (cases per 100,000 insured persons), France, 2016 ....................................................................................................................... 26
Table 10: Number of recognised occupational diseases related to the musculoskeletal system, by degree of incapacity, Italy, 2014-2017 ................................................................................ 27
Table 11: Most commonly reported MSD-related occupational diseases, Netherlands, 2013-2016 .. 28
Table 12: Number of recognised cases of occupational disease resulting in sick leave and average duration (days), by group of occupational diseases, Spain, 2011-2017 ............................. 29

Work-related MSDs: Facts and Figures — Synthesis report of 10 EU Member States reports
European Agency for Safety and Health at Work – EU-OSHA 5
Table 13: Prevalence of selected illnesses (treated or detected by a doctor) in the past year, and by sex and age (%), Finland, 2014 ..................................................................................... 31
Table 14: Number of recognised occupational diseases, by gender and type of disease, Italy, 2014-2017 ........................................................................................................................... 34
Table 15: Main recognised occupational diseases related to the musculoskeletal system, by gender, Italy, 2014-2017 ..................................................................................................... 35
Table 16: Distribution of reported MSD-related occupational diseases, by gender, age and sector, Netherlands, 2013-2016 (%) ............................................................................................... 37
Table 17: Number of recognised cases of occupational diseases resulting in sick leave and caused by physical agents (Group 2), distributed by gender and age, Spain, 2011-2017 ............. 38
Table 18: Occupational diseases reported that are connected to MSDs () per 1,000 employees, by gender, Sweden, 2017 ................................................................................................... 38
Table 19: Incidence of MSDs recognised as occupational diseases per 100,000 insured persons, by economic sectors, France, 2016 .................................................................................... 39
Table 20: Number of recognised occupational diseases related to the musculoskeletal system by sector, Italy, 2017 ................................................................................................................ 41
Table 21: Occupational diseases reported that are connected to MSDs per 1,000 employed, by economic sector, Sweden, 2017 ......................................................................................... 42
Table 22: Number of recognised occupational diseases related to the musculoskeletal system, by occupation, Italy, 2015-2017 ............................................................................................... 43
Table 23: Work accidents resulting in sick leave, by contact – mode of injury, Spain, 2017 ............. 44
Table 24: Work accidents caused by musculoskeletal overload and resulting in sick leave, by type of occupation, Spain, 2014-2017 ........................................................................................ 45
Table 25: Percentage of new health-related retirement pensions related to different diseases in Austria, by gender 2001-2006 ............................................................................................. 46
Table 26: Percentages of sick leave cases and sick leave days and average duration of sick leave in Austria, by type of disease, 2016 .................................................................................... 47
Table 27: Loss of production and gross added-value by different diagnosis disease groups, Germany, 2016 ................................................................................................................... 50
Table 28: MSD-related sick leave days (days per full-time equivalent membership year of statutory health insurance), by gender and age, Germany, 2016 ..................................................... 50
Table 29: Numbers of sick leave cases and days taken due to MSDs in Germany, by gender and type of MSD, 2016 .............................................................................................................. 51
Table 30: Sick leave cases due to MSDs in Germany, by employment status, 2016 ........................ 52
Table 31: Number of MSD patients and benefits (in euros) paid by NEAK by type of MSD in Hungary, 2015-2017 ........................................................................................................... 53
Table 32: Main reasons for the last sick leave taken among workers (excluding the self-employed), by gender and age, Netherlands, 2017 (%) ........................................................................ 54
Table 33: Main reasons for taking sick leave the last time among workers (excluding the self-employed), by economic sector, Netherlands, 2017 (%) .................................................... 55
Table 34: Total costs and allocations of costs for MSDs in Sweden .................................................. 57
Table 35: Percentages of workers affected by MSDs who believe that their MSD is caused and/or aggravated by work, and percentages of workers visiting a doctor because of an MSD, by location of pain, Spain, 2011 .......................................................................................... 58
Work-related MSDs: Facts and Figures — Synthesis report of 10 EU Member States reports
European Agency for Safety and Health at Work – EU-OSHA 6
Table 36: Main sectors affected by specific occupational risks (percentages of sector employees exposed to those risks), France, 2010 ................................................................................ 60
Table 37: Percentage of employees reporting working frequently under certain working conditions and percentage (*) bothered by those conditions in Germany, 2012 ................................. 61
Table 38: Physical factors affecting Dutch workers (excluding self-employed) by gender and age, 2017 .................................................................................................................................... 62
Table 39: Number of recognised cases of occupational diseases resulting in sick leave and caused by physical factors (Group 2), by type of physical factor, Spain, 2011-2017...................... 63
Table 40: Main risk factors for work-related MSDs, 2013, Austria ...................................................... 66
Table 41: Percentages of Swedish workers affected by several psychosocial risk factors at some point in the past 12 months, by gender and age, 2017....................................................... 67
Table 42: Percentages of workers exposed to certain labour intensity and time pressure risk factors, 1984, 1991, 1998, 2005, 2013 and 2016 ............................................................... 69
Table 43: Percentages of workers exposed to certain mental load, ethical conflict and job insecurity risk factors, 2013 and 2016 ................................................................................ 71
Table 44: Percentages of workers exposed to certain psychosocial risks in 2013, according to employers ............................................................................................................................ 72
Table 45: Psychosocial factors affecting work among Dutch workers (excluding self-employed), by gender and age, 2017 ......................................................................................................... 74
Table 46: Psychosocial factors affecting Dutch workers (excluding the self-employed), by economic sector, 2017 ........................................................................................................ 75
Table 47: Most common psychosocial health risk factors in companies as suggested by company managers, 2016 (%)............................................................................................................ 77
Table 48: Measures implemented to reduce risks at work in the past 2 years as suggested by company managers, Netherlands, 2016 (%) ...................................................................... 78
Table 49: Measures implemented to reduce risks at work in the past 2 years as suggested by company managers, Netherlands, 2016 (%) ...................................................................... 79
Work-related MSDs: Facts and Figures — Synthesis report of 10 EU Member States reports
European Agency for Safety and Health at Work – EU-OSHA 7
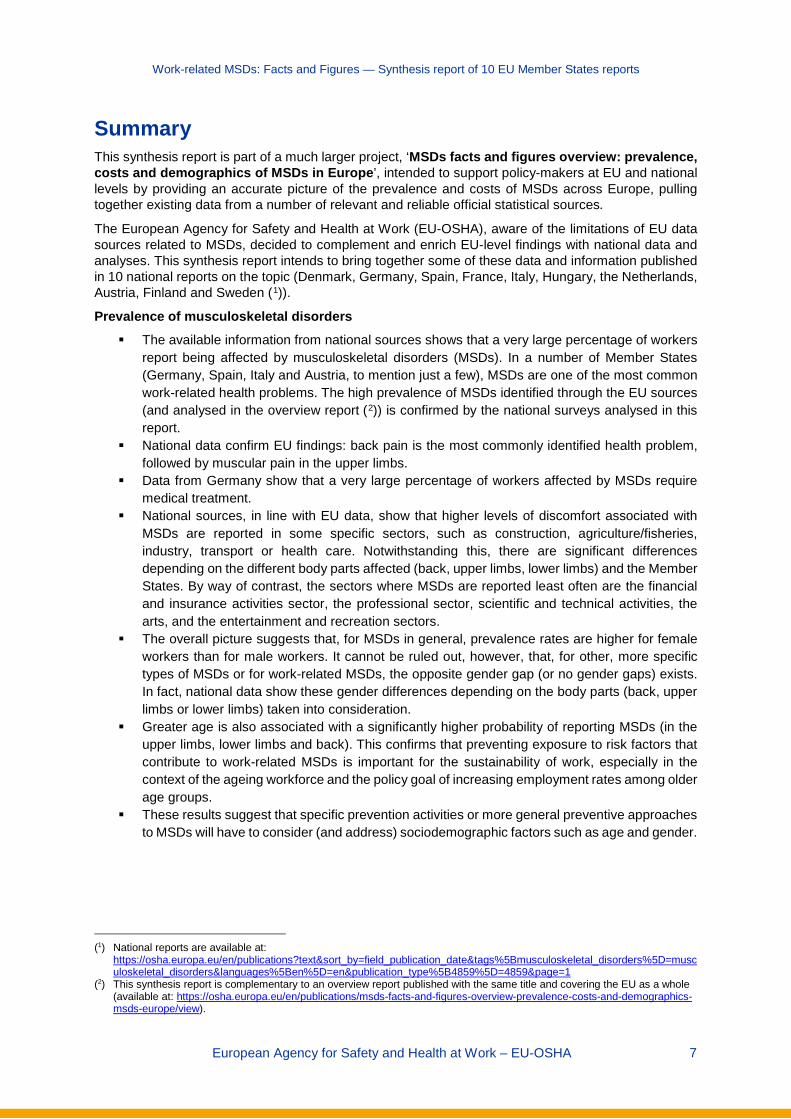
Summary This synthesis report is part of a much larger project, ‘MSDs facts and figures overview: prevalence, costs and demographics of MSDs in Europe’, intended to support policy-makers at EU and national levels by providing an accurate picture of the prevalence and costs of MSDs across Europe, pulling together existing data from a number of relevant and reliable official statistical sources.
The European Agency for Safety and Health at Work (EU-OSHA), aware of the limitations of EU data sources related to MSDs, decided to complement and enrich EU-level findings with national data and analyses. This synthesis report intends to bring together some of these data and information published in 10 national reports on the topic (Denmark, Germany, Spain, France, Italy, Hungary, the Netherlands, Austria, Finland and Sweden (1)).
Prevalence of musculoskeletal disorders The available information from national sources shows that a very large percentage of workers
report being affected by musculoskeletal disorders (MSDs). In a number of Member States (Germany, Spain, Italy and Austria, to mention just a few), MSDs are one of the most common work-related health problems. The high prevalence of MSDs identified through the EU sources (and analysed in the overview report (2)) is confirmed by the national surveys analysed in this report.
National data confirm EU findings: back pain is the most commonly identified health problem, followed by muscular pain in the upper limbs.
Data from Germany show that a very large percentage of workers affected by MSDs require medical treatment.
National sources, in line with EU data, show that higher levels of discomfort associated with MSDs are reported in some specific sectors, such as construction, agriculture/fisheries, industry, transport or health care. Notwithstanding this, there are significant differences depending on the different body parts affected (back, upper limbs, lower limbs) and the Member States. By way of contrast, the sectors where MSDs are reported least often are the financial and insurance activities sector, the professional sector, scientific and technical activities, the arts, and the entertainment and recreation sectors.
The overall picture suggests that, for MSDs in general, prevalence rates are higher for female workers than for male workers. It cannot be ruled out, however, that, for other, more specific types of MSDs or for work-related MSDs, the opposite gender gap (or no gender gaps) exists. In fact, national data show these gender differences depending on the body parts (back, upper limbs or lower limbs) taken into consideration.
Greater age is also associated with a significantly higher probability of reporting MSDs (in the upper limbs, lower limbs and back). This confirms that preventing exposure to risk factors that contribute to work-related MSDs is important for the sustainability of work, especially in the context of the ageing workforce and the policy goal of increasing employment rates among older age groups.
These results suggest that specific prevention activities or more general preventive approaches to MSDs will have to consider (and address) sociodemographic factors such as age and gender.
(1) National reports are available at:
https://osha.europa.eu/en/publications?text&sort_by=field_publication_date&tags%5Bmusculoskeletal_disorders%5D=musculoskeletal_disorders&languages%5Ben%5D=en&publication_type%5B4859%5D=4859&page=1
(2) This synthesis report is complementary to an overview report published with the same title and covering the EU as a whole (available at: https://osha.europa.eu/en/publications/msds-facts-and-figures-overview-prevalence-costs-and-demographics-msds-europe/view).
Work-related MSDs: Facts and Figures — Synthesis report of 10 EU Member States reports
European Agency for Safety and Health at Work – EU-OSHA 8
MSD-related occupational diseases and accidents at work Because of institutional differences between the national compensation and reporting systems
used to register (the cause of) occupational diseases, available data are not comparable across Member States. Country differences are less likely to reflect country differences in the prevalence of occupational diseases than to be related to:
o the reporting systems themselves (list of recognised diseases and so on); o the consequences of reporting; o the institutional context, and; o claimants’ knowledge of these issues (the chances of the disease being recognised as
work related, the benefits and compensation of recognition, changes in legislation and so on).
Thus, recognised diseases and recognition practices vary considerably between Member States. In any case, available data for several Member States suggest that MSDs are the most commonly recognised occupational diseases in some of these Member States (namely Spain, France or Italy).
From gender and age perspectives, the available national data show that diagnosed cases of MSDs and recognised occupational diseases seem to concern more women and older workers (despite differences between Member States).
Despite existing national differences, reported/recognised cases of MSDs seem to be more present in some specific sectors (such as extractive industries, manufacturing, construction, agriculture/fisheries or transport activities).
As far as occupational categories are concerned, available national evidence confirms that both recognised occupational diseases related to MSDs and MSD-related work accidents are more prevalent (at least in absolute numbers) in some specific occupations such as craft, skilled and agricultural workers, plant and machine operators, assemblers or elementary occupations.
The pattern and distribution of occupational diseases currently recognised and compensated is far from reflecting the actual health impairment of workers through MSDs caused by their work.
National data from Spain and Sweden show the important role that MSD-related work accidents play in relation to the total of work accidents. In Spain (data from 2017), around 38 % of work accidents were caused by musculoskeletal overload. In Sweden (data from 2017), MSDs were the most common work-related source of work accidents for men (40 % of their reported work accidents relate to MSDs) and the second most common (after psychosocial diseases) for women (28%).
Impact of MSDs
MSDs have a substantial impact not only on workers’ well-being in daily life but also in economic terms, as they lead to a loss of productivity at work and social expenses (for instance sick leave expenses). There is an extensive amount of national-based information in several EU Member States that tries to quantify the economic impacts derived from MSDs, in terms of both direct costs (contributions and compensations paid by companies, costs paid for health care and medicines, and so on) and (in some cases) indirect costs (disruptions in working teams, decreases of productivity, production delays, losses of production caused by reduced ability to work and sick leave, and so on).
In Austria, MSDs were (in 2001-2006) the main cause underlying new health-related retirement pensions (followed by mental/behavioural disorders and diseases of the circulatory system). Data from Austria also suggest that MSDs represent the third most frequent reason for sick leave.
According to the Finnish social security system (KELA) data for 2017, Finland incurred EUR 63.8 million in medical expenses related to MSDs, of which EUR 28.6 million was reimbursed by KELA. In total, more than 1.4 million recipients benefited from 3.1 million MSD-

Work-related MSDs: Facts and Figures — Synthesis report of 10 EU Member States reports
European Agency for Safety and Health at Work – EU-OSHA 9
related prescriptions; the cost per MSD-related prescription was EUR 20.90 and the average reimbursement per prescription was EUR 9.40.
In France, work-related lower back pain resulted in 12.2 million lost work days, or 57,000 full-time equivalents. Estimates of the direct annual costs borne by companies exceed EUR 1 billion per year through their contributions to occupational accidents and diseases, while more than half (EUR 580 million) is related to sick day compensation (data for 2017). Indirect costs – although difficult to quantify – could be up to 10 times higher.
In Germany, according to the Federal Institute for Occupational Safety and Health, MSDs generate higher costs than any other disease diagnosis group. It is estimated that EUR 17.2 billion production loss (production loss costs based on labour costs) and EUR 30.4 billion loss of gross value added (loss of labour productivity) arise from diseases of the musculoskeletal system. This represents 0.5 % and 1.0 % of Germany’s gross domestic product (GDP), respectively (data for 2016).
In Hungary, the MSD-related benefit paid in 2017 amounted to EUR 360,867,297, paid to more than 2.8 million patients. The number of patients remained relatively stable during the period 2015-2017, whereas the amount of benefits saw a remarkable upward trend.
In the Netherlands, information from the National Working Conditions Survey in 2017 shows that the main reason for Dutch workers (excluding the self-employed) to take sick leave was influenza or common cold (35 % of cases), followed by complaints of the digestive system (6 %) and back complaints (5 %). For self-employed workers, the main reason for taking sick leave was again influenza/common cold (31 %), followed by back complaints (8 %) and complaints of the neck, shoulders, arms and so on (5.5 %).
Information from Germany and the Netherlands shows which economic sectors (agriculture, food industry, construction, industry, metal manufacturing and transport/storage, among others) have the highest percentage of workers suffering from MSDs that result in sick leave. German evidence shows that the days of absence due to musculoskeletal disorders among workers with low levels of education and in elementary occupations are significantly higher than among those with higher degrees.
Having in mind the enormous economic and social costs associated with MSDs together with the increasingly ageing population, MSD-related costs are very likely to increase significantly in the future, so priority should be given to research on the most cost-effective prevention and treatment strategies to deal effectively with them.
Work-related risk factors for MSDs There are a number of physical, organisational, psychosocial and sociodemographic work-
related risk factors that contribute to the onset of MSDs or to aggravating existing ones. To start with, for a relatively high percentage of European workers, their work implies high
physical demands. Available studies have established a positive link between these physically tough working conditions and their negative influences on the locomotor system, resulting in a significant number of workers suffering from or complaining about musculoskeletal pain.
o In Finland, work is reported to be very physically demanding by 6.9 % of workers. o In France, the Medical Surveillance of Occupational Risk Exposures (Surveillance
médicale des expositions aux risques professionnels — SUMER) survey shows that the most frequent occupational risk is postural and joint constraints, which affect 74.6 % of men and 73.9 % of women, followed by standing or working upright in a fixed location (48.6 % of men and 42.9 % of women), walking during work (47.5 % of men and 34.5 % of women) and manual load handling (44.1 % of men and 29.0 % of women).
o In Germany, according to the Federal Institute for Vocational Education and Training (BIBB)/BAuA Employee Survey 2012, 54.4 % of employees report working frequently in an upright position, 48.4 % report that their work involves repetitive tasks and 41.8 %
Work-related MSDs: Facts and Figures — Synthesis report of 10 EU Member States reports
European Agency for Safety and Health at Work – EU-OSHA 10
regularly use their hands in work demanding highly rapid movements or considerable strength.
o In the Netherlands, the survey of working conditions among employers (WEA) provides information on the main physical health risks that are present in companies, as suggested by company managers (2016 data). The risk with the highest prevalence is physical workload (pushing, pulling and lifting), identified by 34.6 % of company managers, followed by visual display unit (VDU) work (28.6 %) and static working posture (14.1 %).
o In Sweden, according to the Swedish Work Environment Authority, around 50 % of men and 47 % of women stated that they work with physically exhausting job assignments. Two out of 10 work in a forward leaning position, without support from the hands. Some 7 % work with tasks that make the entire body shake, and around 50 % had been in physical pain when finishing work at least once per week during the past 3 months.
o Workers involved in some specific economic sectors (building and construction, primary activities, accommodation/catering, transport, health/daycare/nursery activities and so on) are more exposed to MSD-related physical factors.
In addition to physical risk factors, there are several other organisational and psychosocial risk factors that may have an impact on the musculoskeletal health of workers.
o In Austria, available data show that a psychosocial/organisational factor is a particularly important risk factor for MSD-related health problems: significant time pressure/work overload. Another relevant psychosocial risk factor is harassment/bullying in the workplace.
o National evidence from Sweden shows that more than half of Swedish workers experienced some form of conflict with boss or peers in the last 12 months; this situation seems to be more common among women than men. Meanwhile, up to 10 % of young women have experienced some form of sexual harassment from managers/co-workers.
o National data from France show that the most common organisational and psychosocial risk factor is having to frequently leave one task for another, more urgent, task. Of employees in metropolitan France, 65.4 % say that they are exposed to this labour intensity factor. Other important factors are always or often having to hurry (45.5 %) and not being able to leave one’s job (43 %). Meanwhile, having at least three rhythm constraints (out of the following: automatic movement of a product or part; automatic rate of a machine; other technical constraints; immediate dependence on colleagues; production standards to be met in 1 day; external demands; and permanent constraints or supervision exercised by the hierarchy) and having the pace of work imposed by an external control or a computerised follow-up both affect 35.2 % of employees. Finally, changing position according to the needs of the company affects 23.1 % of employees.
o National data from another source in France show that (among the seven factors considered) the most frequently encountered in 2016 were having to think about too many things at once (43.9 % of employees in metropolitan France) and having to do excessive work (40 %). Other important factors were working under pressure (31.2 %), having to hide one’s emotions (24.9 %), fear of losing one’s job (24.7 %) and not being recognised for one’s work (23.8 %). Finally, the risk factor mentioned least frequently was having to do things that one disapproves of, affecting 10 % of employees.
o The above data from France can be complemented with information on the employers’ perspective. Available national data show that, according to employers, the most common psychosocial risk is having to work under time pressure. The results show that 11.5 % of employers considered that 50 % of their employees were exposed to this risk, and 10.1 % of employers reported that 10-50 % of their employees were. Other important psychosocial risks are tension with the public, customers, and so on (4.7 % of employers reported that more than 50 % of their employees were exposed to this risk), followed by having a heavy workload and risk of losing one’s job (in both cases, 3.6 % of employers estimated that more than 50 % of their employees were exposed to these risks).
Work-related MSDs: Facts and Figures — Synthesis report of 10 EU Member States reports
European Agency for Safety and Health at Work – EU-OSHA 11
o The previous data can be compared with national data from Italy, which show that, generally speaking, Italian workers are not particularly concerned with the possible psychosocial risks at work, to the extent that more than 80 % of Italian workers report that, to different levels, they feel satisfied with their work and feel part of the company, they have the opportunity to ask their managers about changes, they feel that the goals of the department/office are clear, they can freely talk to their boss, colleagues give help and support, and they have freedom of choice in deciding how to do the job. By contrast, and interestingly, up to 27.4 % of Italian workers feel that they have unachievable deadlines and 3.0 % feel subject to some form of harassment and violence.
o The Netherlands Working Conditions Survey (Nationale Enquete Arbeidsomstandigheden — NEA) provides interesting data concerning psychosocial factors (2017 data). More precisely, 59.5 % of Dutch workers (excluding the self-employed) regularly decide how their work is done; 60.6 % regularly decide the order in which their tasks are performed; 55.1 % are regularly able to control their own work pace; 67.8 % regularly need to find solutions to do their jobs; 48.7 % are regularly able to take leave when they want; and 24.5 % are regularly able to determine their own working hours.
Prevention of MSDs
In the framework of this study, the available data and information gathered at national level on preventive measures and activities adopted by companies to prevent MSDs within their workforces are quite limited. The information gathered is about OSH prevention in general (and not about specific MSD prevention).
The data gathered at national level confirm the findings of EU surveys such as the European Survey of Enterprises of New and Emerging Risks (ESENER): preventive measures are less common among smaller establishments.

Work-related MSDs: Facts and Figures — Synthesis report of 10 EU Member States reports
European Agency for Safety and Health at Work – EU-OSHA 12
Work-related MSDs: Facts and Figures — Synthesis report of 10 EU Member States reports
European Agency for Safety and Health at Work – EU-OSHA 13
1 Introduction 1.1 Background This synthesis report is part of a much larger project, ‘MSDs facts and figures overview: prevalence, costs and demographics of MSDs in Europe’, intended to support policy-makers at EU and national levels by providing an accurate picture of the prevalence and costs of MSDs across Europe, pulling together existing data from a number of relevant and reliable official statistical sources. This report is intended to be complementary to an overview report published with the same title and covering the EU as a whole, Work-related musculoskeletal disorders: prevalence, costs and demographics in the EU – Final report (3).
The European Agency for Safety and Health at Work (EU-OSHA), aware of the limitations of EU data sources related to MSDs, decided to complement and enrich EU-level findings with national data and analyses. This synthesis report intends to bring together some of these data and information published in 10 national reports on the topic (Denmark, Germany, Spain, France, Italy, Hungary, the Netherlands, Austria, Finland and Sweden (4)).
It is important to stress that these national reports were not intended to provide a comprehensive and exhaustive national overview of MSDs. Rather, the main criterion followed to gather the national data was to identify and focus on national MSD-related information that was either not available at EU level or complementary to what already existed.
This synthesis report follows the same structure as the national reports. It is structured around five chapters, including this introductory Chapter 1. Chapter 2 presents some data on prevalence of MSDs among workers. The two main sources of information and data are self-reporting through surveys and administrative data on occupational diseases and accidents at work. Chapter 3 analyses the impact of MSDs, presenting information on health, work and employment outcomes (including information on costs linked to MSDs). Chapter 4 identifies several risk factors underpinning MSDs, including physical as well as organisational/psychosocial risk factors. Subsequently, Chapter 5 provides some information related to activities carried out by enterprises/establishments and intended to prevent MSDs within their workforces.
The structure of this synthesis report is the same as the one followed in the general EU overview report (mentioned above), and readers are invited to check the information available in the equivalent chapters in the general EU report for a more comprehensive overview of the issues addressed in this synthesis report.
From a methodological perspective, the information presented in this report comes from national data sources based either on surveys or on administrative data that deal with the issue of MSDs.
EU-OSHA believes that it is worth making the information/data identified at national level accessible to the European OSH community and Member States (by publishing it in English). By sharing these national data at EU level, EU-OSHA is contributing to improving knowledge on the MSDs topic among policy-makers, OSH professionals and national authorities in general.
(3) This report is available at: https://osha.europa.eu/en/publications/msds-facts-and-figures-overview-prevalence-costs-and-
demographics-msds-europe/view (4) National reports are available at:
https://osha.europa.eu/en/publications?text&sort_by=field_publication_date&tags%5Bmusculoskeletal_disorders%5D=musculoskeletal_disorders&languages%5Ben%5D=en&publication_type%5B4859%5D=4859&page=1

Work-related MSDs: Facts and Figures — Synthesis report of 10 EU Member States reports
European Agency for Safety and Health at Work – EU-OSHA 14
1.2 Causes and consequences of MSDs: a framework 1.2.1 Main sources of information on MSDs MSDs are impairments of bodily structures such as muscles, joints, tendons, ligaments, nerves, cartilage, bones and the localised blood circulation system (EU-OSHA, 2002) (5). If MSDs are caused or aggravated primarily by work and by the effects of the immediate environment in which work is carried out, they are known as work-related MSDs.
The two main sources of information and data regarding MSDs are surveys based on self-reporting and administrative data.
In the case of self-reporting, people are asked whether or not they suffer from an MSD (either in general or a specific type of MSD). When assessing the prevalence of MSDs through surveys, it is customary to ask about the part of the body affected by health complaints and not about the clinical nature of complaints.
Questions regarding the prevalence of MSDs are included in different surveys. The formulation of the questions used varies between surveys and also between different waves of these surveys. These differences are likely to result in different outcomes.
Another important source of information is administrative data. Two examples of available administrative data are:
data on the number (and proportion) of occupational diseases recognised to be due to diseases of the musculoskeletal system and connective tissue;
data on declared work-related accidents.
Estimates of MSD prevalence based on self-reporting may include people with relatively mild health complaints as well as people with severe health complaints. Statistics based on administrative data are likely to include only people with more severe health complaints (severe enough to result in the complaint being recognised as an occupational disease).
1.2.2 A multidimensional model of MSDs MSDs can be caused by many different (combinations of) factors and may have many different consequences. Figure 1 shows the main causes and consequences of MSDs that have been identified in previous studies.
The objective of this national report is to present additional country-specific information regarding the following aspects of the framework depicted in Figure 1:
the prevalence of MSDs; the impact of MSDs; risk factors for MSDs; the prevention of MSDs.
(5) EU-OSHA — European Agency for Safety and Health at Work, ‘Introduction to work-related musculoskeletal disorders’,
Facts 71, 2002. Available at: https://osha.europa.eu/sites/default/files/publications/documents/en/publications/factsheets/71/Factsheet_71_-_Introduction_to_work-related_musculoskeletal_disorders.pdf

Work-related MSDs: Facts and Figures — Synthesis report of 10 EU Member States reports
European Agency for Safety and Health at Work – EU-OSHA 15
Figure 1: Theoretical framework of work-related MSDs
Note: Theoretical framework developed by Panteia, vhp performance and IKEI.

Work-related MSDs: Facts and Figures — Synthesis report of 10 EU Member States reports
European Agency for Safety and Health at Work – EU-OSHA 16
2 Prevalence of MSDs
2.1 Self-reported MSDs The available data based on EU surveys show that a very large percentage of workers report being affected by MSDs (see EU overview report). This is confirmed by the data and information gathered from national sources.
Data obtained from BAuA (6) in Germany provide information on the percentages of employees affected by MSDs during work in the past 12 months. According to the BIBB/BAuA Employee Survey 2012 (7), 48.5 % of employees were affected by neck and shoulder pain and 46.3 % by lower back pain. Moreover, 21.4 % suffered from pain in the knees, 21 % from pain in the arms, 19.8 % from pain in the legs or in the feet, 15.6 % from pain in the hands and 11.5 % from pain in the hips. In addition to this, the percentage undergoing medical treatment (not necessarily for MSD-related pain) among those suffering from lower back pain was 53.9 %, among those suffering from neck and shoulder pain was 50.7 % and among those with pain in the hips was 46.2 % (see Table 1).
Table 1: Percentage of employees affected by MSDs during work in the past 12 months and percentage
of them undergoing medical treatment because of the MSD, by type of MSDs, Germany, 2012
Type of MSD Employees affected Employees undergoing medical treatment (*)
Lower back pain 46.3 53.9
Neck and shoulder pain 48.5 50.7
Pain in the arms 21.0 40.3
Pain in the hands 15.6 35.8
Pain in the hips 11.5 46.2
Pain in the knees 21.4 38.9
Swollen legs 10.4 33.3
Pain in the legs or feet 19.8 31.4
(*) Responses only for those employees affected by an MSD
Source: BIBB/BAuA Employee Survey 2012
(6) BAuA (www.baua.de) is a federal authority within the Federal Ministry of Labour and Social Affairs (Bundesministerium für
Arbeit und Soziales — BMAS). As a departmental research institution of the federal government, it is responsible for all matters involving occupational safety and health at work, including the adjustment of working conditions to people’s needs. BAuA publishes a lot of research reports on many safety and health-related issues. One of the long-term research topics within BAuA is the prevention of work-related diseases of the musculoskeletal system, as they are the most common cause of sickness absence, severe disability, limited capability at work and premature incapacity for work in Germany. MSDs also account for a significant part of compensation awards for occupational diseases.
(7) BAuA & BIBB, Grundauswertung der BIBB/BAuA-Erwerbstätigenbefragung 2012 [Basic evaluation of the BIBB/BAuA employee survey 2012], 2012. Available at: https://www.baua.de/EN/Topics/The-changing-world-of-work-and-occupational-safety-and-health/Monitoring-working-conditions/Working-conditions/BIBB-BAuA-2012.html

Work-related MSDs: Facts and Figures — Synthesis report of 10 EU Member States reports
European Agency for Safety and Health at Work – EU-OSHA 17
In Austria (8), the most common work-related health problem among workers is back problems (affecting almost one third of respondents, 32.2%), followed by neck, shoulder and arm problems (reported by 19.0 % of respondents) and hip, leg or foot problems (reported by 16.3 % of workers). Other work-related health problems affect much lower percentages of people.
In Italy, national information from INAIL (9) confirms that MSD-related problems are the most typical health problems identified by Italian workers, to the extent that back pain is the most commonly identified health problem (51.6 % of all workers), followed by muscular pain in the upper limbs (46.7 % of all workers).
Data from the Netherlands and Spain confirm this high incidence of self-reported discomfort associated with MSDs, particularly in these two body parts. The Netherlands Working Conditions Survey (Nationale Enquete Arbeidsomstandigheden — NEA ( 10 )) provides interesting information on Dutch workers (excluding the self-employed) who report suffering from some type of pain/discomfort (see Table 2). The following data are based on a scale from 1 (meaning ‘never’) to 5 (meaning ‘multiple times, for a sustained period of time’). In general, the part of the body affected most is the back (2.43), followed by the shoulders (2.19) and neck (2.17). In Spain, available national data sources (11) also show that up to 77.6 % of Spanish workers reported feeling some type of frequent discomfort associated with postures adopted or efforts made at work; in other words, only 22.4 % of respondents did not identify any discomfort (data for 2011). The most common body parts where workers reported frequent discomfort associated with postures adopted or efforts made at work are the lower back (45.0 % of respondents), the neck (34.4 %) and the upper back (27.1 %) (see Figure 2).
Table 2: Percentages of workers (excluding self-employed) experiencing complaints (pain/discomfort)
affecting different parts of the body in the past 12 months, by gender and age, Netherlands, 2017 (from 1, never, to 5, multiple times, for a sustained period of time)
Body part Total Gender Age
Male Female 15-24 25-54 55-64 65-75
Neck 2.17 1.91 2.45 1.94 2.23 2.20 1.80
Shoulders 2.19 1.92 2.48 1.87 2.25 2.28 1.85
Arms/elbows 1.58 1.52 1.65 1.34 1.59 1.78 1.49
Wrists/hands 1.71 1.60 1.83 1.55 1.71 1.87 1.58
Back 2.43 2.30 2.58 2.36 2.46 2.44 2.07
Legs/knees/feet 2.10 1.99 2.22 1.97 2.05 2.40 2.09
Source: NEA, 2017
(8) Statistik Austria, Arbeitsunfälle und arbeitsbezogene Gesundheitsprobleme 2013 [Work-related accidents and work-related
diseases 2013], 2013. Available at: http://www.statistik.at/web_de/services/publikationen/4/index.html?includePage=detailedView§ionName=Gesundheit&pubId=694
(9) INAIL — Istituto Nazionale per l’Assicurazione contro gli Infortuni sul Lavoro, Indagine sulla Sicurezza sul Lavoro (INSULA) [Survey on work-related security], 2014. Available at: https://www.inail.it/cs/internet/comunicazione/sala-stampa/conferenze-stampa/ucm_140537_indagine-nazionale-sulla-salute-e-sicurezza-sul.html
(10) TNO, Nationale Enquête Arbeidsomstandigheden [Netherlands Working Conditions Survey], 2017. Available at: https://www.cbs.nl/nl-nl/publicatie/2018/16/nationale-enquete-arbeidsomstandigheden-2017
(11) INSHT — Instituto Nacional de Seguridad e Higiene en el Trabajo, VII Encuesta Nacional de Condiciones de Trabajo 2011 [7th National Survey on Working Conditions, 2011]. Available at: http://www.oect.es/InshtWeb/Contenidos/Documentacion/FICHAS%20DE%20PUBLICACIONES/EN%20CATALOGO/OBSERVATORIO/Informe%20(VII%20ENCT).pdf
Work-related MSDs: Facts and Figures — Synthesis report of 10 EU Member States reports
European Agency for Safety and Health at Work – EU-OSHA 18
Figure 2: Body location of the most frequent complaints associated with postures or efforts made at work (percentage of workers, some workers may have multiple complaints), Spain, 2011
Source: 7th National Survey on Working Conditions, 2011
The findings based on EU surveys showing that MSDs prevalence differs by gender and age group are confirmed by national data. Generally speaking, more women than men complain about MSDs, and the probabilities of reporting MSDs increases with age. For instance, in Finland (12), national data show that back-related problems are the most common cause of pain (affecting more than 50 % of the population), followed by shoulder and neck pain. Interestingly, women seem to be more affected by these MSD-related health problems. These disorders also seem to be more prevalent among older people, irrespective of gender. In Spain, female workers are generally more likely to suffer from MSD-related health problems than male workers. In particular, 51 % of women experience neck and upper limb pain, compared with 41 % of men; 50 % experience back pain, compared with 41 % of men; and 37 % experience lower extremity pain, compared with 31 % of men. By age, MSD-related health problems are more likely to occur as age increases (Spanish National Survey on Working Conditions, 2015 (13)).
Similarly, data from the Netherlands show (see Table 2) that figures are higher among women than among men. In terms of age, those aged 55 to 64 years old have, in general, the highest scores, although the 25-54 group, which in general has similar scores, has higher figures than the 55-64 group for neck pain (2.23 versus 2.20) and back pain (2.46 versus 2.44).
In Sweden, approximately 36 % of Swedish workers declare that they are affected by pain in their upper back/neck every week, followed by 33 % and 31 % who claim they experience problems in their lower back and in their shoulders/arms, respectively (see Table 3). Generally speaking, women seem to be
(12) Koponen, P., Borodulin, K., Lundqvist, A., Sääksjärvi, K. & Koskinen, S. (eds.), Terveys, toimintakyky ja hyvinvointi
Suomessa: FinTerveys 2017 -tutkimus [Health, functional capacity and welfare in Finland: FinHealth 2017 study], National Institute for Health and Welfare (THL), Report 4/2018. Available at: http://www.julkari.fi/handle/10024/136223
(13) INSHT — Instituto Nacional de Seguridad e Higiene en el Trabajo, Encuesta Nacional de Condiciones de Trabajo 2015 6ª EWCS [National Survey on Working Conditions, 2015, 6th EWCS]. Available at: http://encuestasnacionales.oect.es/
34.4
13.9
12.6
2.5
10.8
27.1
45
5.5
1
7.5
11.9
6.1
22.4
0 20 40 60 80 100
Neck
Shoulders
Arms-Forearms
Elbows
Hands-wrists
High back
Low back
Buttocks-hips
Thighs
knees
Legs
Feet-Ankles
None
Work-related MSDs: Facts and Figures — Synthesis report of 10 EU Member States reports
European Agency for Safety and Health at Work – EU-OSHA 19
more affected than men, and there seems to be a positive correlation with age, that is, the older workers seem to be more affected by these health problems than their younger counterparts.
Table 3: Percentage of Swedish workers affected by pain every week in different body parts, by gender
and age, 2017
Total Women Men
Total 16-29 30-49 50-64 Total 16-29 30-49 50-64
Upper back/neck 36 45 47 47 41 28 21 31 29
Lower back 33 35 36 35 35 30 27 31 31
Shoulders or arms 31 35 32 34 38 27 16 27 34
Wrists or hands 20 24 21 21 30 16 8 17 19
Hips, legs, knees or feet 30 35 36 31 41 25 21 22 33
Source: Swedish Work Environment Authority and Official Statistics of Sweden, ‘Arbetsmiljön 2017 — The Working Environment 2017’
For two countries (Austria and France), national studies confirm that whether MSD prevalence is higher among men or women depends on the specific type of MSDs.
In Austria (14), while men complained more frequently than woman about back problems (33.7 % versus 30.6 %, respectively) or about lower limb issues such as pains in hips, legs and feet (18.1 % versus 14.3 %, respectively), women were more likely to complain about upper limb pains (23.4 % versus 14.9 %, respectively) and particularly in the neck, shoulders, arms or hands.
A more refined analysis for France (15) suggests that the prevalence of persistent pain varied between 14 % (in the elbow) and 35 % (in the back) in women and between 9 % and 24 % for men (respectively for the same locations).
Taking a sector perspective, national data from the different Member States suggest that workers in some specific sectors report higher levels of discomfort associated with MSDs, particularly in sectors such as construction, agriculture, industry, transport, health care or education.
For instance, in the case of Austria (16), MSD-related problems are more prevalent in some specific sectors, such as manufacturing, health and social work, construction and agriculture/forestry/fishing activities, without forgetting other sectors such as trade, public administration or transport and logistics, whereas it is much less present in other sectors such as education, public administration or scientific
(14) Statistik Austria, Arbeitsunfälle und arbeitsbezogene Gesundheitsprobleme 2013 [Work-related accidents and work-related
diseases 2013], 2013. Available at: http://www.statistik.at/web_de/services/publikationen/4/index.html?includePage=detailedView§ionName=Gesundheit&pubId=694
(15) Carton, M., Santin, G., Leclerc, A., Gueguen, A., Goldberg, M., Roquelaure, Y., Zins, M. & Descatha, A., ‘Prévalence des troubles musculo-squelettiques et des facteurs biomécaniques d’origine professionnelle: premières estimations à partir de Constances’ [‘Prevalence of musculoskeletal disorders and occupational biomechanical factors: preliminary estimates from the French CONSTANCES cohort’], Bulletin Epidémiologique Hebdomadaire, No 35-36, 2016, pp. 630-639.
(16) Statistik Austria, Arbeitsunfälle und arbeitsbezogene Gesundheitsprobleme 2013 [Work-related accidents and work-related diseases 2013], 2013. Available at: http://www.statistik.at/web_de/services/publikationen/4/index.html?includePage=detailedView§ionName=Gesundheit&pubId=694

Work-related MSDs: Facts and Figures — Synthesis report of 10 EU Member States reports
European Agency for Safety and Health at Work – EU-OSHA 20
and technical services. Some specific parts of the body seem to be differently affected according to sector considerations (see Table 4).
Table 4: Percentages of workers with a work-related MSD, by type of MSD and individual characteristics,
level of education, economic sector and occupational group in Austria, 2013
Disease group
Bone, joint or muscle
problems (neck,
shoulders, arms, hands)
Bone, joint or muscle problems
(hips, legs, feet)
Bone, joint or muscle problems
(back)
15-30 years old 5.8 3.1 7.0
30-45 years old 18.1 10.7 22.0
45-60 years old 47.6 39.3 40.9
Over 60 years old 28.4 46.9 30.1
Level of education
ISCED 0-2 26.9 34.5 21.8
ISCED 3-4 60.1 57.8 67.2
ISCED 5-6 13.0 7.8 11.0
Economic sector
Agriculture and forestry; fishing 5.6 7.8 6.6
Mining and quarrying n.a. n.a. n.a.
Manufacturing 9.4 11.2 13.6
Energy supply n.a. n.a. n.a.
Water supply; wastewater and waste n.a. n.a. n.a.
Construction 9.9 11.5 9.5
Trade; maintenance and repair of motor vehicles 10.2 6.0 9.6
Transport and logistics n.a. 4.6 4.4
Hotels, restaurants and catering 5.8 7.3 4.2
Information and communication n.a. n.a. n.a.
Financial and insurance services n.a. n.a. n.a.
Real estate and housing n.a. n.a. n.a.
Work-related MSDs: Facts and Figures — Synthesis report of 10 EU Member States reports
European Agency for Safety and Health at Work – EU-OSHA 21
Disease group
Bone, joint or muscle
problems (neck,
shoulders, arms, hands)
Bone, joint or muscle problems
(hips, legs, feet)
Bone, joint or muscle problems
(back)
Scientific and technical services 3.2 n.a. n.a.
Other economic services 3.5 n.a. 2.3
Public administration, defence, social security 7.4 n.a. 5.5
Education 5.0 n.a. 3.6
Health and social work 9.8 5.2 10.5
Arts, entertainment and recreation n.a. n.a. n.a.
Other services n.a. n.a. 2.6
Occupational group
Executives n.a. n.a. 1.9
Academics and comparable professionals 8.6 3.7 6.4
Technicians and equivalent non-technical professionals 11.7 6.7 10.9
Office staff and comparable professionals 8.1 n.a. 5.4
Service professionals and salespeople 18.8 12.8 15.5
Professionals in agriculture, forestry and fishing 6.2 7.7 6.4
Workers in craft and related jobs 11.9 13.3 15.7
Plant and machinery operators and installation professionals n.a. 7.2 8.8
Workers in elementary occupations 13.2 8.5 8.3
Soldiers n.a. n.a. n.a.
TOTAL 100.0 100.0 100.0
ISCED, International Standard Classification of Education; n.a., not available Source: Statistik Austria, Arbeitsunfälle und arbeitsbezogene Gesundheitsprobleme 2013 [Work-related accidents and work-related diseases 2013], 2013
In Spain (see Table 5), the results by sector show that the economic sectors with the highest percentages of workers reporting feeling some type of frequent discomfort associated with postures adopted or efforts made at work are water supply and sanitation activities, and health activities, followed by transport and storage (84.0 %, 84.0 % and 81.7 %, respectively).
Work-related MSDs: Facts and Figures — Synthesis report of 10 EU Member States reports
European Agency for Safety and Health at Work – EU-OSHA 22
In the survey sample as a whole, discomfort in the lower back particularly affects some sectors, namely transport, construction and health activities. Meanwhile, discomfort in the neck is particularly felt in sectors such as financial and insurance activities, information and communications, professional activities, real estate activities, public administration and education. Finally, discomfort in the upper extremities is particularly likely to be experienced in sectors such as water supply and sanitation activities, and construction.
Table 5: Body location of the most frequent complaints associated with postures or efforts made at work
(possibility of multiple answers), by economic sector, Spain, 2011
Neck Upper extrem
ities
Upper back
Lower back
Buttocks/hips Thighs Legs Knees Feet/an
kles
Any complaint
Sector A 23.0 38.2 20.3 50.9 6.3 3.0 13.2 12.4 5.5 77.7
Sector B 30.8 47.9 42.9 43.7 4.1 2.5 7.5 4.9 2.5 77.7
Sector C 29.4 37.5 23.5 42.9 5.7 0.6 9.4 7.9 5.6 76.7
Sector D 36.9 29.6 26.0 41.7 3.7 1.5 3.2 13.3 5.8 75.1
Sector E 35.9 46.3 20.0 49.6 3.2 5.6 10.3 16.9 8.1 84.0
Sector F 28.1 38.3 25.1 52.5 6.5 1.0 9.5 16.3 3.9 79.1
Sector G 27.2 27.8 26.4 42.5 4.4 1.2 17.0 6.6 8.6 75.0
Sector H 39.0 26.4 29.4 53.7 8.2 1.1 12.0 10.5 3.3 81.7
Sector I 23.0 35.3 20.6 41.2 5.1 1.4 27.3 7.8 18.0 80.2
Sector J 49.6 32.2 33.1 38.8 4.6 1.7 5.2 2.6 2.5 74.0
Sector K 53.3 29.8 30.3 38.1 4.5 0.0 5.7 3.3 2.5 77.8
Sector L 43.5 14.1 32.5 35.3 5.5 0.0 3.3 3.3 1.8 65.3
Sector M 47.4 30.9 30.4 43.1 4.2 0.8 6.3 2.8 3.6 75.5
Sector N 35.6 31.9 29.9 47.2 3.9 0.6 10.4 6.1 2.3 75.4
Sector O 44.2 29.2 29.4 43.0 3.9 0.6 7.2 6.7 3.9 78.6
Sector P 43.7 25.6 32.3 42.4 5.1 0.5 6.6 4.9 4.6 74.9
Sector Q 43.7 37.8 31.5 52.2 9.3 1.3 10.0 3.8 4.1 84.0
Sector R 35.2 27.7 27.0 41.0 5.3 1.5 8.2 8.6 2.9 72.9
Sector S 35.8 38.0 27.8 41.5 3.1 0.9 13.6 7.8 7.8 79.6
Sector T 21.9 33.7 22.4 46.9 6.5 0.4 12.0 8.1 5.2 76.0

Work-related MSDs: Facts and Figures — Synthesis report of 10 EU Member States reports
European Agency for Safety and Health at Work – EU-OSHA 23
Neck Upper extrem
ities
Upper back
Lower back
Buttocks/hips Thighs Legs Knees Feet/an
kles
Any complaint
Sector U 45.6 31.6 33.4 30.8 7.0 0.0 17.5 0.0 0.0 77.6
Average 34.4 32.6 27.1 45.0 5.5 1.0 11.9 7.5 6,1 77.6
Note: Sector A = agriculture, livestock, hunting, forestry and fishing; Sector B = extractive industries; Sector C = manufacturing industries; Sector D = electricity, gas and steam supply; Sector E = water supply and sanitation activities; Sector F = construction; Sector G = wholesale and retail trade; Sector H = transport and storage; Sector I = hotels, restaurants and catering; Sector J = information and communications; Sector K = financial and insurance activities; Sector L = real estate activities; Sector M = professional, scientific and technical activities; Sector N = administrative and auxiliary service activities; Sector O = public administration and defence, social security; Sector P = education; Sector Q = health and social services activities; Sector R = artistic and entertainment activities; Sector S = other services; Sector T = households as employers; Sector U = organisation and extraterritorial organism activities.
Source: 7th National Survey on Working Conditions, 2011
Finally, in Germany BAuA provides national data on working conditions and the presence of MSDs among temporary agency workers versus non-temporary agency workers. As the available data show, compared with the non-temporary agency workers, temporary agency workers work much more often under physically demanding working conditions or difficult environmental conditions.
The predominantly physical activities of temporary agency workers are reflected in their health complaints. In particular, pain in the knees, neck pain/shoulder pain or lower back pain occurs more frequently among temporary workers than among non-temporary workers. By contrast, temporary agency workers are less affected by nervousness and irritability than non-temporary agency workers (see Table 6).
Table 6: Percentage of temporary and non-temporary agency workers with health complaints during or immediately after work, in Germany, 2012
Main health problem Temporary agency workers
Non-temporary agency workers
Lower back pain 53.4 48.4
Neck pain/shoulder pain 52.7 49.9
Knee pain 32.8 22.8
Headache 38.5 34.9
Nightly sleep disturbances 24.3 27.1
Overall tiredness/exhaustion 52.3 46.3
Nervousness/irritability 24.5 28.2
Source: BAuA, Arbeitswelt im Wandel, Zahlen — Daten — Fakten, 2018 [The changing world of work: Figures — data — facts, 2018]. Available at: https://www.baua.de/DE/Angebote/Publikationen/Praxis/A99.pdf?__blob=publicationFile&v=11
2.2 MSD-related occupational diseases and accidents at work This section presents administrative data on reported and recognised MSD-related occupational diseases and MSD-related accidents at work, and the extent to which these variables are related to different dimensions such as economic sectors, occupations or several sociodemographic factors such as gender, age or education.
Work-related MSDs: Facts and Figures — Synthesis report of 10 EU Member States reports
European Agency for Safety and Health at Work – EU-OSHA 24
2.2.1 Reported/recognised MSD-related occupational diseases In 2016, a study was carried out by Eurogip (17) focusing on the recognition of MSDs as occupational diseases in 10 European countries (Austria, Belgium, Denmark, Finland, France, Germany, Italy, Spain, Sweden and Switzerland). One of the outcomes of this study was that MSD-related recognised occupational diseases account for a very large proportion of the total number of occupational diseases in several Member States such as Spain, France and Italy. The national data gathered in the framework of our own study confirm these findings.
Because of institutional differences between the national compensation and reporting systems used to register (the cause of) occupational diseases, it is important to underline that these available data are also not comparable across Member States. Country differences are less likely to reflect country differences in the prevalence of occupations diseases than to be related to:
the reporting systems themselves (list of recognised diseases and so on); the consequences of reporting; the institutional context; and claimants’ knowledge of these issues (the chances of the disease being recognised as work
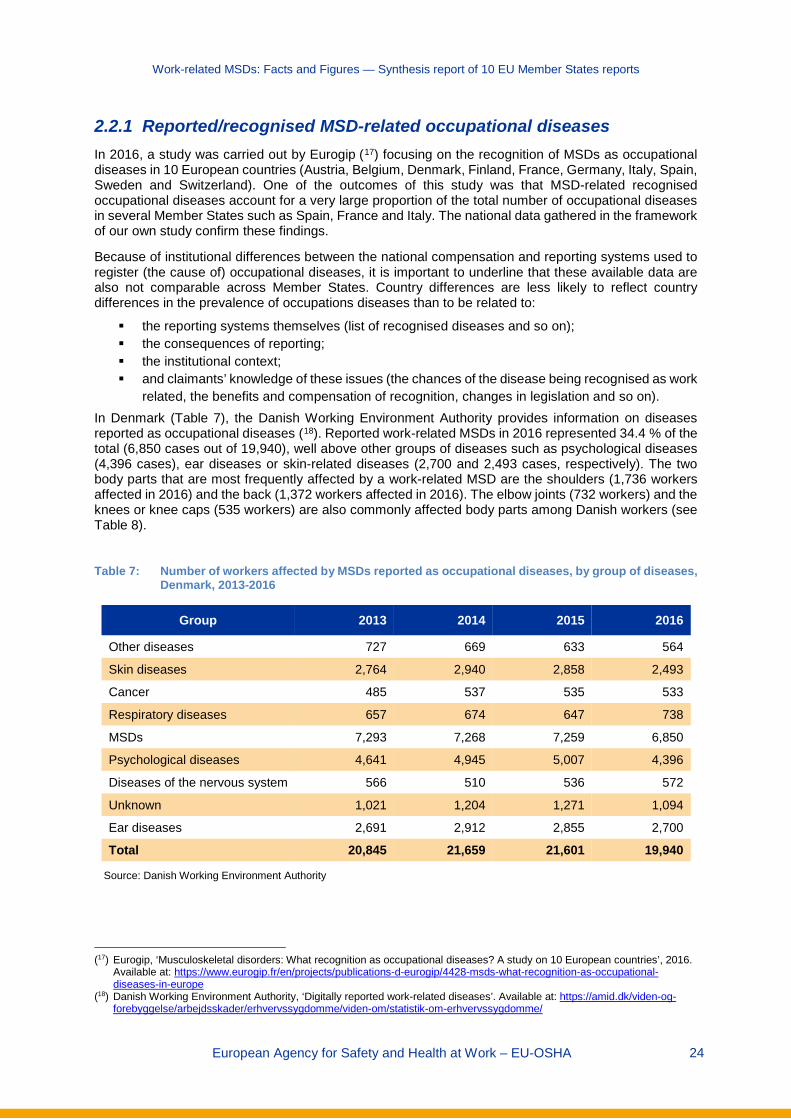
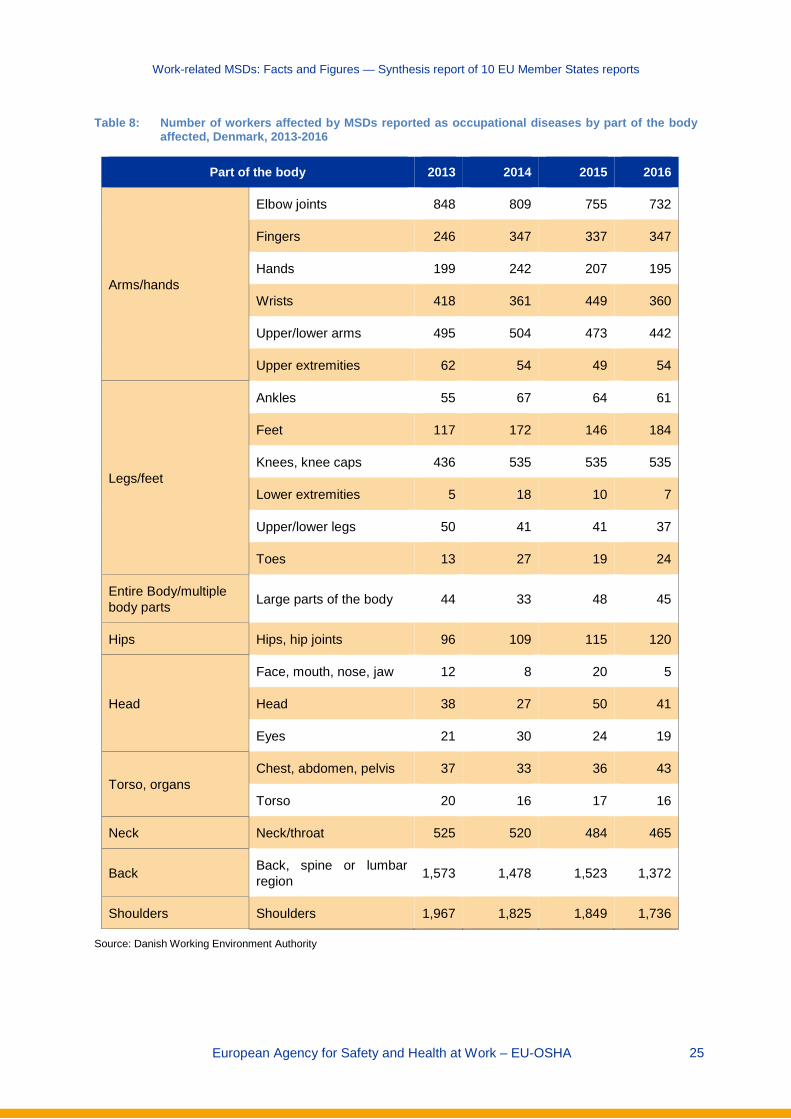
related, the benefits and compensation of recognition, changes in legislation and so on). In Denmark (Table 7), the Danish Working Environment Authority provides information on diseases reported as occupational diseases (18). Reported work-related MSDs in 2016 represented 34.4 % of the total (6,850 cases out of 19,940), well above other groups of diseases such as psychological diseases (4,396 cases), ear diseases or skin-related diseases (2,700 and 2,493 cases, respectively). The two body parts that are most frequently affected by a work-related MSD are the shoulders (1,736 workers affected in 2016) and the back (1,372 workers affected in 2016). The elbow joints (732 workers) and the knees or knee caps (535 workers) are also commonly affected body parts among Danish workers (see Table 8).
Table 7: Number of workers affected by MSDs reported as occupational diseases, by group of diseases,
Denmark, 2013-2016
Group 2013 2014 2015 2016
Other diseases 727 669 633 564
Skin diseases 2,764 2,940 2,858 2,493
Cancer 485 537 535 533
Respiratory diseases 657 674 647 738
MSDs 7,293 7,268 7,259 6,850
Psychological diseases 4,641 4,945 5,007 4,396
Diseases of the nervous system 566 510 536 572
Unknown 1,021 1,204 1,271 1,094
Ear diseases 2,691 2,912 2,855 2,700
Total 20,845 21,659 21,601 19,940
Source: Danish Working Environment Authority
(17) Eurogip, ‘Musculoskeletal disorders: What recognition as occupational diseases? A study on 10 European countries’, 2016.
Available at: https://www.eurogip.fr/en/projects/publications-d-eurogip/4428-msds-what-recognition-as-occupational-diseases-in-europe
(18) Danish Working Environment Authority, ‘Digitally reported work-related diseases’. Available at: https://amid.dk/viden-og-forebyggelse/arbejdsskader/erhvervssygdomme/viden-om/statistik-om-erhvervssygdomme/
Work-related MSDs: Facts and Figures — Synthesis report of 10 EU Member States reports
European Agency for Safety and Health at Work – EU-OSHA 25
Table 8: Number of workers affected by MSDs reported as occupational diseases by part of the body affected, Denmark, 2013-2016
Part of the body 2013 2014 2015 2016
Arms/hands
Elbow joints 848 809 755 732
Fingers 246 347 337 347
Hands 199 242 207 195
Wrists 418 361 449 360
Upper/lower arms 495 504 473 442
Upper extremities 62 54 49 54
Legs/feet
Ankles 55 67 64 61
Feet 117 172 146 184
Knees, knee caps 436 535 535 535
Lower extremities 5 18 10 7
Upper/lower legs 50 41 41 37
Toes 13 27 19 24
Entire Body/multiple body parts Large parts of the body 44 33 48 45
Hips Hips, hip joints 96 109 115 120
Head
Face, mouth, nose, jaw 12 8 20 5
Head 38 27 50 41
Eyes 21 30 24 19
Torso, organs Chest, abdomen, pelvis 37 33 36 43
Torso 20 16 17 16
Neck Neck/throat 525 520 484 465
Back Back, spine or lumbar region 1,573 1,478 1,523 1,372
Shoulders Shoulders 1,967 1,825 1,849 1,736
Source: Danish Working Environment Authority

Work-related MSDs: Facts and Figures — Synthesis report of 10 EU Member States reports
European Agency for Safety and Health at Work – EU-OSHA 26
National data from Finland (19) provide information on the numbers of people affected by MSDs that are treated or detected by a doctor. The available data (see Table 13) show that ‘back illness’ is one of the main illnesses detected in Finland; in 11.7 % of the Finnish population, this illness has been treated or detected by a doctor. Given this, this type of illness is the fourth most prevalent in Finland, surpassed only by hay fever/allergic rhinitis, high blood pressure/hypertension and elevated blood cholesterol (16.3 %, 14.9 % and 12.5 %, respectively).
In France, the 2016 annual report of the Primary Health Insurance Fund (Caisse Nationale de l’Assurance Maladie) on occupational risks (20) provides data on recognised occupational diseases and incidence (cases per 100,000 insured persons). Of the 48,762 recognised cases in total, 42,535 were MSDs (see Table 9). MSDs have an incidence of 229.5 cases per 100,000 insured persons. Of the recognised cases, 38,740 were periarticular disorders caused by certain gestures and postures; 3,183 were lumbar spine diseases; 485 were chronic lesions of the meniscus; and 127 were MSDs caused by shocks or vibration. In addition, other occupational diseases with a considerable number of recognised cases were cancers (1,775 cases) and pleural plaques (1,693 cases).
Table 9: Recognised occupational diseases and Incidence (cases per 100,000 insured persons), France, 2016
Occupational disease Recognised cases Incidence
MSDs 42,535 229.5
- Periarticular disorders caused by certain gestures and postures
- Chronic lesions of the meniscus
- MSDs caused by shocks and vibrations
- Lumbar spine diseases
38,740
485
127
3,183
209.1
2.6
0.7
17.2
Cancers 1,775 9.6
Hearing loss 704 3.8
Eczematiform lesions of allergic mechanism 235 1.3
Rhinitis and occupational asthma 191 1.0
Diseases related to infectious or parasitic agents (in hospitals) 129 0.7
Pleural plaques 1,693 9.1
Asbestosis 243 1.3
Other 1,257 6.8
Total 48,762 263.2
Source: Caisse Nationale de l’Assurance Maladie des Travailleurs Salariés, Rapport annuel 2016: L’Assurance Maladie — Risques professionnels [2016 annual report: Health insurance — occupational risks]. Available at: https://www.ameli.fr/sites/default/files/ra-risques-professionnels-2016_assurance-maladie.pdf
(19) THL — National Institute for Health and Welfare, ‘Suomalaisen aikuisväestön terveyskäyttäytyminen ja terveys — AVTK’
[‘Health behaviour and health among the Finnish population’], 2014. Available at: https://thl.fi/fi/tutkimus-ja-kehittaminen/tutkimukset-ja-hankkeet/finsote-tutkimus/aiemmat-tutkimukset/suomalaisen-aikuisvaeston-terveyskayttaytyminen-ja-terveys-avtk-
(20) Caisse Nationale de l’Assurance Maladie des Travailleurs Salariés, Rapport annuel 2016: L’Assurance Maladie — Risques professionnels [2016 annual report: Health insurance — occupational risks]. Available at: https://www.ameli.fr/sites/default/files/ra-risques-professionnels-2016_assurance-maladie.pdf
Work-related MSDs: Facts and Figures — Synthesis report of 10 EU Member States reports
European Agency for Safety and Health at Work – EU-OSHA 27
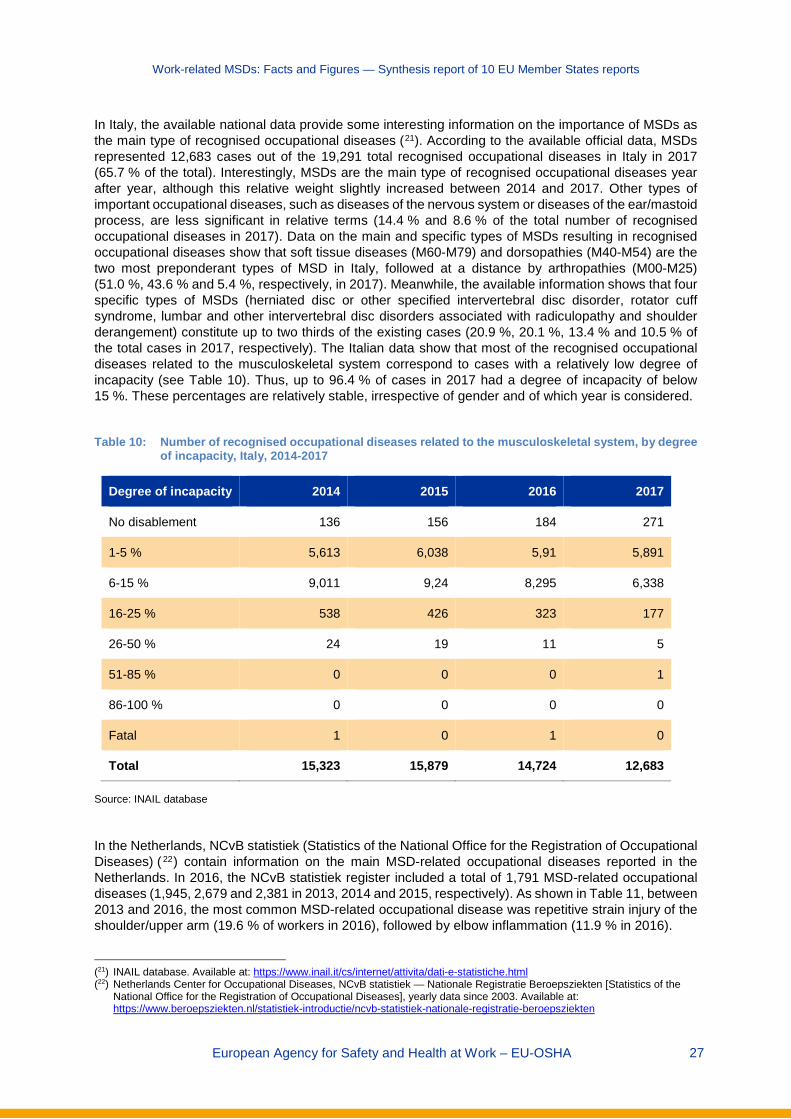
In Italy, the available national data provide some interesting information on the importance of MSDs as the main type of recognised occupational diseases (21). According to the available official data, MSDs represented 12,683 cases out of the 19,291 total recognised occupational diseases in Italy in 2017 (65.7 % of the total). Interestingly, MSDs are the main type of recognised occupational diseases year after year, although this relative weight slightly increased between 2014 and 2017. Other types of important occupational diseases, such as diseases of the nervous system or diseases of the ear/mastoid process, are less significant in relative terms (14.4 % and 8.6 % of the total number of recognised occupational diseases in 2017). Data on the main and specific types of MSDs resulting in recognised occupational diseases show that soft tissue diseases (M60-M79) and dorsopathies (M40-M54) are the two most preponderant types of MSD in Italy, followed at a distance by arthropathies (M00-M25) (51.0 %, 43.6 % and 5.4 %, respectively, in 2017). Meanwhile, the available information shows that four specific types of MSDs (herniated disc or other specified intervertebral disc disorder, rotator cuff syndrome, lumbar and other intervertebral disc disorders associated with radiculopathy and shoulder derangement) constitute up to two thirds of the existing cases (20.9 %, 20.1 %, 13.4 % and 10.5 % of the total cases in 2017, respectively). The Italian data show that most of the recognised occupational diseases related to the musculoskeletal system correspond to cases with a relatively low degree of incapacity (see Table 10). Thus, up to 96.4 % of cases in 2017 had a degree of incapacity of below 15 %. These percentages are relatively stable, irrespective of gender and of which year is considered.
Table 10: Number of recognised occupational diseases related to the musculoskeletal system, by degree
of incapacity, Italy, 2014-2017
Degree of incapacity 2014 2015 2016 2017
No disablement 136 156 184 271
1-5 % 5,613 6,038 5,91 5,891
6-15 % 9,011 9,24 8,295 6,338
16-25 % 538 426 323 177
26-50 % 24 19 11 5
51-85 % 0 0 0 1
86-100 % 0 0 0 0
Fatal 1 0 1 0
Total 15,323 15,879 14,724 12,683
Source: INAIL database
In the Netherlands, NCvB statistiek (Statistics of the National Office for the Registration of Occupational Diseases) ( 22) contain information on the main MSD-related occupational diseases reported in the Netherlands. In 2016, the NCvB statistiek register included a total of 1,791 MSD-related occupational diseases (1,945, 2,679 and 2,381 in 2013, 2014 and 2015, respectively). As shown in Table 11, between 2013 and 2016, the most common MSD-related occupational disease was repetitive strain injury of the shoulder/upper arm (19.6 % of workers in 2016), followed by elbow inflammation (11.9 % in 2016).
(21) INAIL database. Available at: https://www.inail.it/cs/internet/attivita/dati-e-statistiche.html (22) Netherlands Center for Occupational Diseases, NCvB statistiek — Nationale Registratie Beroepsziekten [Statistics of the
National Office for the Registration of Occupational Diseases], yearly data since 2003. Available at: https://www.beroepsziekten.nl/statistiek-introductie/ncvb-statistiek-nationale-registratie-beroepsziekten

Work-related MSDs: Facts and Figures — Synthesis report of 10 EU Member States reports
European Agency for Safety and Health at Work – EU-OSHA 28
Table 11: Most commonly reported MSD-related occupational diseases, Netherlands, 2013-2016
Disease 2013 2014 2015 2016
N % N % N % N %
Repetitive strain injury shoulder/upper arm 382 19.6 504 18.8 400 16.8 351 19.6
Elbow inflammation 175 9.0 275 10.3 220 9.2 213 11.9
Repetitive strain injury wrist/hand 97 5.0 134 5.0 120 5.0 102 5.7
Knee arthrosis 98 5.0 103 3.8 149 6.3 87 4.9
Carpal tunnel syndrome 67 3.4 114 4.3 104 4.4 84 4.7
Inflammation, shoulder joint capsule 61 3.1 88 3.3 90 3.8 72 4.0
Chronic non-specific lower back pain 154 7.9 194 7.2 114 4.8 69 3.9
Repetitive strain injury elbow/lower arm 84 4.3 105 3.9 88 3.7 68 3.8
Herniated spine 84 4.3 128 4.8 97 4.1 66 3.7
Acute non-specific lower back pain 68 3.5 114 4.3 70 2.9 63 3.5
Non-specific acute lower back pain 43 2.2 77 2.9 55 2.3 55 3.1
Generalised arthrosis 41 2.1 43 1.6 48 2.0 54 3.0
Other soft tissue overload 95 4.9 86 3.2 87 3.7 48 2.7
Low back pain with ischialgia 40 2.1 59 2.2 62 2.6 34 1.9
Degenerative disc disease of the neck 24 1.2 40 1.5 37 1.6 28 1.6
Hip arthrosis 19 1.0 35 1.3 29 1.2 27 1.5
Vertebrae cervical injury 16 0.8 28 1.0 24 1.0 27 1.5
Leg pain 25 1.3 25 0.9 21 0.9 27 1.5
Other arthrosis 61 3.1 87 3.2 71 3.0 25 1.4
Spondylolyse/arthrosis vertebrae 41 2.1 58 2.2 46 1.9 23 1.3
Muscle tendon injury, shoulder/arm 30 1.5 20 0.7 38 1.6 22 1.2
Inflammation elbow inner side 17 0.9 32 1.2 23 1.0 21 1.2
Knee bursitis 22 1.1 19 0.7 31 1.3 21 1.2
Chronic synovitis hand/wrist 20 1.0 34 1.3 38 1.6 19 1.1
Carpometacarpal arthrosis first joint 12 0.6 23 0.9 32 1.3 19 1.1
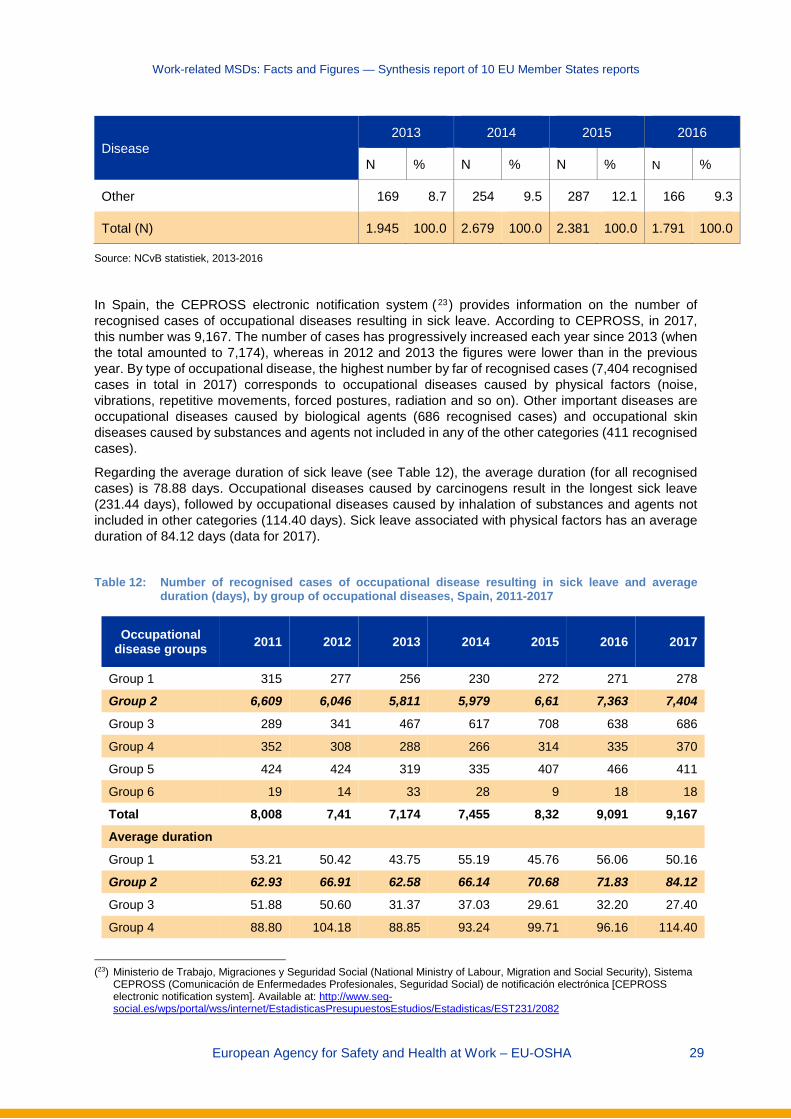
Work-related MSDs: Facts and Figures — Synthesis report of 10 EU Member States reports
European Agency for Safety and Health at Work – EU-OSHA 29
Disease 2013 2014 2015 2016
N % N % N % N %
Other 169 8.7 254 9.5 287 12.1 166 9.3
Total (N) 1.945 100.0 2.679 100.0 2.381 100.0 1.791 100.0
Source: NCvB statistiek, 2013-2016
In Spain, the CEPROSS electronic notification system (23) provides information on the number of recognised cases of occupational diseases resulting in sick leave. According to CEPROSS, in 2017, this number was 9,167. The number of cases has progressively increased each year since 2013 (when the total amounted to 7,174), whereas in 2012 and 2013 the figures were lower than in the previous year. By type of occupational disease, the highest number by far of recognised cases (7,404 recognised cases in total in 2017) corresponds to occupational diseases caused by physical factors (noise, vibrations, repetitive movements, forced postures, radiation and so on). Other important diseases are occupational diseases caused by biological agents (686 recognised cases) and occupational skin diseases caused by substances and agents not included in any of the other categories (411 recognised cases).
Regarding the average duration of sick leave (see Table 12), the average duration (for all recognised cases) is 78.88 days. Occupational diseases caused by carcinogens result in the longest sick leave (231.44 days), followed by occupational diseases caused by inhalation of substances and agents not included in other categories (114.40 days). Sick leave associated with physical factors has an average duration of 84.12 days (data for 2017).
Table 12: Number of recognised cases of occupational disease resulting in sick leave and average
duration (days), by group of occupational diseases, Spain, 2011-2017
Occupational disease groups 2011 2012 2013 2014 2015 2016 2017
Group 1 315 277 256 230 272 271 278
Group 2 6,609 6,046 5,811 5,979 6,61 7,363 7,404
Group 3 289 341 467 617 708 638 686
Group 4 352 308 288 266 314 335 370
Group 5 424 424 319 335 407 466 411
Group 6 19 14 33 28 9 18 18
Total 8,008 7,41 7,174 7,455 8,32 9,091 9,167 Average duration
Group 1 53.21 50.42 43.75 55.19 45.76 56.06 50.16
Group 2 62.93 66.91 62.58 66.14 70.68 71.83 84.12
Group 3 51.88 50.60 31.37 37.03 29.61 32.20 27.40
Group 4 88.80 104.18 88.85 93.24 99.71 96.16 114.40
(23) Ministerio de Trabajo, Migraciones y Seguridad Social (National Ministry of Labour, Migration and Social Security), Sistema
CEPROSS (Comunicación de Enfermedades Profesionales, Seguridad Social) de notificación electrónica [CEPROSS electronic notification system]. Available at: http://www.seg-social.es/wps/portal/wss/internet/EstadisticasPresupuestosEstudios/Estadisticas/EST231/2082
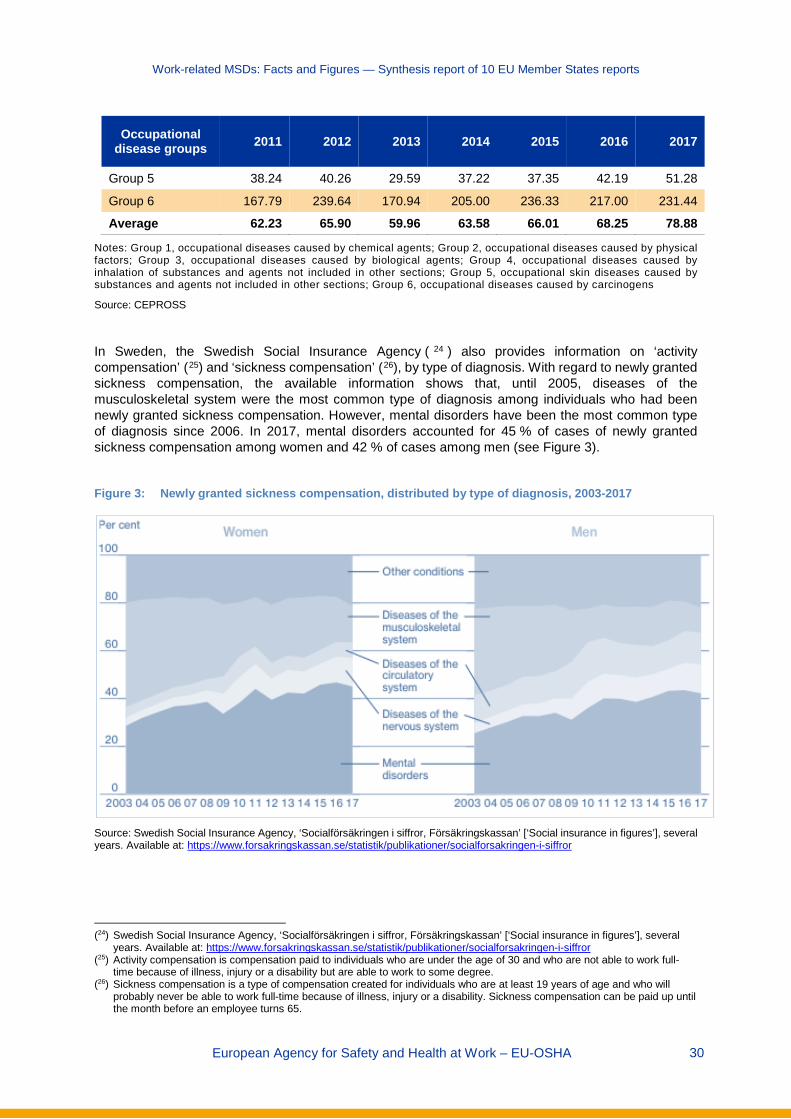
Work-related MSDs: Facts and Figures — Synthesis report of 10 EU Member States reports
European Agency for Safety and Health at Work – EU-OSHA 30
Occupational disease groups 2011 2012 2013 2014 2015 2016 2017
Group 5 38.24 40.26 29.59 37.22 37.35 42.19 51.28
Group 6 167.79 239.64 170.94 205.00 236.33 217.00 231.44
Average 62.23 65.90 59.96 63.58 66.01 68.25 78.88
Notes: Group 1, occupational diseases caused by chemical agents; Group 2, occupational diseases caused by physical factors; Group 3, occupational diseases caused by biological agents; Group 4, occupational diseases caused by inhalation of substances and agents not included in other sections; Group 5, occupational skin diseases caused by substances and agents not included in other sections; Group 6, occupational diseases caused by carcinogens
Source: CEPROSS
In Sweden, the Swedish Social Insurance Agency ( 24 ) also provides information on ‘activity compensation’ (25) and ‘sickness compensation’ (26), by type of diagnosis. With regard to newly granted sickness compensation, the available information shows that, until 2005, diseases of the musculoskeletal system were the most common type of diagnosis among individuals who had been newly granted sickness compensation. However, mental disorders have been the most common type of diagnosis since 2006. In 2017, mental disorders accounted for 45 % of cases of newly granted sickness compensation among women and 42 % of cases among men (see Figure 3).
Figure 3: Newly granted sickness compensation, distributed by type of diagnosis, 2003-2017
Source: Swedish Social Insurance Agency, ‘Socialförsäkringen i siffror, Försäkringskassan’ [‘Social insurance in figures’], several years. Available at: https://www.forsakringskassan.se/statistik/publikationer/socialforsakringen-i-siffror
(24) Swedish Social Insurance Agency, ‘Socialförsäkringen i siffror, Försäkringskassan’ [‘Social insurance in figures’], several
years. Available at: https://www.forsakringskassan.se/statistik/publikationer/socialforsakringen-i-siffror (25) Activity compensation is compensation paid to individuals who are under the age of 30 and who are not able to work full-
time because of illness, injury or a disability but are able to work to some degree. (26) Sickness compensation is a type of compensation created for individuals who are at least 19 years of age and who will
probably never be able to work full-time because of illness, injury or a disability. Sickness compensation can be paid up until the month before an employee turns 65.
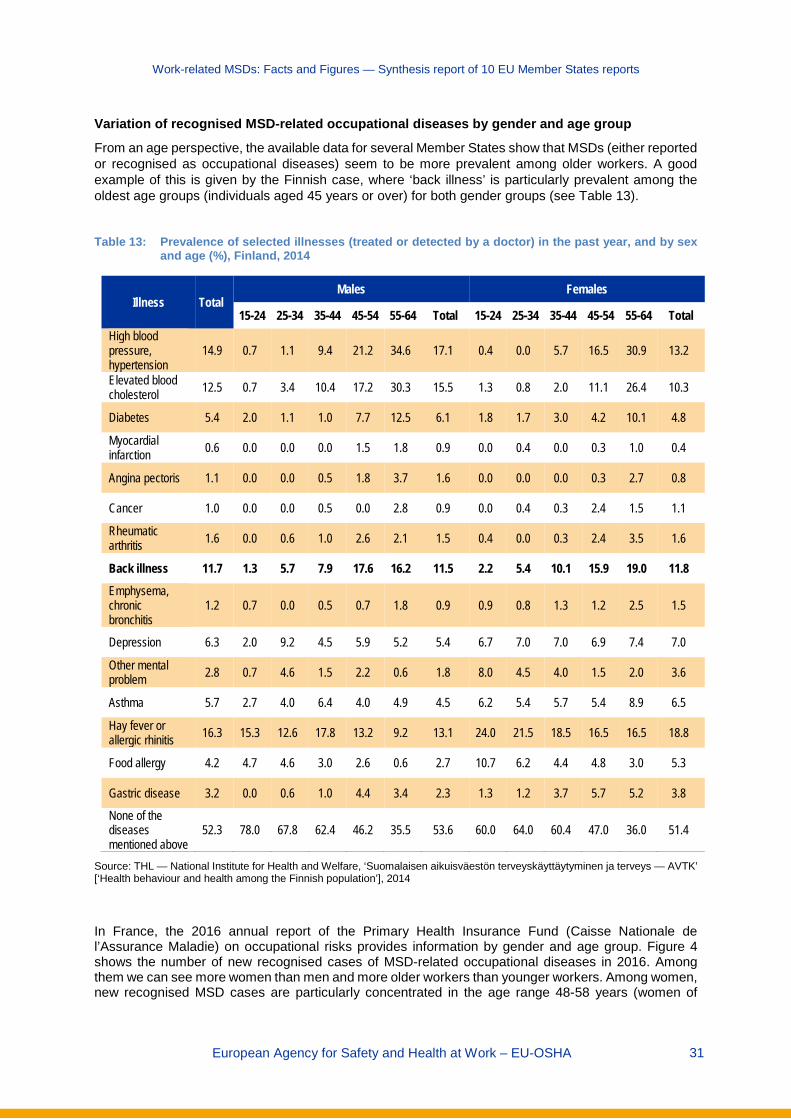
Work-related MSDs: Facts and Figures — Synthesis report of 10 EU Member States reports
European Agency for Safety and Health at Work – EU-OSHA 31
Variation of recognised MSD-related occupational diseases by gender and age group
From an age perspective, the available data for several Member States show that MSDs (either reported or recognised as occupational diseases) seem to be more prevalent among older workers. A good example of this is given by the Finnish case, where ‘back illness’ is particularly prevalent among the oldest age groups (individuals aged 45 years or over) for both gender groups (see Table 13).
Table 13: Prevalence of selected illnesses (treated or detected by a doctor) in the past year, and by sex
and age (%), Finland, 2014
Illness Total Males Females
15-24 25-34 35-44 45-54 55-64 Total 15-24 25-34 35-44 45-54 55-64 Total High blood pressure, hypertension
14.9 0.7 1.1 9.4 21.2 34.6 17.1 0.4 0.0 5.7 16.5 30.9 13.2
Elevated blood cholesterol 12.5 0.7 3.4 10.4 17.2 30.3 15.5 1.3 0.8 2.0 11.1 26.4 10.3
Diabetes 5.4 2.0 1.1 1.0 7.7 12.5 6.1 1.8 1.7 3.0 4.2 10.1 4.8
Myocardial infarction 0.6 0.0 0.0 0.0 1.5 1.8 0.9 0.0 0.4 0.0 0.3 1.0 0.4
Angina pectoris 1.1 0.0 0.0 0.5 1.8 3.7 1.6 0.0 0.0 0.0 0.3 2.7 0.8
Cancer 1.0 0.0 0.0 0.5 0.0 2.8 0.9 0.0 0.4 0.3 2.4 1.5 1.1
Rheumatic arthritis 1.6 0.0 0.6 1.0 2.6 2.1 1.5 0.4 0.0 0.3 2.4 3.5 1.6
Back illness 11.7 1.3 5.7 7.9 17.6 16.2 11.5 2.2 5.4 10.1 15.9 19.0 11.8
Emphysema, chronic bronchitis
1.2 0.7 0.0 0.5 0.7 1.8 0.9 0.9 0.8 1.3 1.2 2.5 1.5
Depression 6.3 2.0 9.2 4.5 5.9 5.2 5.4 6.7 7.0 7.0 6.9 7.4 7.0
Other mental problem 2.8 0.7 4.6 1.5 2.2 0.6 1.8 8.0 4.5 4.0 1.5 2.0 3.6
Asthma 5.7 2.7 4.0 6.4 4.0 4.9 4.5 6.2 5.4 5.7 5.4 8.9 6.5
Hay fever or allergic rhinitis 16.3 15.3 12.6 17.8 13.2 9.2 13.1 24.0 21.5 18.5 16.5 16.5 18.8
Food allergy 4.2 4.7 4.6 3.0 2.6 0.6 2.7 10.7 6.2 4.4 4.8 3.0 5.3
Gastric disease 3.2 0.0 0.6 1.0 4.4 3.4 2.3 1.3 1.2 3.7 5.7 5.2 3.8
None of the diseases mentioned above
52.3 78.0 67.8 62.4 46.2 35.5 53.6 60.0 64.0 60.4 47.0 36.0 51.4
Source: THL — National Institute for Health and Welfare, ‘Suomalaisen aikuisväestön terveyskäyttäytyminen ja terveys — AVTK’ [‘Health behaviour and health among the Finnish population’], 2014
In France, the 2016 annual report of the Primary Health Insurance Fund (Caisse Nationale de l’Assurance Maladie) on occupational risks provides information by gender and age group. Figure 4 shows the number of new recognised cases of MSD-related occupational diseases in 2016. Among them we can see more women than men and more older workers than younger workers. Among women, new recognised MSD cases are particularly concentrated in the age range 48-58 years (women of
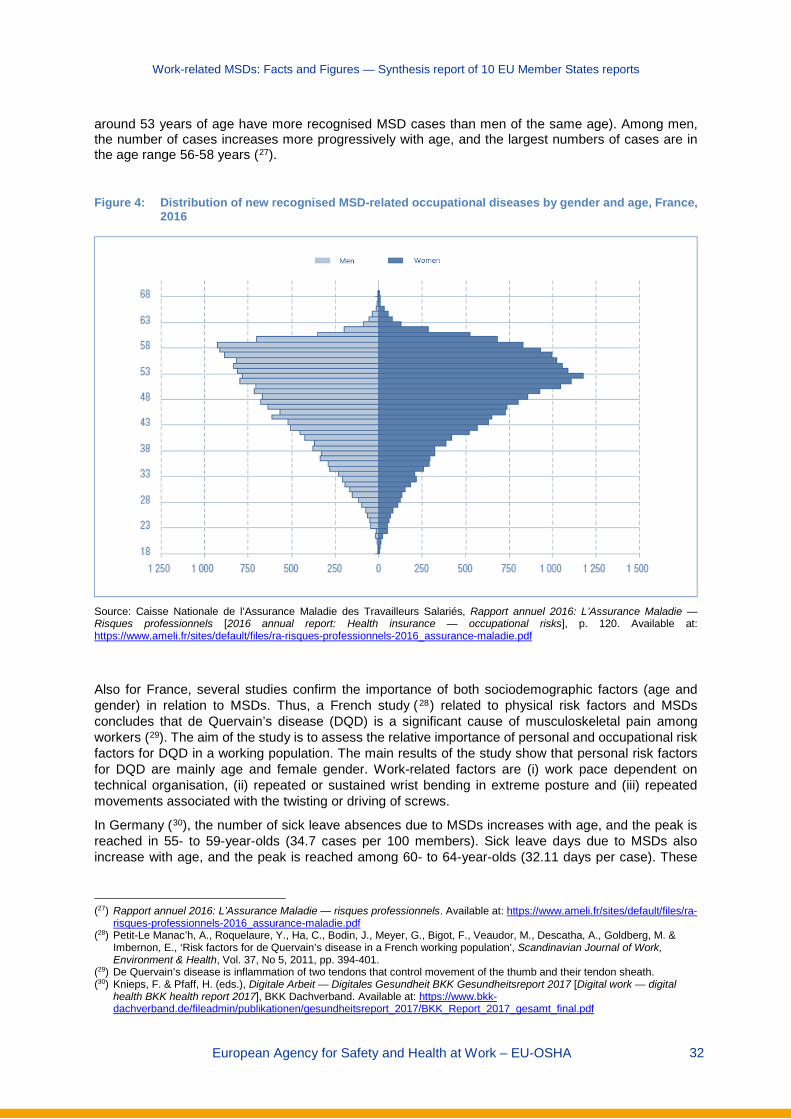
Work-related MSDs: Facts and Figures — Synthesis report of 10 EU Member States reports
European Agency for Safety and Health at Work – EU-OSHA 32
around 53 years of age have more recognised MSD cases than men of the same age). Among men, the number of cases increases more progressively with age, and the largest numbers of cases are in the age range 56-58 years (27).
Figure 4: Distribution of new recognised MSD-related occupational diseases by gender and age, France,
2016
Source: Caisse Nationale de l’Assurance Maladie des Travailleurs Salariés, Rapport annuel 2016: L’Assurance Maladie — Risques professionnels [2016 annual report: Health insurance — occupational risks], p. 120. Available at: https://www.ameli.fr/sites/default/files/ra-risques-professionnels-2016_assurance-maladie.pdf
Also for France, several studies confirm the importance of both sociodemographic factors (age and gender) in relation to MSDs. Thus, a French study ( 28) related to physical risk factors and MSDs concludes that de Quervain’s disease (DQD) is a significant cause of musculoskeletal pain among workers (29). The aim of the study is to assess the relative importance of personal and occupational risk factors for DQD in a working population. The main results of the study show that personal risk factors for DQD are mainly age and female gender. Work-related factors are (i) work pace dependent on technical organisation, (ii) repeated or sustained wrist bending in extreme posture and (iii) repeated movements associated with the twisting or driving of screws.
In Germany (30), the number of sick leave absences due to MSDs increases with age, and the peak is reached in 55- to 59-year-olds (34.7 cases per 100 members). Sick leave days due to MSDs also increase with age, and the peak is reached among 60- to 64-year-olds (32.11 days per case). These
(27) Rapport annuel 2016: L’Assurance Maladie — risques professionnels. Available at: https://www.ameli.fr/sites/default/files/ra-
risques-professionnels-2016_assurance-maladie.pdf (28) Petit-Le Manac’h, A., Roquelaure, Y., Ha, C., Bodin, J., Meyer, G., Bigot, F., Veaudor, M., Descatha, A., Goldberg, M. &
Imbernon, E., ‘Risk factors for de Quervain’s disease in a French working population’, Scandinavian Journal of Work, Environment & Health, Vol. 37, No 5, 2011, pp. 394-401.
(29) De Quervain’s disease is inflammation of two tendons that control movement of the thumb and their tendon sheath. (30) Knieps, F. & Pfaff, H. (eds.), Digitale Arbeit — Digitales Gesundheit BKK Gesundheitsreport 2017 [Digital work — digital
health BKK health report 2017], BKK Dachverband. Available at: https://www.bkk-dachverband.de/fileadmin/publikationen/gesundheitsreport_2017/BKK_Report_2017_gesamt_final.pdf

Work-related MSDs: Facts and Figures — Synthesis report of 10 EU Member States reports
European Agency for Safety and Health at Work – EU-OSHA 33
results apply to both men and women. Similarly, available national data (31) show that musculoskeletal and connective tissue disorders are the second most important underlying reason for new health-related retirement pensions because of reduced working capacity in Germany, after psychological/behavioural disorders. Access to new pensions due to MSD-related reduced working capacity in Germany is higher among women (10,938 new pensions among men and 11,878 among women, data for 2016).
In Italy, MSDs are the main type of recognised occupational disease for both genders, although they are slightly more common in women than in men (see Table 14). Thus, 69.8 % of the total recognised occupational diseases among women in Italy were related to MSDs in 2017, compared with 64.5 % among men. This trend of MSDs being more common in women was seen throughout the period 2014-2017. Differences by gender show that some specific MSDs are more common among men than women in relative terms (for instance, herniated discs and lumbar disorders associated with radiculopathy), whereas other specific MSDs (for instance, shoulder derangement and medial epicondylitis) are more prominent in women (also in relative terms). No important variations can be identified in the period 2014-2017 (see Table 15).
(31) BAuA, Arbeitswelt im Wandel, Zahlen — Daten — Fakten [The changing world of work: Figures — data — facts, 2018],
2018. Available at: https://www.baua.de/DE/Angebote/Publikationen/Praxis/A99.pdf?__blob=publicationFile&v=11
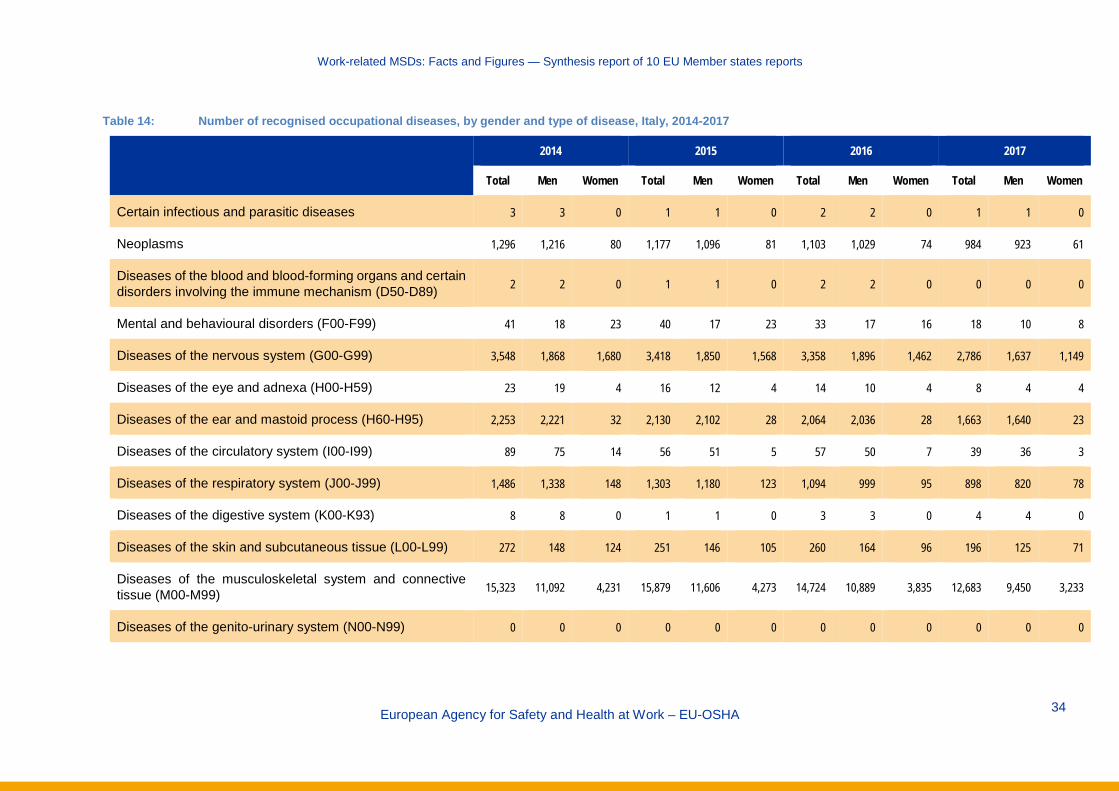
Work-related MSDs: Facts and Figures — Synthesis report of 10 EU Member states reports
European Agency for Safety and Health at Work – EU-OSHA
34
Table 14: Number of recognised occupational diseases, by gender and type of disease, Italy, 2014-2017
2014 2015 2016 2017
Total Men Women Total Men Women Total Men Women Total Men Women
Certain infectious and parasitic diseases 3 3 0 1 1 0 2 2 0 1 1 0
Neoplasms 1,296 1,216 80 1,177 1,096 81 1,103 1,029 74 984 923 61
Diseases of the blood and blood-forming organs and certain disorders involving the immune mechanism (D50-D89) 2 2 0 1 1 0 2 2 0 0 0 0
Mental and behavioural disorders (F00-F99) 41 18 23 40 17 23 33 17 16 18 10 8
Diseases of the nervous system (G00-G99) 3,548 1,868 1,680 3,418 1,850 1,568 3,358 1,896 1,462 2,786 1,637 1,149
Diseases of the eye and adnexa (H00-H59) 23 19 4 16 12 4 14 10 4 8 4 4
Diseases of the ear and mastoid process (H60-H95) 2,253 2,221 32 2,130 2,102 28 2,064 2,036 28 1,663 1,640 23
Diseases of the circulatory system (I00-I99) 89 75 14 56 51 5 57 50 7 39 36 3
Diseases of the respiratory system (J00-J99) 1,486 1,338 148 1,303 1,180 123 1,094 999 95 898 820 78
Diseases of the digestive system (K00-K93) 8 8 0 1 1 0 3 3 0 4 4 0
Diseases of the skin and subcutaneous tissue (L00-L99) 272 148 124 251 146 105 260 164 96 196 125 71
Diseases of the musculoskeletal system and connective tissue (M00-M99) 15,323 11,092 4,231 15,879 11,606 4,273 14,724 10,889 3,835 12,683 9,450 3,233
Diseases of the genito-urinary system (N00-N99) 0 0 0 0 0 0 0 0 0 0 0 0

Work-related MSDs: Facts and Figures — Synthesis report of 10 EU Member states reports
European Agency for Safety and Health at Work – EU-OSHA
35
2014 2015 2016 2017
Total Men Women Total Men Women Total Men Women Total Men Women
Injury, poisoning and certain other consequences of external causes (S00-T98) 2 2 0 1 1 0 3 2 1 3 1 2
Not determined 53 37 16 75 56 19 191 138 53 8 5 3
Total 24,399 18,047 6,352 24,349 18,120 6,229 22,908 17,237 5,671 19,291 14,656 4,635
Source: INAIL database
Table 15: Main recognised occupational diseases related to the musculoskeletal system, by gender, Italy, 2014-2017
2014 2015 2016 2017
Total Men Women Total Men Women Total Men Women Total Men Women
Herniated disc of other specified intervertebral disc disorder 4,007 3,208 799 4,086 3,261 825 3,280 2,689 591 2,648 2,177 471
Rotator cuff syndrome 2,709 1,862 847 2,718 1,921 797 2,788 1,949 839 2,543 1,829 714
Lumbar and other intervertebral disc disorders associated with radiculopathy 2,086 1,637 449 2,182 1,727 455 2,061 1,651 410 1,701 1,396 305
Shoulder derangement 1,538 983 555 1,796 1,156 640 1,683 1,128 555 1,326 886 440
Degeneration of other specified intervertebral disc 888 710 178 1,039 810 229 1,099 878 221 955 772 183
Medial epicondylitis 1,081 675 406 1,019 649 370 983 633 350 923 584 339

Work-related MSDs: Facts and Figures — Synthesis report of 10 EU Member states reports
European Agency for Safety and Health at Work – EU-OSHA
36
2014 2015 2016 2017
Total Men Women Total Men Women Total Men Women Total Men Women
Other meniscus derangements 411 394 17 369 354 15 409 397 12 387 379 8
Other synovitis and tenosynovitis 360 132 228 347 125 222 307 107 200 304 99 205
Lateral epicondylitis 218 137 81 235 161 74 303 191 112 282 196 86
Calcifying tendinitis of the shoulder 294 209 85 251 169 82 244 157 87 258 170 88
Other spondylolysis 235 199 36 319 286 33 273 239 34 218 192 26
Shoulder impingement” syndrome 287 198 89 278 196 82 294 206 88 218 171 47
Other MSD disorder 1,209 748 461 1,240 791 449 1,000 664 336 920 599 321
Total MSDs 15,323 11,092 4,231 15,879 11,606 4,273 14,724 10,889 3,835 12,683 9,450 3,233
Source: INAIL database
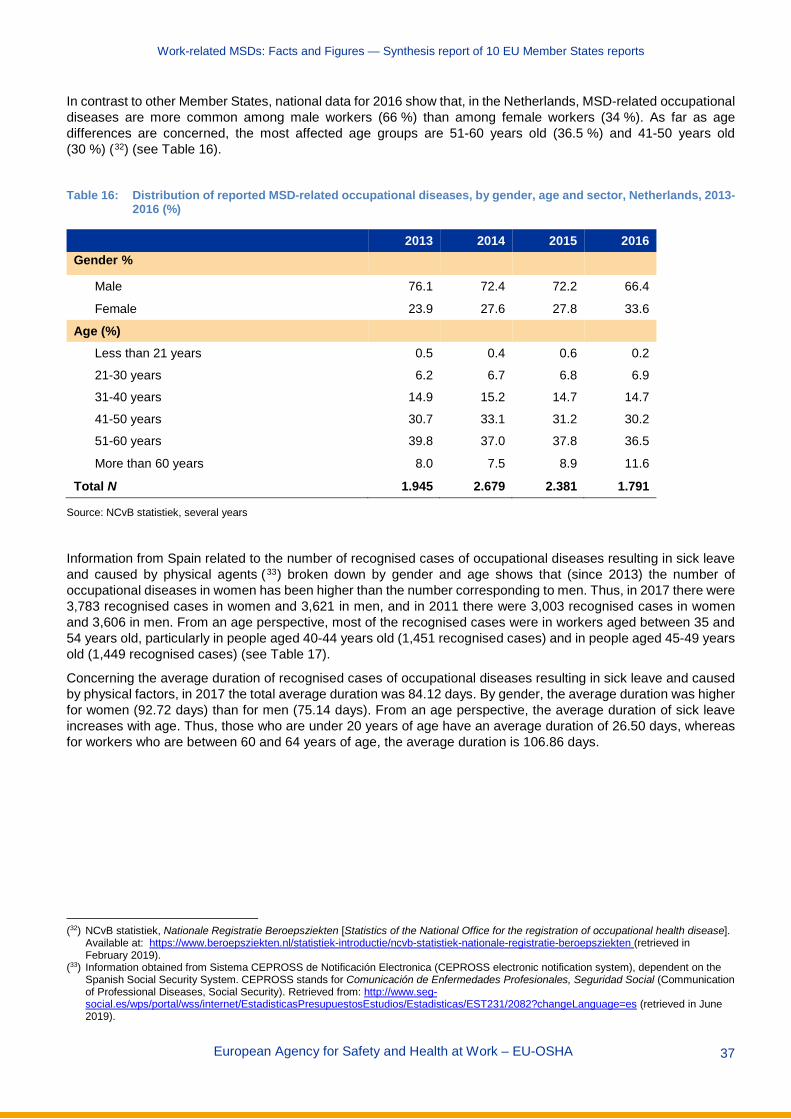
Work-related MSDs: Facts and Figures — Synthesis report of 10 EU Member States reports
European Agency for Safety and Health at Work – EU-OSHA 37
In contrast to other Member States, national data for 2016 show that, in the Netherlands, MSD-related occupational diseases are more common among male workers (66 %) than among female workers (34 %). As far as age differences are concerned, the most affected age groups are 51-60 years old (36.5 %) and 41-50 years old (30 %) (32) (see Table 16).
Table 16: Distribution of reported MSD-related occupational diseases, by gender, age and sector, Netherlands, 2013-
2016 (%)
2013 2014 2015 2016 Gender %
Male 76.1 72.4 72.2 66.4
Female 23.9 27.6 27.8 33.6
Age (%)
Less than 21 years 0.5 0.4 0.6 0.2
21-30 years 6.2 6.7 6.8 6.9
31-40 years 14.9 15.2 14.7 14.7
41-50 years 30.7 33.1 31.2 30.2
51-60 years 39.8 37.0 37.8 36.5
More than 60 years 8.0 7.5 8.9 11.6
Total N 1.945 2.679 2.381 1.791
Source: NCvB statistiek, several years
Information from Spain related to the number of recognised cases of occupational diseases resulting in sick leave and caused by physical agents (33) broken down by gender and age shows that (since 2013) the number of occupational diseases in women has been higher than the number corresponding to men. Thus, in 2017 there were 3,783 recognised cases in women and 3,621 in men, and in 2011 there were 3,003 recognised cases in women and 3,606 in men. From an age perspective, most of the recognised cases were in workers aged between 35 and 54 years old, particularly in people aged 40-44 years old (1,451 recognised cases) and in people aged 45-49 years old (1,449 recognised cases) (see Table 17).
Concerning the average duration of recognised cases of occupational diseases resulting in sick leave and caused by physical factors, in 2017 the total average duration was 84.12 days. By gender, the average duration was higher for women (92.72 days) than for men (75.14 days). From an age perspective, the average duration of sick leave increases with age. Thus, those who are under 20 years of age have an average duration of 26.50 days, whereas for workers who are between 60 and 64 years of age, the average duration is 106.86 days.
(32) NCvB statistiek, Nationale Registratie Beroepsziekten [Statistics of the National Office for the registration of occupational health disease].
Available at: https://www.beroepsziekten.nl/statistiek-introductie/ncvb-statistiek-nationale-registratie-beroepsziekten (retrieved in February 2019).
(33) Information obtained from Sistema CEPROSS de Notificación Electronica (CEPROSS electronic notification system), dependent on the Spanish Social Security System. CEPROSS stands for Comunicación de Enfermedades Profesionales, Seguridad Social (Communication of Professional Diseases, Social Security). Retrieved from: http://www.seg-social.es/wps/portal/wss/internet/EstadisticasPresupuestosEstudios/Estadisticas/EST231/2082?changeLanguage=es (retrieved in June 2019).
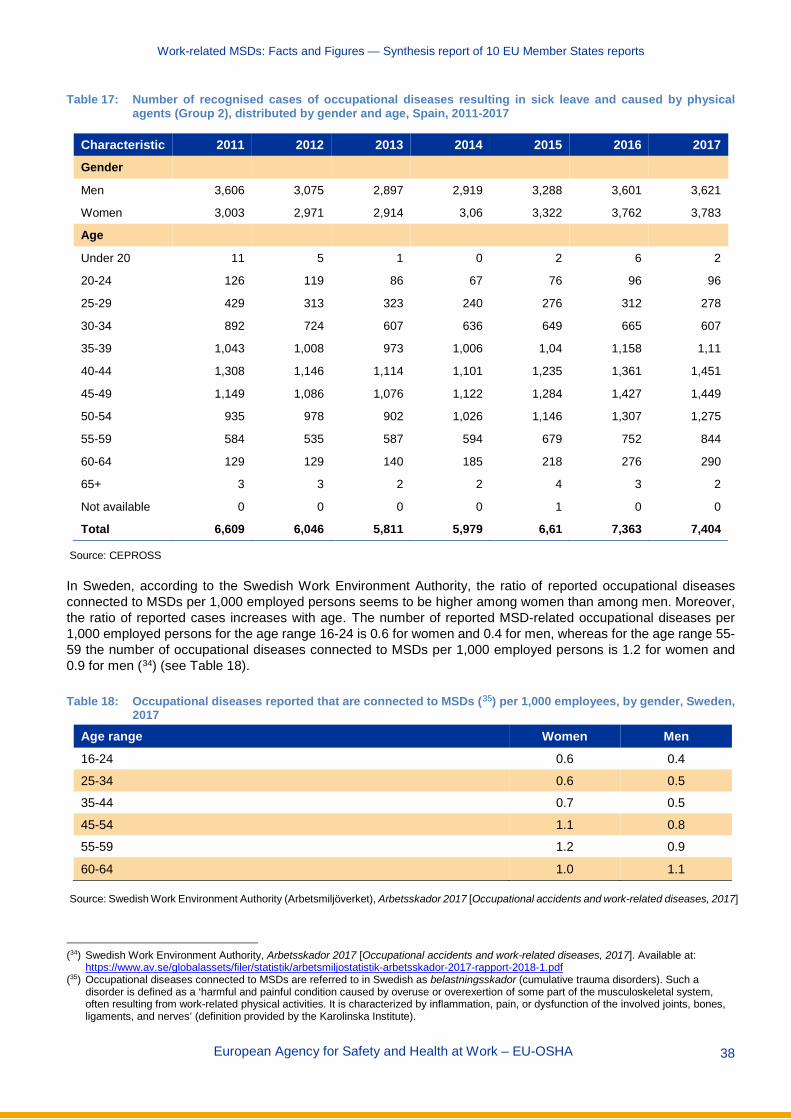
Work-related MSDs: Facts and Figures — Synthesis report of 10 EU Member States reports
European Agency for Safety and Health at Work – EU-OSHA 38
Table 17: Number of recognised cases of occupational diseases resulting in sick leave and caused by physical agents (Group 2), distributed by gender and age, Spain, 2011-2017
Characteristic 2011 2012 2013 2014 2015 2016 2017 Gender
Men 3,606 3,075 2,897 2,919 3,288 3,601 3,621
Women 3,003 2,971 2,914 3,06 3,322 3,762 3,783
Age
Under 20 11 5 1 0 2 6 2
20-24 126 119 86 67 76 96 96
25-29 429 313 323 240 276 312 278
30-34 892 724 607 636 649 665 607
35-39 1,043 1,008 973 1,006 1,04 1,158 1,11
40-44 1,308 1,146 1,114 1,101 1,235 1,361 1,451
45-49 1,149 1,086 1,076 1,122 1,284 1,427 1,449
50-54 935 978 902 1,026 1,146 1,307 1,275
55-59 584 535 587 594 679 752 844
60-64 129 129 140 185 218 276 290
65+ 3 3 2 2 4 3 2
Not available 0 0 0 0 1 0 0
Total 6,609 6,046 5,811 5,979 6,61 7,363 7,404
Source: CEPROSS
In Sweden, according to the Swedish Work Environment Authority, the ratio of reported occupational diseases connected to MSDs per 1,000 employed persons seems to be higher among women than among men. Moreover, the ratio of reported cases increases with age. The number of reported MSD-related occupational diseases per 1,000 employed persons for the age range 16-24 is 0.6 for women and 0.4 for men, whereas for the age range 55-59 the number of occupational diseases connected to MSDs per 1,000 employed persons is 1.2 for women and 0.9 for men (34) (see Table 18).
Table 18: Occupational diseases reported that are connected to MSDs (35) per 1,000 employees, by gender, Sweden, 2017
Age range Women Men 16-24 0.6 0.4
25-34 0.6 0.5
35-44 0.7 0.5
45-54 1.1 0.8
55-59 1.2 0.9
60-64 1.0 1.1
Source: Swedish Work Environment Authority (Arbetsmiljöverket), Arbetsskador 2017 [Occupational accidents and work-related diseases, 2017]
(34) Swedish Work Environment Authority, Arbetsskador 2017 [Occupational accidents and work-related diseases, 2017]. Available at:
https://www.av.se/globalassets/filer/statistik/arbetsmiljostatistik-arbetsskador-2017-rapport-2018-1.pdf (35) Occupational diseases connected to MSDs are referred to in Swedish as belastningsskador (cumulative trauma disorders). Such a
disorder is defined as a ‘harmful and painful condition caused by overuse or overexertion of some part of the musculoskeletal system, often resulting from work-related physical activities. It is characterized by inflammation, pain, or dysfunction of the involved joints, bones, ligaments, and nerves’ (definition provided by the Karolinska Institute).

Work-related MSDs: Facts and Figures — Synthesis report of 10 EU Member States reports
European Agency for Safety and Health at Work – EU-OSHA 39
Variation of recognised MSD-related occupational diseases by economic sector and occupation
There is a significant amount of national information showing that reported/recognised cases of MSDs seem to be more present in some specific sectors such as extractive industries, manufacturing, construction, agriculture/fisheries or transport activities, although there are some differences by Member State.
In Denmark (36), the three sectors that have the highest proportion of workers reporting MSDs as occupational diseases are transport, services and tourism (1,834 workers affected), welfare and public administration (1,748 workers affected) and industry (1,174) (data for 2016).
In France, the Caisse nationale de l’Assurance Maladie des Travailleurs Salariés provides data on the incidence of MSDs recognised as occupational diseases per 100,000 insured persons, by economic sector (see Table 19). One of the most frequently occurring syndromes is carpal tunnel syndrome (hand/wrist problems), with a total incidence of 71.7 cases per 100,000 insured persons. More precisely, it has a high incidence in some specific sectors, affecting particularly workers in sectors relating to wood, furniture, paper, cardboard, textiles, clothing, leather and skins, and stones; the food trade and related services; building and public works; and chemicals, rubber, plastics and metallurgy. Other frequently occurring syndromes are epicondylitis (elbow problems), with a total incidence of 39.8 (affecting particularly workers in chemicals, rubber, plastics and metallurgy, and in sectors relating to wood, furniture, paper, cardboard, textiles, clothing, leather and skins, and stones); and rotator cuff partial rupture (shoulder problems), with a total incidence of 34.4 (affecting particularly workers in building and public works, and in sectors relating to wood, furniture, paper, cardboard, textiles, clothing, leather and skins, and stones).
Table 19: Incidence of MSDs recognised as occupational diseases per 100,000 insured persons, by economic sectors, France, 2016
Part of the body Syndrome
Sectors
1 2 3 4 5 6 7 8 9 10
Elbow
Entrapment neuropathy of the ulnar nerve in the epitrochlear olecranon fossa
7.2 8.6 3.3 8.4 8.5 10.5 1.6 0.6 2.8 4.3
Arthrosis 0.5 1.6 0.0 0.0 0.0 0.0 0.1 0.0 0.0 0.2
Acute hygroma 0.2 0.3 0.0 0.0 0.0 0.2 0.0 0.0 0.0 0.0
Chronic hygroma 0.1 0.3 0.0 0.0 0.0 0.0 0.0 0.0 0.0 0.0
Epitrochleitis 11.0 8.3 4.0 11.4 10.7 14.0 3.5 0.8 4.6 5.8
Epicondylitis 71.9 67.4 24.5 71.1 74.4 106.4 18.3 6.5 34.6 39.8
Hand, wrist, finger
Angioneurotic conditions of hand 0.1 0.1 0.0 0.0 0.0 0.5 0.1 0.0 0.0 0.1
Osteonecrosis of the lunate (Kienböck’s disease) 0.7 1.4 0.0 0.0 0.0 0.5 0.0 0.0 0.0 0.2
Osteonecrosis of the scaphoid bone (Köhler’s disease) 0.1 0.1 0.0 0.0 0.0 0.0 0.0 0.0 0.0 0.0
Ulnar-palmar vascular disorder 0.6 0.5 0.0 0.1 0.0 1.0 0.0 0.0 0.0 0.2
Carpal tunnel syndrome 85.0 90.5 36.5 141.4 89.4 173.5 33.4 13.1 81.3 71.7
(36) Danish Working Environment Authority — digitally reported work-related diseases. Available at: https://amid.dk/viden-og-
forebyggelse/arbejdsskader/erhvervssygdomme/viden-om/statistik-om-erhvervssygdomme/
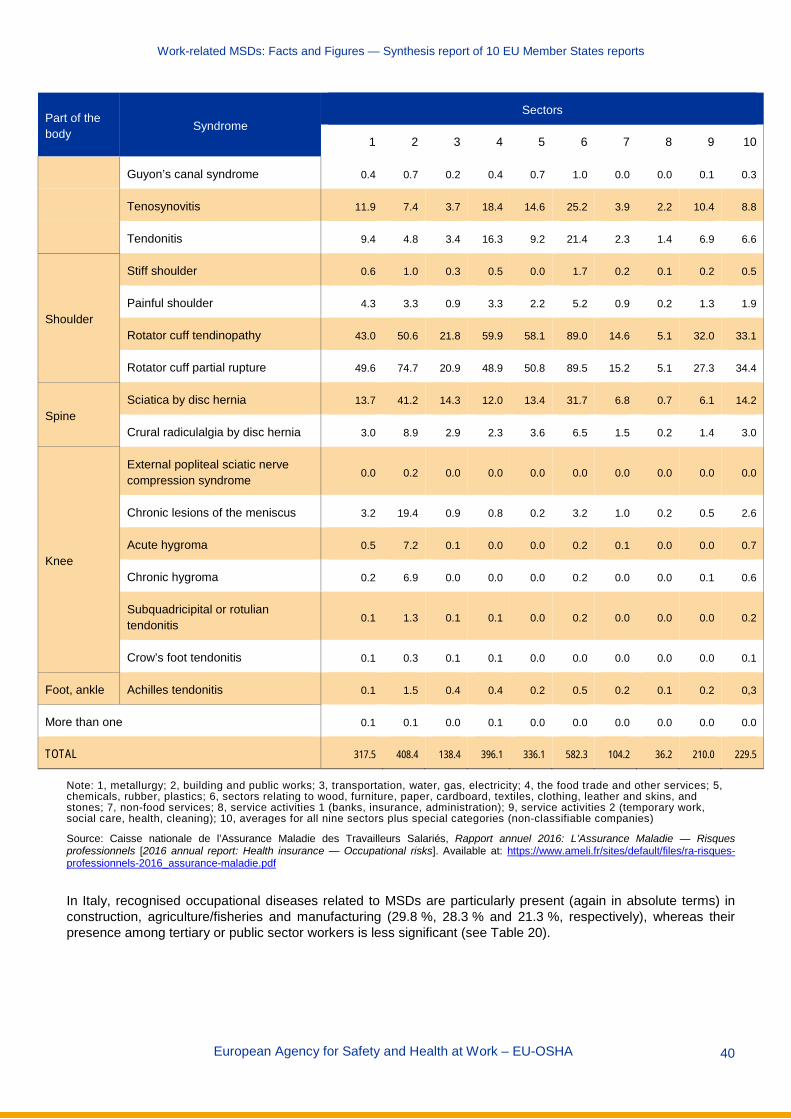
Work-related MSDs: Facts and Figures — Synthesis report of 10 EU Member States reports
European Agency for Safety and Health at Work – EU-OSHA 40
Part of the body Syndrome
Sectors
1 2 3 4 5 6 7 8 9 10
Guyon’s canal syndrome 0.4 0.7 0.2 0.4 0.7 1.0 0.0 0.0 0.1 0.3
Tenosynovitis 11.9 7.4 3.7 18.4 14.6 25.2 3.9 2.2 10.4 8.8
Tendonitis 9.4 4.8 3.4 16.3 9.2 21.4 2.3 1.4 6.9 6.6
Shoulder
Stiff shoulder 0.6 1.0 0.3 0.5 0.0 1.7 0.2 0.1 0.2 0.5
Painful shoulder 4.3 3.3 0.9 3.3 2.2 5.2 0.9 0.2 1.3 1.9
Rotator cuff tendinopathy 43.0 50.6 21.8 59.9 58.1 89.0 14.6 5.1 32.0 33.1
Rotator cuff partial rupture 49.6 74.7 20.9 48.9 50.8 89.5 15.2 5.1 27.3 34.4
Spine Sciatica by disc hernia 13.7 41.2 14.3 12.0 13.4 31.7 6.8 0.7 6.1 14.2
Crural radiculalgia by disc hernia 3.0 8.9 2.9 2.3 3.6 6.5 1.5 0.2 1.4 3.0
Knee
External popliteal sciatic nerve compression syndrome 0.0 0.2 0.0 0.0 0.0 0.0 0.0 0.0 0.0 0.0
Chronic lesions of the meniscus 3.2 19.4 0.9 0.8 0.2 3.2 1.0 0.2 0.5 2.6
Acute hygroma 0.5 7.2 0.1 0.0 0.0 0.2 0.1 0.0 0.0 0.7
Chronic hygroma 0.2 6.9 0.0 0.0 0.0 0.2 0.0 0.0 0.1 0.6
Subquadricipital or rotulian tendonitis 0.1 1.3 0.1 0.1 0.0 0.2 0.0 0.0 0.0 0.2
Crow’s foot tendonitis 0.1 0.3 0.1 0.1 0.0 0.0 0.0 0.0 0.0 0.1
Foot, ankle Achilles tendonitis 0.1 1.5 0.4 0.4 0.2 0.5 0.2 0.1 0.2 0,3
More than one 0.1 0.1 0.0 0.1 0.0 0.0 0.0 0.0 0.0 0.0
TOTAL 317.5 408.4 138.4 396.1 336.1 582.3 104.2 36.2 210.0 229.5
Note: 1, metallurgy; 2, building and public works; 3, transportation, water, gas, electricity; 4, the food trade and other services; 5, chemicals, rubber, plastics; 6, sectors relating to wood, furniture, paper, cardboard, textiles, clothing, leather and skins, and stones; 7, non-food services; 8, service activities 1 (banks, insurance, administration); 9, service activities 2 (temporary work, social care, health, cleaning); 10, averages for all nine sectors plus special categories (non-classifiable companies)
Source: Caisse nationale de l’Assurance Maladie des Travailleurs Salariés, Rapport annuel 2016: L’Assurance Maladie — Risques professionnels [2016 annual report: Health insurance — Occupational risks]. Available at: https://www.ameli.fr/sites/default/files/ra-risques-professionnels-2016_assurance-maladie.pdf
In Italy, recognised occupational diseases related to MSDs are particularly present (again in absolute terms) in construction, agriculture/fisheries and manufacturing (29.8 %, 28.3 % and 21.3 %, respectively), whereas their presence among tertiary or public sector workers is less significant (see Table 20).

Work-related MSDs: Facts and Figures — Synthesis report of 10 EU Member States reports
European Agency for Safety and Health at Work – EU-OSHA 41
Table 20: Number of recognised occupational diseases related to the musculoskeletal system by sector, Italy, 2017
Soft tissues diseases Dorsopathies Arthropathies Other MSDs Total
Agriculture/fisheries 1,774 1,733 87 0 3,594
Manufacturing 1,794 771 130 1 2,696
Construction 1,687 1,695 399 0 3,781
Service sector 1,088 1,11 58 0 2,256
Public administration 124 223 9 0 356
Total 6,467 5,532 683 1 12,683
Source: INAIL database
Figure 5 shows the incidence rate of occupational diseases resulting in sick leave and caused by physical factors, as registered by CEPROSS in Spain. The highest incidence rate (37) of occupational diseases resulting in sick leave was for sector C (manufacturing), which was 316.8 in 2017. Other sectors with high rates were sector N (administrative activities and auxiliary services) (128.2), sector E (water supply, sanitation activities, waste management and decontamination) (127.9) and sector F (construction) (124.5). Regarding the average duration of sick leave caused by physical factors, the longest average durations are found in sector B (the extractive industries), with 131.50 days on average; sector A (agriculture, livestock, hunting, forestry and fishing), with 108.87 days; and sector J (information and communications), with 106.48 days. These are well above the average number of days of sick leave for all sectors, which is 84.12 days.
Figure 5: Incidence rate of occupational diseases resulting in sick leave and caused by physical factors (group 2),
by economic sectors, Spain, 2017
(37) The incidence rate of professional diseases represents the number of recognised cases of occupational diseases resulting in sick leave
for every 100,000 workers exposed to the risk.
69.1
108.0
316.8
21.9
127.9 124.5104.9
29.4
96.5
9.8 3.1 10.615.9
128.2
45.348.335.736.7
111.3
8.8 0.0
122.099.4
0
50
100
150
200
250
300
350
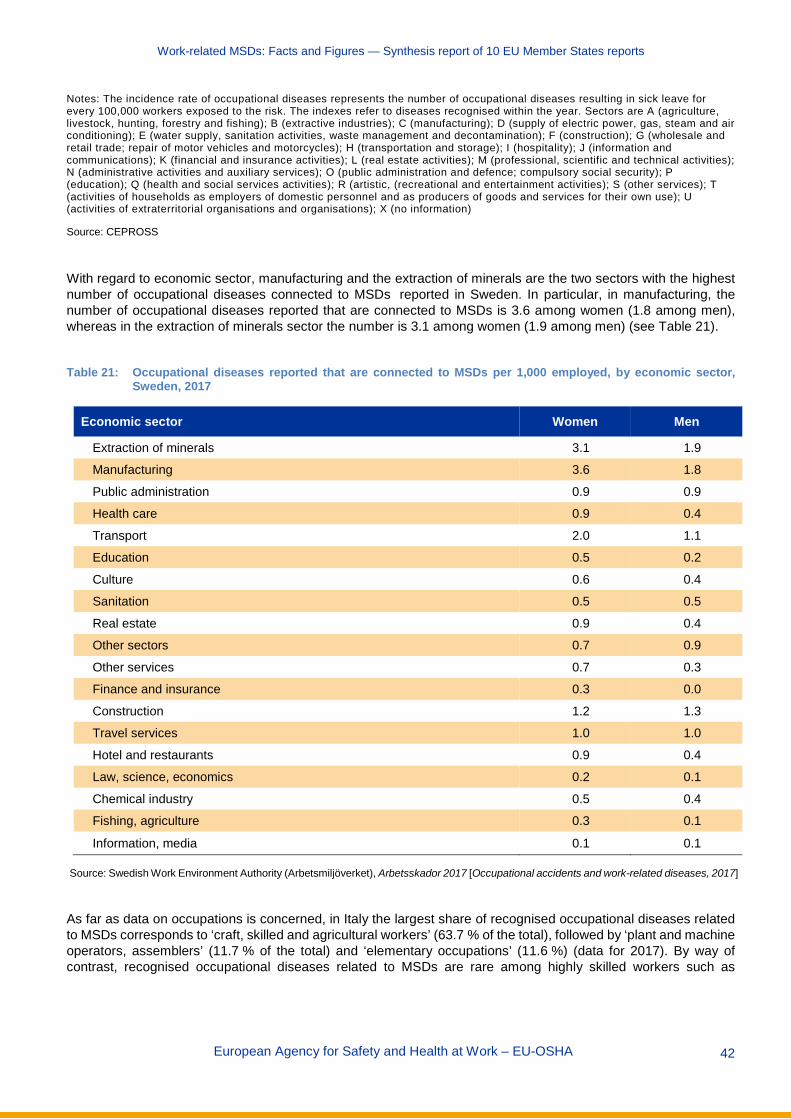
Work-related MSDs: Facts and Figures — Synthesis report of 10 EU Member States reports
European Agency for Safety and Health at Work – EU-OSHA 42
Notes: The incidence rate of occupational diseases represents the number of occupational diseases resulting in sick leave for every 100,000 workers exposed to the risk. The indexes refer to diseases recognised within the year. Sectors are A (agriculture, livestock, hunting, forestry and fishing); B (extractive industries); C (manufacturing); D (supply of electric power, gas, steam and air conditioning); E (water supply, sanitation activities, waste management and decontamination); F (construction); G (wholesale and retail trade; repair of motor vehicles and motorcycles); H (transportation and storage); I (hospitality); J (information and communications); K (financial and insurance activities); L (real estate activities); M (professional, scientific and technical activities); N (administrative activities and auxiliary services); O (public administration and defence; compulsory social security); P (education); Q (health and social services activities); R (artistic, (recreational and entertainment activities); S (other services); T (activities of households as employers of domestic personnel and as producers of goods and services for their own use); U (activities of extraterritorial organisations and organisations); X (no information)
Source: CEPROSS
With regard to economic sector, manufacturing and the extraction of minerals are the two sectors with the highest number of occupational diseases connected to MSDs reported in Sweden. In particular, in manufacturing, the number of occupational diseases reported that are connected to MSDs is 3.6 among women (1.8 among men), whereas in the extraction of minerals sector the number is 3.1 among women (1.9 among men) (see Table 21).
Table 21: Occupational diseases reported that are connected to MSDs per 1,000 employed, by economic sector,
Sweden, 2017
Economic sector Women Men
Extraction of minerals 3.1 1.9
Manufacturing 3.6 1.8
Public administration 0.9 0.9
Health care 0.9 0.4
Transport 2.0 1.1
Education 0.5 0.2
Culture 0.6 0.4
Sanitation 0.5 0.5
Real estate 0.9 0.4
Other sectors 0.7 0.9
Other services 0.7 0.3
Finance and insurance 0.3 0.0
Construction 1.2 1.3
Travel services 1.0 1.0
Hotel and restaurants 0.9 0.4
Law, science, economics 0.2 0.1
Chemical industry 0.5 0.4
Fishing, agriculture 0.3 0.1
Information, media 0.1 0.1
Source: Swedish Work Environment Authority (Arbetsmiljöverket), Arbetsskador 2017 [Occupational accidents and work-related diseases, 2017]
As far as data on occupations is concerned, in Italy the largest share of recognised occupational diseases related to MSDs corresponds to ‘craft, skilled and agricultural workers’ (63.7 % of the total), followed by ‘plant and machine operators, assemblers’ (11.7 % of the total) and ‘elementary occupations’ (11.6 %) (data for 2017). By way of contrast, recognised occupational diseases related to MSDs are rare among highly skilled workers such as

Work-related MSDs: Facts and Figures — Synthesis report of 10 EU Member States reports
European Agency for Safety and Health at Work – EU-OSHA 43
professionals or legislators/managers (see Table 22). Similarly, a French study (38) shows that the prevalence of spinal pain in working-class women was 35 %, compared with 22 % among female executives; spinal pain in working-class men was 35 %, compared with 25 % among male executives.
Table 22: Number of recognised occupational diseases related to the musculoskeletal system, by occupation, Italy,
2015-2017
2015 2016 2017
Legislators, senior officials and managers 101 73 103
Professionals 35 35 34
Technicians and associate professionals 577 433 382
Clerks 145 112 91
Service workers and shop and market sales workers 1,318 1,179 1,037
Craft, skilled and agricultural workers 10,012 9,588 8,082
Plant and machine operators, and assemblers 1,926 1,715 1,481
Elementary occupations 1,765 1,589 1,473
Total 15,879 14,724 12,683
Source: INAIL database
2.2.2 MSD-related accidents at work Data from national sources provide more detailed information on work-related accidents and MSDs. The examples below show information regarding the proportions of MSD-related work accidents among total work accidents for Spain, Sweden and the UK. In several cases, gender differences and differences between workers of different age groups are also mentioned.
In 2017 in Spain (see Table 23) there were a total of 515,082 work accidents resulting in sick leave, of which around 38 % (or 192,029 in absolute terms) were caused by musculoskeletal overload, well above other reasons such as a blow against a stationary object/worker in motion or a shock or hit against an object in motion (25 % and 14 % of total work accidents, respectively). Musculoskeletal overload was consistently the main cause of work accidents during the period 2014-2017.
In terms of the main causes (deviation) underpinning these MSD-related work accidents, two main deviations explain nearly 9 out of 10 of the existing MSD-related work accidents. These are body movement under/with physical stress, and body movement without any physical stress, representing 65 % and 24 % of the total MSD-related work accidents, respectively.
Finally, in terms of the body parts affected, the available information for 2017 shows that these MSD-related work accidents particularly affect three main areas, the back (including spine and thoracolumbar vertebrae) followed by upper limbs and lower limbs (37 %, 27 % and 25 % of the total cases, respectively) (39).
(38) Carton, M., Santin, G., Leclerc, A., Gueguen, A., Goldberg, M., Roquelaure, Y., Zins, M. & Descatha, A., ‘Prévalence des troubles
musculo-squelettiques et des facteurs biomécaniques d’origine professionnelle: premières estimations à partir de Constances [‘Prevalence of musculoskeletal disorders and occupational biomechanical factors: preliminary estimates from the French CONSTANCES cohort’], Bulletin Epidémiologique Hebdomadaire, No 35-36, 2016, pp. 630-639.
(39) Spanish Ministry of Labour, Migrations and Social Security, Estadísticas sobre accidentes de trabajo [Statistics on work accidents], several years. Available at: http://www.mitramiss.gob.es/estadisticas/eat/welcome.htm
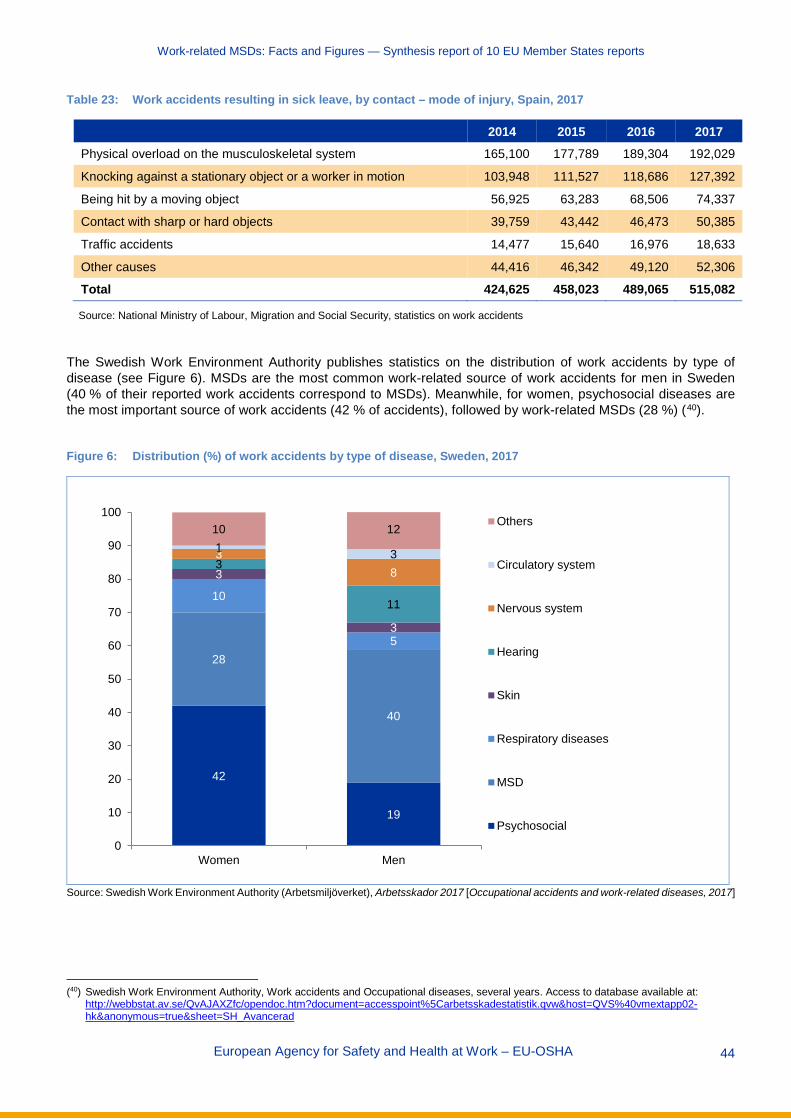
Work-related MSDs: Facts and Figures — Synthesis report of 10 EU Member States reports
European Agency for Safety and Health at Work – EU-OSHA 44
Table 23: Work accidents resulting in sick leave, by contact – mode of injury, Spain, 2017
2014 2015 2016 2017 Physical overload on the musculoskeletal system 165,100 177,789 189,304 192,029
Knocking against a stationary object or a worker in motion 103,948 111,527 118,686 127,392
Being hit by a moving object 56,925 63,283 68,506 74,337
Contact with sharp or hard objects 39,759 43,442 46,473 50,385
Traffic accidents 14,477 15,640 16,976 18,633
Other causes 44,416 46,342 49,120 52,306
Total 424,625 458,023 489,065 515,082
Source: National Ministry of Labour, Migration and Social Security, statistics on work accidents
The Swedish Work Environment Authority publishes statistics on the distribution of work accidents by type of disease (see Figure 6). MSDs are the most common work-related source of work accidents for men in Sweden (40 % of their reported work accidents correspond to MSDs). Meanwhile, for women, psychosocial diseases are the most important source of work accidents (42 % of accidents), followed by work-related MSDs (28 %) (40).
Figure 6: Distribution (%) of work accidents by type of disease, Sweden, 2017
Source: Swedish Work Environment Authority (Arbetsmiljöverket), Arbetsskador 2017 [Occupational accidents and work-related diseases, 2017]
(40) Swedish Work Environment Authority, Work accidents and Occupational diseases, several years. Access to database available at:
http://webbstat.av.se/QvAJAXZfc/opendoc.htm?document=accesspoint%5Carbetsskadestatistik.qvw&host=QVS%40vmextapp02-hk&anonymous=true&sheet=SH_Avancerad
42
19
28
40
10
5
3
3
3
11
38
1 3
10 12
0
10
20
30
40
50
60
70
80
90
100
Women Men
Others
Circulatory system
Nervous system
Hearing
Skin
Respiratory diseases
MSD
Psychosocial
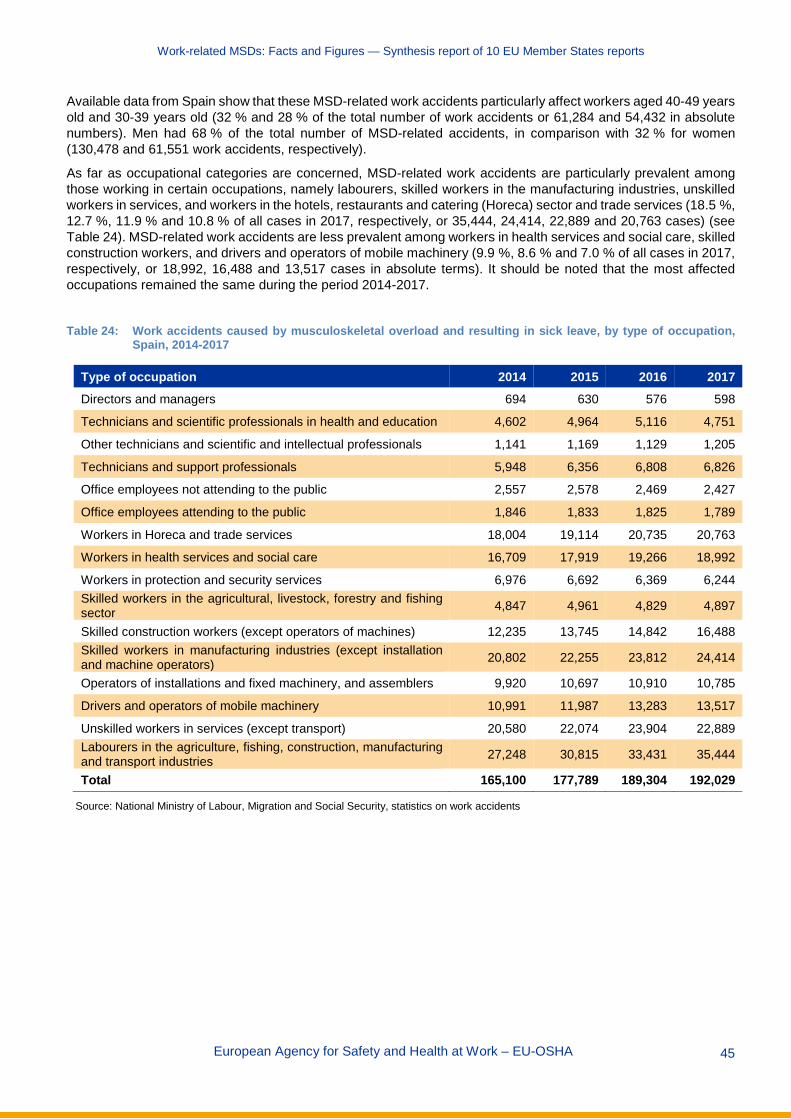
Work-related MSDs: Facts and Figures — Synthesis report of 10 EU Member States reports
European Agency for Safety and Health at Work – EU-OSHA 45
Available data from Spain show that these MSD-related work accidents particularly affect workers aged 40-49 years old and 30-39 years old (32 % and 28 % of the total number of work accidents or 61,284 and 54,432 in absolute numbers). Men had 68 % of the total number of MSD-related accidents, in comparison with 32 % for women (130,478 and 61,551 work accidents, respectively).
As far as occupational categories are concerned, MSD-related work accidents are particularly prevalent among those working in certain occupations, namely labourers, skilled workers in the manufacturing industries, unskilled workers in services, and workers in the hotels, restaurants and catering (Horeca) sector and trade services (18.5 %, 12.7 %, 11.9 % and 10.8 % of all cases in 2017, respectively, or 35,444, 24,414, 22,889 and 20,763 cases) (see Table 24). MSD-related work accidents are less prevalent among workers in health services and social care, skilled construction workers, and drivers and operators of mobile machinery (9.9 %, 8.6 % and 7.0 % of all cases in 2017, respectively, or 18,992, 16,488 and 13,517 cases in absolute terms). It should be noted that the most affected occupations remained the same during the period 2014-2017.
Table 24: Work accidents caused by musculoskeletal overload and resulting in sick leave, by type of occupation,
Spain, 2014-2017
Type of occupation 2014 2015 2016 2017 Directors and managers 694 630 576 598
Technicians and scientific professionals in health and education 4,602 4,964 5,116 4,751
Other technicians and scientific and intellectual professionals 1,141 1,169 1,129 1,205
Technicians and support professionals 5,948 6,356 6,808 6,826
Office employees not attending to the public 2,557 2,578 2,469 2,427
Office employees attending to the public 1,846 1,833 1,825 1,789
Workers in Horeca and trade services 18,004 19,114 20,735 20,763
Workers in health services and social care 16,709 17,919 19,266 18,992
Workers in protection and security services 6,976 6,692 6,369 6,244 Skilled workers in the agricultural, livestock, forestry and fishing sector 4,847 4,961 4,829 4,897
Skilled construction workers (except operators of machines) 12,235 13,745 14,842 16,488 Skilled workers in manufacturing industries (except installation and machine operators) 20,802 22,255 23,812 24,414
Operators of installations and fixed machinery, and assemblers 9,920 10,697 10,910 10,785
Drivers and operators of mobile machinery 10,991 11,987 13,283 13,517
Unskilled workers in services (except transport) 20,580 22,074 23,904 22,889 Labourers in the agriculture, fishing, construction, manufacturing and transport industries 27,248 30,815 33,431 35,444
Total 165,100 177,789 189,304 192,029
Source: National Ministry of Labour, Migration and Social Security, statistics on work accidents
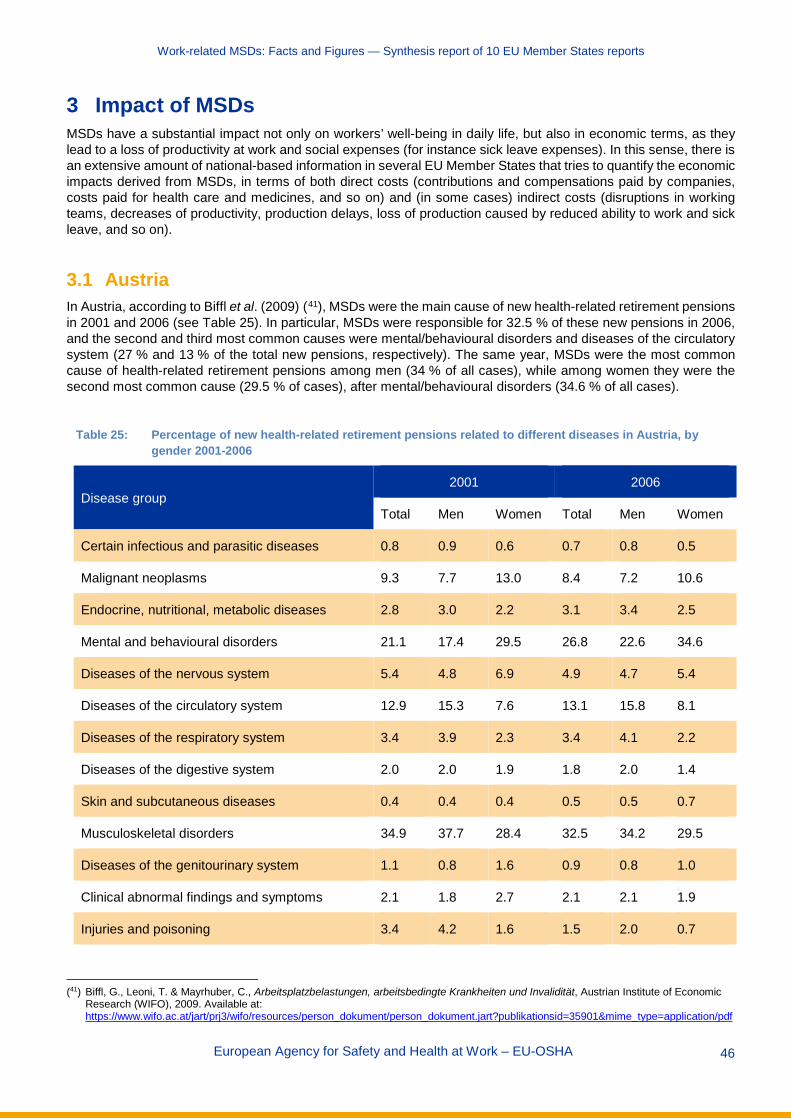
Work-related MSDs: Facts and Figures — Synthesis report of 10 EU Member States reports
European Agency for Safety and Health at Work – EU-OSHA 46
3 Impact of MSDs MSDs have a substantial impact not only on workers’ well-being in daily life, but also in economic terms, as they lead to a loss of productivity at work and social expenses (for instance sick leave expenses). In this sense, there is an extensive amount of national-based information in several EU Member States that tries to quantify the economic impacts derived from MSDs, in terms of both direct costs (contributions and compensations paid by companies, costs paid for health care and medicines, and so on) and (in some cases) indirect costs (disruptions in working teams, decreases of productivity, production delays, loss of production caused by reduced ability to work and sick leave, and so on).
3.1 Austria In Austria, according to Biffl et al. (2009) (41), MSDs were the main cause of new health-related retirement pensions in 2001 and 2006 (see Table 25). In particular, MSDs were responsible for 32.5 % of these new pensions in 2006, and the second and third most common causes were mental/behavioural disorders and diseases of the circulatory system (27 % and 13 % of the total new pensions, respectively). The same year, MSDs were the most common cause of health-related retirement pensions among men (34 % of all cases), while among women they were the second most common cause (29.5 % of cases), after mental/behavioural disorders (34.6 % of all cases).
Table 25: Percentage of new health-related retirement pensions related to different diseases in Austria, by gender 2001-2006
Disease group 2001 2006
Total Men Women Total Men Women
Certain infectious and parasitic diseases 0.8 0.9 0.6 0.7 0.8 0.5
Malignant neoplasms 9.3 7.7 13.0 8.4 7.2 10.6
Endocrine, nutritional, metabolic diseases 2.8 3.0 2.2 3.1 3.4 2.5
Mental and behavioural disorders 21.1 17.4 29.5 26.8 22.6 34.6
Diseases of the nervous system 5.4 4.8 6.9 4.9 4.7 5.4
Diseases of the circulatory system 12.9 15.3 7.6 13.1 15.8 8.1
Diseases of the respiratory system 3.4 3.9 2.3 3.4 4.1 2.2
Diseases of the digestive system 2.0 2.0 1.9 1.8 2.0 1.4
Skin and subcutaneous diseases 0.4 0.4 0.4 0.5 0.5 0.7
Musculoskeletal disorders 34.9 37.7 28.4 32.5 34.2 29.5
Diseases of the genitourinary system 1.1 0.8 1.6 0.9 0.8 1.0
Clinical abnormal findings and symptoms 2.1 1.8 2.7 2.1 2.1 1.9
Injuries and poisoning 3.4 4.2 1.6 1.5 2.0 0.7
(41) Biffl, G., Leoni, T. & Mayrhuber, C., Arbeitsplatzbelastungen, arbeitsbedingte Krankheiten und Invalidität, Austrian Institute of Economic
Research (WIFO), 2009. Available at: https://www.wifo.ac.at/jart/prj3/wifo/resources/person_dokument/person_dokument.jart?publikationsid=35901&mime_type=application/pdf
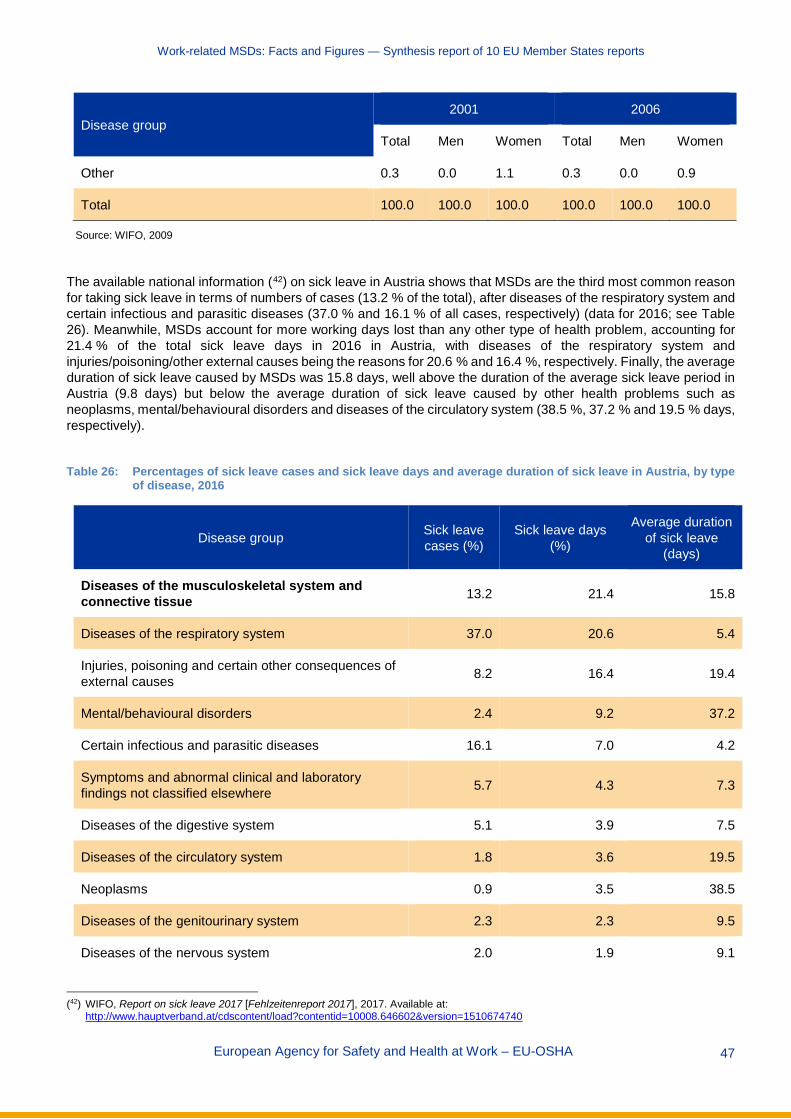
Work-related MSDs: Facts and Figures — Synthesis report of 10 EU Member States reports
European Agency for Safety and Health at Work – EU-OSHA 47
Disease group 2001 2006
Total Men Women Total Men Women
Other 0.3 0.0 1.1 0.3 0.0 0.9
Total 100.0 100.0 100.0 100.0 100.0 100.0
Source: WIFO, 2009
The available national information (42) on sick leave in Austria shows that MSDs are the third most common reason for taking sick leave in terms of numbers of cases (13.2 % of the total), after diseases of the respiratory system and certain infectious and parasitic diseases (37.0 % and 16.1 % of all cases, respectively) (data for 2016; see Table 26). Meanwhile, MSDs account for more working days lost than any other type of health problem, accounting for 21.4 % of the total sick leave days in 2016 in Austria, with diseases of the respiratory system and injuries/poisoning/other external causes being the reasons for 20.6 % and 16.4 %, respectively. Finally, the average duration of sick leave caused by MSDs was 15.8 days, well above the duration of the average sick leave period in Austria (9.8 days) but below the average duration of sick leave caused by other health problems such as neoplasms, mental/behavioural disorders and diseases of the circulatory system (38.5 %, 37.2 % and 19.5 % days, respectively).
Table 26: Percentages of sick leave cases and sick leave days and average duration of sick leave in Austria, by type
of disease, 2016
Disease group Sick leave cases (%)
Sick leave days (%)
Average duration of sick leave
(days)
Diseases of the musculoskeletal system and connective tissue 13.2 21.4 15.8
Diseases of the respiratory system 37.0 20.6 5.4
Injuries, poisoning and certain other consequences of external causes 8.2 16.4 19.4
Mental/behavioural disorders 2.4 9.2 37.2
Certain infectious and parasitic diseases 16.1 7.0 4.2
Symptoms and abnormal clinical and laboratory findings not classified elsewhere 5.7 4.3 7.3
Diseases of the digestive system 5.1 3.9 7.5
Diseases of the circulatory system 1.8 3.6 19.5
Neoplasms 0.9 3.5 38.5
Diseases of the genitourinary system 2.3 2.3 9.5
Diseases of the nervous system 2.0 1.9 9.1
(42) WIFO, Report on sick leave 2017 [Fehlzeitenreport 2017], 2017. Available at:
http://www.hauptverband.at/cdscontent/load?contentid=10008.646602&version=1510674740
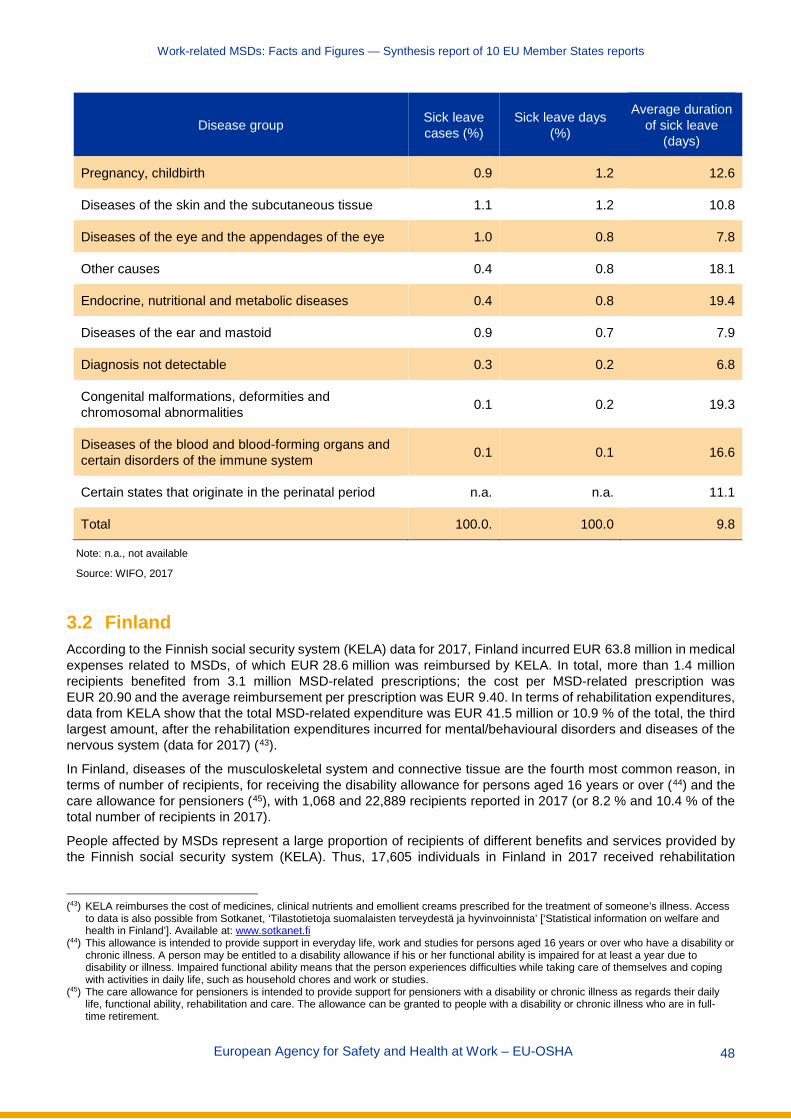
Work-related MSDs: Facts and Figures — Synthesis report of 10 EU Member States reports
European Agency for Safety and Health at Work – EU-OSHA 48
Disease group Sick leave cases (%)
Sick leave days (%)
Average duration of sick leave
(days)
Pregnancy, childbirth 0.9 1.2 12.6
Diseases of the skin and the subcutaneous tissue 1.1 1.2 10.8
Diseases of the eye and the appendages of the eye 1.0 0.8 7.8
Other causes 0.4 0.8 18.1
Endocrine, nutritional and metabolic diseases 0.4 0.8 19.4
Diseases of the ear and mastoid 0.9 0.7 7.9
Diagnosis not detectable 0.3 0.2 6.8
Congenital malformations, deformities and chromosomal abnormalities 0.1 0.2 19.3
Diseases of the blood and blood-forming organs and certain disorders of the immune system 0.1 0.1 16.6
Certain states that originate in the perinatal period n.a. n.a. 11.1
Total 100.0. 100.0 9.8
Note: n.a., not available
Source: WIFO, 2017
3.2 Finland According to the Finnish social security system (KELA) data for 2017, Finland incurred EUR 63.8 million in medical expenses related to MSDs, of which EUR 28.6 million was reimbursed by KELA. In total, more than 1.4 million recipients benefited from 3.1 million MSD-related prescriptions; the cost per MSD-related prescription was EUR 20.90 and the average reimbursement per prescription was EUR 9.40. In terms of rehabilitation expenditures, data from KELA show that the total MSD-related expenditure was EUR 41.5 million or 10.9 % of the total, the third largest amount, after the rehabilitation expenditures incurred for mental/behavioural disorders and diseases of the nervous system (data for 2017) (43).
In Finland, diseases of the musculoskeletal system and connective tissue are the fourth most common reason, in terms of number of recipients, for receiving the disability allowance for persons aged 16 years or over (44) and the care allowance for pensioners (45), with 1,068 and 22,889 recipients reported in 2017 (or 8.2 % and 10.4 % of the total number of recipients in 2017).
People affected by MSDs represent a large proportion of recipients of different benefits and services provided by the Finnish social security system (KELA). Thus, 17,605 individuals in Finland in 2017 received rehabilitation
(43) KELA reimburses the cost of medicines, clinical nutrients and emollient creams prescribed for the treatment of someone’s illness. Access
to data is also possible from Sotkanet, ‘Tilastotietoja suomalaisten terveydestä ja hyvinvoinnista’ [‘Statistical information on welfare and health in Finland’]. Available at: www.sotkanet.fi
(44) This allowance is intended to provide support in everyday life, work and studies for persons aged 16 years or over who have a disability or chronic illness. A person may be entitled to a disability allowance if his or her functional ability is impaired for at least a year due to disability or illness. Impaired functional ability means that the person experiences difficulties while taking care of themselves and coping with activities in daily life, such as household chores and work or studies.
(45) The care allowance for pensioners is intended to provide support for pensioners with a disability or chronic illness as regards their daily life, functional ability, rehabilitation and care. The allowance can be granted to people with a disability or chronic illness who are in full-time retirement.
Work-related MSDs: Facts and Figures — Synthesis report of 10 EU Member States reports
European Agency for Safety and Health at Work – EU-OSHA 49
services arranged by KELA as a result of MSDs. This amounts to approximately 16.2 % of the total number of recipients, and this figure was only surpassed by the number of people affected by mental/behavioural disorders (65,413 individuals or 60.2 % of the total). The importance of MSDs as ‘demanders’ of rehabilitation services was maintained throughout the period 2010-2017, although their relative weight has reduced since 2010.
3.3 France In France, work-related lower back pain resulted in 12.2 million lost work days, or 57,000 full-time equivalents. Estimates of the direct annual costs borne by companies exceed EUR 1 billion per year through their contributions to occupational accidents and diseases, while more than half (EUR 580 million) is related to sick day compensation (data for 2017) (46).
The Caisse primaire d’assurance maladie of the Loire Region provides information regarding the costs of different types of MSDs for French companies. In particular, it is estimated that the average cost to companies is EUR 17,000 for a back-related MSD, EUR 12,780 for a carpal tunnel-related MSD, EUR 52,759 for a rotator cuff tendinitis-related MSD and EUR 18,220 for an epicondylitis-related MSD. These estimations do not include the days of sick leave for the affected worker, which for back disorders are approximately 220 days, for carpal tunnel 151 days, for rotator cuff tendinitis 298 days and for epicondylitis 195 days.
Indirect costs of MSD-related problems include costs due to disruptions in working teams, decreases in productivity, production delays and so on. According to the French National Research and Safety Institute for the Prevention of Occupational Accidents and Diseases (INRS), these indirect costs could be up to 10 times higher than the direct costs for businesses (47).
3.4 Germany In Germany, according to BAuA (2018) (48), MSDs generate higher costs than all other disease diagnosis groups. It is estimated that EUR 17.2 billion production loss (production loss costs based on labour costs) and EUR 30.4 billion loss of gross value added (loss of labour productivity) arise from diseases of the musculoskeletal system. These represent 0.5 % and 1.0 % of Germany’s gross domestic product (GDP), respectively (data for 2016) (see Table 27).
Data by economic sectors show that the manufacturing sector suffers the highest economic losses due to MSDs, with EUR 6.45 million loss of production and EUR 10.63 million loss of gross value added. The public sector, including education and health sector, and other service providers follow, in which the loss of production equates to EUR 5.43 million, and the loss of gross value added equates to EUR 6.69 million (49).
Furthermore, musculoskeletal and connective tissue disorders are the second most common disease behind access to new pensions due to reduced working capacity in Germany, after psychological/behavioural disorders (10,938 new pensions among men and 11,878 among women). Access to new pensions due to MSDs and connective tissue disorders increased between 2014 and 2016.
(46) Assurance Maladie (AMELI), ‘Campagne de Prévention du Mal de Dos au Travail’ [‘Campaign to prevent back ache at work’], press
release, November 2019). Available at: https://www.ameli.fr/fileadmin/user_upload/documents/DP_Lombalgie-06112018.pdf (47) Information obtained from the INRS, ‘Dossier lombalgie’ [‘Low back pain dossier’], Paris, 2018. Available at:
http://www.inrs.fr/dms/inrs/GenerationPDF/accueil/risques/lombalgies/Lombalgie.pdf (48) BAuA, Arbeitswelt im Wandel: Zahlen — Daten — Fakten [Changing working world: Facts and figures], 2018. Available at:
https://www.baua.de/DE/Angebote/Publikationen/Praxis/A99.pdf?__blob=publicationFile&v=11 (49) BAuA, Sicherheit und Gesundheit bei der Arbeit — Berichtsjahr 2016: Unfallverhütungsbericht Arbeit [Safety and health at work report,
2016], 2016. Available at: https://www.baua.de/DE/Angebote/Publikationen/Berichte/pdf/Suga-2016-barrierefrei.pdf?__blob=publicationFile&v=2
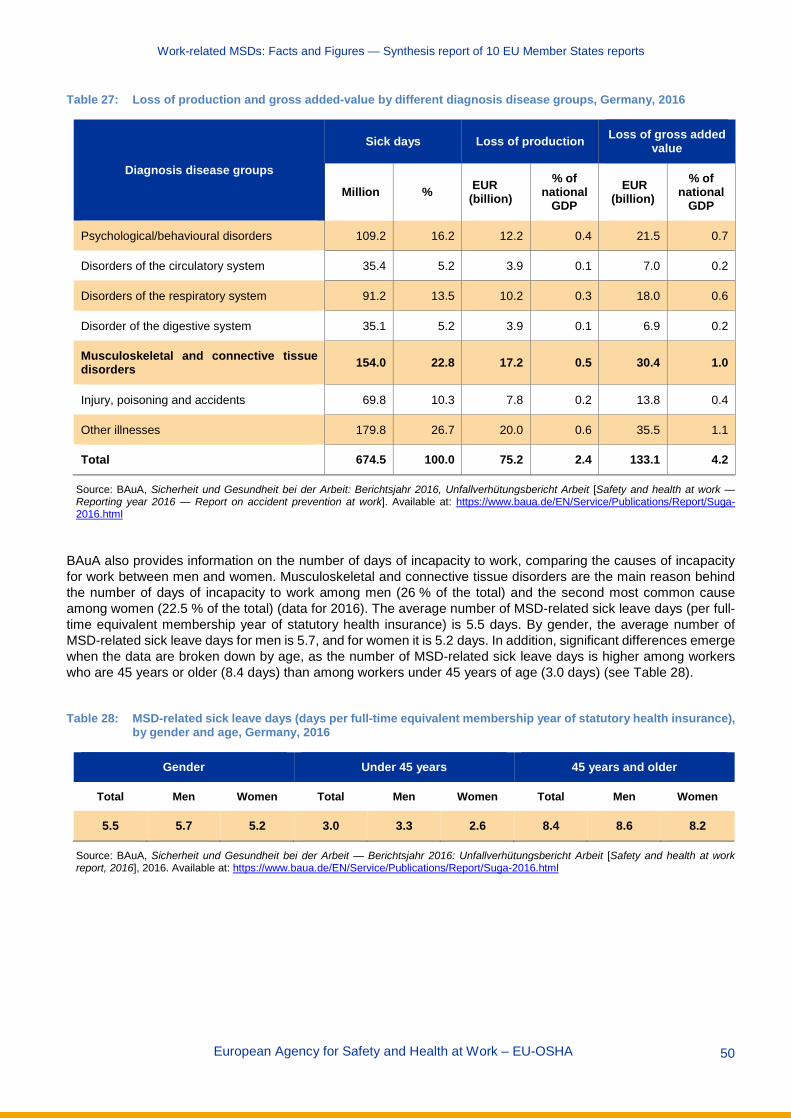
Work-related MSDs: Facts and Figures — Synthesis report of 10 EU Member States reports
European Agency for Safety and Health at Work – EU-OSHA 50
Table 27: Loss of production and gross added-value by different diagnosis disease groups, Germany, 2016
Diagnosis disease groups
Sick days Loss of production Loss of gross added value
Million % EUR (billion)
% of national
GDP EUR
(billion) % of
national GDP
Psychological/behavioural disorders 109.2 16.2 12.2 0.4 21.5 0.7
Disorders of the circulatory system 35.4 5.2 3.9 0.1 7.0 0.2
Disorders of the respiratory system 91.2 13.5 10.2 0.3 18.0 0.6
Disorder of the digestive system 35.1 5.2 3.9 0.1 6.9 0.2
Musculoskeletal and connective tissue disorders 154.0 22.8 17.2 0.5 30.4 1.0
Injury, poisoning and accidents 69.8 10.3 7.8 0.2 13.8 0.4
Other illnesses 179.8 26.7 20.0 0.6 35.5 1.1
Total 674.5 100.0 75.2 2.4 133.1 4.2
Source: BAuA, Sicherheit und Gesundheit bei der Arbeit: Berichtsjahr 2016, Unfallverhütungsbericht Arbeit [Safety and health at work — Reporting year 2016 — Report on accident prevention at work]. Available at: https://www.baua.de/EN/Service/Publications/Report/Suga-2016.html
BAuA also provides information on the number of days of incapacity to work, comparing the causes of incapacity for work between men and women. Musculoskeletal and connective tissue disorders are the main reason behind the number of days of incapacity to work among men (26 % of the total) and the second most common cause among women (22.5 % of the total) (data for 2016). The average number of MSD-related sick leave days (per full-time equivalent membership year of statutory health insurance) is 5.5 days. By gender, the average number of MSD-related sick leave days for men is 5.7, and for women it is 5.2 days. In addition, significant differences emerge when the data are broken down by age, as the number of MSD-related sick leave days is higher among workers who are 45 years or older (8.4 days) than among workers under 45 years of age (3.0 days) (see Table 28).
Table 28: MSD-related sick leave days (days per full-time equivalent membership year of statutory health insurance),
by gender and age, Germany, 2016
Gender Under 45 years 45 years and older
Total Men Women Total Men Women Total Men Women
5.5 5.7 5.2 3.0 3.3 2.6 8.4 8.6 8.2
Source: BAuA, Sicherheit und Gesundheit bei der Arbeit — Berichtsjahr 2016: Unfallverhütungsbericht Arbeit [Safety and health at work report, 2016], 2016. Available at: https://www.baua.de/EN/Service/Publications/Report/Suga-2016.html

Work-related MSDs: Facts and Figures — Synthesis report of 10 EU Member States reports
European Agency for Safety and Health at Work – EU-OSHA 51
The BKK health report for 2017 (50) presents and evaluates key figures concerning the distribution of sick leave among members insured by the health insurance funds (BKK) (51). Some interesting MSD-related results can be summarised as follows:
Back pain is the main MSD-related problem. This type of MSD is more frequent among men than among women, in that there are 97.91 cases of back pain among men per 1,000 members, versus 72.60 cases among women. However, the number of days per case is slightly higher among women (14.9 days among women in comparison with 14.0 among men) (see table 29).
Table 29: Numbers of sick leave cases and days taken due to MSDs in Germany, by gender and type of MSD, 2016
Type of MSD
Cases per 1,000 members
Days per 1,000 members Days per case
Men Women Men Women Men Women
Back pain (M54) 97.91 72.60 1371.1 1080.8 14.0 14.9
Other joint diseases, not classified elsewhere (M25) 13.84 9.02 241.3 177.0 17.4 19.6
Shoulder lesion (M75) 12.20 9.61 388.7 323.7 31.8 33.7
Other enthesopathies (M77) 11.55 8.61 197.9 169.5 17.1 19.7
Other intervertebral disc damage (M51) 11.34 8.37 374.8 307.6 33.1 36.8
Internal damage to the knee joint (M23) 10.54 6.29 321.5 212.4 30.5 33.7
Gonarthrosis (M17) 5.72 4.02 217.1 181.0 37.9 45.0
Source: Knieps, F. & Pfaff, H., Digitale Arbeit — Digitales Gesundheit BKK Gesundheitsreport 2017 [Digital work — digital health BKK health report 2017], BKK Dachverband. Available at: https://www.bkk-dachverband.de/fileadmin/publikationen/gesundheitsreport_2017/BKK_Report_2017_gesamt_final.pdf
In general, the number of sick days taken increased significantly between 2015 and 2016, namely from
15.4 to 17.4 per individual. MSDs are still the most frequently reported reason, accounting for 25.2 % of all days lost. Looking at the period between 2006 and 2016, and especially the period between 2015 and 2016, the increase in sick leave taken due to MSDs becomes obvious. Here, back pain is the main reason among MSDs, accounting for 1,242 sick leave days per 1,000 members. In addition, MSDs account for the largest proportion of sick days among the main groups of diagnoses, accounting for 29.8 %.
In addition, looking at sick leave due to MSDs in 2016, on average, the number of absences per 100 members is 22.1, whereas the total number of days per 100 members is 440 days. This results in 19.91 days per absence.
Comparing men and women, it becomes clear that men accumulate significantly more sick leave days due to MSDs. On average, among men there were 24.4 cases of sick leave due to MSDs per 100 members (resulting in 464.3 days per 100 members), whereas among women there were 19.3 cases per 100 members (and 409.6 days).
(50) Knieps, F. & Pfaff, H., Digitale Arbeit — Digitales Gesundheit BKK Gesundheitsreport 2017 [Digital work — Digital health BKK health
report 2017], BKK Dachverband. Available at: https://www.bkk-dachverband.de/fileadmin/publikationen/gesundheitsreport_2017/BKK_Report_2017_gesamt_final.pdf
(51) BKK is the organisation representing 76 health insurance funds in Germany.

Work-related MSDs: Facts and Figures — Synthesis report of 10 EU Member States reports
European Agency for Safety and Health at Work – EU-OSHA 52
The number of sick leave absences due to MSDs increases with age, and the peak is reached in 55- to 59-year-olds (34.7 cases per 100 members). Sick leave days due to MSDs also increase with age, and the peak is reached among 60- to 64-year-olds (32.11 days per case). These results apply to both men and women.
In addition, the BKK health report 2017 (52) presents and evaluates key figures concerning the distribution of sick leave among members insured by the health insurance funds (BKK) according to some sociodemographic characteristics of workers. The most relevant results can be summarised as follows (see table 30):
Available data show that the higher an employee’s educational or occupational level, the fewer sick leave days taken. In particular, days of absence due to MSDs among employees with low levels of school or vocational qualifications are significantly higher than among those with higher degrees. In addition, sick leave days due to MSDs are more prevalent in very physically demanding occupations (for example in manufacturing and construction).
Higher job requirements are associated with lower absenteeism. This correlation is particularly evident in the number of sick days due to MSDs, which differ more than four-fold between the highest and lowest skill levels. Employees in supervisory or managerial positions have less absenteeism due to illness than other skilled employees, which is particularly evident for sick leave days due to MSDs.
Looking at the workers’ employment situation, sick leave cases per 100 members are higher among employed members than among unemployed members (23.53 and 18.57, respectively). However, the number of days per case is noticeably higher among the unemployed (47.6 days per case for the unemployed and 19.4 days per case for the employed).
For members employed part-time, sick leave cases per 100 members are lower than the average for all the employed (21.20 cases among the part-time employed compared with 23.53 cases among the employed), but the number of days per case is slightly higher (21.9 days among the part-time employed compared with 19.4 days among the average of all employed members).
Table 30: Sick leave cases due to MSDs in Germany, by employment status, 2016
Employment status Sick leave - cases per 100 members
Sick leave days per 100 members
Days per case
All Employed members
Men 25.99 482.7 18.6
Women 20.46 422.6 20.7
Average 23.53 456.0 19.4
Unemployed members
Men 18.76 919.2 49.0
Women 18.37 844.3 46.0
Average 18.57 883.6 47.6
Part-time employed members
Men 20.35 398.4 19.6
Women 21.36 476.2 22.3
Average 21.20 464.0 21.9
Source: Kneips F, Pfaff H, Digital work — Digital health BKK health report 2017 (Digitale Arbeit — Digitales Gesundheit BKK Gesundheitsreport 2017, BKK Dachverband). Available at:https://www.bkk-dachverband.de/fileadmin/publikationen/gesundheitsreport_2017/BKK_Report_2017_gesamt_final.pdf
(52) Knieps, F. & Pfaff, H., Digitale Arbeit — Digitales Gesundheit BKK Gesundheitsreport 2017 [Digital work — digital health BKK health
report 2017], BKK Dachverband). Available at: https://www.bkk-dachverband.de/fileadmin/publikationen/gesundheitsreport_2017/BKK_Report_2017_gesamt_final.pdf

Work-related MSDs: Facts and Figures — Synthesis report of 10 EU Member States reports
European Agency for Safety and Health at Work – EU-OSHA 53
3.5 Hungary In Hungary, available national information shows that the MSD-related benefits paid by the National Health Insurance Fund of Hungary (NEAK) experienced a remarkable upward trend in the period 2015-2017, whereas the number of patients remained relatively stable.
The data set out above can be complemented with some national data related to the impact of MSDs on the benefits paid to patients by the NEAK (53). According to the available data, the MSD-related benefits paid in 2017 amounted to EUR 360,867,297, paid to more than 2.8 million patients. The number of patients remained relatively stable during the period 2015-2017, whereas the amount of benefits saw a remarkable upwards trend (see Table 31)
Table 31: Number of MSD patients and benefits (in euros) paid by NEAK by type of MSD in Hungary, 2015-2017
ICD-10 diseases Number of patients (*) Benefits paid by NEAK related to patients
(EUR)
2015 2016 2017 2015 2016 2017
Mononeuropathies of upper and lower limb (G56-G57) 40,069 42,514 43,571 3,296,945 4,058,785 5,045,575
Arthropathies (M00-M25) 1,900,724 1,924,393 1,892,183 138,050,687 148,505,677 161,276,660
Systemic connective tissue disorders (M30-M36) 32.098 32,339 31,322 5,669,738 6,384,457 7,606,417
Dorsopathies (M40-M54) 2,117,731 2,126,626 2,059,367 111,047,889 116,808,497 131,181,688
Soft tissue disorders (M60-M79) 647,293 668,050 658,835 14,001,916 15,591,242 18,720,733
Osteopathies and chondropathies (M80-M94) 679,979 681,437 671,958 30,367,255 31,215,804 32,391,173
Other disorders of the musculoskeletal system and connective tissue (M95-M99) 31,448 27,829 25,729 4,129,942 4,004,494 4,645,051
Total MSDs 2,784,132 2,803,272 2,778,987 306,564,371 326,568,956 360,867,297
(*) One patient may have more than one ICD-10 disease. Note: Exchange rate: EUR 1 = HUF 323.55
Source: NEAK, ad hoc analysis
3.6 Netherlands In the Netherlands, information from the National Working Conditions Survey in 2017 (54) shows that the main reason for Dutch workers (excluding the self-employed) to take sick leave was influenza or common cold (35 % of cases), followed by complaints of the digestive system (6 %) and back complaints (5 %) (see Table 32). For self-employed workers, the main reason for taking sick leave was again influenza/common cold (31 %), followed by back complaints (8 %) and complaints of the neck, shoulders, arms and so on (5.5 %) (data retrieved from Netherlands Survey of the Self-Employed, 2017) (55).
(53) NEAK — National Health Insurance Fund of Hungary, A Nemzeti Egészségbiztosítási Alapkezelő — NEAK adatbázisa [Database of the
NEAK] (no internet access). (54) TNO, Nationale Enquête Arbeidsomstandigheden 2017 (Netherlands working conditions survey). Available at: https://www.cbs.nl/nl-
nl/publicatie/2018/16/nationale-enquete-arbeidsomstandigheden-2017 (55) Lautenbach, H., van der Torre, W., de Vroome, E. M. M., Janssen, B. J. M., Wouters, B. & van den Bossche, S. N. J., Zelfstandigen
Enquête Arbeid 2017, Centraal Bureau voor de Statistiek, The Hague, 2017. Available at: https://www.monitorarbeid.tno.nl/dynamics/modules/SFIL0100/view.php?fil_Id=199
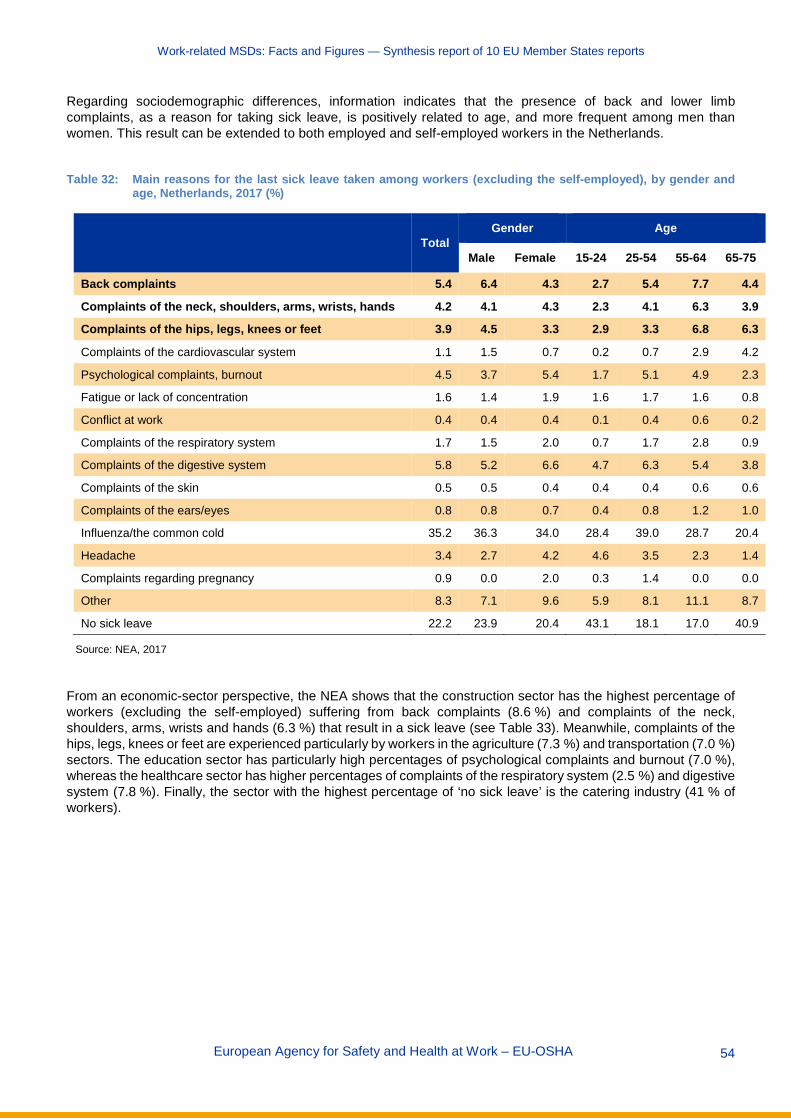
Work-related MSDs: Facts and Figures — Synthesis report of 10 EU Member States reports
European Agency for Safety and Health at Work – EU-OSHA 54
Regarding sociodemographic differences, information indicates that the presence of back and lower limb complaints, as a reason for taking sick leave, is positively related to age, and more frequent among men than women. This result can be extended to both employed and self-employed workers in the Netherlands.
Table 32: Main reasons for the last sick leave taken among workers (excluding the self-employed), by gender and
age, Netherlands, 2017 (%)
Total Gender Age
Male Female 15-24 25-54 55-64 65-75
Back complaints 5.4 6.4 4.3 2.7 5.4 7.7 4.4
Complaints of the neck, shoulders, arms, wrists, hands 4.2 4.1 4.3 2.3 4.1 6.3 3.9
Complaints of the hips, legs, knees or feet 3.9 4.5 3.3 2.9 3.3 6.8 6.3
Complaints of the cardiovascular system 1.1 1.5 0.7 0.2 0.7 2.9 4.2
Psychological complaints, burnout 4.5 3.7 5.4 1.7 5.1 4.9 2.3
Fatigue or lack of concentration 1.6 1.4 1.9 1.6 1.7 1.6 0.8
Conflict at work 0.4 0.4 0.4 0.1 0.4 0.6 0.2
Complaints of the respiratory system 1.7 1.5 2.0 0.7 1.7 2.8 0.9
Complaints of the digestive system 5.8 5.2 6.6 4.7 6.3 5.4 3.8
Complaints of the skin 0.5 0.5 0.4 0.4 0.4 0.6 0.6
Complaints of the ears/eyes 0.8 0.8 0.7 0.4 0.8 1.2 1.0
Influenza/the common cold 35.2 36.3 34.0 28.4 39.0 28.7 20.4
Headache 3.4 2.7 4.2 4.6 3.5 2.3 1.4
Complaints regarding pregnancy 0.9 0.0 2.0 0.3 1.4 0.0 0.0
Other 8.3 7.1 9.6 5.9 8.1 11.1 8.7
No sick leave 22.2 23.9 20.4 43.1 18.1 17.0 40.9
Source: NEA, 2017
From an economic-sector perspective, the NEA shows that the construction sector has the highest percentage of workers (excluding the self-employed) suffering from back complaints (8.6 %) and complaints of the neck, shoulders, arms, wrists and hands (6.3 %) that result in a sick leave (see Table 33). Meanwhile, complaints of the hips, legs, knees or feet are experienced particularly by workers in the agriculture (7.3 %) and transportation (7.0 %) sectors. The education sector has particularly high percentages of psychological complaints and burnout (7.0 %), whereas the healthcare sector has higher percentages of complaints of the respiratory system (2.5 %) and digestive system (7.8 %). Finally, the sector with the highest percentage of ‘no sick leave’ is the catering industry (41 % of workers).

Work-related MSDs: Facts and Figures — Synthesis report of 10 EU Member States reports
European Agency for Safety and Health at Work – EU-OSHA 55
Table 33: Main reasons for taking sick leave the last time among workers (excluding the self-employed), by economic sector, Netherlands, 2017 (%)
Economic sector
Agric
ultu
re
Indu
stry
Cons
truct
ion
Trad
e
Tran
spor
tatio
n
Cate
ring
Indu
stry
IT
Fina
ncial
Busin
ess
Gove
rnan
ce
Educ
atio
n
Healt
h ca
re
Leisu
re
Back complaints 7.2 6.7 8.6 5.2 7.5 4.3 3.8 3.8 5.3 5.1 4.1 4.9 4.1
Complaints of the neck, shoulders, arms, wrists, hands 5.9 5.6 6.3 4.0 5.0 3.4 1.9 2.4 3.8 3.8 3.0 4.6 3.2
Complaints of the hips, legs, knees or feet 7.3 5.3 6.3 4.0 7.0 4.1 1.4 1.8 2.8 3.8 2.6 3.7 3.3
Complaints of the cardiovascular system 1.3 1.7 1.5 1.1 1.4 0.3 0.7 0.6 1.0 1.3 1.2 0.9 1.0
Psychological complaints, burnout 2.6 3.9 3.7 3.6 3.3 2.7 5.1 5.6 4.1 5.2 7.0 5.7 5.1
Fatigue of lack of concentration 0.7 1.4 1.4 1.2 1.8 1.4 2.1 1.7 1.4 2.4 2.0 1.7 2.5
Conflict at work 0.1 0.5 0.3 0.3 0.3 0.3 0.3 0.5 0.4 0.5 0.5 0.4 0.5
Complaints of the respiratory system 0.7 1.8 1.1 1.3 1.8 1.1 1.0 2.4 1.3 2.2 2.2 2.5 1.8
Complaints of the digestive system 4.3 5.8 5.0 5.4 4.6 4.8 6.0 6.3 5.5 6.0 5.5 7.8 4.4
Complaints of the skin 0.0 0.7 0.6 0.4 0.6 0.4 0.4 0.1 0.4 0.5 0.5 0.4 0.2
Complaints on the ears/eyes 1.0 1.1 1.0 0.6 0.8 0.7 1.1 0.7 0.9 0.9 0.5 0.7 0.5
Influenza/the common cold 27.5 34.9 34.1 32.9 29.2 24.9 46.5 43.6 37.1 41.7 39.6 32.7 35.8
Headache 2.3 2.9 2.7 3.5 2.4 3.2 4.1 4.1 3.3 4.2 4.5 3.4 3.7
Complaints regarding pregnancy 0.4 0.3 0.2 0.6 0.4 0.5 0.2 0.8 0.8 0.6 1.4 2.5 1.1
Other 6.6 8.4 7.5 8.2 8.5 6.8 6.5 7.0 6.6 9.0 7.9 10.7 8.4
No sick leave 32.1 19.1 19.6 27.7 25.3 41.0 18.7 18.4 25.3 12.8 17.4 17.3 24.4
Source: NEA, 2017
3.7 Spain According to a study (56), MSDs were the leading cause of temporary work disability in Spain in 2007, representing 18 % of the total (908,781 cases), 23 % of all lost working days (39,342,857 in total) and 23 % of the total costs related to temporary work disability (EUR 1.702 billion in total), which is estimated at EUR 1.62 per EUR 1,000 of national GDP. Furthermore, the annual incidence of temporary work disability cases per 1,000 employed persons was 45, and the average cost per temporary work disability process due to MSDs in Spain was EUR 1,873.
(56) Lázaro, P., Parody, E., García-Vicuña, R., Gabriele, G., Jover, J. Á. & Sevilla, J, ‘Coste de la incapacidad temporal debida a
enfermedades musculoesqueléticas en España’ [‘Cost of temporary work disability due to musculoskeletal diseases in Spain], Reumatología Clínica, Vol. 10, No 2, 2014, pp. 65-138.

Work-related MSDs: Facts and Figures — Synthesis report of 10 EU Member States reports
European Agency for Safety and Health at Work – EU-OSHA 56
3.8 Sweden In Sweden, MSDs are the most common reason for illness and absence from work (Ahlberg, 2014) (57). According to Ahlberg (2014) (see Table 34), around 957,000 Swedes over 16 years old suffered from some form of MSD-related complaint in 2012, and such diseases are more prevalent among people over 45 years old. The study shows that approximately 20-30 % of all visits to Swedish public health care were caused by MSDs and that MSDs accounted for 11 % of total healthcare costs in Sweden (data for 2012).
Regarding direct and indirect costs of MSDs (58), Ahlberg (2014) finds that the total costs for society connected to MSDs were approximately SEK 102.3 billion (around EUR 9.9 billion), which can be translated into SEK 11,000 (approximately EUR 1,065) per inhabitant) or 2.8 % of the national GDP for 2012 (59). In the meantime, direct costs were estimated to be SEK 36.9 billion (36 %), whereas indirect costs amounted to up to SEK 65.4 billion (64 %). Among the direct costs of resource use in health care, outpatient treatment accounted for 62 % of costs, inpatient treatment for 26 % and pharmaceuticals for 12 %. Nevertheless, Ahlberg (2014) underlines that the numbers presented above are most likely an underestimation of the total costs for society, since there are elements regarding MSDs that are very difficult to estimate in monetary terms.
Persistently reduced working capacity due to MSDs that generated sickness and activity compensation accounted for just over 60 % of the indirect costs of loss of production, while morbidity-generated sickness benefit accounted for just over 40 %. Osteoarthritis and back diseases together accounted for 60 % of the sick leave and 64 % of the costs of MSDs. In total, MSDs caused 450,000 days of absence from work distributed among 78,500 people (Ahlberg, 2014).
Table 34: Total costs and allocations of costs for MSDs in Sweden
Type of resource use Number of units Average unit cost, SEK
Total cost, SEK (millions)
Healthcare costs Outpatient care
Primary care Physician contact 5,793,217 1,359 7,873 Other type of healthcare contact 6,475,000 554 3,587
Specialist care Physician contact (physical) 4,052,338 2,316 9,385 Physician contact (other) 803,938 295 237 Other type of healthcare contact 1,815,250 1,039 1,886
Inpatient care Hospital admissions 169,724 9,706
Drugs Pharmaceutical benefit 2,000 Inpatient drug 1,788
Individual expenditure Non-prescription drug (ATC code M) 85,300,000 511
Total healthcare costs 36,973
(57) Ahlberg, I., ‘The economic costs of musculoskeletal disorders: a cost-of-illness study in Sweden for 2012’, MSc dissertation, Lund
University, 2014. Available at: https://lup.lub.lu.se/student-papers/search/publication/4698739. A version in Swedish can be found at: https://ihe.se/wp-content/uploads/2017/06/IHE_Rapport-2014_4.pdf
(58) Direct costs are incurred when resources are used to diagnose and treat the diseases (costs of health care and medicines). Indirect costs are estimated with regard to a loss of production caused by early deaths, reduced ability to work and sick leave. The loss of production was calculated based on the average salary.
(59) The present authors’ own estimation.

Work-related MSDs: Facts and Figures — Synthesis report of 10 EU Member States reports
European Agency for Safety and Health at Work – EU-OSHA 57
(Table 34: Cont. from previous page): Total costs and allocations of costs for MSDs in Sweden
Type of resource use Number of units Average unit cost, SEK
Total cost, SEK (millions)
Non-healthcare costs Productivity costs
Mortality Working years lost M: 293 M: 546,214 M: 26
F: 477 F: 469,642 F: 31 M + F: 770 M + F: 57
Total premature death 57 Reduced work capacity
Sick leave (number of days) 12,650,781 M: 2,324 M: 11,469 F: 1,998 F: 15,421 M + F: 26,890
Sickness and activity compensation (number of persons)
100,585 M: 546,214 M: 13,110 F: 469,642 F: 25,311 M + F: 38,421
Total work of disability 65,311 Total productivity costs 65,368
Total non-healthcare costs 65,368 Total economic burden 102,341
Source: Ahlberg, I., Kostnader för rörelseorganens sjukdomar i Sverige år 2012 [The economic costs of musculoskeletal disorders in Sweden, 2012], Swedish Institute for Health Economics, Lund, 2014. Available at: https://ihe.se/wp-content/uploads/2017/06/IHE_Rapport-2014_4.pdf
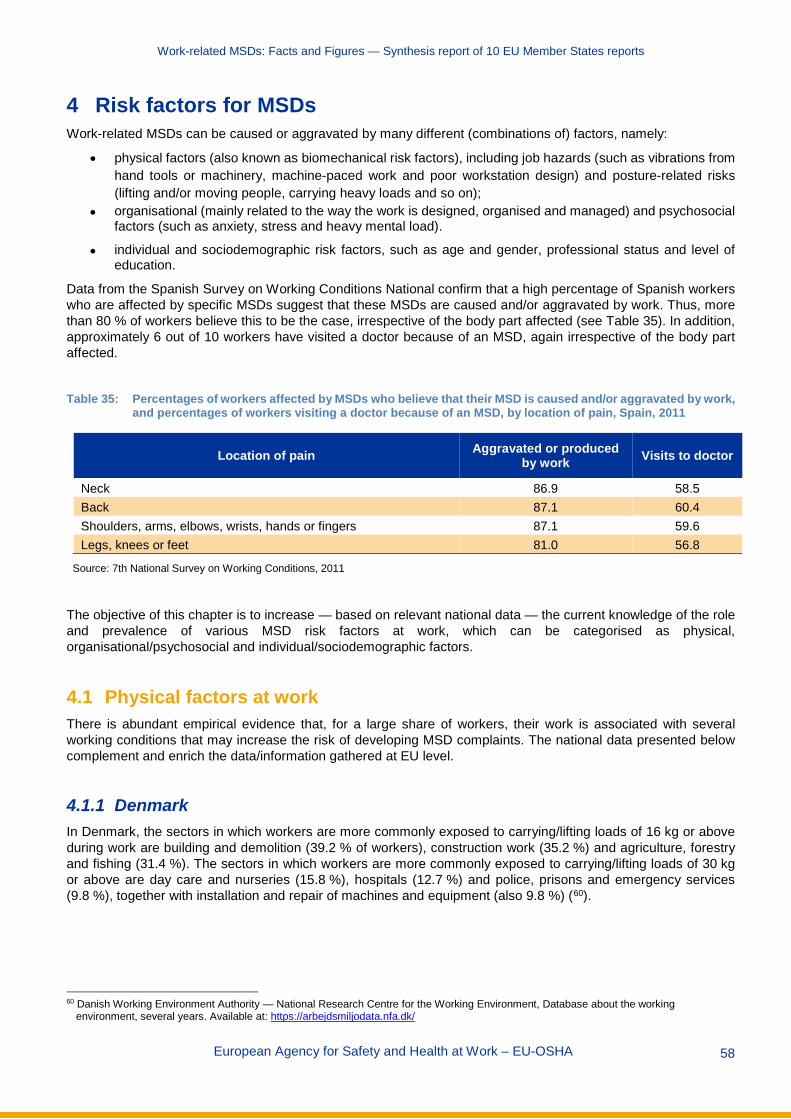
Work-related MSDs: Facts and Figures — Synthesis report of 10 EU Member States reports
European Agency for Safety and Health at Work – EU-OSHA 58
4 Risk factors for MSDs Work-related MSDs can be caused or aggravated by many different (combinations of) factors, namely:
• physical factors (also known as biomechanical risk factors), including job hazards (such as vibrations from hand tools or machinery, machine-paced work and poor workstation design) and posture-related risks (lifting and/or moving people, carrying heavy loads and so on);
• organisational (mainly related to the way the work is designed, organised and managed) and psychosocial factors (such as anxiety, stress and heavy mental load).
• individual and sociodemographic risk factors, such as age and gender, professional status and level of education.
Data from the Spanish Survey on Working Conditions National confirm that a high percentage of Spanish workers who are affected by specific MSDs suggest that these MSDs are caused and/or aggravated by work. Thus, more than 80 % of workers believe this to be the case, irrespective of the body part affected (see Table 35). In addition, approximately 6 out of 10 workers have visited a doctor because of an MSD, again irrespective of the body part affected.
Table 35: Percentages of workers affected by MSDs who believe that their MSD is caused and/or aggravated by work,
and percentages of workers visiting a doctor because of an MSD, by location of pain, Spain, 2011
Location of pain Aggravated or produced by work Visits to doctor
Neck 86.9 58.5 Back 87.1 60.4 Shoulders, arms, elbows, wrists, hands or fingers 87.1 59.6 Legs, knees or feet 81.0 56.8
Source: 7th National Survey on Working Conditions, 2011
The objective of this chapter is to increase — based on relevant national data — the current knowledge of the role and prevalence of various MSD risk factors at work, which can be categorised as physical, organisational/psychosocial and individual/sociodemographic factors.
4.1 Physical factors at work There is abundant empirical evidence that, for a large share of workers, their work is associated with several working conditions that may increase the risk of developing MSD complaints. The national data presented below complement and enrich the data/information gathered at EU level.
4.1.1 Denmark In Denmark, the sectors in which workers are more commonly exposed to carrying/lifting loads of 16 kg or above during work are building and demolition (39.2 % of workers), construction work (35.2 %) and agriculture, forestry and fishing (31.4 %). The sectors in which workers are more commonly exposed to carrying/lifting loads of 30 kg or above are day care and nurseries (15.8 %), hospitals (12.7 %) and police, prisons and emergency services (9.8 %), together with installation and repair of machines and equipment (also 9.8 %) (60).
60 Danish Working Environment Authority — National Research Centre for the Working Environment, Database about the working
environment, several years. Available at: https://arbejdsmiljodata.nfa.dk/

Work-related MSDs: Facts and Figures — Synthesis report of 10 EU Member States reports
European Agency for Safety and Health at Work – EU-OSHA 59
4.1.2 Finland In Finland, work is reported to be very demanding physically by 6.9 % of Finnish workers (61). This percentage is much higher among men than women (12.2 % versus 3.0%, respectively). In addition, for 19.7 % of female and 19.3 % of male Finnish workers, work involves ‘quite a lot of walking and lifting. From an age perspective — irrespective of gender — there is not a significant relationship between this perception of physically demanding work and age.
4.1.3 France The Medical Surveillance of Occupational Risk Exposures (Surveillance médicale des expositions aux risques professionnels — SUMER) survey (62) shows the numbers of workers exposed to different occupational risks in France. The most frequent occupational risk is postural and joint constraints, which affect 74.6 % of men and 73.9 % of women, followed by standing or working upright in a fixed location (48.6 % of men and 42.9 % of women), walking during work (47.5 % of men and 34.5 % of women) and manual load handling (44.1 % of men and 29.0 % of women). In all cases, the number of workers affected by each risk is higher among men than among women, except for fixed position of the head and neck, to which the number of women exposed is higher (32.4 % of women versus 26.4 % of men). Regarding age differences, the exposure to risks decreases as age increases. The most exposed group is workers under 25 years of age, followed by the age group from 25 to 29 years old. The only exception is fixed position of the head and neck, to which the most exposed group is the age group from 30 to 39 years old, and the least exposed is the group less than 25 years old.
According to the SUMER survey ( 63), the construction sector is one of the sectors most affected by specific occupational risks. In the construction sector, 62.2 % of employees are exposed to manual load handling, 53.5 % to working in a kneeling position, 44.4 % to keeping the arms in the air, 50.8 % to other postural constraints (for instance squatting, twisting), 37.9 % to work requiring a forced position of one or more joints and 24.4 % to awkward postures (defined as kneeling position, keeping the arms in the air, work requiring a forced position of one or more joints, or other postural constraints such as squatting, twisting) for 10 hours or more per week (data for 2010; see Table 36).
Meanwhile, employees in accommodation and catering are particularly likely to be exposed to postural and joint constraints (90.3 % of employees) and to repetition of the same gesture or series of gestures at a fast rate (44.4 %). In addition, fixed position of the head and neck is common in the telecommunications sector (60.2 % of the sector employees), and walking during work is common in agriculture, forestry and fishing (65.3 %).
(61) THL — National Institute for Health and Welfare, ‘Suomalaisen aikuisväestön terveyskäyttäytyminen ja terveys — AVTK’ [‘Health
behaviour and health among the Finnish population’], 2014. Available at: https://thl.fi/fi/tutkimus-ja-kehittaminen/tutkimukset-ja-hankkeet/finsote-tutkimus/aiemmat-tutkimukset/suomalaisen-aikuisvaeston-terveyskayttaytyminen-ja-terveys-avtk-
(62) Data retrieved from: https://dares.travail-emploi.gouv.fr/dares-etudes-et-statistiques/enquetes/article/surveillance-medicale-des-expositions-aux-risques-professionnels-sumer-edition (retrieved in March 2019).
(63) DARES, ‘Surveillance médicale des expositions aux risques professionnels (SUMER): édition 2010’ [‘Medical surveillance of occupational risk exposures (SUMER) survey: 2010 edition’]. Available at: https://dares.travail-emploi.gouv.fr/dares-etudes-et-statistiques/enquetes-de-a-a-z/article/surveillance-medicale-des-expositions-aux-risques-professionnels-sumer-edition
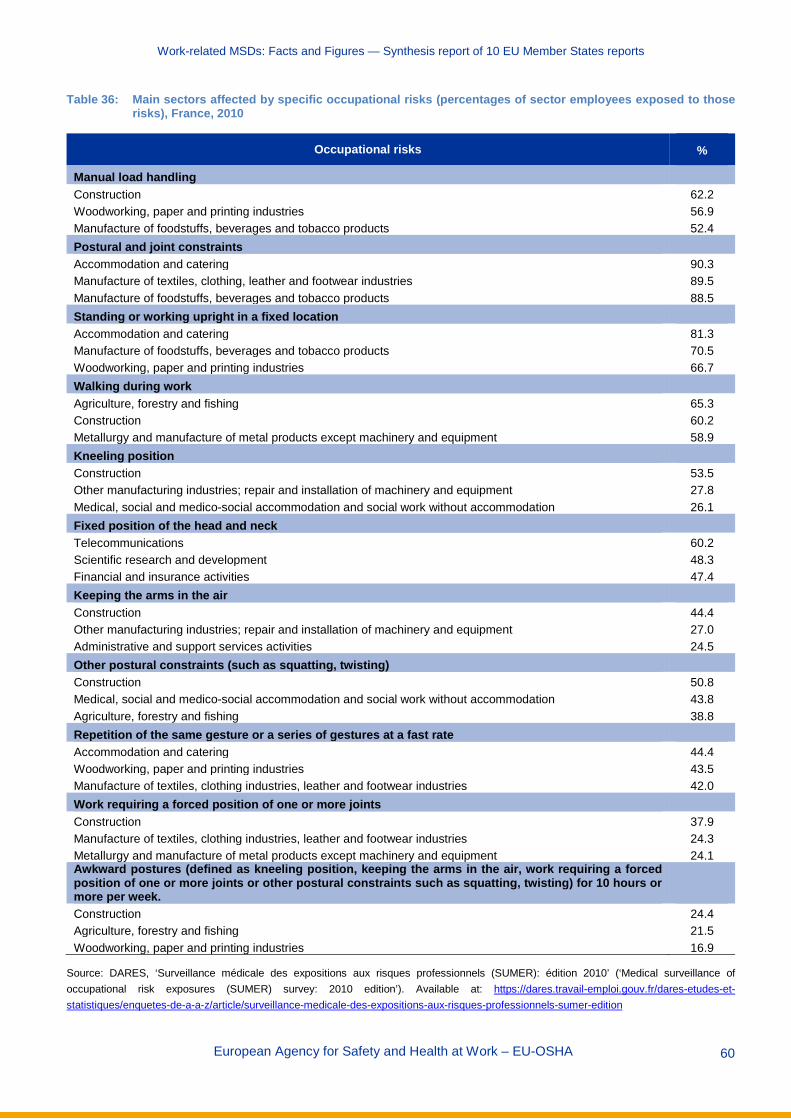
Work-related MSDs: Facts and Figures — Synthesis report of 10 EU Member States reports
European Agency for Safety and Health at Work – EU-OSHA 60
Table 36: Main sectors affected by specific occupational risks (percentages of sector employees exposed to those risks), France, 2010
Occupational risks %
Manual load handling Construction 62.2 Woodworking, paper and printing industries 56.9 Manufacture of foodstuffs, beverages and tobacco products 52.4 Postural and joint constraints Accommodation and catering 90.3 Manufacture of textiles, clothing, leather and footwear industries 89.5 Manufacture of foodstuffs, beverages and tobacco products 88.5 Standing or working upright in a fixed location Accommodation and catering 81.3 Manufacture of foodstuffs, beverages and tobacco products 70.5 Woodworking, paper and printing industries 66.7 Walking during work Agriculture, forestry and fishing 65.3 Construction 60.2 Metallurgy and manufacture of metal products except machinery and equipment 58.9 Kneeling position Construction 53.5 Other manufacturing industries; repair and installation of machinery and equipment 27.8 Medical, social and medico-social accommodation and social work without accommodation 26.1 Fixed position of the head and neck Telecommunications 60.2 Scientific research and development 48.3 Financial and insurance activities 47.4 Keeping the arms in the air Construction 44.4 Other manufacturing industries; repair and installation of machinery and equipment 27.0 Administrative and support services activities 24.5 Other postural constraints (such as squatting, twisting) Construction 50.8 Medical, social and medico-social accommodation and social work without accommodation 43.8 Agriculture, forestry and fishing 38.8 Repetition of the same gesture or a series of gestures at a fast rate Accommodation and catering 44.4 Woodworking, paper and printing industries 43.5 Manufacture of textiles, clothing industries, leather and footwear industries 42.0 Work requiring a forced position of one or more joints Construction 37.9 Manufacture of textiles, clothing industries, leather and footwear industries 24.3 Metallurgy and manufacture of metal products except machinery and equipment 24.1 Awkward postures (defined as kneeling position, keeping the arms in the air, work requiring a forced position of one or more joints or other postural constraints such as squatting, twisting) for 10 hours or more per week. Construction 24.4 Agriculture, forestry and fishing 21.5 Woodworking, paper and printing industries 16.9
Source: DARES, ‘Surveillance médicale des expositions aux risques professionnels (SUMER): édition 2010’ (‘Medical surveillance of occupational risk exposures (SUMER) survey: 2010 edition’). Available at: https://dares.travail-emploi.gouv.fr/dares-etudes-et-statistiques/enquetes-de-a-a-z/article/surveillance-medicale-des-expositions-aux-risques-professionnels-sumer-edition
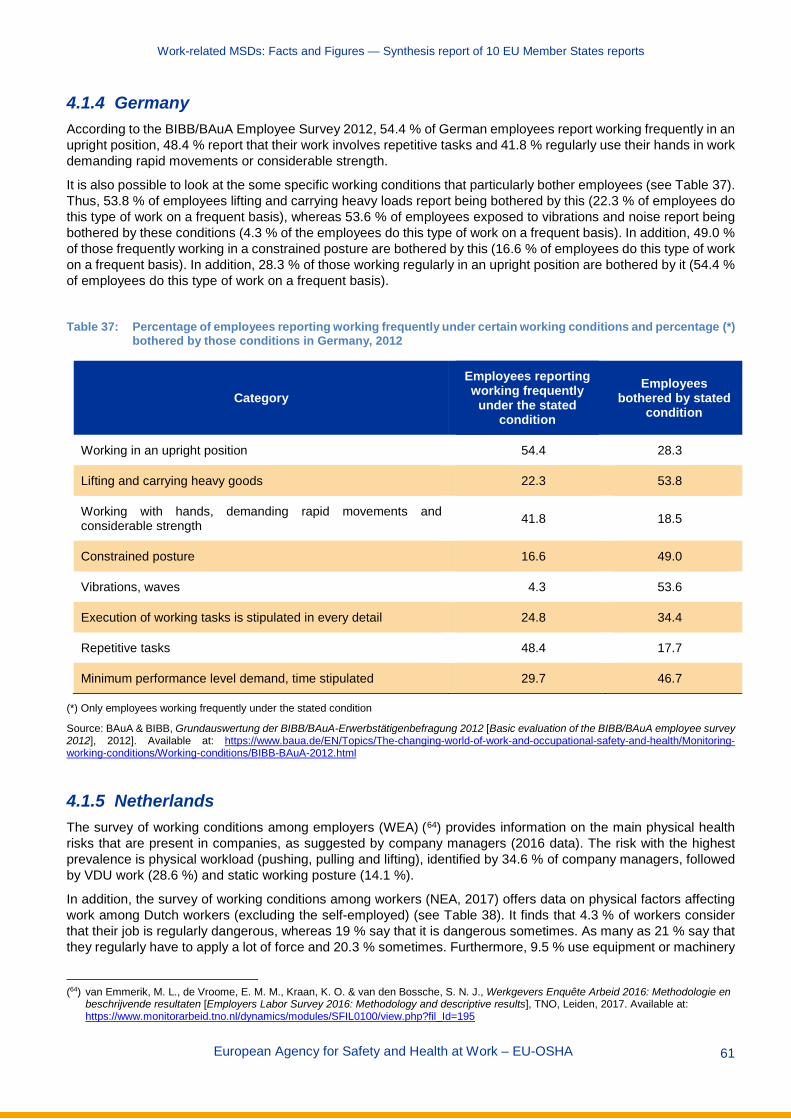
Work-related MSDs: Facts and Figures — Synthesis report of 10 EU Member States reports
European Agency for Safety and Health at Work – EU-OSHA 61
4.1.4 Germany According to the BIBB/BAuA Employee Survey 2012, 54.4 % of German employees report working frequently in an upright position, 48.4 % report that their work involves repetitive tasks and 41.8 % regularly use their hands in work demanding rapid movements or considerable strength.
It is also possible to look at the some specific working conditions that particularly bother employees (see Table 37). Thus, 53.8 % of employees lifting and carrying heavy loads report being bothered by this (22.3 % of employees do this type of work on a frequent basis), whereas 53.6 % of employees exposed to vibrations and noise report being bothered by these conditions (4.3 % of the employees do this type of work on a frequent basis). In addition, 49.0 % of those frequently working in a constrained posture are bothered by this (16.6 % of employees do this type of work on a frequent basis). In addition, 28.3 % of those working regularly in an upright position are bothered by it (54.4 % of employees do this type of work on a frequent basis).
Table 37: Percentage of employees reporting working frequently under certain working conditions and percentage (*)
bothered by those conditions in Germany, 2012
Category Employees reporting working frequently
under the stated condition
Employees bothered by stated
condition
Working in an upright position 54.4 28.3
Lifting and carrying heavy goods 22.3 53.8
Working with hands, demanding rapid movements and considerable strength 41.8 18.5
Constrained posture 16.6 49.0
Vibrations, waves 4.3 53.6
Execution of working tasks is stipulated in every detail 24.8 34.4
Repetitive tasks 48.4 17.7
Minimum performance level demand, time stipulated 29.7 46.7
(*) Only employees working frequently under the stated condition
Source: BAuA & BIBB, Grundauswertung der BIBB/BAuA-Erwerbstätigenbefragung 2012 [Basic evaluation of the BIBB/BAuA employee survey 2012], 2012]. Available at: https://www.baua.de/EN/Topics/The-changing-world-of-work-and-occupational-safety-and-health/Monitoring-working-conditions/Working-conditions/BIBB-BAuA-2012.html
4.1.5 Netherlands The survey of working conditions among employers (WEA) (64) provides information on the main physical health risks that are present in companies, as suggested by company managers (2016 data). The risk with the highest prevalence is physical workload (pushing, pulling and lifting), identified by 34.6 % of company managers, followed by VDU work (28.6 %) and static working posture (14.1 %).
In addition, the survey of working conditions among workers (NEA, 2017) offers data on physical factors affecting work among Dutch workers (excluding the self-employed) (see Table 38). It finds that 4.3 % of workers consider that their job is regularly dangerous, whereas 19 % say that it is dangerous sometimes. As many as 21 % say that they regularly have to apply a lot of force and 20.3 % sometimes. Furthermore, 9.5 % use equipment or machinery
(64) van Emmerik, M. L., de Vroome, E. M. M., Kraan, K. O. & van den Bossche, S. N. J., Werkgevers Enquête Arbeid 2016: Methodologie en
beschrijvende resultaten [Employers Labor Survey 2016: Methodology and descriptive results], TNO, Leiden, 2017. Available at: https://www.monitorarbeid.tno.nl/dynamics/modules/SFIL0100/view.php?fil_Id=195
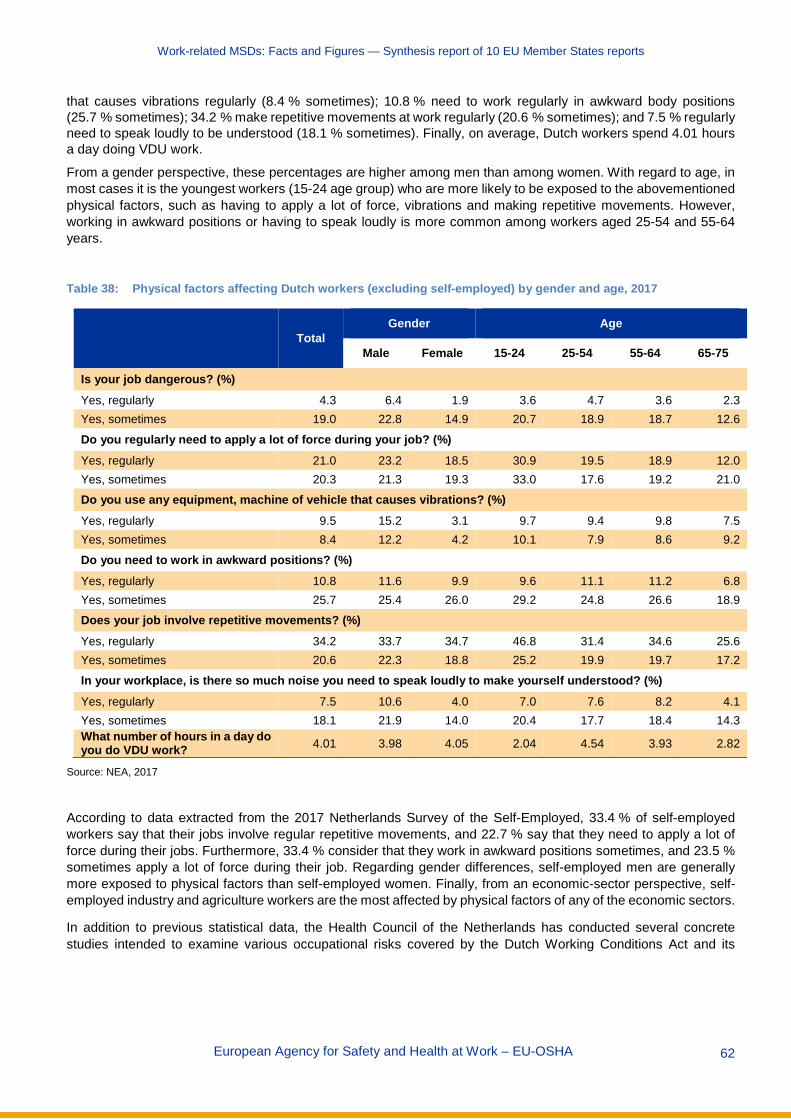
Work-related MSDs: Facts and Figures — Synthesis report of 10 EU Member States reports
European Agency for Safety and Health at Work – EU-OSHA 62
that causes vibrations regularly (8.4 % sometimes); 10.8 % need to work regularly in awkward body positions (25.7 % sometimes); 34.2 % make repetitive movements at work regularly (20.6 % sometimes); and 7.5 % regularly need to speak loudly to be understood (18.1 % sometimes). Finally, on average, Dutch workers spend 4.01 hours a day doing VDU work.
From a gender perspective, these percentages are higher among men than among women. With regard to age, in most cases it is the youngest workers (15-24 age group) who are more likely to be exposed to the abovementioned physical factors, such as having to apply a lot of force, vibrations and making repetitive movements. However, working in awkward positions or having to speak loudly is more common among workers aged 25-54 and 55-64 years.
Table 38: Physical factors affecting Dutch workers (excluding self-employed) by gender and age, 2017
Total Gender Age
Male Female 15-24 25-54 55-64 65-75
Is your job dangerous? (%) Yes, regularly 4.3 6.4 1.9 3.6 4.7 3.6 2.3 Yes, sometimes 19.0 22.8 14.9 20.7 18.9 18.7 12.6
Do you regularly need to apply a lot of force during your job? (%) Yes, regularly 21.0 23.2 18.5 30.9 19.5 18.9 12.0 Yes, sometimes 20.3 21.3 19.3 33.0 17.6 19.2 21.0 Do you use any equipment, machine of vehicle that causes vibrations? (%) Yes, regularly 9.5 15.2 3.1 9.7 9.4 9.8 7.5 Yes, sometimes 8.4 12.2 4.2 10.1 7.9 8.6 9.2
Do you need to work in awkward positions? (%) Yes, regularly 10.8 11.6 9.9 9.6 11.1 11.2 6.8 Yes, sometimes 25.7 25.4 26.0 29.2 24.8 26.6 18.9 Does your job involve repetitive movements? (%) Yes, regularly 34.2 33.7 34.7 46.8 31.4 34.6 25.6 Yes, sometimes 20.6 22.3 18.8 25.2 19.9 19.7 17.2
In your workplace, is there so much noise you need to speak loudly to make yourself understood? (%) Yes, regularly 7.5 10.6 4.0 7.0 7.6 8.2 4.1 Yes, sometimes 18.1 21.9 14.0 20.4 17.7 18.4 14.3 What number of hours in a day do you do VDU work? 4.01 3.98 4.05 2.04 4.54 3.93 2.82
Source: NEA, 2017
According to data extracted from the 2017 Netherlands Survey of the Self-Employed, 33.4 % of self-employed workers say that their jobs involve regular repetitive movements, and 22.7 % say that they need to apply a lot of force during their jobs. Furthermore, 33.4 % consider that they work in awkward positions sometimes, and 23.5 % sometimes apply a lot of force during their job. Regarding gender differences, self-employed men are generally more exposed to physical factors than self-employed women. Finally, from an economic-sector perspective, self-employed industry and agriculture workers are the most affected by physical factors of any of the economic sectors.
In addition to previous statistical data, the Health Council of the Netherlands has conducted several concrete studies intended to examine various occupational risks covered by the Dutch Working Conditions Act and its
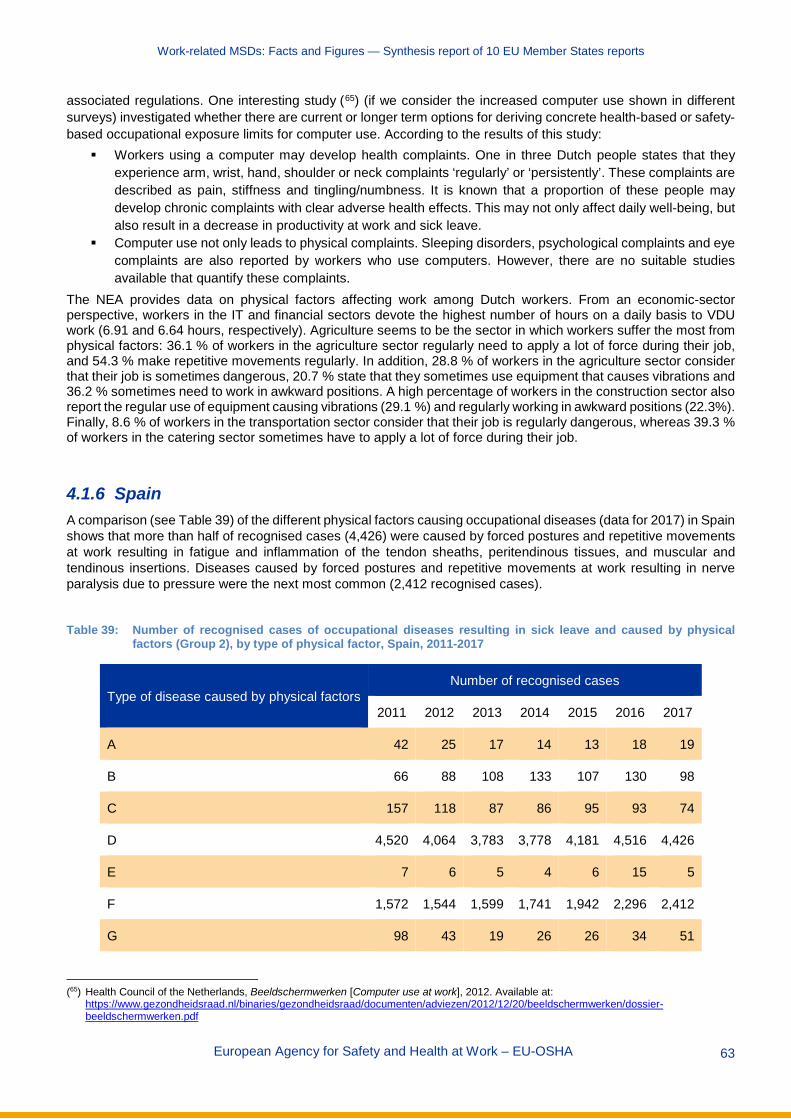
Work-related MSDs: Facts and Figures — Synthesis report of 10 EU Member States reports
European Agency for Safety and Health at Work – EU-OSHA 63
associated regulations. One interesting study (65) (if we consider the increased computer use shown in different surveys) investigated whether there are current or longer term options for deriving concrete health-based or safety-based occupational exposure limits for computer use. According to the results of this study:
Workers using a computer may develop health complaints. One in three Dutch people states that they experience arm, wrist, hand, shoulder or neck complaints ‘regularly’ or ‘persistently’. These complaints are described as pain, stiffness and tingling/numbness. It is known that a proportion of these people may develop chronic complaints with clear adverse health effects. This may not only affect daily well-being, but also result in a decrease in productivity at work and sick leave.
Computer use not only leads to physical complaints. Sleeping disorders, psychological complaints and eye complaints are also reported by workers who use computers. However, there are no suitable studies available that quantify these complaints.
The NEA provides data on physical factors affecting work among Dutch workers. From an economic-sector perspective, workers in the IT and financial sectors devote the highest number of hours on a daily basis to VDU work (6.91 and 6.64 hours, respectively). Agriculture seems to be the sector in which workers suffer the most from physical factors: 36.1 % of workers in the agriculture sector regularly need to apply a lot of force during their job, and 54.3 % make repetitive movements regularly. In addition, 28.8 % of workers in the agriculture sector consider that their job is sometimes dangerous, 20.7 % state that they sometimes use equipment that causes vibrations and 36.2 % sometimes need to work in awkward positions. A high percentage of workers in the construction sector also report the regular use of equipment causing vibrations (29.1 %) and regularly working in awkward positions (22.3%). Finally, 8.6 % of workers in the transportation sector consider that their job is regularly dangerous, whereas 39.3 % of workers in the catering sector sometimes have to apply a lot of force during their job.
4.1.6 Spain A comparison (see Table 39) of the different physical factors causing occupational diseases (data for 2017) in Spain shows that more than half of recognised cases (4,426) were caused by forced postures and repetitive movements at work resulting in fatigue and inflammation of the tendon sheaths, peritendinous tissues, and muscular and tendinous insertions. Diseases caused by forced postures and repetitive movements at work resulting in nerve paralysis due to pressure were the next most common (2,412 recognised cases).
Table 39: Number of recognised cases of occupational diseases resulting in sick leave and caused by physical
factors (Group 2), by type of physical factor, Spain, 2011-2017
Type of disease caused by physical factors Number of recognised cases
2011 2012 2013 2014 2015 2016 2017
A 42 25 17 14 13 18 19
B 66 88 108 133 107 130 98
C 157 118 87 86 95 93 74
D 4,520 4,064 3,783 3,778 4,181 4,516 4,426
E 7 6 5 4 6 15 5
F 1,572 1,544 1,599 1,741 1,942 2,296 2,412
G 98 43 19 26 26 34 51
(65) Health Council of the Netherlands, Beeldschermwerken [Computer use at work], 2012. Available at:
https://www.gezondheidsraad.nl/binaries/gezondheidsraad/documenten/adviezen/2012/12/20/beeldschermwerken/dossier-beeldschermwerken.pdf

Work-related MSDs: Facts and Figures — Synthesis report of 10 EU Member States reports
European Agency for Safety and Health at Work – EU-OSHA 64
Type of disease caused by physical factors Number of recognised cases
2011 2012 2013 2014 2015 2016 2017
H 4 6 8 2 4 4 9
I 1 3 1 3 2 3 3
J 3 0 2 4 2 4 3
K 1 1 0 1 1 0 0
L 138 148 181 187 231 250 304
M 0 0 1 0 0 0 0
Total 6,609 6,046 5,811 5,979 6,610 7,363 7,404
Note: The types of disease are A (hearing loss or deafness caused by noise); B (osteoarticular or angioneurotic diseases caused by mechanical vibrations); C (diseases caused by forced postures and repetitive movements at work: diseases of serous cavities due to pressure, subcutaneous cellulitis); D (diseases caused by forced postures and repetitive movements at work: fatigue and inflammation of the tendon sheaths, peritendinous tissues and muscular and tendinous insertions); E (diseases caused by forced postures and repetitive movements at work: removal by fatigue of the spinous process); F (diseases caused by forced postures and repetitive movements at work: nerve paralysis due to pressure); G (diseases caused by forced postures and repetitive movements at work: injuries to the meniscus by tearing or compression resulting in cracks or complete breaks); H (diseases caused by atmospheric compression or decompression); I (diseases caused by ionising radiation); J (ophthalmological diseases as a result of exposures to ultraviolet radiation); K (diseases caused by radiation); L (diseases of the vocal cord nodules due to the sustained efforts of the voice for professional reasons); M (miners’ nystagmus)
Source: CEPROSS
According to the 7th National Survey on Working Conditions (2011), by economic sector, repetitive movements are the most common physical demand at work in the extractive industries (68.4 %), transport (67.4 %) and construction (67.3 %). Adopting painful/tiring postures was the second most commonly reported physical demand, particularly affecting sectors such as the extractive industries, construction and health activities (50 %, 48.7 % and 48.6 %, respectively). The handling of heavy loads, whether lifting or moving loads or people, particularly affected workers in health activities, construction and agriculture (59.7 %, 41.4 % and 34.8 %, respectively).
In addition, 11.9 % of Spanish workers report that the main risk of accidents at work is linked to extra physical effort. An analysis by economic sector shows that this is most commonly reported in four particular sectors, namely the wholesale and retail trade, the manufacturing industries, health services and social care, and construction (18.6 %, 17.2 %, 14.9 % and 14.4 % of the respondents, respectively) (see Figure 7). These are also economic sectors with a relatively high prevalence of accidents at work.
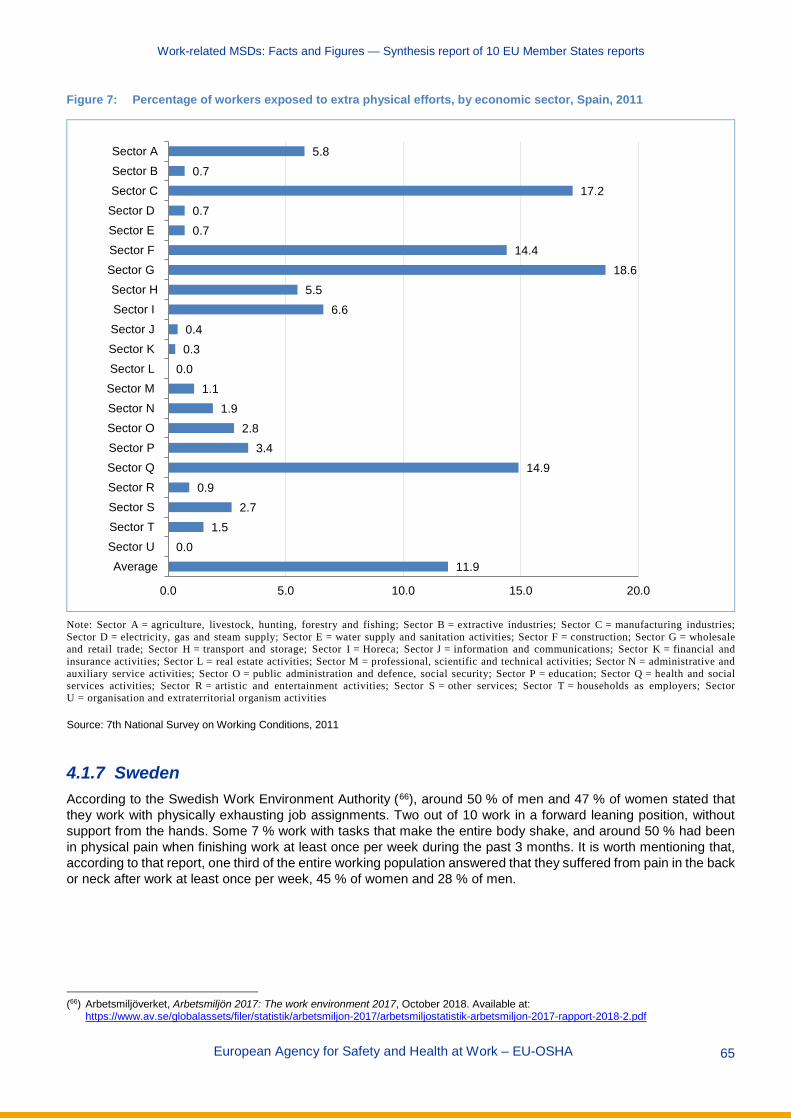
Work-related MSDs: Facts and Figures — Synthesis report of 10 EU Member States reports
European Agency for Safety and Health at Work – EU-OSHA 65
Figure 7: Percentage of workers exposed to extra physical efforts, by economic sector, Spain, 2011
Note: Sector A = agriculture, livestock, hunting, forestry and fishing; Sector B = extractive industries; Sector C = manufacturing industries; Sector D = electricity, gas and steam supply; Sector E = water supply and sanitation activities; Sector F = construction; Sector G = wholesale and retail trade; Sector H = transport and storage; Sector I = Horeca; Sector J = information and communications; Sector K = financial and insurance activities; Sector L = real estate activities; Sector M = professional, scientific and technical activities; Sector N = administrative and auxiliary service activities; Sector O = public administration and defence, social security; Sector P = education; Sector Q = health and social services activities; Sector R = artistic and entertainment activities; Sector S = other services; Sector T = households as employers; Sector U = organisation and extraterritorial organism activities
Source: 7th National Survey on Working Conditions, 2011
4.1.7 Sweden According to the Swedish Work Environment Authority (66), around 50 % of men and 47 % of women stated that they work with physically exhausting job assignments. Two out of 10 work in a forward leaning position, without support from the hands. Some 7 % work with tasks that make the entire body shake, and around 50 % had been in physical pain when finishing work at least once per week during the past 3 months. It is worth mentioning that, according to that report, one third of the entire working population answered that they suffered from pain in the back or neck after work at least once per week, 45 % of women and 28 % of men.
(66) Arbetsmiljöverket, Arbetsmiljön 2017: The work environment 2017, October 2018. Available at:
https://www.av.se/globalassets/filer/statistik/arbetsmiljon-2017/arbetsmiljostatistik-arbetsmiljon-2017-rapport-2018-2.pdf
11.90.0
1.52.7
0.914.9
3.42.8
1.91.1
0.00.30.4
6.65.5
18.614.4
0.70.7
17.20.7
5.8
0.0 5.0 10.0 15.0 20.0
AverageSector USector TSector SSector RSector QSector PSector OSector NSector MSector LSector KSector JSector ISector H
Sector GSector FSector ESector DSector CSector BSector A

Work-related MSDs: Facts and Figures — Synthesis report of 10 EU Member States reports
European Agency for Safety and Health at Work – EU-OSHA 66
4.2 Organisational and psychosocial risk factors There are also a number of organisational risk factors (such as working under time pressure, lack of time to recover, inflexibility of procedures and checks, work pace dependent on automatic rate, repetitiveness of tasks and work pace dependent on quantified targets) and psychosocial risk factors (such as high psychological demands at work, low skill discretion, lack of social support from colleagues or line managers, and stress) that may increase the risk of developing (or aggravating existing) MSDs. Many studies and research in general have revealed an interrelationship between MSDs and psychosocial and organisational factors at work.
4.2.1 Austria Available data in Austria show (see Table 40) that there are three factors that can be identified as being particularly important risk factors for MSD-related health problems, specifically two physical risk factors (difficult work postures/difficult movements and handling heavy loads) and a psychosocial/organisational one (significant time pressure/work overload). These three risk factors can be related to all types of MSD-related health problems. Other, less relevant risk factors include two physical factors (work that strains the eyes and danger of accidents) and one psychosocial one (harassment/bullying in the workplace).
Table 40: Main risk factors for work-related MSDs, 2013, Austria
Risk factor Bone, joint or muscle
problems (neck, shoulder, arms, hands)
Bone, joint or muscle problems (hips, legs,
feet) Bone, joint or muscle
problems (back)
Difficult work postures, difficult movements ++ ++ ++
Handling heavy loads ++ ++ ++
Work that involves eye strain + - +
Danger of accidents - + +
Significant time pressure or work overload ++ ++ +
Harassment or bullying + - +
Note: ‘–’ means that no relationship has been identified
Source: Statistik Austria, work accidents and work-related health problems module of LFS 2013
4.2.2 Sweden National evidence from Sweden shows that more than half of Swedish workers experienced some form of conflict with boss or peers in the last 12 months; this situation seems to be more common among women than men. Meanwhile, up to 10 % of young women have experienced some form of sexual harassment from managers/co-workers (see Table 41).
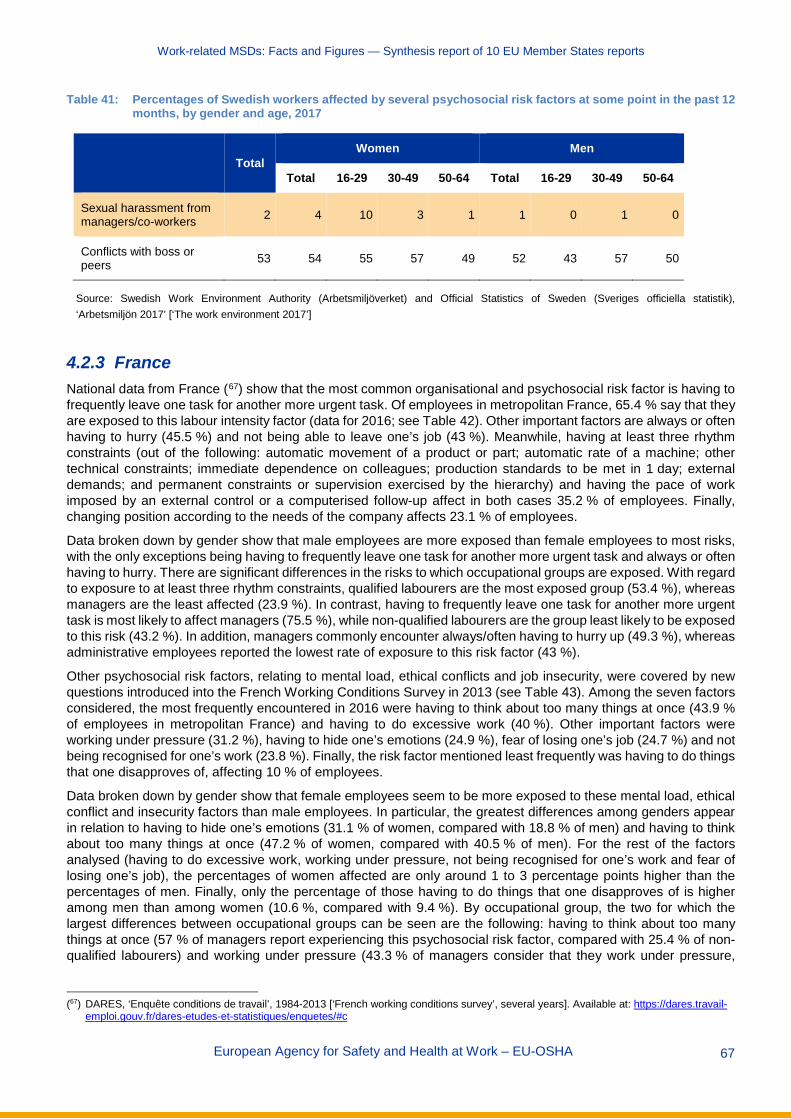
Work-related MSDs: Facts and Figures — Synthesis report of 10 EU Member States reports
European Agency for Safety and Health at Work – EU-OSHA 67
Table 41: Percentages of Swedish workers affected by several psychosocial risk factors at some point in the past 12 months, by gender and age, 2017
Total Women Men
Total 16-29 30-49 50-64 Total 16-29 30-49 50-64
Sexual harassment from managers/co-workers 2 4 10 3 1 1 0 1 0
Conflicts with boss or peers 53 54 55 57 49 52 43 57 50
Source: Swedish Work Environment Authority (Arbetsmiljöverket) and Official Statistics of Sweden (Sveriges officiella statistik), ‘Arbetsmiljön 2017’ [‘The work environment 2017’]
4.2.3 France National data from France (67) show that the most common organisational and psychosocial risk factor is having to frequently leave one task for another more urgent task. Of employees in metropolitan France, 65.4 % say that they are exposed to this labour intensity factor (data for 2016; see Table 42). Other important factors are always or often having to hurry (45.5 %) and not being able to leave one’s job (43 %). Meanwhile, having at least three rhythm constraints (out of the following: automatic movement of a product or part; automatic rate of a machine; other technical constraints; immediate dependence on colleagues; production standards to be met in 1 day; external demands; and permanent constraints or supervision exercised by the hierarchy) and having the pace of work imposed by an external control or a computerised follow-up affect in both cases 35.2 % of employees. Finally, changing position according to the needs of the company affects 23.1 % of employees.
Data broken down by gender show that male employees are more exposed than female employees to most risks, with the only exceptions being having to frequently leave one task for another more urgent task and always or often having to hurry. There are significant differences in the risks to which occupational groups are exposed. With regard to exposure to at least three rhythm constraints, qualified labourers are the most exposed group (53.4 %), whereas managers are the least affected (23.9 %). In contrast, having to frequently leave one task for another more urgent task is most likely to affect managers (75.5 %), while non-qualified labourers are the group least likely to be exposed to this risk (43.2 %). In addition, managers commonly encounter always/often having to hurry up (49.3 %), whereas administrative employees reported the lowest rate of exposure to this risk factor (43 %).
Other psychosocial risk factors, relating to mental load, ethical conflicts and job insecurity, were covered by new questions introduced into the French Working Conditions Survey in 2013 (see Table 43). Among the seven factors considered, the most frequently encountered in 2016 were having to think about too many things at once (43.9 % of employees in metropolitan France) and having to do excessive work (40 %). Other important factors were working under pressure (31.2 %), having to hide one’s emotions (24.9 %), fear of losing one’s job (24.7 %) and not being recognised for one’s work (23.8 %). Finally, the risk factor mentioned least frequently was having to do things that one disapproves of, affecting 10 % of employees.
Data broken down by gender show that female employees seem to be more exposed to these mental load, ethical conflict and insecurity factors than male employees. In particular, the greatest differences among genders appear in relation to having to hide one’s emotions (31.1 % of women, compared with 18.8 % of men) and having to think about too many things at once (47.2 % of women, compared with 40.5 % of men). For the rest of the factors analysed (having to do excessive work, working under pressure, not being recognised for one’s work and fear of losing one’s job), the percentages of women affected are only around 1 to 3 percentage points higher than the percentages of men. Finally, only the percentage of those having to do things that one disapproves of is higher among men than among women (10.6 %, compared with 9.4 %). By occupational group, the two for which the largest differences between occupational groups can be seen are the following: having to think about too many things at once (57 % of managers report experiencing this psychosocial risk factor, compared with 25.4 % of non-qualified labourers) and working under pressure (43.3 % of managers consider that they work under pressure,
(67) DARES, ‘Enquête conditions de travail’, 1984-2013 [‘French working conditions survey’, several years]. Available at: https://dares.travail-
emploi.gouv.fr/dares-etudes-et-statistiques/enquetes/#c

Work-related MSDs: Facts and Figures — Synthesis report of 10 EU Member States reports
European Agency for Safety and Health at Work – EU-OSHA 68
compared with 21.4 % of non-qualified labourers). There is also another factor for which managers have the highest exposure rate, which is the need to do excessive work. On the other hand, for three of the factors analysed managers are the least affected among all the occupational groups considered; these are having to do things that one disapproves of (5.8 % of managers, compared with 16.9 % of non-qualified labourers), the fear of losing one’s job (18.1 % of managers, compared with 33.4 % of non-qualified labourers), and not being recognised for one’s work (18.8 % of managers, compared with 28.4 % of administrative employees).

Work-related MSDs: Facts and Figures — Synthesis report of 10 EU Member States reports
European Agency for Safety and Health at Work – EU-OSHA 69
Table 42: Percentages of workers exposed to certain labour intensity and time pressure risk factors, 1984, 1991, 1998, 2005, 2013 and 2016
Risk factor Middle managers
Intermediate
occupations
Administrative
employees
Trade and services
employees
Qualified labourers
Non-qualified labourers Average Men Women
Having at least three rhythm constraints (*)
1984 3.5 4.8 4.2 2.3 8.7 10.5 5.8 6.8 4.4
1991 12.0 19.7 19.3 13.4 30.2 31.8 21.4 24.1 18.1
1998 19.6 29.3 25.7 20.9 47.0 45.3 31.0 37.2 23.7
2005 22.8 32.4 27.1 19.9 47.3 46.1 31.6 37.9 24.5
2013 25.6 34.8 31.6 28.0 54.0 45.8 35.2 41.3 29.0
2016 23.9 35.1 30.3 29.2 53.4 49.1 35.2 41.4 29.1
Having the pace of work imposed by an external control or a computerised follow-up
1984 – – – – – – – – –
1991 – – – – – – – – –
1998 – – – – – – – – –
2005 23.5 29.7 33.8 15.5 26.2 18.5 24.7 27.5 21.6
2013 35.9 42.3 45.6 25.6 35.6 25 35.3 37.2 33.4
2016 32.6 41.2 43.7 27.8 37.2 27.4 35.2 37.9 32.6
Not being able to leave one’s job
1984 6.1 9.8 14.1 7.5 25.5 27.3 15.5 15.9 15.0
1991 11.6 20.1 24.9 19.3 40.4 38.3 26.3 27.8 24.5
1998 16.5 25.9 28.5 28.3 49.3 43.2 31.9 34.9 28.4
2005 17.3 29.5 25.8 32.9 53.6 46.5 33.7 37.7 29.2
2013 26.2 37.0 31.6 39.3 58.6 44.9 39.0 41.9 36.1
2016 27.1 41.5 33.5 42.9 65.8 51.6 43.0 46 40
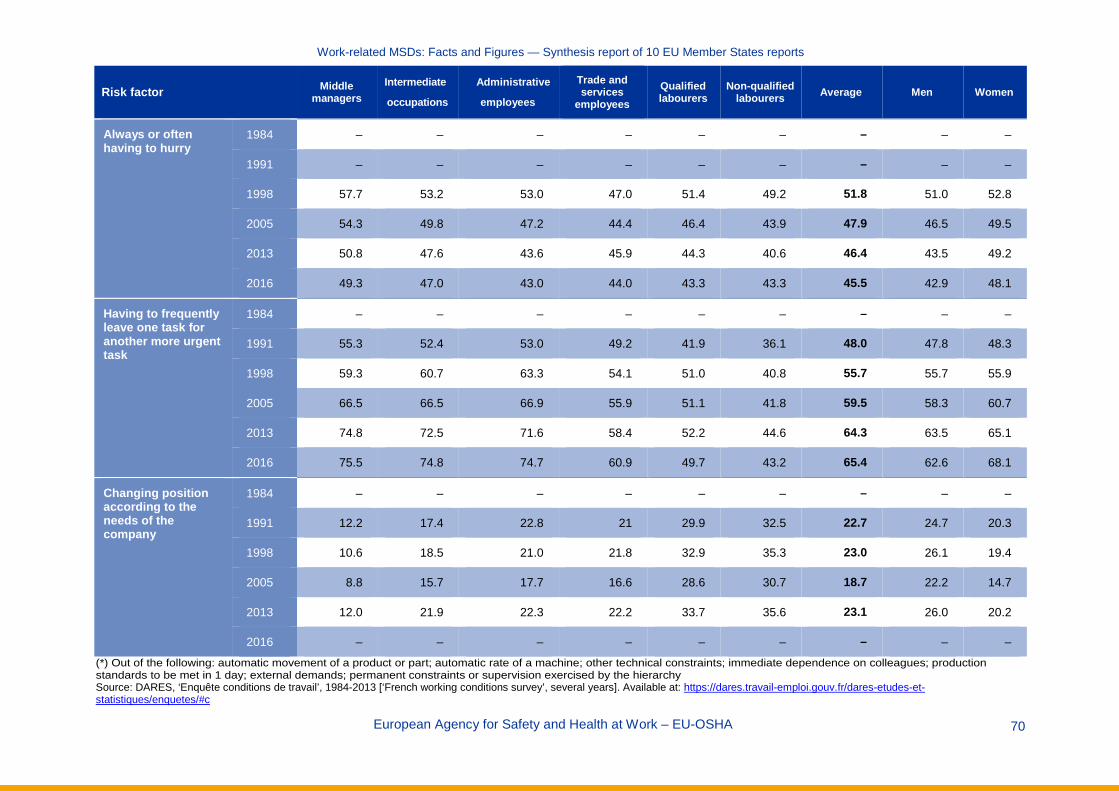
Work-related MSDs: Facts and Figures — Synthesis report of 10 EU Member States reports
European Agency for Safety and Health at Work – EU-OSHA 70
Risk factor Middle managers
Intermediate
occupations
Administrative
employees
Trade and services
employees
Qualified labourers
Non-qualified labourers Average Men Women
Always or often having to hurry
1984 – – – – – – – – –
1991 – – – – – – – – –
1998 57.7 53.2 53.0 47.0 51.4 49.2 51.8 51.0 52.8
2005 54.3 49.8 47.2 44.4 46.4 43.9 47.9 46.5 49.5
2013 50.8 47.6 43.6 45.9 44.3 40.6 46.4 43.5 49.2
2016 49.3 47.0 43.0 44.0 43.3 43.3 45.5 42.9 48.1
Having to frequently leave one task for another more urgent task
1984 – – – – – – – – –
1991 55.3 52.4 53.0 49.2 41.9 36.1 48.0 47.8 48.3
1998 59.3 60.7 63.3 54.1 51.0 40.8 55.7 55.7 55.9
2005 66.5 66.5 66.9 55.9 51.1 41.8 59.5 58.3 60.7
2013 74.8 72.5 71.6 58.4 52.2 44.6 64.3 63.5 65.1
2016 75.5 74.8 74.7 60.9 49.7 43.2 65.4 62.6 68.1
Changing position according to the needs of the company
1984 – – – – – – – – –
1991 12.2 17.4 22.8 21 29.9 32.5 22.7 24.7 20.3
1998 10.6 18.5 21.0 21.8 32.9 35.3 23.0 26.1 19.4
2005 8.8 15.7 17.7 16.6 28.6 30.7 18.7 22.2 14.7
2013 12.0 21.9 22.3 22.2 33.7 35.6 23.1 26.0 20.2
2016 – – – – – – – – –
(*) Out of the following: automatic movement of a product or part; automatic rate of a machine; other technical constraints; immediate dependence on colleagues; production standards to be met in 1 day; external demands; permanent constraints or supervision exercised by the hierarchy Source: DARES, ‘Enquête conditions de travail’, 1984-2013 [‘French working conditions survey’, several years]. Available at: https://dares.travail-emploi.gouv.fr/dares-etudes-et-statistiques/enquetes/#c

Work-related MSDs: Facts and Figures — Synthesis report of 10 EU Member States reports
European Agency for Safety and Health at Work – EU-OSHA 71
Table 43: Percentages of workers exposed to certain mental load, ethical conflict and job insecurity risk factors, 2013 and 2016
Risk factor Middle managers
Intermed.
occupa-tions
Administra-tive
employees
Trade and services
employees
Qualified labourers
Non-qualified labourers
Average Men Women
Having to do excessive work
2013 45.1 43.7 38.6 34.9 38.4 35.0 40.1 39.3 40.9
2016 45.8 43.6 39.4 33.7 37.7 36.3 40.0 38.6 41.4
Having to think about too many things at once
2013 63.0 57.9 48.7 40.4 39.1 28.6 49.1 47.1 51.1
2016 57.0 51.7 44.3 37.4 31.8 25.4 43.9 40.5 47.2
Working under pressure
2013 50.6 42.8 32.6 27.3 29.1 24.1 36.4 36.1 36.8
2016 43.3 35.9 27.9 24.0 25.0 21.4 31.2 30.8 31.6
Doing things that one disapproves of
2013 6.9 9.3 9.4 11.8 11.8 10.2 9.9 10.2 9.5
2016 5.8 8.4 9.1 11.4 12.8 16.9 10.0 10.6 9.4
Having to hide one’s emotions
2013 29.8 31.6 32.0 39.0 22.6 19.1 30.5 24.8 36.3
2016 24.6 27.2 26.7 31.8 15.2 16.2 24.9 18.8 31.1
Not being recognised for one’s work
2013 23.2 31.8 32.6 27.0 32.9 28.1 29.1 28.1 30.0
2016 18.8 25.4 28.4 21.9 24.8 27.3 23.8 22.9 24.7
Fear of losing one’s job
2013 18.8 22.4 22.8 23.9 31.1 33.3 24.3 24.9 23.8
2016 18.1 23.9 26.7 24.5 28.3 33.4 24.7 23.3 26.1
Source: DARES, ‘Enquête conditions de travail’, 1984-2016 [‘French working conditions survey’, several years]. Available at: https://dares.travail-emploi.gouv.fr/dares-etudes-et-statistiques/enquetes/#c
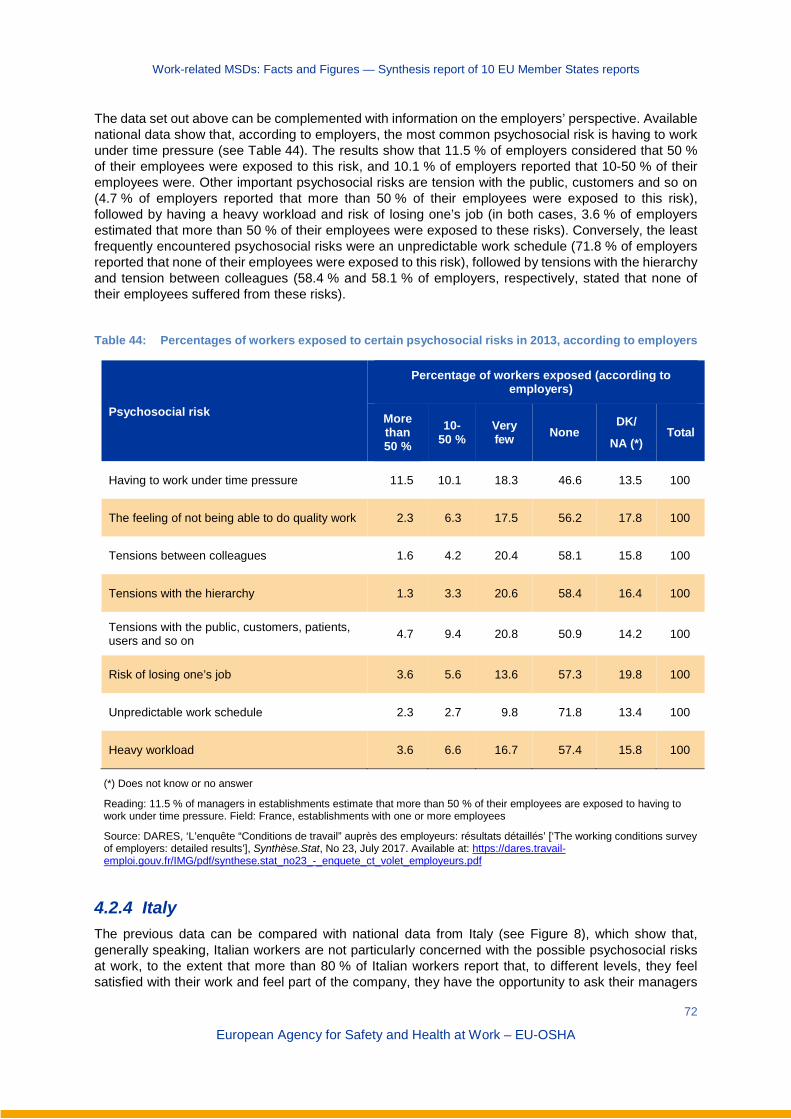
Work-related MSDs: Facts and Figures — Synthesis report of 10 EU Member States reports
72
European Agency for Safety and Health at Work – EU-OSHA
The data set out above can be complemented with information on the employers’ perspective. Available national data show that, according to employers, the most common psychosocial risk is having to work under time pressure (see Table 44). The results show that 11.5 % of employers considered that 50 % of their employees were exposed to this risk, and 10.1 % of employers reported that 10-50 % of their employees were. Other important psychosocial risks are tension with the public, customers and so on (4.7 % of employers reported that more than 50 % of their employees were exposed to this risk), followed by having a heavy workload and risk of losing one’s job (in both cases, 3.6 % of employers estimated that more than 50 % of their employees were exposed to these risks). Conversely, the least frequently encountered psychosocial risks were an unpredictable work schedule (71.8 % of employers reported that none of their employees were exposed to this risk), followed by tensions with the hierarchy and tension between colleagues (58.4 % and 58.1 % of employers, respectively, stated that none of their employees suffered from these risks).
Table 44: Percentages of workers exposed to certain psychosocial risks in 2013, according to employers
Psychosocial risk
Percentage of workers exposed (according to employers)
More than 50 %
10-50 %
Very few None
DK/
NA (*) Total
Having to work under time pressure 11.5 10.1 18.3 46.6 13.5 100
The feeling of not being able to do quality work 2.3 6.3 17.5 56.2 17.8 100
Tensions between colleagues 1.6 4.2 20.4 58.1 15.8 100
Tensions with the hierarchy 1.3 3.3 20.6 58.4 16.4 100
Tensions with the public, customers, patients, users and so on 4.7 9.4 20.8 50.9 14.2 100
Risk of losing one’s job 3.6 5.6 13.6 57.3 19.8 100
Unpredictable work schedule 2.3 2.7 9.8 71.8 13.4 100
Heavy workload 3.6 6.6 16.7 57.4 15.8 100
(*) Does not know or no answer
Reading: 11.5 % of managers in establishments estimate that more than 50 % of their employees are exposed to having to work under time pressure. Field: France, establishments with one or more employees
Source: DARES, ‘L’enquête “Conditions de travail” auprès des employeurs: résultats détaillés’ [‘The working conditions survey of employers: detailed results’], Synthèse.Stat, No 23, July 2017. Available at: https://dares.travail-emploi.gouv.fr/IMG/pdf/synthese.stat_no23_-_enquete_ct_volet_employeurs.pdf
4.2.4 Italy The previous data can be compared with national data from Italy (see Figure 8), which show that, generally speaking, Italian workers are not particularly concerned with the possible psychosocial risks at work, to the extent that more than 80 % of Italian workers report that, to different levels, they feel satisfied with their work and feel part of the company, they have the opportunity to ask their managers
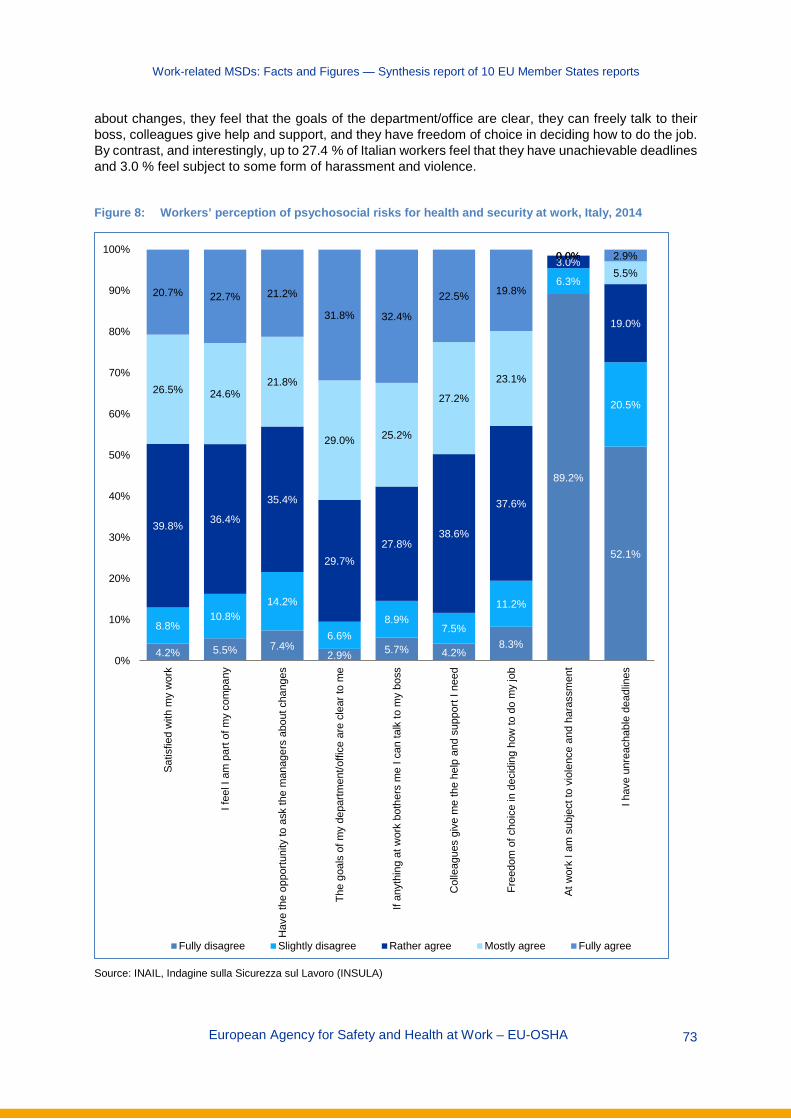
Work-related MSDs: Facts and Figures — Synthesis report of 10 EU Member States reports
European Agency for Safety and Health at Work – EU-OSHA 73
about changes, they feel that the goals of the department/office are clear, they can freely talk to their boss, colleagues give help and support, and they have freedom of choice in deciding how to do the job. By contrast, and interestingly, up to 27.4 % of Italian workers feel that they have unachievable deadlines and 3.0 % feel subject to some form of harassment and violence.
Figure 8: Workers’ perception of psychosocial risks for health and security at work, Italy, 2014
Source: INAIL, Indagine sulla Sicurezza sul Lavoro (INSULA)
4.2% 5.5% 7.4%2.9% 5.7% 4.2%
8.3%
89.2%
52.1%
8.8%10.8%
14.2%
6.6%8.9%
7.5%
11.2%
6.3%
20.5%
39.8% 36.4%
35.4%
29.7%27.8%
38.6%
37.6%
3.0%
19.0%
26.5% 24.6%21.8%
29.0% 25.2%
27.2%
23.1%
0.0%5.5%
20.7% 22.7% 21.2%
31.8% 32.4%
22.5% 19.8%
0.0% 2.9%
0%
10%
20%
30%
40%
50%
60%
70%
80%
90%
100%
Satis
fied
with
my
wor
k
I fee
l I a
m p
art o
f my
com
pany
Hav
e th
e op
portu
nity
to a
sk th
e m
anag
ers
abou
t cha
nges
The
goal
s of
my
depa
rtmen
t/offi
ce a
re c
lear
to m
e
If an
ythi
ng a
t wor
k bo
ther
s m
e I c
an ta
lk to
my
boss
Col
leag
ues
give
me
the
help
and
sup
port
I nee
d
Free
dom
of c
hoic
e in
dec
idin
g ho
w to
do
my
job
At w
ork
I am
sub
ject
to v
iole
nce
and
hara
ssm
ent
I hav
e un
reac
habl
e de
adlin
es
Fully disagree Slightly disagree Rather agree Mostly agree Fully agree

Work-related MSDs: Facts and Figures — Synthesis report of 10 EU Member States reports
European Agency for Safety and Health at Work – EU-OSHA 74
4.2.5 Netherlands The NEA provides interesting data concerning psychosocial factors (2017 data) (see Table 45). More precisely, 59.5 % of Dutch workers (excluding the self-employed) regularly decide how their work is done; 60.6 % regularly decide the order in which their tasks are performed; 55.1 % are regularly able to control their own work pace; 67.8 % regularly need to find solutions to do their jobs; 48.7 % are regularly able to take leave when they want; and 24.5 % are regularly able to determine their own working hours. These percentages are higher among male workers than among female workers. Moreover, the percentages of workers answering ‘regularly’ to these questions increase as worker age increases, whereas the percentages of workers answering ‘sometimes’ increase as worker age decreases.
In addition to this, the NEA also includes some interesting questions that require answers to be provided on a scale of 1 (meaning never) to 4 (meaning always), or on a scale of 1 (meaning never) to 7 (meaning every day). On a scale of 1 to 4, workers’ average score when asked if they need to get a lot of work done is 2.51, the average score when asked if they need to work extra hard is 2.26 and the average score for a question about work being emotionally demanding is 1.70. These scores are higher among female workers and among workers aged from 25 to 54 years.
On a scale of 1 to 7, workers’ average score when asked about experiencing burnout symptoms is 2.13, the average score when asked about feeling empty/numb at the end of the day is 2.72, the average score when asked about feeling tired when confronted with work is 2.19 and the average score when asked about feeling completely exhausted because of work is 1.96. These scores are higher among women than among men.
Table 45: Psychosocial factors affecting work among Dutch workers (excluding self-employed), by gender and age, 2017
Total Gender Age
Male Female 15-24 25-54 55-64 65-75 Do you get to decide how your work is done? (%) Yes, regularly 59.5 64.9 53.6 32.3 63.6 67.0 69.6
Yes, sometimes 27.7 25.2 30.5 45.7 25.7 20.6 17.4
Do you get to decide the order in which your tasks are performed? (%) Yes, regularly 60.6 63.3 57.7 33.3 65.2 66.9 65.9
Yes, sometimes 24.9 23.9 26.0 38.5 23.5 19.3 16.1
Are you able to control your own work pace? (%) Yes, regularly 55.1 60.3 49.4 35.1 57.8 61.2 69.9
Yes, sometimes 29.2 27.7 30.8 40.4 28.5 23.5 16.9
Do you need to find solutions yourself to do your job? (%) Yes, regularly 67.8 71.7 63.5 42.7 73.0 70.9 63.8
Yes, sometimes 27.4 24.0 31.2 46.3 23.6 24.8 28.6
Are you able to take leave when you want? (%) Yes, regularly 48.7 54.8 41.9 41.1 48.7 53.0 67.4
Yes, sometimes 33.7 32.4 35.2 42.5 33.6 27.9 21.2
Are you able to determine your own working hours?
Yes, regularly 24.5 26.9 21.9 21.0 24.5 26.0 40.4
Yes, sometimes 26.0 26.1 25.8 31.3 26.2 21.3 19.1
Do you need to work really fast? (1 = never, 4 = always) Average 2.37 2.34 2.39 2.36 2.39 2.34 2.01

Work-related MSDs: Facts and Figures — Synthesis report of 10 EU Member States reports
European Agency for Safety and Health at Work – EU-OSHA 75
Total Gender Age
Male Female 15-24 25-54 55-64 65-75 Do you need to get a lot of work done? (1 = never, 4 = always) Average 2.51 2.47 2.56 2.29 2.58 2.52 2.08
Do you need to work extra hard? (1 = never, 4 = always) Average 2.26 2.23 2.30 2.11 2.32 2.23 1.80
Is your work emotionally demanding (1 = never, 4 = always)?
Average 1.70 1.63 1.78 1.37 1.77 1.77 1.51
Do you experience burnout symptoms? (1 = never, 7 = every day) Average 2.13 2.08 2.17 1.82 2.20 2.20 1.57
At the end of the day, I feel empty/numb (1 = never, 7 = every day) Average 2.72 2.72 2.72 2.19 2.81 2.92 2.00
When I get up in the morning and am confronted with my work I feel tired (1 = never, 7 = every day) Average 2.19 2.17 2.22 2.00 2.27 2.14 1.47
I feel completely exhausted because of my work (1 = never, 7 = every day) Average 1.96 1.92 2.00 1.78 2.00 2.03 1.43
Source: NEA, 2017
According to 2017 data from the NEA, from an economic-sector perspective, the IT sector is the economic sector with the highest percentages of workers who report having the capacity to decide and control several work factors, whereas the catering sector generally has the lowest percentages (see Table 46). More precisely, 77.7 % of Dutch workers in the IT sector can regularly decide how their work is carried out (38.8 % in the catering sector); 76.9 % can regularly decide the order in which tasks are performed (42.7 % in the catering sector); 71.9 % can control their own work pace (37.3 % in the catering sector); 87.9 % can find solutions themselves to do their jobs (47.3 % in the agriculture sector); 68.5 % are able to take leave when they want (21.6 % in the education sector); and 43.7 % can determine their own working hours (17.3 % in the healthcare sector).
Table 46: Psychosocial factors affecting Dutch workers (excluding the self-employed), by economic sector, 2017
Economic sector
Agr
icul
ture
Indu
stry
Con
stru
ctio
n
Trad
e
Tran
spor
tatio
n
Cat
erin
g
IT
Fina
ncia
l
Bus
ines
s
Gov
erna
nce
Educ
atio
n
Hea
lth c
are
Leis
ure
Do you get to decide how your work is done? (%) Yes, regularly 47.7 63.3 70.5 51.6 52.2 38.8 77.7 70.4 63.8 71.0 64.6 52.8 66.5
Yes, sometimes 32.3 24.5 24.5 31.6 26.9 41.9 19.1 20.3 24.1 22.1 27.3 32.8 23.9
Do you get to decide the order in which your tasks are performed? (%) Yes, regularly 43.7 63.1 70.5 54.3 45.4 42.7 76.9 76.2 67.2 75.4 60.9 54.2 65.0
Yes, sometimes 23.7 22.8 23.7 27.5 25.8 35.0 19.1 16.4 20.9 17.7 25.8 30.7 22.5
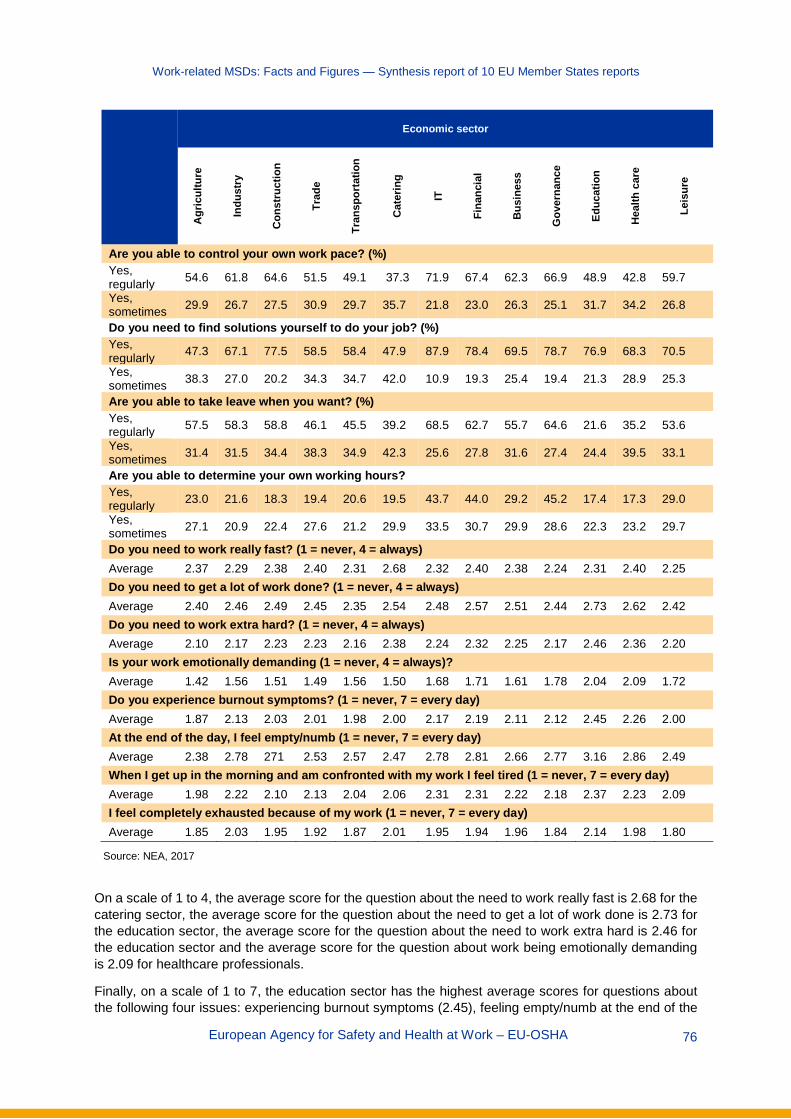
Work-related MSDs: Facts and Figures — Synthesis report of 10 EU Member States reports
European Agency for Safety and Health at Work – EU-OSHA 76
Economic sector
Agr
icul
ture
Indu
stry
Con
stru
ctio
n
Trad
e
Tran
spor
tatio
n
Cat
erin
g
IT
Fina
ncia
l
Bus
ines
s
Gov
erna
nce
Educ
atio
n
Hea
lth c
are
Leis
ure
Are you able to control your own work pace? (%) Yes, regularly 54.6 61.8 64.6 51.5 49.1 37.3 71.9 67.4 62.3 66.9 48.9 42.8 59.7
Yes, sometimes 29.9 26.7 27.5 30.9 29.7 35.7 21.8 23.0 26.3 25.1 31.7 34.2 26.8
Do you need to find solutions yourself to do your job? (%) Yes, regularly 47.3 67.1 77.5 58.5 58.4 47.9 87.9 78.4 69.5 78.7 76.9 68.3 70.5
Yes, sometimes 38.3 27.0 20.2 34.3 34.7 42.0 10.9 19.3 25.4 19.4 21.3 28.9 25.3
Are you able to take leave when you want? (%) Yes, regularly 57.5 58.3 58.8 46.1 45.5 39.2 68.5 62.7 55.7 64.6 21.6 35.2 53.6
Yes, sometimes 31.4 31.5 34.4 38.3 34.9 42.3 25.6 27.8 31.6 27.4 24.4 39.5 33.1
Are you able to determine your own working hours? Yes, regularly 23.0 21.6 18.3 19.4 20.6 19.5 43.7 44.0 29.2 45.2 17.4 17.3 29.0
Yes, sometimes 27.1 20.9 22.4 27.6 21.2 29.9 33.5 30.7 29.9 28.6 22.3 23.2 29.7
Do you need to work really fast? (1 = never, 4 = always) Average 2.37 2.29 2.38 2.40 2.31 2.68 2.32 2.40 2.38 2.24 2.31 2.40 2.25 Do you need to get a lot of work done? (1 = never, 4 = always) Average 2.40 2.46 2.49 2.45 2.35 2.54 2.48 2.57 2.51 2.44 2.73 2.62 2.42 Do you need to work extra hard? (1 = never, 4 = always) Average 2.10 2.17 2.23 2.23 2.16 2.38 2.24 2.32 2.25 2.17 2.46 2.36 2.20 Is your work emotionally demanding (1 = never, 4 = always)? Average 1.42 1.56 1.51 1.49 1.56 1.50 1.68 1.71 1.61 1.78 2.04 2.09 1.72 Do you experience burnout symptoms? (1 = never, 7 = every day) Average 1.87 2.13 2.03 2.01 1.98 2.00 2.17 2.19 2.11 2.12 2.45 2.26 2.00 At the end of the day, I feel empty/numb (1 = never, 7 = every day) Average 2.38 2.78 271 2.53 2.57 2.47 2.78 2.81 2.66 2.77 3.16 2.86 2.49 When I get up in the morning and am confronted with my work I feel tired (1 = never, 7 = every day) Average 1.98 2.22 2.10 2.13 2.04 2.06 2.31 2.31 2.22 2.18 2.37 2.23 2.09 I feel completely exhausted because of my work (1 = never, 7 = every day) Average 1.85 2.03 1.95 1.92 1.87 2.01 1.95 1.94 1.96 1.84 2.14 1.98 1.80
Source: NEA, 2017
On a scale of 1 to 4, the average score for the question about the need to work really fast is 2.68 for the catering sector, the average score for the question about the need to get a lot of work done is 2.73 for the education sector, the average score for the question about the need to work extra hard is 2.46 for the education sector and the average score for the question about work being emotionally demanding is 2.09 for healthcare professionals.
Finally, on a scale of 1 to 7, the education sector has the highest average scores for questions about the following four issues: experiencing burnout symptoms (2.45), feeling empty/numb at the end of the
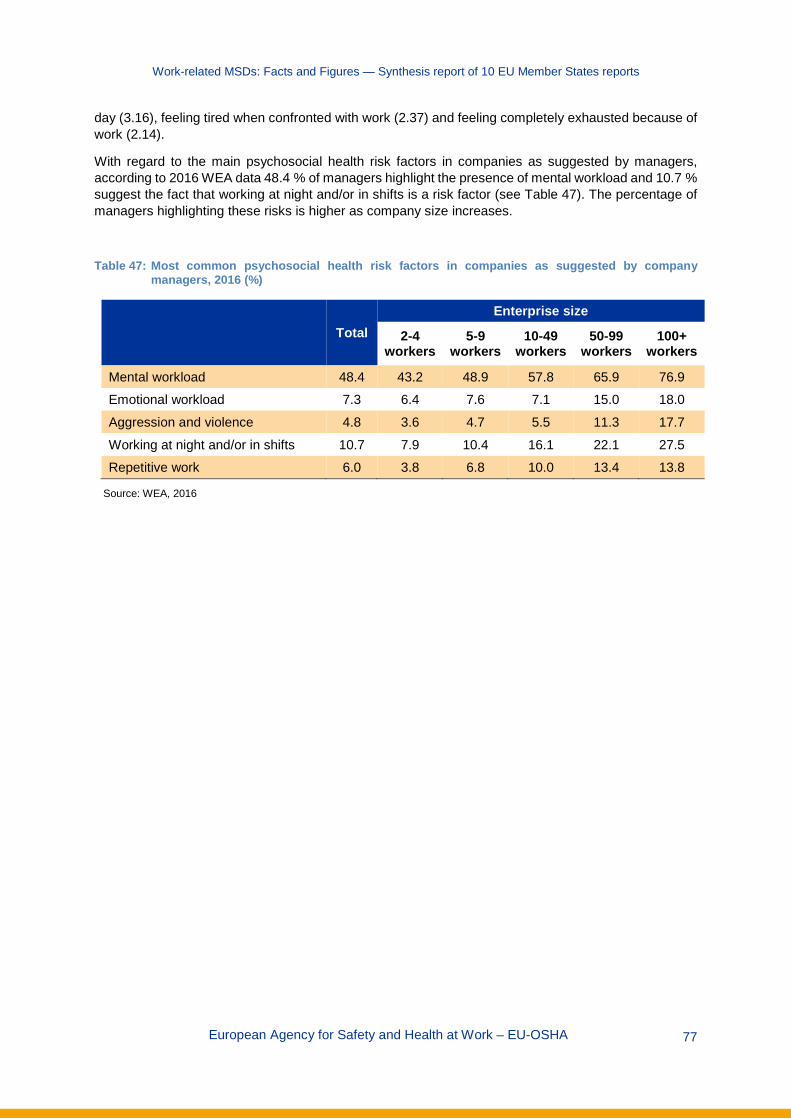
Work-related MSDs: Facts and Figures — Synthesis report of 10 EU Member States reports
European Agency for Safety and Health at Work – EU-OSHA 77
day (3.16), feeling tired when confronted with work (2.37) and feeling completely exhausted because of work (2.14).
With regard to the main psychosocial health risk factors in companies as suggested by managers, according to 2016 WEA data 48.4 % of managers highlight the presence of mental workload and 10.7 % suggest the fact that working at night and/or in shifts is a risk factor (see Table 47). The percentage of managers highlighting these risks is higher as company size increases.
Table 47: Most common psychosocial health risk factors in companies as suggested by company managers, 2016 (%)
Total Enterprise size
2-4 workers
5-9 workers
10-49 workers
50-99 workers
100+ workers
Mental workload 48.4 43.2 48.9 57.8 65.9 76.9 Emotional workload 7.3 6.4 7.6 7.1 15.0 18.0
Aggression and violence 4.8 3.6 4.7 5.5 11.3 17.7
Working at night and/or in shifts 10.7 7.9 10.4 16.1 22.1 27.5 Repetitive work 6.0 3.8 6.8 10.0 13.4 13.8
Source: WEA, 2016
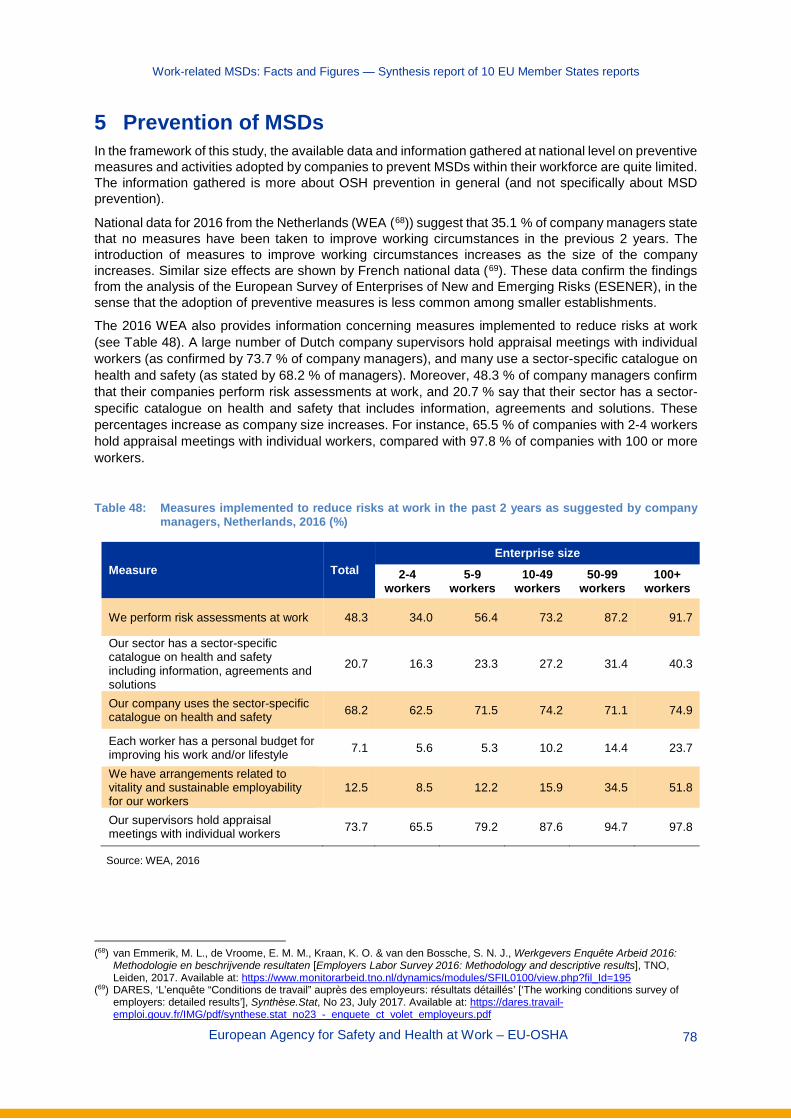
Work-related MSDs: Facts and Figures — Synthesis report of 10 EU Member States reports
European Agency for Safety and Health at Work – EU-OSHA 78
5 Prevention of MSDs In the framework of this study, the available data and information gathered at national level on preventive measures and activities adopted by companies to prevent MSDs within their workforce are quite limited. The information gathered is more about OSH prevention in general (and not specifically about MSD prevention).
National data for 2016 from the Netherlands (WEA (68)) suggest that 35.1 % of company managers state that no measures have been taken to improve working circumstances in the previous 2 years. The introduction of measures to improve working circumstances increases as the size of the company increases. Similar size effects are shown by French national data (69). These data confirm the findings from the analysis of the European Survey of Enterprises of New and Emerging Risks (ESENER), in the sense that the adoption of preventive measures is less common among smaller establishments.
The 2016 WEA also provides information concerning measures implemented to reduce risks at work (see Table 48). A large number of Dutch company supervisors hold appraisal meetings with individual workers (as confirmed by 73.7 % of company managers), and many use a sector-specific catalogue on health and safety (as stated by 68.2 % of managers). Moreover, 48.3 % of company managers confirm that their companies perform risk assessments at work, and 20.7 % say that their sector has a sector-specific catalogue on health and safety that includes information, agreements and solutions. These percentages increase as company size increases. For instance, 65.5 % of companies with 2-4 workers hold appraisal meetings with individual workers, compared with 97.8 % of companies with 100 or more workers.
Table 48: Measures implemented to reduce risks at work in the past 2 years as suggested by company
managers, Netherlands, 2016 (%)
Measure Total Enterprise size
2-4 workers
5-9 workers
10-49 workers
50-99 workers
100+ workers
We perform risk assessments at work 48.3 34.0 56.4 73.2 87.2 91.7
Our sector has a sector-specific catalogue on health and safety including information, agreements and solutions
20.7 16.3 23.3 27.2 31.4 40.3
Our company uses the sector-specific catalogue on health and safety 68.2 62.5 71.5 74.2 71.1 74.9
Each worker has a personal budget for improving his work and/or lifestyle 7.1 5.6 5.3 10.2 14.4 23.7
We have arrangements related to vitality and sustainable employability for our workers
12.5 8.5 12.2 15.9 34.5 51.8
Our supervisors hold appraisal meetings with individual workers 73.7 65.5 79.2 87.6 94.7 97.8
Source: WEA, 2016
(68) van Emmerik, M. L., de Vroome, E. M. M., Kraan, K. O. & van den Bossche, S. N. J., Werkgevers Enquête Arbeid 2016:
Methodologie en beschrijvende resultaten [Employers Labor Survey 2016: Methodology and descriptive results], TNO, Leiden, 2017. Available at: https://www.monitorarbeid.tno.nl/dynamics/modules/SFIL0100/view.php?fil_Id=195
(69) DARES, ‘L’enquête “Conditions de travail” auprès des employeurs: résultats détaillés’ [‘The working conditions survey of employers: detailed results’], Synthèse.Stat, No 23, July 2017. Available at: https://dares.travail-emploi.gouv.fr/IMG/pdf/synthese.stat_no23_-_enquete_ct_volet_employeurs.pdf
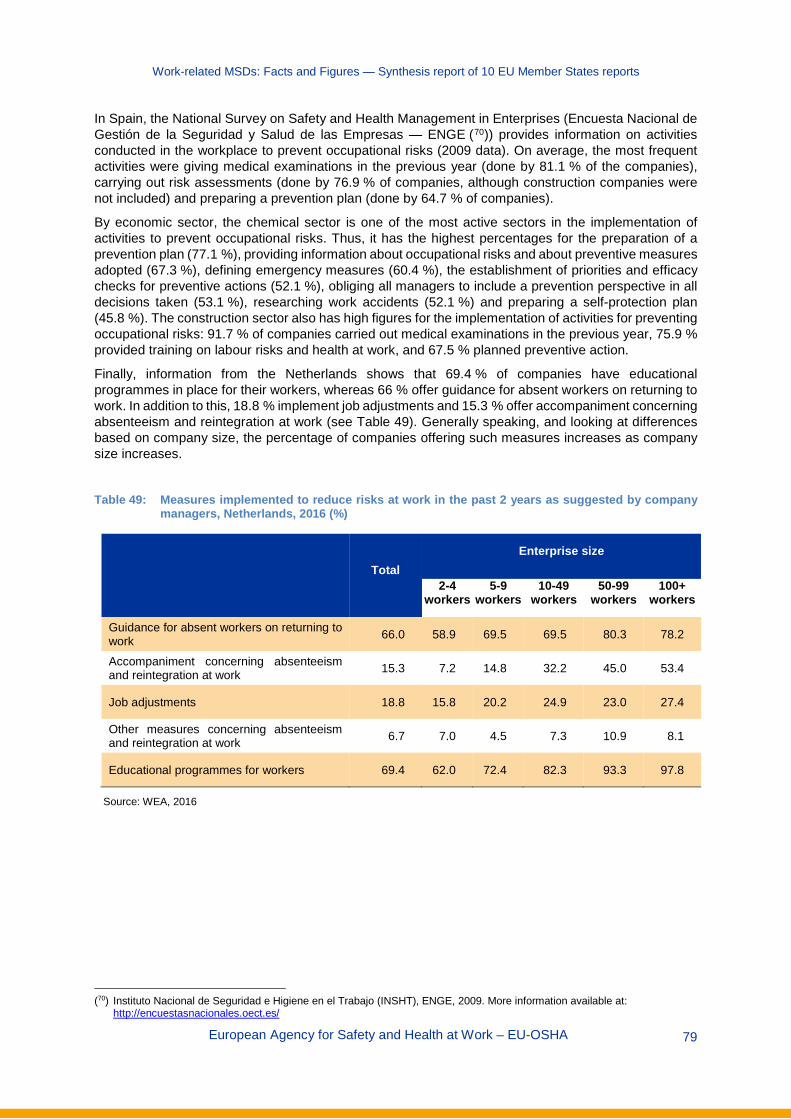
Work-related MSDs: Facts and Figures — Synthesis report of 10 EU Member States reports
European Agency for Safety and Health at Work – EU-OSHA 79
In Spain, the National Survey on Safety and Health Management in Enterprises (Encuesta Nacional de Gestión de la Seguridad y Salud de las Empresas — ENGE (70)) provides information on activities conducted in the workplace to prevent occupational risks (2009 data). On average, the most frequent activities were giving medical examinations in the previous year (done by 81.1 % of the companies), carrying out risk assessments (done by 76.9 % of companies, although construction companies were not included) and preparing a prevention plan (done by 64.7 % of companies).
By economic sector, the chemical sector is one of the most active sectors in the implementation of activities to prevent occupational risks. Thus, it has the highest percentages for the preparation of a prevention plan (77.1 %), providing information about occupational risks and about preventive measures adopted (67.3 %), defining emergency measures (60.4 %), the establishment of priorities and efficacy checks for preventive actions (52.1 %), obliging all managers to include a prevention perspective in all decisions taken (53.1 %), researching work accidents (52.1 %) and preparing a self-protection plan (45.8 %). The construction sector also has high figures for the implementation of activities for preventing occupational risks: 91.7 % of companies carried out medical examinations in the previous year, 75.9 % provided training on labour risks and health at work, and 67.5 % planned preventive action.
Finally, information from the Netherlands shows that 69.4 % of companies have educational programmes in place for their workers, whereas 66 % offer guidance for absent workers on returning to work. In addition to this, 18.8 % implement job adjustments and 15.3 % offer accompaniment concerning absenteeism and reintegration at work (see Table 49). Generally speaking, and looking at differences based on company size, the percentage of companies offering such measures increases as company size increases.
Table 49: Measures implemented to reduce risks at work in the past 2 years as suggested by company
managers, Netherlands, 2016 (%)
Total Enterprise size
2-4 workers
5-9 workers
10-49 workers
50-99 workers
100+ workers
Guidance for absent workers on returning to work 66.0 58.9 69.5 69.5 80.3 78.2
Accompaniment concerning absenteeism and reintegration at work 15.3 7.2 14.8 32.2 45.0 53.4
Job adjustments 18.8 15.8 20.2 24.9 23.0 27.4
Other measures concerning absenteeism and reintegration at work 6.7 7.0 4.5 7.3 10.9 8.1
Educational programmes for workers 69.4 62.0 72.4 82.3 93.3 97.8
Source: WEA, 2016
(70) Instituto Nacional de Seguridad e Higiene en el Trabajo (INSHT), ENGE, 2009. More information available at:
http://encuestasnacionales.oect.es/

Work-related MSDs: Facts and Figures — Synthesis report of 10 EU Member States reports
European Agency for Safety and Health at Work – EU-OSHA 80
European Agency for Safety and Health at Work
Santiago de Compostela 12, 5th floor 48003 Bilbao, Spain Тel. +34 944358400 Fax +34 944358401 E-mail: [email protected]
http://osha.europa.eu
The European Agency for Safety and Health at Work (EU-OSHA) contributes to
making Europe a safer, healthier and more
productive place to work. The Agency
researches, develops, and distributes
reliable, balanced, and impartial safety and
health information and organises pan-
European awareness raising campaigns. Set
up by the European Union in 1994 and based
in Bilbao, Spain, the Agency brings together
representatives from the European
Commission, Member State governments,
employers’ and workers’ organisations, as
well as leading experts in each of the EU
Member States and beyond.
TE-RO
-20-001-EN-N
Copyright © 2022 FDOKUMEN