University Microfilms International
215
INFORMATION TO USERS This material was produced from a microfilm copy of the original document. While the most advanced technological means to photograph and reproduce this document have been used, the quality is heavily dependent upon the quality of the original submitted. The following explanation of techniques is provided to help you understand markings or patterns which may appear on this reproduction. 1.The sign or "target" for pages apparently lacking from the document photographed is "Missing Page(s)". If it was possible to obtain the missing page(s) or section, they are spliced into the film along with adjacent pages. This may have necessitated cutting thru an image and duplicating adjacent pages to insure you complete continuity. 2. When an image on the film is obliterated with a large round black mark, it is an indication that the photographer suspected that the copy may have moved during exposure and thus cause a blurred image. You will find a gccd image of the page in the adjacent frame. 3. When a map, drawing or chart, etc., was part of the material being photographed the photographer followed a definite method in "sectioning" the material. It is customary to begin photoing at the upper left hand corner of a large sheet and to continue photoing from left to right in equal sections with a small overlap. If necessary, sectioning is continued again — beginning below the first row and continuing on until complete. 4. The majority of users indicate that the textual content is of greatest value, however, a somewhat higher quality reproduction could be made from "photographs" if essential to the understanding of the dissertation. Silver prints of "photographs" may be ordered at additional charge by writing the Order Department, giving the catalog number, title, author and specific pages you wish reproduced. 5. PLEASE NOTE: Some pages may have indistinct print. Filmed as received. University Microfilms International 300 North Zeeb Road Ann Arbor, Michigan 48106 USA St. John's Road, Tyler's Green High Wycombe, Bucks, England HP10 8HB
-
Upload
khangminh22 -
Category
Documents
-
view
0 -
download
0
Transcript of University Microfilms International

INFORMATION TO USERS
This material was produced from a microfilm copy of the original document. While the most advanced technological means to photograph and reproduce this document have been used, the quality is heavily dependent upon the quality of the original submitted.
The following explanation of techniques is provided to help you understand markings or patterns which may appear on this reproduction.
1.The sign or "target" for pages apparently lacking from the document photographed is "Missing Page(s)". If it was possible to obtain the missing page(s) or section, they are spliced into the film along with adjacent pages. This may have necessitated cutting thru an image and duplicating adjacent pages to insure you complete continuity.
2. When an image on the film is obliterated with a large round black mark, it is an indication that the photographer suspected that the copy may have moved during exposure and thus cause a blurred image. You will f ind a gccd image of the page in the adjacent frame.
3. When a map, drawing or chart, etc., was part of the material being photographed the photographer followed a definite method in "sectioning" the material. It is customary to begin photoing at the upper left hand corner of a large sheet and to continue photoing from left to right in equal sections with a small overlap. If necessary, sectioning is continued again — beginning below the first row and continuing on until complete.
4. The majority of users indicate that the textual content is of greatest value, however, a somewhat higher quality reproduction could be made from "photographs" if essential to the understanding of the dissertation. Silver prints of "photographs" may be ordered at additional charge by writing the Order Department, giving the catalog number, title, author and specific pages you wish reproduced.
5. PLEASE NOTE: Some pages may have indistinct print. Filmed as received.
University Microfilms International 300 North Zeeb Road Ann Arbor, Michigan 48106 USA
St. John's Road, Tyler's Green High Wycombe, Bucks, England HP10 8HB

I I
77-29,863
RICE, Robert C., 1938-A COMPARISON OF PERCEPTIONS OF SCHOOL DISCIPLINE BETWEEN STUDENTS, PARENTS, TEACHERS, AND SCHOOL ADMINISTRATORS.
Iowa State University, Ph.D., 1977 Education, administration
Xerox University IVlicrofilms, Ann Arbor, Michigan 48io6

A comparison of perceptions of school
discipline between students, parents, teachers.
A Dissertation Submitted to the
Graduate Faculty in Partial Fulfillment of
The Requirements for the Degree of
DOCTOR OF PHILOSOPHY
Department: Professional Studies
Major: Education (Educational Administration)
and school administrators
by
Robert C. Rice
Approved :
In Charge of Major Work
Iowa State University Ames, Iowa
1977
Signature was redacted for privacy.
Signature was redacted for privacy.
Signature was redacted for privacy.

ii
TABLE OF CONTENTS
Page
CHAPTER I. STATEMENT OF THE PROBLEM 1
Introduction 1
The Study 3
Definition of Terms 4
Delimitations 4
Sources of Data 5
CHAPTER II. REVIEW OF LITERATURE 7
Discipline; Defined 7
Discipline: The Public 9
Discipline: The School 14
Discipline: The Court 18
Discipline: Race Relations 20
Discipline: Punishment 21
Discipline: A Humanistic Approach 24
In Summary 24
CHAPTER III. METHODS AND PROCEDURES 26
Description of the Instrument 26
Construction of the Instrument 26
Selection of the Sample 27
Collection of the Data 30
Treatment of the Data 31
CHAPTER IV. FINDINGS 32
Introduction 32

iii
Page
Perceptions of Pressing Problems in School 33
Perceptions of Discipline as a Behavior Problem 43
Teachers and Discipline 55
Curriculum and Discipline 61
Punishment and Discipline 65
Integration and Discipline 67
Disciplinary Tools 68
Sources of Information about Discipline 73
S'jmmary Tables of Significant Chi Square Values 75
Discussion of Rankings 79
CHAPTER V. SUMMARY AND CONCLUSIONS 84
Limitations 84
Discussion 86
Conclusions 89
Recommendations for Future Study 91
Recommendations for Current Practice 93
BIBLIOGRAPHY 95
APPENDIX A. SURVEY INSTRUMENT 102
APPENDIX B. RESPONSES BY EDUCATIONAL LEVEL, AT LEAST A BACHELOR'S DEGREE OR LESS THAN A BACHELOR'S DEGREE, TO SURVEY QUESTIONS 119
APPENDIX C. RESPONSES BY AGE, MALE AND FEMALE, TO SURVEY QUESTIONS 132
APPENDIX D. RESPONSES BY CLASSIFICATION OF ADMINISTRATOR,
TEACHER, STUDENT, PARENT, TO SURVEY QUESTIONS 145
APPENDIX E. RESPONSES BY GEOGRAPHICAL REGION OF THE UNITED STATES, TO SURVEY QUESTIONS 158

iv
Page
APPENDIX F. RESPONSES TO SURVEY QUESTIONS BY SEX, MALE OR FEMALE, OF THE SAMPLE 171
APPENDIX G. VOLUNTARY COMMENTS BY SURVEY RESPONDENTS
ABOUT SCHOOL DISCIPLINE 186

V
LIST OF TABLES
Page
Table 1. Choice of discipline as a pressing problem by classification of respondent 34
Table 2. Choice of discipline as a pressing problem by age of respondent 34
Table 3. Choice of drugs as a pressing problem by classification of respondent 36
Table 4, Choice of drugs as a pressing problem by educational level of respondent 36
Table 5. Choice of drugs as a pressing problem by region of respondent's residence 37
Table 6. Choice of facilities as a pressing problem by classification of respondent 38
Table 7. Choice of facilities as a pressing problem by geographical region of respondent's residence 38
Table 8. Choice of finances as a pressing problem by geographical region of respondent's residence 39
Table 9. Choice of parents' lack of interest as a pressing problem by geographical region of respondent's residence. 40
Table 10. Choice of students' lack of interest as a pressing problem by classification of respondent .... 41
Table 11. Choice of students' lack of interest as a pressing problem by age of respondent 41
Table 12. Choice of students' lack of interest as a pressing problem by educational level of respondent 42
Table 13. Feelings about discipline in the local school by classification of the respondent 44
Table 14. Feelings about discipline in the local school by age of the respondent 45
Table 15. Feelings about discipline in the local school by age of the respondent 45

vi
Page
Table 16. Feelings about discipline in the local school by educational level of the respondent 46
Table 17. Feelings about discipline in the local schools being "not strict enough" or "just about right"
by geographical region of the respondent's
residence. 47
Table 18. Feelings about discipline in the local schools being "too strict" or "don't know" by geographical region of the respondent's residence 47
Table 19. Identification of the place of most undesirable student behavior by classification of the respondent 49
Table 20. Identification of the place of most undesirable student behavior by age of the respondent 50
Table 21. Perception of serious disciplinary problems by classification of the respondent 52
Table 22. Perception of serious disciplinary problems by geographical region of the respondent's residence. ... 53
Table 23. Perceptions of serious disciplinary problems by educational level of the respondent 54
Table 24. Vandalism perceived as poor discipline by educational level of the respondent 54
Table 25. Stricter teachers and fewer discipline problems
by classification of the respondent. .......... 55
Table 26. Perceptions of teachers younger than thirty as more liberal than teachers older than thirty by classification of the respondent 56
Table 27. Perception of teachers younger than thirty as more liberal than teachers older than thirty by by age of the respondent 57
Table 28. Teacher militancy and student discipline problems by classification of the respondent 58
Table 29. Students having more to say about teacher matters
by classification of the respondent 58
vii
Page
Table 30. Students having more say about teacher matters
by educational level of the respondent 59
Tabid 31. Students having more say about teacher matters by sex of the respondent 60
Table 32. Students having more to say about teacher matters by age of the respondent 60
Table 33. Will changing the school curriculum improve student behavior by geographical region of the tespondent's residence 61
Table 34. High school student involvement in curriculum by classification of the respondent 62
Table 35. High school student involvement in curriculum matters by age of the respondent 63
Table 36. Classification of respondents and relationship
of poor reading achievement and increased discipline problems 63
Table 37. Relationship of poor reading achievement and increased discipline problems by educational level of the respondent 64
Table 38. Relationship of poor reading achievement and increased discipline problems by age of the respondent 64
Table 39. Approval or disapproval of physical punishment by classification of the respondent 66
Table 40. Approval or aisapproval of physical punishment by geographical region of the respondent's residence 66
Table 41. Corporal punishment as an effective disciplinary tool by geographical region of the respondent's
residence 66
Table 42. Responses by geographical region to the relationship of integration and student discipline problems . . 67
Table 43. Responses by geographical region to expulsion as an effective disciplinary tool 68

viii
Page
Table 44. Detention as an effective disciplinary tool by geographical region response. 69
Table 45. Perception of corporal punishment as an effective disciplinary tool by geographical region response 70
Table 46. Perception of student-teacher conference as an effective disciplinary tool by geographical region response 70
Table 47. Perception of stricter rules and regulations as an effective disciplinary tool by classification of the respondent 71
Table 48. Perception of stricter rules and regulations as an effective disciplinary tool by age of the respondent 71
Table 49. Choice of parent conferences as an effective disciplinary tool by age of the respondent 72
Table 50. Perception of parent conferences as an effective disciplinary tool by classification of the respondent 73
Table 51. Perception of the best source of information
about school discipline in other parts of the
United States by age of the respondent 74
Table 52. Perception of the best source of information about school discipline in other parts of the United States by the educational level of the respondent 75
Table 53. Summarized list of the significant Chi square
values by topic of the question included in the survey instrument and by demographic categories of the responding sample 76
Table 54. By classification, significant Chi square values .... 77
Table 55. By sex, significant Chi square value 77
Table 56. By age, significant Chi square values 78
Table 57. By educational level, significant Chi square v a l u e s . . . . . . . . . 7 8

ix
Page
Table 58. By region, significant Chi square values 79
Table 59. Biggest problem for public schools 80
Table 60. Frequency of rank order choice of educational programs to help reduce discipline problems 83
Table 61. Class size too large--biggest problem 119
Table 62. Curriculum--biggest problem 119
Table 63, Discipline--biggest problem . 119
Table 64. Facilities—biggest problem 120
Table 65. Finances--biggest problem 120
Table 66. Integration/segregation--biggest problem 120
Table 67. Parents' lack of interest--biggest problem 120
Table 68. School administration procedures—biggest problem . . . 121
Table 69. School board policies—biggest problem 121
Table 70. Teachers in general--biggest problem 121
Table 71. Teachers' lack of interest--biggest problem 121
Table 72. Transportation—biggest problem 122
Table 73. No problems--biggest problem 122
Table 74. Don't know--biggest problem 122
Table 75. Description most associated with discipline 123
Table 76. Who should assume more rpsponsibility for discipline being not strict enough 123
Table 77. In what way is discipline not strict enough 123
Table 78. Best source of local information about discipline . . . 124
Table 79. Should students have more input on curriculum matters 124
Table 80. Should students have more input on school rules .... 124

X
Page
Table 81. Rank of "reduce class size" as a suggestion to
reduce student discipline problems 125
Table 82. Rank of "emphasize peer control" as a suggestion to reduce student discipline problems ... 125
Table 83. Rank of "more effective teacher selection and assignment" as a suggestion to reduce student
discipline problems 125
Table 84. Rank of "parental and community involvement" as a suggestion to reduce student discipline problems. . . 126
Table 85. Rank of "improve curricular offerings and teaching techniques" as a suggestion to reduce student discipline problems. 126
Table 86. Rank of "improve cooperation between administration and teachers" as a suggestion to reduce student
discipline problems 126
Table 87. Rank of "improve cooperation between educators and parents" as a suggestion to reduce student discipline problems 127
Table 88. Rank of "special classes for troublemakers" as a suggestion to reduce student discipline problems. . . . 127
Table 89. Rank of "institute behavior modification techniques by teachers" as a suggestion to reduce student discipline problems 127
Table 90, Rank of "enforce present rules and regulations" as a suggestion to reduce student discipline problems 128
Table 91. Rank of "more pupil participation in the policy and decision-making process" as a suggestion to reduce student discipline problems ......... 128
Table 92. Affect of integration on student discipline
problems 128
Table 93. Suspension from school as an effective disciplinary tool 129
Table 94. Expulsion from school as an effective disciplinary tool 129

xi
Page
Table 95. Lowering grades as an effective disciplinary tool. 129
Table 96. Exclusion from extracurricular privileges as an effective disciplinary tool ....... 129
Table 97. Detention as an effective disciplinary tool 130
Table 98. Parent conferences as an effective disciplinary tool 130
Table 99. Parent-student-teacher conferences as an effective disciplinary tool 130
Table 100. Corporal punishment as an effective disciplinary tool 130
Table 101. Utilization of behavior modification techniques as an effective disciplinary tool 131
Table 102. Stricter rules and regulations as an effective disciplinary tool 131
Table 103. Student-teacher conferences as an effective disciplinary tool ....... 131
Table 104. Class size too large--biggest problem 132
Table 105. Curriculum--biggest problem 132
Table 106. Drugs--biggest problem 132
Table 107. Facilities--biggest problem 133
Table 108. Finances—biggest problem 133
Table 109. Integration/segregation—biggest problem 133
Table 110. Parents' lack of interest—biggest problem 133
Table 111. School administration procedures—biggest problem . . . 134
Table 112. School board policies--biggest problem 134
Table 113. Teachers in general—biggest problem 134
Table 114. Teachers' lack of interest—biggest problem 134

xil
Page
Table 115. Transportation—biggest problem 135
Table 116. Vandalism--biggest problem 135
Table 117. No problems—biggest problem 135
Table 118. Don't know—biggest problem 135
Table 119. Description most associated with discipline 136
Table 120. Who should assume more responsibility for disci
pline being "not strict enough". 136
Table 121. In what way is discipline not strict enough 136
Table 122. Which discipline problems appear to be most serious. . 137
Table 123. Best source of local information about discipline. . . 137
Table 124. Should students have more input on school rules. . . . 137
Table 125, Rank of "reduce class size" as a suggestion to reduce student discipline problems ... 138
Table 126. Rank of "emphasize peer control" as a suggestion to reduce student discipline problems 138
Table 127. Rank of "more effective teacher selection" as a suggestion to reduce student discipline problems . . . 138
Table 128. Rank of "parental and community involvement" as a suggestion to reduce student discipline problems . . 139
Table 129. Rank of "improve curricular offerings and teaching
techniques" as a suggestion to reduce student discipline problems 139
Table 130. Rank of "improve cooperation between administration and teachers" as a suggestion to reduce student discipline problems 139
Table 131. Rank of "improve support between educators and parents" as a suggestion to reduce student dis
cipline problems ..... 140
Table 132. Rank of "special classes or schools for troublemakers" as a suggestion to reduce student dis
cipline problems ...... 140

xiii
Page
Table 133. Rank of "institute behavior modification techniques for teachers" as a suggestion to reduce student discipline problems. 140
Table 134. Rank of "enforce present rules and regulations" as a suggestion to reduce student discipline problems 141
Table 135. Rank of "more pupil participation in the policy and decision-making" as a suggestion to reduce
student discipline problems 141
Table 136. Affect of integration on student discipline
problems 141
Table 137. Suspension from school as an effective disciplinary tool 142
Table 138. Expulsion from school as an effective discipli
nary tool. 142
Table 139. Lowering marks as an effective disciplinary tool . . . 142
Table 140. Exclusion from extracurricular privileges as an effective disciplinary tool 142
Table 141. Detention as an effective disciplinary tool 143
Table 142. Parent-student-teacher conferences as an effec
tive disciplinary tool 143
Table 143. Corporal punishment as an effective disciplinary tool 143
Table 144. Utilization of behavior modification techniques as an effective disciplinary tool 143
Table 145. Student-teacher conferences as an effective disciplinary tool 144
Table 146. Class size too large--biggest problem 145
Table 147. Curriculum--biggest problem 145
Table 148. Finances--biggest problem 145
Table 149, Integration/segregation--biggest problem 146

xiv
Page
Table 150. Parents' lack of interest—biggest problem. ..... 146
Table 151. School administration procedures--biggest problem 146
Table 152. School board policies—biggest problem 146
Table 153. Teachers in general—biggest problem. 147
Table 154. Teachers' lack of intere8t--biggest problem . . , , . 147
Table 155. Transportation—biggest problem 147
Table 156. Vandalism—biggest problem 147
Table 157. There are no problems—biggest problem 148
Table 158. Don't know--biggest problem 148
Table 159. Description most associated with discipline 148
Table 160. Who should assume more responsibility for discipline being not strict enough 149
Table 161. In what way is discipline not strict enough 149
Table 162. Best source of local information about discipline . . 149
Table 163. Best source of national information about discipline 150
Table 164. More guidance counselors in the high school will reduce student discipline problems 150
Table 165. Teacher militancy increases student discipline problems 150
Table 166. A change in school curriculum would improve student behavior. ...... . 150
Table 167. Student input on school rules 151
Table 168. Rank of "reduce class size" as a suggestion to
reduce student discipline problems 151
Table 169. Rank of "emphasize peer control" as a suggestion to reduce student discipline problems 151

XV
Page
Table 170, Rank of "more effective teacher selection" as a suggestion to reduce student discipline problems 152
Table 171. Rank of "parental and community involvement" as a suggestion to reduce student discipline
problems 132
Table 172. Rank of "improve curricular offerings and teacher techniques" as a suggestion to reduce discipline problems 152
Table 173. Rank of "improved cooperation between administration and teachers" as a suggestion to reduce
student discipline problems 153
Table 174. Rank of "improve cooperation between educators
and parents" as a suggestion to reduce student
discipline problems . . . . 153
Table 175. Rank of "special classes or schools for trouble
makers" as a suggestion to reduce student dis
cipline problems 153
Table 176. Rank of "institute behavior modification techniques by teachers" as a suggestion to reduce
student discipline problems 154
Table 177. Rank of "enforce present rules and regulations"
as a suggestion to reduce student discipline
problems 154
Table 178. Rank of "more pupil participation in the policy and decision-making" as a suggestion to reduce
student discipline problems 154
Table 179. Affect of "integration on student discipline problems 155
Table 180. Suspension from school as an effective disci
plinary tool 155
Table 181. Expulsion from school as an effective discipli
nary tool 155
Table 182. Lowering marks as an effective disciplinary tool. . . 155

xvi
Page
Table 183. Exclusion from extracurricular privileges as an effective disciplinary tool 156
Table 184. Detention as an effective disciplinary tool 156
Table 185. Parent-student-teacher conferences as an effec
tive disciplinary tool 156
Table 186. Corporal punishment as an effective disciplinary tool 156
Table 187. Utilization of behavior modification techniques as an effective disciplinary tool 157
Table 188. Student-teacher conferences as an effective disciplinary tool 157
Table 189. Class size too large—biggest problem 158
Table 190. Curriculum--biggest problem 158
Table 191. Di8cipline--biggest problem 158
Table 192. Integration/segregation—biggest problem 158
Table 193. Pupils' lack of interest—biggest problem 159
Table 194. School administration procedures—biggest problem 159
Table 195. School board policies—biggest problem 159
Table 196, Teachers in general--biggest problem 159
Table 197. Teachers* lack of interest—biggest problem 160
Table 198. Transportation—biggest problem 160
Table 199. Vandalism—biggest problem 160
Table 200. No problems—biggest problem 160
Table 201. Don't know—biggest problem 161
Table 202. Description most associated with discipline 161
Table 203. Who should assume more responsibility for
discipline being not strict enough 161

xvii
Page
Table 204. In what way is discipline not strict enough 162
Table 205. Best source of local information about dis
cipline 162
Table 206. Best source of national information about discipline 162
Table 207, More guidance counselors in high school will reduce student discipline problems 163
Table 208. Stricter teachers have fewer student discipline problems 163
Table 209. Younger teachers (under 30) are more liberal
than older teachers. 163
Table 210. Teacher militancy increases student discipline problems 163
Table 211. Should students have more input on curriculum m a t t e r s . . . . . . . . . . 1 6 4
Table 212. Should students have more input on teacher
matters 164
Table 213. Should students have more input on school rules. . . . 164
Table 214. Poor reading achievement and increased student discipline problems 164
Table 215. Rank of "reduce class size" as a suggestion to reduce student discipline problems 165
Table 216. Rank of "emphasize peer control" as a suggestion to reduce student discipline problems 165
Table 217. Rank of "more effective teacher selection and assignment" as a suggestion to reduce student discipline problems. ........ 165
Table 218. Rank of "parental and community involvement" as a suggestion to reduce student discipline problems . . 166
Table 219. Rank of "improve curricular offerings and teaching techniques" as a suggestion to reduce student
discipline problems . 166

xviii
Page
Table 220. Rank of "improve cooperation between adminis
tration and teachers" as a suggestion to reduce student discipline problems 166
Table 221. Rank of "improve cooperation between educators and parents" as a suggestion to reduce student
discipline problems 167
Table 222. Rank of "special classes for troublemakers" as a suggestion to reduce student discipline problems . . 167
Table 223. Rank of "institute behavior modification techniques by teachers" as a suggestion to reduce
student discipline problems. .... 167
Table 224. Rank of "enforce present rules and regulations" as a suggestion to reduce student discipline problems 168
Table 225. Rank of 'teore pupil participation in the policy and decision-making process" as a suggestion to reduce student discipline 168
Table 226. Suspension from school as an effective disciplinary tool 168
Table 227. Lowering grades as an effective disciplinary tool. . . 169
Table 228. Exclusion from extracurricular privileges as an effective disciplinary tool 169
Table 229. Parent conferences as an effective disciplinary tool 169
Table 230. Parent-student-teacher conferences as an effective disciplinary tool 169
Table 231. Utilization of behavior modification techniques as an effective disciplinary tool 170
Table 232. Stricter rules and regulations as an effective disciplinary tool. .... 170
Table 233. Class size—biggest problem 171
Table 234. Curriculum--biggest problem 171
Table 235. Discipline--biggest problem 171
xix
Page
Table 236. Drugs--biggest problem ..... 171
Table 237. Facilities--biggest problem 172
Table 238. Finances--blggest problem 172
Table 239. Integration/segregation--bigge8t problem 172
Table 240. Parents' lack of interest—biggest problem 172
Table 241. Pupils' lack of interest—biggest problem 172
Table 242. School administration procedures--biggest problem, . . 173
Table 243. School board policies--biggest problem 173
Table 244. Teachers in general—biggest problem . ... 173
Table 245. Teachers' lack of interest--biggest problem 174
Table 246. Transportation--biggest problem 174
Table 247. Vandalism--biggest problem 174
Table 248. No problems--biggest problem 174
Table 249. Don't know--biggest problem 175
Table 250. Description most associated with discipline 175
Table 251. Feeling about discipline 175
Table 252. Who should assume more responsibility for discipline being not strict enough 175
Table 253. In what way is discipline not strict enough 176
Table 254. Place of most undesirable student behavior 176
Table 255. Which discipline problems appear to be most serious 176
Table 256. Best source of local information about discipline. . . 177
Table 257. Best source of national information about dis
cipline. . 177

XX
Page
Tablé 258, Younger teachers (under 30) are more liberal than older teachers 177
Table 259. Should students have more input on curriculum matters 177
Table 260. Should students have more input on school rules. . . . 178
Table 261. Poor reading achievement and increased student discipline problems 178
Table 262. Rank of "reduce class size" as a suggestion to reduce student discipline problems 178
Table 263. Rank of "emphasize peer control" as a suggestion to reduce student discipline problems 179
Table 264. Rank of "more effective teacher selection and assignment" as a suggestion to reduce student
discipline problems 179
Table 265. Rank of "parental and community involvement" as a suggestion to reduce student discipline problems . . 179
Table 266. Rank of "improve curricular offerings and teaching techniques" as a suggestion to reduce student dis
cipline problems 180
Table 267. Rank of "improve cooperation between administration and teachers" as a suggestion to reduce student discipline problems. ......... 180
Table 268, Rank of "improve cooperation between educators and parents" as a suggestion to reduce student discipline problems ...... 180
Table 269. Rank of "special classes for troublemakers" as a suggestion to reduce student discipline problems . . . 181
Table 270. Rank of "institute behavior modification techniques by teachers" as a suggestion to reduce stu
dent discipline problems 181
Table 271. Rank of "enforce present rules and regulations" as a suggestion to reduce student discipline problems . . 181

Page
182
182
182
183
183
183
183
184
184
184
184
185
185
xxi
Rank of "more pupil participation in the policy
and decision-making process" as a suggestion to
reduce student discipline
Affect of integration on student discipline
problems
Suspension from school as an effective discipli
nary tool
Expulsion from school as an effective discipli
nary tool
Lowering grades as an effective disciplinary tool. .
Exclusion from extracurricular privileges as an
effective disciplinary tool ;
Detention as an effective disciplinary tool
Parent conferences as an effective discipli
n a r y t o o l . . . .
Parent-student-teacher conferences as an effec
tive disciplinary tool .
Corporal punishment as an effective disciplinary
tool . . . .
Utilization of behavior modification techniques
as an effective disciplinary tool
Stricter rules and regulations as an effective
disciplinary tool
Student-teacher conferences as an effective
disciplinary tool

1
CHAPTER I. STATEMENT OF THE PROBLEM
Introduction
Concern about the behavior of students throughout this country is
by no means concentrated among those connected with the formal educa
tion process as witnessed by the annual Gallup Poll regarding public
schools. For the past seven years, Gallup International has surveyed
the nation to discover the views of the American citizen toward the pub
lic schools. The original survey in 1969, How the Nation Views the Pub
lic Schools, was sponsored by CFK, Ltd., a small Denver-based foundation.
CFK, Ltd., was dissolved in 1974 and the survey was sponsored in 1975 and
1976 by the Ford Foundation. Phi Delta Kappa, a professional educators*
fraternity, has included the results of each survey in their magazine,
Phi Delta Kappan (26-32).
The issue of discipline in the schools is clearly a major issue
among the American citizenry. In six of the seven annual Gallup surveys,
"lack of discipline" was the number one concern, and the percentage of
people rating this first has changed little in those six years—18 per
cent to 26 percent. In 1971 the concern for discipline ranked as the
third greatest concern of the public with 14 percent choosing it as their
first concern. That year, finances was the greatest concern of the pub
lic, and integration/segregation their second concern. The last complete
survey, 1975, indicated discipline as the public's first concern and
integration/segregation second and finances the third greatest concern.
Tentative data released for the 1976 survey also place discipline in
2
first place as a concern.
In examining discipline, Sheviakov and Redl (71, p. 1) reflect
upon present-day attitudes:
Probzsms of discipline and self-control assume new significance and realism in today's world. In a complex civilization, the individual often has to subjugate his per
sonal inclinations, whims, comforts, even some of his liberties, to bigger goals than personal ones. If the democratic philosophy is to flourish, our ways of living, believing, the ideals of generations must be preserved. For this, we need children and young people who cherish those ideals above all and who are ready to endure privation and to exercise utmost self-control.
Indeed, Anderson and Van Dyke (3) argued that, in terms of school
discipline, student behavior should be largely self-controlled. They go
on to explain that obedience to rules is based upon understanding rather
than mere direction.
News reports alert the public to the adjustments schools face in
dealing with liberties and self-control in today's complex society by
reporting incidents of student disruptions, vandalism, and violence.
Court rulings pertaining to student rights and integration, state atten
dance laws, changes in the public image of teachers, public involvement
in school policy development, public recognition of special education
numbers and needs, and the alleged decline of the family role in educa
tion and discipline all combine to present unmet expectations of the
public school. In turn, the public awaits accountability from the
schools, regardless of personnel, legal, social, or financial limita
tions. Even with the results of these annual Gallup surveys, there is
still a lack of evidence about the areas of agreement among students,
parents, teachers, and administrators as to their separate or combined

3
perceptions of what constitutes a "lack of discipline," This void in
hibits schools in their attempts to establish valid and enforceable
policies, rules, and regulations.
The Study
The lack of discipline in the schools is alleged to be the basis of
many failures in a time that public schools are expected to adequately
handle many of the frustrations and unmet needs of society. Perceptions
of school discipline lack consistent definition, desire, and practice
which has resulted in unsatisfactory application of appropriate discipli
nary methods or the achievement of an acceptable behavior pattern. Per
haps this situation can be improved by identifying discipline as parents,
students, and educators have perceived it separately.
The problem of this study is to provide a bench mark which school
managers may use to recognize and control the factors which contribute
to better discipline in the school. A comparison of perceptions of
selected students, parents, teachers, and administrators toward various
factors relating to school discipline is used to provide a basis for the
conclusions. Specifically, the intent is to study and identify, by
selected demographic classifications, areas of common understanding of
school discipline which may then be utilized to interpret, develop, and
communicate practices and programs essential to a good learning environ
ment.

4
Definition of Terms
Words often have different meanings depending on their context.
In the interest of clarity, this investigation used the tentative defi
nition of discipline to be the presence of behavior patterns that do not
inhibit students from learning and/or interfere with the learning of
other students.
Other terms were defined as:
Administrâtor--All personnel who regularly function in a profes
sional nonclassroan capacity--principal, associate principal, assis
tant principal, and counselor or dean--at the school participating
in this study.
Parent--Parent refers to any person, natural or legal, who has a
child in grade 10, 11, or 12 in the school participating in this
study,
Perception--A judgment or observation.
Student--Student refers to regularly enrolled pupils in grades 10,
11, or 12 in the school participating in this study.
Teacher--Teacher refers to any person who was responsible for in
struction in one or more classes at the time the school participated
in the study.
Delimitations
The following delimitations were established for the purposes of
this study:
1, The study was limited to students in grades 10, 11, and 12

5
in four high schools, each representing the North, South, East,
or West region of the mainland United States.
2. The study was primarily concerned with the perceptions held
by students, parents, teachers, and administrators regarding
discipline in their school.
3. The responses from each selected high school were obtained by
a "contact person" working with a consistent set of written
directions and survey instrument.
4. The selection of each specific high school was based upon the
availability of a "contact person" who would consent to partic
ipate in the study, and without attempting to equate the total
number of students enrolled.
Sources of Data
The data were obtained through the administration of a written
survey instrument which was developed by analyzing various studies re
lating to school discipline and other reviewed literature.
Four public high schools, each from one of four geographic areas of
the mainland United States--North-Minnesota, East-Connecticut, South-
Mississippi, and West-California—agreed to participate in this study.
As a provision of consent to participate in the study, it was agreed
that the specific school district and the high school would remain anony
mous. The Individual school data and comparisons will be identified and
disseminated only by the participating district according to the local
policies or practices that govern research in that district.

6
Participants were selected to represent four groups within each
high school, students from grades 10, 11, and 12 only, not to exceed
the number of representatives by each grade belonging to the student
council, 48 parents, 16 for each grade level, and with a child in grade
10, 11, or 12, 25 percent of the teachers in the selected high school,
and all principals, assistant principals, and counselors or deans from
each selected high school were invited to complete the survey instru-
men C.

7
CHAPTER II. REVIEW OF LITERATURE
The review of literature addresses six topics, beginning with ex
planations of school discipline and closing with a humanistic applica
tion of discipline to positively modify student behavior patterns. Other
areas discussed will include the concerns of the general public, the
school, and the court, and the use of discipline as punishment.
Discipline: Defined
In the American public school, key ailments surface and, all too
often, tend to be treated with only peripheral medications. Seldom are
central issues directly confronted, examined without bias, and solved.
So it is with the abrasion and heartache sometimes loosely referred to
by teachers and parents as "discipline" (36). Bleet (6) commented in
his dissertation, which related to developing a model discipline code,
that he had been greatly impressed with the great differences of opinion
concerning discipline within the field of education.
Bleet examined several meanings of the word "discipline" and offered
a tentative definition for application to school situations as the
presence of behavior patterns that do not interfere with learning of
students, i.e., to attend school punctually and regularly; conform to
regulations; obey promptly all directions of those in authority; be re
spectful of others; be courteous to others; and practice good deportment.
Contrariwise, in a 1969 parent survey. Jack Schwartz et al. (70) addressed
"discipline" as control of student behavior or the punishment

8
administered as a resuit of violating school rules.
Other uses of discipline have been to describe a branch of knowl
edge or training. The military interprets discipline as a systematic
method of training that is expected to produce a specific character,
pattern of behavior, or obedience. A set of rules or methods which
regulate some religions and their churches is also referred to as dis
cipline.
John D. Starkey et al. (78, p. 1), writing about discipline and
liberal teachers, defined discipline as "maintenance of conditions con
ducive to the efficient achievement of the school's function within the
classroom." Disciples of William Classer believe that good discipline
is a matter of thinking and responsibility; not just a way of dealing
with students, but a way of living.
Summarizing major public complaints, Gallup (as cited by Elam, 22,
p. 14) points out that "poor education" is often associated with the
lack of proper discipline. The public further defines a "poor" school
as one in which school officials cannot "keep students in line."
Discipline in the school may use any or all of the meanings men
tioned; however, a distinction is necessary when defining discipline as
the presence or absence of certain behaviors and is understood or ex
pected as a punitive action. Discipline as punishment may be adminis
tered as mental or psychological and as physical or corporal.
Oftentimes the discussion of discipline includes reference to
punishment or withdrawal of privileges to the threat of punishment as
a deterrent to poor behavior in the school. Willower et al. (91)

9
measured the pupil control ideology of educators and found the custodial
control of students in school settings was similar to custodial control
of inmates in prisons and mental hospitals (i.e., in terms of main
tenance of order, distrust, and a punitive approach to student control).
Discipline: The Public
Arthur Visor (87) claimed that good discipline does not begin in
the classroom; it starts at home, continues on the way to school, mani
fests itself in the corridors, in the lunchrocsn, and in assemblies, and,
most importantly, is exhibited in the classroom where the student spends
most of his time. In late 1973, Dr. Gallup (cited in 22, p. 3), writing
a summary of the first five polls of public attitudes toward education,
observed, "while discipline is properly a responsibility of the home, the
schools must perforce be more effective in mitigating this problem, or
they will continue to suffer the consequences." And recently, former U.S.
Commissioner of Education, Terrell Bell, was quoted in an interview (49,
p. 44) as saying, "I think discipline in and of itself is part of educa
tion, and one of the great lessons that we have to learn in life is how
to master and control ourselves so the individual does what he should
do, whether at the moment he wants to or not,"
Bell further believes the big task of both the home and the school
is to teach values—self-discipline and self-reliance, an insistence on
standards and a reaching for ideals that reinforce discipline rather
than a punitive approach to discipline.
The many good things which s-hools are achieving in every community

10
regarding discipline seldom receive the same treatment in the local and
national press as the front-page coverage of classroom disruptions and
student violence which unfavorably affect the image of school discipline
(22). Moreover, there is little evidence which suggests a common defi
nition of school discipline that is acceptable to students, parents,
teachers, and school administrators.
William Goldstein (36) writing about school discipline, alluded to
discipline as a key ailment in the school which has not been confronted,
analyzed, and solved. He also wrote that the heartache of parents and
teachers is often referred to as "discipline."
The greatest single indicator of the concern of the public about
school discipline has been the seven annual Gallup Polls about attitudes
toward education. The Gallup Polls sponsored by CFK, Ltd., and the Ford
Foundation as reported in the Phi Delta Kappan have shown that dismay
exists on the part of the public for discipline in the school (22 and 52,
p. 2), The annual sample of opinion has embraced [sic] from 1505 to 1702
adult respondents per year, and during three years 778 student respond
ents and 576 educators in two years (22). This research is described
as using a modified probability sample of the nation, randomly selected
in every part of the country and in all types of ccmmunities. These
communities, taken together, Gallup insists, represent a true microcosm
of the nation. In reporting the results of the interviews of the sample,
Gallup reported responses by region of the United States--East, Midwest,
South, and West. Other demographic data--sex, race, educational level,
occupation, age, religion, income, and community size--were reported

11
for several questions each year. All the surveys were reported in
terras of the percent of various responses to Likert-type scale answers.
The seven Gallup Polls of education, 1969-1975, claim to provide a
great source of information regarding the attitude of the public toward
education and were intended to assist educators in making critical de
cisions. Recognizing the general nature of this poll, it did spotlight
concerns; however, practical use of the results for school decision
makers is suspect. Problems were identified but very few concrete sug
gestions appear that may be applied to improve the negative image of
school discipline.
The Gallup findings apply to the nation as a whole and not to any
state or local community; however, local surveys employing the same ques
tions can be made to determine how a single community compares to the
national norm. Questions and results of the "Gallup Polls of Attitudes
Toward Education" are not copyrighted, and no limitations are placed
upon their use beyond customary credit to source, accuracy, and com
pleteness of quotation (22, p. 190).
In all but one of the last seven years, the nation's adults sampled
in the Gallup Polls have cited discipline as the greatest concern and
problem in their own communities (22, 26, 27, 28, 29, 30, 31, 32). The
initial Gallup Poll in 1969 (22) was conducted to measure the attitudes
of the American public toward public schools and to leam how citizens
judge the quality of their schools. Results of the survey indicated
that the public was only "fairly informed" about the local schools and
"very poorly informed" about education. When asked specifically to name
12
"the biggest problem with which the public schools in this community
must deal," the greatest number of responses was "discipline." The
second greatest concern was the lack of school facilities, and third
mentioned was "teachers." Interestingly, the criterion for good schools
was "qualified teachers," but the responses revealed that there was little
understanding of what was meant.
With few questions directed specifically toward discipline, the
1970 public again indicated it as their greatest concern (29). The
sample responded that discipline was "not strict enough" and parents felt
"the school" should assume more responsibility in correcting laxity.
Students were included as a part of this sample and pointed the finger
at teachers as the ones responsible for correcting the laxity.
With further action by the courts to order busing, the areas of
integration/segregation/busing were the second greatest concern mentioned
by the sample and school finances the third. From this 1970 poll on
through the 1975 poll, these two areas continue to rank high on the list
of public concerns.
In the year 1971, the annual survey (32) emphasized the problem of
school financing; discipline was the third greatest concern of the pub
lic. It is believed that the public concern for discipline ranked third,
rather than first as in 1969 and 1970, because evidence showed that dis
cipline had been tightened in the public schools, just as it had been
in the colleges (22, p. 83).
Data indicated that the issue of whether discipline was "too strict"
or "not strict enough" was nearly even with 22 and 23 percent opting

13
for each choice. Those who said discipline was not strict enough cited
teachers' lack of authority and too much student freedom as the causes
for weakness. The public voiced strong opinion that, "If the schools
and teachers interest the children in learning, most disciplinary prob
lems disappear" (22, p. 97).
In 1972 the Gallup Poll (27) ranked discipline as the greatest con
cern of the public schools. Lack of financial support and integration/
segregation were second and third concerns. This year's poll included
a separate survey of educators, and discipline ranked as their third
concern, with finances and integration/segregation as first and second
(22, p. 121).
The public again ranked discipline as first concern and educators
again ranked finances as their first concern in the 1973 Gallup Poll.
Parents responded to the meaning of discipline as (1) Discipline is
respect for the teacher; (2) Learning taking place without confusion;
and (3) Keeping children so interested they are obeying rules (22, p.
156).
The sixth and seventh Gallup Polls (31, 30) again had "lack of dis
cipline" heading the list of problems cited most often by public survey
respondents. New evidence of the importance of this concern came from
the special 1974 survey of high school juniors and seniors who reported
a higher percentage than the public in identifying discipline as the
leading concern.

14
Discipline: The School
Today's educator is faced with maintaining a discipline balance
between being too permissive and too rigid, between the need for author
ity and order in the school and society's and government's Image of
flaunting the same, and between the demands for law and order and the
cry for autonomy. On one side, Charles Silberman (72) proposes better
student behavior through humanizing the educational process, maintaining
that students can accept the responsibilities of greater freedom from
arbitrary rules, regulations, and practices. To the other side is James
Dobson (19) who feels the assertion of authority is not an adult con
spiracy against children. He agrees that the dangers of harsh, oppres
sive, and crass discipline are not best, but to cite such cases as the
only justification to eliminate discipline is foolishness.
The serious concern of the public, as shown in the Gallup Polls,
doesn't stop at the gate to the school campus where the educators may
be found discussing the breakdown in respect and inconsistent assistance
and enforcement of rules by the school and parents. The Council for
Basic Education has criticized parents for most of the breakdown of dis
cipline and respect for authority in America. A sure sign of the parents'
reaction to a changing curriculum and "poor discipline" is the recent
rapid growth of the "fundamental" or "alternative" schools.
Another sign of the public concern is that many school districts
have found the public pressure so great that they have had to develop,
within their regular school offerings, an alternative school. Generally,

15
the alternative is based upon basic education, i.e., usually courses
which address themselves to reading, writing, computational and civic
skills. The rationale is that by not addressing the curriculum to
these basics permits or promotes a permissive environment and does not
lend support to good disciplinary practices. Typically time for art,
music and physical education is reduced.
Dr. Benjamin Spock (75) has suggested in his writings that the needs
within the family may not be totally appropriate when laissez-faire or
democratic discipline is utilized for discipline. The authoritarian or
arbitrary method of decision-making and disciplinary action would perhaps
better fit the approach expected by the basic school patronage. Not sur
prisingly, Spock does not believe the authoritarian style of discipline
will permit the optimum development of a youngster's potential. He sug
gests that the overpermissive or laissez-faire often results in ill-be
haved children.
Some school districts have recognized the need for mutual support
by parents and the school and have provided formal and informal opportun
ities for the parents and community to communicate their concerns and
desires to the school. As part of the Philadelphia School District's
efforts to increase communication between school personnel, pupils,
parents, and the community at large, they surveyed parental experiences,
concerns, and attitudes regarding the public school system in the Over-
brook High School "feeder area" (70). A team of 20 interviewers con
ducted 751 interviews using a stratified random sampling procedure in
volving census tract, race, and grade level quotas. Responses were

16
reported by percentages and significance noted at the .05 level. The
Overbrook Study (intended to be informative, not a rigorous research model)
did result in a unique approach to strengthening school-community communi
cations, thus providing a sounder basis for critical decision-making in
the district.
When parents were asked about discipline in the schools, 53 percent
expressed support for discipline in general, 18 percent supported some
form of physical punishment, 11 percent opposed physical punishment and
6 percent felt discipline in general should be reduced. Parents men
tioning specific forms of discipline supported detention during recess
and after school, denial of privileges in school, extra homework assign
ments, and expulsion. Interestingly, one in ten parents supported what
ever form of discipline the child's teacher felt was best.
A survey, similar to the Overbrook project, of parents in Willowdale,
Ontario, (92) in 1972 had similar responses when asked whether discip
line in secondary schools should be stricter. A majority of parents
agreed that school discipline should be stricter. The Philadelphia and
Willowdale parents also responded similarly to the question of physical
punishment.
At the University of Southern California, Bruce Hauger (42) studied
perceptions of selected student discipline policies in several high
schools. Data were obtained from one student, parent, and teacher for
every 300 students and all administrators and counselors in eight
Southern California public high schools. Statistical significance was
determined by using the chi square statistical test. Conclusions based

17
upon responses to four discipline policies indicate a need to include
all groups on committees formulating discipline policies, and a more
efficient system of communication between the school and the community
should be developed in regard to discipline procedures.
His conclusions did recognize suspension as a technique of dealing
with some but not all violations of discipline policies. He further
concluded that many of the issues litigated in the courts regarding
school have been a result of the failure of school boards and adminis
trators to recognize the shifts in societal attitudes and values. The
study did not define discipline but implies that good discipline is be
havior which reflects the attitudes and values of society. Hauger (42,
p. 204) also recommends that future studies on this topic address percep
tions held by various members of society toward public school policies.
Others, such as Robert T. Hall (39) have analyzed teacher opinions
concerning discipline to assist in developing administrative direction
to improve school discipline. He found in four Jacksonville, Florida,
junior high schools that sixty-nine percent of the teachers favored
corporal punishment as a disciplinary method. When the same teacher
sample was asked if they favored detention as a disciplinary method,
thirty-nine percent were not in favor, but interestingly thirty-six per
cent felt a student should never be expelled from the classroom.
While developing a model discipline code for secondary schools,
Thomas Bleet (6) determined that seventy percent of the teachers and
eighty-two percent of the school administrators surveyed agreed that
the lack of discipline was a major problem in modern schools. His

18
dissertation raised several interesting questions but appears to con
tain many value-laden beliefs without solid research to support all the
positions taken. He did speculate that teacher militancy contributed
to poor behavior of students at school by submitting that students have
seen the power of teachers increase dramatically to the point that a
teacher can no longer be summarily dismissed without appropriate due
process; hence the students attempt to copy the teachers' example.
Reflecting upon the contribution of the lack of discipline or the
improvement of behavior, Bleet indicates an agreement among his sample
that younger teachers are more liberal than older teachers and that
today's teachers are not strict enough in dealing with disciplinary
problems in the schools. Regarding the application of disciplinary pen
alties, he found that seventy percent of the community representatives
supported corporal punishment while administrators slightly favored it
and teachers were nearly equally divided in their support. For the use
of suspension of student offenders as a penalty, the community did not
strongly support and educators held no consensus.
Discipline: The Court
Externally, the schools have faced the pressures of changing family
lifestyles and of court decisions relating to discipline procedures and
substantive rights of students as citizens. Few schools recognized the
future impact of a 1965 United States Supreme Court review of a case in
which a juvenile appealed his conviction and confinement to a reform
school for allegedly making remarks judged to be obscene. Shortly

19
thereafter, Tinker vs. Pes Moines (85) did awake school districts to
recognize the constitutional rights of students.
Most notably has been the court's recent view of iji loco parentis.
Traditionally, school administrators and teachers operated under a legal
and moral sanction known as iji loco parentis ; that is, that the educators
might act as parents in determining the behavior of the child which was
most appropriate while at school. Recently, the question of the extent
and nature of disciplinary control and the social consequences of in
loco parentis discipline has been critically scrutinized by the courts,
parents, and educators themselves.
Roy Howarth (46, p. 626) in writing on the decline of m loco paren
tis has taken the position that society and the courts assume an in
consistent ethic as far as schools are concerned. Specifically;
In denying the traditional prerogatives of loco parentis, the legal-minded have made certain assumptions about the
American family that are in conflict with traditional assumptions. The modern American family is often rent with disagreements about life-style, authority, respect, and individuality; thus any assumptions about a student's ability to function freely in the school's society because of a consistent framework of values in the modern heme is patently false. Behind the traditional school situation there existed an ethic in American family life which served to unify school
and family in the pursuit of common goals.
Contrariwise, William F. Maready (58, p. 5), in lecturing on the
role of courts as educational policy makers at the National School
Boards Association convention, said the courts have spent much time in
recent years dealing with student discipline. The decisions in this area
have substantially eroded the ccmmon law doctrine which held that the
school authorities stood iji loco parentis, or in the place of parents.

20
and that in such position of the school discipline was final and abso
lute. "The doctrine is still very much alive and is often relied on by
the courts to dismiss an action, provided the court agrees that the
school authorities have not denied substantial rights by arbitrary and
capricious action," Also, in deciding the Tinker (85) case, the court
ruled that the doctrine of loco parentis must yield to the constitu
tional rights of youth. Justice Portas, speaking for the court, asserted
that school officials do not possess absolute authority over their stu
dents and the First Amendment rights are applicable in school as well as
out of school.
Discipline: Race Relations
Since 1954 the courts have been heavily involved in the arena of
mandating equal education opportunities for all students regardless of
race or color, an argument which has yet to be fully settled, interest
ingly though, Gallup's Polls (22) indicated for several years a concern
which ranked high with the public was segregation/integration/busing,
there are two modest studies which indicate that discipline and these
concerns may not be related in actual practice. In a 1971 Pittsburgh
study, Glenn Queer (67) elicited opinions from Pittsburgh School District
principals, selected parents, and representatives of elementary and sec
ondary teachers concerning corporal punishment and disciplinary action;
and in the discussion of the results, he indicated that racial tensions
and busing did not appear to be important factors in the increased dis
cipline problems of Pittsburgh. While across the continent, a 1964-71

21
evaluation report (81) of the Sacramento Schools' integration program
indicated that discipline problems were less in integrated schools.
Discipline: Punishment
Psychological punishment is present in school in a great many forms
which can be interpreted as constructive or destructive, depending upon
by whom and how the punishment is administered and to whan it is applied.
Some of the more common forms of this type of punishment are observed in
reprimands, conferences, enforced labor, isolation, suspension or expul
sion from school settings, and "Mikado" punishments (57, p. 158).
Reprimands may take the form of written or oral criticism and may
be effective in altering behaviors if communicated calmly and without the
heat of anger. A negative effect of a reprimand is likely if it is
thought to be unfair or embarrassing and may actually increase the con
tinuance of unacceptable behavior patterns.
The conference in itself is not a punishment but has the overtones
of punishment when it is held as a result of misbehavior or as the result
of a threat, such as a threat to include parents in a discussion in
hopes to deter errant student actions.
A student who has defaced a school wall may be assigned the task
of repairing the damage and, as a result, experiences enforced labor.
Generally speaking, this punishment does no physical harm to the student
but has caused embarrassment, lowered his ego, and brought about an under
standing of the costs of time, labor, and aesthetics.
Isolation of students who misbehave in school is probably more

22
common in elementary than secondary schools. However, even in the ele
mentary school, the isolation tactic is difficult to handle with posi
tive results since most situations result in ridicule of the offender.
At the secondary school level, the tactic of isolation within the room
becomes nearly nonexistent, and sometimes it becomes necessary to exclude
students from the school environment by enforcing a suspension or expul
sion. Though they are often understood as the same, the suspension is
usually temporary and expulsion is permanent or for an extended length
of time. Neither is in itself a physical punishment, but both separate
the individual physically and mentally from the activity to which they
are applied.
"Mikado" punishments may be effective when applied by talented and
empathetic teachers who take caution not to expose students to sharp rid
icule. An example might be that students who forget their pencils might
be supplied with extremely short pencils which cause annoyance to the
user (57). No doubt there are other effective types of psychological
punishment utilized by teachers and administrators with mature judgment
and common sense.
There is controversy over the administration of corporal punishment
to students by school authorities, that is physical punishment employed
as a reinforcement or the enforcement of discipline. Nolan Estes, Super
intendent of the Dallas, Texas, schools, is one of the most visibly
strong supporters for corporal punishment being retained in the schools.
In 1970 four of the Dallas school board members were not reelected in
favor of candidates who advocated stronger discipline in their schools.

23
At about the same time, Mark Shedd, Superintendent of the Philadelphia
schools, was charged with setting a permissive attitude in the school
district because of his position on corporal punishment and subsequently
resigned.
Many years ago, rules were strict and sternly enforced by corporal
punishment before an audience of peers or by other forms of physical
distress, such as standing in a corner or standing on one foot placed
in a wooden shoe containing a sharp peg. Most, but not all, districts
have stopped such punishment. In the 1971-72 school year, the Dallas,
Texas, school district confirmed that over 24,000 paddlings were admin
istered in the district that year (84, p. 140).
The report of the National Commission on the Reform of Secondary
Education presented a strong recommendation that it is time for public
schools to cease using physical punishment as a means of discipline. The
commission further maintained that children in school are the only mem
bers of society to whom physical punishment can be legally administered
without court procedure, noting also that neither the military nor pen-
tentiaries employ physical punishments, except in the prisons of the
State of Mississippi (84).
At about the same time the National Commission was preparing their
recommendations, the National Education Association Task Force on Cor
poral Punishment and the American Civil Liberties Union jointly formed
the National Committee to Abolish Corporal Punishment in Schools. Despite
controversy within the NEA membership, the organization went ahead by
announcing that teachers and other school personnel abhor physical
24
violence of persons toward each other, no matter what the form.
Discipline: A Humanistic Approach
Since the 1969 Gallup Poll and the Overbrook study, another approach
to discipline has been gaining momentum, William Classer's Reality
Therapy, Dr. Classer is the psychiatrist who has developed a therapy
which varies from Freudian psychology which holds that psychological
disorders arise when there has been a "cultural" interference with the
instinctual or biological needs of the individual. Whereas, Reality
Therapy holds that the problem is rather an incapacity or failure at the
interpersonal or social level of human functioning (33).
In application (34), Classer insists that unsuccessful students and
students who cause trouble should be counseled, preferably in a group
where successful students and problem students are together. His premise
is that punishment is differentiated from discipline; that is, discip
line conries from within while punishment is inflicted by others. The
Reality Therapy approach to the psychology of discipline appears congen
ial to and applicable by professional educators in conjunction with their
regular teaching activities.
In Summary
Generally speaking, discipline of students has been defined as the
behavior of students and punishment as a means to gain good behavior.
Punishment has been administered psychologically and physically. Corpo
ral punishment appears to be more easily recognizable by the general

25
public and has strong supporters from the liberal and conservative seg
ments of the school population. Perhaps, there is not controversy around
the psychological punishment because it is not always recognized as such
by the student or the general public.
The Gallup Poll of attitudes toward schools by the public has
clearly indicated the public's concern about the apparent lack of disci
pline in the public schools. Educators are also questioning the change in
student behavior; however, the simple identification of this concern by
the public and educators appears to have produced little that is useful
for the decision-makers or to pacify the public. All levels of associa
tion with schools have received criticism; the school being blamed for
permissiveness and liberalism; and parents are blamed for lack of concern
and accountability for their youngsters.
With the involvement of the courts in mandating integration, there
is little evidence available to link the lack of student discipline
directly to integration or busing. However, the decisions of the courts
which altered the traditional understanding of ̂ loco parentis have
caused the schools to address their disciplinary actions in a more uni
form and consistent manner. The constitutional rights of today's student
have been found to be equal to those of the private citizen.
It appears from the literature written today and from international
coverage by television, radio, and press services that lack of discipline
is not just an American problem. Other cultures are concerned about the
actions displayed in their youth activism in and out of school. The one
most common trait is that there is a continued quest for identifying and
applying positive procedures which enhance modes of acceptable behavior
patterns.

26
CHAPTER III. METHODS AND PROCEDURES
Description of the Instrument
Gallup (cited in 22) found that discipline opinions vary between
people possessing different characteristics. Therefore, the first sec
tion of the instrument provided a means of identifying certain demo
graphic characteristics. These included sex, race, age, religious affil
iation, educational level, region of the United States, attendance in
other public or private schools, and occupation of parents.
The basic survey instrument was designed to determine the percep
tions of samples of students in grades 10, 11, or 12, parents of students
in grades 10, 11, or 12, classroom teachers in each selected high school,
and administrators in each selected high school regarding discipline
in their schools. After a review of literature, a 44-item instrument
was developed to obtain perceptions of discipline situations in each re
spondent school.
Construction of the Instrument
The first portion of the survey instrument dealt with personal
characteristics of the respondents which are similar to the character
istics noted by Gallup (cited in 22). It was thought that these charac
teristics would be associated with certain differences in responses. Per
sonal characteristics included--sex, race, age, religious affiliation,
level of formal education, region of the United States, attendance in
private schools, and occupation of parents—were measured in the first

27
nine questions.
Items included in the second section of the survey instrument were
identified through a search of opinion polls and studies by Bleet (6),
Gallup (cited in 22), Hall (39), Hauger (42), Queer (67), and Schwartz
et al. (70). Questions were developed and selected to determine defi
nite opinions of the respondents to various perceptions of discipline
in the schools in which they taught, attended, or in which they had
children attending. Specific questions addressed the quality of educa
tion the respondent experienced and reactions to how that school experi
ence was perceived to be affected by student behavior, legal and social
influences, personnel characteristics, and suggested remedies. Those
items included were designed to determine the respondent's perceptions
of school discipline by various choice-type and ranking-type questions
reflecting discipline practices or concerns.
The resulting survey instrument was presented to selected Iowa
State University professors in an effort to increase validity of the
questionnaire.
Selection of the Sample
Gallup (cited in 22) polled approximately 1,500 adults, in the seven
polls on attitudes toward education, in every part of the country, which
were later reported by North, East, South, and West regions of the
United States and by national totals. To obtain a North, South, East,
and West regional and national response to the present study, it was
decided to personally contact a person in each specific region to secure

28
a participating high school district. The persons contacted in each
geographic region of the United States were known through professional
or educational association.
Telephone contact was made with educators in Minnesota, Connecti
cut, Mississippi, and California to determine their willingness to assist
in collection of data from a typical high school in their school dis
trict regarding discipline in the school. The purpose of the study was
discussed, and all district superintendents agreed to participate with
the stipulation that their specific school district would remain anony
mous in the treatment and reporting of the data. The "contact" also del
egated a field assistant to manage the details of the survey locally.
A copy of the survey instrument was then mailed to the "contact"
to determine whether any specific item for response would be offensive
or cause local public relations problems. After each local review of
the survey instrument, telephone communications were again made to estab
lish a calendar and procedure to follow in securing the responses.
The school district participating in the North region prepared and
sent address labels for the selected sample in their district. The sur
vey was then direct-mailed to the sample with a postage-paid return
mailer. The South region school district received all of the survey in
struments individually packaged, affixed their address labels at their
office of research, and mailed the survey instrument to the sample.
The East district received the survey instrument, selected the
sample, distributed the instrument through the principal's office, and
returned the completed instruments in bulk. The West respondent district
29
received the survey instruments in bulk and distributed them to the sample
by personal delivery by four university education graduate students.
These completed instruments were also returned in bulk.
A number of students in grades 10, 11, and 12 at each selected high
school (not to exceed the number of students on the student council and
representing each grade level) were invited to respond to the survey in
strument. The specific student sample was selected by the field assis
tant using a "skip interval" of 15.
A maximum of 48 parents of students, 16 from each grade level, 10,
11, and 12, were selected by the field assistant using a "skip interval"
of 16, beginning with the third name on the alphabetized student class
list and rotating through the list until 16 parents had been selected.
No discrimination was made for instances where a student and parent both
were invited to respond to the survey instrument.
From an alphabetical master list of teachers in each selected high
school, every fourth teacher was selected until twenty-five percent was
reached, beginning with the fourth name on the list.
All principals, assistant principals, and counselors or deans at
each selected high school were invited to respond to the survey instru
ment .
All school board members were originally included to respond; how
ever, two of the four field assistants found strong reluctance of board
members to participate. With this problem, it was decided to remove
this segment from the study.

30
Collection of the Data
Each participating school designated a field assistant who was sup
plied information and directions for the collection of the data. The
field assistant managed the distribution, collection, follow-up, and
answered local questions about the purpose of the study and assurances
of controlled use of the collected data.
The response from students, parents, teachers, and administrators
was direct-mailed by prepaid mailers or returned to the high school ad
ministrative office. Follow-up after two weeks was handled by general
school announcements and specific notice to the selected parents through
their student child.
Data from the sample of students, parents, teachers, and administra
tors were collected from the four participating high schools during a
three-month period from mid-October, 1975, to mid-January, 1976.
Number of Respondents
North South East West Totals
Administrators 3 2 1 9 15
Teachers 13 9 10 6 38
Parents 9 4 5 6 24
Students 20 15 17 12 64
141

31
Treatment of the Data
The data obtained from the survey instrument were analyzed to deter
mine statistical significance through the services of the Iowa State
University Computation Center, The basic statistical program used for
this purpose was the Statistical Package for the Social Sciences (SPSS).
The Chi square statistical test was applied to determine if there
were significant differences in perceptions of parents, students, teach
ers, and administrators toward various school situations and to determine
whether their age, sex, or level of education provided further insight
into their perceptions and responses. Statistical significance was set
at .05.
Insofar as possible, analyses of raw data were undertaken and the
results shown in table form. In several instances, one or more cells of
a Chi square table contained five or less responses. Where this was the
case, recognizing the limitation of no more than twenty percent of the
cells having an expected frequency smaller than 5.0, and no cells with
an expected frequency smaller than 1.0, the cells were collapsed and
categories combined or eliminated in a logical manner. This does not
mean that the observed or actual frequencies should not be small, only
the expected frequencies are so constrained (66, p. 288).
32
CHAPTER IV. FINDINGS
Introduction
Data were gathered to determine how school administrators, teachers,
students, and parents of students perceived school discipline in four
geographical regions of the Iftiited States. Specifically, by selected
demographic data, the data were used to identify a common understanding
of school discipline to assist school decision-makers in interpreting,
developing, and communicating practices and programs essential to optimum
student learning environments.
Insofar as possible, analyses of the raw data were completed, and
the results are displayed in table form. Cells of any Chi square table
which contained five or less observed responses were collapsed and com
bined in a logical fashion. It should be noted that nearly 290 separate
Chi square analyses were computed; only 49 yielded statistically signif
icant results. Only these significant results were tabled; however,
consensus was examined in order to answer the fundamental question of
the investigation.
Demographically, the 141 respondents included 74 males and 67 fe
males, of which 109 indicated their race to be white, 19 nonwhite, and
13 did not report their race.
The respondents are further identified by the categories indicated
in the following open-faced tables. In several categories, respondents
were prohibited from answering certain requests for demographic identifi
cation because of local policies or regulations.

33
Demographic Identity and Number of Respondents
Race
f
Region of United States
f
Classification
f
White 109 East 34 School administrator 15
Nonwhite 19 North 46 Teacher 38
Not reported 13 South 29 Student 64
West 32 Parent of student 24
Sex Educational Level Age by years Religion
f f f f
Male 74 Graduate degree 42 Over 50 12 Protestant 63
Female 67 Bachelor degree 19 40 - 49 27 Catholic 31
Less than bachelor 79 30 - 39 27 Jewish 6
Not reported 1 20 - 29 11 Other 26
Under 20 64 Not reported 15
Perceptions of Pressing Problems in the School
When asked to check what were the five biggest problems with which
public schools in this community must deal, the responses differed sig
nificantly when categorized by type of respondent and by age brackets.
Selection of classification of administrator, student, teacher, or parent
resulted in a Chi square value of 15.06 and, by age, a Chi square value
of 5.29, and are shown in Tables 1 and 2.
Sixty-five percent of the students and sixty percent of the school
administrators did not select discipline as a problem in their school.

34
However, sixty-seven percent of the teachers in the same schools and
seventy percent of parents with children in the same schools selected
discipline as one of the five biggest problems in their school.
Table 1. Choice of discipline as a pressing problem by classification of respondent®
Classification
Administrator Teacher Student Parent Total
Checked 6 25 22 17 70
Not checked 9 12 41 7 69
= 15.06 (p < .01) .
Next, the selection of discipline as a problem was examined by age
categories. The results indicate sixty-three percent of respondents
under the age of thirty rejected discipline as a problem, while sixty-
one percent of the over age thirty respondents selected discipline as
one of the five biggest problems in the schools with which they were
associated. Older respondents saw discipline as more of a problem.
Table 2. Choice of discipline as a pressing problem by age of re
spondent
Age Over 30 Under 30 Total
Checked 40 30 70
Not checked 25 44 69
= 5.29 (p < .05).

35
Drugs, facilities, and students' lack of interest were preferred
choices when the sample respondees identified the five biggest problems
with which local public schools must deal. The identification of drugs
as a problem was distinct when analyzed by the classification of the
respondent, educational level of the respondent, and by region of the
United States; whereas facilities were significant when analyzed by
classification and region. Classification, age, and educational level
of the respondents selecting students' lack of interest produced sig
nificant differences.
Looking specifically at drugs as a problem in their schools, thirty-
five percent of all respondents identified this as one of their five big
gest. When responses are analyzed by classification, that is adminis
trator, teacher, student, and parent of student, more than one-half
(fifty-three percent) of those identifying drugs as a problem were stu
dents compared to only two percent of the school administrators, twenty-
four percent of the teachers, and twenty-four percent of parents of stu
dents. It must also be noted that, even with fifty-three percent of
those identifying drugs as a problem in their school, they only repre
sent eighteen percent of all respondents. Equally puzzling is the fact
that, although administrators comprise ten percent of all respondents,
over ninety-three percent of them did not identify drugs as one of the
five biggest problems in their school. Of the teacher respondents,
nearly three-fourths (seventy-three percent) did not identify drugs as
a problem while the parents of students were evenly split 50-50.

36
Table 3. Choice of drugs as a pressing problem by classification of respondent
Classification
Administrator Teacher Student Parent Total
Checked 1 10 26 12 49
Not checked 14 27 37 12 90
V3 = 9.75 (p < .05).
An analysis of responses by educational level shows that seventy-
two percent of those choosing drugs as one of the five biggest problems
in their school had less than a bachelor's degree. Examination of
Table 4 indicates that more than half of the sample (fifty-six percent)
possessed less than a bachelor's degree; less than half (forty-five per
cent) made this choice.
Table 4. Choice of drugs as a pressing problem by educational level of
respondent*
Educational level
At least a bachelor's degree
Less than a
bachelor's degree Total
Checked 13 35 48
Not checked 47 43 90
= 7.06 (p< .01).

37
Drugs appeared to be more of a concern in the "North" school. About
half (forty-nine percent) of all respondents indicating drugs as one of
the five biggest problems were from the North region of the United States.
Of the fifty-one percent checking drugs as a problem, twelve percent were
from the West, eighteen percent from the East, and twenty percent from
the South region of the United States.
It is important to note that, of all respondents from the North
sample, fifty-three percent did check drugs as a problem, compared to
the next highest response group, being the South with thirty-four per
cent.
Table 5. Choice of drugs as a pressing problem by region of respondent's residence
Region
East North South West Total
Checked 9 24 10 6 49
Not checked 24 21 19 26 90
= 11.19 (p < .05).
Significant differences of responses to facility identification by
classification and region are displayed in Tables 6 and 7, respectively.
Seventy-three percent of all respondents did not identify facilities as
a problem. Approximately one-third of the teachers (thirty-five percent)
and students (thirty-three percent) did identify facilities as one of
their five biggest problems. Thirteen percent of all the administrators

38
and only four percent of parents of students identified facilities as
a big problem.
Table 6. Choice of facilities as a pressing problem by classification of respondent
Classification
Administrator Teacher Student Parent Total
Checked 2 13 21 1 37
Not checked 13 24 42 23 102
V3 = 10.38 (p < .05).
When data were analyzed by region of the United States, it became
evident that seventy-five percent of the respondents identifying facili
ties as a problem are from the East (thirty-two percent) and North (forty-
three percent) regions of the United States. Only six percent of all
respondents identifying facilities as a problem were from the West (two
percent) or South (four percent) regions.
Table 7. Choice of facilities as a pressing problem by geographical region of respondent's residence^
Region
East North South West Total
Checked 12 16 6 3 37
Not checked 21 29 23 29 102
= 8.84 (p < .05).

39
Analyzing the same question (selecting the five biggest problems)
by region--North, South, East, or West, of the United States—highly
significant differences were evident for "finances" and "parents lack
of interest."
The difference in selection of finances was significant with a Chi
square value of 12.16 when analyzed by region of the United States.
Forty-one to forty-six percent of the respondents from the North, South,
and West regions of the United States selected finances as one of the
five biggest problems in their schools. However, seventy-eight percent
of the respondents from the East region selected finance as one of the
five biggest problems in their school. Fifty-two percent of all respond
ents indicated finance as one of their five biggest problems, while over
one-third (thirty-five percent) of those making this selection were from
the Eastern region.
Table 8. Choice of finances as a pressing problem by geographical region of respondent's residence
Region
East North South West Total
Checked 26 20 12 15 73
Not checked 7 25 17 17 66
V3 = 12.16 (PC .01).
Differences in responses by region of the United States resulted in
a highly significant Chi square value as "parents' lack of interest" was
statistically examined. Lack of interest on the part of parents was

40
identified as a problem in the schools by about one-third (thirty-six
percent) of the respondents. Interestingly, of the respondents iden
tifying this as a problem, more than three times as many were West re
spondents as were East respondents (thirty-seven percent to eleven per
cent). Three times in ten the respondents from the North region checked
"parents' lack of interest" as one of the five most pressing problems
in their schools. In the South, four and one-half times in ten the re
spondents made the same observation and is displayed in Table 9.
Table 9. Choice of parents' lack of interest as a pressing problem by geographical region of respondent's residence
Region
East North South West Total
Checked 6 13 13 19 51
Not checked 27 32 16 13 88
= 13.97 (p< .01).
Addressing "pupils' lack of interest," significant differences are
evident in the respondent categories of classification, age, and educa
tional level. Analyzing Table 10 data by classification, fifty-six per
cent of all respondents identified "pupils' lack of interest" as a prob
lem in their schools. Of those so identifying this problem, it is inter
esting to note that over fifty-three percent were students, or nearly
two-thirds (sixty-six percent) of all students responding. Only twenty-
six percent of all administrators identified lack of student interest

41
Table 10. Choice of students' lack of interest as a pressing problem by classification of respondent
Classification
Administrator Teacher Student Parent Total
Checked 4 21 42 12 79
Not checked 11 15 21 12 60
V3 = 8.50 (p < .05).
as one of the five biggest problems in their school, while about half
of the teachers (fifty-six percent) and parents of students (fifty per
cent) identified it as one of the biggest problems.
Similarly, in Table 11, when respondents are classified by age, the
under 30 category has over one-half (sixty-two percent) of the respond
ents selecting "students' lack of interest" as a problem. Chances were
twenty percent greater for a respondent under 30 years of age to iden
tify students' lack of interest as a pressing problem than for a respond
ent older than 30 years to make the same observation. The Chi square
value of 4.89 indicates statistical significance for this choice dif
ference.
Table 11. Choice of students' lack of interest as a pressing problem by age of respondent
Age Over 30 Under 30 Total
Checked 30 49 79 Not checked 35 25 60
^ ̂ = 4.89 ( p < .05).
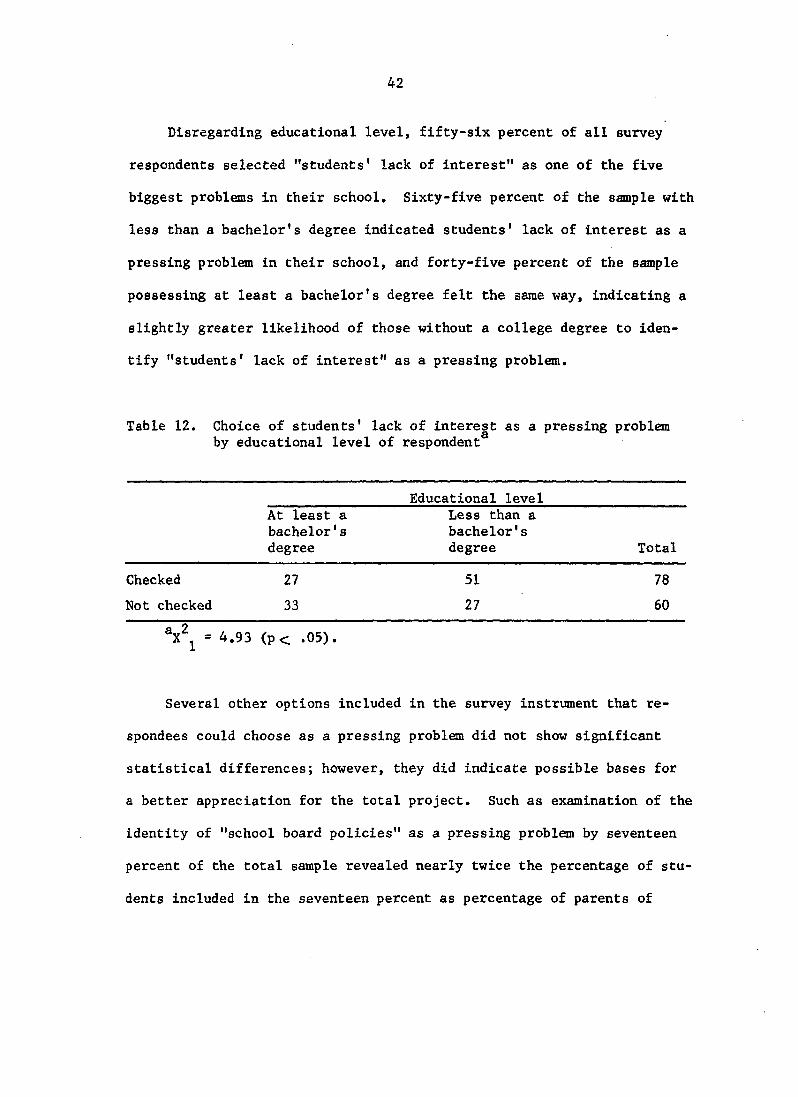
42
Disregarding educational level, fifty-six percent of all survey
respondents selected "students' lack of interest" as one of the five
biggest problems in their school. Sixty-five percent of the sample with
less than a bachelor's degree indicated students' lack of interest as a
pressing problem in their school, and forty-five percent of the sample
possessing at least a bachelor's degree felt the same way, indicating a
slightly greater likelihood of those without a college degree to iden
tify "students* lack of interest" as a pressing problem.
Table 12. Choice of students' lack of interest as a pressing problem by educational level of respondent
Educational level
At least a
bachelor's
degree
Less than a bachelor's degree Total
Checked 27 51 78
Not checked 33 27 60
= 4.93 (PC .05).
Several other options included in the survey instrument that re-
spondees could choose as a pressing problem did not show significant
statistical differences; however, they did indicate possible bases for
a better appreciation for the total project. Such as examination of the
identity of "school board policies" as a pressing problem by seventeen
percent of the total sample revealed nearly twice the percentage of stu
dents included in the seventeen percent as percentage of parents of

43
students, teachers, or administrators. And nine percent of the East
region respondents checking this as a problem, compared to twelve per
cent of the West region respondents, seventeen percent of the South re
gion respondents, and twenty-six percent of the North region respond
ents.
Interestingly, with thirty percent of the sample identifying
"teachers' lack of interest" as one of the most pressing problems, less
than one-half the percent of teachers as the parents of students, stu
dents, and school administrators chose this as a pressing problem.
Unexpectedly, no administrators identified vandalism as a pressing
problem, while thirteen percent of the teachers, twenty percent of the
parents of students, and twenty-five percent of the student samples did
identify vandalism as a pressing problem in their local schools. One-
half the percentage of respondents from the regions. North, South, and
West, identified vandalism as a pressing problem as did the East region
sample respondents.
Perceptions of Discipline as a Behavior Problem
No other question in the survey produced the variation in re
sponse than did whether the respondents felt discipline in the local
schools was "not strict enough" or "just about right," Tables 13,
14, 16, and 17 reveal highly significant Chi square values when the
question was analyzed by the classification of the respondees, by their
age, by their educational level, and by the geographical region of their
residence. Responses by male and female did not produce a statistically

44
slgnlflcaat Chi square value; however, that table appears in the Appen
dix with the other statistically nonsignificant tables.
When the sample was asked whether they felt discipline was "not
strict enough" or "just about right," two-thirds of those responding felt
discipline in the local schools was not strict enough. The highly signif
icant Chi square value of 34.54, Table 13, also Indicates that nine of
ten parents and teachers responding agreed that discipline was "not
strict enough," Four of ten administrators and six of ten students
responding to the same question believed discipline was "just about
right."
Table 13. Feelings about discipline in the local school by classifica-cation of the respondent*
Classification
Administrator Teacher Student Parent Total
Checked 8 32 23 20 83
Not checked 5 3 36 2 46
= 34.54 (p < .01).
When the same question was analyzed by age of the respondents, the
choices were highly significant, with a Chi square value of 22.58,
which is shown in Table 14. Eighty-seven percent of the respondents
over the age of thirty felt discipline in the local school was "not
strict enough," while only thirty-nine percent of the under age thirty
respondents agreed.

45
Table 14, Feelings about discipline in the local school by age of the respondent
Age Over 30 Under 30 Total
Checked 52 31 83
Not checked 8 38 46
V, = 22.58 (p < .01).
Table 15 displays responses to the same question by smaller age-
range categories than the "under 30" and "over 30" categories shown in
the previous table. Examination of the table shows over three-fourths
of the respondents feeling discipline in the local school was "just about
right" were under the age of 20 years.
Table 15. Feelings about discipline in the local school by age of
the respondent
Age
Over 50 40-49 30-39 20-29 Under 20 Total
Not strict enough 7 22 23 8 23 83
Just about right 2 4 2 2 36 46
A Chi square value of 11.89 resulted when the question was analyzed
by the educational level of the respondents and is shown in Table 16.
Those respondents possessing less than a bachelor's degree were nearly
evenly split in their feelings as to whether discipline in their local
schools was "not strict enough" and "just about right." For the

46
respondents possessing more than a bachelor's degree, the selection was
more than four to one that discipline in their schools was thought to be
"not strict enough."
Table 16. Feelings about discipline in the local school by educational level of the respondent^
Educational level More than a Less than a bachelor's bachelor's degree degree Total
Not strict enough 45 37 82
Just about right 10 36 46
= 11.89 (p < .01).
When the survey respondents were identified by the geographical
region in which they resided and asked how they felt about discipline in
the local schools, sixty-four percent said discipline was "not strict
enough." Of that percentage, more than three-fourths of the respondents
residing in the South (78.6 percent) and West (85.7 percent) geographi
cal regions were in that choice cell, and approximately one-fourth less
made the same choice in the North (53.7 percent) and East (46.9 percent)
regions and are shown in Table 17.
In the East and North regions, the percent of choices between "not
strict enough" and "just about right" almost reverse themselves. Only
fourteen pe rcent of the West respondents and twenty-one percent of the
South respondents believed discipline in their local schools was "just
about right."

47
Table 17. Feelings about discipline in the local schools being "not strict enough" or "just about right" by geographical region
of the respondent's residence
Region East North South West Total
Not strict enough 15 22 22 24 83
Just about right 17 19 6 4 46
*x2 = 14.34 (p< .01).
In a further analysis of the question, the percentage of total •
respondents feeling that discipline in the local schools was "too strict"
or "don't know" was very small (7.2 percent).
Table 18. Feelings about discipline in the local schools being "too strict" or "don't know" by geographical region of the respondent 's residence
Region
East North South West Total
Too strict 1 1 0 3 5
Don't know 1 2 1 1 5
Raw data disclosed that nearly one-fourth of all respondents be
lieved discipline was not strict enough because teachers lacked authority
to keep order, students have too much freedom, or that rules were not
enforced. Within the sample, unusual choices were made by these groups,
though they did not show a significant Chi square value. Sixty percent
of the administrators believed that discipline was either "O.K." or that

48
It was not strict enough because rules were not enforced and, strikingly,
no parent indicated that they thought discipline was "O.K." Sixty per
cent of the parents of students split their choice between teachers
lacking authority and lack of student respect for teachers as answers to
the same question. Curiously, no school administrators identified the
"no respect" choice as a reason for discipline not being strict enough.
The teachers' top two choices were too much student freedom and rules
not being enforced. Students split In their top two choices between
rules not being enforced and teachers' lack of authority.
No category of responses to the identification of who should assume
more responsibility in correcting the lack of discipline achieved statis
tical significance; however, there was unanimous agreement that, of the
five groups given as choices, students were the last group expected to
assume more responsibility. Over forty percent said the responsibility
belonged to the administrators; twenty percent each for teachers and par
ents, ten percent for the school board. Interestingly, fifty percent of
the teachers pointed the finger at administrators, and fifty percent of
the administrators pointed to the teachers to assume the responsibility
of improving discipline.
The East region sample opted most often for the teachers to assume
more responsibility, and in the other three region samples the adminis
trator was cited most often.
When the sample was given choices of time and/or place of the most
undesirable student behavior, significant reponse differences are evident
by classification and age of the respondents and are shown in Tables 19

49
and 20. Over one-half of the respondents reported that the formal set
ting of "in class," "study hall," and "homeroom" were the scene of most
undesirable behavior. About one-third thought the informal setting of
"lunch" and "assembly" gatherings were the time of most undesirable be
havior, while one-eighth of the respondents indicated that "passing" to
and from class and before and after class was the time for students to
behave most undesirably.
When analyzing the responses to this question by classification of
the sample, over sixty percent of the educators believed the most unde
sirable student behavior took place in a formal setting, while nearly
ninety percent of the students were near an even split between the "in
formal" and "formal" settings. Parents were nearly evenly split between
all three choices, as shown in Table 19. It is interesting to notice
that, while nearly thirty percent of the parents indicated the "hallway"
was an area for undesirable student behavior, only a bit more than ten
percent of the educators and students made a similar observation.
Table 19. Identification of the place of most undesirable student be
havior by classification of the respondent
Classification
Educator Student Parent Total
Hallway 6 7 5 18
Informal setting 12 28 6 46
Formal setting 29 26 6 64
= 10.06 (p c .05).

50
By age analysis, as shown in Table 20, those respondents over the
age of thirty chose, by two to one, the "formal setting" as the place
of most undesirable student behavior, while one-fourth chose the "infor
mal setting" and one-eighth the "hallways." In the under thirty years
of age cells, about ten percent of the respondents thought the hallway
was the place of the students' most undesirable behavior and the remain
ing ninety percent splitting between the "formal" and "informal" settings.
Table 20. Identification of the place of most undesirable student behavior by age of the respondent
Age
Over 30 Under 30 Total
Hallway 7 8 15
Informal setting 13 33 46
Formal setting 33 31 64
V2 = 6.08 (p < .05).
Examining the responses relating to statements associated with dis
cipline, no significant differences were statistically evidenced; how
ever, the sample most often associated respect for authority and beha
vior patterns of students with discipline in their school. Teachers,
students, and parents of students most often chose respect for authority,
and school administrators most often identified behavior patterns of stu
dents. Each of the categories chose the opposite statement most often
as their second choice.

51
Considering the time or place of the most undesirable student be
havior, eight of ten administrators thought the study hall, classrooms,
and home room were the settings which ranked highest. Teachers, stu
dents, and parents of students most often made the same choice, but re
ported there were discipline problems in the hallways, whereas not a
single administrator made this same observation. The second situation
of undesirable behavior was the informal setting, such as lunchrooms
and assembly areas.
In another question, the sample members were asked to identify,
from four categories, the disciplinary problem which appeared to be most
serious at the senior high school. One-third of the sample felt truancy
and tardiness was the most serious problem. The remaining two-thirds of
the respondents were nearly evenly split in choosing between the other
three choices. There were no significant differences in the responses
to the question when analyzed by sex and age; however, educational level
evidenced important differences, and the classification and region cate
gories had highly significant Chi square values.
Table 21 shows that no school administrators perceived smoking, al
cohol, and drugs as a serious disciplinary problem, while forty-three
percent of the parents did perceive these as a serious problem. One-
fourth of the students and one-tenth of the teachers reported smoking,
alcohol, and drugs as a serious problem.
Truancy and tardiness was perceived by sixty-five percent of the
administrators as a serious problem, but only five percent of the parents
recognized the same problem. About one-third of the teachers and

52
Table 21. Perception of serious disciplinary problems by classification of the respondent
Classification
Educator Student Parent Total
Smoking, alcohol, drugs 4 15 9 28
Truancy, tardiness 21 23 1 45
Cheating, fighting, damaging property 9 15 5 29
Other 15 9 6 30
Vg = 23.79 (p < .01).
students thought of the two as a serious disciplinary problem. This
problem ranked as the most often chosen problem of students.
It is interesting to notice that nearly one-third of the teachers
and parents acknowledged "other" unidentified areas as serious problems.
The same question is shown in Table 22, by geographical regions of
the United States. Nearly one-half of the respondents in the South
sample reported "other" unidentified areas as their most serious problem,
and one-fourth of them thought truancy and tardiness to be the most
serious disciplinary problem.
Four of ten in the East sample perceived cheating, fighting, and
damage to school property as their most serious disciplinary problem.

53
Table 22. Perception of serious disciplinary problems by geographical region of the respondent's residence
Region
East North South West Total
Smoking, alcohol, drugs 8 14 3 3 28
Truancy, tardiness 6 17 8 14 45
Cheating, fighting, damaging property 13 6 4 6 29
Other 6 5 13 6 30
Vg = 26.94 (p < .01).
A significant Chi square value of 10.43 is disclosed in Table 23
for perception of serious discipline problems as detected by the educa
tional level of the sample. It is noteworthy that eight of ten of the
sample perceiving smoking, alcohol, and drugs as the most serious dis
ciplinary problem possessed less than a bachelor's degree. The posses
sion of a bachelor's degree did not associate with differences in the
perception of truancy and tardiness since about one-half of the sample
selecting these items as a problem came from each educational level cate
gory.
However, six of ten respondents of the sample concluding that cheat
ing, fighting, and damaging school property is a serious disciplinary
problem possessed less than a bachelor's degree. The same ratio of the
sample noting "other" unidentified areas as serious disciplinary problems
possessed at least a bachelor's degree.

54
Table 23. Perceptions of serious disciplinary problems by educational level of the respondent
Educational level
At least a Less than a bachelor's bachelor's degree degree Total
Smoking, alcohol, drugs 5 22 27
Truancy, tardiness 21 24 45
Cheating, fighting, damaging property 12 17 . 29
Other 18 12 30
V3 = 10.43 (p < .05).
It is interesting to take cognizance of the significant 4,45 Chi
square value in Table 24, resulting from differences in perceptions of
vandalism as a sign that discipline is not strict enough. It was the
only choice of seven, which showed significant differences in the re
sponses to the question. Although less than twenty percent of the sample
made this observation, nearly eight of ten perceiving vandalism as a
sign of not strict enough discipline possessed less than a bachelor's
degree.
Table 24. Vandalism perceived as poor discipline by educational level of the respondent
Educational level At least a Less than a bachelor's bachelor's degree degree Total
Checked 6 20 26 Not checked 54 58 112
= 4.45 (p < .05).

55
Teachers and Discipline
The next eight tables display various characteristics, images, and
feelings about teachers and discipline in the local schools represented
by the sample. When the sample was classified by type and responses to
the question of whether they agree or disagree that stricter teachers
have fewer student discipline problems, seventy-one percent of the sample
agreed. More than sixty percent of the administrators (61.5 percent)
and students (64.5 percent) agreed, but even greater percentages of
teachers (73 percent) and parents (95.2 percent) agreed that the stricter
teacher has fewer student discipline problems. Table 25 shows a sig
nificant 7.95 Chi square value for the differences in perception of
strictness and fewer discipline problems by the classification of the
responding sample.
Table 25. Stricter teachers and fewer discipline problems by classification of the respondent
Classification
Administrator Teacher Student Parent Total
Agree 8 27 40 20 95
Disagree 5 10 22 1 38
= 7.95 (P < .05).
In Tables 26 and 27, the results of statistical analysis by the
categories of classification and age of the sample are shown for the
question of whether the sample agreed or disagreed that teachers under

56
the age of 30 were more liberal than older teachers. Seventy-nine per
cent of the responding sample agreed that teachers under the age of 30
were more liberal than older teachers. More than one-half (54.1 per
cent) of the sample "agreeing" were students, and only six percent were
school administrators.
Six of ten teachers, nine of ten students, and nine of ten parents
of students reported the younger teacher as more liberal. School ad
ministrators were equally split between agreeing and disagreeing on the
topic of whether age and being liberal were associated.
Table 26, Perceptions of teachers younger than thirty as more liberal than teachers older than thirty by classification of the respondent
Classification Administrator Teacher Student Parent Total
Agree 6 20 53 19 98
Disagree 6 12 5 3 26
V3 = 17.43 (p < .01).
Similar results were observed by age of the responding sample and
are shown in Table 27, where nine of ten respondents under thirty years
of age believe teachers younger than thirty years old are more liberal
than older teachers. It is interesting that the respondents over the
age of thirty perceived the younger teacher as more liberal two of three
times.

57
Table 27. Perception of teachers younger than thirty as more liberal than teachers older than thirty by age of the respondent
Age
Over 30 Under 30 Total
Agree 38 60 98
Disagree 18 8 26
= 6.52 (p < .05).
Type of respondent (administrator. teacher, student. or the parent
of a student) made a highly significant difference in how the sample
perceived teacher miltancy and student discipline, as observed by the
18.45 Chi square value in Table 28.
Forty-two percent of the sample "agree" that teacher militancy in
creases student discipline problems, and thirty-one percent of the sample
indicated they didn't know the relationship. However, it must be noted
that sixty percent of the school administrators sampled and fifty-four
percent of the parents of students "agree" that teacher militancy in
creases student discipline problems.
Only thirty-three percent of the teachers and thirty-eight percent
of the students "agreed" that teacher militancy and student discipline
problems were related. Forty-four percent of the teachers disagreed
with the premise; however, the student sample disagreed less (15.9 per
cent), and it should be noted that forty-six percent said they "didn't
know" whether teacher militancy and student discipline were related.
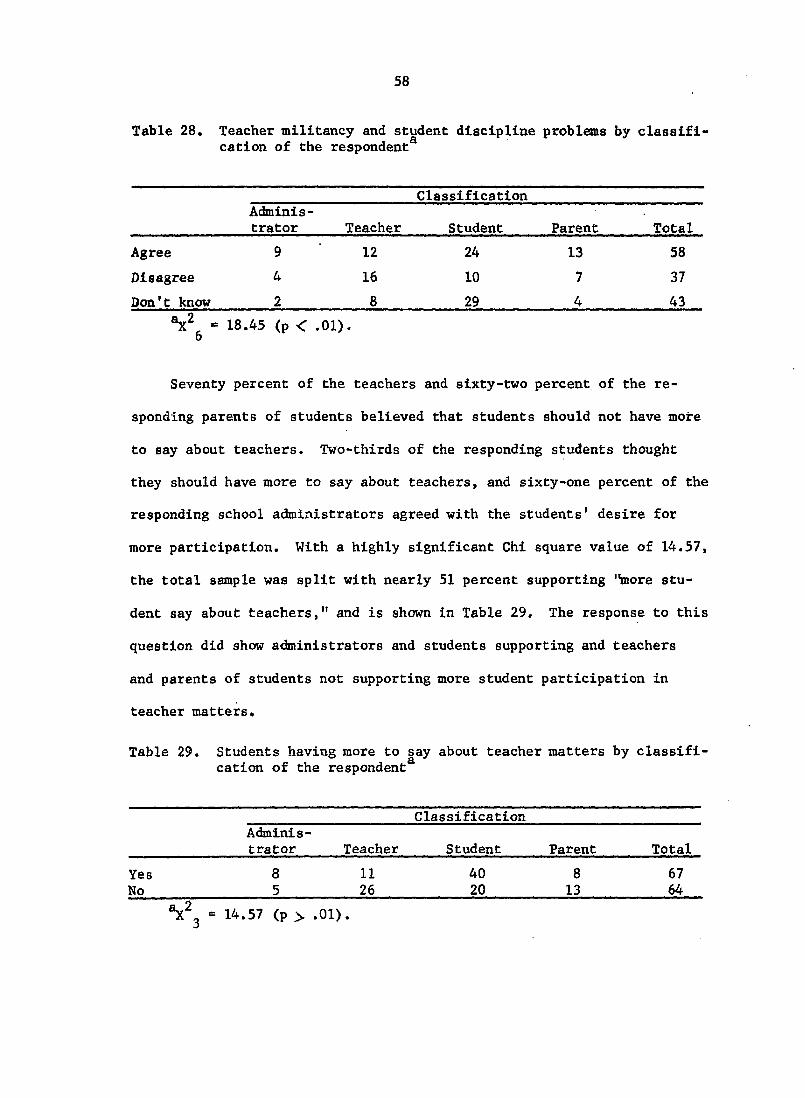
58
Table 28. Teacher militancy and student discipline problems by classification of the respondent
Classification Administrator Teacher Student Parent Total
Agree 9 12 24 13 58
Disagree 4 16 10 7 37
Don't know 2 8 29 4 43
= 18.45 (p < .01). 6
Seventy percent of the teachers and sixty-two percent of the re
sponding parents of students believed that students should not have more
to say about teachers. Two-thirds of the responding students thought
they should have more to say about teachers, and sixty-one percent of the
responding school administrators agreed with the students* desire for
more participation. With a highly significant Chi square value of 14.57,
the total sample was split with nearly 51 percent supporting "more stu
dent say about teachers," and is shown In Table 29, The response to this
question did show administrators and students supporting and teachers
and parents of students not supporting more student participation in
teacher matters.
Table 29. Students having more to say about teacher matters by classification of the respondent
Classification Administrator Teacher Student Parent Total
Yes 8 11 40 8 67
No 5 26 20 13 64
V3 = 14.57 (p > .01).

59
When the responses to the same question were examined by educational
level, respondents with less than a bachelor's degree wanted more partici
pation and are shown with a highly significant Chi square value of 9.86
in Table 30. This response would be expected since sixty-four of the
possible seventy-eight "yes" responses in the "less than a bachelor's
degree" category were high school students. Only thirty-five percent of
the respondents possessing at least a bachelor's degree supported more
student involvement in teacher matters.
Table 30. Students having more sag about teacher matters by educational level of the respondent
Educational level At least a bachelor's degree
Less than a bachelor's degree Total
Yes 20 47 67
No 37 26 63
= 9.86 (p > .01).
A third analysis of the same question indicated sixty-five percent
of the females were in favor of more student say about teacher matters.
The highly significant Chi square value of 8.39 in Table 31 also shows
that only thirty-eight percent of the males felt the same as the females.
Six of ten respondents under the age of thirty support more stu
dent involvement of students in teacher matters, and the same ratio of
respondents over the age of thirty do not support more student involve
ment. Table 32 reveals a highly significant Chi square value of 7.28

60
Table 31. Students h|ving more say about teacher matters by sex of the respondent
Sex
Male Female Total
Yes 26 41 67
No 42 22 64
= 8.39 (p < .01).
for the relationship of age to more student involvement in teacher
matters.
Raw data collected to determine whether more guidance counselors in
the high school would reduce student discipline problems indicated that
one-half of the sample did not believe counselors would make a differ
ence, and forty percent thought more counselors would improve the situa
tion. It was noteworthy that forty-one to fifty-three percent of the
responding school administrators, students, and parents of students
agreed that more counselors would reduce discipline problems, yet less
than twenty percent of the teachers agreed.
Table 32. Students having more to say about teacher matters by age of the respondent
Age
Over 30 Under 30 Total
Yes 23 44 67
No 38 26 64
= 7.28 (p < .01).

61
Curriculum and Discipline
Tables 33, 34, 35, 36, 37, and 38 are all related to some aspect
of discipline and curriculum in the school. When respondents were asked
whether a change in the school curriculum would improve student behavior,
sixty-one percent of the responding sample replied that such a change
would improve student behavior. However, it is noted in the results
tabulated and shown in Table 33 that more than one-half of the respond
ents in each region (excepting the North) stated that a change in their
school's curriculum would improve student behavior. Seventy-nine per
cent of the West sample supported the premise, while sixty-eight percent
of the South and fifty-three percent of the East made the same observa
tion, In the North sample, about one-third (thirty-two percent) sup
ported the premise. In appraising the total response, less than one-
fourth (seventeen percent) of the total sample had no opinion on the
matter.
Table 33. Will changing the school curriculum improve student behavior by geographical region of the respondent's residence^
Region
East North South West Total
Yes 16 12 13 22 63
No 14 25 6 6 51
= 15.33 (p < .01).

62
As revealed in Table 34, eighty-six percent of the administrators
and ninety percent of the students thought that high school students
should have more to say about the curriculum in the school. The parents
(fifty-six percent) and teachers (sixty-five percent) were less favor
able about student involvement in this matter. Totally, more than three-
fourths of the sample were in favor of high school students having more
to say about curriculum.
Table 34. High school student involvement in curriculum by classification of the respondent
Classification
Administrator Teacher Student Parent Total
Yes 12 24 55 13 104
No 2 13 6 10 31
V3 = 15.11 (p < .01).
Age category differences and student involvement in curriculum
matters, shown in Table 35, reveal a highly significant Chi square value
of 16.14. The younger the respondents, the more apt they were to sup
port student involvement in curriculum as evidenced by nine of ten under
the age of thirty respondents agreeing.
Although there were no statistically significant Chi square values
for reactions to student involvement in school rules, it was evident
that more than seven of ten sample respondents believed students should
have more say about school rules. Raw data for this suirvey question is

63
Table 35. High school student involvement in curriculum matters by age
of the respondent
Age
Over 30 Under 30 Total
Yes 39 65 104
No 25 6 31
= 16.14 (p < .01).
included in the Appendix of this study.
When the sample was specifically asked whether poor reading achieve
ment by students increased student discipline problems, seventy-nine
percent of the sample believed there was a relationship, and is reported
in Tables 36, 37, and 38. Two-thirds of the total sample agreed with
the relationship, resulting in the highly significant Chi square values
of the three tables.
By classification of the responding sample, ninety-seven percent of
the educators and eighty-five percent of parents of students perceive
poor reading achievement and discipline problems as associated. Addi
tionally as revealed in Table 36, less than sixty percent of the stu
dents recognized the same relationship.
Table 36. Classification of respondents and relationship of poor
reading achievement and increased discipline problems
Classification
Educator Student Parent Total
Yes 45 29 18 92
No 1 21 3 25
= 23.40 (p < .01).

64
In Table 37, ninety-eight percent of the respondents possessing
at least a bachelor's degree defend the relationship of reading achieve
ment and discipline. Ninety-three percent of the responding sample
over the age of thirty discerned the same relationship and is exhibited
in Table 38.
Table 37. Relationship of poor reading achievement and increased discipline problems by educational level of the respondent
Educational level At least a bachelor's degree
Less than a bachelor's degree Total
Yes 52 40 92
No 1 23 24
= 18.97 (p< .01).
Table 38. Relationship of poor reading achievement and increased dis
cipline problems by age of the respondent
Age
Over 30 Under 30 Total
Yes 55 37 92
No 4 21 25
13.37 (p < .01).

65
Punishment and Discipline
Two questions were asked about physical or corporal punishment, the
first related to the approval or disapproval of the use of physical
punishment for students who do not respond to other forms of punishment;
the second referred to corporal punishment as an effective disciplinary
tool.
A small percent (sixteen) of the sample selected corporal punish-
as an effective disciplinary tool; yet, forty-one percent approved of
physical punishment. In Table 41, no respondent from the East high
school district thought corporal punishment was effective, and thirty-
eight percent of the South district believed otherwise. In the North
and West regions, more than eighty percent of the respondents did not
support corporal punishment. As shown in Table 40, eighty-one percent
of the respondents in the South approved the use of physical punishment,
while seventeen percent approved its use in the East sample region.
Only three of ten in the West and four of ten in the North approved of
physical punishment. Tables 40 and 41 show that the responses to the
question of physical punishment differed significantly when analyzed by
the geographical regions selected in the study and when the choice was
based upon disapproval of physical punishment as a disciplinary tool.
A striking difference in responses is evident in Table 39, which
shows that more than one-half of the teachers and parents of students of
the sample approving of physical punishment for students who do not re
spond to other forms of discipline, while seventy-five percent of the stu
dents and eighty-six percent of the administrators disapproving the

66
the same practice.
Table 39. Approval or disapproval of physical punishment by classification of the respondent
Classification Adminis-
trator Teacher Student Parent Total
Approve 2 21 17 12 52
Disapprove 12 13 ^ 7 74
V3 = 17.63 (p < .01).
Table 40. Approval or disapproval of physical gimishment by geographical region of the respondent's residence
Region
East North South West Total
Approve 5 17 22 8 52
Disapprove 25 24 5 20 74
V3 = 27.37 (p < .01).
Table 41. Corporal punishment as an effective disciplinary tool by geographical region of the respondent's residence
Region
East North South West Total
Checked 0 7 11 4 22
Not checked 34 36 18 28 116
V3 = 17.20 (p < .01).

67
Integration and Discipline
When those surveyed were asked to indicate whether school integra
tion had increased discipline problems in the schools, thirty-nine per
cent believed integration had increased discipline problems. A highly
significant Chi square value of 25.13 is shown in Table 42, and it also
shows sixty-two percent of the North sample did not know whether integra
tion had any relationship to discipline problems. Forty-seven percent
of the East sample concluded that integration was not affecting student
discipline problems; however, one-third thought there were increased
discipline problems as a result of integration.
Table 42. Responses by geographical region to the relationship of integration and student discipline problems
Region
East North South West Total
Increased discipline
problems 11 11 16 15 53
Doesn't affect disci
pline problems 15 11 10 9 45
Don't know 6 23 1 7 37
= 25.13 (p < .01).
In the West, about one-half of the respondents reported discipline
problems had increased, and about fifty percent either observed that
integration did not affect student discipline or they did not know whether
there was any effect. Nearly sixty percent of the respondents from the

68
South sample thought that discipline problems had increased with integra
tion and yet thirty-seven percent reported that integration did not affect
discipline. In contrast to the other three regions, only four percent
of the South sample did not have a feeling about integration.
Disciplinary Tools
A question asked the respondents to identify, from among eleven
choices, those they believed to be effective disciplinary tools. The
next eight tables show significant relationships between the demographic
identification of region, classification, or age and the disciplinary
tools of expulsion, detention, parent conferences, corporal punishment,
stricter rules and regulations, and student-teacher conferences.
While only twenty percent of the sample checked "expulsion" as an
effective disciplinary tool. Table 43 shows a significant Chi square
value of 9.85. Significantly, thirty-eight percent of the South region
sample checked expulsion as an effective disciplinary tool. Only nine
percent of the East sample, fourteen percent of the North, and twenty-
five percent of the West had the same recognition.
Table 43. Responses by geographical region to expulsion as an effective
disciplinary tool
Region
East North South West Total
Checked 3 6 11 8 28
Not checked 31 37 18 24 110
V3 = 9.85 (p < .05).
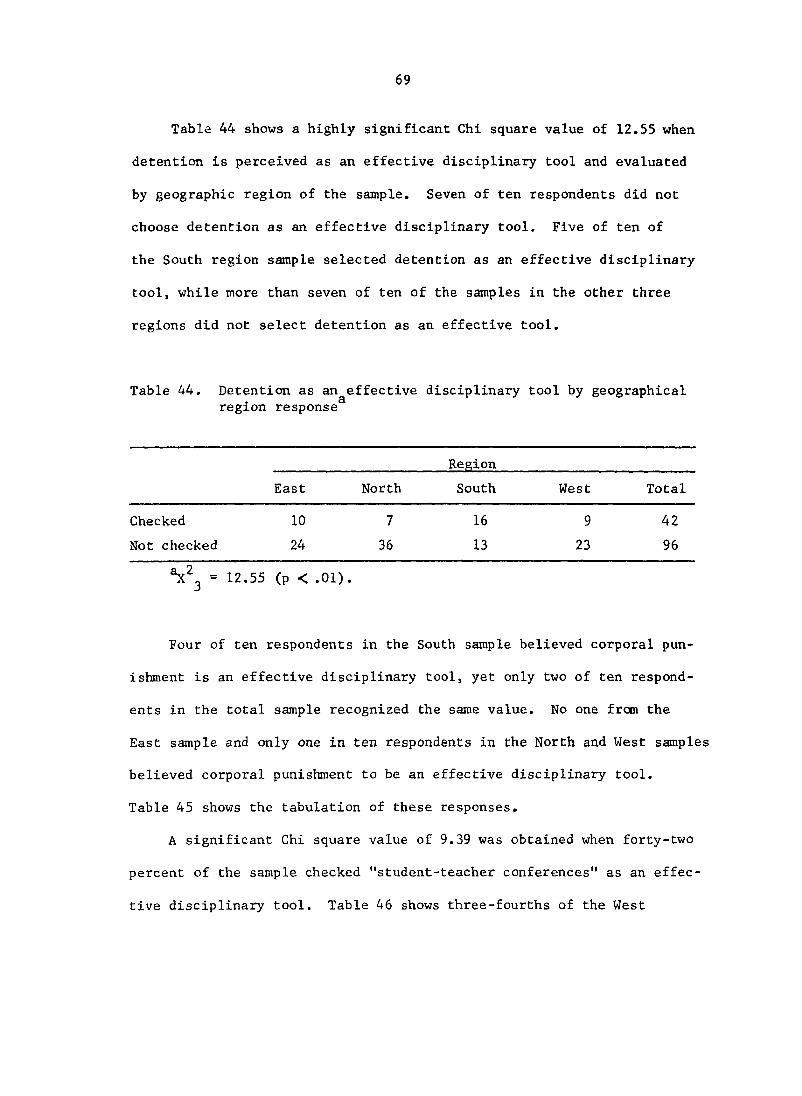
69
Table 44 shows a highly significant Chi square value of 12.55 when
detention is perceived as an effective disciplinary tool and evaluated
by geographic region of the sample. Seven of ten respondents did not
choose detention as an effective disciplinary tool. Five of ten of
the South region sample selected detention as an effective disciplinary
tool, while more than seven of ten of the samples in the other three
regions did not select detention as an effective tool.
Table 44. Detention as an effective disciplinary tool by geographical region response
Region
East North South West Total
Checked 10 7 16 9 42
Not checked 24 36 13 23 96
= 12.55 (p < .01).
Four of ten respondents in the South sample believed corporal pun
ishment is an effective disciplinary tool, yet only two of ten respond
ents in the total sample recognized the same value. No one from the
East sample and only one in ten respondents in the North and West samples
believed corporal punishment to be an effective disciplinary tool.
Table 45 shows the tabulation of these responses.
A significant Chi square value of 9.39 was obtained when forty-two
percent of the sample checked "student-teacher conferences" as an effec
tive disciplinary tool. Table 46 shows three-fourths of the West

70
Table 45. Perception of corporal punishment as an effective disciplinary tool by geographical region response
Region
East North South West Total
Checked 0 7 11 4 22
Not checked 34 36 18 28 116
= 17.20 (p < .01).
Table 46. Perception of student-teacher conference as an effective
disciplinary tool by geographical region response
Region
East North South West Total
Checked 20 15 14 8 57
Not checked 14 28 14 24 80
= 9.39 (p < .05).
geographical sample and two-thirds of the North sample did not check
this choice as an effective disciplinary tool. Interestingly, the South
region sample split even on the choice, and nearly sixty percent of the
East sample felt student-teacher conferences were effective disciplinary
tools.
Table 47 shows a significant Chi square value of 11.33 for the
recognition of stricter rules and regulations as an effective discipli
nary tool and the relationship of that belief to the classification of
the respondents. Over seventy percent of all the respondents did not
feel stricter rules and regulations to be an effective disciplinary

71
Table 47. Perception of stricter rules and regulations as an ef
disciplinary tool by classification of the respondent
Classification Administrator Teacher Student Parent Total
Checked 2 12 13 13 40
Not checked 13 25 49 11 98
11.33 (p < .01).
tool. However, five of ten parents supported the use of stricter rules
and regulations. Only one of ten administrators, two of ten students,
and three of ten teachers thought stricter rules and regulations to be
an effective disciplinary tool.
Response presentations in Table 48 reveal that two-thirds of the
sample over the age of thirty believe that stricter rules and regulations
are effective disciplinary tools.
Table 48. Perception of stricter rules and regulations as an effective disciplinary tool by age of the respondent
Age
Over 30 Under 30 Total
Checked 25 15 40
Not checked 40 58 98
= 4.52 (p < .05).

72
More than one-half of the respondents thirty years old and older
reported parent conferences as effective disciplinary tools. The re
spondents who were thirty years of age and younger did not support parent
conferences as often. Table 49 shows an important relationship of age
to the use of parent conferences as an effective disciplinary tool.
Forty-two percent of the total sample indicated that parent conferences
were an effective disciplinary tool.
Table 49. Choice of parent conferences as an effective disciplinary tool by age of the respondent
Age Over 30 Under 30 Total
Checked 36 22 38
Not checked 29 51 80
= 7.99 (p < .01).
Distinctive differences may be observed in Table 50, where the same
question is examined and reported by classification of the sample. Espe
cially interesting is that thirty percent of the students reported
parent conferences as an effective disciplinary tool, while sixty percent
of the administrators believed parent conferences were effective. About
one-half of the teachers and parents of students thought parent confer
ences were an effective disciplinary tool.
A review of raw data collected regarding the eleven suggestions of
effective disciplinary tools confirmed that parent-student-teacher

73
Table 50. Perception of parent conferences as an effective disciplinary tool by classification of the respondent
Classification
Administrator Teacher Student Parent Total
Checked 9 18 18 13 58
Not checked 6 19 44 11 80
= 8.40 (p < .05).
conferences were selected almost twice as often as any other suggestion.
The second most often mentioned suggestions were the two other combina
tions of parent or student-teacher conferences. Similarly, four in ten
sample respondents also opted to exclude students from extracurricular
privileges as a means to improve student discipline problems. The least
often selected suggestions were corporal punishment and the lowering of
student marks.
Sources of Information about Discipline
No significant Chi square values were obtained in trying to estab
lish the best source of information about discipline in the local schools;
however, the raw data revealed in Appendix Table 78 that seventy-five
percent of the sample obtained their information about discipline in the
local school through personal verbal exchanges. Significant differences
were obtained by age and educational level of the sample for the best
source of information about school discipline in other parts of the
United States. In the age category under thirty, media was reported as

74
the best source by six of ten respondents and is displayed in Table 51.
Media, that is local newspapers, radio, and television, was chosen by
thirty-seven percent of the over thirty years category. Nearly one-half
of the total sample perceived the media as their best source of informa
tion about discipline in other parts of the United States.
Table 51. Perception of the best source of information about school discipline in other parts of the United States by age of the respondent
Age
Over 30 Under 30 Total
Media 24 45 69 Verbal contact 11 10 21 School publications 19 9 28 Don't know 11 11 22
= 9.34 (p < .05).
With a large number of high school students included in the under
thirty category and also possessing less than a bachelor's degree,
Table 52 shows that over two-thirds of the total sample fit that cate
gory and selected media as their best source. School publications and
sources other than media and verbal contact were acknowledged as a best
source by nearly one-third of the sample possessing at least a bachelor's
degree.

75
Table 52. Perception of the best source of information about school discipline in other parts of the United States by the educational level of the respondent
Educational level
At least a Less than a bachelor's bachelor's degree degree Total
Media 16 52 68
Verbal contact 12 9 21
School publications 19 9 28
Don't know 13 9 22
= 21.59 (p < .01).
Summary Tables of Significant Chi Square Values
Table 53 presents a summarized list of the significant Chi square
values by topic of the question included in the survey instrument and by
demographic categories of the responding sample. Further, Tables 54,
55, 56, 57, and 58 each report, by variable, the significant Chi square
statistical values represented in the summary, Table 53.

76
Table 53. Summarized list of the significant Chi square values by topic of the question included in the survey instrument and by demographic categories of the responding sample
Education Topic Class. Sex Age level Region
Discipline xx^ x^ Drugs X XX X Facilities x x Finances xx Parents' lack of interest xx Students' lack of interest x x x
Vandalism x Feel about discipline xx xx xx xx Student behavior undesirable x xx Discipline problems serious xx x xx Source discipline national x xx Younger liberal xx x Stricter teachers x Teacher militancy xx
Physical punishment xx xx Curriculum improve behavior xx Student input curriculum xx xx Student input teachers xx xx xx xx Reading achievement xx xx xx
Integration xx
Expulsion X Detention xx Parent conference x xx Corporal punishment xx Stricter rules x x Student-teacher conferences x
^xx = p < .01.
b X = p ^ .05.

77
Table 54. By classification, significant Chi square values
Variable Value
** Discipline 15.06* Drugs 9.75* Facilities 10.38* Students' lack of interest 8.50^^ Feel about discipline 34.54* Student behavior undesirable 10.07^^
Discipline problems serious 23.79^^ Student input curriculum 17.11^^ Student input teachers 14.57** Reading achievement 23.40* Parent conferences 8.40*
Stricter rules 11.33* Stricter teachers 7.95** Younger liberal 17.43^^ Teacher militancy 18.45^^
Physical punishment 17.63
Significant probability < .05.
Highly significant probability < ,01.
Table 55. By sex, significant Chi square value
Variable Value
** Student input teachers 10.18
** Highly significant probability < .01.

78
Table 56. By age, significant Chi square values
Variable Value
** Discipline 5.29^ Student lack of interest 4.89** Feel about discipline 22.58*
Student behavior undesirable 6.08* Source discipline national 9.34^^ Student input curriculum 16.14** Student input teachers 7.28** Reading achievement 13.37^^ Parent conferences 7.99* Stricter rules 4.53* Younger liberal 6.52
* Significant probability •< .05.
irk Highly significant probability < .01.
Table 57. By educational level, significant Chi square values
Variable Value
_ -Drugs 7.06* Students' lack of interest 4.93* Vandalism 4.45^^ Feel about discipline 11.89* Discipline problems serious 10.43^^ Source discipline national 21.59**
Student input teachers 9.86** Reading achievement 18.97
Significant probability <.05.
Highly significant probability < .01.
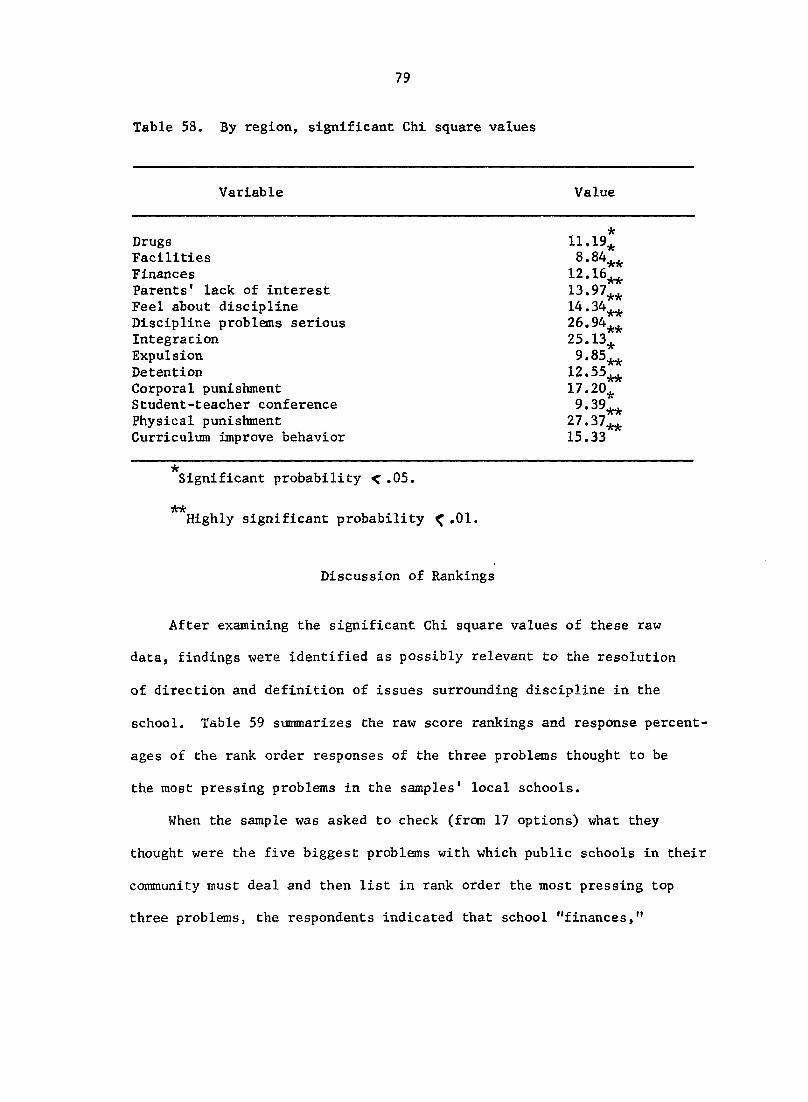
79
Table 58. By region, significant Chi square values
Variable Value
Drugs Facilities Finances Parents' lack of interest Feel about discipline Discipline problems serious Integration
Expulsion Detention Corporal punishment Student-teacher conference Physical punishment Curriculum improve behavior
* 11. 19* 8. 84**
12. 13. 97**
14. 34** 26. 94** 25. 13* 9. 85** 12. ** 17. 20* 9. 39** 27. 15. 33
* Significant probability <.05.
Highly significant probability ^ .01.
Discussion of Rankings
After examining the significant Chi square values of these raw
data, findings were identified as possibly relevant to the resolution
of direction and definition of issues surrounding discipline in the
school. Table 59 summarizes the raw score rankings and response percent
ages of the rank order responses of the three problems thought to be
the most pressing problems in the samples' local schools.
When the sample was asked to check (from 17 options) what they
thought were the five biggest problems with which public schools in their
community must deal and then list in rank order the most pressing top
three problems, the respondents indicated that school "finances,"

Table 59. Biggest problem for public schools^
Total Total resp.
Ranked Ranked Ranked raw without first % second % third % resp. rank %
Class size too large 12 8.5 7 5.0 13 9.2 32 48 34.5
Curriculum 9 6.4 13 9.2 8 5.7 30 55 39.9
Discipline 19 13.5 16 11.3 11 7.8 46 70 50.4
Drugs 8 5.7 9 6.4 9 6.4 26 49 35.3
Facilities 1 0.7 9 6.4 8 5.7 18 37 26.6
Finances 26 18.4 10 7.1 13 9.2 49 72 52.5
Integration/segregation 5 3.5 5 3.5 5 3.5 15 15 10.8
Parents' lack of interest 7 5.0 15 10.6 7 5.0 29 51 36.7
Pupils' lack of interest 19 13.5 15 10.6 22 15.6 46 79 56.8
School administration procedures 3 2.1 3 2.1 6 4.3 12 25 18.0
School board policies 1 0.7 5 3.5 3 2.1 9 24 17.3
Teachers in general 1 0.7 3 2.1 1 0.7 5 12 8.6
Teachers' lack of interest 8 5.7 7 5.0 6 4.3 21 42 30.2
Transportation 0 0.0 1 0.7 0 0.0 1 3 2.2
Vandalism 1 0.7 2 1.4 4 2.8 7 26 18.7
There are no problems 0 0.0 0 0.0 0 0.0 0 1 0.7
Don't know 0 0.0 0 0.0 1 0.7 1 2 1.4
Relative frequency - percent of 141 respondents selecting item.

81
"discipline," and "lack of pupil interest" were the three biggest prob
lems, Finances was chosen most often as the biggesc problem with eighteen
percent, discipline and pupils' lack of interest tied for second with
thirteen percent choosing it as the greatest problem. Discipline, which
has ranked as the greatest concern of the public in Gallup Polls for
six of the last seven years, ranked higher than the other two as a second
ranking but below both as a third choice ranking by percentage of all
respondents ranking of first, second, or third most pressing problem.
The selection of discipline as the greatest concern by eleven per
cent is not as high a percentage as had previously been indicated in
Gallup Poll results. In the six years that a lack of discipline was
chosen as the number one public concern, the percentage of people rating
discipline first has been as high as twenty-six percent and as low as
eighteen percent. The one year discipline did not rank as the greatest
public conem, it ranked third with fourteen percent choosing it as
their first concern (22, 26, 27, 28, 29, 30, 31, 32).
After analyzing the ranking of the three most pressing problems,
the total number of times each choice was checked provides a different
ranking by percentage of all respondents to the question of simply check
ing the five biggest problems without ranking first, second, or third.
As a percentage of all age responses without ranking, the same three
problems have the highest choice; however, they are rearranged with
pupils' lack of interest being selected by fifty-six percent. Finances
was selected by fifty-two percent of all respondents as one of the five
biggest problems in their school. And the third greatest number of

82
choices as a big problem was discipline with fifty percent.
The three, "pupils' lack of interest," "finances," and "discipline,"
most often mentioned in frequency tables as one of the five biggest
problems. These were over ten percentage points greater than the fourth
most often mentioned, "curriculum," which was the choice of thirty-nine
percent of all choices. Several others were chosen by at least one-
third of the sample, "parents' lack of interest" (thirty-seven percent),
"drugs" (thirty-five percent), and "class size too large" (thirty-five
percent).
From all responses, only three respondents, or two percent, thought
there were no problems or didn't know whether there were problems in
their public school.
It should be noted that, when the survey sample was asked to "rank
order choice of educational programs which are believed to help reduce
discipline problems," the respondents most often selected "teaching stu
dents how to solve problems and think for themselves" ar, their first
and second choice. Table 60 indicates the third most often selected
option as "teaching students how to get along with one another."
In terms of total number of times each option was ranked, "teaching
students to respect law and authority" received the second highest
(eighty-one) number of rankings, with option number two being first
and option four as third.

83
Table 60. Frequency of rank order choice of educational programs to
help reduce discipline problems
Ranked Ranked Ranked Total first second third ranked
responses
1. Teaching students to respect law and authority 38 14 29 81
2. Teaching students how to solve problems and think for themselves 53 46 18 117
3. Teaching students vocational skills 12 29 24 65
4. Teaching students how to get along with one another 23 26 36 75
5. Teaching students health and
physical education 3 3 3 9
6. Teaching students how to compete with others 3 10 11 24

84
CHAPTER V. SUMMARY AND CONCLUSIONS
This study was designed to ascertain the perceptions regarding
discipline held by school administrators, teachers, students, and parents
of students. Through the analysis of this data, school managers could
develop a greater awareness in recognizing and controlling factors which
contribute to better discipline in the school.
Statistically, the Chi technique was applied to the data generated
to determine differences in the sample perceptions of student discipline.
Chi square values which were significant or highly significant were
separated for specific display and discussion. Data yielding nonsignifi
cant values are depicted in tables in the Appendix.
The survey instrument included an open-ended section to provide
for unstructured responses. Although varied responses were obtained,
this section yielded nothing of particular significance and those re
sponses are included in the Appendix.
Limitations
The survey portion of this study was directed to administrators,
teachers, students, and parents of students in one high school in each
of four extreme geographical regions of the United States. This selec
tion was predicated on the assumption that the sample would be represen
tative of the various categories in that region and that regional vari
ables might intervene to alter perceptions of factors underlying discip
line problems within public school settings.

85
The sample size within the four high schools was limited because
of geographic contrasts and the necessity of depending on local contacts
to secure the sample and collect the data by a predetermined procedure.
Certainly the inclusion of additional high school districts in the
sample would have added weight to the statistical treatment and analysis,
and would have strengthened the potential of generalizing assumptions
based on the data. The use of respondents in only one high school in
each geographical region exposes conclusions generated from data anal
ysis to the risk that one building may not be representative of a school
district, let alone a state or geographic region.
The survey instrument could have been shortened and still generated
reliable measures of perceptions within the various categories. The
use of a long questionnaire was a limiting factor in that some of those
surveyed might have failed to return the survey since it took a sub
stantial amount of time to complete.
Because of the large number of students responding to the survey
in comparison to other classifications of respondents, the categories
of educational level and age were no doubt biased by the disproportionate
number of student respondents.
A further limitation may be the fact that data included in the
study provided no comparison of perception based on ethnic classifica
tion.

86
Discussion
Parents, students, teachers, and administrators were asked to iden
tify the five most crucial problems with which the public schools in
their community must deal. The data reveal the following:
1. The problems most often perceived were: (a) pupils' lack of
interest, (b) finances, (c) discipline, (d) curriculum, and
(e) parents' lack of interest. Of these five, only curriculum
did not produce a significant Chi square value between percep
tions of responding categories of the demographic variables.
2. The majority of the students perceived "pupils' lack of inter
est" as important; however, few administrators agreed. A sim
ilar relationship was revealed when the responses were strati
fied by respondents under 30 years of age and having less than
a bachelor degree.
3. Over three-fourths of the responding sample in the Eastern
school district believed "finances" was a major problem. Less
than one-half of the remaining sample concurred in this belief.
No other question generated the significant differences as did re
sponses as to whether discipline was "not strict enough" or "just about
right". Significant differences were observed when analysis was per
formed on data classified in the demographic categories of classifica
tion, age, educational level, and geographic location.
1. Seven of ten teachers and those respondents over the age of 30
identified discipline as a major problem.

87
2. Six of ten school administrators, students, and those respond
ents under the age of 30 did not perceive discipline as a
major problem.
3. Respondents from the South and West school districts agreed
with the teachers and parents, while respondents from the East
and North were more evenly divided,
4. Unanimity was not evident among respondents in selecting the
"formal" or "informal" setting as the area in which undesirable
behavior most often occurred. Educators most often selected
the "formal" setting, whereas students split between "formal"
and "infomal".
5. Over one-third of the sample identified truancy and tardiness
as serious discipline problems.
6. Parents and school administrators differed in perception of
serious discipline problems. While administrators identified
truancy and tardiness, parents considered smoking, drugs, and
alcohol as the most serious discipline problems.
Many of the findings in this study were consistent with what one
would intuitively expect. However, one major difference occurred in this
study when "pupils' lack of interest" was perceived as the most press
ing problem with which local schools must deal. None of the seven Gallup
polls (26, 27, 28, 29, 30, 31, 32) reviewed had this problem identified
in the top five pressing problems. Finances ranked second in this study
and also was one of the top five problems each year in the Gallup polls.
Discipline ranked as the most pressing problem in six out of the seven

88
Gallup polls and ranked third in this study. This might be a result of
the differences in the composition of the samples used.
Results of this study show that teaching students how to solve
problems and think for themselves would be their first choice of six sug
gested activities which would help reduce discipline problems. Former
U.S. Commissioner of Education, Terrell Bell (49), made a similar obser
vation. He observed that the home and school should teach values of
self-discipline and self-reliance. The perception of teaching problem-
solving and thinking for oneself, though not an intuitive expectation,
is nonetheless an interesting perception and one which the school deci
sion-maker should address as new programs develop.
The 1974 Gallup poll (31) reported that seven percent felt punitive
punishment with a paddle should be used on a recalcitrant student.
Gleet's (6) dissertation found that over one-half of the teachers, ad
ministrators, and ccsnmunity respondents agreed that corporal punishment
should be permitted, and similar percentages of the same response groups
felt their community would support corporal punishment. About one-
fifth of the students agreed that corporal punishment should be per
mitted. This study found that only sixteen percent of the sample felt
"corporal punishment" was an effective disciplinary tool, yet forty-one
percent approved of "physical punishment".
The National Commission on the Reform of Secondary Education (84)
observed that teachers have purposely used the cloak of professionalism
and the muscle of collective bargaining to evade their responsibilities
for school discipline. Perceptions cited in this study show that over

89
one-half of the parents and administrators included in the sample felt
that teacher militancy contributes to student discipline problems.
Conclusions
The purpose of this study was to obtain perceptions of student be
havior which were felt to be related to discipline in the public schools.
The awareness of certain perceptions, identified by various demographic
categories, was thought to improve the ability of the school manager or
decision-makers to develop programs which would improve student behavior
in the school. The findings of this study, within the parameters set
forth, seem to warrant the following major conclusions:
1. Teachers and parents of students tend to have similar percep
tions on issues related to student discipline, while school
principals, counselors, and students tend to agree on similar
student discipline issues.
2. The greatest source of discipline problems in the school is
perceived by parents as a category of smoking, alcohol and
drugs, and they show little concern for the category of tardi
ness and truancy. Administrators perceived these same cate
gories in a reverse order. Teachers and students perceived
tardiness and truancy as a greater problem than smoking, alco
hol and drugs.
3. A majority of parents of students favor stricter rules and regu
lations in the school their children attend. Administrators did
not concur. Students' perceptions tended toward the

90
administrators' observation, and teachers reinforced the par
ents' perceptions.
4. There appears, by geographical location, to be a dichotomy of
perceptions with the south school district tending to hold a
separate identity.
5. Desirable student discipline is the exercise of student behavior
which enhances the learning opportunities of students. Aberrant
behavior which diminishes the affectiveness of the learning
environment occurs in both the informal and formal school set
ting. Teachers, school administrators, students, and parents
of students perceive desirable discipline patterns as being
characterized by attitudes of respect and obedience toward be
havior standards legitimatized by community acceptance.
This evidence points to the need for educational decision-makers to
become more aware of the populations with which they deal since the fac
tors of local mores and demographic variables appear to affect the public
support of the school. Today's school administrator should develop
mechanics to stay cognizant of community attitudes and opinions on
school issues. Perhaps the best strategy is to develop mechanisms for
securing community input. The mechanisms might take the form of surveys,
forums, or advisory committees. Properly handled, these strategies
would assist in legitimizing the administrative goals and enable adminis
trators to gain or increase community participation, input, and support.
In the final analysis, perhaps the most important result of this
study is to emphasize the lack of unanimity in the perceptions of causal

91
factors of discipline problems. A generalization from the findings in
dicates that teachers and the parents of students tend to reinforce each
other's perceptions; and, conversely, principals and students held sim
ilar perceptions. This dichotomy substantiates a need for dialogue to
resolve divergent viewpoints. In addition, the need for hard data
rather than value judgments to document causes of discipline is sorely
needed before a unified attack can be mounted to reduce discipline
problems.
Recommendations for Future Study
The parameters of this study were limited by geographic constraints
and the size of the sample. In order to provide data of greater utility
to educational decision-makers, future studies should be structured to
strengthen the validity of generalizations by increasing the sample
size. The following paragraphs present strategies for the inclusion of
additional variables and data analysis.
1. Ethnic perceptions of discipline
A future study should compare perceptions between ethnic cate
gories within the same district. Do blacks, whites, Spanish-
surnamed, and the like, differ substantially in their percep
tion of factors related to discipline? Do ethnic groups differ
in opinions of the kinds of strategies needed to improve disci
pline?
2. Teacher militancy and student discipline
The trend nationwide is toward increasing unionization of

92
teachers. With this trend comes extensive media coverage of
teacher-board disputes, frequent teacher work actions and,
less frequently, strikes. The numbers and types of discipline
concerns in school districts with unionized teachers should be
compared to nonunionized districts. This may substantiate or
refute the perceptions that teacher militancy contributes to
discipline problems.
3. Discipline problems in rural and urban settings
An investigation of the perception of discipline problems in
an "inner city" school district and those same perceptions in
a rural and suburban school district might reveal important
differences regarding the necessity of approaching resolution
of problems with drastically different methodology. Broadly
effective programs (i.e., statewide) to address discipline prob
lems cannot be designed until all causative factors are isolated
and considered.
4. Correlation of perceptions with support data
In some instances, the opinion of a respondent regarding fac
tors contributing to discipline problems may be based on a value
judgment or inconclusive evidence. It is important that re
search be conducted to determine if an association exists be
tween perceptions of contributing factors to discipline problems
and the number of suspensions and expulsions actually attribu
table to a perceived factor.

93
5. Integration as related to discipline problems
Additional research to determine the relationships, if any,
between the degree of integration and frequency of discipline
cases might enable school districts to formulate better and
more efficient approaches to human relations programs to counter
act disruptive factors.
Recommendations for Current Practice
The pervasive effects of undesirable behavior produces negative out
comes in student achievement. In order to mount a productive counter
attack, educators must design strategy to impact discipline problems.
Several promising policies which could be implemented by educators to
alter undesirable behavior in a positive manner, thus relieving public
concern, are listed below.
1. Establish a student assistance center where students with dis
cipline problems may be referred, rather than suspending or ex
pelling from school. The intent would be to offer intensive
counseling to assist in developing positive attitudes toward
self and others and to produce values clarification and coun
seling links with the home.
2. Establish an advisory committee of students to provide input to
the administrative process; identifying present and potential
areas of student discipline problems.
3. Establish a teacher/counselor program to contact the parents
of students; providing parents with information which will

94
enable them to provide positive reinforcement for accepted
behavior.
Provide inservice training for teachers which will aid teacher-
centered techniques to enable the establishment of a positive
classroom environment.
Establish immediate procedures to formally analyze the feel
ings of teachers, parents, and students toward discipline
problems and processes employed in alleviating discipline
problems.
Examine present procedures for identifying and coping with
student discipline problems. The intent being to implement
fair and constant rules, regulations, and penalties.

95
BIBLIOGRAPHY
1. Ackerly, Robert L. The reasonable exercise of authority. Washington, D,C.: National Association of Secondary School Principals,
1969. ERIC ED 040 490.
2. Albert, John A. Procedural due process in secondary schools. Marquestte Law Review 54 (Summer, 1971): 358-69.
3. Anderson, Lester W., and Van Dyke, Lauren A. School administration. Boston: Houghton Mifflin Company, 1972.
4. Anonymous. Students look at discipline. North Carolina Education 4 (February, 1974): 20-23.
5. Barratt, Ernest S. Impulse control and anxiety related to school adjustment and academic achievement among high school males. Final
report. Office of Education Project S-484. Galveston, Texas:
Medical Branch, Texas University. ERIC ED 056 354.
6. Bleet, Thomas L. The development and construction of a model discipline code for use in secondary schools. Unpublished Ed.D. dissertation, Wayne State University, 1973.
7. Bryan, Roy C. High school students view classroom control. Clearing House 42 (February, 1968): 345-349.
8. Betts vs. Dallas Independent School District, 306 F. Supp. 488,
1969.
9. Chamberlin, Leslie J. Discipline and individual differences. School and Community 14 (September, 1967): 17-18.
10. Chamberlin, Leslie J., and Carnot, Joseph B., ed. Improving school
discipline, Springfield, Illinois; Charles C. Thomas, 1974.
11. Clarizio, Harvey F. Toward positive classroom discipline. New
York: John Wiley and Sons, Inc., 1971.
12. Coleman, James S. Adolescents and the schools. New York: Basic Books, Inc., 1965.
13. Cooper, John. Discipline and learning: An inquiry into student-
teacher relationships. Washington, D.C.: NEA, 1975.
14. Cusick, Philip A. Inside high school; The students' world. New York; Holt, Rinehart and Winston, Inc., 1973.
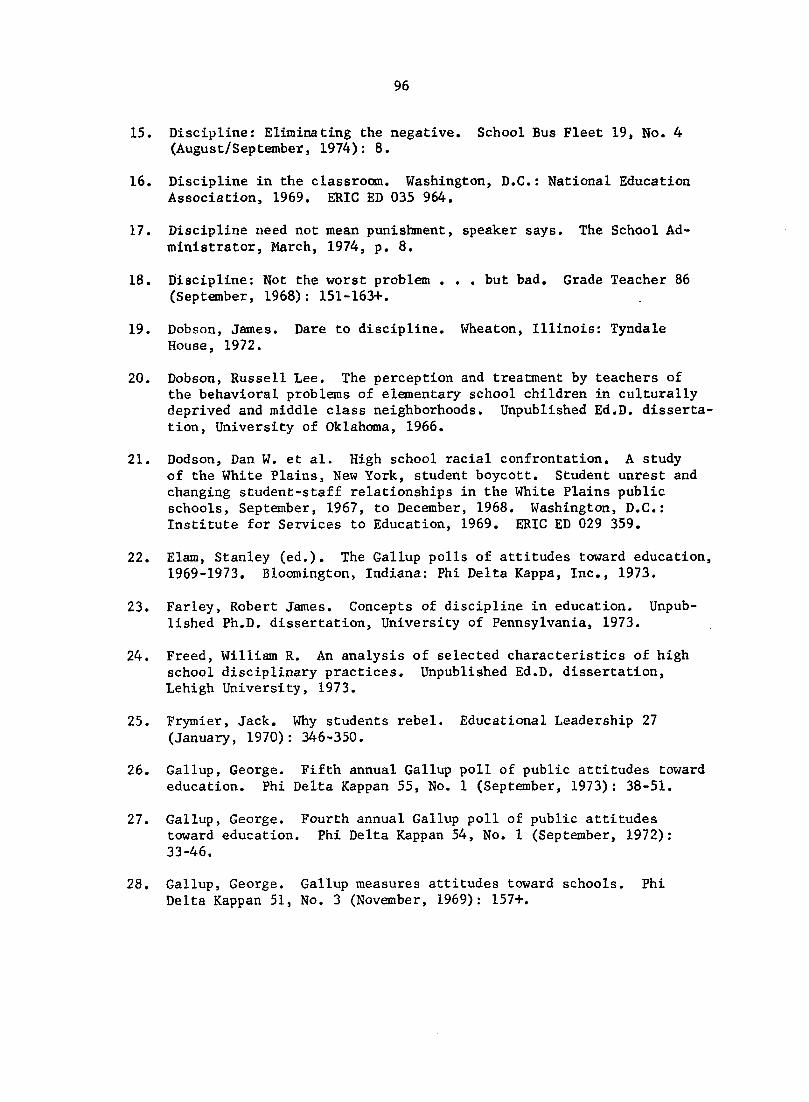
96
15. Discipline: Eliminating the negative. School Bus Fleet 19, No. 4 (August/SeptemberJ 1974): 8.
16. Discipline in the classroom. Washington, D.C.: National Education Association, 1969. ERIC ED 035 964.
17. Discipline need not mean punishment, speaker says. The School Ad
ministrator, March, 1974, p. 8.
18. Discipline: Not the worst problem . . . but bad. Grade Teacher 86 (September, 1968): 151-163+.
19. Dobson, James. Dare to discipline. Wheaton, Illinois: Tyndale
House, 1972.
20. Dobson, Russell Lee. The perception and treatment by teachers of the behavioral problems of elementary school children in culturally deprived and middle class neighborhoods. Unpublished Ed.D. disserta
tion, University of Oklahoma, 1966.
21. Dodson, Dan W. et al. High school racial confrontation. A study
of the White Plains, New York, student boycott. Student unrest and changing student-staff relationships in the White Plains public schools, September, 1967, to December, 1968. Washington, D.C.: Institute for Services to Education, 1969. ERIC ED 029 359.
22. Elam, Stanley (ed.). The Gallup polls of attitudes toward education,
1969-1973. Bloomington, Indiana: Phi Delta Kappa, Inc., 1973.
23. Farley, Robert James. Concepts of discipline in education. Unpub
lished Ph.D. dissertation. University of Pennsylvania, 1973.
24. Freed, William R. An analysis of selected characteristics of high school disciplinary practices. Unpublished Ed.D. dissertation, Lehigh University, 1973.
25. Frymier, Jack. Why students rebel. Educational Leadership 27
(January, 1970): 346-350.
26. Gallup, George. Fifth annual Gallup poll of public attitudes toward
education. Phi Delta Kappan 55, No. 1 (September, 1973): 38-51.
27. Gallup, George. Fourth annual Gallup poll of public attitudes
toward education. Phi Delta Kappan 54, No. 1 (September, 1972):
33-46.
28. Gallup, George. Gallup measures attitudes toward schools. Phi Delta Kappan 51, No. 3 (November, 1969): 157+.

97
29 . Gallup, George. Second annual survey of the public's attitude
toward the public schools. Phi Delta Kappan 52, No. 2 (October,
1970): 99-112.
30. Gallup, George. Seventh annual survey of public attitudes toward
education, 1975. Phi Delta Kappan 57, No. 4 (December, 1975):
227-241.
31. Gallup, George. Sixth annual Gallup poll of public attitudes
toward education. Phi Delta Kappan 56, No. 1 (September, 1974):
20-33.
32. Gallup, George. The third annual survey of the public's attitudes
toward the public schools, 1971. Phi Delta Kappan 53, No. 1 (Septem
ber, 1971): 33-48.
33. Classer, William. Reality therapy: A new approach to psychiatry. New York: Harper and Row Publishers, 1975.
34. Classer, William. Schools without failure. New York: Harper and
Row Publishers, 1969.
35. Gnagey, William J. The psychology of discipline in the classroom. London: Macmillan Company, 1968.
36. Goldstein, William. Discipline: For someone else's kid? The Clear
ing House 47 (April, 1973): 455-458.
37. Hagebak, Robert. Disciplinary practices in Dallas contrasted with school systems with rules against violence against children. A paper presented at the Annual Convention of the American Psycholog
ical Association, September 8, 1972. ERIC ED 072 870.
38. Hall, R. Vance, and Harris, Jasper W. An academic incentive program for high school youth from a poverty area. Kansas City, Missouri: Juniper Garden Children's Project, 1973. ERIC ED 078 579.
39. Hall, Robert Todd. An analysis of teachers' opinions concerning
discipline in four junior high schools of Jacksonville, Florida. Unpublished Master's thesis, Atlanta University, 1969.
40. Hanson, J. Merrell. Discipline: A whole new bag. Education Digest
39, No. 9 (May, 1974): 29-32.
41. Harms, Herman Edward. The concept of in loco parentis in higher
education. Gainesville, Florida: Florida Institute of Higher Edu
cation, June, 1970. ERIC ED 042 421.

98
42. Hauger, Bruce Edwin. Arena of conflict; A study of perceptions regarding student discipline policies. Unpublished Ed.D. dissertation, University of Southern California, 1973.
43. Helsel, A. Ray, and Willower, Donald J. Toward definition and measurement of pupil control behavior. Paper presented at the annual meeting of the American Educational Research Association, New
Orleans, Louisiana, 1973. ERIC ED 074 073.
44. House, James, and Miller, William. Responding to student unrest: A guide for administrators and teachers. Oregon ASCD Bulletin 27, No. 315, 1973. ERIC ED 071 186.
45. Howard, Eugene R., and Jenkins, John M. Improving discipline in the secondary school. A catalogue of alternatives to repression. Denver, Colorado: CFK Limited, 1970. ERIC ED 087 090.
46. Howarth, Roy. On the decline of in loco parentis. Phi Delta
Kappan 53, No. 10 (June, 1972): 626-628.
47. Hoyle, John R., and Wiley, Eldon L. What are the people telling us? Phi Delta Kappan 53, No. 1 (September, 1971): 49-50,
48. Hylland, Dave. Description and summary of first year exemplary program: Occupational development: A vocational program for the potential dropout. Sioux Falls, South Dakota: Sioux Fall Independent School District No. 1, 1971. ERIC ED 056 146.
49. Is school busing at a dead end? Interview with Terrel H. Bell, Commissioner of Education. U.S. News and World Report 77, No. 12
(September 16, 1974): 41-44.
50. Jenison, Lynn Milon. A study of student and faculty opinions regarding selected Iowa State University discipline situations. Unpublished Master's thesis, Iowa State University, 1971.
51. Johnson, Donald V. Student disciplinary codes—what makes them tick. Paper presented at National Association of Secondary School
Principals Annual Conference, Dallas, Texas, February, 1973.
52. Jones, Galion M. A study of teacher-pupil agreement toward corrective action or punishment imposed for pupil misconduct and selected teacher characteristics. Unpublished Ed.D. dissertation,
Northwestern University, 1964.
53. Jones, J. William. Discipline crisis in schools: The problem,
causes and search for solutions. Education U.S.A. Special Report. Arlington, Virginia: National School Public Relations Association,
1973.

99
54. Kohl, Herbert R. The open classroom: A practical guide to a new way of teaching. New York: Random House, Inc., 1969.
55. Kozol, Jonathan. Death at an early age. Boston: Houghton Mifflin Company, 1967.
56. Langenbach, Michael, and Letchworth, George A. Disciplinary techniques: Repertoires and relationships. Paper presented at Annual
Meeting, AERA, New York, 1971. ERIC ED 049 178.
57. Larson, Knute, and Karpas, Melvin R. Effective secondary school discipline. Englewood Cliffs, New Jersey: Prentice-Hall, Inc., 1967.
58. Maready, William F. The courts as educational policy makers.
Speech presented at National School Boards Association Annual Con
vention, April 3-6, 1971.
59. Marple, Marie Elizabeth. Effective and ineffective procedures used in elementary pupil discipline. Unpublished Ed.D. dissertation. University of Southern California, 1968.
60. Mazzacane, Betty Crippen. Parental attitudes toward discipline
and their relationship to the development of social attitudes in children. Unpublished Master's thesis. Southern Connecticut State
College, 1971.
61. Opinion poll: Corporal punishment OK if used sparingly. Nation's
Schools 87 (May, 1971) : 39.
62. Passow, A. Harry. Reactions to Silberman's crisis in the classroom. Worthington, Ohio: Charles A. Jones, 1971.
63. Phay, Robert E. Suspension and expulsion of public school students. Topeka, Kansas: National Organization on Legal Problems of Educa
tion, 1971.
64. Phay, Robert E., and Cummings, Jasper L., Jr. Student suspensions and expulsions. Proposed school board codes prohibiting serious student misconduct and establishing procedures for dealing with alleged violations. Chapel Hill, North Carolina: North Carolina
University, 1970. ERIC ED 047 399.
65. Policies that clarify student rights and responsibilities. School board policy development kit. Waterford, Connecticut: National School Boards Association, October, 1970. ERIC ED 047 362.
66. Popham, W. James, and Sirotnik, Kenneth A. Educational statistics: Use and interpretation. Second Edition. New York: Harper and Row
Publishers, Inc., 1973.

100
67. Queer, Glenn E. Discipline study. Pittsburgh, Pennsylvania; Pittsburgh Public Schools Office of Research, July, 1971. ERIC ED 063 660.
68. Report of the task force on corporal punishment. Washington, D.C.: National Education Association, 1972. ERIC ED 070 173.
69. Robinson, Donald W. Police in the schools. Phi Delta Kappan 48
(February, 1967): 278-80.
70. Schwartz, Jack et al. Overbrook cluster parent survey, Philadelphia, Pennsylvania: Philadelphia School District Office of Research
and Evaluation, 1969. ERIC ED 031 817.
71. Sheviakov, George V., and Redl, Fritz. Let's look at discipline.
Discipline for today's children and youth. Washington; Association for Supervisors and Curriculum Development, 1956.
72. Silberman, Charles E. Crisis in the classroom. New York; Random House, 1970.
73. Silberman, Charles E., ed. The open classroom reader. New York;
Random House, 1973.
74. Smith, David H. Disruptive students. Albany: New York State Education Department, Bureau of School Social Services, 1973. ERIC ED
084 632.
75. Spock, Benjamin. Baby and child care--revised. New York; Simon
and Schuster, 1974.
76. Spock, Benjamin. Raising children in a difficult time. New York:
W. W. Norton and Co., 1974.
77. Stamper, I. Corporal punishment: Teacher opinion. NEA Research
Bulletin 46 (May, 1970): 48-49.
78. Starkey, John D. et al. Discipline; Are older teachers more liberal
than younger ones? DeKalb, Illinois, 1972. ERIC ED 074 053.
79. Stenhouse, Lawrence, ed. Discipline in schools; A symposium.
Oxford; Pergamon Press, 1967.
80. Stiavelli, Richard E., and Sykes, Dudley E. The guidance clinic; An alternative to suspension. NASSP Bulletin 56 (April, 1972);
64-72.
81. Summary of the assessments of the district's integration of programs,
1964-1971. Sacramento, California: Sacramento City Unified School
District, 1971. ERIC ED 056 139.

101
82. Sunshine, Phyllis M. Approaches to school discipline. Selected review of the literature No. 2. Reviews of research. Baltimore, Maryland; Maryland State Department of Education, Division of Research, Evaluation and Information Systems, October, 1973. ERIC
ED 087 084.
83. The problem of discipline/control and security in our schools. Position paper No. 1. New York: National Urban League, May 20,
1971. SRIC ED 069 827.
84. The reform of secondary education. New York: McGraw-Hill Book
Company, 1973,
85. Tinker vs. Des Moines Independent Community School District No. 21, 393 U.S. 503, 89 S Ct. 733, 1969.
86. Vernon, Walter M. Behavior modification in the classroom. New York: Holt, Rinehart and Winston, Inc., 1972.
87. Visor, Arthur. Classroom discipline. School and Community 59 (April, 1973): 22,
88. Vredevoe, Lawrence E. The effort to desegregate and its effects upon school discipline and attitudes. Journal of Secondary Edu
cation 42 (February, 1967): 51-58.
89. What most of the hollering is about. American School Board Journal 157 (October, 1969): 23.
90. Wildman, Louis. Disciplinary problems in urban ghetto schools.
Seattle, Washington; School Information and Research Service,
June 18, 1971. ERIC ED 055 142.
91. Willower, Donald J. et al. Custodialism and the secondary school.
High School Journal 52 (January, 1969): 182-191.
92. Wright, E. et al. Survey of parents of secondary school students perceptions of school and education. Willowdale, Ontario: North
York Board of Education, 1972, ERIC ED 084 291.

102
APPENDIX A. SURVEY INSTRUMENT

103
Enclosed please find a questionnaire relating to "discipline" in
schools. I am requesting your participation by taking a few minutes
to respond to the questions, then return the completed document in
the postage-paid return envelope. This survey will serve as part of
my doctoral study at Iowa State University, Educational Administration
Section, Ames, Iowa. It is hoped that the results obtained will
enable us to better understand "school discipline" as defined by sev
eral groups of people.
You were selected to respond and will represent one of the following
groups: high school administrators, counselors, teachers, students, and parents from four geographical regions of the United States. All
responses will be treated as confidential. Results will be reported
in total, and no attempt will be made to identify the responses of any
individual. The number on the return envelope will be used only for
the follow-up of non-responders to this survey questionnaire.
Thank you for taking time to assist me with this survey.
Sincerely,
Robert C. Rice
Superintendent

104
RESPONDENT CHARACTERISTICS
I ari associated with a school in the following capacity (check one):
School Board Member Classroom Teacher
______ Principal ______ Student Council Member
Assistant Principal Parent of Senior High School
Guidance Counselor Student
Race:
White
Non-white
îfy sex is:
Male
Female
"8= Religion:
Over 60 years Protestant
50-59 years Catholic
40-49 years Jewish
30-39 years Other
20-29 years
Under 20 years
level (check the highest
Doctorate Degree Bachelor's Degree
Master s Degree Associated Arts Degree
One or more years of trade, business or technical school
Grade 12 Grade 11 Grade 10
9 Grade 8 Grade 7
Grade 6 Grade 5 _ Grade 4
Grade 3 Grade 2 Grade 1
No formal education

105
Region of United States where I live is (check o)ie) :
East
North
South
West
Ify elementary education was (check one):
ac a public school
at a private school
tfy secondary education (high school) was (check one):
at a public school
at a private school
For School Board Members and Parents
Occupation (check one):
Business or professional
Clerical or sales
Farm
Skilled labor
Unskilled labor
Homemaker
Non-labor force

106
DISCIPLINE
There are no "right" or "wrong" responses to the questions; we are inter
ested in your opinion. You may use a pen or pencil to mark your response.
1. Check (vO what you think are the five biggest problems with which public schools in this community must deal. Then list by number and
in rank order of most pressing top three problems, 1-2-3.
Class size too large (pupil-teacher ratio too high)
Curriculum
Discipline
Drugs
Facilities
Finances
Integration/Segregation
Parents' lack of interest
Pupils' lack of interest
School administration procedures
School board policies
Teachers in general
Teachers' lack of interest
Transportation
Vandalism
There are no problems
Don't know
You may add problems not listed

107
Do you believe that education today is inferior to education received ten years ago?
Yes
No
. Don't know
If you answered "yes" to question 2, for what reason is today's
education inferior? Check only one (1).
a. Less discipline
b. Lower educational standards
c. Less interest in learning by students
d. Less interest in teaching by teachers
e. Irrelevant subjects are being taught
f. Other
Which one statement or description do you mor.t associate with "discipline" in your school district? Check only one (1).
a. Behavior patterns of students
b. Respect for teachers by students
c. The absence of confusion
d. Self-control and respect for authority
e. A branch of learning or knowledge
f. A systematic method to obtain obedience
g. Punishment intended to correct or train
h. Obedience to a set of rules or regulations
Do you agree or disagree that recent court decisions have made it more difficult to have control or better discipline in your school?
a. Agree
b. Disagree

108
c. Don't know
How do you feel about discipline in the local schools? Check one
a. Too strict
b. Not strict enough
c. Just about right
d. Don't know
If you checked a, c, or d, proceed to question 9.
If you feel school discipline is "not strict enough," who should
assume more responsibility for correcting this situation? Check
one (1).
a. Teachers
b. Students
c. School Board
d. School administration
e. Parents
f. Don't know
In what way is discipline in your schools not strict enough?
Check one (1).
a. Teachers lack authority to keep order
b. Students have too much freedom
c. Students have no respect for their teachers
d. Rules are not enforced
e. Vandalism
fo I disagree, discipline is O.K.
g. Don't know
At what time is student behavior most undesirable? Check one (1).
Before classes begin in the morning
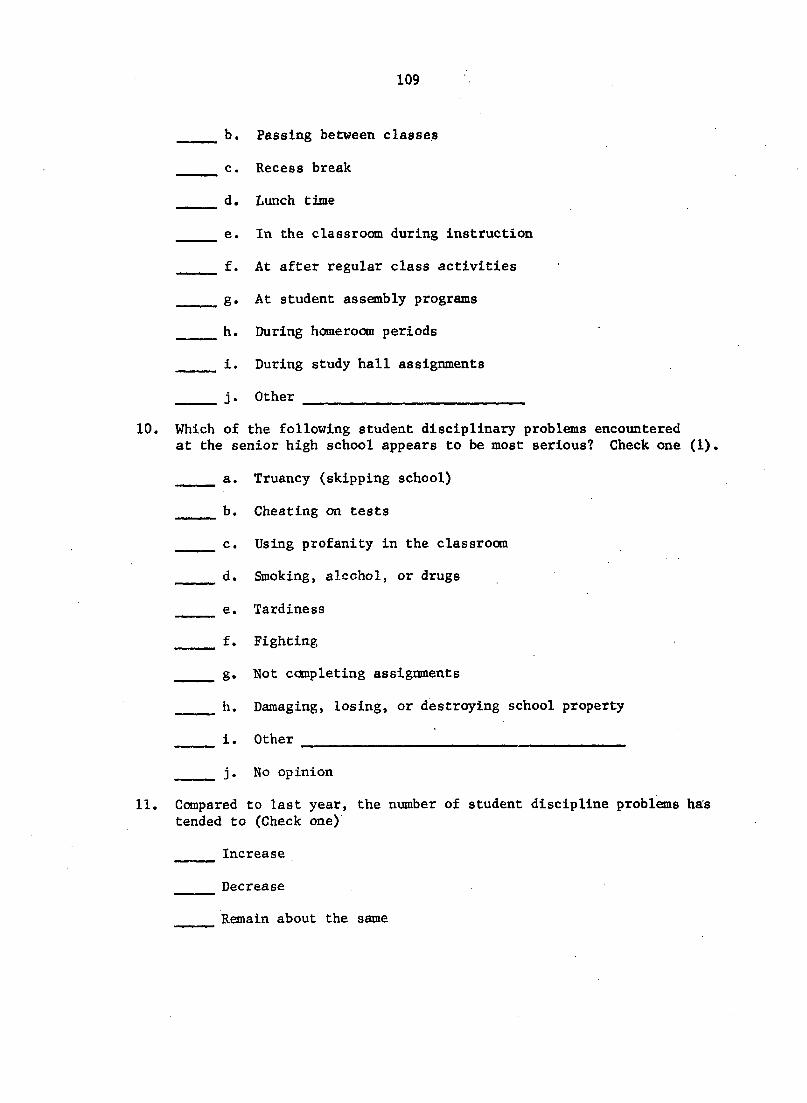
109
b. Passing between classes
c. Recess break
d. Lunch time
e. In the classroom during instruction
f. At after regular class activities
8* At student assembly programs
h. During homeroom periods
• -II During study hall assignments
j. Other
Which of the following student disciplinary problems encountered
at the senior high school appears to be most serious? Check one (1).
a. Truancy (skipping school)
b. Cheating on tests
c. Using profanity in the classroom
- Smoking, alcohol, or drugs
e. Tardiness
Fighting
8» Not completing assignments
h. Damaging, losing, or destroying school property
i. Other
j. No opinion
c%rL'(ch::k %:)- "•' """" «sclplme prcblm. has
Increase
Decrease
Remain about the same

110
Don't know
12. Fran your personal viewpoint, what is the best source of information about discipline in the local schools? Check one (1).
a. Local newspaper
b. Word of mouth of students
c. Word of mouth of adults
d. School personnel
e. Radio and television
f. Meetings at school
g. School publications
h. Don't know
i. Other
13. From your personal viewpoint, what is the best source of information about school discipline in other parts of the United States?
(Check one (1).
a. Local newspaper
b. Word of mouth of students
c. Word of mouth of adults
d. School personnel
e. Radio and television
f. Meetings at school
g. School publications
h. Don't know
i. Other
14. Is discipline in the home weaker or stronger than it was ten years
ago? Check one (1).
Weaker

Ill
stronger
Don't know
15. Has the decrease of "in loco parentis" or the doctrine of the school taking the role of the parent increased acceptance of misbehavior
in your school? Check one (1).
Yes
No
Don't know
16. Will parental involvement in the schools as volunteers or aides improve student behavior in the school? Check one (1).
Yes
No
_______ Don't know
17. Are there enough personnel in the school to properly supervise the students? Check one (1).
Yes
No
Don't know
18. Do you think your local public school system has a hard time getting
good teachers? Check one (1).
Yes
No
Don't know
19. Do you agree or disagree that more guidance counselors in the high school will reduce student discipline problems? Check one (1).
Agree
Disagree
Don't know

112
20. Do you agree or disagree that younger teachers (under 30 years of age) are more liberal than older teachers? Check one (1).
Agree
Disagree
Don't know
21. Do you agree or disagree that stricter teachers have fewer student discipline problems? Check one (1).
Agree
Disagree
Don't know
22. Do you agree or disagree that teacher militancy increases student discipline problems? Check one (1).
Agree
Disagree
Don't know
23. Do you approve or disapprove of physical punislnnent for students who do not respond to other forms of discipline? Check one (1).
Approve
______ Disapprove
No opinion
24. Should discipline in school be left in the hands of the school
without outside interference? Check one (1).
Yes
No
Don't know
25. Do you think the school curriculum in your community needs to be
changed to meet today's needs or do you think it already meets today's needs? Check one (1).
Needs to be changed

113
Already meets needs
No opinion
26. Do you believe a change in your school's curriculum would improve
student behavior? Check one (1).
______ Yes
No
Don't know
27. Should high school students have more to say about what goes on within the school on matters such as curriculum? teachers?
school rules? Check one (1) under each heading.
Curriculum Teachers School Rules
Yes Yes Yes
______ No _____ No _______ No
No opinion No opinion No opinion
28. Do you believe that more "say" by students will improve student
behavior in school? Check one (1).
Yes
No
Don't know
29. Does academic "tracking" of students increase or decrease student
discipline problems? Check one (1).
Increase
_____ Decrease
Don't know
30. Do you agree or disagree that behavior modification techniques with rewards and positive reinforcements improve classroom discipline? Check one (1).
Agree
Disagree

114
Don't know
31. Do poor reading achievement by students and increased discipline problems go hand in hand? Check one (1).
Yes
No
Don't know
32. Please rank five suggestions that you believe would reduce student
discipline problems in school, using 1 to be your best suggestion.
a. Reduce class size
b. Emphasize peer control
c. Use corporal punishment
d. More effective teacher selection and assignment
e. Parental and community involvement
f. Improve curricular offerings and teaching techniques
g. Improve cooperation between administration and teachers
h. Improve cooperation or support between educators and
parents
i. Special classes or schools for "troublemakers"
j. Additional para-professional help in the classroom
k. Institute behavior modification techniques by teachers
1. Enforce present rules and regulations
m. Have more pupil participation in the policy and decision
making process
n. Other
33. Do you agree or disagree that every significant discipline problem of today is rooted in one way or another in increasing advancement of science and technology? Check one (1),
Agree

115
Disagree
No opinion
34. Some people feel the schools do not go far enough in regulating the way boys and girls dress for school. Do you think there should be greater regulation of the way children dress for school or less? Check one (1).
Greater
Less
All right as it is
Don't know
35. Do you feel that school integration has increased or decreased student discipline problems in schools? Check one (1).
Increased discipline problems
Decreased discipline problems
Integration doesn't affect discipline
Don't know
36. Marjuana and other drugs are reported as increasingly being used by students. Do you think it is a serious problem in your schools?
Check one (1).
Yes
No
Don't know
37. Does the use of drugs by students cause more student discipline problems in the schools? Check one (1).
Yes
No
Don't know

116
38. Generally speaking, do the local public school students in your
community have too many rights and privileges or not enough?
one (1).
a. Too many
b. Not enough
c. Just right
d. No opinion
39. Do you agree or disagree that modem and comfortable student learning environments can positively affect the behavior of students?
Check one (1).
Agree
Disagree
Don't know
40. Does "bigness in a school increase discipline problems? Check
one (1).
Yes
No
Don't know
41. What do you think to be the ideal enrollment for a senior high school? This question assumes a senior high school will include
only grades 10, 11, and 12. Check one (1).
a. 100 or less
b. 101-500
c. 501-750
d. 751-1000
e. 1001-1500
f. 1501-more

117
42. Choose three (3) educational programs you believe will help reduce discipline problems in school, and rank them in the order of importance - 1, 2, 3.
______ a. Teaching students to respect law and authority
b. Teaching students how to solve problems and think for themselves
c. Teaching students vocational skills
______ d. Teaching students how to get along with one another
e. Teaching students health and physical education
f. Teaching students how to compete with others
g. Other programs
43. Check the statements you believe to be effective disciplinary tools
Suspension from school
Expulsion from school
_______ Lowering marks or grades
Exclusion from extra-curricular privileges
Detention before or after regular school hours
Parent conferences
Parent-student-teacher conferences
_______ Corporal punishment
Utilization of behavior modification techniques
Stricter rules and regulations
Student-teacher conferences
Other

118
44. Do you feel students in school (check one (1))
a. are safe from being hurt by other students?
b. may be hurt by other students?
c. don't know
45. Please offer other comments about school discipline which may not
have been addressed in this survey.

119
APPENDIX B. RESPONSES BY EDUCATIONAL LEVEL, AT LEAST A BACHELOR'S
DEGREE OR LESS THAN A BACHELOR'S DEGREE, TO SURVEY QUESTIONS
Table 61. Class size too large--bigge8t problem
At least a bachelor's degree
Educational level Less than a bachelor's degree Total
Checked Not checked
21 39
27 51
48 90
Table 62. Curriculum--bigge8t problem
Educational level At least a Less than a bachelor's bachelor's degree degree Total
Checked 25 30 55 Not checked 34 48 82
Table 63. Discipline--biggest problem
Educational level At least a Less than a bachelor's bachelor's degree degree Total
Checked 34 35 69 Not checked 26 43 69

120
Table 64. Facllitie8--bigge8t problem
Education level
At least a Less than a bachelor's bachelor's degree degree Total
Checked 15 22 37 Not checked 45 56 101
Table 65. Finances--biggest problem
Educational level
At least a Less than a bachelor's bachelor's degree degree Total
Checked 39 34 73 Not checked 35 31 66
Table 66. Integration/segregation--biggest problem
Educational level
At least a Less than a bachelor's bachelor's degree degree Total
Checked 10 5 15 Not checked 50 73 123
Table 67. Parents' lack of interest—biggest problem
Educational level
At least a Less than a bachelor's bachelor's degree degree Total
Checked 24 26 50 Not checked 36 52 88

121
Table 68. School administration procedures—biggest problem
Educational level At least a Less than a bachelor's bachelor's degree degree Total
Checked 14 11 25 Not checked 46 67 113
Table 69. School board pollcies--biggest problem
Educational level At least a Less than a bachelor's bachelor's degree degree Total
Checked 9 15 24 Not checked 51 63 114
Table 70. Teachers in general--biggest problem
Educational level At least a . Less than a bachelor's bachelor's degree degree Total
Checked 3 8 11 Not checked 57 70 127
Table 71. Teachers' lack of Interest—biggest problem
Educational level At least a Less than a bachelor's bachelor's degree degree Total
Checked 13 29 42
Not checked 47 49 96

122
Table 72. Transportation—biggest problem
Educational level At least a
bachelor's
degree
Less than a bachelor's degree Total
Checked
Not checked 1
59
2
76 3
135
Table 73. No problems--biggest problem
Educational level
At least a bachelor's degree
Less than a bachelor's degree Total
Checked Not checked
0 60
1
77 1
137
Table 74. Don't know--biggest problem
Educational level
At least a Less than a bachelor's bachelor's degree degree Total
Checked
Not checked
0 60
2 76
2 136

123
Table 75. Description most associated with discipline
Educational level At least a Less than a bachelor's bachelor's degree degree Total
Behavior 21 16 37 Respect 29 37 66 Knowledge 2 1 3 Obedience 7 18 25 Punishment 5 1 6
Table 76. Who should assume more responsibility for discipline being not strict enough
Educational level At least a Less than a bachelor's bachelor's degree degree Total
Teachers 5 14 19
Students 0 2 2 School board 7 2 9 School administration 25 15 40
Parents 9 10 19 Don't know 1 3 4
Table 77. In what way is discipline not strict enough
Educational level
At least a Less than a bachelor's bachelor's degree degree Total
Teacher lack authority 10 14 24
Students too much freedom 17 6 23
Students no respect 7 12 19 Rules not enforced 14 13 27 Vandalism 1 1 2 Discipline--OK 4 4 8

124
Table 78. Best source of local information about discipline
Educational level At least a Less than a bachelor 's bachelor's degree degree Total
Don't know 4 7 11 Media 2 8 10 Verbal exchange 49 56 105 School publica
tions 4 8 12
Table 79. Should students have more input on curriculum matters
Educational level At least a Less than a bachelor' 's bachelor's degree degree Total
Yes 41 62 103
No 17 14 31
Table 80. Should students have more input on school rules
Educational level
At least a Less than a bachelor' s bachelor's degree degree Total
Yes 42 60 102
No 19 18 37

125
Table 81. Rank of "reduce class size" as a suggestion to reduce student discipline problems
Educational level At least a Less than a bachelor's bachelor's degree degree Total
First 9 10 19 Second 6 5 11 Third 6 3 9 Fourth 5 6 11 Fifth 3 8 11
Table 82. Rank of "emphasize peer control" as a suggestion to reduce student discipline problems
Educational level At least a Less than a bachelor's bachelor's degree degree Total
First 1 3 4 Second 3 2 5 Third 2 2 4
Fourth 5 1 6
Fifth 7 5 12
Table 83. Rank of "more effective teacher selection and assignment" as a suggestion to reduce student discipline problems
Educational level At least a Less than a bachelor's bachelor's degree degree Total
First 12 7 19
Second 4 9 13
Third 3 6 9
Fourth 2 8 10
Fifth 2 6 8

126
Table 84. Rank of "parental and community involvement" as a suggestion to reduce student discipline problems
Educational level
At least a Less than a bachelor's bachelor's degree degree Total
First 7 6 13 Second 3 3 6 Third 1 6 7 Fourth 6 1 7 Fifth 5 3 8
Table 85. Rank of "improve curricular offerings and teaching technique; as a suggestion to reduce student discipline problems
Educational level
At least a Less than a bachelor's bachelor's degree degree Total
First 5 18 23
Second 7 6 13
Third 13 6 19 Fourth 2 9 11 Fifth 6 3 9
Table 86. Rank of "improve cooperation between administration and
teachers" as a suggestion to reduce student discipline
problems
Educational level
At least a Less than a bachelor's bachelor's degree degree Total
First 4 2 6
Second 4 2 6
Third 4 2 6
Fourth 6 3 9
Fifth 2 4 6

127
Table 87. Rank of "Improve cooperation between educators and parents" as a suggestion to reduce student discipline problems
Educational level
At least a Less than a bachelor's bachelor's degree degree Total
First 6 2 8 Second 8 5 13 Third 3 6 9 Fourth 10 5 15 Fifth 4 4 8
Table 88. Rank of "special classes for troublemakers" as a suggestion
to reduce student discipline problems
Educational level At least a Less than a bachelor's bachelor's degree degree Total
First 0 3 3 Second 2 3 5
Third 6 7 13 Fourth 2 3 5 Fifth 4 4 8
Table 89. Rank of "institute behavior modification techniques by teachers" as a suggestion to reduce student discipline
problems
Educational level At least a Less than a bachelor's bachelor's . degree degree Total
First 2 3 5
Second 3 3 6 Third 6 1 7 Fourth 2 3 5 Fifth 3 3 6

128
Table 90. Rank of "enforce present rules and regulations" as a suggestion to reduce student discipline problems
Educational level At least a Less than a bachelor •s bachelor's degree degree Total
First 11 8 19 Second 6 9 15 Third 6 5 11 Fourth 5 7 12 Fifth 3 2 5
Table 91. Rank of "more pupil participation in the policy and decision making process" as a suggestion to reduce student discipline problems
Educational level At least a Less than a bachelor' 's bachelor's degree degree Total
First 0 3 3 Second 3 10 13 Third 3 7 10
Fourth 5 6 11 Fifth 8 7 15
Table 92. Affect of integration on student discipline problems
Educational level At least a Less than a bachelor's bachelor's degree degree Total
Increased 23 30 53 Doesn't affect 19 25 44
Don't know 15 22 37

129
Table 93. Suspension from school as an effective disciplinary tool
Educational level At least a Less than a bachelor's bachelor's degree degree Total
Checked 24 26 50 Not checked 36 50 86
Table 94. Expulsion from school as an effective disciplinary tool
Educational level
At least a Less than a bachelor's bachelor's degree degree Total
Checked 16 12 28
Not checked 44 65 109
Table 95. Lowering grades as an effective disciplinary tool
Educational level At least a Less than a bachelor's bachelor's degree degree Total
Checked 7 14 21
Not checked 53 63 116
Table 96. Exclusion from extracurricular privileges as an effective disciplinary tool
Educational level At least a Less than a bachelor's bachelor's degree degree Total
Checked 25 36 61
Not checked 35 41 76

130
Table 97. Detention as an effective disciplinary tool
Educational level At least a Less than a bachelor's bachelor's degree degree Total
Checked 19 23 42 Not checked 41 54 . 95
Table 98. Parent conferences as an effective disciplinary tool
Educational level At least a Less than a bachelor's bachelor's degree degree Total
Checked 31 27 58 Not checked 29 50 79
Table 99. Parent-student-teacher conferences as an effective disciplinary tool
Educational level
At least a Less than a bachelor's bachelor's degree degree Total
Checked 52 56 108
Not checked 8 21 29
Table 100. Corporal punishment as an effective disciplinary tool
Educational level At least a Less than a bachelor's bachelor's degree degree Total
Checked 13 9 22 Not checked 47 68 115

131
Table 101. Utilization of behavior modification techniques as an effective disciplinary tool
Educational level At least a bachelor's degree
Less than a bachelor's degree Total
Checked Not checked
22 38
18 59
40 97
Table 102. Stricter rules and regulations as an effective disciplinary
tool
Educational level At least a
bachelor's
degree
Less than a bachelor's degree Total
Checked Not checked
17 43
23 54
40 97
Table 103. Student-teacher conferences as an effective disciplinary
tool
Educational level
At least a
bachelor's degree
Less than a
bachelor's degree Total
Checked
Not checked
30 29
27 50
57
79

132
APPENDIX C. RESPONSES BY AGE, MALE AND FEMALE, TO SURVEY QUESTIONS
Table 104. Class size too large--blggest problem
Age Over 30 Under 30 Total
Checked 23 25 48 Not checked 42 49 91
Table 105. Curriculum--biggest problem
Age
Over 30 Under 30 Total
Checked 27 28 55 Not checked 37 46 83
Table 106. Drug8--biggest problem
Age
Over 30 Under 30 Total
Checked Not checked
19 46
30
44 49 90

133
Table 107. Facilities—biggest problem
Age
Over 30 Under 30 Total
Checked 14 23 37 Not checked 51 51 102
Table 108. Finances—biggest problem
Ase Over 30 Under 30 Total
Checked 34 39 73 Not checked 31 35 66
Table 109. Integration/segregation—biggest problem
Age
Over 30 Under 30 Total
Checked 10 5 15 Not checked 55 69 124
Table 110. Parents' lack of interest--biggest problem
Age
Over 30 Under 30 Total
Checked 25 26 51 Not checked 40 48 88

134
Table 111. School administration procedures—biggest problem
Age
Over 30 Under 30 Total
Checked 13 12 25 Not checked 52 62 114
Table 112. School board policies—biggest problem
Age Over 30 Under 30 Total
Checked 7 17 24 Not checked 58 57 115
Table 113. Teachers in general—biggest problem
Age
Over 30 Under 30 Total
Checked 4 8 12 Not checked 61 66 127
Table 114. Teachers' lack of interest--biggest problem
Over 30 Under 30 Total
Checked 16 26 42 Not checked 49 48 97

135
Table 115. Transportation—biggest problem
Age Over 30 Under 30 Total
Checked 1 2 3 Not checked 64 72 136
Table 116. Vandalism--biggest problem
Age Over 30 Under 30 Total
Checked 10 16 26 Not checked 55 58 113
Table 117. No problems—biggest problem
Age
Over 30 Under 30 Total
Checked 0 1 1
Not checked 65 73 138
Table 118. Don't know—biggest problem
Age Over 30 Under 30 Total
Checked Not checked
0 65
2 72
2 137

136
Table 119. Description most associated with discipline
Age Over 30 Under 30 Total
Behavior 20 17 37 Respect 30 37 67
Knowledge 2 13 Obedience 11 14 25 Punishment 2 4 6
Table 120. Who should assume more responsibility for discipline being "not strict enough"
Age Over 30 Under 30 Total
Teachers 10 9 19
Students 112 School board 8 19 School administration 23 17 40 Parents 12 8 20 Don't know 13 4
Table 121. In what way is discipline not strict enough
Teachers lack authority
Students too much freedom
Students--no respect
Rules not enforced Vandalism Discipline--O.K.
Age Over 30 Under 30 Total
11 14 25
18 5 23
9 10 19 13 14 27
2 0 2 3 5 8

137
Table 122. Which discipline problems appear to be most serious
Age
Over 30 Under 30 Total
Smoking, alcohol, drugs 10 18 28 Truancy, tardiness 17 28 45 Cheating, fighting 14 15 29 Other 18 12 30
Table 123. Best source of local information about discipline
Age
Over 30 Under 30 Total
Don't know 4 7 11 Media 6 5 11 Verbal exchange 52 53 105
School publications 3 9 12
Table 124. Should students have more input on school rules
Age
Over 30 Under 30 Total
Yes No No opinion
42 22 1
60 12 3
102 34
4

138
Table 125. Rank of "reduce class size" as a suggestion to reduce stu-dent discipline problems
Age
Over 30 Under 30 Total
First 9 10 19 Second 5 6 11 Third 6 3 9 Fourth 6 5 11
Fifth 4 7 11
Table 126. Rank of "emphasize peer control" as a suggestion to reduce student discipline problems
Age Over 30 Under 30 Total
First 3 2 5
Second 4 1 5
Third 2 2 4
Fourth 4 2 6
Fifth 6 6 12
Table 127. Rank of "more effective teacher selection" as a suggestion to reduce student discipline problems
Over 30 Under 30 Total
First 7 12 19 Second 9 4 13 Third 6 3 9
Fourth 8 2 10
Fifth 6 2 8

139
Table 128. Rank of "parental and coranunity involvement" as a suggestion to reduce student discipline problems
Agg Over 30 Under 30 Total
First 6 7 13 Second 2 4 6
Third 16 7 Fourth 5 2 7
Fifth 5 3 8
Table 129. Rank of "improve curricular offerings and teaching techniques" as a suggestion to reduce student discipline problems
Age
Over 30 Under 30 Total
First 5 18 23 Second 8 5 13 Third 9 10 19 Fourth 5 6 11 Fifth 6 3 9
Table 130. Rank of "improve cooperation between administration and teachers" as a suggestion to reduce student discipline
problems
Am. Over 30 Under 30 Total
First 4 2 6 Second 5 1 6
Third 2 4 6
Fourth 5 4 9 Fifth 2 4 6

140
Table 131. Rank of "improve support between educators and parents" as a suggestion to reduce student discipline problems
èM Over 30 Under 30 Total
First 7 18 Second 8 5 13 Third 5 4 9 Fourth 7 8 15
Fifth 5 3 8
Table 132. Rank of "special classes or schools for troublemakers" as a suggestion to reduce student discipline problems
Age Over 30 Under 30 Total
First 0 3 3 Second 2 3 5
Third 9 4 13 Fourth 3 2 5 Fifth 3 5 8
Table 133. Rank of "institute behavior modification techniques for teachers" as a suggestion to reduce student discipline
problems
A^e Over 30 Under 30 Total
First 2 3 5 Second 4 2 6
Third 6 17 Fourth 3 2 5 Fifth 2 4 6

141
Table 134. Rank of "enforce present rules and regulations" as a suggestion to reduce student discipline problems
Over 30 Under 30 Total
First & . 11 19 Second 9 6 15 Third 5 6 11 Fourth 7 5 12 Fifth 2 3 5
Table 135. Rank of "more pupil participation in the policy and decisionmaking" as a suggestion to reduce student discipline problems
Age Over 30 Under 30 Total
First 0 3 3 Second 3 10 13
Third 3 7 10
Fourth 5 6 11
Fifth 9 6 15
Table 136. Affect of integration on student discipline problems
Age Over 30 Under 30 Total
Increased Doesn't affect Don't know
25 19 18
28 26 19
33 45 37

142
Table 137. Suspension from school as an effective disciplinary tool
Age Over 30 Under 30 Total
Checked 24 26 50 Not checked 41 46 87
Table 138. Expulsion from school as an effective disciplinary tool
Age
Over 30 Under 30 Total
Checked 13 15 28 Not checked 52 58 110
Table 139. Lowering marks as an effective disciplinary tool
Age
Over 30 Under 30 Total
Checked 8 14 22 Not checked 57 59 116
Table 140. Exclusion from extracurricular privileges as an i effective disciplinary tool
Age
Over 30 Under 30 Total
Checked 26 35 61 Not checked 39 38 77

143
Table 141. Detention as an effective disciplinary tool
Age
Over 30 Under 30 Total
Checked 17 25 42 Not checked 48 48 96
Table 142. Parent-student-teacher conferences as an effective discipli
nary tool
Age
Over 30 Under 30 Total
Checked 54 • 54 108
Not checked 11 19 30
Table 143. Corporal punishment as an effective disciplinary tool
Age
Over 30 Under 30 Total
Checked 12 10 22 Not checked 53 63 116
Table 144. Utilization of behavior modification techniques as an
effective disciplinary, tool
Age
Over 30 Under 30 Total
Checked Not checked
21 44
19 54
40 98

144
Table 145. Student-teacher conferences as an effective disciplinary
tool
hSÈ
Over 30 Under 30 Total
Checked Not checked
29 36
28 44
57 80

145
APPENDIX D. RESPONSES BY CLASSIFICATION OF ADMINISTRATOR, TEACHER,
STUDENT, PARENT, TO SURVEY QUESTIONS
Table 146. Class size too large—biggest problem
Classification
Administrator Teacher Student Parent Total
Checked 3 14 23 8 48 Not checked 12 23 40 16 91
Table 147. Curriculum—biggest problem
Classification
Adminis
trator Teacher Student Parent Total
Checked 8 15 24 8 53
Not checked 7 22 39 15 83
Table 148. Finances—biggest problem
Classification
Adminis-trator Teacher Student Parent Total
7 21 33 12 73 8 16 30 12 66
Checked
Not checked

146
Table 149. Integration/segregation—biggest problem
Classification
Adminis
trator Teacher Student Parent Total
Checked 4 5 4 2 15 Not checked 11 32 59 22 124
Table 150. Parents' lack of interest—biggest problem
Classification
Adminis
trator Teacher Student Parent Total
Checked 5 16 19 11 51
Not checked 10 21 44 13 88
Table 151. School administration procedures--biggest problem
Classification
Administrator Teacher Student Parent Total
Checked 2 7 10 6 25 Not checked 13 30 53 18 114
Table 152. School board policies --biggest problem
Classification
Adminis
trator Teacher Student Parent Total
Checked 2 5 15 2 24
Not checked 13 32 48 22 115

147
Table 153. Teachers in general—biggest problem
Classification Âdmlnl8-trator Teacher Student Parent Total
Checked Not checked
2
13
1 36
7 56
2
22
12
127
Table 154. Teachers' lack of interest--bigge8t problem
Classification
Administrator Teacher Student Parent Total
Checked Not checked
5 10
6
31 22
41
9
15
42
97
Table 155. Transportation--bigge8t problem
Classification
Administrator Teacher Student Parent Total
Checked Not checked
1 14
0 37
1 62
1 23
3 136
Table 156. Vandallsm--biggest problem
Classification Administrator Teacher Student Parent Total
Checked 0 5 16 5 26 Not checked 15 32 47 19 113

148
Table 157. There are no problem8--biggest problem
Classification
Administrator Teacher Student Parent Total
Checked 0 0 1 0 1 Not checked 15 . 37 62 24 138
Table 158. Don' 't know--biggest problem
Classification
Administrator Teacher Student Parent Total
Checked 0 0 2 0 2 Not checked 15 37 61 24 137
Table 159. Description most associated with discipline
Classification Adminis-trator Teacher Student Parent Total
Behavior 6 13 12 6 37
Respect 6 19 31 11 67
Knowledge 0 2 1 0 3
Obedience 3 3 14 5 25
Punishment 0 1 4 1 6

149
Table 160. Who should assume more responsibility for discipline being not strict enough
Classification Adminis-trator Teacher Student Parent Total
Teachers 4 1 8 6 19 Students 0 0 1 1 2 School board 0 7 1 1 9 School administration 3 17 12 8 40 Parents 1 8 6 5 20 Don't know 0 1 3 0 4
Table 161. In what way is discipline not strict enough
Classification Adminis-
trator Teacher Student Parent Total
Teachers lack authority 2 6 11 6 25 Students--too much
freedom 2 12 4 5 23 Students—no respect 0 6 7 6 19 Rules not enforced 3 11 11 2 27 Vandalism 0 1 0 1 2
Discipline--O.K. 3 1 4 0 8
Table 162. Best source of local information about discipline
Classification Adminis
trator Teacher Student Parent Total
Don * t know 0
Media 1 Verbal exchange 14 School publications 0
4 1 27 4
6 5
45 8
1 4 19 0
11 11
105 12

150
Table 163. Best source of national information about discipline
Classification Adminis-trator Teacher Student Parent Total
Don't know 2 8 7 5 22 Media 3 10 42 14 69 Verbal exchange 3 8 8 2 21 School publications 7 11 7 3 28
Table 164. More guidance counselors in the high school will reduce student discipline problems
Classification Adminis-trator Teacher Student Parent Total
Agree 8 7 29 10 54
Disagree 6 26 27 11 70 Don't know 1 5 7 3 16
Table 165. Teacher militancy increases student discipline problems
Classification Administrator Teacher Student Parent Total
Agree 9 12 24 13 58
Disagree 4 16 10 7 37 Don't know 2 8 29 4 43
Table 166. A change in school curriculum would improve student behavior
Classification Adminis
trator Teacher Student Parent Total
Yes 10 14 32 7 63 No 4 16 20 11 51 Don't know 1 7 11 5 24

151
Table 167, Student input on school rules
Classification Administrator Teacher Student Parent Total
Yes 9 27 51 15 102 No 5 11 10 8 34 No opinion 1 0 3 0 4
Table 168, Rank of "reduce class size" as a suggestion to reduce stu-dent discipline problems
Classification Administrator Teacher Student Parent Total
First 2 5 8 4 19
Second 2 4 5 0 11
Third 1 5 3 0 9
Fourth 2 3 5 1 11
Fifth 0 1 6 4 11
Table 169. Rank of "emphasize peer control" as a suggestion to reduce student discipline problems
Classification Administrator Teacher Teacher Student Total
First 0 12 2 5 Second 1112 5
Third 0 2 2 0 4 Fourth 2 3 10 6 Fifth 2 5 4 1 12

152
Table 170. Rank of "more effective teacher selection" as a suggestion to reduce student discipline problems
Classification Administrator Teacher Student Parent Total
First 5 5 4 5 19 Second 2 2 8 1 13
Third 0 2 5 2 9 Fourth 1 1 8 0 1Ô Fifth 0 2 5 1 8
Table 171. Rank of "parental and community involvement" as a suggestion to reduce student discipline problems
Classification Administrator Teacher Student Parent Total
First 1 5 5 2 13 Second 2 0 3 16
Third 0 1 5 17 Fourth 2 4 10 7 Fifth 14 2 18
Table 172. Rank of "improve curricular offerings and teacher techniques" as a suggestion to reduce student discipline problems
Classification
Adminls-trator Teacher Student Parent Total
First 3 2 17 1 23
Second 2 5 4 2 13
Third 4 7 6 2 19
Fourth 0 1 5 5 11
Fifth 4 2 3 0 9

153
Table 173. Rank of "improved cooperation between administration and teachers" as a suggestion to reduce student discipline problems
Classification Administrator Teacher Student Parent Total
First I 3 2 0 6 Second 1 3 1 1 6 Third 0 3 2 1 6 Fourth 0 4 3 2 9 Fifth 2 0 4 0 6
Table 174. Rank of "improve cooperation between educators and parents" as a suggestion to reduce student discipline problems
Classification Administrator Teacher Student Parent Total
First 0 4 0 4 8 Second 2 6 4 1 13
Third 1 2 3 1 9
Fourth 3 6 5 1 15
Fifth 0 3 3 2 8
Table 175. Rank of "special classes or schools for troublemakers" as a suggestion to reduce student discipline problems
Classification
Adminis
trator Teacher Student Parent Total
First 0 0 3 0 3
Second 0 2 3 0 5
Third 1 4 4 4 13
Fourth 1 1 2 1 5
Fifth 2 1 4 1 8

154
Table 176. Rank of "institute behavior modification techniques by teachers" as a suggestion to reduce student discipline problems
Classification Administrator Teacher Student Parent Total
First 1 0 3 I 5 Second 0 1 1 4 6 Third 3 3 1 0 7 Fourth 0 2 2 I 5 Fifth 1 2 2 1 6
Table 177. Rank of "enforce present rules and regulations" as a suggestion to reduce student discipline problems
Classification Adminis-trator Teacher Student parent Total
First 2 9 5 3 19
Second 0 4 9 2 15
Third 3 2 4 2 11
Fourth 0 3 5 4 12
Fifth 0 3 1 1 5
Table 178. Rank of "more pupil participation in the policy and decisionmaking" as a suggestion to reduce student discipline problems
Classification
Administrator Teacher Student Parent Total
First 0 0 3 0 3
Second 1 2 9 1 13
Third 2 1 6 1 10
Fourth 2 2 5 2 11
Fifth 1 5 6 3 15

155
Table 179. Affect of "integration on student discipline problems
Classification Administrator Teacher Student Parent Total
Increased 2 16 25 8 53 Doesn't affect 4 12 20 9 45 Don't know 6 8 18 5 37
Table 180. Suspension from school as an effective disciplinary tool
Classification
Adminis
trator Teacher Student Parent Total
Checked 5 16 20 9 50
Not checked 10 21 41 15 87
Table 181. Expulsion from school as an effective disciplinary tool
Classification Administrator Teacher Student Parent Total
Checked 3 13 11 1 28 Not checked 12 24 51 23 110
Table 182. Lowering marks as an effective disciplinary tool
Classification
Adminis
trator Teacher Student Parent Total
Checked 1 5 13 3 22
Not checked 14 32 49 21 " 116

156
Table 183. Exclusion from extracurricular privileges as an effective disciplinary tool
Classification
Adminis
trator Teacher Student Parent Total
Checked 5 17 27 12 61 Not checked 10 20 35 12 77
Table 184. Detention as an effective disciplinary tool
Classification
Adminis
trator Teacher Student Parent Total
Checked 4 12 18 8 42 Not checked 11 25 44 16 96
Table 185. Parent-student-teacher conferences as an effective disciplinary tool
Classification
Adminis
trator Teacher Student Parent Total
Checked 12 33 43 20 108 Not checked 3 4 19 4 30
Table 186. Corporal punishment as an effective disciplinary tool
Classification
Adminis
trator Teacher Student Parent Total
Checked 2 10 8 2 22
Not checked 13 27 54 22 116

157
Table 187. Utilization of behavior modification techniques as an effective disciplinary tool
Classification Administrator Teacher Student Parent Total
Checked 7 12 14 7 40 Not checked 8 25 48 17 98
Table 188. Student-teacher conferences as an effective disciplinary tool
Classification Administrator Teacher Student Parent Total
Checked 8 17 23 9 57
Not checked 7 20 39 14 80

158
APPENDIX E. RESPONSES BY GEOGRAPHICAL REGION OF THE UNITED STATES, TO SURVEY QUESTIONS
Table 189. Class size too large--biggest problem
Region East North South West Total
Checked 9 20 8 11 48 Not checked 24 25 21 21 91
Table 190. Curriculum --biggest problem
Region
East North South West Total
Checked 17 14 8 16 55 Not checked 16 30 21 16 83
Table 191. Discipline---biggest problem
Region East North South West Total
Checked 15 20 18 17 70
Not checked 18 25 11 15 69
Table 192. Integration/segregation—biggest problem
Region
East North South West Total
Checked 0 1 10 4 15
Not checked 33 44 19 28 124

159
Table 193. Pupils' lack of interest—biggest problem
Region
East North South West Total
Checked 15 29 18 17 79 Not checked 18 16 11 15 60
Table 194. School administration procedures—biggest problem
Region
East North South West Total
Checked 6 11 4 4 25 Not checked 27 34 25 28 114
Table 195. School board policies—biggest problem
Region
East North South West Total
Checked 3 12 5 4 24 Not checked 30 33 24 28 115
Table 196. Teachers in general--biggest problem
Region
East North South West Total
Checked 3 4 2 3 12
Not checked 30 41 27 29 127

160
Table 197, Teachers' lack of Interest—biggest problem
Region
East North South West Total
Checked 11 10 10 11 42 Not checked 22 35 19 21 97
Table 198. Transportation--biggest problem
Region East North South West Total
Checked 2 0 0 1 3 Not checked 31 45 29 31 136
Table 199. Vandalism—biggest problem
Région East North South West Total
Checked 10 7 4 5 26
Not checked 22 38 25 27 113
Table 200. No problems—biggest problem
Region
East North South West Total
Checked 1 0 0 0 1
Not checked 32 45 29 32 138

161
Table 201. Don't know--biggest problem
Region East North South West Total
Checked 0 2 0 0 2 Not checked 33 43 29 32 137
Table 202. Description most associated with discipline
Region
East North South West Total
Behavior 11 11 8 7 37 Respect 11 27 15 14 67 Knowledge 2 1 0 0 3 Obedience 9 3 3 10 25 Punishment 1 2 2 1 6
Table 203. Who should assume more responsibility for discipline being not strict enough
Region
East North South West Total
Teachers 7 4 1 7 19
Students 1 0 0 1 2 School board 2 6 1 0 9
School administration 5 9 15 11 40
Parents 3 6 5 6 20
Don't know 1 2 1 0 4
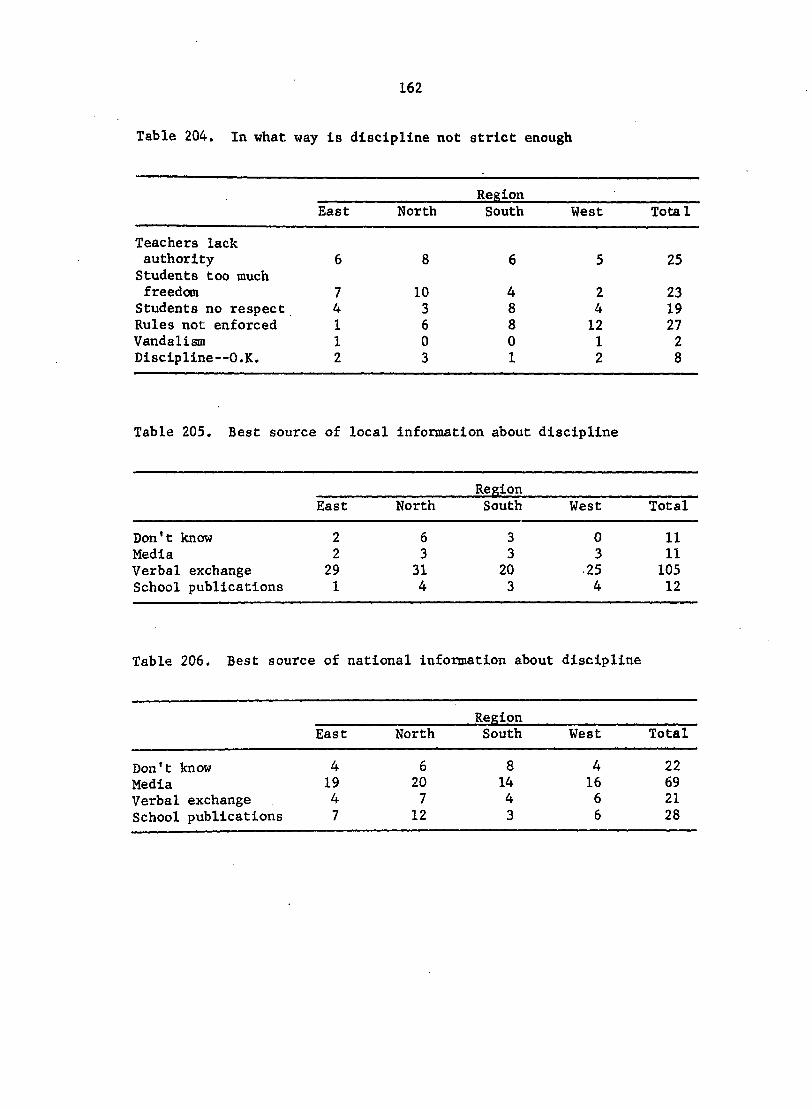
162
Table 204. In what way is discipline not strict enough
Region
East North South West Total
Teachers lack authority 6 8 6 5 25 Students too much freedom 7 10 4 2 23
Students no respect 4 3 8 4 19 Rules not enforced 1 6 8 12 27 Vandalism 1 0 0 1 2 Discipline—O.K. 2 3 1 2 8
Table 205. Best source of local information about discipline
Region
East North South West Total
Don't know 2 6 3 0 11 Media 2 3 3 3 11 Verbal exchange 29 31 20 25 105
School publications 1 4 3 4 12
Tablé 206. Best source of national Information about discipline
Region
East North South West Total
Don't know 4 6 8 4 22
Media 19 20 14 16 69
Verbal exchange 4 7 4 6 21
School publications 7 12 3 6 28

163
Table 207. More guidance counselors in high school will reduce student discipline problems
Region East North South West Total
Agree Disagree Don't know
12 18 4
16 25 5
10 13 6
16
14 1
54
70
16
Table 208. Stricter teachers have fewer student discipline problems
Region East North South West Total
Agree Disagree
23
11
26
15
25
2 21 10
95 38
Table 209. Younger teachers teachers
(under 30) are more liberal than older
Region East North South West Total
Agree Disagree
21 9
37 4
19 6
21
7
98 26
Table 210. Teacher militancy increases student discipline problems
Region
East North South West Total
Agree 16 16 17 9 58
Disagree 10 14 3 10 37

164
Table 211. Should students have more input on curriculum matters
Region East North South West Total
Yes 28 28 21 27 104 No 5 16 5 5 31
Table 212. Should students have more input on teacher matters
Region East North South West Total
Yes 19 18 11 19 67
No 14 24 14 12 64
Table 213. Should students have more input on school rules
Region
East North South West Total
Yes 30 29 20 23 102
No 4 14 7 9 34
No opinion 0 3 1 0 4
Table 214. Poor reading achievement and increased student discipline
problems
Region East North South West Total
Yes 21 26 22 23 92
No 7 11 2 5 25

165
Table 215. Rank of "reduce class size" as a suggestion to reduce stu
dent discipline problems
Region
East North South West Total
First 4 6 5 4 19 Second 2 3 3 3 11 Third 2 4 12 9
Fourth 0 4 1 6 11 Fifth 2 5 0 4 11
Table 216. Rank of "emphasize peer control" as a suggestion to reduce student discipline problems
Region East North South West Total
First 2 10 2 5 Second 2 3 0 0 5 Third 0 4 0 0 4
Fourth 13 2 0 6 Fifth 2 1 4 5 12
Table 217. Rank of "more effective teacher selection and assignment" as a suggestion to reduce student discipline problems
Region East North South West Total
First 4 6 5 4 19 Second 3 4 4 2 13
Third 2 13 3 9 Fourth 1 3 2 4 10 Fifth 2 3 12 8

166
Table 218. Rank of "parental and community involvement" as a suggestion to reduce student discipline problems
Region East North South West Total
First 1 3 5 4 13 Second 0 2 2 2 6 Third 1 2 2 2 7 Fourth 2 2 0 3 7 Fifth 2 2 4 0 8
Table 219. Rank of "improve curricular offerings and teaching techniques" as a suggestion to reduce student discipline problems
Region East North South West Total
First 8 9 3 3 23 Second 4 2 2 5 13 Third 4 5 3 7 19
Fourth 4 4 2 1 11 Fifth 0 3 15 9
Table 220. Rank of "Improve cooperation between administration and teachers" as a suggestion to reduce student discipline problems
Region East North South West Total
First 2 1 2 1 6
Second 1 3 2 0 6
Third 1 2 2 1 6 Fourth 1 2 4 2 9
Fifth 3 2 0 1 6

167
Table 221. Rank of "improve cooperation between educators and parents" as a suggestion to reduce student discipline problms
Region East North South West Total
First 3 3 1 1 8 Second 2 4 2 5 13 Third 3 2 2 2 9 Fourth 3 6 4 2 15 Fifth 2 4 1 1 8
Table 222. Rank of "special classes for troublemakers" as a suggestion to reduce student discipline problems
Region East North South West Total
First 0 2 0 1 3
Second 0 4 0 1 5
Third 2 5 3 3 13 Fourth 2 1 1 1 5
Fifth 3 2 1 2 8
Table 223. Rank of "institute behavior modification techniques by teachers" as a suggestion to reduce student discipline
problems
Region
East North South West Total
First 0 3 0 2 5 Second 2 3 1 0 6
Third 1 3 1 2 7
Fourth 1 1 2 1 5
Fifth 0 3 2 1 6

168
Table 224. Rank of "enforce present rules and regulations" as a suggestion to reduce student discipline problems
Region East North South West Total
First 2 5 3 9 19 Second 1 5 5 4 15 Third 3 3 3 2 11 Fourth 2 4 4 2 12 Fifth 2 0 3 0 5
Table 225. Rank of "more pupil participation in the policy and decisionmaking process" as a suggestion to reduce student discipline
Region
East North South West Total
First 0 2 0 1 3 Second 7 2 2 2 13
Third 2 4 1 3 10
Fourth 3 4 1 3 11
Fifth 3 4 5 3 15
Table 226. Suspension from school as an effective disciplinary tool
Region
East North South West Total
Checked 10 16 15 9 50
Not checked 24 27 13 23 87

169
Table 227. Lowering grades as an effective disciplinary tool
Region East North South West Total
Checked 5 7 5 5 22 Not checked 29 36 24 27 116
Table 228. Exclusion from extracurricular privileges as an effective disciplinary tool
Region
East North South West Total
Checked 18 15 14 14 61 Not checked 16 28 15 18 77
Table 229. Parent conferences as an effective disciplinary tool
Resion East North South West Total
Checked 12 15 18 13 58
Not checked 22 28 11 19 80
Table 230. Parent-student-teacher conferences as an effective discipli
nary tool
Region
East North South West Total
Checked 26 33 27 22 108 Not checked 8 10 2 10 30

170
Table 231. Utilization of behavior modification techniques as an effective disciplinary tool
Region
East North South West Total
Checked 12 10 10 8 40 Not checked 22 33 19 24 98
Table 232. Stricter rules and regulations as an effective disciplinary tool
Region
East North South West Total
Checked 6 14 12 8 40 Not checked 28 29 17 24 98

171
APPENDIX F. RESPONSES TO SURVEY QUESTIONS BY SEX, MALE OR FEMALE, OF THE SAMPLE
Table 233, Class size—biggest problem
Sex Male Female Total
Checked 23 25 48 Not checked 50 41 91
Table 234. Curriculum—biggest problem
Sex Male Female Total
Checked 27 28 55
Not checked 45 38 83
Table 235. Discipline—biggest problem
Sex Male Female Total
Checked 37 33 70 Not checked 36 33 69
Table 236, Drugs--biggest problem
Sex Male Female Total
Checked 26 23 49
Not checked 47 43 90

172
Table 237. Facilities—biggest problem
Sex Male Female Total
Checked 21 16 37 Not checked 52 50 102
Table 238, Finances--biggest problem
Sex Male Female Total
Checked 42 31 73 Not checked 31 35 66
Table 239. Integration/segregation— biggest problem
Sex Male Female Total
Checked 9 6 15 Not checked 64 60 124
Table 240. Parents' lack of interest —biggest problem
Sex Male Female Total
Checked 21 30 51
Not checked 52 36 88

173
Table 241. Pupils' lack of interest—biggest problem
Sex
Male Female Total
Checked 40 39 79 Not checked 33 27 60
Table 242. School administration procedures—biggest problem
Sex Male Female Total
Checked 10 15 25 Not checked 63 51 114
Table 243. School board policies 1—biggest problem
Sex
Male Female Total
Checked 17 7 24
Not checked 56 59 115
Table 244. Teachers in general— biggest problem
Sex Male Female Total
Checked 7 5 12 Not checked 66 61 127

174
Table 245. Teachers' lack of Interest—biggest problem
Sex Male Female Total
Checked 17 25 42 Not checked 56 41 97
Table 246. Transportation--biggest problem
Sex
Male Female Total
Checked 2 1 3 Not checked 71 65 136
Table 247. Vandali8m--biggest problem
Sex
Male Female Total
Checked 16 10 26
Not checked 57 56 113
Table 248. No problems—biggest problem
Sex
Male Female Total
Checked 0 1 1 Not checked 73 65 138

175
Table 249. Don't know—biggest problem
Sex Male Female Total
Checked 2 0 2
Not checked 71 66 137
Table 250. Description most associated with discipline
Sex Male Female Total
Behavior 20 17 37 Respect 39 28 67
Knowledge 2 13 Obedience 10 15 25
Punishment 1 5 6
Table 251. Feeling about discipline
Sex Male Female Total
Not strict enough 43 40 83 Just about right 23 23 46
Table 252. Who should assume more responsibility for discipline being not strict enough
Sex
Male Female Total
Teachers 9 10 19 Students 1 1 2 School board 6 3 9
School administrators 18 22 40
Parents 11 9 20
Don't know 2 2 4

176
Table 253. In what way is discipline not strict enough
Sex Male Female Total
Teachers lack authority 14 11 25 Students too much freedom 12 11 23 Students no respect 9 10 19
Rules not enforced 15 12 27 Vandalism 2 0 2 Discipline--O.K. 4 4 8
Table 254. Place of most undesirable student behavior
Sex Male Female Total
Hallway 9 6 15 Informal setting 23 23 46 Formal setting 33 31 64
Table 255. Which discipline problems appear to be most serious
Sex
Male Female Total
Smoking, alcohol, drugs 15 13 28
Truancy, tardiness 27 18 45 Cheating, fighting, property damage 13 16 29
Other 15 15 30
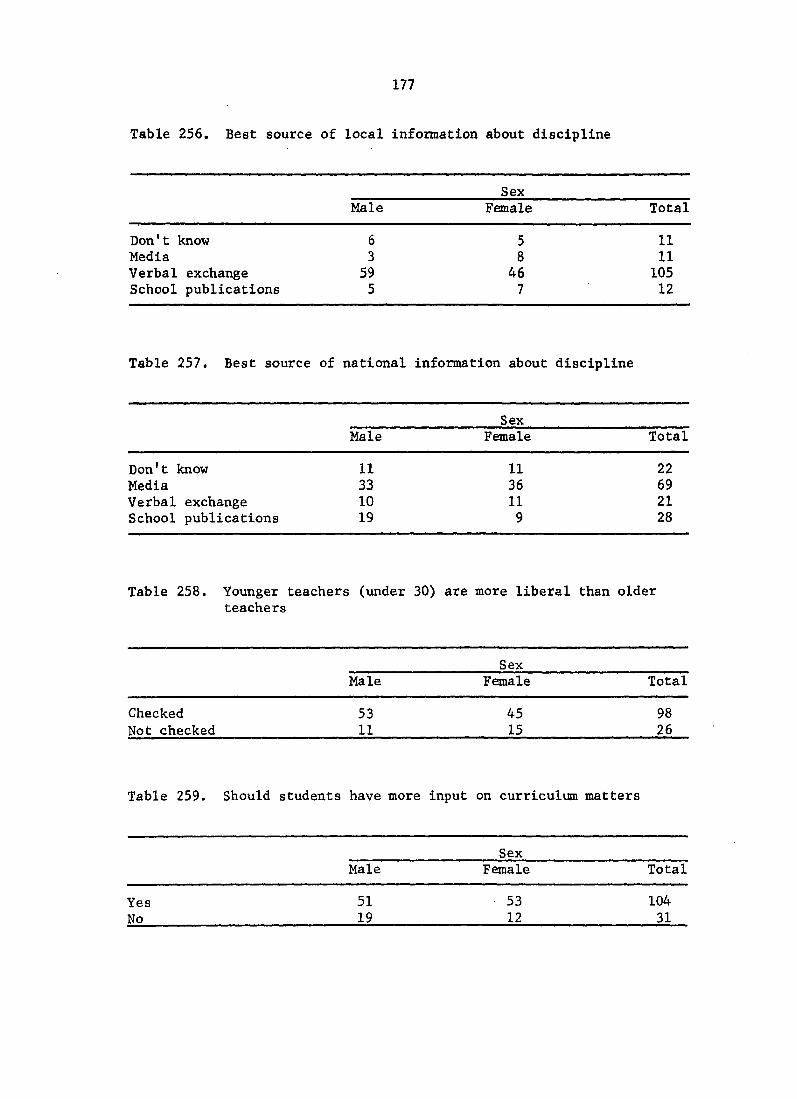
177
Table 256. Best source of local information about discipline
Sex Male Female Total
Don't know 6 5 11 Media 3 8 11 Verbal exchange 59 46 105 School publications 5 7 12
Table 257. Best source of national information about discipline
Sex Male Female Total
Don't know 11 11 22
Media 33 36 69
Verbal exchange 10 11 21 School publications 19 9 28
Table 258. Younger teachers (under 30) are more liberal than older teachers
Sex Male Female Total
Checked 53 45 98
Not checked 11 15 26
Table 259. Should s tudents have more input on curriculum matters
Sex Male Female Total
Yes
No
51
19
53
12
104
31

178
Table 260. Should students have more input on school rules
Sex
Male Female Total
Yea 57 45 102
No 14 20 34
Table 261. Poor reading achievement and increased student discipline problems
Sex
Male Female Total
Yes 48 44 92 No 14 11 25
Table 262. Rank of "reduce class size" as a suggestion to reduce stu-dent discipline problems
Sex Male Female Total
First 14 5 19 Second 4 7 11 Third 6 3 9
Fourth 8 3 11
Fifth 1 10 11

179
Table 263. Rank of "emphasize peer control" as a suggestion to reduce student discipline problems
Sex Male Female Total
First 4 1 5 Second 2 3 5 Third 2 2 4 Fourth 5 1 6
Fifth 6 6 12
Table 264. Rank of "more effective teacher selection and assignment" as a suggestion to reduce student discipline problems
Sex Male Female Total
First 9 10 19
Second 4 9 13 Third 2 7 9 Fourth 1 9 10
Fifth 5 3 8
Table 265. Rank of "parental and conmiunity involvement" as a suggestion to reduce student discipline problems
Sex Male Female Total
First 7 6 13 Second 5 1 6
Third 2 5 7 Fourth 4 3 7
Fifth 5 3 8

180
Table 266. Rank of "Improve currlcular offerings and teaching tech
niques" as a suggestion to reduce student discipline problems
Sex Male Female Total
First 8 15 23 Second 5 8 13 Third 11 8 19 Fourth 3 8 11 Fifth 5 4 9
Table 267. Rank of "improve cooperation between administration and teachers " as a suggestion to reduce student discipline problems
Sex Male Female Total
First 4 2 6 Second 3 3 6 Third 4 2 6
Fourth 7 2 9
Fifth 2 4 6
Table 268. Rank of "Improve cooperation between educators and parents" as a suggestion to reduce student discipline problems
Sex Male Female Total
First 4 4 8
Second 9 4 13
Third 4 5 9
Fourth 10 5 15
Fifth 2 6 8

181
Table 269, Rank of "special classes for troublemakers" as a suggestion
to reduce student discipline problems
Sex Male Female Total
First 3 0 3 Second 5 0 5 Third 7 6 13 Fourth 1 4 5 Fifth 4 4 8
Table 270. Rank of "institute behavior modification techniques by teachers " as a suggestion to reduce student discipline problems
Sex Male Female Total
First 2 3 5
Second 2 4 6 Third 5 2 7 Fourth 2 3 5 Fifth 3 3 6
Table 271. Rank of "enforce present rules and regulations" as a suggestion to reduce student discipline problems
Sex
Male Female Total
First 8 11 19 Second 9 6 15 Third 5 6 11 Fourth 8 4 12
Fifth 3 2 5

182
Table 272. Rank of "more pupil participation in the policy and decisionmaking process" as a suggestion to reduce student discipline problems
Sex Male Female Total
First 1 2 3 Second 5 8 13 Third 6 4 10 Fourth 4 7 11 Fifth 8 7 15
Table 273. Affect of integration on student discipline problems
Sex Male Female Total
Increased 28 25 53 Doesn't affect 22 23 45 Don't know 23 14 37
Table 274. Suspension from school as an effective disciplinary tool
Sex Male Female Total
Checked Not checked
31 40
19
47
50 87

183
Table 275. Expulsion from school as an effective disciplinary tool
Sex
Male Female Total
Checked 18 10 28 Not checked 53 57 110
Table 276. Lowering grades as an effective disciplinary tool
Sex Male Female Total
Checked 12 10 22 Not checked 59 57 116
Table 277. Exclusion from extracurricular privileges as an effective disciplinary tool
Sex
Male Female Total
Checked 26 35 61 Not checked 45 32 77
Table 278. Detention as an effective disciplinary tool
Sex
Male Female Total
Checked 24 18 42 Not checked 47 49 96

184
Table 279. Parent conferences as an effective disciplinary tool
Sex Male Female Total
Checked 31 27 58 Not checked 40 40 80
Table 280. Parent-student-teacher conferences as an effective disci-plinary tool
Sex Male Female Total
Checked 57 51 108
Not checked 14 16 30
Table 281. Corporal punishment as an effective disciplinary tool
Sex Male Female Total
Checked 15 7 22
Not checked 56 60 116
Table 282. Utilization of behavior modification techniques as an effective disciplinary tool
Sex Male Female Total
Checked 16 24 40
Not checked 55 43 98

185
Table 283. Stricter rules and regulations as an effective disciplinary tool
Sex Male Female Total
Checked 20 20 40 Not checked 51 47 98
Table 284. Student-teacher conferences as an effective disciplinary tool
Sex Male Female Total
Checked
Not checked
30 40
27 40
57 80

186
APPENDIX G: VOLUNTARY COMMENTS BY SURVEY RESPONDENTS ABOUT SCHOOL DISCIPLINE
Educators
Administrator Male White North
It becomes increasingly evident that the home problems contribute
a great deal, in fact increasingly so, (sic) that heme background can
many times predict student discipline problems in one way or another.
Counselor Female White West
Young society is lacking in self-control, self-restraint, and self-
goal setting. These may once have been taught by family. Whether the
job belongs to school or not now is irrelevant because we know we can't
control 16 year olds with the self-restraint of a four year old. This
being the case it behooves us to take on the job to make the business
of getting on with education easier. Teaching self-discipline, caring
about the outcome of each of our students as a unique & special person
will help the student while developing a group of young people that care
about each other & the teacher & his interests.
A school district should teach its students the nature of civil
life by using the school code to set the pace for the body of laws to be
faced on the outside. Consistency & fairness will be the most effective
means of making it work. Taking a cigarette away from one smoker,
suspending the next & ignoring the third on your patrol around campus
is not consistent or fair & the students will be the first to let you
know in the uncomfortable way possible. Let the Civics classes

187
teach them how to press for change in the school code as any other law
through their representative and letters.
Strictness should be defined in this questionnaire. Is it the poker
face, the physically threatening teacher, the consistent teacher, the
one who takes care of her own classroom business, the one who sends
everyone to the dean or are you referring to their results no matter how
they got them (I'll give anyone an A so long as he doesn't cause trouble
all year).
Teacher Female White West
I feel students are not made to accept the consequences of their
misbehavior. Nor are parent (sic) held responsible for the behavior or
misbehavior of their children. In these cases, I feel the responsibil
ity or consequences of misbehavior should be forced upon those who refuse
to accept it. By this, I mean that when rules are broken privileges
should be taken away or withheld and restraints impose (sic) until
acceptable behavior results.
Teacher Male White North
I feel a large majority of discipline problems stem from the lack
of parental concern, and failure to fulfill committments (sic).
Teacher Male White North
As I reach this point, I realize that I am interpreting these ques
tions in the light of problems other than discipline. Frankly I don't

188
have discipline problems. While I have students with problems, I do not
have problem children, and I don't recall any for twenty-five years.
Teacher Male White North
I appreciate the opportunity to respond to your questionnaire. The
key to good student behavior is to get dedicated, involved teachers who
can provide positive reinforcement. Add a relevant curriculum and you
will have a well-functioning educational environment.
Teacher Male White South
Without a doubt, students (ALL) should be guaranteed that their
rights will be protected.
However, it seems that there are too many instances where the schools
and the law forget that this also applies to the right of the coopera
tive students to be guaranteed an environment conducive to good learning.
In many cases, the good students are being sacrificed in order to
"protect" disciplinary werewolves.
Parents
Parent Male Non-White West
1. when students privileges are decrease (sic) - Discipline
increases.
2. slow or poor readers causes discipline problems to increase.
3. when there is no father in the home causes discipline to increase.

189
4. when there is no person in school for the student to look-up
to - "same ethnic background" - discipline increase (sic).
Parent Female White East
1. When a student is misbehaving, it is Important that parents be
notified.
2. Rules that have been made must be adhered to. All too often
we find that the rules are ignored or bent making student
believe that the rules mean nothing.
Parent Female White North
I believe we must each children and teachers to do away with the
Double (sic) standards they use with out realizing it. Ex. By this I
mean a student watching another student taking drugs and considering its
his problem not mine. Eventually its all our problems (sic).
Parent Female White North
We are in a school district in which most parents are positively con
cerned about their children and their education. This climate carries
over to the students. I strongly believe that parents' positive feelings
toward their children and a positive attitude about education carries
over into school discipline. I have seen children change when parents'
work and/or social activities become so hectic that time and attention
to their children become minimal. Parental attitudes toward the value
of education influence how children act in school.

190
Parent Female White North
Classroom discipline depends on the individual teacher. Some
teachers have good control over their students and others none at all.
I think a school system that is allowed to fire teachers that are proven
to be bad teachers even if they have tenure will have fewer discipline
problems. If enough parents complain about a teacher, he or she should
be brought before the administrators and his teaching techniques ex
amined.
Parent Male North
An old principal once said wisely to incoming sophomores, "Welcome,
you are free to do as you wish in this high school, but in doing so,
always be prepared to pay the consequences."
Parent Male North
I realize that this questionnaire deals only with student behavior
in high schools so I would like to add this comment to my answers:
Respect for authority whether it be teachers or parents is something
that must be ptarted and instilled in the student at heme even before
the child starts school.
Students
Student Male White North
I believe that a student raised in a good atmosphere at home.

191
directly corresponds to his behavior and educational achievements.
Student Male White South
The racial problem in my school is increasing every day. I don't
think that schools should be intergerated (sic) but I do believe in
compulsory education, which Miss, does not have.
Congressmen and all of the other people that brought about school
intergration (sic) don't know how bad things are because they can afford
to send their kids to private schools. . . .
Student Male White East
Present regulations must be enforced openly & equitable (sic). If
an offense against regulations is committed and no or little action is
taken, the rule is worth nothing. Discipline problems must be dealt with
openly, not "whitewashed" by those anxious to present a better image of
their school.
Student Male White West
As long as there is a fear of being beaten or possibly killed by
other students, students who want to leam are not going to go to school
unless protected. This may not be so in some communities but it was so
in mine. If you could get gangs out of school and get the courts to hand
out stricter punishments to juvinile (sic) offenders, schools will have
more students attending.

192
Student Female White North
Teachers have the say of what goes on in the classroom. I have
come in contact with teachers that can't teach - and ones that are ex
tremely obnoxious and even vulgar. This kinds (sic) of authority
figures should not be acting in such mannerism.
Student Female Black South
I feel that if students are not threaten (sic) by teachers and ad
ministers (sic) the students would not be as apt to engaged (sic) in
things that would have to have discipline measures taken against. Often,
it is because of these threats that student (sic) try things to see if
they will do would teachers say they would do.