University Microfilms - ScholarSpace
196
INFORMATION TO USERS This dissertation was produced from a microfilm copy of the original document. While the most advanced technological means to photograph and reproduce this document have been used, the quality is heavily dependent upon the quality of the original submitted. The following explanation of techniques is provided to help you understand markings or patterns which may appear on this reproduction. 1. The sign or "target" for pages apparently lacking from the document photographed is "Missing Page(s)". If it was possible to obtain the missing pagels) or section, they are spliced into the film along with adjacent pages. This may have necessitated cutting thru an image and dupllgating adjacent pages to insure you complete continuity. 2. When an image on the film is obliterated with a large round black mark, it is an indication that the photographer suspected that the copy may have moved during exposure and thus cause a blurred image. You will find a good image of the page in the adjacent frame. 3. When a map, drawing or chart, etc., was part of the material being photographed the photographer followed a definite method in "sectioning" the material. It is customary'to begin photoing at the upper left hand corner of a large sheet and to continue photoing from left to right in equal sections with a small overlap. If necessary, sectioning is continued again - beginning below the first row and continuing on 'until complete. 4. The majority of users indicate that the textual content is of greatest value, however, a somewhat higher quality reproduction could be made from "photographs" if essential to the understanding of the dissertation. Silver prints of "photographs" may be ordered at additional charge by writing the Order Department, giving the catalog number, title, author and specific pages you wish reproduced. University Microfilms 300 North Zeeb Road Ann Arbor, Michigan 48106 A Xerox Education Company
-
Upload
khangminh22 -
Category
Documents
-
view
4 -
download
0
Transcript of University Microfilms - ScholarSpace

INFORMATION TO USERS
This dissertation was produced from a microfilm copy of the original document.While the most advanced technological means to photograph and reproduce thisdocument have been used, the quality is heavily dependent upon the quality ofthe original submitted.
The following explanation of techniques is provided to help you understandmarkings or patterns which may appear on this reproduction.
1. The sign or "target" for pages apparently lacking from the documentphotographed is "Missing Page(s)". If it was possible to obtain themissing pagels) or section, they are spliced into the film along withadjacent pages. This may have necessitated cutting thru an image anddupllgating adjacent pages to insure you complete continuity.
2. When an image on the film is obliterated with a large round blackmark, it is an indication that the photographer suspected that thecopy may have moved during exposure and thus cause a blurredimage. You will find a good image of the page in the adjacent frame.
3. When a map, drawing or chart, etc., was part of the material beingphotographed the photographer followed a definite method in"sectioning" the material. It is customary'to begin photoing at theupper left hand corner of a large sheet and to continue photoing fromleft to right in equal sections with a small overlap. If necessary,sectioning is continued again - beginning below the first row andcontinuing on 'until complete.
4. The majority of users indicate that the textual content is of greatestvalue, however, a somewhat higher quality reproduction could bemade from "photographs" if essential to the understanding of thedissertation. Silver prints of "photographs" may be ordered atadditional charge by writing the Order Department, giving the catalognumber, title, author and specific pages you wish reproduced.
University Microfilms300 North Zeeb RoadAnn Arbor, Michigan 48106
A Xerox Education Company

I.·.•··,~I
tJ',~.
tt!t"
I1\:
'73-15,944
LANGFORD, .Stephen: Arthur, 1940..STATISTICAL METHOD IN OPTICAL CRYSTALLOGRAPHY:TECHNIQUE AND APPLICATION TO. ROCK FORMING ~fINERALS.
University of Hawaii, Ph.D., 1972Geo1.ogy
University Microfilms, A XEROX Company, Ann Arbor, Michigan..
~, ... -"..",-~. ~
1HIS DISSERI'ATION HAS BEEN MICROFLIMED EXACTLY AS RECEIVED

STATIS~ICA~ METHOD IN OPTICAL CRYSTALLOGRAPHY:TECHNIQUE AND APPLICA110N TO ROCK EO~MING MINEiALS
A »ISS~RTAII0N SUBMITT£D 10 TaB G~A»UATE DIVISION OF THEUNIVEHSITY OF HAWAII IN PARTIAL FULFILLMENT
OF THE REQUIREMENIS FOR THE DEGREB OE
DOCTO. OE PHILOSOPHYIN
GEOLOGY AND GEOPHYSICS
DECEMBER 1972
Stepbeo A. LaoMtord
Doctoral Comm~ttee:
Gordon A. Macdonald, ChairmanA~4tio T. AbbottJaaes E. AndrewsRuc~ne H. Jobnaoo
Ralph M. MoberlyAoa~ A. PanxlwskYJ

PLEASE NOTE:
Some pages may have
indistinct print.
Filmed as received.
University Microfilms, A Xerox Education Company

This wurk provides
AIlS7RACT
a new rapid way to determine mean
princip41 re£rac~ive indices o£ minerals. Crushed mineral
Mraina yieLd immersion data wbich are trea~ed in a way new ~o
opticaL crystalloMraphy.
The mineral families so treated yield mean re1rac~ive
indices and ~he s~andard deviation o~ the refractive index
probability .function .for each sample. Raw data are provided
by the percent of ranqomly encountered mineral ~r4ins which
dispLay indices less than, equal to, and greater than each 01
several di1:ferent iamersion medium re1ractive indices. The
mean re1rac&ive indices :from randumly encountered erains are
plotted a~Ginst the mean indices for ~rains of the same sample
popuLation oriented in cbosen principaL opticaL directions.
stu.tistica are treated ~rapbically wIth probabiLity paper
or with electronic computex programmed to simulate normal
probability paper.
oliviues, au~itic cLinopyroxenes,
and ortbopyroxenes are treated. A third degree equation is
to J.~ data points for pla~iocLases. The other mineral
10milies yield s~raiaht line equations. However the data for
oLivines and pyroxenes are considered preliminary, being based
on :fewer data points tnan were obtained :for p14gioclases, and
only Linear .fits were com~leted.

A tempera~ure-controLLed modi~1ed JelLey re~rac~ome~er cap
abLe o~ measuring oiL re1ructive indices to accuracies o~
0.001 and precisions 01 0.0002 1s coupLed to and caLibrated
with a temperature-controlled microscope staae.
The cos~s in time and money o£ this methou are Less than
~or conventionaL optical methods. The portahility o£ the
Bys~em make it applicabLe to use in the 1ield or aboard ships.
The precision and £lexibility o£ the system permit the
empirical dra1tin~ o~ density 1unctions 10r specimens which do
not dispLay a Gaussian dist~ibution o£ indices.
A 1eaa1bility study is made 01 the appLicahiLi~y o£ the
technique to derivation 01 ~ock modes.

CONIENT~
•
•
•
•
11557789
11
•
•
•
••
•
•
•
•
•
••
•
INTRODUCTION ••••••••••• ~ • • • • • • • • •PURPOSE • • • • • • • • • • • • • • • • • • • • • • •BACKGROUND OF OPTiCAL MINERALOGY ••••••• •••
RELATION OF REF~CT1VE INDiCES TO COMPOSITION •••P~VI0US OIL IMMERSIO~ ~ORK ••••••••••••Becxe Line and oblique ~llumin~tion methods. • ••EEEEeTS OF PHASE ~EGION ON INDICES AND BIREFRINGtiNCETsuboi's dispers~on method•••••••••••••
STATlSTlC~ IN OPTICAL PE~~OGRAPHY • • • • • • • •••
• 13• 13• 14• 15• 16• 18• 18• 20• 21• 21• 21• 24• 26• 31• 33• 33• 35• 37• 37• 38• 39• 40• 40• 43• 46• 46• 48• 50• 50• 51
MATERIALS AND METHODS • • • • • • • • • • • • • • • • •MATERiALS • • • • • • • • • • • • • • • • • • • • • •CHOICE OF MiNERAL AND ROCK TYPES APPROPRIATE TO THISSTUDY. • ••••••••••••••••••••••~INERALS ••• • • • • • • • • • • • • • • • • • •Pl~gloclases. • • • • • • • • • • • • • • • • •••Ollvlnea. • • • • • • • • • • • • • • • • • • • • •Augl~ic clinopyroxenes•••••••••••••••Or~horhombic pyroxenes•••••••••••••••Gamma-prime taXen as POD. • • • • • • • • • • • • •ROC~S • • • • • • • • • • • • • • • • • • • • • • •
~lNERAL AND BOCK SAMPLES STUDIED ••••••••••MINERALS •••••••••••••••••••••Pla~ioclases. • • • • • • • • • • • • • • • • • • •OLivines. • ••••••••••••••••••••A~itic clinopyroxenes•••••••••••••••Ortbopyroxenes. • • • • • • • • • • • • • • • • • •ROCKS • • • • • • • • • • • • • • • • • • • • • • •SampLe 363-69. ••••••••••••••••••Maui rocks. • • • • • • • • • • • • • • • • • • • •
~ET~ODS • • • • • • • • • • • • • • • • • • • • • • •SEARCH rOB ACCURACY AND PRECISION • • • • • • • • •£LoMENTS OF THIS METHOD • • • • • • • • • • • • • •D4ta description. • • • • • • • • • • • • • • •••The statistics. • • • • • • • • • • • • • • • • • •G4ussian dlstribut~ons. • • • • • • • • • • • • • •Gaussian probability paper Mraphlcs. • ••••••USE OF CO~PUTERS IN TH1S WORK • • • • • • • • • • •Use o~ IHM 360. • • • • • • • • • • • • • • • • • •Use of Nova 1200. • • • • • • • • • • • • • • • • •SAMPLE PRSPARATiCN •••••••••••• • • • •Mineral sa.p~es. •••••••••••••••••Rock samples. • • • • • • • • • • • • • • • • • • •
••
••••••••••••••••••••••••••••••
••
1313

Possib~Li.y o~ modes 1rom immersion data•••••••Treatment ox broad phase regions in crushed rock•••CaOiC!i UP IJiUiBRSJ.ON MEDiA • • • • • • • • • • • • • •COUNTiNG INDICES IN SEGREGATED MINERAL GRAINS • • • •COUNTING INDICES IN UNSEGREGATED GRAINS OF CRUSHED~OCK •• • • • • • • • • • • • • • • • • • • • • • •~UWEROUS INDEX COUNTS OVER A BROAD PHASE REGION • • •
• 52• 55• 56• 58
• 00• 60
.117
.119
.119
.121• 123• 124
RESULTS, DiSCUSSION AND CCNCLUSION •••••••••••• 61RESULTS • _ • • • • • _ • • • • • _ • • • • • • • • • • • 61
STATEMENT OF PREClSIO~ AND ACCURACY • • • • • • • • • • 61Temperature precision. ••••••• _ ••• _ _ • • • 61Repeatability 01 i.wersion medium calibrations••••• 61~ineral index meusurement precision and accuracy. • • • 62WiN ERAL RESULTS • • _ • • • • • • • • • • • • • • • • • 65Pla~ioclase result~. ••••••••••••••••• 65Olivine results. ••••••••••••••••••• 77Augitic clinopyro~ene results_ •••••••••••• 80Orthopyroxene results. •••••••••••••••• 84ROCK ~BSULTS •••• • • • • • _ • • _ • • • • • • • • 89
DI SCUSSION •••• _ • • • • • • • • • • • • • • • • • • 96COMPARISON OF PRESENT HESULTS TO THOSE OF OTHEiiS ••• 96Pla"ioclases ••••••••••••••••••••• 97Discussion o~ Table 22. • • • • • • • • • • • • • • • • 98DIscussion o~ Table 23•••••••••••••••••100OLIvines•••••••••••••••••••••••• 100
I
Discussion 01 Table 24•••••••••••••••••102Au"itic clinopyroxenes••••••••••••••••• 102Discussion 01 Table 25•••••••••••••••••103Ortbopyru~enes•••••••••••••••••••••104Discussion o~ Table 26••••••••••••••••• 105~EASIBJ.LIT~ OF WODES ERCM IMMERSION DATA •••••••107DENSITY FUNCTION OF CCNCENTRATED FELSICS •••••••109REV~EW OF ACCURACY OF TBIS WORK ••••••••••••110SOURCES OF ERROR •• • • • • • • • • • • • • • • • • .112LIMITATIONS OF THIS TECHNIQUE •••••••••••••116RBVIEW OF GRAPHICA~ ME7UODS ••••••••••••••117Cons~ructiun o~ curves relatina DMEANBP to PODindices. ••••••••••••••••••••••
CONCLUSION ••••••••••••••••••••••EASE AND SPEBD UP ~ETHOD ••• • • • • • • • • • • •SUGGESTIO~S FOR FUTURE lORK •••••••••••••Recommended cban~es in procedure. • • • • • • • • • •SUMMARY OF CONCLUSIONS •••••• • • • • • • • • •
AC~NOWL~DG~BNTS ••••••••••••••••••••••127
LITBllATUJiU~ C! TED • • • • •••••••••••••••••131

APPENDIX A • • • • • • • • • • • • • • • • • • • • • • •METHODS OF REFRACT~VE I~DEX CONTROL • • • • • • • • • •
DOUBLE VA~IATI0N DEPENDENCY OF INDICES •••••••~EVIEW OF LiTERATURE PER7INENT TO FELDSPAR iNDICES ••
Me~bod o~ ~icbel-Levy. •••••••• • ••••••Otbe~ ~eldspa~ work. ••••••••••••••••INDICES OF OTHER ~l~E'ALS • • • • • • • • • • • • • •OTHE~ ~ELATED WORK • • • • • • • • • • • • • • • • •
APPENDIX B • • • • • • • • • • • • • • • • • • • • • ••DBSCRIPTIO~ OF PETROGRAPHIC LABORATORY •••• ••••
ELECT~ONICS • • • • • • • • • • • • • • • • • • • • •St4Me te.pe~ature cont~ols••••••••••••••Re£racto~eter.prism temperature con~rols•••••••Room temperature. • • • • • • • • • • • • • • ••••An improved lar~er Jelley re£ractometer. • •••••Re1~acto.eter components and costs. • • • • • • • • •ReLr~ctometer optics. • • • • • • • • • • • • • • • •
CONSTRUCTIO~ OF ~EFRACTC~~7ER AND INTEGRATION WITHSTAUE. ••••••••••••••• • • • • • • • • •
MOUNTING OF THERMiSTOR eN STAGB SLIDE • • • • • • • •MOUNTING OF THEBMISTOJiS ON BBF.1lAC'rOMETER PRIS~ SLIDECONSTRUCTIO~ OF BIG REFRACTO~TER ••••••••••SYSTEM CALIBRATIONS • • • • • • • • • • • • • • • • •The~mlstor caLlb~ations. ••••• • • • • • • • • •lnte~ratlon and caLibration o~ stage-re1ractometersystem. • • • • • • • • • • • • • • • • • • • ••••
APPENDIX C • • • • • • • • • • • • • • • • • ••••••USE OF PETROGRAPHIC LABCRATORY ••••• • • • • • • •
USE OF ELECTRONiCS • • • • • • • • • • • • • • • • •St4~e ~empe~atures. • • • • • • • • • • • • • • • ••Prism temperatures. • • • • • • • • • • • • • • • • •
CALlll~ATIOH OF IMME~S10N ~EDIA ••• • • • • • • • • •USE OF RE~RACTOMETER ••••••••••••••••Introduction o£ oIL ~o prism•••••••••••••Readlna tbe bi~ sC41e. ••••••••• ••••••CARE OF CALIBRATED OILS • • • • • • • • • • • • • • •DETAILED SUGGESTIO~S FOa COUNTING INDICES • • • • • •Sea~e~~~ed wineral pbase ~e~ion Index counts. • • • •RAndomly encount~red lndices. • • • • • • • • • • • •lndices 01 known POD's••••••••••••••••O~he~ coun~lu~ conside~Gtiona. ••••••••• ••
.139
.139
.139• 143• 146.150.152.153
• 155• 155• 155• 156• 157.157.157• 157.158
.164• 164.165.166• 169• 169
.169
• 174• 174.175• 175• 176.177.177.177• 177.179• 181.181.181• 183• 184

• 70• 77• 78
• 31• 32• 36• 66• 69
TABLES
Table 1. Published p~a~ioclase data o~ otber work. •• 22Tabl~ 2. O~ivine sample sources and source ~orsterite
es~ima~es 1rom microprobe data••••••••••••• 24Table 3. Olivine chemical data o~ o~her work•••••• 25Tabl~ 4. AUMi~ic clinopyroxene sample sources andsourc~s' reported indices. •••••••••••••• 28Table 5. AUKitic cLinopyroxene chemistries (.ei&h~
percen~s). • ••••••••••••••••••••• 29Table b. Orthopyroxene sample sources And sources'~eported re~ractive indices. ••••••••••••Table 7. Orthopyroxene chemistries (weight percents).Table 8. Maui pbanerite ChemIstries. • •••••••Table 9. Plagioclase aicroprobe analyses•••••••TaDle 10. Pla~ioclase Indices ~rom this work•••••Table 11. Analysis o~ variance for 3 degreepolynomial ~it to plaMioclase index data. • • • • ••• 73Table 12. Pla~ioclase 2VZ's measured in ~his work. •• 75Table 13. Pla~loc~4se anorthite percents estima~ed
£rom sample's mean beta index. • ••••••••••Table 14. Olivine indices ~rom this work•••••••Table 15. OlIvine 2VZ's measured in thIs work. • ••Table 10. Forsterite es~imates £rom mean beta indiceso£ "thio work. .• • • • • • • • • • • • • • • • • • • • • 79Table 17. Aual"tlc clinopyroxene re£ractive indices£rom this work. • • • • • • • • • • • • • • • • • • • • 80Table 1~. Au~itic clinopyroxene ~VZ's meusured inthis work. •••••••••••••••••••••• 82Table 1~. Orthopyroxene indices from this work. • • • • 84Table 20. Statistics o~ strai"bt line equations £It~o olivine, cpx, ~nd opoX data. •••••••••••• 86Table ~1. Raw da~a used in Fi~ures 3, 7, 8, and 9A••• 92Table 22. Estima~es 01 anorthite contents inpla"iocLases (percents). • •••••••••••••• ~7
Table 23. Comparison o~ An ran3e ~ro. microprobe toDSDB o~ this work. •••••••••••••••••• 99Table 24. Comparison of ~orsterite estimates inolivines••••••••••••••••••••••••101TabLe 25. Comparison of DMBANB indices to reported orestimated indices of o~her workers £or au"i~ic clinopyroxenes•••••••••••••••••••••103Table 26. Comparison o~ DMEANGP and reported orea~imated indices fro. work of others fororthopyroxenes•••••••••••••••••••••105
'.

EIGURES
• 86
• 41• 42• 44
• 89• 90• 94
• 94.156• 159.162
• 5372
Figure 1. ~ormaL probability density 1unction. • ••••Fiaure 2. Cumulative norlllal distribution :function. •••Fi~ure 3. Gaussian probability paper plot. • ••••••Fi4ll;ure 4. Theoretical model. relatin& total rock cumulative :frequency distribution to modaL percents. • •••Figure 5. D~EANB as a ~unction 01 U~EANBP in plagioclases.Figure 6. POV indices as 8 1unction o£ D~EANBP inolivines, augites, and ortbopyroxenes. ....... ••••Figure 7. Cumulative :frequency distribution 01 minerals inthe re1ractive index ran"e 01 :feldspars :for 9 rocks. ••Fi"ure 8. Empirically dra.n density :function. • • • • ••Fi"ure 9A. Cumulative normal curve :for ~63-69. • ••••Flaure 9H. Accumulated cumulative curves :for all DMEANHPindices treated in Table 10. ••••••• • • • • • • •Figure al. Temperature cont~ol circuitry•••••••••Fi~ure B2. Bi~ Jelley optics. •••••••••••• •Fi"ure B3. Prism optics. • •••••••••••••••

l~TBODUCTION
PURPOSE
The ~irs~ purpose o~ tbis work is ~o create a new op~ic4L
mineral iden~i1ication technique wbich is appLicahLe to ho~h
oriented and randomly encountered mineraL grains. The second
purpose ~s to crea~e £or various minerals determinative curves
.relatinM randomLy encoun~ered to known principle op~ic direc-
tion (POD; see Bloss, 1961) indices.
Few previous workers have empbas~zed the range 01 indices
encountered in imaersed Mrains o~ a soLid soLu~ion dispLayina
whether the pb~se re~ion be na~uraL or
arti1iciaL, ~so~ropic or aniso~ropic, oriented or unorien~ed.1
This work WAS prompted by examination 01 coarse-grained
rocks 1rom severaL Maui, bosses. The pL4&iocLase
1eldspars 01 these rocks ran&e 1rom abou~ An25 ~o abou~ An7S.
When crushed arains o~ these 1eLdspars are rando.Ly sca~-
~ered on a sLide and are randomly encountered in oiLs chosen
somewhere near ~he apparent meAn index 01 ~be sampLe popula-
~ion viewed as a WhoLe, there is a no~iceabLe di11erence
11 know 01 no previous s~atistlcaL petro~raphic approAchaimed speci~lcalLy at makinM quantita~lve statemen~s abou~ ~he
composi~lonaL density 1unc~ion 01 a mineral phase reaion inany rock. Nobody seems to have attempted emplr~caL de1inl~ion01 the densi~y 1unc~ion 01 composition throu"h de11ni~10n 01re1ractlve indices.
INTRODUCTION 1

in ~he number 01 ~rAins above or beLow v~rious oil indices so
chosen. The aerm of oriaiDa~i~y here arose in the quanti£lca-
tion of "rains less ~baD (L), equal to (E), and greater than
(G), each of several chosen oil indices with ~he aim of
seeking the mean index of ~he phase re~ioD.2 Applica~ion and
development ot descrlp~ive statistics fo~lowed successful
quantlfica~ion of L, S, and G.
The phase rea ion may include more than one mineral species,
and the nomenclature is complicated. (See Berry and Mason,
lB59, p. 271-5.) A phase re&ion is here considered to be
encoapassed by tbe concept of a mineral name in the more
aenera1 sense. Tbus, foz presen~ purposes, plagioclase,
olivine, and -orthopyroxene are four
different phase re~ions.
A refractive index encountered at a random ata~e se~ting in
a grain scGt~ered at randem and immersed in oi~ on ~he sta&e
is here defined as beta-prime (HP). The IDean (DMEAN) of some
number of beta-primes for the same mineral phase region in a
specimen is called bere DMEANllP. DMEANBP is here related to
~he mean be~a (DMEANBJ for plaaioclase, olivine, and Augitic
clinopyroxene;
or~hopyroxenes.
-------------
to the lIlean .,amma-prime ( DMEANGP) for
2The present wor-": incorpora~es the use1ul d.istinction ofDarken a.nd. Gurry (1953, p. 290) between "phase" and uphasere"lon."
INTRODUCTION 2

The presen~ work explores ~he rela~ionship be~ween DMBANBP
and means o~ indices measured in known POD's.
Rocks are usually com»osed of only a £e. principa~ phase
re"ions, each o~ which varies composi~ionalLy. In specimens
containing a mineral species con~ined to a narrow phase
reaion, data 1rom one or a jew grains reasonably represent the
entire phase reaion. However, it ~he mineral ranges over a
rather broad phase re~ion, sinMle-grain me~hods (e.~. Wilcox,
1959) may well 1ail ~o de1ine the mean composition o£ the
phase reaion. O~her grains 1rom ~he same phase region 01 the
same rock chip may be quite di£1erent.
The problem of gaininM insight with respect to the to~al
rock body under s~udy is compounded by the variability
commonly eviden~ even meaascopicalLy in the Lield within the
same ou~crop.3
The present metbod seeks to i~nore weatberin~ and ~o
isolate ~resh minerals with the hope ~hat they are su£ficlent-
ly represen~a~ive 01 ~he oriainal unweatbered rock.
This method is aimed a~ the elimination of ~edium and a~
~he aeneration of a more complete quantitative description of
the rock Dody as a Whole than is now avai~able by other
inexpensive me~hods. B~oad compositional variations are
----~--------~~--3Xoch and Link (1970, p.255-335) discuss the problems
invo~ved in sampling a ~ock body ~o ob~aln statis~ically
significant in1or.a~ion on the entire body.
INTJItODUCTION 3

emphasiz.~d. Hapid mineral de~ermlnatious by this "technique
shouLd en~ble workel'a to muk~ a hi~hly accurate sta"tls"tical
treatment o~ lar~~ rock .oodles.
This metnod provides a way to estimate quickly the probabi
lity density £unction (~~ird, 1~6~' o£ refractive indices 101'
any phase r~~ion in a rock. DMEANdP oL A phase region and the
standard deviation o~ the re£rac"tive index densi~y func~ion
101' many rock specimens may be compared "raphically or
mathewa. t ieal ly. By extension of this principle, comparisons
of parameters are possible amon~ specimens from di1Keren"t
JJosses, bd.tholi~bS, aur~oles, or Whatever seems appropr.i.a"te "to
the investi~a"tor.
The results are presented as mathematical formulas and as
~raphs to be o£ use to workers with or without computers.
PLa~iocLase feldspars receive eaphasise Olivines, or"tho-
and d.ugitic c~lnopyroxenes receive preliminarypyroJ'enes,
treatmen t.
A fea.sibility stUdy 01 obtainin~ rock modes 1rom this
method is undertaken.
unRODUCTION 4

BACA.uROUNU OF OPTICAl.. MINERALOGY
Hhl..ATION Or k~FRACTIVE I~DICES TO CO~POSITION.
The important relation of re£r~ctlve index to composition
amon~ many minerals is well known.
optiCAL work is the ability to extract the mine~al ~rom a
mixture o£ minerals by visuaL inspection. No sin~le technique
c£A.n extr~ct ~LL possible In£ormation 1rom a rock.
re~ractive indices provide inexpensive results when compared
to other methods yieLdinM compositional estimates. Appendix A
contains a discussion oL immersion medium re~ractlve Index
controls and a discussion o~ related methods 01 identi~ication
01: pLa"ioc'l.a.ses.
routine work. does not warrant the expense o£ chemical
analysis, X-ray, microprobe, or atomic absorp~ion methods.
Also, chemical analyses are to be Viewed with caution in ll~ht
0:£ -the conclusions dra.wn .b~ Fa.irba.irn U AJ.. (1951), Flana.~an
(196~). and ~tevens ~ AJ.. ( 19(0).
There are otber workers who u~ree that optical methods have
not been outdated by the Dore expensive modern analytical
"tecbniQues: .....microprobe a.nd/or optic data are considered
to be a better measure o~ the pla.gioclase composition (than
UPor comparative studies o~ plagioclases
ChemIcal analyses]"
(lSoii, p. lOb) sa.ys:
378 ). Morse
:from a sin~le environment or ~enetic history, It is even
INTRODUCTION 5

probable ~hat compositional variation can be determined with
~reater precision by the dispersion method than by any
anaLytical means, possibly excepting the electron microprobe,
which gives comparable results and statistics." Since the
statistics o£ thia work are comparable
statement is Mermane.
to Morse's, his
Friedman (1860, p. 74) 1inds that "£or rocks in which the
composition o£ the individual minerals can be obtained by
optical measurements, the .aJor constituents can be determined
with the petroaraphic microscope and the results can be
considered reLiable £or most purposes. Petrologists should
there£ore make more chemical analyses with the aid o£ the
microsc ope."
Cdore.fuL determination 01 re1ractiv8 indices seems the most
expedient and perhaps the most accurate way to estimate
composition 10r most o£ the maJor, couullon rock £orming
minera.Ls. Success£ul eatablishment 01 the relationship o£
.DJUiANBP to the mean index 01 a known POD £or the same sampLe
population £orms the Logical link between mean random indices
and known compositions when composition is reasonably esti
18ated b~ index.
INTIlODUCTION 6

PREVIOUS OIL IMMERSION WORK.
The ~raditionaL, And currentLy ~he usual, approach to
Some ofoptical mineraLo&y is well presen~ed by Bloss (1961).
his notation is adop~ed here.
Becke Line And ObLique 'llyginatLRD-m~~.
Toe reL4~ionships 01 principal refractive indIces to
indices 01 i.mersion media are es~ablished by the use of the
Heeke Line or the oblique illumination method (BLoss. 1861).
transmi~ted, .hi~e, pLane-poLarized light wi~h
reduced diaphraam under low and medium powers produces colored
Becke lines zor "rains dispLayin" indices close to that of the
immersion medium (BLoss, 1961; Emmons and Gates, 1948). Use
01 a wonochroma~ic Liah~ source eliminates the colored Becke
Lines and narrows ~be zone 01 apparent match.
iNTRODUCTION 7

EFEB~TS OF PHASE REGION O~ ~NDICES AND BIREFRINGENCE.
When grains in a sample are comprised o£ a sinale pbase and
do no~ r~nge ~ppr~ciably over a pb~se region o£ a solid
aoLu~ion, compari~ona ~rom gr~in to ~rain o£ a given POD's
Index yieLd essentiaLly Identic~L resuLts, and there Is no
need £or the present method. Quartz provides the bes~ natural
example o~ such ~n occurrence (~houah even quartz displays
sllgbt v~riability o£ ome~a In the per£ec~Ly cLe~r sampLe used
in this work to c~lihrate the re£ractive index scale).
However, must mineraLs commonLy dispLay soLid solutions over
some ran~e o~ composition and there~ore of indices.
mineraLs a&ainst ~he
L~rsen ~nd Berman (1964, p. 20) s~y:
and hi~hest indices o~ refraction of•••
"To tes~ the lowest
embedding media a grain should be chosen that appears to show
s~rong birefringence, both ~he thickness of the araln and ~he
Interference color being ~a~en into account. The grain should
be turned ~o extinction (or the lower nicol ShouLd be revolved
900) and tested a&ain. This procedure shouLd be repeated on a
number of ~rains, and wi~h a Lit~le prac~ice, unless ~he
bire£rin~ence is extreme, many o~ thea will show the lowes~
index of refraction, equaL to [aLpha], or the bighes~ index
equal to (~am.a], within the limits of error o~ the immersion
method." 1 consider this advice faulty.
Bire1riQ&ence is usualLy about the same from grain to ~rain
INTRODUCTION 8

~or grains of the ~~.e phase resion in ~he same hand specimen.
Bu~ it ~s my experience tha~ re~ractive indices vary ~rom
arain to ~rain in powders ~rom a sin~le hand specimen. So the
smalles~ uLpha £ound sUb~racted £rom the greatest gamma ~ound
is no* ~be bire~rinaence for a arain, but might be called the
bire1~ingence o~
concept.
the phase re~~on, a distinctly d.i~~erent
Tsuboi (1826) 1eLlinto the trap 01 regional birefrin..ence
when he treated indices 01 crystals "in powders of random
orientation. lI +
I~ is interesting that even though he states that o~ all
the pyrogenic minerals, only quartz is not a member o~ a solid
solution series, When he compares refractive indices he
derived for A sample 01 danburite ~rom Obira, Bun~o, Japan
with indices de~ermined by M. Kawamura for ~he aame mineral
from the same locality, he obtains a ~amma index .00168 higher
than that obtained by KAwamura (Which he calls a IIclose
approximation ll ). Tsuhoi conclUdes (p. 146): "If a lar"er
number o~ Krains had been used, better resuL~s would have been
obtained."
However, ~he value for gam.a could never be reduced by
APplyina nis method ~o more grains. his method selects not the
+But be derandomized his approacb by brin~ln" each crys~al
to a pos~tion 01 extinction.
.lNTRODUCT.lON 9

hire£rin&ence of a ~rain hut the w~ximum and minimum index
va~ues to be obtained from the phase region. Therefore, had a
laraer number of ~rains been used, the measured range of the
phase region prob~bly would have been increased and the tai~s
ot the refractive index density distribution probably wou~d
have been better determined, increasina the value of the
regional birefringence Which be mistook for the phase bire-
1rin~ence. This opinion is supported by the fact tha~ Tro"er
(1959) ~ists danburite bire1rin~ences from .0057 to .0059.
That Tsuboi ~ound a danburite birefringence of .007 confirms
the be~ie1 that he i&DOred the presence of solid solution
e1tects on indices to the dlaadvant~~e of his method. Workers
currently using methods directly or indirectly invo~ving the
method ot TSUbOi should t~ke note of this warning.
INTRODUCT~OH 10

19b1, pp. 75, 151,
STATiSTICS IN OPTICAL PETROGRAPHY
Only i£ da~a are Available in enoush abundance and in short
enou~h time per apecimen are statistical s~udies involving a
lar~e number of specimens practical.
The statisticuL quantification of rocks has been deLayed by
many ~actors. Among them are:
1. The dif~icuLty of obtAinin~ statis.ically meaningful
amounts of data 00 extinc.ion an~les, optic figures,
oriented indices and 2V within a reasonabLe amount 01
t ..Lllle,
2. Seriate size relationships amon~ grains of the same
phase in a sin~Le specimen,
3. Ti.e required to orient ~rAins for measuremen~s of
principal or si~ni£ican~ (BLoss,
293) indices,
4. Contradictory indices indicated by different optical
5. Tue i.nordina"te amount of "time required by universal
sta~s methods or such "tedious and complex uniaxial
staas aethods as those 01 Nieuwenkamp (1966) to produce
enouah composi.tiooal dAta for statistical significance,
6. LaCK 01 a qUAntitative method capable of deali.ng
rapidly and inexpensively with data
compositi.on,
rela"tina to
INTRODUCTION 11

7. The di1£icuLty o£ obtainin~ op~ic Ligures ~rom small
~rAins, Whether in thin sections or immersion media.
The i:l.oove problems dre lar~ely soLved by: 1. Use o.f on
line computers Which make measurements o.f 2V's less tedious
than otherwise; DO work bas been done here with
~xtinction ~u~les , the same statement must hold .for theme
2. Crushin~ a apeciwen to a size smaller than the general rock
~rain size und addressin~ the question o~ that phase re~ion's
densi~y .function rather than the composition of a single
J. The areat r8~idity of counting indices 01 grains
scattered uud encountered randowly. 4. The advanta~e 01
to produce a mean index for~vera~in~ wuny ~rains'
that phase reMion in the
indices
rock, thereby establishing enough
knowledAle ul: tbe index distribution for the e1~ects o.f
con~lictin~ resuLts on a few grains to become insignificant.
5. The rapidity o.f tbis method. b. This methode 7. '£he
advanta~e uf being ~ble to work qu~ntitativeLy with grains too
s~aLl to yield optic 1i"ures.
It is tiwe to Join the powerful., avalLab1.e immersion
techniques l~maons, 1929, 1943; El.-Hlnnawl, 1966i van
del'" P1.as, 19bb) to the recentLy developed power.fuL statisticaL
and eLec~ronic computer techniques.
the resultin~ marriage can he excitinG and elucidating.
INTRODUCTION 12

MATERIALS AND MHTHODS
MATERIALS
A desc~iption 01 the ~et~o~~aphic L~boratory appears in
Appendix S, which is intended 10.1' readers wanting to construct
a laboratory simiLa~ to the one used in this work.
caOICE OF AUNERAL AND liOCK TYPES APPROPRIATB TO THIS STUDY.
JUNBRALS.
This work tr~ats pLaMioclase 1eldspars, otivines, aUQitic
ctinopyroxenes, and orthorhombic pyroxenes. These common
minerals ~epresent the triclinic, monoclinic, and orthorhombic
crystal syatems. 5 They ran~e in bire1rinaence 1rom low (ptaa-
10cLase) ~o hi"h (oLivine); in re1ractive index, 1rom Low
(plaaiocL~se) to medium and biah (pyroxenes and olivines).
Demonstration 01 tbe appticability 01 tbe present method to
these minera.ls, wbile in no way providina an exhaustive
overview 01 a~l crysta.l aystems, bi~e1rin&ences, or ran~es 01
refractive indices, does provide a sianificant 1ir8t step in a
continuin& investigation.
5Readers .antln& a Beneral and concise review 01 theliterature relevant to the aineral groups treated here arere1erred to volumes I, 2, and 4 01 Deer ~ ~. (1967a, 1965,18670 ).
~TERIALS AND METHODS 13

EJ.,ilgloc las~la.
II F"eldspars are "the most lmportan"t 01 alL rock-10rming
no mineral group whlch has beensUbs"tances•••
s"tudied more
T.bere is
thoroughly in the past, and yet "there ls no
mineraL group which has presen"ted, and still presen"ts "'to t.he
so many puzzlin~ problems" (Harth, 1Sb9, p. xi).
The importance 01 the :feldspars in the to"tal context 01
mineru"lo~y and their importance in rock classi1ication makes
"their em~hasi~ bere mos~ IIp"t. Pa.rt 01 the emphasis "they
receive her':l is aiwply due to the :fact tbll"t It was s"tudy of
them wbich promp"ted development 01 "the present method.
Specia.l condl"'tions imposed by pLa~iocLase feldspa~s on the
present method are: 1. La. blre1rillgence and 2. Two prominent
SuccessJ:ul es"tablishwent 01 a reLa.-
~ionship between D~EANBP and D~EANB f~r feldspars promp"ted the
preliminary work on "tbe otber mineral phase regions
here.
"trea. ted
MATERIALS AND METHODS 14

Olivines are orthorhcmbic. They have high birefringence.
They are said to have virtually per1ect conchoidal fracture
when crushed (Deer ~i A~.' 1907a).6
UThe ap~roxl.mi;Lte cOJll~061tion oJ: an <A1£hFe)-o"Livine may be
determined optically most e~peditiously by measurement of the
optic More preclse resul~s can be obtained from
the refractive indices. 7hese, however, are not: readily
determined in ~rains, ~or although the optic axial plane is
perpendicular to the two c.leava",es, these usually are not
deveLoped su1ficl.entLy to give cleava~e 1ragments on
crus.bin~" (D..er" AJ.., lE67a, p. 24). Thus, olivines are
dif£ereut ~rom pLa~iocLase felds~ars in crystal system, bire-
frin~ence, and manner 01 break. Purthermore, a successj;ul
demonstration of a relationship between beta and beta-prime
for olivines would reduce t~e difficulties involved in ubtain-
in~ 101' them precise compositional determinations frow refrac-
tive indices which were noted hy Deer ~..t A.I:..
-------_._-----6However,
fi"ures notednot perfectLy
the domin~nt frequency of Bxax fi~ures over Bxoxin Table 15 bere su~gestti that the frActure isconchoidal, 7he question deserves further work.
A1ATtiRIALS AND METHODS 15

"Pyroxenes ar~ the most import4nt .roup 01 rock-10rming
£erroma~nesiun aiLlcutes, and occur as stabte phases in atmost
every type o~ i~neous rock" (Deer ~~ ~~., 1965, p. 1).
to determine both the beta
The compLexities o~
pyroxenes resuLts in ~be
ionic
need
SUbstitution in the au"i~ic
re~ructive index and 2V in order to use determinative charts
such as those present~d b~ Deer ~ Al. (1~65. p. 132). Even
then "compositions estimated ~rom the optic uxiaL angLe and
beta indices way di1~er b~ as much as 5 per cent. 01 the Ca,
bl~ or Fe content :froID tbeir true vaLues" (Deer U Jl.l,., 1965,
p. 13.2).
The au~itic pyroxenes di1~er ~rom pLagioclase 1eldspars,
ollvines, and orthorbolllbic pyroxenes in that they have mono-
ctinlc rather than tr1cl1n1c or orthorhombic struc~ure. Their
bire~rin~ence 1s ~reater than that oJ: orthopyroxenes, tess
than that o~ oLiv1nes. Just as orthopyroxenes possess A
pyroxenes: "crushed
1ra~meDts o~ the pyroxenes 1nctuae tablets lyin~ paratteL to
the prislIlai:1c c teava&e (1.1 0) a.nd a smatl.er number 01 tabtets
paralLel to tlle (100) partin". The latter are easy to
reco~nize by %heir low bire~rin"ence slnce a.n optic axis
ewerges £row them at about 200 1rom the veri:lcal, and 11
bounded by tne prismatic cleava"e or (010) parting pl.anes such
~ATERIALS AND METHODS 16

The orientation o£
~bese tablets can be checked by observin~ the inter£erence
~iaure which, i~ the ~raament i~ parallet to the (100) plane,
witt show an o~1-center optic axis £i~ure. l~ on rotating the
stage until ~he isogyre is east-west the brush divides the
~ieLd exactty, then the o~tic Axial plane is norma~ to the
section and the (beta] v~bration direction north-south" (Deer
»MEANd for a~L hut the orthopyroxenes in the present work.
MATERIALS AND METHODS 17

~~bQrb~~Lgxenes.
Or~hopyroxenes Lorm u continuous series of mineral species
increasing in re£ractive index in the urder: enstatite,
bronzite, hypersthene, 1errohypersthene, eulite, and ortho£er-
rosi Lite. Deer ~i ~~. (1965, p. 28) fit straight lines
tbrou~h the alpha and ~Gmma (-prime) indices but do not plot
~he beta index. There£ore, no A R£~OrA assumption of a
strai"ht line relationSlli~ between composition 01
pyroxenes and the beta indices is made here.
Gamma-priule taken as POD.
the ortho-
Al thoulith most re.ferences advise de~er11lination of the
""amman index 101' orthop;yroxenes, they aenerally do not
mention use 01 an optic 1igure to check orientation. "Since
most or~hopyroxene cleavaMe :fra"ments in a crush lie on a
(~10) ~ace, the ["amJlla] index cun ~enerally be determined with
the "reatest ease and d.ccuracy" (Poldervaart, 1950, p. 1015).
The implication is that one need onLy aLi~n the cleava~e with
tbe poLarizer and chec~ that extinction is parallel to measure
However, a chec~ o~ tlle frequency of use1u~ optic
~i~ures 101' ~amma and oeta in several orthopyroxene samples
showed that optic ~i~ures yieldin~ gamma are more dit1icuLt to
11nd than those yieldin. beta. This is because in Meneral the
a1.ignment of the cleavaMe and extinction ot an orthopyroxene
MATERIALS AND METHODS 18

with tile po1.u.~izer does not assure 1:1Iat the C cl"ystaLLographic
axis (and there~ore gamma propel") is reaLly in 1:he pLane ox
the sta6&e. More oxten the crystal breaks unevenly and
~amma-prime, not "ammo. proper, is ~ound. EXhaustive, quantl-
tative work to see Which POD, ~amma proper or beta, is most
use£uL over 1:he en~lre orthopyroxene range Is beyond the scope
ox the present work but
attention.
is a problem worthy ox .fur1:her
Birefringence ox the tieries ran~es'1rom Low to moderate,
intermediate 1:0 the bire~ringencea o.f pla~ioclase .feLdspars
and olivinea. "Because ..ost crusbed :fru.~ments ox the mineral
lie on a (210) cleava",e p l.ane, the (tiamwa-prime] re.fractive
index can be measured with the greatest ease and accuracy and
this is the most accurate optical method of determining the
hu:Fa ratio of 4111 or'tnopy~oxene" (Deer n Jl.l., 1965, p. 29).
Use 01 ~amma-prlme here shows tbat t1&e di:f.ference in
precision be1:aeen gamma and gamma-prime measuremen1:s is likely
to be quite small, .for tile 6lawua-priwe s-tatis1:ics are compar
able in precision to those of beta .for pla~iocl4ses, au~itic
clinopyroxenes, and oLivines. Cert4inly i1: is quicker to use
gauama-prime than to use .amma .for orthopyroxenes. .It has
there10re been decided 1:0 ~elate u~EANBP
zor ortbopyroxenes treated bere.
to DMEANGP indices
MATERIALS AND METHODS 19

ROCKS.
01 the Maui rocks that Mave rise to this study, ei~ht o£
the ~resher ones were cbemically analyzed at the Japan
Analytica~ Chemistry Research Institute. La~er work will give
more complete ~ield descriptions £or the locations o~ the
sites at which the Maui rocks were co~lected. These, with a
single rock provided by Lindsley and Smith (1971), were chusen
to test the applic~biLity 01 the present method to total rock
counts and to concentrates known to range over a considerable
phase re~ion. It was hoped tha~ statistics ~or total rock
crushed Mrains simiLar to those to be presen~ed 10r mineral
phase reaians might provide a way to determine modal percen
tages. Also, it was hoped ~hat index counts ~rom concentrated
%eLsic graino iram a rock known to have extreme variation 01
1eldspars m~aht provide an empirically derived density ~unc-
tion use1uL in determinin~ relative amounts 01 dl~£erent
plagioclases in the sample.
MATERIALS AND METHODS 20

MINERAL A~~ lOCK SAMPLES STUDIED
JiINERALS.
The maJo~ity o~ samples ~re~ted here were kindly donated by
other workers. As ~ result, mos~ bave been previously
discussed in the li~erature.
Many of the ;followin~ tables are sel.:f explanatory and are
presented w~~bout comment.
flag,j, 01« ],ase§.
Specimens Pi througb P5 and P8 were selected at random ;(rom
drawers lAbeled with aenerul nAmes Like 'bytownite'; they Are
1:.1'011I u.nknown LocalLtiea, .h~ch choice WAS purposely made
durina in~tial work to ma~imize the randomness o£ tha~ aspect
ot. tbe approach. 7 Specimens 6 and 7 are respectively Universi-
ty 01 Hawaii specimens No. 10.3.14 and 10.3.12 .:from the
stillwAter complex. Followina the success 01 initial work,
other sa-ples were obtained .:from other workers as summArized
in Table 1.
All tables list samples in increasina DMBANB or DMEANGP
uetermined by -this work.
7The initial purpose was to see whether a relationshipmight be .:found Amon" j:l..~ioclAses regArdless o.:f structuralstate or rock suite. This is why no initiAL e~.:fort WAS madeto do Anythiua bu"t obtain .. .:fe. samples which rAnaed over theplA&iocla.se indices at intervals AS even as possible.
MATERIALS AND METHODS 21

T~ble 1. PUbl~tibed ~14~loclase d~.a o~ other .ork.
SAMPLE SAMPL.E SOU~C.E STJUJCT. CJ:iEJll. MICROPROBE XRAY OPT.lCSli]U4J,uH~ ~:Ul.E ANA~L--_AYG~__HA~G~l~kCEN~N)
P-25 tiOJW AND HJiARJJ 1.0'1 A.....01.0 2( lS70) O~O.7
U~11 II PEbI5- AN11.2 AN06.2 ANOb- ~
TEkllJ:; O.iH.35 ORO.7 AN~
269J .. .t>EliIS- ~13.~ AN12.9 ANI0- 13TElH~E OJl.}.8 OR2.2 AN14
lJ112 .. 1.0W AN~O.J A~18.9 AN15- 18OJl.}.9 OJl1.5 Al\I20
P-5 1 II LO~ ANa1.9 30OR.l.1
P-8 1 II LOW ~~d.6 ANJ7.4 AN37- 390«1.7 ORO.6 AN38
A-175 .. l.OW AN51.9 AN44.4 AN41- 50Otl~.7 0«1.5 AN50
U116 It LOW ANtiJ.2 ANS4.o AN51- 55ot(4.1 ORJ.O AN56
531N-2 ..JACKS(jN (1961) 5~.9
MATERIALS AND METHODS 22

:fabl.e ~.
work.t~~n~Lu~eti) PublLsbe~ pLa~locla~e da~~ o~ other
55~ri-l "
P-lo ~U~~ AN~ L~A~u P~~~l-
<157u) TIVE AN
30~-o& ~i~llS~£t~~~~:rti2
(1~71)
b2~E-J~ ~A~A~CN (1&01)
~-24 uU~b ~ND tiLA~~ LO~3
( Ib7U )5~b~-2~ ~A~~~O~ (l~ol)
70.3
AN6.J ANo.l-OIH.O AN72
A.i.'l6~ AN6u-OAtO.7 AN72
AN70 AN7t)-o~O.5 AN7l::i
7.J.O
A.N 7tu:t. AN 70. & 77u~O.4 Ol{O ....
7b.6
d3.3
AN95.0 ('-at)ORO.2
II
"
A.i.~ ~C;l;;.o:,v,N .!U. at•~ .l~71'
"
.hA.l:j~~
aPlibi.Ll~4:)U
,sc.h.6.106~
.;255b1V-3~
1 Do 001: conLuse P.> aud P~ w.i.'tll .l!-~ tlu'U r-3~llroughou1; t:ids work.
2 liThe nulk o~ tbe plu.~~ocL~s~ com~os~1;lous .Ll~ be 1;bos~ 01 -the ph~nocrys1; cores(around A1l80) ann ~rounu wass l d.J:·ound AnoO) (Linds Ley, personal comlJiunica1;10n ].n .:iee
UlUC!J W01'C he low under "kvC.K~II.
37rausL~ional ~nor~h~te.
MATERiALS AND ~ETHODS 2~

Table 2. OLivlne sample sou~ces and source 1orH~e~i~e estlmates ~ro. microprobe data.
SOURCEPERCENTFOJiST.6RITECOJtPOS1710NAVG. RANGE
D1'5-1 FL~na"an
( 1~69)
JJG-352 ~uahi.. o(unpuh. )
pcc-l FLanauan( 1969)
lHlL1950SE Anderson !U Al. 84 84-86( 1971 )
llK1868G2 It 79 77-81
45~o 11:3 !Jurns S Hu""lns 78.9( 1972 )
SIll "5 " 60.0
5107 114 It 58.3
540b7 117 ..
5181 119 II
MATERIALS- AND METHODS 24

Twenty-six separa~e bulk analyses 01 ~otal rock 10r both
PCC-l and DIS-I are colla~ed by Flanagan(1969, p.87-8) and
are not repeated here.
Table 3. OLivine chemicaL data o£ o"ther work.
JJG-352 1 4526 5111 5107 54087 51814a~_ 152 ,~2 ___.#7 2 La!-
Si02 042.1 039.66 036.80 036.26 035.35 032.63A1203 000.00 000.06 000.06 000.06 000.02 000.09F e 2 0 3 n.d. n.d. n.d. n.d. n.d.FeO 007.733 019.60 034.a8 034.37 041.15 055.50lh,o 050.~ 040.55 028.80 02~.05 02~.50 011.90eao 000.0 000.07 000.08 000.10 000.03 000.11Nafl!O 000.00Ti02 000.00 000.01 ooo.oa 000.02 000.00 000.05MoO OOO.Ob 000.21 000.41 000.48 000.54 000.39Cr203 000.00lU.O 000.22 000.10 000.10 OaO.1S QaO.WlTotal 100.8 100.89 100.72 099.44 100.74 100.67
Fe~SiO.y." 021.02 038.76 040.33 049.09 011.78M82S J.O... 078.30 059.46 058.82 050.04 027.51Jto2SiOf 000.30 000.54 000.58 000.65 000.51Ca;l'SiOfi 000.10 000.11 000.16 000.04 000.19LH.2S l. 0, 000.28 000.13 000.11 000.18 000.00
--1 Microprobe analysis.2Bulk chemical analysis assuilled.3Tota&. iron as FeO."The rest o£ the table consists o£ partial oLivine
.formulas Listed hy Burns and au"ains (1972 ).
MATB~lALS AND METHODS 25

Augitic~~xgxeues.
locaLity o~ ~ree-au~iteA sample
crystals at
I collected At the
the 8500-£00t level o~ Hateakala, Maui, is
probably rtHu:ionably cLose in cOloposi tion to the sample ana-
lyzed by WasnioMton and Merwin (1922, p. 119, analysis 1).
Tilou",U the Locality is a ~air distance downhill ~rom the Red
Hill location mentioned by thoae authors, the collection si.es
are prubably the same. This ia in1erred frum the reasonin~ u1
\Vasniololton aud Merwin (1922, p. 117J. An u.bundant supply o~
free au~ite crystala remains there yet.
Eiaht of the au»ite crystals from this site, ran~ing in
size ~row about 3 mm to is mm Acroas, were pounded together
They should provide a
Part of the sample was purified 101'
reasonable su.mple 01 the
1972cpx (1972 for ahurt).
locality. The powder is called
chemical analysis. ~efore purification it consisted o~ a
mixture oi cpx and red ~lass. Initial aeparatioos on the
Fran~z ma~netic separatur 1ailed ~o purify the sample.
Heavy liquid sepa.ration llIitb bromo~orJtl also 1ailed, for the
~lass remained admixed _ith all densities ot the cpx. About
one tnird of the sample was enclosed in a glass tube and
heated in a bunsen fla8e to convert the ~lass' hematite to
JIla&neti~e. Optical wurk was done on the unseparated portion
~ATERIALS AND METHODS 26

o~ ~he sample ~o avoid any change o£ optical proper~iea as a
result 01 ~he hea~ treu~aent. Passes o~ ~he hea.-treated
sample throu~h the Frantz magnetic separator resulted in
puri£ication at the 99 percent leveL. This puri£ied sample is
beinM analyzed by atomic absorption spectra-photometry by
Patricia Fryer at tbe Hawaii Instl~ute 01 Geophysics. The
results are not yet available.
MATERIALS AND METHODS 27
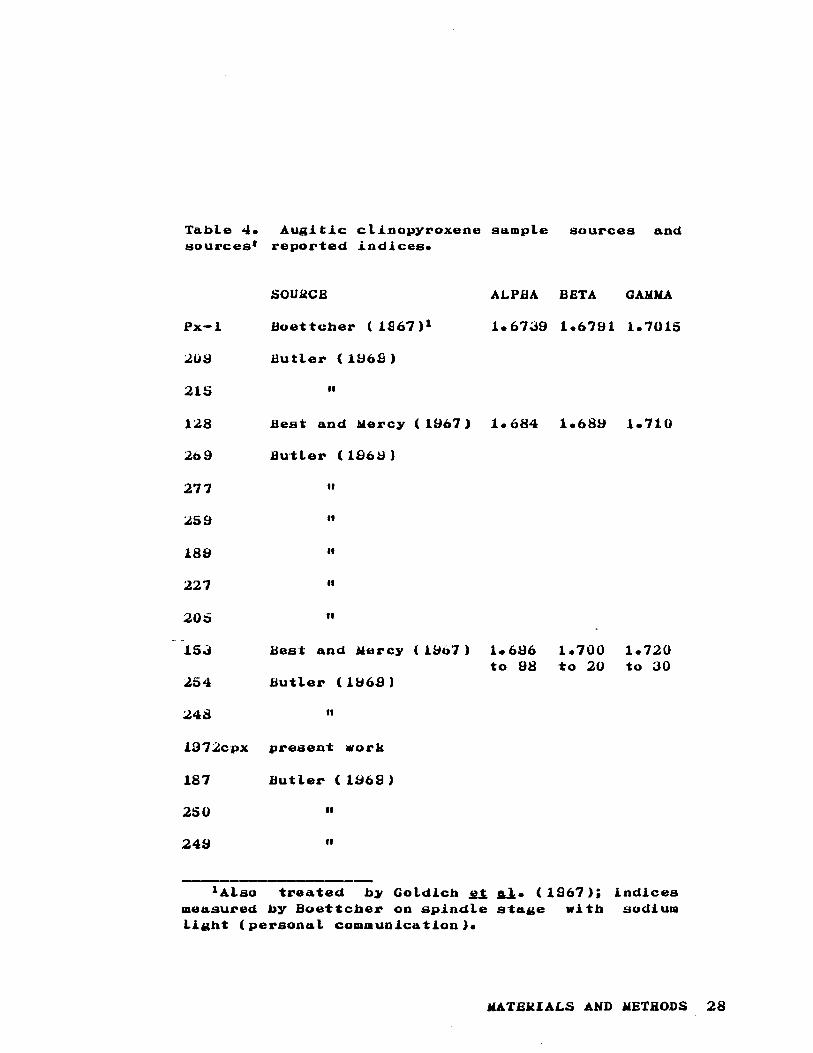
Ta.ble 4. Augitic clinopyroxene sample sources andsources' repor"ted .indices.
SOURCE ALPBA BETA GAMMA
Px-l Boet"tcher ( IS(7)1 1.6739 1.6791 1.7015
209 Butler ( la6.s )
215 II
128 Best a.nd Mercy ( 19(7) 1.684 1.689 1.710
209 Bu·tler (lB69)
277 II
259 II
189 II
227 II
205 ..15,) .Hes"t and .6hsrcy ( 1~41 ) 1.696 1.700 1.720
to 98 "to 20 to 30254 Butler ( 1965 )
248 II
J.972cpx presen"t work
181 Butler (1969)
250 II
249 II
lAlso treated b~ Goldlch ~~ Al. (1967); indicesmeasured by Boettcher on spindle s"tage with sodiumLiMht (personal communlca"tion).
~ATERIALS AND METHODS 28

Table 5. AU"itic clinupyroxene chemistries (.ei~ht percents).
Px-l1 ;,l,OSZ-3 2153 128 4 2693 277 3 259 3 1893 2273
SIOz. 05J.~4 05~.48 054.06 052.51 0~3.26 053.06 052.79 052.27 052.19A1203 000.6b 002.11FeZ03 001.13 L01.09FeO. 001.S1 004.62 006.26 OU1.97 010.b2 011.36 012.62 012.39 014.97M6IO 016.~,J 01b.77 015.50 01~.23 013.14 013.18 012.65 012.00 010.90CaO 024.55 023.05 023.34 021.58 022.00 022.02 021.38 01~.97 021.57Na2.0 000.24 lJOO.28.K~(J <0.01 OOO.U4T10z 000.26 000.37PaO~ ooo.uoJtnO 00u.07 001.08 000.84 OOO.lO O~a.38 000.38 000.57 004.37 000.36F 000.00CrZ03 000.21BaO 000.006SrO 000.035RbO 000.00'ueO 000.00H:aO+ 000'.00H2O- 000.03
To~al 0~a.97 100.00 10U.OO 100.38 100.00 100.00 100.00 100.00 100.00
MATE~IA~S AND METHODS 29

.;,
Tu.ble 5. ( COil t.1nued .) Au,y.1t.1c clinopyroxene chemistries (weigh-tpercen"ts ).
2053 lti~· 2542- 3 248 3 un3 2502- 3 2492- 3
SlO~ 051.~2 0~1.20 052.46 Oti1.65 051.23 051.02 050.66AL203 OUO.dOi'e 203 UUl.5~
FeO 015.71 ~14.S1 U14.2~ 011.74 019.10 U19.81 020.64M~O 010.12 010.27 01~.22 OU~.1~ Oti8.~~ u07.$9 007.07Cu.O 0~0.80 u~u.a7 Oi~.~~ U~0.60 020.65 020.54 020.23Nu.~O UOO.32
. K~O OUO.Oo"i.10 2 000.27.MnO 001.49 OOO.~6 001.11 000.27 000.50 000.64 001.41
'1'o-ta 1. 100.0u 10u.04 100.00 lUO.OU 100.0u 100.00 100.00
l~ulk unalyses reported in Goldlch ~£ A~. pre~erahle -to that 01~oe"ttcbcr (l~b7) (Buettcher, pevsou~l communication); Cr203 and SrO byem.is~ion ~pec~roule-ter; U~O by mass spec~rometer.
2Averu.he o~ zour analyses.3FeO. ~nO. and e40 by X-ray eaission s~ectrochemica1. analysis; other
values ~rom u11xerences based 01. iueal structure ~ormulas, so total is100 percen-t.
·Eulk cbemlc4L analysis a~sumed.
MATERIALS AND METHODS 30

QdjJog;vro.x.eoes.
Table 6. Orthop~roxene sample sources andsources' repor~ed re1ractive indices.
SOURCJ::
J~G-352 Kushiro (unpublished)
ALPHA 8ETA GAMMA
1..l8 Best and .Mercy ( J.967 ) 1.694 1.704 1.707
277 ButLer (1669)
189 II
259 ";}'27 II
254 II
153 Best and .Mercy (19&7) 1.719 1.732 1.737
205 But Ler (1969)
248 "187 "250 II
249 II
171 "
MATERIALS AND METHODS 31

Table 7. Orthopyroxene chemistries (weight percents).
LUl~ .u~ ~1:l3 JJ:Ut;J ~3 },.ll3 ~3
SiO~ 058.5 052.77 052.40 050.82 051.03 050.62 050.54AL203 000.66 001.1.2Fe203 003.37£o'eO 004.56 1 019.92 026.92 025.46 031.64 033.86 032.~0
W~O 035.6 0.21.06 019.. 05 014.Jl 015.13 014.03 013.80CaO 000.40 001.15 000.50 001.03 000.63 000.58 000.45Na~O 000.04 000.041'.20 000.02T10,2 000.00 000.33MnO OUO.06 000.52 001.13 008.37 001.57 000.91 003.01Cr203 000.20
Total 100.0 100.30 100.00 100.00 100.00 100.00 100.00
..1iiii ~3 ~.B3 J.a23 ~2-3 ~a3 .1.1.13
S.102 049.27 049.75 049.70 049.14 048.74 048.46 048.09A L203 000.94Fe203 003.53FeO 031.43 034.02 031.51 039.17 040. ifJ 039.49 041.85bhcO 012.~4 011.48 011.39 009.81 008.67 007.74 007.01CaO 001.38 000.73 000.75 000.76 000.80 001.09 000.23Na20 000.04K2 0 000.04Ti02 000.43WnO 00&).87 004.02 000.65 001 • .1J 001.bO 003.23 002.81
TotaL 100.3b 100.00 100.00 100.00 100.00 100.00 100.00
ITo tal iron as FeO.2Avera~e o~ ~our aualyses.3FeO, MoO, and Ca.O by Xray emlsslon spectrochemlcal
auaLyais. o~her values 1rom dl£~erences based on idealstructure ~ormulas, so total is 100 percent.
~TEalALS AND MBTHODS 32

ROCKS.
a\iJ&~1. e 3 cia::wt •
Sawple Jo3-b9 is part of a core studied by Lindsley and
S8Ii'til (1971). Lindsley says the sample "was collected close
~o the host rock sample on which the chemical analyses were
done••• The more ~1.~aLic portions make up but a smal! volume
o~ the ~otal ~eldsp~r" ( ,lJersoua 1 communica tion). A sketch
inclUded with his relllarks shows 363-69 about 1 to 2 eters
above 3"1-90 which wa.s ana lyzed Aud called "host
tbeir Fi~ure 7~b (1~71, p. 274).
rock" in
Other pertinent remarks based ou U-sta~e work are made by
Lindsley a.nd Smith (ld71): .....mos~ [pl.~~ioclase] .from host
rock and o~her zones o~ tbe ~lows are in ~he 'hi~h' s~ructural
state. O£ the remainder, wost a.re 'intermediate' and onLy a
very few are in the 'low' state. ALL parts 01 the .flows
exce»S [emphasis theirsJ the pe"wil.tolds contain phenocrysts
with op~ically distinct cores of cil.Lcic pl~~ioclase and with
rims identical in composition witil that o~ the ~roundmass
Laths. There is a compositionaL ~ap be~ween phenocryst cores
and rims extendin~ .fro~ a~proximately An65 to An75 as deter
mined optically. Pe~matoid 1elds~ars ran"e from An4H ~o An53
in the cores and are pro~ressiveLy zoned toward albite and
il.lkal.i fel.dspar. Most pLa~loclase twinning In ~he pe~matoids
MATERIALS AN~ METHODS 33

is according to the simpLe aLbi*e law, whereas tha~ £rom the
host rock is dominantLy by the simple Carlsbad or combined
~lbite-Carlsbud laws•••
"Because o:f nearly ub.Lquitous compositional zoning, most
1eldspar analyses presented here are o£ a sin~le point only;
averaainu values :for several points would be .eanin~less•••
[See also the remarks o£ Anderson below, £0110wlng TabLe 22.J
"The optically detected compositional ~ap between pheno-
cryst cores on the one hand and phenocryst rims and ground
mass plagioclase on the other is contirmed (Fig. 73),
although the microprobe d4ta ShoW a narrower ~ap (An70-74).
The width o~ the gap is prohably more accurately determIned by
optical methods, ~or whereas the break hetween phenocryst
cores and rims is sharp «1 (mi1l.Lmicron] in width), the 8-12
[milllmicron] spot size used to minimize Na loss undoUbtedly
resulted in hybrid values .ben the beam overlapped core and
rim during step-scan traverses o~ tbe phenocrysts. (Work
reported here later shows that optical. work cLoses the noted
~ap very nicely.J The ccmpositional trends in Fig. 73 are
similar to those reported 101' :feldspars 1rom a Hawaiian lake
lava (Bvans and Moore, 1968), althouah the Hawaiian alkali
£elds~rs tend to contain aore calcium.
".l.arae numbers o£ a.nalyses were lIIade o£ :feldspars :from the
host rock, dark peQmatoid, and Light pegmatoid in an attempt
to detect sympathetic or antipathetic relations among them.
MATERIALS AND ~ETHODS 34

Althou~h the dis~ribution o~ analyzed points is ~ (emphasis
tbeirs) ri~orousLy proportional to the volume o~ .feldspar
havin~ a ~iven cOlilposi tion (tbe sampling was biased toward
sodic and potasBic £eLdspars), the dominance o£ poLnts .from
step-scan traverses ~ives meanin~ to variations in point
denBity Lilc Ad.ja~nt CQJll.UUU.tJ..2Wi l emphasis theirs]. Thus if
traverses across ei,t.llat or ten crystaLs in a ~iven sample all
show a ~ap in the same com~ositional range, it is likely that
ieldspar oz that composition crystallized sparse1.y, i£ at all,
in that s.a.lQ"l.e. A concentra'tion of points, on the other hand,
may indicate an abundance o~ .feLdspar ot that composition, but
may also re~resent the results ot a traverse across a grain
sectioned parallel to a ~ro.th sur1ace rather than through its
center. concentrations of points indicate relative
abundance only i.f they appear on
(pp. ;.7 ;j-6 ).
Maui cocka.
two 01' more traverses"
Maul rock BampLes 27, 33C, and 52 are .from
Ukumehame Valley; sampLe 45 is .from KabakuLoa Valley; sample
55 is .from lao Valley; and sampLe 62 is .from Kahoma Valleye
All are phanerites o.f the ~abbroic .facies. More detailed
1ield descriptions wilL be ~iven Later but are
MATEHIALS AND METHODS 35

available on a personal basis ~or now.
Chem~s~ries are reported bere to make them available to
other workers and to provide background da~a a~ainst which to
view future results 01 opticaL work on ~heir minerals.
Table 8. ~au~ phaner1te chemistries.(Weight percents; Shiro lmai, analyst.)
;a2 31E _a2JL_ ~ac ~.s..._52___ SS 62 -
s10~ 49.30 49.9b 50.19 50.74 46.82 50.35 50.77 50.74T102 2.70 3.50 J.08 2.~7 2.42 2.33 2.83 2.71A1.203 14.72 13.86 13.49 14.5b 12.21 14.55 9.86 10.09F e 20.:J 4.30 J.18 2.5' 2.49 2.26 2.04 3.81 3.91FeO 6.27 10.00 10.18 9.47 10.79 8.85 10.50 10.52CaO 10.~2 10.29 10.82 10.62 9.98 11.84 10.36 10.32MgO c).S9 5.86 4).42 5.74 12.23 6.98 7.91 7.74MnO 0.12 0.16 0.1.6 0.14 0.15 0.15 0.18 0.18Ha20 2.19 2.28 2.27 2.41 2.04 2.23 1.87 1.901'20 0.24 0.34 O.~O 0.33 0.36 0.23 0.26 0.271120( +) 0.70 0.32 0.43 0.48 0.62 0.53 0.54 0.43ji20(- ) 1.61 0.35 0.37 0.46 0.39 0.35 0.88 1.01P20". O.2~ 0.2a 0.27 0.29 0.28 0.17 0.28 0.29
Total 98.59 100.39 100.65 100.60 100.55 100.60 100.05 100.11
MATERIALS AND METHODS 36

METHODS
Instability of immersion media results in the well known
need to calibrate immersion mediu rather often in care1ul
work. 8
SEARCH FO~ ACCURACY AND PR£CISION.
AlthuuU;h a-place accuracies are suf1icient for most pur-
poses 01 mineral identification, this work seeks four-place
accuracy and precision to ensure the validity o~ the results.
The limiting factor 01 precise and accurate knowled~e of
imaersion media indices has been the maJor impediment to the
production trustworthy da.ta. Temperature-controlled
laboratory, stage, and reiractometer are necessary to achieve
the desired accuracy and precision in this work. The system
constructed to weet these needs employs a common monocular
unia~iaL petroMrapbic micKoscope and a JeLLey refractometer
(Jelley, 19~4). See "DESCRIPTION OF l'E"IROGRAPHIC LABORATORY',"
Appendix B, zor details.
the use of students a~
Appendix C is included primarily for
the University 01 Hawaii wbo are
currently m~king use 01 the laboratory. It may also be
8Evaporation, contamination, precipitation, oxidation, andchemical chanQes durin~ the aging process 01 an immersionmedium as we'LL as cbanj£es 01 refractive index due to temperature fLuctuations, alL necessitate immersion medium calibrations when accuracy is important. The probLems 01 instabilityare especially criticaL 10r immersion oiLs of indices ~reater
than 1.65 due to their volatility.
MATBRIALS AND ~BTHODS 37

in8t~ue~ive to readers wanting a more detailed Listing o£
steps performed durin~ analytical ope~ations than is given in
the body o£ ~his text.
ELEMENTS OP THIS METHOD.
CurrentLy, workers a~e trained to ~ely only on indices
determined from grains previously brought to extinc~ion posi-
~ions. Tbe present work departs from the traditionaL approach
by cowp4rin~ indices o~ ~rains scattered randomly and immersed
in oiL. .I'ota~ed to brinM each ~rain to
ex~lnction. Instead, arain indices are examined at whatever
orlen~ations they have when encountered du~ln~ a traverse o£
~he mount at a 1ixed staae posi~ion.
Orientations o~ the ~rains are no~ entirely random, because
they may lie on cleavaie, fl'acture, partin.. , or remnant
crystal. :tace». This may partiaLl.y derandomize the orientation
01 the indlcat~lx.
11 an immersIon oil is held at cons~ant temperature, its
reLractive index zone may be considered to be a Line so thin
that any mineral "rain by comparison must be 01 either hi~her
or Lower inde~. Given the theoreticall,y perfect situatioll,
there should be no grains _hich display indices matchln~ ~hat
01 the immersion mediu.. However physiol.ogical limitations
coupled perhaps with inability to control temperature per1ect-
Ly have resuLted in the traditional, practical, and routine
Umatchina" 01 minerals to oiLs. Saylor (1935) treats sensiti-
MATERIALS AND METHODS 38

vity o£ the criterion 01 match uoder various methods o£
illumi9,ation usin" monochromatic liaht. He finds the upper
limit of prec~sion available to extremely care~ul optical
microscopists determinio~ 8ineral refractive indices to be
about .0001.
DAta de~~!piioQ.
Miner~l gra~ns viewed under pLane polarized sodium light in
immersion media selected somewbere near the mean index estab
lished by preLimin~ry work Day or may not display Becke lines.
Of tbose that do. some display refractive indices bigher than.
wbile otbers display refractive indices lower than. that o~
each immersion medium. Grains Which are io the field but are
seen onLy under crossed nicols are said to be equal in index
to the ~mmersion medium.
The data consist of percenta~es of ~rains whose indices of
reiraction are determined to fall in the categories less than.
equal to. aod areater than each of ~everal immersion medium
indices. The data are ~enerated either from grains oriented
at random witb respect to tbe rotation of the microscope
or from ~rains oriented conoscopically to display a
refractive index ~ssociated with a known axis
indicatr~x.
01 the
MATERIALS AND ~ETHODS 39

Dle ata:tJ.st.i.scca.
Gaussian distributions.
The most cowmon dis~ribution £ound in nature is normal
( Ga.ussi a.n ) • The most power1ul statistics are based on assump-
tions o£ normal prObability density :functions (Figure 1).
There:fore, the assumption that the :frequency distribution 01
re£ractive indices in such natural solid solution series as
the pl~aiocLase :feldspars is normal is the most convenient one
on which to base a :first statisticaL treatment 01 the data.
The statistics developed 10r the present appLication (Johnson
and Lang.ford, in prepara.ion) are there:fore based on the
assumption o:f a normal distribution.
Gruphics and numerical statistics generated by electronic
computer data analysis are described below; these may display
radicaL departures o£ the data :from the best normal curve .fit
to the data., thus providing a convenient check on the
appropriateness o:f
dis.ribution.
the assumed re:fractive index Gaussian
WATERIALS AND METHODS 40

~>-'"ozw=>
"wa:Lt.
w,..~J~<Ill-'ZWW0:0
INDEX
Fi~ure 1. Nurmal probabili~i density ~unctlon.
ProhabiLity density Lunction 01 re~ractive
index (~) of a solid solution (abcissa) versusdensity, relative ~requency in percent (ordinateJ. L, E, G, and D are expLained in thetext. (A1ter Haird, 1902.)
Fi~ure 1 shows the best ~it normal (G4ussian) dis~ribution
probability density function 01 phase re&ion indices. The
total area under the curve is 1. The areas labeled L, H, and
G represent the ~raction 01 total area under the curve
occupied by ~rains wbich appear respectively to be less than,
equal ~o, and greater than each particular oil index (n)
chosen. Since the oil index theoretically cannot precisely
match that of the ~rain, addition of £/2 to L yields (Johnson
and Lan".toro., in preparatiou) an adjusted :fraction of the
tota~ area less than ~ Which is calLed Y (not drawn).9·.
Xbar is the mean re1ractive index sOU~ht ~or the sample
population; s is the standard deviation ot refractive index.
These are here called ~MEAN and liSD when determined by
electronic computer.
9aecalL tbe work o:f Saylor (1935'.
~ATERIALS AND METHODS 41

20
GO -
10 -
30
o I
- 35 - 25 -15 0 +15 +25 +35
50
70 -
40
80
y 100 .(%)
90
Fiaure 2. cumulative normal distribu~ion £unction.(A1ter King, 1911.)
Piaure 2 shows the same normaL distribu~ion as shown In
Fi~ure 1, but in 1i"ure 2 the relations to indices are omitted
and the curve is the cUJll'ulative normal probabil.ity distrlbu-
tion £unction rather than tbe density ~unctlon.
MATQ~lALS AND METHODS 42

Gaussian probability paper ~raphlcg.
Normal probability paper (SpiaQel, 1961, p. 136; King,
1971) would convert the curve o~ Figure 2 to a s~raight line.
PLottillM data on normal probability paper tbere~ore provides a
~est o~ the normal distribution o~ indices assumed in the
sample. Departures from a strai~ht line indicate a violation
o~ t11e normal probaoility function assumption.
MATERIALS AND METHODS 43

......§
1.53 1.54 1.55 1.56 1.57 1.58 N-
FIgure 3. v~ussl~n probablll~y paper plot.
S~ral&h~ Line ~l~ b~ eye ~o immers~on data p~o~ted
on norlllaL probabil~ty paper. HeJ:.ra.ctive ~ndex N(abcltisa) veraus eumula~ive r0la~ive ~requency y(ordinate). The samp~e is 363-69 (Lindsley a.nd Smith,1971). Thirty-one po~nts ~.roUl 22-26 JU~y 1972 workare shown. Indices are measured as ra.ndomly encountered. See also Figu~es 7, 8, SA, ~B, and Ta.ble 21.
MATERIALS AND MBTHODS 44

A strai"ht line is ~it by eye to the data within the limits
o~ one standard deviation (1 s1 on either side o~ the mean.
line ~its tbe data sUi1iciently well within 1 s
o£ the ~ean.l0 The arapblcally determined mean re1ractive
index 01 the randomLy encountered grains is about 1.5625.
The standard deviation o~ the best Gaussian curve 1it to
the data is the absolute di1ference between the vaLue o£ the
mean and tbe value on the abcissa o~ either of two lines
parallel to tbe density axis, drawn equally far £rom the mean,
And enclosin~ hetween themselves 68 percent of the areu. under
tbe curve (~aird, 1962) • There;fore, the re1ractive index
values, one s"'tandArd dev.J.cation on each side of the mean
refractive index, are found hy readin~ the indices correspond-
ina to vaLues on tbe cumulative rela.tive frequency axis at 16
or 84 percent against the hest strai~ht line fit to the data
on prohability paper. Tbe absolute di~ference between one of
"'these index values and the value 01 the mean index defines the
value 01 one Btandard deviation of the refractive index curve.
IOThe mean re1ractive index is found In FIgure 3 by 1ittln&the beat strai~ht line to the data by eye a.nd then readine thevalue on the ahclssa. that correspobds to the 50 percent levelon the ordinate. A mat~eDatical best fit is qui"'te a tediouschore without a computer. Use oJ: a computer obviates the needfor A probability paper solution.
~ATERIALS AND METHODS 45

The Gau~sian assump~ion o£ index distribu~ion is apparently
violated beyund 1 s in bo~b increasing and decreasing Index
directions. There are 1ewer higb Index and more ~ow Index
members o~ ~he sample population ~han would be expec~ed in a
Gaussian dIstribution. ~nis apparent violation o~ the normal
distribution assumption prompted the work shown in FIgure 8.
USB OF COMPVT~RS iN THIS VC'X.
When a Lar~e number of data points in a set or a large
number of data sets require treatment, the more elegant
numerical solutions available throu~h electronic computer
become attractive especially with reMard to time savin~s. A
teletype is cOlmected remotely to an lHM 360 or a Nova 1200
computer.
~of laM 3bO.
The mean (DMEAN), tbe standard deviation (DSD), half the
width of ~be zone of apparent matcb (DX), the standard error
01 DWEA~ (SDM), the standard error of uSD (SDS), the standard
error o£ DX (SD~), and the standard deviation of the residuals
o£ the data abou~ the best 1it Gaussian curve to the data (SD)
are computed by pro"raw CUM which is available on request.
Data input to CUM are a ainimum of 3 counts of Land E at 3
dif~erent indices B for each phase reMion investiMated in a
WATERIALS AND METHODS 46

sampLe. The program handles any number of successive such
calculations.
Consisten~ly repeatable departures o~ data ~rom the best
1it straiaht line ~hrough the data pLotted on normal probabi
~ity pa.per and lar~e vaLues of SD returned ~rom program CUM
are both indicators of departures o~ ~he data from the
assumption o~ a Gaussian dis~ributlon.
De~ailed empirical de£inition of density functions may be
desired, especially i1 the vaLues o£ SD or DSD are high.
The importance o£ use o~ computers in the present work
cannot be overemphasized, for a principle aim has been to
construct reLiable determinative curves. Computers yield
results to precisions unavailable by graphics. But workers
without computers should realize that the reason ~or producin~
araphica1. representa.tions of the matheMatical reLations
de£ined is precisely to make the results a.vailable to all
petrographers, Whether or not they have computers.
It is here emphasized that the work treated in the present
dissertAtion considers only the parameters DMEAN and DSD in
detaiL, their analo~s beinli available also from the graphical
a.pproach. The paraMeters not treated here in detail will he
more £ully explained in the a1urementioned work of Johnson and
Lang:ford.
The IBM time sharinM option Which makes remote terminals
interactive with the iBM 360 computer is callod TSO. l~ is
MATERiALS AND METHODS 41

now possible to do aLL work ~t the microscope even to ~he
extent 01 entering data ~or CUM and havin" re~urned to the
terminaL th~ statistics 1it by computer to the da~a Just
sUbmitted. It is also possible to submit aLL or any part o£
the da~a se~B stored on disk as card imaMes and receive ~he
return eIther a~ the terminal, as B~andard IBM printout, or
both.
~ion,
However, TSO is not aLways available at tbis installa-
the system is rather
ine1ficien"'t aud time conswainlil' and the procedure is not
recommen~ed as a standard operation. In particular, the
excessive cunnect time required While worK is done at the
microscope and the resultant cost of typing in card ima~es
tend to make the procedure prohibitively expensive unless
connect time costs are reduced. Storage of such data on a
disk available to severaL remote terminals would make possible
an interlaboratory data bank which could be o~ great impor
tance in such works as the present. A pro"ram whicb lists the
data in any data set on disk and at the same time punches out
cards is available.
~Qt Nuxa 140g.
The lanMuaae used wi~h the Nova 1200 is Multiuser BASIC.
An adaptabLe pro~ram ot about 6000 word~ of core storage is
used tor oil caLibrations and generation 01 data for program
MATERIALS AND METHODS 48

Tbe pro~ram is interac~ive and requests da~a input in a
repeatin~ lo~ical pattern which ~rees the operator's mind 1rom
most caLculations. it stores calibra~lon equations 10r each
calihrated oil. The proaram is stored on paper tape and is
available on request.
It is now possible to enter pro~ram CUW to the Nova and
have it work .t:rom disk on da'ta en tered :froID the ~erJlliDal near
the microscope. This should in the 1uture avoid IBW connect
time coats 10r workers wanting quick numerical returns on data
AS generated. It shouLd aleo make possible computerized data
processing at laboratories without IBM computers bU~ with mini
computers. For instance, such computerized data processing
aboard sblpd now seems 1easibLe.
.ATBRIA~S AND ~ETHODS 49

SAMPLE P8EPARAT~ON.
Mine£al ~~~.
Mineral samples were crushed by pounding and were sieved
into various si~e :fractions. Some samples were already so
processed when received ~rom donors. There is no obvious
reason to seLect any par'ticuLar size :fraction other thu.n
convenience unless ~rains very 01ten display distinctly dif-
1erent indices within the same "rain. This is due to zonin~.
The lar~est sizeIn such ca.ses, 1iner poundina is indicated.
used bere is .124 ma, the smallest, .032 mm.
Low concentration o:f the .tiubJect mineral in a crushed rock
specimen at 55MV-~2) necessitates magnetic
separa'tion, but heavy Liquid and magnetic separations are
Menerally not needed unless coexis~ina phase regions generate
con1:ulied resul.ts or concentration 01: an unweathered portion of
u mineral. phase reaion seems indicated. Nore o~ten, counting
is possibLe by visibl.e separation 01 the mineral desired in a
moun't of mixed mineraLs. The present results confirm the A
~rl assumption that these iIIuidelines would su:ffice.
~ATERIALS AND METHODS 50

Rock samolea.
Wheu workluM with rock samples, pounding should reduce the
"rains to a. .fraction sDu~ller thantbe predominant rock grain
size.
Each chip 01 rock Is pounded in an iron mor.ar with an iron
pestLe. A~thouMb it is not known what proportion o~ .he
opaque "ru.ins seen are lron from these tools. the ma~leability
01 .he Iron seems su11icientLy ~reater than that of the opaque
miner~Ls, u.uu such con~amination Is believed to be neg~igib~e.
PoundIng is done gently at "1.irst, 61:f.in& o:ften to obtain a
O.03~-O.Obl .a :fraction. As the specimen is reduced.o
smalLer tiizes, .first the weatherinM products••hen the fresher
non-opaque minerals, and :flnaLly the tenaceous opaques are
passed throuah the O.O~l am sieve until no sample remains
~reater than that size.
After the :fIrs• .fe. poundinK and sievin~ cycles, .he sample
tends to Lorm c~ods :from poundin~. These are broken up by
"ent1.e rubbing between aortar and pestle.
~rlndinQ.
Thls is not
The -0.32 mm part is set aside and not treated bere. It
probably contains a greater proportion of weathering produc.s
than the part used :for immersion work. Thus. comparison of a
chemicaL analysis .0 modes produced by tbe present method
MATERLALS AND MBTHODS 51

may show some discrepancies; ~or chemical analyses re1er to
total rock, in most cases sQmewhat weathered.
Possibility 01 modes ~row i.mersion data.
Pluts o~ ~ derived 1rom countin~ in crushed rock con~aining
several minerals are made to pinpoint index ranges 01 particu-
lar interest. A ran~e of indices between the maximum of one
and the minimum of another mineral is at times so de1ined.
OpticaL separation o~ one mineral from the other is then
A best ~itted horizontal straiaht line to da.a
points taken at various indices yieLdin¥ an approximateLy
cons tan. value of Y theore.icalLy should provide an estimate
ot such a phase region1s modal percent, assuming a lower or
upper bound to the phase reMion is found in the same way. The
method is e~plured and discussion is continued below, but
su11icient data have not yet been .enerated to aLLow beat
1itti~ 01 a horizontal straiah. line between two such mineraL
index ran~eB 10r any rock gampLe.
MATERIALS A~D METHODS 52

NO
100 --------------------
~ R3
~wu> R0-o::~...J...J
~~~B R1 ····· .. ··· .. ·· ....··· ..·.... ··1
o~~:....--H-:-±--+----t---XR N3 N4 N---7
Pi~ure 4. Theoreticul model rela~in~ total rock cumulative ~requency distribution to modal percents.
Figure 4 provides the ~heore~ical backMround. the working
hypothe~is, 10r the work shown in Fi~ure 7.
MATERIALS AND METHODS 53

Grains oz a totaL rock are crushed and not separated.
Immersed in a series oL oils, there is some index NO below
wbich no ~ruln in any orlent~tion matches the oil; and there
is an index N4 above which DO grains in Whatever orientatiuns
match the oil. Opaques, when present, are assigned to the
biMbest step, In which case the v~lue o£ N4 is not deLined.
For purposes o£ initial simplicity, each phase region is
aasumed to ranue over a distinct and Limited ran~e o£ indices;
and phase re~lon indices are assumed not to overlap. So, no
matter Whether or not the phase re~ion u£ interest has a
Gaussian distribution 01 indices, t41Ls oL phase re~ions are
de£ined by slopca approaching the horizontaL.
11 there is no index overlap between two contl~uous phase
1'e"ions, a8 10r pLa.giocl4ses and apatite, a truLy horizontaL
sLope is expected over soae ran~e o£ N.
phase re~lons overlap to some extent.
But more aeneraLLy,
NI and NJ o~ Figure 4
are the Lower and upper Li.lt 01 a phase region whose mean
index is at Xbar(R). RI, ~3, and R~ are the corresponding
cuunts 01 cumuLative .frequency (Y = L + £/2).
chosen Is Labelled a; Lor Each a there exists an ~.
Any index
kATBRIALS AND WETHODS 54

Preliwin~ry work sho.n in F~~ure 7 was done on the
assumption that a wide aap o~ indices 1n the total rock
probably exists between the upper limit 01 pLagioclases and
the next hi"her mlnerBL, say, apatite, 10r all rocks consi-
dered. De~iJlition o:f tbe total rock cumulative percent at
which the curve becomes horizontal zor such a case wouLd
provide a new WBy to estigate the modal percent 01 minerals in
rocks--the modal percent wouLd simply be the dif:ference
between ill
could be 100.
and Ra :for each phase re~ion.ll Rl could be 0; R3
Treatment of broad phase reuions in crushed rock.
Separation by ..u.~netic and heavy liquid methods 01 the
various rock pha~e re~ions in ~ sample may yield broad or
nBrrow standard deviations of the re~ractive index distribu-
tion ~unction ~or each. 11 DSD or SD values are biah and the
specimen is o:f particular interest, it may be necessary to get
lots ox d4ta. at closely spaced index intervals in an attempt
to define tne actual density :function o:f indices in the
sample. Such is the case here below with sample 363-b9.
110f course, rocks &enerally have overlapping indices fromcontiguous phase reaions. But tbe theory is young and must.first work :for simple cases be~ore development to fit aorecompli~ated situations .~kes sense.
MATERIALS AND METHODS 55

P4r~ o~ sampLe 363-69 was separa~ed by Frantz magne~ic
separator to alLow precise empiricaL de~inition o~ the ~eLsic
portion aLone. The data are analyzed graphicalLy and the
unwei"hted data are analyzed by program CUM and are reported
in Table 10 ~or DMEANBP only.
data and sbows a run o~ CUM.
CHOICE OF IMME2S10~ MEDIA.
Table 21 summarizes the raw
ALL indices ~reAted bere are measured with monochromatic
sodium Light.
PreLiminary work establishes the ran8e o~ indices to be
encountered in a phase, and an oiL is chosen o~ an index
someWhat hi~her than .ha~ appears to be the mean index of the
subJect mineral. Di:f1erent sta~e temperatures are used to
obtain immersion indices at several di:f1erent values over ~he
ran~e o:f indices o~ the SUbject mineraL pbase region so that
counts may be made.
Graphs ure use:fuL durin~ data coLLection even i~ a computer
is to be used. Plots 01 y12 on normaL probability paper can
&uide the choice of the ne~t oiL index n. Also, araphs may be
used durin" data coLLection to spo~ outLiers so that counts
may be repeated immedIately as a Check.
Havinli pLotted a point on the GorlllaL probability paper,
MATBRIALS AND METHODS 56

assume a slope simila~ to slopes al~eady plo~ted ~or o~he~
samples nea~by. Choose ne~t an oiL lnde~ which is de~ermined
by ~be intersection o~ the projected line and the 50 percent
value ox the probabili~y paper o~dinate. Plot the point
resulting xroa u count at this index and connect the two
plotted points. ProJect the resultin" line to in~ersect the
ordinate ox 16 or 84 percent to choose an index ahout one
standard deviation ~rom the mean. Count at the indicated
index and pLot the result. Count at other indices as
necessary to ~ive conxidence that the best straiaht line :fit
by eye to the data is su:fficiently ~ood ~or your purposes.
Submit the ~:ta.to computer :fit tin" ix possibLe.
When determinina a mineral aLready determined hy another
worker who has supplied a compositionaL estimate, relate the
repo~ted composition to an expected index for the POD ~eLated
by tbe p~esent work to lJM~ANHP. l:f the mineral is not trea~ed
here, a need 10r new work alonM the present lines exists ~o~
the minera L. Use the best 10rmula availahle, if one exists,
to estimate the expected DMEANHP 10r the sample. Select an
appropriate oiL. Determine ~raphicaLly or by on line computer
the temperature desired at the sta~e thermistor. T~anslate
the temperature desired to ohms halancin~ the Wheatstone
hrid&e; aet the stepped resistor accordingly. AdJust the
sUbsta.~e hea.te~ and the supe~sta~e in:frared heater to bring
the thermistor to the desired temperature unde~ the optical
MATBRiALS AND ~ETHODS 57

cond~t~ona to he used wh~Le countin~.
COUNTING INDICES IN SEG~EGATED MINERAL GRAINS.
Two me~nods o£ counting have been used: the 1irst appLies
to rando..ly-or~ented grtl.~ns;the second, to grains orien1ed by
optic ~i~ure to display the desired principal index when lit
by plane-polarized li~ht 1r~m helow.
Either hi~h (40X, NA=O.8S) or ..edium (lOX, NA=O.22) power
objectives are used in conJunction with a lOX ocular to
establish by Becke line or van de~ ~oLk ilLumination techni-
ques Whether each ~rain is less than,
~han the index of the immersion medium.
equal to, or greater
Care is taken that no
operator bias in any way ai1ects the or~en~ation 01 ~he ~rain
prior to assian..ent 01 the ~rain to the mos~ appropriate index
cateJiory.
For both unoriented and oriented grains, each grain is
assianed to the ..ost predominatin~ cate~ory it displays
unless, as happens 01teo enough to be remarkable, the ~rain is
large enouQh to display quite clearly that ha11 of it belon~s
to one cate~ory, haL£ ~~ another. If the half-volume of the
arain is comparable to the voLumes of other grains commonly in
~he field, one coun1 is ass~aned to each of ~he appropriate
cate~ories. O~her.ise, tbe Mrain is assi~ned to the category
of the most prominently displayed index. Pollowina such a
MATBRIALS AND METHODS 58
coun-t, the sa.mple is pounded to a :fine.. size -to eliminate -this
zoning prob1.ellle See more .in Appendix C under "DETAILED
SUGGEST IONS FOR COUNl'lNG l~DICES.1I
~ATBRIALS AND MBTHODS 59

COUNTiNG INDiCES IN UNSEG~EGATHD GRAINS OF CRUSHED ~OCX.
Counts 01 L, H, and G 10r the M~ui, Hawaii, rocks as well
as ~or a sample o~ the Lindsley and Smith sample 363-69 were
made without separating one mineral phase re~~on 1rom another.
The attempt was made to keep eacn mount 01 grains in oils
representative o~ ~he total rock with respect to proportions
o~ minerals. Samplin~ o~ the vi~l containinM the powder was
done by tiltin~ the vial over the slide on the stage and
tapping until enou~h ~rains ~ell out.
~~MHaou~ I~DE~ COUNTS OVEi A BROAD PHASE REGION.
An e.piric~lly drawn density function ox sample 363-69
se~re~ated 1els1cs is constructed by plotting E (percent
equal) 1rom beta-prime counts at 31 di11erent indices. During
these counts, thou"h 100 ~rains were counted at most chosen
indices, some counts were mad~ o~ as few as SO grains.
~ATBRIALS AND ~BTHODS 60

~E5ULTS, DISCUSSION AND CONCLUSION
RESULTS
ST.A'1'BbUi~T OF PitECISIO~ AND ACCURACY.
~mperatu~M p~~~.
A typicaL oil rounds to the S4me thousandths 01 re1ractive
index over a temperature ran~e o£ abou~ 2 0 Celsius. 50
,emperatures should be cODt~olled to +/- I DC ~or work rounding
to thousandtb~h Temperature controL in this work is precise
to at least one and possibly two orders o~ ma~nitude better
'Uu:Ln required.
~R~tabiLity 01 ~merqlgD medium ca!ibrutiona.
Usin~ the enLarged version of the JeLley re1rac'ometer
(Appendix B) incre~ses pr~cision from about 0.0008 ~or the
unmodified model to about 0.0002.
Eighteen readin~s ~:f index (N) VS. temperature ('1') were
taken on 4 litLrch 1~72 for an oil La.beLed 1.536 (at 2S DC in
sodiuw Li"ot) by the aanuf~cturer. The resulting equa~lon
chosen was 0.1 second degree, and it indicated a re.:fractive
index of 1.5~61 at 2o.U DC. 7he same oIL was again c~librated
with 7 readin~s of N ~s. ~ on 7 Ma.rch 1~72. .A second degree
eqUAtion was aj£ain chosen. It ind.i.c ... ted a re.fra.c·tive index of
~ESULIS, DISCUSSION, A~D CONCLUSION 61

1.5355 at ~50C. A combination of the data from the ~wo days
resul.ed ~ll 25 da.a poiuts and a second degree equation which
was vir.ualLy a s.rai~bt line. The lndica.ed refractive index
1.5359. Ihe si~ni1icance 01 this work is that
repeatability of immersion medium calibrations ~o 3-pLace
accuracies seems to ho~d tor as 1ew as 7 da~um poin~s.
~IQeral_Ln~~~~m§Bi-QrecislQn aD~-A~A£X.
ALL re~ractive indices meaSured by the presen~ study are
SUbject to inaccuracies wbich may be present in ~he numbers
the indices of the Cornin~ calibra.ion gLass and
the quartz owe~a used in calibrating the system. Independent
corroboration of these values wouLd be ideal, but lack of such
corroborca.t.ion here does not reduce the use1ulness 01 .he
derived reLationships bet_een DUEAHBP's and .indices 01 known
POD's.
Indices obtained by varyln~ the temperature In a sin~le
medium rather than by cban~in~ the medium itself are reLat.ive
ly wore precise, ~robabLy beln~ on the same order 01 precision
as is the ability to reproduce readin~s on ~he b.ig refracto
meter acaLe, i.e. O.OU02.
~ESDL1~. DISCDSSIO~, AHD COHCLUSION 62

Since use oL more tban one oil produces a systema~ic
ch~D~e, i1 m~~e ~ban one ~il is u~ed, use o~ as many oils as
possible results in aver~Ming the systematic errors o~ each
and tends to improve accuracy.
ALtbouuh the double vari~tion method has not been used in
this work, use oJ: that method would reduce the number ox
immersion media required Lor most mine~~l work and wouLd
thereby allow incrensed precision ~nd accuracy.13
Grains o~ ~be Cornin~ ~Lass were 10und to disappe~r over a
zone o~ up to about .OOO~, in accordance with the resul~s o:f
SayLor (1~~5).
The conclusions oL Gillber~ (1960, p. 509) ~re pertinent:
"For ~ rexractive index, accur~cy oi 0.001, orientation er~or
is of LittLe igpor~ance cQmp~red with the other errors in
routine determinations b~ the immersion method, ~t Least :for
miner~ls with weak to strQnM hireLrln~ence. Only lor minerals
with very stron~ bi~e1rinMence, e.g. m~ny carbona~es, need the
orien~u.tiOll be per.£ec t.
13Emmons (1928, p. 506) used only IJ Liquids to cover ~he
&·a.n~e of ind..ices ufrom 1.40 to 1.1~ without a single interruption, and usualLy with conslder~ble overlap."
R~SUL7S, DiSCUSSION, AND CONCLUSION 63

"When an accuracy ox 0.0005 is desired, the orientation
must be almos~ per~ect ~o~ minerals oL s~rong and very strong
hirefrinMence. In the case of an accuracy of 0.0001, the
orientation must be per~ect e~cept for minerals with very weak
birei:rinMence. 1l
Examination of outlyina data points and addition of new
data to test the trutb of outliers or reduce the residua~ In
a~l CBses resulted in discovering errors. These were most
often linked to a series of data taken with an Blmost dead 12
It was at the
time the dead battery was producin~ sporadic readings tha~ an
accident with too much heat from a soldering iron produced
such strains in the staMe slide &Lass that a new stage s~ide
and thermistor had to be built and the entire
recalibrated.
system
The six weeks' of reaul-tin.. down time in operations was
used in part to make the Nova program more ef1icient and the
electronics more precise.
Whereas the conclusions of GilLberg are based on pure
theory, the resu~ts reported here are empirical, and it is
important to reaLi~e tbat the present resu~ts encompass
inaccuracies of caLibrBtion equations, operator errors hoth at
the refractometer and at the stB~e, and fluctuations due to
temperature variations.
RBSDL7S, DISCUSSION, AND CONCLUSION 64

The standard erro~ of ·the mean (SDM) is never lIIore -than
0.00125, is usualLy less than 0.0005, and is at times below
0.0001 (see Tables 10, 14, 11, and 19).
:MINERAL RESUL'IS.
Plagioclas» resulia.
Pla~ioclase weight percents were de~ermined by microprobe
(analyst, Fodor, R. V.) for samples original to -this work
and not previously reported in tbe literature. These were
done at the courtesy of Dr. Klaus &eil, Direc~or, Institute
o~ Meteoritics, University o~ New Mexico. They are reported
in TabLe 9. Estimates of An and Or in TabLe 9 are mine. They
are based on ideal ~ormuL8s and molecular weights as given by
Johannsen (1869). The proarwn Which calculates these esti-
mates is av~ilable on request.
RESUL7S, DlSCUSSIO~, AND CO~CLUSIO.N 65

TabLe 9. .PlagiocLase JIIicroprobe anal)'ses.
CaO NlA20 K2 0 An Or Xbar s Xbar sAn An Or Or
OO.11:.l 11.689 .012 00.56 0.07OO.Oba 11.251 .02S 00.36 0.18
Pl OO.O6~ 10.980 .1~0 00.36 o.~~ 00.54 0.22 0 • .32 0.2600.155 10.796 .054 00.83 0.3500. DbB 10.901 .03B 00.37 U.25UO.151 11.204 .036 00.78 0.22
02.446 0&.630 .386 12.67 2.380~.474 09.42~ .340 13.07 2.14
p'.' 02.269 OB.453 .446 12.01 2.81 12.54 0.59 2.54 0.32"'"02.37B 10.044 .3~S 11.93 2 • .3202.357 09.645 .485 12.1~ 2.9902.442 09.023 .40.3 13.36 2.63
08.~86 06.188 .150 45.34 0.9208.~43 06.JOO .165 45.02 0.S909.275 Ob.l08 .148 46.73 0.89
P3 09.375 06.308 .140 46.23 0.82 45.69 0.60 0.81 0.1509.085 06.~64 .092 45.36 0.5509.103 06.500 .130 45.79 0.7609.4,1b 06.572 .126 45.37 0.72
10.,177 04.986 .~29 53.14 1.4410.307 04.787 .258 54.93 1.64
P4 10.816 05.370 .299 53.24 1.75 53.61 0.65 1.44 0.2510.577 05.490 .193 52.48 1.1410.2.35 05.107 .18~ 53.45 1.1410.570 05.155 .251 53.80 1.52
K~SULlS, DiSCUSSION, AND CONCLUSION 66

TabLe 9. (Continued) PLaaloclase microprobe anaLyses.
Cu.O ~a20 6.20 An Or Xbar s Xbar sAn An Or Or
14.172 03.24,) ••WB 71.07 1.2413.765 03.490 .216 69.B5 1.2913.877 03.714 .126 68.19 0.7415.~16 02.621 .153 77.30 0.~9
P5 14.440 02.885 .170 73.85 1.04 71.24 2.88 1.03 0.2314.064 03.132 .165 71.78 1.0014.14.2 03.300 .106 71.11 0.6413.873 03.659 .199 68.21 1.1714.443 03.5Jl .215 69.74 1.24
16.010 02.561 .087 78.20 0.5116.6~4 02.1.14 .132 81.62 0.77
P6 16.040 02.305 .156 80.20 O.UO 79.97 1.26 0.83 0.2015.945 02.393 .1&8 78.77 1.1116.480 02.218 .149 80.65 0.8710.439 02.258 .13~ 80.39 0.d1
17.220 01.650 .12~ 85.34 0.1417.450 01.658 .108 85.53 0.b3
P7 16.702 01.874 .1-33 8J.30 0.79 86.35 2.25 0.50 0.2417.494 01.034 .048 86.04 0.2817.694 01.355 .043 88.24 0.261S.5~4 01.219 .056 89.63 0 • .32
19.158 00.508 .000 95.68 0.0019.1~6 00.691 .027 94.06 0.1618.9~4 00.795 .037 93.14 0.22
PB 19.545 00.723 .064 93.73 0.37 94.12 1.19 0.17 0.1319.701 00.444 .010 96.26 0.0619.494 00.787 .024 93.44 0.1418.918 00.803 .012 93.19 0.0718.92.3 00.739 .056 93.46 0.33
RESUL1S, DISCUSSION, AND CONCLUSION 67

In the .followinll tab les o:f indices, su:ffl:xed to "the retu.-ns
direction to wbich the data apply unless the indices were
measured as randomly encountered, in whlch case the su:f:fix is
UP. Thus, su~~ix B is ~or heta; GP Is for ~amma-prime.
Pre:fix N atd-llda :for the number of indices at whlch counts
were md-de. The con~used N notation is un£ortuna"te, but
context makes ~he meaning clear.
An estimate 01 tbe number 01 grdins counted is obtained b¥
the product 01 Nand 20 .for counts in known POD's;
100 :for beta-prime counts.
o:f Nand
RESUL7S, DISCUSSION, AND CONCLUSION 68

JOI~
tnI~
~f"r-r-..or
O~..o"'N'"..0 ... 00000UlOOOOO-7>InOOOOO'
~ ..,~~OOOOO'"
.0(") 0 Or- ...
..o~O')"'-4'"N0040000InOOOO:>-4lJ) 0 '0 ;;) :;) 0 :n• • • • • • •:X)"'OOOOOOO
o,Q(")~r-Nr:")oor-o ... o00 <0 0 0 ·0 0~OOOOONIn ~ ·0 0 0 .;;:) .J)
• • • • • • •11)00400000..0
'It'tnoo4DO·O0)000-40(") ...... 000~OOOOO(")'I') :;) 0 .::1 00 -4• • • • • • •tn-40000::l"1'
~ rH'" "? 0 n...... r- ... ~ ..."'-400·:10.,~OOO:lorI) 0 0 0 .':)::) •
:"1 • • • • • "1)...... 00'000 ...
r-.o 0 f'" ..., r--~ 'J) ...... ~ ...~"'-400QC?UO~O~~
(1)00000'.'"• • • • • • •-O ... OO::lOOl3
... o..,coo·~In 7 ~ ... ~ ...r-. ... ooooo(")':»00:;)0'"IJ)OOOO.:J'
tn • • • • • • "J)...... 00000 ...
Ml'tOODO'I) ... l.O ...... to41'oo4:>OOO!)(')0000:)0lnoo':)':)O,
... • • • • • • 0
...... 00000004
~ ~.~ 0 "1' '0o ... l' (') 1""~ rot ... :) 0:1(")0::)00000It)::) 0 :» 0 ':» .0
."""'"...... ~::)O::)O ...
... .0 .....0 'It' ,0O)~r;f)N"'M-r., ... 000lJ)OOOO::l~
tn:::lO::lOO:')• • • • • • •'X)"'OOO·OO·jQ
'" N ';() :") In ofOOD-"O ... ~ .......... 00:;:10'f) :;) 000 I;) '~
'./)'00000:0• • • • • • •
r-"'OO:;)OO~
(") ~ C'H1) r- ."r-O·7)O"'O'10(')00001'00oo·0rlJ)OO::).oO'"• • • • • • •.0 ... 00 0 0 Q ,:')
» ... In '0 ~ .'"... ,X) :» ... '1' ...C?~·ooooofOOOO:::lil)lJ) ::l 00 0 .;;) l»• • • • • • •·0"'00'000..0
.Q N ~ ~ jQ it)"'":)\O"'f")'":1"00001'0..;10001'lJ);)O:)::IOO
"1' • • • • • • •"'-40000~0)
~"''1'~''''''''If) ... II) ... ~ ...~~ ... oooC?o..;IOooo,'"lJ)OOO~Oll)
• • • • • • •it) ... 0 :;) 0 0 :;) ...,
to) If) 0) 'n l"O ..,~ .X) 'Xl'" N ...r- ~ 00 0 .::)(,)00000'"Ino:;)o~ol»
• • • • • • •r- ... o'OOOO1'
Cl)>QlJ)(")"'~
0.Qr- ... ~ ...t)~":)ooo
,~OOO~O':?
'f) '0 ':I 0 :) '0 :')., ............. 0000011)
r- ... 11) II) '0 Inr-"'OO"'N'"~C')o·:)oo
(")000":)":)..0'1) 0 0 ~ 0 0 ro
IJ) • • • • • • •...... ;)oooor-

Table 10. (Con~inued) Plagiocla~e Indicea .frolllthis work..
P4 A-115 U116 oi3U~-~ 363-09 5.2BE-35 HK1955 ~5 HYL1950AP SE
NB .:; 8 0 5 no da~a 11 4 5 6lJi£EANB 1.55B53 1.560b7 1.So311 1.56~OJ 1.56161 1.56852 1.5b9il2 1.57034D~~H O.uUO~l 0.OUl05 0.00171 O.OC1S! 0.00164 O.OOI2~ O.0015~ 0.002~8
DXB O.Oa087 O.uulOO 0.00077 0.00044 0.00074 u.00051 0.Oul10 0.00095SJJl\l.il U.OOUO~ O.uuOl~ 0.OU020 0.00011 0.00013 0.00010 0.00014 0.00020::i!lsn 0.00014 0.00029 0.00027 0.VC02~ 0.OOO~2 0.0002H 0.00018 0.00038SDXh O.UOOll O.OOul~ 0.00020 0.00017 O.OOOla 0.00010 0.00014 OQOO021SD.d ~.73 11.0lj 9.2d 10.~S 10.33 10.44 4.9ts 7.:J3
N1;~ 7 19 4 ~ 31 13 5 9 11J)~U~A~JjI! 1.55100 !.5G020 1.50177 1.5CiJ~1 1 • .>6411 1.56757 1.5b810 1.56805 1.51015lJ~ll.uP O.Uu~O~ O.001b5 0.00172 O.OOI~d O.OI0~9 0.00336 0.00158 0.00238 0.00308LX.llP 0.00079 o.uUoJB 0.OOO~4 O.OOOJ~ o.ou~~~ 0.00073 0.00U37 0.00089 0.OOOS4:iJJlli.llP ·O.OOol~ o.uouO~ 0.00u03 0.OL012 0.U0028 0.uu020 0.00009 0.00020 0.00013SJJS.up O.OOO~o 0.uOOI0 O.OOLu~ 0.00024 O.OOOtio 0.OOO~7 0.u0013 0.00027 0.00020SJ)XhP 0.00020 0.000u4 O.OOOUJ O.UGOll 0.OuO~9 0.Ou023 0.00U09 0.00020 0.00012S,&,ijp b.~3 4.1b 1.9.l 7.2S 6.0~ 11.24 5.02 8.24 5.32
R£SU~TS, DISCUSSION, AND CONCLUSION 70

~~hle 10. (Cun~iDued) Plagiocl~se indlcea ~rom ~hia work.
HK1~b~ SO)~V-32 P-24 :)2HE-2~ Po S5BE-1 P7 P-1~ PB\;2
Nti 5 5 4 .oj 1~ 4 13 .;, ~
DbU~ANjj 1.~70b7 1.;)7u~.l 1.ti7.l10 1.S72.Jb 1.;)7492 1.57861 1.57997 1.5b2~2 1.5H412JJSIJD 0.OU1!~ U.UO.lbl O.OUIOA O.~CIJJ O.uOlaO 0.00172 0.00252 0.00U74 0.00170DXH 0.uu002 O.UOO~2 U.oUU6oj 0.OGOl4~ 0.uOO~9 0.000cl8 0.OOi33 0.Ou03H 0.OU130,sJH.B O.uOUU~ U.UOo~4 O.~~Ol~ O.LGUlu 0.OU011 0.00011 0.OUO~2 0.00030 0.00013o:a.u£lJ 0.00012 0.u0042 u.o0026 O.OOO~U 0.00u16 0.00026 0.00035 0.00060 0.00u21SllXli O.OOOOd 0.Uuu~4 0.00010 U.00017 0.00011 0.00017 U.000~2 0.0002S 0.00013SLl.ti .,.35 ~.4~ 11• .)2 11.~7 8.74 6.52 11.46 15.79 6.77
N.dP 11 9 B b 19 10 10 7 7.o~EAN.aP 1.ti71~2 1.S70~7 1.57197 1.~72~ci 1.57410 1.57898 1.57770 1.5~103 1.5~287
.lJS.j,,~P 0.00~~4 O.UU~27 0.OOi~2 0.OG3L~: 0.OU2d8 0.002d~ 0.OO~41 0.00~d2 0.00553
.ux.uP O.UU05oi 0.OUu90 0.uU04~ O.UUO~O 0.000b5 0.00092 0.00075 0.00058 0.OO15a::iD.:..HP O.OU01~ O.0001~ u.OOu1.l O.OUOOd 0.OUOl1 0.00021 0.00015 0.00007 o.oooaoS!)s~P 0.uOO~8 O.Ouub& 0.Ou027 0.00024 a.Ou017 0.OOO~4 0.00024 0.uuU20 0.00053S.uXLlP O.uUOi7 a.OoO~3 0.00011 O.GOOlO O.~UOil 0.00021 0.00015 0.00008 0.00030SJJ.dP S.11 7.0a 7.t>3 ..).68 t>.31 9.93 5.49 3.3S 5.89
RESULTS, DISCUSSION, AND CONCLUSION 71

Xp1.59 r---r--r--,......--,r----,.----,---.---:---,.--r-~-~-_r-...,
1.58
1.57
1.56
1.55
1.54
1.53
1.52 l---'o--I---'---.l...---'o--I---'---~--'o-,:-:5=7:--""'---:,~5::;8:--""'----:,-::.551.52 1.53 1.54 1.55 1.56 . . .
Xpl
rJ.gUl"e 5. DMEANB as 4 1uncclon o~ DMEANBP in plaaioclases.
~~SUL~S, DISCUSSION, AND CONCLUSION 72

statistics for the third de~ree equation relating DMEANBP
to D~EA~~ in plagioclases (Fi~ure 5) are returned b~ the
Table 11. Analysis of v4riance forpolynomial fit to pla~ioclase index da~a.
3 degree
SOURCE OF DEG. OF SUli OF MEAN FVA1UAl'.lON FRE.EDCM SQUA~ES SQUARE VAL.UE
LiNEAl( :tERM 1 .00594u7 .0059407 6485.7QUADRATIC :fER... 1 .0000001 .0000001CUBIC TElolM 1 .0000053 .0000053DEY. A.BOUI REv. 22 .OUOOUt»7 .0000003TOTAL. 25 .0059529
The Fisher s~atistlc (F value) indicates that the data are
~ood to better than the
(Neville and Kennedy,
personal communication).
1 percent
1964, p. ~13;
Level o~ sl~nificance
Dr. Harold G. Loomis,
These s.atistic~ generated such small numbers as to induce
a zero divide, so it was necessary to convert the HMD05R
packaaed pro~ram to double precision throughout (incLuding all
called subroutines). The double precision version was checked
against the unmodi~ied version of ilMD05R as kept on d1sk by
the University o~ Hawaii Computing Center. The returns were
RESUL~S, DISCUSSION, AND CONCLUSION 13

identicaL xor duta which did not produce such extremeLy small
values.
RESUL7S, DISCVSSION, AND CONCLUSION 14

Tuhle 12. Pla.ioclase 2VZ's geasured in this work.
PI1'-25Ulll2693lJ112P-5P-8P3p4A-175lJ1165~IN-2
.3b3-0952ljE-35lili.l&55AP1'5HML1950SEJiK1868G255MV-.J2P-2452llE-29P655H£-11'7P-lbp-8
2VZ's
85.b,~2177.~.7b,87.0185.7~,8~.4,76.4,77.2
87.4,~2.S0.4185.8,'5.0,83.4t77.8
~O.4,88.0,7d.4,~2.~.'6.0,do.O,84.2
H3.4.~2.0.8~.0,b8.4.90,d5.8,d2.2,83.4
87.b,~S.4,86.8,d8.4,84.~,~8.6,81.8
~2.4.~5.8,db.4,8l.6,SO.8,79.0,~1.6.92.4,84.6
9~.u.~b.(;
91.8,~5.4,84.0,7~.t,78.~,~8.2,bO.4
b1.b,86.08~.4
77.0,7~.5,7~.8,81.6.i4.o,87.8
1U1.0,101.0,100.4n.d.~3.u.8S.5,83.4,8o.4,80.0,dJ.8,81.2
77.6,73.4,8~.2,~O.O,77.6,71.6
&7.0~2.2,7 5.bt~.b, u~.O, 69.0,75. 0,'92.2,90.88u.5,~5.4.79.0.79.2,65.0,8u.0
8~.4,&i.4,d7.0,~1.4,S2.4.iS.6,84.2,89.4
80.&.91.b,88.o,b8.69~.O,~b.O,91.b,9d.t,88.2
94.2,~1.4.~4.4.B6.4,~5.0,9a.4.89.6,97.6
S8.b,S5.~,96.4,~b.G,SO.4
aO.8,aS.2,87.8,99.5.S1.b,10U.6,102.699.2,108.2,d6.u,95.6,93.0i77.2(a~)
~2.4.102.6.94.4,10j.4,95.6
Xbar2Vz s2Vz
80.28 4.6579.33 4.3786.30 4.7585.40 3.0986.71 2.718b.07 4.7394.00 2.H~
83.80 5.1083.~0 3.11
7~.88 4.56100.80 0.35
85.33 4.6378.73 6.65
~3.42 9.34~1.52 '2.9186.9~ 5.8087.40 4.6293.28 4.0692.70 4.019J.44 3.6695.44 5.6193.20 10.72S8.48 6.29
HHSULTS. DISCUSSION, AND CONCLUSION 75

Tablu 13. PLa~ioclase dnortbite percents est~ma~ed ~rom
s~mple's mean beta inde~.
An sr;c 1 An Sc;C A'n SE;C.
pl Oo.l.u;i 0.70 1'4 52 • .lu 1.J5 55MV-~2 7.5.70 1.50P-:.l5 04.~~ G.~1 A-115 5b.57 1.b4 P-24 78.27 1.35Ull.1 10.4~ O.~17 Ul1u bO.85 1.33 52BE-29 78.19 1.281'2 14.9J 1.09 53Il~-2 62.71 1.35 P6 83.21 l.bO2693 .17.0~ 1.15 52BE-35 69• .1-1 1.~b S5J31::-1 90.27 1.6~
u112 22.70 0.78 H.Kl~55AP 71.b6 1.97 P7 92.7~ 1.51P-5 ~1.86 0.07' PS 7i.~~ 1.,.j5 P-18 97.85 1.281'-8 40.31 O.4~ ~ML1950SE 74.8~ 1.73 P8 &~.51 0.50p3 47• .l.1 0.99 hKld6~G2
lDAoEd.NB is entered in tbe 1orl1lul4 of Chayes (1952) andis 41su entered with the s~mple's Xbar2VZ to ~ormulas
based on tbe urapns u~ Sm~tb (1956,1957) ~or a separateestimat~ o~ An content. The mean o£ the two valuesreturned is here ta.ou141:eu d.S An; sec represents haL~ -theabsolute value 0% the sum o£ the An contents returned bytue Ch4yeS 10rmula and the £ormuLas based on Smith's.rapbs.
RESULTS, »lSCUSSION. AND CONCLUSION 76

Tab4e 14. 04ivine Indices £rom ~hls work.
------ _.._----,J.JG-~52 pcc-1 BlIL1950 HK1868
~ G2..-
4526 M3 5111 liS 5107 N4 54087_'7
NBDMEANBDSDBDXBSDMBSDSBSDXBSDlJ
NBPDMBAHBPDSDBPDXBPSDMBPSDSBPSJ)XBPSDBP
NBDMEANBDSDIJDXBSDMBSDSBSDXBSDa
NBPDMEANBPDSDBPDXBPSDMBPSDSBPSDXBPSDJ:JP
DTS-1
61.669350.001870.001080.000180.000270.000187.76
~
1.672660.008620.001040.000250.000420.000243.73
41.696670.0030.10.001670.000590.001190.000i»817.10
81.696400.009920.001690.000400.0007.10.000394.53
51.670130.001000.000460.000180.OOC2~
0.0001~
13.48
91.6723~
0.008560.001770.000420.000700.0£10415.49
71.735630.. 00.4.410.000380.000180.000260.0001711.27
131.736840.127980.000620.000820.001250.000787.03
101.671620.002730.000900.000200.000330.000207.60
151.b70460.0.11~O
0.00U840.000270.000370.000263.46
31.738220.00.2610.005280.000240.000450.000247.32
51.739360.011470.001380.001250.002840.0012111.21
81.688520.008140.000820.000820.001480.0008212.36
51.692190.011600.000520.000540.000840.000544.54
31.755930.003790.001200.000490.001050.0005210.56
41.757250.012670.001630.000620.000910.000613.87
71.689350.002930.000840.000340.000500.0003410.98
71.699240.010340.000910.000580.000780.000585.43
5181 119
61.804210.003010.001900.000450.000690.0004613.14
lo.i1.798530.014040.000940.000400.000550.000403 • .99
RBSULTS, DISCUSSION, AND CONCLUSION 77

Tabl.e 15. Olivine 2VZ's measured in this work.
biBASUiU3D 2VZ's Xbar s(Kamb me tbod)
DTS-l 84.2,84.6,85.0,86.4, 88.86 3.6188.6,88.6,92.0,92.2,a2.6,93.4
JJG-,JS2 84.4,86.2.87.0,88.21 , as.6S 2.7990.4,90.6,91.4,91.6,91.6,92.6,92.6
PCC-l 87.0,87.4,89.5,89.6, 90.71 2.6490.2,90.2,91.2,93.4,93.4,B5.2
HbiL1950SB 89.4,90.2,90.2,93.6, 94.44 4.5094.0,94.0,94.4,94.6,100.4,103.6
HK186BG2 64.2,65.4,66.2,69.2, 67.20 2.8171.0
4526 113 84.0,94.8,95.6,96.8, 96.00 1.4397.4,97.4
5111 115 96. 8,~Hi.8,99. 6, 100.67 2.06100.8,101.0,101.6,101.6,101.8,104.0
5107 114 100.4,103,0,10J.~, 102.55 1.45103.b
54087 117 100.4,10J.6,105.8, 104.35 3.10107.6
5181 liS 96.6 1 ,9ij.6 1 ,112.0, 111.00 7.90113.2,114.0,114.0,114.6,116.6,119.4
l~easured on ~xazi all others measured onB,Xax.
HBSULTS, DISCUSSION, AND CONCLUS~ON 78

Table 16. Forsterite es~lmates 1romwean heta indices o£ this work •
.Estil1lated ~r()m data of Bowen andShairer (1935) as presented by Deer ~~. (1967, v. 1, p. 22).
DTS-l oJ.JG.352
PCC-1 HML HK18681950S£ G2
4526113
5111tl5
5107114
54087117
5181119
Fo 78.00 59.~0 58.65 50.30 27.70
RESULTS, DISCUSSION, AND CONCLUSION 79

•r....
00):»)0000.:0 :') 0 004 ..., .-4NN .... OO·:>O':,)OOO~"1r--OO~:>:>O
• • • • • • •~~OOOO<:>·O
N :lO r-- ~ ~ ,.,0) r-- .:') If) .").... ~ O;:>·':)~
o ':) 0 .~ 0 ':) ....r--OO~OO'
• ••••• 0~""·O 0 0·0'0 ....
OONXl:?N~('It'-.l() .... "')-4·t'-~":)O:;,':)
~OOOOO~,:).::100·:>0 ....• • • • • • •
II)~OOOOOf1)
'0.0'0 ~ "I .~!J) .... ~ .... :')N~('I .... O·~O~00~0·0t',Q ;:) 0 .~ :> :> ~• • • • • • •l' ~ 0 0 0 '0 0 I/)
r-:O(1)OC?:7):»00"'1:')'""'~""O':)':):7)OOOOOt'O,:»O,",O:;)ro• • • • • • •
~ ... OOOOOI/)
00"f0:,)0tJ')O .-41'~0) ('") :» 0 0~CO~OQC't
4QO':)001/)• • • • • • •
('")~OOO:»O1'
... ~ ..., 'I) 'I) 'I)
~"''1'''''~'''O)':"tOO:;'O:0000:>01'o .;) 0 0 Q 0 ~
• • • • • • •~"'OOOOQtJ')
~"1-DO.l:JO
t"':"'l'Q~1)..., .... '00:;, ...X)'O'O':;) 00('")000 '0 ~ 0 •·..... :;)
'1' ... 00000 ....
I' r- '11 .f) ~ OX)r- r- OIl l' !/)N~"'':I.-4;:).;'')C400000r.000000'.' • • • • • l'
r-- ... 0 .:;) ;:) .:;) 0 ...
CQ
~~ :a~~~"=t~~:n,<~
r:Q~:I2><q~~~Z ~ ~ ~ '12 '12 UJ 11
(")...0.0..0 ........;") II) )0 .l) 0 .l)~~OO .... O01000:101'r--OOOOON•• • • • • • •"1 .... 00000..0
N..or-r-- .... r--!'II r-- .., -0 J) '0ro.» ... -oOO:10':)0':»04C"'OOOOOll)• • • • • • •
.0"'00000-0
0 1'0):'):7)<') "OIXl ~
MJ)0040 0000000·0r--00'0001l)• • • • • ••"1"':lOOOOr-
:? l' .",,: on 0 'n":) ,., ..., "" .:Of) "":'?oXl .... OOO000'000:")r-ooooo oo4
• • • • • • •"'foo4'OOOOO~
o ... "o .... .,,~
J)1'~~4'"Qrooo':)oOOO:lOOIYJ1'0.0000:'3)• • • • • • •0 ... 0·000011
.., Q ·4 "'1 OX) 'I
." :Of) ... ;f) I' J)roY)-4000.J~ ~o ~ .~QC?
..o~QOQO:?
• • • • • • •1''''00000.0
'101:")4r-",1'..0 'I) 'lO ('I .,. ~r-rooo·':)oO)oOOoor...000000;(1
• t • • • • •...o ... ·OOOQOt?
'O~,Q('INN~["INc)'1'o)
"i':) .... ':)-4:;)0) ... 0 ,':) 0 ;) 000000':) ...• • • • • • •'O .... 'OOO~OJ)
(") ... "'.,.11)1'o (")t'-Mro'")OJOOOOO.1) 0 0 0 ':) Q 00..0'00000(")• • • • • • •;) .... ooooo..n
o00

TAble 17. ( Continued) AUli'&' tic c linoP:ll·ox~ne re£ractive indices J:rom thiswork.
~O~ 1~3 254 2-1~ .UO;,t 187 250 249
NB 4 4 J .J ,J 3 4 5
U~EANH 1.70..27 j,.70..&5 1.70bJ5 1.7(flJ.3 1.70792 1.71201 1.71394 1.71670USDJJ 0.u0320 O.OOa7~ 0.00266 O.OO~~~ U.002~8 0.U0217 0.00296 0.OU354uXti U.OO~~6 0.UOl11 0.uOO~5 O.UOuYd 0.0007b 0.OOO~9 U.00177 0.00104Sj)Al.8 u.OUOlb U.00041 U.OOO~4 O.OOU~9 0.00026 0.00023 0.00U23 0.00035SuSb O.UOO~b a.QOlln O.OOO~i O.OOUoO u.00051 0.00040 0.00U43 0.00065s.uXti 0.00U15 0.U0045 0.00014 U.Ouu~1 O.OOO~i 0.00024 0.OUu25 0.00034S~li J.40 ~.24 4.00 10.2~ i.4d 7.77 6.51 8.60
NllP 5 0 ::i 4 5 4 6 6!HlliANhP 1.71170 1.iu~79 1.71111 1.71d81 1.71552 1.71bJ8 1.71967 1.72334!)~£lJP 0.Ou~54 u.uO&l~ 0.OU658 0.ou7du O.OObJO 0.00306 0.00820 0.00740DXBP U.OOl~~ o.ouua~ 0.00072 O.OOl~J 0.00173 0.00318 0.00117 0.OU057~JJU.tU! O.UUU~ti 0.Uu056 0.OuOJ6 U OOU72 0.00044 0.00108 0.00050 0.00030SUStiP O.0007~ O.OOOdl 0.00060 0.00119 0.00065 0.00234 0.00085 0.00041~D},JJP 0.UuO"5 0.00055 O.OUO~5 O.O~071 0.00044 0.00125 0.U004~ 0.00029SDJ:iP 5.2d 0.50 4.90 7.';'7 4.32 14.36 b.48 3.74
~:E~1JLT.s, DiSCUSSION, AND CONCLUSION 81

Table 18. Auaitic clinopyroxene 2VZ'smea.sured in 'tbls work.
2VZ's Xba.r s
Px-l 62.6,12.8 67.70 07.2J.128 70.8269 68.0259 7~.6
1~9 63.6,69.4,6J..0 b~.67 04.30153 85.4254 80.0,19.8,79.4 19.73 00.3J.1972cpx 62.0250 63.0,88.4 76.00 11.54.l49 60.0
RESULTS, DlSCUSSIO~, AND CONCLUSION 82

The re~son ~or the aug~tic pyroxene 2V's be~ng greater than
those measured by other workers ~or the same samples and
greater than augitic pyroxenes shouLd display accord~ng to the
literature is not known. It may be a ~unct~on o~ these
present 2V's havina been measured quantitatively by the Kamb
method, whereas the methods o~ other workers, generally not
stated, may have been qual~tative estimates based on the
curves 01 Wright (~.&. Bloss, 1961). Comparison (not shown)
01 the ~V'a measured by Borg and Heard (1970) to those
reported here in Table 1~ discloses reasonable a~reement, on
the other hand.
RESUL7S, DISCUSSION, AND CONCLUSION 83

Ortho~~~!~)e resul~.
Table 1~. Or~hopyroxene ind~ca~ £rom this work•
....<;-.352 128 211 Id~ 25~ 227 254
NGP ~ 4 4 3 4 4 5DMEANGP 1.67396 1.11500 1.72311 1.7~3J5 1.7349G 1.13b58 1.74031DSDGP 0.U0154 0.OU201 u.OC1~b 0.00095 0.0009J 0.00144 0.00121DXGP 0.oUI04 0.00118 0.00054 O.OOO~d 0.00078 0.00010 0.00115S1>WGP O.Ou02a 0.00024 O.OOOl~ 0.00007 0.00007 O.u0007 0.00014SDS~P 0.00030 0.LOU41 O.OOOJS 0.UuOl0 0.0~012 0.00014 0.00019SDXGP O.OOu~3 O.OOO~~ 0.0002U 0.000U7 0.00007 0.000&8 0.00014SDGP 15...7 9.27 1.1.S6 4.J7 5.80 4.28 7.97
~JjP 5 3 6 3 5 4 4JjJ.l.J:ANBP 1.668.35 1.70675 1.71626 1.72d~1 1.72932 1.73075 1.73296.llSJJdP 0.00228 0.006~2 O.~OB08 0.00376 0.~0576 0.OO~05 0.00581DXBP 0.00073 0.00151 0.00117 0.00043 0.00081 0.00080 0.00152oS»biUP o.OOu17 0.0001~ 0.Ot06~ 0.00014 0.00043 0.OU015 0.00018SuSBP 0.00025 O.0002b O.0010~ 0.00030 0.00006 O.Ou02~ O.OOO2aSDXdP 0.00016 0.00018 O.OOOb~ 0.00014 0.00043 0.V0015 0.00018S~BP 4. tiS 1.77 7 • .39 3.21 1.20 2.56 ~.27
BESULTS. DISCUSSION, AND CONCLUSION 84

Tab1.e 19. ( Cun tinued.) Ort bOPY~'oxene indices 1rom this work.
15.J 205 248 187 250 .249 171
Ntil' 4 ~ 4 3 4 3 4DMEANGP 1.741~0 1.74343 1.i~a67 1.7b472 1.75761 1.75962 1.76401l.l,sDGP 0.0011~ 0.u0007 O.UOOSb 0.00174 0.~011~ 0.OU114 0.002~6
l)X<iP 0.0009u O.OOO~~ u.OOO~J 0.O~077 0.00061 0.00062 0.00143SD.NGP O.OuuOo 0.0009J O.OOOLg 0.00010 0.00013 0.00011 0.00031SD::ivP 0.00u08 0.u002o O.OOOlJ 0.OuU14 0.00018 0.00017 0.00069SDl..UP 0.00006 O.OUO~~ O.OaOud 0.00010 0.00013 O.OUull 0.000a9SDGP 3.04 23.80 7.53 3.7~ 6.77 0.43 9.08
~BP 3 4 3 4 5 5 5D~EANBP 1.7J406 1.74014 1.741tJ 1.747~8 1.75083 1.7527~ 1.75793j)~.Dap 0.OOu~6 0.00285 0.OC7~9 0.00623 0.00497 0.00559 0.007S7DXbP 0.OUI06 0.OU057 0.00117 0.00115 0.00097 0.OU096 0.00116SDAldP O.Ouu~3 O.OOU7J 0.00004 0.OU074 0.00036 0.00020 0.000b1SDSBP 0.00u54 0.0012d 0.00105 0.00099 0.00069 0.00034 0.00106SDxap 0.00033 0.00073 O.OOO~~ 0.00071 0.00037 0.00020 0.00058oSDbP 3.87 17.2~ 6.0.1 ~.21 6.00 3.55 7.35
M£SULTS, DISCUSSlON, AND CONCLUSION 85

I.GO
1.79
1.78
1.76
1.74
1.73
1.72
1.70
'.69
,.G8
1.67
Fi"ure 6. POD indicesDMEANBP in olivines,orthopyro.xenes.
iii " ORTHOPYROXENES
Q ·OLIVINES
b> .. AUGITIC CLINOPYROXENES
as a. function ofa.ugltes, a.nd
RESULTS, DISCUSSION, AND CONCLUSION 86

Table 20. Statistics o~ strai&h~ line equa~ions £i~ to olivine,cpx, and opx data.
STD. E~ROR OF ~BG. COEF.CORRELATION COEF.
OLIVINES
0.25056040.9977570
AUGITES
0.31796830.9932827
OJtTHOPYROXENES
0.1576731O.9~85189
ANALYSIS OF VA.lUA.NCE FOR S~~PLB LINBAR REGRESSION TO OL~VINB DATA
SOURCE OF DEG. OF SUM OF MEAN FVAlUATION FREBDOM SQUARES SQUARE VALUE
DUE 1'0 REG. 1 .(l180989 .0180989 1777.34DBV. ABOUT REG. 8 .0000815 .0000102TOTAL 9 .0181804
ANALYSIS OF VA~iANCE FOR SIMPLE LINEAR REGRESSION TO AUGITE DATA
SaUlteR OF DBG. OF SUM OE MEAN FVAlUATION FREEDOM SQUARES SQUARE VALUE
DUE TO REG. 1 .0016034 .0016034 1105.28DEY. AdOUI' REG. 15 .0000218 .0000015TOTAL 16 .O(l16252
ANALYSIS OE VARIANCE FOR SIMiLE LINEAR REGRESSION TO OPX DATA
SOURCE OF DEG. OF SUIA OF .MEAN FVAJUATION FRESDO.w: .sQUARES SQUARB VALUE
!>UE TO REG. 1 .0068618 ~O068618 4042.06DEY. ABOUT REG. 12 .0000202 .0000017TOTAL 13 .0068822
RESULTS, DISCUSSIO~, AND CONCLUSION 87

statistics returned by BMD05R ~or olivine, au~itic clino
pyroxene, ~nd orthopyroxene s~rai~ht line equations are ~iven
in Tu.bLe 20. The ~empta-t.ion to ex~rapoLate beyond ~he deLta
should be avoided. Ini~ial work on the plagioclases also
indicated a s~rai&h~ line relationship. More data revealed a
More data may indica~e higher
order equations £or these o-ther minerals ~oo.
~ESUL7S, DISCUSSION, A~D CO~CLUSION 88

BOCK RESULTS
Fi~ure 7. Cumula~ive £requency distribution o£ minerals inthe re£ractive index ranae o£ 1eLdspars zor 9 rocks.
RESULIS, DISCUSSION, AND CONCLUS10N 89

20
10
363-69
""Ic
An69.01'9
·IO-·S
-6 stilrt 24 J!lfV
O..a..-..().Ii....,:.__~-.- ...,..... -r- -.- Oi.1;-::s=tart 22 July 1972
1.53 1.54 1.55 1.56 1.57 1.58 N
Fiaure 8.:function.
Bmpirically drawn density
SampLe 363-69 nonma~netic 1raction:B(percent 01 beta-prime counts :found equalthe chosen a) is plo~ted on ~he ordinateaaainst chosen re1ractive indices N onthe abcissa 01 orthoaonAL "raph paper.See also Fiaures 3, 7, 9, and Table 21.
~BSUL7S, DlSCijS510N, AND CONCLUSION 90
The E pe~ks o~ the curve drawn in Figure 8 are interpre~ed
by the ~ormula 01 Fiaure 4 into DKEAN~. DMEANB is then entered
in tbe ~ormula 01 Cbayes (1952, p. 96, xormula (2» which
re~urns an estimate 01 An. Anorthite estimates are written
above each E peak in Figure 8.
RESULTS, DISCUSSION, AND CONCLUSION 91

lI~oilEY A~o i~1I11 II? 1\ I, ]43-&9, 8EU-V'I~ft 17-2& JUlY 19l1
I,~, vtlf PCEQI,HlldO ~,U o,~
1.S,'d:I)'i \I." J.SU1,))I~IJ Il,O l,IlO1.lJJi ,,,., 1).0 ','HJ1,))hU 1,3~ I,UJI, H<H. 1.33 l.OO1.~.lld. I.~O ~,JO
1.j"J~"J b.40 l,RIl1.~.. It"'Ja It.CO 3.001.~.ftJl~ "'.00 2.l)O1.)~lJI~ 1•• 9U 1.0u1. ~~z., ...) V. dO S.'H)1.)))ld3 11.40 &.~Il
1.SS>SJZI lS.40 3.401.)HlH 1S.40 1.101,5SHIO ld.bO J.70l.hl~~J H.1l0 1).30I. ~bIJJJ 310 40 .~. ~O
1.)&5N9 4d.bO \ •• 101.5.60IlJ ••• 90 11.401o~6.ZlO 49.);) 19,201.~l)~:':I:' "'.6-> 21."0lo~.'J)J .1l.00 10.1l0I.S.hH H.)O 2'.BO1.5.7&1) SI•• " 2&.201.5.17&9 &1.00 17,,)01,~.7H9 &Il,20 H.BO1.~.d17~ SJ.OB 21.101. ~.d~H ~O. 00 17.)0I,HII5J II.BO 7••01.S7I.)UloJ.OO 0.0
IlIE.,I Hltn InN)ht .. ,..q. f'ftl-r;II"'t.)b~"b'~. l't,l-P:JI..,t:,lb1-l)1. nHA-r"."'f.16)-61,P£1A-I'oI,":,)~.!-Ct~. Rf 't.-"otl"'(.).)-b9, PEl A-"I"E,3b1-h9, tliJ""'P)l:I"f.)t'l'-l'oq. t'ET.\-PQ1"'f.)l))-b? f'E rA-PM I Wi..)b)-b". t\r',\-pl( ....S t
)b)-tt", ftl:l:'-PHI"'t.3b )-b'i. Ptl4-PI\ 1"'(.363-1) tle (t~T.l-"'AI"'~t
)b)-&9, PElA-•• '"E,3(,)-"9. i'(tA-PIolJ"'(.]b)-taq. f'EIA-i'A: ...·:.)b)-b'J. 6U A-tiP 1"':aJh)-6Q. P[fl-PRI~t.
)b!-b~. 6~fA-P;(1"':.
)b)-69, fHA-PAI"c.)6]-.9, BElA-PAI"E,]&)-n. BETA-P.l ~E,)tI)-"rJ. "cfA-"Kl ...~.36)-69, ftfT"-P~I"i,
~b3-6q, JlIff4-P~I"'t.
)61-&1. BEIA-PRI.=,)s)-n, eETA·.~I·e.
)b)·b~, MIA-PAI"E,)6)-b9, BETA-PAI"e.)b)-n, BEU-P~I"E.
)6)-6'1. 8ElA-pRIHh
All 72tH w"', .. ; MI tAl AOJ 'lEtI.ll '10 1 til';~: 'ill (aL AOJ Mr-ALL , Zul itO" ..... ,-., Coil AOJ MtAll '~iJ' \il', .... : ~'I CAl AqJ ,.reHl 1101 "r'ol(: h') CAL A!U MtAll 110' "~"Ol'" I 'ill CAL AqJ NEtAll 710 7 Ul"~: .. , CAl AOJ MtAll 1101 .. t,! .... : ..0 CAL ADJ MtAll lZ01 wr,.c; '411 CAL AOJ 'jEtIII 1107 "'02<; ',1 Cl,L An) .,eeAll HOl kraq N,1 tAl ADJ MtALL 72(\1 wr2~: 1.0 t<l A)J ~EC
All 71UI UO~'I ,.n CAl A()J hECAll 1101 w:PIIt: ~" tAl ADJ "'ctAll 7201 .~'q "0 CAl AOJ MtHL 7107 "'j~(: h·J CAl ADJ NECAll J201 w:':'lt: ..:I CAL ADJ IIEtAll 720T "\1"'~: '.0 CAL A~J MtAll 7107 .O'~: Pill CAL AOJ "'~,ALL 7101 kOHl NO CAl ADJ ~EC
All 7101 WO'~ 1 N:I tAl AqJ I.EtAll 1201 "lj ... (; h:J CAl ADJ MtAll lzn wn~1( : '10 tAl 'DJ ~rt
All 120 I wn:'<l '10 CAl ADJ NEtAll 1207 un"1 Pte elL ADJ r.t'CAll 1207 .0::1'(: NO tal AOJ hECAll nOl UD·<: ..·.1 tAl AoJ NECAll 7207 .0'<1 ~O tAL AOJ IIECAll 7101 .COAI "0 tAl ADJ ~Et
All 7201 WG'~I "0 tAl AOJ hEtAll 1207 wO~~; NO CAl AOJ hEt
o~u~
1.5••Ub1.56.0dl1.5••1091.56.111loS ••IU
oSDo.OIDUl0,0103490.0101300.0101880.010287
010.OQ2314O. OJ~2eao.oouaso.oouas0.oe22i5
0.000~55
O.ol44S~
O. 01~0000.01120)0.0214~0
0.0)04780.0)9~91
0.11.5110.12116)0.0711500.07100)U,OlS9S90.11I17J0.1·).1190.11107l)n.I2I,OIoIO.01~R4.
0.JB909O.OIo,qZSO.OIJlKS0.n7))01O.O)~501
0.21·0~a
O. U~5UI0.15)017O. llo~SI0,1791660.09.7170.155947O.OB7I 980.145b15
SOH-J.U0028 SOS.O.OOOSIo 50100.00019
so- 6.0)pERtElll
0.800It-07 -O,IOUE-07 -0.2651E-08-O,IJJd~-07 O,)018E-OIo 0.)415.-07-0.1&5U-08 0.341 SE-07 0.8)'ZE-07
RESIOUALS-II. 00~1l87 -0.000.68-0.00JU2 0.014)2)-O,OJJl'IB 0.01R631-O.OIlJSlO 0.012b73
0.00d672 0.0147TaO.OUHO) 0.024'125O.OOZ.62 O.OllOH0.05J6U 0.06).')O.ObISlI 0.05'17]20.051'lbO O. OlGI?O0.06S"86 -O.~qlqll
o.oOIJZ5 -Il. 1l11?J.0.074~25 0.0)JIo;'80.09'10996 0.001,711-0.~)l~94 -0.14ll18
O. 0)~d8 6 -0, Oobl 105-O,OIH~9 -o,OS6toH0.02)))1 o.OOJSTI0,0)1901 0,024124
-0.0)5.58 -0.3)'527-~.uulIl9 0.Jlld~8
-0.0)5H8 0.004199-0.1l.571o -0.OH51)-0.0IlSIo7 -0.0111059
O,OllOH 0.I2N9)0.05b'l07 0.1617 ..t.0.0;,l/51 o.lloSIO
-0.012265 -0.072.52-0.01""14 -0.07lS))
0.072&50 O.OHS"O0.102257 0.0.,358
TabLe 21. aAt. da.taused J.o FJ.6£ures 3, 7, 8, and SA.
04L re~ract4ve J.ndex.atchina A (El a.re listed1972, on sample 363-69.
and percent o£data collec"ted
arain indices22-26 July,
BBSU~IS, DISCUSSION, AND CONC~USION 92

Table 21 (CUM output) lists the 31 indices B (here labeled
"I.R." at which counts were ma~e. L is here called "PCLT";
H, "PCEQ." The identification ~leLd 1o~lows for each case.
DMEANllP is determined in a series o~ iterations to be
1.5641 while DSD and DX respectiveLy iterate to values o~
printec.l out In turn.
O.010~ and O.002~. The values for SD~t SDS, SDX, and SD are
SD is 10Llowed by a correLation matrix
and table of reslduaLs, tvo ~enerated ~or each oiL (Johnson
and Lan~~ord, in preparation). The riaht hand coLumn o~ the
~abLe of resic.luaLs is tbe sum of the absolute vaLues of the
two residuaLs "enerated 10r each oiL. Since the residuals are
mathematlcaLLy independent entities, a lar"e value for their
absolutes summed may ~e a reasanaule indicator of systematic
errors for some a's.
Raw data of this nature is available on request for all
mineraLs treated here, but not £or the Maui rocks.
RESUL7S, DISCUSSION, AND CONCLUSION 93

UltO'Lit '''0 , .. ,," U'UI. In·... 11,,·,-.1"', ,,·u .lvU U"
(u,""LUlvl HD....L (U' .. ,
0. ,,,,or
•............._ _..•.........•...__ _.-...--.....•.__....-.- -.......••• 0000 • I I •••••
I I I ..... I
; I : ...:'" II I I" Io.,o)!., , ••• •
, ,., JI •• II •• I II • I I, •• I •I •• ,I • II • II ••I •I ..I •I •I •
a.aoot • , ••I I •I 0I 0I 0
~'Oll' ••I 0I •I •I •
a.'tOn. ..I •I 0I 0I ..
a.JOU • •I 0I o.I 0I ..
a.IOU' ..I 0I •I ..I -I
a.l020 • ... II .t.I ....,I •••• II ..... ,
a.oon ..... ••.........•._--_..-.- - - _-.----.._- _ - _ .I.'U, I.UII 1.,.00 ,.,.12 I.'''' I.,,,,
cumulative normal curve £or 363-69.
Irs' 'If "a."'L (UIVn to 'U~IOtl"se DU'. I. PlJilun ."0 I. (U-'uUUVI tv.'IS.
CC"".UCtf 0' (""ULUI'II '\I"CflO,.S·
O.St)u
0"00'
0.100'
o.a",'
..-_ __.-.--- _...•.__ _ ---..--_ __..1.0000 • uact II" Gee." .. kLL "'.. 0 • ,. tr Wyy 0110' U'
I &lIte ff" "Mtt JJ It Co " C':"""" fa UuVY 000""" III II •••, DE' G M U au."~ 0'"'' \lu VO,O UII n II II 'let De. , " ..,J .. l H 0:'"'' r UCleo .." II II All elf' GG "1'4 ..... L "''' 0'''.' U30f II Y II I
0.9001 • ..,ce: Of' G " 1.1 .. L" 0'" '''O~W .., II •• 1 ell' , " 1.1 .. L" O"N 0':011 v.,. Y II
lIate 01 " "1.1 .. LillO' .OOU V '11' IIf' ( 01' G "I ~ .. l .. 0'" aoosu ¥ ..", III' 01:' G "'of 1.1 a L" (l#,. OI'U\I. .". , Ia"" C 01 , ~ .. I I at.,," O. aOfSU V .. , I
all' ( DE' G .. I ~J ...." c' t,) U !J W .., IAll C DE' G .. 1.1 ...... .,.0 air, '"\1 v I III' Ias , • , ~ .. I .. • &." , 0 a.'" ¥ .., I
.1 cor'" ... J .. L" 000 Qnu y ..., IAll C or' G .. I ~ ..... co It U , I." I&It' 0(' " .. I .I""" 00' 0" U , •• , I.., U , GG N I I ..,.. 0" Olfu Y ..., I
II C PI ." ... I .. L .. a, Ouu ¥ • Ill' IA4 C 01 ,,, .. I I ~ L II 0' auu v 1!If"• C nl' G M' I ~ &. .. 00 • 0\' 'u , • til, I
u tit. G' .. , .I • L .. 0 "" os U V.". , ,.. 'Ot • Go .. I J .. L .. a It' cu U" ..., I.. C 01 , Go .. • J .. L "0 , s.'u. I III , ," ,or ,,, ...,.. .. ..~ .. ,.,u V ..., I• C 01'" .. I I .... 0 .." u,vu.. I.., I
AI t Drt , GG ....1 .. , 0" ~, n"" n"II' II C O[ , G "'.I" L a.... ~." u V ..., I• eLI' .. G H' J aLO'" ""$IV. Iw,'• ( ri ,,, " , I • '0 .. "'0 S .'U Y I'" I
It C D;')l , GC N I , .. 0" "'Q S'\I V I'" ,• (Of " "., .. Cl" "'a S"U v ...II , I• C. Of • G HI' a 0\" h' SIJ<I" v a W If I• C D' ., .. I I _0 L .. .., S • U" 1 III "
II C 01'" M I , 0 L" """ IU' V • If "O.)OU • • C DE 'G HI I all L. h""'" lUI V I" I
I • C 01 ,,, "1.1 0 .. L" ....l"Q. U V .""I • C 01. , C w., oU( .. II ~ 'lUJIilUU V .. ""• • e: ot'" H' I 0" .. .. "')t: IIl1f V I W ,I • C Dt " I (I:.. L .. h"'U I'll' V I "iii "
••un • .. C Of " 14' 00 I U II It '\U 'lIf V ... ,I • C ot '" NI 0' .. L .. "'\1) '\oUIVV • w"I I C Ot, , ,Co I 0" .. L .. "'~" !JUf V • If 'tI II C"' • G , O<J I .. L " ",~uJ 'Ul Y II"""I "c C'ltIf ,,, II 0 .. .. L •• N '\U '11 I;w • "",
0.1010' I' 'C"t • C 100 IJ • LL" .... l"" ',Ilfv II"'"I U C fl. , C 1~ I. L • iii Irg u' 'I • til IfI III C on ... aa~ ,,,,,. iii U,," _U 1'1 .,,, ,• 1ft e:, "U , GG 0" ..... II .. lL ......".1II1'1t1t In ." IfI .IIl (C 0' r , " ~OO I" , .. , "-n\\'t,llt ,n' n 1"" "
0.0011 "'1' ell"" • r; 000 '" .II U U. ......hhvutl".'1 "" •• "•................•..•._.._.••.•...........................•.........•.........f·····....•.........•I..,,, I. ,,~, I.".' I.'"'' ,.••at .. , ....
Fiaureindices
9~. Accumulatedtreated .l.n Table
cUDlu1.at.l.ve10.
curves for all. DNEANBP
~BSCLTS, DISCDSSION, AND CONCLUSION 94

Each set u~ CUM data processed genera~es a graph Like that
01 Figure 9A. The pro~ra~ olso accumulo~es all such plots and
prints the. all out at once, adJustin~ the scale on the
abscissa to cover the ronMe reported among all specimens
This pictures nicely the remaining "aps ~hat
could be filled w~th new plagiocLase samples.
In addi~ion to alL o~ the pla~ioclase minerals used in
obtainin& the equation ~iven in Fl~ure 5, the Mraph 01 363-69
is shown as ~eroes (do not con£use with the let~er O·s) in
Fiaure 9B. Tbe samples are ordered by increasing beta indices
as listed in Table 10. The occasional reversal of the
alphabet read at the 0.5011 level on the ordinate is due to
tiLi~ht scatter in the ~ata. Omission of a le~ter is due to
the space beinM overlaid with a Later, congruent DWEANBP.
RBSUL7S. DISCUSSION. A~D CONCLUSION 95

jHSCUSSI0N
COMPAIUSON OF PRESENTRES1lL1S TO THOSE OF OTHERS.
Tne foLlow~na ~ables coLla~e re~ract~ve index or composl
~lonal estima~es 01 this work 4nd comparable avaiLabLe da~a
s~a~ed by or io~erred froB .orks of o~bers.
RESDL~S. DISC1lSSION, AND CONCLUSION 96

TabLe 22. Estima~es o£ anor~hite contents in pLagiocLases(percents ).
i2.54
79.97
00.54
86.35
ADJ.ANBST.2
(9)
00.8001.7207.1811.6813.7819.4428.6037.0643.9649.0053.3257.6059.4666.0868.4068.7271.5872.7872.4475.0274.9479.9687.0289.4894.6096.26
3.513.481.962.393.803.630.911.981.52
-1.357.806.582.81
-0.968.660.746.840.042.701.671.593.246.976.382.355.39
= 3.255= 2.663
45.6953.61
71.24
(7) (8)9PROBE DIFFlAVG.
94.12XBARs
0208
13183039
5055
(6)1opTICS
77
96
59.910.3
83.3
(5)1XltAY
12.916.9
06.2
3,.4
44.454.6
63
68,6
(4)1PJiOBBAVG.
95.0
01.0J.l.2
J.3.820.331.938.6
51.953.2
(3)1CHEM.ANAL.
76.2
( 2 J13DWEANB
04.0504.9810.4314.9317.0322.70..H. 8040.3147.2152.2656.5700.85b2.7109.3471.6011.9874.8476.0475.7078.2778.1983.2190.2792.7397.8599.51
PIP-25UlllP22683UIJ.2P-5P-8P3P4A-175U116531N-25.2BE-35HK1955APP5HllL1950SEHi:1868G255MV-32P-245.2BB-29P655118-J.P7P-18P8
lo'kOM T.AJU•.E:",AN" :from:
lDlFF :for each sample is tbe di~ference in An percent between~be estimate :from TabLe 13 and ~be avera~e o:f otber estimatessbown in this tabLe.
2An AdJusted estiMate in terms of An percent is derived bysubtractin~ tne meAn DIFF 01 column (8) 1rom each vaLue in column(2 ).
RESULTS. DISCUSSION. AND CONCLUSION 97

Discussion of Table 22.
Indices o~ re~raction are generalty not stated in the
Literature £01' the pLA~ioclase samples treated here. There
fore, the cumpositionaL es~imates ~iven in Tabte 13 are
repeated in Table 22 and are compared to compositional
estimates shown aLso in Tables 1 and 9. Column (8) of Table
22 lists the difference (D1FF) obtained by sUbtracting values
from Tables 1 and 9, or the average uf such values, from the
respective vaLues from Table 13. The avera~e difference is
+3.255 percent An, and the standard deviation of DIFF is 2.663
percent An.
The mean DIFF o~ J.255 indicates that a systematic error in
refractive index of +0.00113 e~ists in the present work if the
average An contents reported by otbers is taken as a standard.
Co.-rec·tions to the An va Lues reported in Table 13 a.re made
in TabLe ~2 by Uddin" the mean DIFF to each; the resulting
"adJusted An estimate" is ~iven in coLumn (9) of Table 22.
In response to my questionin~ the value Anderson reported
for HK1955AP, Anderson repLied (personal communication) .ith a
tist of ori~inal data and ~he six, se~arate microprobe
estimates of An: ~3, ~4, 64, 64, 61, and 13. He says: "You
wilL note ~here is li~tle signi~lcance to my average value."
Recall tbe similar statement quoted above from Linds1.ey and
SIII1 th (1971).
Compositional esti.ates of Borg and Hea.-d (1970) given in
RESULTS, DISCUSSION, .AND CONCLUSION 98

Tables 1 and 22 display wide ranges, making direct comparison
o~ the ~resent results to tbeirs somewhat tenuous. The 7.5
percent dif~ereuce betwe~n An values estimated by chemical
analysis versus microprobe analysis ~or sample A-175 is
particuLarly no~ewortbY. Tbe standard deviation of beta
indices (DS~li) reported bere in Table 10 is 0.00185, the
laraest suc~ fi~ure amon~ ull measured for sampLes ~rom Borg
und Heard. Furthermore, the microprobe ran~es o~ An content
reported in Table 1 aLso yield the largest value for sample
A-175 amon~ sampLes ~rom Bor~ and Heard.
It is instructive to tabula~e the avaiLable reported An
ranges determined by microprobe (Table 1) 4"alnst the values
o~ DSDll "ivan in Table 10. This is done in lable 23.
Table 23. Comparison o~
An ran~e from microprobeto DSDB 01 this work.
PJWBE DSDH
p-8 01Ul11 02lll'ldu8G:2 0226~.l 04Ul1~ 05U116 05A-l1;;; 09H.K1955.AP 10i:UU.1950S.E 12
0.001130.001400.001160.001130.001050.001710.001850.001290.002H8
RESULIS, DISCUSSION, AND CONCLUSION 99

Discussion 01 TabLe 23.
A plo~ (not shown) o~ the data in Table 23 reveals a poor
correLation between the absolute range observed by microprobe
and tbe stundard deviation de.fined by this me"thod. Correla-
tion wouLd probably be improved if the standard deviation o~
microprobe compositional estima~es wer~ availab~e rather than
the absolute observed ran.e.
In dony c atie, when the worker is primarily in~erested In
di~~ere"tiation or othe~ pbeuomena £or which de~inition of
compositionaL density £unc~ion taiLs is particularly impor-
~ant. work Like tha~ shown in Fi~ure 8 is indicated.
The most interesting olivine studied is liKi868G2 which has
an aoom~Lous 2V and tlle lar~est residual with respect to the
best 1it strai"ht line u£ Figure &. A direct rela~ion between
anomalous 2V's and distance ±rom a line best fi~ to points of
DMEA~llP xa. do known POU index may be indicated.
Only .Live ox ~be ten olivines treated here have composi
~ional estimates aiven directly for them (Table 2), thou~h
chemicaL comlJositions are available j;or the others (Table 3).
R~S~LlS. DISCUSSION, AND CONCLUSION 100

Table 24 compares the estimates o£ £orsterite based on the
present work (.:from Table 16) with .forsteri-te estimates made by
other workers (Table 2).
Table 24. Comparison oL :forsterlte estimates in olivlnes.
(2)IABLE16
(3)TABLE (2)-(3)2
H.wL1950SEHK1868G24526 '35111 M55107 64
82.25B1.7078.005S.855.65
84797~.9
60.059.3
Xbar =s =
-1.752.70
-0.90-0.20-0.65-0.16
1.70
~ESDL1St DlSCUSSlO~t AND CONCLUSION 101

The dif£er-
Discussion 01 Table 24.
The -0.16 mean dl11erence in ~ors~erite estimates derived
In Table 24 'indicates a sys~ematlc error o~ re1rac~lve index
In the present work ot about 0.00034 too hiab.
enees are small enouah to be ianored.
AYaitic cliQoPyr9¥eneu.
ae~ractive index data 01 the present work are compared In
Table 25 to re£ractive indice~ repor~ed in the literature (128
and 153), reported in personal communication (Px-1), or
In£erred Lro. the X-~ay ea1ssion spectrochemical analyses o£
ButLer (1~69) (all the other samples):
RESUL1S, DISCUSSIO.N, AND CONCLUSION 102

Table 25. Comparison o~ DMEANHind~ces ~o reported or estimatedindices o~ o~ber workers 10r aUQiticclinopyroxenes.
.0004-.001-.0010
= .0001= .0021
Px-120921512826927725U1H9227205.15325424~
1S72187250249
(2)DMEANBl
1.1182711.685781.b~941
1.689501.693971.694501.697281.701921.70281.104271.704651.7063ti1.7071~
1.701921.712611.1J.a941.71t)70
1.61~1
1.6~2b
1.68551.6891.69321.69451.69671.70191.70231.70681.710+/-.011.70UO1.7073
1.11221.71401.7177
Xbars
(4)(2 )-(3)
.0031
.0032
.0039
.0005
.0008
.0000
.0006
.0000
.0005-.0025-.0054
.0064-.0002
lData from lable 11.2Ind1ces for Butler (1969)
sampLes (Table 4) estimated frompLots 01 Butler Analyses on quadr~
lateral ot teer ~£ Al. (1965,p. 132).
Discussion 01 Table 25.
Table 25 sbows that the sys~ematic error detected In the
present work with respect ~o refractive indices of plag10-
clases and olivines Is cor&'ohorated. It also shows that the
standard deviation o~ re1ractive indices measured in this work
,,,,':1"11,'
RESlJL'lS,DlSClJSSION, AND CONCLUSION 103

compared to indices ~rom other work is 0.0027 ~or augites.
However, the larae majori~y o£ data in coLumn (3) are in£erred
1rom "rapbicaL interpre~ation of X-ray emission spectrochemic-
aL anaLyses. They are subJect to errors of dra£~ing as we~L
as to errors o£ in£erence. None~beless, tbe errors seem ~o be
quite dmaLL.
~Xb~Yro¥enes.
Whereas tbe relationship of indices to composition in
au~itic c~inopyroxenes is compLex, i~ is qui~e straightforward
hetween tbe g~mm~ index and composition £or orthopyroxenes.
This permits transLation of orthopyroxene anaLyses directLy
into in1erred ~amma indices via an equation. Such is the
approach taken in Table 26 ~or tbe samples o£ ButLer (1969):
RBSUL1S, DISCUSSION, AND CONCLUSION 104

Table 26. Cgmparison o~ D~EANGP
and reported or estimated indices~rom work of others ~or
ortbopyroxenes.
( 2 ) ( 3 j
DAl£.ANGP.l GAbUiA2(4 )(2 )-( a)
1.7071.7l0171.7,)4721.7.32401.730061.7J6961.7371.744561.7...4791. 751J281.754311.757491.760b1
X.bars
.1.10-35212827718~
~59
22.7254153205248187250249171
J..6'3961.715001.72Jll1.7~33S
1.7J4~8
J..736581.740311.741301.'j434~
1.748671.7S47~
1.,57611.,59621.76461
.0080
.0029-.0014
.0026
.0005
.0034
.0043-.0011
.0039
.0044
.0033
.0021_Jl0040
= .0028= .0025
lProm Table 18.2128 and 153 from Literature.
Other samples those o~ Butler( 19(9).
RESUL1S, DISCUSSION, AND CO~CLUSION 105

Discussion 01 ~able 26.
The sYstematic er~or 01 re1ractive indices measured in the
present work is a~ain appa~tiut. The standard deviation 01
re£ractive indices in~exred ~rom or stated b~ other work
reLative to those measured in this work is 0.0025. This is on
the same order as was ~ound for au~itic clinopyroxenes. The
orthopyroxene reiractive indices measured seem to be about
0.0028 hi~her than might he expected 1rom the work 01 others.
~ESUL1S, D1SCaSS~ON, AND CONCLUSION 106

FEASl~ILlrx OF MODES F~OU IMMERSION DATA.
Re1errina to Figure 1, data 10r samples 62, 55, 31F, and 27
indicate appro~imate modal percentaMes 01 feldspar respect~ve-
These percen~ages are derived
by assu.in~ all of the data helow the break in the s~raight
lines £i~ totbe data for each to be due only ~o pla"ioclase.
Also, it is not always clear Just wbere to draw a horizontal
line. Tbe presu~ptlon Is made, but work has not been done to
demonstra~e that it Is so, that there are no other minerals in
the sauaples bavinu. indices near those of high-index plaaio-
clases. Lack 01 a distinct break in the trend 01 data points
4::, ;j~C, and ~2D may be due to
minerals other than pla~loclase wIth indices in the 1.59
regiun, but is more likely due to some other cause. No
minerals ObViously not ~laMioclase were noted in this reGion.
Lack 01 compLete success in tbis first attempt to determine
modal percent from total rock counts of L, E, and G may be due
to the samplinM technique used between viaL and sta~e sLide.
The sample in the ViaL was twirLed and shaken before and after
each removaL o~ material. But the materIal was removed by
tippiDt& the vial and tappin~ the mouth above the stage
thermistor until a suiticient number of ~rains were on the
slide. This may have permitted ll~hter Qralns to slip
differentially over heavier arains durin" some but not alL
RESDL1S, DISCUSSION, AND CONCLUSiON 107

coul1"ta. Perh~ps the use 01 a small samplin~ spoon (such as a
~lat"tened end o~ a paper cLip) mi~h"t reduce the suspected
e1~ect. Further work on the problem is needed to find ou~
whe"ther modaL estima"tes can be doue practicably in crushed
"rain work without resor"tinQ to tedious separation ~nd wei~h
ing we"thods. Also the theory deserves further attention. For
instAnce, what are "the e1iects of countin~ percent of mica by
thIs me-thod xa. the Cbayes method? 1.£ the effects are
su~ficlently strong, can a correction factor be applied?
Also, L~ck o~ success in the initial work may be due to not
h~vin~ taken enou"h counts between the upper li.it o~ pla&io-
clase indices and the Lower limit of the mineral of next
bi4ther .i.ndices. Perhaps the next step should be to mix some
known proportions of feldspar, apatite, and soae ferro
maanesian mineral of hi"h index, say, olivine. Count results
could be ~eaning~ulLy co.~ared to "the known proportions "to
provide ~uickly the answer as to whether the method is worth
further pursuit.
REseLlS, DISCUSSION, AND CONCLUSION 108

DENSITY FUNCTION OF CONCB~liAIED FBLSICS.
With respec~ to the resu~~s 01 the empirically drawn
density £unction ~or the felsic portion o~ 363-69, i~ appears
that graphs 01 probabitit~ density lunctions for mineral phase
regions which do not adhere to tbe assumption o£ normal
refractive index distribution provide use1uL comparisons o~
kindred rOCK specimens. ~te data 01 Figure 8 disp~ay a hi5 h
degree o~ reproducibility. Notice the fact that DMEANBP
returned by pro~ram CUM £or 363-69 (Table 10) ~alls centrally
in the region of the widest peak 01 Figure 8. 1~ workers
require rapid knowledae 01 the approximate distribution 01
indices for a mineral phase region, either the graphical
methods or the computer metbod should be use1u~. The dif-
ference between the arapblcatly drawn solution for DMBANBP and
that returned by CUM ~or 363-69 is only 0.0016, indicating
that the Hrapbical"aolution is quite good even 10r a sample
with so lar~e a DSD vaLue.
Fi"ure 8 shows a stron~ peak at An69.01. This is in direct
conflict with re~ults expec"ted ~rom the description of Linds
ley and Smith who define a compositional gap between AnoS and
An75 (1971, p. 275). However, they re1er to phenocryst cores
and rims in .eneral for tbe area stUdied, While ~he present
reaul~s re~er to total rock 1eLsics in a speci1ic samp~e. So
tbis notable excepiionto the "eneral agreement 01 the present
RESULIS, DISCUSSION, A~D CONCLUSION 109

results ~u resuLts o~ other workers may be reso~ved.
The nega~iYe An percent dispLayed by the lower index end of
Fl~ure 8 is interpreted as beina caused by potassium ~eldspar.
This suaaests the possibility that a neaative An percent may
ultimately be translatable by equations into an Or percent; or
that a sin¥le equation may be ~ound to cover all ~eldspars.
Lack 01: a siA;ni.:ficant 1Il0de between 1.544 and 1.553 su&~ests
tha1 36J-6~ contains no amount 01 quartz detectable by this
method.
~EVicW OF ACCURACY OE TulS IORK.
The results 01 A~l four mineral ~roups treated show A
systematic error in the present work which has resulted in
index ~easurements sLightly hi~ber than expected in view of
the work o~ others. 'For plagioclases, olivines, augites, and
orthopyroxenes respectively, the indices seem to be too hIgh
by: 0.00173. 0.00034, 0.0007, and 0.0028.
The source of the systematic error is not known, and the
pattern of error is not consistent.
Part 01 the error for plaaioclases may be due to the use o~
2V in estimatin~ compositions here. Other workers, who
aenerally do not state their optic methods or their methods 01
e5tlmatio" compositions 1zom indices in detail, may not have
taken such data lnto account. Discrepancies as ~arge AS
RSSUL~S, DISCUSSION, AND CONCLUSION 110

0.0011 exist be~ween beta indices measured on hi"u and ~ow
state pl.aa.locLases (Saaith, 1951). Since 2V's measured in the
present work have a1; times been oU1;side the ranae de:fined by
Smi1;h (1~5Q), more work seems to be needed to refine Smith's
11356 "raph with data irom a much lar~er number 01 samples.
Work 01 this na1;ure ~or otber common minerals seems to be
indicated as weLL; recalL 1;he anomaLous 2V o:f olivine sample
11:i'1808G2 and the con~omitant departure from the best :fit
straight Line to the olivine data 01 Figure 6.
It is, possible that the choice o:f an arbl1;rary value for
the ome~a index 01 the qua~1;z used 101' calibration rather than
the index stated b¥ the manu:facturer 101' the prism alass was
an unfortunate one. That the error in the plaaiocLase index
ne16Cbbornood seems to be about 0.00173 too high while the
manUfacturer's stated index 101' the prism glass was Judged to
be O.OOl~l too low (see above: "~nteMration agd calibration
ot stai!e-,.e.trActQ",Il.1jl~JdJuI)Beems suspicious. However, i1
this were the onLy problem, higher indices closer to the
Corning calibration Mlass index should become progressively
more accurate. This does not seem to be so. Therefore, the
sta1;ed index of the Corning ~Lass must also remain in doubt.
11; is possibLe that enou&h variation between the glass
actuaLly measured and that provided for calibration 01 the
re:fractometer e~isted to account 101' the problem in the bigher
index range.
RESDL1S, DISCUSSION, AND CONCLUSION 111

These re&ul-ts empbasize the need for even more careful
calibratiuns in future related wor~. The indices of minerals
or ~lasses used for calibration should perhaps be determined
by several independent, dependable laboratories and -the
results averaMed.
It is also possible thAt tne lack of. pa~-tern to tbe
apparent inaccuracies over the ran~e of indices treated is
lar"eLy a function oz how well previous workers have relo-ted
indices to compositions for each of t.he four mineral groups.
However, this work bas been ai~ed at: 1. Development of 0
new identification tecbnique, ~nd 2. Derivation of curves
relatin~ D~EANBP to mean indices 01 mi~erals whose privileged
directions are known to be aligned aith the ~olarizer. While
inaccuracies noted on the order 01 0.003 and less indicate
some lack 01 success in the present work's ef10rt to identify
mineral compositions by indices, tbese inaccuracies have no
e.f:fect at a 11 on aim 1, cilld negli"ib ly a1:fect the equa tions
(Figures 5 aDd 6) derived to satis1y aim 2.
SOU~CES OF E~iOR.
Discrepancies between re1ractive index values reported here
and tbose reported previo~sly by others may best be explained
by eitber poor oil calibration, poor tem~erature con-trol, or
choice 01 a "raln for sinMle-~raln study whlcb was not
REStL1S, DISCUSSION, AND CONCLUSION 112

represen~a~ive o~ the mean sampLe populace composi~ion.
Errors in the present work may have several sources.
Not determinin~ the Aean beta-prime and POD indices at
about ~he same ~ime when 4lenera~in" data ~o de:fine determina
tive curves re~ating randoDly-encountered ~o oriented indices
SUbjects results to ina.ccuracies wbichmight result :from known
or unknown chanMes in systeD calibration. Durin~ the present
work with plaaioc~ases, the system was recalibrated and
di1:ficulties were encoun~ered In 4~telllpts to mesh older with
newer data.. The probLem was probabLy due to some 01 the older
data havin" been Menerated While the WheatB~one bridGe's 12
v. hattery char~e was near zero. But ba.d both beta. and
beta-prime mean indices been determined at the same time under
similar conditions, ~he rela'tive p.recisions would have been
about the tialile even i~ both were ina.ccurate by the same
amount. A use~uL point 10r the determinative curve relating
beta to beta-prime would prohably have been obtained.
Fati~ue may produce errors in coordination which produce
sloppy counts.
The wrong equation may have beeu chosen from among several
de~rees 01 equations returned by the BMD05R program. The
t1mes
choice to use on'l1' second de",ree equations was somewha~
arbitrary, and perhaps the fir~t degree equa~ionB a~
more cLosely approximate tbe true behavior o:f some oils.
SampLes which have not been concentrated by magnetic or
RBSULtS, DISCUSSIO~. AND CONCLUSION 113

heavy liquid methods may p~oduce standard devlations di£.ferent
xrom that o£ tbe mineral phase under consideration. Accept-
ance o£ a value .for tbe mean re£ractive index o£ a sample
population whose extreme in~ices are not included may produce
an increase in the value o£ the standard error 01 the mean.
Counts o~ too zew grains at each index chosen may yield ao
much scatter tbat too many counts must be made. This lueans a.
~reater numuer of chan~es o~ temperature. It is better to
count enou~h ~rains per count so that the number o£ counts
needed is on the order ot 3 to o. Twelve counts 01 oriented
~rains and 50 01 randomly encountered ~ra1ns proved 1ne1£i
cient. Standard counts of 20 and lUO were adopted respective
ly. Inadvertence While entering da"ta to the on-line computer
or whiLe keypunchiu~ data either on
terminaL or on cards may p~oduce errors.
line from a remote
Errors 01 equations
used in a pro~ram may appear unuot~ced due to a copyinG or
keypunchln~ error. Each equation used has been checked
initiaLly aud repeatedLy durin~ use to be sure it is the same
one returned by BMD05~.
Contamination o~ a new oil by an old one results 11 "the
slide holdin~ the stage tte~aistor is not thoroughly cleansed
between oils. Sometimes, cleanin~ Is done wltb acetone and
then with the oi~ to be introduced; more 01ten "the oils are
slailil.r enouun that a drop o£ the new oi~ used to dilu"te "the
RESUL1S, DISCUSSION, AND COMCLUSIO.N 114

is sufficient.~iLm o~ oil Le1t a~ter wipio& witb a tissue
The dilu~ion e1tect is i~portan~ here.
Some ails in use are sU1ficlently vola~iLe to chan~e index
at cool temperatures and u1l oils are sUbject to drivin~ off
volatiles at the elevated ~emperatures used here. Evaporation
of oiLs is ~ccelerated ii cooLin~ o~ the staGe is dane with a
.tan, so dry ice _as used .in later work.
IJauces 01 coat.ings on Ml'ains may be mistaken for those o:f
the "rain itseLf. Check 01 a Becke Line by van der Kolk's
obLique ilLuwination metbod is done .in case o:f dOUbt.
It a crystal is ~oned, the index observed from ~he Becke
line can bo di11erent .t~om the index to he ascribed to the
larger voLume 01 the ~rain as indicated by the method o:f
oblique illumination. l~ various ~rains in ~he crushed sample
commonLy show more than one index cate~ory (L, li, or G), the
sample sbouLd he si~ed at a finer ran~e.
The oil may he poorly calibrated.
A random optic :figure Day be misread.
Dir~y or sli"htly-aJar stepped-resistor contacts may cause
4 wron~ reacJinM of ohms in use to balance the brid~e.
Unknown uncertainties exist due to effects of heat on
op~ics, especia tly dur.iolo£ use 01 a l1ilih-po.er obJective 4"t
high s~a~e te.pera"tures.
The thermistor can set 100 cLose to the meta~ of the stage
which can conduct heat to or from the tber.is~or and cause it
RESUL1S, DISCUSSION, A~D CONCLUSION 115

to ~ive a. reading di~1erent from th~~ of the grains being
counted under the obJective. To keep the thermistor close to
the center 01 the fieLd and cLose to the grains being counted,
cover slips ~.re taped to~ether in bundles and then cut by
diamond saw to one centimeter squ~res. Reduction of the cover
slip si~e encour~~es ainimum was~e 01 both mineral and oil.
Air hubbLes introduced over the thermistor during installa-
tlon of ~ra.ins and oil ma~ produce a. pocket of Insula~ion
Which would produce a reading d11ferent from ooe taken wi~h
the ~hermistor immersed in the oil.
Durln~ 4 period of one Acnih, a residual ~otential from the
thermistor was noted when the power was taken off the circuit
Lor a null. reading. Ihe char~e was initiaLly about 70 my.
This may contribute to the noted systematic errors.
Ll~lTAT10NS uF ~ll.iS TECHNICUE._.. _- --- .... - --_.~.... -::--_..::=~_..:. ---_•.. -.
Some s~mples may prove to be too difficult to work w.lth;
such difficulties encountered in the present work on two
olivines o± high inde~ may he due to attempts to work with
very oLd arsenic dibromlde oils. Conflictin~ results derived
from Becke Line ~.
tlon were noted in
van der Ko~k method of Oblique illumina-
this work at indices above 1.80 and the
reason for tne Qi1ficult~ is not yet clear.
RBSULlS, DISCUSSION, AND CONCLUSION 116

When ~wo phase regions have overtappin~ re1rac~ive index
ran~es (to the Limi~, one may be co.ple~ety con~ained in ~he
other, as for quartz in the midst of the pla~ioclases), o~her
methods may be necessary ~o determine propor~ions. Such work
migh~ incLude de~ermina~ions of habit, birefrinGence, and even
2V if necessary.
A 1urther limitation on this method is the lar~e number of
oils required for its use hy workers unwilling or unabLe to
use ei~her temperature or light wavelength in order ~o vary
the apparen~ index of ~he immersion medium.
Application of ~he method in ~he field is liml~ed by the
worker's abitl~y to cont~ol temperatures. However, work at
ambient temperatures with well calibra~ed olts and a ~hermo
me~er should produce use~ul prelimInary results.
~EVlbW OF GRAPH~CAL MBTHO~S.
~tructioD-Rt curves relAilna DMBANBP to POD iQdic~.
Because ot ~be large number of samples ~rea~ed here,
compu~ers have here been a virtual necessl~y. Bu~ workers
wi~hou~ computers available, whether in ~he 1ield or in the
laboratory, caD con~idently use ~he ~raphical me~hods of
normal probabill~y paper.
The timita~lon on resul~s is probably most strongly con
~rolled by how well c81ibr8~ed the immersIon media are and how
RESUL7S, DISCUSSION, AND CONCLUSION 117

well temperature is known, whether or not wavelengths o£ ~i~ht
are v~ried in conJunction with ~his technique. But with
little temperatura control, results good ~o +/- 0.002 should
prove to be e~sily obt~inable even in £ield camps.
To reSketcb ~ha process brie.fly, one counts a number o.f
"rains which may be ran~ogly encountered or oriented in known
POD's in ~n immel"sion medium o£ known re:.fractive index. The
percentaae 01 grains less than the medium's index is L. To
this is added hal:.f o.f tbe percentaMe 01 tbe count whicb seems
to match the chosen index. CaLL L + E/2 the "raphable
quantity r (see Fiaure 3). On normaL probabiLity paper, graph
Y ajtainst the index chosen 101" the count. Repeat these steps
at di.f.fel"eut indices until enouab points are assembled that a
straiah t line
con.fidence.
through tbea may be drawn with reasonable
The me .....n re1ractlv,~ l.ndex for the beta-pl"lme or
known optic dil"ections is simpLy read on tbe re.fractive index
axis ~ ..ainst the intersection o~ the 50 percent vaLue o.f
cumulative relative .frequency Y and the ~ine drawn tbrou~h the
data points.
roLLowin~ tbe methods outlined here, other workers can add
datu. to the data presented here :for pLagioclases, olivines,
auaites, and ortbopyroxenes. Other mineral aroups deserve
attentIon as well. I will appreciate receipt of samples .from
other workers who have used this method. Limited amounts o.f
some 01 the s~mpLes treated here are av~ilab~e on request.
RESDL1S, DlSCUSS~ON, AND CONCLUSION l18

The results o£
CCNCLUSION
this .ork on pLagioclases are general~y
compatibLe with the results o£ other workers on the same
specimens.
DMEANBP dispL~ys a distinct, use£uL, and impor~unt re~a-
tionship to UWEANH amon~ plaaiocl~ses. This cLose relation-
ship indicates that it is no longer necessary to orient
p~a"ioclAses to e~ti.ate co_positions £rom optical immersion
d~ta.
Similarly cLose rela~iontihips seem to exist amonM oLivines,
~ugitic cLinopyroxenes, and orthopyroxenes. No large re1r~c
tive index discrep~ncies e~ist bet.een work 01 others ~nd this
work. Compositional estimates made here A"ree reasonably with
those o~ otbers. This su~*ests that the concept 01 reLatin~
dat4 o~ randomly encountered indices to indices 01 known
privileged directions is universally appLic~ble to transparent
solids.
EASE AND SPEED OF METHOD.
Counts ot beta-prime mineral indices 10r mineraLs havin~ a
de1ined re1.atlonsbJ.p 01 beta-pr1meto a. known POD index have
the areat a.dvant~ae o~ Ireein~ the worker's mind 1rom consi-
derut10ns 01 tho indlcatrix during determinative work.
RESULIS, DISCUSSION, AND CONCLUSION 119

A1tbou~b the count~n~ 01 indices as randomly encountered ~s
only oue 01: l;he nuve1 aspects of the present method, tbis
lat~er considerat~on makes it ~n i~por~ant one. However, the
technique is rapid even .for gr~ins in known orien~a~ions.
dissert~t~on bas been done in a 14 month
AII oJ: the laboratory work direc~ly related ~o
time per~od.
this
Th~s
h~ included deveLopment o~ re£r~ctome~er theory and construc
tion as weLL as alL work reLated to the development of the
techuique under d~scuss~on. The speed of ~his method can be
the :tact that alL data presented here for ~he
olivines. au~itic pyroxenes, and orthopyroxenes; as well as
the dat~ presented in Fiuures 7 and 8 were coLLected in tess
than one month's time.
Division 01 the number of hours at the microscope by the
number o~ po~nts generated .for Table 21 y~eLds about 17
minutes per point in Fi~ure 8. This time includes the time
needed to kuep a runnin& ,Lot of data as shown in Figure 8.
Comparison or. the value Obtained in F~~ure a .for 363-69's
mean beta-prime index (1.5625) to tb~t shown for its DMEANBP
in l'~bLe 10 (1.5641) sUMMests that workers seekin~ the mean
refractive index to J decimal places will in most cases find
the ~r4pblcal soLution su.f1:1cient. The argument is stl"en",
tbened since the sampLe in questiun was purpose.fully chosen
bec~use o£ i~s known ~ide varia~lon o£
~ESULlSt D1SCUSSI0~, AND CONCLUSION 120

.zeldspars. 15
l~ is conceivabLe ~ha~ shipboard opera~ions could a~ ~imes
hin~e on such rapid petrologic determinations. Interes~in&
work wi~h rapid mineral determina~ions on the R. V.
have been repor~ed b~ S. A. Morse (1971).
SUGGESTIONS FOB FUTURB WOiK.
PITSIULAK
Corroborative work is needed before the data ~iven here ~or
oLivinos. orthopyroxenos, and augitlc pyroxenes are to be
trusted by otber workers. The auccess1ul results for the
p1aaioc1ase ~eLdspars and tbe apparently encouragin~ results
~or the olivines, orthopyroxenes, and au&itic pyroxenes,
encoura~e completion o~ the work fur the minerals trea~ed here
and initiation of aimi1ar investl~ations amon" other natural
and artificial solid soLution phase rOMlons.
The avenues for other future work are almost too multi~u-
dinous to contempLa~e.
Theoretical expl4natioDS for the empirical results pre-
sented here are needed.
Genetic interpretations of well-defined refractive index
density functions in terms of the Bowen
--_._---------reaction series and
15These variations are such thatpersonal communications e~pressed
applicability 01 ~heir specimens too~ determinative curved!
botb Lindsley and Smith instrong doubt as to the
a study seeking definition
RESUL~S, DISCUSSION, AND CONCLUSION 121

more recen~ phase di~grams may y~eLd in~eres~ing resuLts ~or
is not restricted to any sin~le rock
i~neous rocks. However, other rock types may also be ~ound ~o
yield interestin~ results when compared in this way. The
concept of coaparina preciseLy defined dens~ty func~ions among
various rock specimens
type.
The re~r~ctive index e11ects produced by ch~n~es o£ indica-
~rix And cleuvaMe thrOU"R ranges o£ composition are not
~reated here but deserve at~~ntion. The consistency with
which any aiven phase breaks in a given way is a related ~opic
01 interest.
Adapt4tion 01 ~he extinction method of Miche~Levy to a
modern statistical viewpoiot migbt produce a use~ul method for
workin" on ~oned plaaioclase feLdspars in thin section on the
uniaxial petroaraphic staMe where ~wins and ~ones coexist.
Numerical methods o~ comparison such as factor or cluster
analysis .i~ht in some cases prove more powerful than the
araphicalLy o~iented methods discussed here.
Future work shouLd rela~e random indices obtained by the
present method ~o other useful parameters no~ treated here,
for example
pla"ioclases.
the Tsuboi alpha-prime indices of the
RuSUL~S. DISCUSSION, AND CONCLUSION 122

Becommvnd~g cDangvs in~~£~.
Thermis~ors should be caLiDra~ed over even wider tempera
ture ranMes, using dry ice and hotplates over, say, -30 to +75
degrees Celsius. Tbermis~ors and tbermome~er bulbs should be
calibrated ill the Dallle chamber o:f a one liter aluminum cube.
Thermisturs should be calibra~ed after epoxy has cured.
This will reduce a ba~ter~ e11ec~ noted in the present work.
As lar~e as possible a volume 01 each oil calihrated should
be used to reduce the DUlQbel' o:f interruptions 01 petrographic
work in order to caLibra~e an oil similar ~o one exhausted
durinause. Fresh Carallle Laboratory H Series immersion oils
The dOUbLe variationshouLd be used 10r indices above 1.80.
method should be used.
Percent coun~s sbould in the future be weiMhted by the
total nUlllber of grains counted at each chosen u11 index.
BBSULIS, DISCUSSION, AND CONCLUSION 12a

SU~~ARY OF CO~CLU~I~~~.
1. Temperd~ure can be controlled sU11iciently we~l 10r
precise control o~ immersion medium indices. Double variation
methods are pre~erable.
2. The blre£rin~ence 01 a mineral urain should no~ be
confused with the ranace 01 indices exhibited by a mineral
con:fusion.
The method Q:t 'Isuhoi (1926) su.f:fers 1rom this
The present method
3. Tile method 01. Michel-Levy generally :fails :for albite-
twinned crystals i1 they are ~oned.
provides a viable alterna~ive.
4. Whereas op~icaL Identi1ic~tion .ethods available prior
to this worK bave ~eneraLly ~8iled to achieve the rapidity
necessary £or awa&sin~ enough data 10r statistical de1inition
ot density tunctions, this aethod maken such data accumulation
:teu-alble.
5. PL~giocLaBe ~eldB~ar compositions can be precisely
estimated %rom indices measured on randomly encountered grains
in olla. A third de~ree equation relating the means 01.
randomly encountered re1ructive indlces to tile means o:f beta
indices tor the same pla~ioclaBe dample popuLations is pro-
vided. The equation covers toe entire pla~ioclase ran~e.
b. For oLivincs, and ortbopyroxenes, straight
line equa~lon~ are tit to data relatin~ means 01
HESUL1S, DISCUSSION, AND CONCLUSION 124

randomly encountered indices ~o means of indices in chosen
principal optic direc~lons. The equations are preliminary.
Additional datu may yield equations o£ higher order 10r these
three mineraL ~roups.
7. Success~ul application of this method to ~our mineral
groups stron"ly su~&eststbat similar relationships remain to
be de~in~d for many and maybe for alL natural and artificial
transparent solidS.
8. This method provides a successfuL way to view the
compositional distribution of a mineral in context o~ total
rock ra~her than sinMLe arain.
9. ModiiL estimates from crushed but unseparated rock
samples appear ~o be possible from immersion data.
10. Empirically drawn compositionaL density functions are
available from ~his method.
11. This method achieves a high de~re~ 01 internal
consistency. The resul~s ~eneraLly aaree well with results 01
other workers treating the same samples. An apparent excep
tion seems resolvable.
12. The portability and flexibility 01 the system aake it
applicable to use in fieLd camps or aboard ships. TherlJlome-
ters can replace electronic temperiiture control devices durina
such preliminary work.
13. The method evolved and described in this study o1fers
a quick and relativeLy chea~ way to determine averaae coaaposi-
BHSDL1S, DISCUSSION, AND CONCLUSION 125

tioals o~ d~~~erent mineraLs in a rock with accuracy comparable
to that obtained by more expensive and more time-consuming
methods.
RESUL1S, DISCUSSION, AND CONCLUSION 126

BigeLow and Phillip S.
ACANOIIL.EDGbiBN1:S
Dr. GeraLd P • .Brophy o.f Amherst College inspired my or.1"in
al in~erest in optic~l microscopy. The memory o.f his dedi
cated teachinQ remains an inspir~tion.
O£.ficeaates Richard c. Brill, Henry ~. Fletcher Ill, Patri
ci~ Fryer, and ~arion W. Lee have "raciously accepted personal
inconvenience durin" the prottress of this work; without ~heir
cooperative spirits tl~ tusk would have been immeasurably more
ditficuL~.
Thou~ht.fuL and heLpful discussions of ~eoLoGic aspects of
this work were enJoyed with Gordon E.
HUbbard.
Collection of s~.ples during the 110ld work leading to the
present work may in several cases have been impossibLe without
tbe help of many individuals, noteworthy among whom are
William H. SaQer (and the members 0% the Maui Boy Scout Rescue
Tea~ whom he helped interest in the work), Daniel Anderson,
Jay Spe~kman, Jordan lae, John Jeffrey Brash, Chris and Nick
Halford, and Bob RoLand.
Quentin I. Smith and Charles~. Harvey kindly provided
rOOm, board, transportation, And ~ood cheer during parts of
the 1ield work.
ACJ(NOWLEDGMBNTS 127

Permissiun to enter private property was kindly given by
the Wailuku ~ugar Company and the Pioneer Mill Company,
Limited, wbose Field Superintendent, Robert I. Vor~eld. kindLy
provided heLp~ul transpurtation on his own time.
Manfred Nahmmacher, of E. Leitz, Inc. bas kindly
tinswerea many question::i tibout tbe Leitz Jelley refractometer
in use. Cornin~ vLasa lorks and Cornin~'s Senior Product
Enuineer Jobn B. HelM kindly provided glass used in re~racto
meter caLibration.
Dr. Charl.es D. Fein sUQ~ested usin& USGS standard samples
D7S-1 and PCc-l to test this methode
Fur su"~esting wurke~s who mi~bt supply samples, I thank
Dr. MichticL FLeisCher, Dr. Surendra Sa~ena, and Dr. DougLas
Smith.
Witbout donations ~ro~ the toLlowin~ writers, this work
wouLd have heen mucb Less meaning1uL: Dr. AL~red T. Ander-
Best, Dr. A. L. Boettcher, Dr. Irisson, Jr., Dr. Myron G.
~. Bor~, Dr. lioiler G. Burns, Dr. Patrick Butler, Jr.,
D. Jackson, Dr. lkuo Kushiro, and
.Dr. DonaLd tie J..indsLey •
pLagioclases.
Dr. KLaus ~eiL and Dr. ~onald V. Fodor were most ~enerous
in providin~ microprobe anaLYl:ies o:f eight
Patricia Fryer is anaLyzin~ 1972cpx.
Whatever modest statisticaL insi~hts I have gained during
ACKNOWLEDGMENTS 12S

tbi~ work have been ~redtl~ £aci1~*ated by *he good will and
encoura"ement not onLy Q~ commit*ee members, bU* also of
Drs. Stephen V. Smith and iilliam B. Size.
Help ~Q taking measuremen~s during various sta~es o~ the
8i2ris*, Dr. William ~. Size,
M. Wisham Jr.
work was ~raciously ~iven
ruJishima, ~obert C. va1~in,
E. Bigelow, Karen Y.
Christopher Rossi,
Ronald L. Soroos,
Marion M.
Dennis J.
and CLyde
Hubbard,
by Gordon
Phil li~ S.
Lineberuer,PatrickLee,
For invaluable help in critical readings, thanks are
expre~sed to: RJ.chard C. BriLL, Freder~ck K. Duennebier,
10rd, Marion M. Lee, EtheL u. ~cAiee, Hita Parvulescu, Dr.
WiLlJ.am B. Size, Es*her~. Smith, a.nd Clyde M. WIsham Jr.,
Dr. Rita PuJalet and Jackie Pomeroy
helped with illustrations.
I thank H. CLif~ord
makiutoC their ~ravity meter tripOd, office, a.nd keypunch
availauLe.
Loans a.nd Mi~t~ of electronic equipment as well as help
electronic circuitry were
aenerousLy given by A. Julin Halunen dnd ~oel J. Thom~son.
Dr. HaroLd G. Loomis Bnd Dougla~ P. Klein kindly acted as
mathematIcal and programJUi~~ consultants.
For cheer.:fuL and indispensaule help wi*h programming, I
ACKNOWLEDGMENTS 129

wiah to ~bank: Helen Carey, Dr. Peter N. Dobson, Steve
Glans~ein, Kay H. Hoke, Julie Hu, Dennis ~a., James K.
~otaka, Shiela s. NaAiamine, Dr. William B. Size, Max W.
S~arr, James H. Thompson, ~oel J. Thompson, and Charles F.
WaLL.
The Hawaii !nsti~u~e of Geophysics Shipboard Computer
Committee ~hrough Dr. John C. Rose, William B. Severson, And
Noel J. Thompson kindly provided use of a Nova computer.
On line IBM TSO was arranued by courtesy 01 Noel
J. Thompson.
IBW compu~er time was suppLied by the Universi~y of Hawaii
Departmen~ o£ Geology and Geophysics.
Walter S. Yee, Direc~or of the University of Hawaii
Computina Center, toaetber with his excellent sta£1 have been
indispensible to the completion 01 this work. Vincent T.
Watsuda And his third shift crew 01 lBM360 operators deserve
special mention for their friendly help.
Dr. Gaylord WiLLer kindly provided the 100 percent rag
con'tent paper required ..for the first copy of this work.
Too many individual members 01 the Hawaii Institu"te of
Geopbysics remain to list here. They have my thanks.
ACKNOWLEDGMENTS 130

LI]EaA~URE CITED
American ~eolouical Institute, 190~. Glossary o~ ~eology and
reL~ted sciences:
72 p. supplement.
Andersonw A. T., Jr., Clayton, ~. N., and Mayeda, T. K., lS71.
Oxy~en isotope thermometry o£ ma~ic i~neous rocks:
GeoLogy, v. 79, no. 6, p. 715-29.
Jour.
Ashton, F. W., and Taylor, w. e., lS28.
Lor meaaurin~ temper~tures 01 re1ractive index Liquids on
a crystal re~ractometer and on a microscope slide: Am.
~ineraloaist, v. 13, nO. 8, p. 411-418.
Baird, D. e., 1~b2. An intrOduction to measurement theory and
Prentice-Hall; Englewood Cli11s, Newexperiment desi&n:
Jersey; iSS p.
Barth, T. ~. W., 1969. ~eldspars: Wiley-Interscience; New
York, London, Sydney, and T~ronto; 2&1 p.
llest, M. G., and Mercy, E. L. P., 1~67. Composition and crys-
talLization 01 ma1ic minerals in the Guadalupe igneous
complex, Calixorni4: Am. ~ineralogist, v. 52, p. 436-74.
Bloss, F. D., 19&1. An introduction to the methods o£ pptical
Holt, Rinehart and Winston; New York,
Chicago, San Francisco, Toronto, and London; 294 p.
LI7E~ATUQB CITED 131

Doe"ttcner, A. L., 1967. 1he Rainy Creek aLkaline-ultrama1ic
Experlmen"tal de1orma"tion
Mon"tana:igneous co.plex near Libby,
v. 75, p. 526-53.
Bor~, !. y., and Heard, H. C., 1970.
Jour. Geology,
of pla~loclases, in Experimen"tal and na"tural rock de£or-
wo."tion: Springer-Verlag, Berlin, Heidelberg, and .New
York, p. 375-403.
Burns, R. G.t Cation determina"tlve
curves ~or M~-Fe-Mn olivinsa £rom vihra"tional spectra:
Am. MineraLogist, v. 57, p. 967-85.
ButLer, Patrick, Jr_, 1969. Mineral composl"tions and equili-
brio. in the me"tamorpbosed iron ~ormation o~ "the Gagnon
re6&lon, Quebec, CCUlaGa: Jour. Petrology, v. 10, no. 1 t
p. 56-101.
Darken, L. S.t and Gurry, B. W., 1953. Physical chemistry o£
metals:
p.
McGraw-Hill; .New York, Toronto and London; 535
Deer, W. A., Bowie, B.. A., and Zussman, J., 1965. Rock-
~ormin~ minerals: Wiley and Sona, .New York, v. 2, 379 p.
LODamans,London, v. 1,----- 196711..
,J~3 p.
--- Ui67h.
435 p.
Rock-1ormin& minerals:
Rock-1orminM ainerala: Long.ans,London, v. 4,
LiTERATURE C~TED 132

Dixon, w. J. , 1970. BMD Biomedical Compu~er Programs:
Un£versi~y o~ CaliLornia Press;
London; «)00 p.
Berkeley, Los Angeles,
~l-.u.innawi, E. E., 19b6. Me~hods in chemical and mineral
microticopy: Elsevier; Amsterdam, London, and New York;
222 p.
Emmons, it. c. , 1928. The double dispersion metbod o~ mineral
determination:Am. Mineralugist, v. 13, p. 504-515.
1929. The double v8ria~ion method of re~ractive index
dete&"m£na~ion: Am. Mineraloglst, v. 14, p.414-426.
--- 194.l. Tbe universal stage:Geol. Soc. A•• , MemolI" 8,
~mmons, ~. e., and Gates, R. M., The use of Becke line
Am. Mineralo-coLors in re~r4ctive index dete&"min~tion:
alat, v. 33, p. 612-61B.
Fairbalrn, H. W. Ahrens, L. H., Cbayes, Fel~x, Dennen, W. H.,
Schlecb~, W. G., and Stevens, R. E., 1951. A cooperative
investigation o~ precision and accuracy in chemical,
spectrochemical and modal analysis o~ silicate rocks:
U. S. Geol. Survey BulL. 980, 11 p.
Flanagan, F. J., 1969. u.S. Geoloaical Survey standards--IL.
Firat compilat£on of data ~or the new U.S.G.S. rocks:
Geochi•• et Cosmocnim. Acta, v. 33, p. 81-120.
LITERATURE CITED 133

Friedman, G. M., 1960. Chemical analyses o~ rocks wl~h ~be
microscope:pe~roLogic
p. 69-78.
GiLlberM, Marianne, 1860.
v. 45,
Ibe error caused by Inexac~ orlen-
~a lion in the de~ermination o~ re~rac~lve indIces o~
minerals by the immerslon metbod: Arkiv Mineral. Geol.,
509-518.
GoLdich, ~. S., In~a~ells, c. 0., SUhr, N. H., and Anderson,
D. H., 1967. Analyses o~ silicate rock and mineral
standards: Canadian Jour• Earth Scl., v. 4, p. 747-55.
.Harrison, R. K., und Day, G., 1963. 11 continuous monochroma~-
ic inter.ference 111~er: Mineralog. Nag., v. 3,
p. 517-9.
Beinr1cb, E. W., 1956. AUcroscoplc IdeDtifica~ion 01
_i nerals: McGraw-aill; New York, St. Louis, San Francls-
co, Toronto, London, and Sydney; 414 p.
1i lter?: AUneralo".
HoLa;ate, Norman, l~oJ. Nonochromator or ~raded spectrum
Na~., v. 33, p. 512-6.
manuaL:
IBN system/JbO 1BXT360 introduction and re~erence
IBN, Boulder, 13b p.
Jackson, B. D., 1961. .I-ray determinative curve -tor some
natural plaaloclases 01 cOillposit1on An 60-85:
Pro.f. Paper 424-C, p. 28b-8.
U.S.G.S.
LITBRATU~ CITED 134

Jelley, E. E., 1934. A microrefractometer and i~s use in
chemical microscopy: Jour. Royal Microscopical Soc.,
London, v. 54, no. 3, p. 234-245.
Johannsen, A lbElr~, 1918. ManuaL o£ pe~ro~raphic me~hods:
McOraw-HiLl, New York and London, 647 p.
--- 1969.
Univ.
A descrip~ive petrography of ~he I~neous rocks:
Chica~o Press, v. 1, ~19 p.
Johnson, R• .Ii., and Lan~1ord, S. A., (in preparu.~ion). Es~i-
ma.~in" dIs~ribution 01 index 01 mIneral re1ractive
indices £rom immersion data.
Kerr, P. F., 19S~. McGraw-HILL; New
York, Toronto, anu London; 442 p.
KinA, J. R., 1S71. Probahility charts for decision makin~:
IndustriaL Press, Inc., 290 p.
Koch, o. S., Jr., and Link, R. E., 1970. statistical anaLysis
o~ Meolo"icaL data: John Wiley & Sons, Inc.; New York,
Loudon, Sydney, and 10ronto; 315 p.
Larsen, E. S., and Berman, Harry, 1864. The mIcroscopic
de.ermina~ion o£ the nonopaque minerals:
206 p.
USGS Bu1.1. 848,
Leitz, B., Inc., undated. U-sta~e re1ractometer 10r measurin~
Loose particles o£ minerals etc.:
WetzLar, Germany, 15p.
Ernst Leitz GMBH
LiTERATURE CITED 135

Lindsley, D. ~., and Smi~b, Douglas, 1971. Chemical varia-
tions in the feldspars: Annual Report 01 the Director
Geophys. Lab., CarneMie Inst. Washin&~on Year Book 69,
1969-1970, p. 274-8.
Mar1unin, A. S., 1962. The 1eLdspars phase relations, optical
properties, and ~eoloQical dlstrihu~ion: U. S. Depart
ment 01 Commerce trunslation TT 65-50091, from Russian by
Isreal ProQram ~or Sclenti1ic Translations, Jerusalem,
1966, 317 p. (~aperbac~).
Korse, S. A., 1965. Revised dispersion method for low plagio
clase: Am. ~in~raloaist, v. 5J, p. 105-15.
de Waard, Dirk, and Wheeler, E.Morse, S. A.,
The Nuin anorthosite proJect, Lahrador:
P., 2nd, 1971.
Field Report
Contribution no. 9, University of Massachusetts,187!:
102 p.
NeVille, A. M., and ~ennedy, J. B., 1964. Basic statisticaL
methuds for en"ineers and scientists: International
Textbouk Co., Scranton, Pennsylvania, 325 p.
~ieuwen~amp, i., 1966. Stereograms ~or the determination of
ELseVier,plauiocLase feldspars in random sections:
Amsterdam, 29 p.
Saylor, C. P., 1935. Accuracy of microscopical methods for
determinina refractive index hy immersion; J. Res. Nat.
Bur. Standards, v. IS, p. 277-94.
LITERATURE CITED 136

Smith, J. R., 1956. E~lects o~ heating naturaL pLagioclases:
Annual. Repor"t o:f the Director Geophys. Lab. Carne"ie
lnst.
--- 1957.
Washin~ton Year Book No. 55. p. 188-90.
OpticaL properties 01 heated plaMioclases: Annu-
al Report o:f the Director Geopbya. Lab., Carnegie Inst.
WAshin~ton Year Book No. 50, p. 210.
Spie~el, M. R. ,19~1. Schaum's outline o:f tbeory and problems
o~ stA'tlstlcs: Mc-Graw-Hill. New York, St. Louis, San
Francisco, Toronto, and Sydney; 359 p.
Stevens, H. B., Fleischer, Michael, Niles, w. W., Chodos, A.
A., Filby, R. H., Leinin~er, R. K., Ahrens, L. H., and
J., 1960. Second report o:f a comparitive
investigation o:f the composition 01 two silicate rocks:
U.S. Geol. Survey BuLL. 1113, 126 p.
Tro"er, W. E., 1959. ~sch~ Beai!mmung der ~esteiQbildepgeD
MipQrg,.l&.S. E. Scbwelzerbart'scbe Verla~sbuchhandlun",
Stutt~art,141 p.,2 pls.
Tsuboi, Seitaro, 1926. A dispersion method o:f diacriminating
rock-constituen-ts and its use in petro~enic investi~a-
tlon: Fac. Sci., Jour., Tokyo, v. 1, pt. 5, p. 139-80.
LITBRATURE CITED 137

Van der PLas, L., 1966. The iden~i~ication of detri~aL
~eLdspars:
J05 p.
ELsevier; Ams~erda., London, and New York;
H. S., and H. E. Kerwin, 1922. MineraLo~y.
Augi~e of H~leakaL~, Maul, Hawaiian IsLands: Am. Jour.
Sci., sera 5, v. 3, no. 14,p. 117-22•
• erner, A. J., 1968. Methods In hi"h precision re~ractometry
o~ opticaL aLaases: Applied Op~ics, v. 7, p. a37-43.
WiLcox, ~. E., 1~5a. Use o~ the sp~ndle sta~e ~or determina-
tion 01 principal indices 01 re1ractioQ o~ crystaL
fra~meDt8: Am. Wineraloaist, v. 44, p. 1272-93.
LI~EBATURE CITED 138

APPBNJHX A
MBT~ODS OF HhFBACTIVH INDBX CO~THOL
DOUBLE VARIATION DEPBN~ENCI OF INDICBS.
Re~rAc~ive indices are ~eneralLy strongly dependent on both
the waveLeu&th o~ impinMing Light and the temperature o~ the
subject material. The presen~ work controls oi~ indices by
temperature chanaes. Temperature variations cbanae indices of
oils ~ppreci~bly and a11ect mineral indices insi~nificantly.
Varia~ions of both w8veLenath and temperature are treated
by Bmuoos (19281 who produces by them respectively chromatic
and thermal dispersions 1n what he Later (Emmons; 1929, 1943)
calls the double variation method. He points (Emmons, 1928)
to the ~dv~otaMes 01 often beina able to work with a sin~~e,
small arain without needin~ tu transfer it to other immersion
media (a tedious and sometimes impossible task).
PolderVAar t ( 1950, p. 1071) divides re1ractive index
methods into U(l) the ordinAry iamersion method using sodium
light, (2) the slnate variation metbod, and (3) the dOUble
the three methods bein~ 01 increasing
accuracy io the order stated.
APPENDIX A 139

The double va~iation method, per£ected by Emmons (1929), is
undoubtedLy the most accurate, but it requires eLaborate and
expensive apparatus and consumes more time than "the other two
methods."
Di11erentiaL thermocouples capabLe o£ measuring tempera-
tures to pLus or minus 1° C16 are reported as early as 1928
(Ashton and Taylor).
Asbton and TayLor show tbat mercury thermometers are
probabLy satis£actory £01' work where temperature control o~
plus or minus 2° (Celsius again in1erred) is su££icient. But
they state that even the ~lus or minus 10 (C) accuracies
obtained with a thermocoupLe are "not rel.iab1.e when precise
data are desired" (p. 41'1 ).
In his above-mentioned study of the zone over which mineral
indIces seem to match thoae 01 immersion medIa under varyio&
conditions. SayLor (19:J5, p_ 2B5) u,sed "a 5-Junction, copper-
constantan thermocouple, _ith its warm end placed between the
slide and cover glass so that it was Just at tbe edge 01 the
1ieLd when the 45X obJective was used."
A1.tbou"D variation of wavelenatb methods in sin~le or
double variation have been used for years, workers generally
translate results to the common denominator 01 the index o£
16The teaperature scale in use is in£erred to be CeLsius,thou~ the authors ne~lect to say so. the in1erence rests onthe fact that readin~s are in the 25 deMree range common to.icroscope work in Celsius degrees_
APPENDIX A 140

re~~ac~ion in monochromatic sodium light at 250 c. So the
obse~ved mineral dispersion is lost as an independently
reported quantity in most of the Literature. This is unfor-
tunate. It would be interesting to see whether different
samples ~rom di1feren~ places o~ the same kind of mineral
showin" the same index a-t 250 C in sodium li~ht might not have
ma~kedLy di~1e~ent dispersions Which could be used quite
independently o~ refractive index informa-tion to help in
identi~ication and a further re1inement of knowledge.
Van der Plus (1906) says that variable monochromators are
now inexpensive, thouah he does not quote prices. HoLgate
(1963) and Harrison and Day (1963) treat respectively the use
o~ an inexpensive Mraded interference filter And a precision
mount for use with a Mraded interference 1ilter. Specific
costs are mentioned in neither of these works. But Leitz now
seLls a. sUbtitaMe vCIoriaole filter (12.5 miili.icron, xeriL S
200, 400-700 millimicron ranae) with graduated mount and
diaphra~. housina for $453.00. This compares wIth the cost of
$363.00 10r a complete sodium vapor lamp system from the same
coapany. ThouMh the cost of a ll~ht system to proJect through
the variabLe 1ilter is not included in the Latter's cost it
should be postiible to adapt ~he 1ilter to existin~ White liMht
sources, tiO its cost is co.~etitive with that of a monoc-
hromatlc li~ht source. 7he reduced cost 01 immersion liquids
needed to cover the complete range of mineral indices, the
APPBIIIDIX A 141

advantages 0:£ the double variation method, and the evident
educa.tional. opportuni~ieSt aLl dug~est that the variable
monochromator shouLd be
be.
in more common use than it seems to
APPENDIXA 142

REVIEW OF LITERATURB PERTINENT XO FELDSPAR INDICES
Poldervaar~ (1~5Uf p. 1068-70) says: "A large number of
methods have been devised to correlate physical properties
witq chemical compositioo. Since pla~ioclase occurs in nearly
every i~neous rock and in many metamorphic and sedimentary
rocks, the de~ermination of the An content oL the feldspar is
one -of the most essentiaL and common parts of petrolouical
procedure. Yet maoy problems remain in de~ermininM composi-
tiona of raembers oJ: the series by optical means. It is seldom
realized how di1~lcult is tbe correct determination u1 the
avera~e pla"iocLase composition in a rock in which the
feldspar is stron~Ly zoned (Wenk, 1945). Merely taking the
mean 01 extreme vaLues determined in one or more crystals
rarely pruvides the correct result, unless a lar&e number of
crystals is examined. Determination of the mean index 01
re£raction by comparison 01 a lar~e number of grains oriented
at random is less tIme-robbing, but likewise not very accur
ate." Tbe present work ef1ectively refutes the phrase "but
likewise no1: ver)' li.ccurate."
A comprehensIve overview of the state of ~he art of
1eldspar identi1ica~ion is aiven by Van del.' Plas (1906). In
spite 01 its restrictive title, this work is vaLuable ~o all
APPENDIX A 143

workers concerned wl~h :feldspars, hecause so much of the work
deals w~~h properties o£ 1eldspars which are no~ re&~ric~ed ~o
de~rital occurrences.
A myria.d o:f :feldspar identl:flcation techniques exists. 1 ? It
seems stJ:"allQ;e that in sUJllmarizinM 1;he me1;bods :for determina-
tion o:f plagioclase feldspar chelll.ical composl1;ions on the
basis o:f indlcatrix orientations, van der PLas (1966, p. 137)
i~nores oiL imMersion work: "These aethods ma~ be divided
into ~wo uroups. For the :first group a universal staQe is
needed. the second "ro~p tries to make the best of the
in:formation that can he drawn :from inspecting a thin section
wi1;h a uniaxial petro"raphic microscope. This seemingl~
reversed order has been chosen because i1; is necessar~ to have
a clear understandin~ of the possible behavior o:f sections of
plagioclase 1raaments in order ~o make the proper guesses,
simply by loo~in. at a thin section with an ordinar~ micros-
cope. It must he admi1;ted tha1; the stud~ 01 the pla~ioclases
io thin sections ••• witbout a. universal staae, engagin~ as it
may be, is u. rather di:f1icuLt Job."
Surely the careful determination 01 principa~ indices in
oiLs involves orienta~ion 01 the indlcatrixl Van der Plas is
17Van der Plas (p. 100-5) points to recent work relatingEuler an&Les to feldspar identification with an eye ~o
computer tecbniques, thouah the computer techniques are no1;~reated. The approach looks promisi.ojj1, hU~ it is not ~reated
bere.
APPENDIX A 144

not ignorant 01 immersion methods, however, and the above
quotation J:oLlows a chap1:er entitled liThe indices o:f refrac-
tion and the axial aOMle of feldspars." In closing his
section on ~etdspar re:fractive indices, van der Plas (p. 90)
wri tes: lIIn summary, the determin~tion o~ the chemical
composition of plaaioclases with immersion liquids is a
reliable and e:fficien-t method. This is especiaLly -true :for
-the workers [sedimeotoLo"ists] .for whom this review is
in-tended. The inaccuracies that may resuLt ~rum not recoaniz-
in" the presence of hl~h-te.perature phases are small, and do
not constitute an annoyinQ disturbance 01 the reLiabi1.ity o:f a.
set 01 measure.e~ts.lI18
l8See also the work of Cboyes (1952).
APPBNDIX A 145
T.he me"thod of bUcne i-Levy is "perhaps the single moat
uaeful me"thod in thin section [work on plagioclases]" (Hein-
rich, '1hat -the me"tllod may also be of use in
iwmers~on m~dia mak~s it ~ermane to this work. However, "the
absence o:f tains in plagioclaaes ~t times makes tbe Michel-
Levy metbud Impoasiule.
Althou"b it seem~ aUfficiently obvious that the Michel-Levy
me"thud 1ail~ for twinned cryat~ls Which are zoned, no previous
statement bas been found in the 1.i tera ture to that ef.fect.
Thou"h bein~ 1undamentally statistical (Kerr, 1959, p. 257)
like tbe ~resent method, the metbod of Michel-Levy faiLs for
~oned twins because it selects only the most caLcic composi-
tion availabLe in a pa~ticular section. It works Lor composi-
tionaLLy ""oned crYdtals (111)' if one takes the trOUble to use
it 101' individual compositional zones in a section known
certainly to be cut normal to the (OiO) 1ace and to be rota-ted
about the [U10] zone so as to give the maximum extinction
Possible 101' eacb zone. The method aLso does not take into
account the variations in zonin~ Which seem to be CAused by
tWinnin~ (Em.ons ~ ~~., HJ53 ). Since application of -the
method ~eneraLly necessitates universal sta~e work, the 01'1-
APPENDIX A 146

~~naL de~inition o£ ~he method is somewhat stretched. The
method aLso becom~s impractica~ £o~ amassing data 10r statist-
icaL treatmen t.
PoLdervaart (1950, p. 1070) mentions the discrepancies to
be expected between work on the same sample done with U-s~a~e
JUl. re£ractive index methods:...... :
lIin zoned crystaLs re1ractive
index ~etnods tend to emphaslze lower An values, slnce tne
edaes 01 cleavAae :fragments are employed [ls the assuaaption
tba~ the rock cLeaves around rather than through most
"rains1 J, wnl.le universal stage methods emphasize hiiPler An
values, as crystal cores are most conveniently used (Wenk,
1945)."19 CrushAn" Mirains to size :frifoctions small enou~h to
break Mlril.ins 'tllrouMIl the cores makes the results o:f the
present metbod more representatl.ve 01 the true compositional
dlstrihutl.oo in the totaL ~ock and does not bias toward either
lower or hi~her An contents. Tile observations 01 Emmons
J2X A.l. (1953, p. 41-54) point to the apparent Incompatl.bllity
01 zoned and twinned crystals and ~here10re the :failure 01 the
method 01 bUchel-J..evy .for a l.arjie number o:f pLagioclase
crystals: IIsl.nce polysynihetic twl.noing develops so consl.s-
tently at the time ~onin& disappears, the two must he related.
This does not neaate tile reaction prlnciple; in :fact, the
19The implication that U-sta&e methods dea~ only with thinsec~ions is un10rtuna~e and lanores the cited work o:f Emmons.See al.so tDe undated publication o:f Leitz in my list 01re1erences.
APPBNDIX A 147
development of *_inning may help ~o implemen~ reaction, or to
~ri&aer its operation (p. 41)." And again: "one conclusion
is that, in 4 crystaL which lost its zonin~ as it was ~winned,
the composi~ionaL differences Which pre-existed in the zones,
in part at Leas~ are now found in the difference in composi-
tion oj; the contiauous t~in ~aae11ae. Such a difference in
composition between lamellae is no more permanent than Is a
difference in composition between zones, but may be removed
with ~be ~dvancing history ot tbe crystal •••• Especially
interestlna ~nd apparently si~niticant is the observation that
tbe ditterence in composition between 1amel~ae is not constant
tbrouMhout the crystal •••• Our overaL~ conclusion is that
twinnina, which forms late in the history ot the crystal and
postdates zonlna, is one 01 tbe factors and often ~be dominant
1:actor in the elimination of zonina. The difference in
composition of conti~uous t.in lameLlae, in part at least,
substitutes tor the difterence in composition between zones.
Tentatively we conclUde that tbe dlf~erence in composition
between conti~uous twin lamellae is less tor twins accordin"
to tbe ~lDite law than 1:or twins accordina to the other
polysyntbetic laws. This is ~n observation and Is ottered
without expLanation (Emmons £1 li., 1953, p. 42-3 ).n
To summarize, the ~ichel-Levy method ianores tbe phase
region's ranae completely, not only in each sin~le grain
treated, but aLso in the total rock specimen. It should be
APPENDIX A 148

possible ~o adapt the technique to a more modern s~a~isticat
viewpoint, bu~ such an adapta~ion is beyond the scope of the
present work.
APPBND.IX A 149
Qiber feLgSRA& work.
The rhomb~c sec~ion metbod, ~he method 01 Schuster, and the
me~hod of Tsuboi are all applicabLe to cleavage fragments 01
plagioclase ~eldspar (Heinrich, 1965, p. 359f1) ; all are
ianored in tne remainder of ~his work.
Van der Plas (1~66, p. 83) mentions work by Marfunin
( 1962,. Van der PLas says: "~ARFUNIN ••• lis~s 59 samples
whose refrActive indices are measured And mentions a number of
du~a not published in the comp11a~ion of CHAYES (1952b).20 He
also lis~s the mean index of refraction. (The meaning of
"mean" in thiti context is crucial, and bears on the original1-
ty of ~he present work.] It 1s shown graphically that this
mean index of re1raction eXhibits a ra~her perfect linear
relationship .itb the Ca-con~ent." The quotation suggests
that "the sa.we relationship used bere to demonstrate the
present method may already have been found by totally indepen-
dent work, :for the third de~ree equ~tion rela~lng mea.n beta to
aean beta-prime indices (FJQure 5) was a~ first believed ~o be
a straiMht line relationsblp.
20The re1erence is to Chayes (1952).
APPENDIX A 150

Mar~unin (1962, P8 ~72) says: liThe composi~ion o:f all 1:he
specimens o~ Hrnst ~nd Nieland was de1:ermined, ~here:fore, by
means o~ the ~veraae re1ractive index as calcula~ed :from 1:be
presented vaLues (a8ama, beta, and aLpha] accordina ~o ~he
empirical 10raul~:
The work o~ ~ar1unin cLearly does no1: impair the claim 01 the
presen~ work to ori"inal ity. He is Dot concerned with
creatin~ a new mineral identi1ication technique, and bis
deJ:ini~ioll of " meu.n re.fractive index" is quite di:f:ferent :from
the meu.nina ~iven DMEAN in the present work.
APPENDIX A 151

INDICES OF OTHE~ MI~BRALS.
Even 101' mineraLs wbose cOlGpositions must be estimated :from
additiona.L op~icaL parameters, tbe vaLue o:f re:fractive indices
remains essentiaL to the determinAtion.
Deer ~X~. (196780, p. 22) reLa~e refractive indices of
oLivines to compositions via straight Lines :for all 3 princip-
aL indices. The same authqrs (Deer U Al., 1965, p. 28) :fit
s~raigbt lines to tbe alpba and ilaDlllla indices (they deAL witb
~alllllla-prime but caLL it Mamma) o.f orthopyroxenes AS a £un,:tJ.on
o~ cOlllposition. They do Dot plot or show the Line :for tbe
beta index as a :function o:f composition_ The ~ore complex
relationship o:f opticaL properties dispLayed by auaitic pyrox
enes necessitates the pLottinM 01 2V together with re:fractive
indices (Deer ~ Ai-, 1965, p. 132) to determine the best
estimate u1 composition based on opticaL parameters aLone.
But the .faiLure o:f tbe relationship between re:fractive indices
and cumpusition ~ a~ is no impediment to tbe present worki
for the investiaation over compositionaL pbase re"ions 01 the
relationsbip between DMEANBP and known principal refractive
indices is a primary present »urpose. Success.fuL establlsh-
ment 01 a relatiuDship between DUBANBP and DMEANB for au"itic
pyroxenes must be supplemented by 2V data in order to
determine composition.
APPENDIX A 152

O~HER ~ELAT~D WORK.
The stron~es~ parallel ~o ~be present work is tbat of Morse
( 1~(8)' He p£oduced ~ new dispersion chart based on the 1923
and :followin" work of Isuboi and others who have identi:fied
~La"iocLases on the basis 01 alpha-prime curve~. Morse says:
For comparative studies o.fpLag.locLmses :from a sin"le environ
ment or ~enetic history, it is even probable that composi~ion
al variation can be deter.ined with ~reater precision by tbe
dispersiun me~hod than ~~ any analytical means, possibly
exceptina tbe electron microprobe, which gives comparable
results and ~tatJ.stics" (Morse, 19b8, p. 106). The similari-
~ies oi: the pre~ent work to ~orse's will become apparent:
Morse says "composition ranMe and sta~is~icaL parame~ers can
be read 01::1" (1968, p. I1JJ. Morse reports precisions on the
order oi: .OuOJ6 (Morse, 1b6S, p. 114). He does not es~imate
the accuracy 01 his metbod, however, sayin~ flit must be
stressed that we speak here 01 precision, Which is a necessary
but not su1Licient requirement 10r the accura~e knowLed~e of a
na~ural pla"ioclase compotiitionfl (Marso, 1698, p. 114). His
data SUQ~ea~ to him the pOtisibiLity that errors in assigning
vaLues to ~he immersion media are comparable ~o the order of
precision o~ mineral index determinations by his method.
Siailar in1erences are drawn 1rom tlle present work.
concern :for a.ccurate results is important in any case,
Though
APPBNDIX A 153

i~ is precision, no~ accuracy, which weighs mos~ heaviLy on
~he outcome 01 the present work. This is because the reLation
o£ D~EANBP ~o a knowQ priviLe~ed direction's index is the
sUbJec~ o£ the s~udy.
Morse (196~) used ouly sodium and mercury vapor lamp Li&h~
sources in his work,nolding temperature s~eady. The presen~
work uses onl~ sodium LiMht and varies temperature. Both
aetbodti .ta.Ll. short oof the aophis~ication o£ the double
varia~.ion method (£mmons, 1943).
The presen~ work shows that sin~le varia~ion o£ tempera~ure
is rapid. Morse's wor~ shows that sinale variation o.t wave
length Is rapid. Both are prec~se. Reversion by optical
mllleraloaiats ~o tlle dOUbLe variation method in combina.-tion
wi~h the identifica.tion techniques presented here should
resul~ in more rapid determinations than PoLdervaart could ~et
by double va.ria~iol1 as olltlined by Emmons. The cos~ o£
a.pparatus is LittLe compared to costs of modern microprobes,
X-ray machines, and wet chemical anaLyses. Of course, these
other techniques provide other kinds oJ: in:formation and are
not "oina to he replaced h~ the present method.
APPENDIX A 154
APPENDIX B
DESCR~PTI0N OF PE7ROGRAPHIC LABOBATORY
E1.EC'IBONICS.
A stepped decade resis~or is set to balance the resistance
of the ~hermistor on the stage, the thermistors at the prism
trouQh, or tbQ standard resistor used to check the circuitry
(switch to activate prism thermistors or standard resis~or,
prism theraistors, and standard resistor are not shown) in a
Wheatstone bridMe driven by a 12 v. dry battery (Figure B1).
Readin~s In ohms of the ste~ped variable resistor are con
v~rted by ca~ibratlon equations to temperature in Celsius
delllrees.
The upper leMB of the brid~e contain matched 24,000 ohm
resistors. Balunce in tbe brid&e is indicated by a di~l~aL
indicator whlch activates a hea~
control relay to turn on an above-staae in1rared heat source
as needed to hold the temperature desired. VariabLe trans-
10raers are used to permit dlf1erent amounts of heat to be
&enerated by four 300 ohm resistors fastened beneath the stage
and by the 100 Watt lamp set io a housina with variable :focus,
a dlapbra~mt and an in~rared camera 1ilter between the lamp
and tbe staMe.
APPENDIX.a 155

.....WESTON......... 3.5 DIGIT DVM
199.9rnv. FULL SCALE
THERMISTORABOVE-STAGEINFRAREDHE(>.T SOURCE,
~ 100WattLAMp·
12v.DRY
-=-BATTERY
HEATCONTROLL_~:t-_-,
RELAY.. ----- VARIABLE ----.,n't TRANSFORMERS'
.f}" au: "STA::;E Ir-J."----..JI~ HEATER * a
......... 110V. A.C ....... ~.... 11). ~h..~Jn\.
~ Fi~ure Bl. Tempe~ature control circuitry.
The therm~stors used are manu1actured by FenwaL E~ec-
tronics, Inc. They are Model G~a~ M~l12, described by Fenwal
Data Sbeet 1IJ>-7. Tbe beads each have .060" dil'meters and come
as aLl'8s-encapsulated pairs. Thuti, the pair is .120" wide;
the liIluss covers the 1 3/8" leads~or a distance o~ 1/2".
Glass protecting the leads is removed AS necessary.
Stage tggueralure cOQtroLa.
A thermistor set 1n 8 standard petrographic sLide senses
tempera ture.
A Zeiss Model KFT atudent polari~ina microscope is used.
Cbanaesin d~aae temperature are made by adjusting the voltage
to resistors in serIes a,11ixed to the stationary hori~ontaL
plate beneath the ro~atinM stA~e. The microscope is grounded.
APPENDIX B 156

Resis~ors mounted to the steeL ~~ame of the Jelley re~ract-
ometer and placed close to 1he s~eeL ~late against wbich the
prism sLide is heLd provide heat to the prism by conduction.
The temperature is varied by variabLe transformer. The above
sta~e infrared heat source is moved to interact with the
refractometer thermistors during oil caLibrations.
Re£ractoaaeter temperAtures are monitored by two thermistor
beAds.
Room temperdture is cont~oLLed by air conditioning.
Althou~h more precise and more expensive re£ractometers are
curren~ly manUfactured, the instrument described here yieLds
slani~icantLy increused precision
restrlctions. 21
Refractometer components and costs.
in spite of bud~et
The prototype uses Leitz Jelley refractometer Model II,
serial M2673 and Leitz microprislJl R7 640005, 1/333 ($212.00
manu1weturer's List prIce). A General ELectric 7 NA-l sodium
vapor lamp p~ovideB tbe monochromatic Light source. A pre-
ciaeLy machIned adjustabLe tripod desi&ned to support aravity
meters is used to support the JeLLey re£ractometer. An
21Readers interested in methods Yieldio& 7 place precisionare re1erred to the work 01 Werner (1~68).
APPENDIX B 157

Al~eneder and Sons steel meter s~ick serves as ~he hi« scale.
Re1ractometer op~ics.
Fi~ure B2 shows a 1amily 01 rays aenerated hy a sodium
11gb~ and projected to the Left as drawn.
APPBNDIX B 158

<C .:t-o 0
•UIU~
+tQ,0
~Ql~....
I 3lV':)S ~~
Jot V'H to~
~
•N~
Ql~,ttl
.>4r:..

The 10LlowinG AbbreYiA~ions Are used in the ~ext , in this, or in the next 1igure:
A = "the point u:t wbich unrefructed heam a-A bi*s the vertical scale normally. A' =the point ut _hich ~he r~~ ~o be rezructed c~o_se~ the Jelley refractometer scale.Delta. = the distance £rom A to the ~oint ~buve A where light shlnin~ 1rom above theoil hits the scale at FA. FA = tbe ~~lse A ~bt~ined when Li¥ht passes over the oiL onthe prism. H = the puint _here re~ractE~ be~~ a-a hits the scaLe. a' = the pointWhere the virtuQL im~~e created h~ o-a ~a.y be seen on the JelLey scale. HA = thevector Lrom A to a. U'A' = the vector trom A' to a'. NA = re1ractive index o~ air,here taken a~ ~.0002U. N~ = refractive index o£ prism glass, stated by manu£actureras 1.52012. NO = re~ructive index 01 iBmersion 'medium (usualLy oiL). a = the pointin the prism h4lf-wuy he tween the two iuter~aces shown in the second oi these two~i~ures; "as the re~ractometer is enlAr§ed th~ conceptua.l, practicaL, und arithmeticdl11erences between the prism anU poJnt 0 b~come vanishin~ly smaLL And are ignored incd.LculatioDS berth OA = t11e distu.nce trom 0 "to A. O-A = the unre:tracted ru}r"truvelinjl zrom A' to A. eli = the distance .from 0 "to H established by O-H. O-H = therefracted be....m tru.veLLinM ;from the pr.1slZ to a. p = t11e prism re~ion throu~h which there~ructed beam travel~ wnile between tbe tWD interiaces shown in the second o~ these 2.1i~ure~; the re~ion is di~~onaLly dot led In th~t £i~ure. PM = the prism mount, a ~Lat
sur~uce a~4~nst which clips hold tDe prism slide when it is placed on the Jelleyre~ruc~ometer. PS = t11e prism slide on whicb ~be prism is cemented; PS attaches totbe reJ'ractoancter via· the JJri~1D mount. pr = tbe prism t.rou"h Which bolus the~mmersion medium. ~H= a shiela pL~ced between the tops o£ PM and the Jelley scale toprevent lit4bt dii'.t:r~cted At A' ;from he.1n" Jii'~"n at the hi" verti.ca1. scule and. con:fusedwitb t11e re:tr<lac""ted beam U-li.
APPENDIX B 160

One o~ ~h~ rays ~n F£~ure a~ pas~~a thr~u~h A' (on the plAne connectin~ the centers
o~ tbe slIts In the JelLe~ re~rActometer s~4Le And tbe prism mount) and Is s~lected
10r dlscustilon. When the selected ruy pU.:ises normally :from air into th~ ~lass o:f the
prism slide, its veloc~ty decre~ses. ""hen .i.t emer"es :from the ~la~s to p~ss normally
into the i~mersiou medium held by the prism trou~h, its veLocity is again decreased
(the inde.x g:f tbe imlJuarti~on med~um is talten bere to be grea.ter 'than that o£ -the glass,
.bleh is tho case most cummon to tbe ~rese~t work; air, ~lASSI and oiL are not so
labeled, but are identi~ied by the syabcl o~ their res~ective re£ractive indices).
~
APPl::NDIX B 161

FJ.&ure BJ. PrislD optics.
NA
NG
J.'1
,yPS
APPENDIX B 162

A si~pli~ied treatment ot wha~ 101lowH is given by Jelley(1934). Tbe beam selected in Figure h2 is treated in FigureB3. The beam hits in~erface 1 at the angle _ to which theprism is cut. It is re~racted accordin~ to Snell's law,
N sin; = N' sin ~'.
Emer~in~ 1rom tbe prism at an angle to inter1ace 2, the ray isuaain rexrca.cted; it is now calLed o-H. By @eometry,
Application 01 Snell's law at inter1ace 2 yields
NG sin;' I = NA sin""".
Likewise by application of Snell's law and the relation
at interJ:ace I,
sin; = CNO sinC ; + t/>"»/ NO,
which may be rewritten,,"
sin ~ = NG( sin t/> •• cos; + cos;" sin ~ )/1110.
The entire equation lDay be divided by sin to yletd
li1O/NG = sin ~. I cot r/J + cos ~ •
cot tp = (NO - NO cos tp" )/(NG sin ~") ( 1) •
Equation 1 is ca. ~eneral ~eLAtionship. Use Is made 01 it inthe lIJ.nte"'~U.!JlJl-AO<S cl&l,.l.bniJ.oo of stl&u.e=re:(cactometer SYS
..tJuD1I section.
APPENDIX B 163

CONSTRUCT~ON 02 REF2ACTL~E~ER AND INTEGRATION WITH STAGE.
MOUNTING OF T~EBMISTOR ON S7AGE SL~»E.
A standard petroMraphlc microscope slide is pLaced on the
rota~in" a~a"e and is held by Zeiss mechanical s~a&e (ser~al
number 4210454). Tbe slide is moved to the extremes allowed
»y ~be mecbanical stage wbile a £elt-tipped pen is held under
medium power (lOX objective o£ N.A. 0.22 with lOX ocular) a~
the center o£ ~he field. Tbe perimeter of the field avaiLable
on a standard slide While held by the meChanicaL stage is thus
drawn. The dia&onals 01 the resultinM rectangLe cross and
de~lne the poin~ at Which a ~hermlstor is to be pLaced.
A 1 mm bole is drilled _itb a water lubricated diamond bi~~
The thermis~or is empLaCEd and held with epoxy resin. The
wires are led to the ed~e 0% the sLide and held with epoxy so
thin that it does not inter£ere with the action of the sLide
on the 8~a~e. The leads are tb~n connected to flexible wire
which is suspended from above the entire wicroscope with
enou&h play to alLow 1ulL 3600 s~age rotation (but no~ much
more). The leads then connect with the above described
Whea~stune bridge. The slide can easily be built in a morning
and is reused un~il, perhaps, it is des~royed accidentally.
SUch an accident occurred in this work when a soLdering iron
APPENDIX B 164

was used in an attemp~ to remove excess epoxy ~rom the stage
sLide and thereby permit 1ree pLay 01 the high power obJective
lens no matter wbat ~he stQ~e rotation. The heat strained the
~Lass and produced anisotropy in it. A Short study showed
that both uniaxial and biaxial optic 1i~ures appear qUickly in
gLass as it is heated at the center 01 the sLide with a
soLderinM iron. The 1igures appear in the ..Lass under crossed
DicoLs and withuut the conoscope. The markedly biaxial
1i~ures so produced in quartz being used to calibrate the
sys~e. necessitated buiLdinM a new prism slide and submitting
the entire system tu recalibration.
MOUNTING OF T~E~MlSTORS ON iEF~ACTOMETBR PRISM SLIDE.
A thermistor bead is placed at ~ach end of the trou~h of
the JelLey re1ractometer ~rism so that each is in contact with
the immersion medium in tbe prism trou..h. The leads from the
prism 10rm a verotex at the top o~ the prism slide, and the
thermistors and ~lass eDcasin~ tbem and their ~eads for a
length oJ: 1/2" are a.ffixed by cLear epoxy resin.
To facilitate placement 01 immersion media into the prism
trouKh, a short wire is a11ixed by epoxy so that a drop 01 oil
placed on it is led to tbe prism trouah. This avoids having
the drop Led to ~he outside 01 the prism sTstem by .followlnG
the outer sides o:f the prislI LeAds.
APPENDIX B 165

Grea-t Cl:&.re is needed during "l.uin" -to ensure tbat no epoxy
resin en~crs the prism trough whicb will contain the immersion
medium. Even "though none enters immediately, SO.lle may be
drUWD ioto the trough by surface tension durin~ curinG' so it
is better to use too little ratber than too mucb resin.
CONSTRUCTION OF BIG RBFRAC10~ErE~.
A Leit~ Jelley re~rdctometer is tilted to project a
horizontaL, unre1racted beam across the room where readio"s on
a vert icl:&. L scule Are dlrec"tly related to readinGs 00 the
unmodified re~ractomete~. Calihration of the entire scale is
~osBibl.e when a s~aListicalLy si~ni1icant number 01 readinGs
on the hi" scaLe are avera~ed against concurrent readings on
the small scaLe for an oil of high re1ractive index.
However, a di±1crent approach introduced here below relates
known indices measured cn the sta~e to known heights 00 the
hi*, sCbole. This removes tbe effects of the small SCAle trom
the calib..atiQn.
A scale is erected oo..aal to the unre1racted beam AS ~Ar as
possible ~rom the prism (in the present case 518.1 cm) within
vertical bond horizontal B&dCe limitations. Tbe l1iMhest index
01 interest and the de~.. ee ot precision desired determine the
respective extremes necessary.
The prototype was aSBeahled by pLacin" the sodium li"ht on
APPBNDIX Blob

a desk aga.in.lit tne rooUl waLL. A wooden pla~~orm was gLued to
botb ~loor and walL wi~b contact cement. The tripod was
pLaced on tne pLat£orm, lis steeL prongs were du~ 11rmLy into
the wood 01 ~he p~at10rm top, and ~he tripod was gLued to the
pLat.:forlll. The top part o£ the tripod comes mounted to the
tripod base via iI. hall Joint. The ~elLey re£rac~ometer was
mounted on a pLywood base and the base was a~tached by
C-cLamps to the top 01 the tripod. Tbe hack 01 the JeLLey
re1ractometer was placed aMainat the sodium vapor Lamp. A
wooden ShieLd was placed between the tops 01 the JeLLey scaLe
and the prism mount to eLiminate stray Li"ht e~fects at the
bi~ scaLe.
Two bookcases were cemented t06Jether back to back wlth
siLicone ruober to 10rm a firm support £or the scaLe. The
edae 01 ~be bookcase 1artheat £rom the prism was made vert.ical
wltb a pluuab, Level bUbble, and Lar~e 45° triangle. Screws on
the top 01 tne tripOd were adJus~ed to make the unre1racted
beam arrive normal to the verilcaL edge o~ the bookcase. A
Large number of marks was ~ade o£ the incoming beam height on
the bookcase where the scaLe would be mounted. See be1.ow IIJlJiJl
0:( retrac1;owetiU;:" for a description of how arriving beams are
The center 01 density of these marks was found by
eye and arbitrariLy caLLed A.
zeroed to A and alued in pLace.
Two wooden meter sticks were
They serve as ~he pLai10rm on
wbicb ~be steeL meter sticM is mounted with C-clamps. Tbey
APPEHDIX B 167

repof:ii~ion thetoalso provide re:ference marks with which
6~eel 6~ick when necessary.
The distance OA (Fi~ure B2) was measured with an uncatl-
bra ted steel tape. Ten measurements ran~ed between 16.995 £t
and 11.001 :ft, Yletdinu a mean 01 16.995 ft and a sta.ndard
These convert respectively to 518.1 emdevia.tion o:f .002 £t.
and 0.06 em.
Sli~ht vertical dispLaceuents 01 H as a :function o£ varyin~
·IJ lac emen ts 0 f the prisB on the prism mount we~e noticed.
There£ore, chocks wer~ ~laced on the back 01 the prism slide
and on tbe 1ront of tbe prism mount to ensure repeatable
placement ox the prism on the prism mount.
A Wbite a" x 5" card is .folded Len.. thwise, accordian-style.
One ox the outer panels so created is laid along the ed~e 01
the steeL meter stick. ~he other two panets are laid on the
:front 01 tbe steeL weter stick, and the outer one of them is
stuck to U.e meter stick "ltb cJoubte-stick tape; this 0.1low6
repositionin" as necessary. The panel laid against
01 the meter stick is sur:facad with transluscent, penciL-
acceptinM tape. This is in turn coa.ted _ith white typewriter
eorrec~ion :fluid. Use 01 the card is described in Appendix C
under lI~eadin" the bi~ scale."
APPENDIX B 168

SYSTEM CALIBBATIONS.
Thermistors are ctLlih~4~ed tL¥ainst thermometers over a
~emperature ran&e 1rom 00 C to 500 C. Calibration is
perforwed in an aLuminum block witb a central chamber bolding
tbermometer aDd both the sta~e sLide and prism slide with
their contained tbermistors. Thermometers used are readable
to bundredths 01 a de~ree c. Eacb thermometer is about 2 1eet
lana and covers a ranae 01 ~out 120 c.
Data 101' thermistor calibrations consist 01 a large number
01 readiD~s during bo~b increu.sin~ and .decreasing temperature
cbana88, obms to balance tbe Wbeatstone bridge beina read
against tbermometer tew~eratures. Pulynomial re"ressions to
the data .tor each slide's tbermistors are done by BMD05.R
(Dixon, 1970).
Two refractive indices are taken as known. One is that 01
a precisely known CorDinM Glass Works glass 01 biab index. 22
~~s index for sodium Li"ht 1s 1.7548543. Corning's Senior
Pa-oduct ED"ineer John B. Bel. writes (personal cOllllllunication):
"The Cornina Glass Works method 01 determining the indices 01
A piece of ~lass utilizes 6 me&surements at eacb 01 ~en
22"Precision ~ptical Glass, Code 8276.marked uEXTRA .1-45."
Type 755-276. "
APPENDIX B 169

distinct monochromatic 2pectraL Lines read on a Model C20
Guild-Watta spectrometer. lhese data are proaraamed Into an
i.B.~. 360 Model 40 coaputer to produce a sl~ constant
Se~lmeier dispersion equation which best Lits the data.
individual errors are averaged out and the curve smoothed.
Tbe individual indices produced ~or any wavelength are repre
sentative o~ tbe true indices o~ the .~ass with an accuracy in
the seventh decimal place, and the data 101' any wavelen~th
witbin the ranMe o£ the orl~inal ten measurements is more
accurate than that obtained by any sy~tew using only measure
ments at one waveLength to determ1ne "the index 101' that
wavelenMth." A corolLary statement can he made in support oL
usin~ a sUbstaMe variable bandwidth monochromator durine work
with minerals.
The other re1ractive index taken as known is that o~ omega
in a per£ec"tly clear crysta 1 of quu.rtz (orlain unknown). An
arbitrary assi&nment of index to the quartz ome~a was made on
the bu.sis 01 the work of Frondel and Hurlbut as reported in
(1867h, p. 201), This most precise measurement
made on a crystal of known purity aave a value 01 1.544258 tor
quartz ome~a. Since Deer ~~ Al. mention in the same context
work 01 others who have sUM~ested rounding the value of quartz
omega to 1.544 for purposes 01 calihra"tion. hu"t since the
auagestion preceded the work o£ FrondeL and Hurlbut, se~ectlon
01 the more recent and more precise measurement seems Justi-
APPENDIX B 170

~ied, especially since tbe number is used in double precision
computer c~lculations in this work ~nd since it rounds to the
sug~ested 1.544 anyway. Unfurtunately, independent corrubora-
t10n of either the Cornin~ gLuss or the quartz omega indices
have not been obtained. But this shuuld be no ~reat detriment
to the present work, 10r precision, not accuracy, is here most
import~nt ~s discussed eLsewhere herein. And tbe constancy 01
the value 01 quartz omega 1rom sample to sampLe is well known.
The aoaL is to relate £or a given oil at a given
temperature tbe heiaat it proJectti on the big scale to the
index it possesseti both in the re£ractometer prism trough and
under a cover slip on ~be staMe slide.
Establishment 01 the nUD~er o£ ohas at which the Wheatstone
bridae is balanced wben eitber the Corning glass or the quartz
ome~a matches an oiL Mi~es the temperature 10r each oil at
which match of index is established on the sta~e. By
calibration equations, the same temperature is determined for
the refractometer prism, and the system is switched to the
refr~ctometer to balance at the indicated temperature 1ur each
oil. Tbe helaht un the biM refractometer scale is established
for each oil at the reB~ective temperatures. Thus, .tor two
Widely separated pointti on the refractometer scale, height is
related to known index. Castin~ equation 1 into a specl1ic
form which pertains to this present system is the next step.
Angle phi is a property of the prism. It does not change
APPENDIX B 171

as a function of tbe oil ~n use. NO of equat~on 1 is known
precisely for two o~Ls at tempera*ures matcbing *he indices of
the Corn~n~ glass and quartz ome"a respect~vely. Let the
index 01 the oil matchinQ ibe quartz omega index be NQO. Le*
ihe ~ndex 01 the o~L matcb1n~ *he CorninQ cal~bration glass be
NCCGO. Le~ phi double pr~me measured zor NQO be QZPHIDP and
le* phi double prime measur~d for NCCGO be CCGPHIDP.
Since equat~on 1 sets ihe cotan~eni of phi equal to an
expression .hoae only unkoo.n is NG in both the cases of
quar*z omega and ihe Cornln~ gLass, measured vulues of QZPH
und CCGPHI to~ether with known values 01 NQO and NCCGO are
entered in the ri~bt s~de 01 equation 1 separately £or the
cuse of quartz omeMa and the case of tbe Corn~ng Mlass, and
the resultina expressions ~re set equal to each other:
(NQO - NG • cosQZPHIDP)/(NG • sinQZPHIDP) =
(NCCGO NG. cos~CGPli!UPj/(NG • sinCCGPBIDP),
u sln"le equailon wiin a 810£le unknown, NG.
NG may be found eitber matbematicall.y or by iterative
cnanges to NG in a computer pro~ram until tbe heights and
Indices measured respectively for CorninM glass and quartz
omega are made to match. 7he latter approach 1s used bere.
Solv~n" for NG in the present work yielded a value of
1.52143, s~"ni~icantLy 0.00131 hi~ber ihan the manufacturer's
APPBNDIX B 172

s*ated index of 1.52012 +/-0.0003 (Dr. Manfred Nahmmacher,
personal communication}. 1 have trus*ed the value of the
arbitrarily chosen quartz omega index over that of the
manu±acturer's stated prism alaas index in the current system.
A proaram which ~enerates a table of re~ractive indices for
small increments in height on the big re1ractome*er scale is
avaiLable on request.
Construction and calihration 01 the entire, inte~rated
pro*otype ~ystem was accomplished along _ltb other work over a
6 month period.
APPENDIX B 173

APPENDIX C
USB OF PBIBOGRAPHIC LABORATORY
The limits 01 system calihra~ion at present allow tempera
ture chanaes from 15 to 50 degrees Celsius. The digital volt
meter is most often adjusted to deviate no more than about 20
reprQsents in the present system a ~e.pera~ure 01
dig1ts .from the desirQd zero setting. Since each di~it
0.004° C,
and since the system avera.ges about the desired temperature,
it is conservative to say that temperature on the sta.e is
controLled to precIsions of ~entbs and possibly to hundred~hs
of a de"ree CelsIus.
beat.
The system produces constant, metered
Wbereas otber studies (~.~. Smitb, 1960) and the present
one at its start bave souMht to work at closely controlled
room temperatures to avoid beat ~radients, beat GradIents are
now used extensively in tbis work both to chan&e temperature
quickLy and to hold a desired temperature precisely. Por
instance, a bi~b power obJective close to the slIde acts as a
heat sink when the stajie is above room temperature and as a
heater when tbe sta"e is below room temperature. It is :found
that repeatable, useful results are obtained in any case since
the thermistor is mounted .iih the oil and ~rains in the slide
and controls the above-staMe heater. It is sometimes helpful
to turn OfL the air conditioner While heating the sta~e to a
APPENDIX C 174

consider~bLy hi~her ~empera~ure. Both s~age and refrac~ome~er
are at times cooled with dry ice. The system is dynamic.
USE OF ELECTkONICS.
To cooL the thermistor to a desired temperature, ~he
s~epped resis~ance is raised. This turns off the above-stage
heater And the system beains to cooL. If necessary, ~he
sUhsta~e hea.ter can he turned down or off a.nd dry ice CAn be
used to hasten ~he process. When the resistance of the
thermistor .a~ches that 01 the stepped resistor, the minus
indicator ~ecomes active, turns on ~he ahove-s~age heater, and
cycLes 1=be in1rared heat on and off to hold a temperature
Which Avera,gea ~out the one sou~ht. Adjustment of ~he
variabLe trans10rmers quickly brine£s the system to A tempero.-
ture equilibrium at the thermistor .ithin tenths And at times
thouso.ndtbs of a de~ree CeLsius. Conversely, to heAt ~he
stage, one may need onLy to ~ower the resistance set into the
stepped resis~or i1 ~he chanae desired is small. For very
large changes in temperature, it may he necessary to turn the
sUhstaae heAter up, shine unfiltered .biteli",bt up ~hrougb
~be uaicroscope, turn 011 Air conditionin& to reduce air
motion, and cover the alcroscope 1=0 trap the heat. This
sounds complicated but Is easily done. Even though it
APPENDIX C 175

"eneral~y ~~kes longer to heat th~n to cool the sta~e, beating
even over a temperature ranMe o£, say, 30° C usual~y takes no
longer than ~ 1ew minutes. When the temperature Bought is
re~ched, ~he above-staMe beater be~ins to cycle on and o~£ at
ahout 1 second interals, and counting is begun. Further minor
adJustments o£ variable transformers during the count permit
e~tremely stable temperatures durin~ the count.
f£ism-i§mQ§~LAa·
Temperature at the pris. is monitored as £or the stage; the
above stage heater is moved and called the ex~ernal heat
source £or the re1ractQmeter. The Wheatstone brid~e is
tiwitched to the prism thermistors, and the system seeks a
balance exactly as it does when monitoring stage temperatures.
Readin~s of ohms £or the same temperature are di££erent,
however, between the st4~e and the prism thermistors. This is
because even thou~h e~ch is calibrated ~t the same time under
the same conditions, euch produces a di~1erent calibration
curve.
APPENDIX c 176

CALl.JlRAl'ION CF UUiERSION MEDIA
C~l.iJJra.tl.on of each immersion medium used is made over a
wide (10-50 0 C) temperature ~an~e. This permits ~empera~ure
p~ede~ermination 01 a deslred relractive index with which to
compare indices 01 immersed Mrains. Equations relating re1ra-
c~ive index to temperature 101' each medium so treated are
~enerated by the packaaed ~QlynomiaL regression program llMDOSR
(Dixon, 1970).
USB OE ~EF~ACTOM~TER •
.1JlU~.lUioQ QLoil to QUit...
The prism is placed on the prism mount and a drop of oil is
placed on the wire leadiDM down to the prism trough. The oil
~lo.s by surLace tension to the prism trough. Excess oil is
led to the outside • .1tn a hand-held alass rod so that it does
not 1low over the front 01 the prism ~lass.
Readio"~ !JiM scal~.
For hi~hLy volat.1le media, two people may be used ~o ensure
~hat the redodlngs 'taken are not a1fec'ted significantly by even
brie.f time chanaes. One person in~roduces the oil to the
prism trouab. the other takes readin&s as soon as possible at
H on tile .aia sca'le. With practic'e, even one person can ge~
APPBNDIX C 177

~ood ~eadings of oiLs even as high in index as 1.8.
InitiaL posi~ionin" of ~be ~olded 3" X 5" card on ~he big
scaLe is accomplished by introducing the oi~ to be measured to
the prism And siQhting the beam o-H ~rom behind the hig sCAte.
The card is pLaced and the prism is c~refulLy cLeaned While
s~ill in p1.ace so tha.t it can ~emain at the desired tempera
ture. CLea.nin~ is ~eadi1.~ done wlth twists ot tissue. As
SOon as the medium whose ~ndex is to he dete~mined is in the
prism trough. a very sbarp, thinly tapered, so~t pencil. is
used to spLit the inco.in~ beam at its apparent maximum
intensity, and the position of H is marked 10 times as a
watte~ o~ course tor all H readinMs in this wo~k. The marks
are made on the panel of the card which Lies against the side
o~ the meter stick, and the observer is not able to see the
ma~ks made wbiLe si~btin& down bea.m a-H.
For corrections to driit of the refractometer durin~ a
series ot ca.1.ibrations, a. series of 50 readin"s is taken at
~he start and another 50 at ~be end ot each calibratin~
session. The p~ism is dis.ounted 10~ these readings •• Thus,
sliMbt correct~ons .tor d~~;ft due to tempe~a.ture, pressu~e, and
humidity fluctuations are gade ~o the heights measured during
the session hy si~ple tri~onometry. The co~rections so made
are "eDe~a1.Ly on the o~der 01 no more tban .2 cm, representing
refractive index corrections 01 no more than .00003 over the
~ange 01 indices up to I.S.
APPENDIX c 178

The cal"u is ~oLded £ack so ~hat the dots placed on it by
the obsel"vel" lie in the same plane as the ·lines SCl"ibed on the
mete I" s~ick, and two cemtimetel" lines near the dots are
care~ully transcribed ~o the panel with the dots. These lines
are labeled, and the cal"d is I"emoved from the meter stick. A
Gerber scale (which divides Len~ths ~rom 1 to 10 inches into
100 equal se~wents by woving a calibrated spring) is used to
.&'ead the dots. Tbe indicated heights o~ Hare recol"ded ~o
hund.&'edths o~ a cen~imete~ fo.&' each. The mean 01 the readings
is Lound by Nova computer. The standard deviation of 10 such
measUl"ements is commonly on the order of 1 mm 01 height on the
bia scale.
Some comments on how best to si"bt the beam are in order.
Best results are obtained when the stylus is held normal to
the side 01 the meter stick at a comfortable arm's len"th.
nohbin~ the head slowLy up and down and ~ocusin~ on the beam
u.t the priam, not at the .biB sCta.le, maximum beam intensity is
To eliminate bias it is best to
settle on the beam alternately Lrom above and below. A pu.tch
over the unused eye is sometimes heLp1ul lL a large numbel" of
relLdln"s is to be taken. Coatln~ o~ the middle panel of the
card with black avoids the possibility 01 preJUdicing readings
with atray marks which mu.~ have heen made.
CARE OF CALiBRATED OILS.
Culihl"ated oils are precious. Grea~ care ~s ~aken to
APPENDIX c 17SJ

elimina~e contamination. Glass rods in~roduced ~o an oil are
firs~ quite ~horoughLy cleaned wi~h ace~one and then mois~ened
with condensation 1rom the h~eath and wiped with tissue. OiL
vial caps are sealed with tape or silicon rubber ~or stora~e.
The extremely toxic, volatile, and corrosive H series oils 01
Car~ilLe Labo~atories deccmpose even the bottle caps used by
the manufacturer. TraQa1e~ to ~tass vials capped with polye
thylene and sealed with silicon rubber after each use seems to
provide a soLution to tbe problem. The effects o~ curing
siLicone ru~ber so near tbe oil remain unknown.
APPENDIX C 180

DETAILED SUGGESTIONS FOB COUNTING INDICES.
~~§&~§~miQer4L-RhA~ereMio~~~~~.
Randomly encountered indices.
AllY coun tina( methud used to count indices of beta-prime is
acceptabLe so Long as each grain's index is encoun~ered a~
random. Operatora Ulay 1ind that varying the pattern in use
preserves sanity. I do not mean to prescribe any particu~ar
pattern, but one used repeatedly in this work is to count
first the grains on the vertical, then those on the horizontal
crosahair. The perimeter Is then examined. For crosshair and
perimeter coYnts, all ~rains tuuching crosshair or perimeter
are counted once only. So 1f a grain is in the 1ield center,
it is counted on the vertical, not the horizontal pass. Some
~rains on the perimeter do oot extend into the 1ield 1ar
enou&h to ~ive unambi&uous readings. They are ignored. AJ:ter
countiotl aLl ~raios cut by or tanaeot to crosshair3 or
perimeter, those remalninQ 1n the 1ieLd are counted qU~drant
by quadrant proceedin" counter-clockwise 1rom the northeast
quadr4Ut. Use 01 such a pattern exhausts the £ieLd systemat-
A new 1ieLd is selected and tbe count continued.
Adherence to such Ii. pattern provides a consta.nt check against
subJectlvi ty.
It is commonly best to use medium power, have the grains
dispersed enou~h so tha~ no more than about 10 fal~ in each
APPENDIX c 181

qua.dran t o£ the field, and to examine each grain o£ each
quadrant £lrst under pLane-polariz~d a.nd then under cross
poLarized .Li~ht (to seek Qrains containing so little impurity
tha~ i£ they match the oiL they otherwise go undetected).
Huvin~ exhausted a :field in such Ii. manner, movement of one
axis o£ a mechanical sta~e introduces a completely new field
01 grains (best located under crossed nicolaJ and the count is
continued. Though statistically it does not matter Whether or
not the stage is set so long as euch grain encountered has
random orientation, the stuQe is locked at some convenient
orientation for two reasons: 1. Operator bias is eliminated.
2. If tbe operator becomes interested in measurln" some
properties of anythin" in the oil, he can note the readings of
the microscope and mechanical staMes and return tu the same
point ai: wilL. Care.ful lIorkers wiLL not be bothered by
movement of grains in the mount durin~ this procedure.
Moreover, in some work it is o:f interest to compare the
randomly encountered index with that of a known vibration
direction, in which case it is a convenience to have a set
stage position. It is convenient to use a setting Which
aLlows a "rain to travel alon" a. cross-hair when the ocular is
set wi±o the cross-hairs at a 45° angle to the nicols.
Counts o.f index assi&nments are best accumulated on a
mechanicaL point counter. In the case o£ randomly scattered
Mrains, 100 grains are counted in each mount.
APPENDIX C 182

Indices o£ Known POD's.
In ~he case 01 oriented Mrains, 20 grains are coun~ed in
each moun~ unLess ~he ~irs~ 12 grains are assigned ~o ~he same
ca~egory, in which case ~be coun~ is discon~inued.
The - -most convenien~ fOD index to measure is usually be~a,
hut circumstances mi~ht dictate other choices as 1:01' the
choice oJ: ,-,amilia-prime in this work on orthopyroxenes. The
relations between DMEAN~P and the mean alpha-prime o~ Tsuboi
miah~ prove interesting 101' the pLagioclases, £01' example.
Operator bias was J:ound to be more danMerous during work
with oriented than With random ~rains, £or the stage is free
~o ro~ate durin~ the procedure, and it is the petroarapher's
trainin~ to recognize and select ~rains 01 low retarda~ion
when seek in. optic axis 1iMures. 23 However, the phase reGion
examined may be so broad as possibLy to select one composition
ou~ of a raUMe i~ this ~echnique is employed. Therefore, the
method adop~ed has been to traverse the 1ield under conoscopic
eondi~ions and to examine each new 1i~ure to see whether A
desired orientation can ~e obtained. The first 12 or 20 such
~rains yielding use~uL ~i~ures are counted.
230ptic a~is ~i~ures are in fact very rarely used in thepresen~ work. In nearly all cases, even in 1eldspars, turningthe sta"e produced noticeable changes in grain indices evenwhen optic fi~ures appeared so well centered that prior tothis work i would not have besitated to use the index measuredat any sta~e rotation. This work makes almost exclusive use01 the Kamb method on Bxax and Bxaz 1:isures; rarely, themethod of Tobi is possible (BLQss, 1B61).
APPE.NDIX c 183

In 1:raverses dur.ing a beta COUll't, grains wl1:h ambiguous
optic ~l~ures are rotated under plane poLarized light through
360°. if the ~rain indices are in all positions 01 rotation
assignable to the same cateQory of L, E, or G, i1: 10110ws that
the beta index is also in tha1: category, and a count is made
in spi1;e o£ the inability to align beta with the polarizar.
other countin" conaidera1:icns.
When a aampLe is contaminated by a mineral with about the
same refractive index, optic £i~ures may provide tbe only
trustworthy method o£ optical discrimination. Such A case
occurs in the present .ork in sample P-8 where the £eldspar
occurs with rather abundant quartz. Usually, only grains
haviu" clearly bi~xiAL liMures and yielding the beta index are
counted. Heta and beta-prime indices are taken from the same
~rain by choosing a set staMe position to Which each grain is
turned .£0.1'
measurement.
the beta-prime weasurement £ollowing the beta
The count o£ beta-prime under these circumstances is
limited to 20 rather tban the usual 100. ALthough 1:he
possibility that the observer will show preJudice to the
category 1uund ~or beta .ben finding beta-prime 10.1' the same
~raln. the assignment to L, E, or G is usually clearcut. The
occasion",l twenty grains per count of beta-prime by this
APPENDIX C 184

method seem ~o bave produced use~uL reau~ts. But ·the method
is more time consuming ~han ~he standard method o~ obt~ining
100 counts of beta-prime lind is not recommended.
In samples containinM bi~hLy-aLtered minerals (~.~. 52HE-
29 ), only ~resh grains wbich produce use~u~ £igures are used.
This way bias the results of the present work when ~he resu~ts
are compared to ~hose produced by cbemical
probe, Xray, or other methods.
analysis, micro-
Twins o..t times cause a sin~le grain to display distinctly
aifferent indices. In such cases each member is treated as a
When .his occurs with polysynthetic twins,
one count is ~iven to eacb type o£ twin member.
The counting ~ime required to produce the data for deter
mination o:f DMEANBP by proMralD CUld or its analog by probabili
ty paper "rllpbi'cs is tbe sawe--ahout 45 minutes per mineral.
phase per rock specimen, durin~ Which tiu1e the worker can
obtain 100 coun,ts - oJ: beta-prime in each o~ 4 media whose
di~ferent indices are £eLected near the mean. Counts o£
indices in known POD'S ~enerall.y take someWhat lODger due to
the need of ohtainin& optic figures. However, the need o£
optic £iuures wiLl. become less important for de~ermination of
indices as determinative curves relating DMEANHP to known POD
indices become ~enerally available for various minerals.
APPENDIX C 185