UNIVERSITA' DEGLI STUDI DI UDINE - IRIS
102
UNIVERSITA’ DEGLI STUDI DI UDINE Joint PhD programme in Molecular Biology Ciclo XXXII in agreement with: Università degli Studi di Trieste International Center for Genetic Engineering and Biotechnology Scuola Internazionale Superiore di Studi Avanzati ROLE OF MITOCHONDRIAL APE1 IN EARLY STAGES OF HEPATOCELLULAR CARCINOMA Candidate: Supervisor: Veronica BAZZANI Dott. Carlo Vascotto YEAR 2020
-
Upload
khangminh22 -
Category
Documents
-
view
3 -
download
0
Transcript of UNIVERSITA' DEGLI STUDI DI UDINE - IRIS
UNIVERSITA’ DEGLI STUDI DI UDINE
Joint PhD programme in Molecular Biology
Ciclo XXXII
in agreement with:
Università degli Studi di Trieste
International Center for Genetic Engineering and Biotechnology
Scuola Internazionale Superiore di Studi Avanzati
ROLE OF MITOCHONDRIAL APE1
IN EARLY STAGES OF HEPATOCELLULAR CARCINOMA
Candidate: Supervisor:
Veronica BAZZANI Dott. Carlo Vascotto
YEAR 2020

1
2
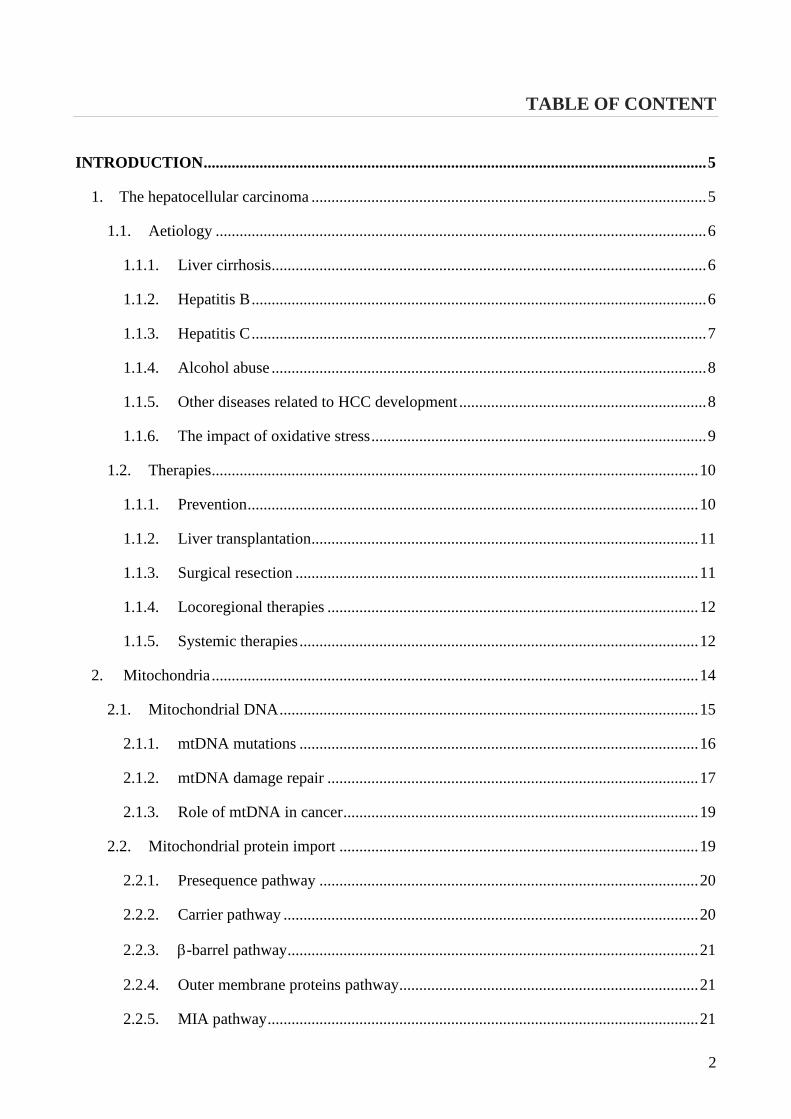
TABLE OF CONTENT
INTRODUCTION .............................................................................................................................. 5
1. The hepatocellular carcinoma ................................................................................................... 5
1.1. Aetiology ........................................................................................................................... 6
1.1.1. Liver cirrhosis............................................................................................................. 6
1.1.2. Hepatitis B .................................................................................................................. 6
1.1.3. Hepatitis C .................................................................................................................. 7
1.1.4. Alcohol abuse ............................................................................................................. 8
1.1.5. Other diseases related to HCC development .............................................................. 8
1.1.6. The impact of oxidative stress .................................................................................... 9
1.2. Therapies .......................................................................................................................... 10
1.1.1. Prevention ................................................................................................................. 10
1.1.2. Liver transplantation................................................................................................. 11
1.1.3. Surgical resection ..................................................................................................... 11
1.1.4. Locoregional therapies ............................................................................................. 12
1.1.5. Systemic therapies .................................................................................................... 12
2. Mitochondria .......................................................................................................................... 14
2.1. Mitochondrial DNA ......................................................................................................... 15
2.1.1. mtDNA mutations .................................................................................................... 16
2.1.2. mtDNA damage repair ............................................................................................. 17
2.1.3. Role of mtDNA in cancer ......................................................................................... 19
2.2. Mitochondrial protein import .......................................................................................... 19
2.2.1. Presequence pathway ............................................................................................... 20
2.2.2. Carrier pathway ........................................................................................................ 20
2.2.3. -barrel pathway ....................................................................................................... 21
2.2.4. Outer membrane proteins pathway........................................................................... 21
2.2.5. MIA pathway ............................................................................................................ 21
3
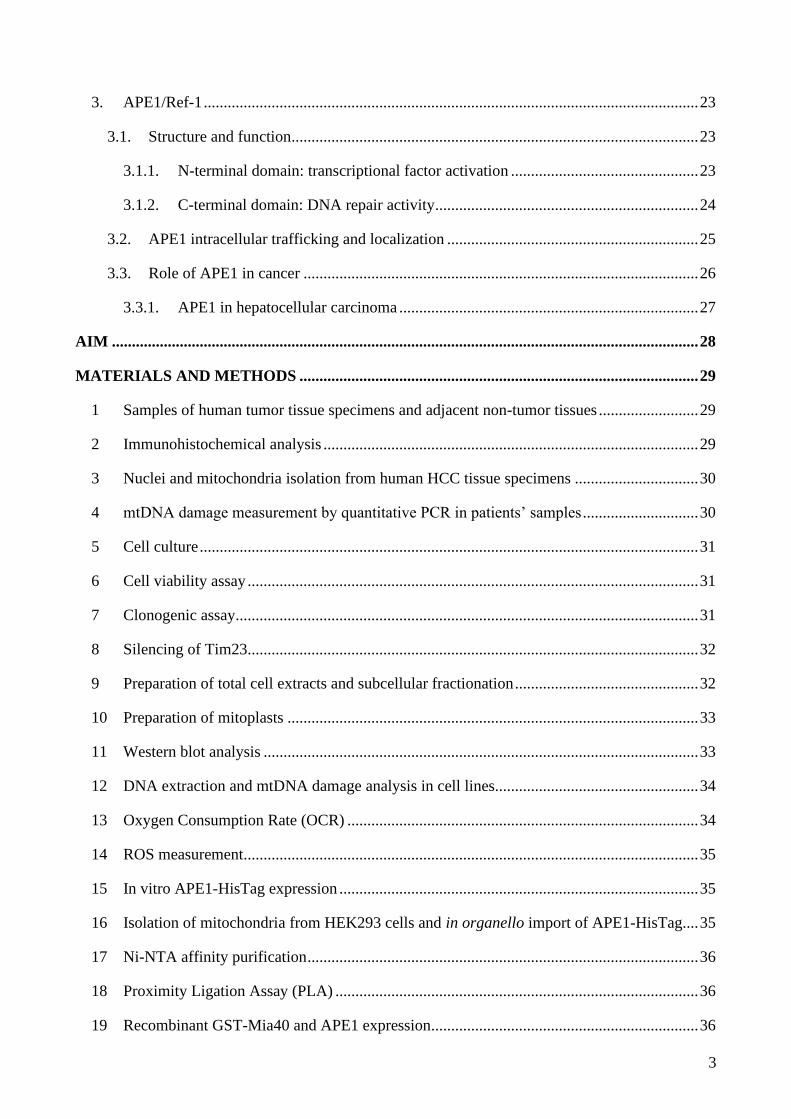
3. APE1/Ref-1 ............................................................................................................................ 23
3.1. Structure and function ...................................................................................................... 23
3.1.1. N-terminal domain: transcriptional factor activation ............................................... 23
3.1.2. C-terminal domain: DNA repair activity .................................................................. 24
3.2. APE1 intracellular trafficking and localization ............................................................... 25
3.3. Role of APE1 in cancer ................................................................................................... 26
3.3.1. APE1 in hepatocellular carcinoma ........................................................................... 27
AIM ................................................................................................................................................... 28
MATERIALS AND METHODS .................................................................................................... 29
1 Samples of human tumor tissue specimens and adjacent non-tumor tissues ......................... 29
2 Immunohistochemical analysis .............................................................................................. 29
3 Nuclei and mitochondria isolation from human HCC tissue specimens ............................... 30
4 mtDNA damage measurement by quantitative PCR in patients’ samples ............................. 30
5 Cell culture ............................................................................................................................. 31
6 Cell viability assay ................................................................................................................. 31
7 Clonogenic assay.................................................................................................................... 31
8 Silencing of Tim23................................................................................................................. 32
9 Preparation of total cell extracts and subcellular fractionation .............................................. 32
10 Preparation of mitoplasts ....................................................................................................... 33
11 Western blot analysis ............................................................................................................. 33
12 DNA extraction and mtDNA damage analysis in cell lines................................................... 34
13 Oxygen Consumption Rate (OCR) ........................................................................................ 34
14 ROS measurement.................................................................................................................. 35
15 In vitro APE1-HisTag expression .......................................................................................... 35
16 Isolation of mitochondria from HEK293 cells and in organello import of APE1-HisTag.... 35
17 Ni-NTA affinity purification .................................................................................................. 36
18 Proximity Ligation Assay (PLA) ........................................................................................... 36
19 Recombinant GST-Mia40 and APE1 expression................................................................... 36
4
20 GST-pull down ....................................................................................................................... 37
21 CABS-dock ............................................................................................................................ 37
22 Mitochondrial lysate incubation with MSP1 or MSP2 .......................................................... 38
23 Immunofluorescence .............................................................................................................. 38
24 MSP1 and MSP2 import in mitochondria .............................................................................. 38
25 Cell viability ........................................................................................................................... 39
26 Statistical analysis .................................................................................................................. 39
RESULTS ......................................................................................................................................... 40
1 Mitochondrial accumulation of APE1 in HCC Grades 1 and 2 prevents mtDNA damage ... 40
2 Mitochondrial expression of APE1 sustains cell growth and cellular respiration ................. 43
3 Mitochondrial oxidative stress induces IMS/matrix translocation of APE1 to preserve mtDNA
integrity .......................................................................................................................................... 48
4 APE1 interacts with TIM23/PAM complex........................................................................... 55
5 Selective inhibition of TIM23 blocks APE1 trafficking preventing mtDNA repair .............. 60
6 Design a strategy to block APE1 translocation in mitochondria ........................................... 63
7 MSP1 and MSP2 characterization ......................................................................................... 67
8 MSP1 negatively affects cell viability ................................................................................... 68
DISCUSSION AND CONCLUSION ............................................................................................. 69
LIST OF PUBLICATIONS ............................................................................................................ 77
REFERENCES ................................................................................................................................. 79
5
INTRODUCTION
1. The hepatocellular carcinoma
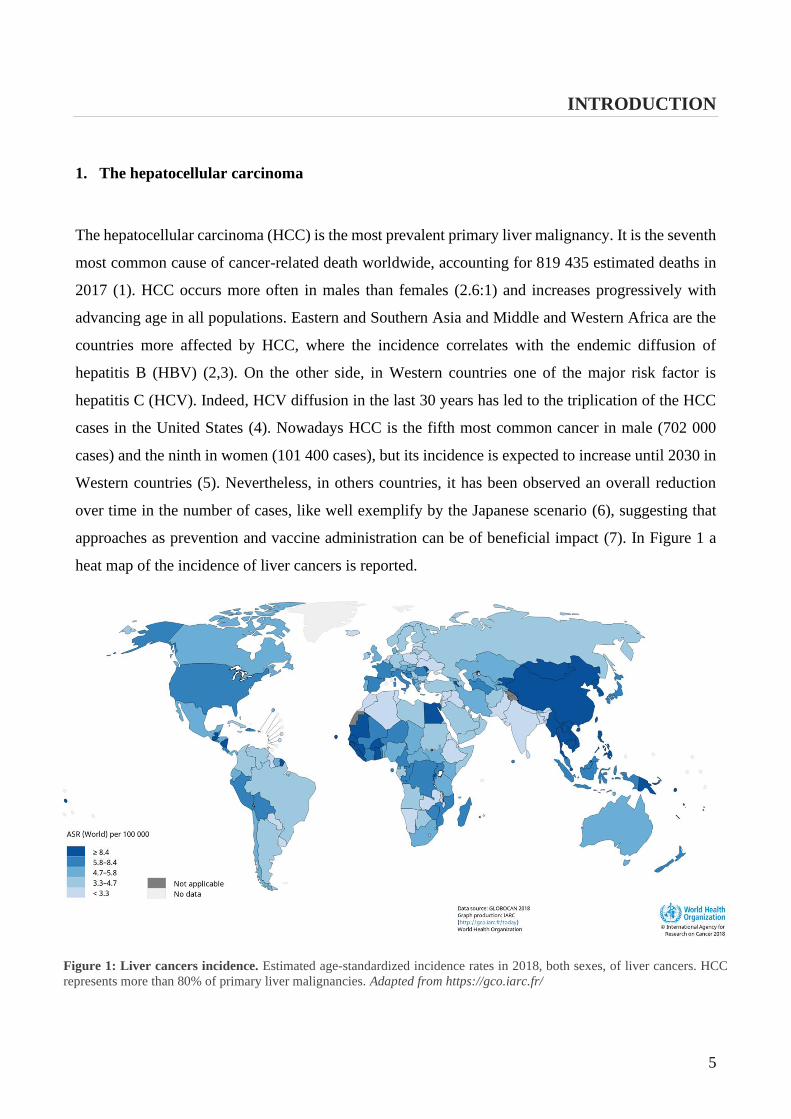
The hepatocellular carcinoma (HCC) is the most prevalent primary liver malignancy. It is the seventh
most common cause of cancer-related death worldwide, accounting for 819 435 estimated deaths in
2017 (1). HCC occurs more often in males than females (2.6:1) and increases progressively with
advancing age in all populations. Eastern and Southern Asia and Middle and Western Africa are the
countries more affected by HCC, where the incidence correlates with the endemic diffusion of
hepatitis B (HBV) (2,3). On the other side, in Western countries one of the major risk factor is
hepatitis C (HCV). Indeed, HCV diffusion in the last 30 years has led to the triplication of the HCC
cases in the United States (4). Nowadays HCC is the fifth most common cancer in male (702 000
cases) and the ninth in women (101 400 cases), but its incidence is expected to increase until 2030 in
Western countries (5). Nevertheless, in others countries, it has been observed an overall reduction
over time in the number of cases, like well exemplify by the Japanese scenario (6), suggesting that
approaches as prevention and vaccine administration can be of beneficial impact (7). In Figure 1 a
heat map of the incidence of liver cancers is reported.
Figure 1: Liver cancers incidence. Estimated age-standardized incidence rates in 2018, both sexes, of liver cancers. HCC
represents more than 80% of primary liver malignancies. Adapted from https://gco.iarc.fr/

6
1.1. Aetiology
1.1.1. Liver cirrhosis
The most established risk factors related to the development of HCC are chronic liver diseases and
cirrhosis which develop mainly from viral hepatitis infections and alcohol abuse (8–11).
Liver cirrhosis is the final stage of liver fibrosis, which initiates as the healing response to chronic
liver injuries. This pathology is not only a major risk factor for the evolution of the disease in HCC,
but it is also a limiting factor for anticancer therapies. Cirrhosis may limit surgical approaches,
influence the pharmacokinetic of anticancer drugs and increase their side effects (12). Not ultimately
it can result in a competitive risk for morbidity and mortality. An asymptomatic long-lasting period
of fibrosis (“compensated” phase) can suddenly be followed by the “decompensated” phase where
the cirrhosis is no more asymptomatic: the patient reveals signs of liver function impairment and
his/her prognosis get worst drastically, with a median survival of 2 years versus 12 years of the
“compensated” phase (13,14). When the “decompensated” phase is reached HCC can arise in any
moment.
1.1.2. Hepatitis B
Between the chronic hepatitis, hepatitis B is the most widespread in south-eastern countries of the
World. HBV is a double strand circular DNA virus (Figure 2).
Figure 2: Hepatitis B virus. Surrounded by a lipidic
envelope, the core of the HBV contains a dsDNA
molecule. The surface antigen HBsAg or the hepatitis B
core antibody anti-HBc can be used as marker for the
detection of the pathology. Modified from Gilman et al.
2019
7
It is transmitted via intravenous injections, blood transfusion and sexual contact. Its vertical
transmission from mother to fetus is the leading cause for HBV infection (15). Different genotypes
of the virus are associated with different risk of developing HCC, with the genotype C the one at
higher risk between the eight HBV genotypes known (A to H) and the most common in Asia (16).
The overall lifetime risk of developing HCC when diagnosed HBV positive is 10-25% and unless
other causes of chronic hepatitis, HBV is unique in that HCC can develop without evidence of
cirrhosis. HBV presence can be detected either thanks to the surface antigen HBsAg or the hepatitis
B core antibody anti-HBc, which is a haematological marker that can be observed even in HBsAg
negative patients (17).
Only recently the molecular mechanisms of HBV infection leading to HCC development have been
described (18,19). HBV contributes to HCC development either through HBV-DNA integration,
inducing genomic instability and direct insertional mutagenesis, and HBx protein expression, which
is fundamental on long term for the control of cellular transcription and proliferation program, but
also for epigenetics changes, such as the chromatin modulation at specific loci (20–22). Both the
genetic and epigenetic factors play a role in liver cirrhosis advancement and its progression to HCC.
1.1.3. Hepatitis C
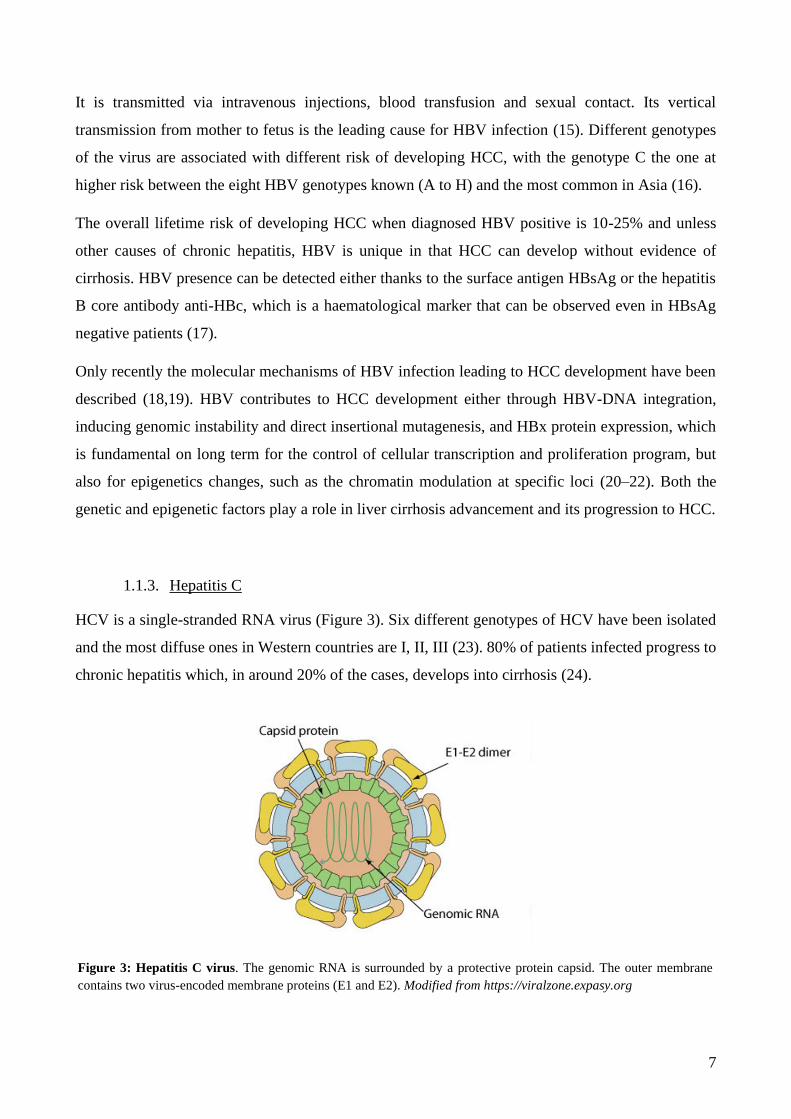
HCV is a single-stranded RNA virus (Figure 3). Six different genotypes of HCV have been isolated
and the most diffuse ones in Western countries are I, II, III (23). 80% of patients infected progress to
chronic hepatitis which, in around 20% of the cases, develops into cirrhosis (24).
Figure 3: Hepatitis C virus. The genomic RNA is surrounded by a protective protein capsid. The outer membrane
contains two virus-encoded membrane proteins (E1 and E2). Modified from https://viralzone.expasy.org
8
Several studies have reported the involvement of HCV in inducing chronic inflammation, oxidative
stress, hepatic steatosis and liver fibrosis during the hepatocarcinogenesis, but few is known about
the molecular mechanisms that transform healthy cells into neoplastic ones (25–28). The persistent
infection with replicating HCV initiates several liver alterations, creating an environment for the
development of the liver cancer. HCV related proteins, like the HCV core E1, E2, NS3 and NS5A
seem to modulate signal pathways, dysregulating the cell cycle and metabolism directly (29). On the
other side, the chronic infection acts indirectly on the genome integrity through the innate immune
system response stimulation (30,31). However, the exact mechanism is not fully understood and
requires deeper investigation.
1.1.4. Alcohol abuse
Alcohol abuse remains an important risk factor to be considered when investigating the development
of hepatocellular carcinoma. An alcohol intake higher than 80 g/day for more than 10 years is related
to an increased risk of HCC of approximately 5-fold (11). Especially in Western Countries, an
excessive alcohol consumption has become a predominant cause of liver diseases which eventually
lead to the carcinoma (32). In the United States alcohol abuse rate is higher than hepatitis C rate and
in Europe between 40-50% of HCC cases are related to alcohol abuse (33). Alcohol carcinogenic
effects are well known, and the substance is classified as Group 1 carcinogen by the International
Agency for Research on Cancer (34).
In combination with other risk factors, alcohol use worsen the patients prognosis: it doubles the risk
of HCC in chronic hepatitis C affected individual and it can trigger the HCC occurrence at an earlier
age (35). At molecular level, alcohol can induce oxidative stress, chromosomal loss and can alter
DNA methylation, but these mechanisms are still poorly understood (36–38).
1.1.5. Other diseases related to HCC development
A patient with previous liver diseases is at higher risk of HCC development. Within the pathologies
with highest incidence there are non-alcoholic fatty liver disease (NAFLD) and non-alcoholic
steatohepatitis (NASH). Both can arise from conditions such as obesity and diabetes type II and can
lead to fibrosis, cirrhosis and eventually HCC (39,40).
Diabetes mellitus affects the liver playing a direct role in glucose metabolism. Insulin has a
pleiotropic effect on the regulation of anti-inflammatory cascades and pathways that are involved in
cell proliferation. This role can be crucial to inhibit apoptosis and promote carcinogenesis (41,42).
9
Patients with diabetes have between 1.8 to 4-fold increased risk of HCC (43,44). Obesity increases
the risk of HCC on similar levels (1.5 to 4-fold) (45). HCC cases related to NAFLD/NASH are
probably underestimated, but it is thought that 60% of patients older than 50 years with diabetes or
obesity have NASH with advanced fibrosis (46). A significant proportion of patients with these
diseases do not have histological evidence of cirrhosis, nevertheless they can develop HCC (47).
1.1.6. The impact of oxidative stress
Inflammation-induced cancers as HCC are strongly linked to oxidative stress (48). Oxidative stress
is defined as an imbalance between production of reactive oxygen species (ROS) and their elimination
by protective mechanisms. In normal conditions, ROS can activate signalling cascades and being
involved in physiological process as proliferation, apoptosis and senescence (49,50). Antioxidants
enzymes as the superoxide dismutase (SOD) and the glutathione peroxidase control the ROS
generation, avoiding dangerous effects of an imbalance in ROS production. When the balance is
broken, we are in presence of oxidative stress and potentially of damage to all the main cellular
components. Oxidative stress, indeed, activates inflammatory pathways and promotes the formation
of promutagenic DNA adducts, creating genetic instability that can cause mutations, and eventually
promoting carcinogenesis (51). Oxidative stress has a controversial role in cancer progression with
studies on this topic trying to evaluate the microenvironment involvement on oxidative stress ability
to promote or suppress migration, invasion, and metastasis formation (52,53).
ROS generation has been studied in relation to HCC aetiology, observing, for example, how the
increased oxidative stress in obesity and diabetes may play a crucial role in hepatocarcinogenesis
(54–56). Interestingly, ROS production can be used also as biomarkers to predict HCC risk and
recurrence. Indeed, it is possible to detect compounds modified by oxidative stress in serum,
antioxidant enzymes activity, and oxidative stress indicators containing transcription factors and use
these indicators to define the patient prognosis (57).
10
1.2. Therapies
The major problem related to HCC therapies efficacy is the difficulty in identifying the disease at an
early stage. Indeed, in most of the cases patients are diagnosed at advanced stage, when curative
therapies are not feasible (58). This scenario improved in 2007, with the Food and Drug
Administration (FDA) approval of Sorafenib, an oral multi-kinase inhibitor targeting RAF kinase, as
well as vascular endothelial growth factor receptors (VEGFRs) and additional kinases (59). Even if
Sorafenib has improved the survival overall rate of HCC patients, the monotherapy has modest
clinical benefits and relative severe side effects that do not allow to overcome the challenging problem
in the treatment of advanced stage HCC patients (60). Surgical approaches as tumor resection or liver
transplantation remain the treatment of choice with a low rate of life-threatening complications, but
they depend on the clinical patient picture and they are not always a feasible choice (61). New
strategies are required for both the diagnosis and treatment of this disease.
1.1.1. Prevention
Prevention is the first lane of action for avoiding the onset of HCC in patient with chronic liver
diseases (primary prevention) and for reducing the probability of recurrence after a successful surgical
or non-surgical treatment (secondary prevention).
Primary prevention strategies include: to avoid alcohol consumption (62), to prevent infections with
HCV (63), and to administrate HBV vaccine to the population (64). HBV vaccine administration has
been extensively studied in countries as Taiwan, confirming the efficacy in preventing the occurrence
of HCC (65). Unfortunately, the high variability of HCV strains and their ability to rapidly mutate
have made difficult to develop an HCV vaccine, even if many strategies have been tested over the
years (66).
Other forms of primary prevention are related to the treatment of liver diseases which can develop in
severe pathologies and subsequently in a liver tumor. The aim in this case is to block the transition of
a liver disease into a chronic hepatitis or in case of a chronic hepatitis scenario to block its
development into cirrhosis (67).
Secondary prevention can significantly improve disease free time and patient survival (68). The
probability of recurrence after the HCC resection in a cirrhotic liver is about 50% within 3 years from
the surgical operation (69). It has been shown that administration of polyprenoic acid, interferon alpha
11
and beta have a beneficial impact on HCC patients whose tumor was resected (70,71). HBV patients
can also benefit from the use of antiviral treatment (72).
1.1.2. Liver transplantation
The only curative HCC therapy available is the orthotopic liver transplantation (73). Unfortunately,
organ shortage limits significantly this approach. Furthermore, this option is suggested only as a last
resource, when the clinical scenario of the patient does not allow to apply therapies like the surgical
resection of the tumoral mass (74).
Over the years different guidelines have been defined to evaluate the patient prognosis after a liver
transplantation (75,76). These guidelines can slightly differ one from another (77), but the Milan
criteria are generally universally accepted (78). Clinicians evaluate the tumor size and the number of
tumoral mass, regardless their biology, to define the survival rate. Milan criteria defined a 4-years
survival rate of 75% when tumours have a diameter smaller than 5 cm or where more lesions are
present, but they have a smaller than 3 cm diameter (79). In 2001, Milan criteria has been extended
by the University of California San Francisco, including the analysis of bigger single lesions or of
three lesions were the total size diameter was smaller than 8 cm (80). Their results confirmed a
survival rate comparable to the one seen in studies based on the Milan criteria (81).
In order to meet transplantation criteria, locoregional therapies aimed to downsize the tumor have
been analysed with promising survival rate results (82).
1.1.3. Surgical resection
When the patient does not present liver cirrhosis, HCC resection is the treatment of choice. Life-
threating complication have a low rate and this approach could be particularly effective in Sub-Sahara
Africa and Asia, where 40% of the cases of HCC arise in a cirrhosis-free liver (83,84). The
reimagining 60% of patients living in these areas and the 95% of patients in Western countries have
cirrhosis. The surgical resection is still possible and advisable, but a stricter selection is required to
avoid complications or tumor recurrence (85). Independent risk factors as bilirubin and albumin
concentration are taken into consideration to acknowledge the postoperative liver failure (86). When
it exists a normal liver function, there is no relevant portal hypertension, and only a tumor mass is
identified, the 5-yers survival rate of 70% can be achieved (87). The major clinical problem is the
70% rate of recurrence after 5 years from the operation (87). Therefore, as said before, secondary
HCC prevention is fundamental.
12
1.1.4. Locoregional therapies
Transarterial chemoembolization (TACE), radiofrequency ablation (RFA), and percutaneous ethanol
injection (PEI) are some of the locoregional therapies that can be applied when surgery is not possible.
Data on their effectiveness come mostly from retrospective, not randomized studies (88,89).
Nevertheless, Z. XU et al. in a 2019 review (90), showed how the combination of two approaches
(like TACE and RFA) can be very effective and promising in the treatment of large HCC lesions.
Percutaneous intervention is the best option for small unresectable HCC. Tumor ablation can be
achieved chemically by percutaneous ethanol injection (PEI) or thermally by radiofrequency thermal
ablation (RFTA). Microwave heat-induced thermotherapy (HiTT), laser-induced thermotherapy
(LiTT), and cryoablation are also available.
PEI is the most widely used technique (91,92). It is safe, easy to perform, inexpensive and can achieve
complete tumor response rate in HCCs smaller than 2 cm in diameter. PEI is the procedure of choice
for patients with a single HCC lesion smaller than 5 cm in diameter or with up to three lesions smaller
than 3 cm in diameter.
Radiofrequency thermal ablation RFTA is an alternative to PEI (93). The efficacy of RFTA is like
that of PEI but requires generally only a single session. RFTA offers a better local tumor control and
can allow the ablation of tumours larger than 5 cm in diameter.
Transarterial embolization and chemoembolization are the most widely used treatments for HCCs
which are unresectable or cannot be effectively treated with percutaneous interventions (94).
Embolization agents may be administered alone or after selective intra-arterial chemotherapy
(generally doxorubicin, mitomycin or cisplatin) or in combination with lipiodol
(chemoembolization). Transarterial embolization or chemoembolization results in partial responses
in 15-55% of patients, delays tumor progression and vascular invasion, and prolongs the survival time
compared to conservative management (95).
When a patient exceeds the transplant criteria, a possible alternative to meet the parameters required
is to reduce the tumor burden using locoregional therapies (96). Post-transplant survival data are
comparable in patients who underwent downsizing with those within the conventional criteria (97).
1.1.5. Systemic therapies
Systemic therapies are relatively new in the treatment of HCC. Till twelve years ago, no effective
drugs targeting liver tumours were available. In July 2008 a first paper was published about an oral
13
multitargeted tyrosine kinase inhibitor, called Sorafenib (59). Since then Sorafenib has become the
new standard of treatment for advanced HCC. Sorafenib blocks the activity of Raf serine/threonine
kinase isoforms, as well as the tyrosine kinases vascular endothelial growth factor receptor 2 and 3,
platelet-derived growth factors receptor β, c-KIT, FLT-3, and RET, to inhibit tumor angiogenesis and
tumor cell proliferation (98).
Nowadays, Sorafenib is recommended for patients with intact liver function, who are not candidates
for either surgical resection or liver transplantation and have failed to respond to locoregional
therapies.
Even though a therapy with Sorafenib has incremented the survival expectancy from 7 to 10 months,
its side effects are still strong (60). These include among the others nausea, weight loss, esthesia, and
hypertension and can lead to prescribe a dose reduction or to the treatment interruption.
14
2. Mitochondria
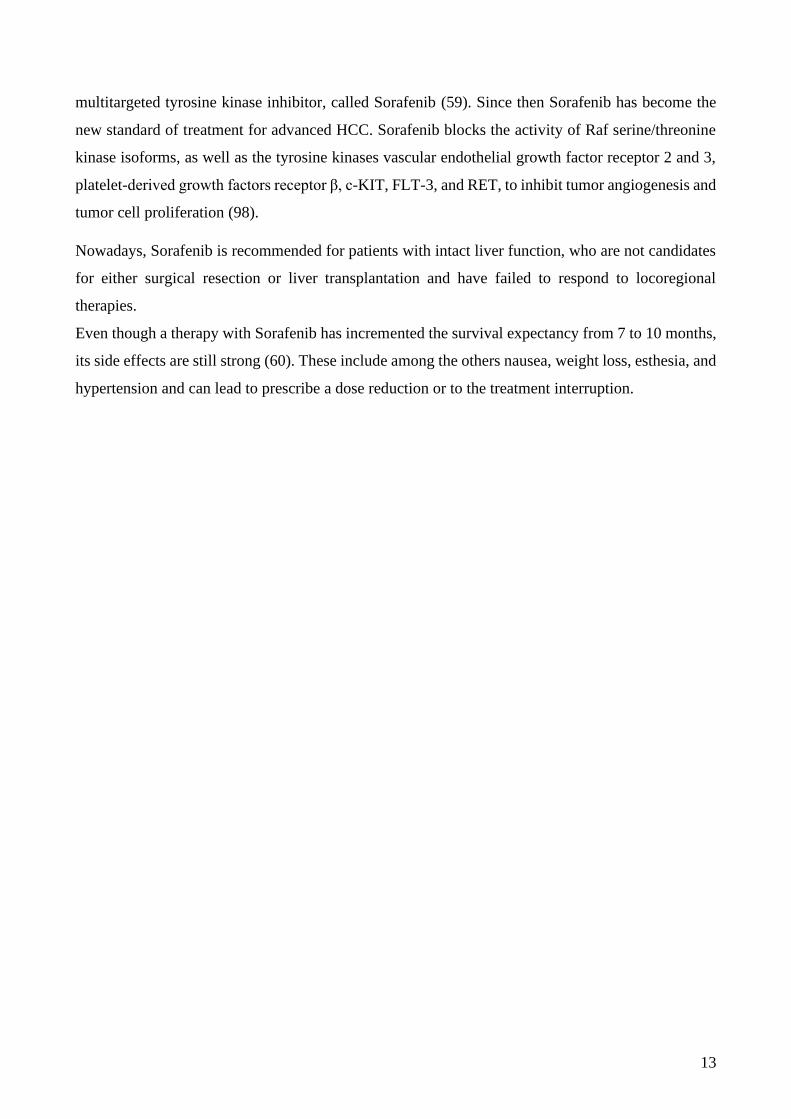
Structure and function of mitochondria have been investigated deeply over the years. Mitochondria
are organelles present in almost all the eukaryotic cells. They have two subcompartments: the
intermembrane space, delimited by the outer and the inner membrane, and the matrix (Figure 4) (99).
Figure 4: Structure of the mitochondrion. Proteins from the cytosol enter inside mitochondria passing through the outer
membrane and reaching the inter membrane space (IMS). Once in this compartment, they can be stored here or proceed
to the matrix, through the inner membrane. Energy production takes place at the level of the cristae of the inner membrane.
https://en.wikipedia.org/wiki/Mitochondrion
The inner membrane due to the presence of cristae, provide a large amount of surface area for
chemical reaction to occur on it. In fact, it is the physical location of the complexes of the oxidative
phosphorylation metabolic pathway (OXPHOS) (100). OXPHOS is the mechanism through which
mitochondria are able to convert oxidised nutrients into energy, stored in the form of adenosine
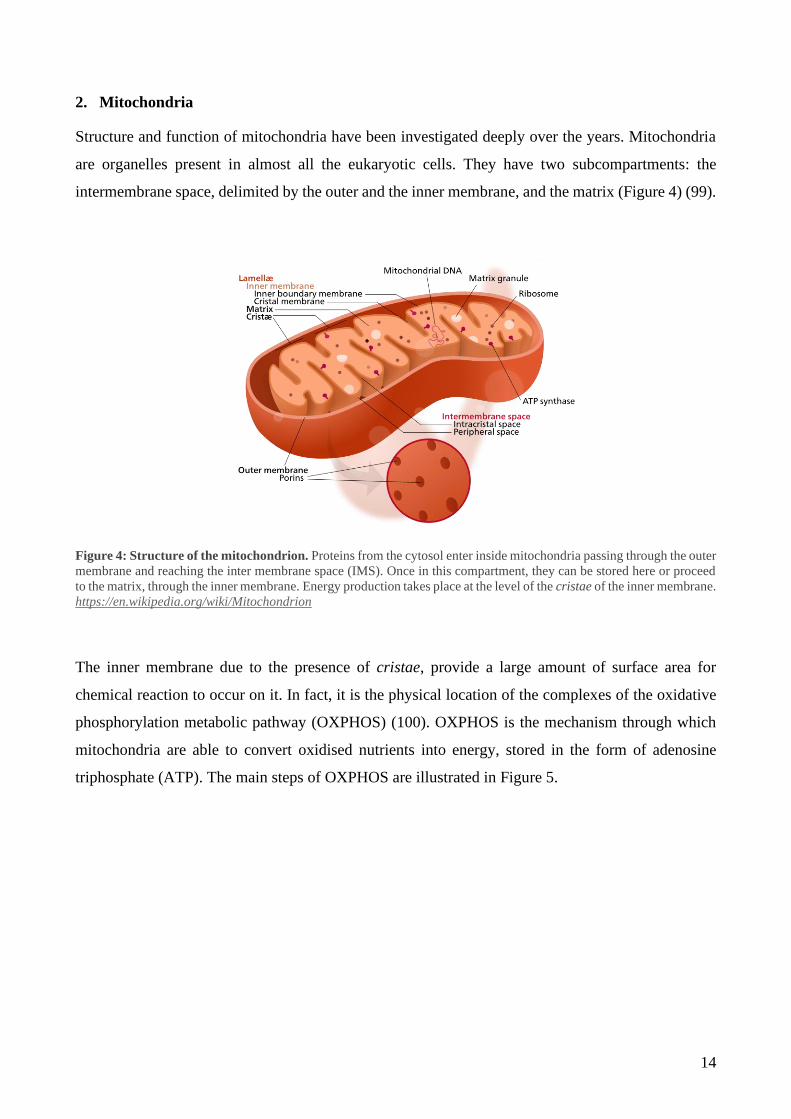
triphosphate (ATP). The main steps of OXPHOS are illustrated in Figure 5.
15
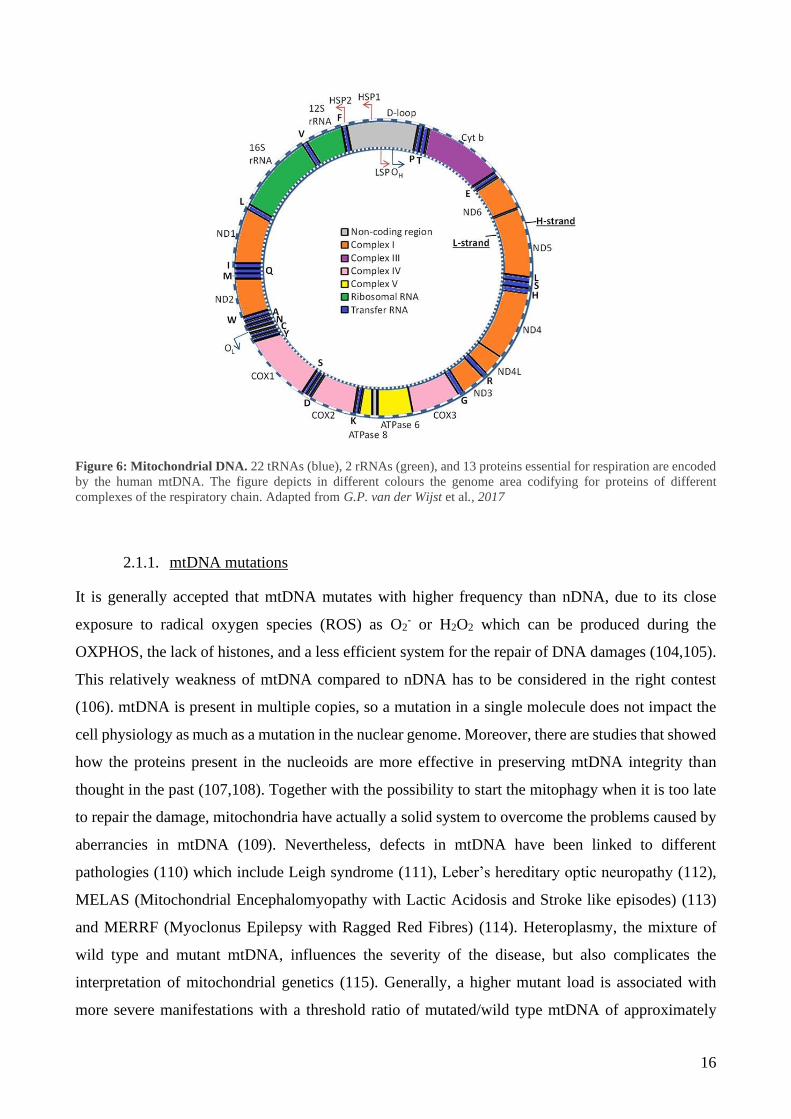
Figure 5: Oxidative Phosphorylation System (OXPHOS). The electrons transport through mitochondrial complexes is
coupled to shipment of protons in the intermembrane space to create an electrochemical gradient which can be used by
Complex V for the ATP synthesis. Electrons derived from cellular metabolism reach complex I or complex II through
NADH or FADH2, respectively. These electrons are then transferred to coenzyme Q (ubiquinone), a carrier of electrons
from complex I or II, to III. In complex III, particles are shifted form cytochrome b to cytochrome c with a consequent
transfer to Complex IV where they reduce O2. Finally, thanks to the H+ gradient created during the process, ATP synthase
can produce ATP from ADP. Adapted from Granata et al., 2015.
2.1. Mitochondrial DNA
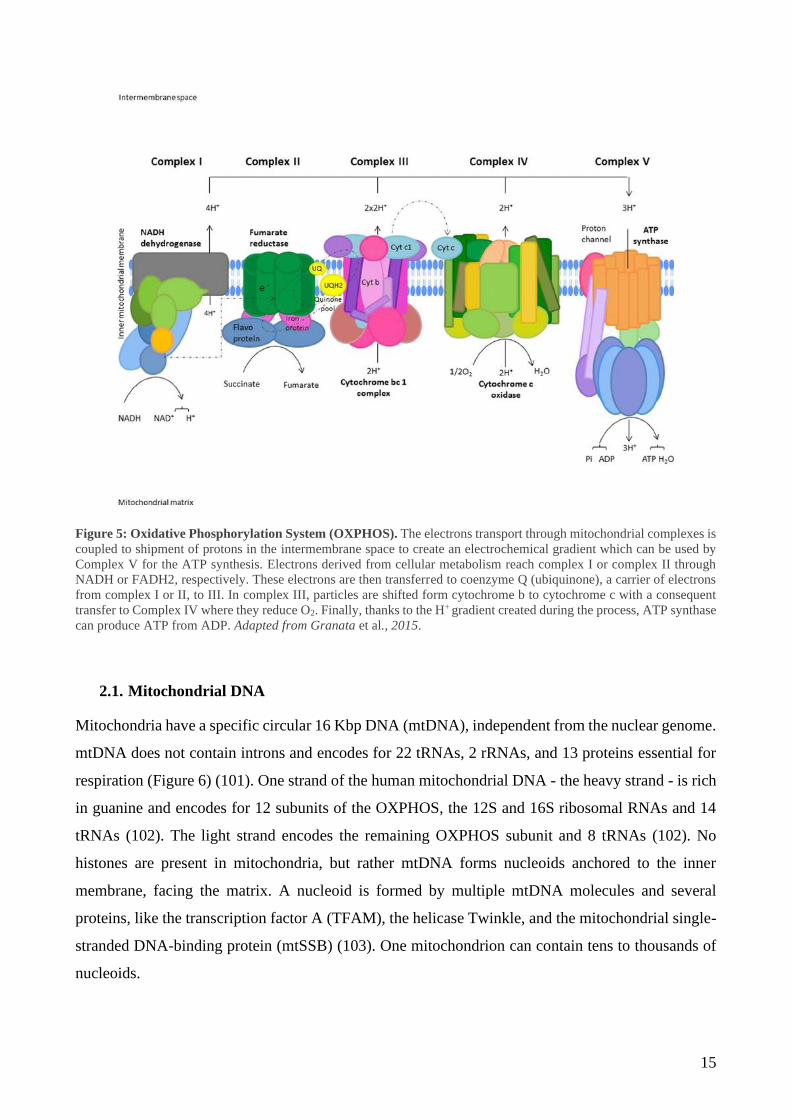
Mitochondria have a specific circular 16 Kbp DNA (mtDNA), independent from the nuclear genome.
mtDNA does not contain introns and encodes for 22 tRNAs, 2 rRNAs, and 13 proteins essential for
respiration (Figure 6) (101). One strand of the human mitochondrial DNA - the heavy strand - is rich
in guanine and encodes for 12 subunits of the OXPHOS, the 12S and 16S ribosomal RNAs and 14
tRNAs (102). The light strand encodes the remaining OXPHOS subunit and 8 tRNAs (102). No
histones are present in mitochondria, but rather mtDNA forms nucleoids anchored to the inner
membrane, facing the matrix. A nucleoid is formed by multiple mtDNA molecules and several
proteins, like the transcription factor A (TFAM), the helicase Twinkle, and the mitochondrial single-
stranded DNA-binding protein (mtSSB) (103). One mitochondrion can contain tens to thousands of
nucleoids.
16
Figure 6: Mitochondrial DNA. 22 tRNAs (blue), 2 rRNAs (green), and 13 proteins essential for respiration are encoded
by the human mtDNA. The figure depicts in different colours the genome area codifying for proteins of different
complexes of the respiratory chain. Adapted from G.P. van der Wijst et al., 2017
2.1.1. mtDNA mutations
It is generally accepted that mtDNA mutates with higher frequency than nDNA, due to its close
exposure to radical oxygen species (ROS) as O2- or H2O2 which can be produced during the
OXPHOS, the lack of histones, and a less efficient system for the repair of DNA damages (104,105).
This relatively weakness of mtDNA compared to nDNA has to be considered in the right contest
(106). mtDNA is present in multiple copies, so a mutation in a single molecule does not impact the
cell physiology as much as a mutation in the nuclear genome. Moreover, there are studies that showed
how the proteins present in the nucleoids are more effective in preserving mtDNA integrity than
thought in the past (107,108). Together with the possibility to start the mitophagy when it is too late
to repair the damage, mitochondria have actually a solid system to overcome the problems caused by
aberrancies in mtDNA (109). Nevertheless, defects in mtDNA have been linked to different
pathologies (110) which include Leigh syndrome (111), Leber’s hereditary optic neuropathy (112),
MELAS (Mitochondrial Encephalomyopathy with Lactic Acidosis and Stroke like episodes) (113)
and MERRF (Myoclonus Epilepsy with Ragged Red Fibres) (114). Heteroplasmy, the mixture of
wild type and mutant mtDNA, influences the severity of the disease, but also complicates the
interpretation of mitochondrial genetics (115). Generally, a higher mutant load is associated with
more severe manifestations with a threshold ratio of mutated/wild type mtDNA of approximately
17
70% before disease symptoms become evident, depending on the mutation and the type of tissue
(116,117).
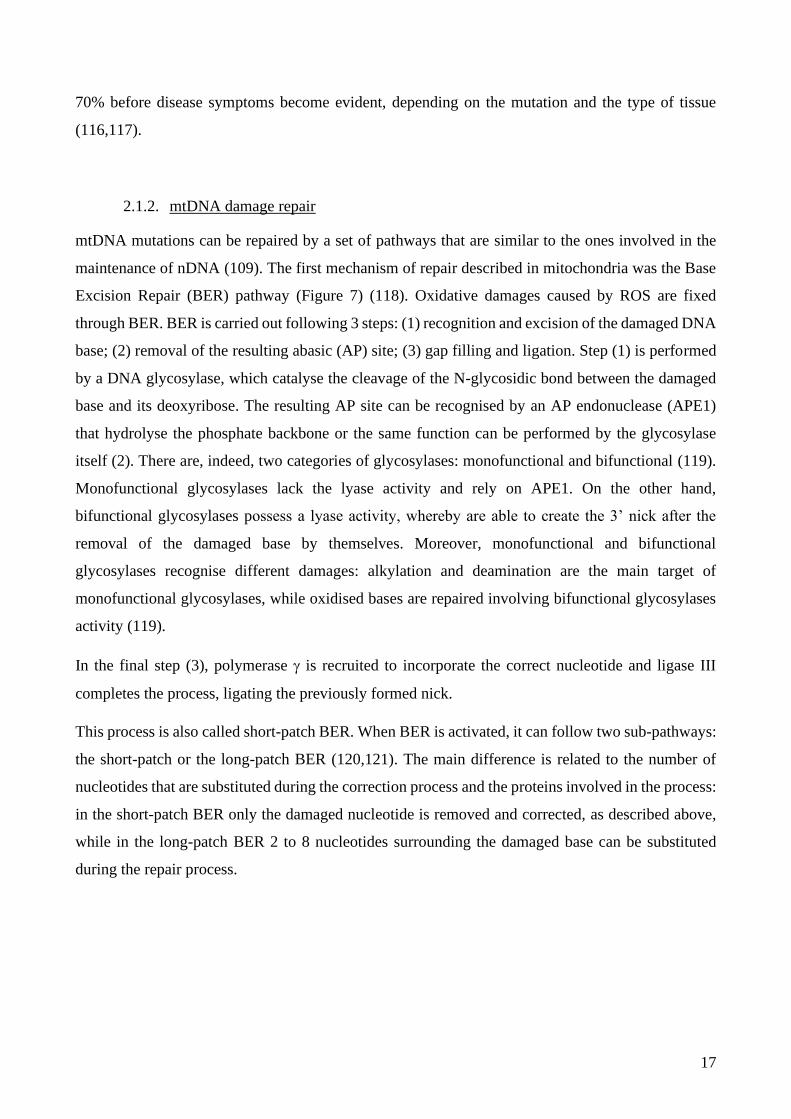
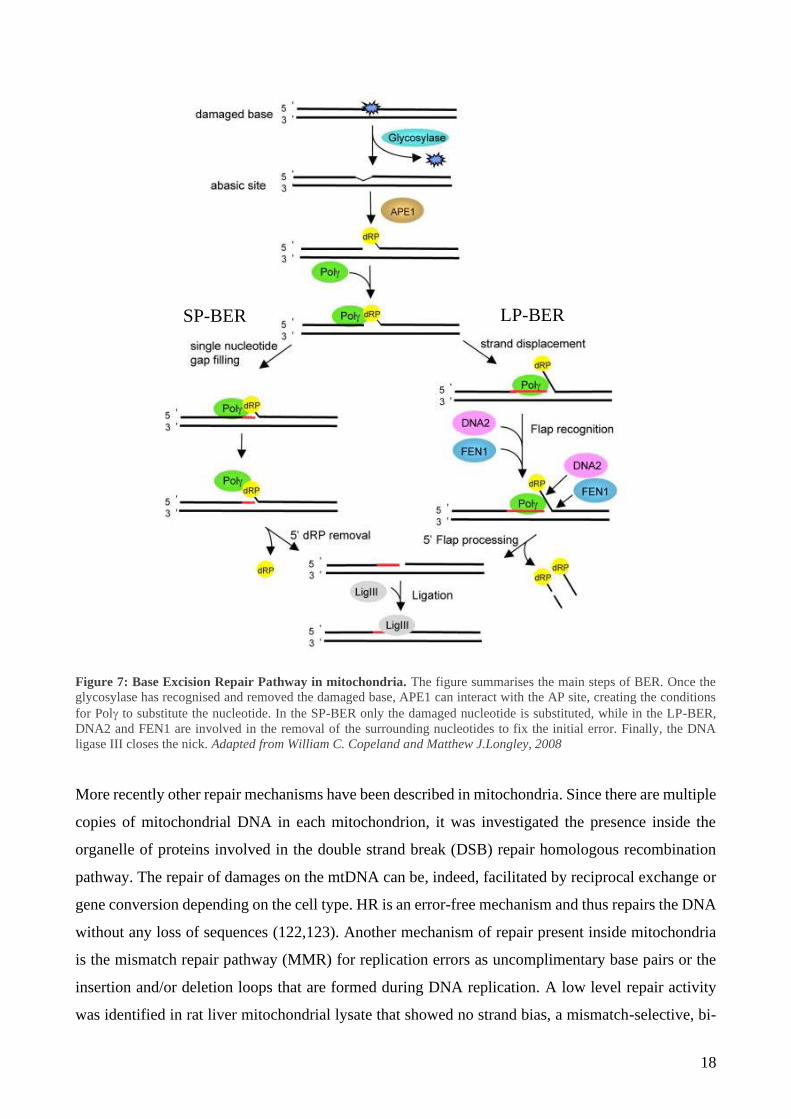
2.1.2. mtDNA damage repair
mtDNA mutations can be repaired by a set of pathways that are similar to the ones involved in the
maintenance of nDNA (109). The first mechanism of repair described in mitochondria was the Base
Excision Repair (BER) pathway (Figure 7) (118). Oxidative damages caused by ROS are fixed
through BER. BER is carried out following 3 steps: (1) recognition and excision of the damaged DNA
base; (2) removal of the resulting abasic (AP) site; (3) gap filling and ligation. Step (1) is performed
by a DNA glycosylase, which catalyse the cleavage of the N-glycosidic bond between the damaged
base and its deoxyribose. The resulting AP site can be recognised by an AP endonuclease (APE1)
that hydrolyse the phosphate backbone or the same function can be performed by the glycosylase
itself (2). There are, indeed, two categories of glycosylases: monofunctional and bifunctional (119).
Monofunctional glycosylases lack the lyase activity and rely on APE1. On the other hand,
bifunctional glycosylases possess a lyase activity, whereby are able to create the 3’ nick after the
removal of the damaged base by themselves. Moreover, monofunctional and bifunctional
glycosylases recognise different damages: alkylation and deamination are the main target of
monofunctional glycosylases, while oxidised bases are repaired involving bifunctional glycosylases
activity (119).
In the final step (3), polymerase is recruited to incorporate the correct nucleotide and ligase III
completes the process, ligating the previously formed nick.
This process is also called short-patch BER. When BER is activated, it can follow two sub-pathways:
the short-patch or the long-patch BER (120,121). The main difference is related to the number of
nucleotides that are substituted during the correction process and the proteins involved in the process:
in the short-patch BER only the damaged nucleotide is removed and corrected, as described above,
while in the long-patch BER 2 to 8 nucleotides surrounding the damaged base can be substituted
during the repair process.
18
Figure 7: Base Excision Repair Pathway in mitochondria. The figure summarises the main steps of BER. Once the
glycosylase has recognised and removed the damaged base, APE1 can interact with the AP site, creating the conditions
for Pol to substitute the nucleotide. In the SP-BER only the damaged nucleotide is substituted, while in the LP-BER,
DNA2 and FEN1 are involved in the removal of the surrounding nucleotides to fix the initial error. Finally, the DNA
ligase III closes the nick. Adapted from William C. Copeland and Matthew J.Longley, 2008
More recently other repair mechanisms have been described in mitochondria. Since there are multiple
copies of mitochondrial DNA in each mitochondrion, it was investigated the presence inside the
organelle of proteins involved in the double strand break (DSB) repair homologous recombination
pathway. The repair of damages on the mtDNA can be, indeed, facilitated by reciprocal exchange or
gene conversion depending on the cell type. HR is an error-free mechanism and thus repairs the DNA
without any loss of sequences (122,123). Another mechanism of repair present inside mitochondria
is the mismatch repair pathway (MMR) for replication errors as uncomplimentary base pairs or the
insertion and/or deletion loops that are formed during DNA replication. A low level repair activity
was identified in rat liver mitochondrial lysate that showed no strand bias, a mismatch-selective, bi-
SP-BER LP-BER
19
directional, ATP-dependent and EDTA-sensitive activity (124). Interestingly, the key player of
MMR, MSH2 was not identified in the mitochondrial extract, opening the way for further
investigation about the protein involved in the mtDNA mismatch repair. Particularly, in 2010, the
protein Mlh1 of MutL family was confirmed to cut the mismatch in mitochondria, being associated
with mtDNA polymerase (125).
2.1.3. Role of mtDNA in cancer
Starting from their discovery in the 1890s (126), mitochondria took a central role in the investigation
of tumour development. The relationship between mtDNA and cancer has risen debates and
contradictory results. Publications referring to the same type of tumor support both the link between
decreased mtDNA copy number and cancer, as well as increased copy number and tumor
development. An example of this uncertain association is the case of the renal cancer (127–129).
What it is nowadays clear is how mutations do not inactivate mitochondrial energy, but rather affect
mitochondria bioenergetic and biosynthetic state (130). Indeed, through the modulation of the
mitochondrial retrograde signalling, tumoral cells are able to reprogram stromal cells adjacent to the
tumour itself to optimize the cancer environment and promote its growth (131,132). Both somatic
and germline mutations have been related to different cancers (133–135). More than 50% of mtDNA
mutations involved in carcinogenesis are located in the 22 mitochondrial tRNA genes (136).
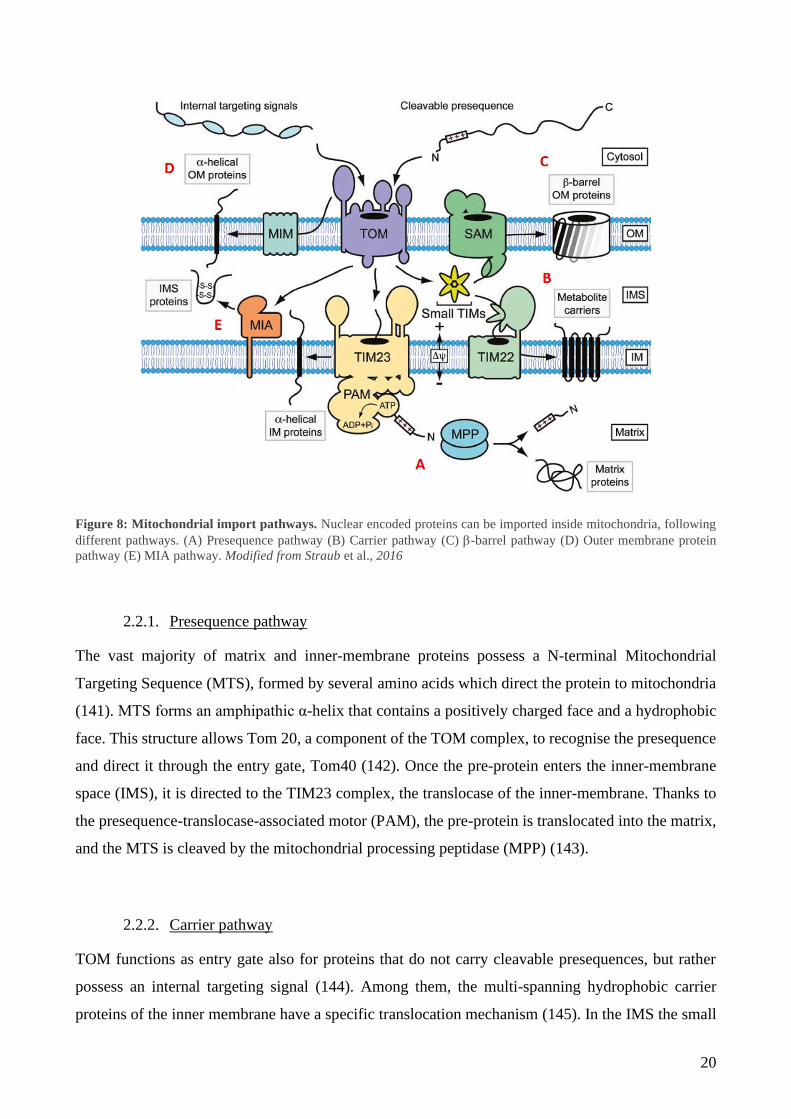
2.2. Mitochondrial protein import
The greatest part of proteins present inside mitochondria is nuclear encoded. mtDNA translates only
for some subunits of the OXPHOS, which represent around 1% of the whole mitochondria proteome.
The remaining 99% needs to be imported from the cytosol inside mitochondria. Five pathways have
been characterised, depending on the targeting signal of the imported protein (Figure 8) (137).
Nevertheless, recent studies revealed an even higher complexity of mitochondrial protein sorting.
Novel import routes have been studied, which combine elements of different import pathways
(138,139). Moreover, for several precursor proteins, a clear pathway has not been identified yet,
leading to the possibility for the identification of other protein import and assembly machineries in
the future (140).
20
Figure 8: Mitochondrial import pathways. Nuclear encoded proteins can be imported inside mitochondria, following
different pathways. (A) Presequence pathway (B) Carrier pathway (C) -barrel pathway (D) Outer membrane protein
pathway (E) MIA pathway. Modified from Straub et al., 2016
2.2.1. Presequence pathway
The vast majority of matrix and inner-membrane proteins possess a N-terminal Mitochondrial
Targeting Sequence (MTS), formed by several amino acids which direct the protein to mitochondria
(141). MTS forms an amphipathic α-helix that contains a positively charged face and a hydrophobic
face. This structure allows Tom 20, a component of the TOM complex, to recognise the presequence
and direct it through the entry gate, Tom40 (142). Once the pre-protein enters the inner-membrane
space (IMS), it is directed to the TIM23 complex, the translocase of the inner-membrane. Thanks to
the presequence-translocase-associated motor (PAM), the pre-protein is translocated into the matrix,
and the MTS is cleaved by the mitochondrial processing peptidase (MPP) (143).
2.2.2. Carrier pathway
TOM functions as entry gate also for proteins that do not carry cleavable presequences, but rather
possess an internal targeting signal (144). Among them, the multi-spanning hydrophobic carrier
proteins of the inner membrane have a specific translocation mechanism (145). In the IMS the small
21
TIM chaperones Tim9 and Tim10 recognise the internal targeting elements distributed over the
primary structure of these proteins and help the translocation to TIM22, which is the responsible for
the proteins’ integration in the inner membrane. This last step has not been clarified for any of the
substrates of the TIM22 complex (146). Future studies are needed to understand how multiple
transmembrane segments are translocated by TIM22 and laterally released into the inner membrane.
2.2.3. -barrel pathway
-barrel proteins possess a β-hairpin element at the C-terminus, which contains two adjacent β-strands
and a connecting loop, as mitochondrial targeting signal. -barrel proteins translocate through the
TOM complex channel and are then recognised by the TIM chaperons, which direct them to the outer
membrane (147,148). Here they are inserted into the outer membrane by the sorting assembly
machinery (SAM).
2.2.4. Outer membrane proteins pathway
A plethora of outer membrane proteins with an -helical transmembrane segment are imported
through the mitochondrial import complex (MIM). N-terminal signal-anchor sequence proteins as
well as multispanning outer-membrane proteins are imported by the MIM, but the exact mechanism
is still poorly understood (149).
2.2.5. MIA pathway
IMS proteins are recognised by a specific machinery called the mitochondrial import and assembly
(MIA) pathway (Figure 9) (150). The key player of the pathway is the oxidoreductase Mia40, which
can interact with specific cysteines located on the imported protein. Motifs CX3C and CX9C are
characteristic of numerous intermembrane space proteins (151). The oxidative protein folding
machinery of the IMS catalyse the formation of disulphide bonds, which promote the conformational
stabilization and assembly of the imported protein. Mia40 can recognise immediately proteins
emerging form the intermembrane surface of the channel Tom40, thanks to a hydrophobic binding
pocket that interacts with the MTS of the imported protein (152). To this transient interaction, it
follows the creation of an intermolecular disulphide bond between Mia40 cysteine and the cysteine
on the substrate. During the formation of this transient disulphide bond electrons are transferred from

22
the oxidized substrate to the sulfhydryl oxidase ALR (augmenter of liver regeneration) via Mia40 and
then to cytochrome c or molecular oxygen (153).
Mia40 promotes both the folding and the translocation of precursor proteins across the outer
membrane and it also contributes to the biogenesis and quality control of inner-membrane and matrix
proteins (154). Indeed, recent studies have underlined the importance of the MIA pathway in the
assembly and translocation of a wider spectrum of substrates than expected (155–157). The small
TIM chaperons are the classical substrate for Mia40, but also integration of the subunit Tim17 and
Tim22 of the TIM complex in the inner membrane is promoted by the MIA pathway (155). Other
proteins as Mrp10 are translocated following the presequence pathway. Nevertheless, Mrp10 contains
a proline-rich N-terminal matrix-targeting signal which is recognised by Mia40 (157). Once oxidized,
Mrp10 is stabilized, preventing its degradation and it is translocated to the TIM23 complex into the
matrix in a loop formation, instead of in a linear chain, underling the fundamental role of the MIA
pathway for the biogenesis of this matrix protein.
Recently, the translocation of uncanonical substrates has also been described. Proteins as p53 and
APE1 are interacting with Mia40 when translocated inside mitochondria (158,159).
Finally, the MIA pathway has a role in the retro-translocation of several small intermembrane space
proteins with impaired folding (160). Once in the cytosol these proteins can be degraded by the
proteasome, suggesting that the cytosolic quality control can contribute to the removal of folding-
defective intermembrane space proteins.
Figure 9: MIA pathway in mammal cells.
A representation of the MIA pathway and its key elements
is reported in this picture. The imported protein is
translocated through the TOM complex. A hydrophobic
pocket on Mia40 allows a first transient interaction, which
is immediately followed by the intermolecular disulphide
bond formation between the active cysteine on Mia40 and
the cysteine of the motif CX3C or CX9C on the substrate.
Electrons are transferred from Mia40 to ALR and finally
delivered to CytC or directly to O2. Modified from Amelia
Mordas, Kostas Tokatlidis, 2015.
23
3. APE1/Ref-1
3.1. Structure and function
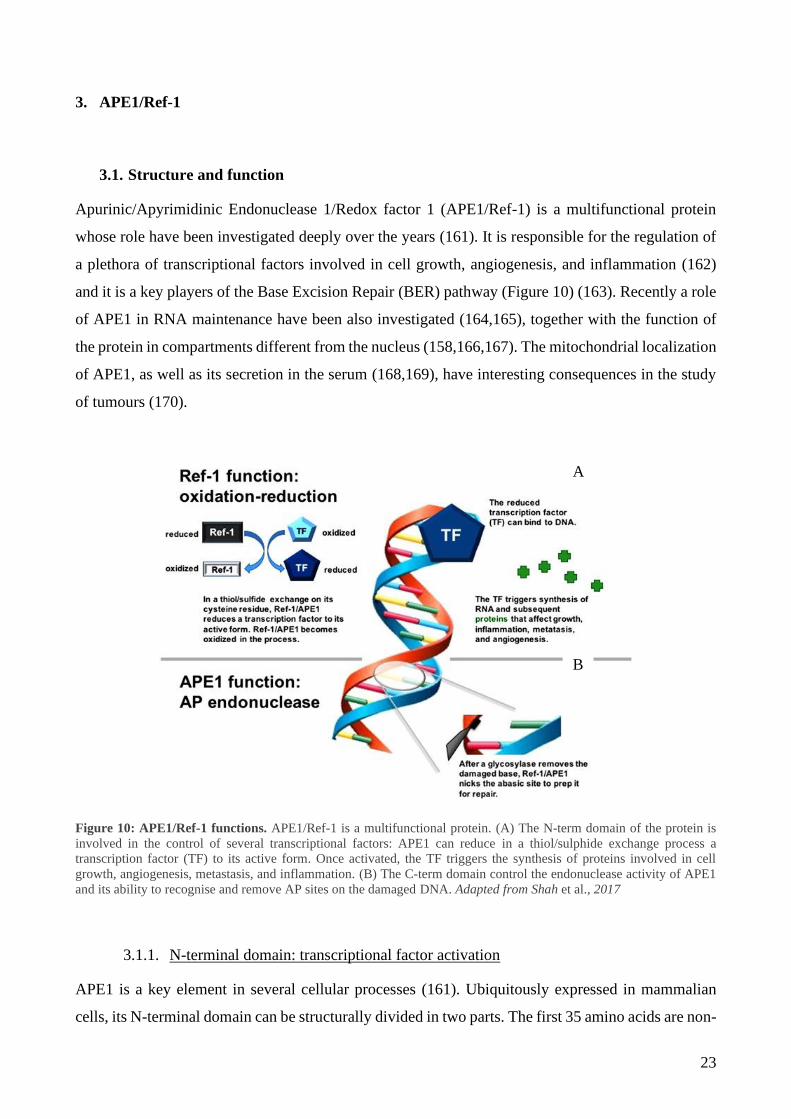
Apurinic/Apyrimidinic Endonuclease 1/Redox factor 1 (APE1/Ref-1) is a multifunctional protein
whose role have been investigated deeply over the years (161). It is responsible for the regulation of
a plethora of transcriptional factors involved in cell growth, angiogenesis, and inflammation (162)
and it is a key players of the Base Excision Repair (BER) pathway (Figure 10) (163). Recently a role
of APE1 in RNA maintenance have been also investigated (164,165), together with the function of
the protein in compartments different from the nucleus (158,166,167). The mitochondrial localization
of APE1, as well as its secretion in the serum (168,169), have interesting consequences in the study
of tumours (170).
Figure 10: APE1/Ref-1 functions. APE1/Ref-1 is a multifunctional protein. (A) The N-term domain of the protein is
involved in the control of several transcriptional factors: APE1 can reduce in a thiol/sulphide exchange process a
transcription factor (TF) to its active form. Once activated, the TF triggers the synthesis of proteins involved in cell
growth, angiogenesis, metastasis, and inflammation. (B) The C-term domain control the endonuclease activity of APE1
and its ability to recognise and remove AP sites on the damaged DNA. Adapted from Shah et al., 2017
3.1.1. N-terminal domain: transcriptional factor activation
APE1 is a key element in several cellular processes (161). Ubiquitously expressed in mammalian
cells, its N-terminal domain can be structurally divided in two parts. The first 35 amino acids are non-
A
B
24
conserved, completely unstructured and highly disordered, a peculiarity that gives APE1 an important
advantage in damage sensing and protein-protein interaction (171). Indeed, the positively charged
amino acids present in this region confer to APE1 the ability to scan the DNA for DNA damages.
Moreover, amino acids 27, 31, 32, 35 are fundamental for the interaction with Nucleophosmin
(NPM1), a nucleolar protein involved in DNA repair and RNA degradation (172). These amino acids
can undergo post-transcriptional modification and influence APE1 activity. In fact, when they are
acetylated, there is a reduction of the affinity binding for NPM1 with a consequent re-localization of
APE1 from the nucleoli to the nucleoplasm, where it can repair the damaged DNA (173). This area
is also the location of the bipartite nuclear localization sequence (NLS), which directs the protein
within the nucleus. The remaining part of the N-terminal domain is a globular structure, involved in
the redox-dependent transcription activity, which acts on several cancer-related transcriptional factors
(174). APE1 is a well-known activator of Fos and Jun subunits of the Activator Protein 1 (AP-1)
(175), p53 (176,177), HIF- (), NF-kB (179) and other transcriptional factors responsible for
several processes as apoptosis, angiogenesis, cell cycle regulation and differentiation (180,181).
Cys65, Cys93, and Cys99 are implicated in the redox activity. Interestingly, structural studies of
Cys65 demonstrated that its localization is in a hydrophobic pocket of the core structure, which would
make the residue inaccessible for the interaction with the target cysteine (182). In a model proposed
by Su et al. APE1 is reported to be able “open” the globular structure to expose the cysteine residue
to the solvent, in a conformational change which will allow to have a binding site accommodating for
different transcriptional factors (183).
3.1.2. C-terminal domain: DNA repair activity
The C-terminal domain of APE1 is critical for its role in the DNA repair. APE1 is, as said before
(Chapter 2.1.2 Mitochondrial DNA: mtDNA damage repair), a crucial component of the BER
pathway. The catalytic domain of the protein possesses one active site with a positively charged semi-
rigid structure, which interacts with high affinity to the abasic DNA. Met270 in the minor groove and
Arg177 in the major groove are essential for the domain structure (184). They create a twist of the
helix that helps to retain the product after the protein cut. His309 and Asp283 are also important for
the correct conformation of the active site. Interestingly, a substitution of the residue His309 with an
asparagine causes the loss of the whole catalytic activity, nevertheless this mutated form of APE1 is
still able to bind the DNA, resulting in a dominant-negative form of the protein (185).
Crucial for the binding to the abasic site is the residue Asn212: a mutation completely abort APE1
ability to bind the substrate (186). Finally, it is worth to mention residues Asp70, Asp283 and Asp308
25
for their involvement in the DNA/protein interaction, and Glu96, Tyr171, Asp210 for their role on
the catalysis of the reaction. Glu96, particularly, participates in the stability of the magnesium ions
(Mg2+) which are decisive cofactors to perform APE1 endonuclease activity (187).
3.2. APE1 intracellular trafficking and localization
The dual localization of APE1 is functional to the role of the protein. Both nuclear and mitochondrial
DNA require this key player of the BER pathway, consequently, unveil the molecular mechanisms
involved in the translocation of APE1 within different compartments is of utmost relevance. Stimuli
as oxidative stress or calcium levels have been observed to stimulate the translocation of APE1 from
the nucleus to the cytosol (Figure 11) (188). Moreover, despite the NLS, studies indicate that in some
cell types with an elevated metabolic and proliferative rate, APE1 accumulates within mitochondria
and the endoplasmic reticulum (189,190). The molecular mechanisms able to explain this redirection
of APE1 are still under debate. Initially, it was hypothesized that a truncated form of APE1, lacking
its NLS, was at the base of the mitochondrial localization of the protein (191). However, new studies
demonstrated that many cellular types possess a full-length APE1 within mitochondria. Any classical
Nuclear Export Sequence (NES) has been identified so far, but recently two complementary
explanations have been proposed to clarify the cytoplasmic translocation of APE1. Firstly, a non-
canonical MTS sequence has been identified (192), and secondly a post-transcriptional modification
of the Cys93 and Cys310 has been demonstrated to redirect APE1 outside the nucleus in a CRM1-
dependent manner (193).
All together these data depict a very dynamic network involved in the subcellular distribution of
APE1 that need a deeper investigation to be fully understand.
26
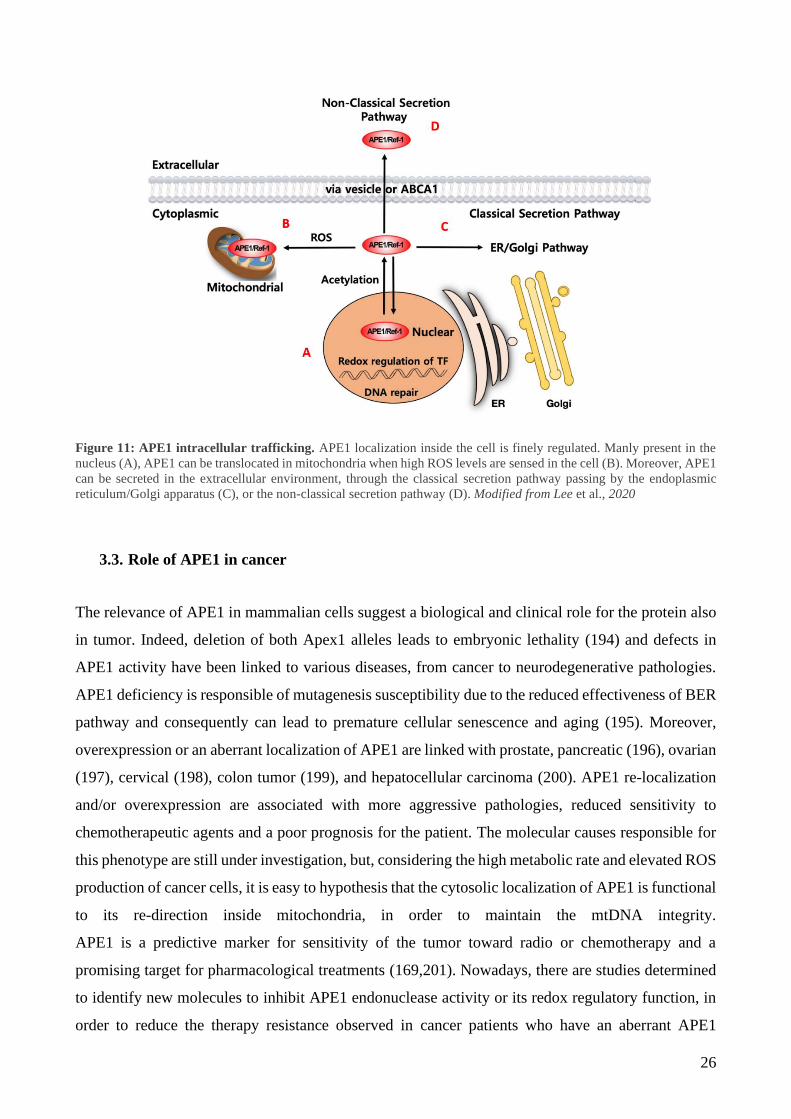
Figure 11: APE1 intracellular trafficking. APE1 localization inside the cell is finely regulated. Manly present in the
nucleus (A), APE1 can be translocated in mitochondria when high ROS levels are sensed in the cell (B). Moreover, APE1
can be secreted in the extracellular environment, through the classical secretion pathway passing by the endoplasmic
reticulum/Golgi apparatus (C), or the non-classical secretion pathway (D). Modified from Lee et al., 2020
3.3. Role of APE1 in cancer
The relevance of APE1 in mammalian cells suggest a biological and clinical role for the protein also
in tumor. Indeed, deletion of both Apex1 alleles leads to embryonic lethality (194) and defects in
APE1 activity have been linked to various diseases, from cancer to neurodegenerative pathologies.
APE1 deficiency is responsible of mutagenesis susceptibility due to the reduced effectiveness of BER
pathway and consequently can lead to premature cellular senescence and aging (195). Moreover,
overexpression or an aberrant localization of APE1 are linked with prostate, pancreatic (196), ovarian
(197), cervical (198), colon tumor (199), and hepatocellular carcinoma (200). APE1 re-localization
and/or overexpression are associated with more aggressive pathologies, reduced sensitivity to
chemotherapeutic agents and a poor prognosis for the patient. The molecular causes responsible for
this phenotype are still under investigation, but, considering the high metabolic rate and elevated ROS
production of cancer cells, it is easy to hypothesis that the cytosolic localization of APE1 is functional
to its re-direction inside mitochondria, in order to maintain the mtDNA integrity.
APE1 is a predictive marker for sensitivity of the tumor toward radio or chemotherapy and a
promising target for pharmacological treatments (169,201). Nowadays, there are studies determined
to identify new molecules to inhibit APE1 endonuclease activity or its redox regulatory function, in
order to reduce the therapy resistance observed in cancer patients who have an aberrant APE1
27
expression. Some molecules seem to be promising. Soy isoflavones, resveratrol and E3330 are able
to inhibit APE1 redox activity (202–204), while CRT0044876, lucanthone, methoxyamine,
compound 3 and 52 have an effect on the DNA repair capacity of the protein (205–207). These
compounds could be used, not only alone, but also in combination with other chemotherapeutic agents
as bleomycin, temozolomide or gemcitabine to enhance the cytotoxic effect (208,209). However,
further studies are necessary to identify new compounds able to target specific functions of the
protein, while reducing the side effects.
3.3.1. APE1 in hepatocellular carcinoma
In 2007, Di Maso et al. started investigating the subcellular localization of APE1 in hepatocellular
carcinoma cells obtained from patients with a different stage of the disease (167). They illustrated
that in cells with a low degree of differentiation, the cytosolic localization of APE1 was 3-fold higher
than the one detected in well-differentiated cells. Interestingly, the nuclear levels of the protein were
unchanged. They also evaluated if there was a correlation between the levels of cytoplasmic APE1
and the patient prognosis, demonstrating that patients in an advanced stage of the carcinoma presented
higher levels of cytoplasmic APE1. These observations leaded the authors to suggest a crucial role
for APE1 as prognostic marker. Moreover, recent studies showed an increased interest for APE1
levels in serum (168,210). It has been shown that HCC patients have high levels of serum APE1 and
that the detection of APE1 in the serum could be used as new marker for HCC diagnosis (168).
APE1 role in HCC has been also associated to chemo or radiotherapy resistance. A 2013 work showed
the positive effects of silencing APE1 in vitro and in vivo in combination with radiotherapy (211).
Beneficial effects of the APE1 silencing are evident (212), but further investigations are required to
elucidate the better approach to target cancer cells.
28
AIM
Aim of this work is to investigate the role of mitochondrial APE1 in the maintenance of cell
physiology. We especially focused our attention on hepatocytes and the impact of the mitochondrial
localization of the protein in liver affected by hepatocellular carcinoma. Our observations open a new
field of investigation that can complement the role of APE1 on the genomic DNA with the
mitochondrial role of the endonuclease.
29
MATERIALS AND METHODS
1 Samples of human tumor tissue specimens and adjacent non-tumor tissues
Samples of paired HCC and adjacent non-tumor liver tissues from patients undergoing HCC resection
were obtained from the Department of Medicine, General Surgery and Transplantation of the
University of Udine (Udine, Italy). None of the patients had received any local or systemic anticancer
treatments before the surgery. Diagnosis of HCC was performed in all cases by preoperative imaging
(CT or MRI scan) or by liver biopsy when requested. Hepatic serology, α-fetoprotein (AFP), routine
laboratory assessment of liver and renal function were also performed. The presence of suspected
(based on radiologic features) neoplastic main branch portal thrombosis was considered a
contraindication to surgery.
After hospital discharge all patients were followed up and monitored for tumor recurrence by monthly
assessments of serum AFP and by US, CT or MRI scan every 3-6 months. HCC recurrence was in all
cases diagnosed by CT or MRI imaging according to international guidelines (213).
2 Immunohistochemical analysis
In the registry of the Pathology Department of University Hospital of Udine (Udine, Italy), a total of
20 patients who had a pathological diagnosis of hepatocellular carcinoma between January 2015 and
December 2017, were identified. For each case, a single pathologist looked at slides stained with
hematoxylin-eosin to evaluate the histological grading of HCC according to the Edmondson and
Steiner criteria. Another slide (not stained) was used for immunohistochemical analysis. Each slide
included both the tumor and not neoplastic liver (cirrhosis or normal liver).
Immunohistochemical detection of APE1 was performed by immunohistochemistry using the anti-
APE1 mouse monoclonal antibody as the primary antibody (Novus Biologicals, Cambridge,
England). The slides were deparaffinized and rehydrated (Xylene: three washes for 5 minutes each;
100% Ethanol: two washes 10 minutes each; 95% Ethanol: two washes 10 minutes each; 70%
Ethanol: two washes 10 minutes each; 50% Ethanol: two washes 10 minutes each; distilled water:
two washes for 5 minutes). Using microwave, the tissue sections were brought to boil in 10 mM
sodium citrate buffer (pH 6.0) and then maintained at a sub-boiling temperature for 10 minutes. The
tissue sections were quenched with 3.0% hydrogen peroxide in methanol for at least 15 minutes to
block endogenous peroxidase activity. To permeabilize the cells, the tissue sections were washed with
1% animal serum in PBS with 0.4% Triton X-100 (PBS-T). Then, the tissue sections were incubated
with 5% animal serum in PBS-T for 30 minutes at room temperature to block any non-specific

30
binding. The primary antibody (diluted 1:200; Novus Biologicals, Cambridge, England) was added
and the tissue sections were incubated for 12 hours at room temperature and then at 4°C overnight.
A DAKO REAL EnVision Rabbit/Mouse (K5007) was used as a second antibody. Horseradish
peroxidase activity was detected using DAKO REAL 3,3′-diaminobenzidine + chromogen (K5007)
as substrate for 3 minutes in accordance with the manufacturer’s instructions. Sections were counter-
stained with hematoxylin with a cover slip. We consider the reaction for APE1 positive when a dense,
homogeneous brown staining is identified in the nucleus of hepatocyte and when a granular brown
staining is identified in the cytoplasm of hepatocyte.
3 Nuclei and mitochondria isolation from human HCC tissue specimens
After collection, all procedures were carried out at 4°C and in the presence of protease inhibitors to
avoid proteins degradation. Fresh samples were finely minced, suspended in 5 mL of Isolation Buffer
(IB) [10 mM Tris/MOPS, 1 mM EGTA/Tris, 200 mM Sucrose], and homogenized. Then, sample
were centrifuged at 70 x g for 3 minutes to remove non-homogenized tissue. Supernatant was further
centrifuged at 600 x g for 10 minutes to separate nuclear (pellet) and mitochondrial (supernatant)
fractions. Nuclei were washed in T1 solution [10 mM HEPES pH 7.9, 0.1 mM EDTA pH 8.0, 10 mM
KCl, 0.1 mM MgCl2] and then lysed in T2 solution [10 mM HEPES pH 7.9, 0.1 mM EDTA pH 8.0,
400 mM NaCl, 1.5 mM MgCl2, 5% glycerol] for 20 minutes on ice. After centrifugation at 14000 x
g for 20 minutes, the supernatant, accounting for nuclear protein extract, was collected. Mitochondria
were centrifuged at 7000 x g for 10 minutes, washed once in IB buffer, and then resuspended in IB
buffer. Nuclear and mitochondria protein extracts were then quantified using Bio-Rad protein assay
reagent (Bio-Rad).
4 mtDNA damage measurement by quantitative PCR in patients’ samples
mtDNA isolation and damage measurement were performed as previously described by Barchiesi et
al. (214). Briefly, mtDNA was extracted by patients isolated mitochondria from non-tumor or HCC
sample using the plasmid isolation kit NucleoSpin Plasmid (Macherey-Nagel) and quantified by
Quant-iT™ PicoGreen™ dsDNA Reagent (Invitrogen). Q-PCR was performed on each sample to
amplify a 16 ∼ Kbp fragment, using the following primers: FOR 5’-TCT AAG CCT CCT TAT TCG
AGC CGA-3’ and REV 5’- CCA TCC AAC ATC TCC GCA TGA TGA AA-3’. Fluorescence
readings of the Q-PCR reactions were quantified in triplicate with Quant-iT™ PicoGreen™ dsDNA
Reagent (Invitrogen) and then averaged for each sample. Blank value was subtracted, and the ratio of
the fluorescence readings obtained for the tumor tissue to those of the distal section determined the
relative amplification of the mtDNA for each patient sample. Relative mtDNA damage was then
expressed as the inverse of this relative amplification.

31
5 Cell culture
HeLa and HEK293 cells were grown at 37°C with 5% CO2 in DMEM (Dulbecco’s modified Eagle’s
medium), supplemented with 10% fetal bovine serum (FBS), 100 U/mL penicillin and 10 μg/mL
streptomycin. For Antimycin treatments, where not otherwise specified, cells were treated for 30
minutes with 25 μM Antimycin A (AMA) in DMEM without serum; release was performed for the
indicated time in DMEM supplemented with FBS.
Stable HeLa clones for inducible silencing of endogenous APE1 and re-expression of recombinant
shRNA resistant APE1 WT and mitochondrially targeted APE1 (MTS-APE1) were obtained as
previously described (215). MTS-APE1 resistant sequence was designed substituting the N-terminal
sequence involved in the nuclear localization of the protein with the well-characterized MTS
sequence of manganese-superoxide dismutase (MLSRAVCGTSRQLAPALGYLGSRQ) (216).
Expression and localization of the recombinant protein were confirmed by WB. APE1 silencing was
induced by addition of doxycycline to the cell culture medium at a final concentration of 1 μg/mL for
10 days.
Stendomycin was used on HeLa cells at the final concentration of 500 nM for 24 hours in DMEM
supplemented with 10% FBS.
6 Cell viability assay
Cell viability upon AMA treatment was performed using CellTiter 96 AQueous One Solution Cell
Proliferation Assay (Promega) in a 96 well plate. The day before the experiment, 104 HeLa cells/well
were plated. 25 μM AMA was resuspended in DMEM without serum and cells were incubated for 30
min (AMA) or for 30 min followed by 1 hour of release in DMEM complemented with 10% FBS
(AMA+rel.). DMEM without serum was used as control. As a positive control cells were incubated
with 200 μg/mL of digitonin for 15 min.
After treatment, 20 μl of CellTiter 96 AQueous One Solution were added to 100 μl of DMEM and
cells were incubated at 37°C, 5% CO2 for 1h. Absorbance was measured at 490 nm using the EnSpire
Multimode Plate Reader (PerkinElmer).
7 Clonogenic assay
For the clonogenic assay, 500 cells were plated the day before the beginning of the silencing. After
10 days, cells were stained with 0.5% (wt/vol) methyl violet. Four biological replicates were
preformed and for each replicate four 10 cm2 plates per clone were analysed. Plates were imaged
using a live scanner (GE Healthcare). The analysis was performed using a modified CellProfiler
pipeline for colonies counting (217). Briefly, the pipeline used was based on four steps: background
32
correction, identification of the single plate, colony detection, and measurement of colonies
parameters. Colonies were identified using the module Identify Primary Object with three classes
intensity threshold: foreground, middle and background. Middle class pixels were then categorized
as background, to avoid overestimation of the colony area.
8 Silencing of Tim23
One day before transfection cells were seeded in 150 cm2 plates at the density of 15 x 106 cells/plate.
Cells were then transfected with 25 nM of either control (Ctrl) (Sense: AUG AGG UCA GCA UGG
UCU G[dT][dT]; Anti-sense: CAG ACC AUG CUG ACC UCA U[dT][dT]) or Tim23 siRNA
(siRNA) (Sense: UAA AUA AGG AGA CAG AGG G[dT][dT]; Anti-sense: CCC UCU GUC UCC
UUA UUU A[dT][dT]) per plate using RiboJuice (Millipore) according to the manufacturer’s
instructions. After 24 h cells medium was replaced by low‐glucose medium for 24 h and then by
galactose medium for 24 h.
9 Preparation of total cell extracts and subcellular fractionation
To prepare total protein extracts, cells were harvested by trypsinization and centrifuged at 250 x g for
5 minutes at 4°C. The pellet was washed once with cold PBS and then resuspended in Lysis buffer
[50 mM Tris-HCl pH 7.5, 150 mM NaCl, 1 mM ethylenediaminetetracetic acid (EDTA), 1% (vol/vol)
Triton X-100, protease inhibitor cocktail (Sigma), 0.5 mM phenylmethylsulfonyl fluoride (PMSF)]
at a cell density of 107 cells/mL, incubated on ice for 30 minutes, and centrifuged at 20000 x g for 20
minutes at 4°C. The supernatant was collected as total cell lysate (TCE). For subcellular fractionation,
cells were scraped in PBS, collected, and centrifuged at 250 x g for 5 minutes. Then, the pellet was
suspended at a cell density of 100 mg/mL in Mitochondrial Isolation Buffer (MIB) [20 mM HEPES
pH 7.6, 1 mM EDTA, 220 mM Mannitol, 70 mM Sucrose] supplemented with 2 mg/mL Bovine
Serum Albumin (BSA). Cells were mechanically broken using a 7 mL dounce homogenizer
(Wheaton), centrifuged at 650 x g for 10 minutes at 4°C. The pellet was conserved to prepare nuclear
subfraction. Supernatant collected was centrifuged at 14000 x g for 15 minutes at 4°C. Isolated
mitochondria were washed with MIB supplemented with 2 mg/mL BSA and 1M KCl and centrifuged
as before. A last wash was performed using MIB without BSA, and then mitochondria were
resuspended in MIB and considered as mitochondrial protein extract (MCE). In parallel, nuclei were
resuspended in T1 solution [10 mM HEPES pH 7.9, 10 mM KCl, 0.1 mM MgCl2, 0.1 mM EDTA70,
2mM PMSF] and centrifuged at 1000 x g for 15 minutes at 4°C. This step was performed twice
followed by nuclei resuspension in T2 lysis buffer [20 mM HEPES pH 7.9, 420 mM NaCl, 1.5 mM
MgCl2, 0.1 mM EDTA70, 5% glycerol, 2mM PMSF]. Samples were incubated on ice for 20 minutes
33
and centrifuged at 20000 x g for 20 minutes at 4°C. Supernatant represented the nuclear protein
fraction (NCE).
Protein concentration was determined using Bio-Rad protein assay reagent (Bio-Rad). Subfractions
purity was evaluated by Western blot analysis using LSD1 and ATP5A as nuclear and mitochondria
markers, respectively, to exclude the presence of cross contaminations between the two organelles.
AMA treatment of isolated mitochondria was performed on MIB buffer without serum with 5 μM of
AMA for 30 minutes, then mitochondria were resuspended for an additional hour in MIB.
10 Preparation of mitoplasts
90 μg of isolated mitochondria were used to obtain mitoplasts. Briefly, mitochondria for swelling
were resuspended in M buffer [20 mM HEPES (pH 7.4), 5 mM sucrose], while sample for whole
mitochondria preparation were resuspended in SM buffer [20 mM HEPES (pH 7.4), 250 mM
sucrose]. After 30 minutes incubation on ice, proteinase K (PK) was added to the samples at a final
concentration of 10 μg/μL for 15 minutes at 4°C. PK digestion was stopped with 2 mM PMSF.
Finally, 300 mM KCl was added to mitoplasts and then all the samples were centrifuged at 20000 x
g for 10 minutes at 4°C. Pellets were resuspended directly in Leammli buffer for Western Blot
analysis.
11 Western blot analysis
The reported amount of nuclear or mitochondrial protein subfractions were separated onto 12% SDS-
PAGE. Then, proteins were transferred into a nitrocellulose membrane (Sartourius Stedim Biotech
S.A.). Saturation of the membranes was performed for 1h at room temperature using 5% non-fat dry
milk in TBS-T [1XTBS supplemented with 0.1% Tween 20], followed by primary antibody
incubation overnight at 4°C [anti-APE1: 1:1000 monoclonal (Novus); anti-Mia40: 1:500 polyclonal
(costumed produced by APS Antibody Production Services); anti-ATPVA: 1:2000 monoclonal
(Abcam); anti-LSD1: 1:10000 polyclonal (Abcam); anti-Cyt.C: 1:1000 polyclonal (Abcam); anti-
Polγ 1:000 polyclonal (Abcam); anti-FLAG: 1:1000 monoclonal (Sigma); anti-Tim23: 1:1000
polyclonal (Abcam); anti-mtHSP70: 1:1000 polyclonal (Enzo Life Sciences); anti-DNAJc19: 1:1000
(Abcam); anti-Tim29: 1:500 polyclonal (ProteinTech); anti-Mic60: 1:1000 (Abcam); anti-Sam50:
1:500 (costum prepared); anti-AIF: 1:200 polyclonal (Abcam); anti-MnSOD: 1:000 monoclonal
(Abcam); anti-RESA: 1:1000 polyclonal (Atlas antibodies HPA); anti-TOM20: 1:1000 polyclonal
(Abcam); anti-Actin: 1:2000 polyclonal (Sigma Aldrich)]. Membranes were washed three times for
5 minutes with TBS-T, incubated for 2h with the secondary antibody, and washed again for three
times. The signal was detected with the Odyssey CLx scanner (Li-Cor Bioscience) and densitometric

34
analysis was performed with ImageStudio software (Li-Cor Bioscience). Images reported in Figure
30 were acquired through autoradiography using horseradish peroxidase conjugated secondary
antibodies.
12 DNA extraction and mtDNA damage analysis in cell lines
DNA was extracted using Qiagen genomic-tip 20/G and following manufacturer’s indications. After
isolation DNA was precipitated overnight with isopropanol, and then 10 μg were digested with
Formamidopyrimidine DNA Glycosylase (Fpg) enzyme at 37°C for 30 minutes to remove damaged
bases leaving an abasic (AP) site. Fpg was inactivated at 60°C for 10 minutes and DNA was
precipitated overnight, resuspended in 50 μL of Tris-EDTA buffer pH 8.0. Quantification was
determined with Quant-iT™ PicoGreen™ dsDNA Reagent (Invitrogen), according to manufacturer’s
instructions and DNA concentration was adjusted to 3 ng/μL.
mtDNA lesions were quantified by Q-PCR, using the following primers: Mitolong Forward: 5’-TCT
AAG CCT TAT TCG AGC CGA-3’ and Mitolong Reverse: 5’-TTT CAT GCG GAG ATG TTG
GAT GG-3’ which amplified an 8.9 Kbp mitochondrial fragment; Mitoshort Forward: 5-CCC CAC
AAA CCC CAT TAC TAA ACC CA-3’ and Mitoshort Reverse: 5’-TTT CAT GCG GAG ATG TTG
GAT GG-3’ which amplified a 221 bp mitochondrial fragment. DNA was amplified using Platinum™
SuperFi™ DNA Polymerase (Invitrogen) using the following protocol: 2 minutes at 94°C, 18 cycles
of denaturation for 15 sec at 94°C, annealing for 10 seconds at 66°C, extension for 5.30 minutes at
68°C for the 8.9 Kbp fragment or annealing 45 seconds at 60°C and extension for 45 seconds at 72°C
for the 221 bp fragment. A final extension for 10 minutes at 68 or 72°C was performed for each
fragment. To ensure quantitative conditions a sample with the 50% of template amount was included
in each amplification and, as negative control, a sample without the template were used. PCR products
were quantified in triplicate by using Quant-iT™ PicoGreen™ dsDNA Reagent (Invitrogen). The
Mitoshort fragment was used to calculate the relative amount of mtDNA copies and to normalize the
lesions frequency calculated with the Mitolong fragment (218).
13 Oxygen Consumption Rate (OCR)
OCR was determined by direct measurement with a Seahorse Extracellular Flux Analyzer XFe24
instrument (Agilent Technologies). OCR for the mitochondrial stress test was determined following
the manufacturer’s instructions. OCR of HeLa stable clones was measured at baseline and after the
addition of the stressors oligomycin to evaluate ATP production, FCCP to measure the maximal
respiration and rotenone and antimycin A for the spare capacity calculation. Time and type of stressor
administration are indicated in the graph. For statistical analyses, all OCR values were normalized
with those of SCR.
35
14 ROS measurement
To measure intracellular ROS production, 3x10⁵ cells were plated in a 6 wells multiwell. The day
after, cells were treated with 5 μM of cell-permeant 2',7'-dichlorodihydrofluorescein diacetate
(H2DCFDA) as an indicator for cellular ROS for 30 minutes in DMEM without serum and then the
indicated amounts of Antimycin A were added to the medium for 30 minutes. An untreated control
(Ctrl) was added as well as a background control only treated with H2DCFDA (Ctrl+H2DCFDA).
Cells were washed in PBS, harvested and centrifuged at 250 x g for 4 minutes at 4°C. All samples
were resuspended in 300 μl of PBS and analysed at the cytofluorimeter FACScalibur (BD
Biosciences) with excitation/emission wavelengths of 500nm/520nm. Ctrl+H2DCFDA sample was
considered as reference threshold.
15 In vitro APE1-HisTag expression
Human APE1’s cDNA was subcloned into pTNT vector (Promega), a 10xHisTag was added at the
C-terminal and the construct was sequenced. Then, the cell-free Wheat Germ System (Biotechrabbit)
was used for expressing APE1-HisTag. Briefly, Feeding solution [feeding mix 900 µl, amino acids
80 µl, Methionine 20 μl] and Reaction solution [reaction mix 15 µl, amino acids 4 µl, Methionine 1
μl, Wheat Germ lysate 15μl, pTNT-APE1-HisTag vector 3 μg] were prepared as reported by
manufacturer. Feeding and Reaction solutions were pipetted into the microplate, covered with
adhesive film, and incubated at 24°C for 24h, shaking speed of 900 rpm. Fifty μl of recombinant
APE1-HisTag protein has been recovered, evaluated on SDS-PAGE gel and used for in organello
protein import on isolated mitochondria. The same protocol was applied for the preparation of MSP1
and MSP2 using the pTNT vectors subcloned to express the two peptides.
16 Isolation of mitochondria from HEK293 cells and in organello import of APE1-HisTag
A total of 9×10⁶ HEK293 cells were seeded and grown in low‐glucose medium for 24 h and then in
galactose medium for 24 h. Cells were harvested, and mitochondria isolated as mentioned above.
APE1-HisTag and control (empty vector/mock) proteins were synthesized in vitro using wheat germ
system and imported into the isolated mitochondria of HEK293 cells.
One mg of isolated mitochondria were suspended in 1 ml of Import buffer [250 mM sucrose, 80 mM
potassium acetate, 5 mM magnesium acetate, 5 mM methionine, 10 mM sodium succinate, 20 mM
HEPES/KOH pH 7.4] and incubated with 50 μl (5% v/v) of the in vitro synthetized APE1-HisTag
protein at 37°C for 30 min. Then, samples were treated with PK at the final concentration of 25 µg/ml
for 15 min on ice to degrade the not-imported precursor protein. Reaction was stopped with PMSF
2.5 mM for 5 min on ice. Samples were centrifuge at 20000 x g for 10 min at 4°C and mitochondria
36
were resuspended and washed with 1 ml of HS buffer [500 mM sucrose, 20 mM HEPES/KOH pH
7.4]. Finally, mitochondria were centrifuged at 20000 x g for 10 min at 4°C and then lysed under
native condition to preserve protein-protein interaction.
17 Ni-NTA affinity purification
Mitochondria were resuspended in Lysis buffer [50 mM Tris–HCl pH 7.4, 150 mM NaCl, 10%
glycerol, 1 mM EDTA, and 1% digitonin] supplemented with 2 mM PMSF and incubated for 20 min
at 4°C. The lysate was clarified by centrifugation at 20000 x g for 15 min, and the supernatant was
incubated with 20 μl of Ni-NTA Agarose resign (Qiagen) for 2 h at 4°C with mild rotation. After
binding, the resin was washed five times with lysis buffer without digitonin. The column‐bound
proteins were eluted with Laemmli buffer and analysed by Western blot.
18 Proximity Ligation Assay (PLA)
To monitor the interaction between ectopic APE1 and DNAJc19 in living cells, the in situ Proximity
Ligation Assay kit (Olink Bioscience) was used. HeLa cells were seated into a glass coverslip in the
amount of 8×10⁴ per 24-multiwell plate and then fixed with 4% (w/v) paraformaldehyde for 15
minutes at RT, permeabilized for 5 min with Triton X-100 0.25% in PBS 1X and incubated with 5%
normal goat serum in PBS-0.1% (v/v) Tween20 (blocking solution) for 30 min, to block unspecific
binding of the antibodies. Cells were then incubated with the mouse monoclonal anti-APE1 (Novus)
at a final dilution of 1:400 for 2 h an RT, in a humid chamber. After washing three times with Washing
solution [PBS 0.1% (vol/vol) Tween-20] for 5 min, cells were incubated with a rabbit anti-DNAJc19
(Abcam) at a final dilution of 1:400 for 3 h at 37°C. PLA was performed following manufacturer’s
instructions. Technical controls, represented by the omission of the anti-DNAJc19 primary antibody,
resulted in the complete loss of PLA signal. Images were acquired using an upright laser scanning
confocal microscope Zeiss LSM700. For the analysis, an average of 35 randomly selected cells per
condition were imaged. PLA-spots present in each single cell were then scored using the BlobFinder
software (Olink Bioscience). DAPI staining was used to identify cell nuclei.
19 Recombinant GST-Mia40 and APE1 expression
pGEX-3X expression plasmids (Sigma) containing wild-type APE1 or empty vector and pGEX-4T
expression vectors (Sigma) containing wild-type Mia40 were transformed into Escherichia coli BL21
(DE3) cells (Stratagene). Bacterial cells were grown at 37°C to an absorbance of 0.8 OD measured at
600 nm, and then protein expression was induced with 1-mM isopropyl-β-D-thiogalactopyranoside.
Induction was carried out for 4 h for GST-APE1 and GST and for 2 h for GST-Mia40 at 37°C and
then cells were collected by centrifugation at 4000 × g for 20′ at 4°C. Cells were resuspended in Lysis

37
buffer (20-mM Tris HCl (pH 8.0), 250-mM NaCl, 0.1% [v/v] Tween-20) with protease inhibitor
cocktail (Sigma), sonicated five times for 30 s and then centrifuged at 16000 × g for 30 min.
Recombinant proteins were purified from the clarified extracts on an AKTA Prime FPLC system (GE
Healthcare) using GSTrap HP columns (GE Healthcare). To remove the GST tag from GST–APE1,
the protein was further hydrolysed with factor Xa (five factor Xa units per milligram of recombinant
GST-fused protein) for 4 h at room temperature (RT). The protease was then removed from the
sample using a benzamidine HiTrap FF column (GE Healthcare), and the proteins were then purified
on a GSTrap HP column to purify APE1 from the GST tag. The quality of purification was checked
by SDS-PAGE analysis. Accurate quantification of all recombinant proteins was performed by
colorimetric Bradford assays (Bio-Rad) and confirmed by SDS-PAGE
20 GST-pull down
1 g of GST-Mia40 was incubated for 1 hour with the chemically synthetised peptide MSP1 or MSP2,
produced thanks to the collaboration with the Department of Pharmacy, CIRPEB (Centro
Interuniversitario di Ricerca sui Peptidi Bioattivi), University of Naples “Federico II” (Naples, Italy).
After 1 hour the recombinant APE1 protein was added to the mix and incubated for 2 hours. The mix
was then incubated with the 10 L of glutathione agarose beads (XX) for 30 minutes. Three washes
were performed with washing solution (PBS 1X, NP-40 0,1%, glycerol 10%) and GST-Mia40 was
eluted with 10 mM GSH for 10 minutes vortexing. Samples were run on SDS-page to evaluate the
amount of APE1 binding GST-Mia40 in presence of MSP1 or MSP2. The peptides were omitted in
the control sample.
21 CABS-dock
MSP1 and MSP2 interaction with Mia40 were tested in silico using the online resource CABS-dock
(http://biocomp.chem.uw.edu.pl/CABSdock ) for the simulation of the interaction of small peptides
no longer than 30 residues with a protein. Briefly, the human Mia40 3D structure (PDB code: 2K3J)
was uploaded to be docked with the “de novo” modelling of MSP1 or MPS2. Two type of simulation
were performed: in a first approach it was defined as strict condition the interaction of Cys59 on
Mia40 with the Cys on MSP1, defining a distance of 2.1 Å between the two to allow for the disulphide
bridge formation. In the second approach no restrictions were imposed. The best model was chosen
in each simulation evaluating the trajectory obtained, the density of the cluster and the average Root
Mean Square Deviation (RMSD).

38
22 Mitochondrial lysate incubation with MSP1 or MSP2
1 mg of mitochondria were lysed in 200 L of mitochondrial lysis buffer (20 mM Tris-HCl pH 7.4,
01 mM EDTA pH 8.0, 50 mM NaCl, 10% glycerol, 1% digitonin) incubating the reaction for 15
minutes on ice. The sample was centrifuged at 20000 x g for 15 minutes at 4°C and surnatant was
collected in a new tube. 20 L were incubated for 1 hour either with 20% v/v in organello synthetised
MSP1 or MSP2. A control without peptides was also prepared. 22 L of Leammli 2X without DTT
were added and samples were run on native precast gel (Life Technologies).
23 Immunofluorescence
HeLa cells were seated into a glass coverslip in the amount of 8×10⁴ per 24-multiwell plate. Cells
were then transiently transfected to express MSP1-FLAG or MSP2-FLAG peptides, using the
transfection reagent JetPrime (PolyPlus). 50 L of buffer, 500 ng of pCMV expressing either MSP1
or MSP2 and 1 L of JetPrime were incubated for 10 minutes at RT. The mix was then added on
HeLa for 4 hours. Media was changed with fresh DMEM and cells were allowed to growth for 24
hours. The day after cells were fixed with 4% (w/v) paraformaldehyde for 15 minutes at RT,
permeabilized for 5 min with Triton X-100 0.25% in PBS 1X and incubated with 5% normal goat
serum in PBS-0.1% (v/v) Tween20 (blocking solution) for 30 min, to block unspecific binding of the
antibodies. Cells were then incubated with the rabbit polyclonal antibody MRSP15 at a final dilution
1:250, O/N at 4°C in humid chamber. After washing three times with Washing solution [PBS 0.1%
(vol/vol) Tween-20], HeLa cells were incubated with the mouse monoclonal anti-FLAG (Sigma
Aldrich) at a final dilution of 1:100 for 2 hours at RT, in a humid chamber. Cells were finally
incubated with the secondary antibody Alexa Fluor 488 (mouse) and Alexa Fluor 647 (rabbit). Images
were acquired with the upright laser scanning confocal microscope Zeiss LSM700.
24 MSP1 and MSP2 import in mitochondria
In organello import was performed for several time points to evaluate the kinetics of import of
MSP1/2. Briefly, the import protocol was adapted as follow: 30 g of mitochondria were incubated
in 30 L of import buffer [250 mM sucrose, 80 mM potassium acetate, 5 mM magnesium acetate, 5
mM methionine, 10 mM sodium succinate, 20 mM HEPES/KOH pH 7.4] supplemented with 62.5
mM ATP at 30°C, 350 rpm, for 2 minutes. 9 L of MSP1/2 synthetised with the TNT-system were
added for the desired time. Soon after 25 g/ L of PK were added to degrade the not-imported
peptide, incubating the reaction on ice for 15 minutes. 2.5 mM PMSF was added to block PK action.
The sample was centrifuged at 20000 x g for 10 minutes at 4°C, washed in HS buffer [500 mM
sucrose, 20 mM HEPES/KOH pH 7.4] and resuspended in Leammli 1X.
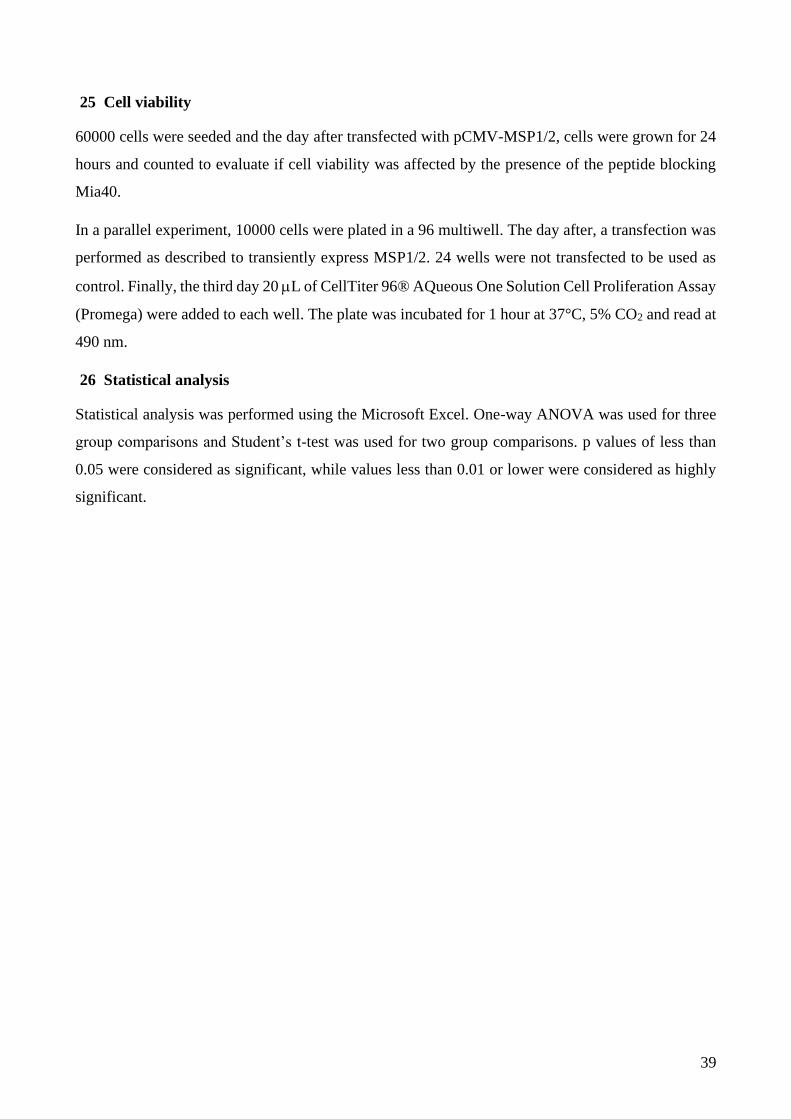
39
25 Cell viability
60000 cells were seeded and the day after transfected with pCMV-MSP1/2, cells were grown for 24
hours and counted to evaluate if cell viability was affected by the presence of the peptide blocking
Mia40.
In a parallel experiment, 10000 cells were plated in a 96 multiwell. The day after, a transfection was
performed as described to transiently express MSP1/2. 24 wells were not transfected to be used as
control. Finally, the third day 20 L of CellTiter 96® AQueous One Solution Cell Proliferation Assay
(Promega) were added to each well. The plate was incubated for 1 hour at 37°C, 5% CO2 and read at
490 nm.
26 Statistical analysis
Statistical analysis was performed using the Microsoft Excel. One-way ANOVA was used for three
group comparisons and Student’s t-test was used for two group comparisons. p values of less than
0.05 were considered as significant, while values less than 0.01 or lower were considered as highly
significant.
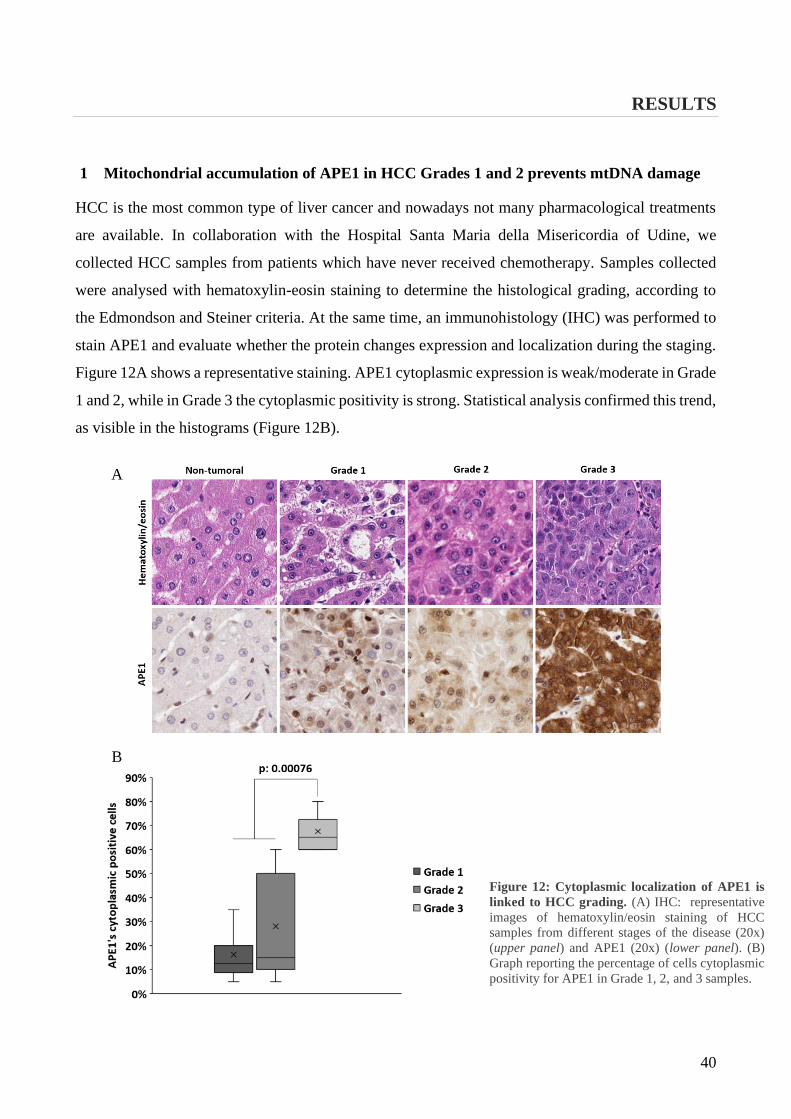
40
RESULTS
1 Mitochondrial accumulation of APE1 in HCC Grades 1 and 2 prevents mtDNA damage
HCC is the most common type of liver cancer and nowadays not many pharmacological treatments
are available. In collaboration with the Hospital Santa Maria della Misericordia of Udine, we
collected HCC samples from patients which have never received chemotherapy. Samples collected
were analysed with hematoxylin-eosin staining to determine the histological grading, according to
the Edmondson and Steiner criteria. At the same time, an immunohistology (IHC) was performed to
stain APE1 and evaluate whether the protein changes expression and localization during the staging.
Figure 12A shows a representative staining. APE1 cytoplasmic expression is weak/moderate in Grade
1 and 2, while in Grade 3 the cytoplasmic positivity is strong. Statistical analysis confirmed this trend,
as visible in the histograms (Figure 12B).
Figure 12: Cytoplasmic localization of APE1 is
linked to HCC grading. (A) IHC: representative
images of hematoxylin/eosin staining of HCC
samples from different stages of the disease (20x)
(upper panel) and APE1 (20x) (lower panel). (B)
Graph reporting the percentage of cells cytoplasmic
positivity for APE1 in Grade 1, 2, and 3 samples.
B
A
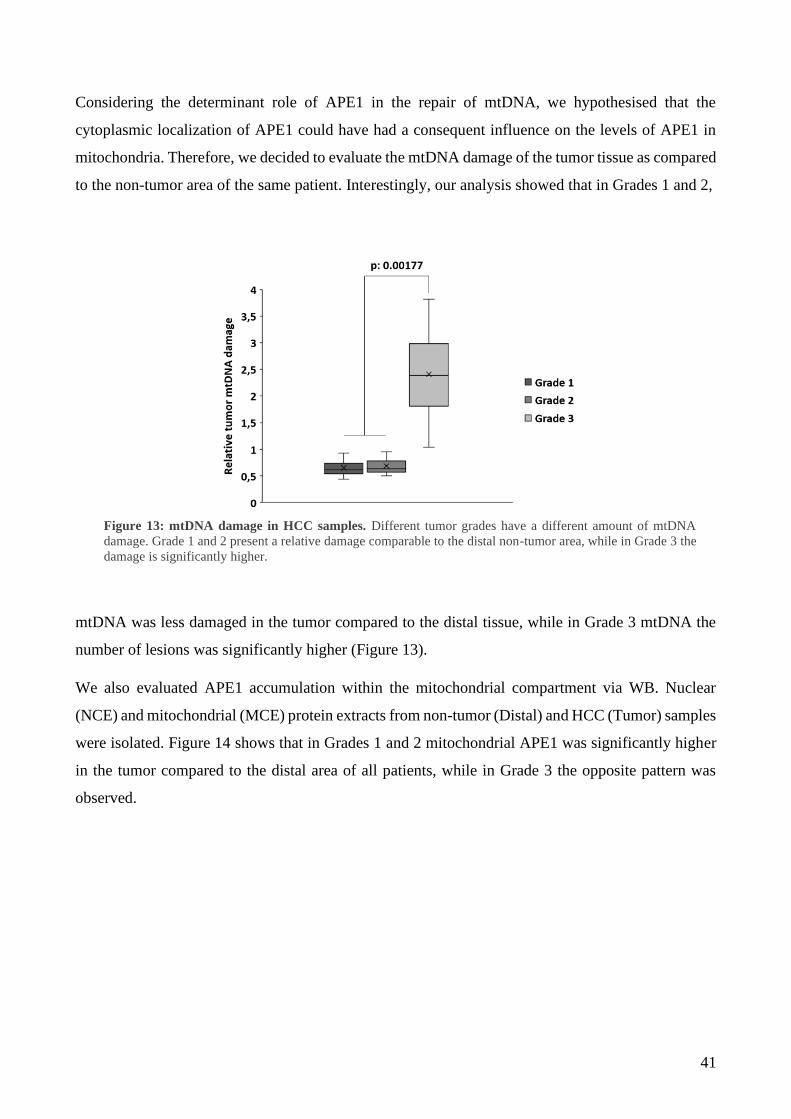
41
Considering the determinant role of APE1 in the repair of mtDNA, we hypothesised that the
cytoplasmic localization of APE1 could have had a consequent influence on the levels of APE1 in
mitochondria. Therefore, we decided to evaluate the mtDNA damage of the tumor tissue as compared
to the non-tumor area of the same patient. Interestingly, our analysis showed that in Grades 1 and 2,
mtDNA was less damaged in the tumor compared to the distal tissue, while in Grade 3 mtDNA the
number of lesions was significantly higher (Figure 13).
We also evaluated APE1 accumulation within the mitochondrial compartment via WB. Nuclear
(NCE) and mitochondrial (MCE) protein extracts from non-tumor (Distal) and HCC (Tumor) samples
were isolated. Figure 14 shows that in Grades 1 and 2 mitochondrial APE1 was significantly higher
in the tumor compared to the distal area of all patients, while in Grade 3 the opposite pattern was
observed.
Figure 13: mtDNA damage in HCC samples. Different tumor grades have a different amount of mtDNA
damage. Grade 1 and 2 present a relative damage comparable to the distal non-tumor area, while in Grade 3 the
damage is significantly higher.

42
Altogether, these data suggest that APE1’s cytoplasmic positivity in Grades 1 and 2 reflects an
increased amount of mitochondrial APE1, explaining the lower levels of mtDNA damage observed.
In contrast, the cytoplasmic positivity in Grade 3 is not associated with APE1’s mitochondrial
accumulation, thus accounting for the higher number of mtDNA lesions in that grade.
In 2015 our lab published a work on the translocation of APE1 inside mitochondria (158). We
identified the MIA pathway as responsible for the translocation of APE1. The key player of this
pathway is Mia40 and to verify if the accumulation of APE1 was somehow associated with an
upregulation of the MIA pathway, we investigated via WB also the amount of Mia40 detected in
patient samples (Figure 14). Similarly to APE1, Mia 40 expression is enhanced in Grade 1 and 2,
while it is unchanged in Grade 3 (Figure 15). This trend confirms the direct correlation of APE1 and
Mia40 and correlates with the higher mtDNA damage repair capacity seen in lower tumor grades.
Figure 14: Representative WB analysis of nuclear and mitochondrial extracts of Grade 1-2 and Grade 3
tumor samples. LSD1 and ATP5A were used as nuclear and mitochondrial marker respectively.
43
Figure 15. Relative tumor APE1 and Mia40 levels. Graphs show the relative amount of APE1 (right) and Mia40 (left)
in the tumor tissue with respect to the distal non-tumor area. Both the proteins result increased in Grade 1-2.
2 Mitochondrial expression of APE1 sustains cell growth and cellular respiration
Once defined the correlation between tumor stages, amount of APE1 in mitochondria, and extension
of mtDNA damage, we decided to fully investigate the role of mitochondrial APE1 in HCC
progression. To support our analysis, we developed a stable HeLa cell line expressing a recombinant
form of APE1, called MTS-APE1, where the NLS of the protein was substituted with the MTS of
MnSOD2, a known and well characterized mitochondrial protein (219). Thanks to this MTS
sequence, the ectopic APE1 is driven into the mitochondrial matrix. As control we used a knock-in
clone, expressing wild-type APE1 (APE1 WT). Both ectopic proteins’ expression is performed on
the background of a stable inducible APE1 silencing clone, previously developed in our lab (220).
Scramble control (SCR) and inducible shRNA (shRNA) clones were also included in our analyses
(Figure 16).
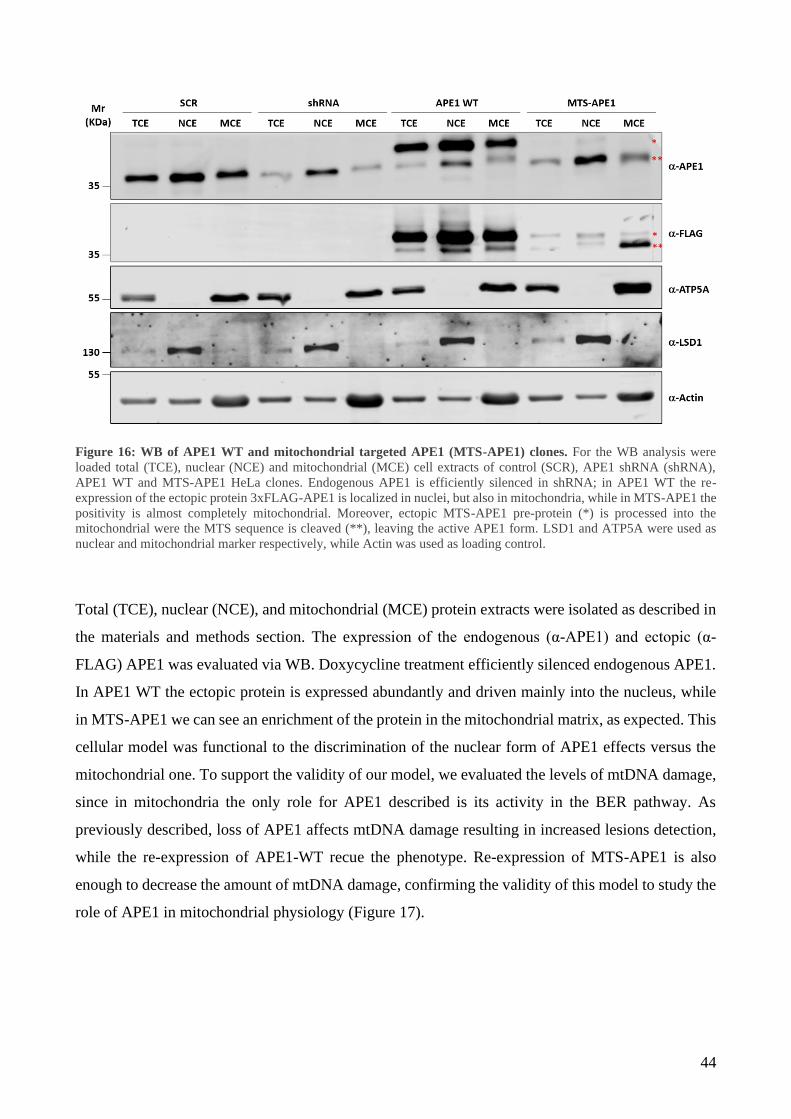
44
Figure 16: WB of APE1 WT and mitochondrial targeted APE1 (MTS-APE1) clones. For the WB analysis were
loaded total (TCE), nuclear (NCE) and mitochondrial (MCE) cell extracts of control (SCR), APE1 shRNA (shRNA),
APE1 WT and MTS-APE1 HeLa clones. Endogenous APE1 is efficiently silenced in shRNA; in APE1 WT the re-
expression of the ectopic protein 3xFLAG-APE1 is localized in nuclei, but also in mitochondria, while in MTS-APE1 the
positivity is almost completely mitochondrial. Moreover, ectopic MTS-APE1 pre-protein (*) is processed into the
mitochondrial were the MTS sequence is cleaved (**), leaving the active APE1 form. LSD1 and ATP5A were used as
nuclear and mitochondrial marker respectively, while Actin was used as loading control.
Total (TCE), nuclear (NCE), and mitochondrial (MCE) protein extracts were isolated as described in
the materials and methods section. The expression of the endogenous (α-APE1) and ectopic (α-
FLAG) APE1 was evaluated via WB. Doxycycline treatment efficiently silenced endogenous APE1.
In APE1 WT the ectopic protein is expressed abundantly and driven mainly into the nucleus, while
in MTS-APE1 we can see an enrichment of the protein in the mitochondrial matrix, as expected. This
cellular model was functional to the discrimination of the nuclear form of APE1 effects versus the
mitochondrial one. To support the validity of our model, we evaluated the levels of mtDNA damage,
since in mitochondria the only role for APE1 described is its activity in the BER pathway. As
previously described, loss of APE1 affects mtDNA damage resulting in increased lesions detection,
while the re-expression of APE1-WT recue the phenotype. Re-expression of MTS-APE1 is also
enough to decrease the amount of mtDNA damage, confirming the validity of this model to study the
role of APE1 in mitochondrial physiology (Figure 17).
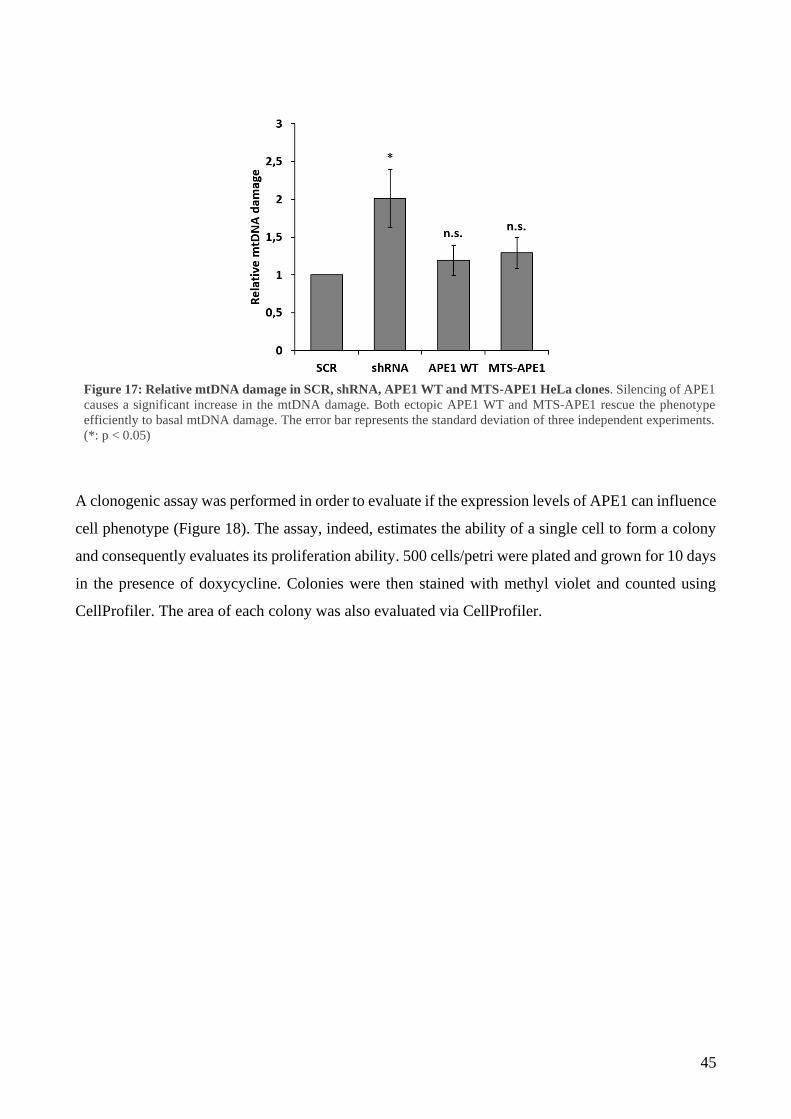
45
A clonogenic assay was performed in order to evaluate if the expression levels of APE1 can influence
cell phenotype (Figure 18). The assay, indeed, estimates the ability of a single cell to form a colony
and consequently evaluates its proliferation ability. 500 cells/petri were plated and grown for 10 days
in the presence of doxycycline. Colonies were then stained with methyl violet and counted using
CellProfiler. The area of each colony was also evaluated via CellProfiler.
Figure 17: Relative mtDNA damage in SCR, shRNA, APE1 WT and MTS-APE1 HeLa clones. Silencing of APE1
causes a significant increase in the mtDNA damage. Both ectopic APE1 WT and MTS-APE1 rescue the phenotype
efficiently to basal mtDNA damage. The error bar represents the standard deviation of three independent experiments.
(*: p < 0.05)

46
When the expression of APE1 was silenced (shRNA), cell growth was inhibited. This data was not
unexpected, since it is known in literature that APE1 absence negatively affect cell growth (221).
APE1 WT expression rescues the phenotype completely. Interestingly, the growth inhibition was also
efficiently rescued in MTS-APE1, suggesting a fundamental role for APE1 in mitochondria (Figure
19, left). Next, we analysed the area of the colonies. When APE1 is localised in mitochondria,
colonies are significantly bigger compared to both silenced (shRNA) or APE1 overexpressing cells
(APE WT) (Figure 19, right), indicating that APE1 expression levels in mitochondria may impact
cell growth in the early phases of tumor progression.
Figure 18: Clonogenic assay. Representative images of clonogenic assay on APE1 shRNA and KI clones. In the
zoomed squares it is possible to appreciate the colonies area difference of APE1 WT and MTS-APE1 clones.

47
Figure 19: Clonogenic assay. Graph on the left shows the relative amount of colonies per each clone. Silencing of APE1
negatively influence cell growth. Overexpression of ectopic APE1 rescue the phenotype in both APE1 WT and MTS-
APE1. On the right, relative colonies’ dimension quantification of shRNA, APE1 WT and MTS-APE1 clones compared
to the SCR. MTS-APE1 has significantly bigger colonies than the other clones. Data reported are mean of four
independent biological replicates.
Cell proliferation was affected by APE1 localization in mitochondria. Therefore, we decided to
further investigate if mitochondria physiology was also affected. For this purpose, the Oxygen
Consumption Rate (OCR) of APE1 shRNA and KI clones was measured using Seahorse extracellular
flux analyser (Figure 20).
Figure 20: Oxygen Consumption Rate (OCR). Profiles of mitochondrial bioenergetics measurements monitored using
Seahorse XFe24.
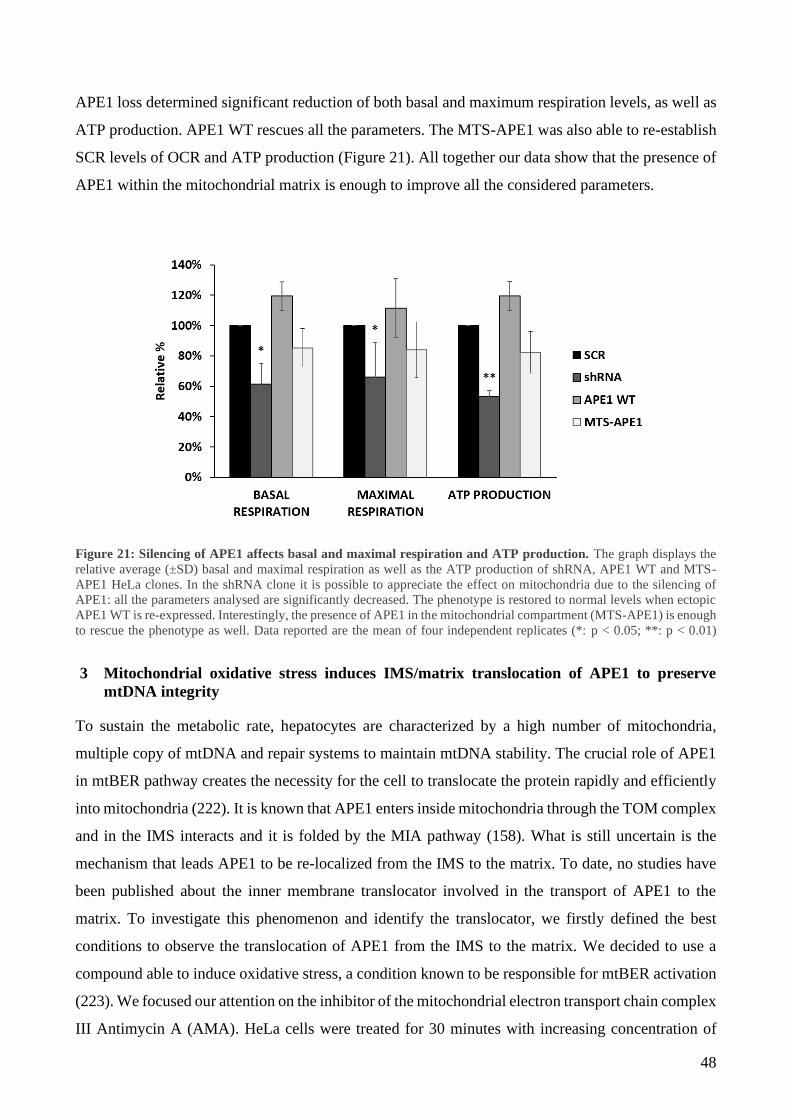
48
APE1 loss determined significant reduction of both basal and maximum respiration levels, as well as
ATP production. APE1 WT rescues all the parameters. The MTS-APE1 was also able to re-establish
SCR levels of OCR and ATP production (Figure 21). All together our data show that the presence of
APE1 within the mitochondrial matrix is enough to improve all the considered parameters.
Figure 21: Silencing of APE1 affects basal and maximal respiration and ATP production. The graph displays the
relative average (±SD) basal and maximal respiration as well as the ATP production of shRNA, APE1 WT and MTS-
APE1 HeLa clones. In the shRNA clone it is possible to appreciate the effect on mitochondria due to the silencing of
APE1: all the parameters analysed are significantly decreased. The phenotype is restored to normal levels when ectopic
APE1 WT is re-expressed. Interestingly, the presence of APE1 in the mitochondrial compartment (MTS-APE1) is enough
to rescue the phenotype as well. Data reported are the mean of four independent replicates (*: p < 0.05; **: p < 0.01)
3 Mitochondrial oxidative stress induces IMS/matrix translocation of APE1 to preserve
mtDNA integrity
To sustain the metabolic rate, hepatocytes are characterized by a high number of mitochondria,
multiple copy of mtDNA and repair systems to maintain mtDNA stability. The crucial role of APE1
in mtBER pathway creates the necessity for the cell to translocate the protein rapidly and efficiently
into mitochondria (222). It is known that APE1 enters inside mitochondria through the TOM complex
and in the IMS interacts and it is folded by the MIA pathway (158). What is still uncertain is the
mechanism that leads APE1 to be re-localized from the IMS to the matrix. To date, no studies have
been published about the inner membrane translocator involved in the transport of APE1 to the
matrix. To investigate this phenomenon and identify the translocator, we firstly defined the best
conditions to observe the translocation of APE1 from the IMS to the matrix. We decided to use a
compound able to induce oxidative stress, a condition known to be responsible for mtBER activation
(223). We focused our attention on the inhibitor of the mitochondrial electron transport chain complex
III Antimycin A (AMA). HeLa cells were treated for 30 minutes with increasing concentration of
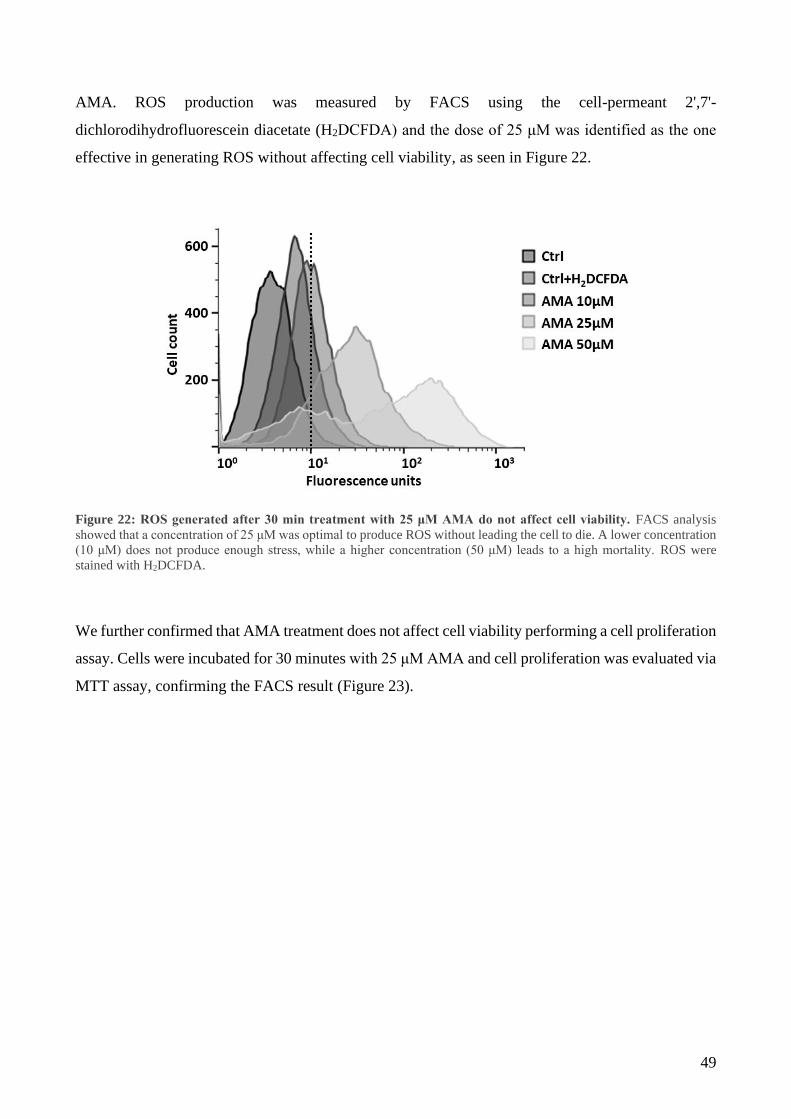
49
AMA. ROS production was measured by FACS using the cell-permeant 2',7'-
dichlorodihydrofluorescein diacetate (H2DCFDA) and the dose of 25 μM was identified as the one
effective in generating ROS without affecting cell viability, as seen in Figure 22.
Figure 22: ROS generated after 30 min treatment with 25 μM AMA do not affect cell viability. FACS analysis
showed that a concentration of 25 μM was optimal to produce ROS without leading the cell to die. A lower concentration
(10 μM) does not produce enough stress, while a higher concentration (50 μM) leads to a high mortality. ROS were
stained with H2DCFDA.
We further confirmed that AMA treatment does not affect cell viability performing a cell proliferation
assay. Cells were incubated for 30 minutes with 25 μM AMA and cell proliferation was evaluated via
MTT assay, confirming the FACS result (Figure 23).
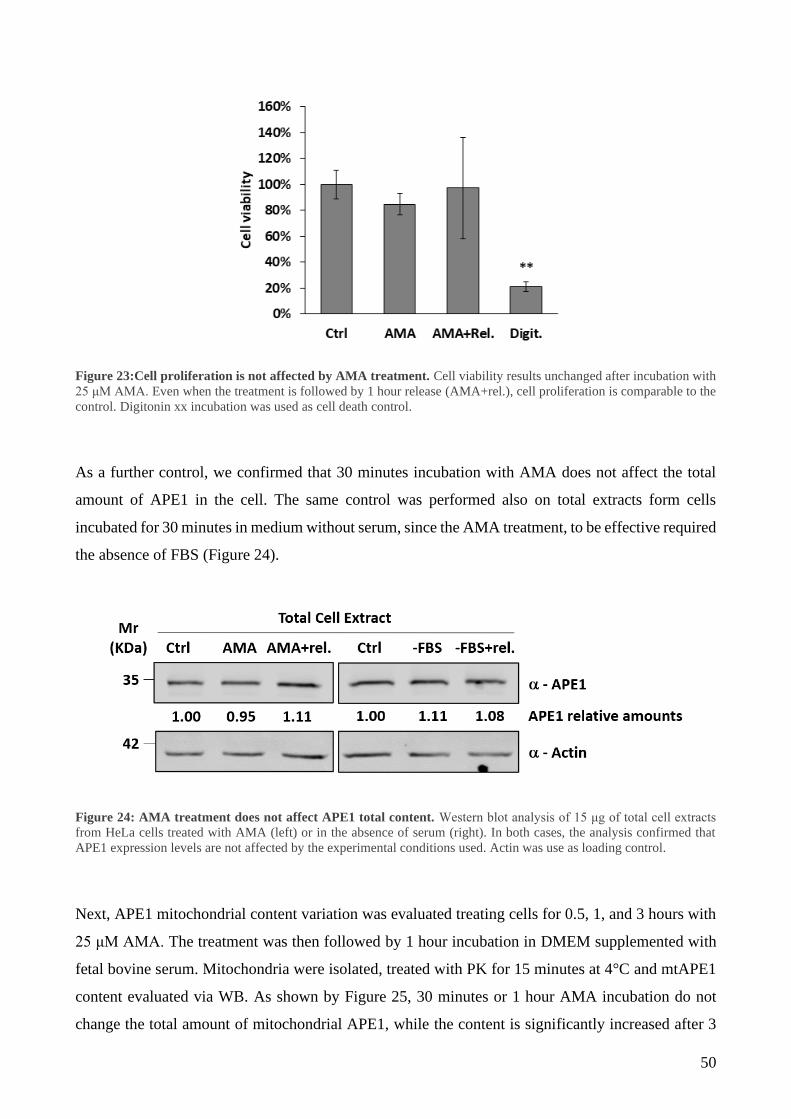
50
Figure 23:Cell proliferation is not affected by AMA treatment. Cell viability results unchanged after incubation with
25 μM AMA. Even when the treatment is followed by 1 hour release (AMA+rel.), cell proliferation is comparable to the
control. Digitonin xx incubation was used as cell death control.
As a further control, we confirmed that 30 minutes incubation with AMA does not affect the total
amount of APE1 in the cell. The same control was performed also on total extracts form cells
incubated for 30 minutes in medium without serum, since the AMA treatment, to be effective required
the absence of FBS (Figure 24).
Next, APE1 mitochondrial content variation was evaluated treating cells for 0.5, 1, and 3 hours with
25 μM AMA. The treatment was then followed by 1 hour incubation in DMEM supplemented with
fetal bovine serum. Mitochondria were isolated, treated with PK for 15 minutes at 4°C and mtAPE1
content evaluated via WB. As shown by Figure 25, 30 minutes or 1 hour AMA incubation do not
change the total amount of mitochondrial APE1, while the content is significantly increased after 3
Figure 24: AMA treatment does not affect APE1 total content. Western blot analysis of 15 μg of total cell extracts
from HeLa cells treated with AMA (left) or in the absence of serum (right). In both cases, the analysis confirmed that
APE1 expression levels are not affected by the experimental conditions used. Actin was use as loading control.

51
hours. Mitochondrial integrity was monitored by cytochrome c levels: permeabilization occurs for
long exposure, but not for 30 minutes of AMA treatment.
Figure 25: mtAPE1 total content is stable after ROS generation. 0.5 and 1 hour treatments with 25 μM AMA do not
create changes in the levels of APE1 detected inside mitochondria. After 3 hours APE1 content is visibly incremented,
but also mitochondria integrity is affected, as seen by the lower amount of CytC detected.
As known, APE1 localizes mainly into the nucleus. To quantify the expression levels and to study
the intra-mitochondrial trafficking of mtAPE1, avoiding misinterpretation due to APE1 presence in
the cytosol/nucleus, in all our experiments mitochondria and isolated matrices were treated with
proteinase K (PK) for 15 minutes at 4˚C to degrade outside proteins. Figure 26 shows the efficiency
and quality of our protocol for the isolation of mitochondria. With the exception of Tom20, which
resided on the OM and resulted to be degraded by PK treatment, the intensity levels of all other
markers were unaffected confirming that mitochondria were intact (Figure 26, left). Concerning
APE1, most of the protein was protected from PK. In parallel, isolated mitochondria were
resuspended in isotonic (SM buffer) or hypotonic (M buffer) sucrose solution and incubated on ice
for 30 minutes (Figure 26, right). The hypotonic solution determined the swelling and consequent
rupture of the outer mitochondrial membrane releasing IMS proteins. Then, PK was added for 15
minutes on ice and samples were analysed on Western blot (Fig. 2A, right). As visible on the right
panel, PK digestion of APE1 led to the cleavage of the first 33 residues at the N-terminal and the
accumulation of a truncated form of the protein (N33). These experiments confirmed that only the
quote of APE1 inside mitochondria or the matrix is protected from PK digestion and is visible as full-
length (FL) form.
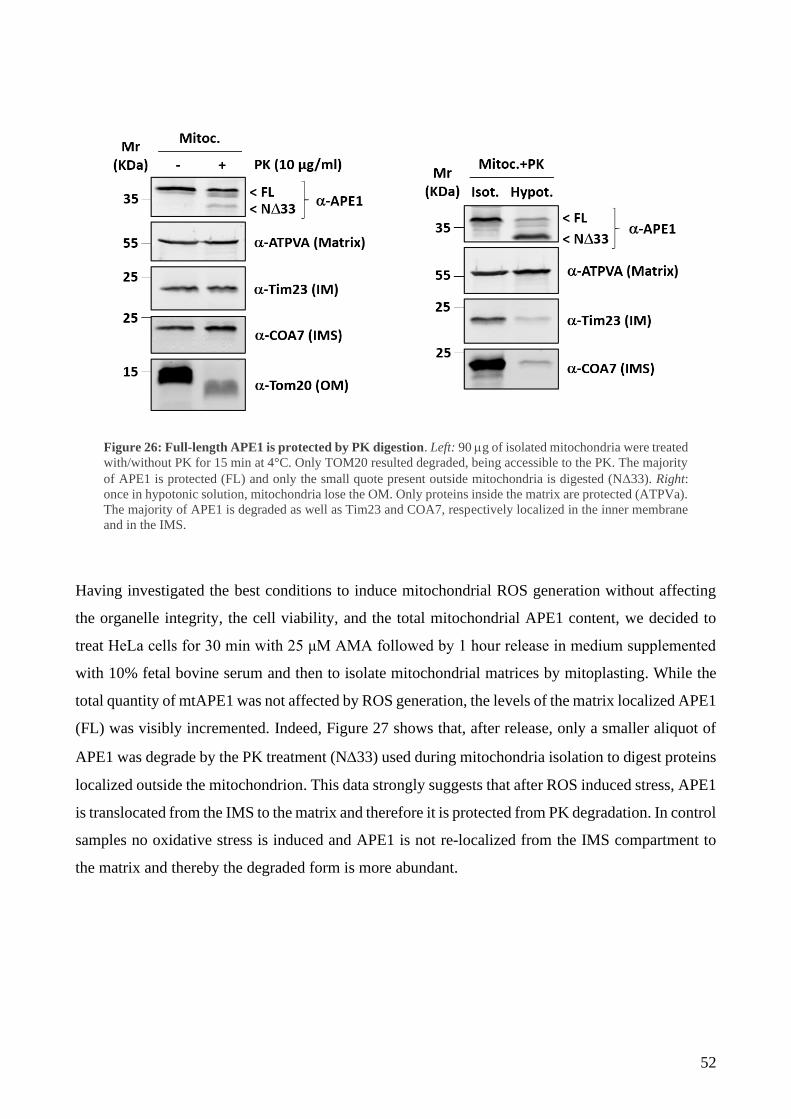
52
Having investigated the best conditions to induce mitochondrial ROS generation without affecting
the organelle integrity, the cell viability, and the total mitochondrial APE1 content, we decided to
treat HeLa cells for 30 min with 25 μM AMA followed by 1 hour release in medium supplemented
with 10% fetal bovine serum and then to isolate mitochondrial matrices by mitoplasting. While the
total quantity of mtAPE1 was not affected by ROS generation, the levels of the matrix localized APE1
(FL) was visibly incremented. Indeed, Figure 27 shows that, after release, only a smaller aliquot of
APE1 was degrade by the PK treatment (N33) used during mitochondria isolation to digest proteins
localized outside the mitochondrion. This data strongly suggests that after ROS induced stress, APE1
is translocated from the IMS to the matrix and therefore it is protected from PK degradation. In control
samples no oxidative stress is induced and APE1 is not re-localized from the IMS compartment to
the matrix and thereby the degraded form is more abundant.
Figure 26: Full-length APE1 is protected by PK digestion. Left: 90 g of isolated mitochondria were treated
with/without PK for 15 min at 4°C. Only TOM20 resulted degraded, being accessible to the PK. The majority
of APE1 is protected (FL) and only the small quote present outside mitochondria is digested (N33). Right:
once in hypotonic solution, mitochondria lose the OM. Only proteins inside the matrix are protected (ATPVa).
The majority of APE1 is degraded as well as Tim23 and COA7, respectively localized in the inner membrane
and in the IMS.
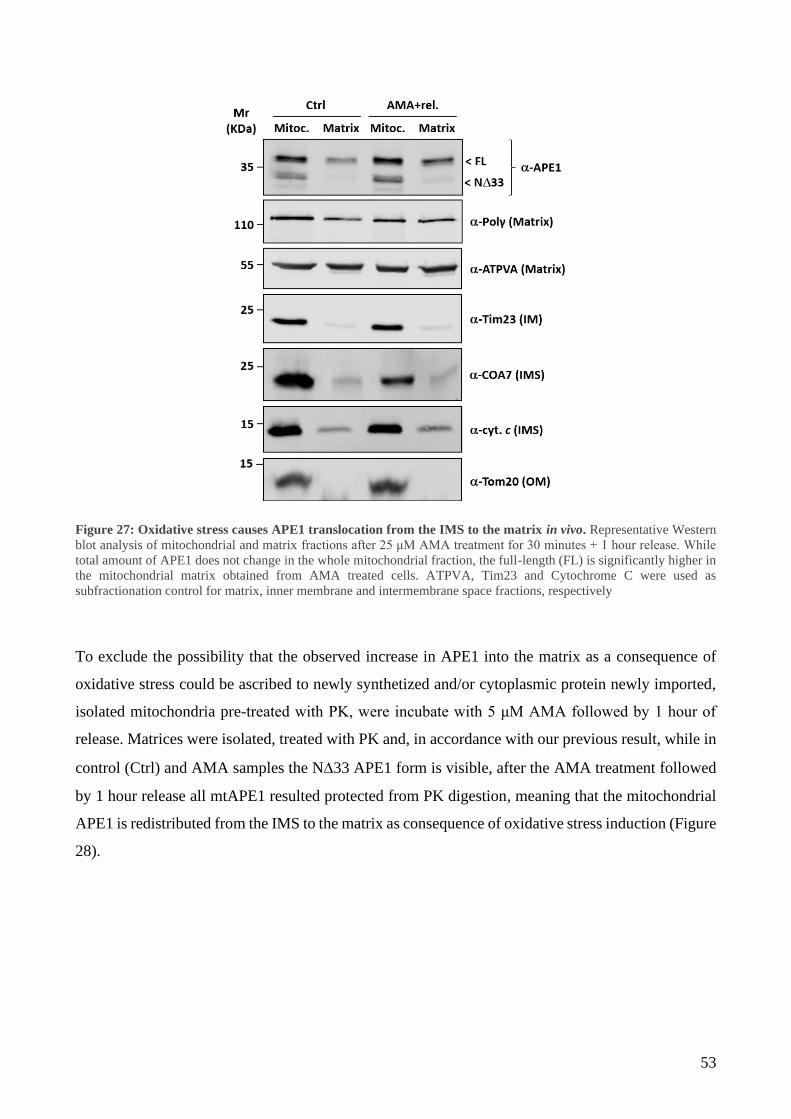
53
Figure 27: Oxidative stress causes APE1 translocation from the IMS to the matrix in vivo. Representative Western
blot analysis of mitochondrial and matrix fractions after 25 μM AMA treatment for 30 minutes + 1 hour release. While
total amount of APE1 does not change in the whole mitochondrial fraction, the full-length (FL) is significantly higher in
the mitochondrial matrix obtained from AMA treated cells. ATPVA, Tim23 and Cytochrome C were used as
subfractionation control for matrix, inner membrane and intermembrane space fractions, respectively
To exclude the possibility that the observed increase in APE1 into the matrix as a consequence of
oxidative stress could be ascribed to newly synthetized and/or cytoplasmic protein newly imported,
isolated mitochondria pre-treated with PK, were incubate with 5 μM AMA followed by 1 hour of
release. Matrices were isolated, treated with PK and, in accordance with our previous result, while in
control (Ctrl) and AMA samples the N33 APE1 form is visible, after the AMA treatment followed
by 1 hour release all mtAPE1 resulted protected from PK digestion, meaning that the mitochondrial
APE1 is redistributed from the IMS to the matrix as consequence of oxidative stress induction (Figure
28).
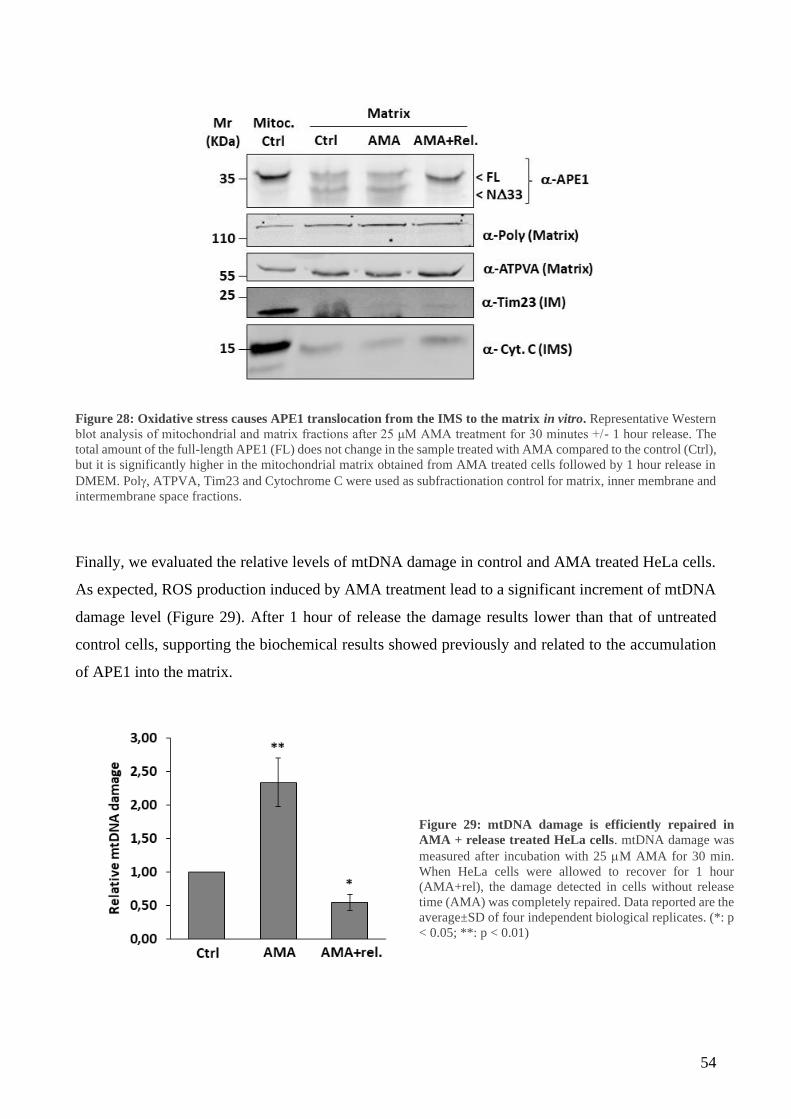
54
Figure 28: Oxidative stress causes APE1 translocation from the IMS to the matrix in vitro. Representative Western
blot analysis of mitochondrial and matrix fractions after 25 μM AMA treatment for 30 minutes +/- 1 hour release. The
total amount of the full-length APE1 (FL) does not change in the sample treated with AMA compared to the control (Ctrl),
but it is significantly higher in the mitochondrial matrix obtained from AMA treated cells followed by 1 hour release in
DMEM. Pol, ATPVA, Tim23 and Cytochrome C were used as subfractionation control for matrix, inner membrane and
intermembrane space fractions.
Finally, we evaluated the relative levels of mtDNA damage in control and AMA treated HeLa cells.
As expected, ROS production induced by AMA treatment lead to a significant increment of mtDNA
damage level (Figure 29). After 1 hour of release the damage results lower than that of untreated
control cells, supporting the biochemical results showed previously and related to the accumulation
of APE1 into the matrix.
Figure 29: mtDNA damage is efficiently repaired in
AMA + release treated HeLa cells. mtDNA damage was
measured after incubation with 25 M AMA for 30 min.
When HeLa cells were allowed to recover for 1 hour
(AMA+rel), the damage detected in cells without release
time (AMA) was completely repaired. Data reported are the
average±SD of four independent biological replicates. (*: p
< 0.05; **: p < 0.01)
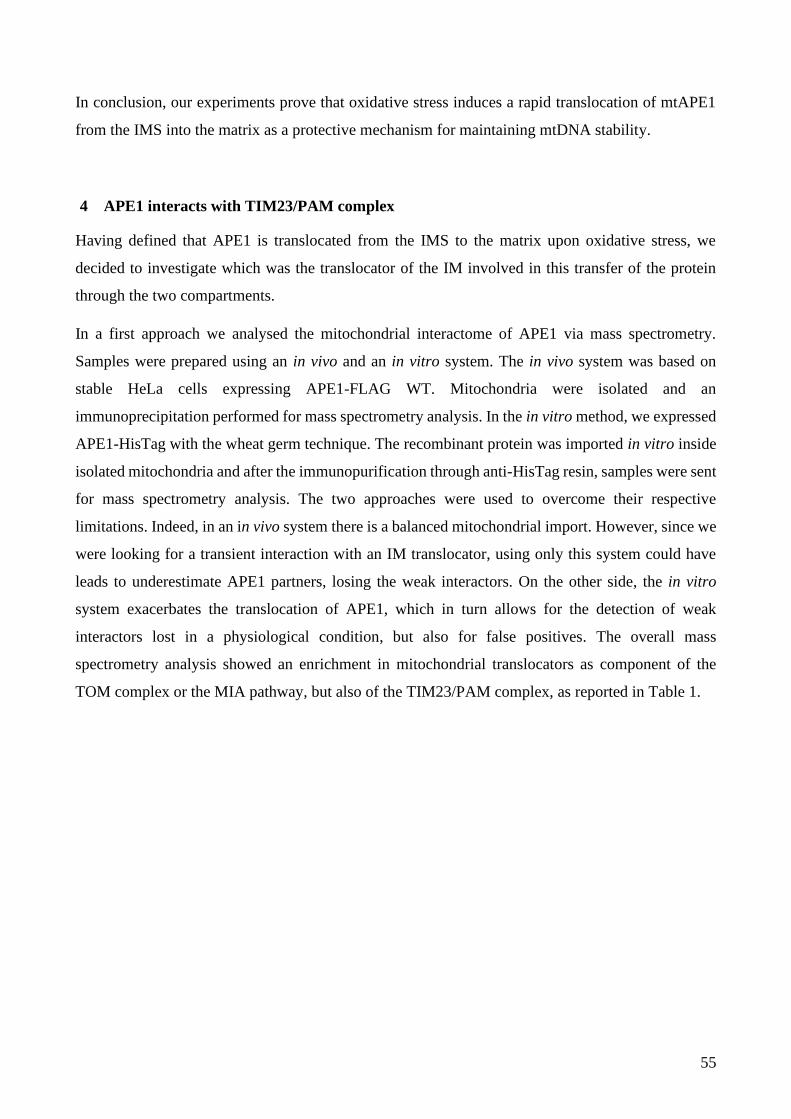
55
In conclusion, our experiments prove that oxidative stress induces a rapid translocation of mtAPE1
from the IMS into the matrix as a protective mechanism for maintaining mtDNA stability.
4 APE1 interacts with TIM23/PAM complex
Having defined that APE1 is translocated from the IMS to the matrix upon oxidative stress, we
decided to investigate which was the translocator of the IM involved in this transfer of the protein
through the two compartments.
In a first approach we analysed the mitochondrial interactome of APE1 via mass spectrometry.
Samples were prepared using an in vivo and an in vitro system. The in vivo system was based on
stable HeLa cells expressing APE1-FLAG WT. Mitochondria were isolated and an
immunoprecipitation performed for mass spectrometry analysis. In the in vitro method, we expressed
APE1-HisTag with the wheat germ technique. The recombinant protein was imported in vitro inside
isolated mitochondria and after the immunopurification through anti-HisTag resin, samples were sent
for mass spectrometry analysis. The two approaches were used to overcome their respective
limitations. Indeed, in an in vivo system there is a balanced mitochondrial import. However, since we
were looking for a transient interaction with an IM translocator, using only this system could have
leads to underestimate APE1 partners, losing the weak interactors. On the other side, the in vitro
system exacerbates the translocation of APE1, which in turn allows for the detection of weak
interactors lost in a physiological condition, but also for false positives. The overall mass
spectrometry analysis showed an enrichment in mitochondrial translocators as component of the
TOM complex or the MIA pathway, but also of the TIM23/PAM complex, as reported in Table 1.

56
PROTEIN NAME IN VIVO IN VITRO
TOM COMPLEX
TOMM40 + +
TOMM70 + +
TOMM22 +
TOMM70a +
TOMM20 +
IMS PROTEINS
TIMM8A + +
TIMM8B + +
TIMM10 +
TIMM13 +
TIMM9 +
Mia40/CHCHD4.1 +
GFER/ALR +
TIM 23 COMPLEX TIMM50 +
PAM COMPLEX
DNAJc19/TIMM14 +
TIMM44 +
PAM16 +
GrpE1 + +
GrpE2 +
Mortalin +
Table 1: APE1 mitochondrial interactome enrichment detected via mass spectrometry. The two approaches used to
prepare the samples for the mass spectrometry show the ability of APE1 to interact with several proteins of translocation
complexes located in the different mitochondrial compartment.
To deepen our investigation, another in vitro in organello import experiment was settled, using APE-
HisTag recombinant protein incubated with isolated mitochondria from HEK293. After incubation,
mitochondria were treated with PK to degrade proteins not imported and lysed under native condition
to preserve protein/protein interactions. Input, eluate, and unbound fractions from control (Mock) and
APE1-HisTag affinity purified (AfP) samples were separated onto SDS-PAGE and analysed by
Western blotting. Figure 30 illustrates the enrichment of Tim23 (TIM23 complex), mtHSP70 (PAM
motor complex,) and DNAJc19 (PAM motor complex) proteins in the eluate of the AfP fraction,
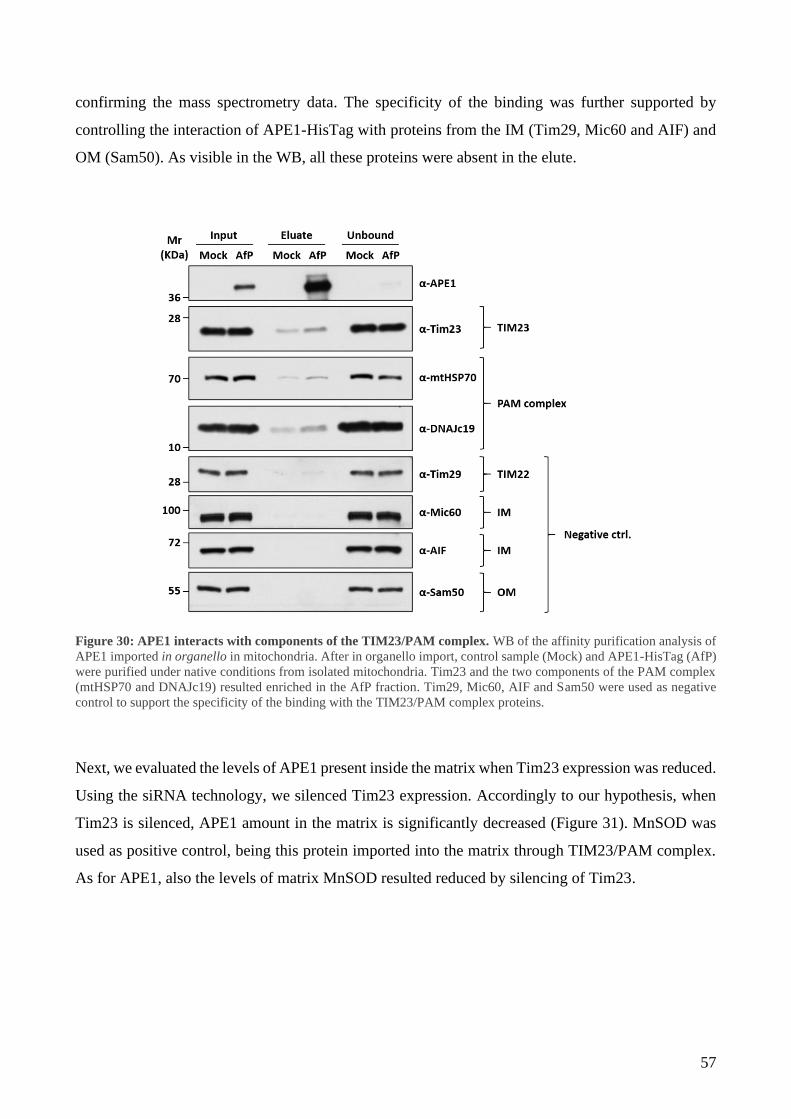
57
confirming the mass spectrometry data. The specificity of the binding was further supported by
controlling the interaction of APE1-HisTag with proteins from the IM (Tim29, Mic60 and AIF) and
OM (Sam50). As visible in the WB, all these proteins were absent in the elute.
Figure 30: APE1 interacts with components of the TIM23/PAM complex. WB of the affinity purification analysis of
APE1 imported in organello in mitochondria. After in organello import, control sample (Mock) and APE1-HisTag (AfP)
were purified under native conditions from isolated mitochondria. Tim23 and the two components of the PAM complex
(mtHSP70 and DNAJc19) resulted enriched in the AfP fraction. Tim29, Mic60, AIF and Sam50 were used as negative
control to support the specificity of the binding with the TIM23/PAM complex proteins.
Next, we evaluated the levels of APE1 present inside the matrix when Tim23 expression was reduced.
Using the siRNA technology, we silenced Tim23 expression. Accordingly to our hypothesis, when
Tim23 is silenced, APE1 amount in the matrix is significantly decreased (Figure 31). MnSOD was
used as positive control, being this protein imported into the matrix through TIM23/PAM complex.
As for APE1, also the levels of matrix MnSOD resulted reduced by silencing of Tim23.

58
Figure 31: Silencing of Tim23 interferes with APE1 translocation into the matrix. On the WB (left) it is possible to
observe how the transient silencing of Tim23 negatively affects APE1 presence in the matrix. The matrix protein MnSOD
was used as positive control, while ATPVA, RESA1 and Tom20 were used as subfractionation control for matrix,
intermembrane space and outer membrane, respectively. The graph (right) shows the percentage of matrix APE1 and
MnSOD in control and siRNA cells respect to the total protein present in mitochondria after PK treatment. Data reported
are the average±SD of four independent biological replicates (*: p < 0.05; **: p < 0.01).
We demonstrated that oxidative stress rapidly induces a transfer of APE1 from the IMS to the matrix.
To support the biochemical data showed before (Figure 30), we performed a proximity ligation assay
(PLA), in order to study the kinetic of interaction of APE1 with the PAM motor complex protein
DNAJc19. DNAJc19 has a transmembrane segment and exposes four residues of the N-terminus to
the IMS side of the IM while the majority of the protein is located in the matrix side and therefore its
interaction with APE1 could occur only during its passage through TIM23 (Figure 32). The basal
interaction of the two proteins was incremented after 20 minutes of treatment (33±17 PLA dots/cell),
reaching a maximum after 30 minutes (55±15 PLA dots/cell). Once removed the stimulus, the number
of interactions decreased to basal levels, confirming that ROS production triggers a rapid distribution
of APE1 in the matrix as a mechanism to preserve mitochondrial genome integrity.
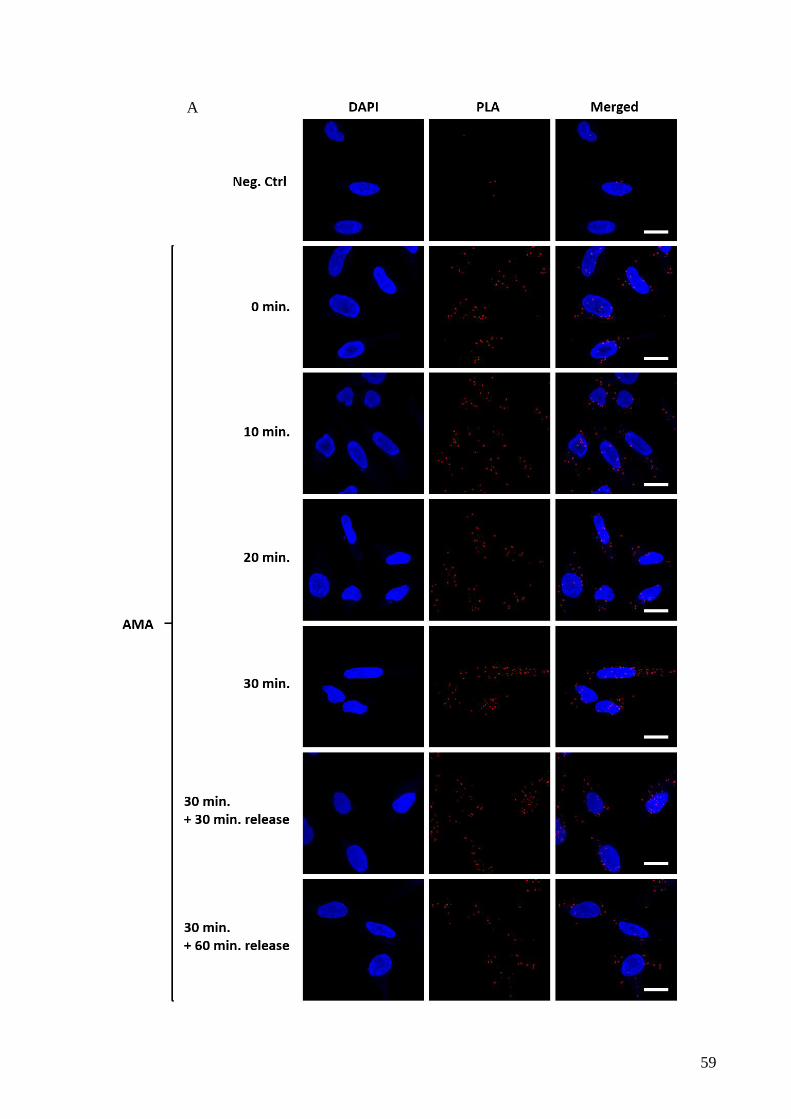
59
A
60
Figure 32: Oxidative stress induces translocation of APE1 into the matrix. A PLA was performed to evaluate the
interaction of APE1 with the PAM motor protein DNAJc19. Cells were treated with AMA for 10, 20, 30 minutes or 30
min + 30 min release, 30 min + 60 min release. (A) The panel shows a representative immunofluorescence of the PLA in
HeLa incubated for 30 minutes with AMA and for 30 minutes + 60 minutes release.(B) The box and whisker plot reports
the number of counted red dots indicating the interaction between APE1 and DNAJc19 over time in cells treated with
AMA. Data reported in the plot accounted for the average number of PLA signals of at least 35 randomly selected cells
per condition. Nuclei were stained with DAPI, while PLA signal is visible as red dots. White bar corresponded to 10 μm.
Similar images were obtained in other two independent experiments. Statistical significance was calculated versus
untreated cells. (n.s.: not significant; *: p < 0.05; **: p < 0.01).
5 Selective inhibition of TIM23 blocks APE1 trafficking preventing mtDNA repair
Stendomycin is an antifungal lipopeptide isolated from Streptomyces endus that can be used as a
potent and specific inhibitor of TIM23 complex in yeast and mammalian cells (224,225).
To rule out any import defect ascribable to mitochondrial membrane potential loss due to the
stendomycin treatment, HeLa cells were treated with the antifungal lipopeptide for 24 hours and
stained with MitoTracker Red (Figure 33). No loss of mitochondrial membrane potential (MMP) was
detected.
B
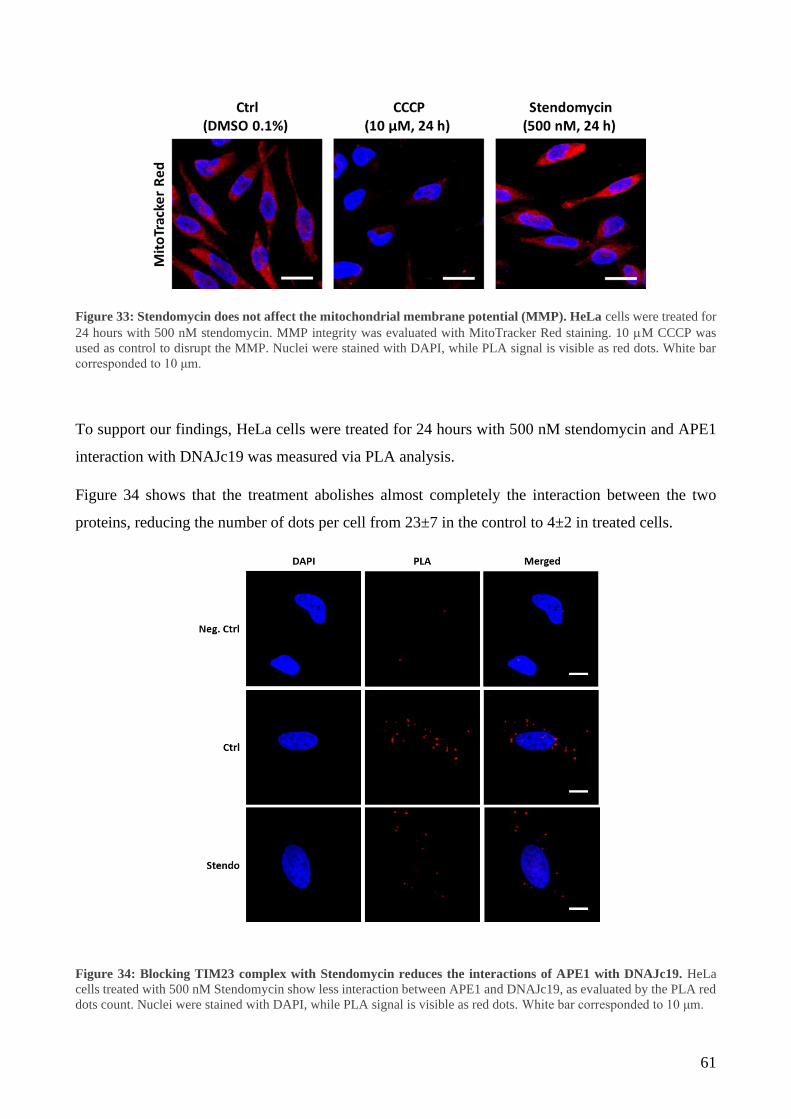
61
Figure 33: Stendomycin does not affect the mitochondrial membrane potential (MMP). HeLa cells were treated for
24 hours with 500 nM stendomycin. MMP integrity was evaluated with MitoTracker Red staining. 10 M CCCP was
used as control to disrupt the MMP. Nuclei were stained with DAPI, while PLA signal is visible as red dots. White bar
corresponded to 10 μm.
To support our findings, HeLa cells were treated for 24 hours with 500 nM stendomycin and APE1
interaction with DNAJc19 was measured via PLA analysis.
Figure 34 shows that the treatment abolishes almost completely the interaction between the two
proteins, reducing the number of dots per cell from 23±7 in the control to 4±2 in treated cells.
Figure 34: Blocking TIM23 complex with Stendomycin reduces the interactions of APE1 with DNAJc19. HeLa
cells treated with 500 nM Stendomycin show less interaction between APE1 and DNAJc19, as evaluated by the PLA red
dots count. Nuclei were stained with DAPI, while PLA signal is visible as red dots. White bar corresponded to 10 μm.

62
We also evaluated the mtDNA damage in cells where the TIM23 complex was inhibited by
stendomycin (Figure 35). For this purpose, after 24 hours incubation with 500 nM stendomycin, HeLa
cells were treated with 25 M AMA for 30 minutes and then growth for an additional hour in DMEM
(Stendo). HeLa cells not pre-treated with stendomycin were used as control (Ctrl).
Figure 35: mtDNA damage evaluation in Hela cells treated with stendomycin. mtDNA damage was evaluated in cells
treated or untreated with 500 nM stendomycin for 24 hours where oxidative stress was induced with 30 minutes AMA
treatment (AMA) followed by 1 hour of release (AMA+rel.). HeLa cells treated only with AMA show an increased level
of mtDNA damage, which is completely rescued after 1 hour of release. In stendomycin treated cells mtDNA damage
levels are unchanged, even in the presence of the oxidative stress caused by the AMA treatment. Data reported are the
average ± SD of three independent biological replicates. (*: p < 0.05; **: p < 0.01).
AMA treatment determines a significant increase in the levels of mtDNA damage which is rescued
after the release. On the contrary, cells pre-treated with stendomycin showed slightly increased, even
if not significant (p < 0.054), basal level of mtDNA damage (1.36 ± 0.23) that could be associated to
the mitochondrial stress induced by the inhibition of TIM23 determined by 24h stendomycin
treatment. The short treatment with AMA is not effective in inducing any rise in the levels of mtDNA
damage (1.19 ± 0.27). This could be explained considering that pre-treatment with stendomycin
induces mitochondrial stress triggering an adaptive response by enhancing repair mechanisms.
Interestingly, differently from the control cells where mtDNA lesions after AMA treatment were
lower than that untreated sample (0.47 ± 0.14), we did not observe the reduction of mtDNA damage
levels above the control upon release (1.21 ± 0.27) confirming that inhibition of TIM23 prevent the
IMS/matrix translocation of mtAPE1.
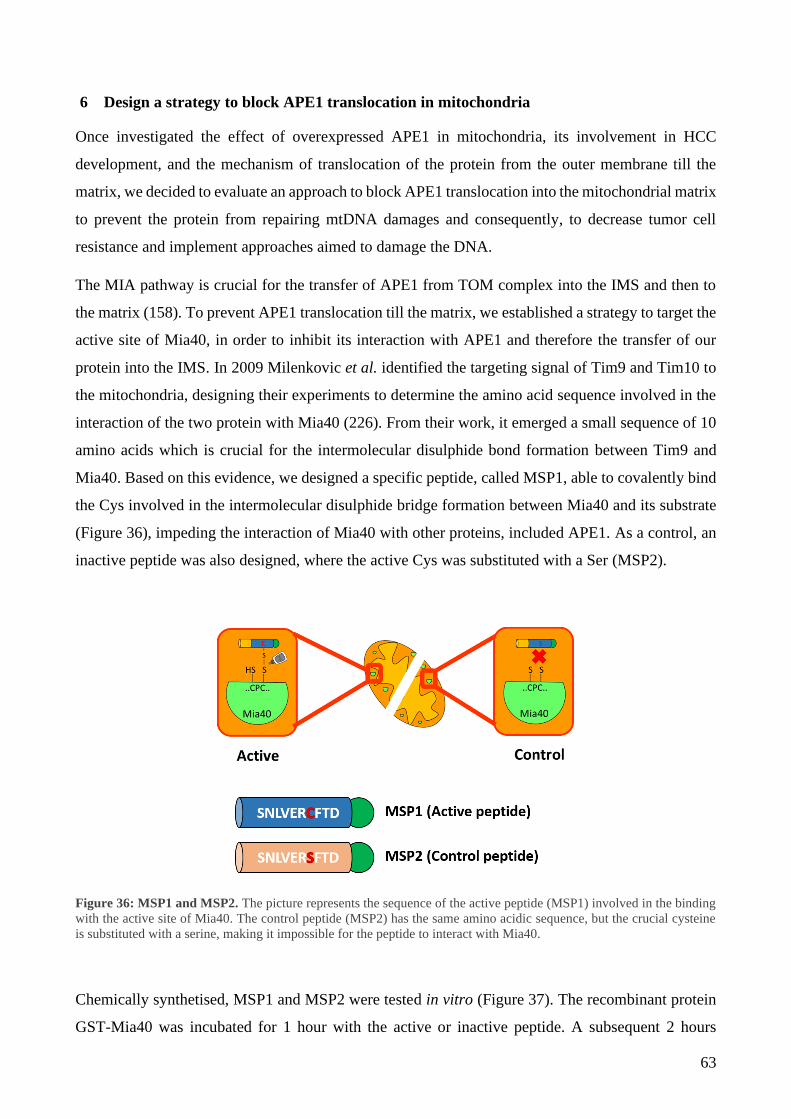
63
6 Design a strategy to block APE1 translocation in mitochondria
Once investigated the effect of overexpressed APE1 in mitochondria, its involvement in HCC
development, and the mechanism of translocation of the protein from the outer membrane till the
matrix, we decided to evaluate an approach to block APE1 translocation into the mitochondrial matrix
to prevent the protein from repairing mtDNA damages and consequently, to decrease tumor cell
resistance and implement approaches aimed to damage the DNA.
The MIA pathway is crucial for the transfer of APE1 from TOM complex into the IMS and then to
the matrix (158). To prevent APE1 translocation till the matrix, we established a strategy to target the
active site of Mia40, in order to inhibit its interaction with APE1 and therefore the transfer of our
protein into the IMS. In 2009 Milenkovic et al. identified the targeting signal of Tim9 and Tim10 to
the mitochondria, designing their experiments to determine the amino acid sequence involved in the
interaction of the two protein with Mia40 (226). From their work, it emerged a small sequence of 10
amino acids which is crucial for the intermolecular disulphide bond formation between Tim9 and
Mia40. Based on this evidence, we designed a specific peptide, called MSP1, able to covalently bind
the Cys involved in the intermolecular disulphide bridge formation between Mia40 and its substrate
(Figure 36), impeding the interaction of Mia40 with other proteins, included APE1. As a control, an
inactive peptide was also designed, where the active Cys was substituted with a Ser (MSP2).
Figure 36: MSP1 and MSP2. The picture represents the sequence of the active peptide (MSP1) involved in the binding
with the active site of Mia40. The control peptide (MSP2) has the same amino acidic sequence, but the crucial cysteine
is substituted with a serine, making it impossible for the peptide to interact with Mia40.
Chemically synthetised, MSP1 and MSP2 were tested in vitro (Figure 37). The recombinant protein
GST-Mia40 was incubated for 1 hour with the active or inactive peptide. A subsequent 2 hours

64
incubation with recombinant APE1 was performed and after precipitation in a GST-pulldown
experiment, samples were loaded on 12% SDS page. GST was used as control. As expected, the
incubation with MSP1 reduced drastically the interaction between GST-Mia40 and APE1.
Defined the efficacy of the peptide in blocking the active site of Mia40, preventing its interaction
with APE1, it was necessary to define a strategy to: (a) deliver the peptides into mitochondria; (b)
release the peptides in the IMS (Figure 38).
Figure 37: MSP1 inhibit the binding between Mia40 and APE1 in vitro. (A) Recombinant GST-Mia40 and APE1
interaction is abolished by the active peptide MSP1, as shown by the GST-pull down. MSP2 does not influence the
interaction of the two proteins. (B) The graph shows the percentage of APE1 detected in the GST-pull down experiment
after incubation with MSP1 or MSP2. **: p < 0.01
A B
**

65
To address the first issue, we included to our peptides sequences an N-terminal mitochondrial
targeting sequence, derived from the mitochondrial protein DIABLO. Targeting a protein or a peptide
into mitochondria is an establish process: specific plasmids containing MTS sequences are available,
making the whole process easy to be performed. For what concern the second issue, the question was
more challenging. MTS sequences usually lead the protein to the matrix, but for our purpose, it was
fundamental to target the peptides in the IMS. Taking advantage of the presence of the IMP peptidase
complex in the IMS (227), we decided to introduce after the MTS a sequence recognised by this
specific IMS peptidase. Once entered in the IMS, IMP peptidase complex would have cut our
peptides, removing the MTS and stalling the peptide in the IMS as desired.
To study the effect of the new designed MSP1 and MSP2, an in silico docking of Mia40 with MSP1
was performed using the online CABS-fold web server (Figure 39). The model confirmed the ability
of MSP1 to bind Mia40.
Figure 38: MSP1 and MSP2 design. To target the peptides into the IMS of mitochondria, an MTS sequence was added
to the N-term of MSP1 and MSP2 (red), followed by the IMP target sequence of DIABLO (yellow). Once in the IMS,
IMP complex cuts the IMP target sequence, releasing the peptide in the IMS, while the remaining MTS proceeds to the
matrix. At the C-term is present a FLAG tag (green).
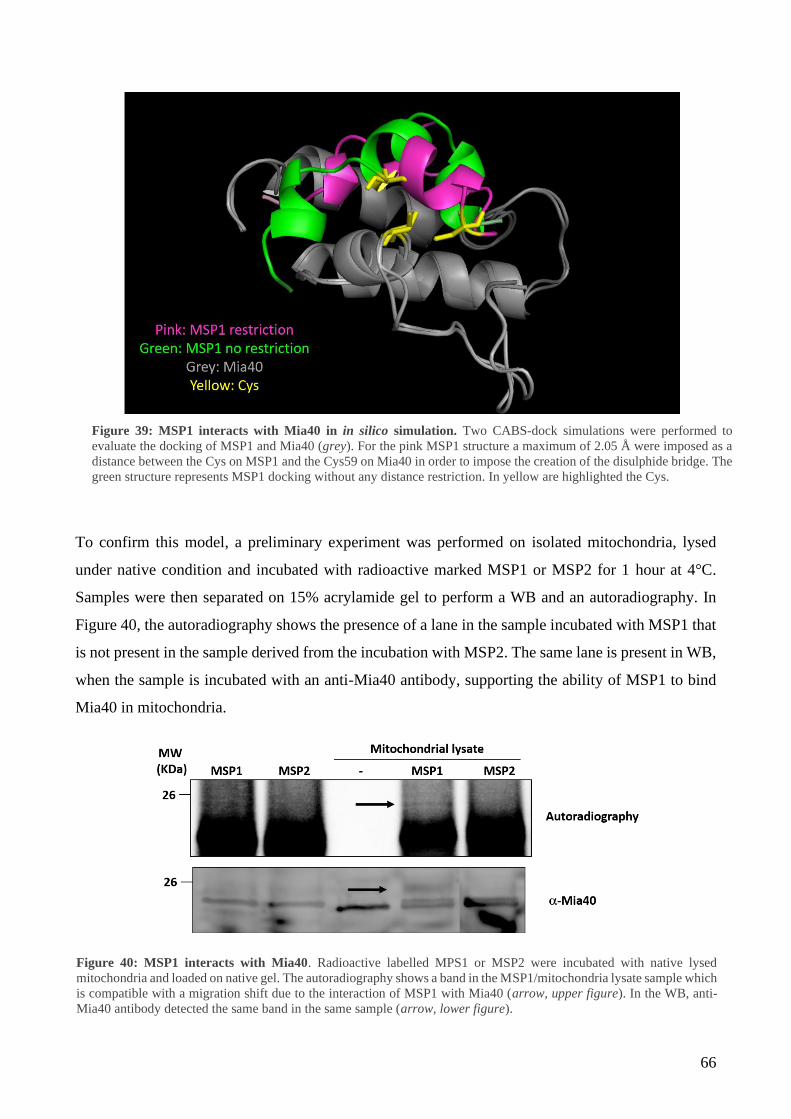
66
To confirm this model, a preliminary experiment was performed on isolated mitochondria, lysed
under native condition and incubated with radioactive marked MSP1 or MSP2 for 1 hour at 4°C.
Samples were then separated on 15% acrylamide gel to perform a WB and an autoradiography. In
Figure 40, the autoradiography shows the presence of a lane in the sample incubated with MSP1 that
is not present in the sample derived from the incubation with MSP2. The same lane is present in WB,
when the sample is incubated with an anti-Mia40 antibody, supporting the ability of MSP1 to bind
Mia40 in mitochondria.
Figure 39: MSP1 interacts with Mia40 in in silico simulation. Two CABS-dock simulations were performed to
evaluate the docking of MSP1 and Mia40 (grey). For the pink MSP1 structure a maximum of 2.05 Å were imposed as a
distance between the Cys on MSP1 and the Cys59 on Mia40 in order to impose the creation of the disulphide bridge. The
green structure represents MSP1 docking without any distance restriction. In yellow are highlighted the Cys.
Figure 40: MSP1 interacts with Mia40. Radioactive labelled MPS1 or MSP2 were incubated with native lysed
mitochondria and loaded on native gel. The autoradiography shows a band in the MSP1/mitochondria lysate sample which
is compatible with a migration shift due to the interaction of MSP1 with Mia40 (arrow, upper figure). In the WB, anti-
Mia40 antibody detected the same band in the same sample (arrow, lower figure).
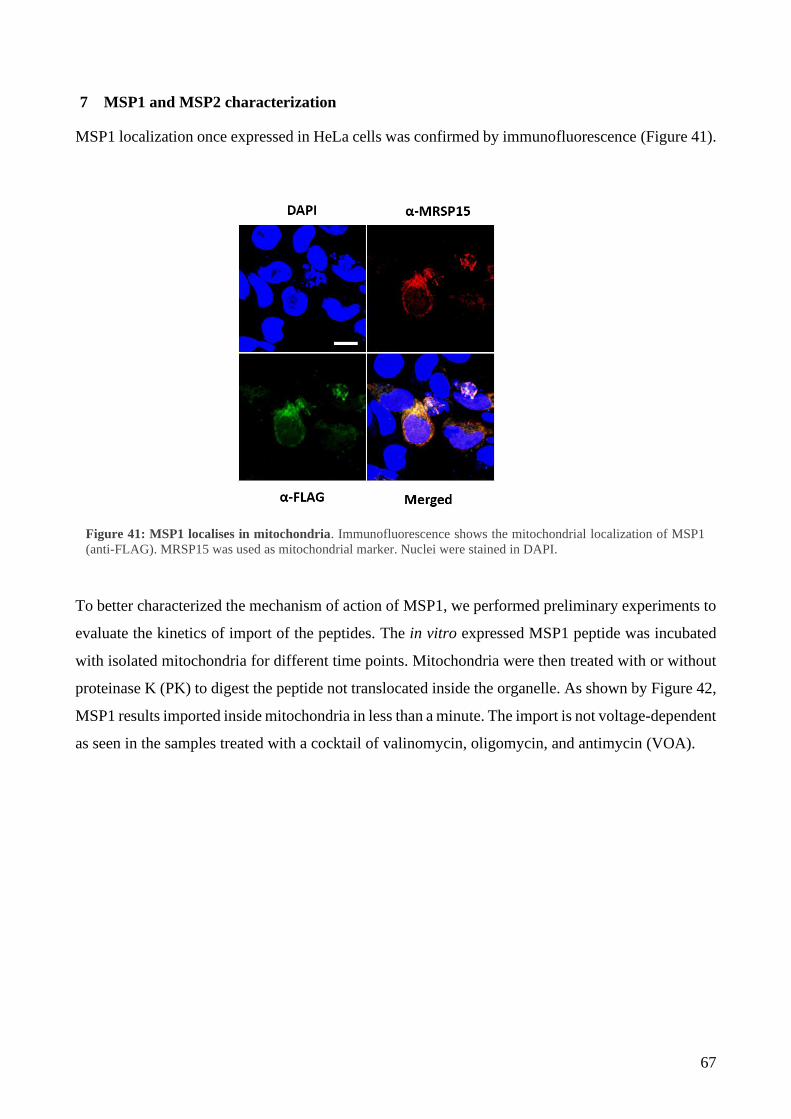
67
7 MSP1 and MSP2 characterization
MSP1 localization once expressed in HeLa cells was confirmed by immunofluorescence (Figure 41).
To better characterized the mechanism of action of MSP1, we performed preliminary experiments to
evaluate the kinetics of import of the peptides. The in vitro expressed MSP1 peptide was incubated
with isolated mitochondria for different time points. Mitochondria were then treated with or without
proteinase K (PK) to digest the peptide not translocated inside the organelle. As shown by Figure 42,
MSP1 results imported inside mitochondria in less than a minute. The import is not voltage-dependent
as seen in the samples treated with a cocktail of valinomycin, oligomycin, and antimycin (VOA).
Figure 41: MSP1 localises in mitochondria. Immunofluorescence shows the mitochondrial localization of MSP1
(anti-FLAG). MRSP15 was used as mitochondrial marker. Nuclei were stained in DAPI.
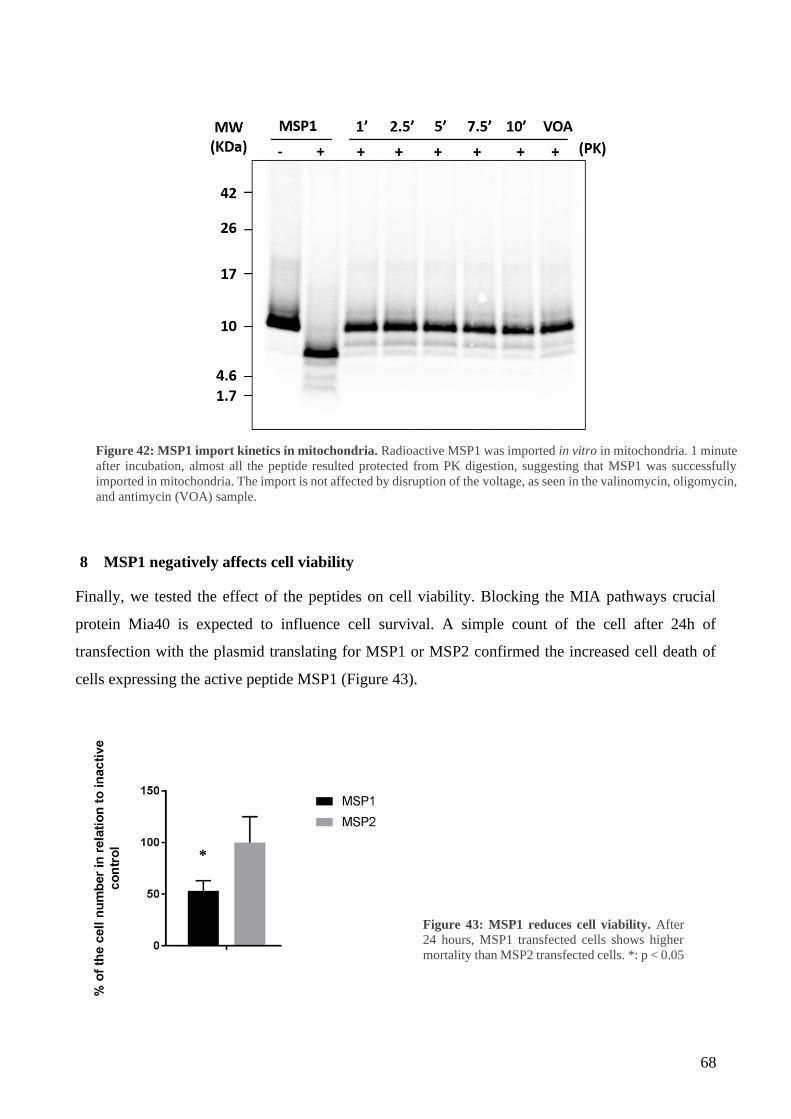
68
8 MSP1 negatively affects cell viability
Finally, we tested the effect of the peptides on cell viability. Blocking the MIA pathways crucial
protein Mia40 is expected to influence cell survival. A simple count of the cell after 24h of
transfection with the plasmid translating for MSP1 or MSP2 confirmed the increased cell death of
cells expressing the active peptide MSP1 (Figure 43).
Figure 42: MSP1 import kinetics in mitochondria. Radioactive MSP1 was imported in vitro in mitochondria. 1 minute
after incubation, almost all the peptide resulted protected from PK digestion, suggesting that MSP1 was successfully
imported in mitochondria. The import is not affected by disruption of the voltage, as seen in the valinomycin, oligomycin,
and antimycin (VOA) sample.
Figure 43: MSP1 reduces cell viability. After
24 hours, MSP1 transfected cells shows higher
mortality than MSP2 transfected cells. *: p < 0.05
*
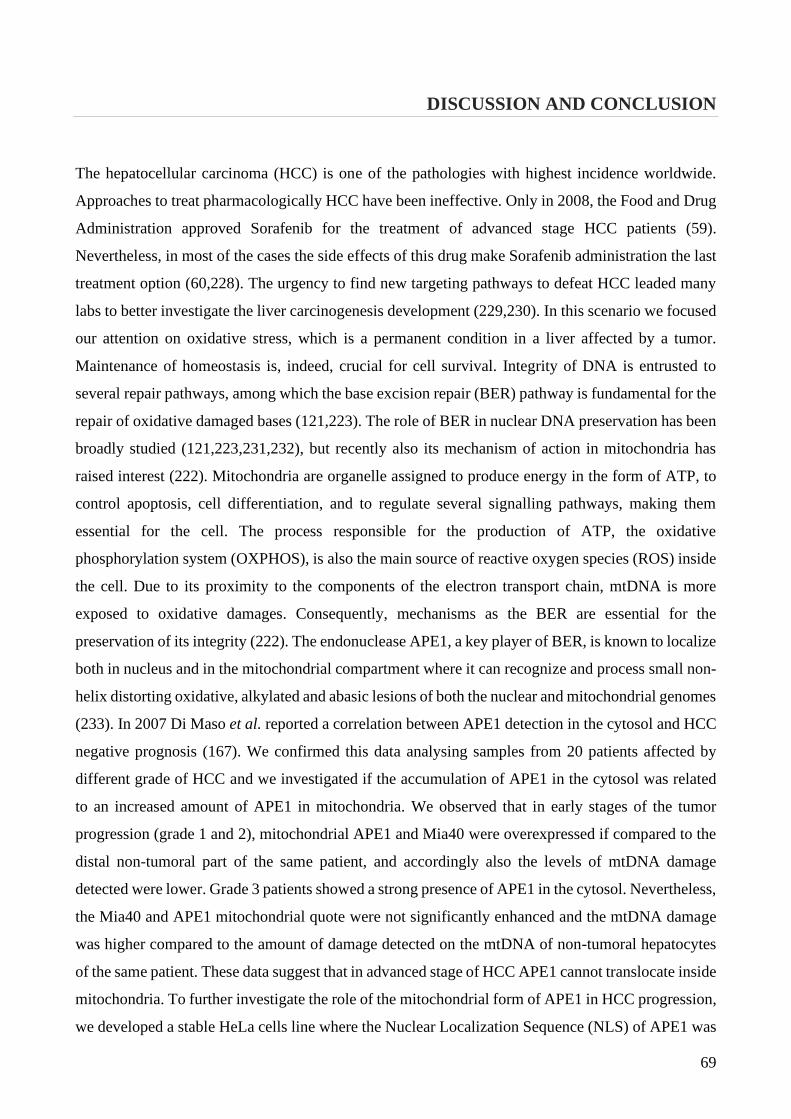
69
DISCUSSION AND CONCLUSION
The hepatocellular carcinoma (HCC) is one of the pathologies with highest incidence worldwide.
Approaches to treat pharmacologically HCC have been ineffective. Only in 2008, the Food and Drug
Administration approved Sorafenib for the treatment of advanced stage HCC patients (59).
Nevertheless, in most of the cases the side effects of this drug make Sorafenib administration the last
treatment option (60,228). The urgency to find new targeting pathways to defeat HCC leaded many
labs to better investigate the liver carcinogenesis development (229,230). In this scenario we focused
our attention on oxidative stress, which is a permanent condition in a liver affected by a tumor.
Maintenance of homeostasis is, indeed, crucial for cell survival. Integrity of DNA is entrusted to
several repair pathways, among which the base excision repair (BER) pathway is fundamental for the
repair of oxidative damaged bases (121,223). The role of BER in nuclear DNA preservation has been
broadly studied (121,223,231,232), but recently also its mechanism of action in mitochondria has
raised interest (222). Mitochondria are organelle assigned to produce energy in the form of ATP, to
control apoptosis, cell differentiation, and to regulate several signalling pathways, making them
essential for the cell. The process responsible for the production of ATP, the oxidative
phosphorylation system (OXPHOS), is also the main source of reactive oxygen species (ROS) inside
the cell. Due to its proximity to the components of the electron transport chain, mtDNA is more
exposed to oxidative damages. Consequently, mechanisms as the BER are essential for the
preservation of its integrity (222). The endonuclease APE1, a key player of BER, is known to localize
both in nucleus and in the mitochondrial compartment where it can recognize and process small non-
helix distorting oxidative, alkylated and abasic lesions of both the nuclear and mitochondrial genomes
(233). In 2007 Di Maso et al. reported a correlation between APE1 detection in the cytosol and HCC
negative prognosis (167). We confirmed this data analysing samples from 20 patients affected by
different grade of HCC and we investigated if the accumulation of APE1 in the cytosol was related
to an increased amount of APE1 in mitochondria. We observed that in early stages of the tumor
progression (grade 1 and 2), mitochondrial APE1 and Mia40 were overexpressed if compared to the
distal non-tumoral part of the same patient, and accordingly also the levels of mtDNA damage
detected were lower. Grade 3 patients showed a strong presence of APE1 in the cytosol. Nevertheless,
the Mia40 and APE1 mitochondrial quote were not significantly enhanced and the mtDNA damage
was higher compared to the amount of damage detected on the mtDNA of non-tumoral hepatocytes
of the same patient. These data suggest that in advanced stage of HCC APE1 cannot translocate inside
mitochondria. To further investigate the role of the mitochondrial form of APE1 in HCC progression,
we developed a stable HeLa cells line where the Nuclear Localization Sequence (NLS) of APE1 was
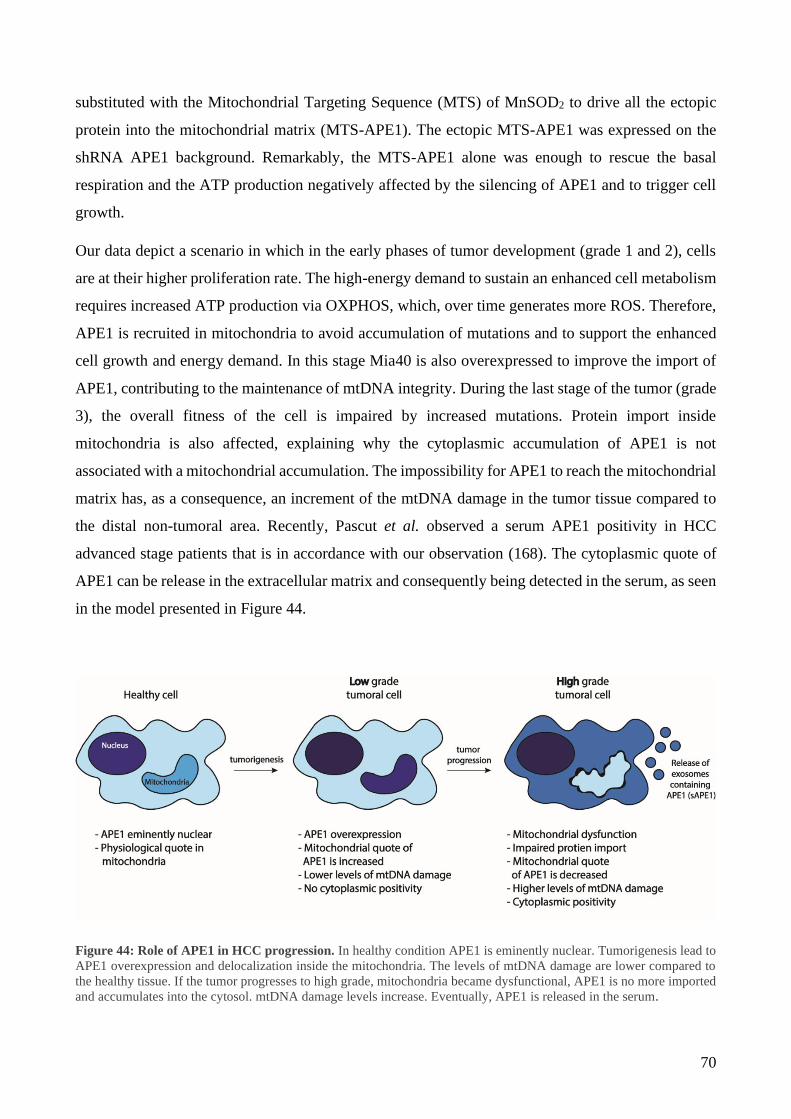
70
substituted with the Mitochondrial Targeting Sequence (MTS) of MnSOD2 to drive all the ectopic
protein into the mitochondrial matrix (MTS-APE1). The ectopic MTS-APE1 was expressed on the
shRNA APE1 background. Remarkably, the MTS-APE1 alone was enough to rescue the basal
respiration and the ATP production negatively affected by the silencing of APE1 and to trigger cell
growth.
Our data depict a scenario in which in the early phases of tumor development (grade 1 and 2), cells
are at their higher proliferation rate. The high-energy demand to sustain an enhanced cell metabolism
requires increased ATP production via OXPHOS, which, over time generates more ROS. Therefore,
APE1 is recruited in mitochondria to avoid accumulation of mutations and to support the enhanced
cell growth and energy demand. In this stage Mia40 is also overexpressed to improve the import of
APE1, contributing to the maintenance of mtDNA integrity. During the last stage of the tumor (grade
3), the overall fitness of the cell is impaired by increased mutations. Protein import inside
mitochondria is also affected, explaining why the cytoplasmic accumulation of APE1 is not
associated with a mitochondrial accumulation. The impossibility for APE1 to reach the mitochondrial
matrix has, as a consequence, an increment of the mtDNA damage in the tumor tissue compared to
the distal non-tumoral area. Recently, Pascut et al. observed a serum APE1 positivity in HCC
advanced stage patients that is in accordance with our observation (168). The cytoplasmic quote of
APE1 can be release in the extracellular matrix and consequently being detected in the serum, as seen
in the model presented in Figure 44.
Figure 44: Role of APE1 in HCC progression. In healthy condition APE1 is eminently nuclear. Tumorigenesis lead to
APE1 overexpression and delocalization inside the mitochondria. The levels of mtDNA damage are lower compared to
the healthy tissue. If the tumor progresses to high grade, mitochondria became dysfunctional, APE1 is no more imported
and accumulates into the cytosol. mtDNA damage levels increase. Eventually, APE1 is released in the serum.

71
Information about APE1 translocation inside mitochondria are still fragmentary and incomplete. To
date it is still undefined the process which leads APE1 to translocate from the nucleus to
mitochondria. What is known is the interaction of APE1 with the entry gate of the outer membrane
TOM and the essential role of residues Lys299 and Arg301 for this translocation (192). Moreover,
our laboratory studied the interactors of APE1 in the IMS and described the mechanism by which the
MIA pathway helps the translocation and the partial fold of APE1 (158). Indeed, we observed that,
although the mtDNA and all the BER enzymes are present within the matrix, the majority of APE1
resides into the IMS. This observation leaded us to investigate the mechanism by which APE1 is
recruited inside the matrix, particularly, to the identification of the IM translocator complex
interacting with APE1.
Initially, we set up the conditions to induce APE1’s IMS/matrix translocation, without altering the
total mitochondrial amount of APE1. Cells were incubated with different concentration of Antimycin
A (AMA), a known inhibitor of the OXPHOS, for 30 minutes to evaluate the ROS production and
the cell viability. 25 M concentration was chosen as optimal. Indeed, cells stimulated with 25 M
AMA showed increased oxidative stress, without evident effects on cell viability. On this background,
the total amount of mtAPE1 was not changed, suggesting that the stress induced by this concentration
of AMA is not sufficient to induce the translocation of newly synthetised protein. On the contrary, as
expected, the matrix full length quote of APE1 was significantly higher when compared to the matrix
APE1 present in the control after AMA treatment followed by 1 hour of recovery (Figure 28). In
agreement with this data, the mtDNA damage detected is reduced in AMA + release treated cells
compared to the untreated control cells (Figure 29). Our experiments strongly suggested that
oxidative stress induces a rapid translocation of APE1 from the IMS to the matrix as a protective
mechanism to maintain mtDNA integrity. To avoid the possibility that the increment in the matrix
APE1 observed was due to protein retained in close proximity of the outer surface of mitochondria
and translocated inside the organelle from the cytosol, we set up an in vitro mitochondria stimulation
with 5 M AMA followed by 1 hour of recovery. Isolated mitochondria were pre-treated with
proteinase k (PK) to digest all the external proteins. Mitochondria were then incubated with AMA
followed by 1 hour release, matrices were isolated, treated with PK, and the APE1 content was
estimated via WB. The hour of release was enough to implement the quote of APE1 in the matrix
(Figure 28), confirming the in vivo result.
Having defined that APE1 is stored into the IMS to be available immediately in case of oxidative
stress, we focused our attention on the channel involved in the transport of APE1 through the IM.
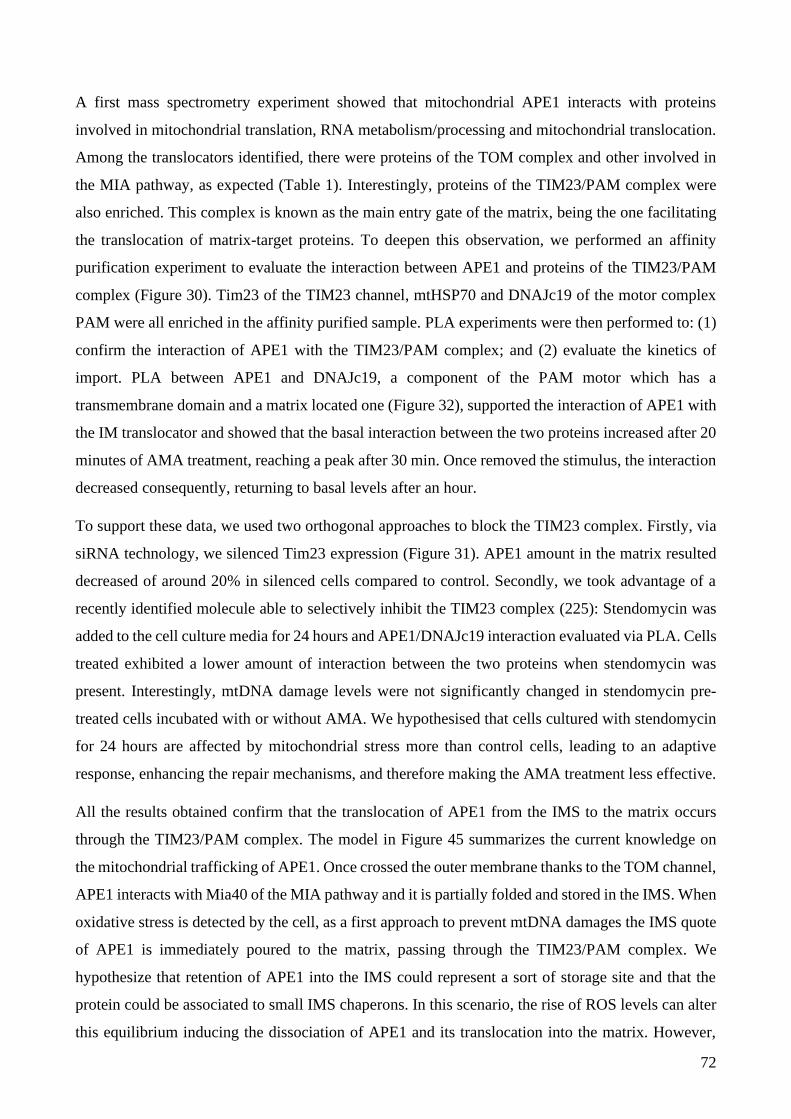
72
A first mass spectrometry experiment showed that mitochondrial APE1 interacts with proteins
involved in mitochondrial translation, RNA metabolism/processing and mitochondrial translocation.
Among the translocators identified, there were proteins of the TOM complex and other involved in
the MIA pathway, as expected (Table 1). Interestingly, proteins of the TIM23/PAM complex were
also enriched. This complex is known as the main entry gate of the matrix, being the one facilitating
the translocation of matrix-target proteins. To deepen this observation, we performed an affinity
purification experiment to evaluate the interaction between APE1 and proteins of the TIM23/PAM
complex (Figure 30). Tim23 of the TIM23 channel, mtHSP70 and DNAJc19 of the motor complex
PAM were all enriched in the affinity purified sample. PLA experiments were then performed to: (1)
confirm the interaction of APE1 with the TIM23/PAM complex; and (2) evaluate the kinetics of
import. PLA between APE1 and DNAJc19, a component of the PAM motor which has a
transmembrane domain and a matrix located one (Figure 32), supported the interaction of APE1 with
the IM translocator and showed that the basal interaction between the two proteins increased after 20
minutes of AMA treatment, reaching a peak after 30 min. Once removed the stimulus, the interaction
decreased consequently, returning to basal levels after an hour.
To support these data, we used two orthogonal approaches to block the TIM23 complex. Firstly, via
siRNA technology, we silenced Tim23 expression (Figure 31). APE1 amount in the matrix resulted
decreased of around 20% in silenced cells compared to control. Secondly, we took advantage of a
recently identified molecule able to selectively inhibit the TIM23 complex (225): Stendomycin was
added to the cell culture media for 24 hours and APE1/DNAJc19 interaction evaluated via PLA. Cells
treated exhibited a lower amount of interaction between the two proteins when stendomycin was
present. Interestingly, mtDNA damage levels were not significantly changed in stendomycin pre-
treated cells incubated with or without AMA. We hypothesised that cells cultured with stendomycin
for 24 hours are affected by mitochondrial stress more than control cells, leading to an adaptive
response, enhancing the repair mechanisms, and therefore making the AMA treatment less effective.
All the results obtained confirm that the translocation of APE1 from the IMS to the matrix occurs
through the TIM23/PAM complex. The model in Figure 45 summarizes the current knowledge on
the mitochondrial trafficking of APE1. Once crossed the outer membrane thanks to the TOM channel,
APE1 interacts with Mia40 of the MIA pathway and it is partially folded and stored in the IMS. When
oxidative stress is detected by the cell, as a first approach to prevent mtDNA damages the IMS quote
of APE1 is immediately poured to the matrix, passing through the TIM23/PAM complex. We
hypothesize that retention of APE1 into the IMS could represent a sort of storage site and that the
protein could be associated to small IMS chaperons. In this scenario, the rise of ROS levels can alter
this equilibrium inducing the dissociation of APE1 and its translocation into the matrix. However,

73
further studies are required to verify this hypothesis. A second and maybe more relevant question that
still require an answer is how APE1 is targeted into the nucleus rather than in mitochondria. Although
APE1 possesses an NLS at the N-terminal, both the nuclear and mitochondrial forms are full length,
and this exclude the proteolytical removal of the N-terminal as the mechanism to direct the protein
into the mitochondria. Our data proved that mitochondrial oxidative stress initially determined a rapid
IMS/matrix translocation of APE1 without any contribution of newly synthetized protein. However,
by prolonging the stimulus the total amount of APE1 into the mitochondria increased. A possible
explanation is that oxidative stress determines still unidentified post-translational modifications
responsible for directing newly synthetized APE1 into the mitochondria. A different scenario could
foresee the involvement of interacting proteins and a modification of APE1 interactome in response
to cell stimuli as a way for conveying the protein into the nucleus or mitochondria.
Figure 45: APE1 translocation inside mitochondria. (1) APE1 protein is translocated through the TOM complex.
(2) In the IMS it is recognised and partially folded by Mia40, which (3) releases the endonuclease in the IMS. When
oxidative stress is sensed by the cell (4a-b), APE1 is driven to the TIMM23/PAM complex (5) and released into the
matrix, where it can fulfill its role in the repair of mtDNA lesions (6).

74
Understanding the molecular mechanisms responsible for the intracellular trafficking of APE1 could
led at the development of innovative strategies for anticancer treatment based on interfering with
APE1 translocation. The last decade has been pivotal for the development of new therapies for a
plethora of pathologies, including cancer (234,235). Unfortunately, for the HCC there were not
significant improvement in the pharmacological therapies available. As said before, since 2008, the
standard approach to treat HCC when a surgical intervention is not possible is the administration of
Sorafenib, a kinase inhibitor with heavy side effects (59). This poor scenario leaded us to investigate
the possibility to develop a therapeutic strategy based on our findings about the crucial role of APE1
in mitochondria. Recently, combinational therapies obtained promising results in cancer treatments,
as in the case of neuroblastoma (236). Targeting with different approaches cancer cells seems to be
an effective method to cure a tumor. Chemotherapy agents in combination with a molecule able to
block the repair of DNA can be a successful approach. We decided therefore, to develop a strategy
able to block the entrance of APE1 into the mitochondrial matrix, to interfere with the mtDNA BER
activity. It is indeed known the importance of mitochondria in energy production, especially for a
cancer cell, whose metabolism is enhanced. Attacking the mtDNA stability blocking APE1
translocation into the matrix could weakness the aggressivity of a tumor cell and be beneficial in
combination with a drug targeting the DNA.
Mia40 is an essential component of the MIA pathway, involved in the interaction with APE1 during
its transfer from the OM inside the IMS. This interaction takes place thanks to a disulphide bond
formation between the Cys93 on APE1 and the Cys55 on Mia40. Cys55 is part of the CPC motif,
forming the catalytic domain of Mia40. When Mia40 interacts with one of its classical substrates, it
follow a sliding-docking model which involve 3 steps: (1) a dynamic hydrophobic interaction of
Mia40 with its substrate; (2) a docking forming a mixed disulphide bond intermediate between the
CXnC of the substrate and the CPC of Mia40 (nucleophilic attack); (3) a second nucleophilic attack
performed by the second Cys of the CXnC (237). Even though the mechanisms behind the second
nucleophilic attack have not been completely clarified, it is known the importance of the Mia40
catalytic domain. Blocking this domain abolishes the function of Mia40, disrupting the import and
folding of all its substrates, including APE1. In 2009 Milenkovic et al. identify the key sequence of
Tim10 involved in the binding with Mia40 (226). The MSP1 peptide synthetized based on this
sequence is able to covalently bind to Mia40, making the catalytic domain unavailable for any other
substrate as seen in in vitro experiments involving the recombinant proteins APE1 and Mia40 (Figure
37). We designed then a more complex MSP1, capable to localize into the IMS of mitochondria in in
vivo experiments, as summarized by Figure 46. MSP1 original amino acids’ sequence was
implemented with a mitochondrial targeting sequence, which contains a site recognised by IMP, a
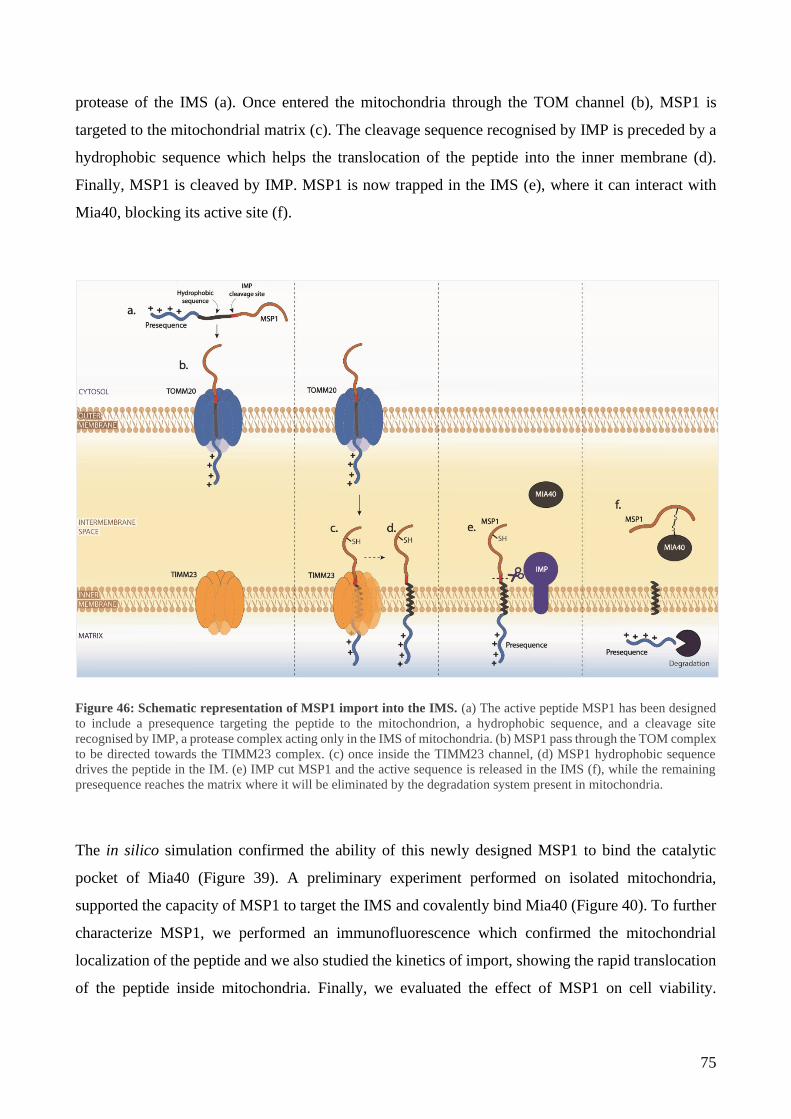
75
protease of the IMS (a). Once entered the mitochondria through the TOM channel (b), MSP1 is
targeted to the mitochondrial matrix (c). The cleavage sequence recognised by IMP is preceded by a
hydrophobic sequence which helps the translocation of the peptide into the inner membrane (d).
Finally, MSP1 is cleaved by IMP. MSP1 is now trapped in the IMS (e), where it can interact with
Mia40, blocking its active site (f).
Figure 46: Schematic representation of MSP1 import into the IMS. (a) The active peptide MSP1 has been designed
to include a presequence targeting the peptide to the mitochondrion, a hydrophobic sequence, and a cleavage site
recognised by IMP, a protease complex acting only in the IMS of mitochondria. (b) MSP1 pass through the TOM complex
to be directed towards the TIMM23 complex. (c) once inside the TIMM23 channel, (d) MSP1 hydrophobic sequence
drives the peptide in the IM. (e) IMP cut MSP1 and the active sequence is released in the IMS (f), while the remaining
presequence reaches the matrix where it will be eliminated by the degradation system present in mitochondria.
The in silico simulation confirmed the ability of this newly designed MSP1 to bind the catalytic
pocket of Mia40 (Figure 39). A preliminary experiment performed on isolated mitochondria,
supported the capacity of MSP1 to target the IMS and covalently bind Mia40 (Figure 40). To further
characterize MSP1, we performed an immunofluorescence which confirmed the mitochondrial
localization of the peptide and we also studied the kinetics of import, showing the rapid translocation
of the peptide inside mitochondria. Finally, we evaluated the effect of MSP1 on cell viability.

76
Incubation for 24 hours with the peptide negatively affect cell viability, supporting the effectiveness
of our approach in the sensibilization of cells to chemotherapy drug.
With our work we gave a hint of the possible approaches that can be used to better understand
mechanisms linked to tumor development and to target them to avoid tumor progression. Despite the
molecular details presented in this work, the study of the translocation of APE1 from the nucleus to
mitochondria requires a further investigation which could open the door to new promising therapeutic
tools in cancer therapy, as seen in the last part of this thesis.
77
LIST OF PUBLICATIONS
1. Mitochondrial apurinic/apyrimidinic endonuclease 1 enhances mtDNA repair
contributing to cell proliferation and mitochondrial integrity in early stages of
hepatocellular carcinoma
Veronica Bazzani, Arianna Barchiesi, Dorota Radecka, Riccardo Pravisani, Antonio
Guadagno, Carla Di Loreto, Umberto Baccarani, Carlo Vascotto
BMC Cancer 20, 969 (2020). https://doi.org/10.1186/s12885-020-07258-6
Hepatocellular carcinoma (HCC) is the leading cause of primary liver cancers. Surveillance
of individuals at specific risk of developing HCC, early diagnostic markers, and new
therapeutic approaches are essential to obtain a reduction in disease-related mortality.
Apurinic/apyrimidinic endonuclease 1 (APE1) expression levels and its cytoplasmic
localization have been reported to correlate with a lower degree of differentiation and shorter
survival rate. In this work we demonstrated that APE1's cytoplasmic positivity in Grades 1
and 2 HCC patients is linked to a significantly higher expression of mitochondrial APE1,
which accounted for lower levels of mtDNA damage observed in the tumor tissue with respect
to the distal area. In the contrast, the cytoplasmic positivity in Grade 3 was not associated with
APE1's mitochondrial accumulation even when accounting for the higher number of mtDNA
lesions measured. Moreover, we showed that loss of APE1 expression negatively affected
mitochondrial respiration, cell viability, and proliferation as well as levels of mtDNA damage.
Remarkably, the phenotype was efficiently rescued in MTS-APE1 clone, where APE1 is
present only within the mitochondrial matrix.
Our study confirms the prominent role of the mitochondrial form of APE1 in the early stages
of HCC development and the relevance of the non-nuclear fraction of APE1 in the disease
progression. We have also confirmed overexpression of Mia40 and the role of the MIA
pathway in the APE1 import process. Based on our data, inhibition of the APE1 transport by
blocking the MIA pathway could represent a new therapeutic approach for reducing
mitochondrial metabolism by preventing the efficient repair of mtDNA.
78
2. Mitochondrial oxidative stress induces rapid intermembrane space/matrix translocation
of Apurinic/apyrimidinic endonuclease 1 protein through the TIM23 complex
Arianna Barchiesi, Veronica Bazzani*, Vanessa Tolotto, Praveenraj Elancheliyan,
Michał Wasilewski, Agnieszka Chacinska, and Carlo Vascotto
In press to Journal of Molecular Biology
(*co-first author)
Mitochondria are essential cellular organelles that import the majority of proteins to sustain
their function in cellular metabolism and homeostasis. Due to their role in oxidative
phosphorylation, mitochondria are constantly affected by oxidative stress. Stability of
mitochondrial DNA (mtDNA) is essential for mitochondrial physiology and cellular well-
being and for this reasons mtDNA lesions have to be rapidly recognized and repaired. Base
excision repair (BER) is the main pathway responsible for repair non-helix distorting base
lesions both into the nucleus and in mitochondria. Apurinic/Apyrimidinic Endonuclease 1
(APE1) is a key component of BER pathway and the only protein that can recognize and
process an abasic (AP) site. Comprehensions of the mechanisms regulating APE1 intracellular
trafficking are still fragmentary. In this study we focused our attention on the mitochondrial
form of APE1 protein and how oxidative stress induce its translocation to maintain mtDNA
integrity. Our data proved that: (i) the rise of mitochondrial ROS determines a very rapid
translocation of APE1 from the intermembrane space (IMS) into the matrix; and (ii)
TIM23/PAM machinery complex is responsible for the matrix translocation of APE1.
Moreover, our data support the hypothesis that the IMS, were the majority of APE1 resides,
could represent a sort of storage site for the protein.
79
REFERENCES
1. GBD Results Tool | GHDx. Available at: http://ghdx.healthdata.org/gbd-results-tool
2. Zhu RX, Seto W-K, Lai C-L, Yuen M-F. Epidemiology of Hepatocellular Carcinoma in the
Asia-Pacific Region. Gut Liver. May 2016;10(3):332–9.
3. Lemoine M, Thursz MR. Battlefield against hepatitis B infection and HCC in Africa. J
Hepatol. 2017;66(3):645–54.
4. Harnois DM. Hepatitis C Virus Infection and the Rising Incidence of Hepatocellular
Carcinoma. Mayo Clin Proc. January 2012;87(1):7–8.
5. Petrick JL, Kelly SP, Altekruse SF, McGlynn KA, Rosenberg PS. Future of Hepatocellular
Carcinoma Incidence in the United States Forecast Through 2030. J Clin Oncol. 4 April 2016.
Available at: https://ascopubs.org/doi/pdf/10.1200/JCO.2015.64.7412
6. Tanaka H, Imai Y, Hiramatsu N, Ito Y, Imanaka K, Oshita M, et al. Declining incidence of
hepatocellular carcinoma in Osaka, Japan, from 1990 to 2003. Ann Intern Med. 3 June
2008;148(11):820–6.
7. Ashtari S, Pourhoseingholi MA, Sharifian A, Zali MR. Hepatocellular carcinoma in Asia:
Prevention strategy and planning. World J Hepatol. 28 June 2015;7(12):1708–17.
8. Tarao K, Nozaki A, Ikeda T, Sato A, Komatsu H, Komatsu T, et al. Real impact of liver
cirrhosis on the development of hepatocellular carcinoma in various liver diseases—meta‐analytic
assessment. Cancer Med. 21 February 2019;8(3):1054–65.
9. Sarbah SA, Gramlich T, Younoszai A, Osmack P, Goormastic M, Grosso L, et al. Risk factors
for hepatocellular carcinoma in patients with cirrhosis. Dig Dis Sci. May 2004;49(5):850–3.
10. Fujiwara N, Friedman SL, Goossens N, Hoshida Y. Risk factors and prevention of
hepatocellular carcinoma in the era of precision medicine. J Hepatol. March 2018;68(3):526–49.
11. Ganne-Carrié N, Nahon P. Hepatocellular carcinoma in the setting of alcohol-related liver
disease. J Hepatol. 1 February 2019;70(2):284–93.
12. Ismail BES, Cabrera R. Management of liver cirrhosis in patients with hepatocellular
carcinoma. Chin Clin Oncol. 11 December 2013;2(4):4.

80
13. Fattovich G, Giustina G, Degos F, Tremolada F, Diodati G, Almasio P, et al. Morbidity and
mortality in compensated cirrhosis type C: a retrospective follow-up study of 384 patients.
Gastroenterology. February 1997;112(2):463–72.
14. Hallager S, Ladelund S, Christensen PB, Kjær M, Thorup Roege B, Grønbæk KE, et al. Liver-
related morbidity and mortality in patients with chronic hepatitis C and cirrhosis with and without
sustained virologic response. Clin Epidemiol. 24 October 2017;9:501–16.
15. Navabakhsh B, Mehrabi N, Estakhri A, Mohamadnejad M, Poustchi H. Hepatitis B Virus
Infection during Pregnancy: Transmission and Prevention. Middle East J Dig Dis. September
2011;3(2):92–102.
16. Yang H-I, Yeh S-H, Chen P-J, Iloeje UH, Jen C-L, Su J, et al. Associations Between Hepatitis
B Virus Genotype and Mutants and the Risk of Hepatocellular Carcinoma. JNCI J Natl Cancer Inst.
20 August 2008;100(16):1134–43.
17. Hwang G-Y, Lin C-Y, Huang L-M, Wang Y-H, Wang J-C, Hsu C-T, et al. Detection of the
hepatitis B virus X protein (HBx) antigen and anti-HBx antibodies in cases of human hepatocellular
carcinoma. J Clin Microbiol. December 2003;41(12):5598–603.
18. Guerrieri F, Belloni L, Pediconi N, Levrero M. Molecular mechanisms of HBV-associated
hepatocarcinogenesis. Semin Liver Dis. May 2013;33(2):147–56.
19. Kanda T, Goto T, Hirotsu Y, Moriyama M, Omata M. Molecular Mechanisms Driving
Progression of Liver Cirrhosis towards Hepatocellular Carcinoma in Chronic Hepatitis B and C
Infections: A Review. Int J Mol Sci. 18 March 2019;20(6).
20. Tu T, Budzinska MA, Shackel NA, Urban S. HBV DNA Integration: Molecular Mechanisms
and Clinical Implications. Viruses. April 2017. Available at:
https://www.ncbi.nlm.nih.gov/pmc/articles/PMC5408681/
21. Yang L, Ye S, Zhao X, Ji L, Zhang Y, Zhou P, et al. Molecular Characterization of HBV DNA
Integration in Patients with Hepatitis and Hepatocellular Carcinoma. J Cancer. 2018;9(18):3225.
22. Yen C-J, Yang S-T, Chen R-Y, Huang W, Chayama K, Lee M-H, et al. Hepatitis B virus X
protein (HBx) enhances centrosomal P4.1-associated protein (CPAP) expression to promote
hepatocarcinogenesis. J Biomed Sci. 6 June 2019;26(1):44.
81
23. Messina JP, Humphreys I, Flaxman A, Brown A, Cooke GS, Pybus OG, et al. Global
Distribution and Prevalence of Hepatitis C Virus Genotypes. Hepatol Baltim Md. January
2015;61(1):77–87.
24. de Oliveria Andrade LJ, D’Oliveira A, Melo RC, De Souza EC, Costa Silva CA, Paraná R.
Association Between Hepatitis C and Hepatocellular Carcinoma. J Glob Infect Dis. 2009;1(1):33–7.
25. Paracha UZ, Fatima K, Alqahtani M, Chaudhary A, Abuzenadah A, Damanhouri G, et al.
Oxidative stress and hepatitis C virus. Virol J. 7 August 2013;10:251.
26. Sebastiani G, Gkouvatsos K, Pantopoulos K. Chronic hepatitis C and liver fibrosis. World J
Gastroenterol WJG. 28 August 2014;20(32):11033–53.
27. Yoon EJ, Hu K-Q. Hepatitis C Virus (HCV) Infection and Hepatic Steatosis. Int J Med Sci. 1
April 2006;3(2):53–6.
28. Zampino R, Marrone A, Restivo L, Guerrera B, Sellitto A, Rinaldi L, et al. Chronic HCV
infection and inflammation: Clinical impact on hepatic and extra-hepatic manifestations. World J
Hepatol. 27 October 2013;5(10):528–40.
29. Mahmoudvand S, Shokri S, Taherkhani R, Farshadpour F. Hepatitis C virus core protein
modulates several signaling pathways involved in hepatocellular carcinoma. World J Gastroenterol.
7 January 2019;25(1):42–58.
30. Heim MH. Innate immunity and HCV. J Hepatol. 1 March 2013;58(3):564–74.
31. Saha B, Szabo G. Innate immune cell networking in hepatitis C virus infection. J Leukoc Biol.
November 2014;96(5):757–66.
32. Purcell Y, Copin P, Paulatto L, Pommier R, Vilgrain V, Ronot M. Hepatocellular carcinoma
surveillance: Eastern and Western perspectives. Ultrasonography. July 2019;38(3):191–9.
33. Yang JD, Ahmed Mohammed H, Harmsen WS, Enders F, Gores GJ, Roberts LR. Recent
Trends in the Epidemiology of Hepatocellular Carcinoma in Olmsted County, Minnesota: A US
Population-based Study. J Clin Gastroenterol. September 2017;51(8):742–8.
34. Pflaum T, Hausler T, Baumung C, Ackermann S, Kuballa T, Rehm J, et al. Carcinogenic
compounds in alcoholic beverages: an update. Arch Toxicol. October 2016;90(10):2349–67.
35. Vandenbulcke H, Moreno C, Colle I, Knebel J-F, Francque S, Sersté T, et al. Alcohol intake
increases the risk of HCC in hepatitis C virus-related compensated cirrhosis: A prospective study. J
Hepatol. 2016;65(3):543–51.
82
36. Miranda-Mendez A, Lugo-Baruqui A, Armendariz-Borunda J. Molecular Basis and Current
Treatment for Alcoholic Liver Disease. Int J Environ Res Public Health. May 2010;7(5):1872–88.
37. MOST D, FERGUSON L, HARRIS RA. Molecular basis of alcoholism. Handb Clin Neurol.
2014;125:89–111.
38. Ohashi K, Pimienta M, Seki E. Alcoholic liver disease: A current molecular and clinical
perspective. Liver Res. 1 December 2018;2(4):161–72.
39. M R, M G, Nk M, Jp R, D V, La O, et al. Should Patients With NAFLD/NASH Be Surveyed
for HCC?. Vol. 103, Transplantation. Transplantation; 2019. Available at:
https://pubmed.ncbi.nlm.nih.gov/30080818/
40. S DM, C D, G S-B. From NAFLD to NASH and HCC: Pathogenetic Mechanisms and
Therapeutic Insights. Vol. 19, Current pharmaceutical design. Curr Pharm Des; 2013. Available at:
https://pubmed.ncbi.nlm.nih.gov/23394093/
41. Li X, Wang X, Gao P. Diabetes Mellitus and Risk of Hepatocellular Carcinoma. BioMed Res
Int. 2017;2017. Available at: https://www.ncbi.nlm.nih.gov/pmc/articles/PMC5742888/
42. Wang P, Kang D, Cao W, Wang Y, Liu Z. Diabetes mellitus and risk of hepatocellular
carcinoma: a systematic review and meta-analysis. Diabetes Metab Res Rev. February
2012;28(2):109–22.
43. Davila JA, Morgan RO, Shaib Y, McGlynn KA, El-Serag HB. Diabetes increases the risk of
hepatocellular carcinoma in the United States: a population based case control study. Gut. 1 April
2005;54(4):533–9.
44. Mantovani A, Targher G. Type 2 diabetes mellitus and risk of hepatocellular carcinoma:
spotlight on nonalcoholic fatty liver disease. Ann Transl Med. July 2017;5(13). Available at:
https://www.ncbi.nlm.nih.gov/pmc/articles/PMC5515814/
45. Saitta C, Pollicino T, Raimondo G. Obesity and liver cancer. Ann Hepatol. 1 November
2019;18(6):810–5.
46. Luyckx FH, Lefebvre PJ, Scheen AJ. Non-alcoholic steatohepatitis: association with obesity
and insulin resistance, and influence of weight loss. /data/revues/12623636/00260002/98/. 17
February 2008; Available at: https://www.em-consulte.com/en/article/79867
83
47. Rb P, Rj W, A, Sa H. Hepatocellular Carcinoma in the Setting of Non-cirrhotic Nonalcoholic
Fatty Liver Disease and the Metabolic Syndrome: US Experience. Vol. 60, Digestive diseases and
sciences. Dig Dis Sci; 2015. Available at: https://pubmed.ncbi.nlm.nih.gov/26250831/
48. Reuter S, Gupta SC, Chaturvedi MM, Aggarwal BB. Oxidative stress, inflammation, and
cancer: How are they linked? Free Radic Biol Med. 1 December 2010;49(11):1603–16.
49. Davalli P, Mitic T, Caporali A, Lauriola A, D’Arca D. ROS, Cell Senescence, and Novel
Molecular Mechanisms in Aging and Age-Related Diseases. Vol. 2016, Oxidative Medicine and
Cellular Longevity. Hindawi; 2016. pag. e3565127. Available at:
https://www.hindawi.com/journals/omcl/2016/3565127/
50. Simon H-U, Haj-Yehia A, Levi-Schaffer F. Role of reactive oxygen species (ROS) in
apoptosis induction. Apoptosis. 1 November 2000;5(5):415–8.
51. Aggarwal V, Tuli HS, Varol A, Thakral F, Yerer MB, Sak K, et al. Role of Reactive Oxygen
Species in Cancer Progression: Molecular Mechanisms and Recent Advancements. Biomolecules. 13
November 2019;9(11). Available at: https://www.ncbi.nlm.nih.gov/pmc/articles/PMC6920770/
52. Kumari S, Badana AK, G MM, G S, Malla R. Reactive Oxygen Species: A Key Constituent
in Cancer Survival. Biomark Insights. 6 February 2018;13. Available at:
https://www.ncbi.nlm.nih.gov/pmc/articles/PMC5808965/
53. Peiris-Pagès M, Martinez-Outschoorn UE, Sotgia F, Lisanti MP. Metastasis and Oxidative
Stress: Are Antioxidants a Metabolic Driver of Progression? Cell Metab. 1 December
2015;22(6):956–8.
54. Singh MK, Das BK, Choudhary S, Gupta D, Patil UK. Diabetes and hepatocellular carcinoma:
A pathophysiological link and pharmacological management. Biomed Pharmacother. 1 October
2018;106:991–1002.
55. Manna P, Jain SK. Obesity, Oxidative Stress, Adipose Tissue Dysfunction, and the Associated
Health Risks: Causes and Therapeutic Strategies. Metab Syndr Relat Disord. 1 December
2015;13(10):423–44.
56. Yu J, Shen J, Sun TT, Zhang X, Wong N. Obesity, insulin resistance, NASH and
hepatocellular carcinoma. Semin Cancer Biol. 1 December 2013;23(6, Part B):483–91.

84
57. Marra M, Sordelli IM, Lombardi A, Lamberti M, Tarantino L, Giudice A, et al. Molecular
targets and oxidative stress biomarkers in hepatocellular carcinoma: an overview. J Transl Med. 10
October 2011;9:171.
58. Bialecki ES, Di Bisceglie AM. Diagnosis of hepatocellular carcinoma. HPB. 2005;7(1):26–
34.
59. Llovet JM, Ricci S, Mazzaferro V, Hilgard P, Gane E, Blanc J-F, et al. Sorafenib in Advanced
Hepatocellular Carcinoma. N Engl J Med. 24 July 2008;359(4):378–90.
60. Raoul J-L, Adhoute X, Penaranda G, Perrier H, Castellani P, Oules V, et al. Sorafenib:
Experience and Better Management of Side Effects Improve Overall Survival in Hepatocellular
Carcinoma Patients: A Real-Life Retrospective Analysis. Liver Cancer. 2019;8(6):457–67.
61. Belghiti J, Kianmanesh R. Surgical treatment of hepatocellular carcinoma. HPB.
2005;7(1):42–9.
62. Testino G, Leone S, Borro P. Alcohol and hepatocellular carcinoma: A review and a point of
view. World J Gastroenterol WJG. 21 November 2014;20(43):15943–54.
63. Lim EJ, Torresi J. Prevention of hepatitis C virus infection and liver cancer. Recent Results
Cancer Res Fortschritte Krebsforsch Progres Dans Rech Sur Cancer. 2014;193:113–33.
64. Kao J-H. Hepatitis B vaccination and prevention of hepatocellular carcinoma. Best Pract Res
Clin Gastroenterol. December 2015;29(6):907–17.
65. Chien Y-C, Jan C-F, Kuo H-S, Chen C-J. Nationwide Hepatitis B Vaccination Program in
Taiwan: Effectiveness in the 20 Years After It Was Launched. Epidemiol Rev. 1 August
2006;28(1):126–35.
66. Bailey JR, Barnes E, Cox AL. Approaches, Progress, and Challenges to Hepatitis C Vaccine
Development. Gastroenterology. 2019;156(2):418–30.
67. Hoshida Y, Fuchs BC, Tanabe KK. Prevention of hepatocellular carcinoma: potential targets,
experimental models, and clinical challenges. Curr Cancer Drug Targets. 1 November
2012;12(9):1129–59.
68. Tang ZY, Yang BH. Secondary prevention of hepatocellular carcinoma. J Gastroenterol
Hepatol. December 1995;10(6):683–90.

85
69. Portolani N, Coniglio A, Ghidoni S, Giovanelli M, Benetti A, Tiberio GAM, et al. Early and
Late Recurrence After Liver Resection for Hepatocellular Carcinoma. Ann Surg. February
2006;243(2):229–35.
70. Muto Y, Moriwaki H, Ninomiya M, Adachi S, Saito A, Takasaki KT, et al. Prevention of
second primary tumors by an acyclic retinoid, polyprenoic acid, in patients with hepatocellular
carcinoma. Hepatoma Prevention Study Group. N Engl J Med. 13 June 1996;334(24):1561–7.
71. Zhuang L, Zeng X, Yang Z, Meng Z. Effect and Safety of Interferon for Hepatocellular
Carcinoma: A Systematic Review and Meta-Analysis. PLoS ONE. 17 September 2013. Available at:
https://www.ncbi.nlm.nih.gov/pmc/articles/PMC3775819/
72. Akateh C, Pawlik TM, Cloyd JM. Adjuvant antiviral therapy for the prevention of
hepatocellular carcinoma recurrence after liver resection: indicated for all patients with chronic
hepatitis B? Ann Transl Med. October 2018. Available at:
https://www.ncbi.nlm.nih.gov/pmc/articles/PMC6230855/
73. Lladó L, Figueras J. Techniques of orthotopic liver transplantation. HPB. 2004;6(2):69–75.
74. Samuel D, Colombo M, El-Serag H, Sobesky R, Heaton N. Toward optimizing the indications
for orthotopic liver transplantation in hepatocellular carcinoma. Liver Transplant Off Publ Am Assoc
Study Liver Dis Int Liver Transplant Soc. October 2011;17 Suppl 2:S6-13.
75. Murray KF, Carithers RL. AASLD practice guidelines: Evaluation of the patient for liver
transplantation. Hepatology. 2005;41(6):1407–32.
76. Apiratpracha W, Chailimpamontree W, Intraprasong P, Yoshida EM. Liver transplantation:
current indications and patient selection for adult patients with chronic liver disease. J Med Assoc
Thail Chotmaihet Thangphaet. October 2008;91(10):1623–32.
77. Lingiah VA, Niazi M, Olivo R, Paterno F, Guarrera JV, Pyrsopoulos NT. Liver
Transplantation Beyond Milan Criteria. J Clin Transl Hepatol. 28 March 2020;8(1):69–75.
78. Mazzaferro V, Bhoori S, Sposito C, Bongini M, Langer M, Miceli R, et al. Milan criteria in
liver transplantation for hepatocellular carcinoma: an evidence-based analysis of 15 years of
experience. Liver Transplant Off Publ Am Assoc Study Liver Dis Int Liver Transplant Soc. October
2011;17 Suppl 2:S44-57.
79. Milan Criteria for Liver Transplantation. MDCalc. Available at:
https://www.mdcalc.com/milan-criteria-liver-transplantation
86
80. Yao FY, Ferrell L, Bass NM, Watson JJ, Bacchetti P, Venook A, et al. Liver transplantation
for hepatocellular carcinoma: expansion of the tumor size limits does not adversely impact survival.
Hepatol Baltim Md. June 2001;33(6):1394–403.
81. Unek T, Karademir S, Arslan NC, Egeli T, Atasoy G, Sagol O, et al. Comparison of Milan
and UCSF criteria for liver transplantation to treat hepatocellular carcinoma. World J Gastroenterol
WJG. 7 October 2011;17(37):4206–12.
82. Jang JW, You CR, Kim CW, Bae SH, Yoon SK, Yoo YK, et al. Benefit of downsizing
hepatocellular carcinoma in a liver transplant population. Aliment Pharmacol Ther. 1 February
2010;31(3):415–23.
83. Zhu RX, Seto W-K, Lai C-L, Yuen M-F. Epidemiology of Hepatocellular Carcinoma in the
Asia-Pacific Region. Gut Liver. May 2016;10(3):332–9.
84. Kew MC. Epidemiology of hepatocellular carcinoma in sub-Saharan Africa. Ann Hepatol. 1
March 2013;12(2):173–82.
85. Zamora-Valdes D, Taner T, Nagorney DM. Surgical Treatment of Hepatocellular Carcinoma.
Cancer Control J Moffitt Cancer Cent. 11 September 2017. Available at:
https://www.ncbi.nlm.nih.gov/pmc/articles/PMC5937244/
86. Carr BI, Guerra V. Serum albumin levels in relation to tumor parameters in hepatocellular
carcinoma patients. Int J Biol Markers. 31 October 2017;32(4):e391–6.
87. Poon RT-P, Fan ST, Lo CM, Liu CL, Wong J. Long-Term Survival and Pattern of Recurrence
After Resection of Small Hepatocellular Carcinoma in Patients With Preserved Liver Function. Ann
Surg. March 2002;235(3):373–82.
88. Si T, Chen Y, Ma D, Gong X, Guan R, Shen B, et al. Transarterial chemoembolization prior
to liver transplantation for patients with hepatocellular carcinoma: A meta-analysis. J Gastroenterol
Hepatol. July 2017;32(7):1286–94.
89. Titano J, Noor A, Kim E. Transarterial Chemoembolization and Radioembolization across
Barcelona Clinic Liver Cancer Stages. Semin Interv Radiol. June 2017;34(2):109–15.
90. Xu Z, Xie H, Zhou L, Chen X, Zheng S. The Combination Strategy of Transarterial
Chemoembolization and Radiofrequency Ablation or Microwave Ablation against Hepatocellular
Carcinoma. Anal Cell Pathol Amst. 2019;2019:8619096.
87
91. Shiina S, Yasuda H, Muto H, Tagawa K, Unuma T, Ibukuro K, et al. Percutaneous ethanol
injection in the treatment of liver neoplasms. AJR Am J Roentgenol. November 1987;149(5):949–
52.
92. Weis S, Franke A, Berg T, Mössner J, Fleig WE, Schoppmeyer K. Percutaneous ethanol
injection or percutaneous acetic acid injection for early hepatocellular carcinoma. Cochrane Database
Syst Rev. 26 January 2015;1:CD006745.
93. Licata A, Di Marco V, Parisi P, Latteri F, Nebbia ME, Cabibbo G, et al. Radio-frequency
thermal ablation (RFTA) of small hepatocellular carcinoma in patients with cirrhosis. Experience at
a single tertiary referral center. Minerva Gastroenterol Dietol. June 2005;51(2):171–8.
94. Tsurusaki M, Murakami T. Surgical and Locoregional Therapy of HCC: TACE. Liver Cancer.
September 2015;4(3):165–75.
95. Jiang B-G, Wang N, Huang J, Yang Y, Sun L-L, Pan Z-Y, et al. Tumor SOCS3 methylation
status predicts the treatment response to TACE and prognosis in HCC patients. Oncotarget. 25 April
2017;8(17):28621–7.
96. Cescon M, Cucchetti A, Ravaioli M, Pinna AD. Hepatocellular carcinoma locoregional
therapies for patients in the waiting list. Impact on transplantability and recurrence rate. J Hepatol.
March 2013;58(3):609–18.
97. Yao FY, Mehta N, Flemming J, Dodge J, Hameed B, Fix O, et al. Downstaging of
hepatocellular cancer before liver transplant: Long-term outcome compared to tumors within Milan
criteria. Hepatology. 2015;61(6):1968–77.
98. Cervello M, Bachvarov D, Lampiasi N, Cusimano A, Azzolina A, McCubrey JA, et al.
Molecular mechanisms of sorafenib action in liver cancer cells. Cell Cycle Georget Tex. 1 August
2012;11(15):2843–55.
99. Kühlbrandt W. Structure and function of mitochondrial membrane protein complexes. BMC
Biol. 29 October 2015;13(1):89.
100. Wilson DF. Oxidative phosphorylation: regulation and role in cellular and tissue metabolism.
J Physiol. 2017;595(23):7023–38.
101. Taanman J-W. The mitochondrial genome: structure, transcription, translation and replication.
Biochim Biophys Acta BBA - Bioenerg. 9 February 1999;1410(2):103–23.
88
102. Falkenberg M. Mitochondrial DNA replication in mammalian cells: overview of the pathway.
Essays Biochem. 7 June 2018;62(3):287–96.
103. Garrido N, Griparic L, Jokitalo E, Wartiovaara J, van der Bliek AM, Spelbrink JN.
Composition and Dynamics of Human Mitochondrial Nucleoids. Mol Biol Cell. 7 December
2002;14(4):1583–96.
104. Yakes FM, Van Houten B. Mitochondrial DNA damage is more extensive and persists longer
than nuclear DNA damage in human cells following oxidative stress. Proc Natl Acad Sci U S A. 21
January 1997;94(2):514–9.
105. Shokolenko I, Venediktova N, Bochkareva A, Wilson GL, Alexeyev MF. Oxidative stress
induces degradation of mitochondrial DNA. Nucleic Acids Res. 1 May 2009;37(8):2539–48.
106. Holzerová E, Prokisch H. Mitochondria: Much ado about nothing? How dangerous is reactive
oxygen species production? Int J Biochem Cell Biol. June 2015;63:16–20.
107. Alán L, Špaček T, Pajuelo Reguera D, Jabůrek M, Ježek P. Mitochondrial nucleoid clusters
protect newly synthesized mtDNA during Doxorubicin- and Ethidium Bromide-induced
mitochondrial stress. Toxicol Appl Pharmacol. 1 July 2016. Available at:
https://www.osti.gov/biblio/22689192-mitochondrial-nucleoid-clusters-protect-newly-synthesized-
mtdna-during-doxorubicin-ethidium-bromide-induced-mitochondrial-stress
108. Lee SR, Han J. Mitochondrial Nucleoid: Shield and Switch of the Mitochondrial Genome.
Oxid Med Cell Longev. 2017. Available at:
https://www.ncbi.nlm.nih.gov/pmc/articles/PMC5478868/
109. Kazak L, Reyes A, Holt IJ. Minimizing the damage: repair pathways keep mitochondrial DNA
intact. Nat Rev Mol Cell Biol. October 2012;13(10):659–71.
110. Ryzhkova AI, Sazonova MA, Sinyov VV, Galitsyna EV, Chicheva MM, Melnichenko AA, et
al. Mitochondrial diseases caused by mtDNA mutations: a mini-review. Ther Clin Risk Manag. 9
October 2018;14:1933–42.
111. Chang X, Wu Y, Zhou J, Meng H, Zhang W, Guo J. A meta-analysis and systematic review
of Leigh syndrome: clinical manifestations, respiratory chain enzyme complex deficiency, and gene
mutations. Medicine (Baltimore). 31 January 2020. Available at:
https://www.ncbi.nlm.nih.gov/pmc/articles/PMC7004636/
89
112. Meyerson C, Van Stavern G, McClelland C. Leber hereditary optic neuropathy: current
perspectives. Clin Ophthalmol Auckl NZ. 26 June 2015;9:1165–76.
113. Henry C, Patel N, Shaffer W, Murphy L, Park J, Spieler B. Mitochondrial Encephalomyopathy
With Lactic Acidosis and Stroke-Like Episodes—MELAS Syndrome. Ochsner J. 2017;17(3):296–
301.
114. Finsterer J, Zarrouk-Mahjoub S, Shoffner JM. MERRF Classification: Implications for
Diagnosis and Clinical Trials. Pediatr Neurol. 2018;80:8–23.
115. Stewart JB, Chinnery PF. The dynamics of mitochondrial DNA heteroplasmy: implications
for human health and disease. Nat Rev Genet. September 2015;16(9):530–42.
116. Filograna R, Koolmeister C, Upadhyay M, Pajak A, Clemente P, Wibom R, et al. Modulation
of mtDNA copy number ameliorates the pathological consequences of a heteroplasmic mtDNA
mutation in the mouse. Sci Adv. 1 April 2019;5(4):eaav9824.
117. Vries D de, Wijs I de, Ruitenbeek W, Begeer J, Smit P, Bentlage H, et al. Extreme variability
of clinical symptoms among sibs in a MELAS family correlated with heteroplasmy for the
mitochondrial A3243G mutation. J Neurol Sci. 1 June 1994;124(1):77–82.
118. Bohr VA, Dianov GL. Oxidative DNA damage processing in nuclear and mitochondrial DNA.
Biochimie. February 1999;81(1–2):155–60.
119. Jacobs AL, Schär P. DNA glycosylases: in DNA repair and beyond. Chromosoma. February
2012;121(1):1–20.
120. Robertson AB, Klungland A, Rognes T, Leiros I. DNA Repair in Mammalian Cells. Cell Mol
Life Sci. 1 March 2009;66(6):981–93.
121. Sattler U, Frit P, Salles B, Calsou P. Long-patch DNA repair synthesis during base excision
repair in mammalian cells. EMBO Rep. April 2003;4(4):363–7.
122. Dahal S, Dubey S, Raghavan SC. Homologous recombination-mediated repair of DNA
double-strand breaks operates in mammalian mitochondria. Cell Mol Life Sci CMLS.
2018;75(9):1641–55.
123. Tadi SK, Sebastian R, Dahal S, Babu RK, Choudhary B, Raghavan SC. Microhomology-
mediated end joining is the principal mediator of double-strand break repair during mitochondrial
DNA lesions. Mol Biol Cell. 15 January 2016;27(2):223–35.
90
124. Mason PA, Matheson EC, Hall AG, Lightowlers RN. Mismatch repair activity in mammalian
mitochondria. Nucleic Acids Res. 1 February 2003;31(3):1052–8.
125. Martin SA, Lord CJ, Ashworth A. Therapeutic targeting of the DNA mismatch repair
pathway. Clin Cancer Res Off J Am Assoc Cancer Res. 1 November 2010;16(21):5107–13.
126. Ernster L, Schatz G. Mitochondria: a historical review. J Cell Biol. December 1981;91(3 Pt
2):227s–55s.
127. Hofmann JN, Hosgood HD, Liu C-S, Chow W-H, Shuch B, Cheng W-L, et al. A nested case-
control study of leukocyte mitochondrial DNA copy number and renal cell carcinoma in the Prostate,
Lung, Colorectal and Ovarian Cancer Screening Trial. Carcinogenesis. May 2014;35(5):1028–31.
128. Meierhofer D, Mayr JA, Fink K, Schmeller N, Kofler B, Sperl W. Mitochondrial DNA
mutations in renal cell carcinomas revealed no general impact on energy metabolism. Br J Cancer.
30 January 2006;94(2):268–74.
129. Xing J, Chen M, Wood CG, Lin J, Spitz MR, Ma J, et al. Mitochondrial DNA content: its
genetic heritability and association with renal cell carcinoma. J Natl Cancer Inst. 6 August
2008;100(15):1104–12.
130. Szczepanowska J, Malinska D, Wieckowski MR, Duszynski J. Effect of mtDNA point
mutations on cellular bioenergetics. Biochim Biophys Acta BBA - Bioenerg. 1 October
2012;1817(10):1740–6.
131. Guha M, Avadhani NG. Mitochondrial Retrograde Signaling at the crossroads of tumor
bioenergetics, genetics and epigenetics. Mitochondrion. November 2013. Available at:
https://www.ncbi.nlm.nih.gov/pmc/articles/PMC3832239/
132. Yang D, Kim J. Mitochondrial Retrograde Signalling and Metabolic Alterations in the
Tumour Microenvironment. Cells. 22 March 2019. Available at:
https://www.ncbi.nlm.nih.gov/pmc/articles/PMC6468901/
133. Yu M. Somatic mitochondrial DNA mutations in human cancers. Adv Clin Chem.
2012;57:99–138.
134. Hertweck KL, Dasgupta S. The Landscape of mtDNA Modifications in Cancer: A Tale of
Two Cities. Front Oncol. 2 November 2017. Available at:
https://www.ncbi.nlm.nih.gov/pmc/articles/PMC5673620/
91
135. Jiménez-Morales S, Pérez-Amado CJ, Langley E, Hidalgo-Miranda A. Overview of
mitochondrial germline variants and mutations in human disease: Focus on breast cancer (Review).
Int J Oncol. September 2018;53(3):923–36.
136. Taylor SD, Ericson NG, Burton JN, Prolla TA, Silber JR, Shendure J, et al. Targeted
enrichment and high-resolution digital profiling of mitochondrial DNA deletions in human brain.
Aging Cell. February 2014;13(1):29–38.
137. Chacinska A, Koehler CM, Milenkovic D, Lithgow T, Pfanner N. Importing Mitochondrial
Proteins: Machineries and Mechanisms. Cell. 21 August 2009;138(4):628–44.
138. Pfanner N, Geissler A. Versatility of the mitochondrial protein import machinery. Nat Rev
Mol Cell Biol. May 2001;2(5):339–49.
139. Harbauer AB, Zahedi RP, Sickmann A, Pfanner N, Meisinger C. The Protein Import
Machinery of Mitochondria—A Regulatory Hub in Metabolism, Stress, and Disease. Cell Metab. 4
March 2014;19(3):357–72.
140. Nuebel E, Manganas P, Tokatlidis K. Orphan proteins of unknown function in the
mitochondrial intermembrane space proteome: New pathways and metabolic cross-talk. Biochim
Biophys Acta. November 2016;1863(11):2613–23.
141. Omura T. Mitochondria-targeting sequence, a multi-role sorting sequence recognized at all
steps of protein import into mitochondria. J Biochem (Tokyo). June 1998;123(6):1010–6.
142. Mahendran KR, Romero-Ruiz M, Schlösinger A, Winterhalter M, Nussberger S. Protein
Translocation through Tom40: Kinetics of Peptide Release. Biophys J. 4 January 2012;102(1):39–
47.
143. Gakh O, Cavadini P, Isaya G. Mitochondrial processing peptidases. Biochim Biophys Acta. 2
September 2002;1592(1):63–77.
144. Stan T, Brix J, Schneider-Mergener J, Pfanner N, Neupert W, Rapaport D. Mitochondrial
Protein Import: Recognition of Internal Import Signals of BCS1 by the TOM Complex. Mol Cell
Biol. April 2003;23(7):2239–50.
145. Frazier AE, Chacinska A, Truscott KN, Guiard B, Pfanner N, Rehling P. Mitochondria Use
Different Mechanisms for Transport of Multispanning Membrane Proteins through the
Intermembrane Space. Mol Cell Biol. November 2003;23(21):7818–28.

92
146. Kovermann P, Truscott KN, Guiard B, Rehling P, Sepuri NB, Müller H, et al. Tim22, the
Essential Core of the Mitochondrial Protein Insertion Complex, Forms a Voltage-Activated and
Signal-Gated Channel. Mol Cell. 1 February 2002;9(2):363–73.
147. Rapaport D. How does the TOM complex mediate insertion of precursor proteins into the
mitochondrial outer membrane? J Cell Biol. 7 November 2005;171(3):419–23.
148. Höhr AIC, Straub SP, Warscheid B, Becker T, Wiedemann N. Assembly of β-barrel proteins
in the mitochondrial outer membrane. Biochim Biophys Acta BBA - Mol Cell Res. 1 January
2015;1853(1):74–88.
149. Doan KN, Grevel A, Mårtensson CU, Ellenrieder L, Thornton N, Wenz L-S, et al. The
Mitochondrial Import Complex MIM Functions as Main Translocase for α-Helical Outer Membrane
Proteins. Cell Rep. 28 April 2020;31(4):107567.
150. Stojanovski D, Müller JM, Milenkovic D, Guiard B, Pfanner N, Chacinska A. The MIA
system for protein import into the mitochondrial intermembrane space. Biochim Biophys Acta BBA
- Mol Cell Res. 1 April 2008;1783(4):610–7.
151. Gabriel K, Milenkovic D, Chacinska A, Müller J, Guiard B, Pfanner N, et al. Novel
mitochondrial intermembrane space proteins as substrates of the MIA import pathway. J Mol Biol.
19 January 2007;365(3):612–20.
152. Peleh V, Cordat E, Herrmann JM. Mia40 is a trans-site receptor that drives protein import into
the mitochondrial intermembrane space by hydrophobic substrate binding. eLife. Available at:
https://www.ncbi.nlm.nih.gov/pmc/articles/PMC4951193/
153. Banci L, Bertini I, Calderone V, Cefaro C, Ciofi-Baffoni S, Gallo A, et al. Molecular
recognition and substrate mimicry drive the electron-transfer process between MIA40 and ALR. Proc
Natl Acad Sci U S A. 22 March 2011;108(12):4811–6.
154. Chatzi A, Manganas P, Tokatlidis K. Oxidative folding in the mitochondrial intermembrane
space: A regulated process important for cell physiology and disease. Biochim Biophys Acta BBA -
Mol Cell Res. 1 June 2016;1863(6, Part A):1298–306.
155. Wrobel L, Trojanowska A, Sztolsztener ME, Chacinska A. Mitochondrial protein import:
Mia40 facilitates Tim22 translocation into the inner membrane of mitochondria. Mol Biol Cell. March
2013;24(5):543–54.
93
156. Chatzi A, Sideris DP, Katrakili N, Pozidis C, Tokatlidis K. Biogenesis of yeast Mia40 –
uncoupling folding from import and atypical recognition features. FEBS J. 2013;280(20):4960–9.
157. Longen S, Woellhaf MW, Petrungaro C, Riemer J, Herrmann JM. The Disulfide Relay of the
Intermembrane Space Oxidizes the Ribosomal Subunit Mrp10 on Its Transit into the Mitochondrial
Matrix. Dev Cell. 13 January 2014;28(1):30–42.
158. Barchiesi A, Wasilewski M, Chacinska A, Tell G, Vascotto C. Mitochondrial translocation of
APE1 relies on the MIA pathway. Nucleic Acids Res. 23 June 2015;43(11):5451–64.
159. Zhuang J, Wang P -y., Huang X, Chen X, Kang J-G, Hwang PM. Mitochondrial disulfide
relay mediates translocation of p53 and partitions its subcellular activity. Proc Natl Acad Sci. 22
October 2013;110(43):17356–61.
160. Bragoszewski P, Wasilewski M, Sakowska P, Gornicka A, Böttinger L, Qiu J, et al. Retro-
translocation of mitochondrial intermembrane space proteins. Proc Natl Acad Sci. 23 June
2015;112(25):7713–8.
161. Tell G, Quadrifoglio F, Tiribelli C, Kelley MR. The Many Functions of APE1/Ref-1: Not
Only a DNA Repair Enzyme. Antioxid Redox Signal. March 2009;11(3):601–19.
162. Kelley MR, Georgiadis MM, Fishel ML. APE1/Ref-1 Role in Redox Signaling: Translational
Applications of Targeting the Redox Function of the DNA Repair/Redox Protein APE1/Ref-1. Curr
Mol Pharmacol. 1 January 2012;5(1):36–53.
163. Sukhanova MV, Khodyreva SN, Lebedeva NA, Prasad R, Wilson SH, Lavrik OI. Human base
excision repair enzymes apurinic/apyrimidinic endonuclease1 (APE1), DNA polymerase β and
poly(ADP-ribose) polymerase 1: interplay between strand-displacement DNA synthesis and
proofreading exonuclease activity. Nucleic Acids Res. 2005;33(4):1222–9.
164. Chohan M, Mackedenski S, Li W-M, Lee CH. Human apurinic/apyrimidinic endonuclease 1
(APE1) has 3’ RNA phosphatase and 3’ exoribonuclease activities. J Mol Biol. 30 January
2015;427(2):298–311.
165. Kim W-C, King D, Lee CH. RNA-cleaving properties of human apurinic/apyrimidinic
endonuclease 1 (APE1). Int J Biochem Mol Biol. 10 March 2010;1(1):12–25.
166. Park MS, Kim C-S, Joo HK, Lee YR, Kang G, Kim SJ, et al. Cytoplasmic Localization and
Redox Cysteine Residue of APE1/Ref-1 Are Associated with Its Anti-Inflammatory Activity in
Cultured Endothelial Cells. Mol Cells. 30 November 2013;36(5):439–45.
94
167. Di Maso V, Avellini C, Crocè LS, Rosso N, Quadrifoglio F, Cesaratto L, et al. Subcellular
Localization of APE1/Ref-1 in Human Hepatocellular Carcinoma: Possible Prognostic Significance.
Mol Med. 2007;13(1–2):89–96.
168. Pascut D, Sukowati CHC, Antoniali G, Mangiapane G, Burra S, Mascaretti LG, et al. Serum
AP-endonuclease 1 (sAPE1) as novel biomarker for hepatocellular carcinoma. Oncotarget. 8 January
2019;10(3):383–94.
169. Zhang S, He L, Dai N, Guan W, Shan J, Yang X, et al. Serum APE1 as a predictive marker
for platinum-based chemotherapy of non-small cell lung cancer patients. Oncotarget. 2 November
2016;7(47):77482–94.
170. Ballista-Hernández J, Martínez-Ferrer M, Vélez R, Climent C, Sánchez-Vázquez MM, Torres
C, et al. Mitochondrial DNA Integrity Is Maintained by APE1 in Carcinogen-Induced Colorectal
Cancer. Mol Cancer Res MCR. 2017;15(7):831–41.
171. Poletto M, Vascotto C, Scognamiglio PL, Lirussi L, Marasco D, Tell G. Role of the
unstructured N-terminal domain of the hAPE1 (human apurinic/apyrimidinic endonuclease 1) in the
modulation of its interaction with nucleic acids and NPM1 (nucleophosmin). Biochem J. 15 June
2013;452(3):545–57.
172. López DJ, de Blas A, Hurtado M, García-Alija M, Mentxaka J, de la Arada I, et al.
Nucleophosmin interaction with APE1: Insights into DNA repair regulation. DNA Repair. 1 April
2020;88:102809.
173. Lirussi L, Antoniali G, Vascotto C, D’Ambrosio C, Poletto M, Romanello M, et al. Nucleolar
accumulation of APE1 depends on charged lysine residues that undergo acetylation upon genotoxic
stress and modulate its BER activity in cells. Mol Biol Cell. October 2012;23(20):4079–96.
174. Bhakat KK, Mantha AK, Mitra S. Transcriptional Regulatory Functions of Mammalian AP-
Endonuclease (APE1/Ref-1), an Essential Multifunctional Protein. Antioxid Redox Signal. March
2009;11(3):621–37.
175. S X, G M, F W, Yc P, T C. Redox activation of Fos-Jun DNA binding activity is mediated by
a DNA repair enzyme. Vol. 11, The EMBO journal. EMBO J; 1992. Available at:
https://pubmed.ncbi.nlm.nih.gov/1380454/
176. Jayaraman L, Murthy KG, Zhu C, Curran T, Xanthoudakis S, Prives C. Identification of
redox/repair protein Ref-1 as a potent activator of p53. Genes Dev. 1 March 1997;11(5):558–70.

95
177. Gaiddon C, Moorthy NC, Prives C. Ref-1 regulates the transactivation and pro-apoptotic
functions of p53 in vivo. EMBO J. 15 October 1999;18(20):5609–21.
178. Ema M, Hirota K, Mimura J, Abe H, Yodoi J, Sogawa K, et al. Molecular mechanisms of
transcription activation by HLF and HIF1alpha in response to hypoxia: their stabilization and redox
signal-induced interaction with CBP/p300. EMBO J. 1 April 1999;18(7):1905–14.
179. Mitomo K, Nakayama K, Fujimoto K, Sun X, Seki S, Yamamoto K. Two different cellular
redox systems regulate the DNA-binding activity of the p50 subunit of NF-kappa B in vitro. Gene. 5
August 1994;145(2):197–203.
180. Tell G, Pellizzari L, Cimarosti D, Pucillo C, Damante G. Ref-1 controls pax-8 DNA-binding
activity. Biochem Biophys Res Commun. 9 November 1998;252(1):178–83.
181. Tell G, Zecca A, Pellizzari L, Spessotto P, Colombatti A, Kelley MR, et al. An «environment
to nucleus» signaling system operates in B lymphocytes: redox status modulates BSAP/Pax-5
activation through Ref-1 nuclear translocation. Nucleic Acids Res. 1 March 2000;28(5):1099–105.
182. Vascotto C, Bisetto E, Li M, Zeef LAH, D’Ambrosio C, Domenis R, et al. Knock-in
reconstitution studies reveal an unexpected role of Cys-65 in regulating APE1/Ref-1 subcellular
trafficking and function. Mol Biol Cell. October 2011;22(20):3887–901.
183. Su D, Delaplane S, Luo M, Rempel DL, Vu B, Kelley MR, et al. Interactions of
apurinic/apyrimidinic endonuclease with a redox inhibitor: evidence for an alternate conformation of
the enzyme. Biochemistry. 11 January 2011;50(1):82–92.
184. Mol CD, Izumi T, Mitra S, Tainer JA. DNA-bound structures and mutants reveal abasic DNA
binding by APE1 and DNA repair coordination [corrected]. Nature. 27 January 2000;403(6768):451–
6.
185. Jp E, DM 3rd W. The role of Mg2+ and specific amino acid residues in the catalytic reaction
of the major human abasic endonuclease: new insights from EDTA-resistant incision of acyclic abasic
site analogs and site-directed mutagenesis. J Mol Biol. 1 July 1999;290(2):447–57.
186. Kanazhevskaya LY, Koval VV, Lomzov AA, Fedorova OS. The role of Asn-212 in the
catalytic mechanism of human endonuclease APE1: stopped-flow kinetic study of incision activity
on a natural AP site and a tetrahydrofuran analogue. DNA Repair. September 2014;21:43–54.
96
187. Lipton AS, Heck RW, Primak S, McNeill DR, Wilson DM, Ellis PD. Characterization of
Mg2+ Binding to the DNA Repair Protein Apurinic/Apyrimidic Endonuclease 1 (APE1) via Solid-
State 25Mg NMR Spectroscopy. J Am Chem Soc. 23 July 2008;130(29):9332–41.
188. Ramana CV, Boldogh I, Izumi T, Mitra S. Activation of apurinic/apyrimidinic endonuclease
in human cells by reactive oxygen species and its correlation with their adaptive response to
genotoxicity of free radicals. Proc Natl Acad Sci U S A. 28 April 1998;95(9):5061–6.
189. Torres-Gonzalez M, Gawlowski T, Kocalis H, Scott BT, Dillmann WH. Mitochondrial 8-
oxoguanine glycosylase decreases mitochondrial fragmentation and improves mitochondrial function
in H9C2 cells under oxidative stress conditions. Am J Physiol - Cell Physiol. 1 February
2014;306(3):C221–9.
190. Tell G, Damante G, Caldwell D, Kelley MR. The intracellular localization of APE1/Ref-1:
more than a passive phenomenon? Antioxid Redox Signal. April 2005;7(3–4):367–84.
191. Chattopadhyay R, Wiederhold L, Szczesny B, Boldogh I, Hazra TK, Izumi T, et al.
Identification and characterization of mitochondrial abasic (AP)-endonuclease in mammalian cells.
Nucleic Acids Res. 2006;34(7):2067–76.
192. Li M, Zhong Z, Zhu J, Xiang D, Dai N, Cao X, et al. Identification and Characterization of
Mitochondrial Targeting Sequence of Human Apurinic/Apyrimidinic Endonuclease 1. J Biol Chem.
14 May 2010;285(20):14871–81.
193. Qu J, Liu G-H, Huang B, Chen C. Nitric oxide controls nuclear export of APE1/Ref-1 through
S-nitrosation of Cysteines 93 and 310. Nucleic Acids Res. April 2007;35(8):2522–32.
194. Xanthoudakis S, Smeyne RJ, Wallace JD, Curran T. The redox/DNA repair protein, Ref-1, is
essential for early embryonic development in mice. Proc Natl Acad Sci U S A. 20 August
1996;93(17):8919–23.
195. Li M, Yang X, Lu X, Dai N, Zhang S, Cheng Y, et al. APE1 deficiency promotes cellular
senescence and premature aging features. Nucleic Acids Res. 20 June 2018;46(11):5664–77.
196. Fishel ML, Jiang Y, Rajeshkumar NV, Scandura G, Sinn AL, He Y, et al. Impact of
APE1/Ref-1 Redox Inhibition on Pancreatic Tumor Growth. Mol Cancer Ther. September
2011;10(9):1698–708.
97
197. Wen X, Lu R, Xie S, Zheng H, Wang H, Wang Y, et al. APE1 overexpression promotes the
progression of ovarian cancer and serves as a potential therapeutic target. Cancer Biomark Sect Dis
Markers. 26 September 2016;17(3):313–22.
198. Schindl M, Oberhuber G, Pichlbauer EG, Obermair A, Birner P, Kelley MR. DNA repair-
redox enzyme apurinic endonuclease in cervical cancer: evaluation of redox control of HIF-1alpha
and prognostic significance. Int J Oncol. October 2001;19(4):799–802.
199. Codrich M, Comelli M, Malfatti MC, Mio C, Ayyildiz D, Zhang C, et al. Inhibition of APE1-
endonuclease activity affects cell metabolism in colon cancer cells via a p53-dependent pathway.
DNA Repair. 2019;82:102675.
200. Di Maso V. Study of APE1/Ref-1 expression in human hepatocellular carcinoma. Evaluation
of its prognostic significance. Studio della espressione di APE1/Ref-1 nel carcinoma epatocellulare
Valutazione del suo significato prognostico. 21 April 2009; Available at:
http://www.openstarts.units.it/dspace/handle/10077/3133
201. Dai N, Cao X-J, Li M-X, Qing Y, Liao L, Lu X-F, et al. Serum APE1 Autoantibodies: A
Novel Potential Tumor Marker and Predictor of Chemotherapeutic Efficacy in Non-Small Cell Lung
Cancer. PLOS ONE. 5 March 2013;8(3):e58001.
202. Singh-Gupta V, Joiner MC, Runyan L, Yunker CK, Sarkar FH, Miller S, et al. Soy Isoflavones
Augment Radiation Effect by Inhibiting APE1/Ref-1 DNA Repair Activity in Non-small Cell Lung
Cancer. J Thorac Oncol. 1 April 2011;6(4):688–98.
203. Jia J-Y, Tan Z-G, Liu M, Jiang Y-G. Apurinic/apyrimidinic endonuclease 1 (APE1)
contributes to resveratrol‑induced neuroprotection against oxygen‑glucose deprivation and
re‑oxygenation injury in HT22 cells: Involvement in reducing oxidative DNA damage. Mol Med Rep.
1 December 2017;16(6):9786–94.
204. Kaur G, Cholia RP, Mantha AK, Kumar R. DNA Repair and Redox Activities and Inhibitors
of Apurinic/Apyrimidinic Endonuclease 1/Redox Effector Factor 1 (APE1/Ref-1): A Comparative
Analysis and Their Scope and Limitations toward Anticancer Drug Development. J Med Chem. 26
December 2014;57(24):10241–56.
205. Madhusudan S, Smart F, Shrimpton P, Parsons JL, Gardiner L, Houlbrook S, et al. Isolation
of a small molecule inhibitor of DNA base excision repair. Nucleic Acids Res. 2005;33(15):4711–
24.
98
206. Naidu MD, Agarwal R, Pena LA, Cunha L, Mezei M, Shen M, et al. Lucanthone and Its
Derivative Hycanthone Inhibit Apurinic Endonuclease-1 (APE1) by Direct Protein Binding. PLoS
ONE. 15 September 2011. Available at: https://www.ncbi.nlm.nih.gov/pmc/articles/PMC3174134/
207. Abbotts R, Jewell R, Nsengimana J, Maloney DJ, Simeonov A, Seedhouse C, et al. Targeting
human apurinic/apyrimidinic endonuclease 1 (APE1) in phosphatase and tensin homolog (PTEN)
deficient melanoma cells for personalized therapy. Oncotarget. 27 April 2014;5(10):3273–86.
208. Montaldi AP, Godoy PRDV, Sakamoto-Hojo ET. APE1/REF-1 down-regulation enhances the
cytotoxic effects of temozolomide in a resistant glioblastoma cell line. Mutat Res Toxicol Environ
Mutagen. 1 November 2015;793:19–29.
209. Lau JP, Weatherdon KL, Skalski V, Hedley DW. Effects of gemcitabine on APE/ref-1
endonuclease activity in pancreatic cancer cells, and the therapeutic potential of antisense
oligonucleotides. Br J Cancer. 13 September 2004;91(6):1166–73.
210. Skill NJ, Maluccio MA. Apurinic/apyrimidinic endonuclease-1 and hepatocellular carcinoma.
J Clin Oncol. 1 February 2020;38(4_suppl):563–563.
211. Cun Y, Dai N, Xiong C, Li M, Sui J, Qian C, et al. Silencing of APE1 Enhances Sensitivity
of Human Hepatocellular Carcinoma Cells to Radiotherapy In Vitro and in a Xenograft Model. PLoS
ONE. 13 February 2013. Available at: http://www.ncbi.nlm.nih.gov/pmc/articles/PMC3572126/
212. Zheng Z-H, Du W, Li Y-J, Gao M-Q, Huang A-M, Liu J-F. Lentiviral-mediated short hairpin
RNA silencing of APE1 suppresses hepatocellular carcinoma proliferation and migration: A potential
therapeutic target for hepatoma treatment. Oncol Rep. 1 July 2015;34(1):95–102.
213. European Association For The Study Of The Liver, European Organisation For Research And
Treatment Of Cancer. EASL-EORTC clinical practice guidelines: management of hepatocellular
carcinoma. J Hepatol. April 2012;56(4):908–43.
214. Barchiesi A, Baccarani U, Billack B, Tell G, Vascotto C. [Letter to the Editor] Isolation of
mitochondria is necessary for precise quantification of mitochondrial DNA damage in human
carcinoma samples. BioTechniques. 01 2017;62(1):13–7.
215. Vascotto C, Fantini D, Romanello M, Cesaratto L, Deganuto M, Leonardi A, et al. APE1/Ref-
1 interacts with NPM1 within nucleoli and plays a role in the rRNA quality control process. Mol Cell
Biol. April 2009;29(7):1834–54.

99
216. Jackson EB, Theriot CA, Chattopadhyay R, Mitra S, Izumi T. Analysis of nuclear transport
signals in the human apurinic/apyrimidinic endonuclease (APE1/Ref1). Nucleic Acids Res.
2005;33(10):3303–12.
217. Choudhry P. High-Throughput Method for Automated Colony and Cell Counting by Digital
Image Analysis Based on Edge Detection. PLOS ONE. 5 February 2016;11(2):e0148469.
218. Santos JH, Meyer JN, Mandavilli BS, Van Houten B. Quantitative PCR-Based Measurement
of Nuclear and Mitochondrial DNA Damage and Repair in Mammalian Cells. In: Henderson DS,
curatore. DNA Repair Protocols: Mammalian Systems. Totowa, NJ: Humana Press; 2006. pag. 183–
99. (Methods in Molecular BiologyTM). Available at: https://doi.org/10.1385/1-59259-973-7:183
219. Candas D, Li JJ. MnSOD in Oxidative Stress Response-Potential Regulation via
Mitochondrial Protein Influx. Antioxid Redox Signal. 1 April 2014;20(10):1599–617.
220. Vascotto C, Cesaratto L, Zeef LAH, Deganuto M, D’Ambrosio C, Scaloni A, et al. Genome-
wide analysis and proteomic studies reveal APE1/Ref-1 multifunctional role in mammalian cells.
Proteomics. February 2009;9(4):1058–74.
221. Fung H, Demple B. A vital role for Ape1/Ref1 protein in repairing spontaneous DNA damage
in human cells. Mol Cell. 4 February 2005;17(3):463–70.
222. Prakash A, Doublié S. Base Excision Repair in the Mitochondria. J Cell Biochem. August
2015;116(8):1490–9.
223. Maynard S, Schurman SH, Harboe C, de Souza-Pinto NC, Bohr VA. Base excision repair of
oxidative DNA damage and association with cancer and aging. Carcinogenesis. January
2009;30(1):2–10.
224. Thompson RQ, Hughes MS. STENDOMYCIN: A NEW ANTIFUNGAL ANTIBIOTIC. J
Antibiot (Tokyo). September 1963;16:187–94.
225. Filipuzzi I, Steffen J, Germain M, Goepfert L, Conti MA, Potting C, et al. Stendomycin
selectively inhibits TIM23-dependent mitochondrial protein import. Nat Chem Biol. December
2017;13(12):1239–44.
226. Milenkovic D, Ramming T, Müller JM, Wenz L-S, Gebert N, Schulze-Specking A, et al.
Identification of the signal directing Tim9 and Tim10 into the intermembrane space of mitochondria.
Mol Biol Cell. May 2009;20(10):2530–9.

100
227. Gomes F, Palma FR, Barros MH, Tsuchida ET, Turano HG, Alegria TGP, et al. Proteolytic
cleavage by the inner membrane peptidase (IMP) complex or Oct1 peptidase controls the localization
of the yeast peroxiredoxin Prx1 to distinct mitochondrial compartments. J Biol Chem. 13 October
2017;292(41):17011–24.
228. Niu L, Liu L, Yang S, Ren J, Lai PBS, Chen GG. New insights into sorafenib resistance in
hepatocellular carcinoma: Responsible mechanisms and promising strategies. Biochim Biophys Acta
Rev Cancer. December 2017;1868(2):564–70.
229. Okuda H. Hepatocellular carcinoma development in cirrhosis. Best Pract Res Clin
Gastroenterol. 2007;21(1):161–73.
230. Ogunwobi OO, Harricharran T, Huaman J, Galuza A, Odumuwagun O, Tan Y, et al.
Mechanisms of hepatocellular carcinoma progression. World J Gastroenterol. 21 May
2019;25(19):2279–93.
231. Hegde ML, Hazra TK, Mitra S. Early steps in the DNA base excision/single-strand
interruption repair pathway in mammalian cells. Cell Res. January 2008;18(1):27–47.
232. Unnikrishnan A, Raffoul JJ, Patel HV, Prychitko TM, Anyangwe N, Meira LB, et al.
Oxidative stress alters base excision repair pathway and increases apoptotic response in
Apurinic/apyrimidinic endonuclease 1/Redox factor-1 haploinsufficient mice. Free Radic Biol Med.
1 June 2009;46(11):1488–99.
233. Demple B, Sung J-S. Molecular and biological roles of Ape1 protein in mammalian base
excision repair. DNA Repair. December 2005;4(12):1442–9.
234. Bayat Mokhtari R, Homayouni TS, Baluch N, Morgatskaya E, Kumar S, Das B, et al.
Combination therapy in combating cancer. Oncotarget. 6 June 2017;8(23):38022–43.
235. Palmer AC, Sorger PK. Combination cancer therapy can confer benefit via patient-to-patient
variability without drug additivity or synergy. Cell. 14 December 2017;171(7):1678-1691.e13.
236. Bayat Mokhtari R, Baluch N, Ka Hon Tsui M, Kumar S, S Homayouni T, Aitken K, et al.
Acetazolamide potentiates the anti-tumor potential of HDACi, MS-275, in neuroblastoma. BMC
Cancer. 24 2017;17(1):156.
237. Chacinska A, Pfannschmidt S, Wiedemann N, Kozjak V, Sanjuán Szklarz LK, Schulze-
Specking A, et al. Essential role of Mia40 in import and assembly of mitochondrial intermembrane
space proteins. EMBO J. 29 September 2004;23(19):3735–46.

101