Marco Palma - IRIS
158
Marco Palma The application of Structure from Motion photogrammetry as innovative method to assess marine benthic habitats and support their management Scienze della Vita e dell’ Ambiente PhD Academic Year: 2015–2018 Supervisor: Prof. Carlo Cerrano October 2018
-
Upload
khangminh22 -
Category
Documents
-
view
0 -
download
0
Transcript of Marco Palma - IRIS
Marco Palma
The application of Structure from Motion
photogrammetry as innovative method to assess
marine benthic habitats and support their
management
Scienze della Vita e dell’ Ambiente
PhDAcademic Year: 2015–2018
Supervisor: Prof. Carlo CerranoOctober 2018

Scienze della Vita e dell’ Ambiente
PhD
Academic Year: 2015–2018
Marco Palma
The application of Structure from Motion
photogrammetry as innovative method to assess
marine benthic habitats and support their
management
Supervisor: Prof. Carlo CerranoOctober 2018
Submitted in partial fulfilment of the requirements of the degree of Doctor ofPhilosophy
©Universita Politecnica delle Marche 2018. All rights reserved. No part of this publication may be reproduced
without the written permission of the copyright holder.


Abstract
Global environmental changes and human activities are having significant effectson the composition of marine benthic habitats, disturbing the ecological functioningof many ecosystems. Yet, quantifying ecological responses to habitat changes is chal-lenging because of limitation of current field methods and technology. The aim of thisresearch is to improve the characterization of benthic marine communities by usingStructure for Motion (SfM)-based methods. The objectives are (i) to provide a SfM-framework to assess the spatial composition of benthic communities and uncover thescale-specific effects that determine sample representativeness; (ii) to apply and testthe framework to study the effects of human and environmental pressures on coralreefs; and (iii) to propose a new method for investigating the population structure andbiomass of benthic tree-shaped species. The research was carried out at the PartialMarine Reserve of Ponta do Ouro (PPMR, Mozambique) and at the Marine ProtectedArea of Portofino (Italy).
At PPMR, the findings show that the best sampling size is 25 m2. This size allowedcapturing the diversity, abundance, structural complexity and morphological functionsof reefs’ organisms, and investigating changes driven by anthropic activities (i.e. scubadiving). Highly dove sites had low taxa diversity and density, and were characterized bymainly resistant-to-physical-impact organisms (i.e. sponges and algae) of big sizes andwith complex shapes. On the contrary, low or moderately dove sites presented fragile-to-physical-impact organisms (i.e. Acropora spp.). This research also demonstrated thatin addition to abundance and morphological information, the use of SfM point cloudsover tree-shaped organisms allows to have accurate prediction of biomass, avoiding toconduct destructive sampling and supporting calculation of secondary production.
To support marine management using SfM to investigate benthic communities, thisresearch emphasizes the need to (i) recognise the need of standardised approaches ofSfM method to identify relevant scales for conservation; (ii) develop better approachesto derive quantitative information on marine organisms biodiversity, biomass and ontheir structural habitat, and (iii) establish further knowledge on the spatial variationof benthic communities as a result of human pressure.
Keywords : SfM, gorgonian, coral reefs, scuba divers, ortho-mosaics, point clouds, con-servation, management
This research project was funded by “EUREKA”, European Social Funds (FSE), Pro-gramma Operativo Regionale (POR) 2014/2020 Regione Marche (Italy).

Acknowledgements
Questa tesi e a conclusione di un lungo percorso di crescita professionale e di ricercascientifica che mi ha dato la possibilita di congiungere la passione per la conservazionecon l’interesse per l’innovazione e le nove tecnologie. Produrre nuove applicazionipratiche per migliorare esistenti sistemi e stato obiettivo ultimo di questo lavoro diricerca sempre supportato dalla fiducia e dalle infallibili intuizioni del mio supervisoreProf. Carlo Cerrano.
Questa ricerca e stata occasione irripetibile di approfondimento e sperimentazione,di conoscenza e multidisciplinarita. Devo ringraziare per questo la ditta UBICA srl,l’Ateneo dell’Universita Politecnica delle Marche e la Regione Marche che tramite ilprogetto EUREKA (Fondi Sociali Europei, Programma Operativo Regionale (POR)2014/2020) hanno supportato finanziariamente la ricerca. Un ringraziamento partico-lare ai membri della UBICA srl che mi hanno sempre supportato nelle attivita di ricercae con i quali ho condiviso ogni fase del lavoro realizzato.
Un ringraziamento a Dr. Monica Rivas Casado della Cranfield University per la suaenergia, positivita, supporto e curiosita scientifica che mi hanno permesso di superarei grandi ostacoli del publicare su riviste scientifiche. Grazie al gruppo di ricercatori,dottoranti e studenti del laboratorio di zoologia con i quali ho avuto occasione di con-solidare forti amicizie.
Infine un grazie a mia moglie Chiara, con la quale ho condiviso le frustrazioni e legioie quotidiane di questi tre anni, e che, piu di chiunque, mi ha in ogni modo ed istantesupportato.
Al prossimo Nebbiolo


Contents
Abstract ii
Acknowledgements iv
List of Figures ix
List of Tables x
1 Introduction 11.1 What is Structure from Motion photogrammetry? . . . . . . . . . . . . . . 21.2 Knowledge gap and research needs . . . . . . . . . . . . . . . . . . . . . . . 41.3 Aim and objectives . . . . . . . . . . . . . . . . . . . . . . . . . . . . . . . . . 5
1.3.1 Thesis outline . . . . . . . . . . . . . . . . . . . . . . . . . . . . . . . 6
2 High Resolution Orthomosaics of African Coral Reefs: A Tool forWide-Scale Benthic Monitoring 92.1 Introduction . . . . . . . . . . . . . . . . . . . . . . . . . . . . . . . . . . . . . 102.2 Material and Methods . . . . . . . . . . . . . . . . . . . . . . . . . . . . . . . 14
2.2.1 Study Site . . . . . . . . . . . . . . . . . . . . . . . . . . . . . . . . . 142.2.2 Data Acquisition . . . . . . . . . . . . . . . . . . . . . . . . . . . . . . 142.2.3 Photogrammetric Process and Digitization . . . . . . . . . . . . . . 172.2.4 Seascape Metric Estimation . . . . . . . . . . . . . . . . . . . . . . . 182.2.5 Data Analysis . . . . . . . . . . . . . . . . . . . . . . . . . . . . . . . 24
2.3 Results . . . . . . . . . . . . . . . . . . . . . . . . . . . . . . . . . . . . . . . . 242.4 Discussion . . . . . . . . . . . . . . . . . . . . . . . . . . . . . . . . . . . . . . 362.5 Conclusions . . . . . . . . . . . . . . . . . . . . . . . . . . . . . . . . . . . . . 43
3 Application of Structure from Motion photogrammetry to coral reefsfor characterizing their spatial composition and pressures. 453.1 Introduction . . . . . . . . . . . . . . . . . . . . . . . . . . . . . . . . . . . . . 463.2 Material and methods . . . . . . . . . . . . . . . . . . . . . . . . . . . . . . . 51
3.2.1 Study area and experimental design . . . . . . . . . . . . . . . . . . 513.2.2 Data processing . . . . . . . . . . . . . . . . . . . . . . . . . . . . . . 53
3.2.2.1 Photogrammetric processing and seascape compositionanalysis . . . . . . . . . . . . . . . . . . . . . . . . . . . . . 53

Contents vi
3.2.2.2 Clustering analysis . . . . . . . . . . . . . . . . . . . . . . 543.2.2.3 Calculation of seascape metrics . . . . . . . . . . . . . . . 56
3.3 Results . . . . . . . . . . . . . . . . . . . . . . . . . . . . . . . . . . . . . . . . 573.3.1 Evaluation of clusters and agreement with the experts . . . . . . . 573.3.2 Seascape composition of diving sites . . . . . . . . . . . . . . . . . . 593.3.3 Seascape metrics . . . . . . . . . . . . . . . . . . . . . . . . . . . . . . 62
3.4 Discussions . . . . . . . . . . . . . . . . . . . . . . . . . . . . . . . . . . . . . 643.5 Acknowledgments . . . . . . . . . . . . . . . . . . . . . . . . . . . . . . . . . 68
4 SfM-Based Method to Assess Gorgonian Forests (Paramuricea clavata
(Cnidaria, Octocorallia)) 694.1 Introduction . . . . . . . . . . . . . . . . . . . . . . . . . . . . . . . . . . . . . 704.2 Materials and Methods . . . . . . . . . . . . . . . . . . . . . . . . . . . . . . 73
4.2.1 Study Site . . . . . . . . . . . . . . . . . . . . . . . . . . . . . . . . . 734.2.2 Data Collection . . . . . . . . . . . . . . . . . . . . . . . . . . . . . . 75
4.2.2.1 Pilot Study on Gorgonian Population Structure . . . . . 754.2.2.2 Underwater Imagery Collection . . . . . . . . . . . . . . . 754.2.2.3 Gorgonian Colony Density and Morphometry Measure-
ment . . . . . . . . . . . . . . . . . . . . . . . . . . . . . . . 764.2.2.4 Relationship between Planar Surface Area and Weight . 76
4.2.3 Image Processing . . . . . . . . . . . . . . . . . . . . . . . . . . . . . 804.2.4 Data Analysis . . . . . . . . . . . . . . . . . . . . . . . . . . . . . . . 82
4.2.4.1 SfM Estimation of Gorgonian Density Colony and Mor-phometry . . . . . . . . . . . . . . . . . . . . . . . . . . . . 82
4.2.4.2 Dried Colonies Analysis . . . . . . . . . . . . . . . . . . . . 844.2.5 Validation . . . . . . . . . . . . . . . . . . . . . . . . . . . . . . . . . . 85
4.3 Results . . . . . . . . . . . . . . . . . . . . . . . . . . . . . . . . . . . . . . . . 854.3.1 SfM-Population Structure Estimates and Validation . . . . . . . . 864.3.2 SfM-Biomass Estimation and Validation . . . . . . . . . . . . . . . 91
4.4 Discussion . . . . . . . . . . . . . . . . . . . . . . . . . . . . . . . . . . . . . . 934.4.1 Estimated Metrics of P. clavata . . . . . . . . . . . . . . . . . . . . 954.4.2 Domain of Application . . . . . . . . . . . . . . . . . . . . . . . . . . 97
4.5 Conclusions . . . . . . . . . . . . . . . . . . . . . . . . . . . . . . . . . . . . . 98
5 Discussion and Conclusion 1005.1 Introduction . . . . . . . . . . . . . . . . . . . . . . . . . . . . . . . . . . . . . 1005.2 Marine management plans and SfM . . . . . . . . . . . . . . . . . . . . . . . 101
5.2.1 Scuba diving . . . . . . . . . . . . . . . . . . . . . . . . . . . . . . . . 102
Contents vii
5.2.2 Climate change . . . . . . . . . . . . . . . . . . . . . . . . . . . . . . 1045.3 Implication for future research . . . . . . . . . . . . . . . . . . . . . . . . . . 105
5.3.1 Data collection of benthic communities . . . . . . . . . . . . . . . . 1055.3.2 Availability of photogrammetric data . . . . . . . . . . . . . . . . . 106
5.4 Conclusion . . . . . . . . . . . . . . . . . . . . . . . . . . . . . . . . . . . . . . 107
References 109
A Application of Structure from Motion photogrammetry to coral reefsfor characterizing their spatial composition and pressures. 135
B SfM-Based Method to Assess Gorgonian Forests (Paramuricea clavata(Cnidaria, Octocorallia) 141

List of Figures
2.1 Study site in the Partial Marine Protected Area of Ponta do Ouro (Mozam-bique) . . . . . . . . . . . . . . . . . . . . . . . . . . . . . . . . . . . . . . . . 14
2.2 Diver Propulsion Vehicle (DPV) . . . . . . . . . . . . . . . . . . . . . . . . . 152.3 Workflow of field data collection and analysis . . . . . . . . . . . . . . . . . 162.4 Processed orthoimages with organisms . . . . . . . . . . . . . . . . . . . . . 202.5 Percentage of cover per morphological class for each sampling design . . . 262.6 Area-density-edge, shape, contagion and interspersion metric values from
nested sampling . . . . . . . . . . . . . . . . . . . . . . . . . . . . . . . . . . . 322.7 Area-density-edge, shape, contagion and interspersion metric values for
random sampling . . . . . . . . . . . . . . . . . . . . . . . . . . . . . . . . . . 332.8 Diversity metric values obtained for the nested sampling strategy . . . . . 342.9 Diversity metric values obtained for the random sampling strategy . . . . 35
3.1 Study area. . . . . . . . . . . . . . . . . . . . . . . . . . . . . . . . . . . . . . 523.2 Distribution of surface, perimeter and count across the clusters . . . . . . 613.3 Relative frequency distribution of the functional groups . . . . . . . . . . . 613.4 Relative frequency distribution of the three resistant categories . . . . . . 623.5 On-Way ANOVA seascape indices . . . . . . . . . . . . . . . . . . . . . . . . 63
4.1 The study site in the Marine Protected Area of Portofino . . . . . . . . . 744.2 Workflow of data collection and processing . . . . . . . . . . . . . . . . . . 774.3 Image footprint obtained with the Gopro Hero4 Black Edition and the
Sony NEX7 alpha . . . . . . . . . . . . . . . . . . . . . . . . . . . . . . . . . 784.4 Example of data processing workflow for calculating morphometrics and
the average coenenchymal surface . . . . . . . . . . . . . . . . . . . . . . . . 814.5 Spatial represeantation of point cloud and colonies . . . . . . . . . . . . . . 844.6 Histogram of the morphometric values obtained for the SfM method . . . 884.7 Correlation between the SfM method vs. the ground truth data . . . . . . 904.8 Correlation between the coenenchymal surface . . . . . . . . . . . . . . . . 92
5.1 Illustration of scuba diving at PPMR . . . . . . . . . . . . . . . . . . . . . . 104
A.1 One-way ANOVA figures for seascape metrics . . . . . . . . . . . . . . . . . 138A.2 Average organisms’ surface across sites . . . . . . . . . . . . . . . . . . . . . 139A.3 Average organisms’ perimeter across sites . . . . . . . . . . . . . . . . . . . 139
List of Figures ix
A.4 Total organisms abundance . . . . . . . . . . . . . . . . . . . . . . . . . . . . 140
B.1 The point clouds of the nine dried colonies generated from SfM analysis. 142B.2 Views over the 3D scene representing the study area. . . . . . . . . . . . . 143B.3 The maps showing border of the Portofino Marine Protected Area . . . . 144
List of Tables
1.1 Authors’ contributions to Chapters . . . . . . . . . . . . . . . . . . . . . . . 8
2.1 Seascape metrics estimated for the case study area of Ponta do OuroMarine Reserve . . . . . . . . . . . . . . . . . . . . . . . . . . . . . . . . . . . 23
2.2 Description of the key morphological classes of benthic organisms . . . . . 282.3 Sample size . . . . . . . . . . . . . . . . . . . . . . . . . . . . . . . . . . . . . 292.4 Seascape metric for the surveyed reef . . . . . . . . . . . . . . . . . . . . . . 302.5 Suggested sampling designs for the seascape metrics . . . . . . . . . . . . . 38
3.1 Metrics predicted to be significantly different across coral reefs . . . . . . 503.2 Surveyed dive sites. . . . . . . . . . . . . . . . . . . . . . . . . . . . . . . . . 533.3 Taxonomic and morphological classes from the ortho-mosaics . . . . . . . 543.4 List of landscape indices . . . . . . . . . . . . . . . . . . . . . . . . . . . . . 573.5 X-Means clusters . . . . . . . . . . . . . . . . . . . . . . . . . . . . . . . . . . 583.6 Absolute percentage of agreement and Kappa statistic . . . . . . . . . . . 59
4.1 Metrics calculated by the SfM . . . . . . . . . . . . . . . . . . . . . . . . . . 794.2 Key image processing outcomes using the Gopro Hero4 Black Edition
(GP) and the Sony NEX7 alpha (SN) . . . . . . . . . . . . . . . . . . . . . 824.3 Gorgonian descriptors . . . . . . . . . . . . . . . . . . . . . . . . . . . . . . . 864.5 Estimated morphometrics . . . . . . . . . . . . . . . . . . . . . . . . . . . . . 934.4 Summary of morphometric results for the study site. . . . . . . . . . . . . 94
A.1 Dive site frequencies per year . . . . . . . . . . . . . . . . . . . . . . . . . . 135A.2 Confusion matrix Pantaleo . . . . . . . . . . . . . . . . . . . . . . . . . . . . 135A.3 Confusion matrix Fernandez . . . . . . . . . . . . . . . . . . . . . . . . . . . 136A.4 Confusion matrix Fernandez-Pantaleo . . . . . . . . . . . . . . . . . . . . . 136A.5 Expert opinion on the clusters and across sites . . . . . . . . . . . . . . . . 137
B.1 Camera specifications and settings. . . . . . . . . . . . . . . . . . . . . . . . 141B.2 Number of images processed for each of the 1 m × 1 m quadrats. . . . . . 141

Chapter 1
Introduction
Marine habitats are essential element of Earth’s ecosystem and provide a wide range
of services for human life. They are also intensively impacted by human activities:
urbanization, coastal runoff, excess of nutrient and chemicals, have impaired natural
biological regimes and caused a widespread decline of marine species and habitats world-
wide (Thakur et al., 2018; Doney, 2010). Coral reefs and coralligenous habitats are for
example two of the most vulnerable systems on earth, undergoing major decline due
to short term human and natural threats (Hughes et al., 2017; Cerrano et al., 2010).
The impact of all these changes suggests the need to investigate marine habitats in
their geographical extent, ecological functions and conservation status (Lecours et al.,
2015). This is the ambition of many governmental agendas that promote topographic
investigations, habitat, and biotope marine mapping to protect marine biodiversity and
services (Hong Kong Special Administrative Region, 2016; Buhl-Mortensen et al., 2015;
Commission, 2011).
Research studies have demonstrated that mapping marine habitats supports ef-
fective management of marine environment (i.e. monitoring) (Van Dover et al., 2017;
Lecours et al., 2015; Brown et al., 2011). However, mapping marine habitats and species
at high resolution and large spatial scales is impaired by current investment changes
and technological approaches (Lecours et al., 2015). Conventional seabed survey meth-
ods are limited or inadequate for extended and high-resolution mapping (Brown et al.,
2011). To this end, only the 5-10% seabed ecosystems has been surveyed at similar
fine resolution of terrestrial system (Wright and Heyman, 2008). The lack of high res-
olution information over large spatial scales, has limited our understanding on species
distribution pattern, ecological dynamics, and the design of conservation strategies
(Gonzalez-Rivero et al., 2014; Mengerink et al., 2014; Brown et al., 2011).
Hence, the application of validated technologies in terrestrial environment have been
Chapter 1. Introduction 2
suggested in the marine field for collecting quantitative information on the impacts of
anthropogenic and natural factors on benthic species and habitats (Harris and Baker,
2012; Harris, 2012). In this direction, marine research has started to adopt more in-
terdisciplinary approaches by using for example using the Structure for Motion (SfM)
Photogrammetry (Westoby et al., 2012).
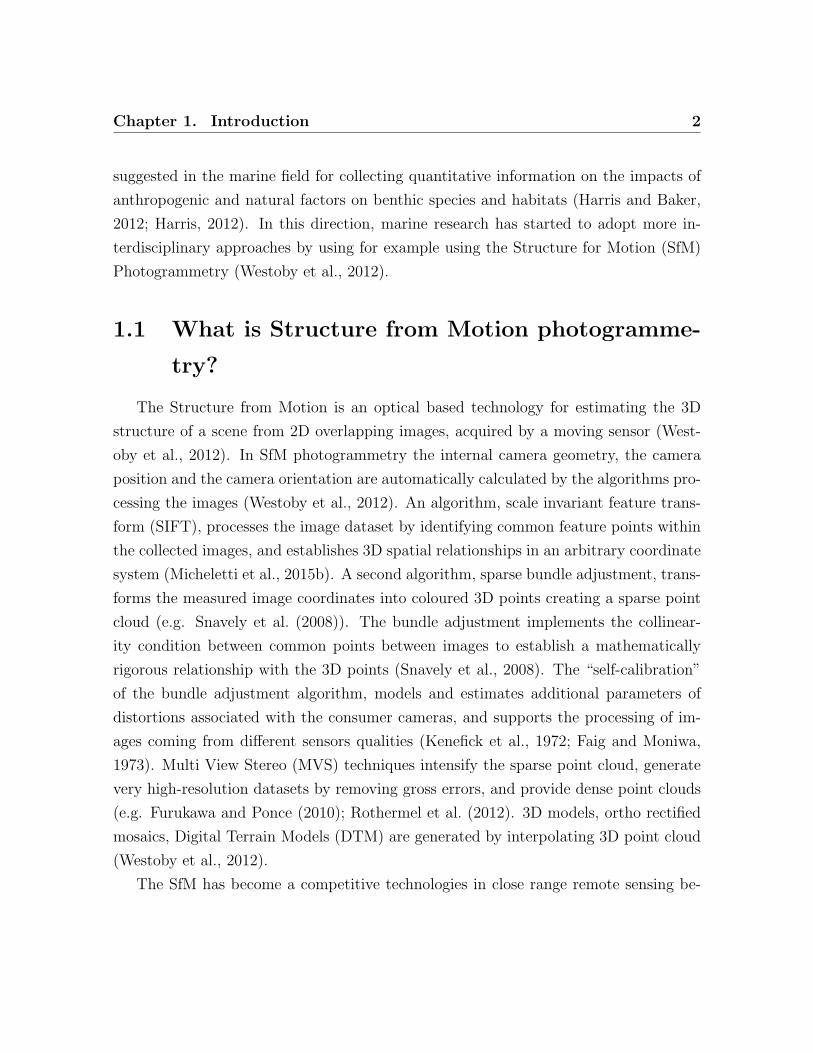
1.1 What is Structure from Motion photogramme-
try?
The Structure from Motion is an optical based technology for estimating the 3D
structure of a scene from 2D overlapping images, acquired by a moving sensor (West-
oby et al., 2012). In SfM photogrammetry the internal camera geometry, the camera
position and the camera orientation are automatically calculated by the algorithms pro-
cessing the images (Westoby et al., 2012). An algorithm, scale invariant feature trans-
form (SIFT), processes the image dataset by identifying common feature points within
the collected images, and establishes 3D spatial relationships in an arbitrary coordinate
system (Micheletti et al., 2015b). A second algorithm, sparse bundle adjustment, trans-
forms the measured image coordinates into coloured 3D points creating a sparse point
cloud (e.g. Snavely et al. (2008)). The bundle adjustment implements the collinear-
ity condition between common points between images to establish a mathematically
rigorous relationship with the 3D points (Snavely et al., 2008). The “self-calibration”
of the bundle adjustment algorithm, models and estimates additional parameters of
distortions associated with the consumer cameras, and supports the processing of im-
ages coming from different sensors qualities (Kenefick et al., 1972; Faig and Moniwa,
1973). Multi View Stereo (MVS) techniques intensify the sparse point cloud, generate
very high-resolution datasets by removing gross errors, and provide dense point clouds
(e.g. Furukawa and Ponce (2010); Rothermel et al. (2012). 3D models, ortho rectified
mosaics, Digital Terrain Models (DTM) are generated by interpolating 3D point cloud
(Westoby et al., 2012).
The SfM has become a competitive technologies in close range remote sensing be-

Chapter 1. Introduction 3
cause low-cost and time-efficient. In fact, a wide range of camera sensors ranging from
smartphones cameras (Micheletti et al., 2015a) to action cameras and DLCS cameras
(Ingwer et al., 2015), can be used for SfM surveys providing highly accurate 3D point
clouds. In contrast, laser scanning systems, which measure the time of an emitted
laser pulse to be reflected off and return to the sensor, provides the highest quality
3D point clouds but at lower densities than SfM and more expensive equipment and
specific knowledge is required (Wallace et al., 2016) . Therefore SfM is revolutionizing
traditional methods for data collection and data processing in ecology.
In terrestrial research, the use of SfM encouraged the growth of “personal remote
sensing” of landscapes at high spatial and temporal resolution (Dandois et al., 2015).
It has been applied for a wide range of purposes and replaced in most cases the use
of aerial or terrestrial laser scanning surveys; from mapping canopy height and esti-
mating their density, to investigating the extent and coverage of lichen and moss on
bare soils (Dandois et al., 2015; Liang et al., 2015). In marine field, SfM has been
successfully applied in aerial and underwater application. Aerial studies demonstrated
the effectiveness of SfM in mapping coastal and shallow areas at high resolution by
using drones and kites (Levy et al., 2018; Chirayath and Earle, 2016; Currier, 2015).
Underwater studies tested SfM technology by using “out of the shelf cameras” handled
by scuba diver (Storlazzi et al., 2016), cameras equipped on semiautonomous under-
water vehicles (Bryson et al., 2017; Gonzalez-Rivero et al., 2014) or cameras coupled
with autonomously navigated vehicles (Williams et al., 2012). Researchers have started
defining new frameworks to integrated remote sensing methods to underwater habitat
monitoring for improving the understanding of key aspects of habitat dynamics, pro-
vision and productivity, and estimating their structural complexity at multiple scale
(Storlazzi et al., 2016; Ferrari et al., 2016; Figueira et al., 2015; Leon et al., 2015). For
example, measuring habitat structural complexity of coral reefs by using linear rugosity
calculations has greatly contributed to our understanding of the reef functioning (Gra-
ham and Nash, 2013). Traditional methods as chain transect have been replaced by
using linear or surface rugosity calculation on 3D model generated by SfM (Storlazzi
et al., 2016) and the SfM accuracy in calculating the habitat complexity has been esti-
mated in different environmental conditions and on target taxonomical groups (Bryson

Chapter 1. Introduction 4
et al., 2017). These types of approaches allows avoiding contact with the substrate,
to perform rapid underwater surveys and to replicate multiple measurements at known
spatial resolutions (Leon et al., 2015).
Recent applications also include investigations on the morphological complexity of
reefs from single organisms to reef-scape scales (10 km2) (Ferrari et al., 2016). However,
few SfM based studies investigated the correlation between coral reef morphological
complexity and species composition (Bryson et al., 2017). None of these studies in-
vestigated the composition of benthic communities at high resolution and across wide
areas of orthorectfied mosaics or point cloud datasets. Ortho- mosaics generated from
SfM data processing are new informative layers to support detailed ecological studies
and habitat mapping. For example, they can inform about organisms varying in dimen-
sion, shape, species and abundance interact at seascape level, and how environmental
and human pressures act over time in selecting and designing benthic communities.
Also, SfM point clouds are commonly used for estimating relevant metrics in terrestrial
forestry (i.e. canopy coverture, trees, steam diameters) (Liang et al., 2015), but no
studies have processed SfM point clouds in the underwater field to estimate population
structure and morphometrics, for example of tree shaped marine benthic species (i.e.
gorgonians).
To date, the lack of a framework that standardize SfM sampling protocols and data
processing for habitat characterization, limits the use of SfM technologies in experimen-
tal studies and monitoring programs. Therefore, it is important to investigate potential
benefits of SfM applications to study marine benthic communities and to respond to
national and international policies.
1.2 Knowledge gap and research needs
Studying benthic communities is the first step to assess the potential impact of
human and environmental pressures in marine environment and for the development of
appropriate management strategies. Thus, to quantify ecological responses to habitat
changes, there is the need of tools supporting a comprehensive knowledge of habitats
and organisms and their interactions. Therefore, this research investigates the use of

Chapter 1. Introduction 5
SfM in marine research and identified two key research needs about its applications to
support marine management.
First, there is a need for studies that standardize and synthesize SfM approaches to
study marine communities at seascape scale (Gonzalez-Rivero et al., 2014). To date,
SfM approaches have been applied at organisms-scale and used the 3D structure of the
seascape as proxy of organisms growth, habitat complexity and biodiversity conditions
(Ferrari et al., 2017; Bryson et al., 2017). However, this research is limited by the
type of organism (i.e. stout branched coral) and the use of 3D models within which
habitat complexity has been quantified, making investigations difficult about the spatial
composition of organisms.
Second, there is the need for studies that uses SfM approaches to derive quantitative
information on marine organisms biodiversity, biomass and on their structural habitat.
To date, sampling methodologies used to characterize benthic communities are time-
consuming, limited by small sampling surfaces defined a-priori (i.e. quadrat samples
size), and often require destructive sampling (Mistri and Ceccherelli, 1994). These ap-
proaches limit our ability to understand the spatial distribution of species and habitats,
and consequently their conservation status.
1.3 Aim and objectives
The aim of this study is to improve the characterization of benthic marine commu-
nities by using SfM, and to support the development of targeted marine management
strategies by providing standardised methods for assessing benthic composition and or-
ganisms’ morphometrics at seascape scale. This aim will be met through the following
objectives:
Objective 1: to provide a framework to assess the spatial composition of benthic
communities using SfM ortho-mosaics and uncover the scale-specific effects that deter-
mine sample representativeness (Chapter 2).
Objective 2: to apply and test the framework to study the effects of human and
Chapter 1. Introduction 6
environmental pressures on coral reefs (Chapter 3).
Objective 3: to propose a new method for investigating the population structure
(e.g. maximal height, abundance) and biomass of benthic tree-shaped species (i.e. gor-
gonians) by using scaled point cloud from SfM (Chapter 4).
Case study: The study is applied to the Ponta do Ouro Partial Marine Reserve
(PPMR) (Mozambique) and to the Portofino Marine Protected Area (Italy).
1.3.1 Thesis outline
The thesis has been written in a paper format, and thus the novel contributions to
science are written as individual academic journal articles (Chapter 2 to 4). Chapter
2 has been published in Remote Sensing (Palma et al., 2017) and Chapter 4 has been
published in at Remote Sensing (Palma et al., 2018), Chapter 3 will be submitted to
People and Nature for review, after completion of this thesis. All original work was
carried out by the author of this thesis, and the contributions of the co-authors were
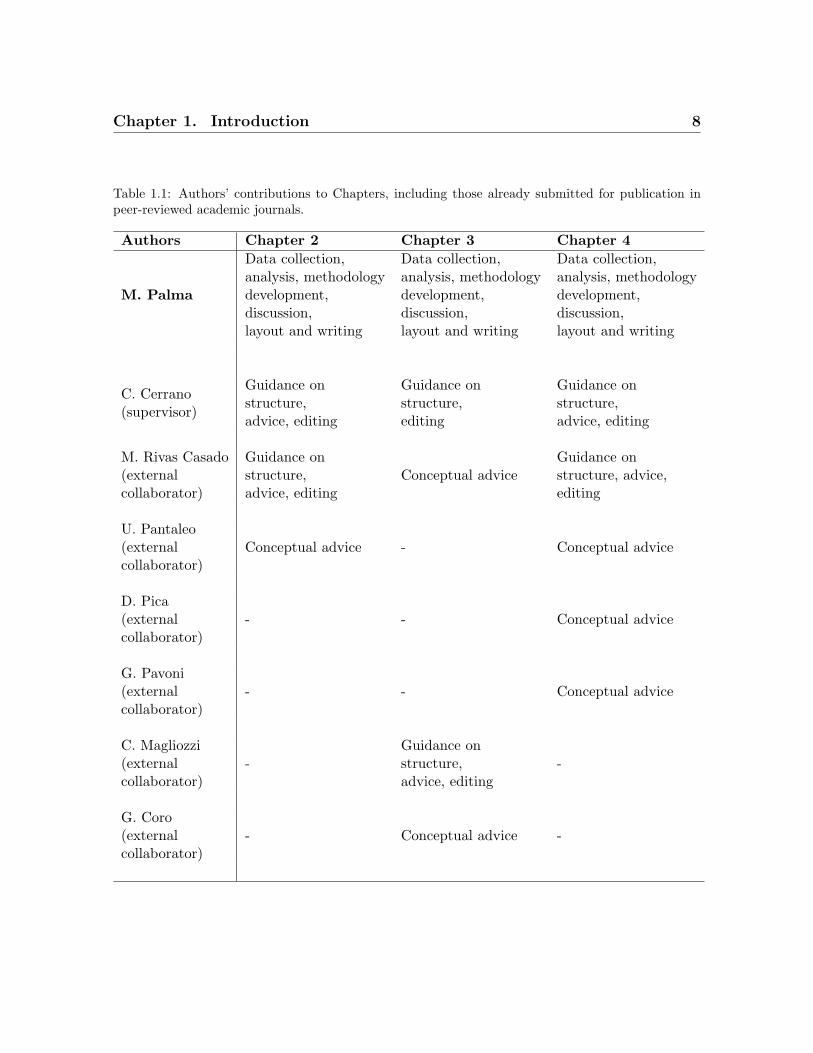
what would normally be expected from supervisors and advisors (Table 1.1). Please
note that due to the format of the thesis, repetition in data description and methodol-
ogy occur (especially in Chapter 2 and 3).
Chapter 2 presents a multiple scale framework to standardize SfM data collection
method, data processing and ortho-mosaic analysis. It provides a methodology to as-
sesses the minimal sample size (i.e. extension and number of replies) to be used to
monitor coral reef community at PPMR, and to calculate quantitative metrics (i.e.
shape, biodiversity and fractality of coral communities) for investigating the spatial
composition of benthic communities at seascape scale (Objective 1).
Chapter 3 presents a field study investigating the structural composition of benthic
communities in coral reefs and their responses to scuba diving and environmental con-
ditions by applying the SfM framework (Chapter 2). This chapter outlines the effect of

Chapter 1. Introduction 7
scuba diving and environmental pressures to shape the structural composition of coral
reefs and highlights the potential of using the SfM framework for spatial and temporal-
based monitoring of coral reefs (Objective 2).
Chapter 4 presents a novel and transferable method to calculate gorgonians’ met-
rics (i.e. max high, max width, fan surface, abundance and biomass) by processing
point cloud generated through SfM. The methods bases on interpolation of organisms
point cloud generated by SfM and avoids the reliance on in-situ collection of gorgonian
organism. The chapter provides guidance and is a base for effective approaches to ma-
rine monitoring (Objective 3).
Chapter 5 discusses how the results presented in the previous chapters contributes
to identifying the best approaches to use SfM and supporting the development of SfM-
targeted marine monitoring strategies.
Additionally, Appendices are included at the end of the document, which provide
more detail on the cases of study, statistical analysis, and methodologies.
Chapter 1. Introduction 8
Table 1.1: Authors’ contributions to Chapters, including those already submitted for publication inpeer-reviewed academic journals.
Authors Chapter 2 Chapter 3 Chapter 4
M. Palma
Data collection,analysis, methodologydevelopment,discussion,layout and writing
Data collection,analysis, methodologydevelopment,discussion,layout and writing
Data collection,analysis, methodologydevelopment,discussion,layout and writing
C. Cerrano(supervisor)
Guidance onstructure,advice, editing
Guidance onstructure,editing
Guidance onstructure,advice, editing
M. Rivas Casado(externalcollaborator)
Guidance onstructure,advice, editing
Conceptual adviceGuidance onstructure, advice,editing
U. Pantaleo(externalcollaborator)
Conceptual advice - Conceptual advice
D. Pica(externalcollaborator)
- - Conceptual advice
G. Pavoni(externalcollaborator)
- - Conceptual advice
C. Magliozzi(externalcollaborator)
-Guidance onstructure,advice, editing
-
G. Coro(externalcollaborator)
- Conceptual advice -

Chapter 2
High Resolution Orthomosaics of African Coral Reefs:
A Tool for Wide-Scale Benthic Monitoring1
Abstract
Coral reefs play a key role in coastal protection and habitat provision. They are
also well known for their recreational value. Attempts to protect these ecosystems have
not successfully stopped large-scale degradation. Significant efforts have been made by
government and research organizations to ensure that coral reefs are monitored sys-
tematically to gain a deeper understanding of the causes, the effects and the extent of
threats affecting coral reefs. However, further research is needed to fully understand
the importance that sampling design has on coral reef characterization and assessment.
This study examines the effect that sampling design has on the estimation of seascape
metrics when coupling semi-autonomous underwater vehicles, structure-from-motion
photogrammetry techniques and high resolution (0.4 cm) underwater imagery. For this
purpose, we use FRAGSTATS v4 to estimate key seascape metrics that enable quan-
tification of the area, density, edge, shape, contagion, interspersion and diversity of
sessile organisms for a range of sampling scales (0.5 m × 0.5 m, 2 m × 2 m, 5 m × 5 m,
7 m × 7 m), quadrat densities (from 1–100 quadrats) and sampling strategies (nested
vs. random) within a 1655 m2 case study area in Ponta do Ouro Partial Marine Re-
serve (Mozambique). Results show that the benthic community is rather disaggregated
1Palma, M., Rivas Casado, M., Pantaleo, U. and Cerrano, C., 2017. High Resolution Orthomosaicsof African Coral Reefs: A Tool for Wide-Scale Benthic Monitoring. Remote Sensing, 9(7), p.705.Open Access
The spelling of the original published manuscript has been adjusted to fit the format of this thesis.
Chapter 2. High Resolution Orthomosaics of African Coral Reefs: A Toolfor Wide-Scale Benthic Monitoring 10
within a rocky matrix; the embedded patches frequently have a small size and a regular
shape; and the population is highly represented by soft corals. The genus Acropora is
the more frequent and shows bigger colonies in the group of hard corals. Each of the
seascape metrics has specific requirements of the sampling scale and quadrat density
for robust estimation. Overall, the majority of the metrics were accurately identified
by sampling scales equal to or coarser than 5 m × 5 m and quadrat densities equal to or
larger than 30. The study indicates that special attention needs to be dedicated to the
design of coral reef monitoring programmes, with decisions being based on the seascape
metrics and statistics being determined. The results presented here are representative
of the eastern South Africa coral reefs and are expected to be transferable to coral reefs
with similar characteristics. The work presented here is limited to one study site and
further research is required to confirm the findings.
Keywords :seascape metrics; structure-from-motion;FRAGSTATS; photogrammetry; sam-
pling scale; quadrat density; sampling strategy; sampling framework
2.1 Introduction
Coral reefs provide key provisioning, cultural and regulating ecosystem services
(Hilmi et al., 2014; Laurans et al., 2013). Their economic value has been estimated
in recent studies through the ecosystem services theory developed by Samonte et al.
(2016); Seenprachawong (2016) and the Millennium Ecosystem Assessment’s classifica-
tion (Assessment, 2003). Within the context of provisioning and cultural services, coral
reefs provide an important protein source and a basin for livelihoods for fisheries in
addition to scenic beauty for recreational tourism (Pascal et al., 2016). Regarding reg-
ulating services, coral reefs provide coastal protection by dissipating the waves energy
(Barbier et al., 2011) and contribute to the regulation of the coastal line erosion and
sedimentation (Pascal et al., 2016). The benefits of coral reefs are therefore vast and
varied. However, anthropogenic threats at the regional and global scale have consider-
ably impacted coral reefs, with 19% of reefs considered completely lost and 60–75% of
reefs threatened by 2011 (Wilkinson and Souter, 2008; Burke et al., 2012; Mora, 2015).
Chapter 2. High Resolution Orthomosaics of African Coral Reefs: A Toolfor Wide-Scale Benthic Monitoring 11
The increase of extreme weather events impacting the coast (Cheal et al., 2017) has
also played a significant role in large-scale degradation. As a result, coral reef protec-
tion has become a priority in many governmental agendas (e.g., Hong Kong Special
Administrative Region (2016)). This has resulted in the development and implemen-
tation of scientific surveys and monitoring programs aimed at evaluating the causes,
effects and extent of coral threats (e.g., sedimentation, bleaching and climate change)
(Gonzalez-Rivero et al., 2016; Hattori and Shibuno, 2015; Hedley et al., 2016).
In general, wide-area (>1500 m2) coral reef monitoring methods are based on
remote sensing approaches that range from autonomous or semi-autonomous under-
water vehicles (Beijbom et al., 2012; Friedman et al., 2012; Williams et al., 2012;
Ferrari et al., 2016; Gonzalez-Rivero et al., 2016) to satellite and airborne imagery
(Costa et al., 2009; De’ath et al., 2012; Zhang et al., 2013; Barnes et al., 2015). For
the particular case of wide-area (>1500 m2) in situ monitoring, the key limitations
are cost, access to the site and the spatio-temporal extent to be covered (Hedley
et al., 2016). In situ refers hereinafter to all techniques that require human pres-
ence at the site to obtain relevant samples (e.g., photographs or biological samples),
and its meaning is specific to this manuscript. In situ methodologies provide higher
spatial resolution than wide-area (>1500 m2) remote sensing methods (e.g., satel-
lites) and are essential for the understanding of very fine ecological processes (Lecours
et al., 2015; Hedley et al., 2016). New technologies and analytical solutions (e.g.,
autonomous and semi-autonomous underwater vehicles, boat-based systems and close
range Structure-from-Motion (SfM)) have been developed and can help fulfil the need
for wide-area (>1500 m2) high resolution data provision (Williams et al., 2012; Leon
et al., 2015; Ferrari et al., 2016; Gonzalez-Rivero et al., 2016; Storlazzi et al., 2016).
This scientific advance in coral reef monitoring relies on the integration of low cost off-
the-shelf cameras and state of the art photogrammetric techniques (i.e., SfM) (Figueira
et al., 2015; Carrivick et al., 2016). The resulting data products include high resolution
(finer than 5 cm) Digital Elevation Models (DEMs), point clouds and two-dimensional
mosaics (Westoby et al., 2012; McCarthy and Benjamin, 2014; Ferrari et al., 2016),
which enable the 2D and 3D analysis of coral reef ecological processes at different scales
through the use of key metrics (Casella et al., 2016; Storlazzi et al., 2016; Figueira et al.,
Chapter 2. High Resolution Orthomosaics of African Coral Reefs: A Toolfor Wide-Scale Benthic Monitoring 12
2015; Gonzalez-Rivero et al., 2014; Ferrari et al., 2016; Leon et al., 2015). Examples
of the use of these techniques include Burn (Burns et al., 2016), Chirayath (Chirayath
and Earle, 2016), Gutierrez (Gutierrez-Heredia et al., 2015) and Lavy (Lavy et al.,
2015). Burns (Burns et al., 2016) used 3D SfM-derived models to estimate key metrics
that informed on changes to the benthic habitat along 25 m long transects and cover-
ing around 250 m2. Chirayath (Chirayath and Earle, 2016) applied SfM techniques to
map a 15 km2 coral reef area in the Shark Bay (Australia) and to generate an accurate
bathymetric map from an unmanned aerial vehicle. Gutierrez (Gutierrez-Heredia et al.,
2015) applied SfM to generate 3D models of the benthic organisms for taxonomic iden-
tification purposes, whereas Lavy (Lavy et al., 2015) applied SfM techniques to derive
morphological measurement of corals.
Several authors have looked at the application of seascape ecology metrics to char-
acterize the ecological processes of coral reefs Bostrom et al. (2011); Wedding et al.
(2011a). However, little effort has yet been made to define the appropriate sampling
strategy to accurately determine each of the metrics; the ecological rational for scale
selection is usually unsupported Bostrom et al. (2011). Generally, scale selection is
based on arbitrary choices or convention, albeit scale having an impact on seascape
metric estimation (Kendall and Miller, 2008). The importance of standardized sam-
pling protocols has already been recognized by several authors (Bostrom et al., 2011).
For example, Lecours et al. (2015) recognizes the need for multiple scale approaches
in benthic habitat mapping and states that sampling should be planned in order to
describe those variables relevant for the study. Bostrom et al. (2011) recognizes the
design of a survey as a key future research priority for seascape ecology; the wide
range of spatio-temporal scales used in seascape studies inhibits the ability to directly
compare studies’ outcomes, identify general patterns, predict consequences across sys-
tems and design coastal reserves based on relevant information. Kendall and Miller
(2008) underline the negative effects of changes in map resolution when representing
ecological landscape indexes. Garrabou et al. (1998, 2002) proposed the calculation of
landscape metrics at centimeter resolution in accord with the principles of landscape
ecology Turner (1989).
There are multiple studies that (Costa et al., 2009; Pittman et al., 2009; Wedding
Chapter 2. High Resolution Orthomosaics of African Coral Reefs: A Toolfor Wide-Scale Benthic Monitoring 13
et al., 2008; Purkis et al., 2008) investigate the effect that the sampling design (i.e.,
the combined effect of scale, quadrat density and sampling strategy) has on metric
estimation. For example, Costa et al. (2009) carried out a comparative assessment
for bathymetry and intensity characterization at two different spatial scales (4 m ×
5000 m and 4 m × 500 m), whereas Pittman et al. (2009) quantified seven different
morphometrics at multiple scales (i.e., 15 m, 25 m, 50 m, 100 m, 200 m, 300 m radius)
from a 4 m bathymetry grid. Both studies showed that the spatial scale had an influence
on the derived metrics. Wedding et al. (2008) used a stratified sampling strategy to
estimate rugosity and compare it to rugosity estimates obtained from a DEM at four
grid sizes (i.e., 4 cm, 10 cm, 15 cm and 25 cm). Results showed that the 4 m grid was
the only grid size showing a significant positive association with the in situ rugosity.
The author proposed the method as non-substitutive of the finer scale rugosity methods
for characterizing coral reef communities, but as an effective alternative for broad scale
assessments. Purkis et al. (2008) used a kernel radius of 4 m, 8 m, 20 m and 40 m with
an increment of 20 m–400 m to estimate rugosity and habitat. In their study, results
indicated that the habitat of up to (but likely not exceeding) 40 m away, most strongly
influenced the diversity and particularly the abundance of certain fish guilds.
Here, multiple sample scales and quadrat densities applied on a high resolution
(1.8 cm) wide area (>1500 m2) dataset, where sample scale indicates the sampling
quadrat size and quadrat density refers to the number of quadrats taken within a target
area, will be compared. The aim of the study is to develop an SfM-based monitoring
framework for the estimation of seascape metrics using semi-autonomous vehicles with
embedded cameras for imagery collection for the case of the study area of Ponta do
Ouro, Mozambique. This will be achieved through the following overarching objectives:
(1) to quantify the trade-offs between sample scale and robustness in seascape metric
estimation;
(2) to quantify the trade-offs between sample quadrat density and robustness in
seascape metrics estimation;
(3) to define a set of guidelines for seascape metric estimation based on findings from
(1) and (2).
Chapter 2. High Resolution Orthomosaics of African Coral Reefs: A Toolfor Wide-Scale Benthic Monitoring 14
2.2 Material and Methods
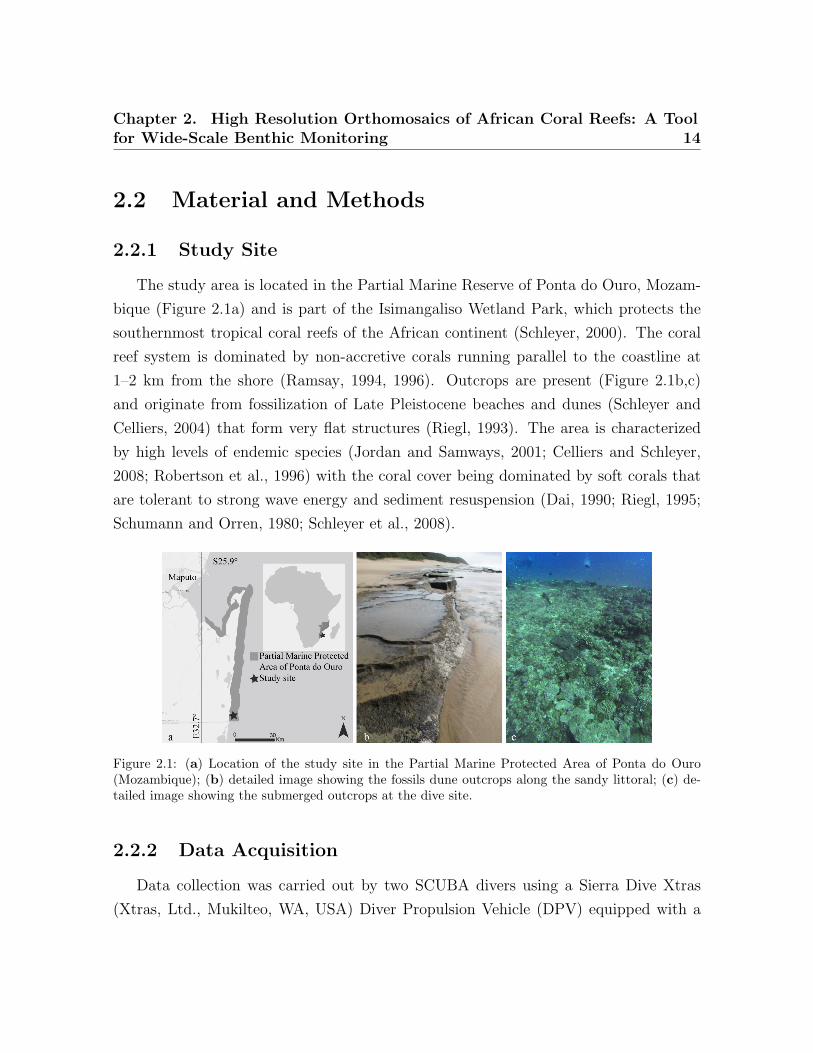
2.2.1 Study Site
The study area is located in the Partial Marine Reserve of Ponta do Ouro, Mozam-
bique (Figure 2.1a) and is part of the Isimangaliso Wetland Park, which protects the
southernmost tropical coral reefs of the African continent (Schleyer, 2000). The coral
reef system is dominated by non-accretive corals running parallel to the coastline at
1–2 km from the shore (Ramsay, 1994, 1996). Outcrops are present (Figure 2.1b,c)
and originate from fossilization of Late Pleistocene beaches and dunes (Schleyer and
Celliers, 2004) that form very flat structures (Riegl, 1993). The area is characterized
by high levels of endemic species (Jordan and Samways, 2001; Celliers and Schleyer,
2008; Robertson et al., 1996) with the coral cover being dominated by soft corals that
are tolerant to strong wave energy and sediment resuspension (Dai, 1990; Riegl, 1995;
Schumann and Orren, 1980; Schleyer et al., 2008).
Figure 2.1: (a) Location of the study site in the Partial Marine Protected Area of Ponta do Ouro(Mozambique); (b) detailed image showing the fossils dune outcrops along the sandy littoral; (c) de-tailed image showing the submerged outcrops at the dive site.
2.2.2 Data Acquisition
Data collection was carried out by two SCUBA divers using a Sierra Dive Xtras
(Xtras, Ltd., Mukilteo, WA, USA) Diver Propulsion Vehicle (DPV) equipped with a
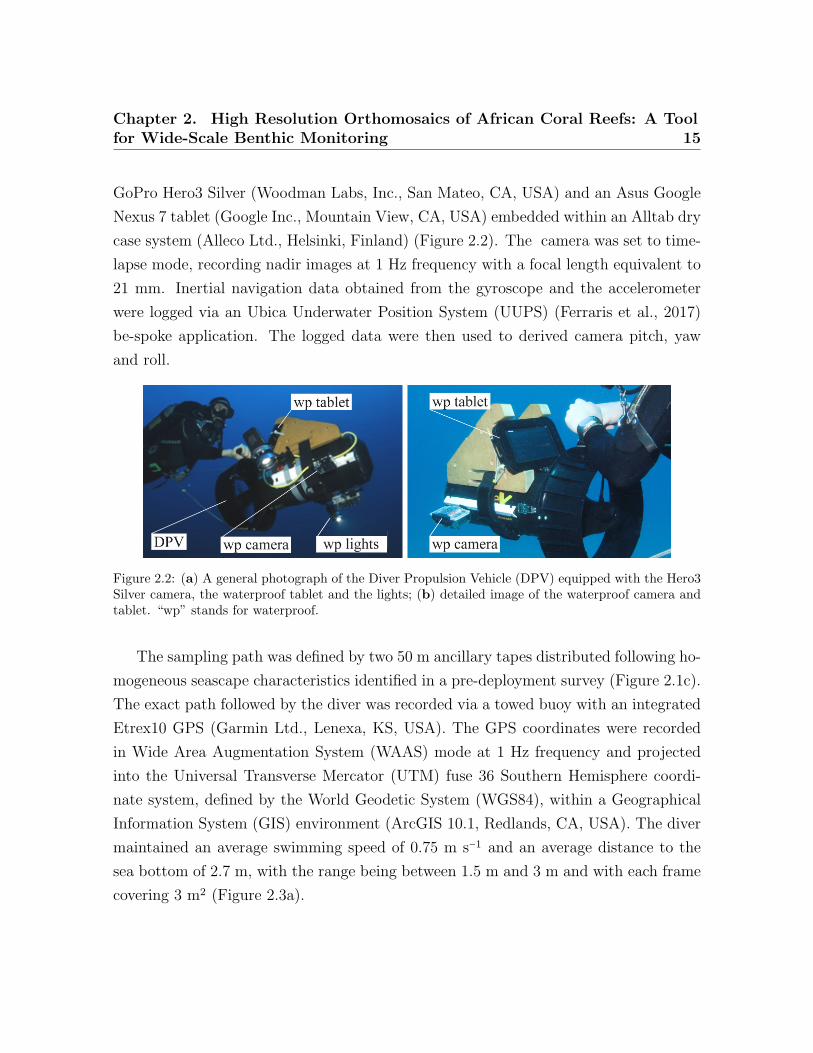
Chapter 2. High Resolution Orthomosaics of African Coral Reefs: A Toolfor Wide-Scale Benthic Monitoring 15
GoPro Hero3 Silver (Woodman Labs, Inc., San Mateo, CA, USA) and an Asus Google
Nexus 7 tablet (Google Inc., Mountain View, CA, USA) embedded within an Alltab dry
case system (Alleco Ltd., Helsinki, Finland) (Figure 2.2). The camera was set to time-
lapse mode, recording nadir images at 1 Hz frequency with a focal length equivalent to
21 mm. Inertial navigation data obtained from the gyroscope and the accelerometer
were logged via an Ubica Underwater Position System (UUPS) (Ferraris et al., 2017)
be-spoke application. The logged data were then used to derived camera pitch, yaw
and roll.
Figure 2.2: (a) A general photograph of the Diver Propulsion Vehicle (DPV) equipped with the Hero3Silver camera, the waterproof tablet and the lights; (b) detailed image of the waterproof camera andtablet. “wp” stands for waterproof.
The sampling path was defined by two 50 m ancillary tapes distributed following ho-
mogeneous seascape characteristics identified in a pre-deployment survey (Figure 2.1c).
The exact path followed by the diver was recorded via a towed buoy with an integrated
Etrex10 GPS (Garmin Ltd., Lenexa, KS, USA). The GPS coordinates were recorded
in Wide Area Augmentation System (WAAS) mode at 1 Hz frequency and projected
into the Universal Transverse Mercator (UTM) fuse 36 Southern Hemisphere coordi-
nate system, defined by the World Geodetic System (WGS84), within a Geographical
Information System (GIS) environment (ArcGIS 10.1, Redlands, CA, USA). The diver
maintained an average swimming speed of 0.75 m s−1 and an average distance to the
sea bottom of 2.7 m, with the range being between 1.5 m and 3 m and with each frame
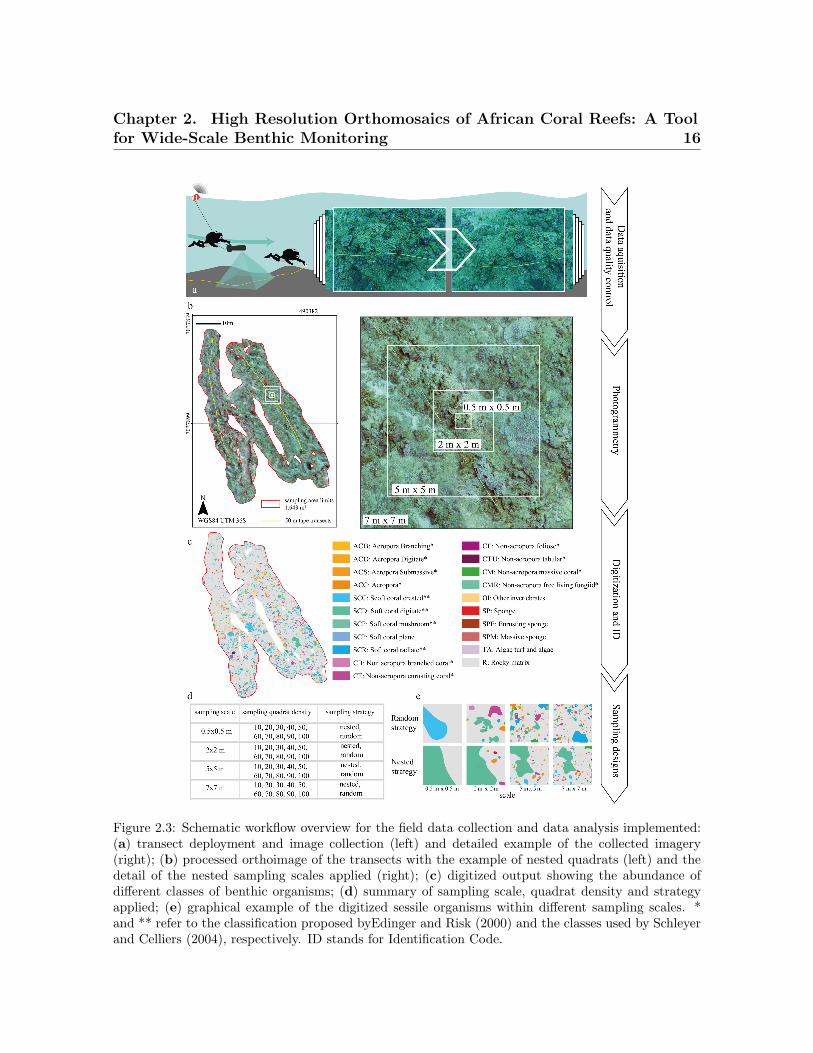
covering 3 m2 (Figure 2.3a).
Chapter 2. High Resolution Orthomosaics of African Coral Reefs: A Toolfor Wide-Scale Benthic Monitoring 16
Figure 2.3: Schematic workflow overview for the field data collection and data analysis implemented:(a) transect deployment and image collection (left) and detailed example of the collected imagery(right); (b) processed orthoimage of the transects with the example of nested quadrats (left) and thedetail of the nested sampling scales applied (right); (c) digitized output showing the abundance ofdifferent classes of benthic organisms; (d) summary of sampling scale, quadrat density and strategyapplied; (e) graphical example of the digitized sessile organisms within different sampling scales. *and ** refer to the classification proposed byEdinger and Risk (2000) and the classes used by Schleyerand Celliers (2004), respectively. ID stands for Identification Code.
Chapter 2. High Resolution Orthomosaics of African Coral Reefs: A Toolfor Wide-Scale Benthic Monitoring 17
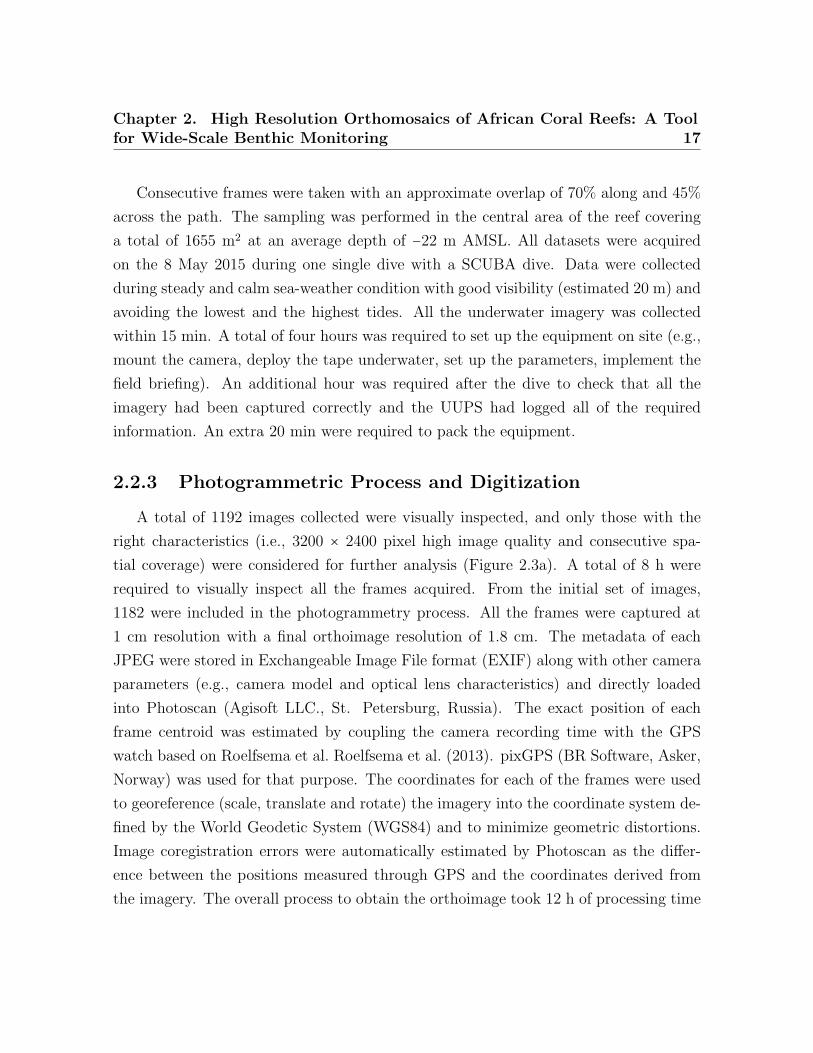
Consecutive frames were taken with an approximate overlap of 70% along and 45%
across the path. The sampling was performed in the central area of the reef covering
a total of 1655 m2 at an average depth of −22 m AMSL. All datasets were acquired
on the 8 May 2015 during one single dive with a SCUBA dive. Data were collected
during steady and calm sea-weather condition with good visibility (estimated 20 m) and
avoiding the lowest and the highest tides. All the underwater imagery was collected
within 15 min. A total of four hours was required to set up the equipment on site (e.g.,
mount the camera, deploy the tape underwater, set up the parameters, implement the
field briefing). An additional hour was required after the dive to check that all the
imagery had been captured correctly and the UUPS had logged all of the required
information. An extra 20 min were required to pack the equipment.
2.2.3 Photogrammetric Process and Digitization
A total of 1192 images collected were visually inspected, and only those with the
right characteristics (i.e., 3200 × 2400 pixel high image quality and consecutive spa-
tial coverage) were considered for further analysis (Figure 2.3a). A total of 8 h were
required to visually inspect all the frames acquired. From the initial set of images,
1182 were included in the photogrammetry process. All the frames were captured at
1 cm resolution with a final orthoimage resolution of 1.8 cm. The metadata of each
JPEG were stored in Exchangeable Image File format (EXIF) along with other camera
parameters (e.g., camera model and optical lens characteristics) and directly loaded
into Photoscan (Agisoft LLC., St. Petersburg, Russia). The exact position of each
frame centroid was estimated by coupling the camera recording time with the GPS
watch based on Roelfsema et al. Roelfsema et al. (2013). pixGPS (BR Software, Asker,
Norway) was used for that purpose. The coordinates for each of the frames were used
to georeference (scale, translate and rotate) the imagery into the coordinate system de-
fined by the World Geodetic System (WGS84) and to minimize geometric distortions.
Image coregistration errors were automatically estimated by Photoscan as the differ-
ence between the positions measured through GPS and the coordinates derived from
the imagery. The overall process to obtain the orthoimage took 12 h of processing time

Chapter 2. High Resolution Orthomosaics of African Coral Reefs: A Toolfor Wide-Scale Benthic Monitoring 18
based on the performance of an Asus laptop (Beitou District, Taipei, Taiwan) with an
Intel Core i7-3630QM 2.40-GHz processor (Intel Corporation, Santa Clara, CA, USA),
16 Gb RAM and graphic card NVIDIA Geoforce GTX 670M (NVIDIA Corporation,
Santa Clara, CA, USA).
Mega-epibenthic sessile organisms (i.e., seabed living organisms with a body diame-
ter of 5 cm approximately) were manually identified and digitized to the finest possible
taxonomic level and then clustered according with common morphological characteris-
tics following the approach by Edinger and Risk (2000) and the descriptions published
by Schleyer and Celliers (2004). The morphological classification also accounted for
non-coral organisms, such as sponges and other sessile invertebrates (i.e., tunicates
and ascidians). The orthoimage was digitized manually and classified within ArcGIS
(Figures 2.3b,c and 2.4a,b). The background rocky substrate, within which patches
were embedded as “islands”, was considered as the seascape matrix (i.e., rocky matrix)
following the island biogeography theory proposed by MacArthur and Wilson (2015).
The digitization process required 21 days (i.e., 147 h at 7 h per day). A total of 7547
individual organisms were digitized from the orthoimage.
2.2.4 Seascape Metric Estimation
Seascape metrics were estimated from the orthoimage for a set of different sampling
designs described by all the possible combinations of a range of sampling scales, quadrat
densities and sampling strategies. Within the scope of this study, the sampling scale
refers to the size of the sampling quadrats and ranged from 0.5 m × 0.5 m–7 m × 7 m
(Figure 2.3d); the quadrat density is the number of quadrats taken within the target
area and ranged from 10–100 in consecutive increments of 10 quadrats; and the sampling
strategy refers to the spatial distribution of the samples (i.e., nested or random) (Figure
2.3e). The sampling designs were overlaid onto the orthoimage within ArcGIS.
Nested sampling approaches require the overlap of quadrat centroids of consecutively
increasing scales. Each scale appears only once in each set of overlapped centroids, with
each set being randomly distributed across the reef. The range of values considered for
the sampling scale, quadrat density and sampling strategy was selected based on the
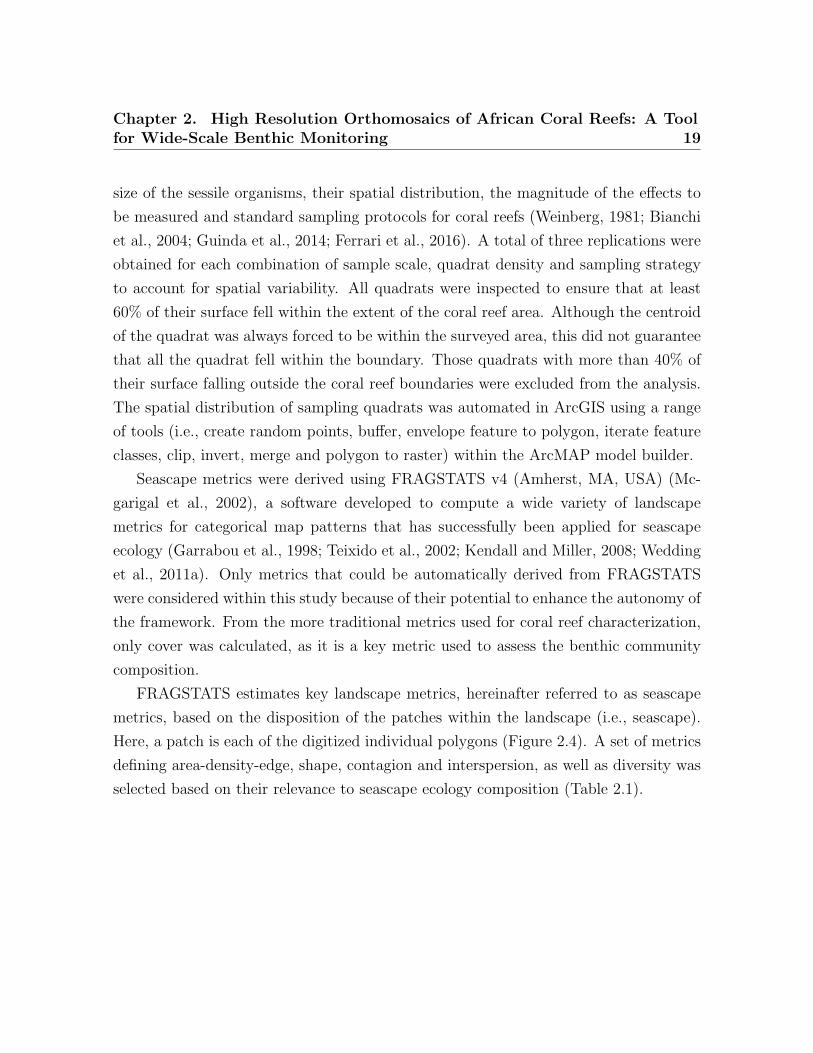
Chapter 2. High Resolution Orthomosaics of African Coral Reefs: A Toolfor Wide-Scale Benthic Monitoring 19
size of the sessile organisms, their spatial distribution, the magnitude of the effects to
be measured and standard sampling protocols for coral reefs (Weinberg, 1981; Bianchi
et al., 2004; Guinda et al., 2014; Ferrari et al., 2016). A total of three replications were
obtained for each combination of sample scale, quadrat density and sampling strategy
to account for spatial variability. All quadrats were inspected to ensure that at least
60% of their surface fell within the extent of the coral reef area. Although the centroid
of the quadrat was always forced to be within the surveyed area, this did not guarantee
that all the quadrat fell within the boundary. Those quadrats with more than 40% of
their surface falling outside the coral reef boundaries were excluded from the analysis.
The spatial distribution of sampling quadrats was automated in ArcGIS using a range
of tools (i.e., create random points, buffer, envelope feature to polygon, iterate feature
classes, clip, invert, merge and polygon to raster) within the ArcMAP model builder.
Seascape metrics were derived using FRAGSTATS v4 (Amherst, MA, USA) (Mc-
garigal et al., 2002), a software developed to compute a wide variety of landscape
metrics for categorical map patterns that has successfully been applied for seascape
ecology (Garrabou et al., 1998; Teixido et al., 2002; Kendall and Miller, 2008; Wedding
et al., 2011a). Only metrics that could be automatically derived from FRAGSTATS
were considered within this study because of their potential to enhance the autonomy of
the framework. From the more traditional metrics used for coral reef characterization,
only cover was calculated, as it is a key metric used to assess the benthic community
composition.
FRAGSTATS estimates key landscape metrics, hereinafter referred to as seascape
metrics, based on the disposition of the patches within the landscape (i.e., seascape).
Here, a patch is each of the digitized individual polygons (Figure 2.4). A set of metrics
defining area-density-edge, shape, contagion and interspersion, as well as diversity was
selected based on their relevance to seascape ecology composition (Table 2.1).

Chapter 2. High Resolution Orthomosaics of African Coral Reefs: A Toolfor Wide-Scale Benthic Monitoring 20
Figure 2.4: (a) The processed orthoimage; (b) the map of the digitized benthic organisms; (c) theconfiguration of the digitized sessile organism within the case study area of Ponta do Ouro PartialMarine Reserve (Mozambique). * and ** refer to the classification proposed by Edinger and Risk(2000) and the classes used by Schleyer and Celliers (2004), respectively.

Chapter 2. High Resolution Orthomosaics of African Coral Reefs: A Toolfor Wide-Scale Benthic Monitoring 21
Area-density-edge metrics relate to the number and size of sessile organisms and
the amount of edges created by them. Here, the edge is the border between adjacent
patches. This group of metrics includes the Landscape Shape Index (LSI) and the
Largest Patch Index (LPI) (Mcgarigal et al., 2002). LSI informs about the morpho-
logical aggregation of the patches within a standardized seascape square. The value
of LSI increases without limit from 1 upwards as the seascape becomes disaggregated,
where 1 represents minimum disaggregation. LPI informs about the clumpiness of the
seascape as the percentage value within a standardized seascape square. It is a measure
of patch dominance; LPI values of 100% indicate that the seascape unit is dominated by
a single patch. Both LSI and LPI provide information on the composition of the sessile
organism communities in size per class and on the structure of the reef; seascapes that
are highly subdivided into small patches are characteristics of low colonized substrates
where colonies have difficulties settling and cannot reach typical dimensions. This can
be caused by multiple factors, such as sediment resuspension and deposition or high
wave energy (Schleyer et al., 2008).
Shape metrics (i.e., Perimeter Area Ratio (PARA)(Mcgarigal et al., 2002; McGarigal
and Marks, 1995)) are directly estimated from the shape of the organisms. In particular,
PARA estimates the ratio between the perimeter and the area of all the patches within
the seascape unit and provides information on the shape complexity of the patches in
the seascape; an increase in the size of the patch results in a decrease in the value
of PARA. PARA is always larger than 0 and does not have an upper limit. The
PARA value could be interpreted as a good indicator of the growth conditions of corals;
corals show constant radial allometric growth (Dornelas et al., 2017), but this can be
affected by external factors, such as intra-specific and inter-specific competition and
hydrodynamic conditions. Under affected allometric growth conditions, larger PARA
values are to be expected.
Contagion and dispersion metrics (i.e., Aggregation Index (AI) and Division index
(DIVISION)) (Mcgarigal et al., 2002) look at the seascape texture by examining the
aggregation and intermix of the class of organisms. AI (He et al., 2000; Mcgarigal
et al., 2002) quantifies the adjacencies per patch type within the seascape and informs
on the homogeneity of the composition of the benthic communities. It ranges from 0%

Chapter 2. High Resolution Orthomosaics of African Coral Reefs: A Toolfor Wide-Scale Benthic Monitoring 22
(maximum patch disaggregation) to 100% (maximum patch aggregation). High values
of AI indicate that the classes of patches are more clustered within the landscape. This
could inform about the reproductive biology of the species considered and the popula-
tion dynamics; species with short larval dispersion tend to create clusters of individuals
near the organism. These species are more sensitive to local extinctions (Cowen and
Sponaugle, 2009). Instead, DIVISION measures the heterogeneity of the seascape and
estimates the variability in patch types within the seascape. DIVISION ranges from
0–1, where a 0 value indicates maximum aggregation, and values close to 1 indicate
maximum disaggregation. These indexes provide information on the composition of
the coral and the planar morphology of the colonies within the seascape; heterogeneous
seascapes are composed by a varied benthic community or placed at the edge of the
reef, where just a few individuals per specie are settled.
Diversity metrics focus on the number of organisms and their distribution within
the seascape. They are an indication of the resilience of the coral reef and its ability
to withstand significant disturbances (Nystrom, 2006). Within this group, five key
metrics have been estimated: Patch Richness (PR), Shannon’s Diversity Index (SHDI),
Simpson’s Diversity Index (SIDI), Shannon’s Evenness Index (SHEI) and Simpson’s
Evenness Index (SIEI) (Mcgarigal et al., 2002). PR informs about the number of patches
present within the seascape. SHDI (Spellerberg and Fedor, 2003) informs about the
number of different patch types within the seascape and how evenly these types are
distributed. SHDI can present any positive value from 0 upwards. Larger SHDI values
represent greater evenness amongst patch types within the seascape. SIDI (Somerfield
et al., 2008) informs about the probability that two entities (i.e., pixels) taken at random
from the same seascape belong to different patch types and ranges between 0 and 1.
Larger SIDI values indicate a greater probability that two pixels are from different
patch types. Both SHEI and SIEI estimate the proportion of the maximum Shannon’s
or Simpson’s diversity index, respectively. SHEI and SIEI range from 0–1, where 1
indicates that the area is distributed evenly among patch types.
Chapter 2. High Resolution Orthomosaics of African Coral Reefs: A Toolfor Wide-Scale Benthic Monitoring 23
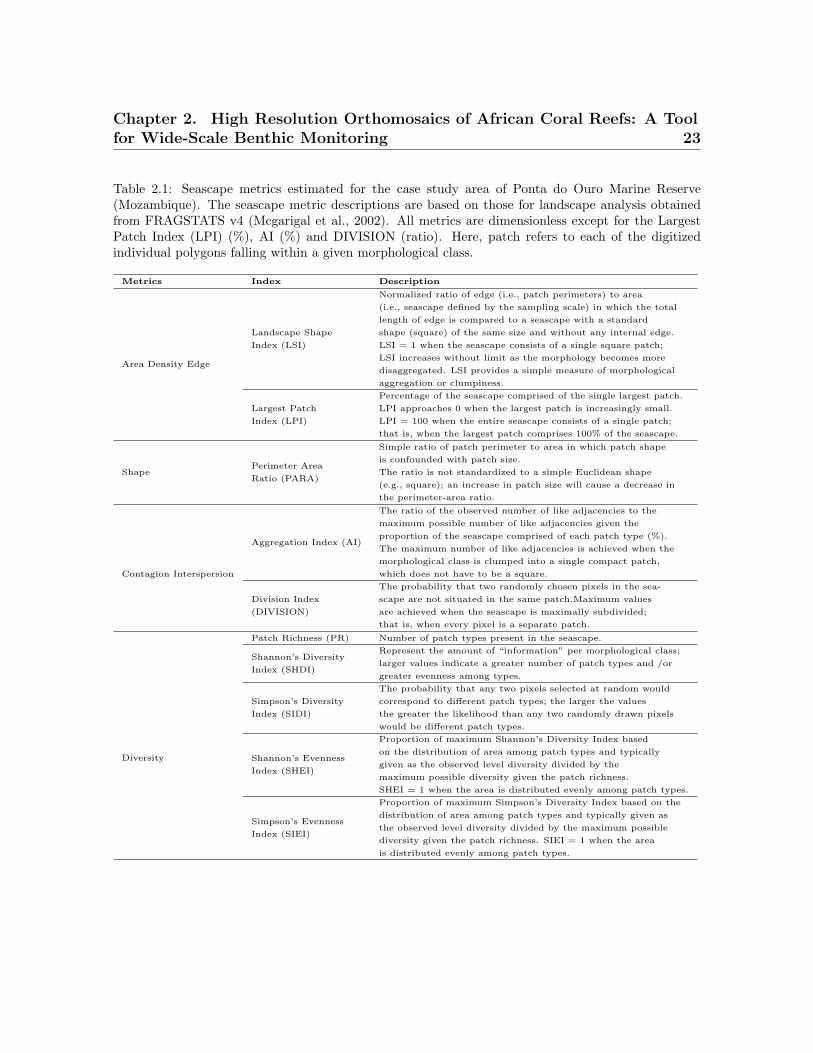
Table 2.1: Seascape metrics estimated for the case study area of Ponta do Ouro Marine Reserve(Mozambique). The seascape metric descriptions are based on those for landscape analysis obtainedfrom FRAGSTATS v4 (Mcgarigal et al., 2002). All metrics are dimensionless except for the LargestPatch Index (LPI) (%), AI (%) and DIVISION (ratio). Here, patch refers to each of the digitizedindividual polygons falling within a given morphological class.
Metrics Index Description
Area Density Edge
Landscape Shape
Normalized ratio of edge (i.e., patch perimeters) to area
Index (LSI)
(i.e., seascape defined by the sampling scale) in which the total
length of edge is compared to a seascape with a standard
shape (square) of the same size and without any internal edge.
LSI = 1 when the seascape consists of a single square patch;
LSI increases without limit as the morphology becomes more
disaggregated. LSI provides a simple measure of morphological
aggregation or clumpiness.
Largest Patch
Index (LPI)
Percentage of the seascape comprised of the single largest patch.
LPI approaches 0 when the largest patch is increasingly small.
LPI = 100 when the entire seascape consists of a single patch;
that is, when the largest patch comprises 100% of the seascape.
ShapePerimeter Area
Ratio (PARA)
Simple ratio of patch perimeter to area in which patch shape
is confounded with patch size.
The ratio is not standardized to a simple Euclidean shape
(e.g., square); an increase in patch size will cause a decrease in
the perimeter-area ratio.
Contagion Interspersion
Aggregation Index (AI)
The ratio of the observed number of like adjacencies to the
maximum possible number of like adjacencies given the
proportion of the seascape comprised of each patch type (%).
The maximum number of like adjacencies is achieved when the
morphological class is clumped into a single compact patch,
which does not have to be a square.
Division Index
(DIVISION)
The probability that two randomly chosen pixels in the sea-
scape are not situated in the same patch.Maximum values
are achieved when the seascape is maximally subdivided;
that is, when every pixel is a separate patch.
Diversity
Patch Richness (PR) Number of patch types present in the seascape.
Shannon’s Diversity
Index (SHDI)
Represent the amount of “information” per morphological class;
larger values indicate a greater number of patch types and /or
greater evenness among types.
Simpson’s Diversity
Index (SIDI)
The probability that any two pixels selected at random would
correspond to different patch types; the larger the values
the greater the likelihood than any two randomly drawn pixels
would be different patch types.
Shannon’s Evenness
Index (SHEI)
Proportion of maximum Shannon’s Diversity Index based
on the distribution of area among patch types and typically
given as the observed level diversity divided by the
maximum possible diversity given the patch richness.
SHEI = 1 when the area is distributed evenly among patch types.
Simpson’s Evenness
Index (SIEI)
Proportion of maximum Simpson’s Diversity Index based on the
distribution of area among patch types and typically given as
the observed level diversity divided by the maximum possible
diversity given the patch richness. SIEI = 1 when the area
is distributed evenly among patch types.
Chapter 2. High Resolution Orthomosaics of African Coral Reefs: A Toolfor Wide-Scale Benthic Monitoring 24
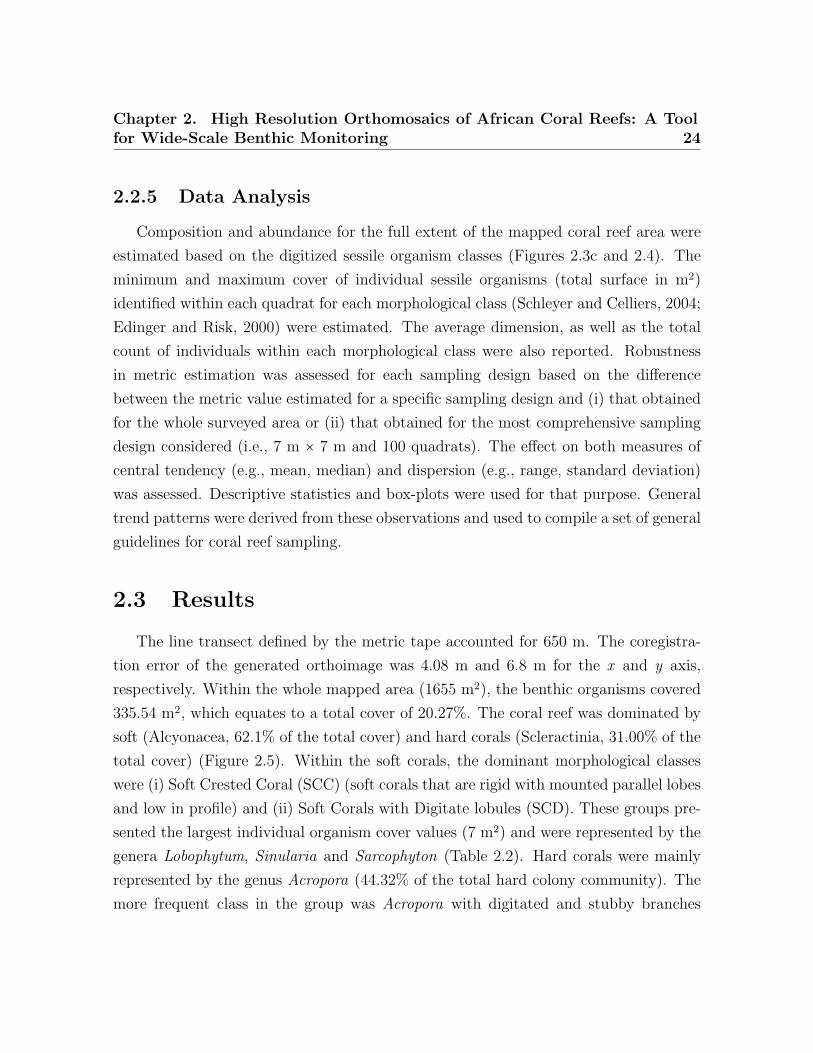
2.2.5 Data Analysis
Composition and abundance for the full extent of the mapped coral reef area were
estimated based on the digitized sessile organism classes (Figures 2.3c and 2.4). The
minimum and maximum cover of individual sessile organisms (total surface in m2)
identified within each quadrat for each morphological class (Schleyer and Celliers, 2004;
Edinger and Risk, 2000) were estimated. The average dimension, as well as the total
count of individuals within each morphological class were also reported. Robustness
in metric estimation was assessed for each sampling design based on the difference
between the metric value estimated for a specific sampling design and (i) that obtained
for the whole surveyed area or (ii) that obtained for the most comprehensive sampling
design considered (i.e., 7 m × 7 m and 100 quadrats). The effect on both measures of
central tendency (e.g., mean, median) and dispersion (e.g., range, standard deviation)
was assessed. Descriptive statistics and box-plots were used for that purpose. General
trend patterns were derived from these observations and used to compile a set of general
guidelines for coral reef sampling.
2.3 Results
The line transect defined by the metric tape accounted for 650 m. The coregistra-
tion error of the generated orthoimage was 4.08 m and 6.8 m for the x and y axis,
respectively. Within the whole mapped area (1655 m2), the benthic organisms covered
335.54 m2, which equates to a total cover of 20.27%. The coral reef was dominated by
soft (Alcyonacea, 62.1% of the total cover) and hard corals (Scleractinia, 31.00% of the
total cover) (Figure 2.5). Within the soft corals, the dominant morphological classes
were (i) Soft Crested Coral (SCC) (soft corals that are rigid with mounted parallel lobes
and low in profile) and (ii) Soft Corals with Digitate lobules (SCD). These groups pre-
sented the largest individual organism cover values (7 m2) and were represented by the
genera Lobophytum, Sinularia and Sarcophyton (Table 2.2). Hard corals were mainly
represented by the genus Acropora (44.32% of the total hard colony community). The
more frequent class in the group was Acropora with digitated and stubby branches
Chapter 2. High Resolution Orthomosaics of African Coral Reefs: A Toolfor Wide-Scale Benthic Monitoring 25
(ACD), presenting also the largest surface dimensions (Table 2.2).
Non-Acropora Massive or Multilobate Corals (CM) include Platygyra spp., Mon-
tastrea spp., Galaxea spp., Favites spp., Favia spp. and Turbinaria sp.. The average
size for this morphological class was 0.019 m2. In addition to the above groups, 141
colonies of free-living fungiid corals were identified. These showed an average dimen-
sion of 0.006129 m2 (Table 2.2) and also included 11 encrusting and dome-shaped
sponges. The Other Invertebrates (OI) presented the largest variance in surface dimen-
sion with the tunicate Atriolum robustum, accounting for 0.0008 m2, and the actinias
Stichodactyla spp., accounting for 1.04 m2. The background rocky substrate accounted
for 1150.55 m2 of the total area (69.52%). The 10.27% (168.84 m2) of the overall coral
reef area sampled, where individual organisms could not be identified, was not digitized.
The exclusion of quadrats with more than 40% of the area falling outside the coral
reef boundary or presenting non-textured classes did not influence the overall anal-
ysis; the number of samples available was large enough for the robust estimation of
the descriptive statistics, boxplots and associated metrics of species abundance and
composition (Table 2.3).
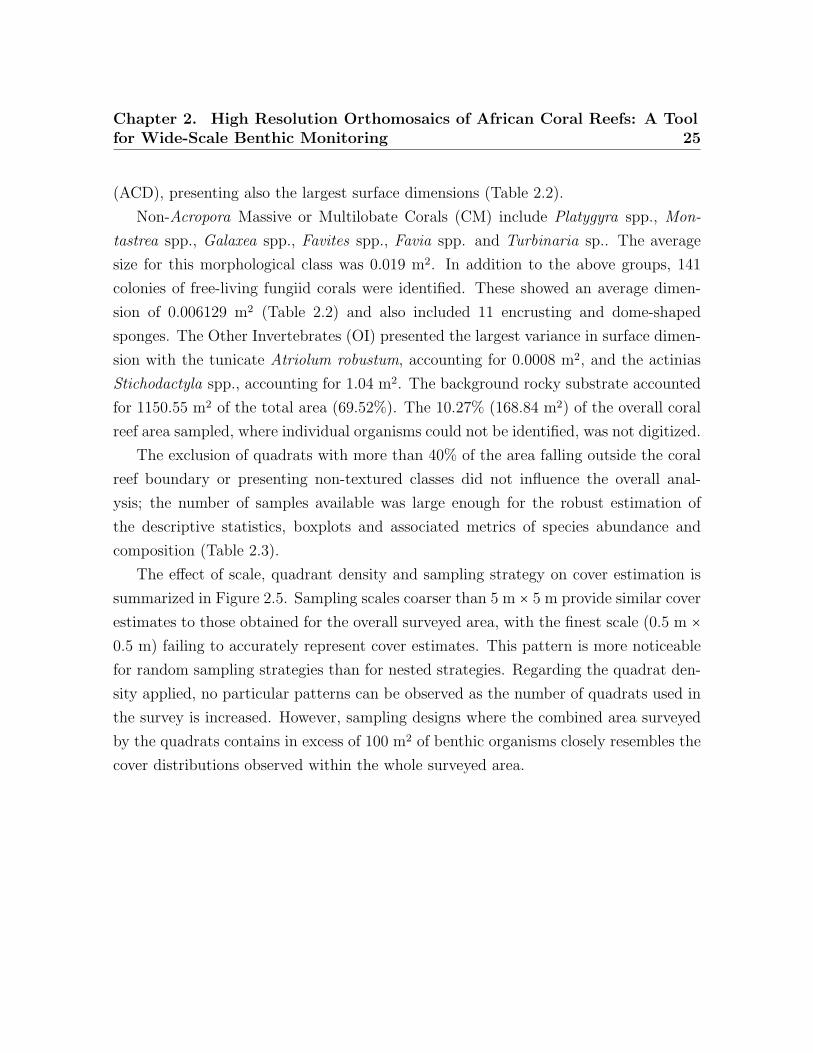
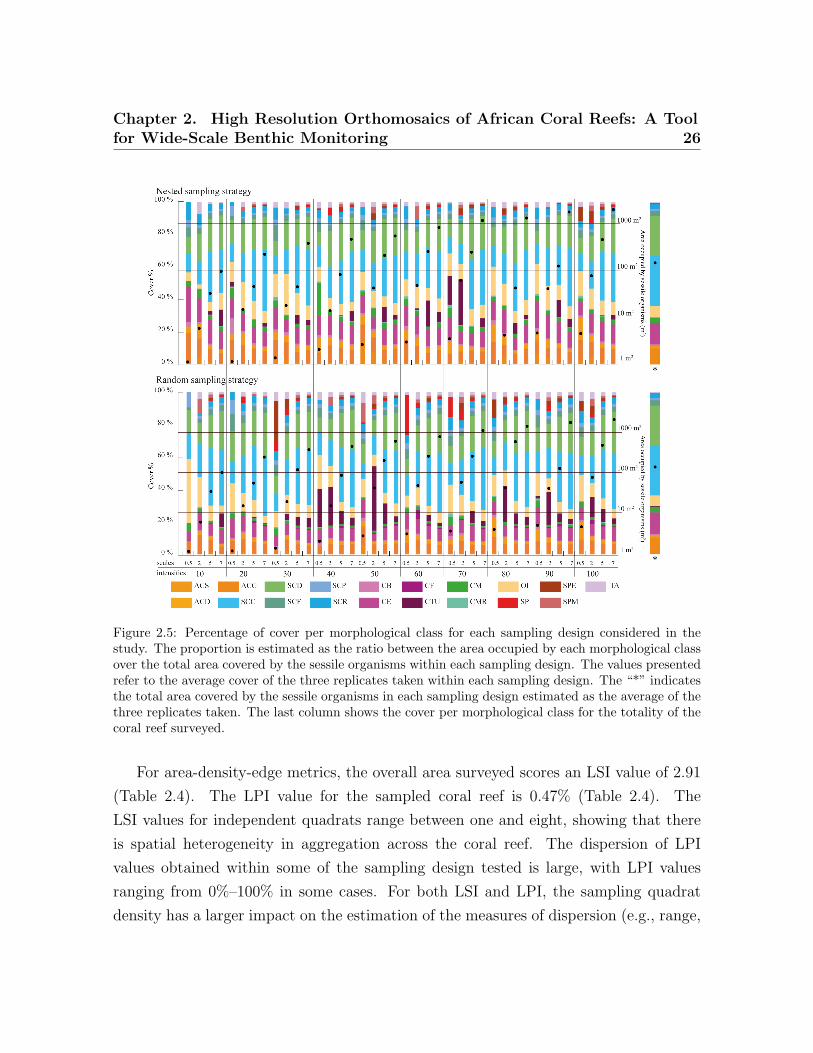
The effect of scale, quadrant density and sampling strategy on cover estimation is
summarized in Figure 2.5. Sampling scales coarser than 5 m × 5 m provide similar cover
estimates to those obtained for the overall surveyed area, with the finest scale (0.5 m ×
0.5 m) failing to accurately represent cover estimates. This pattern is more noticeable
for random sampling strategies than for nested strategies. Regarding the quadrat den-
sity applied, no particular patterns can be observed as the number of quadrats used in
the survey is increased. However, sampling designs where the combined area surveyed
by the quadrats contains in excess of 100 m2 of benthic organisms closely resembles the
cover distributions observed within the whole surveyed area.
Chapter 2. High Resolution Orthomosaics of African Coral Reefs: A Toolfor Wide-Scale Benthic Monitoring 26
Figure 2.5: Percentage of cover per morphological class for each sampling design considered in thestudy. The proportion is estimated as the ratio between the area occupied by each morphological classover the total area covered by the sessile organisms within each sampling design. The values presentedrefer to the average cover of the three replicates taken within each sampling design. The “*” indicatesthe total area covered by the sessile organisms in each sampling design estimated as the average of thethree replicates taken. The last column shows the cover per morphological class for the totality of thecoral reef surveyed.
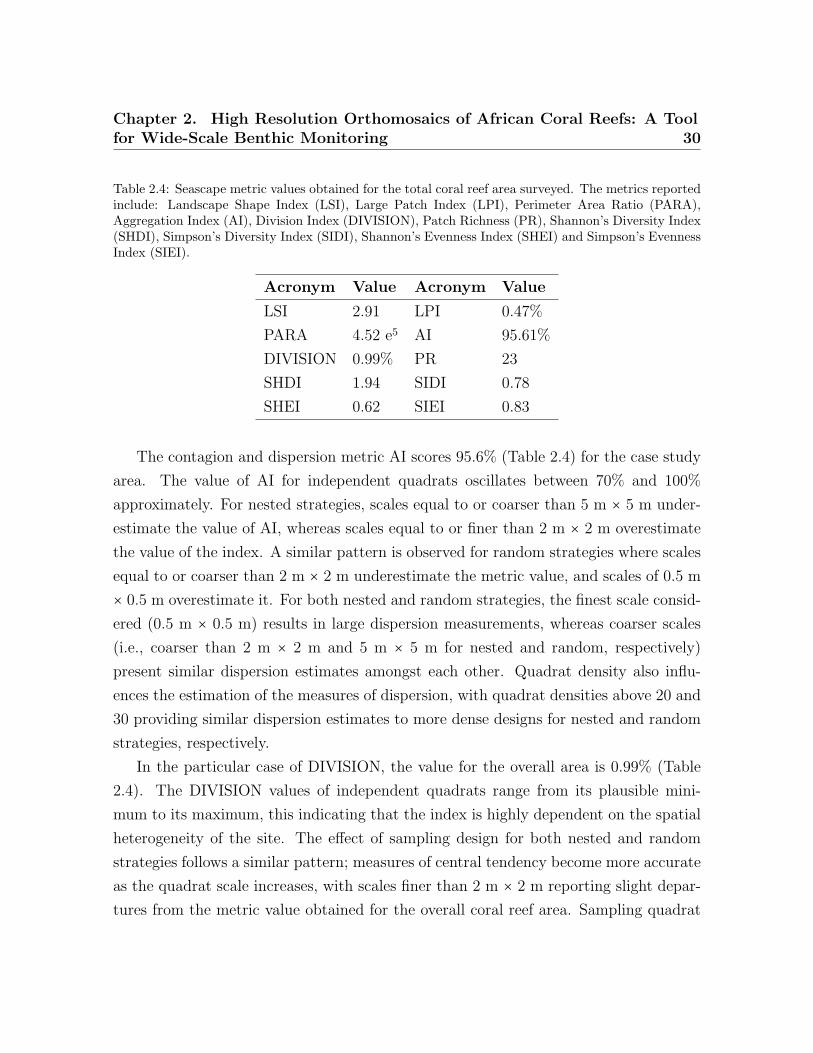
For area-density-edge metrics, the overall area surveyed scores an LSI value of 2.91
(Table 2.4). The LPI value for the sampled coral reef is 0.47% (Table 2.4). The
LSI values for independent quadrats range between one and eight, showing that there
is spatial heterogeneity in aggregation across the coral reef. The dispersion of LPI
values obtained within some of the sampling design tested is large, with LPI values
ranging from 0%–100% in some cases. For both LSI and LPI, the sampling quadrat
density has a larger impact on the estimation of the measures of dispersion (e.g., range,

Chapter 2. High Resolution Orthomosaics of African Coral Reefs: A Toolfor Wide-Scale Benthic Monitoring 27
standard deviation) than on the estimation of measures of central tendency (e.g., mean,
median). For LSI, quadrat densities above 70 are required to characterize the measures
of dispersion for nested strategies to the same level as the most comprehensive quadrat
density applied (i.e., 100), whereas quadrat densities above 40 are required for random
strategies. For LPI, quadrat densities above 40 and 30 are required to characterize the
measures of dispersion for nested and random strategies, respectively. In contrast, the
sampling scale has a larger impact on the measures of central tendency than on the
measures of dispersion. The finest scale (0.5 m × 0.5 m) presents the largest deviations
from the seascape metrics obtained for the overall coral reef area. For LPI, sampling
scales of 5 m × 5 m and 7 m × 7 m provided good approximations to the metrics
obtained for the totality of the coral reef area for both nested and random strategies
(Figures 2.6 and 2.7). However, for LSI, coarse scales (7 m × 7 m) were required for
both nested and random strategies.
Chapter 2. High Resolution Orthomosaics of African Coral Reefs: A Toolfor Wide-Scale Benthic Monitoring 28
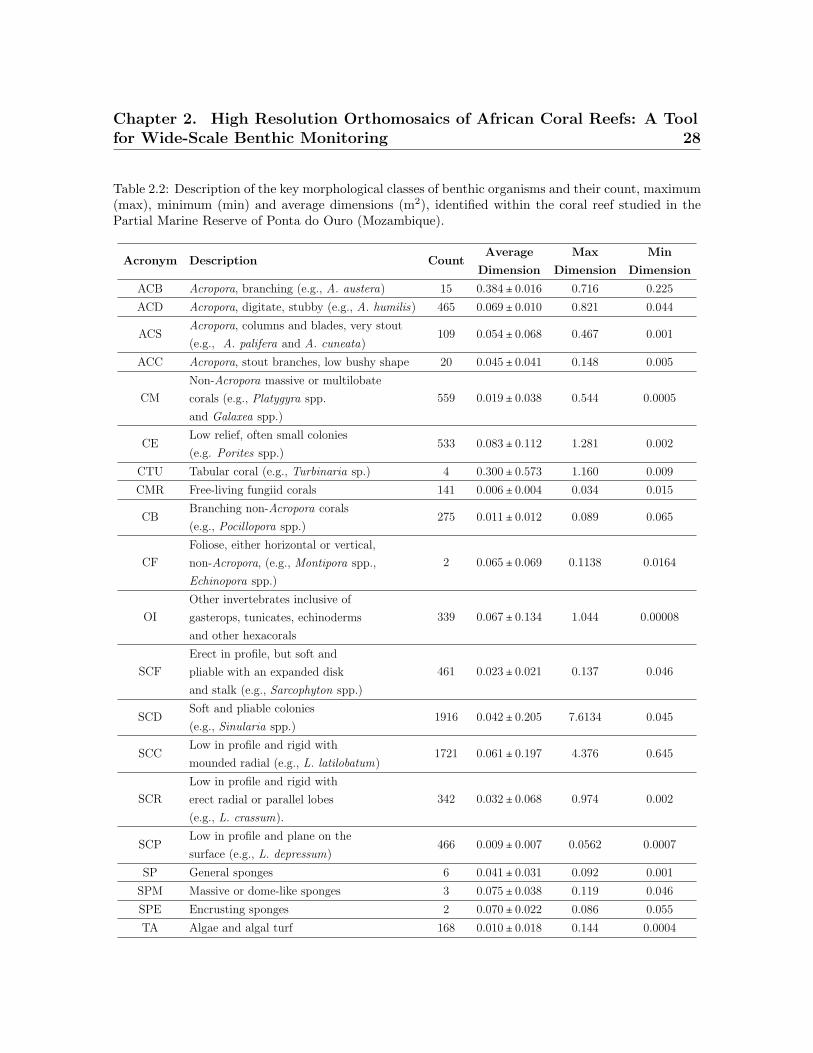
Table 2.2: Description of the key morphological classes of benthic organisms and their count, maximum(max), minimum (min) and average dimensions (m2), identified within the coral reef studied in thePartial Marine Reserve of Ponta do Ouro (Mozambique).
Acronym Description CountAverage
Dimension
Max
Dimension
Min
Dimension
ACB Acropora, branching (e.g., A. austera) 15 0.384 ± 0.016 0.716 0.225
ACD Acropora, digitate, stubby (e.g., A. humilis) 465 0.069 ± 0.010 0.821 0.044
ACSAcropora, columns and blades, very stout
(e.g., A. palifera and A. cuneata)109 0.054 ± 0.068 0.467 0.001
ACC Acropora, stout branches, low bushy shape 20 0.045 ± 0.041 0.148 0.005
CM
Non-Acropora massive or multilobate
corals (e.g., Platygyra spp.
and Galaxea spp.)
559 0.019 ± 0.038 0.544 0.0005
CELow relief, often small colonies
(e.g. Porites spp.)533 0.083 ± 0.112 1.281 0.002
CTU Tabular coral (e.g., Turbinaria sp.) 4 0.300 ± 0.573 1.160 0.009
CMR Free-living fungiid corals 141 0.006 ± 0.004 0.034 0.015
CBBranching non-Acropora corals
(e.g., Pocillopora spp.)275 0.011 ± 0.012 0.089 0.065
CF
Foliose, either horizontal or vertical,
non-Acropora, (e.g., Montipora spp.,
Echinopora spp.)
2 0.065 ± 0.069 0.1138 0.0164
OI
Other invertebrates inclusive of
gasterops, tunicates, echinoderms
and other hexacorals
339 0.067 ± 0.134 1.044 0.00008
SCF
Erect in profile, but soft and
pliable with an expanded disk
and stalk (e.g., Sarcophyton spp.)
461 0.023 ± 0.021 0.137 0.046
SCDSoft and pliable colonies
(e.g., Sinularia spp.)1916 0.042 ± 0.205 7.6134 0.045
SCCLow in profile and rigid with
mounded radial (e.g., L. latilobatum)1721 0.061 ± 0.197 4.376 0.645
SCR
Low in profile and rigid with
erect radial or parallel lobes
(e.g., L. crassum).
342 0.032 ± 0.068 0.974 0.002
SCPLow in profile and plane on the
surface (e.g., L. depressum)466 0.009 ± 0.007 0.0562 0.0007
SP General sponges 6 0.041 ± 0.031 0.092 0.001
SPM Massive or dome-like sponges 3 0.075 ± 0.038 0.119 0.046
SPE Encrusting sponges 2 0.070 ± 0.022 0.086 0.055
TA Algae and algal turf 168 0.010 ± 0.018 0.144 0.0004

Chapter 2. High Resolution Orthomosaics of African Coral Reefs: A Toolfor Wide-Scale Benthic Monitoring 29
The PARA shape metric (Figures 2.6 and 2.7) reaches values of 4.5 × 10⁵ (Table 2.4)
for the whole area surveyed. The multiple sampling scales considered report different
results in terms of measures of dispersion. Scales finer than 2 m × 2 m report dispersion
values considerably larger than coarser scales and are characterized by PARA metric
overestimation. The pattern is more prominent for nested strategies, where PARA val-
ues of individual quadrats reach magnitudes of 3 × 10⁶, whereas for random strategies,
the maximum values do not exceed magnitudes of 1.6 × 10⁶. The quadrat density
also influences the estimation of the measures of dispersion, with the range of PARA
decreasing as the number of quadrats increases for both nested and random sampling
strategies. Quadrat densities of 40 and 30 provide similar results to those obtained for
the maximum quadrat densities applied (i.e., 100) for nested and random strategies,
respectively.
Table 2.3: Sample size per combination of sampling scale, quadrat density and strategy considered,after exclusion of non-valid samples (i.e., quadrats with more than 40% of the area falling outside thecoral reef boundary or presenting non-textured morphological class).
Scale 0.5 m × 0.5 m 2 m × 2 m 5 m × 5 m 7 m × 7 mExpected
Density Random Nested Random Nested Random Nested Random Nested
10 24 25 29 28 28 28 27 27 30
20 50 49 54 56 53 53 44 44 60
30 73 70 78 83 80 80 73 73 90
40 91 98 113 116 108 108 109 109 120
50 127 117 142 142 136 136 130 130 150
60 145 146 178 176 167 167 161 162 180
70 164 161 201 204 202 202 190 190 210
80 191 187 237 234 225 225 223 223 240
90 213 216 260 265 244 245 250 250 270
100 240 239 287 290 291 290 270 282 300
Chapter 2. High Resolution Orthomosaics of African Coral Reefs: A Toolfor Wide-Scale Benthic Monitoring 30
Table 2.4: Seascape metric values obtained for the total coral reef area surveyed. The metrics reportedinclude: Landscape Shape Index (LSI), Large Patch Index (LPI), Perimeter Area Ratio (PARA),Aggregation Index (AI), Division Index (DIVISION), Patch Richness (PR), Shannon’s Diversity Index(SHDI), Simpson’s Diversity Index (SIDI), Shannon’s Evenness Index (SHEI) and Simpson’s EvennessIndex (SIEI).
Acronym Value Acronym Value
LSI 2.91 LPI 0.47%
PARA 4.52 e5 AI 95.61%
DIVISION 0.99% PR 23
SHDI 1.94 SIDI 0.78
SHEI 0.62 SIEI 0.83
The contagion and dispersion metric AI scores 95.6% (Table 2.4) for the case study
area. The value of AI for independent quadrats oscillates between 70% and 100%
approximately. For nested strategies, scales equal to or coarser than 5 m × 5 m under-
estimate the value of AI, whereas scales equal to or finer than 2 m × 2 m overestimate
the value of the index. A similar pattern is observed for random strategies where scales
equal to or coarser than 2 m × 2 m underestimate the metric value, and scales of 0.5 m
× 0.5 m overestimate it. For both nested and random strategies, the finest scale consid-
ered (0.5 m × 0.5 m) results in large dispersion measurements, whereas coarser scales
(i.e., coarser than 2 m × 2 m and 5 m × 5 m for nested and random, respectively)
present similar dispersion estimates amongst each other. Quadrat density also influ-
ences the estimation of the measures of dispersion, with quadrat densities above 20 and
30 providing similar dispersion estimates to more dense designs for nested and random
strategies, respectively.
In the particular case of DIVISION, the value for the overall area is 0.99% (Table
2.4). The DIVISION values of independent quadrats range from its plausible mini-
mum to its maximum, this indicating that the index is highly dependent on the spatial
heterogeneity of the site. The effect of sampling design for both nested and random
strategies follows a similar pattern; measures of central tendency become more accurate
as the quadrat scale increases, with scales finer than 2 m × 2 m reporting slight depar-
tures from the metric value obtained for the overall coral reef area. Sampling quadrat
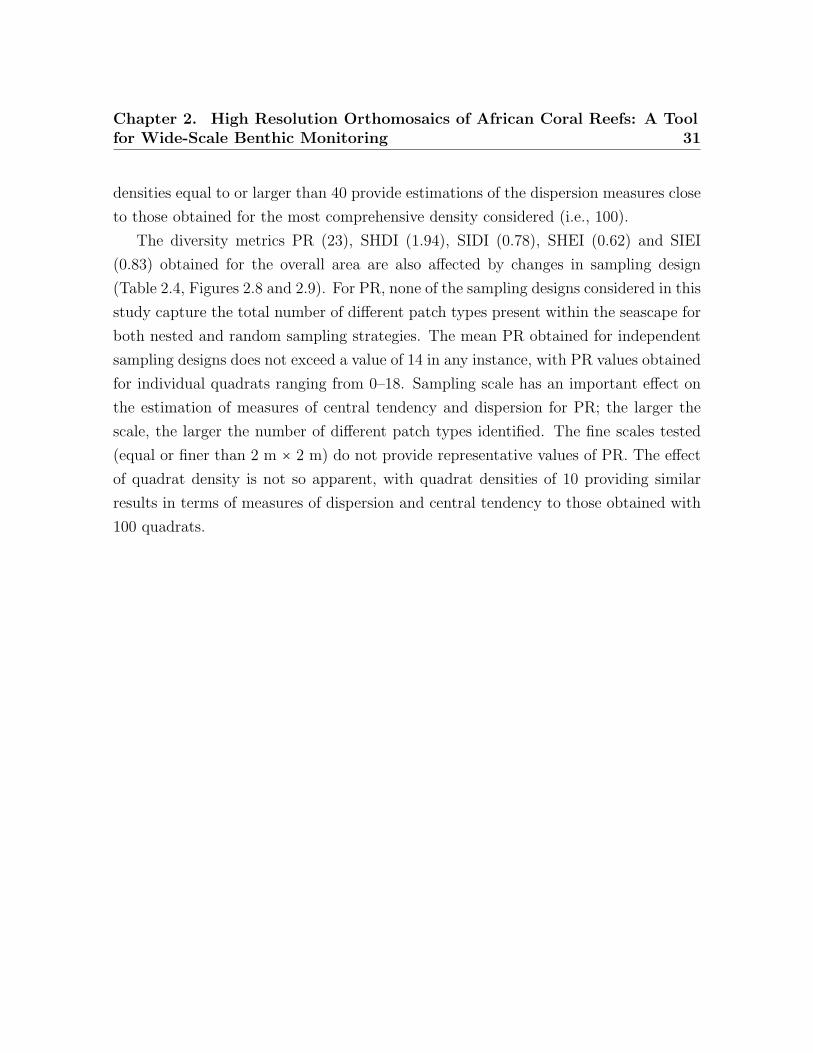
Chapter 2. High Resolution Orthomosaics of African Coral Reefs: A Toolfor Wide-Scale Benthic Monitoring 31
densities equal to or larger than 40 provide estimations of the dispersion measures close
to those obtained for the most comprehensive density considered (i.e., 100).
The diversity metrics PR (23), SHDI (1.94), SIDI (0.78), SHEI (0.62) and SIEI
(0.83) obtained for the overall area are also affected by changes in sampling design
(Table 2.4, Figures 2.8 and 2.9). For PR, none of the sampling designs considered in this
study capture the total number of different patch types present within the seascape for
both nested and random sampling strategies. The mean PR obtained for independent
sampling designs does not exceed a value of 14 in any instance, with PR values obtained
for individual quadrats ranging from 0–18. Sampling scale has an important effect on
the estimation of measures of central tendency and dispersion for PR; the larger the
scale, the larger the number of different patch types identified. The fine scales tested
(equal or finer than 2 m × 2 m) do not provide representative values of PR. The effect
of quadrat density is not so apparent, with quadrat densities of 10 providing similar
results in terms of measures of dispersion and central tendency to those obtained with
100 quadrats.
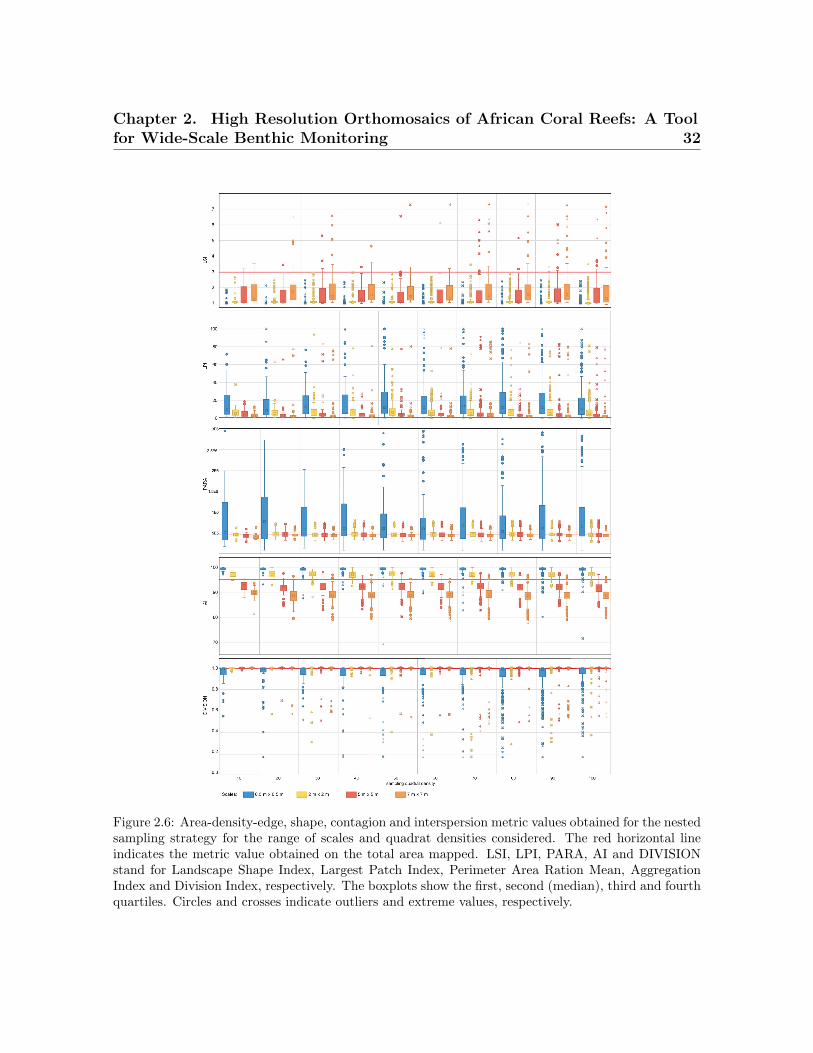
Chapter 2. High Resolution Orthomosaics of African Coral Reefs: A Toolfor Wide-Scale Benthic Monitoring 32
Figure 2.6: Area-density-edge, shape, contagion and interspersion metric values obtained for the nestedsampling strategy for the range of scales and quadrat densities considered. The red horizontal lineindicates the metric value obtained on the total area mapped. LSI, LPI, PARA, AI and DIVISIONstand for Landscape Shape Index, Largest Patch Index, Perimeter Area Ration Mean, AggregationIndex and Division Index, respectively. The boxplots show the first, second (median), third and fourthquartiles. Circles and crosses indicate outliers and extreme values, respectively.

Chapter 2. High Resolution Orthomosaics of African Coral Reefs: A Toolfor Wide-Scale Benthic Monitoring 33
Figure 2.7: Area-density-edge, shape, contagion and interspersion metric values obtained for the ran-dom sampling strategy for the range of scales and quadrat densities considered. The red horizontal lineindicates the metric value obtained on the total area mapped. LSI, LPI, PARA, AI and DIVISIONstand for Landscape Shape Index, Largest Patch Index, Perimeter Area Ration Mean, AggregationIndex and Division Index, respectively. The boxplots show the first, second (median), third and fourthquartiles. Circles and crosses indicate outliers and extreme values, respectively.
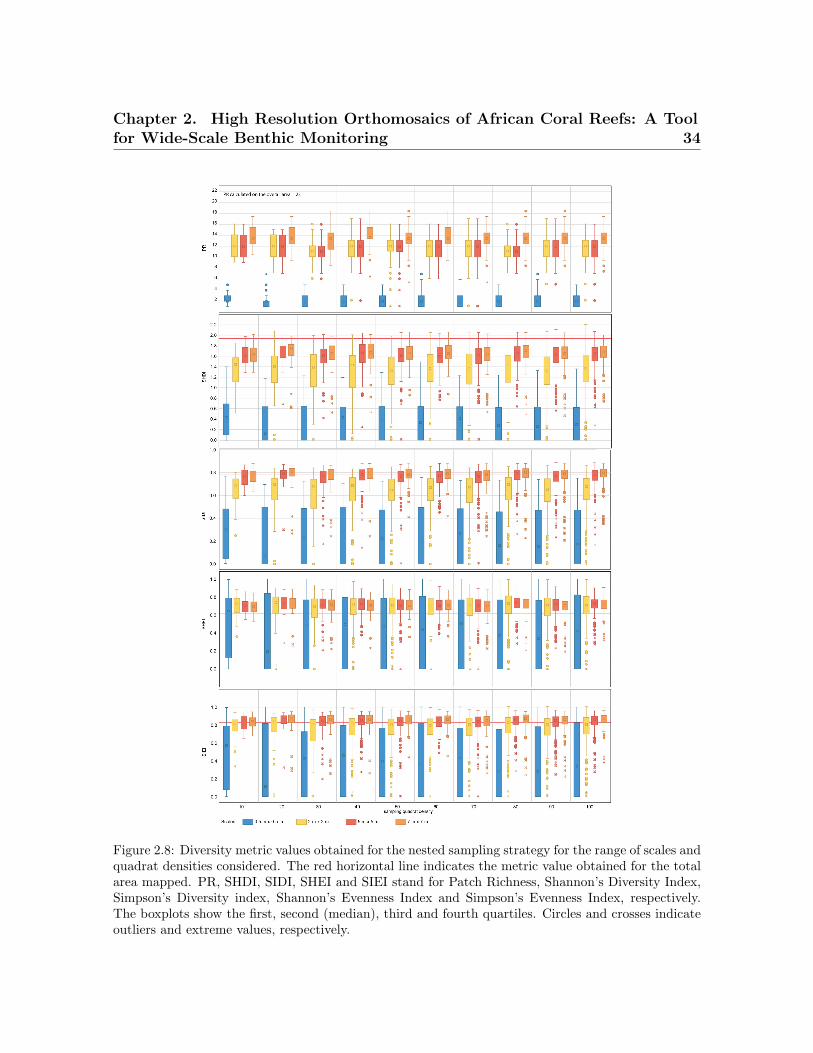
Chapter 2. High Resolution Orthomosaics of African Coral Reefs: A Toolfor Wide-Scale Benthic Monitoring 34
Figure 2.8: Diversity metric values obtained for the nested sampling strategy for the range of scales andquadrat densities considered. The red horizontal line indicates the metric value obtained for the totalarea mapped. PR, SHDI, SIDI, SHEI and SIEI stand for Patch Richness, Shannon’s Diversity Index,Simpson’s Diversity index, Shannon’s Evenness Index and Simpson’s Evenness Index, respectively.The boxplots show the first, second (median), third and fourth quartiles. Circles and crosses indicateoutliers and extreme values, respectively.
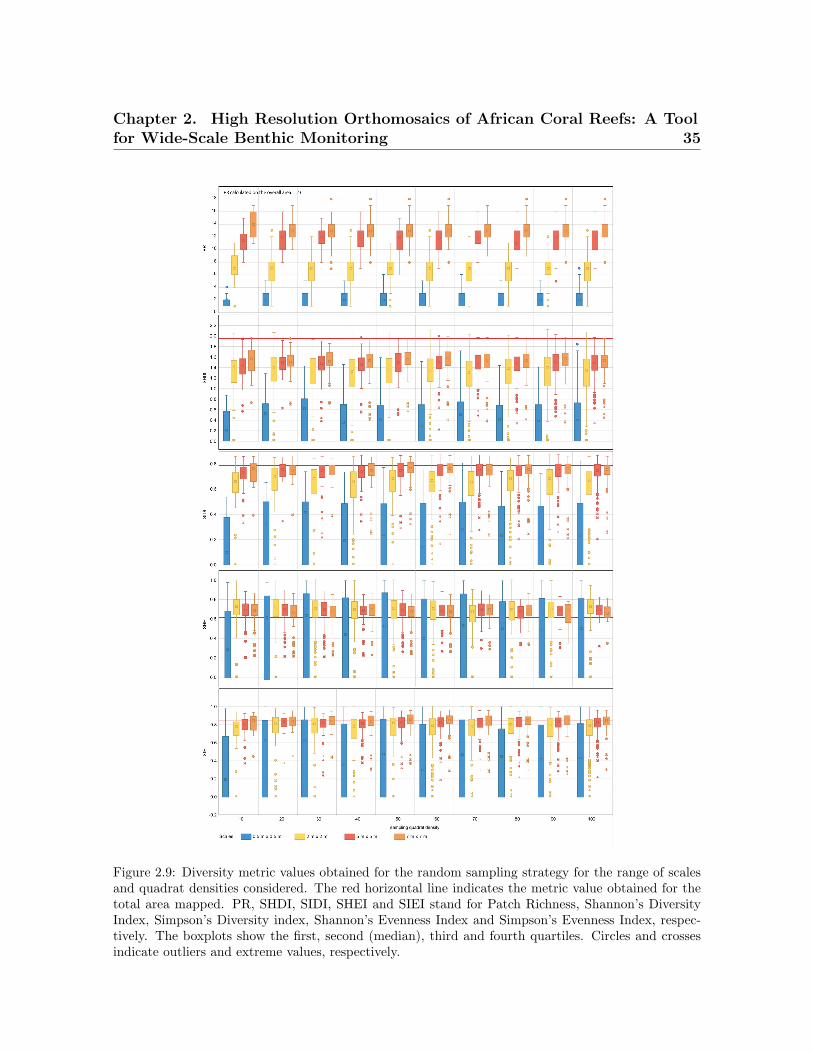
Chapter 2. High Resolution Orthomosaics of African Coral Reefs: A Toolfor Wide-Scale Benthic Monitoring 35
Figure 2.9: Diversity metric values obtained for the random sampling strategy for the range of scalesand quadrat densities considered. The red horizontal line indicates the metric value obtained for thetotal area mapped. PR, SHDI, SIDI, SHEI and SIEI stand for Patch Richness, Shannon’s DiversityIndex, Simpson’s Diversity index, Shannon’s Evenness Index and Simpson’s Evenness Index, respec-tively. The boxplots show the first, second (median), third and fourth quartiles. Circles and crossesindicate outliers and extreme values, respectively.
Chapter 2. High Resolution Orthomosaics of African Coral Reefs: A Toolfor Wide-Scale Benthic Monitoring 36
For SHDI and SIDI, the sampling design has a considerable effect on the estimation
of the values of dispersion and central tendency, for both nested and random designs.
Sampling scales equal to or finer than 5 m × 5 m for SHDI and 2 m × 2 m for SIDI
fail to provide reliable metric estimates. The values of SHDI for individual quadrats
oscillate between zero and two, with SIDI oscillating between zero and 0.9. SHEI and
SIEI present a similar pattern to that described for SHDI and SIDI. However, for both
metrics, sampling scales equal to or finer than 2 m × 2 m fail to provide close estimates
of central tendency.
2.4 Discussion
The results herein presented inform about the effect that sampling scale, quadrat
density and strategy have on the estimation of specific seascape metrics and address
the following objectives: (1) to quantify the trade-offs between sample scale and ro-
bustness in seascape metric estimation; (2) to quantify the trade-offs between sample
quadrat density and robustness in seascape metric estimation; and (3) to develop a
set of guidelines for seascape metric estimation based on the findings from (1) and
(2). We acknowledge that other authors (Garrabou et al., 1998; Hawkins and Hartnoll,
1980; Sleeman et al., 2005; Teixido et al., 2002) successfully estimated those seascape
metrics, and their experience has been fundamental for the selection of parameters in
this study. For example, Hawkins and Hartnoll (1980) estimated the species richness
in intertidal benthic communities and highlighted the importance of calibrating the
sample area based on the organism dimensions. They showed the effect that sample
area had on different communities with different abundance and richness in species.
Teixido et al. (2002) estimated a set of FRAGSTAT metrics for the characterization of
the Antarctic mega-benthic communities across six stations. In their study, only one
picture with a 1 m2 footprint was taken at each station. The results indicated that
the set of metrics used to characterize a coral reef must be defined and tailored to the
case study area. Sleeman et al. (2005) tested several metrics on seagrass meadow and
reported the importance of defining a standard area for a meaningful interpretation of
the ecological relevance of the metric. Garrabou et al. (1998) investigated the spatial

Chapter 2. High Resolution Orthomosaics of African Coral Reefs: A Toolfor Wide-Scale Benthic Monitoring 37
and temporal dynamics on rocky bottom benthic communities and successfully intro-
duced the novel used of a set of area-perimeter-edge, shape, contagion interspersion and
diversity metrics. However, none of these studies have assessed the combined effect of
sampling scale, quadrat density and sampling strategy for the estimation of seascape
metrics for high resolution coral reef sampling and SfM analysis.
Within the scope of Objectives (1) and (2), the area-density-edge seascape metrics
obtained for the case study area of Ponta Do Ouro describe a coral reef that is dis-
aggregated (LSI values around three) with low morphological class dominance (LPI =
0.47%). This is consistent with the cover value registered (69.52%), which indicates
that the patches are dispersed within the rocky matrix. The LSI and LPI metrics also
indicate that the sessile organisms within the surveyed area are present in a variety of
dimensions. Based on the work by Schleyer et al. (2008), this could be the result of
abrasion, caused by the combined effect of re-suspended sediments and waves energy,
affecting the growth of both soft and hard corals. As a reference, in (Teixido et al.,
2002), the Antarctic benthic communities analyzed scored LSI values between 2.88 and
7.47. These communities are characterized by multistoreyed assemblages, intermediate
to high species richness (Starmans and Gutt, 2002) and patchy distributions (Starmans
et al., 1999).
The description for the case study area of Ponta do Ouro may change depending on
the sampling design implemented. For the area-density-edge metrics, quadrat densities
below 70 for nested approaches and 40 for random would have failed to capture the
spatial heterogeneity of LSI within the landscape (Table 2.5). For LPI, a similar pattern
is encountered for quadrat densities below 40 and 30 for nested and random strategies,
respectively. As a result, the seascape would have been assumed to have a homogeneous
distribution of colonies, aggregation, clumpiness and dominance values based on the
configuration described by the few quadrats sampled. Similarly, the finest sampling
scales tested would have failed to provide representative values of area-density-edge
metrics for the coral reef area. The metrics would have indicated that the reef is slightly
more aggregated than observed and dominated by specific morphological classes. This
would have had considerable implications in the assessment of the conservation status
of the coral reef, its communities and their roles in supporting ecosystem services.
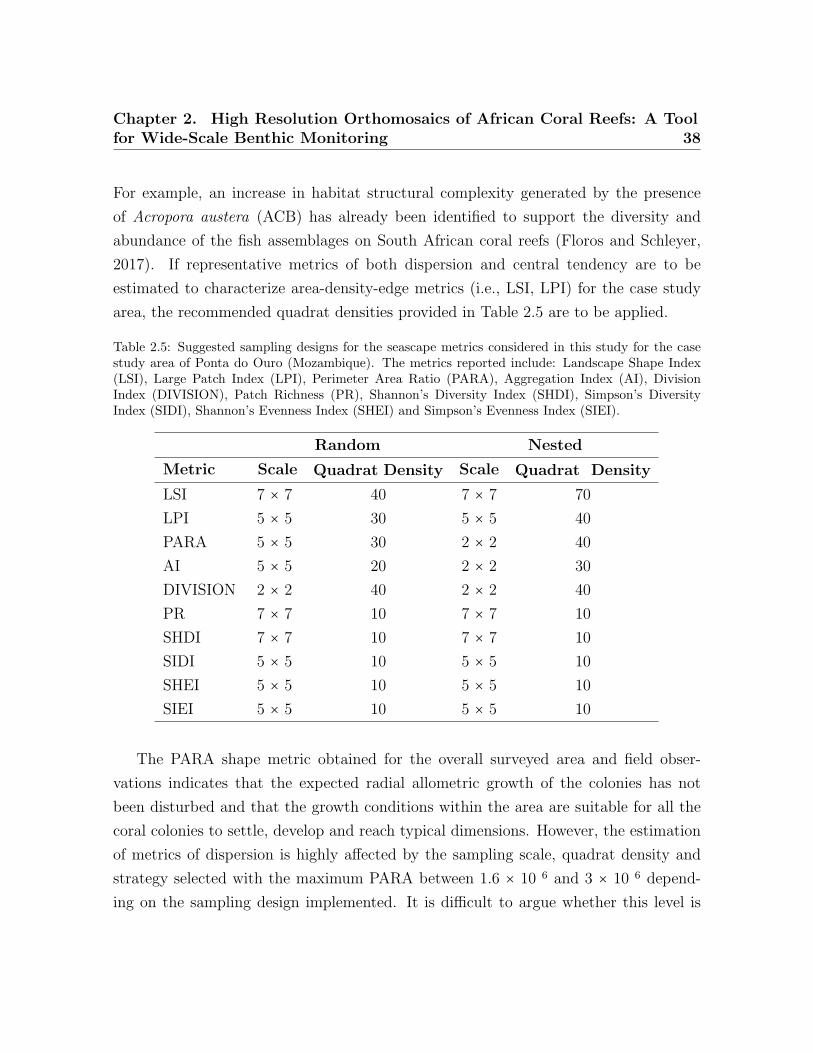
Chapter 2. High Resolution Orthomosaics of African Coral Reefs: A Toolfor Wide-Scale Benthic Monitoring 38
For example, an increase in habitat structural complexity generated by the presence
of Acropora austera (ACB) has already been identified to support the diversity and
abundance of the fish assemblages on South African coral reefs (Floros and Schleyer,
2017). If representative metrics of both dispersion and central tendency are to be
estimated to characterize area-density-edge metrics (i.e., LSI, LPI) for the case study
area, the recommended quadrat densities provided in Table 2.5 are to be applied.
Table 2.5: Suggested sampling designs for the seascape metrics considered in this study for the casestudy area of Ponta do Ouro (Mozambique). The metrics reported include: Landscape Shape Index(LSI), Large Patch Index (LPI), Perimeter Area Ratio (PARA), Aggregation Index (AI), DivisionIndex (DIVISION), Patch Richness (PR), Shannon’s Diversity Index (SHDI), Simpson’s DiversityIndex (SIDI), Shannon’s Evenness Index (SHEI) and Simpson’s Evenness Index (SIEI).
Random Nested
Metric Scale Quadrat Density Scale Quadrat Density
LSI 7 × 7 40 7 × 7 70
LPI 5 × 5 30 5 × 5 40
PARA 5 × 5 30 2 × 2 40
AI 5 × 5 20 2 × 2 30
DIVISION 2 × 2 40 2 × 2 40
PR 7 × 7 10 7 × 7 10
SHDI 7 × 7 10 7 × 7 10
SIDI 5 × 5 10 5 × 5 10
SHEI 5 × 5 10 5 × 5 10
SIEI 5 × 5 10 5 × 5 10
The PARA shape metric obtained for the overall surveyed area and field obser-
vations indicates that the expected radial allometric growth of the colonies has not
been disturbed and that the growth conditions within the area are suitable for all the
coral colonies to settle, develop and reach typical dimensions. However, the estimation
of metrics of dispersion is highly affected by the sampling scale, quadrat density and
strategy selected with the maximum PARA between 1.6 × 10 6 and 3 × 10 6 depend-
ing on the sampling design implemented. It is difficult to argue whether this level is

Chapter 2. High Resolution Orthomosaics of African Coral Reefs: A Toolfor Wide-Scale Benthic Monitoring 39
meaningful from an ecological perspective, as no typology exists on the expected PARA
value for coral reefs. However, based on in-field observations and the results for the
most comprehensive sampling design applied (7 m × 7 m and 100 quadrats), infor-
mation on how PARA relates to the spatial variability of coral growth can be derived.
Results are more likely to indicate that the coral reef is dominated by smaller organisms
than those present when using sampling scales finer than 2 m × 2 m. This could drive
the assessment of the coral reef towards a more degraded status than it is. In addi-
tion, scales finer than 2 m × 2 m provide highly variable PARA measurements between
independent quadrats and, therefore, overestimate the spatial heterogeneity of PARA
within the area of interest. This is probably related to the dimensions of the organisms
encountered (Table 2.2); many of the morphological classes identified are larger than
the sampling area covered by any of the 0.5 m × 0.5 m (total area of 0.025 m2) and
the 2 m × 2 m (total area of 4 m2). This sampling scale fails to capture the individual
organisms in full and provide a biased estimation of PARA. In addition, fine sampling
scales underestimate the perimeter of the organisms. This is because the perimeter of
those organisms that are not included in full within the quadrat is not accounted for.
The selection of quadrat density also plays a key role in the robust estimation of the
spatial heterogeneity of PARA within the area of interest. For that purpose, quadrat
densities below 30 and 40 are required for nested and random strategies, respectively.
The use of lower quadrat densities may result in assessments that portray the growth
of colonies within the surveyed area to be more heterogeneous (i.e., degraded) than it
actually is (Table 2.5).
For the contagion and dispersion seascape metrics (AI and DIVISION), the overall
metrics for the area indicate that most organisms colonizing the coral reef present rela-
tively small dimensions, are disperse across the rocky matrix and are characterized by
homogeneous distributions across the area. Results show that the sampling design has
an influence on the estimation of AI with different combinations of scales and quadrat
densities resulting in over and underestimations of AI measures of dispersion and central
tendency. AI underestimation will portray the coral reef to be more aggregated than
it is, whereas overestimations will result in a more positive assessment of the overall
impact within the area. He et al. (2000) demonstrated that AI is strongly dependent
Chapter 2. High Resolution Orthomosaics of African Coral Reefs: A Toolfor Wide-Scale Benthic Monitoring 40
(non-linear relationship) on the number of patches present within the landscape, and
the identification for a sampling design that optimizes AI estimation is therefore diffi-
cult. For the case study area of Ponta do Ouro, sampling designs of 20 × (7 m × 7 m)
and 30 × (5 m × 5 m) quadrats, for nested and random strategies respectively, provided
good approximations to the values observed for the whole surveyed area. Fine sam-
pling scales (equal to or finer than 2 m × 2 m for nested and 0.5 m × 0.5 m for random
strategies) did not provide as good estimates as coarser scales; AI and its spatial het-
erogeneity were systematically overestimated. This is probably due to the dimensions
of the individual organisms as described for the PARA metric. If these fine scales are
applied, the systematic overestimation of AI and its spatial heterogeneity will result in
biased coral reef assessment. For DIVISION, fine sampling scales (finer than 2 m × 2 m)
and reduced quadrat densities (<40) translate into underestimation of the measures of
central tendency and dispersion. In brief, these sampling designs will portray the coral
reef to be more aggregated and less spatially heterogeneous than it is.
The group of diversity metrics (PR, SHDI, SIDI, SHEI and SIEI) presents a common
pattern of response to changes in sampling design. Overall, the metrics indicate that the
coral reef is diverse, and its area is proportionally distributed in accordance with their
presence within the seascape. For the specific case of PR, scales finer than 2 m × 2 m fail
to provide a representative value of PR. As per previous metrics, this may be explained
by the size configuration of organisms within the seascape. None of the scales tested
reached the PR value obtained for the overall coral reef area (i.e.,23). It is therefore
difficult to suggest an optimal sampling scale for the case study area and impractical to
make suggestions for other coral reefs. However, from the results obtained, scales of 7 m
× 7 m are the best suited from those tested for the estimation of PR. In addition, the
variability of PR values between individual quadrats indicates that this metric is also
highly sensitive to the presence of spatial heterogeneity within the seascape. Spatial
heterogeneity can be captured through the inclusion of further quadrats within the
sampling design. For the case study area of Ponta do Ouro, quadrat densities as low as
10 provided similar estimates of PR measures of dispersion and central tendency as the
most comprehensive densities applied (i.e., 100). Finer scales and densities than those
suggested here (Table 2.5) will result in the coral reef being portrayed as less diverse
Chapter 2. High Resolution Orthomosaics of African Coral Reefs: A Toolfor Wide-Scale Benthic Monitoring 41
and more heterogeneous than it really is.
For the SHDI and SIDI metrics, the sampling scale is key to reliable metric charac-
terization. For SHDI, scales equal to or finer than 2 m × 2 m would have been more
likely to portray the coral reef as less diverse (i.e., more degraded) and, therefore, less
suited to host multiple colonies than it is. Similar results would have been obtained if
scales equal to or finer than 5 m × 5 m would have been used for SIDI. The outcomes
would have indicated that the reef is dominated by specific species that are more suited
to colonize the available space. For both indexes, the variation in independent quadrat
values indicates that the metrics are highly susceptible to the spatial heterogeneity. In
the case of SHDI, it is difficult to assess whether the variation is significant from an
ecological point of view, as the index is not capped in the upper limit. The SIDI index
can adopt values comprised between zero and one, where zero indicates null diversity
and one maximum diversity. In the case of the studied area, where the values of SIDI
for individual quadrats oscillate between zero and 0.9, it is essential to ensure that the
spatial heterogeneity within the site is captured with the sampling design implemented.
The same rational applies to SHEI and SIEI, which are derived calculations from SHDI
and SIDI. For both SHEI and SIEI, the recommended sampling scales should be equal
to or coarser than 5 m × 5 m. This is consistent with the results shown in Weinberg
(1978), where for coral reef benthic communities, the number of observed species in-
creases by less than 10% when the sampling scale is doubled. Similarly, Bianchi et al.
(2004) points out the need for selecting a suitable sample size based on the dimensions
of the organisms and the composition of the community and recognizes the fact that
a priori standard reference sampling scales have not yet been defined. Other authors
have shown that species richness is strongly dependent on sample size Drakare et al.
(2006) and sampling quadrat densities Walther and MARTIN (2001); Condit et al.
(1996); Gotelli and Colwell (2001), as well as indicating that comparing assemblages
using different sample sizes may produce erroneous conclusions Stout and Vandermeer
(1975). This is key for the interpretation of ancillary metrics, such as the Species Area
Ratio (SAR) (i.e., the relationship between species richness and scale), which inform
about the change in biodiversity in response to global environmental change Thomas
et al. (2004).
Chapter 2. High Resolution Orthomosaics of African Coral Reefs: A Toolfor Wide-Scale Benthic Monitoring 42
Regarding Objective (3), results herein reported indicate that different sampling
scales and quadrat densities should be considered when designing the sampling strategy
depending on the metrics to be estimated. Special attention needs to be dedicated to
the initial stages of the design of coral reef monitoring protocols with decisions being
based on the metrics, as well as the type of statistical measures (i.e., central tendency
or dispersion) being estimated. This should be coupled with the ecological relevance of
these metrics and the spatio-temporal characteristics of the communities present within
the sampling area. Failure to do so will result in biased estimates of the overall values.
Further work should focus on assessing the transferability of the framework pre-
sented here to other study areas. The shallow coral reef selected for the scope of the
study is representative of the eastern South Africa coral reefs for this depth range
(Riegl, 1993; Riegl et al., 1995; Jordan and Samways, 2001; Schleyer et al., 2008), with
the overall composition of the benthic community showing a preferential abundance
for soft corals. These South African coral reefs are primarily characterized by soft
coral communities growing on fossil dunes outcrops (i.e., Sodwana Bay) (Schleyer and
Celliers, 2004; Ramsay, 1994, 1996). In particular, the site characterizes the Delagoa
Bioregion, which constitutes the southernmost coral reef in the Western Indian Ocean
(Porter et al., 2013). These benthic communities have been monitored for the last 20
years along four fixed transects in Sodwana Bay (South Africa) (Porter and Schleyer,
2017) and have shown a shift in community composition due to changes in tempera-
tures. The results herein presented are expected to be transferable to areas with similar
characteristics and propose a sampling framework for wide-area (>1500 m2) coral reef
characterization that contributes to overcoming some limitations in coral reef sampling.
Based on the work by previous authors (Porter and Schleyer, 2017; Schleyer and Cel-
liers, 2004; Schleyer et al., 2008), the SfM methodology presented in this paper should
be directly transferable to the coral reefs of KwaZulu-Natal province in Mozambique
and the southern South African coral reefs, which present similar geomorphological
characteristics (Jordan and Samways, 2001).
This study quantifies the effect of sampling protocols on coral reef seascape metric
estimation using high resolution underwater imagery coupled with the photogrammetry
image processing technique for the case study area of Ponta do Ouro. A set of metrics
Chapter 2. High Resolution Orthomosaics of African Coral Reefs: A Toolfor Wide-Scale Benthic Monitoring 43
derived from FRAGSTATS that inform about the overall quality of the coral reef area
surveyed have been selected for the study. However, the framework can be expanded to
assess the effect that sampling protocols have on other metrics (available or not within
FRAGSTATS). For example, further work could explore the effect of sampling protocols
on more classic metrics that are key for coral reef characterization (e.g., rugosity) or
focus on the development of new metrics that can be derived from multiple geomatic
products (e.g., point cloud, DEM and orthoimage). This will require the end user to
develop scripts that can automatically derive the metrics within a GIS environment.
The results herein presented are a step forward and contribute to improving current
practice in coral reef monitoring protocols.
2.5 Conclusions
Current efforts on coral reef monitoring have focused on the estimation of the com-
position and health status. Seascape metrics can be also used to assess the quality of
coral reefs. However, little effort has yet been dedicated to developing robust mon-
itoring strategies for the accurate estimation of such metrics. This paper evaluates
the effects that different sampling scales, quadrat density and sampling strategy have
on seascape metric estimation when relying on SfM techniques. The SfM framework
herein presented generates high resolution information that is useful for the character-
ization of the benthic communities down to single colonies. Results show that each
of the seascape metrics considered in this study has different optimal sampling scales,
quadrat densities and sampling strategies for the case study area of Ponta do Ouro.
Overall, sampling designs with over 30 (5 m × 5 m or 7 m × 7 m) quadrats provide rep-
resentative results for most metrics considered here. Failure to select the appropriate
monitoring strategy will result in biased estimates of these seascape metrics. The SfM
framework has the potential to be transferred to similar coral reefs, specifically those
of the KwaZulu-Natal province in Mozambique and the South African Republic. This
paper contributes to improving current practice in high resolution coral reef monitoring
protocols. The comparison of the metrics presented here with descriptive statistics lim-
its the transferability of the outcomes to other coral reefs. Further work should focus on
Chapter 2. High Resolution Orthomosaics of African Coral Reefs: A Toolfor Wide-Scale Benthic Monitoring 44
the validation of the proposed framework in other coral reefs. In addition, multiple sites
need to be compared using a hierarchical modelling technique to account for a nested
sampling design, with findings being used to determine the optimal sub-sampling area
(quadrats) and intensity (number of quadrats) to accurately characterize this type of
environment. This information would be very helpful in directing the design of future
reef survey techniques.
Acknowledgements
This work was supported by the PhD scholarship “ EUREKA; European Social
Funds (FSE), Programma Operativo Regionale (POR) 2014/2020 Regione Marche
(Italy) ; the Marie Sklodowska-Curie Action, Horizon2020 within the project Green-
Bubbles (Grant Number 643712); the company UBICA srl. The authors would like to
thank Miguel Goncalves, Director of Ponta do Ouro Partial Marine Reserve (Mozam-
bique). Special thanks go to Jenny Stromvoll (Back to Basic Adventures Diving Center)
for contributing to Figure 2.2. Thanks also to Dr. Fabrizio Torsani for his support in
species identification. Thank you to Nicola Castelnuovo as UBICA srl co-supervisor
of my research. We thank four very helpful reviewers and the Editor for providing
extremely useful comments, direction and constructive criticism. We will always be
grateful.
Chapter 3
Application of Structure from Motion photogram-
metry to coral reefs for characterizing their spatial
composition and pressures.
Abstract
Coral reefs are dynamic ecosystems subjected to environmental and human pres-
sures varying in intensity and in duration. Recreational diving has been documented
having negative effects on coral habitats and organisms, however its impacts on the
composition, diversity, and fractality of coral communities at seascape scale are un-
known. This study combines high-resolution ortho-mosaic generated with Structure
from Motion photogrammetry and data mining techniques (X-Means clustering), to
investigate the spatial composition of benthic communities at seascape scale (25 m2)
and identify potential diving impacts and environmental conditions across dive sites for
marine monitoring.
The classification showed substantial to excellent agreement with expert opinion,
and indicated differences in the benthic composition between diving sites in terms of
(i) patches surface, perimeter, abundance, and (ii) functional groups categories (e.g.
resistant, moderately resistant, fragile). Resistant-to-physical-impact categories (i.e.
sponges and algae) were abundant at small diving sites and highly visited by divers.
These sites were characterized by big organisms and with complex shapes, low taxa
diversity and density. Fragile-to-physical-impact categories (i.e. Acropora spp.) were
abundant at diving sites low or moderately visited by divers. These sites are character-
ized by complex geomorphology and moderate hydrodynamic conditions. The highest
taxa diversity and density, and the lowest abundance of resistant-to-physical-impact
FGs were recorded at rarely and larger dived sites. The sites exhibited different seascape
Chapter 3. Application of Structure from Motion photogrammetry tocoral reefs for characterizing their spatial composition and pressures. 46
metrics (i.e. patch density, patch richness, Shannon Diversity Index, Perimeter-Area
Fractal Index), with general patterns emerging in terms of responses to diving pressure
and environmental conditions.
Our results suggest that site- specific human pressures, history and site geomor-
phology, increase understanding of impacts associated with scuba diving and therefore
should be considered in conservation programs looking forward its sustainability.
3.1 Introduction
World’s coral reefs are facing several threats from many directions, and people are
playing a big role in this picture. Threats from local sources such as overfishing, coastal
development and pollution, constitute the major peril for over the 60 % of coral reefs
worldwide, and operate in combination with the global threats of climate change (i.e.
raising temperature, carbon dioxide) (Hughes et al., 2003; Burke et al., 2012). Among
local threats, scuba diving can have negative effects on coral ecosystems (Buckley, 2012).
Previous ecological studies on tropical reefs, have documented that scuba diving directly
impacts on reef benthic habitat and organisms through its effects on sedimentation,
breaks and diseases (Hawkins et al., 1999; Zakai and Chadwick-Furman, 2002; Chabanet
et al., 2005; Luna et al., 2009; Lyons et al., 2015), but evidences of its ecological effects
at seascape scale remain rare.
Scuba diving tourism has experienced growing levels of participation worldwide since
1960s (Richardson, 1999) and is considered an example of sustainable growth (Buckley,
2012). Whilst it favours economic activities in many developing coastal communities
(Dimmock and Musa, 2015), research studies suggest it can have negative indirect and
direct effects over short-term and high intensity (“pulse” effect, e.g. seasonal tourism,
(Bravo et al., 2015)), or over long-term and at constant intensity (“press” effect, e.g.
all year tourism (Lyons et al., 2015)) on benthic reef communities. Both indirect and
direct impacts constitute a concern at heavily dived sites (Roche et al., 2016). Indi-
rect impacts on benthic habitats and organisms in coral reefs include secondary effects
of scuba diving activities such as urban development, land management and sewage
disposal (Lucrezi and Saayman, 2017). Processes driven by changes in coastal urban-
Chapter 3. Application of Structure from Motion photogrammetry tocoral reefs for characterizing their spatial composition and pressures. 47
ization, result in diverse distribution and composition of corals taxa than in places
where this impact is absent or low (Wongthong and Harvey, 2014). Several studies sug-
gest that reefs affected for example by terrestrial runoff (i.e. high level of sedimentation
from coastal erosion), result in changed benthic population structure, reduced size and
altered structural forms (Rogers, 1990; Fabricius et al., 2005). Additionally, turbidity-
related light limitation decreases gross photosynthesis and causes severe reduction of
phototrophic coral recruits survival (Dikou and Van Woesik, 2006). Indirect impacts are
often considered as inevitable costs of doing business (Schuhmann et al., 2013), though
undermining the conditions for a long-term sustainable growth (Musa, 2002; Donner
and Potere, 2007; Lucrezi and Saayman, 2017). In contrast, direct impacts refer to
physical scuba divers- contact with the seabed (Lyons et al., 2015). Damages often
result in tissue abrasion, skeleton breakage (Hawkins and Roberts, 1992; Chadwick-
Furman, 1995), dislodging (Zakai and Chadwick-Furman, 2002), burring (Erftemeijer
et al., 2012), and diseases (Lamb et al., 2014) of benthic organisms. The response of
benthic corals to direct impacts is different across taxonomic groups because of taxa-
specific mophological, physiological, and behavioural characteristics reflecting adapta-
tions to physical-disturbance (Lyons et al., 2015). For example, branched and stony
colonies have little resistance to breakage and sensitive to abrasion, diseases, dislodging
than soft corals (Lyons et al., 2015). Massive and meandroid stony corals are unlikely
to be dislodged and fragmented but can still be abraded (Meesters et al., 1992). Soft
corals show low resilience to sedimentation and therefore are often distributed at sites
where water hydrodynamism allows to cope with sediment loads (Schleyer and Celliers,
2003).
Most of the research have investigated direct impacts of scuba diving focusing on
reef benthic community composition (i.e. taxonomic richness, organisms abundance) at
high resolution and over small surfaces (Bravo et al., 2015), or on wide areas at lower
resolution (Wilkinson et al., 2003; Hill and Wilkinson, 2004; Lyons et al., 2015). Whilst
these small-scale studies have further our understanding on the impact of recreational
diving on reef organisms, substantial gaps remain in our understanding and ability
to predict interactions among scuba diving and reef benthic communities at seascape
scale. Few research studies conducted at seascape scale have reported that coral reefs
Chapter 3. Application of Structure from Motion photogrammetry tocoral reefs for characterizing their spatial composition and pressures. 48
subjected to direct impacts by scuba diving undergo physical deterioration (Lyons et al.,
2015), biodiversity loss (Hasler and Ott, 2008), changes in reproductive cycles and
trophic interactions at coral ecosystem scale (Hawkins and Roberts, 1992). As large
and representative areas of the seascape include the main benthic groups of the reef, a
better scientific understanding of the effects of scuba diving on benthic reef communities
at seascape scale is necessary to unravel changes in its structure and functions, and
identify the processes affecting its health.
The composition of coral reef varies also with respect to local environmental con-
ditions. For example, reef that are larger in area and deeper would be less affected
by severe weather events (Cheal et al., 2017), and local morphological structure vari-
ability (i.e. gullets, canyons, plateau) would support different coral communities (Riegl
et al., 1995). Structure from Motion (SfM) photogrammetry is an optical based tech-
nology to estimate the 3D structure of a scene from 2D overlapping images acquired
from a moving sensor (Westoby et al., 2012). The camera positions and orientation
are automatically calculated by the algorithms processing the images (Micheletti et al.,
2015b).
In recent years, SfM has received particular attention in marine research because
it is a low-cost technology, time efficient, requires low budgets, and little technical
expertise to apply at sea (Westoby et al., 2012). SfM has been applied to study the
ecology of coral reefs and showed to be a versatile, repeatable, and accurate technology
for data collection and high-resolution analysis (Figueira et al., 2015; Storlazzi et al.,
2016; Ferrari et al., 2016; Palma et al., 2017; Coro et al., 2018). For example, highly
detailed ortho-mosaics were realized for the African coral reefs using SfM to investigate
the spatial composition of benthic reef communities across multiple spatial scales (4
m2 to 48 m2), and to define the minimal sample size for representative sampling of
coral reefs ecosystems (Palma et al., 2017). The potential of SfM to provide a detail
picture of coral reefs health, has been demonstrated for single organisms (Ferrari et al.,
2017) and habitat complexity (Storlazzi et al., 2016). Yet, this technology has not been
applied at seascape scale to study the effect of scuba diving on benthic reef structural
composition, diversity and fractality metrics.
This study combines high-resolution ortho-mosaics generated with SfM photogram-
Chapter 3. Application of Structure from Motion photogrammetry tocoral reefs for characterizing their spatial composition and pressures. 49
metry and data mining techniques, to investigate the composition of benthic reef com-
munities at seascape scale (25 m2), and identify potential diving impacts and environ-
mental conditions across dive sites for marine monitoring. The benthic composition
of coral reef is expected to differ across diving sites, taking into account scuba-diving
pressures (i.e. number of dives per year) and the site environmental conditions (i.e.
depth and reef area). Specifically we expect that: (i) specific composition metrics at
seascape scale would differ across sites, as in Table 3.1, and (ii) the contribution of
resistant-to -physical impact organisms to the composition of coral reefs would differ
across sites, with large contribution of resistant organisms to highly dove sites and to
small and shallow reefs.
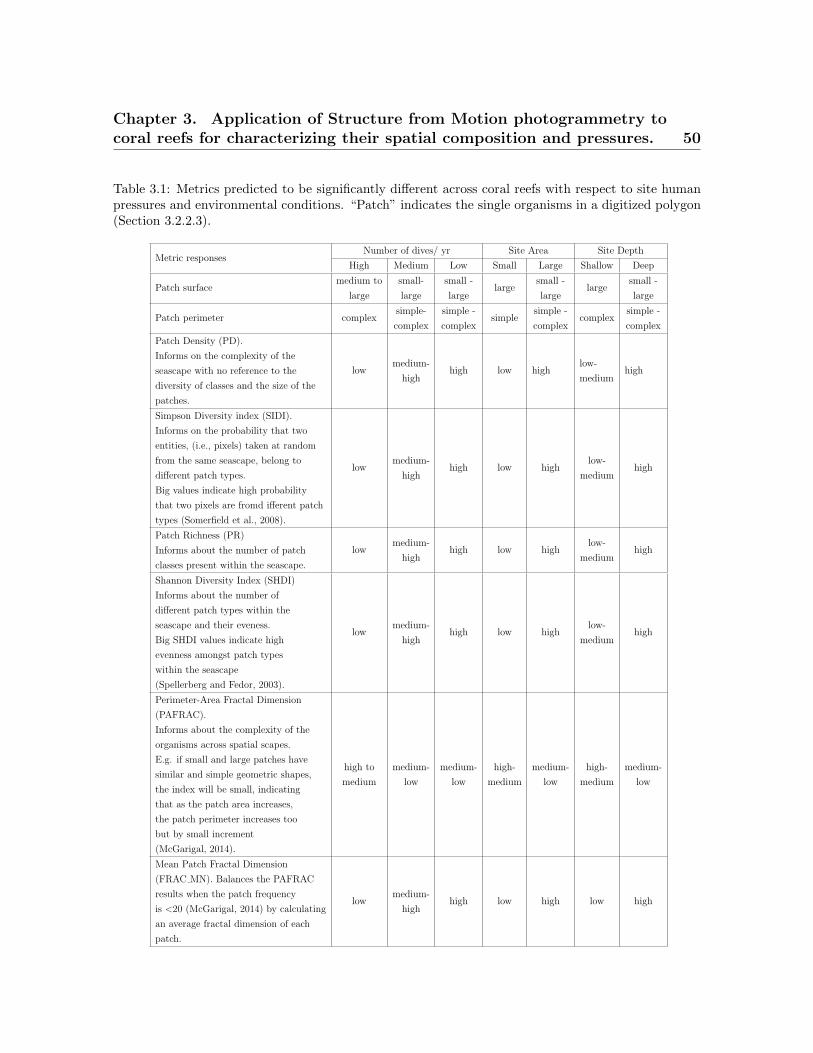
Chapter 3. Application of Structure from Motion photogrammetry tocoral reefs for characterizing their spatial composition and pressures. 50
Table 3.1: Metrics predicted to be significantly different across coral reefs with respect to site humanpressures and environmental conditions. “Patch” indicates the single organisms in a digitized polygon(Section 3.2.2.3).
Metric responsesNumber of dives/ yr Site Area Site Depth
High Medium Low Small Large Shallow Deep
Patch surfacemedium to
large
small-
large
small -
largelarge
small -
largelarge
small -
large
Patch perimeter complexsimple-
complex
simple -
complexsimple
simple -
complexcomplex
simple -
complex
Patch Density (PD).
Informs on the complexity of the
seascape with no reference to the
diversity of classes and the size of the
patches.
lowmedium-
highhigh low high
low-
mediumhigh
Simpson Diversity index (SIDI).
Informs on the probability that two
entities, (i.e., pixels) taken at random
from the same seascape, belong to
different patch types.
Big values indicate high probability
that two pixels are fromd ifferent patch
types (Somerfield et al., 2008).
lowmedium-
highhigh low high
low-
mediumhigh
Patch Richness (PR)
Informs about the number of patch
classes present within the seascape.
lowmedium-
highhigh low high
low-
mediumhigh
Shannon Diversity Index (SHDI)
Informs about the number of
different patch types within the
seascape and their eveness.
Big SHDI values indicate high
evenness amongst patch types
within the seascape
(Spellerberg and Fedor, 2003).
lowmedium-
highhigh low high
low-
mediumhigh
Perimeter-Area Fractal Dimension
(PAFRAC).
Informs about the complexity of the
organisms across spatial scapes.
E.g. if small and large patches have
similar and simple geometric shapes,
the index will be small, indicating
that as the patch area increases,
the patch perimeter increases too
but by small increment
(McGarigal, 2014).
high to
medium
medium-
low
medium-
low
high-
medium
medium-
low
high-
medium
medium-
low
Mean Patch Fractal Dimension
(FRAC MN). Balances the PAFRAC
results when the patch frequency
is <20 (McGarigal, 2014) by calculating
an average fractal dimension of each
patch.
lowmedium-
highhigh low high low high

Chapter 3. Application of Structure from Motion photogrammetry tocoral reefs for characterizing their spatial composition and pressures. 51
3.2 Material and methods
3.2.1 Study area and experimental design
The study was conducted between April and June 2015 at the Ponta do Ouro Partial
Marine Reserve (PPMR), Mozambique (Figure 3.1). Since the end of the civil war in
1994, Ponta do Ouro has grown as international scuba diving destination, rapidly regis-
tering high intensity of use: 30k -40k dives/year (1995, (Robertson et al., 1996)), 80k -
90k dives/year (1998, (Motta, 2000)), 42.5k - 62k dives/year (2001 -2002, (Costa et al.,
2005)), and 26k (± 3k) dives/year (2011 2015, PPMR report) Table A.1). Seven dive
sites were selected with different diving use across the PPMR (Figure 3.1, Table 3.2).
The sites are characterized by “coral carpets” constituted by the unique combination of
numerous endemic species covering Late Pleistocene fossils dunes and forming typical
morphological structures low in profile (Robertson et al., 1996; Celliers and Schleyer,
2008; Jordan and Samways, 2001).
Imagery data were collected at each site in one single dive and covering the entire
coral reef area, or in larger reef, surveying the areas most visited by dive operators (i.e.
Table 3.2). Dive sites were mapped by a semi-autonomous underwater vehicle equipped
with action cameras, tablet, illumination system and GPS buoy Palma et al. (2017).

Chapter 3. Application of Structure from Motion photogrammetry tocoral reefs for characterizing their spatial composition and pressures. 52
Figure 3.1: The figure shows the seven surveyed diving sites across the PPMR in Mozambique.

Chapter 3. Application of Structure from Motion photogrammetry tocoral reefs for characterizing their spatial composition and pressures. 53
Table 3.2: Surveyed dive sites. Location of sites (WGS84), distance from launch point (km), averagedepth (m), surveyed area (m2), and number of divers per year (2001-2002 and 2011-2016 from PPMRreport). The asterisk indicates diving sites that were not sampled for their total area.
PPMR Bays Dive sitesLong, Lat
(WGS84)
Distance from
launch (km)
Average
depth (m)
Area
(m2)
Average dives/year
(2001-2002, ref)
Average dives/year
(2011-2016,
PPMR report)
Ponta do Ouro
DoodlesW 32.896103,
N -26.8306691.7 17 850 10350 7374
BlacksW 32.897408,
N -26.8248832.5 19 425 - 985
StepsW 32.894828,
N -26.8132753.6 16 950 3125 3462
Ponta Malongane
MaverickW 32.904875,
N -26.7756087.9 25 2550 - 20
Paradise ledgeW 32.903339,
N -26.7803977.1 22 2250 2403 365
Texas*W 32.902742,
N -26.7631539.5 15 2150 3248 280
Ponta Techobanine Techobanine*W 32.903397,
N -26.67710319.6 12 3500 - 35
3.2.2 Data processing
3.2.2.1 Photogrammetric processing and seascape composition
analysis
For each site, high resolution ortho-mosaics (pixel size <0.01 m) were obtained by
processing the geo-tagged images of the underwater surveys (Palma et al., 2017). The
images were projected into the Universal Transverse Mercator (UTM) fuse 36 Southern
Hemisphere coordinate system, defined by the World Geodetic System (WGS84) and
processes by Photoscan (Agisoft LLC., St. Petersburg, Russia) (Palma et al., 2017). To
study the composition of the coral reefs at seascape scale, virtual random quadrat of 5 m
x 5 m were selected and replicated 3 times over each ortho-mosaic (Palma et al., 2017).
The quadrat size 5 m x 5 m is proved representative of the coral reefs at the PPMR
(Palma et al., 2017). Within each quadrat, the benthic organisms were identified in
taxonomic and morphological classes, digitalised using ArcGIS 10.1 software, and finally
rasterized to obtain categorical maps (Redlands, CA, USA) (Table 3.3). The classes

Chapter 3. Application of Structure from Motion photogrammetry tocoral reefs for characterizing their spatial composition and pressures. 54
were summarized in functional groups (FGs) and for each class, abundance and the
summary statistics of surface, perimeter were calculated.
Table 3.3: Taxonomic and morphological classes identified from the ortho-mosaics for each site. Thetable reports also the classes of resistance obtained from the analysis of the quadrats.
Resistant- to- physical- impacts categories Functional groups (FGs) Classes Code
Fragile
Acropora spp.
Acropora branched ACBAcropora ACC
Acropora digitate ACDAcropora stout branched ACS
Non Acropora branched coral Non Acropora branched coral CBFree living fungiid Free living fungiid CMR
Tabular coral Tabular coral CTA
Moderately fragile
Encrusting coral Encrusting coral CEFolious coral Folious coral CFMassive coral Massive coral CM
Soft corals
Soft crested coral SCRSoft digitate coral SCD
Soft mushroom coral SCFSoft plane coral SCPSoft radiate coral SCR
Resistant
Other invertebrate Other invertebrate OI
SpongesSponge SP
Sponge encrusting SPESponge massive SPM
Algal turf Algal turf TA
3.2.2.2 Clustering analysis
Data on FGs (i.e. diversity, surfaces and perimeter, average, maximal, minimal,
standard deviation, count), and reef sites (i.e. depth, extension) was analysed using a
principal component analysis (PCA (Jolliffe, 2005) ) and the distance- based clustering
X-Means (Pelleg et al., 2000) to look for similarities in community composition between
diving sites and possible diving impacts. The approach, which involves a series of steps
performed sequentially to the harmonized data (Figure 1 in Magliozzi et al. (2018),
was applied at seascape scale and carried out by using the e-Infrastructure D4Science
services (Candela et al., 2009; Magliozzi et al., 2018). First, a PCA was performed
to reduce the dimensionality of the dataset and explore the patterns in data variabil-
ity among diving sites (Jolliffe, 2005; Magliozzi et al., 2018). Secondly, X-Means was
applied to the PCA-transformed vectors associated with largest variance, to identify
Chapter 3. Application of Structure from Motion photogrammetry tocoral reefs for characterizing their spatial composition and pressures. 55
the variables indicating similarities of benthic composition between sites (Magliozzi
et al., 2018). In this study, we searched for a number of clusters between 1 and 10.
The resulting clusters contain equally distributed variables and are characterized by a
centroid which is a summary of the characteristics of the cluster. The clusters were
evaluated with respect to expert opinion (Table A.2-A.5). Two experts (Pantaleo and
Fernandez) evaluated independently the clusters by assigning the clusters’ results to
each diving sites, based on their expert opinion. Then, a confusion matrix was used
to assess the agreement between the experts assignment and X-means clusters as the
percentage of matching assignments (absolute percentage of agreement). The Cohen’s
Kappa (Cohen, 1960) was calculated to estimate the agreement between the experts
and the model compared to purely random assignments (Coro et al., 2015). To look
at patterns of taxonomic and morphological benthic composition over the clusters and
among broad taxonomic groups, the FGs were grouped into three categories based on
a series of taxa mophological, physiological, and behavioural characteristics identified
in the literature as reflecting adaptations to physical-disturbance (Schleyer and Cel-
liers, 2003), Table 3.3).“Resistant” organisms include sponges (SP), algal patches (TA)
and “other invertebrates” (OI) (e.g. gasterops, tunicates, echinoderms, hexacorals such
as Stichodactyla spp., Atriolum sp.). These taxa show high regenerative physiological
resistance to physical damages because of their skeleton structure, and have been of-
ten reported in relation to ecological shifts in coral reefs communities (Hughes et al.,
2003; Wulff, 2006; Norstrom et al., 2009; Lyons et al., 2015). “ Moderately resistant”
organisms include soft corals (SCD, SCP, SCC, SCR, SCF) (e.g. Sarcophyton sp., Sin-
ularia sp., Lobophyton spp.), massive corals (CM) (e.g. Platygyra spp., Montastrea
spp., Galaxea spp., Favites spp., Favia spp. and Turbinaria sp.), folios corals (CF)
(e.g. Montipora spp., Echinopora spp.), and encrusting corals (CE) (e. g. Porites
spp). Soft corals are often described as sensitive organisms to sediment burying and
wave actions (Riegl et al., 1995) but their flexibility of the colonies, their low profile
suggest they are resistant animals to hydrodynamic condition (Schleyer and Celliers,
2003). Massive, encrusting and folios corals show resistance to physical impacts due
to a stout or flat morphological growth. However, they can be dislodged or more com-
monly scratched by accidental impact with divers equipment (Schleyer and Tomalin,
Chapter 3. Application of Structure from Motion photogrammetry tocoral reefs for characterizing their spatial composition and pressures. 56
2000; Zakai and Chadwick-Furman, 2002; Lyons et al., 2015). Finally, the “fragile”
”group includes Acropora spp. (AC), branched corals (CB) (e.g. Pocillopora spp.),
free living fungiid (CMR), and tabular corals (CTA) (i.e. Turbinaria sp.). Acropora
spp. and branched-corals taxa have tree- shaped carbonate skeletons that increase the
structural complexity of reefs but, as erected forms are also the most exposed to breaks
and fragmentation (Hawkins and Roberts, 1992; Rouphael and Inglis, 1995; Chadwick-
Furman, 1995; Schleyer and Tomalin, 2000; Lyons et al., 2015; Floros and Schleyer,
2017). Among the fragile group, tabular corals and free living fungiid colonies are
most the most subjected to breaks, for example during severe weather conditions entire
colonies might be tipped over (Hughes and Connell, 1999)
3.2.2.3 Calculation of seascape metrics
The composition of the reefs was investigated by calculating seascape metrics such
as diversity, aggregation and shape on the categorical maps using the FRAGSRATS
v4 software (Amherst, MA, USA) (McGarigal, 2014). The set of metrics was selected
based on their relevance to seascape ecology composition (Table 3.4). FRAGSTATS
v4 computes a variety of metrics for categorical maps, and has been applied in a wide
range of disciplines including seascape ecology (Garrabou et al., 1998; Teixido et al.,
2002; Kendall and Miller, 2008; Wedding et al., 2011b; Palma et al., 2017). In this
study, the categorical maps were processed at patch (the single individual digitized in
a polygon), class (taxonomical and morphological FGs, Table 3.3) and seascape level
(denotes all the patches of different classes within the quadrats) by considering the
disposition, the size and the shape of the patches within the quadrats. PD, SIDI,
PR, SHDI, PAFRAC, FRACMN at seascape level were compared between reef sites by
applying a One-Way ANOVA test using the aov function in the R “stats” v3.5.1 package
(Chambers et al., 1992) (Table A.1-.6). In order to solve heterogeneity in the residuals,
PD, PR, SHDI, PAFRAC were log-transformed, but this was not necessary for the rest
of responses. Validation of underlying assumptions of normality and homoscedasticity
of tests residuals was applied following Zuur et al. (2009) (shapiro.test function from the
R “stats” v3.5.1 package (Stats et al., 2013) and leveneTest in R “car” v3.0-2 package

Chapter 3. Application of Structure from Motion photogrammetry tocoral reefs for characterizing their spatial composition and pressures. 57
(Fox et al., 2018) and, subsequently, post-hoc Tukey tests were applied to compare
which specific treatments differ significantly using the TukeyHSD function from the R
“stats” v3.5.1 package (Stats et al., 2013).
Table 3.4: List of landscape indices calculated on the virtual random quadrats using FRAGSTATS v4and their description.
Metrics class Index Description
Aggregation metricsPD
(Patch density)PD is the number of patch counted within the landscape.
Diversity metrics
SIDI
(Simpson Diversity Index)
SIDI is the proportional abundance of each patch type squared.
SIDI approaches 1 as the number of different patch types
(i.e., patch richness, PR) increases and the proportional
distribution of area among patch types becomes more equitable.
PR
(Patch Richness)PR is the count of the patch variety within the landscape
SHDI
(Shannon’s Diversity Index )
SHDI is calculate the probability that any two pixels selected
at random would correspond to different patch types; the larger
the values the greater the likelihood than any two randomly
drawn pixels would be different patch types
Shape metrics
FRAC MN
(Mean patch fractal dimension)
FRAC MN based on the fractal dimension of each patch at
landscape levels by weighting patches according to their size.
PAFRAC
(Perimeter-area fractal dimension)
PAFRAC of a patch mosaic provides an index of patch shape
complexity across the landscape describing the power
relationship between patch area and perimeter.
3.3 Results
3.3.1 Evaluation of clusters and agreement with the experts
The reefs were classified in three clusters (Table 3.5) and their reliability evaluated
with respect to expert opinion (Table 3.6, Tables A.2-.5). The clusters results showed
moderate to substantial agreement with experts opinion, indicating reliable semantic
interpretations of the vectors identified in the clusters variations (Table 3.5). Marginal
agreement is recorded between the two experts due to Expert 2 who classified most of
the sites as moderately impacted.

Chapter 3. Application of Structure from Motion photogrammetry tocoral reefs for characterizing their spatial composition and pressures. 58
Table 3.5: X-Means clusters, labelled and semantically described.
Clusters Label Description
Cluster 1 Very impacted
Distribution of organism patches
with big average surfaces and perimeter in relation with the total abundance.
High abundance of algal patches with large perimeter.
Abundant average sponge patches with large maximal perimeter length
and high variability among patches. No Acropora corals, branched corals
and massive corals patches. Folios coral patches with large perimeter.
Low abundance of tabular coral patches. Rare soft crested coral patches
with small maximal surface and perimeter. Very low abundance of soft
digitate coral patches. Rare and soft mushroom coral with small average
areas and medium average perimeter.
Cluster 2 Moderately impacted
Distribution of organism patches with small average surface and perimeter
in relation with the total abundance. Medium abundance of algal patches
with medium perimeter. Abundant average sponge patches with medium
maximal perimeter and low variability among patches. Medium abundance
of Acropora patches with medium average perimeter. Large average branched
coral patches surface with large perimeter. Folios coral patches with medium
perimeter. Massive coral with medium patch areas and perimeters. Medium
abundance of tabular coral patches. Medium soft crested coral patches
maximal surface with large maximal perimeter. Medium abundance of soft
digitate coral patches. Soft mushroom coral with large average areas and
large average perimeter.
Cluster 3 Low impacted
Distribution of organism patches with very small average surface and
perimeter in relation with the total abundance. Low abundance of algal patches
with small perimeter. Rare sponges with very small perimeter length.
High abundance of Acropora coral patches with medium average perimeter.
Small average branched coral patches surface with small perimeter. Folios
coral patches with small perimeter. Massive coral with medium patch areas
and perimeters. High abundance of tabular coral patches. Large soft crested
coral patches maximal surface with medium maximal perimeter.
High abundanceof soft digitate coral patches. Soft mushroom coral with
medium average areas and medium average perimeter.
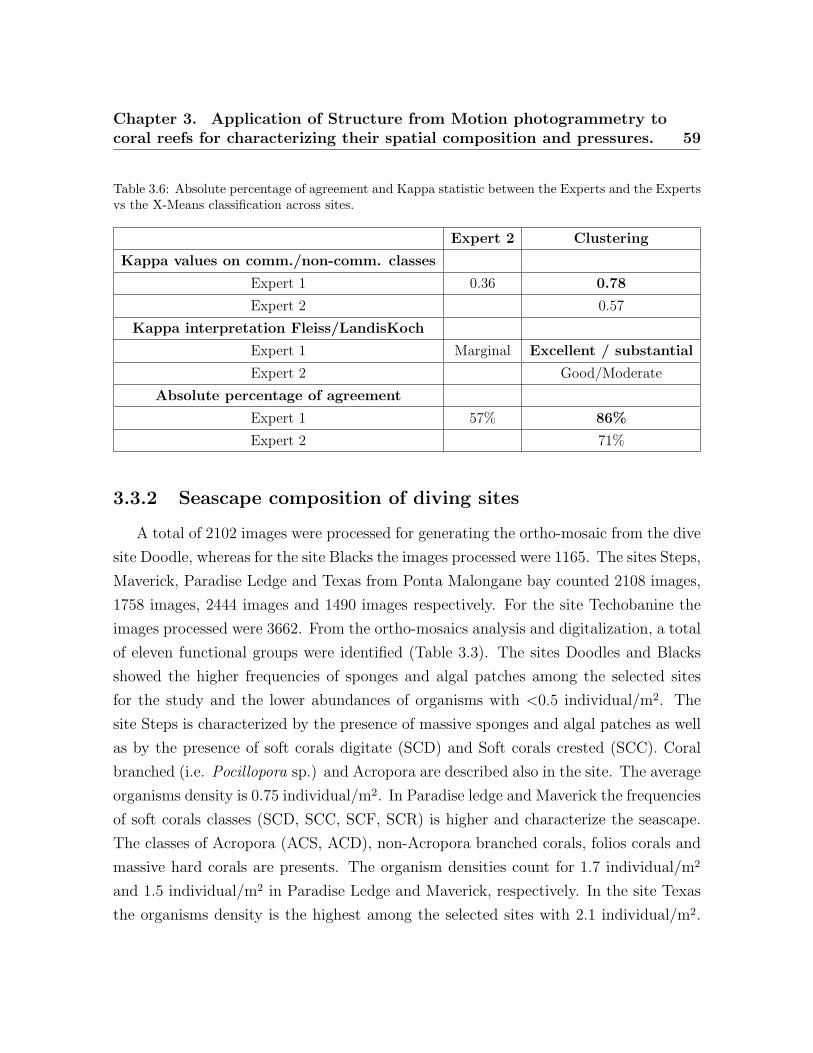
Chapter 3. Application of Structure from Motion photogrammetry tocoral reefs for characterizing their spatial composition and pressures. 59
Table 3.6: Absolute percentage of agreement and Kappa statistic between the Experts and the Expertsvs the X-Means classification across sites.
Expert 2 Clustering
Kappa values on comm./non-comm. classes
Expert 1 0.36 0.78
Expert 2 0.57
Kappa interpretation Fleiss/LandisKoch
Expert 1 Marginal Excellent / substantial
Expert 2 Good/Moderate
Absolute percentage of agreement
Expert 1 57% 86%
Expert 2 71%
3.3.2 Seascape composition of diving sites
A total of 2102 images were processed for generating the ortho-mosaic from the dive
site Doodle, whereas for the site Blacks the images processed were 1165. The sites Steps,
Maverick, Paradise Ledge and Texas from Ponta Malongane bay counted 2108 images,
1758 images, 2444 images and 1490 images respectively. For the site Techobanine the
images processed were 3662. From the ortho-mosaics analysis and digitalization, a total
of eleven functional groups were identified (Table 3.3). The sites Doodles and Blacks
showed the higher frequencies of sponges and algal patches among the selected sites
for the study and the lower abundances of organisms with <0.5 individual/m2. The
site Steps is characterized by the presence of massive sponges and algal patches as well
as by the presence of soft corals digitate (SCD) and Soft corals crested (SCC). Coral
branched (i.e. Pocillopora sp.) and Acropora are described also in the site. The average
organisms density is 0.75 individual/m2. In Paradise ledge and Maverick the frequencies
of soft corals classes (SCD, SCC, SCF, SCR) is higher and characterize the seascape.
The classes of Acropora (ACS, ACD), non-Acropora branched corals, folios corals and
massive hard corals are presents. The organism densities count for 1.7 individual/m2
and 1.5 individual/m2 in Paradise Ledge and Maverick, respectively. In the site Texas
the organisms density is the highest among the selected sites with 2.1 individual/m2.
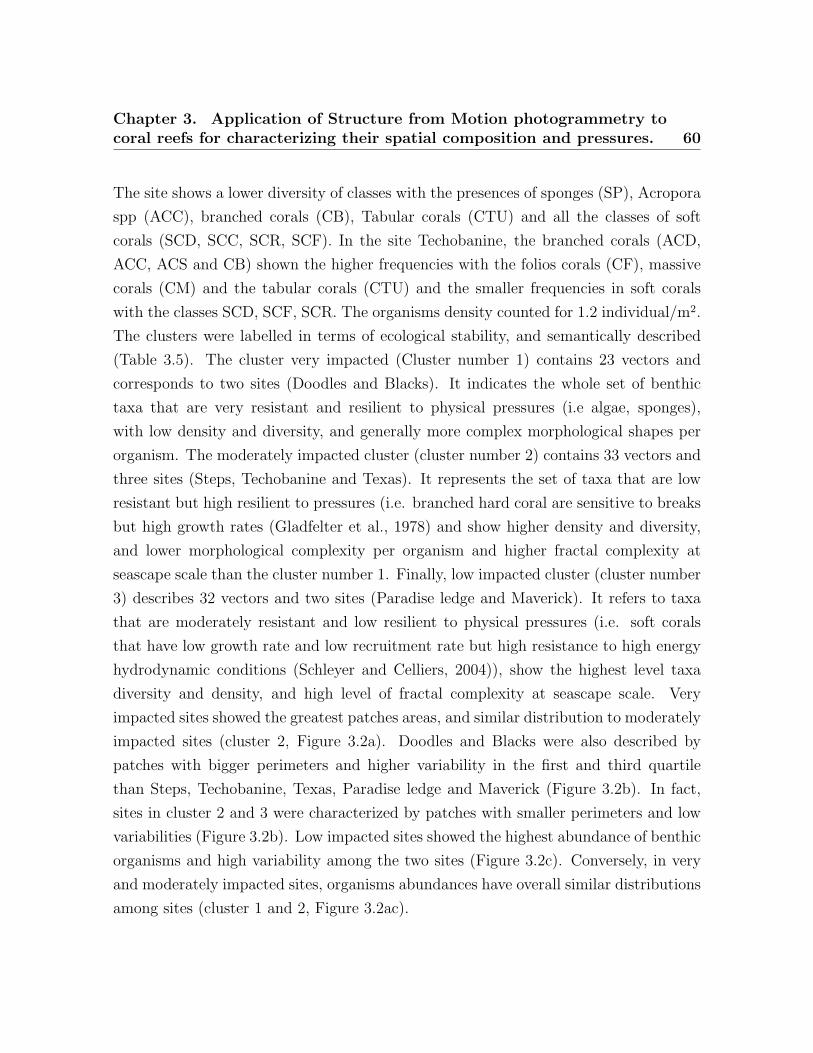
Chapter 3. Application of Structure from Motion photogrammetry tocoral reefs for characterizing their spatial composition and pressures. 60
The site shows a lower diversity of classes with the presences of sponges (SP), Acropora
spp (ACC), branched corals (CB), Tabular corals (CTU) and all the classes of soft
corals (SCD, SCC, SCR, SCF). In the site Techobanine, the branched corals (ACD,
ACC, ACS and CB) shown the higher frequencies with the folios corals (CF), massive
corals (CM) and the tabular corals (CTU) and the smaller frequencies in soft corals
with the classes SCD, SCF, SCR. The organisms density counted for 1.2 individual/m2.
The clusters were labelled in terms of ecological stability, and semantically described
(Table 3.5). The cluster very impacted (Cluster number 1) contains 23 vectors and
corresponds to two sites (Doodles and Blacks). It indicates the whole set of benthic
taxa that are very resistant and resilient to physical pressures (i.e algae, sponges),
with low density and diversity, and generally more complex morphological shapes per
organism. The moderately impacted cluster (cluster number 2) contains 33 vectors and
three sites (Steps, Techobanine and Texas). It represents the set of taxa that are low
resistant but high resilient to pressures (i.e. branched hard coral are sensitive to breaks
but high growth rates (Gladfelter et al., 1978) and show higher density and diversity,
and lower morphological complexity per organism and higher fractal complexity at
seascape scale than the cluster number 1. Finally, low impacted cluster (cluster number
3) describes 32 vectors and two sites (Paradise ledge and Maverick). It refers to taxa
that are moderately resistant and low resilient to physical pressures (i.e. soft corals
that have low growth rate and low recruitment rate but high resistance to high energy
hydrodynamic conditions (Schleyer and Celliers, 2004)), show the highest level taxa
diversity and density, and high level of fractal complexity at seascape scale. Very
impacted sites showed the greatest patches areas, and similar distribution to moderately
impacted sites (cluster 2, Figure 3.2a). Doodles and Blacks were also described by
patches with bigger perimeters and higher variability in the first and third quartile
than Steps, Techobanine, Texas, Paradise ledge and Maverick (Figure 3.2b). In fact,
sites in cluster 2 and 3 were characterized by patches with smaller perimeters and low
variabilities (Figure 3.2b). Low impacted sites showed the highest abundance of benthic
organisms and high variability among the two sites (Figure 3.2c). Conversely, in very
and moderately impacted sites, organisms abundances have overall similar distributions
among sites (cluster 1 and 2, Figure 3.2ac).
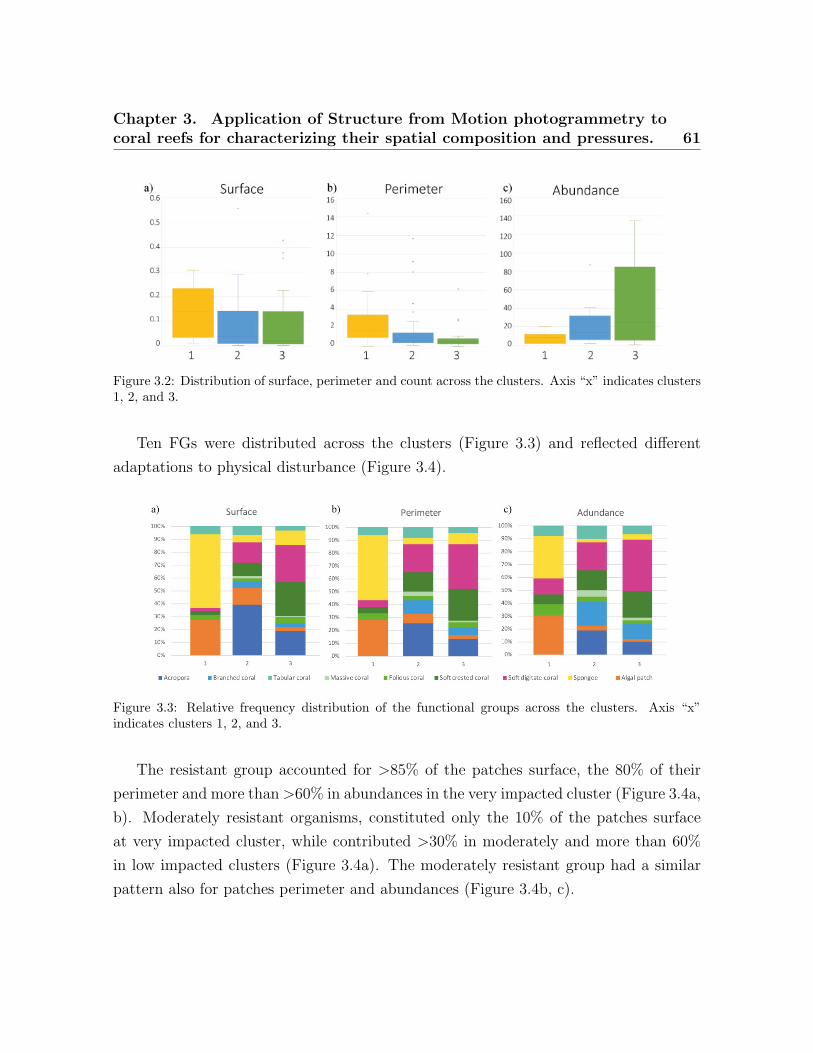
Chapter 3. Application of Structure from Motion photogrammetry tocoral reefs for characterizing their spatial composition and pressures. 61
Figure 3.2: Distribution of surface, perimeter and count across the clusters. Axis “x” indicates clusters1, 2, and 3.
Ten FGs were distributed across the clusters (Figure 3.3) and reflected different
adaptations to physical disturbance (Figure 3.4).
Figure 3.3: Relative frequency distribution of the functional groups across the clusters. Axis “x”indicates clusters 1, 2, and 3.
The resistant group accounted for >85% of the patches surface, the 80% of their
perimeter and more than >60% in abundances in the very impacted cluster (Figure 3.4a,
b). Moderately resistant organisms, constituted only the 10% of the patches surface
at very impacted cluster, while contributed >30% in moderately and more than 60%
in low impacted clusters (Figure 3.4a). The moderately resistant group had a similar
pattern also for patches perimeter and abundances (Figure 3.4b, c).
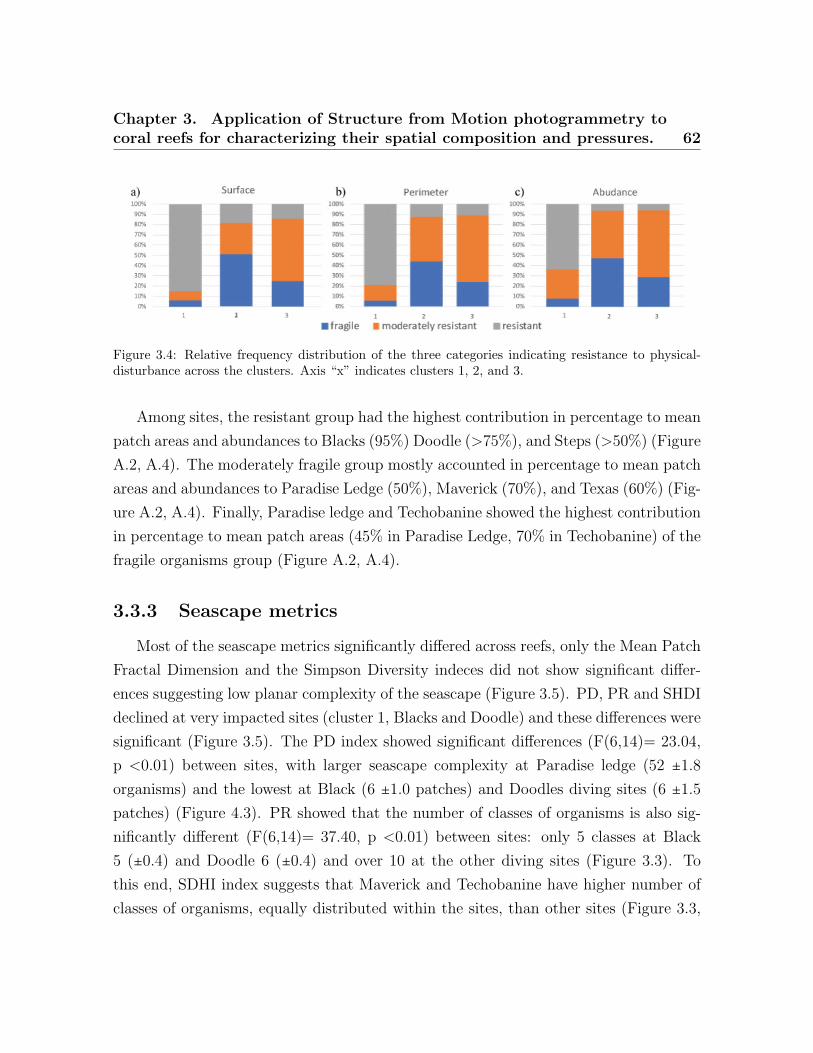
Chapter 3. Application of Structure from Motion photogrammetry tocoral reefs for characterizing their spatial composition and pressures. 62
Figure 3.4: Relative frequency distribution of the three categories indicating resistance to physical-disturbance across the clusters. Axis “x” indicates clusters 1, 2, and 3.
Among sites, the resistant group had the highest contribution in percentage to mean
patch areas and abundances to Blacks (95%) Doodle (>75%), and Steps (>50%) (Figure
A.2, A.4). The moderately fragile group mostly accounted in percentage to mean patch
areas and abundances to Paradise Ledge (50%), Maverick (70%), and Texas (60%) (Fig-
ure A.2, A.4). Finally, Paradise ledge and Techobanine showed the highest contribution
in percentage to mean patch areas (45% in Paradise Ledge, 70% in Techobanine) of the
fragile organisms group (Figure A.2, A.4).
3.3.3 Seascape metrics
Most of the seascape metrics significantly differed across reefs, only the Mean Patch
Fractal Dimension and the Simpson Diversity indeces did not show significant differ-
ences suggesting low planar complexity of the seascape (Figure 3.5). PD, PR and SHDI
declined at very impacted sites (cluster 1, Blacks and Doodle) and these differences were
significant (Figure 3.5). The PD index showed significant differences (F(6,14)= 23.04,
p <0.01) between sites, with larger seascape complexity at Paradise ledge (52 ±1.8
organisms) and the lowest at Black (6 ±1.0 patches) and Doodles diving sites (6 ±1.5
patches) (Figure 4.3). PR showed that the number of classes of organisms is also sig-
nificantly different (F(6,14)= 37.40, p <0.01) between sites: only 5 classes at Black
5 (±0.4) and Doodle 6 (±0.4) and over 10 at the other diving sites (Figure 3.3). To
this end, SDHI index suggests that Maverick and Techobanine have higher number of
classes of organisms, equally distributed within the sites, than other sites (Figure 3.3,

Chapter 3. Application of Structure from Motion photogrammetry tocoral reefs for characterizing their spatial composition and pressures. 63
Figure A1). Finally, higher morphological complexity of the patches in the seascape
(PAFRAC index F(6,14)= 3.54, p =0.02) is recorded at Doodle (2.23 ± 0.54) (Figure
3.3).
Figure 3.5: Patch Richness, Patch Density, Simpson Diversity Index, Shannons Diver-sity Index, Perimeter-Area Fractal Dimension, Mean Patch Fractal dimension (mean±SD).Siteswheretheresponsesarenotsignificantlydifferentareindicatedwiththesameletter(95%CI).

Chapter 3. Application of Structure from Motion photogrammetry tocoral reefs for characterizing their spatial composition and pressures. 64
3.4 Discussions
This study is, to the authors’ knowledge, the first attempt to assess benthic compo-
sition of coral reef using SfM ortho-mosaics and seascape ecology index over wide areas
(25 m2) and in relation to scuba diving and environmental conditions for marine mon-
itoring. The result of the classification showed substantial to excellent agreement with
expert opinion, and indicated differences in the benthic composition between diving
sites in terms of (i) patches surface, perimeter, abundance, and (ii) FGs categories (e.g.
resistant, moderately resistant, fragile). The sites exhibited different seascape metrics
(i.e. PD, PR, SHDI, PAFRAC), with general patterns emerging in terms of responses
to diving pressure and environmental conditions. In this section we discuss the result
of the classification against diving pressure and environmental conditions.
Our study found that the benthic composition differed between reef sites, suggesting
a functional relationship to diving in the PPMR, and upholding our first hypothesis
that scuba diving and environmental conditions would affect the composition of coral
reefs. Cluster results show groups of FGs and their metrics (i.e. surface, perimeter,
abundance) that suggest differences between sites in relation to benthic communities
resilience and resistance, indicating that scuba diving and environmental conditions
reflects on reef composition at seascape scale. The calculation of the seascape indices
did not show significant variability within sites suggesting that the selected sampling
unit and the number of replicates were adequate for describing the communities of
the selected coral reefs. The resistant- to- physical- impacts categories provide further
insights into seascape composition, and partialy support our second hypothesis that
the contribution of resistant organism would reflect highly dove sites and small and
shallow reefs. Dimensional factors, such as patch surface and perimeter inform the
benthic assemblage composition and complexity observing the organisms sizes and pla-
nar shape. The shape of bigger size organisms is expected to show higher complexity
in results of intra- and inter-specific competition and is related with the organisms’
densities populating the seascape. The seascape composition factors (i.e. functional

Chapter 3. Application of Structure from Motion photogrammetry tocoral reefs for characterizing their spatial composition and pressures. 65
groups and organisms abundance), inform about benthic taxa diversity and organisms
density. Lower values in taxa diversity are related to more homogeneous seascapes,
whereas higher values of organisms densities suggested lower human (i.e. low number
of dives per year) and environmental pressures (i.e. deeper and larger coral reefs). Low
organisms densities with large and complex shapes were recorded in Doodle and Blacks
which were grouped in the very impacted cluster. These sites are characterized by lower
taxa diversity and by the highest number of dives per year and are the closest sites to
lauching point at Ponta do Ouro beach. Doodle is highly frequented since 1995 while
Blacks has been dove since 2011 with moderately intensities (Table 3.2). Both sites are
subjected to strong environmental pressures due to small surface areas (450 m2 to 850
m2) and moderatly shallow average depth (-17m to -19m); the waves and the abrasive
action of resuspended sediment, limit the settlement and growth of resistant to phys-
ical impact organism as sponges and algae. Previous studies related the presence of
the organisms to scuba diving pressures (Lyons et al., 2015). Higher FGs diversity and
high presence of Acropora colonies were recorded on the moderately impacted cluster.
This cluster included three sites very distant one another (Figure 3.1): Techobanine
is at 19.6 km, Steps at 3.6 km and Texas at 9.6 km from Ponta do Ouro launching
point. Steps, is characterized by lowest organisms density while Texas by the highest.
Both sites present high variability which suggests that there are spatial differences in
the benthic community composition (PR and PD) over the sampled seascapes (Figure
3.5). Texas also shows smaller average organisms surface and higher fractal dimension
than the other two sites suggesting greater variabilities in organisms’ shapes and di-
mensions which could be related to local recovering to environmental extreme events
(i.e. cyclones storms) or to intense scuba diving use of the dive site in the past (Table
A.1). Techobanine shows highest frequencies in hard branched corals and Acroporas’
colonies probably favoured by the lower average depth of the site (-12 m) and by the
very low number of dives per years recorded in the last decade. The low density and
large dimensions of the organisms is explained by the higher grow rate of these hard
corals ((Lirman, 2000)) which compensate the impacts caused by the high energy hy-
drodynamic conditions of the area. Among sites, Steps is the only highly visited by
scuba divers since 1995 (>3000 dives/yr), while Texas has less than 300 dives/yr in the

Chapter 3. Application of Structure from Motion photogrammetry tocoral reefs for characterizing their spatial composition and pressures. 66
last decade and Techobanine is annually rarely visited (Table 3.2 Table A.1). Steps is
smaller than Techobanine and Texas but it develops along a rocky edge; small canyons
and cracks in the rocky substrate provide sheltered areas to waves action and scuba
diving direct impacts, likely favouring the presence of branched corals (Schleyer et al.,
2008).
Cluster 3 shows higher level of taxa diversity and organisms density in results of
the low scuba diving pressure and the low Environmental conditions. Paradise ledge
and Maverick are the deeper (-18m to -20 m) and extended sites with maximal of
2852 dives/yr recorded in Paradise Ledge 2002 and an average of 365 dive/yr for the
same site in the last decade. Maverick is located in the close proximity and it has been
rarely visited. The high taxa diversity observed in the sites has correspondence with the
high organisms’ abundance composing the seascape which is more variable in Maverick.
Soft corals classes which mainly represent the moderately resistant organisms shown
low growth rate and low larval recruitment (Schleyer et al., 2008) compose in the sites
the more characteristic “coral carpet” described in literature (Jordan and Samways,
2001). The three clusters described with organisms’ classes of resistance to physical
impacts showed the agreements with the scuba diving pressure intensity and duration
and environmental pressures defined with site extension and average depth. Recre-
ational diving appears to elicit a press on benthic assemblages’ composition effecting
more on small size and shallow sites. Doodles and Blacks presented the higher frequen-
cies of organisms resistant- to- physical- impacts (i.e. sponges, algal patches), the lower
patch classes diversity and organisms’ density. The few fragile organisms identified
in the cluster 1 sites are tabular corals which have a limited three-dimensional com-
plexity shape and are potentially more resistant- to- physical- impacts to scuba diving
activities than Acroporas and other branched corals. In Steps, resistant organisms are
relatively higher than in Techobanine. The reef morphology (i.e. edges and canyons)
could influence the abundance and dimension of fragile organisms (i.e. Acropora corals)
favouring a more heterogeneous community with moderately fragile and resistant or-
ganisms. Steps and Texas present higher frequencies in resistant organisms especially
sponges, and the relatively low frequencies in fragile organisms. Cluster 3 grouped the
sites Paradise ledge and Maverick. Both are large sites and the most deeper (-18 m to
Chapter 3. Application of Structure from Motion photogrammetry tocoral reefs for characterizing their spatial composition and pressures. 67
-20 m) therefore environmental pressure were considered low. Benthic communities in
both sites are well represented by soft corals and moderately resistant organisms. Or-
ganisms abundance is the higher which includes several size organisms with is reflected
in a smaller perimeter variability of the second and third quartiles and in a lower frac-
tality of the patches within the landscape. The lowest number of dives registered in
these sites suggest a low to null scuba diving impacts. As reported in literature the
southernmost African coral reef areas are frequently kicked by seasonal cyclones which
may cause extensive damages (Ramsay, 1996) but on a long term are do not exceed
human damages recorded on benthic habitat (Schleyer and Tomalin, 2000). In these
hydrodynamic high energy habitats where coral reefs morphological complexity is low,
the role of branched coral colonies has been descried as very important for protecting
fish species juveniles (Floros and Schleyer, 2017). Physical damages on these particular
coral reef population where soft and low in profile corals are dominant in seascape are
not easy to identify by visual census even if Schleyer and Tomalin (2000) studying the
coral reef communities of Sodwana Bay quantify damages on both hard and soft corals
caused by scuba diving activities and recreational fishing. The method here proposed
does not focus on the damages observed on organisms but described the resulting effect
of the human pressures combined with environmental conditions on the spatial compo-
sition of benthic functional groups and their interaction in the seascape (Lamb et al.,
2014; Bravo et al., 2015). Traditional tools for establishing management programmes for
recreational SCUBA diving estimate the sites carry capacity as the maximal amount of
disturbances that communities can cope without showing degradation effects and losing
their aesthetic value (Davis, 1993; Hawkins and Roberts, 1997). The calculation based
on the vulnerability of the site, therefore consider the species composition and their
conservation status (Hawkins and Roberts, 1997). However, this approach does not
consider if the community composition is already the result of human driven changes
or the community composition is the results of environmental conditions. Despite, our
study looked at the benthic habitat composition as the result of the specific history of
each site and consider all the site equally able to support similar benthic communities
in order to the similar geology, geomorphology, exposition and depth range, long-term
monitoring program are required for a correct interpretation of natural trend in the
Chapter 3. Application of Structure from Motion photogrammetry tocoral reefs for characterizing their spatial composition and pressures. 68
coral reef composition. Porter and Schleyer (2017) describing the results of a 20 years
long monitoring program at Sodwana bay highlighting the decreasing trend in soft
corals and the positive increment of hard corals with inter annual positive temperature
increment. These information, when available should be considered in the definition of
the new descriptors related to the fragility of the studied sites.
3.5 Acknowledgments
This work was supported by the PhD scholarship EUREKA, the European So-
cial Funds (FSE), Programma Operativo Regionale (POR) 2014/2020 Regione Marche
(Italy), the Marie Sklodowska-Curie Action, Horizon2020 within the project GreenBub-
bles (Grant Number 643712) and UBICA srl.
Chapter 4
SfM-Based Method to Assess Gorgonian Forests (Para-
muricea clavata (Cnidaria, Octocorallia))1
Abstract
Animal forests promote marine habitats morphological complexity and functioning.
The red gorgonian, Paramuricea clavata, is a key structuring species of the Mediter-
ranean coralligenous habitat and an indicator species of climate effects on habitat func-
tioning. P. clavata metrics such as population structure, morphology and biomass in-
form on the overall health of coralligenous habitats, but the estimation of these metrics
is time and cost consuming, and often requires destructive sampling. As a consequence,
the implementation of long-term and wide-area monitoring programmes is limited. This
study proposes a novel and transferable Structure from Motion (SfM) based method for
the estimation of gorgonian population structure (i.e., maximal height, density, abun-
dance), morphometries (i.e., maximal width, fan surface) and biomass (i.e., coenenchy-
mal Dry Weight, Ash Free Dried Weight). The method includes the estimation of a
novel metric (3D canopy surface) describing the gorgonian forest as a mosaic of planes
generated by fitting multiple 5 cm × 5 cm facets to a SfM generated point cloud. The
performance of the method is assessed for two different cameras (GoPro Hero4 and
Sony NEX7). Results showed that for highly dense populations (17 colonies/m2), the
SfM-method had lower accuracies in estimating the gorgonians density for both cam-
1Palma, M., Rivas Casado, M., Pantaleo, U., Pavoni, G., Pica, D. and Cerrano, C., 2018. SfM-Based Method to Assess Gorgonian Forests (Paramuricea clavata (Cnidaria, Octocorallia)). RemoteSensing, 10(7), p.1154.The spelling of the original published manuscript has been adjusted to fit the format of this thesis.
Chapter 4. SfM-Based Method to Assess Gorgonian Forests(Paramuricea clavata (Cnidaria, Octocorallia)) 70
eras (60% to 89%) than for medium to low density populations (14 and 7 colonies/m2)
(71% to 100%). Results for the validation of the method showed that the correlation
between ground truth and SfM estimates for maximal height, maximal width and fan
surface were between R2 = 0.63 and R2 = 0.9, and R2 = 0.99 for coenenchymal surface
estimation. The methodological approach was used to estimate the biomass of the gor-
gonian population within the study area and across the coralligenous habitat between
−25 to −40 m depth in the Portofino Marine Protected Area. For that purpose, the
coenenchymal surface of sampled colonies was obtained and used for the calculations.
Results showed biomass values of dry weight and ash free dry weight of 220 g and 32 g
for the studied area and to 365 kg and 55 Kg for the coralligenous habitat in the Marine
Protected Area. This study highlighted the feasibility of the methodology for the quan-
tification of P. clavata metrics as well as the potential of the SfM-method to improve
current predictions of the status of the coralligenous habitat in the Mediterranean sea
and overall management of threatened ecosystems.
Keywords : animal forest; point cloud classification; Good Environmental Status; envi-
ronmental accounting; conservation
4.1 Introduction
The term animal forest refers to the underwater population of suspension feeders
mainly represented by sponges, cnidarians and bivalves which are well known for en-
hancing the morphological complexity of the seascape and structuring the habitat of
the communities, thus promoting their functionalities Sanchez (2015). In the Mediter-
ranean Sea, animal forests are well represented by several octocoral species such as the
gorgonian Paramuricea clavata (Risso, 1826). This is a slow-growing, long-lived and
low fecundity species which forms dense forests along outcrops, cliffs and biogenic sub-
strates (Ballesteros, 2006) from −15 m to −200 m depth (Rossi, 2013; Gori et al., 2017).
P. clavata is of special interest in coralligenous habitats because its canopy reduces
the range of environmental variability and supports key associated biota (Rossi, 2013;
Valisano et al., 2016; Ponti et al., 2016). The annual linear growth rate for the species

Chapter 4. SfM-Based Method to Assess Gorgonian Forests(Paramuricea clavata (Cnidaria, Octocorallia)) 71
ranges between 2.7 cm and 3.0 cm, with larger rates observed for smaller colonies (Mis-
tri and Ceccherelli, 1994). The shape of the fan, its growth and orientation adapt to
local water current regimes, with the maximal filtration surface always opposing the
water flow to maximize feeding efficiency (Grigg, 1972). In return, the drag effect of the
fans promotes particle retention, this supporting both invertebrate and vertebrate and
favoring the trophic energy transfer between benthos and plankton (Gili and Coma,
1998). As cold-affinity species, P. clavata has a high sensitivity to thermal stress (Pre-
viati et al., 2010; Vezzulli et al., 2013) and is therefore considered an indicator species
of climate effects on benthic assemblages (Linares et al., 2008b). In the last decades,
the gorgonian forests in the Mediterranean Sea have been affected by mass mortality
events triggered by water temperature anomalies that have led to functional changes in
the coralligenous habitat, and to local extinctions of the species in shallow waters (Cer-
rano et al., 2000; Linares et al., 2008c; Cerrano and Bavestrello, 2008, 2009; Garrabou
et al., 2009; Vezzulli et al., 2010; Huete-Stauffer et al., 2011; Santangelo et al., 2015;
Ponti et al., 2016). Moreover, the short larval dispersion of P. clavata could inhibit
genetic exchanges between populations increasing their genetic isolation and limit the
species recovery to mass mortality events (Mokahtar-Jamaı et al., 2011).
Multiple structural, morphological and biomass metrics have been used to describe
the status (or quality) of gorgonian forests (Coma et al., 1995; Mistri and Ceccherelli,
1994; Coma et al., 1998; Cerrano et al., 2005). For example, the linear growth and
density of colonies, the basal diameter, and the coenenchymal ash free dry weight
inform about the population’s structure, the secondary production and the growth,
which in combination with the sex ratio and the characteristics of the gonads (number,
dimension and dry weight) provides insight into the population’s conservation status
and the state of evolution (Mistri and Ceccherelli, 1994; Coma et al., 1995; Mistri,
1995; Cerrano et al., 2005). The rectangular fan surface, calculated as the product of
the maximal height and the maximal width of the fan, informs about the age of the
colony (Weinbauer and Velimirov, 1995), whereas the epibiosis typology and coverage
of the colonies highlight the intensity of the mechanical impacts that the colonies have
been exposed to (Cerrano et al., 2005). These metrics are therefore critical to (i)
monitor changes in the population structure over time (Linares et al., 2008b; Rossi,
Chapter 4. SfM-Based Method to Assess Gorgonian Forests(Paramuricea clavata (Cnidaria, Octocorallia)) 72
2013), (ii) quantify the magnitude of environmental disturbances (Deter et al., 2012)
and (iii) assess the recovery capacity of the populations (Santangelo et al., 2015).
In recent years, the up-take of new technologies has supported researchers and sur-
veyors with the collection of in-situ data. Structure fromMotion (SfM) photogrammetry
based methods are perhaps the most successful example within the context of benthic
community mapping (Figueira et al., 2015; Ferrari et al., 2017; Palma et al., 2017).
SfM is a topographic survey technique for the reconstruction of real scale three dimen-
sional models of subjects or scenarios, using imagery collected at unknown camera posi-
tions (James and Robson, 2012). It enables non-destructive, repeatable measurements
and facilitates rapid sampling (Figueira et al., 2015). Applications of SfM surveying
methods in terrestrial and seascape environments have provided accuracies and reso-
lutions comparable to more sophisticated technologies (e.g., laser scanning) (Wallace
et al., 2016; Palma et al., 2017) and therefore, show great potential for the estimation
of gorgonian structural and morphological metrics. The accuracy of SfM in estimating
habitat complexity and morphometries of massive organisms and branched hard corals
has been recently assessed by other authorsm (Ferrari et al., 2017; Raoult et al., 2017;
Bryson et al., 2017; Royer et al., 2018) but none previously characterized erected and
branched soft corals such as gorgonian species, even though SfM could provide an effec-
tive way forward towards assessing colonies’ sizes and density, as well as biomass across
habitats. With an increasing need to rapidly characterize gorgonian size, density and
biomass being more prominent than ever under an economically constrained scenario
and increased antrophogenic and climate pressures, the potential of SfM methods to fill
this gap in knowledge cannot be left unexplored.
In Palma et al. (2017), we developed an SfM based framework for the design of
robust monitoring programmes of African coral reefs. Here, we propose a method for
the estimation of density, abundance and key P. clavata morphometrics in gorgonian
forests through segmentation and analysis of scaled point clouds generated by SfM
photogrammetry. This is achieved through the following objectives: 1—To develop a
SfM based framework for the automated and accurate estimation of P. clavata density,
abundance, maximal height, maximal width, fan surface and biomass; 2—To assess
the performance of the SfM method using two cameras representative of different mar-

Chapter 4. SfM-Based Method to Assess Gorgonian Forests(Paramuricea clavata (Cnidaria, Octocorallia)) 73
ket segments. 3—To demonstrate the usefulness of the method for the estimation of
the gorgonian forests biomass within the Marine Protected Area of Portofino (Punta
del Faro, Italy); 4—To discuss the relevance of the proposed method in line with cur-
rent practice in gorgonian forest monitoring and its implications for future P. clavata
research and management.
4.2 Materials and Methods
4.2.1 Study Site
The study site is located in the Marine Protected Area of Portofino (Punta del Faro,
Italy) (44.298414N, 9.218549E, WGS84) and extends along 52 m2. The sampling was
carried out between −32 m to −36 m along the West-East oriented cliff of Punta del
Faro (Figure 4.1). In the area, the gorgonian forest underwent four consecutive mass
mortality episodes in 1999, 2003, 2008 and 2013 that led to a progressively fragmented
distribution of the colonies with increasing depth and the species extinction above
−20 m (Cerrano and Bavestrello, 2008; Garrabou et al., 2009; Huete-Stauffer et al.,
2013).
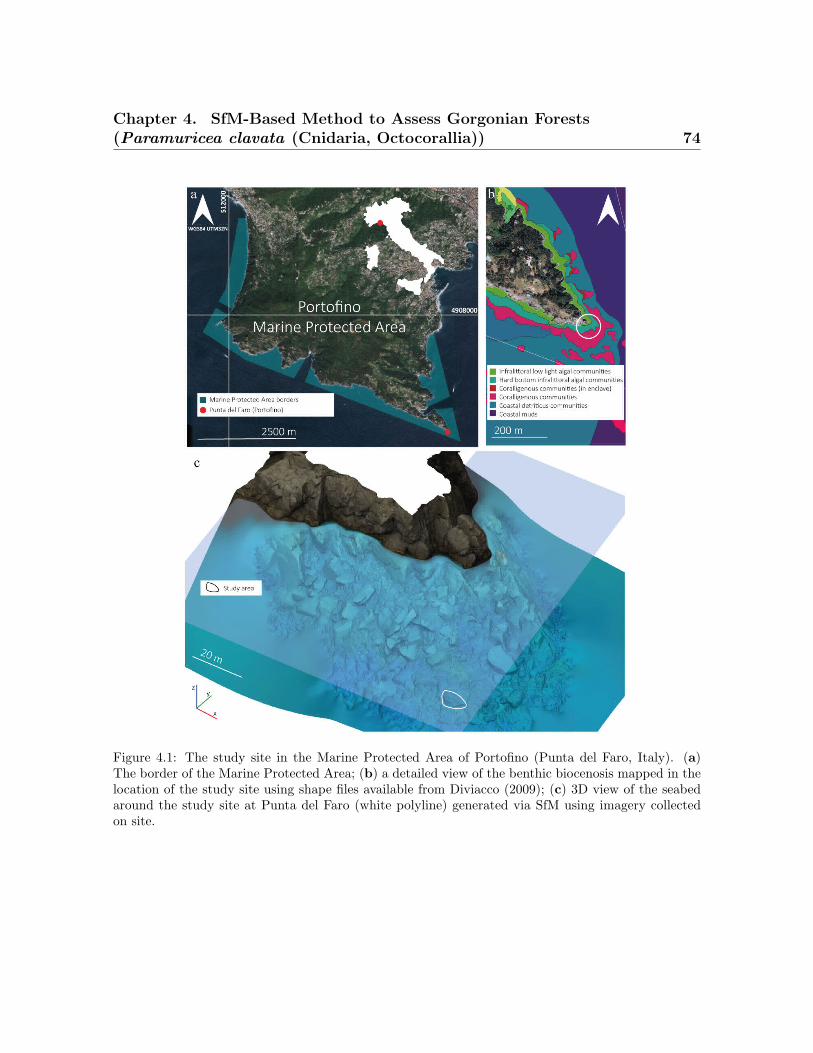
Chapter 4. SfM-Based Method to Assess Gorgonian Forests(Paramuricea clavata (Cnidaria, Octocorallia)) 74
Figure 4.1: The study site in the Marine Protected Area of Portofino (Punta del Faro, Italy). (a)The border of the Marine Protected Area; (b) a detailed view of the benthic biocenosis mapped in thelocation of the study site using shape files available from Diviacco (2009); (c) 3D view of the seabedaround the study site at Punta del Faro (white polyline) generated via SfM using imagery collectedon site.
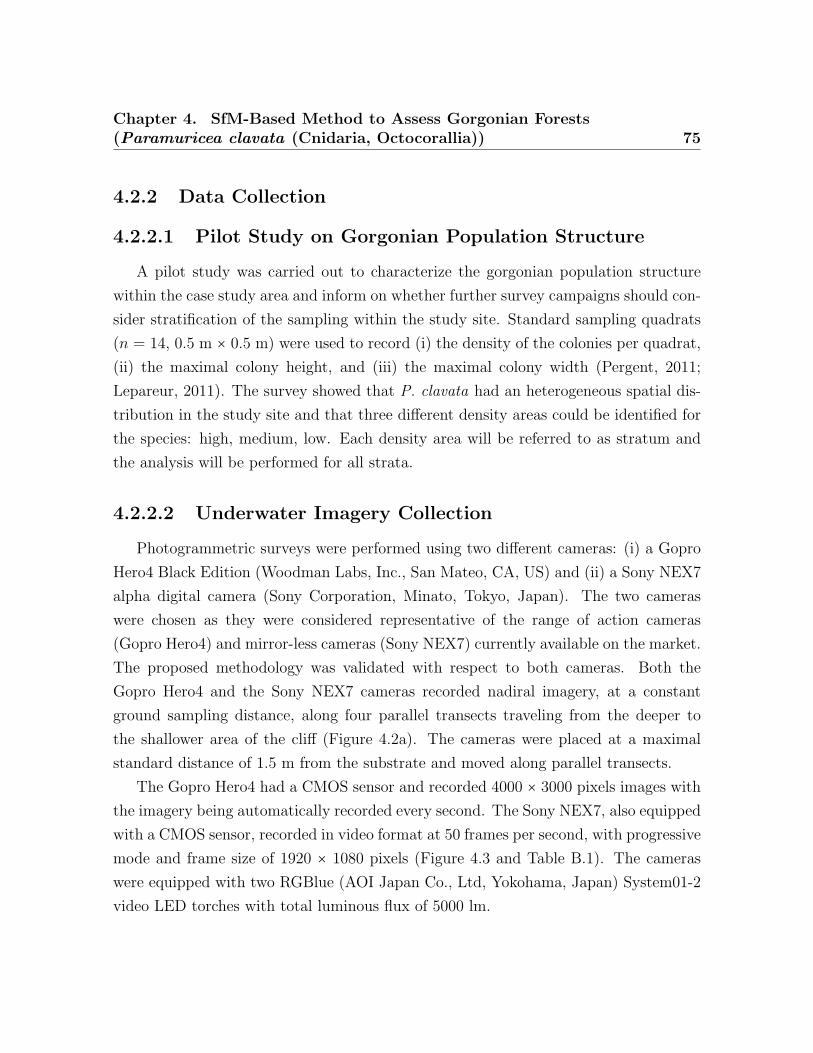
Chapter 4. SfM-Based Method to Assess Gorgonian Forests(Paramuricea clavata (Cnidaria, Octocorallia)) 75
4.2.2 Data Collection
4.2.2.1 Pilot Study on Gorgonian Population Structure
A pilot study was carried out to characterize the gorgonian population structure
within the case study area and inform on whether further survey campaigns should con-
sider stratification of the sampling within the study site. Standard sampling quadrats
(n = 14, 0.5 m × 0.5 m) were used to record (i) the density of the colonies per quadrat,
(ii) the maximal colony height, and (iii) the maximal colony width (Pergent, 2011;
Lepareur, 2011). The survey showed that P. clavata had an heterogeneous spatial dis-
tribution in the study site and that three different density areas could be identified for
the species: high, medium, low. Each density area will be referred to as stratum and
the analysis will be performed for all strata.
4.2.2.2 Underwater Imagery Collection
Photogrammetric surveys were performed using two different cameras: (i) a Gopro
Hero4 Black Edition (Woodman Labs, Inc., San Mateo, CA, US) and (ii) a Sony NEX7
alpha digital camera (Sony Corporation, Minato, Tokyo, Japan). The two cameras
were chosen as they were considered representative of the range of action cameras
(Gopro Hero4) and mirror-less cameras (Sony NEX7) currently available on the market.
The proposed methodology was validated with respect to both cameras. Both the
Gopro Hero4 and the Sony NEX7 cameras recorded nadiral imagery, at a constant
ground sampling distance, along four parallel transects traveling from the deeper to
the shallower area of the cliff (Figure 4.2a). The cameras were placed at a maximal
standard distance of 1.5 m from the substrate and moved along parallel transects.
The Gopro Hero4 had a CMOS sensor and recorded 4000 × 3000 pixels images with
the imagery being automatically recorded every second. The Sony NEX7, also equipped
with a CMOS sensor, recorded in video format at 50 frames per second, with progressive
mode and frame size of 1920 × 1080 pixels (Figure 4.3 and Table B.1). The cameras
were equipped with two RGBlue (AOI Japan Co., Ltd, Yokohama, Japan) System01-2
video LED torches with total luminous flux of 5000 lm.
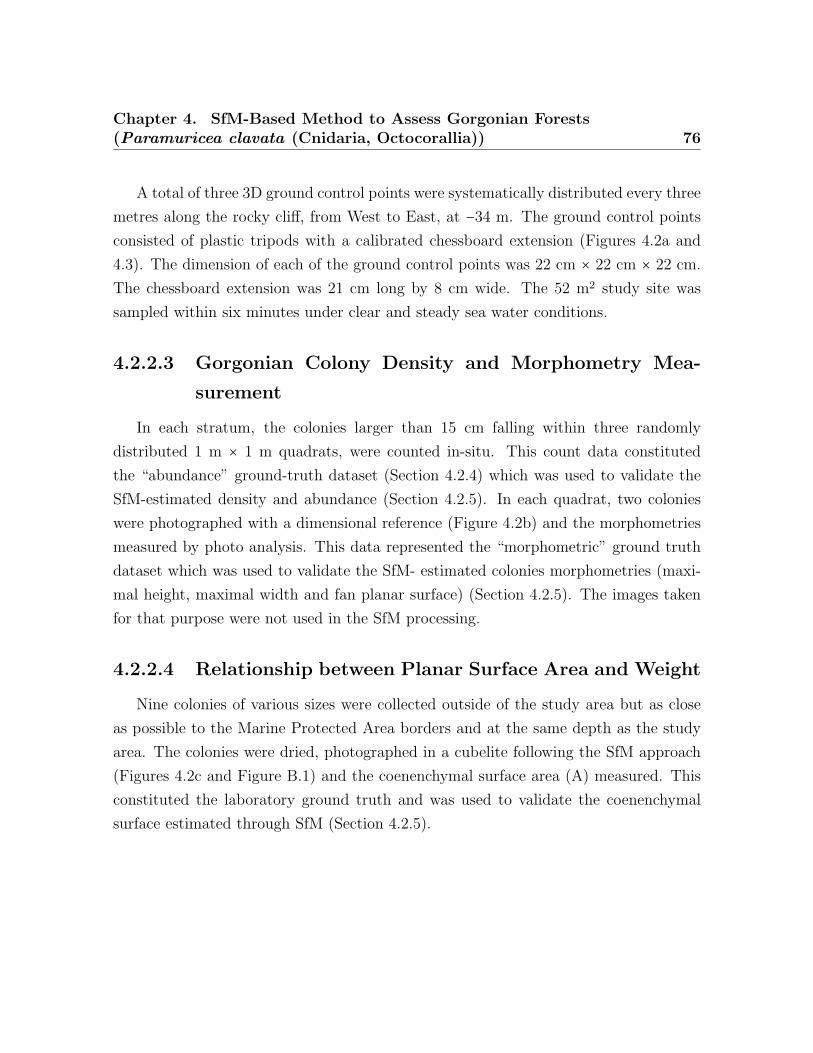
Chapter 4. SfM-Based Method to Assess Gorgonian Forests(Paramuricea clavata (Cnidaria, Octocorallia)) 76
A total of three 3D ground control points were systematically distributed every three
metres along the rocky cliff, from West to East, at −34 m. The ground control points
consisted of plastic tripods with a calibrated chessboard extension (Figures 4.2a and
4.3). The dimension of each of the ground control points was 22 cm × 22 cm × 22 cm.
The chessboard extension was 21 cm long by 8 cm wide. The 52 m2 study site was
sampled within six minutes under clear and steady sea water conditions.
4.2.2.3 Gorgonian Colony Density and Morphometry Mea-
surement
In each stratum, the colonies larger than 15 cm falling within three randomly
distributed 1 m × 1 m quadrats, were counted in-situ. This count data constituted
the “abundance” ground-truth dataset (Section 4.2.4) which was used to validate the
SfM-estimated density and abundance (Section 4.2.5). In each quadrat, two colonies
were photographed with a dimensional reference (Figure 4.2b) and the morphometries
measured by photo analysis. This data represented the “morphometric” ground truth
dataset which was used to validate the SfM- estimated colonies morphometries (maxi-
mal height, maximal width and fan planar surface) (Section 4.2.5). The images taken
for that purpose were not used in the SfM processing.
4.2.2.4 Relationship between Planar Surface Area and Weight
Nine colonies of various sizes were collected outside of the study area but as close
as possible to the Marine Protected Area borders and at the same depth as the study
area. The colonies were dried, photographed in a cubelite following the SfM approach
(Figures 4.2c and Figure B.1) and the coenenchymal surface area (A) measured. This
constituted the laboratory ground truth and was used to validate the coenenchymal
surface estimated through SfM (Section 4.2.5).
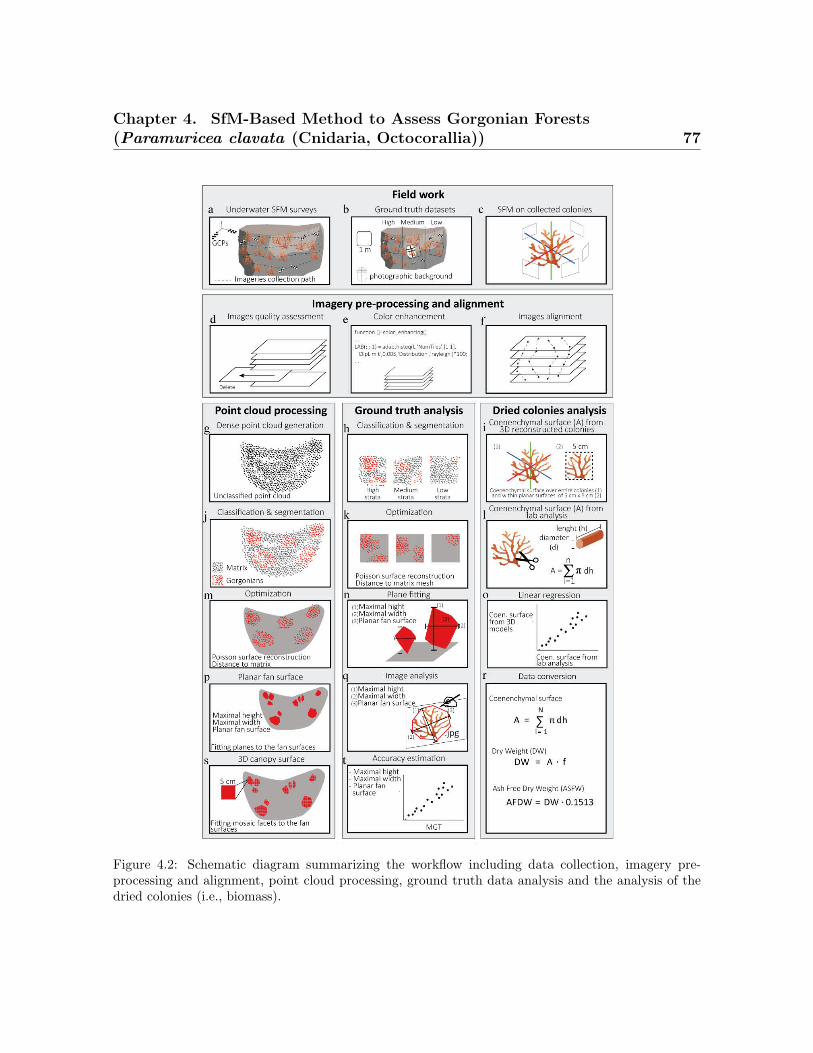
Chapter 4. SfM-Based Method to Assess Gorgonian Forests(Paramuricea clavata (Cnidaria, Octocorallia)) 77
Figure 4.2: Schematic diagram summarizing the workflow including data collection, imagery pre-processing and alignment, point cloud processing, ground truth data analysis and the analysis of thedried colonies (i.e., biomass).
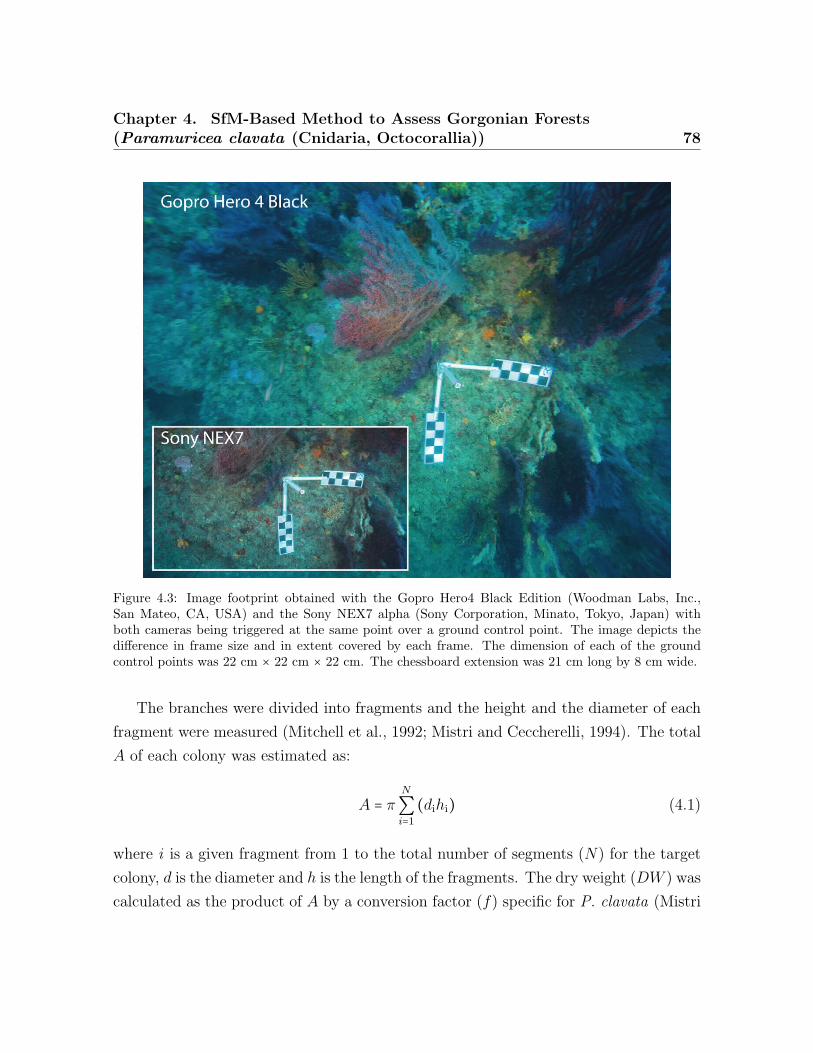
Chapter 4. SfM-Based Method to Assess Gorgonian Forests(Paramuricea clavata (Cnidaria, Octocorallia)) 78
Figure 4.3: Image footprint obtained with the Gopro Hero4 Black Edition (Woodman Labs, Inc.,San Mateo, CA, USA) and the Sony NEX7 alpha (Sony Corporation, Minato, Tokyo, Japan) withboth cameras being triggered at the same point over a ground control point. The image depicts thedifference in frame size and in extent covered by each frame. The dimension of each of the groundcontrol points was 22 cm × 22 cm × 22 cm. The chessboard extension was 21 cm long by 8 cm wide.
The branches were divided into fragments and the height and the diameter of each
fragment were measured (Mitchell et al., 1992; Mistri and Ceccherelli, 1994). The total
A of each colony was estimated as:
A = πN
∑i=1
(dihi) (4.1)
where i is a given fragment from 1 to the total number of segments (N) for the target
colony, d is the diameter and h is the length of the fragments. The dry weight (DW ) was
calculated as the product of A by a conversion factor (f) specific for P. clavata (Mistri
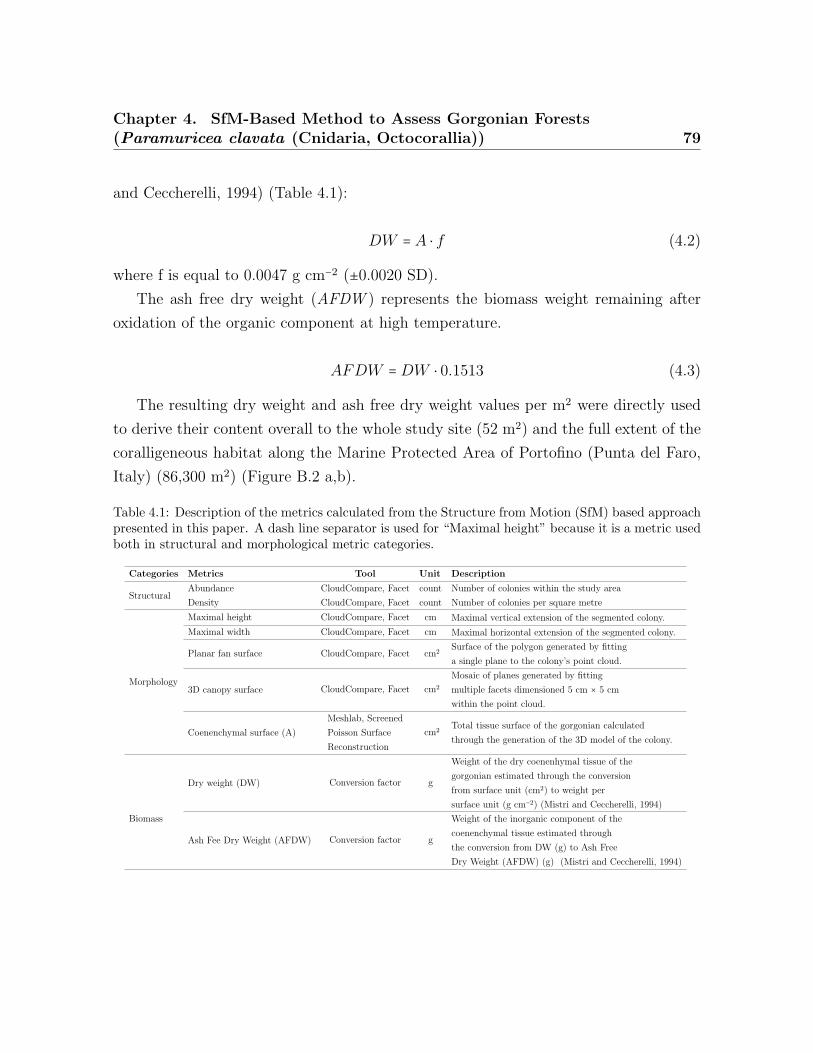
Chapter 4. SfM-Based Method to Assess Gorgonian Forests(Paramuricea clavata (Cnidaria, Octocorallia)) 79
and Ceccherelli, 1994) (Table 4.1):
DW = A ⋅ f (4.2)
where f is equal to 0.0047 g cm−2 (±0.0020 SD).
The ash free dry weight (AFDW ) represents the biomass weight remaining after
oxidation of the organic component at high temperature.
AFDW =DW ⋅ 0.1513 (4.3)
The resulting dry weight and ash free dry weight values per m2 were directly used
to derive their content overall to the whole study site (52 m2) and the full extent of the
coralligeneous habitat along the Marine Protected Area of Portofino (Punta del Faro,
Italy) (86,300 m2) (Figure B.2 a,b).
Table 4.1: Description of the metrics calculated from the Structure from Motion (SfM) based approachpresented in this paper. A dash line separator is used for “Maximal height” because it is a metric usedboth in structural and morphological metric categories.
Categories Metrics Tool Unit Description
StructuralAbundance CloudCompare, Facet count Number of colonies within the study area
Density CloudCompare, Facet count Number of colonies per square metre
Morphology
Maximal height CloudCompare, Facet cm Maximal vertical extension of the segmented colony.
Maximal width CloudCompare, Facet cm Maximal horizontal extension of the segmented colony.
Planar fan surface CloudCompare, Facet cm2Surface of the polygon generated by fitting
a single plane to the colony’s point cloud.
3D canopy surface CloudCompare, Facet cm2
Mosaic of planes generated by fitting
multiple facets dimensioned 5 cm × 5 cm
within the point cloud.
Coenenchymal surface (A)
Meshlab, Screened
Poisson Surface
Reconstruction
cm2Total tissue surface of the gorgonian calculated
through the generation of the 3D model of the colony.
Biomass
Dry weight (DW) Conversion factor g
Weight of the dry coenenhymal tissue of the
gorgonian estimated through the conversion
from surface unit (cm2) to weight per
surface unit (g cm−2) (Mistri and Ceccherelli, 1994)
Ash Fee Dry Weight (AFDW) Conversion factor g
Weight of the inorganic component of the
coenenchymal tissue estimated through
the conversion from DW (g) to Ash Free
Dry Weight (AFDW) (g) (Mistri and Ceccherelli, 1994)

Chapter 4. SfM-Based Method to Assess Gorgonian Forests(Paramuricea clavata (Cnidaria, Octocorallia)) 80
4.2.3 Image Processing
All the imagery collected underwater was screened and chosen for photogrammetric
processing when having suitable image quality and consecutive spatial coverage (Palma
et al., 2017) (Figure 4.2d–f and Table 4.2). The selected images were processed within
Matlab (Mathworks, Natick, MA, USA) using the Contrast Limited Adaptive His-
togram Equalization (CLAHE) algorithm (Zuiderveld, 1994) to enhance the luminos-
ity, sharpness and contrast of the images (Figure 4.2e). The uncalibrated images were
then processed using AgiSoft Photoscan software (Agisoft LLC., St. Petersburg, Rus-
sia) to estimate the relative camera poses and generate dense clouds. For consistency
and comparability purposes, both Gopro Hero4 and Sony NEX7 datasets were aligned
together generating a sparse point cloud and then separated to create the dense point
cloud under the same settings (Figure 4.2f). The photogrammetric processing was
performed with an Asus laptop (Beitou District, Taipei, Taiwan) with an Intel Core i7-
3630QM 2.40-GPz processor (Intel Corporation, Santa Clara, CA, USA), 16 Gb RAM
and NVIDIA Geoforce GTX 670M (NVIDIA Corporation, Santa Clara, CA, USA)
graphic card. The overall procedure for the two cameras combined required a total
of 10 h (Figure 4.2g). The resulting dense point clouds were sub-sampled at 1 mm,
scaled using the ground control point and cleaned of extremes and outliers using the
software CloudCompare (Girardeau-Montaut, 2014). Then, the clouds were clipped
using a polygon mask to a common surface of 52 m2. The dense point clouds (and
derived population structure and morphometry) obtained by processing the imagery of
each camera, were compared to determine the sensitivity of the proposed SfM method
to the equipment used. For that purpose, the closest point distance between the two
clouds was calculated. For each point of the second point cloud, the closest point from
the first point cloud and the distance between them was recorded (Lague et al., 2013).
Similarly, the point frequency per distance class (1 cm) and the average value were
also calculated. The imagery collected in the cubelite from the dried colonies was also
processed to generate dense point clouds. The Screened Poisson Reconstruction filter
in Meshlab, ref. (Kazhdan and Hoppe, 2013) was applied to the cleaned and scaled
dense point cloud to generate an accurate coenenchymal surface model of each colony
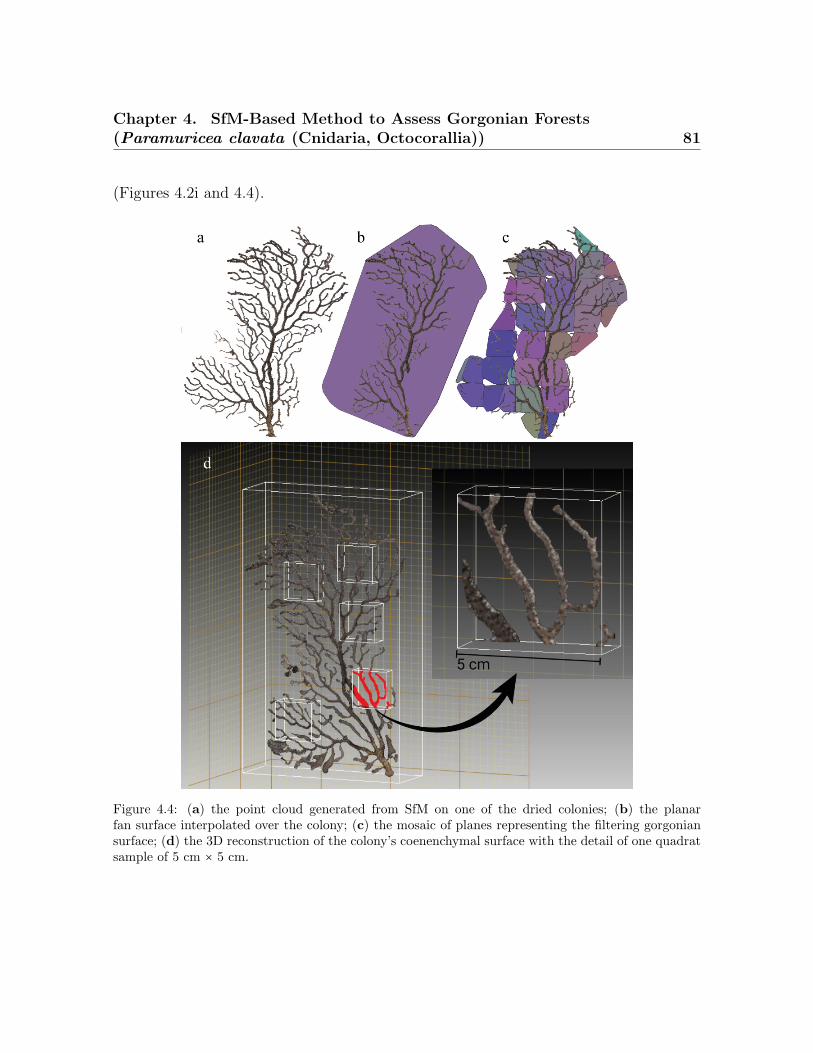
Chapter 4. SfM-Based Method to Assess Gorgonian Forests(Paramuricea clavata (Cnidaria, Octocorallia)) 81
(Figures 4.2i and 4.4).
Figure 4.4: (a) the point cloud generated from SfM on one of the dried colonies; (b) the planarfan surface interpolated over the colony; (c) the mosaic of planes representing the filtering gorgoniansurface; (d) the 3D reconstruction of the colony’s coenenchymal surface with the detail of one quadratsample of 5 cm × 5 cm.
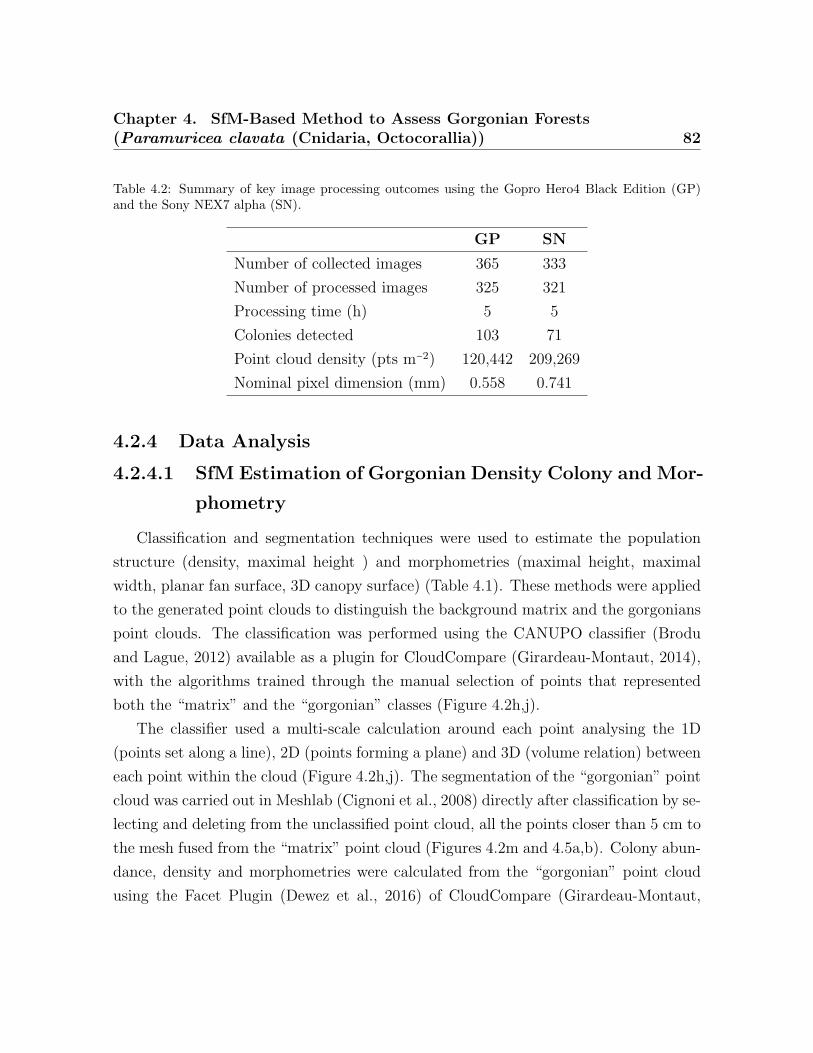
Chapter 4. SfM-Based Method to Assess Gorgonian Forests(Paramuricea clavata (Cnidaria, Octocorallia)) 82
Table 4.2: Summary of key image processing outcomes using the Gopro Hero4 Black Edition (GP)and the Sony NEX7 alpha (SN).
GP SN
Number of collected images 365 333
Number of processed images 325 321
Processing time (h) 5 5
Colonies detected 103 71
Point cloud density (pts m−2) 120,442 209,269
Nominal pixel dimension (mm) 0.558 0.741
4.2.4 Data Analysis
4.2.4.1 SfM Estimation of Gorgonian Density Colony and Mor-
phometry
Classification and segmentation techniques were used to estimate the population
structure (density, maximal height ) and morphometries (maximal height, maximal
width, planar fan surface, 3D canopy surface) (Table 4.1). These methods were applied
to the generated point clouds to distinguish the background matrix and the gorgonians
point clouds. The classification was performed using the CANUPO classifier (Brodu
and Lague, 2012) available as a plugin for CloudCompare (Girardeau-Montaut, 2014),
with the algorithms trained through the manual selection of points that represented
both the “matrix” and the “gorgonian” classes (Figure 4.2h,j).
The classifier used a multi-scale calculation around each point analysing the 1D
(points set along a line), 2D (points forming a plane) and 3D (volume relation) between
each point within the cloud (Figure 4.2h,j). The segmentation of the “gorgonian” point
cloud was carried out in Meshlab (Cignoni et al., 2008) directly after classification by se-
lecting and deleting from the unclassified point cloud, all the points closer than 5 cm to
the mesh fused from the “matrix” point cloud (Figures 4.2m and 4.5a,b). Colony abun-
dance, density and morphometries were calculated from the “gorgonian” point cloud
using the Facet Plugin (Dewez et al., 2016) of CloudCompare (Girardeau-Montaut,

Chapter 4. SfM-Based Method to Assess Gorgonian Forests(Paramuricea clavata (Cnidaria, Octocorallia)) 83
2014). This plugin, developed to study the geological planar facets (Figure 4.4) of rock
out-crops, processed the point cloud twice. The first time, to count the gorgonian’s
fans by approximating them to elementary planar objects (Figures 4.2p and 4.5c) and
to calculate the maximal height, maximal width and planar fan surface (Table 4.1).
The second time, to divide the point cloud into a mosaic of facets with maximal di-
mension of 5 cm × 5 cm (Figure 4.2s) from which the 3D canopy surface (Table 4.1,
Figures 4.4c and 4.5d) of the population was estimated as the sum of the individual
facet surfaces.The facet dimensions (5 cm × 5 cm) were determined based on the size
of the smallest colonies considered in the study site.
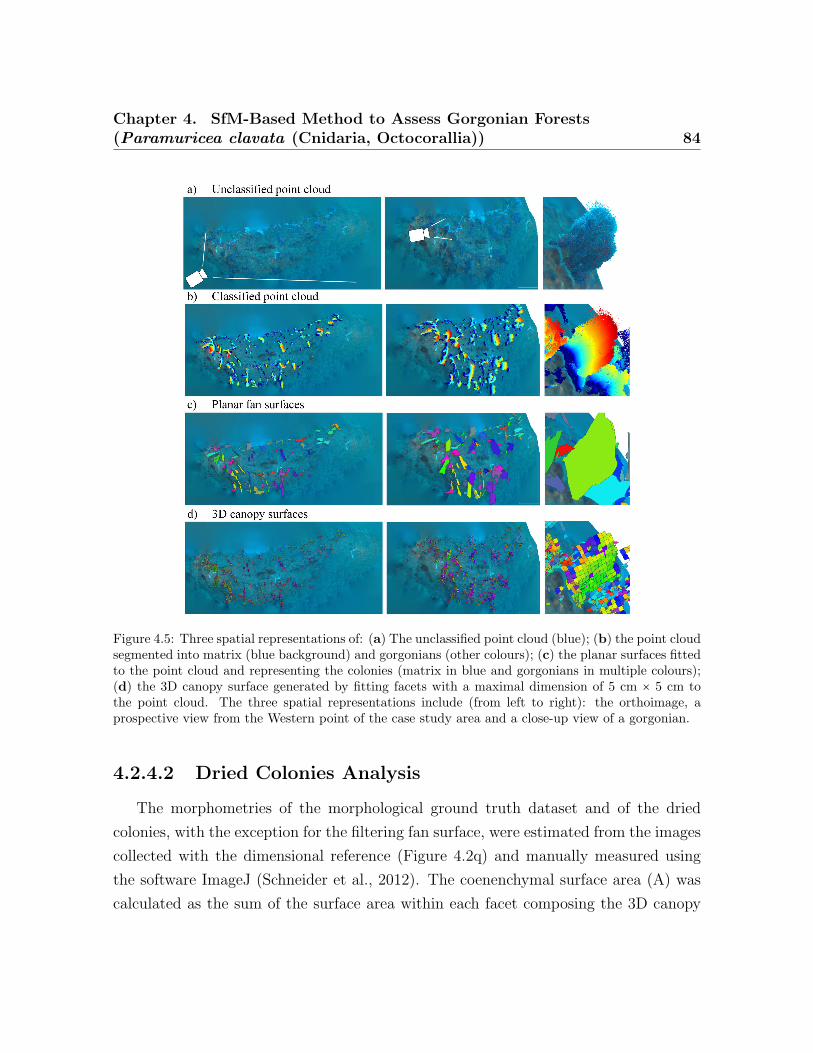
Chapter 4. SfM-Based Method to Assess Gorgonian Forests(Paramuricea clavata (Cnidaria, Octocorallia)) 84
Figure 4.5: Three spatial representations of: (a) The unclassified point cloud (blue); (b) the point cloudsegmented into matrix (blue background) and gorgonians (other colours); (c) the planar surfaces fittedto the point cloud and representing the colonies (matrix in blue and gorgonians in multiple colours);(d) the 3D canopy surface generated by fitting facets with a maximal dimension of 5 cm × 5 cm tothe point cloud. The three spatial representations include (from left to right): the orthoimage, aprospective view from the Western point of the case study area and a close-up view of a gorgonian.
4.2.4.2 Dried Colonies Analysis
The morphometries of the morphological ground truth dataset and of the dried
colonies, with the exception for the filtering fan surface, were estimated from the images
collected with the dimensional reference (Figure 4.2q) and manually measured using
the software ImageJ (Schneider et al., 2012). The coenenchymal surface area (A) was
calculated as the sum of the surface area within each facet composing the 3D canopy
Chapter 4. SfM-Based Method to Assess Gorgonian Forests(Paramuricea clavata (Cnidaria, Octocorallia)) 85
surface. Within each facet, the average coenenchymal surface area was obtained from
the nine dried colonies 3D-reconstructed that were randomly sampled using 56 quadrats
(5 cm × 5 cm) (Figure 4.2i). According to the colony size, the sampling was replicated
from three to nine times. The coenenchymal surface was then computed using the
geometry filter in Meshlab software (Figure 4.4). The average colonies DW and the
average AFDW were estimated using Equations (2) and (5).
4.2.5 Validation
Colony density and abundance estimated by the SfM were compared against the
abundance ground truth dataset by counting the identified colonies within the 1 m × 1 m
quadrats across the three density strata. The SfM-estimated morphometries were val-
idated against the morphological ground truth dataset and a linear regression model
performed to assess the accuracy of morphometries estimation (Figure 4.2t). The SfM-
estimated coenenchymal surface estimation (A) was compared against the laboratory
ground truth dataset and its accuracy calculated by applying a linear regression model.
A residual analysis was carried out for all linear regression models to assess the validity
of the normality, homoscedasticity and independence assumptions (Figure 4.2o).
4.3 Results
A total of 325 and 321 images were processed respectively by the Gopro Hero4 and
Sony NEX7 cameras. Tables 4.2 and Table B.2 summarize the total number of frames
included in the photogrammetric processing pipeline. The point clouds generated over
the study area contained 10.9 million and 6.2 million points each and the cloud to cloud
distance was on average 3 cm ± 1.8 SD. Over 98% of the points presented a cloud to
cloud distance smaller than 8 cm with an average distance between the two point clouds
representing the gorgonians of 1.6 cm ± 5.3 SD.
Chapter 4. SfM-Based Method to Assess Gorgonian Forests(Paramuricea clavata (Cnidaria, Octocorallia)) 86
4.3.1 SfM-Population Structure Estimates and Validation
The gorgonian population had a mean density of 12.4 colonies m−2 (Table 4.3, pilot
study). The densities ranged between 6.4 colonies m−2 to 16.8 colonies m−2 across the
three strata (Table 4.3). The species distribution was denser along the Western side
of the cliff and sparser towards the Eastern side. The SfM estimated higher abun-
dance of P. clavata using the Gopro Hero4 (103 colonies) than the Sony NEX7 cam-
era (71 colonies) (Table 4.2). The density estimated by SfM-method ranged between
3.3 colonies m−2 to 14.0 colonies m−2 across the three strata (Table 4.3). The Gopro
Hero4 showed higher accuracies (89%, 81%, 100% in high, medium and low density
strata respectively) than the Sony NEX7 camera (60%, 71%, 77% in high, medium
and low density strata respectively) across strata (Figure B.2). When compared to
the abundance ground truth dataset, the SfM-density estimates demonstrated an over-
all systematical underestimation for both cameras and across strata. The Gopro Hero4
showed lower departures from the abundance ground truth dataset values, <2.0 colonies
m−2, whereas the Sony NEX7 camera presented larger departures, <6.4 colonies m−2
(Table 4.3).
Table 4.3: Mean gorgonian density (colonies m−2), density range (minimum to maximum in num-ber of colonies per quadrat) and abundance (number of colonies) within each stratum in the studyarea. Note that all the quadrats are 1 m × 1 m, except for the pilot study where the quadrats are0.5 m × 0.5 m. Values in brackets denote the standard deviation. SfM stands for Structure fromMotion. GP and SN stand for Gopro Hero4 and Sony NEX7, respectively. AGT stands for abundanceground truth dataset.
Metrics High Density Strata Medium Density Low Density
Pilot study 0.5 m × 0.5 m Average Range 16.8 (±7.6) 1–7 14.0 (±4.0) 1–4 6.4 (±9.2) –3
AGT 1 m × 1 m Average Range 15.7 (±1.9) 13–17 10.3 (±1.2) 7–12 4.3 (±1.2) 3–6
SfM-GP 1 m × 1 m Average Range 14.0 (±1.4) 13–16 8.3 (±0.9) 7–9 4.3 (±1.2) 3–6
SfM-SN 1 m × 1 m Average Range 9.3 (±1.2) 8–11 7.3 (±2.1) 5–10 3.3 (±0.5) 3–4
The study site was dominated by colonies of small/ medium sizes (Figure 4.6). The
colonies recorded by the Gopro Hero4 and the Sony NEX7 cameras ranged between
10–58 cm in maximal height, 7–55 cm in maximal width and 60–1770 cm2 in planar
surface (Table 5). The comparison of the SfM estimates with the morphological ground
truth dataset values showed that both cameras underestimated maximal height mea-
Chapter 4. SfM-Based Method to Assess Gorgonian Forests(Paramuricea clavata (Cnidaria, Octocorallia)) 87
sures by 2.6 cm (Gopro Hero4) and 1.9 cm (Sony NEX7). The difference between the
morphological ground truth dataset and the SfM cameras ranged between −11.1 cm
and 12.6 cm for the Gopro Hero4 and between −7.9 cm and 9.1 cm for the Sony NEX7,
where negative values indicated underestimation. The mean maximal width was also
underestimated by 3.6 cm (Gopro Hero4) and 2.5 cm (Sony NEX7). The difference
between the morphological ground truth and the SfM estimates ranged from −9.2 cm
to 13.0 cm (Gopro Hero4) and −14.7 cm and 14.7 cm (Sony NEX7).
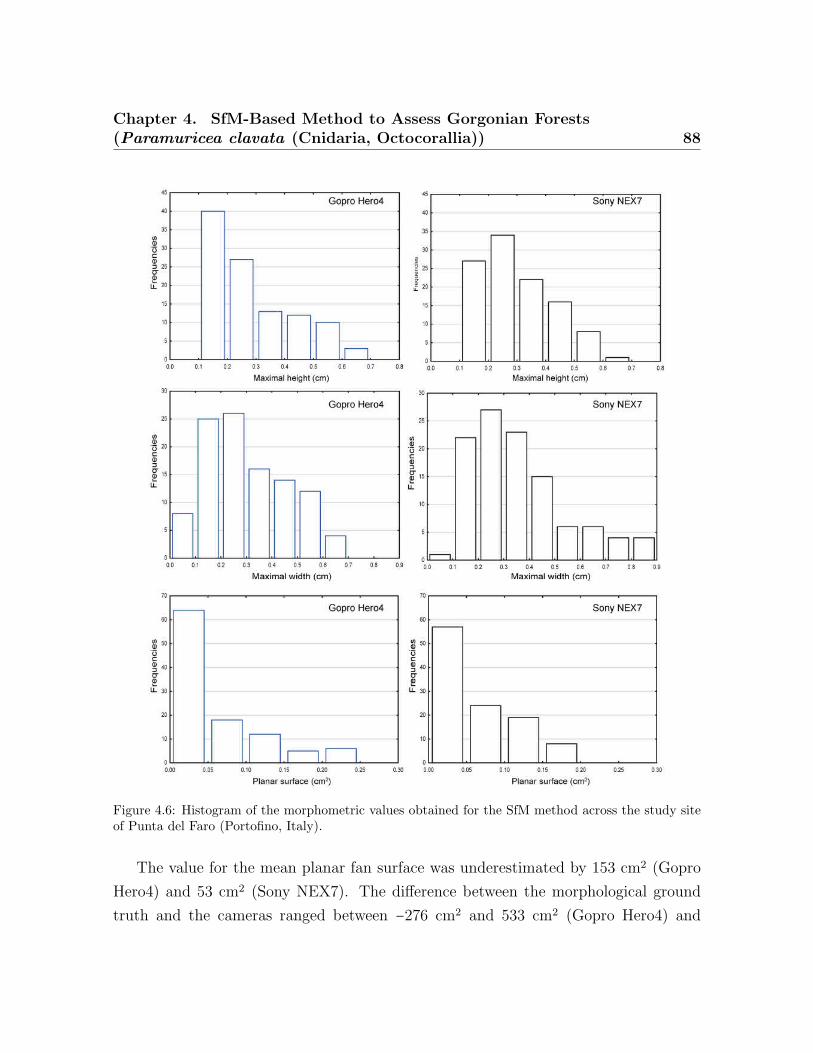
Chapter 4. SfM-Based Method to Assess Gorgonian Forests(Paramuricea clavata (Cnidaria, Octocorallia)) 88
Figure 4.6: Histogram of the morphometric values obtained for the SfM method across the study siteof Punta del Faro (Portofino, Italy).
The value for the mean planar fan surface was underestimated by 153 cm2 (Gopro
Hero4) and 53 cm2 (Sony NEX7). The difference between the morphological ground
truth and the cameras ranged between −276 cm2 and 533 cm2 (Gopro Hero4) and
Chapter 4. SfM-Based Method to Assess Gorgonian Forests(Paramuricea clavata (Cnidaria, Octocorallia)) 89
−552 cm2 and 420 cm2 (Sony NEX7). Finally, the results of the linear regression analysis
between the estimated SfM morphometric and the morphological ground truth showed
that the Gopro Hero4 camera was more accurate than the Sony NEX7 in estimating the
maximal width and planar fan surface (R2 = 0.8, R2 = 0.9) whereas the Sony NEX7
provided better estimations of maximal height measures (R2 = 0.8) (Figure 4.7).
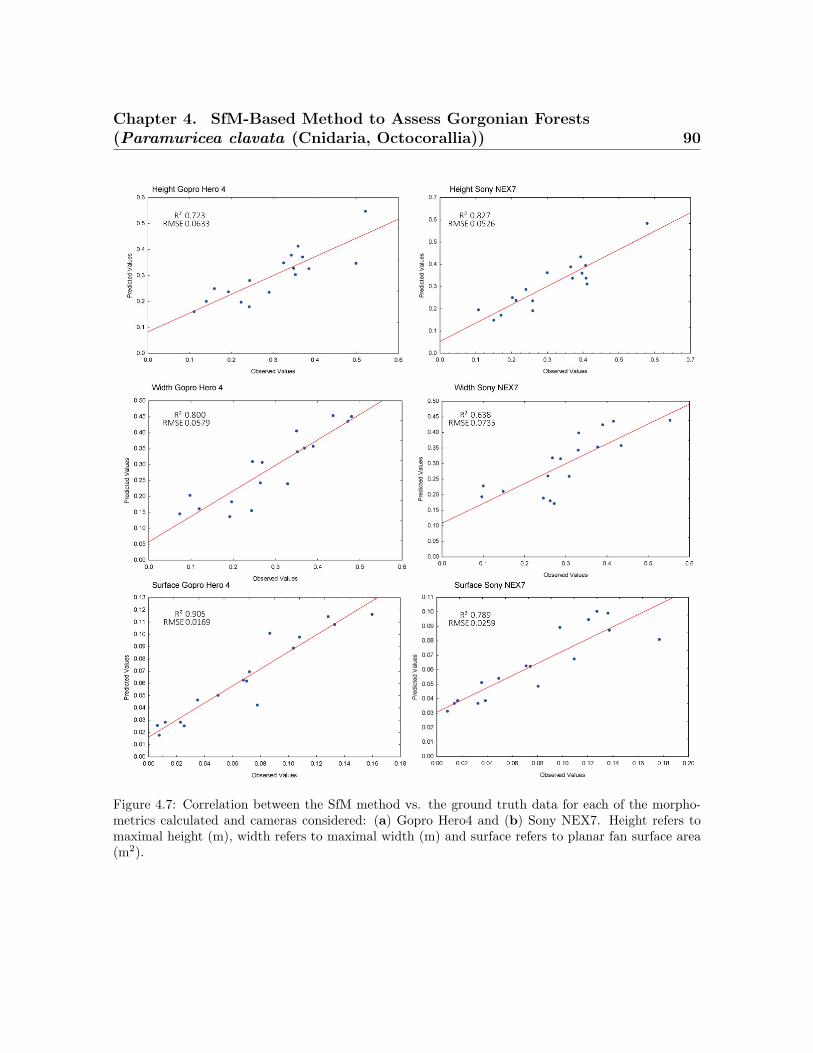
Chapter 4. SfM-Based Method to Assess Gorgonian Forests(Paramuricea clavata (Cnidaria, Octocorallia)) 90
Figure 4.7: Correlation between the SfM method vs. the ground truth data for each of the morpho-metrics calculated and cameras considered: (a) Gopro Hero4 and (b) Sony NEX7. Height refers tomaximal height (m), width refers to maximal width (m) and surface refers to planar fan surface area(m2).
Chapter 4. SfM-Based Method to Assess Gorgonian Forests(Paramuricea clavata (Cnidaria, Octocorallia)) 91
4.3.2 SfM-Biomass Estimation and Validation
The mean coenenchymal surface obtained from the 56 sampling quadrats (5 cm × 5 cm)
was 23.24 cm2 (±0.06 SD) and corresponded to a coenenchymal dry weight of 0.109 g
(±0.0750 SD) per facet. The total coenenchymal surface, derived from the 3D canopy
surface estimated across the study site, was 4.74 m2 (Gopro Hero4) corresponding to
1896 facets and 4.61 m2 (Sony NEX7) for a total of 1844 facets (Figure 4.5d). Lower
estimates of 3D canopy surface were obtained with the Sony NEX7.
The linear regression analysis showed a strong correlation between the laboratory
ground truth dataset and SfM R2= 0.99 (Figure 4.8). SfM overestimated the calculation
of the coenenchymal surface (Table 4.4): the differences with respect to the laboratory
ground truth dataset varied between 24.6 cm2 and 341.2 cm2. The nine colonies used
for dry weight estimation showed sizes comprised between the small colonies dimensions
(15.1 maximal height, 9.9 cm maximal width, 115.6 cm2 planar fan surface) to the big
dimensions (55.6 cm in maximal height, 30.3 cm maximal width, 729.8 cm2 planar fan
surface) (Table 4.5).
The dry weight values calculated from the coenenchymal surfaces, are reported
in Table 4.4. For the laboratory analysis, the mean dry weight content per colony
corresponded to 1.56 g, whereas for the SfMmethod the value was 2.27 g. The calculated
mean adh free dry weight did not differ by more than 0.24 g per colony between the
two methods.
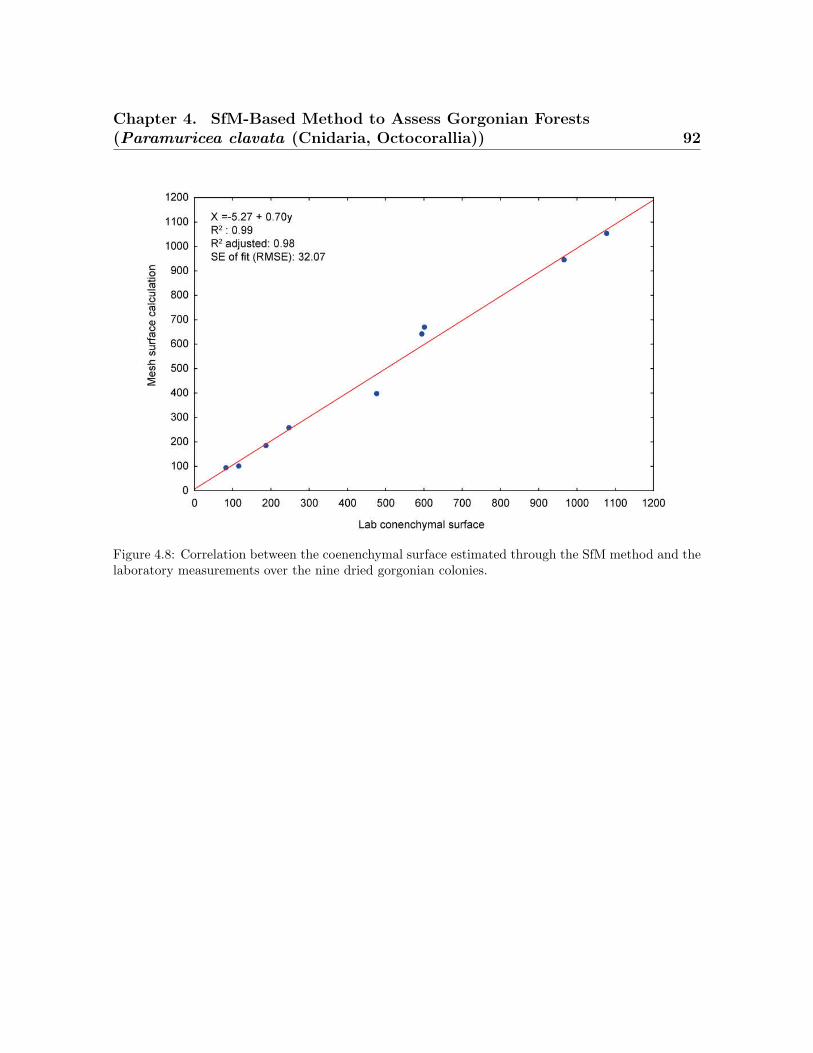
Chapter 4. SfM-Based Method to Assess Gorgonian Forests(Paramuricea clavata (Cnidaria, Octocorallia)) 92
Figure 4.8: Correlation between the coenenchymal surface estimated through the SfM method and thelaboratory measurements over the nine dried gorgonian colonies.

Chapter 4. SfM-Based Method to Assess Gorgonian Forests(Paramuricea clavata (Cnidaria, Octocorallia)) 93
Table 4.5: Mean and range of the estimated morphometrics for the colonies sampled in-situ with adimensional background for each of the approaches considered. Height and width stand for maximalheight and maximal width, respectively. N stands for the number of colonies used for the morphometricestimation. MGT stands for Morphometry Ground Truth data set. Within the table, difference refersto the difference between MGT and SfM outcomes. Positive differences represent overestimations.
Study Metric N Mean RangeMean
Difference
Difference
Range
MGT
Height (cm)
17 32.63 14.3–64.7 − −
SfM-GP 17 30.0 11.1–52.1 −2.63 −11.12–12.57
SfM-SN 17 30.7 10.7–57.8 −1.93 −7.95–9.09
Dry colony analysis 9 30.6 15.1–55.6 − −
MGT
Width (cm)
17 32.3 12.5–54.3 − −
SfM-GP 17 28.7 7.3–48.1 −3.63 −9.20–13.04
SfM-SN 17 29.8 9.7–55.2 −2.47 −14.70–14.69
Dry colony analysis 9 18.9 9.89–30.3 − −
MGT
Plannar fan surface (cm2)
17 833 120–1640 − −
SfM-GP 17 680 60–1590 −153.0 −276.4–533.0
SfM-SN 17 780 80–1770 −52.8 −552.2–420.4
Dry colony analysis 9 330 116–730 − −
4.4 Discussion
The SfM method was developed and applied to P. clavata to showcase the direct
estimation of population and colony metrics at a large scale. The comparison between
both cameras showed high to moderate accuracy between results and ground-truth
data, thus supporting the suitability of the presented method for the estimation of
the gorgonian metrics by the SfM data processing. A good agreement between Gopro
Hero4 and Sony NEX7 (30% approximately as per Table 4.4) was also observed for
dry weight and ash free dry weight, thus indicating that the SfM method can be a
suitable tool for estimating the indirect contribution of P. clavata to local and regional
carbon budgets. In this section we discuss the results of the SfM framework on the
estimation of P. clavata metrics (Section 4.4.1) and the domain of application of the
method (Section 4.4.2).

Chapter4.
SfM
-Based
Meth
od
toAsse
ssGorg
onian
Forests
(Paramuricea
clavata
(Cnidaria
,Octo
cora
llia))
94
Table 4.4: Summary of morphometric results for the study site. The abbreviations used correspond to: Structure-from-Motion(SfM), laboratory (lab), coenenchymal (coen), Dry Weight (DW) based on (Mistri, 1995), Ash Free Dry Weight (AFDW) anddifference (diff). Positive differences represent overestimations.
Colonies Units 1 2 3 4 5 6 7 8 9Maximal height
cm24.43 15.07 39.31 19.78 24.12 24.56 38.09 55.65 38.26
Maximal width 12.82 11.53 21.49 9.89 16.02 20.30 30.33 15.74 22.63Fan surface cm2 196.95 115.66 667.76 124.05 226.10 428.86 729.88 609.41 566.55Coen. surface SfM analysis 186.48 82.72 600.56 115.57 246.48 475.77 966.34 1078.17 601.43Coen. surface lab analysis
cm2121.30 58.13 465.82 61.98 172.88 273.61 660.46 736.99 445.65
Diff. between SfM andlab coen surfaces
65.18 24.59 134.76 53.59 73.6 202.16 305.88 341.18 149.78
Coen. DW SfM analysisg
0.876 0.388 2.822 0.543 1.158 2.236 4.541 5.067 2.798Coen. DW lab analysis 0.570 0.273 2.189 0.291 0.812 1.285 3.104 3.463 2.094Diff. between SfM andlab DW
0.306 0.115 0.633 0.252 0.346 0.951 1.437 1.604 0.704
AFDW SfM analysisg
0.133 0.059 0.427 0.082 0.175 0.338 0.687 0.767 0.423AFDW lab analysis 0.086 0.041 0.331 0.044 0.123 0.194 0.470 0.524 0.317Diff. between SfM andlab AFDW
0.046 0.017 0.096 0.038 0.052 0.144 0.217 0.243 0.107

Chapter 4. SfM-Based Method to Assess Gorgonian Forests(Paramuricea clavata (Cnidaria, Octocorallia)) 95
4.4.1 Estimated Metrics of P. clavata
The SfM method (Figure 4.6) showed promising results when estimating P. clavata
population structure, colonies morphometries and biomass suggesting that the method
would be transferable for application on similar erected, plane shaped corals. Across all
the sampled quadrats and strata, the accuracy on mean colonies density was greater or
equal to 60%. The two cameras performed differently on estimating the morphometries
although both showed good to moderate agreement with the morphological ground
truth data. The error reported for these metrics accounted for the arbitrary decision
on the selection of a 5 cm threshold to segment the “gorgonian” point cloud from the
“matrix” point cloud. Lower errors would be expected for a more refined estimation of
such a threshold.
The Gopro Hero4 showed higher accuracy than the Sony NEX7 for abundance and
density, maximal width and planar fan surface. These results could be explained by the
small frame dimension provided by the Sony NEX7 camera when in recording mode
(Figure 4.3 and Table B.1), which resulted in clouds with lower number of points. The
use of the Sony NEX7 in video recording mode was obliged to ensure an automatic and
continuous imagery collection and effective data sampling. The accuracy of the overall
method could be improved through the use of cameras in video recording mode that
allow for the extraction of frames at frequencies higher than those here presented. The
approach will however be limited by the size of the video imagery files collected.
The SfM method allowed for the calculation of the gorgonian planar fan surface
based on the planar shape of the gorgonian point cloud. This approach presents an
advantage over traditional methods, which usually rely on the product between the
maximal height and the maximal width of the colony (Weinbauer and Velimirov, 1995).
In this study, we estimated the Paramuricea clavata 3D canopy surface using SfM; this
is a novel approach that for the first time provides accurate approximation of the gor-
gonian population surface by interpolating the species point cloud with a mosaic facets
of standard maximal dimension (5 cm × 5 cm). The metric provides complementary
information to those traditionally used in gorgonian population structure studies (i.e.,
abundance, density, maximal height, maximal width, fan surface) and further insights
Chapter 4. SfM-Based Method to Assess Gorgonian Forests(Paramuricea clavata (Cnidaria, Octocorallia)) 96
about the characteristics of the entire population. The accuracy of the coenenchymal
surface achieved by the SfM method and validated through the laboratory analysis was
promising, supporting the use of virtual sampling for calculating the colony geometry.
The calculations are subject to the inherent error associated with water loss of the in-
terbranches fan surface when drying the individual gorgonian samples. Further research
should focus on increasing the accuracy of the proposed method by taking into account
the loss in volume of the tissues between coral arms.
The average coenenchymal surface per surface unit was converted into DW and
AFDW to obtain the biomass of the gorgonian population in the study area. The
two cameras showed similar results (223 g for the Gopro Hero4 and 217 g for the
Sony NEX7), this suggesting that biomass estimation is not affected by the camera
characteristics and that the Gopro Hero4 and the Sony NEX7 have similar performances
in the estimation of the 3D canopy surface.
The SfM method described a mixed-size gorgonian population; few big colonies
(maximal height > 40 cm), indicative of greater reproductive organisms, were depicted
by both cameras whereas the higher frequencies were identified around small/medium
size colonies (maximal height < 30 cm). These results are indicative of populations that
are recovering after mass mortality events. Similar findings were reported by previous
studies on P. clavata population structure that have observed an unimodal and bell-
shaped distribution of species size in years following mortality episodes (Linares et al.,
2008a; Santangelo et al., 2015; Bramanti et al., 2015). The Sony NEX7 showed higher
frequencies for the wider colonies classes (from 50 cm to 90 cm in maximal width)
with respect to the smaller number of colonies counted. Regarding the laboratory
analysis, the SfM method overestimated the size of the colonies (discrepancy range
24.6–341.2 cm2) probably in return of the lower accuracy showed in abundance ground
truth dataset comparison.
Finally, field SfM sampling required less than 6 m for data collection including
deployment and retrieval of ground control points, thus ensuring safe scuba diving con-
dition and high-quality data. The sampling approach did not require the manipulation
of gorgonians, thus minimizing the risk of seabed contact and as a consequence damage
to other benthic organisms (Milazzo et al., 2002). The time required for images align-

Chapter 4. SfM-Based Method to Assess Gorgonian Forests(Paramuricea clavata (Cnidaria, Octocorallia)) 97
ment was ¡ 5 h whereas only 4 h of post-processing time were required to extract the
morphometry values. Overall, the operational times were suitable for a fast estimation
of the required values, with the times provided improving as the user gets acquainted
with data and software manipulation.
Although the point clouds generated with the imagery from both cameras were
highly dense (over 6 million points) and only differed an average distance of 1.6 cm
(±5.3 cm SD) for the points representing the gorgonians. This discrepancy propagated
in the calculation of the population structure and morphometries. The uncertainties
associated to the species population structure and morphometry likely affected the esti-
mation of the biomass (dry weight and ash free dry weight). Overall, the SfM framework
can provide accuracies suitable for traditional population structure, morphometric and
biomass studies (Rossi et al., 2011; Linares et al., 2008a), and is flexible to support
finer gorgonian measurements based on the projection of images over point cloud fitted
planes (Pavoni et al., 2018).
4.4.2 Domain of Application
This study proposes a SfM-based method which allows the estimation of gorgonian
population structure, morphometries and biomass, and supports scientist and marine
managers in fulfilling the requirements of national and European policies (Commission,
2011; Franzese et al., 2015) on ecosystem functioning assessments (i.e., Environmental
accounting). P. clavata was chosen as the species because of its role in structuring the
coralligenous habitat and being an indicator of climate change effect, thus an assess-
ment of its conservation status and its contribution for environmental accounting is of
key relevance to managers and scientists alike. Several studies have reported that gor-
gonian populations, recovering after mass mortalities events, tend to reach a new state
of equilibrium with lower density and trophic energy (Linares et al., 2008a; Coma et al.,
2009; Cerrano et al., 2010; Santangelo et al., 2015), this implying that the ecological and
the economic value of coralligenous habitat can be negatively affected. In the selected
areas across the Portofino MPA (Figures B.2,B.3), the contribution of P. clavata was
calculated to be between 370.4 kg (Gopro Hero4) and 360.5 kg (Sony NEX7) of DW

Chapter 4. SfM-Based Method to Assess Gorgonian Forests(Paramuricea clavata (Cnidaria, Octocorallia)) 98
and 56 kg and 54 kg of AFDW, not a negligible contribution in terms of trapped or-
ganic matter. As highlighted by studies on ecosystem functions, heterotrophic habitat
dominated by corals can contribute to carbon turnover and nutrient recycling (White
et al., 2012; Cathalot et al., 2015; Le et al., 2017) and our approach provides a way for-
ward towards the accurate estimation of the turned organic carbon by animal forests in
the Mediterranean Sea. However, the contribution of the phylum Cnidaria in environ-
mental accounting approaches has not been calculated yet (Franzese et al., 2015, 2017;
Picone et al., 2017). Our approach is transferable and can therefore assist scientists
and managers by providing a method to quantify the essential gorgonian forest metrics
and to prioritize actions over spatial scales relevant for the MPAs management even
supporting existing conservation indexes on coralligenous habitat (see Sartoretto et al.
(2017)). Finally, existing scientific literature suggests that knowing the structure and
morphometry at population level is fundamental to assess the conservation status of
marine habitats and their ecosystem functions. There is an increasing emphasis on ad-
dressing innovative technologies to monitor marine habitats to allow overcoming spatial
resolution and temporal data limitations; our SfM framework can support scientists and
marine managers as a tool to target key-habitat species and thus provide the greatest
benefit to prioritization plans.
4.5 Conclusions
The methodology here presented highlights the potential of SfM based methods
for fast and reliable monitoring of demography and morphometry of gorgonian forests.
Of particular relevance is the development of the method for very slow growing and
threatened species such as gorgonian colonies that are indicators of the effects of cli-
matic anomalies on the coralligeneous community. Results show that the method could
complement traditional sampling methods by enabling effective long-frequency wide-
area monitoring of gorgonian forests, enhancing current management practices of and
compliance with legislative requirements for coralligeneous areas (including MPAs).

Chapter 4. SfM-Based Method to Assess Gorgonian Forests(Paramuricea clavata (Cnidaria, Octocorallia)) 99
Acknowledgments
This research was funded through the scolarship EUREKA; European Social Funds
(FSE), Programma Operativo Regionale (POR) 2014/2020 Regione Marche (Italy)
grant number 0020404 and Cranfield University. We thank the Visual Computing
Laboratory, Research laboratory of ISTI-CNR (Italy), for providing full support for
the development of this research. Special thanks go to Ilaria delle Mura and Fabio
Benelli for the underwater support during the surveys and to Carlos Gomez for the
photographic support. We also thank the reviewers that helped shape and improve the
final version of this manuscript with their useful comments.
Chapter 5
Discussion and Conclusion
5.1 Introduction
Previous chapters have described the application of SfM-based methods to marine
habitats and their advantages. SfM demonstrated to be a flexible, affordable and reli-
able technology for rapid surveys, providing informative data to support spatial analysis
of ecological communities and to investigate the effects of natural and human stressors.
Considering SfM-based approaches in management plans could bring a major bene-
fit to assess pressures on marine ecosystems. But, to develop adequate management
strategies, advancing standard SfM-methods to marine environments, are required to
improve data collection and analysis at relevant spatial scale for conservation.
To this end, a novel and transferable approach was developed to assess the spatial
composition of benthic communities using SfM ortho-mosaics and uncover the scale-
specific effects that determine sample representativeness (Objective 1) and applied on
coral reefs to investigate the effects of human and environmental pressures (Objec-
tive 2). Finally, a new method is implemented to investigate the population structure
(e.g. maximal height, abundance) and biomass of benthic tree-shaped species (i.e. gor-
gonians) in coralligenous habitat and to support environmental accounting calculation
(Objective 3). This last chapter of the thesis will reflect on how SfM-based approaches
can support marine management in coral reefs and coralligenous systems through the
implementation of standardised methods for assessing benthic composition and organ-
isms morphometrics at seascape scale.
Chapter 5. Discussion and Conclusion 101
5.2 Marine management plans and SfM
Internationally, there are several strategies adopted to provide general knowledge of
distribution, species composition and functioning of calcareous bio-concretions UNEP-
MAP-RAC (2008). However, most actions regard individual-national-based efforts lim-
ited in spatial and temporal resolution and extent, or lack of coordinated standard
method. Reasons for this are technology limitation on high-resolution ecological infor-
mation and costs, complicating our ability to formulate guidelines that can be univer-
sally applied. Only when we are able to capture spatial and temporal variations of the
benthic community, it is possible to effectively allocate resources for conservation and
human-impact prevention UNEP-MAP-RAC (2008).
By assessing the spatial composition of benthic marine communities and associ-
ated morphometrics at representative spatial scales using standardized SfM-based ap-
proaches, potential issues can be identified that require management interventions (Sec-
tions 5.2.1, 5.2.2).
A starting point for management to use the SfM methods developed in this the-
sis is considering the prioritization of sites with a seascape approach. By focusing on
strengthening the resilience of marine ecosystems at seascape scale, marine manage-
ment can optimise its good and services as new environmental challenges arise Magris
et al. (2014); Bellwood et al. (2004). This means collecting quantitative, georeferenced
and representative samples (Chapter 2) and including compositional data providing a
functional perspective (Chapter 3). The SfM-based seascape approach leads to a more
inclusive understanding of the short, medium and long-term implications of benthic
changes to management actions, overcoming technical limitations (i.e. decompression
time and diver performances in deep waters).
At the regional scale, SfM approaches can be included into the current monitor-
ing activities required by the European Marine Strategy Framework Directive (MSFD
2008/56/EC) and the Barcelona Convention Decision (IG.21/9, 2016; Parliament and
the Council, 2008). The basic scheme of data collection, in fact, includes periodic mon-
itoring of reference parameters or indicators. To this end, data collected using SfM will
provide per se information on structural and functional parameters (i.e. the degree of
Chapter 5. Discussion and Conclusion 102
complexity of coralligenous habitats, Chapters 3 and 4), and impacts of disturbances
(i.e. fishing nets).
In this context, marine management would be an opportunity for marine research to
access information-rich data being collected in time. Marine management, whose design
is informed by a scientific understanding of ecological processes at the seascape, can
provide to science a wide range of fine resolution data with more intensive sampling at
a local scale to evaluate human and natural factors driving community changes. Also,
temporal data so obtained could facilitate the development of indicators for the moni-
toring of the Good Environmental Status (GES) within the Marine Strategy Framework
Directive and COP18 EcAp Decision (IG.21/9, 2016; Parliament and the Council, 2008).
To this end, community involvement could take many different forms (i.e. recent
started 4Dive, Section 5.3.2), promote awareness and actions across broad geographic
scales. Especially at this stage that interdisciplinary collaboration with the academic
institutions would be beneficial to understand the extent at which marine management
actions promote habitat conservation.
5.2.1 Scuba diving
Scuba diving at Ponta do Ouro Partial Marine Reserve (Mozambique) may have
major impacts on the ecological status of local reefs in the near future. Research has
demonstrated that scuba diving might have different effects on coral reefs, this is to be
considered for determining management guidelines to limit the access upon individual
reefs (Hawkins and Roberts, 1997; Lyons et al., 2015; Roche et al., 2016). Based on the
results of the SfM framework, coral communities at PPMR show different characteristics
reflecting organisms resistance and benthic communities resilience to scuba diving and
environmental conditions. The study is the first providing relevant information for
studying changes in composition and functionality across reefs at PPMR and constitute
the starting point for conservation actions and long-term data collection programs.
Recently, the village of Ponta do Ouro has been connected with an high speed road
to Maputo. The new road allows to cover the distance in less than two hours by car
or buses while previously 7 hours were needed by all-terrain vehicles. Managers of
Chapter 5. Discussion and Conclusion 103
the PPMR are expecting great changes on the touristic offer with possible negative
influences on natural habitats including coral reefs.
Managers of the PPMR can benefit from the combined SfM-approach and statistical
classification at any stage of the analysis. First looking at the clusters that describe:
i) taxonomic and morphologic composition of the benthic communities, ii) seascape
spatial composition and organisms’ shape complexity, iii) classes of fragility to physical
impacts. Second by looking at the final confusion matrices which embeds the summary
of related ecological data and provide insights into the spatial variability of the coral
reef benthic communities in the protected area.
Considering the above information, managers of the PPMR can prioritise conser-
vation measures at each site. Different types of management actions could be ex-
perimented on coral reef sites, given the possible negative impacts (Figure 5.1). For
example, strategic policies could favor visiting sites with more resistant community to
beginner divers while limiting the access to sites with more fragile organisms to more
expert divers and when environmental conditions are favourable. This approach might
minimize accidental impacts with the seafloor. To this end, the methodological SfM-
based approach combining high-resolution orthomosaics and data mining technique
(Chapter 2 and Chapter 3) will support future surveys in the PPMR.
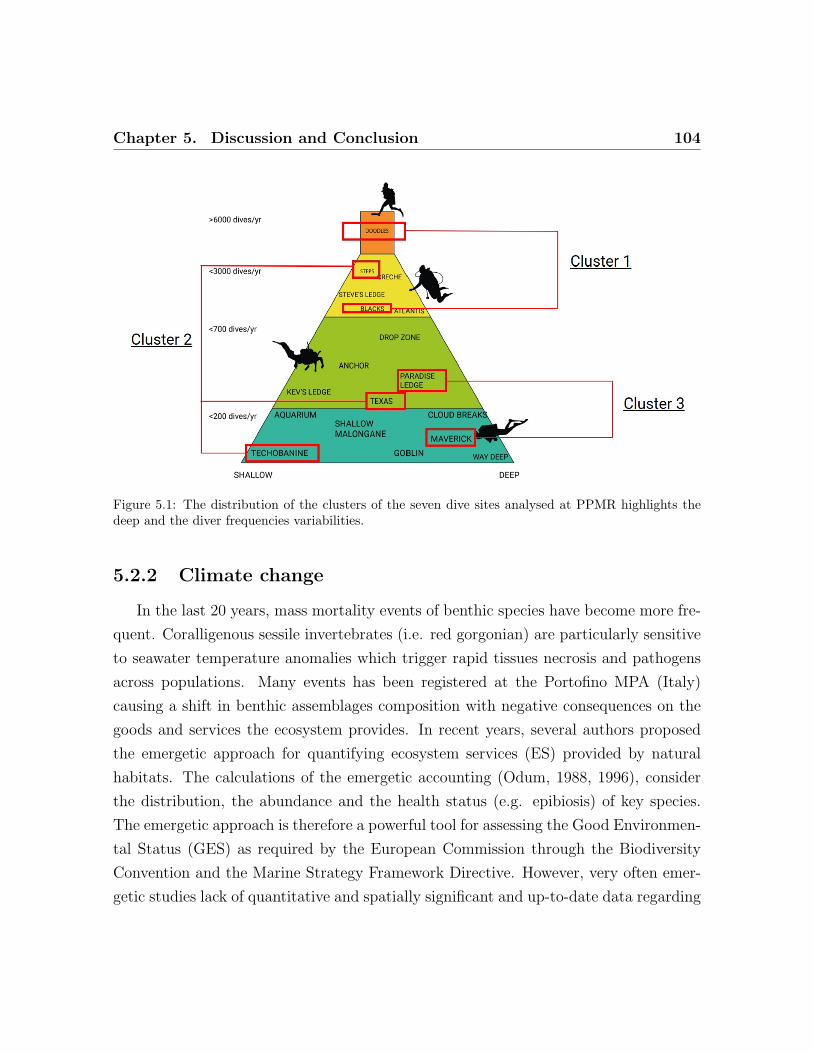
Chapter 5. Discussion and Conclusion 104
Figure 5.1: The distribution of the clusters of the seven dive sites analysed at PPMR highlights thedeep and the diver frequencies variabilities.
5.2.2 Climate change
In the last 20 years, mass mortality events of benthic species have become more fre-
quent. Coralligenous sessile invertebrates (i.e. red gorgonian) are particularly sensitive
to seawater temperature anomalies which trigger rapid tissues necrosis and pathogens
across populations. Many events has been registered at the Portofino MPA (Italy)
causing a shift in benthic assemblages composition with negative consequences on the
goods and services the ecosystem provides. In recent years, several authors proposed
the emergetic approach for quantifying ecosystem services (ES) provided by natural
habitats. The calculations of the emergetic accounting (Odum, 1988, 1996), consider
the distribution, the abundance and the health status (e.g. epibiosis) of key species.
The emergetic approach is therefore a powerful tool for assessing the Good Environmen-
tal Status (GES) as required by the European Commission through the Biodiversity
Convention and the Marine Strategy Framework Directive. However, very often emer-
getic studies lack of quantitative and spatially significant and up-to-date data regarding
Chapter 5. Discussion and Conclusion 105
species distribution and abundances, resulting in general approximation of habitat sta-
tus (Franzese et al., 2015, 2017; Picone et al., 2017; Paoli et al., 2018). As a result,
these studies do not reflect the intrinsic variability of ecological communities and of
their responses to environmental changes. The method of Chapter 4 is transferable and
can complement emergetic approaches by providing quantitative metrics of key-habitat
species. In our study (Chapter 4) the estimated contribution of P.clavata across the
Portofino MPA was of 1.51 GJ of Energy, considering the bathymetric range and the
habitat map layer across the studied area (Figure B.3). This is a significant contribution
calling for further investigations to support the development of conservation indexes on
coralligenous habitat (Sartoretto et al., 2017) and tailored natural capital calculations
(Paoli et al., 2018).
5.3 Implication for future research
It is important to acknowledge that the results of this research and associated in-
terpretation in terms of underlying processes, are constrained by high quality data.
Therefore, implications and recommendations for further research are formulated here
in terms of (i) data collection and (ii) availability.
5.3.1 Data collection of benthic communities
While technological advancements have made it easier to collect large amounts of
samples using SfM, implementation of specific measuring are often constrained.
For example in this study, field campaigns were limited by weather conditions (i.e.
seawater visibility) and seasonal mucilages. This means a restricted temporal sampling
in some geographic areas (i.e. winter and spring seasons in the North Mediterranean
Sea; summer until late autumn in Southern Mozambique). The environmental condi-
tions during which the sampling is performed have consequences on the quality and
resolution of the resulting point cloud as well as on the sharpness of the generated
ortho-mosaic and the number of faces of the 3D model. Surveys should be therefore
performed in calm sea-weather condition with good visibility during the central hours of
Chapter 5. Discussion and Conclusion 106
the day. For example, in Chapter 3, data collected under low visibility conditions were
not analyzed because affecting the sharpness and blurriness of the images and reducing
the quality of the orthomosaic. The horizontal underwater visibility at PPMR varied
between 20 meters in April to 5 meters in June as a result of the seasonal changes of
the current direction and regime (Ramsay, 1996).
In this study, sampling has been carried out at the same distance to the seafloor
to guarantee a similar pixel size of the generated ortho-mosaics. It was not possible to
collect SfM imageries at different distances from the object and to then select only the
images in proximity to the target to generate the dense cloud points as often imple-
mented in terrestrial surveys. This is an approach that ensures high accuracy but it is
not very efficient underwater due to reflectance and colour problems.
Future research should explore the possibility of implementing oblique SfM data
collection underwater with multiple cameras today limited to terrestrial environments.
This is technique provides high accuracy of altimetric information and corrected geo-
metrical edges of complex scenarios (i.e. metropolitan areas) but requires high perfor-
mance computing and costly cameras. This approach could have offered the possibility
of having a more accurate estimate of organisms morphometries (Chapter 4).
To this end, the success of using SfM-approaches in marine management plans lies in
the ability of providing methods easy to implement, suitable to the scale of assessment,
and responding to impacts in an interpretable way.
5.3.2 Availability of photogrammetric data
More studies are required that apply SfM at a high temporal and spatial resolu-
tion to improve scientific understandings on how changes in benthic communities relate
to environmental and human processes. Towards that, there is the need to explore
alternative possibilities to increase the availability of underwater quality information
e.g. working with scuba divers. Online repositories already exist to access to pho-
togrammetric datasets for terrestrial environments (i.e. Open Aerial Map web portal),
while have not been implemented yet underwater. In this context, ongoing citizen and
science initiatives, such as 4Dive have opened new strategies to promote the use of

Chapter 5. Discussion and Conclusion 107
SfM-methods for conservation by involving scuba volunteers collecting data on cultural
heritage (i.e. shipwrecks) at Malta Island and providing an e- infrastructure for image
processing. Hopefully this initiative could be used to coordinate standardize sampling
approaches and provide benchmark data to complement routine monitoring in MPAs.
Finally, application of SfM-based method, and reliably quantify the effects of scuba
diving, it is recommended to collect environmental data potentially relevant to the aim
of the study. For example, the method testing presented in Chapter 3 suggested that
environmental conditions mediate the effect of diving at some coral reefs sites. Due to
time constraints, it was not possible to collect data about current velocity, topography
and test the correlation with benthic composition and seascape metrics.
5.4 Conclusion
This research aimed to improve the characterization of benthic marine communi-
ties by using SfM, and to support the development of targeted marine management
strategies by providing standardised methods for assessing benthic composition and or-
ganisms’ morphometrics in tropical and mediterranean environments. By using ortho-
mosaics and point clouds from SfM, there are three main ways in which this research
will improve methodologies to investigate and quantify benthic communities changes.
First, a novel framework, statistical investigation based on empirical evidences on
spatial composition of reef communities demonstrated the importance of sample repre-
sentativeness in order to evaluate and select high resolution ortho-mosaics to investigate
benthos. The benthic community of Ponta do Ouro Partial Marine Reserve (Mozam-
bique) is disaggregated within a rocky matrix. The organism are often characterized
by small sizes and regular shapes and and the population is highly represented by soft
corals. Common metrics (i.e. diversity index, shape index, fractal index) have specific
requirements of sampling scale and quadrat density to be robust but, overall accurately
identified by sampling scales of 25 m2. The results confirmed the need of selecting
the appropriate sampling strategy when accounting for community metrics, the lack of
which result in biased estimate of population structure and functions.
Second, by combining high resolution ortho-mosaics and data mining techniques
Chapter 5. Discussion and Conclusion 108
to reef communities, the potential impact of scuba diving could be assessed (Chapter
3). The findings confirmed hypotheses made in previous research about scuba diving
having negative direct (i.e breaks, sedimentation) and indirect effects (i.e. diseases) over
reef habitats, and provided baseline information for the reefs at PPMR. However, it is
essential to establish further knowledge on how scuba diving affect benthic communities
in different reefs types and over multiple spatial and temporal scales, so that marine
management can account for heterogeneity of seascapes and specific processes (Sections
5.2.1).
Third, a method based on empirical evidences on density and morphometrics of
gorgonian forests demonstrated the high accuracy of metrics quantifications in order to
evaluate and select scaled point clouds to indirect estimates of biomass. This type of
approach has not been applied before to tree-shaped organisms, and it clearly demon-
strates the potential of the method to improve predictions coralligenous status in the
Mediterranean sea. The findings provide important empirical evidence that highlights
the need to further application to others species and protected area.
In conclusion, through new methodological approaches and empirical evidence, this
research highlights that SfM-based method are a flexible, affordable and reliable technol-
ogy to improved survey of ecological communities. Further development of this avenue
of research will aid better-resolved scientific understanding of benthic communities and
management to safeguard marine habitats.
References
Assessment, M. E., 2003. Ecosystems and human well-being.
Ballesteros, E., 2006. Mediterranean coralligenous assemblages: a synthesis of present
knowledge. Oceanography and marine biology: an annual review 44, 123–195.
Barbier, E. B., Hacker, S. D., Kennedy, C., Koch, E. W., Stier, A. C., Silliman, B. R.,
2011. The value of estuarine and coastal ecosystem services. Ecol Monogr 81 (2),
169–193.
Barnes, B. B., Hallock, P., Hu, C., Muller-Karger, F., Palandro, D., Walter, C., Zepp,
R., 2015. Prediction of coral bleaching in the Florida Keys using remotely sensed
data. Coral Reefs 34 (2), 491–503.
Beijbom, O., Edmunds, P. J., Kline, D. I., Mitchell, B. G., Kriegman, D., 2012. Au-
tomated annotation of coral reef survey images. In: Computer Vision and Pattern
Recognition (CVPR), 2012 IEEE Conference on. IEEE, pp. 1170–1177.
Bellwood, D. R., Hughes, T. P., Folke, C., Nystrom, M., 2004. Confronting the coral
reef crisis. Nature 429 (6994), 827.
Bianchi, C., Pronzato, R., Cattaneo-Vietti, R., Benedetti-Cecchi, L., Morri, C., Pansini,
M., Chemello, R., Milazzo, M., Fraschetti, S., Terlizzi, A., et al., 2004. Hard bottoms.
Biol Mar Mediterr 11 (1), 185–215.
Bostrom, C., Pittman, S. J., Simenstad, C., Kneib, R. T., 2011. Seascape ecology of
coastal biogenic habitats: advances, gaps, and challenges. Mar Ecol Prog Ser 427,
191–217.
Bramanti, L., Benedetti, M. C., Cupido, R., Cocito, S., Priori, C., Erra, F., Iannelli, M.,
Santangelo, G., 2015. Demography of Animal Forests: The Example of Mediterranean
Gorgonians. Springer International Publishing, Cham, pp. 1–20.

References 110
Bravo, G., Marquez, F., Marzinelli, E. M., Mendez, M. M., Bigatti, G., 2015. Effect
of recreational diving on patagonian rocky reefs. Marine environmental research 104,
31–36.
Brodu, N., Lague, D., 2012. 3d point cloud classification of complex natural scenes
using a multi-scale dimensionality criterion: applications in geomorphology. In: EGU
General Assembly Conference Abstracts. Vol. 14. p. 4368.
Brown, C. J., Smith, S. J., Lawton, P., Ander-son, J. T., 2011. Benthic habitat mapping:
A review of progress towards improved un-derstanding of the spatial ecology of the
seafloor using acoustic tech-niques. Estuarine, Coastal and Shelf Science 92 (3), 502–
520.
Bryson, M., Ferrari, R., Figueira, W., Pizarro, O., Madin, J., Williams, S., Byrne,
M., 2017. Characterization of measurement errors using structure-from-motion and
photogrammetry to measure marine habitat structural complexity. Ecology and Evo-
lution 7 (15), 5669–5681.
Buckley, R., 2012. Sustainable tourism: Research and reality. Annals of Tourism Re-
search 39 (2), 528–546.
Buhl-Mortensen, L., Buhl-Mortensen, P., Dolan, M. F., Holte, B., 2015. The mareano
programme–a full coverage mapping of the norwegian off-shore benthic environment
and fauna. Marine Biology Research 11 (1), 4–17.
Burke, L., Reytar, K., Spalding, M., Perry, A., 2012. Reefs at risk revisited in the coral
triangle: World resources institute. In: The Nature Conservancy. World-Fish Center,
International Coral Reef Action Network. UNEP World Conservation Monitoring
Centre and Global Coral Reef Monitoring Network Washington, DC.
Burns, J., Delparte, D., Kapono, L., Belt, M., Gates, R., Takabayashi, M., 2016. As-
sessing the impact of acute disturbances on the structure and composition of a coral
community using innovative 3D reconstruction techniques. Method Oceanogr 15, 49–
59.
References 111
Candela, L., Castelli, D., Pagano, P., 2009. D4science: an e-infrastructure for support-
ing virtual research en-vironments. In: IRCDL. pp. 166–169.
Carrivick, J. L., Smith, M. W., Quincey, D. J., 2016. Structure from Motion in the
Geosciences. John Wiley & Sons.
Casella, E., Collin, A., Harris, D., Ferse, S., Bejarano, S., Parravicini, V., Hench, J. L.,
Rovere, A., 2016. Mapping coral reefs using consumer-grade drones and structure
from motion photogrammetry techniques. Coral Reefs, 1–7.
Cathalot, C., Van Oevelen, D., Cox, T. J., Kutti, T., Lavaleye, M., Duineveld, G.,
Meysman, F. J., 2015. Cold-water coral reefs and adjacent sponge grounds: Hotspots
of benthic respiration and organic carbon cycling in the deep sea. Frontiers in Marine
Science 2, 37.
Celliers, L., Schleyer, M. H., 2008. Coral community structure and risk assessment
of high-latitude reefs at sodwana bay, south africa. Biodiversity and Conservation
17 (13), 3097–3117.
Cerrano, C., Arillo, A., Azzini, F., Calcinai, B., Castellano, L., Muti, C., Valisano, L.,
Zega, G., Bavestrello, G., 2005. Gorgonian population recovery after a mass mortality
event. Aquatic Conservation: Marine and Freshwater Ecosystems 15 (2), 147–157.
Cerrano, C., Bavestrello, G., 2008. Medium-term effects of die-off of rocky benthos
in the Ligurian Sea. What can we learn from gorgonians? Chemistry and Ecology
24 (sup1), 73–82.
Cerrano, C., Bavestrello, G., 2009. Mass mortalities and extinctions. In: Marine Hard
Bottom Communities. Springer, pp. 295–307.
Cerrano, C., Bavestrello, G., Bianchi, C. N., Cattaneo-Vietti, R., Bava, S., Morganti,
C., Morri, C., Picco, P., Sara, G., Schiaparelli, S., et al., 2000. A catastrophic mass-
mortality episode of gorgonians and other organisms in the Ligurian Sea (North-
western Mediterranean), summer 1999. Ecology letters 3 (4), 284–293.

References 112
Cerrano, C., Danovaro, R., Gambi, C., Pusceddu, A., Riva, A., Schiaparelli, S., 2010.
Gold coral (Savalia savaglia) and gorgonian forests enhance benthic biodiversity and
ecosystem functioning in the mesophotic zone. Biodiversity and Conservation 19 (1),
153–167.
Chabanet, P., Adjeroud, M., Andrefouet, S., Bozec, Y.-M., Ferraris, J., Garcıa-Charton,
J.-A., Schrimm, M., 2005. Human-induced physical disturbances and their indicators
on coral reef habitats: A multi-scale approach. Aquatic Living Resources 18 (3),
215–230.
Chadwick-Furman, N., 1995. Effects of scuba diving on coral reef invertebrates in the
us virgin islands: implications for the management of diving. In: Proceedings of the
6th International Conference on Coelenterate Biology. Vol. 91. pp. 1–5.
Chambers, J. M., Hastie, T. J., et al., 1992. Statistical models in S. Vol. 251. Wadsworth
& Brooks/Cole Advanced Books & Software Pacific Grove, CA.
Cheal, A. J., MacNeil, M. A., Emslie, M. J., Sweatman, H., 2017. The threat to coral
reefs from more intense cyclones under climate change. Glob Change Biol.
Chirayath, V., Earle, S. A., 2016. Drones that see through waves–preliminary results
from airborne fluid lensing for centimetre-scale aquatic conservation. Aquatic Con-
servation: Marine and Freshwater Ecosystems 26, 237–250.
Cignoni, P., Callieri, M., Corsini, M., Dellepiane, M., Ganovelli, F., Ranzuglia, G.,
2008. MeshLab: an Open-Source Mesh Processing Tool. In: Scarano, V., Chiara,
R. D., Erra, U. (Eds.), Eurographics Italian Chapter Conference. The Eurographics
Association.
Cohen, J., 1960. A coefficient of agreement for nominal scales. Educational and psy-
chological measurement 20 (1), 37–46.
Coma, R., Ribes, M., Serrano, E., Jimenez, E., Salat, J., Pascual, J., 2009. Global
warming-enhanced stratification and mass mortality events in the Mediterranean.
Proceedings of the National Academy of Sciences 106 (15), 6176–6181.
References 113
Coma, R., Ribes, M., Zabala, M., Gili, J.-M., 1998. Growth in a modular colonial
marine invertebrate. Estuarine, Coastal and Shelf Science 47 (4), 459–470.
Coma, R., Zabala, M., Gili, J.-M., 1995. Sexual reproductive effort in the Mediterranean
gorgonian paramuricea clavata. Marine ecology progress series. Oldendorf 117 (1),
185–192.
Commission, E., 2011. Communication from the commission to the European Parlia-
ment, the Council, the Economic and Social Committee and the Committee of the
Regions. Brussels.
Condit, R., Hubbell, S. P., Lafrankie, J. V., Sukumar, R., Manokaran, N., Foster, R. B.,
Ashton, P. S., 1996. Species-area and species-individual relationships for tropical
trees: a comparison of three 50-ha plots. J Ecol, 549–562.
Coro, G., Palma, M., Ellenbroek, A., Panichi, G., Nair, T., Pagano, P., 2018. Recon-
structing 3d virtual environments within a collaborative e-infrastructure. Concur-
rency and Computation: Practice and Experience, e5028.
Coro, G., Webb, T. J., Appeltans, W., Bailly, N., Cattrijsse, A., Pagano, P., 2015.
Classifying degrees of species commonness: North sea fish as a case study. Ecological
modelling 312, 272–280.
Costa, A., Pereira, M. A., Motta, H., Schleyer, M., 2005. Status of coral reefs of mozam-
bique: 2004. Coral reef degradation in the Indian Ocean: status report, 54–60.
Costa, B., Battista, T., Pittman, S., 2009. Comparative evaluation of airborne LiDAR
and ship-based multibeam SoNAR bathymetry and intensity for mapping coral reef
ecosystems. Remote Sens Environ 113 (5), 1082–1100.
Cowen, R. K., Sponaugle, S., 2009. Larval dispersal and marine population connectivity.
Annu Rev Mar Sci 1, 443–466.
Currier, K., 2015. Mapping with strings attached: Kite aerial photography of durai
island, anambas islands, indonesia. Journal of Maps 11 (4), 589–597.

References 114
Dai, C.-f., 1990. Interspecific competition in Taiwanese corals with special reference
to interactions between alcyonaceans and scleractinians. Mar Ecol Prog Ser 60 (3),
291–297.
Dandois, J. P., Olano, M., Ellis, E. C., 2015. Optimal altitude, overlap, and weather
conditions for computer vision uav estimates of forest structure. Remote Sensing
7 (10), 13895–13920.
Davis, D., 1993. Scuba diving: Conflicts in marine protected area. Australian Journal
of Leisure and Recreation 3 (4), 65–71.
De’ath, G., Fabricius, K. E., Sweatman, H., Puotinen, M., 2012. The 27–year decline
of coral cover on the Great Barrier Reef and its causes. P Natl A Sci USA 109 (44),
17995–17999.
Deter, J., Descamp, P., Ballesta, L., Boissery, P., Holon, F., 2012. A preliminary study
toward an index based on coralligenous assemblages for the ecological status assess-
ment of Mediterranean French coastal waters. Ecological indicators 20, 345–352.
Dewez, T. J. B., Girardeau-Montaut, D., Allanic, C., Rohmer, J., 2016. Facets: a
CloudCompare plugin to extract geological planes from unstructured 3d point clouds.
ISPRS - International Archives of the Photogrammetry, Remote Sensing and Spatial
Information Sciences XLI-B5, 799–804.
Dikou, A., Van Woesik, R., 2006. Survival under chronic stress from sediment load: spa-
tial patterns of hard coral communities in the southern islands of singapore. Marine
pollution bulletin 52 (11), 1340–1354.
Dimmock, K., Musa, G., 2015. Scuba diving tourism system: a framework for collabo-
rative management and sustainability. Marine Policy 54, 52–58.
Diviacco, 2009. Atlante degli habitat marini sc. 1:10000 - 2009, Accessed: 2018–05–30.
Doney, S. C., 2010. The growing human footprint on coastal and open-ocean biogeo-
chemistry. science 328 (5985), 1512–1516.
References 115
Donner, S. D., Potere, D., 2007. The inequity of the global threat to coral reefs. AIBS
Bulletin 57 (3), 214–215.
Dornelas, M., Madin, J. S., Baird, A. H., Connolly, S. R., 2017. Allometric growth in
reef-building corals. P Roy Soc Lond B Bio 284 (1851).
URL http://rspb.royalsocietypublishing.org/content/284/1851/20170053
Drakare, S., Lennon, J. J., Hillebrand, H., 2006. The imprint of the geographical,
evolutionary and ecological context on species–area relationships. Ecol Lett 9 (2),
215–227.
Edinger, E. N., Risk, M. J., 2000. Reef classification by coral morphology predicts coral
reef conservation value. Biol Conserv 92 (1), 1–13.
Erftemeijer, P. L., Riegl, B., Hoeksema, B. W., Todd, P. A., 2012. Environmental
impacts of dredging and other sediment disturbances on corals: a review. Marine
pollution bulletin 64 (9), 1737–1765.
Fabricius, K., Death, G., McCook, L., Turak, E., Williams, D. M., 2005. Changes in
algal, coral and fish assemblages along water quality gradients on the inshore great
barrier reef. Marine pollution bulletin 51 (1-4), 384–398.
Faig, W., Moniwa, H., 1973. Convergent photos for close range. Photogrammetric En-
gineering and Remote Sensing 39 (6), 605–610.
Ferrari, R., Bryson, M., Bridge, T., Hustache, J., Williams, S. B., Byrne, M., Figueira,
W., 2016. Quantifying the response of structural complexity and community compo-
sition to environmental change in marine communities. Glob Change Biol.
Ferrari, R., Figueira, W. F., Pratchett, M. S., Boube, T., Adam, A., Kobelkowsky-
Vidrio, T., Doo, S. S., Atwood, T. B., Byrne, M., 2017. 3d photogrammetry quanti-
fies growth and external erosion of individual coral colonies and skeletons. Scientific
reports 7 (1), 16737.

References 116
Ferraris, D., Palma, M., Pantaleo, U., Cerrano, C., Chiantore, M., January 2015
2017. Method and device for tracking the path of an object. WO Patent App.
PCT/IB2016/053,924.
URL https://www.google.co.uk/patents/WO2017002060A2?cl=en
Figueira, W., Ferrari, R., Weatherby, E., Porter, A., Hawes, S., Byrne, M., 2015. Accu-
racy and precision of habitat structural complexity metrics derived from underwater
photogrammetry. Remote Sens-Basel 7 (12), 16883–16900.
Floros, C., Schleyer, M., 2017. The functional importance of acropora austera as nursery
areas for juvenile reef fish on south african coral reefs. Coral Reefs 36 (1), 139–149.
Fox, J., Weisberg, S., Friendly, M., Hong, J., Andersen, R., Firth, D., Taylor, S., Team,
R. C., Fox, M. J., 2018. Package effects.
Franzese, P. P., Buonocore, E., Donnarumma, L., Russo, G. F., 2017. Natural capital
accounting in marine protected areas: The case of the Islands of Ventotene and S.
Stefano (Central Italy). Ecological Modelling 360, 290–299.
Franzese, P. P., Buonocore, E., Paoli, C., Massa, F., Stefano, D., Fanciulli, G., Miccio,
A., Mollica, E., Navone, A., Russo, G. F., et al., 2015. Environmental accounting
in marine protected areas: the eampa project. Journal of Environmental Accounting
and Management 3 (4), 324–332.
Friedman, A., Pizarro, O., Williams, S. B., Johnson-Roberson, M., 2012. Multi-scale
measures of rugosity, slope and aspect from benthic stereo image reconstructions.
PloS one 7 (12), e50440.
Furukawa, Y., Ponce, J., 2010. Accurate, dense, and robust multiview stereopsis. IEEE
transactions on pattern analysis and machine intelligence 32 (8), 1362–1376.
Garrabou, J., Ballesteros, E., Zabala, M., 2002. Structure and dynamics of north-
western Mediterranean rocky benthic communities along a depth gradient. Estuar
Coast Shelf S 55 (3), 493–508.

References 117
Garrabou, J., Coma, R., Bensoussan, N., Bally, M., Chevaldonne, P., Cigliano, M.,
Diaz, D., Harmelin, J.-G., Gambi, M., Kersting, D., et al., 2009. Mass mortality
in northwestern mediterranean rocky benthic communities: effects of the 2003 heat
wave. Global change biology 15 (5), 1090–1103.
Garrabou, J., Riera, J., Zabala, M., 1998. Landscape pattern indices applied to Mediter-
ranean subtidal rocky benthic communities. Landscape Ecol 13 (4), 225–247.
Gili, J.-M., Coma, R., 1998. Benthic suspension feeders: their paramount role in littoral
marine food webs. Trends in ecology & evolution 13 (8), 316–321.
Girardeau-Montaut, D., 2014. Cloudcompare (version 2.6. 0)[gpl software].
Gladfelter, E. H., Monahan, R. K., Gladfelter, W. B., 1978. Growth rates of five reef-
building corals in the northeastern car-ibbean. Bulletin of Marine Science 28 (4),
728–734.
Gonzalez-Rivero, M., Beijbom, O., Rodriguez-Ramirez, A., Holtrop, T., Gonzalez-
Marrero, Y., Ganase, A., Roelfsema, C., Phinn, S., Hoegh-Guldberg, O., 2016. Scal-
ing up Ecological Measurements of Coral Reefs Using Semi-Automated Field Image
Collection and Analysis. Remote Sens-Basel 8 (1), 30.
Gonzalez-Rivero, M., Bongaerts, P., Beijbom, O., Pizarro, O., Friedman, A., Rodriguez-
Ramirez, A., Upcroft, B., Laffoley, D., Kline, D., Bailhache, C., et al., 2014. The
Catlin Seaview Survey–kilometre-scale seascape assessment, and monitoring of coral
reef ecosystems. Aquat Conserv 24 (S2), 184–198.
Gori, A., Bavestrello, G., Grinyo, J., Dominguez-Carrio, C., Ambroso, S., Bo, M., 2017.
Animal Forests in Deep Coastal Bottoms and Continental Shelf of the Mediterranean
Sea. Marine Animal Forests: The Ecology of Benthic Biodiversity Hotspots, 1–27.
Gotelli, N. J., Colwell, R. K., 2001. Quantifying biodiversity: procedures and pitfalls
in the measurement and comparison of species richness. Ecol Lett 4 (4), 379–391.
Graham, N., Nash, K., 2013. The importance of structural complexity in coral reef
ecosystems. Coral Reefs 32 (2), 315–326.
References 118
Grigg, R. W., 1972. Orientation and growth form of sea fans. Limnology and Oceanog-
raphy 17 (2), 185–192.
Guinda, X., Gracia, A., Puente, A., Juanes, J. A., Rzhanov, Y., Mayer, L., 2014. Appli-
cation of landscape mosaics for the assessment of subtidal macroalgae communities
using the CFR index. Deep Sea Research II: Topical Studies in Oceanography 106,
207–215.
Gutierrez-Heredia, L., D’Helft, C., Reynaud, E., 2015. Simple methods for interac-
tive 3D modeling, measurements, and digital databases of coral skeletons. Limnol
Oceanogr: Methods 13 (4), 178–193.
Harris, P. T., 2012. Anthropogenic threats to benthic habitats. In: Seafloor Geomor-
phology as Benthic Habitat. Elsevier, pp. 39–60.
Harris, P. T., Baker, E. K., 2012. Why map benthic habitats? In: Seafloor geomor-
phology as benthic habitat. Elsevier, pp. 3–22.
Hasler, H., Ott, J. A., 2008. Diving down the reefs? intensive diving tourism threatens
the reefs of the northern red sea. Marine Pollution Bulletin 56 (10), 1788–1794.
Hattori, A., Shibuno, T., 2015. Total volume of 3D small patch reefs reflected in aerial
photographs can predict total species richness of coral reef damselfish assemblages
on a shallow back reef. Ecol Res 30 (4), 675–682.
Hawkins, J. P., Roberts, C., 1997. Estimating the carrying capacity of coral reefs for
scuba diving. In: Proceedings of the 8th international coral reef symposium. Vol. 2.
Smithsonian Tropical Research Institute Panama, pp. 1923–1926.
Hawkins, J. P., Roberts, C. M., 1992. Effects of recreational scuba diving on fore-reef
slope communities of coral reefs. Biological Conservation 62 (3), 171–178.
Hawkins, J. P., Roberts, C. M., Van’t Hof, T., De Meyer, K., Tratalos, J., Aldam, C.,
1999. Effects of recreational scuba diving on caribbean coral and fish communities.
Conservation Biology 13 (4), 888–897.

References 119
Hawkins, S., Hartnoll, R., 1980. A study of the small-scale relationship between species
number and area on a rocky shore. Estuar Coast Mar Sci 10 (2), 201–214.
He, H. S., DeZonia, B. E., Mladenoff, D. J., 2000. An aggregation index (AI) to quantify
spatial patterns of landscapes. Landscape Ecol 15 (7), 591–601.
Hedley, J. D., Roelfsema, C. M., Chollett, I., Harborne, A. R., Heron, S. F., Weeks, S.,
Skirving, W. J., Strong, A. E., Eakin, C. M., Christensen, T. R., et al., 2016. Remote
sensing of coral reefs for monitoring and management: A review. Remote Sens-Basel
8 (2), 118.
Hill, J., Wilkinson, C., 2004. Methods for ecological monitoring of coral reefs. Australian
Institute of Marine Science, Townsville 117.
Hilmi, N., Bambridge, T., Claudet, J., David, G., Failler, P., Feral, F., Leopold, M.,
Pascal, N., Safa, A., 2014. Preserver la biodiversite des recifs coralliens: l’evaluation
economique comme outil d’une gouvernance multi-echelle. In: Les sciences sociales
dans le Pacifique Sud : terrains, questions et mthodes. Marseille : Pacific-Credo
Publ., (Cahiers du Credo). ISBN 978-2-9537485-2-9, pp. 291–312.
Hong Kong Special Administrative Region, 2016. Hong Kong Biodiversity Strategy
Action Plan 2016-2021
https://www.afcd.gov.hk/tc_chi/conservation/Con_hkbsap/files/HKBSAP_
ENG_2.pdf.
Huete-Stauffer, C., Previati, M., Scinto, A., Palma, M., Pantaleo, U., Cappanera, V.,
Cerrano, C., Imperia, C. E. A., Portofino, M., 2013. Long-term monitoring in a
multi-stresses Paramuricea clavata population.
Huete-Stauffer, C., Vielmini, I., Palma, M., Navone, A., Panzalis, P., Vezzulli, L.,
Misic, C., Cerrano, C., 2011. Paramuricea clavata (Anthozoa, Octocorallia) loss in
the Marine Protected Area of Tavolara (Sardinia, Italy) due to a mass mortality
event. Marine Ecology 32 (s1), 107–116.
References 120
Hughes, T., Connell, J., 1999. Multiple stressors on coral reefs: A long-term perspective.
Limnology and oceanography 44 (3part2), 932–940.
Hughes, T. P., Baird, A. H., Bellwood, D. R., Card, M., Connolly, S. R., Folke, C.,
Grosberg, R., Hoegh-Guldberg, O., Jackson, J. B., Kleypas, J., et al., 2003. Climate
change, human impacts, and the resilience of coral reefs. science 301 (5635), 929–933.
Hughes, T. P., Kerry, J. T., Alvarez-Noriega, M., Alvarez-Romero, J. G., Anderson,
K. D., Baird, A. H., Babcock, R. C., Beger, M., Bellwood, D. R., Berkelmans,
R., et al., 2017. Global warming and recurrent mass bleaching of corals. Nature
543 (7645), 373.
IG.21/9, U., 2016. Annex II Thematic Decisions. http://actionmed.eu/wp-
content/uploads/2016/03/Decision-21.3-ECAP-FINAL.pdf.
Ingwer, P., Gassen, F., Pust, S., Duhn, M., Schalicke, M., Muller, K., Ruhm, H., Rettig,
J., Hasche, E., Fischer, A., et al., 2015. Practical usefulness of structure from motion
(sfm) point clouds obtained from different consumer cameras. In: Mobile Devices and
Multimedia: Enabling Technologies, Algorithms, and Applications 2015. Vol. 9411.
International Society for Optics and Photonics, p. 941102.
James, M., Robson, S., 2012. Straightforward reconstruction of 3d surfaces and topog-
raphy with a camera: Accuracy and geoscience application. Journal of Geophysical
Research: Earth Surface 117 (F3).
Jolliffe, I., 2005. Principal component analysis: Wiley online library. Google Scholar.
Jordan, I. E., Samways, M. J., 2001. Recent changes in coral assemblages of a south
african coral reef, with recommendations for long-term monitoring. Biodiversity &
Conservation 10 (7), 1027–1037.
Kazhdan, M., Hoppe, H., 2013. Screened poisson surface reconstruction. ACM Trans-
actions on Graphics (TOG) 32 (3), 29.
Kendall, M. S., Miller, T., 2008. The influence of thematic and spatial resolution on
maps of a coral reef ecosystem. Marine Geodesy 31 (2), 75–102.
References 121
Kenefick, J. F., Gyer, M. S., Harp, B. F., 1972. Analytical self-calibration. Photogram-
metric Engineering 38 (11), 1117–1126.
Lague, D., Brodu, N., Leroux, J., 2013. Accurate 3d comparison of complex topogra-
phy with terrestrial laser scanner: Application to the rangitikei canyon (nz). ISPRS
journal of photogrammetry and remote sensing 82, 10–26.
Lamb, J. B., True, J. D., Piromvaragorn, S., Willis, B. L., 2014. Scuba diving dam-
age and intensity of tourist activities increases coral disease prevalence. Biological
Conservation 178, 88–96.
Laurans, Y., Pascal, N., Binet, T., Brander, L., Clua, E., David, G., Rojat, D., Seidl,
A., 2013. Economic valuation of ecosystem services from coral reefs in the South
Pacific: Taking stock of recent experience. J Environ Manage 116, 135–144.
Lavy, A., Eyal, G., Neal, B., Keren, R., Loya, Y., Ilan, M., 2015. A quick, easy and
non-intrusive method for underwater volume and surface area evaluation of benthic
organisms by 3D computer modelling. Methods Ecol Evol 6 (5), 521–531.
Le, J. T., Levin, L. A., Carson, R. T., 2017. Incorporating ecosystem services into en-
vironmental management of deep-seabed mining. Deep Sea Research Part II: Topical
Studies in Oceanography 137, 486–503.
Lecours, V., Devillers, R., Schneider, D. C., Lucieer, V. L., Brown, C. J., Edinger,
E. N., 2015. Spatial scale and geographic context in benthic habitat mapping: review
and future directions. Mar Ecol Prog Ser 535, 259–284.
Leon, J. X., Roelfsema, C. M., Saunders, M. I., Phinn, S. R., 2015. Measuring coral reef
terrain roughness using ‘Structure-from-Motion’close-range photogrammetry. Geo-
morphology 242, 21–28.
Lepareur, F., 2011. Evaluation de letat de conservation des habitats naturels marins a
lechelle dun site natura 2000. Guide methodologique. Rapport SPN 3, 9.

References 122
Levy, J., Hunter, C., Lukacazyk, T., Franklin, E. C., 2018. Assessing the spatial distri-
bution of coral bleaching using small unmanned aerial systems. Coral Reefs 37 (2),
373–387.
Liang, X., Wang, Y., Jaakkola, A., Kukko, A., Kaartinen, H., Hyyppa, J., Honkavaara,
E., Liu, J., 2015. Forest data collection using terrestrial image-based point clouds
from a handheld camera compared to terrestrial and personal laser scanning. IEEE
transactions on geoscience and remote sensing 53 (9), 5117–5132.
Linares, C., Coma, R., Garrabou, J., Dıaz, D., Zabala, M., 2008a. Size distribution,
density and disturbance in two Mediterranean gorgonians: Paramuricea clavata and
Eunicella singularis . Journal of Applied Ecology 45 (2), 688–699.
Linares, C., Coma, R., Mariani, S., Dıaz, D., Hereu, B., Zabala, M., 2008b. Early
life history of the Mediterranean gorgonian Paramuricea clavata: implications for
population dynamics. Invertebrate Biology 127 (1), 1–11.
Linares, C., Coma, R., Zabala, M., 2008c. Restoration of threatened red gorgonian pop-
ulations: An experimental and modelling approach. Biological Conservation 141 (2),
427 – 437.
Lirman, D., 2000. Fragmentation in the branching coral acropora palmata (lamarck):
growth, survivorship, and reproduction of colonies and fragments. Journal of Exper-
imental Marine Biology and Ecology 251 (1), 41–57.
Lucrezi, S., Saayman, M., 2017. Sustainable scuba diving tourism and resource use:
Perspectives and experiences of operators in mozambique and italy. Journal of Cleaner
Production 168, 632–644.
Luna, B., Perez, C. V., Sanchez-Lizaso, J. L., 2009. Benthic impacts of recreational
divers in a mediterranean marine protected area. ICES Journal of Marine Science
66 (3), 517–523.
Lyons, P. J., Arboleda, E., Benkwitt, C. E., Davis, B., Gleason, M., Howe, C., Mathe, J.,
Middleton, J., Sikowitz, N., Untersteggaber, L., et al., 2015. The effect of recreational
References 123
scuba divers on the structural complexity and benthic assemblage of a caribbean coral
reef. Biodiversity and conservation 24 (14), 3491–3504.
MacArthur, R. H., Wilson, E. O., 2015. Theory of Island Biogeography.(MPB-1). Vol. 1.
Princeton University Press.
Magliozzi, C., Coro, G., Grabowski, R., Packman, A. I., Krause, S., 2018. A multi-
scale statistical method to identify potential areas of hyporheic exchange for river
restoration planning. Environmental Modelling & Software.
Magris, R. A., Pressey, R. L., Weeks, R., Ban, N. C., 2014. Integrating connectivity
and climate change into marine conservation planning. Biological Conservation 170,
207–221.
McCarthy, J., Benjamin, J., 2014. Multi-image photogrammetry for underwater ar-
chaeological site recording: An accessible, diver-based approach. J Mari Arch 9 (1),
95–114.
McGarigal, K., 2014. Fragstats help. Documentation for FRAGSTATS 4.
Mcgarigal, K., Cushman, S. A., Neel, M. C., Ene, E., 2002. FRAGSTATS: Spatial
pattern analysis program for categorical maps. Tech. rep.
URL http://www.umass.edu/landeco/research/fragstats/fragstats.html
McGarigal, K., Marks, B. J., 1995. FRAGSTATS: spatial pattern analysis program for
quantifying landscape structure. Gen tech rep pnw-gtr-351, United States Depart-
ment of Agriculture, Forest Service, Pacific Northwest Research Station.
Meesters, E., Bos, A., Gast, G., 1992. Effects of sedimentation and lesion position on
coral tissue regeneration. In: Proc 7th Int Coral Reef Symp. Vol. 2. pp. 681–688.
Mengerink, K. J., Van Dover, C. L., Ardron, J., Baker, M., Escobar-Briones, E., Gjerde,
K., Koslow, J. A., Ramirez-Llodra, E., Lara-Lopez, A., Squires, D., et al., 2014. A
call for deep-ocean stewardship. Science 344 (6185), 696–698.
References 124
Micheletti, N., Chandler, J. H., Lane, S. N., 2015a. Investigating the geomorphological
potential of freely available and accessible structure-from-motion photogrammetry
using a smartphone. Earth Surface Processes and Landforms 40 (4), 473–486.
Micheletti, N., Chandler, J. H., Lane, S. N., 2015b. Structure from motion (sfm) pho-
togrammetry.
Milazzo, M., Chemello, R., Badalamenti, F., Camarda, R., Riggio, S., 2002. The impact
of human recreational activities in marine protected areas: what lessons should be
learnt in the Mediterranean sea? Marine ecology 23 (s1), 280–290.
Mistri, M., 1995. Gross morphometric relationships and growth in the mediterranean
gorgonian Paramuricea clavata. Italian Journal of Zoology 62 (1), 5–8.
Mistri, M., Ceccherelli, V. U., 1994. Growth and secondary production of the Mediter-
ranean gorgonian Paramuricea clavata. Marine Ecology-Progress Series 103, 291–291.
Mitchell, N. D., Dardeau, M. R., Schroeder, W. W., Benke, A. C., 1992. Secondary pro-
duction of gorgonian corals in the northern Gulf of Mexico. Marine Ecology Progress
Series, 275–281.
Mokahtar-Jamaı, K., Pascual, M., Ledoux, J.-B., Coma, R., Feral, J.-P., Garrabou,
J., Aurelle, D., 2011. From global to local genetic structuring in the red gorgonian
paramuricea clavata: the interplay between oceanographic conditions and limited
larval dispersal. Molecular Ecology 20 (16), 3291–3305.
Mora, C., 2015. 36 Perpetual struggle for conservation in a crowded world and the
needed paradigm shift for easing ultimate burdens. In: Ecology of Fishes on Coral
Reefs. Vol. 20. Cambridge University Press, p. 289.
Motta, H, R. M. S. M. H., 2000. Coral reef monitoring and management in mozambique.
Musa, G., 2002. Sipadan: a scuba-diving paradise: an analysis of tourism impact, diver
satisfaction and tourism management. Tourism Geographies 4 (2), 195–209.

References 125
Norstrom, A. V., Nystrom, M., Lokrantz, J., Folke, C., 2009. Alternative states on coral
reefs: beyond coral–macroalgal phase shifts. Marine ecology progress series 376, 295–
306.
Nystrom, M., 2006. Redundancy and response diversity of functional groups: implica-
tions for the resilience of coral reefs. AMBIO: A Journal of the Human Environment
35 (1), 30–35.
Odum, H. T., 1988. Self-organization, transformity, and information. Science
242 (4882), 1132–1139.
Odum, H. T., 1996. Environmental accounting: emergy and environmental decision
making. Wiley.
Palma, M., Rivas Casado, M., Pantaleo, U., Cerrano, C., 2017. High Resolution Ortho-
mosaics of African Coral Reefs: A Tool for Wide-Scale Benthic Monitoring. Remote
Sensing 9 (7), 705.
Palma, M., Rivas Casado, M., Pantaleo, U., Pavoni, G., Pica, D., Cerrano, C., 2018.
Sfm-based method to assess gorgonian forests (paramuricea clavata (cnidaria, octo-
corallia)). Remote Sensing 10 (7), 1154.
Paoli, C., Povero, P., Burgos, E., Dapueto, G., Fanciulli, G., Massa, F., Scarpellini,
P., Vassallo, P., 2018. Natural capital and environmental flows assessment in marine
protected areas: The case study of liguria region (nw mediterranean sea). Ecological
Modelling 368, 121–135.
Parliament, E., the Council, 2008. Directive 2008/56/EC.
http://data.europa.eu/eli/dir/2008/56/oj.
Pascal, N., Allenbach, M., Brathwaite, A., Burke, L., Le Port, G., Clua, E., 2016.
Economic valuation of coral reef ecosystem service of coastal protection: A pragmatic
approach. Ecosyst Serv 21, 72–80.
References 126
Pavoni, G., Palma, M., Callieri, M., Dellepiane, M., Scopigno, R., Cerrano, C., 2018.
Quasi-Orthorectified projection for the measurement of Red Gorgonian colonies. IS-
PRS Annals of the Photogrammetry, Remote Sensing and Spatial Information Sci-
ences.
Pelleg, D., Moore, A. W., et al., 2000. X-means: Extending k-means with efficient
estimation of the number of clusters. In: Icml. Vol. 1. pp. 727–734.
Peraira, M. A., Schleyer, M. H., 2005. A diver and diving survey in southern mozam-
bique. Coral Reef Degradation in the Indian Ocean, 184.
Pergent, G., 2011. Proposal for the definition of standard methods for inventorying and
monitoring coralligenous and maerl populations. UNEP-MAP, RAC/SPA Report.
UNEP (DEPI)/MED WG 362 (4), 20.
Picone, F., Buonocore, E., DAgostaro, R., Donati, S., Chemello, R., Franzese, P., 2017.
Integrating natural capital assessment and marine spatial planning: A case study in
the Mediterranean sea. Ecological Modelling 361, 1–13.
Pittman, S. J., Costa, B. M., Battista, T. A., 2009. Using lidar bathymetry and boosted
regression trees to predict the diversity and abundance of fish and corals. J Coastal
Res, 27–38.
Ponti, M., Grech, D., Mori, M., Perlini, R. A., Ventra, V., Panzalis, P. A., Cerrano, C.,
2016. The role of gorgonians on the diversity of vagile benthic fauna in Mediterranean
rocky habitats. Marine Biology 163 (5), 1–14.
Porter, S., Branch, G., Sink, K., 2013. Biogeographic patterns on shallow subtidal reefs
in the western Indian Ocean. Mar Biol 160 (5), 1271–1283.
Porter, S., Schleyer, M., 2017. Long-term dynamics of a high-latitude coral reef com-
munity at sodwana bay, south africa. Coral Reefs, 1–14.
Previati, M., Scinto, A., Cerrano, C., Osinga, R., 2010. Oxygen consumption in Mediter-
ranean octocorals under different temperatures. Journal of Experimental Marine Bi-
ology and Ecology 390 (1), 39 – 48.

References 127
Purkis, S. J., Graham, N., Riegl, B., 2008. Predictability of reef fish diversity and
abundance using remote sensing data in Diego Garcia (Chagos Archipelago). Coral
reefs 27 (1), 167–178.
Ramsay, P., 1994. Marine geology of the Sodwana Bay shelf, southeast Africa. Mar
Geol 120 (3), 225–247.
Ramsay, P., 1996. Quaternary marine geology of the Sodwana Bay continental shelf,
Northern KwaZulu-Natal. Oceanograph Lit Rev 11 (43), 1103.
Raoult, V., Reid-Anderson, S., Ferri, A., Williamson, J. E., 2017. How reliable is struc-
ture from motion (sfm) over time and between observers? a case study using coral
reef bommies. Remote Sensing 9 (7), 740.
Richardson, D., 1999. A brief history of recreational diving in the united states.
Riegl, B., 1993. Taxonomy and ecology of South African reef corals. Ph.D. thesis, Uni-
versity of Cape Town.
Riegl, B., 1995. Effects of sand deposition on scleractinian and alcyonacean corals.
Marine Biology 121 (3), 517–526.
Riegl, B., Schleyer, M. H., Cook, P., Branch, G., 1995. Structure of africa’s southern-
most coral communities. Bulletin of Marine Science 56 (2), 676–691.
Robertson, W., Schleyer, M., Fielding, P., Tomalin, B., Beckley, L., Fennessy, S.,
Van der Elst, R., Bandeira, S., Macia, A., Gove, D., 1996. Inshore marine resources
and associated opportunities for development of the coast of southern mozambique:
Ponta do ouro to cabo de santa maria.
Roche, R. C., Harvey, C. V., Harvey, J. J., Kavanagh, A. P., McDonald, M., Stein-
Rostaing, V. R., Turner, J. R., 2016. Recreational diving impacts on coral reefs
and the adoption of environmentally responsible practices within the scuba diving
industry. Environmental management 58 (1), 107–116.
References 128
Roelfsema, C., Phinn, S., Jupiter, S., Comley, J., Albert, S., 2013. Mapping coral reefs
at reef to reef-system scales, 10s–1000s km2, using object-based image analysis. Int
J Remote Sens 34 (18), 6367–6388.
Rogers, C. S., 1990. Responses of coral reefs and reef organisms to sedimentation.
Marine ecology progress series. Oldendorf 62 (1), 185–202.
Rossi, S., 2013. The destruction of the animal forests in the oceans: towards an over-
simplification of the benthic ecosystems. Ocean & coastal management 84, 77–85.
Rossi, S., Gili, J.-M., Garrofe, X., 2011. Net negative growth detected in a population
Leptogorgia sarmentosa: quantifying the biomass loss in a benthic soft bottom-gravel
gorgonian. Marine Biology 158 (7), 1631–1643.
Rothermel, M., Wenzel, K., Fritsch, D., Haala, N., 2012. Sure: Photogrammetric surface
reconstruction from imagery. In: Proceedings LC3D Workshop, Berlin. Vol. 8. p. 2.
Rouphael, T., Inglis, G., 1995. The effects of qualified recreational scuba divers on coral
reefs. Tech. Rep. CRC Reef Res. Cent. (4), 39.
Royer, J.-P., Nawaf, M. M., Merad, D., Saccone, M., Bianchimani, O., Garrabou,
J., Ledoux, J.-B., Lopez-Sanz, A., Drap, P., 2018. Photogrammetric surveys and
geometric processes to analyse and monitor red coral colonies. Journal of Marine
Science and Engineering 6 (2), 42.
Samonte, G. P., Eisma-Osorio, R.-L., Amolo, R., White, A., 2016. Economic value of
a large marine ecosystem: Danajon double barrier reef, Philippines. Ocean Coast
Manage 122, 9–19.
Sanchez, J. A., 2015. Diversity and evolution of octocoral animal forests at both sides
of tropical america. Marine Animal Forests: The Ecology of Benthic Biodiversity
Hotspots, 1–33.
Santangelo, G., Cupido, R., Cocito, S., Bramanti, L., Priori, C., Erra, F., Iannelli, M.,
Oct 2015. Effects of increased mortality on gorgonian corals (cnidaria, octocorallia):

References 129
different demographic features may lead affected populations to unexpected recovery
and new equilibrium points. Hydrobiologia 759 (1), 171–187.
Sartoretto, S., Schohn, T., Bianchi, C. N., Morri, C., Garrabou, J., Ballesteros, E.,
Ruitton, S., Verlaque, M., Daniel, B., Charbonnel, E., et al., 2017. An integrated
method to evaluate and monitor the conservation state of coralligenous habitats:
The INDEX-COR approach. Marine pollution bulletin 120 (1-2), 222–231.
Schleyer, M., 2000. South African coral communities. In: Coral reefs of the Indian ocean:
their ecology and conservation. Oxford University Press, New York. pp. 83–105.
Schleyer, M., Celliers, L., 2003. Coral dominance at the reef–sediment interface in
marginal coral communities at sodwana bay, south africa. Marine and Freshwater
Research 54 (8), 967–972.
Schleyer, M., Celliers, L., 2004. Coral dominance at the reef–sediment interface in
marginal coral communities at Sodwana Bay, South Africa. Mar Freshwater Res
54 (8), 967–972.
Schleyer, M. H., Kruger, A., Celliers, L., 2008. Long-term community changes on a
high-latitude coral reef in the Greater St Lucia Wetland Park, South Africa. Mar
Pollut Bull 56 (3), 493–502.
Schleyer, M. H., Tomalin, B. J., 2000. Damage on south african coral reefs and an
assessment of their sustainable diving capacity using a fisheries approach. Bulletin of
Marine Science 67 (3), 1025–1042.
Schneider, C. A., Rasband, W. S., Eliceiri, K. W., 2012. Nih image to imagej: 25 years
of image analysis. Nature methods 9 (7), 671–675.
Schuhmann, P. W., Casey, J. F., Horrocks, J. A., Oxenford, H. A., 2013. Recreational
scuba divers’ willingness to pay for marine biodiversity in barbados. Journal of envi-
ronmental management 121, 29–36.
References 130
Schumann, E., Orren, M., 1980. The physico-chemical characteristics of the south-west
Indian Ocean in relation to Maputaland. Rhodes University and The Wildlife Society
of Southern Africa.
Seenprachawong, U., 2016. An economic analysis of coral reefs in the Andaman Sea of
Thailand. In: Marine and Coastal Ecosystem Valuation, Institutions, and Policy in
Southeast Asia. Springer, pp. 31–45.
Sleeman, J. C., Kendrick, G. A., Boggs, G. S., Hegge, B. J., 2005. Measuring frag-
mentation of seagrass landscapes: which indices are most appropriate for detecting
change? Mar Freshwater Res 56 (6), 851–864.
Snavely, N., Seitz, S. M., Szeliski, R., 2008. Modeling the world from internet photo
collections. International journal of computer vision 80 (2), 189–210.
Somerfield, P., Clarke, K., Warwick, R., 2008. Simpson index. In: Encyclopedia of
Ecology. Elsevier.
Spellerberg, I. F., Fedor, P. J., 2003. A tribute to claude shannon (1916–2001) and
a plea for more rigorous use of species richness, species diversity and the shannon–
wienerindex. Global Ecol Biogeogr 12 (3), 177–179.
Starmans, A., Gutt, J., 2002. Mega-epibenthic diversity: a polar comparison. Mar Ecol
Prog Ser 225, 45–52.
Starmans, A., Gutt, J., Arntz, W., 1999. Mega-epibenthic communities in arctic and
antarctic shelf areas. Mar Biol 135 (2), 269–280.
Stats, R. C., et al., 2013. R: A language and environment for statistical computing.
Storlazzi, C. D., Dartnell, P., Hatcher, G. A., Gibbs, A. E., 2016. End of the chain?
rugosity and fine-scale bathymetry from existing underwater digital imagery using
structure-from-motion (sfm) technology. Coral Reefs 35 (3), 889–894.
References 131
Stout, J., Vandermeer, J., 1975. Comparison of species richness for stream-inhabiting
insects in tropical and mid-latitude streams. The American Naturalist 109 (967),
263–280.
Teixido, N., Garrabou, J., Arntz, W., 2002. Spatial pattern quantification of Antarctic
benthic communities using landscape indices. Mar Ecol Prog Ser 242, 1–14.
Thakur, M., Schattin, E. W., McShea, W. J., 2018. Globally common, locally rare: re-
visiting disregarded genetic diversity for conservation planning of widespread species.
Biodiversity and Conservation, 1–5.
Thomas, C. D., Cameron, A., Green, R. E., Bakkenes, M., Beaumont, L. J., Collingham,
Y. C., Erasmus, B. F., De Siqueira, M. F., Grainger, A., Hannah, L., et al., 2004.
Extinction risk from climate change. Nature 427 (6970), 145–148.
Turner, M. G., 1989. Landscape Ecol: the effect of pattern on process. Annu Rev Ecol
Syst, 171–197.
UNEP-MAP-RAC, S., 2008. Action plan for the conservation of the coralligenous and
other calcareous bio-concretions in the mediterranean sea. UNEP MAP RAC-SPA
publ., Tunis.
Valisano, L., Notari, F., Mori, M., Cerrano, C., 2016. Temporal variability of sedimen-
tation rates and mobile fauna inside and outside a gorgonian garden. Marine Ecology
37 (6), 1303–1314.
Van Dover, C., Ardron, J., Escobar, E., Gianni, M., Gjerde, K., Jaeckel, A., Jones,
D., Levin, L., Niner, H., Pendleton, L., et al., 2017. Biodiversity loss from deep-sea
mining. Nature Geoscience 10 (7), 464.
Vezzulli, L., Colwell, R. R., Pruzzo, C., 2013. Ocean warming and spread of pathogenic
vibrios in the aquatic environment. Microbial ecology 65 (4), 817–825.
Vezzulli, L., Previati, M., Pruzzo, C., Marchese, A., Bourne, D. G., Cerrano, C., 2010.
Vibrio infections triggering mass mortality events in a warming Mediterranean Sea.
Environmental microbiology 12 (7), 2007–2019.

References 132
Wallace, L., Lucieer, A., Malenovsky, Z., Turner, D., Vopenka, P., 2016. Assessment of
forest structure using two uav techniques: A comparison of airborne laser scanning
and structure from motion (sfm) point clouds. Forests 7 (3), 62.
Walther, B. A., MARTIN, J.-L., 2001. Species richness estimation of bird communities:
how to control for sampling effort? Ibis 143 (4), 413–419.
Wedding, L. M., Friedlander, A. M., McGranaghan, M., Yost, R. S., Monaco, M. E.,
2008. Using bathymetric lidar to define nearshore benthic habitat complexity: Im-
plications for management of reef fish assemblages in Hawaii. Remote Sens Environ
112 (11), 4159–4165.
Wedding, L. M., Lepczyk, C. A., Pittman, S. J., Friedlander, A. M., Jorgensen, S.,
2011a. Quantifying seascape structure: extending terrestrial spatial pattern metrics
to the marine realm. Mar Ecol Prog Ser 427, 219–232.
Wedding, L. M., Lepczyk, C. A., Pittman, S. J., Friedlander, A. M., Jorgensen, S.,
2011b. Quantifying seascape structure: extending terrestrial spatial pattern metrics
to the marine realm. Marine Ecology Progress Series 427, 219–232.
Weinbauer, M. G., Velimirov, B., 1995. Biomass and secondary production of the tem-
perate gorgonian coral Eunicella cavolini (coelenterata: Octocorallia). Marine Ecol-
ogy Progress Series, 211–216.
Weinberg, S., 1978. The minimal area problem in invertebrate communities of Mediter-
ranean rocky substrata. Mar Biol 49 (1), 33–40.
Weinberg, S., 1981. A comparison of coral reef survey methods. Bijdragen tot de
Dierkunde 51 (2), 199–218.
Westoby, M., Brasington, J., Glasser, N., Hambrey, M., Reynolds, J., 2012. ‘Structure-
from-Motion’ photogrammetry: A low-cost, effective tool for geoscience applications.
Geomorphology 179, 300–314.

References 133
White, M., Wolff, G. A., Lundalv, T., Guihen, D., Kiriakoulakis, K., Lavaleye, M.,
Duineveld, G., 2012. Cold-water coral ecosystem (Tisler Reef, Norwegian Shelf) may
be a hotspot for carbon cycling. Marine Ecology Progress Series 465, 11–23.
Wilkinson, C. R., Green, A., Almany, J., Dionne, S., 2003. Monitoring coral reef marine
protected areas: A practical guide on how monitoring can support effective manage-
ment of mpas.
Wilkinson, C. R., Souter, D. N., 2008. Status of Caribbean coral reefs after bleaching
and hurricanes in 2005. Global Coral Reef Monitoring Network.
Williams, S. B., Pizarro, O. R., Jakuba, M. V., Johnson, C. R., Barrett, N. S., Babcock,
R. C., Kendrick, G. A., Steinberg, P. D., Heyward, A. J., Doherty, P. J., et al., 2012.
Monitoring of benthic reference sites: using an autonomous underwater vehicle. IEEE
IEEE Robot Autom Mag 19 (1), 73–84.
Wongthong, P., Harvey, N., 2014. Integrated coastal management and sustainable
tourism: A case study of the reef-based scuba dive industry from thailand. Ocean &
Coastal Management 95, 138–146.
Wright, D. J., Heyman, W. D., 2008. Introduction to the special issue: marine and
coastal gis for geomorphology, habitat mapping, and marine reserves. Marine Geodesy
31 (4), 223–230.
Wulff, J., 2006. Resistance vs recovery: morphological strategies of coral reef sponges.
Functional Ecology 20 (4), 699–708.
Zakai, D., Chadwick-Furman, N. E., 2002. Impacts of intensive recreational diving on
reef corals at eilat, northern red sea. Biological Conservation 105 (2), 179–187.
Zhang, C., Selch, D., Xie, Z., Roberts, C., Cooper, H., Chen, G., 2013. Object-based
benthic habitat mapping in the Florida Keys from hyperspectral imagery. Estuar
Coast Shelf S 134, 88–97.
Zuiderveld, K., 1994. Contrast limited adaptive histogram equalization. Graphics gems,
474–485.

References 134
Zuur, A., Ieno, E., Walker, N., Saveliev, A., Smith, G., 2009. Mixed effects models and
extensions in ecology with r. springer science+.
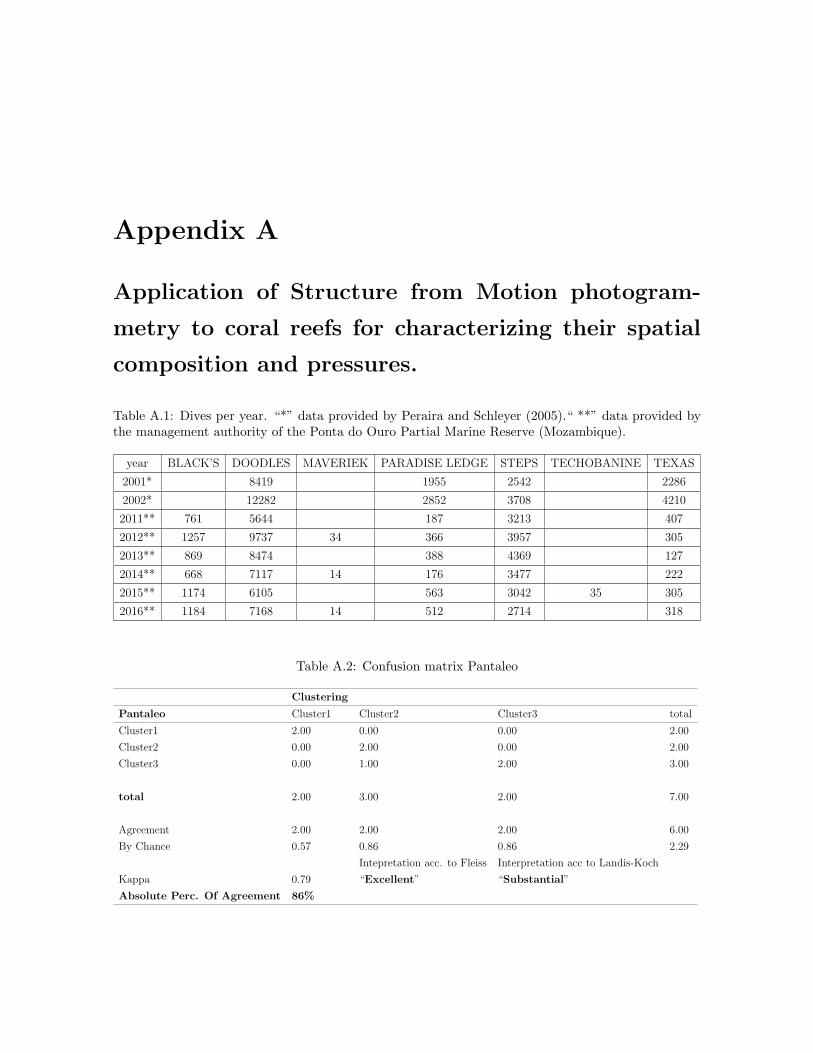
Appendix A
Application of Structure from Motion photogram-
metry to coral reefs for characterizing their spatial
composition and pressures.
Table A.1: Dives per year. “*” data provided by Peraira and Schleyer (2005).“ **” data provided bythe management authority of the Ponta do Ouro Partial Marine Reserve (Mozambique).
year BLACK’S DOODLES MAVERIEK PARADISE LEDGE STEPS TECHOBANINE TEXAS
2001* 8419 1955 2542 2286
2002* 12282 2852 3708 4210
2011** 761 5644 187 3213 407
2012** 1257 9737 34 366 3957 305
2013** 869 8474 388 4369 127
2014** 668 7117 14 176 3477 222
2015** 1174 6105 563 3042 35 305
2016** 1184 7168 14 512 2714 318
Table A.2: Confusion matrix Pantaleo
Clustering
Pantaleo Cluster1 Cluster2 Cluster3 total
Cluster1 2.00 0.00 0.00 2.00
Cluster2 0.00 2.00 0.00 2.00
Cluster3 0.00 1.00 2.00 3.00
total 2.00 3.00 2.00 7.00
Agreement 2.00 2.00 2.00 6.00
By Chance 0.57 0.86 0.86 2.29
Intepretation acc. to Fleiss Interpretation acc to Landis-Koch
Kappa 0.79 “Excellent” “Substantial”
Absolute Perc. Of Agreement 86%
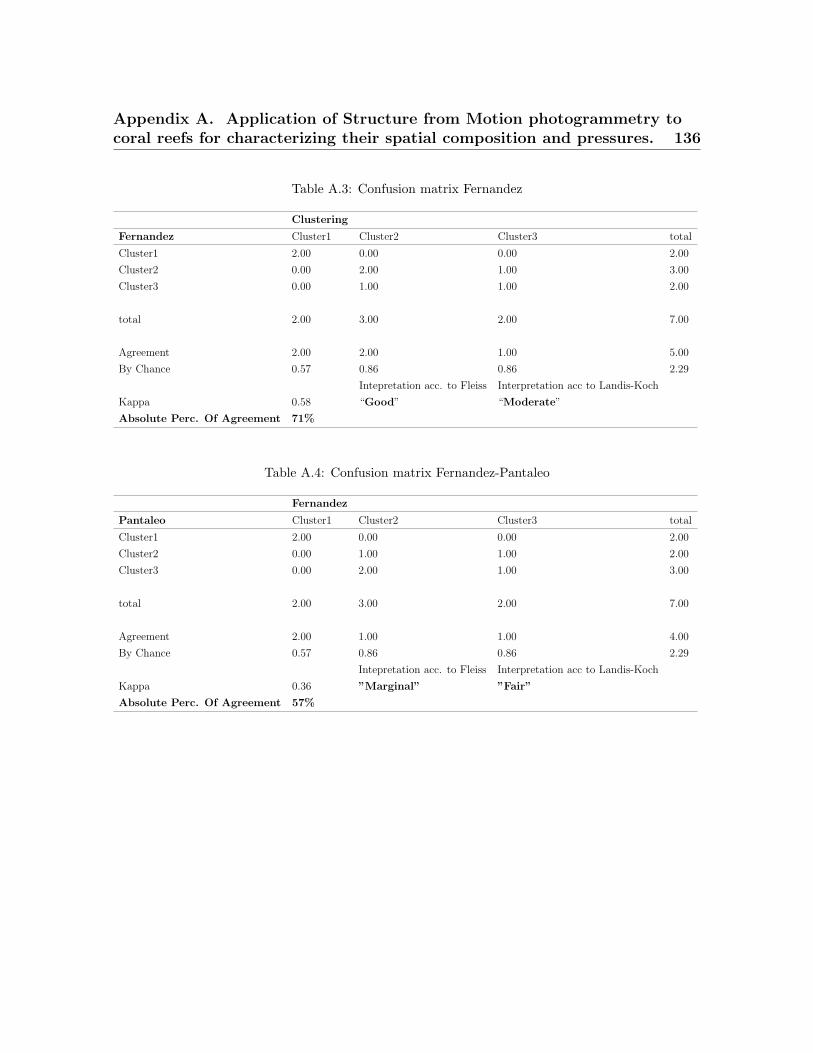
Appendix A. Application of Structure from Motion photogrammetry tocoral reefs for characterizing their spatial composition and pressures. 136
Table A.3: Confusion matrix Fernandez
Clustering
Fernandez Cluster1 Cluster2 Cluster3 total
Cluster1 2.00 0.00 0.00 2.00
Cluster2 0.00 2.00 1.00 3.00
Cluster3 0.00 1.00 1.00 2.00
total 2.00 3.00 2.00 7.00
Agreement 2.00 2.00 1.00 5.00
By Chance 0.57 0.86 0.86 2.29
Intepretation acc. to Fleiss Interpretation acc to Landis-Koch
Kappa 0.58 “Good” “Moderate”
Absolute Perc. Of Agreement 71%
Table A.4: Confusion matrix Fernandez-Pantaleo
Fernandez
Pantaleo Cluster1 Cluster2 Cluster3 total
Cluster1 2.00 0.00 0.00 2.00
Cluster2 0.00 1.00 1.00 2.00
Cluster3 0.00 2.00 1.00 3.00
total 2.00 3.00 2.00 7.00
Agreement 2.00 1.00 1.00 4.00
By Chance 0.57 0.86 0.86 2.29
Intepretation acc. to Fleiss Interpretation acc to Landis-Koch
Kappa 0.36 ”Marginal” ”Fair”
Absolute Perc. Of Agreement 57%
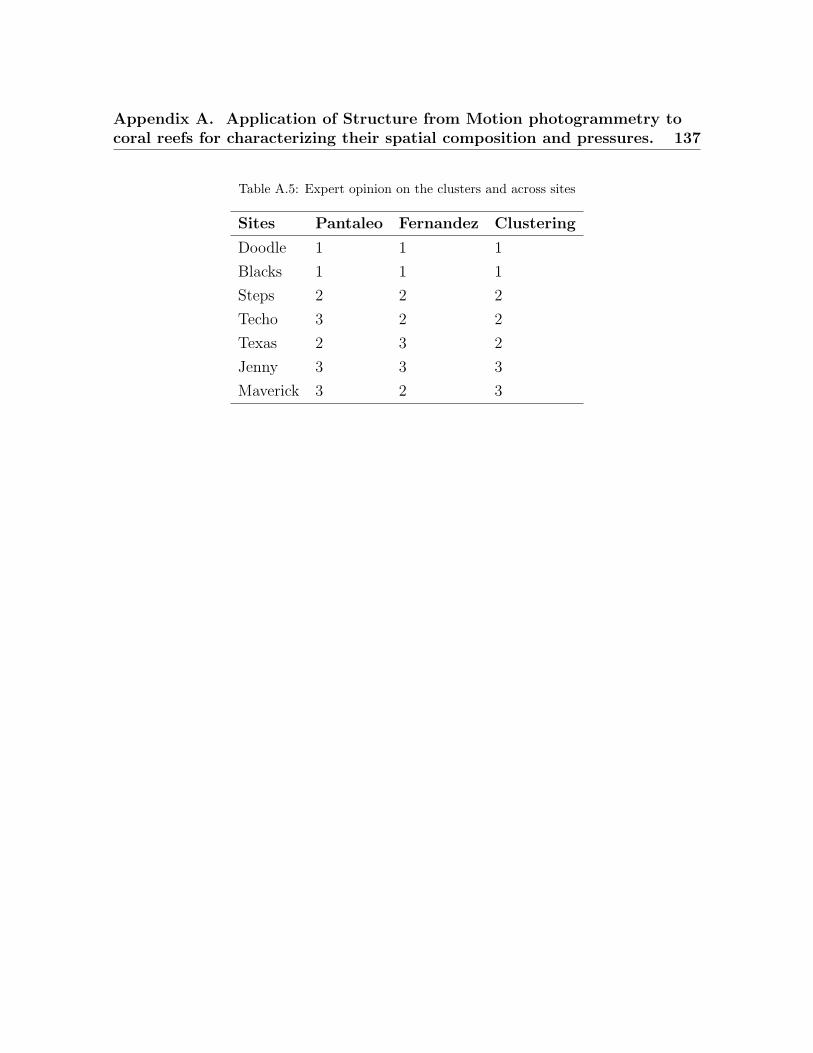
Appendix A. Application of Structure from Motion photogrammetry tocoral reefs for characterizing their spatial composition and pressures. 137
Table A.5: Expert opinion on the clusters and across sites
Sites Pantaleo Fernandez Clustering
Doodle 1 1 1
Blacks 1 1 1
Steps 2 2 2
Techo 3 2 2
Texas 2 3 2
Jenny 3 3 3
Maverick 3 2 3
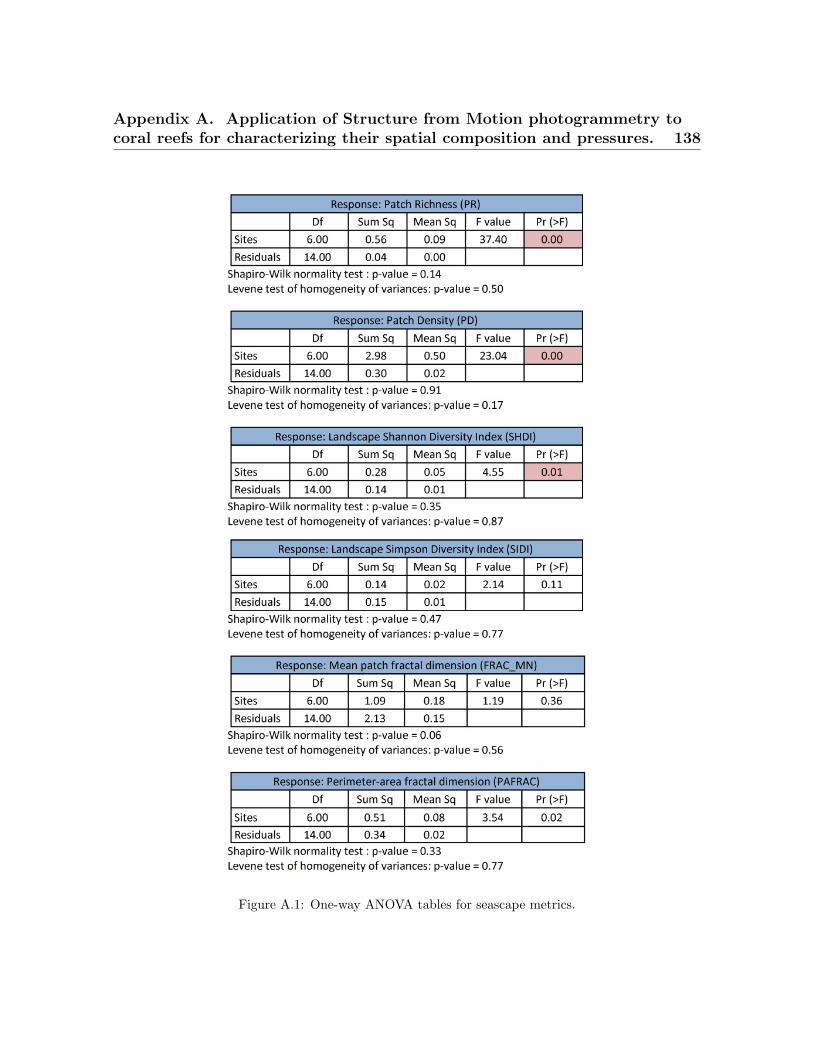
Appendix A. Application of Structure from Motion photogrammetry tocoral reefs for characterizing their spatial composition and pressures. 138
Figure A.1: One-way ANOVA tables for seascape metrics.

Appendix A. Application of Structure from Motion photogrammetry tocoral reefs for characterizing their spatial composition and pressures. 139
Figure A.2: Relative contribution in percentage of the classes of fragility to physical impacts of theaverage organisms’ surface, across the sites
Figure A.3: Relative contribution in percentage of the classes of fragility to physical impacts of theaverage organisms’ perimeter, across the sites
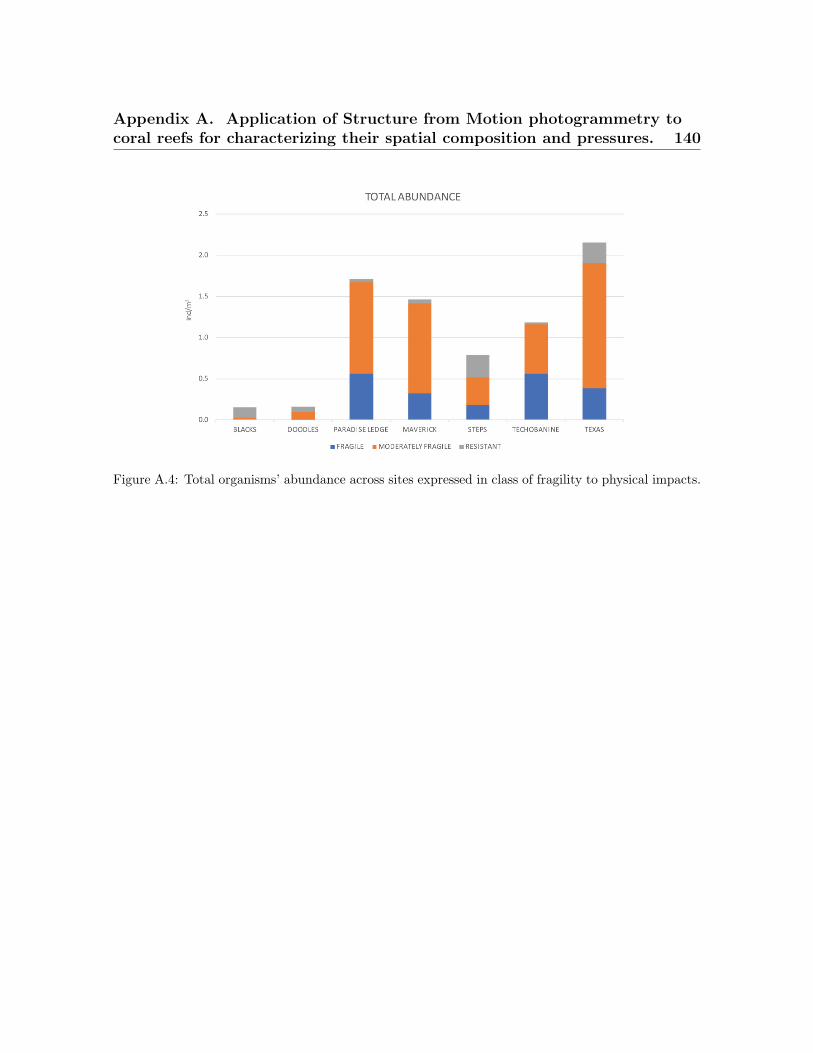
Appendix A. Application of Structure from Motion photogrammetry tocoral reefs for characterizing their spatial composition and pressures. 140
Figure A.4: Total organisms’ abundance across sites expressed in class of fragility to physical impacts.
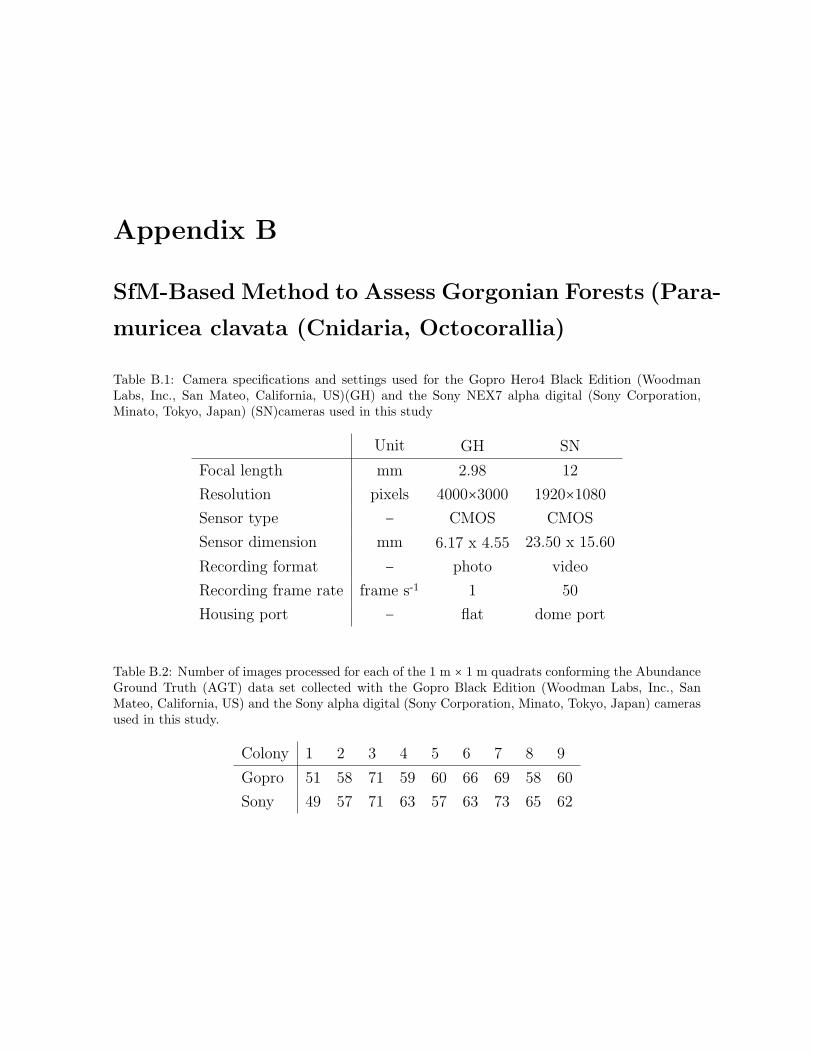
Appendix B
SfM-Based Method to Assess Gorgonian Forests (Para-
muricea clavata (Cnidaria, Octocorallia)
Table B.1: Camera specifications and settings used for the Gopro Hero4 Black Edition (WoodmanLabs, Inc., San Mateo, California, US)(GH) and the Sony NEX7 alpha digital (Sony Corporation,Minato, Tokyo, Japan) (SN)cameras used in this study
Unit GH SN
Focal length mm 2.98 12
Resolution pixels 4000×3000 1920×1080
Sensor type − CMOS CMOS
Sensor dimension mm 6.17 x 4.55 23.50 x 15.60
Recording format − photo video
Recording frame rate frame s-1 1 50
Housing port − flat dome port
Table B.2: Number of images processed for each of the 1 m × 1 m quadrats conforming the AbundanceGround Truth (AGT) data set collected with the Gopro Black Edition (Woodman Labs, Inc., SanMateo, California, US) and the Sony alpha digital (Sony Corporation, Minato, Tokyo, Japan) camerasused in this study.
Colony 1 2 3 4 5 6 7 8 9
Gopro 51 58 71 59 60 66 69 58 60
Sony 49 57 71 63 57 63 73 65 62
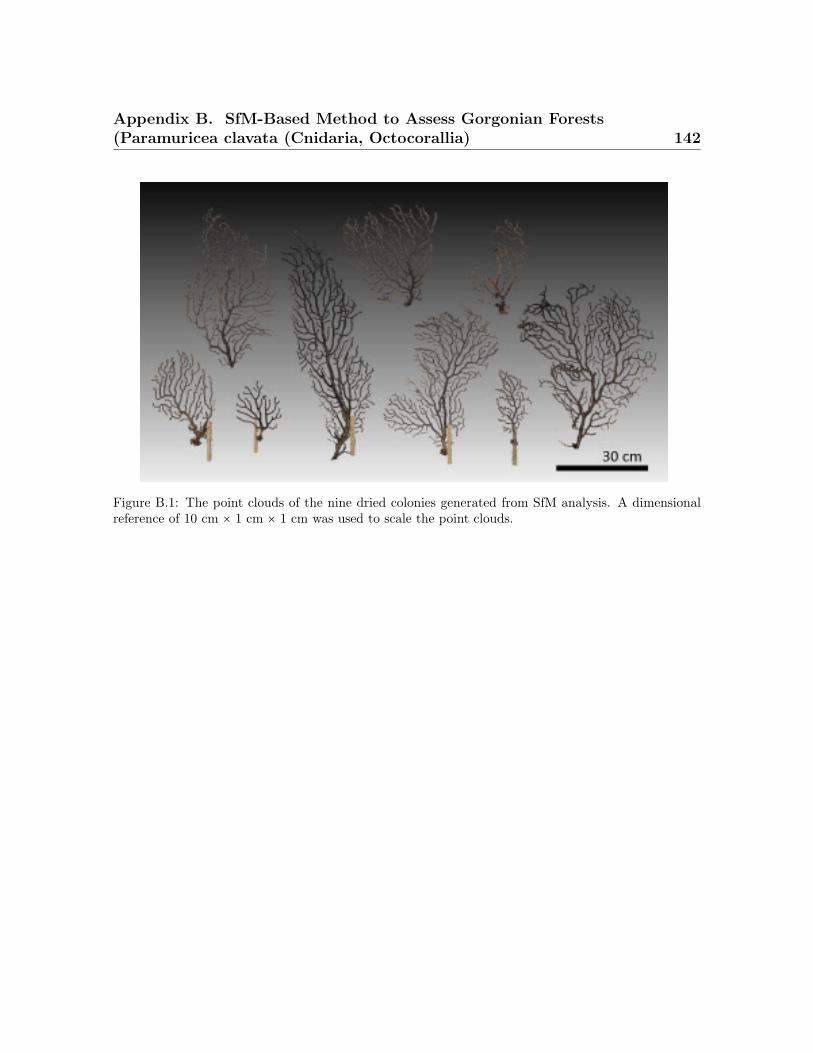
Appendix B. SfM-Based Method to Assess Gorgonian Forests(Paramuricea clavata (Cnidaria, Octocorallia) 142
Figure B.1: The point clouds of the nine dried colonies generated from SfM analysis. A dimensionalreference of 10 cm × 1 cm × 1 cm was used to scale the point clouds.
Appendix B. SfM-Based Method to Assess Gorgonian Forests(Paramuricea clavata (Cnidaria, Octocorallia) 143
Figure B.2: Views over the 3D scene representing the study area with the gorgonians fan surfacesgenerated within the three strata by using the imagery recorded with the Gopro Hero4 Black Edition(Woodman Labs, Inc., San Mateo, California, US)(GP) (a, b) and the Sony NEX7 alpha digital (SonyCorporation, Minato, Tokyo, Japan) (SN) (c, d) cameras.

Appendix B. SfM-Based Method to Assess Gorgonian Forests(Paramuricea clavata (Cnidaria, Octocorallia) 144
Figure B.3: The maps showing border of the Portofino Marine Protected Area (Italy) (a), the bathyme-tries at 20 m spatial resolution (a), the benthic biocenosis Diviacco (2009) (b), and the selected 8.63Ha over a total of 22.22 Ha of coralligenous habitats comprised within the depth -25 m to -40 m,considered for the calculation of carbon and Energy contents of the gorgonians’ forests living tissues