Padova : un altro degli arrestati accusato anche per il caso Moro
Upload
khangminh22Category
view
4download
0
UNIVERSITA’ DEGLI STUDI DI PADOVA
DIPARTIMENTO DI SCIENZE ECONOMICHE ED AZIENDALI “M.FANNO”
CORSO DI LAUREA MAGISTRALE IN BUSINESS ADMINISTRATION
TESI DI LAUREA
“THE IMPACT OF ELECTRIFICATION ON THE BICYCLE INDUSTRY”
RELATORE: CH.MO PROF. ANTONIO ZOTTI
LAUREANDA: SARA MAZZOCATO
MATRICOLA N. 1178841
ANNO ACCADEMICO 2018 – 2019

2
3
Il candidato dichiara che il presente lavoro è originale e non è già stato sottoposto, in tutto o in parte, per il conseguimento di un titolo accademico in altre Università italiane o straniere. Il candidato dichiara altresì che tutti i materiali utilizzati durante la preparazione dell’elaborato sono stati indicati nel testo e nella sezione “Riferimenti bibliografici” e che le eventuali citazioni testuali sono individuabili attraverso l’esplicito richiamo alla pubblicazione originale. The candidate declares that the present work is original and has not already been submitted, totally or in part, for the purposes of attaining an academic degree in other Italian or foreign universities. The candidate also declares that all the materials used during the preparation of the thesis have been explicitly indicated in the text and in the section "Bibliographical references" and that any textual citations can be identified through an explicit reference to the original publication.
Firma dello studente _________________

4
5
Index
List of Figures ......................................................................................................................... 11
List of Graphs ......................................................................................................................... 11
List of Tables .......................................................................................................................... 12
Ringraziamenti ....................................................................................................................... 15
Introduction ............................................................................................................................ 17
1. Introduction to Electric Bicycles ....................................................................................... 19
1.1 Electric Bicycle Impact in Addressing Global Mega-Trends ................................... 19
1.2 Definition ....................................................................................................................... 20
1.3 Components .................................................................................................................. 21
1.3.1 Motor ....................................................................................................................... 22
1.3.2 Battery ..................................................................................................................... 22
1.3.3 Electrics Components ............................................................................................. 23
1.4 History ........................................................................................................................... 23
1.5 Market Development: The Diffusion of the Electric Bicycle’s Innovation ............. 24
1.5.1 China ....................................................................................................................... 26
1.5.2 Japan ....................................................................................................................... 28
1.5.3 Europe ..................................................................................................................... 29
1.5.3.1 Italy .................................................................................................................. 32
1.5.4 United States of America ........................................................................................ 33
1.6 Electric Bicycle Industry: Strengths, Weaknesses, Opportunities and Threats .... 36
1.6.1 Strengths ................................................................................................................. 37
1.6.2 Weaknesses ............................................................................................................. 38
1.6.3 Opportunities .......................................................................................................... 39
1.6.3.1 Reduction of Motorized Means of Transportation and Urban Mobility Solution
...................................................................................................................................... 39
1.6.3.2 Others: Tourism and Public Health .................................................................. 40
1.6.4 Threats .................................................................................................................... 40
6
1.6.4.1 Lack of Suitable Infrastructure ......................................................................... 40
1.6.4.2 Other ................................................................................................................. 41
1.6.5 SWOT analysis: Conclusions ................................................................................. 41
2. Pedelecs Industry Analysis ................................................................................................ 43
2.1 Market Segmentation: A Comparison between Pedelecs and Traditional Bicycles
.............................................................................................................................................. 43
2.1.1 Industry and Market Segmentation: Framework definition and purposes ......... 43
2.1.2 Industry Segmentation: Application to the Bicycle Industry ............................... 44
2.1.3 Market Segmentation in the Bicycle Industry: Segment identification in Pedelecs
and Traditional Bicycles ................................................................................................. 45
2.1.3.1 Growth Opportunities provided by Pedelecs with respect to Traditional
Bicycles Market ........................................................................................................... 47
2.2 Main Players in the Pedelecs Industry: Overview. ................................................... 49
2.2.1 Value Chain Analysis Framework ........................................................................ 49
2.2.2 Pedelecs Value Chain: Overview ........................................................................... 50
2.2.2.2 Overview of the Players: Group-set manufacturers, drive-unit producers and
OEMs ........................................................................................................................... 52
2.2.2.3 Pedelecs: Cost Drivers Along the Value Chain ............................................... 53
2.2.2.4 Pedelecs: Criteria Driving Customer Decisions ............................................... 55
2.3 Pedelecs: Industry’s Structure Analysis .................................................................... 58
2.3.1 Porter Five Forces Framework ............................................................................. 58
2.3.2 Porter Five Forces Framework Applied to Pedelecs Industry ............................. 59
2.3.2.1 Threat of Entry ................................................................................................. 59
2.3.2.2 The Power of Suppliers .................................................................................... 61
2.3.2.3 The Power of Buyers ........................................................................................ 62
2.3.2.4 The Threat of Substitutes ................................................................................. 63
2.3.2.5 Rivalry among Existing Competitors ............................................................... 64
2.3.2.6 Conclusions ...................................................................................................... 65
2.4 Pedelecs Industry Analysis: Conclusions ................................................................... 68

7
3. Overview of the Pedelecs Market and Industry: Evidence from Italy .......................... 71
3.1 Pedelecs Market in Italy .............................................................................................. 71
3.1.2 Italian Government and Municipalities Policies .................................................. 72
3.1.3 Cycle -Tourism and growth of the potential customer base ................................. 73
3.1.4 Pedelecs Market Potential in Italy: Interview with Pietro Nigrelli ...................... 74
3.2 Pedelecs Industry in Italy ............................................................................................ 75
3.2.1 Database and Research Methodology ................................................................... 76
3.2.2 Players in Italian Pedelecs Market: Financial Statement Analysis ..................... 79
3.2.2.1 Methodology .................................................................................................... 79
3.2.2.2 Bicycle Producers ............................................................................................. 80
3.2.2.3 Motorcycles Producers ..................................................................................... 84
3.2.2.4 Pedelecs OEMs ................................................................................................ 87
3.2.2.5 Components Manufacturers ............................................................................. 90
3.2.2.6 Drive-Unit Manufactures ................................................................................. 92
3.2.2.7 Summary and Conclusions ............................................................................... 96
3.2.3 Pedelecs Industry in Italy: Conclusions ................................................................ 97
4. Players in Pedelecs Value Chain in the Italian Market: Selected Case Studies ........... 99
4.1 Bicycle Producers Case Studies ................................................................................ 101
4.1.1 Wilier Triestina ..................................................................................................... 101
4.1.1.1 History and Financial Background ................................................................. 101
4.1.1.2 Wilier’s entrance in the pedelecs market ....................................................... 102
4.1.2 Cicli Pinarello S.R.L. ........................................................................................... 103
4.1.2.1 History and Financial Background ................................................................. 103
4.2.2.2 Cicli Pinarello’s entrance in the pedelecs market .......................................... 104
4.2.2.3 Cicli Pinarello’s Strategic Partnership with Fazua ......................................... 105
4.1.3 Cicli Olympia S.R.L. ............................................................................................. 106
4.1.3.1 History and Financial Background ................................................................. 106
4.1.3.2 Olympia’s entrance in the pedelecs market .................................................... 106
8
4.1.4 Atala SPA .............................................................................................................. 107
4.1.4.1 History and Financial Background ................................................................. 107
4.1.4.2 Atala’s entrance in the pedelecs market ......................................................... 108
4.1.4.3 The non-equity joint venture with Oli S.P.A. ................................................ 109
4.1.5 Fabbrica Italiana Velocipedi Edoardo Bianchi .................................................. 110
4.1.5.1 History and Financial Background ................................................................. 110
4.1.5.2 Bianchi’s entrance in the pedelecs market ..................................................... 110
4.1.5.3 The Strategic Partnership with Polini Motori S.P.A. ..................................... 111
4.1.6 Lombardo Bikes .................................................................................................... 111
4.1.6.1 History and Financial Background ................................................................. 111
4.1.6.2 Lombardo’s entrance in the pedelecs market ................................................. 112
4.1.7 Cicli Elios .............................................................................................................. 113
4.1.7.1 History and Financial Background ................................................................. 113
4.1.7.2 Cicli Elios’ entrance in the pedelecs market .................................................. 113
4.1.8 Denver Bikes ......................................................................................................... 114
4.1.8.1 History and Financial Background ................................................................. 114
4.1.8.2 Denver Bike’s entrance in the pedelecs market ............................................. 114
4.1.9 Cicli Casadei S.R.L. .............................................................................................. 115
4.1.9.1 History and Financial Background ................................................................. 115
4.1.9.2 Cicli Casadei’s entrance in the pedelecs market ............................................ 115
4.1.10 Cases Summary .................................................................................................. 116
4.2 Motorcycles Producers .............................................................................................. 117
4.2.1 Fantic Motor S.P.A. ............................................................................................. 117
4.2.1.1 History and Financial Background ................................................................. 117
4.2.1.2 Fantic’s entrance in the pedelecs market ........................................................ 118
4.2.2 Moto Morini S.R.L. .............................................................................................. 119
4.2.2.1 History and Financial Background ................................................................. 119
4.2.2.2 Moto Morini’s entrance in the pedelecs market ............................................. 120
9
4.2.3 Cases Summary .................................................................................................... 120
4.3 Pedelecs Producers ..................................................................................................... 121
4.3.1 World Dimension S.R.L. ...................................................................................... 121
4.3.1.1 History and Financial Bacground ................................................................... 121
4.3.1.2 World Dimension’s decision to make pedelecs its core business. ................. 121
4.3.2 Askoll EVA ........................................................................................................... 122
4.3.2.1 History and Financial Background ................................................................. 122
4.3.2.2 Askoll’s entrance in the pedelecs market ....................................................... 123
4.3.3 KP S.R.L. - Thok E-Bikes .................................................................................... 124
4.3.3.1 History and Financial Background ................................................................. 124
4.3.3.2 Thok’s entrance in the pedelecs market ......................................................... 125
4.3.4. Case Studies Summary ........................................................................................ 126
4.4 Components Manufacturer ....................................................................................... 126
4.4.1 Selle Italia ............................................................................................................. 126
4.4.1.1. History and Financial Background ................................................................ 126
4.4.2.2 Selle Italia’s entrance in the pedelecs market ................................................ 127
4.4.2 Fabbrica Accessori Cicli Michelin S.P.A. ........................................................... 128
4.4.2.1 History and Financial Background ................................................................. 128
4.4.2.2 Miche’s entrance in the pedelecs market ....................................................... 128
4.4.3 GiPiemme S.R.L. .................................................................................................. 129
4.4.3.1 History and Financial Background ................................................................. 129
4.4.3.2 GiPiemme’s entrance in the pedelecs market ................................................ 130
4.4.4 Cases Summary .................................................................................................... 130
4.5 Drive-Unit Manufacturers ......................................................................................... 130
4.5.1 Oli S.P.A. (Olieds) ................................................................................................ 130
4.5.1.1 History and Financial Background ................................................................. 130
4.5.1.2 Oli’s entrance in the pedelecs market ............................................................ 131
4.5.2 Polini Motori S.P.A. ............................................................................................. 132
10
4.5.2.1 History and Financial Background ................................................................. 132
4.5.2.2 Polini’s entrance in the pedelecs market ........................................................ 133
4.5.3 Bikee Bike S.R.L. .................................................................................................. 133
4.5.3.1 History and Financial Background ................................................................. 133
4.5.3.2 Bikee Bike’s entrance in the pedelecs market ................................................ 134
4.5.4 Cases Summary .................................................................................................... 134
4.6 Conclusions ................................................................................................................. 135
Conclusions ........................................................................................................................... 139
Sources .................................................................................................................................. 143
Websites ................................................................................................................................ 149
11
List of Figures
Figure 1.1. Own Ri-Elaboration. Highlighted Mega-Trends impacted by electric-bicycles ... 20
Figure 1.2: Electric Bicycle: Main Components. Source:
https://www.eriksbikeshop.com/electric-bikes-at-eriks-bike-shop.aspx .................................. 21
Figure 1.3. Everett Rogers’ Diffusion of Innovation. Source: Wikipedia ............................... 25
Figure 2.1. Bicycle Industry Segmentation. ............................................................................. 45
Figure 2.2. Bicycle Market Segmentation. ............................................................................... 46
Figure 2.3. Bicycle Market Segmentation.1. ............................................................................ 46
Figure 2.4. Ansoff Matrix Pedelecs. ........................................................................................ 47
Figure 2.5. Market Segments Expansion. ................................................................................ 48
Figure 2.6. Source: Competitive Advantage (p.37, Porter, 1985) ............................................ 49
Figure 2.7. Pedelcs Value Chain Summary. ............................................................................ 51
Figure 2.8. Pedelecs Value Chain: Main Players ..................................................................... 53
Figure 2.9. Standard Pedelecs and Premium Pedelecs Value Chain: Cost Drivers. ................ 55
Figure 2.10. Standard and Premium Pedelecs Value Chain: Consumers’ purchase decision
drivers. ...................................................................................................................................... 57
Figure 2.11. Porter Five Forces. Source: Competitive Advantage ........................................... 58
Figure 2.12. Porter 5 Forces. Main determinants in the pedelecs industry. ............................. 67
Figure 6.1. Impacts in Italian Bicycle Market. Summary. ..................................................... 140
Figure 6.2. Impacts in Bicycle Industry: Summary ............................................................... 141
List of Graphs Graph 1.1: Electric Bikes circulating in China. Own ri-elaboration of data, based on literature
review ....................................................................................................................................... 26
Graph 1.2: Bicycles Sale in Japan. Source: METI’s data ........................................................ 28
Graph 1.3 Bicycles and EPACs sales in EU 28 (Conebi, 2018) .............................................. 29
Graph 1.4: units of EPAC sold in EU 28. Source: Conebi (2018) ........................................... 30
Graph 1.5 Number of EPACs sold in Italy. Number of EPACs and Traditional Bicycles sold in
Italy. Source: Ancma, 2018 ...................................................................................................... 32
Graph 1.6. Number of EPACs and Traditional Bicycles Produced and Sold in Italy (%). Source:
Ancma, 2018. ........................................................................................................................... 32
Graph 1.7. EPACs sold in Italy (bicycle type). Source: Interview with Mr. Nigrelli (2019) .. 33
Graph 1.8. Demand Drivers among U.S. citizens. Source: Statista (2017) ............................. 35
Graph 2.1. Standard and Premium Pedelecs. Threat of Entry. ................................................. 60
12
Graph 2.2. Standard Pedelecs and Premium Pedelecs. The Power of Supplier. ...................... 61
Graph 2.3. Standard Pedelecs and Premium Pedelecs. The Power of Buyers. ........................ 62
Graph 2.4. Standard Pedelecs and Premium Pedelecs. Threat of Substitutes. ......................... 63
Graph 2.5. Standard Pedelecs and Premium Pedelecs. Industry Rivalry. ................................ 65
Graph 2.6. Five Forces Summary Standard and Premium Pedelecs. ....................................... 68
Graph 3.1. Companies Summary. Source: Aida (2019) and bicilive.it catalogue (2019) ........ 77
Graph 3.2. Detail of the companies. Source: Aida (2019) ....................................................... 78
Graph 3.3. Detail of the bicycle manufacturers. Source: Aida (2019) ..................................... 79
Graph 3.4. Bicycle’s Producers Region ................................................................................... 80
Graph 3.5. Own Ri-elaboration. Companies belonging or not to a bigger group. Source: Aida
(2019) ....................................................................................................................................... 96
Graph 3.6. Analyzed Companies’ Geographic Region. Source: Aida (2019). ........................ 97
Graph 4.1. Type of Contact. ..................................................................................................... 99
Graph 4.2. Company Core Business ...................................................................................... 100
Graph 4.3. Type of Interview ................................................................................................. 101
List of Tables Table 1.1: SWOT Analysis Summary. Own elaboration on the basis of literature review ..... 37
Table 2.1. Summary of the scores attributed to each characteristic by Italian OEMs. ............ 56
Table 2.2. Porter 5 Forces. Analysis Basis ............................................................................... 59
Table 2.3. Standard and Premium Pedelecs. Threat of New Entry. Own Ri-elaboration. ....... 60
Table 2.4. Standard Pedelecs and Premium Pedelecs. The Power of Supplier. Own Ri-
elaboration ................................................................................................................................ 61
Table 2.5. Standard and Premium Pedelecs. The Power of Buyers. Own Ri-elaboration ....... 63
Table 2.6. Standard Pedelecs and Premium Pedelecs. Threat of Substitutes. Own Ri-
Elaboration ............................................................................................................................... 64
Table 2.7 Standard and Premium Pedelecs. Industry Rivalry. Own Ri-elaboration. ............... 65
Table 2.8. Five Force Summary. Standard and Premium Pedelecs ......................................... 68
Table 3.1. Financial Indicators Calculated. .............................................................................. 79
Table 3.2. Bicycle Manufacturers operating in the Italian Pedelecs Market. P&L Data. Source:
Aida (2019) .............................................................................................................................. 81
Table 3.3. Bicycle Manufacturers operating in the Italian Pedelecs Market. Balance Sheet
Data. Source: Aida (2019) ........................................................................................................ 83
13
Table 3.4. Motorcycles Manufacturers operating in the Italian Pedelecs Market. P&L Data.
Source: Aida (2019) ................................................................................................................. 85
Table 3.5. Motorcycles Manufacturers operating in the Italian Pedelecs Market. Balance Sheet
Data. Source: Aida (2019) ........................................................................................................ 87
Table 3.6. Pedelecs OEMs operating in the Italian Market. P&L Data. Source: Aida (2019) 88
Table 3.7. Pedelecs OEMs operating in the Italian Market. Balance Sheet Data. Source: Aida
(2019) ....................................................................................................................................... 89
Table 3.8. Bicycle Components Manufacturers operating in the Italian Pedelecs Market. P&L
Data. Source: Aida (2019) ........................................................................................................ 91
Table 3.9. Bicycle Components Manufacturers operating in the Italian Pedelecs Market.
Balance Sheet Data. Source: Aida (2019) ................................................................................ 92
Table 3.10. Pedelecs Drive-Unit Manufacturers operating in the Italian Market. P&L Data.
Source: Aida (2019). ................................................................................................................ 94
Table 3.11. Pedelecs Drive-Unit Manufacturers operating in the Italian Market. Balance Sheet
Data. Source: Aida (2019) ........................................................................................................ 96
Table 4.1. Companies Answer Summary ............................................................................... 100
Table 4.2. Wilier Triestina Financials. Source: Aida (2019). ................................................ 102
Table 4.3. Cicli Pinarello Financials. Source: Aida (2019). .................................................. 104
Table 4.4. Cicli Olympia Financials. Source Aida (2019). .................................................... 106
Table 4.5. Atala SPA Financials. Source Aida (2019). .......................................................... 108
Table 4.6. F.I.V. Edoardo Bianchi S.P.A Financials. Source Aida (2019). ........................... 110
Table 4.7. Cicli Lombardo. Financials. Source Aida (2019). ................................................ 112
Table 4.8. Cicli Elios S.R.L Financials. Source Aida (2019). ............................................... 113
Table 4.9. Denver Bikes SRL. Financials. Source Aida (2019). ............................................ 114
Table 4.10. Cicli Casadei SRL Financials. Source Aida (2019). ........................................... 115
Table 4.11. Fantic Motor S.P.A.. Financials. Source Aida (2019). ....................................... 118
Table 4.12. Moto Morini S.R.L. Financials. Source Aida (2019). ......................................... 120
Table 4.13. World Dimension S.R.L. Financials. Source Aida (2019). ................................. 121
Table 4.14. Askoll EVA S.P.A.. Financials. Source Aida (2019). ........................................ 123
Table 4.15. KP S.R.L. Financials. Source Aida (2019). ........................................................ 125
Table 4.16. Selle Italia SRL Financials. Source Aida (2019). ............................................... 127
Table 4.17. F.A.C Michelin S.P.A. Financials. Source Aida (2019). .................................... 128
Table 4.18. Gipiemme S.R.L. Financials. Source Aida (2019). ............................................. 129
Table 4.19. Oli S.P.A. Financials. Source Aida (2019). ........................................................ 131
Table 4.20. Polini Motori S.P.A. Financials. Source Aida (2019). ........................................ 132

14
Table 4.21. Bikee Bike S.R.L. Financials. Source Aida (2019). ............................................ 134
15
Ringraziamenti Un ringraziamento speciale va a tutte le aziende ed i manager che si sono resi disponibile a
rispondere alle mie domande, dedicando del tempo prezioso a descrivermi con dedizione e
passione la propria azienda, e senza i quali il mio progetto non si sarebbe potuto realizzare.
Inoltre, vorrei ringraziare il mio relatore, il professor Antonio Zotti, per il tempo che mi ha
dedicato, i suoi consigli e la sua guida nella stesura dell’elaborato.
Infine, ma non meno rilevante, un sentito ringraziamento va alla mia famiglia ed ai miei amici,
i quali mi hanno supportata durante tutto il periodo universitario. In particolare, vorrei
ringraziare i miei genitori e mia sorella, per essermi sempre stati vicini e per avermi arricchita,
con i loro consigli.

16
17
Introduction
The electrification of mobility has been revolutionizing the way people move and behave. The
world population has welcomed this innovation. In fact, E-mobility helps addressing one of the
main issues of modern society: climate change. Among all, the electric bicycle has a great
potential, not only to fight climate change but also to address some other issues, such as
increasing urbanization, and to reduce health problems of an ageing population, by allowing
also older people to make physical exercise and keep fit.
The electric bicycle innovation’s impact has been heterogeneous among different countries.
Specifically, in developing countries it is seen as a cheap mode of transportation to commute
faster. In developed countries instead the electric bicycle is both a clean commuting tool and
an opportunity for older people to maintain fit and healthy. Furthermore, as electric bicycles
are smaller than cars or motorcycles, they are a tool for governments to improve urban mobility
and to make it more efficient, thus reducing traffic jams and cities’ pollution. In fact, according
to a study of University of Queensland and University of Lund (see Bosch eBike Systems
Magazine, 2018), the CO2 produced by an e-bike per person, for each kilometer is 5,4 grams,
compared to the 53 grams of local public transport and the 124 – 200 grams of cars.
Ruan et al. (2014) stated that the electric-bike is a disruptive innovation. An innovation is
classified as disruptive if it provides a re-definition of what performance means or if it disrupts
the established trajectory of performance improvement (Christensen and Bower, 1996). The
electric bicycle is a disruptive innovation, as it re-defined the bicycle as a transportation tool,
by adding an electric motor. In fact, the motor’s assistance allows the rider to travel longer and
steeper paths without any additional effort, and, at the same time, to keep enjoying the benefits
of cycling.
The purpose of this document is to introduce the electric bicycle, its main advantages and
disadvantages, its recent market development around the world, in particular in the European
Union and in Italy. In fact, thanks to the recent progresses in the e-bike’s technology, the
European electric bicycle’s market has experienced a tremendous growth. For instance, in 2016
in Germany 605.000 electric bicycles have been sold, compared to the 11.410 electric cars.
The growth potential of this market has attracted some players into it. Many multinational
groups active in the automotive sector like Bosch, Yamaha and Continental all decided to enter
in the e-bike market. In particular, the technological progresses brought about by Bosch have
been pivotal for the development of the market. In fact, by introducing the first mass-produced
mid-drive unit for e-bikes into the market, Bosch has made the innovation of the electric bicycle
18
to be accepted and appreciated by consumers. Since then, more and more companies decided
to engage in the e-bike business and many start-ups were born.
Nonetheless, the European market is heterogeneous and different countries are in different
stages of innovation’s diffusion. As the Italian market is still in its very early stages, but it is
experiencing a double-digit growth rate, this document would focus on it. More and more
newspapers and media channels are describing the upsurge of the market in Italy, especially in
the recreational segment. Rental shops in touristic locations are buying a lot of these vehicles,
because of the growing request from tourists.
After describing how the value chain of the bicycle has been modified by the electrification of
the vehicle, and the industry structure of the electric bicycle, the Italian electric bicycle industry
and market are analyzed. The analysis’ objectives are to assess which kind of players have
joined the electric bicycle market in Italy and which are the reasons behind their entrance.
Furthermore, the way in which the players got into the market is investigated. In order to do so,
the operators in the Italian market were asked to answer an interview about the reasons why
they decided to enter in the e-bike market and whether they needed new competences or skills
in order to join it. In particular, the majority of the players interviewed declared that they needed
to acquire skills from the market, either in the form of professional personnel hiring or of
strategic partnerships with other companies or both. However, as the Italian market is still
young, none of the players decided to undertake M&A deals.
19
1. Introduction to Electric Bicycles This chapter introduces the electric bicycle by assessing its possible impact on addressing issues
generated by current mega-trends, its definition, an overview of its component and its history.
Furthermore, the development of its market is analyzed, firstly by illustrating the worldwide
market and later by focusing on the most important ones (i.e. China, Japan, the U.S. and the
European Union). Finally, an analysis of the major drivers and obstacles to the electric bike’s
diffusion is conducted.
1.1 Electric Bicycle Impact in Addressing Global Mega-Trends
Mega-trends are disruptive structural strengths which shape changings in society, economics
and culture (Pictet, 2016). The world is changing rapidly, and governments are required to
provide answers to emerging issues, such as demographic growth, climate change, urbanization
and resources stress. According to KPMG International (2014), there are nine mega-trends
which will affect the world’s economy in the next 20 years: (i) Demographics, as world
population is growing, especially in Africa and Asia, and life expectancy in developed countries
is getting longer thus increasing the proportion of elderly people; (ii) Rise of the Individual;
(iii) Enabling Technology; (iv) Economic Interconnectedness; (v) Public Debt; (vi) Economic
Power Shift; (vii) Climate Change; (viii) Resources Stress and (ix) Urbanization. Those trends
are all interrelated.
E-mobility, and in particular, electric bicycle is crucial to address some of the afore-mentioned
mega-trends. In fact, it provides a solution for governments to fight climate change as it is a
sustainable transportation tool, which helps reducing greenhouse emissions in cities’ centers,
thus positively affecting air quality and human health. For example, Norway’s capital Oslo has
become the first city in the world to ban all types of car from the city center and more cities are
expected to follow its path toward environmental sustainability in the next future.
Furthermore, as e-bikes occupy less space with respect to other transportation modes (i.e. cars
or motorcycles), they would render urban mobility more efficient in an increasingly urbanized
world. In addition, as life expectancy of the population is growing and the 13% is expected to
be over 65 years-old in 2030, e-bikes can help elderly to keep fit and healthy by continuing
cycling, thus limiting governmental expenses for the hospital system. Finally, electric bicycle’s
energy can be produced by renewable sources, thus partially relieving stress from fossil-fuel
usage and dependence.
20
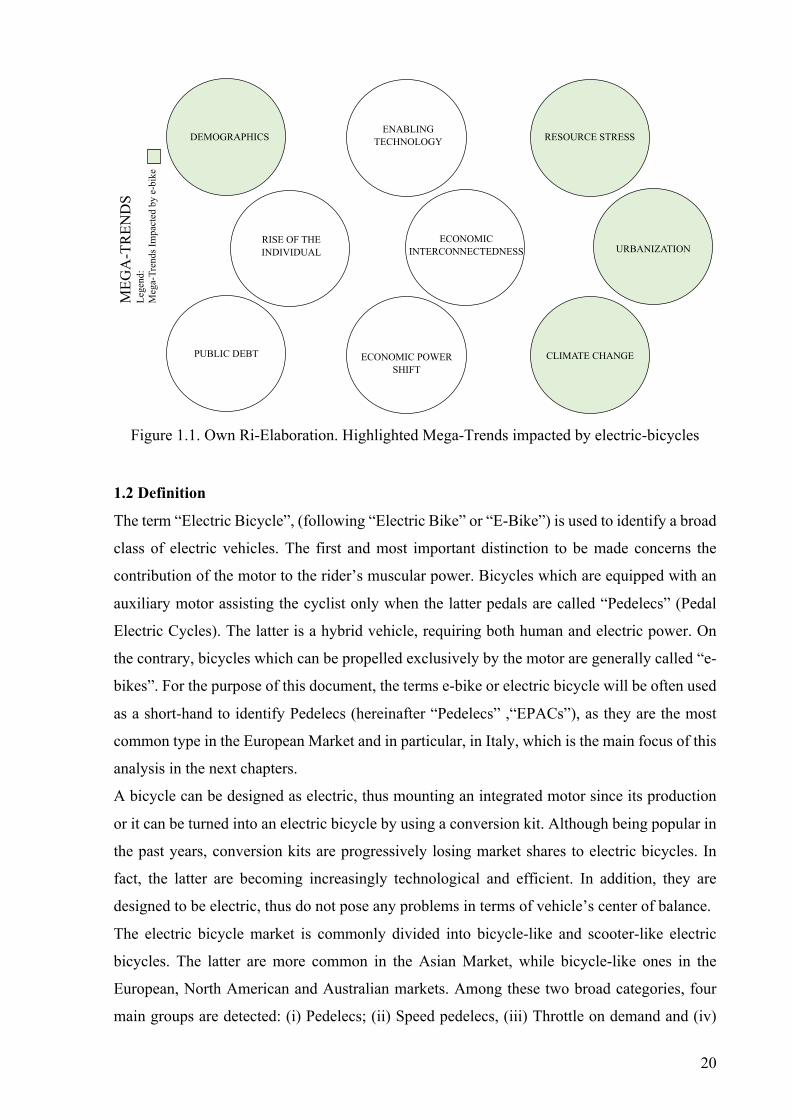
Figure 1.1. Own Ri-Elaboration. Highlighted Mega-Trends impacted by electric-bicycles
1.2 Definition
The term “Electric Bicycle”, (following “Electric Bike” or “E-Bike”) is used to identify a broad
class of electric vehicles. The first and most important distinction to be made concerns the
contribution of the motor to the rider’s muscular power. Bicycles which are equipped with an
auxiliary motor assisting the cyclist only when the latter pedals are called “Pedelecs” (Pedal
Electric Cycles). The latter is a hybrid vehicle, requiring both human and electric power. On
the contrary, bicycles which can be propelled exclusively by the motor are generally called “e-
bikes”. For the purpose of this document, the terms e-bike or electric bicycle will be often used
as a short-hand to identify Pedelecs (hereinafter “Pedelecs” ,“EPACs”), as they are the most
common type in the European Market and in particular, in Italy, which is the main focus of this
analysis in the next chapters.
A bicycle can be designed as electric, thus mounting an integrated motor since its production
or it can be turned into an electric bicycle by using a conversion kit. Although being popular in
the past years, conversion kits are progressively losing market shares to electric bicycles. In
fact, the latter are becoming increasingly technological and efficient. In addition, they are
designed to be electric, thus do not pose any problems in terms of vehicle’s center of balance.
The electric bicycle market is commonly divided into bicycle-like and scooter-like electric
bicycles. The latter are more common in the Asian Market, while bicycle-like ones in the
European, North American and Australian markets. Among these two broad categories, four
main groups are detected: (i) Pedelecs; (ii) Speed pedelecs, (iii) Throttle on demand and (iv)
DEMOGRAPHICS
RISE OF THE INDIVIDUAL
ENABLINGTECHNOLOGY
ECONOMICINTERCONNECTEDNESS
PUBLIC DEBT ECONOMIC POWERSHIFT
CLIMATE CHANGE
RESOURCE STRESS
URBANIZATION
MEG
A-T
REN
DS
Lege
nd:
Meg
a-Tr
ends
Impa
cted
by
e-bi
ke
21
Mopeds. Electric bicycles are faster and require less physical effort than a traditional bicycle,
they are more ecological and lighter than motorcycles, and are easier to park and cheaper than
cars (Xin, 2018).
Electric bikes usage is typically split in two main categories: (i) professional use and (ii)
personal use. The first one comprehends passenger transport, freight transport and provision of
services. (PRO-EBIKE, 2013). The second one is broad and can range from everyday
commuting to sporting activities, both in off-road and road paths, to recreational purposes. In
the personal use category, three main types of e-bikes can be identified, namely the e-mountain-
bike, the e-city bike (which includes also e-bikes used for touring and trekking) and the e-road
bike. (Nigrelli, 2019).
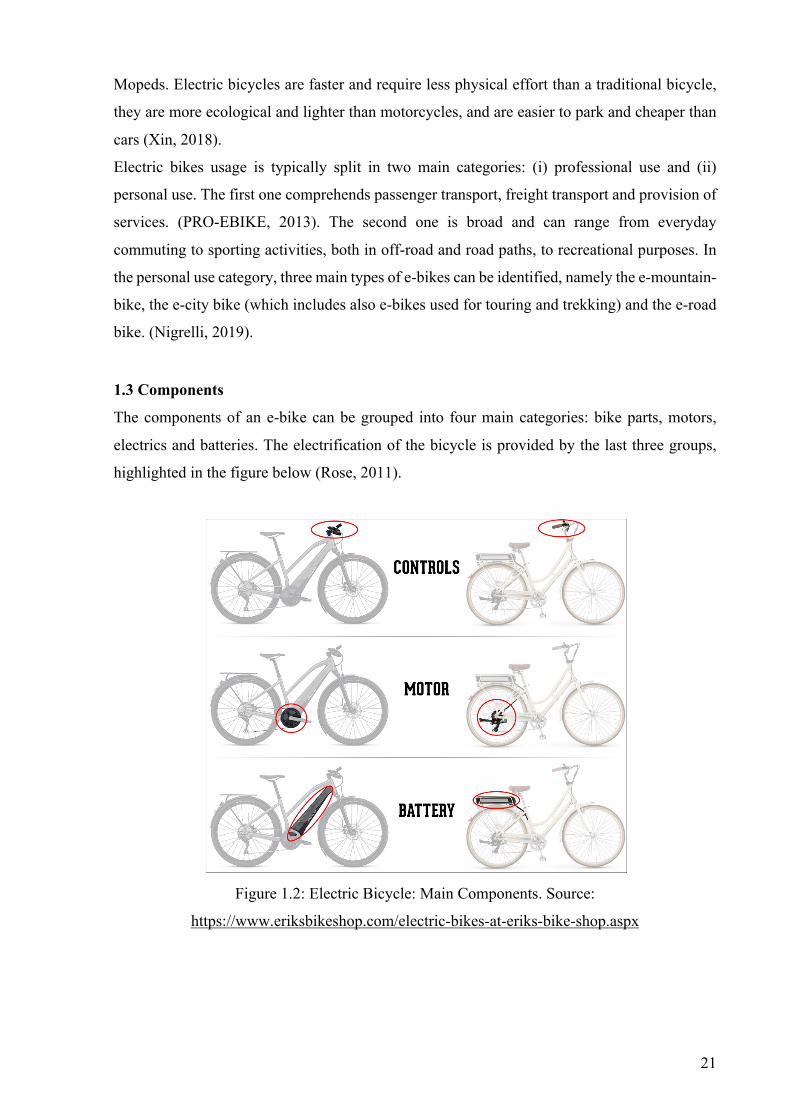
1.3 Components
The components of an e-bike can be grouped into four main categories: bike parts, motors,
electrics and batteries. The electrification of the bicycle is provided by the last three groups,
highlighted in the figure below (Rose, 2011).
Figure 1.2: Electric Bicycle: Main Components. Source:
https://www.eriksbikeshop.com/electric-bikes-at-eriks-bike-shop.aspx
22
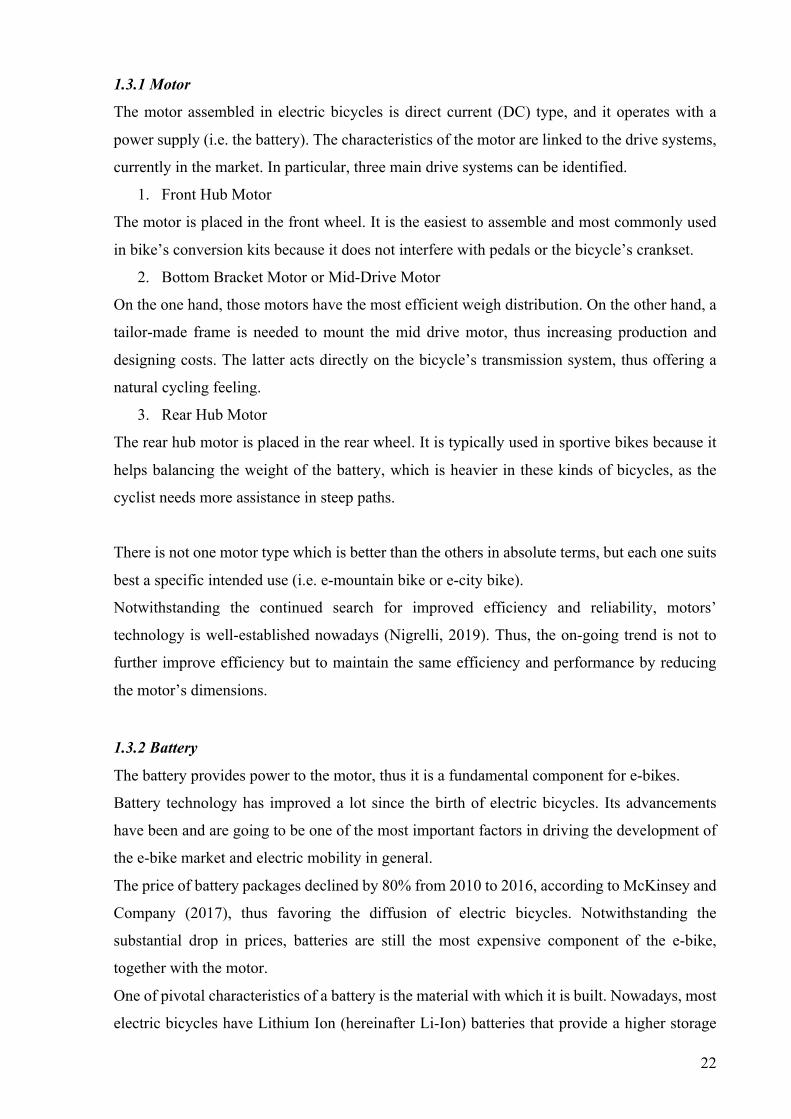
1.3.1 Motor
The motor assembled in electric bicycles is direct current (DC) type, and it operates with a
power supply (i.e. the battery). The characteristics of the motor are linked to the drive systems,
currently in the market. In particular, three main drive systems can be identified.
1. Front Hub Motor
The motor is placed in the front wheel. It is the easiest to assemble and most commonly used
in bike’s conversion kits because it does not interfere with pedals or the bicycle’s crankset.
2. Bottom Bracket Motor or Mid-Drive Motor
On the one hand, those motors have the most efficient weigh distribution. On the other hand, a
tailor-made frame is needed to mount the mid drive motor, thus increasing production and
designing costs. The latter acts directly on the bicycle’s transmission system, thus offering a
natural cycling feeling.
3. Rear Hub Motor
The rear hub motor is placed in the rear wheel. It is typically used in sportive bikes because it
helps balancing the weight of the battery, which is heavier in these kinds of bicycles, as the
cyclist needs more assistance in steep paths.
There is not one motor type which is better than the others in absolute terms, but each one suits
best a specific intended use (i.e. e-mountain bike or e-city bike).
Notwithstanding the continued search for improved efficiency and reliability, motors’
technology is well-established nowadays (Nigrelli, 2019). Thus, the on-going trend is not to
further improve efficiency but to maintain the same efficiency and performance by reducing
the motor’s dimensions.
1.3.2 Battery
The battery provides power to the motor, thus it is a fundamental component for e-bikes.
Battery technology has improved a lot since the birth of electric bicycles. Its advancements
have been and are going to be one of the most important factors in driving the development of
the e-bike market and electric mobility in general.
The price of battery packages declined by 80% from 2010 to 2016, according to McKinsey and
Company (2017), thus favoring the diffusion of electric bicycles. Notwithstanding the
substantial drop in prices, batteries are still the most expensive component of the e-bike,
together with the motor.
One of pivotal characteristics of a battery is the material with which it is built. Nowadays, most
electric bicycles have Lithium Ion (hereinafter Li-Ion) batteries that provide a higher storage

23
capability, higher autonomies and a longer lifespan with respect to the previous standard
material, the Lead Acid. The latter is cheaper and, until a few years ago, was mostly used in the
Chinese market before the Chinese government started regulating the production and disposal
of this material. Lead-acid batteries, despite being cheaper than Li-ion, are heavier, thus
rendering the placement of the battery in the electric bicycle more complicated, as it should not
interfere with the cyclists’ balance.
Trends in battery technology are towards the improvement in battery’s autonomy, the reduction
of charging time and the maintenance of the same autonomy and efficiency in smaller and
lighter batteries.
1.3.3 Electrics Components
The main electric components are sensors, the controller and the display.
A typical electric bicycle has three main sensors: (i) RPM Sensor, which sends a signal to the
controller as soon as the crank set rotates; (ii) Torque Sensor, that measures the strength of the
pressure applied to the pedal to regulate the motor’s assistance; and (iii) Speed Sensor, which
is required by law in Pedelecs to cut off the motor once 25km/h are reached.
The controller is the element connecting the display, the motor, the battery and the sensors
together, thus being the heart of the electric bicycle.
The display’s basic functions are: (i) Switch on or off the system, (ii) Check the battery charge
level and (iii) Choose the assistance level of the motor. Recent technological progresses brought
about new functionalities. For instance, it is possible to check the performance, both in terms
of time and distance travelled, to connect the display with the smartphone and also to easily
connect with the drive-unit’s assistance service.
1.4 History
The first electric bicycle dates back to 1890s. Developments in the e-bike’s technology took
place both in America and in Europe, but in 1895 Ogden Bolton Jr. patented the first electrical
bicycle in the United States of America. It was a battery-powered bicycle without gears and its
hub motor was in the rear-wheel, with the battery inside the main triangle of the frame.
However, technology was not well-developed and for the next thirty years no mass-produced
electric powered bicycle was launched in the market. In 1930s the first mass-production electric
bicycles was firstly sold in The Netherlands.
In 1970s Japanese players with their advanced technology entered in the market and
progressively refined the e-bike’s design.

24
The 1989 was a crucial year for the electric bicycle. The Pedal Assist principle was invented
by the Swiss Michael Kutter. In pedelecs, it was the cyclists’ muscular power that activated the
motor’s assistance through pedals, rather than the direct throttle control (Evan Cycles, 2017).
In 1993, Yamaha developed the first mass-produced pedal assist bicycle with its Power Assist
System (PAS), which was launched in the Japanese market. It was powered by a lead battery
and had an autonomy of 20 kilometers. Nevertheless, Yamaha sold 30,000 units in the first year
of production, three times beyond its expectations. The first pedelecs looked very much like
bicycles and they were targeting older people. Progresses in motor and battery technology in
early 2000s improved significantly the performance of the e-bikes, thus meeting the needs of
urban consumers for motorized transportation, especially in China, where the demand boomed.
In 2009 Bosch joined the market by founding the start-up Bosch eBike Systems. Its innovative
drive system for pedelecs was able to offer for the first time a natural riding experience. Since
then, the world’s e-bike industry has been in a rising path, especially in China and in the
European Union. Thanks to technological developments, nowadays e-bikes are not only
addressed to ageing people but also to sporty people and commuters. In fact, e-mobility in
general is a growing market, targeting people who desire a healthy and environmentally friendly
lifestyle.
1.5 Market Development: The Diffusion of the Electric Bicycle’s Innovation
Everett Rogers (2005) in his book “Diffusion of Innovation”, describes an innovation as “an
idea, practice, or object that is perceived as new by an individual or other units of adoption”
(p.49, 2005) and the diffusion of innovation as “the process by which an innovation is
communicated through certain channels over time among the members of a social system”
(p.41, 2005). The electric bicycle can be identified as an innovation, as by using an electric
motor propelled by a battery, it has redefined the performance and the characteristics of two-
wheeler transportation. It is thus perceived as new by the social system (Ruin, 2014). The
diffusion of innovation’s process involves five different subsequent phases: (i) knowledge, (ii)
persuasion, (iii) decision, (iv) implementation and confirmation (v). In addition, individuals
have heterogeneous rates of innovativeness, meaning that they have different timing in the
adoption of an innovation. As such, if they are plotted in a frequency distribution they approach
a normal distribution and five groups can be identified, namely (i) innovators, who correspond
to the 2.5% of the social system; (ii) early adopters, who are the 13.5%; (iii) early majority and
(iv) late majority, both corresponding to the 34% of the social system; and (v) laggards, who
are the remaining 16% (Rogers, 2005).

25
Figure 1.3. Everett Rogers’ Diffusion of Innovation. Source: Wikipedia
The worldwide market of electric bicycles is growing, but it is geographically heterogeneous.
According to Bloomberg (see Statista, 2017), the world’s e-bike market value in 2016 was 15.7
billion dollars, and it is expected to grow to 24.3 billion in 2025. The Asia-Pacific market is the
largest, with China leading the group since 2000s. Even though China remains the most
important market in terms of sales and production volumes, also the European market has been
increasing in recent years, with more than 2 million Pedelecs sold in 2017 (Conebi, 2018). Two
other important markets are the U.S., where 280,000 units are predicted to be sold in 2024 and
Japan, where 667,240 units were sold in 2018. The rate of adoption of e-bike’s innovation
differs among geographical areas. In the Asian markets, with China and Japan in front, it has
already overtaken the early-adopters’ phase, while in some others such as the U.S. and the
European Union it is still in the early phases of the frequency distribution projected by Rogers
(2005) (i.e. innovators or early adopters).
The heterogeneity of the world market is also due to the differing drivers pushing consumers
demand all over the world. In developing countries, market’s growth is driven by the utilitarian
need of low-cost mobility, while in developed countries e-bikes are mostly seen as a device
which could help overcome mobility problems of an ageing population or, more recently, as a
recreational mean and an environmentally-friendly mode of transportation.
To better understand the e-bike market it follows a more accurate description of some of the
most important markets, with a particular focus on the European one.

26
1.5.1 China
The Chinese electric-bike market has been particularly flourishing and has grown at an
impressive pace during the last two decades. According to Weinert et al. (2007), the number of
electric bicycles in China went from 40,000 units in 1998, to 300,000 units in 2000 and up to
10 million in 2005. In 2019, it is estimated that more than 250 million e-bikes are circulating
in China (Desmond, 2019). Therefore, following Roger’s model, the Chinese market is likely
to be in its late-majority phase of innovation’s diffusion.
Over the years, China has become one of the largest e-bike producers. Chinese electric two-
wheelers manufacturing is a growing, fragmented industrial sector, and the largest e-bike
industry in the world (Zuev 2019). The number of yearly e-bike sales in China is around 30
million units, thus economies of scales have been established in the industry (Xin et al, 2018).
The figure below represents the upsurge of e-bikes sales in China in the last 20 years.
Graph 1.1: Electric Bikes circulating in China. Own ri-elaboration of data,
based on literature review
The reasons of the surge of e-bikes sales in the Chinese market are manifold. Chinese people
see in the e-bikes a fast, comfortable mean of transportation in their cities, where buses are
often crowded, and bicycles are slower and require more physical effort. Demand in China was
also pushed by economic factors, such as increasing gasoline prices, decreasing cost of e-bike
technology and rising income levels of the population. Moreover, because of China’s ongoing
transition towards a developed economy, commuting travel distances between houses and
workplaces increased, leading households to desire a faster and more comfortable traveling
mode.
0
50000
100000
150000
200000
250000
300000
1998 2000 2005 2016 2019
Thou
sand
s
Electric Bikes circulating in China
27
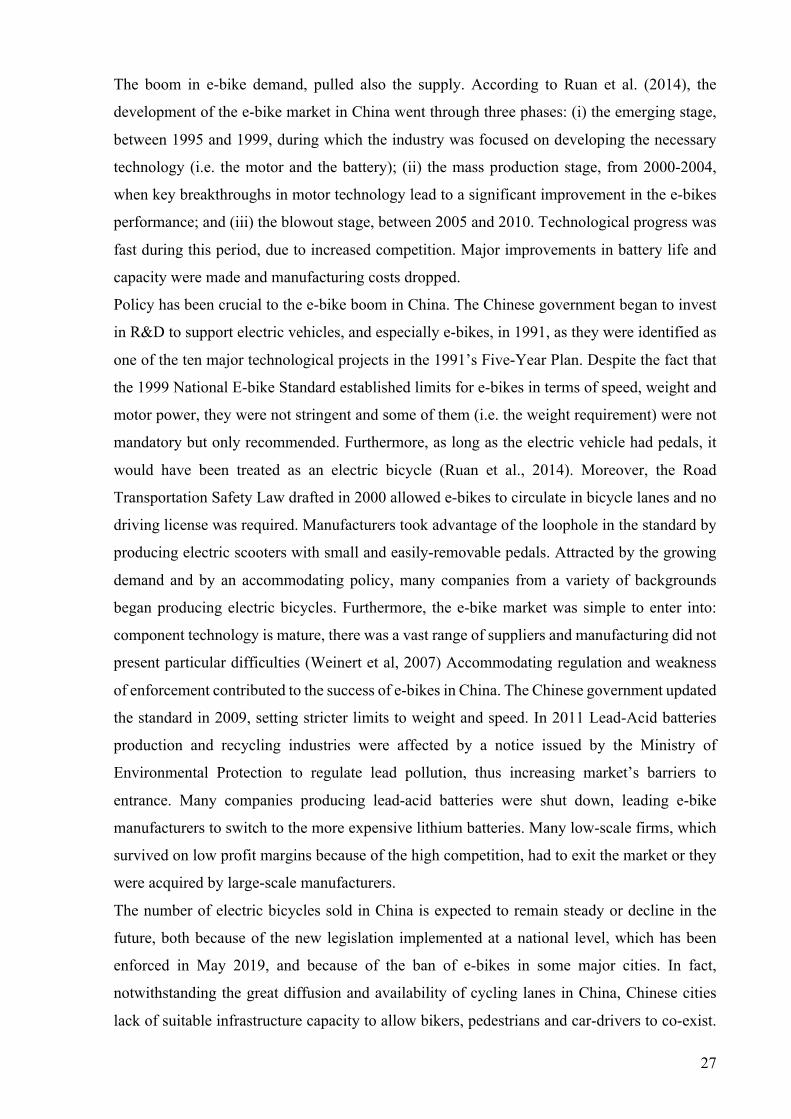
The boom in e-bike demand, pulled also the supply. According to Ruan et al. (2014), the
development of the e-bike market in China went through three phases: (i) the emerging stage,
between 1995 and 1999, during which the industry was focused on developing the necessary
technology (i.e. the motor and the battery); (ii) the mass production stage, from 2000-2004,
when key breakthroughs in motor technology lead to a significant improvement in the e-bikes
performance; and (iii) the blowout stage, between 2005 and 2010. Technological progress was
fast during this period, due to increased competition. Major improvements in battery life and
capacity were made and manufacturing costs dropped.
Policy has been crucial to the e-bike boom in China. The Chinese government began to invest
in R&D to support electric vehicles, and especially e-bikes, in 1991, as they were identified as
one of the ten major technological projects in the 1991’s Five-Year Plan. Despite the fact that
the 1999 National E-bike Standard established limits for e-bikes in terms of speed, weight and
motor power, they were not stringent and some of them (i.e. the weight requirement) were not
mandatory but only recommended. Furthermore, as long as the electric vehicle had pedals, it
would have been treated as an electric bicycle (Ruan et al., 2014). Moreover, the Road
Transportation Safety Law drafted in 2000 allowed e-bikes to circulate in bicycle lanes and no
driving license was required. Manufacturers took advantage of the loophole in the standard by
producing electric scooters with small and easily-removable pedals. Attracted by the growing
demand and by an accommodating policy, many companies from a variety of backgrounds
began producing electric bicycles. Furthermore, the e-bike market was simple to enter into:
component technology is mature, there was a vast range of suppliers and manufacturing did not
present particular difficulties (Weinert et al, 2007) Accommodating regulation and weakness
of enforcement contributed to the success of e-bikes in China. The Chinese government updated
the standard in 2009, setting stricter limits to weight and speed. In 2011 Lead-Acid batteries
production and recycling industries were affected by a notice issued by the Ministry of
Environmental Protection to regulate lead pollution, thus increasing market’s barriers to
entrance. Many companies producing lead-acid batteries were shut down, leading e-bike
manufacturers to switch to the more expensive lithium batteries. Many low-scale firms, which
survived on low profit margins because of the high competition, had to exit the market or they
were acquired by large-scale manufacturers.
The number of electric bicycles sold in China is expected to remain steady or decline in the
future, both because of the new legislation implemented at a national level, which has been
enforced in May 2019, and because of the ban of e-bikes in some major cities. In fact,
notwithstanding the great diffusion and availability of cycling lanes in China, Chinese cities
lack of suitable infrastructure capacity to allow bikers, pedestrians and car-drivers to co-exist.
28
Cars and e-bicycles owners compete for road and parking space and their relationship has
become more and more conflictual over the years (Zuev et al, 2019). Furthermore, electric two-
wheelers create issues for both pedestrians and car drivers, as the e-bike motor is hardly audible.
The e-bike market in China is expected to drop also because of the on-going promotion of
public transport and the growing income-level of Chinese people. High-income individuals are
expected to switch to private cars, as car owners are seen as well-educated and wealthy people,
therefore highly respected from the rest of the population (Xin et al, 2018).
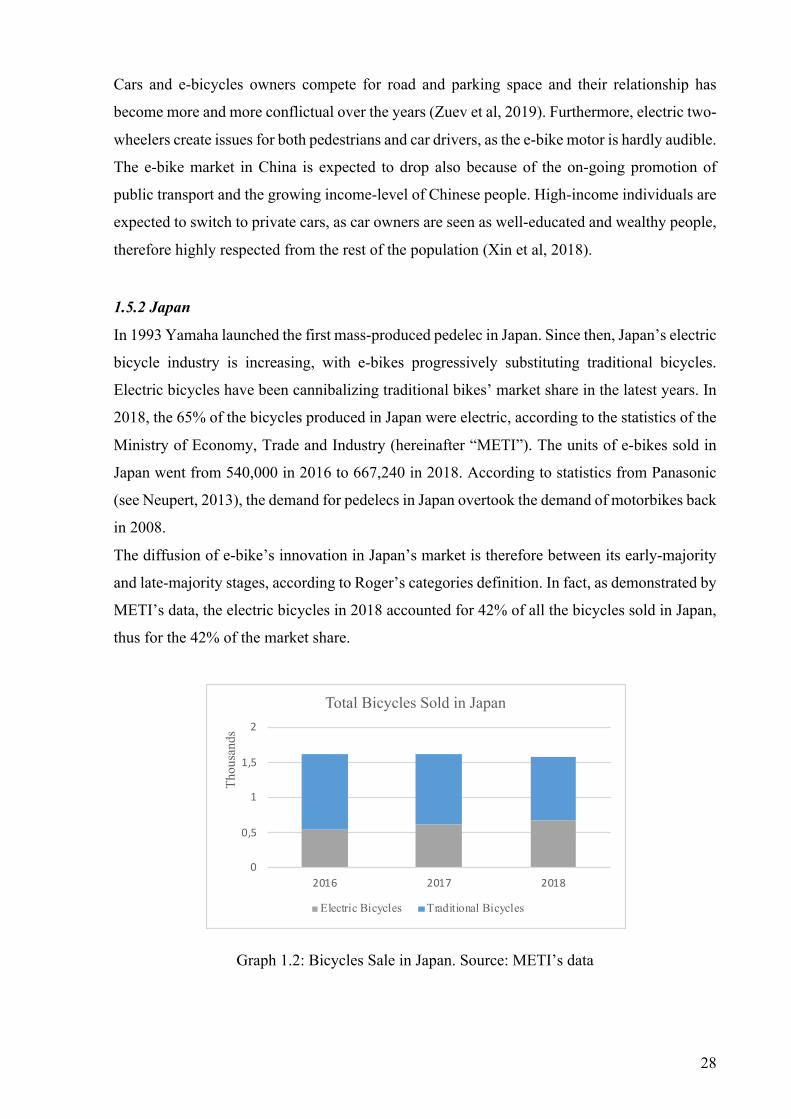
1.5.2 Japan
In 1993 Yamaha launched the first mass-produced pedelec in Japan. Since then, Japan’s electric
bicycle industry is increasing, with e-bikes progressively substituting traditional bicycles.
Electric bicycles have been cannibalizing traditional bikes’ market share in the latest years. In
2018, the 65% of the bicycles produced in Japan were electric, according to the statistics of the
Ministry of Economy, Trade and Industry (hereinafter “METI”). The units of e-bikes sold in
Japan went from 540,000 in 2016 to 667,240 in 2018. According to statistics from Panasonic
(see Neupert, 2013), the demand for pedelecs in Japan overtook the demand of motorbikes back
in 2008.
The diffusion of e-bike’s innovation in Japan’s market is therefore between its early-majority
and late-majority stages, according to Roger’s categories definition. In fact, as demonstrated by
METI’s data, the electric bicycles in 2018 accounted for 42% of all the bicycles sold in Japan,
thus for the 42% of the market share.
Graph 1.2: Bicycles Sale in Japan. Source: METI’s data
0
0,5
1
1,5
2
2016 2017 2018
Thou
sand
s
Total Bicycles Sold in Japan
Electric Bicycles Traditional Bicycles
29
Technology and regulation have been the two driving forces for e-bikes’ diffusion in Japan.
After the revising of road safety regulations and setting rules on the bicycle’s motor in 2008,
the e-bike market in Japan began to grow, as people felt safer than before while riding an electric
bicycle. In order to be classified as a bicycle, the motor is not allowed to exceed the power of
250 watts and the speed of 24 km/h. Moreover, it can only be a hybrid vehicle, thus requiring
both human and motor power to function. In Japan bicycle riders are required to have a driving
license and to register their vehicle (O’Donoghue, 2017).
Electric bicycles turned out to be a perfect mode of transportation in the crowded city centers,
and an easy way for parents to carry their children without any particular physical strain, due
to the hilliness of the Japanese territory. Furthermore, this device is also appealing to older
people looking for a way to keep healthy and fit, thus answering the needs of Japan’s ageing
population.
1.5.3 Europe
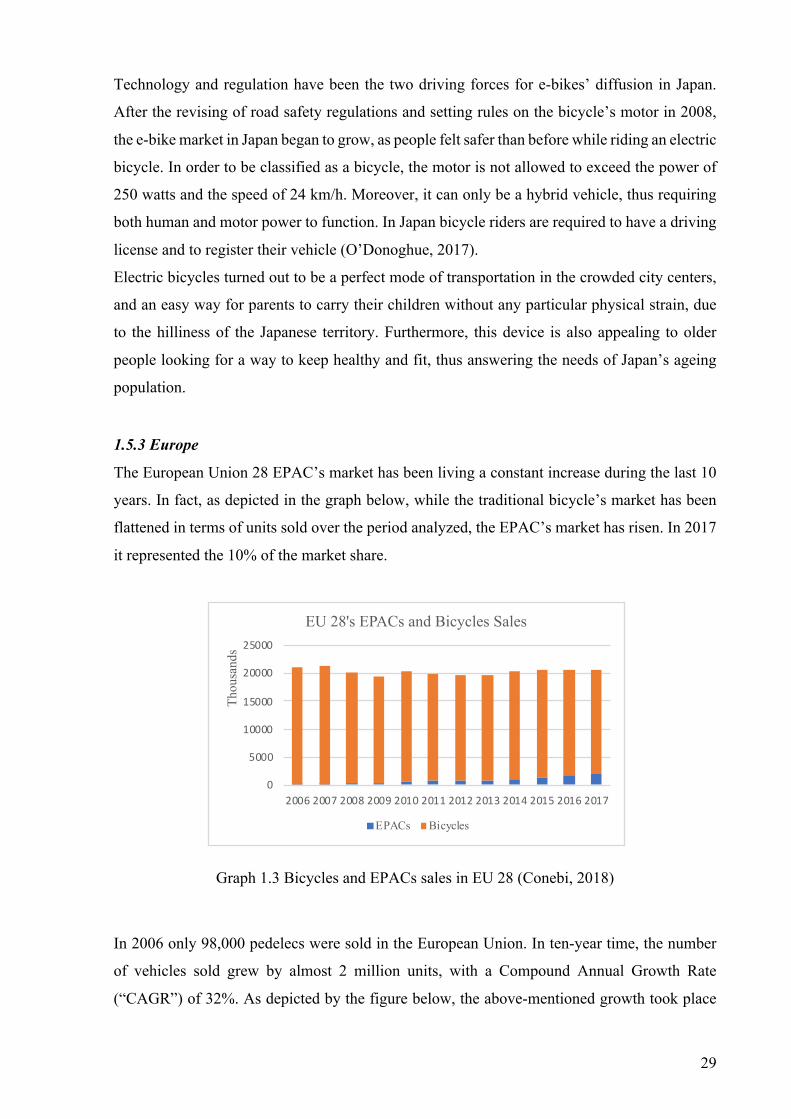
The European Union 28 EPAC’s market has been living a constant increase during the last 10
years. In fact, as depicted in the graph below, while the traditional bicycle’s market has been
flattened in terms of units sold over the period analyzed, the EPAC’s market has risen. In 2017
it represented the 10% of the market share.
Graph 1.3 Bicycles and EPACs sales in EU 28 (Conebi, 2018)
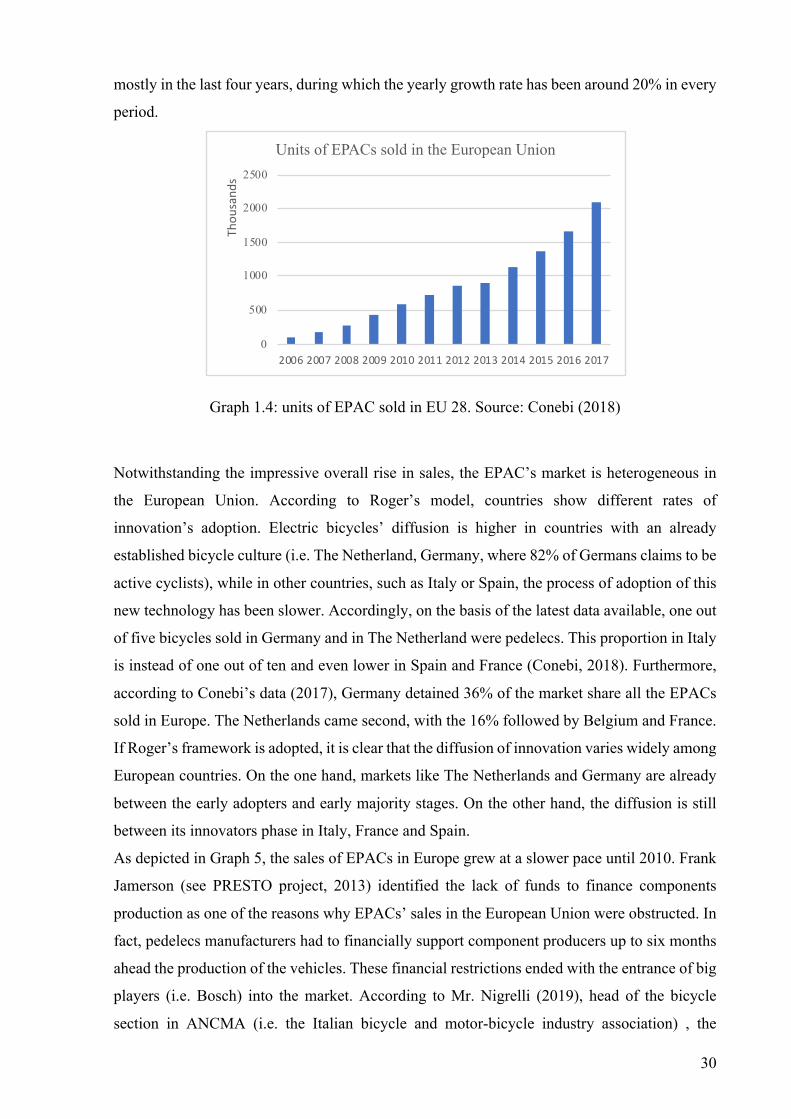
In 2006 only 98,000 pedelecs were sold in the European Union. In ten-year time, the number
of vehicles sold grew by almost 2 million units, with a Compound Annual Growth Rate
(“CAGR”) of 32%. As depicted by the figure below, the above-mentioned growth took place
0
5000
10000
15000
20000
25000
2006 2007 2008 2009 2010 2011 2012 2013 2014 2015 2016 2017
Thou
sand
s
EU 28's EPACs and Bicycles Sales
EPACs Bicycles
30
mostly in the last four years, during which the yearly growth rate has been around 20% in every
period.
Graph 1.4: units of EPAC sold in EU 28. Source: Conebi (2018)
Notwithstanding the impressive overall rise in sales, the EPAC’s market is heterogeneous in
the European Union. According to Roger’s model, countries show different rates of
innovation’s adoption. Electric bicycles’ diffusion is higher in countries with an already
established bicycle culture (i.e. The Netherland, Germany, where 82% of Germans claims to be
active cyclists), while in other countries, such as Italy or Spain, the process of adoption of this
new technology has been slower. Accordingly, on the basis of the latest data available, one out
of five bicycles sold in Germany and in The Netherland were pedelecs. This proportion in Italy
is instead of one out of ten and even lower in Spain and France (Conebi, 2018). Furthermore,
according to Conebi’s data (2017), Germany detained 36% of the market share all the EPACs
sold in Europe. The Netherlands came second, with the 16% followed by Belgium and France.
If Roger’s framework is adopted, it is clear that the diffusion of innovation varies widely among
European countries. On the one hand, markets like The Netherlands and Germany are already
between the early adopters and early majority stages. On the other hand, the diffusion is still
between its innovators phase in Italy, France and Spain.
As depicted in Graph 5, the sales of EPACs in Europe grew at a slower pace until 2010. Frank
Jamerson (see PRESTO project, 2013) identified the lack of funds to finance components
production as one of the reasons why EPACs’ sales in the European Union were obstructed. In
fact, pedelecs manufacturers had to financially support component producers up to six months
ahead the production of the vehicles. These financial restrictions ended with the entrance of big
players (i.e. Bosch) into the market. According to Mr. Nigrelli (2019), head of the bicycle
section in ANCMA (i.e. the Italian bicycle and motor-bicycle industry association) , the
0
500
1000
1500
2000
2500
2006 2007 2008 2009 2010 2011 2012 2013 2014 2015 2016 2017
Thou
sand
s
Units of EPACs sold in the European Union

31
innovation provided by the entrance of Bosch in the market with its start-up Bosch eBike
Systems has been the one of the main drivers for the impressive growth of the e-bike market in
Europe, as it provided a highly-performant drive unit, which perfectly responded to European
citizens’ needs.
Next to the reduction of traditional cycling barriers, one of the main motivations to ride a
pedelec in Europe is environmental protection. In fact, European consumers are becoming
increasingly sensitive to the matter. This increased awareness also lead to the identification of
a new consumer group, the “LoHaS” (i.e. Lifestyle of Health and Sustainability), a neologism
by the American sociologist Paul Ray (see Manthey, 2013), which identifies consumers who
are highly-educated and well-paid and are willing to influence the world throughout their
sustainable behavior.
According to a market research conducted by Shimano Steps in the European market (2018),
which has involved 12,000 participants in 10 European countries, on average the 24% of the
respondents is willing to commute to work by e-bike. Among the top reasons to make the
switch, the interviewed identified the desire to keep fit (34%), willingness to protect the
environment (30%) and to save money (30%). On the opposite, the respondents stated that
possibility of bad weather (37%) and the purchase price (34%) are among the main motivations
not to make the switch.
In the European Union, a common regulation is adopted to define and characterize electric
bicycles. The Directive n. 24 issued on the 18th of March 2002 by the European Parliament and
Council identifies three types of electric bicycles: (i) Pedelecs; (ii) Speed pedelecs; and (iii)
Light Electric Vehicles or Mopeds. Pedelecs are bicycles which are equipped with an assisting
motor providing a maximum power of 250 watts and can reach a speed of up to 25 km/h before
the engine cuts out. Their main advantage is that they are excluded from type approval.
Registration therefore is not required for pedelecs, and the cyclist does not need a driving
license to ride them. Furthermore, they can run on bicycle lanes, as by law, they are considered
bicycles themselves. This rules setting has contributed to the boost of EPAC’s sales. In fact, all
the population, including children, is potentially allowed to ride it, no registration is needed and
therefore there is no mandatory insurance to pay, thus they are cheaper with respect to the other
electric two-wheelers. The harmonized European legislation has made the pedelecs’ adoption
easier both for consumers, who do not have to question the compliance of the e-bike they
purchase with their own country’s laws, and for manufacturers who can potentially target the
whole European market with the same technology without worrying to abide by heterogeneous
regulations. Furthermore, more and more European municipalities are banning fuel-powered
32
cars from city centers, thus creating the need for citizens to find new environmentally-friendly
means of transportation.
1.5.3.1 Italy
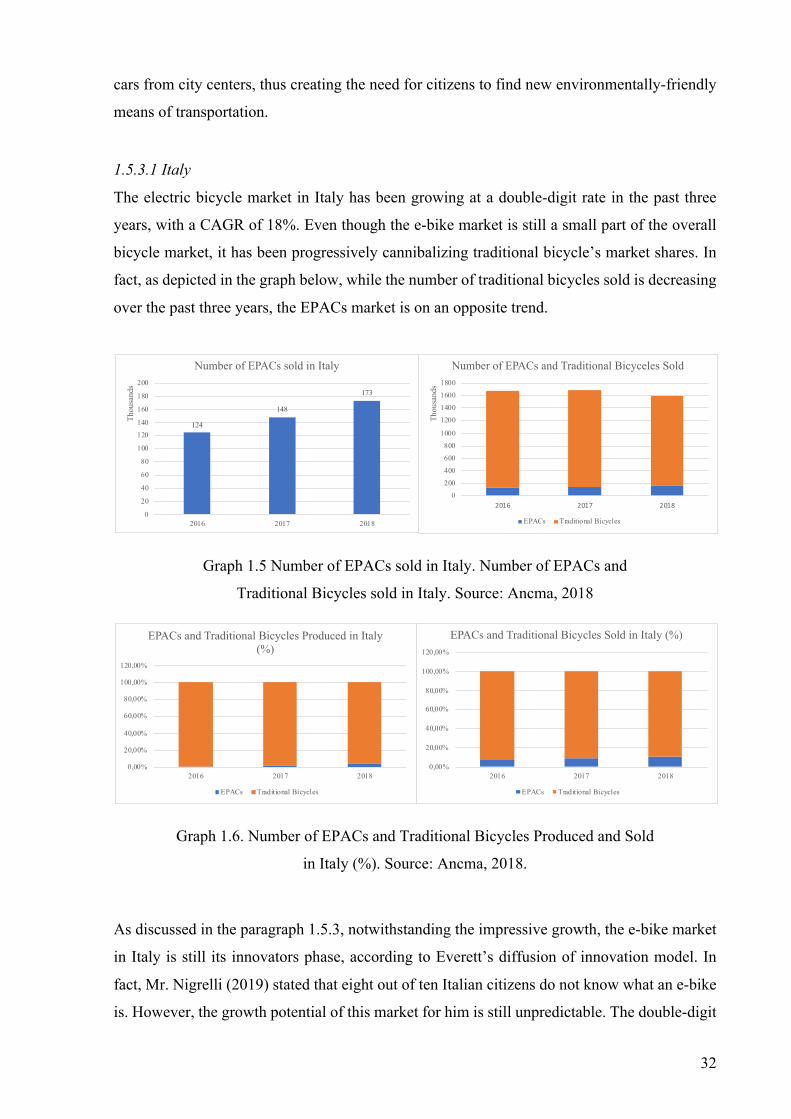
The electric bicycle market in Italy has been growing at a double-digit rate in the past three
years, with a CAGR of 18%. Even though the e-bike market is still a small part of the overall
bicycle market, it has been progressively cannibalizing traditional bicycle’s market shares. In
fact, as depicted in the graph below, while the number of traditional bicycles sold is decreasing
over the past three years, the EPACs market is on an opposite trend.
Graph 1.5 Number of EPACs sold in Italy. Number of EPACs and
Traditional Bicycles sold in Italy. Source: Ancma, 2018
Graph 1.6. Number of EPACs and Traditional Bicycles Produced and Sold
in Italy (%). Source: Ancma, 2018.
As discussed in the paragraph 1.5.3, notwithstanding the impressive growth, the e-bike market
in Italy is still its innovators phase, according to Everett’s diffusion of innovation model. In
fact, Mr. Nigrelli (2019) stated that eight out of ten Italian citizens do not know what an e-bike
is. However, the growth potential of this market for him is still unpredictable. The double-digit
124
148
173
0
20
40
60
80
100
120140
160
180
200
2016 2017 2018
Thou
sand
s
Number of EPACs sold in Italy
0200400600800
1000
1200140016001800
2016 2017 2018
Thou
sand
s
Number of EPACs and Traditional Bicyceles Sold
EPACs Traditional Bicycles
0,00%
20,00%
40,00%
60,00%
80,00%
100,00%
120,00%
2016 2017 2018
EPACs and Traditional Bicycles Sold in Italy (%)
EPACs Traditional Bicycles
0,00%
20,00%
40,00%
60,00%
80,00%
100,00%
120,00%
2016 2017 2018
EPACs and Traditional Bicycles Produced in Italy (%)
EPACs Traditional Bicycles

33
growth would probably stop in the future, but it is not yet possible to estimate when. A study
by Shimano Steps (2019) revealed that 33% of Italians are willing to switch to e-bike for their
everyday commuting.
The reasons of the rise are manifold. On one side, bans of conventionally-fueled cars are
becoming more and more frequent in Italian cities centers, and at the same time the Italian
government is taxing citizens purchasing polluting vehicles. Furthermore, some Italian cities
are offering their inhabitants incentives to purchase a pedelec (i.e. Vicenza or Bologna). Those
legal barriers and incentives would positively affect EPACs sales in the next future. On the
other side, as mentioned in paragraph 1.4.4, people are increasingly looking for healthy and
sustainable lifestyles, thus rendering e-bikes an interesting transportation tool. Moreover,
pedelecs are attractive for people’s recreation. In fact, thanks to the assistance provided by the
motor, a broader portion of the population can undertake a long cycling distance or climb
ascents they could not before because of the too demanding physical effort. These facts are
demonstrated by the data provided by Mr. Nigrelli (2019): in Italy, the 55% of the e-bikes sold
are e-mountain bikes, the 43% are e-city bikes and 2% are e-road bikes. The fun-segment has
thus the highest market share.
Graph 1.7. EPACs sold in Italy (bicycle type). Source: Interview with Mr.
Nigrelli (2019)
1.5.4 United States of America
According to Roger’s model on the diffusion of innovation, in the U.S., electric bicycles are
still between the innovators and early-adopters phase. According to Bloomberg (see Statista,
2017), only 17% of American citizens knew what an e-bike was in 2017. In particular, the
results of a survey conducted by Statista (2017) only 11% of women and 24% of men claimed
to be aware of what an e-bike was. Around 30% of both genders have heard about it but cannot
55%
2%
43%
EPACs sold in Italy (type, %)
E-Mountain Bike E-Road Bike E-City Bike
34
give a precise definition of the vehicle and 62% of females and 41% of males do not know what
it is.
During 2016, 150,000 units were sold in the U.S., but this number is predicted to surge in the
next few years reaching 280,000 units in 2024. In fact, according to NPD group (2018) the e-
bike segment is the fastest growing one in the U.S.’s bicycle industry and was worth 143 million
dollars in 2018, up by 78% with respect to the previous year. Among the Americans who
intended to purchase a bicycle in 2017, the 10% of them declared it would be an e-bike (Statista,
2017). Nowadays, the 10% of all the bicycles sold in the U.S. are electric bicycle and according
to Trek’s President, John Burke, this percentage could grow up to 30%. The U.S. market has
therefore an impressive growth potential.
Electric bicycle users are rising in North America. There are many motives behind the growth
in e-bike usage, which vary across users-groups. According to a survey among e-bike owners
conducted by the National Institute of Transportation and Community (2018), the primary
reasons why early-adopters decided to buy an electric bicycle are mostly related to the
overcome of some barriers which typically deter individuals from riding a traditional bicycle,
such as physical effort and challenging topography. Early-adopters are typically older adults,
are better educated and have a relatively high income (Ling, Z. et al, 2017). Furthermore, the
latter are motivated by health, fitness and recreational reasons. Millennials and Generation X
purchase intentions instead are driven by the desire to replace car trips, thus using a more
environmental-friendly mean of transportation and to make commuting quicker, easier and
cheaper. The above-mentioned survey’s results indicate that e-bikes have the potential to
expand the user groups, thus replacing other modes of transportation (i.e. private cars or public
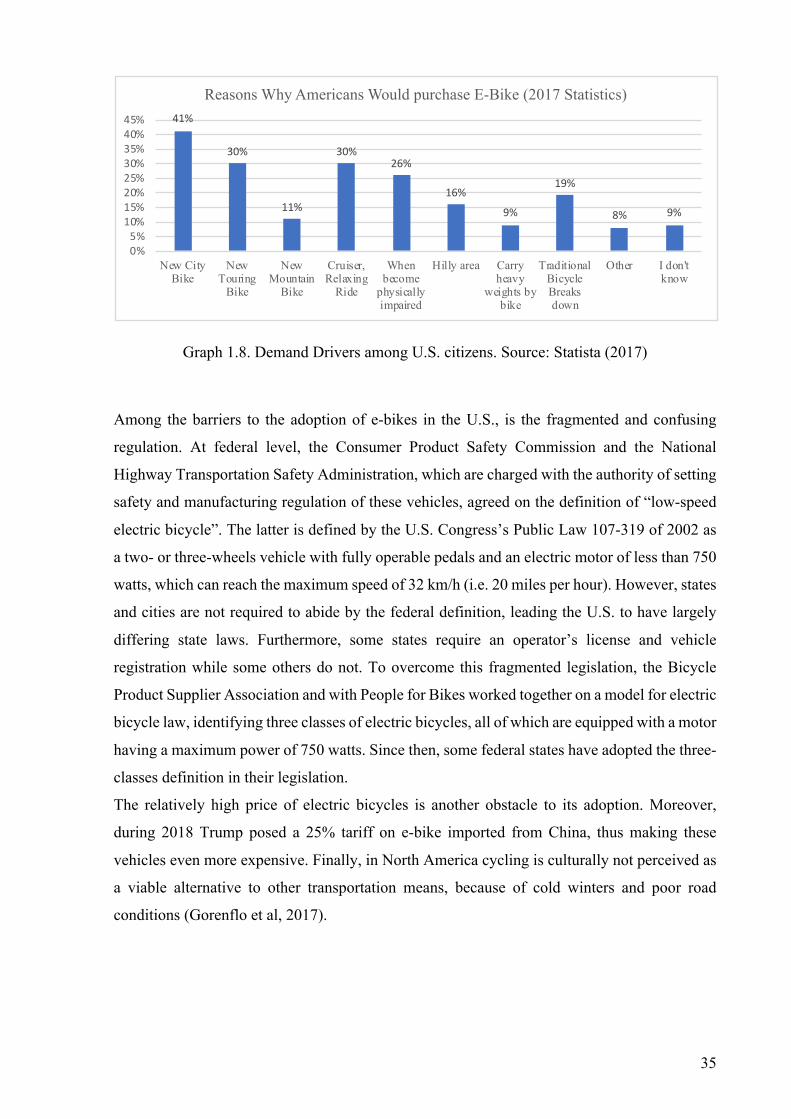
transport) commonly used for recreational or utilitarian trips. As depicted in the graph below,
the 41% of the respondent to a Statista survey (2017) declared that they would consider
purchasing an e-bike when they would need a new city-bike, for everyday rides., while the 26%
showed the intention to switch to an electric bicycle when they would not be able to ride
anymore with their bicycle with their own effort. Furthermore, some respondent declared to
feel safer while riding an e-bike with respect to riding a traditional bicycle.
35
Graph 1.8. Demand Drivers among U.S. citizens. Source: Statista (2017)
Among the barriers to the adoption of e-bikes in the U.S., is the fragmented and confusing
regulation. At federal level, the Consumer Product Safety Commission and the National
Highway Transportation Safety Administration, which are charged with the authority of setting
safety and manufacturing regulation of these vehicles, agreed on the definition of “low-speed
electric bicycle”. The latter is defined by the U.S. Congress’s Public Law 107-319 of 2002 as
a two- or three-wheels vehicle with fully operable pedals and an electric motor of less than 750
watts, which can reach the maximum speed of 32 km/h (i.e. 20 miles per hour). However, states
and cities are not required to abide by the federal definition, leading the U.S. to have largely
differing state laws. Furthermore, some states require an operator’s license and vehicle
registration while some others do not. To overcome this fragmented legislation, the Bicycle
Product Supplier Association and with People for Bikes worked together on a model for electric
bicycle law, identifying three classes of electric bicycles, all of which are equipped with a motor
having a maximum power of 750 watts. Since then, some federal states have adopted the three-
classes definition in their legislation.
The relatively high price of electric bicycles is another obstacle to its adoption. Moreover,
during 2018 Trump posed a 25% tariff on e-bike imported from China, thus making these
vehicles even more expensive. Finally, in North America cycling is culturally not perceived as
a viable alternative to other transportation means, because of cold winters and poor road
conditions (Gorenflo et al, 2017).
41%
30%
11%
30%26%
16%9%
19%
8% 9%
0%5%10%15%20%25%30%35%40%45%
New CityBike
NewTouring
Bike
NewMountain
Bike
Cruiser,Relaxing
Ride
Whenbecome
physicallyimpaired
Hilly area Carryheavy
weights bybike
TraditionalBicycleBreaksdown
Other I don'tknow
Reasons Why Americans Would purchase E-Bike (2017 Statistics)
36
1.6 Electric Bicycle Industry: Strengths, Weaknesses, Opportunities and Threats
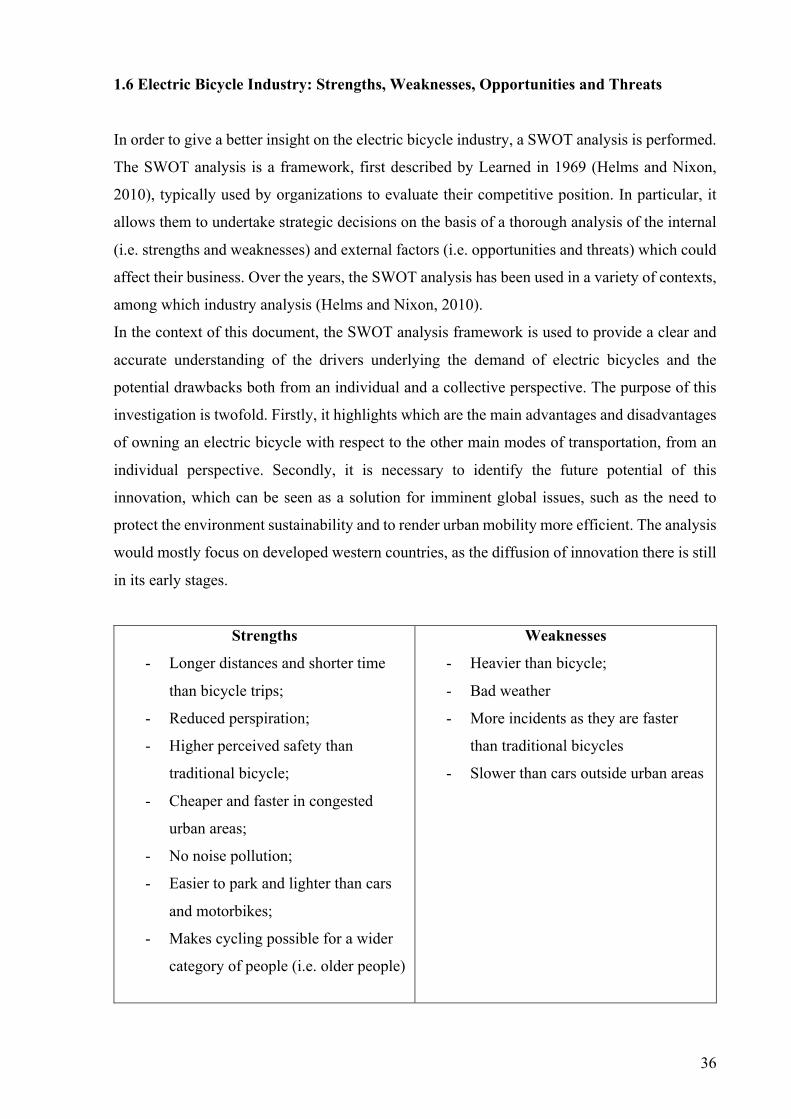
In order to give a better insight on the electric bicycle industry, a SWOT analysis is performed.
The SWOT analysis is a framework, first described by Learned in 1969 (Helms and Nixon,
2010), typically used by organizations to evaluate their competitive position. In particular, it
allows them to undertake strategic decisions on the basis of a thorough analysis of the internal
(i.e. strengths and weaknesses) and external factors (i.e. opportunities and threats) which could
affect their business. Over the years, the SWOT analysis has been used in a variety of contexts,
among which industry analysis (Helms and Nixon, 2010).
In the context of this document, the SWOT analysis framework is used to provide a clear and
accurate understanding of the drivers underlying the demand of electric bicycles and the
potential drawbacks both from an individual and a collective perspective. The purpose of this
investigation is twofold. Firstly, it highlights which are the main advantages and disadvantages
of owning an electric bicycle with respect to the other main modes of transportation, from an
individual perspective. Secondly, it is necessary to identify the future potential of this
innovation, which can be seen as a solution for imminent global issues, such as the need to
protect the environment sustainability and to render urban mobility more efficient. The analysis
would mostly focus on developed western countries, as the diffusion of innovation there is still
in its early stages.
Strengths
- Longer distances and shorter time
than bicycle trips;
- Reduced perspiration;
- Higher perceived safety than
traditional bicycle;
- Cheaper and faster in congested
urban areas;
- No noise pollution;
- Easier to park and lighter than cars
and motorbikes;
- Makes cycling possible for a wider
category of people (i.e. older people)
Weaknesses
- Heavier than bicycle;
- Bad weather
- More incidents as they are faster
than traditional bicycles
- Slower than cars outside urban areas

37
Opportunities
- Increased adoption of e-bikes
because of motorized vehicles bans
in city centers;
- More efficient urban mobility;
- Cycle-tourism;
- Improvement of Public Health
Threats
- Changes in regulation which could
hamper the adoption of e-bikes;
- Environmental concerns for battery
disposal
- Lack of infrastructure
Table 1.1: SWOT Analysis Summary. Own elaboration on the basis of literature review
1.6.1 Strengths
The use of electric bicycle has many advantages both when compared with car and motorbike
trips or traditional bicycle rides.
With respect to traditional bicycles, the e-bike can overtake many of the perceived barriers to
cycling. In fact, the engine assistance reduces the physical strain required to cycle, particularly
in hilliness topographies and allows riders to cover a longer distance than traditional bicycles,
in a shorter time. As most of the passenger trips (i.e. 50- 60%) in China, in Europe and in North
America are shorter than 8 kilometers (Mc. Kinsey, 2019), electric bicycles can be a solution
for this range of mobility. Moreover, commuting to the workplace with an electric bicycle
reduces the risk of perspiration, thus it avoids having to change clothes once the workplace is
reached. Furthermore, carrying loads with an e-bike is much easier when compared with a
traditional bicycle. In addition, thanks to the electric assistance, the e-bike allows also older
people to ride a bike easily, thus increasing their cycling lifespan. All these advantages of the
electric bike, in comparison with traditional bicycles have the potential to widen the customer
base, in particular in the commuting segment.
According to a survey conducted among U.S. citizens (2018), people feel safer while riding an
e-bike with respect to traditional bicycles. In fact, the e-bike allows them to keep the pace with

38
traffic, to avoid utilizing dangerous street as they are able to take longer routes without any
additional effort and to accelerate quickly when going through wide intersections.
Compared to car and motorbikes, electrically-assisted bicycles are often faster in congested
urban areas. Additionally, they are cheaper, both in terms of purchase price and of fuel costs.
Yet, it is easier to find a place to park them.
Finally, as concerns about environmental protection grow among the population, electric
bicycles do not produce any noise pollution and emit considerably less CO2 with respect to
traditionally-fueled vehicles. In fact, according to a survey conducted by Shimano Steps, the
30% of the respondent declared that they are willing to switch to electric bicycles in order to
protect the environment. Specifically, an e-bike, on average, emits 5,2 grams of CO2 per
kilometers, per person, compared to the 124-200 grams on average emitted by a car (Bosch
eBike Systems, 2018).
1.6.2 Weaknesses
When compared to cars or motorbikes, e-bikes are slower outside urban areas and are not
suitable for very long trips, as their battery autonomy is limited. Furthermore, the climate might
affect people’s decision to commute by e-bike. Frequent rain, bad weather and cold outside
temperatures are all obstacles to e-bike adoption.
A flaw of electric bicycles, when compared to traditional ones is the weight. In fact, the drive
unit of e-bikes increases the overall weight of the vehicle and, depending on where the battery
pack is placed, it might alter the center of balance, thus increasing the risk of falling both when
riding and when mounting or dismounting the bike (Johnson, M., Rose G., 2015). According
to Mr. Borgonovo (2019), project manager for Pedelecs at Atala S.P.A., most cyclists are not
aware of the importance of the electric bicycle setting before they ride, thus increasing risks of
accidents if the retailer does not set the bicycle as best suits them. Moreover, as e-bikes are
faster than traditional bicycles thus they are likely to be involved in more road accidents. For
instance, in 2018 in Switzerland 5 e-bike riders died in the consequences of a road accident,
and 309 have been seriously injured, with an increase by 39% with respect to the previous year.
This trend involves also other countries. For example, in the Netherlands there were 38
casualties among e-bike riders. Furthermore, the accidents rate is higher among older people.
In fact, e-bikes are heavier, thus more difficult to control than traditional bicycles, when facing
a potential accident situation. Moreover, older people have slower reaction times.
39
1.6.3 Opportunities
1.6.3.1 Reduction of Motorized Means of Transportation and Urban Mobility Solution
One of the major opportunities that electric bicycles provide to social systems is the chance to
switch from motorized to non-motorized modes of transportation. In particular, the e-bike is
more likely to substitute motorized transportation than traditional bicycles as it reduces both
the physical strain and travelling times (Kroesen, 2017). This potential is larger in car-
dominated countries, such as Australia and the U.S., where surveys conducted among e-bike
owners highlighted that 60-65% of the respondents identified the reduction of car trips as one
of the main motivations to purchase an electric bicycle (MacArthur et al., 2014; Johnson and
Rose, 2013).
Moreover, some countries, and in particular the European Union, are actively contrasting the
use of conventionally-fueled cars in city centers. In fact, the European Union’s general road
and transport policy framework has set the goal to eliminate all conventionally-fueled cars in
cities by 2050 (Ricardo AEA, 2015). Furthermore, among the priorities set in EU’s funding
program for research and innovation “Horizon 2020”, and specifically, among the “Societal
Challenges”, the EU has set goals toward a “Smart, green and Integrated Transport”. Under this
thematic, the “Resource efficient transport that respect the environment” and the “Better
mobility, less congestion, more safety and security” objectives are opportunities to enhance and
promote the adoption of electric bicycles in the European Union, thus stimulating demand.
According to the United Nations (2018), nowadays 55% of the world population is living in
urban areas. This percentage is expected to grow to 68% by 2050, with peaks of 90% in Asia
and Africa. Urbanized areas would therefore become more and more populated, posing great
challenges to urban mobility. Electric bicycles can be a solution for this kind of problem. In
fact, as previously mentioned, they occupy less space than cars and motorcycles. As such, they
have the potential to improve urban mobility by limiting traffic jams and reducing the necessary
space for parking.
As stated in the paragraph above, e-bikes can reduce CO2 emissions, as they do not emit any
particulate while ridden, save resources and reduce traffic congestions. In fact, according to
Cairns et al (2017), transport policy makers are interested in how electric bicycles could help
to switch people away from more polluting modes of transportation, thus reducing local air
pollution and greenhouse gas emissions. For these reasons, some countries, among which The
Netherlands, Italy, Belgium and Austria, are trying to stimulate bicycle, and pedelecs sales in
general by providing fiscal incentives for citizens willing to buy a new two-wheeler vehicle.
Furthermore, e-bikes could be used for professional reasons in city centers. In fact, home-
40
delivery is becoming fashionable again and some services such as the post or packages shipping
could be provided through sustainable modes of transportation.
1.6.3.2 Others: Tourism and Public Health
Electric bicycles contribute to sustainable tourism. Some tourists enjoy exploring the region
they are visiting by bike. Electric bicycle allows longer trips than traditional ones. In fact,
thanks to improvements in battery’s technology, battery autonomy has increased a lot in recent
years, reaching the level of 100 kilometers1. In addition, cycle-tourism is crucial to increase
people’s awareness of pedelecs, thus being an effective promotion mean. According to a report
produced for a project of the European Union (2013), most people have their first contact with
pedelecs during a holiday. Once they tried the vehicle, a purchase interest might start to grow.
Furthermore, among the variety of products available (i.e. e-mountain bike, e-city bike, e-road),
e-mountain bikes give the chance to young and sporty people to face heavier and curvier paths
that would have been difficult to ascend without the motor assistance, thus potentially widening
the customer base.
For what concerns contribution to public health, electric bicycles have been found to have
positive effects on the fitness level of regular users, thus reducing the risk of overweight. In
addition, a Swiss Study (2006) demonstrated that e-bikes help the prevention of cardiovascular
diseases, hypertension. As such, e-bikes also contribute to reduce the overall cost of the health
system for countries.
1.6.4 Threats
1.6.4.1 Lack of Suitable Infrastructure
External factors might influence the adoption of electric bicycles. First of all, lack of suitable
infrastructure for cyclists, such as bicycle paths or lanes could affect consumers’ decision to
purchase electric bicycles. In fact, individuals’ perception of safety is dependent on the quality
of the infrastructure available. If there are no bicycle paths or lanes people would feel unsafe
riding, therefore they would decide to use other means of transportation (Heinen et al, 2009).
In addition to bicycle lanes, also bicycle parking spaces are crucial in the consumers’ decision
to commute. The effect of the lack of safe parking facilities is twofold. If the parking space is
1Bosch eBike System provides users with a way of self-calculating their battery autonomy https://www.bosch-ebike.com/en/service/range-assistant/
41
found to be too close to car’s parking, riders might feel unsafe. Moreover, the lack of proper
parking facilities increases the risk of theft.
1.6.4.2 Other
One of the most debated aspects of e-bikes concerns the production and disposal of their
batteries. In the past, lead acid batteries have been found to have negatively affected the
environment and public health, especially in China, where e-bikes had the major success
(Cherry et al, 2009). Nowadays Lithium-Ion is used in the vast majority of batteries and has
both environmental and performance benefits over lead acid. Furthermore, countries began to
regulate the production and the disposal of the batteries in order to protect the environment. For
example, in 2006, the European Union has prohibited the disposal of batteries in landfills or by
incineration and stated that all electric bicycles have to be recycled. People’s environmental
concerns over batteries disposal might lead to a decrease in e-bikes’ sales.
In addition, changes in regulation could have an impact on the adoption of e-bikes. For instance,
if pedelecs would not be allowed to ride on bicycles lanes or would require a driving license
and registration, sales would probably drop in Europe. Furthermore, some cities in China and
in the U.S., such as New York City, have banned e-bikes from cities’ centers, as they are
considered dangerous for other vehicles’ drivers or pedestrians. In fact, e-bikes ride too fast,
and people riding them are usually older, with weaker reflexes and reaction times.
1.6.5 SWOT analysis: Conclusions
To sum up, the electric bicycle market is quite appealing on the demand side, as it has
tremendous possibilities of enlarging its customer base, especially in the countries where the
diffusion of innovation is only at its early stages (i.e. European Union and the U.S.). Potential
users include every-day commuters who could be willing to reduce their motorized trips, older
people who desire to keep healthy and fit but are not able to ride a bicycle anymore because of
the higher physical strain required, and professional groups who might need to travel a lot on
short distances. Furthermore, more and more policies and campaigns in favor of sustainable
mobility and environmentally friendly modes of transportation are being conducted by
governments around the world, thus helping to increase the awareness of this technology among
consumers.
Given its great potential on the demand side, a lot of companies coming from different
backgrounds are entering or are planning to enter in the market. As such, in the next section the

42
industry analysis of the pedelecs industry is performed in order to assess its overall
attractiveness and state of the art.

43
2. Pedelecs Industry Analysis
The focus of this chapter is on pedelec’s market as it is the most common e-bike’s type in the
European Union, and, in particular in Italy, which is the target of the investigation of the next
chapters. In fact, the majority of the players interviewed for the purpose of analyzing Italian
electric bicycle market’s status quo, are engaged in the production of pedelecs only. The main
goal is to assess the attractiveness of the pedelecs industry by using three of the most common
strategic analysis’ frameworks, namely (i) Industry and Market Segmentation; (ii) Value Chain
Analysis and (iii) Porter’s Five Forces analysis.
2.1 Market Segmentation: A Comparison between Pedelecs and Traditional Bicycles
The aim of this section is to compare the pedelec’s and the traditional bicycle’s markets, in
order to gain a better understanding of these markets’ dynamics, and to assess whether the
electrification of the bicycle has opened the way to the definition of new market segments.
2.1.1 Industry and Market Segmentation: Framework definition and purposes
Porter (p. 231, 2005) stated that “industry segmentation is the division of an industry into sub-
units, for the purpose of developing competitive strategy”. In fact, industries are heterogeneous,
meaning that each of their segments might have different grades of attractiveness.
Industry segments are identified either on the basis of structural differences or value chain
differences. On the one hand, structural differences are defined as variations in products or
buyers which alter one of the five Porter’s forces, namely (i) Threat of Entry; (ii) The Power of
Suppliers; (iii) The Power of Buyers; (iv) Threat of Substitutes or; (v) Industry Rivalry. On the
other hand, value chain differences are used to identify industry segments when they determine
a variation in the criteria to be met in order to obtain competitive advantage among different
product varieties or buyers. In particular, differences which: (i) lead to a variation in cost drivers
or peculiarity of the firm’s value chain; (ii) modify the arrangement of a firm’s value chain; or
(iii) involve differences in the buyers value chain, lead to the definition of different segments
(Porter, 1985). Segmentation variables can be categorized into four classes, specifically (i)
product variety, (ii) buyer type; (iii) distribution channels and (iv) geographic buyer location.
Differentiation criteria can be detected for each of the afore-mentioned classes. For instance,
price level and performance are two criteria pertaining to the product variety’s class, while
localities and weather zones criteria pertains to the geographic buyer location’s one. To sum
44
up, industry segmentation is important in order to comprehend the peculiar key success factors
of each segment and to have an understanding of the elements which guarantee a competitive
advantage within each segment (Porter, 1985).
Market segmentation is a part of the broader concept of industry segmentation and it is crucial
in order to provide a clear understanding of an industry. It is defined as “the process of splitting
customers, or potential customers, within a market into different groups, or segments”
(MacDonald, Dunbar, p.9, 2012). Companies undertake this analysis in order to establish
differences in customers’ needs and behaviors, thus allowing them to focus their efforts only
into market segments in which they can exploit their own key success factors (Porter, 1985).
The pre-condition of market segmentation is the possibility to group heterogenous customers
into homogeneous clusters (McDonald and Jenkins, 1995). Like in industry segmentation, also
a market can be segmented in manifold ways, the most common being: (i) Technology; (ii)
Product; (iii) Application; (iv) Channel; (v) Geography and (vi) Customers.
2.1.2 Industry Segmentation: Application to the Bicycle Industry
The bicycle industry can be segmented in various ways. For the purpose of this document, the
segmentation into pedelecs and traditional bicycles is the most relevant one. In fact, according
to the value chain segmentation theory presented above, pedelecs and traditional bicycles are
two distinct segments. In particular, the electrification of the bicycle has altered the value chain
of the traditional bicycle by adding three groups of components to the typical configuration of
the product, which have already been presented in chapter 1 (i.e. the motor, the battery and the
electric components). Product varieties’ differences affect the drivers of cost in the firm’s value
chain, as battery’s and motor’s technology are quite expensive. Furthermore, mounting the
motor into the bicycle and connecting it with the other mechanical components has required a
re-configuration of firms’ assembly lines. Pedelecs and traditional bicycles can be detected as
separate segments also when structural segmentation theory is applied. In particular, pedelecs
original equipment manufacturers (hereinafter “OEMs”) have to interface, among all, not only
with traditional mechanical components manufacturers but also with drive units’ producers.
Another important classification to be made in the bicycle industry is the difference between
standard bicycles and premium bicycles. In fact, both the material used, and the key success
factors required to gain and maintain a competitive advantage in these two segments vary. For
instance, while the quality of the frame’s material and the brand awareness are two pivotal
factors for the premium segment, this is not the case when considering the standard segment.
In fact, consumers in the standard segments are more concerned about the reliability and the
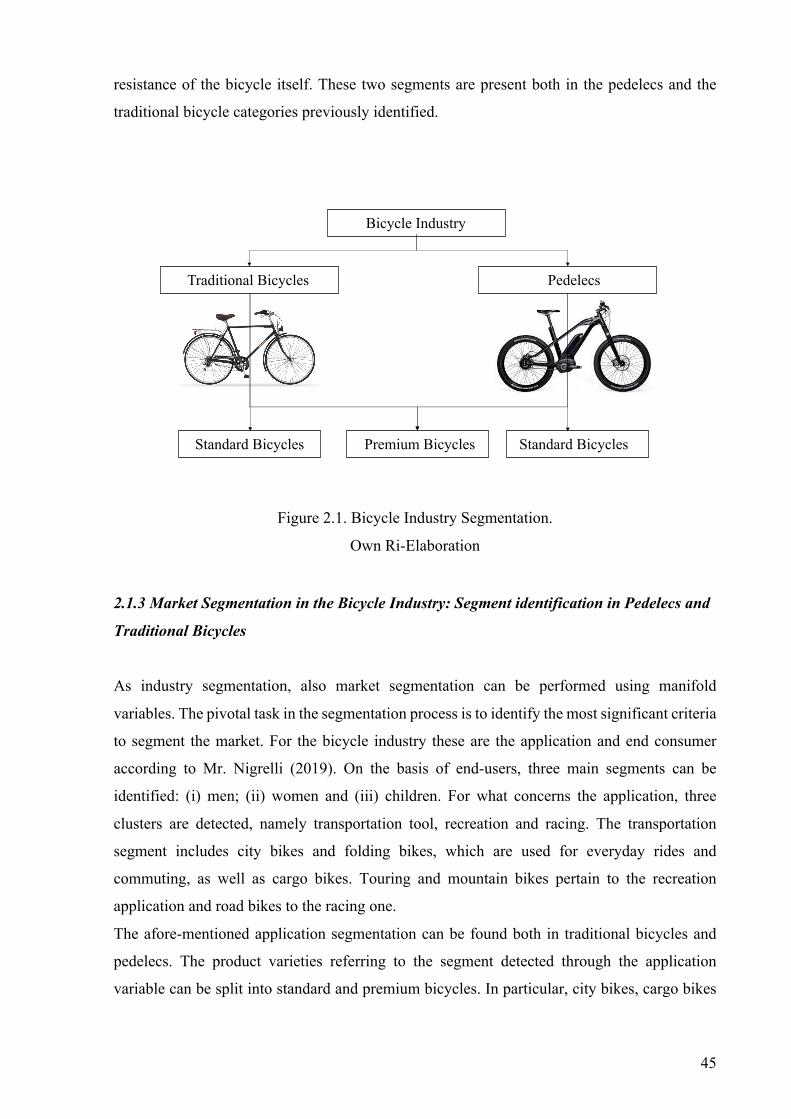
45
resistance of the bicycle itself. These two segments are present both in the pedelecs and the
traditional bicycle categories previously identified.
Figure 2.1. Bicycle Industry Segmentation.
Own Ri-Elaboration
2.1.3 Market Segmentation in the Bicycle Industry: Segment identification in Pedelecs and
Traditional Bicycles
As industry segmentation, also market segmentation can be performed using manifold
variables. The pivotal task in the segmentation process is to identify the most significant criteria
to segment the market. For the bicycle industry these are the application and end consumer
according to Mr. Nigrelli (2019). On the basis of end-users, three main segments can be
identified: (i) men; (ii) women and (iii) children. For what concerns the application, three
clusters are detected, namely transportation tool, recreation and racing. The transportation
segment includes city bikes and folding bikes, which are used for everyday rides and
commuting, as well as cargo bikes. Touring and mountain bikes pertain to the recreation
application and road bikes to the racing one.
The afore-mentioned application segmentation can be found both in traditional bicycles and
pedelecs. The product varieties referring to the segment detected through the application
variable can be split into standard and premium bicycles. In particular, city bikes, cargo bikes
Bicycle Industry
Traditional Bicycles Pedelecs
Standard Bicycles Standard BicyclesPremium Bicycles
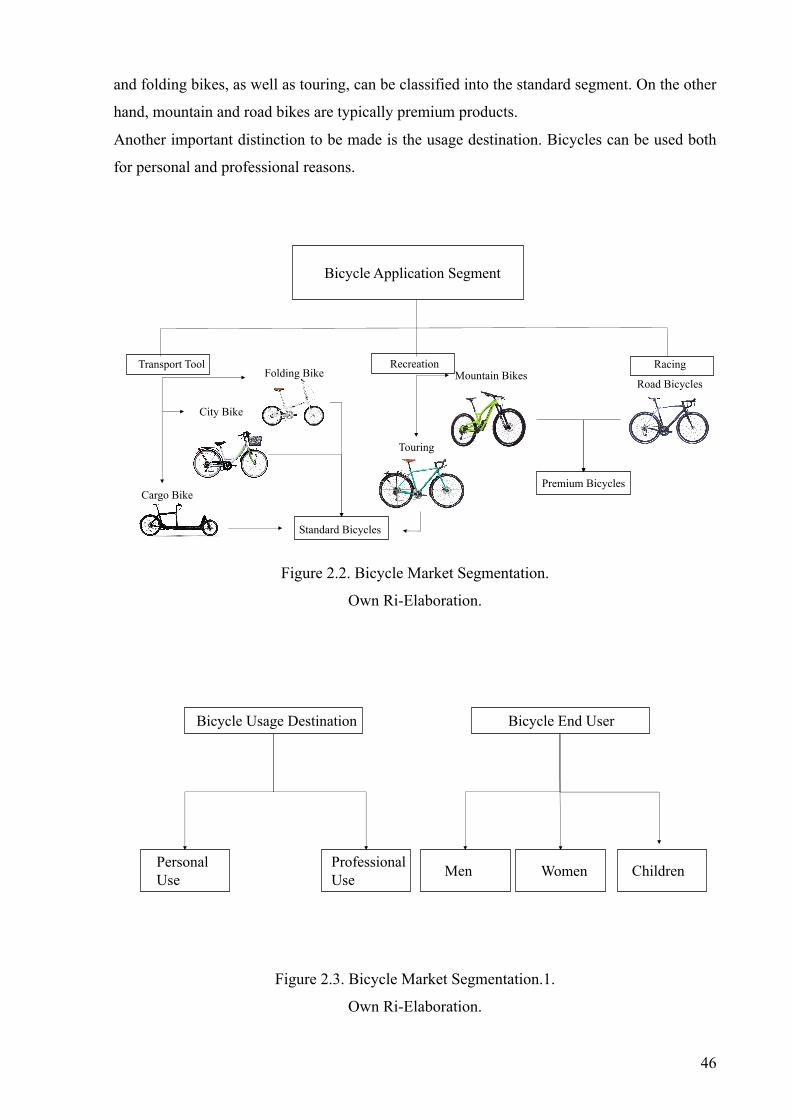
46
and folding bikes, as well as touring, can be classified into the standard segment. On the other
hand, mountain and road bikes are typically premium products.
Another important distinction to be made is the usage destination. Bicycles can be used both
for personal and professional reasons.
Figure 2.2. Bicycle Market Segmentation.
Own Ri-Elaboration.
Figure 2.3. Bicycle Market Segmentation.1.
Own Ri-Elaboration.
Bicycle Application Segment
RecreationTransport Tool Racing
Premium Bicycles
Touring
Mountain BikesFolding Bike
City Bike
Cargo Bike
Standard Bicycles
Road Bicycles
Bicycle Usage Destination Bicycle End User
PersonalUse
Professional Use Men Women Children
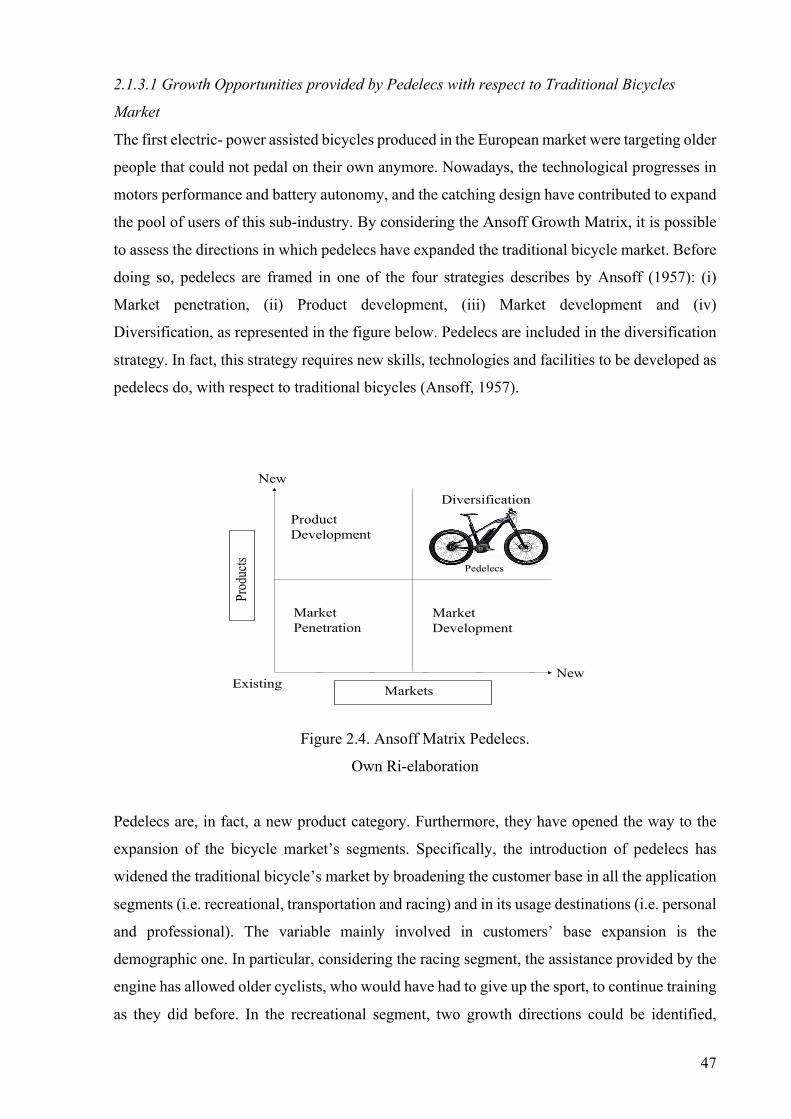
47
2.1.3.1 Growth Opportunities provided by Pedelecs with respect to Traditional Bicycles
Market
The first electric- power assisted bicycles produced in the European market were targeting older
people that could not pedal on their own anymore. Nowadays, the technological progresses in
motors performance and battery autonomy, and the catching design have contributed to expand
the pool of users of this sub-industry. By considering the Ansoff Growth Matrix, it is possible
to assess the directions in which pedelecs have expanded the traditional bicycle market. Before
doing so, pedelecs are framed in one of the four strategies describes by Ansoff (1957): (i)
Market penetration, (ii) Product development, (iii) Market development and (iv)
Diversification, as represented in the figure below. Pedelecs are included in the diversification
strategy. In fact, this strategy requires new skills, technologies and facilities to be developed as
pedelecs do, with respect to traditional bicycles (Ansoff, 1957).
Figure 2.4. Ansoff Matrix Pedelecs.
Own Ri-elaboration
Pedelecs are, in fact, a new product category. Furthermore, they have opened the way to the
expansion of the bicycle market’s segments. Specifically, the introduction of pedelecs has
widened the traditional bicycle’s market by broadening the customer base in all the application
segments (i.e. recreational, transportation and racing) and in its usage destinations (i.e. personal
and professional). The variable mainly involved in customers’ base expansion is the
demographic one. In particular, considering the racing segment, the assistance provided by the
engine has allowed older cyclists, who would have had to give up the sport, to continue training
as they did before. In the recreational segment, two growth directions could be identified,
Pedelecs
Markets
Prod
ucts
New
NewExisting
Market Penetration
Diversification
Market Development
Product Development
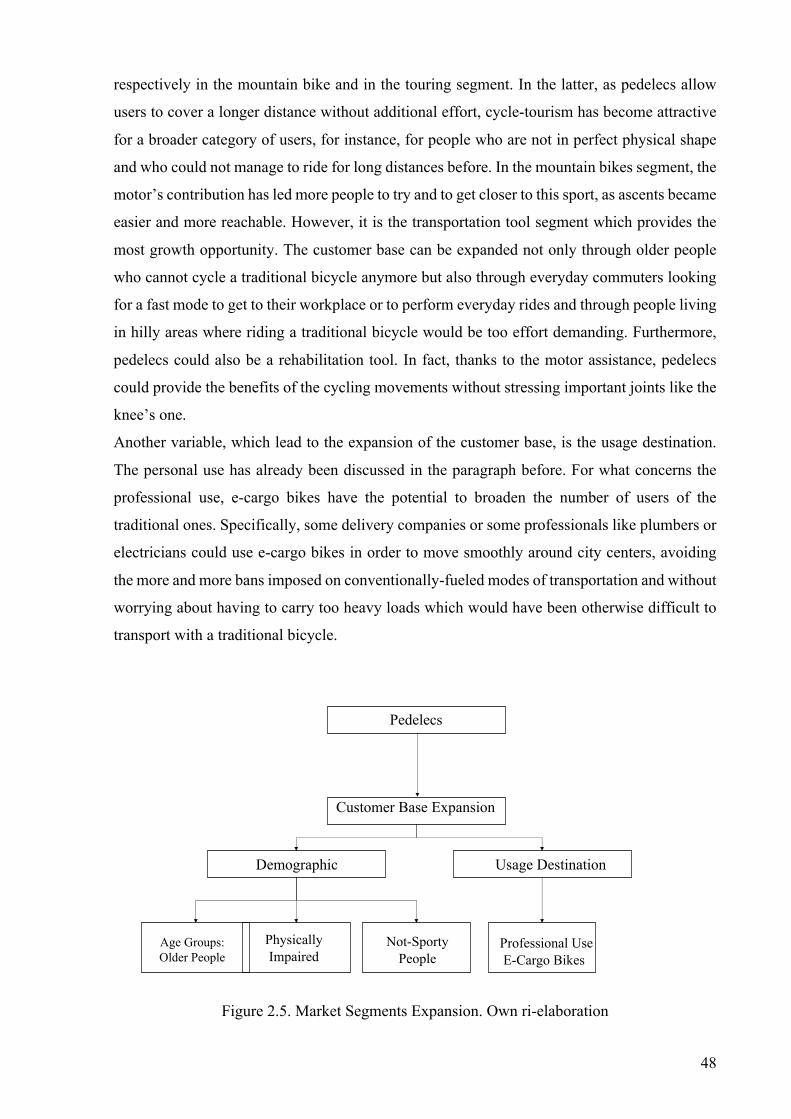
48
respectively in the mountain bike and in the touring segment. In the latter, as pedelecs allow
users to cover a longer distance without additional effort, cycle-tourism has become attractive
for a broader category of users, for instance, for people who are not in perfect physical shape
and who could not manage to ride for long distances before. In the mountain bikes segment, the
motor’s contribution has led more people to try and to get closer to this sport, as ascents became
easier and more reachable. However, it is the transportation tool segment which provides the
most growth opportunity. The customer base can be expanded not only through older people
who cannot cycle a traditional bicycle anymore but also through everyday commuters looking
for a fast mode to get to their workplace or to perform everyday rides and through people living
in hilly areas where riding a traditional bicycle would be too effort demanding. Furthermore,
pedelecs could also be a rehabilitation tool. In fact, thanks to the motor assistance, pedelecs
could provide the benefits of the cycling movements without stressing important joints like the
knee’s one.
Another variable, which lead to the expansion of the customer base, is the usage destination.
The personal use has already been discussed in the paragraph before. For what concerns the
professional use, e-cargo bikes have the potential to broaden the number of users of the
traditional ones. Specifically, some delivery companies or some professionals like plumbers or
electricians could use e-cargo bikes in order to move smoothly around city centers, avoiding
the more and more bans imposed on conventionally-fueled modes of transportation and without
worrying about having to carry too heavy loads which would have been otherwise difficult to
transport with a traditional bicycle.
Figure 2.5. Market Segments Expansion. Own ri-elaboration
Pedelecs
Customer Base Expansion
Demographic Usage Destination
Professional UseE-Cargo Bikes
Age Groups: Older People
Not-Sporty People
Physically Impaired
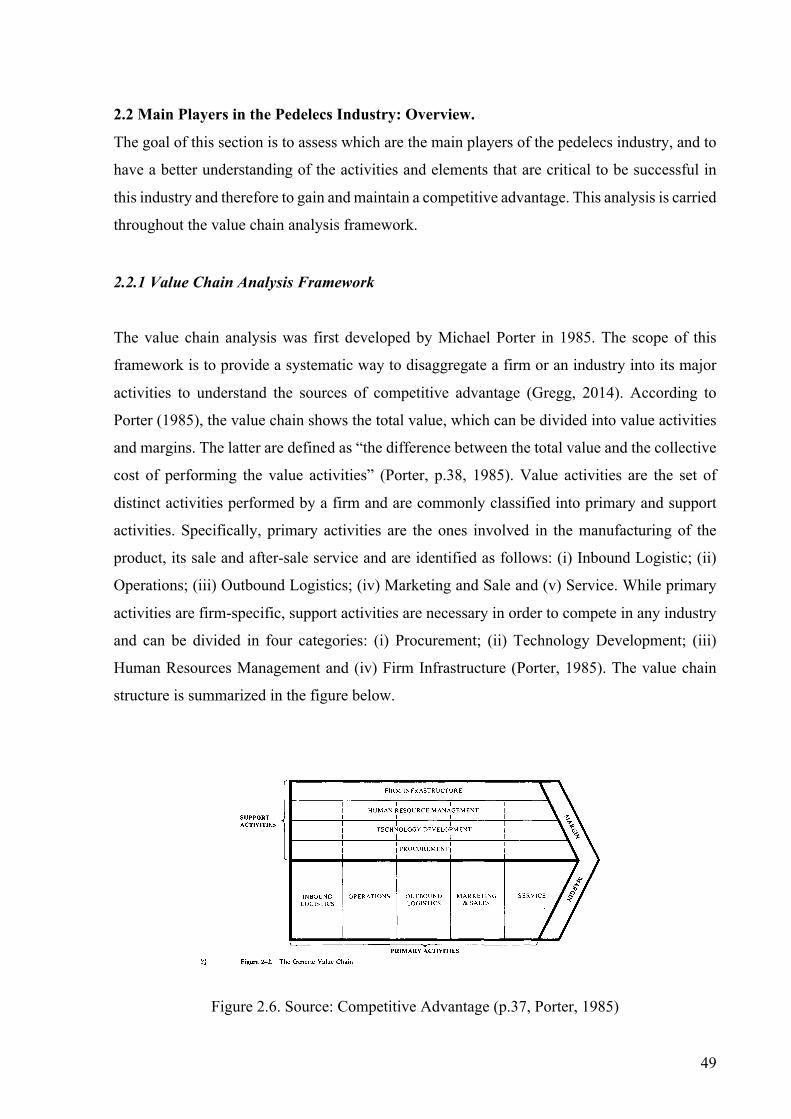
49
2.2 Main Players in the Pedelecs Industry: Overview.
The goal of this section is to assess which are the main players of the pedelecs industry, and to
have a better understanding of the activities and elements that are critical to be successful in
this industry and therefore to gain and maintain a competitive advantage. This analysis is carried
throughout the value chain analysis framework.
2.2.1 Value Chain Analysis Framework
The value chain analysis was first developed by Michael Porter in 1985. The scope of this
framework is to provide a systematic way to disaggregate a firm or an industry into its major
activities to understand the sources of competitive advantage (Gregg, 2014). According to
Porter (1985), the value chain shows the total value, which can be divided into value activities
and margins. The latter are defined as “the difference between the total value and the collective
cost of performing the value activities” (Porter, p.38, 1985). Value activities are the set of
distinct activities performed by a firm and are commonly classified into primary and support
activities. Specifically, primary activities are the ones involved in the manufacturing of the
product, its sale and after-sale service and are identified as follows: (i) Inbound Logistic; (ii)
Operations; (iii) Outbound Logistics; (iv) Marketing and Sale and (v) Service. While primary
activities are firm-specific, support activities are necessary in order to compete in any industry
and can be divided in four categories: (i) Procurement; (ii) Technology Development; (iii)
Human Resources Management and (iv) Firm Infrastructure (Porter, 1985). The value chain
structure is summarized in the figure below.
Figure 2.6. Source: Competitive Advantage (p.37, Porter, 1985)
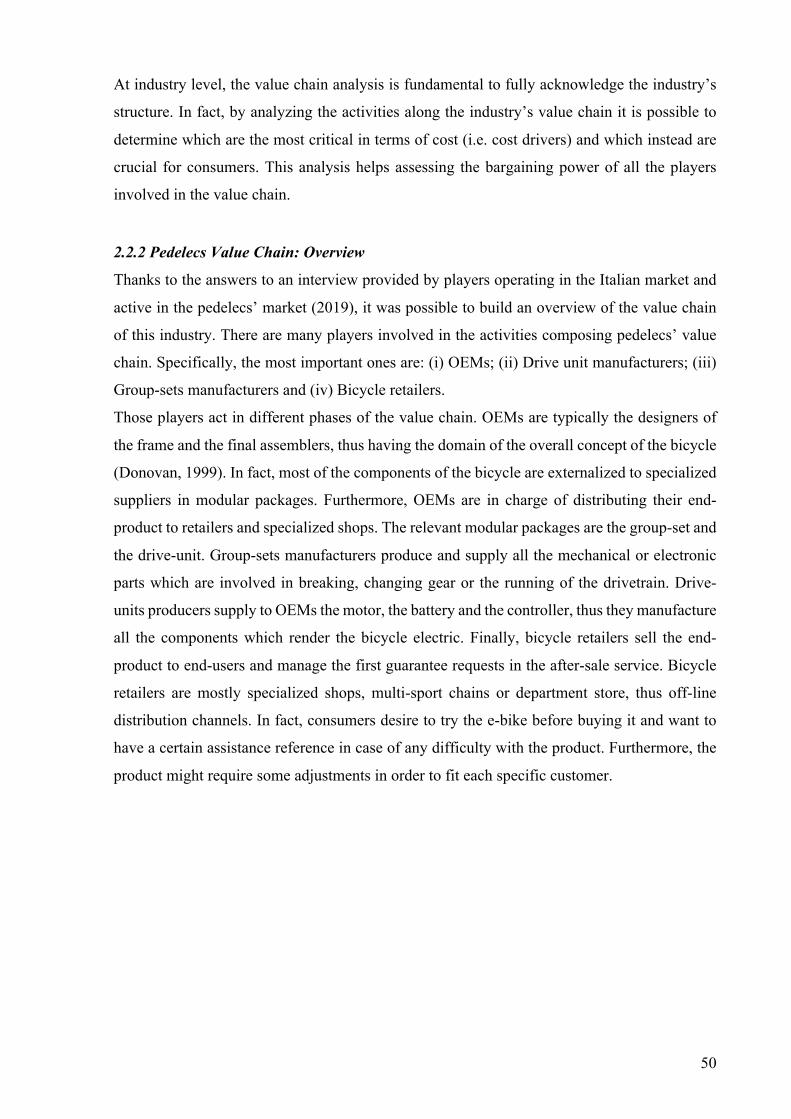
50
At industry level, the value chain analysis is fundamental to fully acknowledge the industry’s
structure. In fact, by analyzing the activities along the industry’s value chain it is possible to
determine which are the most critical in terms of cost (i.e. cost drivers) and which instead are
crucial for consumers. This analysis helps assessing the bargaining power of all the players
involved in the value chain.
2.2.2 Pedelecs Value Chain: Overview
Thanks to the answers to an interview provided by players operating in the Italian market and
active in the pedelecs’ market (2019), it was possible to build an overview of the value chain
of this industry. There are many players involved in the activities composing pedelecs’ value
chain. Specifically, the most important ones are: (i) OEMs; (ii) Drive unit manufacturers; (iii)
Group-sets manufacturers and (iv) Bicycle retailers.
Those players act in different phases of the value chain. OEMs are typically the designers of
the frame and the final assemblers, thus having the domain of the overall concept of the bicycle
(Donovan, 1999). In fact, most of the components of the bicycle are externalized to specialized
suppliers in modular packages. Furthermore, OEMs are in charge of distributing their end-
product to retailers and specialized shops. The relevant modular packages are the group-set and
the drive-unit. Group-sets manufacturers produce and supply all the mechanical or electronic
parts which are involved in breaking, changing gear or the running of the drivetrain. Drive-
units producers supply to OEMs the motor, the battery and the controller, thus they manufacture
all the components which render the bicycle electric. Finally, bicycle retailers sell the end-
product to end-users and manage the first guarantee requests in the after-sale service. Bicycle
retailers are mostly specialized shops, multi-sport chains or department store, thus off-line
distribution channels. In fact, consumers desire to try the e-bike before buying it and want to
have a certain assistance reference in case of any difficulty with the product. Furthermore, the
product might require some adjustments in order to fit each specific customer.
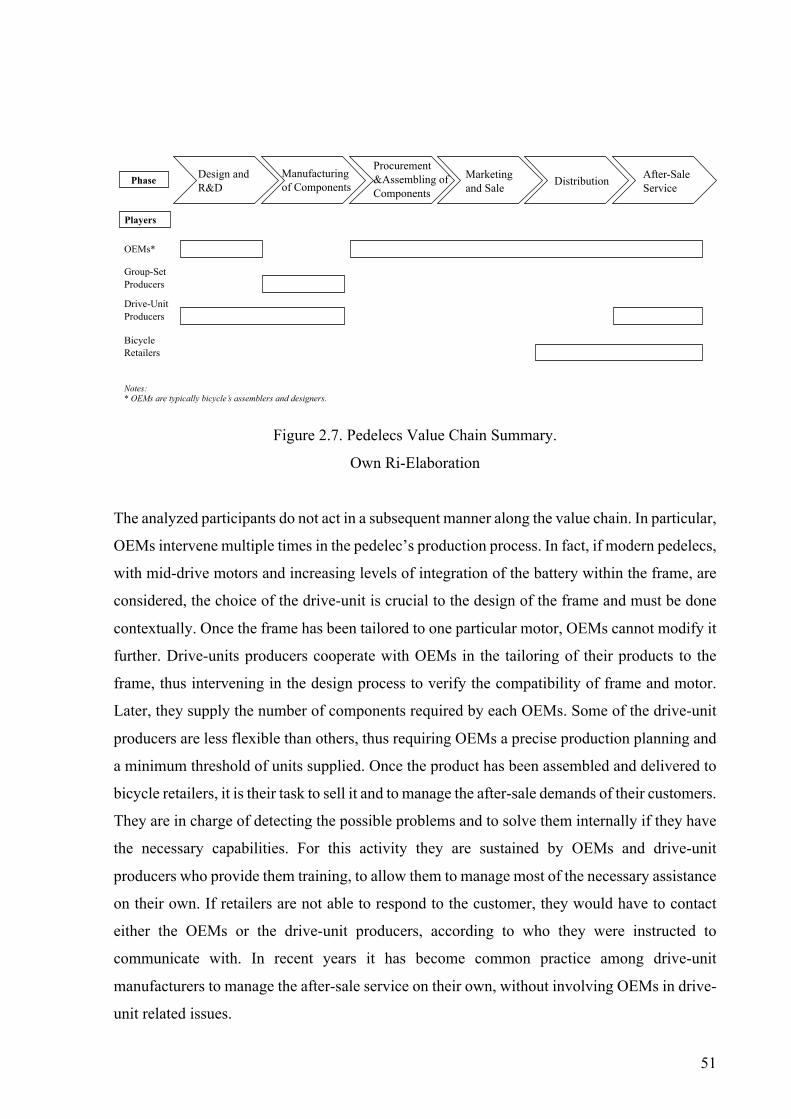
51
Figure 2.7. Pedelecs Value Chain Summary.
Own Ri-Elaboration
The analyzed participants do not act in a subsequent manner along the value chain. In particular,
OEMs intervene multiple times in the pedelec’s production process. In fact, if modern pedelecs,
with mid-drive motors and increasing levels of integration of the battery within the frame, are
considered, the choice of the drive-unit is crucial to the design of the frame and must be done
contextually. Once the frame has been tailored to one particular motor, OEMs cannot modify it
further. Drive-units producers cooperate with OEMs in the tailoring of their products to the
frame, thus intervening in the design process to verify the compatibility of frame and motor.
Later, they supply the number of components required by each OEMs. Some of the drive-unit
producers are less flexible than others, thus requiring OEMs a precise production planning and
a minimum threshold of units supplied. Once the product has been assembled and delivered to
bicycle retailers, it is their task to sell it and to manage the after-sale demands of their customers.
They are in charge of detecting the possible problems and to solve them internally if they have
the necessary capabilities. For this activity they are sustained by OEMs and drive-unit
producers who provide them training, to allow them to manage most of the necessary assistance
on their own. If retailers are not able to respond to the customer, they would have to contact
either the OEMs or the drive-unit producers, according to who they were instructed to
communicate with. In recent years it has become common practice among drive-unit
manufacturers to manage the after-sale service on their own, without involving OEMs in drive-
unit related issues.
Players
Phase Design and R&D
Marketing and Sale Distribution After-Sale
Service
OEMs*
Group-Set Producers
Drive-Unit Producers
Bicycle Retailers
Notes:* OEMs are typically bicycle’s assemblers and designers.
Manufacturing of Components
Procurement &Assembling of Components
52
2.2.2.2 Overview of the Players: Group-set manufacturers, drive-unit producers and OEMs
The three main types of players in the pedelecs market are the group-set manufacturers, the
drive-unit producers and the OEMSs.
Group-set industry is an oligopoly. In fact, there are three mega-suppliers in the industry,
namely Shimano, SRAM and Campagnolo. Shimano is the industry leader, followed by SRAM
and Campagnolo. In particular, Campagnolo leads the racing segment, SRAM has a competitive
advantage in mountain bikes and Shimano is the leader in all the other bicycle types. These
players detain a high bargaining power both with respect to OEMs (i.e. assemblers) and
consumers, who specifically demand for these group’s brands. Part of the source of their
bargaining power was derived from their ability to standardize bike’s componentry and supply
OEMs with modular packages ready to be assembled with their frame. With the exception of
Shimano, which has entered the market with its e-bike system, group-set producers are different
from drive-unit producers.
The landscape of drive-unit producers is heterogeneous. The world scenario is dominated by
six key players: (i) Bosch, which is the market leader; (ii) Continental; (iii) Panasonic; (iv)
Shimano; (v) Yamaha Motors and (vi) Brose. However, the drive-unit market is populated by
many others smaller and more local players, which can undermine the bargaining power of the
leaders in some market niche (i.e. e-road market segment or some geographic regions).
As previously mentioned, most of these players produce only the drive-unit which need to fit
with the group-set components. Furthermore, their product needs to be compliant with the
differing regulations around the world. Both drive-unit and group-set producers are tier-1
suppliers to OEMs.
OEMs scenario is composite. There are some multinational companies which have a world-
wide coverage (i.e. Giant Bicycle, Accell Group, Merida, Specialized, Trek). However, these
companies leave market space for many smaller local producers that characterize each
country’s market and try to target some market niches. Moreover, while some producers have
multiple brands in their portfolio, covering both the premium and the standard segment, some
other OEMs are focused in either one of them.
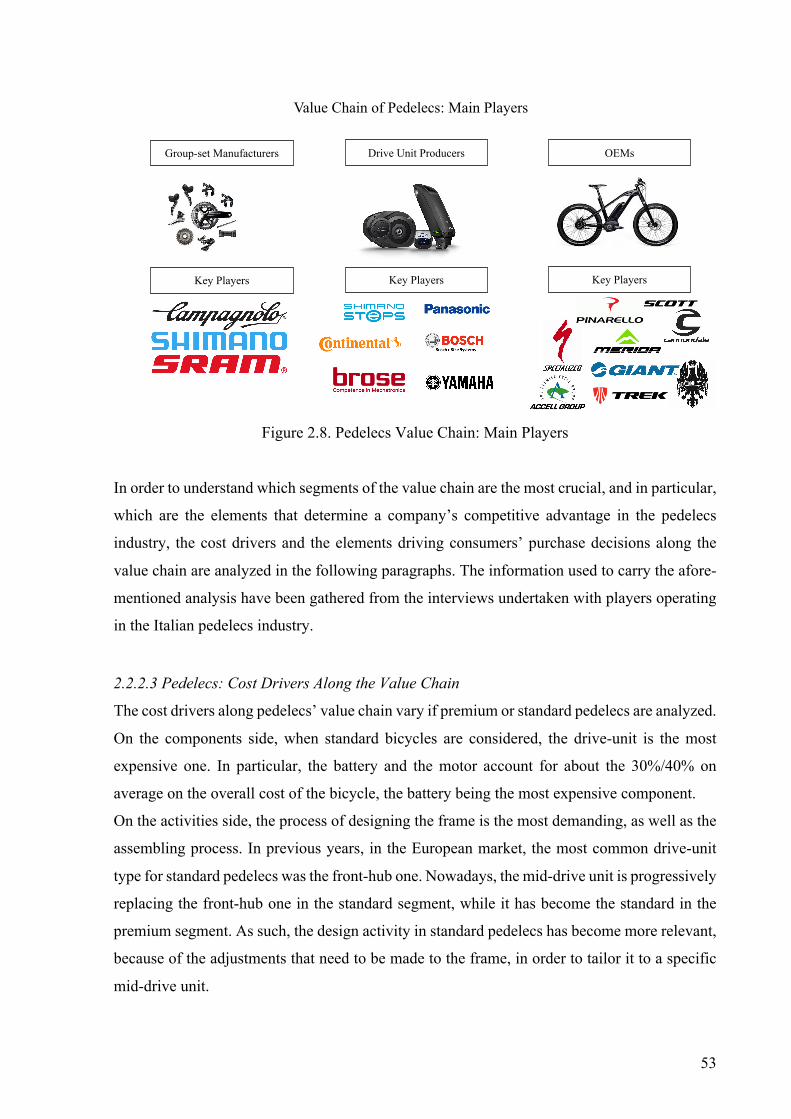
53
Figure 2.8. Pedelecs Value Chain: Main Players
In order to understand which segments of the value chain are the most crucial, and in particular,
which are the elements that determine a company’s competitive advantage in the pedelecs
industry, the cost drivers and the elements driving consumers’ purchase decisions along the
value chain are analyzed in the following paragraphs. The information used to carry the afore-
mentioned analysis have been gathered from the interviews undertaken with players operating
in the Italian pedelecs industry.
2.2.2.3 Pedelecs: Cost Drivers Along the Value Chain
The cost drivers along pedelecs’ value chain vary if premium or standard pedelecs are analyzed.
On the components side, when standard bicycles are considered, the drive-unit is the most
expensive one. In particular, the battery and the motor account for about the 30%/40% on
average on the overall cost of the bicycle, the battery being the most expensive component.
On the activities side, the process of designing the frame is the most demanding, as well as the
assembling process. In previous years, in the European market, the most common drive-unit
type for standard pedelecs was the front-hub one. Nowadays, the mid-drive unit is progressively
replacing the front-hub one in the standard segment, while it has become the standard in the
premium segment. As such, the design activity in standard pedelecs has become more relevant,
because of the adjustments that need to be made to the frame, in order to tailor it to a specific
mid-drive unit.
Value Chain of Pedelecs: Main Players
Group-set Manufacturers Drive Unit Producers OEMs
Key PlayersKey Players Key Players
54
Additionally, another activity is crucial both for premium and standard bicycles: the after-sale
service. The latter has gained importance because of the bicycle’s electrification, as OEMs have
to deal with more components with complex technologies. It is relevant particularly in standard
bicycles because they are more likely to mount cheaper drive-units with respect to premium
bicycles. As a consequence, the producers of the afore-mentioned drive units are less likely to
offer after-sale service directly to the retailer, thus charging the OEMs with the burden of the
customers’ assistance.
Premium pedelecs’ drive-units are slightly more performant than the ones installed in standard
ones. However, this component does not drive the costs of a premium product. The quality and
the type of material used to produce the frames, and the quality of the group-set are the most
expensive components in this case. The pivotal activities are almost the same as in standard
bicycles. In fact, the R&D and the design of the frame are the most cost-demanding, according
to the players interviewed (2019). Furthermore, marketing plays an important role in premium
bicycles as producers need to undertake sponsorship activities in order to keep up their brand-
awareness and perception among consumers.
To sum up, the main cost drivers in standard pedelecs value chain are the R&D and design, the
manufacturing of components and the after-sale service. In particular, all these phases are
connected to the drive-unit element. In fact, despite being expensive on its own, reaching almost
30/40% of the whole vehicle value in the case of standard pedelecs, the drive-unit also affects
the design and R&D activities of pedelecs OEMs, as the frame has to be tailored to it when
mid-drive motors are mounted. Moreover, as the drive-unit is a technologically complex
component, it has rendered the after-sale service more difficult to manage.
For what concerns premium pedelecs, both manufacturing of components and the R&D and
design activities are pivotal. In particular, the manufacturing of components is crucial both
because of the cost of the material used to produce the vehicles (i.e. the quality of the material
has to be high for premium pedelecs) and because of the drive-unit. Furthermore, like in the
standard pedelecs’ case, the choice of the drive-unit affects the design of pedelecs’ frame. In
addition, as for premium pedelecs the brand asset is important, the marketing and sale segment
is one of the most relevant on the costs side. The data are summarized in the table below.
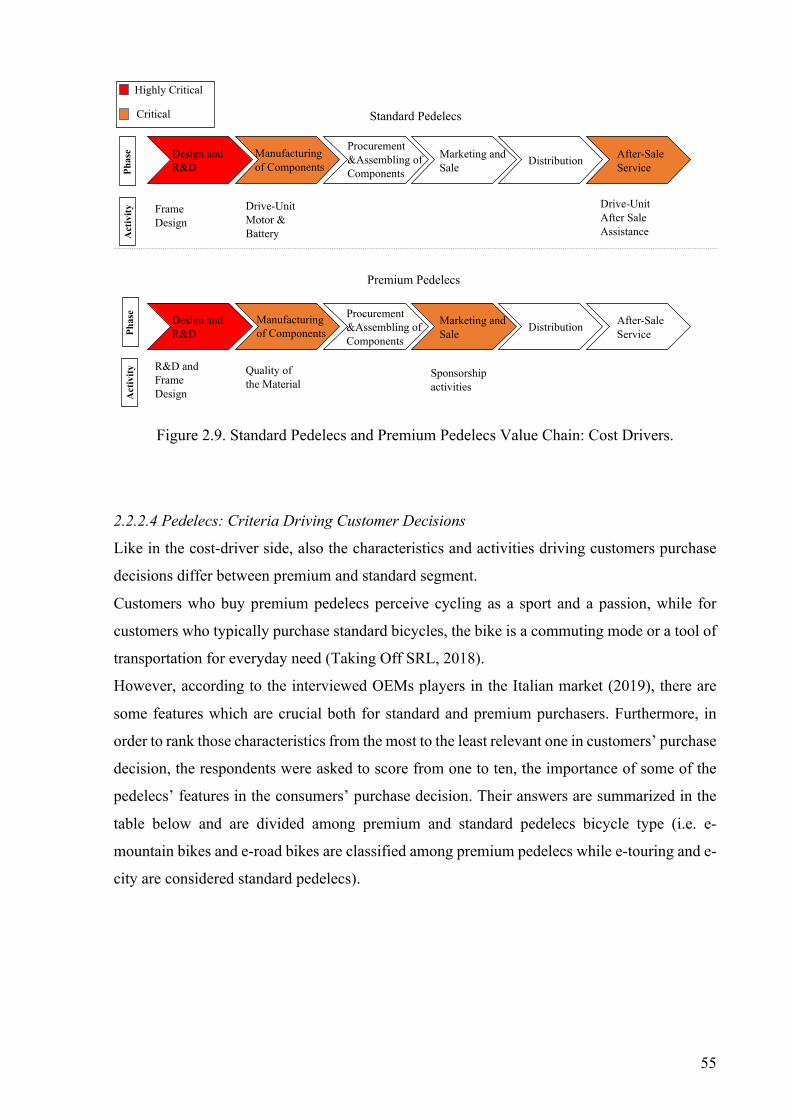
55
Figure 2.9. Standard Pedelecs and Premium Pedelecs Value Chain: Cost Drivers.
2.2.2.4 Pedelecs: Criteria Driving Customer Decisions
Like in the cost-driver side, also the characteristics and activities driving customers purchase
decisions differ between premium and standard segment.
Customers who buy premium pedelecs perceive cycling as a sport and a passion, while for
customers who typically purchase standard bicycles, the bike is a commuting mode or a tool of
transportation for everyday need (Taking Off SRL, 2018).
However, according to the interviewed OEMs players in the Italian market (2019), there are
some features which are crucial both for standard and premium purchasers. Furthermore, in
order to rank those characteristics from the most to the least relevant one in customers’ purchase
decision, the respondents were asked to score from one to ten, the importance of some of the
pedelecs’ features in the consumers’ purchase decision. Their answers are summarized in the
table below and are divided among premium and standard pedelecs bicycle type (i.e. e-
mountain bikes and e-road bikes are classified among premium pedelecs while e-touring and e-
city are considered standard pedelecs).
Phase
Frame Design
Standard PedelecsPhase
Premium Pedelecs
Quality of the Material
R&D and Frame Design
Sponsorship activities
Drive-UnitMotor & Battery
Drive-Unit After Sale AssistanceA
ctivity
Activity
Highly Critical
Critical
Design and R&D
Marketing and Sale Distribution After-Sale
Service
Design and R&D
Marketing and Sale Distribution After-Sale
Service
Manufacturing of Components
Manufacturing of Components
Procurement &Assembling of Components
Procurement &Assembling of Components
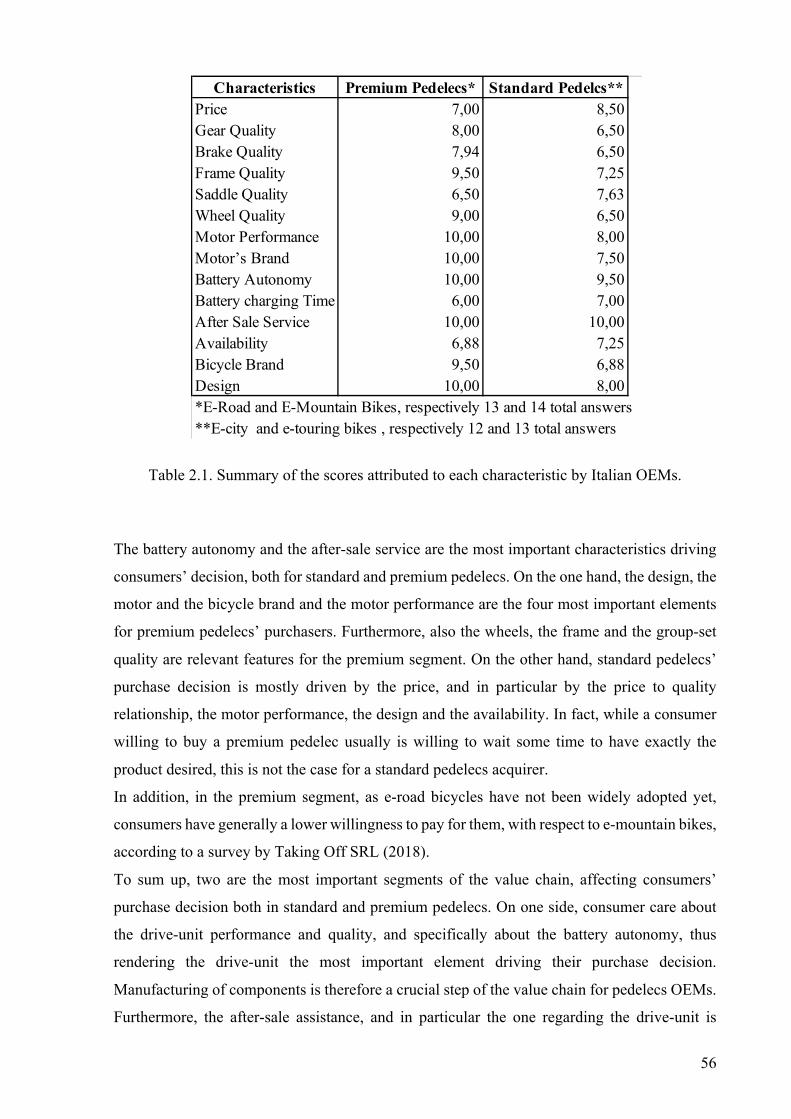
56
Table 2.1. Summary of the scores attributed to each characteristic by Italian OEMs.
The battery autonomy and the after-sale service are the most important characteristics driving
consumers’ decision, both for standard and premium pedelecs. On the one hand, the design, the
motor and the bicycle brand and the motor performance are the four most important elements
for premium pedelecs’ purchasers. Furthermore, also the wheels, the frame and the group-set
quality are relevant features for the premium segment. On the other hand, standard pedelecs’
purchase decision is mostly driven by the price, and in particular by the price to quality
relationship, the motor performance, the design and the availability. In fact, while a consumer
willing to buy a premium pedelec usually is willing to wait some time to have exactly the
product desired, this is not the case for a standard pedelecs acquirer.
In addition, in the premium segment, as e-road bicycles have not been widely adopted yet,
consumers have generally a lower willingness to pay for them, with respect to e-mountain bikes,
according to a survey by Taking Off SRL (2018).
To sum up, two are the most important segments of the value chain, affecting consumers’
purchase decision both in standard and premium pedelecs. On one side, consumer care about
the drive-unit performance and quality, and specifically about the battery autonomy, thus
rendering the drive-unit the most important element driving their purchase decision.
Manufacturing of components is therefore a crucial step of the value chain for pedelecs OEMs.
Furthermore, the after-sale assistance, and in particular the one regarding the drive-unit is
Characteristics Premium Pedelecs* Standard Pedelcs**Price 7,00 8,50
Gear Quality 8,00 6,50
Brake Quality 7,94 6,50
Frame Quality 9,50 7,25
Saddle Quality 6,50 7,63
Wheel Quality 9,00 6,50
Motor Performance 10,00 8,00
Motor’s Brand 10,00 7,50
Battery Autonomy 10,00 9,50
Battery charging Time 6,00 7,00
After Sale Service 10,00 10,00
Availability 6,88 7,25
Bicycle Brand 9,50 6,88
Design 10,00 8,00
*E-Road and E-Mountain Bikes, respectively 13 and 14 total answers
**E-city and e-touring bikes , respectively 12 and 13 total answers
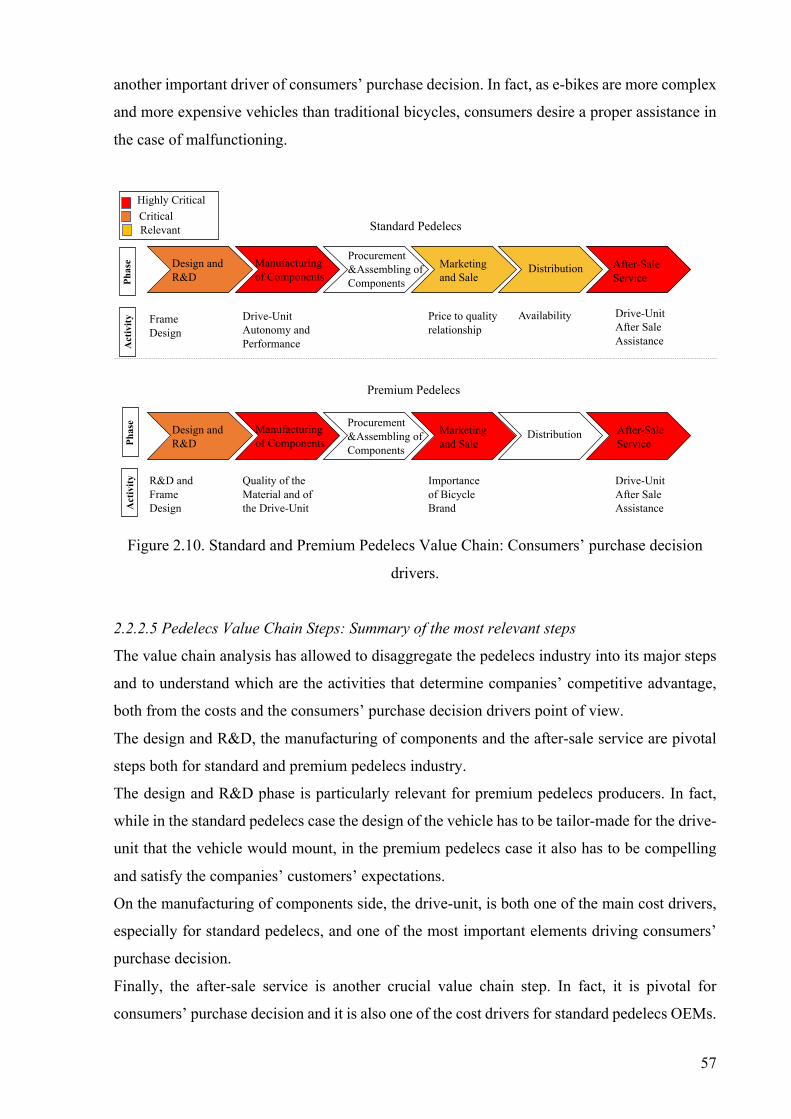
57
another important driver of consumers’ purchase decision. In fact, as e-bikes are more complex
and more expensive vehicles than traditional bicycles, consumers desire a proper assistance in
the case of malfunctioning.
Figure 2.10. Standard and Premium Pedelecs Value Chain: Consumers’ purchase decision
drivers.
2.2.2.5 Pedelecs Value Chain Steps: Summary of the most relevant steps
The value chain analysis has allowed to disaggregate the pedelecs industry into its major steps
and to understand which are the activities that determine companies’ competitive advantage,
both from the costs and the consumers’ purchase decision drivers point of view.
The design and R&D, the manufacturing of components and the after-sale service are pivotal
steps both for standard and premium pedelecs industry.
The design and R&D phase is particularly relevant for premium pedelecs producers. In fact,
while in the standard pedelecs case the design of the vehicle has to be tailor-made for the drive-
unit that the vehicle would mount, in the premium pedelecs case it also has to be compelling
and satisfy the companies’ customers’ expectations.
On the manufacturing of components side, the drive-unit, is both one of the main cost drivers,
especially for standard pedelecs, and one of the most important elements driving consumers’
purchase decision.
Finally, the after-sale service is another crucial value chain step. In fact, it is pivotal for
consumers’ purchase decision and it is also one of the cost drivers for standard pedelecs OEMs.
Phase
Standard Pedelecs
Phase
Premium Pedelecs
Activity
Activity
Design and R&D
Manufacturing of Components
Marketing and Sale
Distribution After-Sale Service
Design and R&D
Marketing and Sale
Distribution After-Sale Service
Highly CriticalCriticalRelevant
Frame Design
Drive-UnitAutonomy and Performance
Drive-Unit After Sale Assistance
AvailabilityPrice to quality relationship
Quality of the Material and of the Drive-Unit
R&D and Frame Design
Importance of Bicycle Brand
Drive-Unit After Sale Assistance
Manufacturing of Components
Procurement &Assembling of Components
Procurement &Assembling of Components
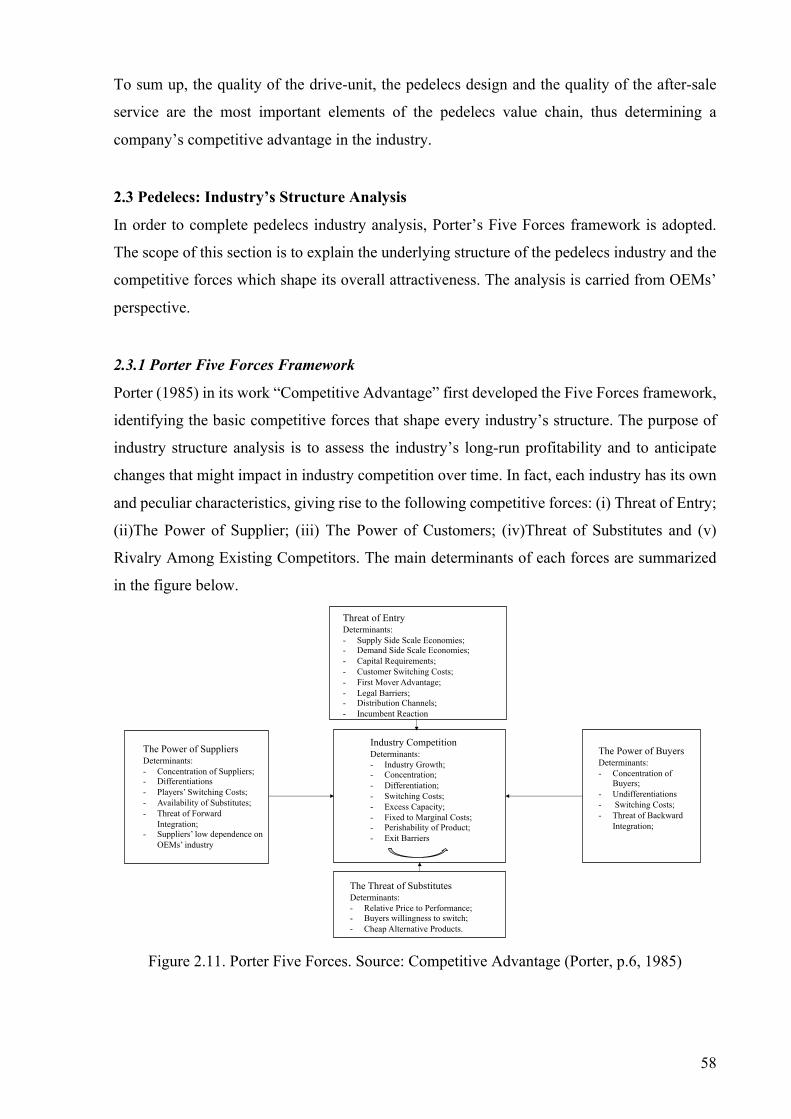
58
To sum up, the quality of the drive-unit, the pedelecs design and the quality of the after-sale
service are the most important elements of the pedelecs value chain, thus determining a
company’s competitive advantage in the industry.
2.3 Pedelecs: Industry’s Structure Analysis
In order to complete pedelecs industry analysis, Porter’s Five Forces framework is adopted.
The scope of this section is to explain the underlying structure of the pedelecs industry and the
competitive forces which shape its overall attractiveness. The analysis is carried from OEMs’
perspective.
2.3.1 Porter Five Forces Framework
Porter (1985) in its work “Competitive Advantage” first developed the Five Forces framework,
identifying the basic competitive forces that shape every industry’s structure. The purpose of
industry structure analysis is to assess the industry’s long-run profitability and to anticipate
changes that might impact in industry competition over time. In fact, each industry has its own
and peculiar characteristics, giving rise to the following competitive forces: (i) Threat of Entry;
(ii)The Power of Supplier; (iii) The Power of Customers; (iv)Threat of Substitutes and (v)
Rivalry Among Existing Competitors. The main determinants of each forces are summarized
in the figure below.
Figure 2.11. Porter Five Forces. Source: Competitive Advantage (Porter, p.6, 1985)
Industry CompetitionDeterminants:- Industry Growth;- Concentration;- Differentiation;- Switching Costs;- Excess Capacity;- Fixed to Marginal Costs;- Perishability of Product;- Exit Barriers
Threat of EntryDeterminants:- Supply Side Scale Economies;- Demand Side Scale Economies;- Capital Requirements;- Customer Switching Costs;- First Mover Advantage;- Legal Barriers;- Distribution Channels;- Incumbent Reaction
The Power of SuppliersDeterminants:- Concentration of Suppliers;- Differentiations- Players’ Switching Costs;- Availability of Substitutes;- Threat of Forward
Integration;- Suppliers’ low dependence on
OEMs’ industry
The Power of BuyersDeterminants:- Concentration of
Buyers;- Undifferentiations- Switching Costs;- Threat of Backward
Integration;
The Threat of SubstitutesDeterminants:- Relative Price to Performance;- Buyers willingness to switch;- Cheap Alternative Products.
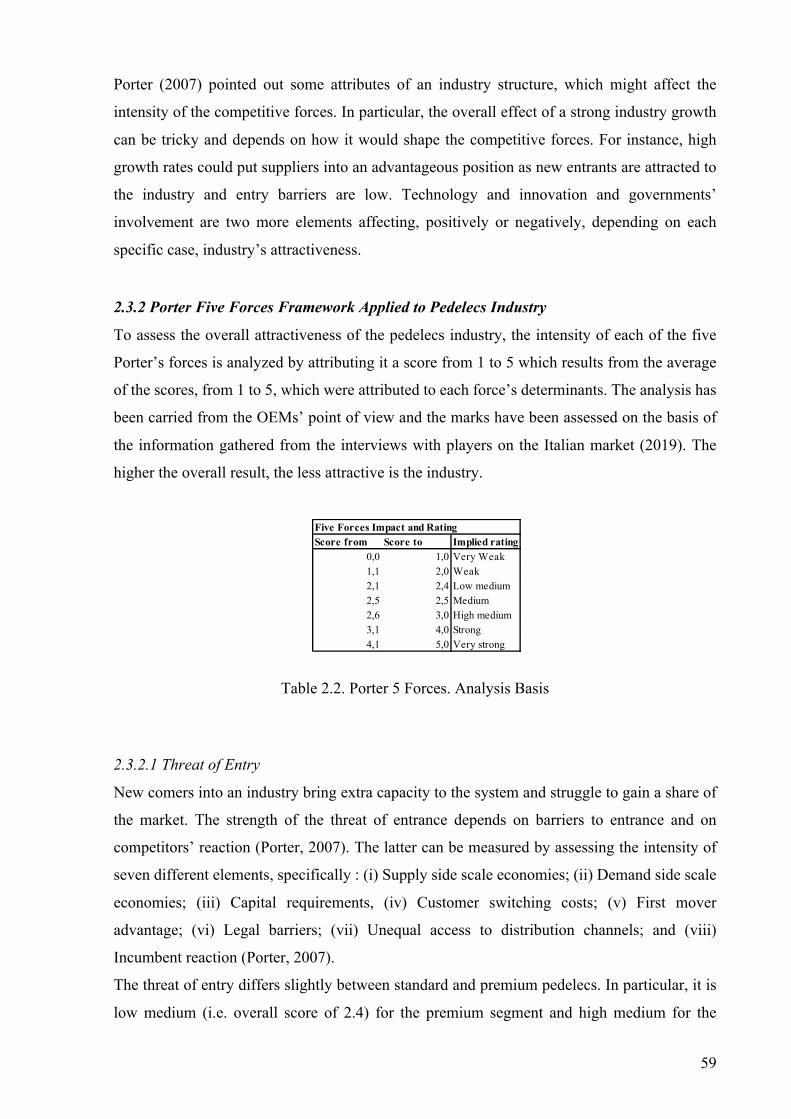
59
Porter (2007) pointed out some attributes of an industry structure, which might affect the
intensity of the competitive forces. In particular, the overall effect of a strong industry growth
can be tricky and depends on how it would shape the competitive forces. For instance, high
growth rates could put suppliers into an advantageous position as new entrants are attracted to
the industry and entry barriers are low. Technology and innovation and governments’
involvement are two more elements affecting, positively or negatively, depending on each
specific case, industry’s attractiveness.
2.3.2 Porter Five Forces Framework Applied to Pedelecs Industry
To assess the overall attractiveness of the pedelecs industry, the intensity of each of the five
Porter’s forces is analyzed by attributing it a score from 1 to 5 which results from the average
of the scores, from 1 to 5, which were attributed to each force’s determinants. The analysis has
been carried from the OEMs’ point of view and the marks have been assessed on the basis of
the information gathered from the interviews with players on the Italian market (2019). The
higher the overall result, the less attractive is the industry.
Table 2.2. Porter 5 Forces. Analysis Basis
2.3.2.1 Threat of Entry
New comers into an industry bring extra capacity to the system and struggle to gain a share of
the market. The strength of the threat of entrance depends on barriers to entrance and on
competitors’ reaction (Porter, 2007). The latter can be measured by assessing the intensity of
seven different elements, specifically : (i) Supply side scale economies; (ii) Demand side scale
economies; (iii) Capital requirements, (iv) Customer switching costs; (v) First mover
advantage; (vi) Legal barriers; (vii) Unequal access to distribution channels; and (viii)
Incumbent reaction (Porter, 2007).
The threat of entry differs slightly between standard and premium pedelecs. In particular, it is
low medium (i.e. overall score of 2.4) for the premium segment and high medium for the
Five Forces Impact and RatingScore from Score to Implied rating
0,0 1,0 Very Weak1,1 2,0 Weak2,1 2,4 Low medium2,5 2,5 Medium2,6 3,0 High medium3,1 4,0 Strong4,1 5,0 Very strong
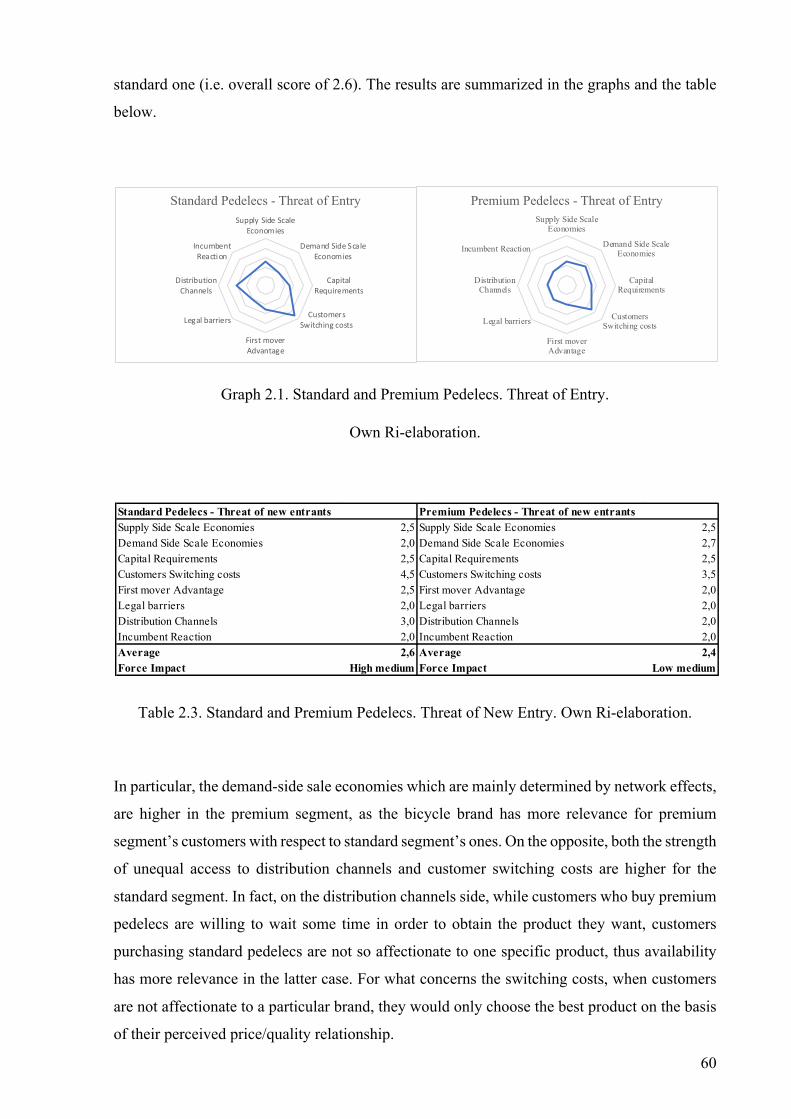
60
standard one (i.e. overall score of 2.6). The results are summarized in the graphs and the table
below.
Graph 2.1. Standard and Premium Pedelecs. Threat of Entry.
Own Ri-elaboration.
Table 2.3. Standard and Premium Pedelecs. Threat of New Entry. Own Ri-elaboration.
In particular, the demand-side sale economies which are mainly determined by network effects,
are higher in the premium segment, as the bicycle brand has more relevance for premium
segment’s customers with respect to standard segment’s ones. On the opposite, both the strength
of unequal access to distribution channels and customer switching costs are higher for the
standard segment. In fact, on the distribution channels side, while customers who buy premium
pedelecs are willing to wait some time in order to obtain the product they want, customers
purchasing standard pedelecs are not so affectionate to one specific product, thus availability
has more relevance in the latter case. For what concerns the switching costs, when customers
are not affectionate to a particular brand, they would only choose the best product on the basis
of their perceived price/quality relationship.
Supply Side ScaleEconomies
Demand Side ScaleEconomies
CapitalRequirements
CustomersSwitching costs
First moverAdvantage
Legal barriers
DistributionChannels
Incumbent Reaction
Premium Pedelecs - Threat of EntrySupply Side Scale
Economies
Demand Side ScaleEconomies
CapitalRequirements
CustomersSwitching costs
First moverAdvantage
Legal barriers
DistributionChannels
IncumbentReaction
Standard Pedelecs - Threat of Entry
Standard Pedelecs - Threat of new entrants Premium Pedelecs - Threat of new entrantsSupply Side Scale Economies 2,5 Supply Side Scale Economies 2,5Demand Side Scale Economies 2,0 Demand Side Scale Economies 2,7Capital Requirements 2,5 Capital Requirements 2,5Customers Switching costs 4,5 Customers Switching costs 3,5First mover Advantage 2,5 First mover Advantage 2,0Legal barriers 2,0 Legal barriers 2,0Distribution Channels 3,0 Distribution Channels 2,0Incumbent Reaction 2,0 Incumbent Reaction 2,0Average 2,6 Average 2,4Force Impact High medium Force Impact Low medium
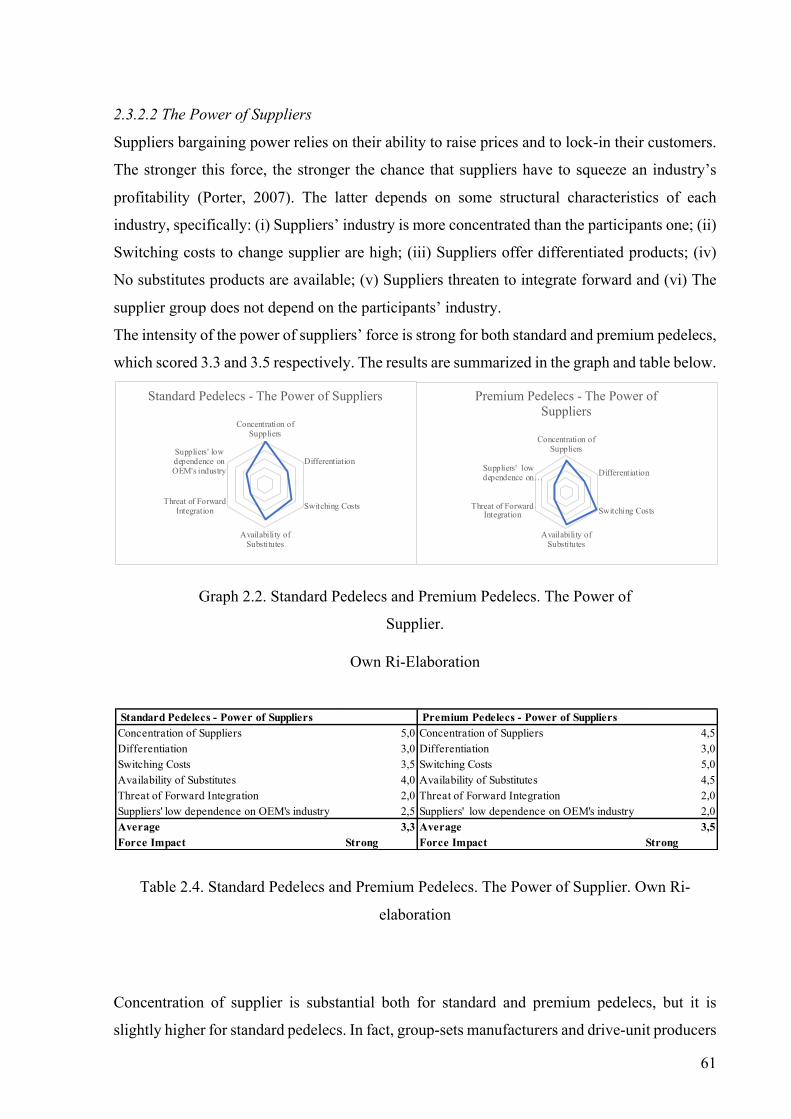
61
2.3.2.2 The Power of Suppliers
Suppliers bargaining power relies on their ability to raise prices and to lock-in their customers.
The stronger this force, the stronger the chance that suppliers have to squeeze an industry’s
profitability (Porter, 2007). The latter depends on some structural characteristics of each
industry, specifically: (i) Suppliers’ industry is more concentrated than the participants one; (ii)
Switching costs to change supplier are high; (iii) Suppliers offer differentiated products; (iv)
No substitutes products are available; (v) Suppliers threaten to integrate forward and (vi) The
supplier group does not depend on the participants’ industry.
The intensity of the power of suppliers’ force is strong for both standard and premium pedelecs,
which scored 3.3 and 3.5 respectively. The results are summarized in the graph and table below.
Graph 2.2. Standard Pedelecs and Premium Pedelecs. The Power of
Supplier.
Own Ri-Elaboration
Table 2.4. Standard Pedelecs and Premium Pedelecs. The Power of Supplier. Own Ri-
elaboration
Concentration of supplier is substantial both for standard and premium pedelecs, but it is
slightly higher for standard pedelecs. In fact, group-sets manufacturers and drive-unit producers
Concentration ofSuppliers
Differentiation
Switching Costs
Availability ofSubstitutes
Threat of ForwardIntegration
Suppliers' lowdependence onOEM's industry
Standard Pedelecs - The Power of Suppliers
Concentration ofSuppliers
Differentiation
Switching Costs
Availability ofSubstitutes
Threat of ForwardIntegration
Suppliers' lowdependence on…
Premium Pedelecs - The Power of Suppliers
Standard Pedelecs - Power of Suppliers Premium Pedelecs - Power of SuppliersConcentration of Suppliers 5,0 Concentration of Suppliers 4,5Differentiation 3,0 Differentiation 3,0Switching Costs 3,5 Switching Costs 5,0Availability of Substitutes 4,0 Availability of Substitutes 4,5Threat of Forward Integration 2,0 Threat of Forward Integration 2,0Suppliers' low dependence on OEM's industry 2,5 Suppliers' low dependence on OEM's industry 2,0Average 3,3 Average 3,5Force Impact Strong Force Impact Strong
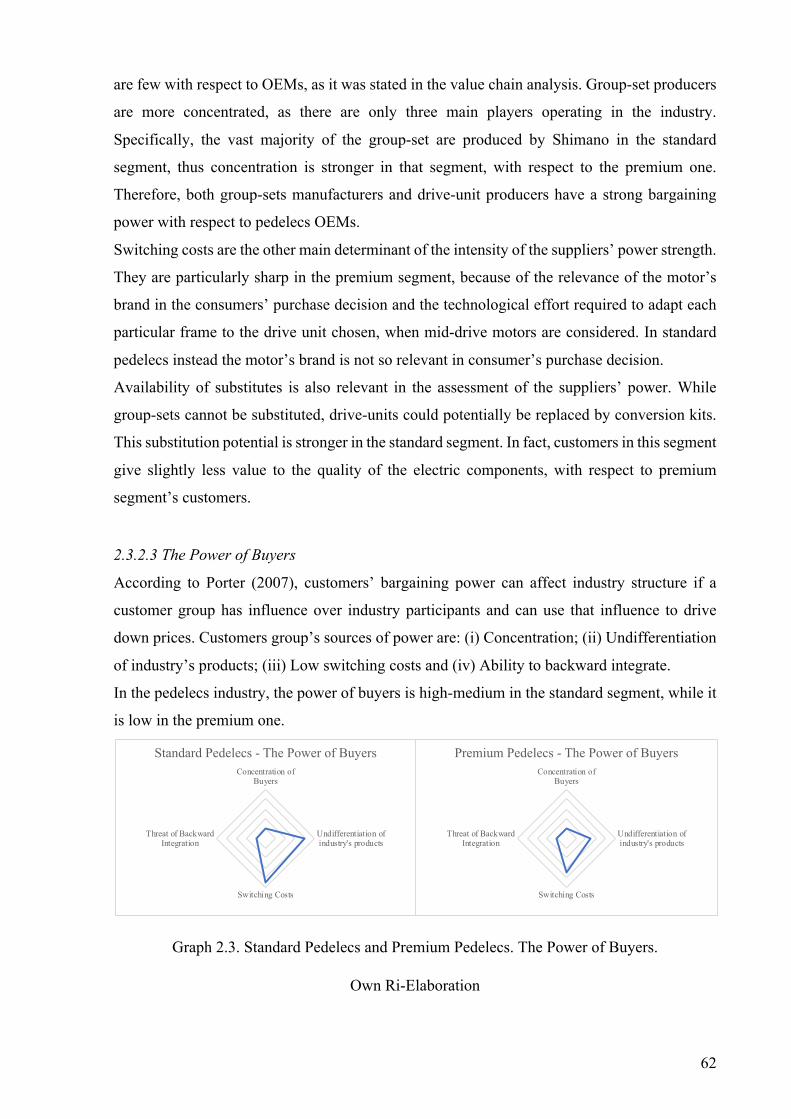
62
are few with respect to OEMs, as it was stated in the value chain analysis. Group-set producers
are more concentrated, as there are only three main players operating in the industry.
Specifically, the vast majority of the group-set are produced by Shimano in the standard
segment, thus concentration is stronger in that segment, with respect to the premium one.
Therefore, both group-sets manufacturers and drive-unit producers have a strong bargaining
power with respect to pedelecs OEMs.
Switching costs are the other main determinant of the intensity of the suppliers’ power strength.
They are particularly sharp in the premium segment, because of the relevance of the motor’s
brand in the consumers’ purchase decision and the technological effort required to adapt each
particular frame to the drive unit chosen, when mid-drive motors are considered. In standard
pedelecs instead the motor’s brand is not so relevant in consumer’s purchase decision.
Availability of substitutes is also relevant in the assessment of the suppliers’ power. While
group-sets cannot be substituted, drive-units could potentially be replaced by conversion kits.
This substitution potential is stronger in the standard segment. In fact, customers in this segment
give slightly less value to the quality of the electric components, with respect to premium
segment’s customers.
2.3.2.3 The Power of Buyers
According to Porter (2007), customers’ bargaining power can affect industry structure if a
customer group has influence over industry participants and can use that influence to drive
down prices. Customers group’s sources of power are: (i) Concentration; (ii) Undifferentiation
of industry’s products; (iii) Low switching costs and (iv) Ability to backward integrate.
In the pedelecs industry, the power of buyers is high-medium in the standard segment, while it
is low in the premium one.
Graph 2.3. Standard Pedelecs and Premium Pedelecs. The Power of Buyers.
Own Ri-Elaboration
Concentration ofBuyers
Undifferentiation ofindustry's products
Switching Costs
Threat of BackwardIntegration
Standard Pedelecs - The Power of BuyersConcentration of
Buyers
Undifferentiation ofindustry's products
Switching Costs
Threat of BackwardIntegration
Premium Pedelecs - The Power of Buyers
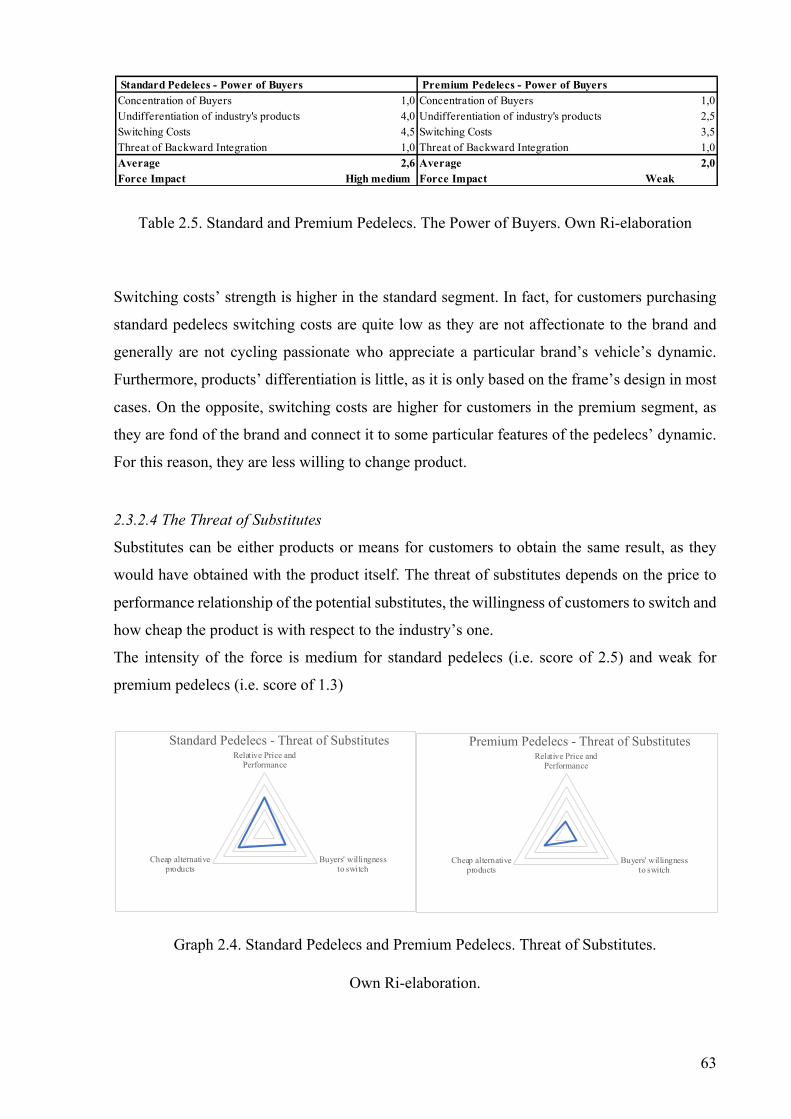
63
Table 2.5. Standard and Premium Pedelecs. The Power of Buyers. Own Ri-elaboration
Switching costs’ strength is higher in the standard segment. In fact, for customers purchasing
standard pedelecs switching costs are quite low as they are not affectionate to the brand and
generally are not cycling passionate who appreciate a particular brand’s vehicle’s dynamic.
Furthermore, products’ differentiation is little, as it is only based on the frame’s design in most
cases. On the opposite, switching costs are higher for customers in the premium segment, as
they are fond of the brand and connect it to some particular features of the pedelecs’ dynamic.
For this reason, they are less willing to change product.
2.3.2.4 The Threat of Substitutes
Substitutes can be either products or means for customers to obtain the same result, as they
would have obtained with the product itself. The threat of substitutes depends on the price to
performance relationship of the potential substitutes, the willingness of customers to switch and
how cheap the product is with respect to the industry’s one.
The intensity of the force is medium for standard pedelecs (i.e. score of 2.5) and weak for
premium pedelecs (i.e. score of 1.3)
Graph 2.4. Standard Pedelecs and Premium Pedelecs. Threat of Substitutes.
Own Ri-elaboration.
Standard Pedelecs - Power of Buyers Premium Pedelecs - Power of BuyersConcentration of Buyers 1,0 Concentration of Buyers 1,0Undifferentiation of industry's products 4,0 Undifferentiation of industry's products 2,5Switching Costs 4,5 Switching Costs 3,5Threat of Backward Integration 1,0 Threat of Backward Integration 1,0Average 2,6 Average 2,0Force Impact High medium Force Impact Weak
Relative Price andPerformance
Buyers' willingnessto switch
Cheap alternativeproducts
Standard Pedelecs - Threat of SubstitutesRelative Price and
Performance
Buyers' willingnessto switch
Cheap alternativeproducts
Premium Pedelecs - Threat of Substitutes
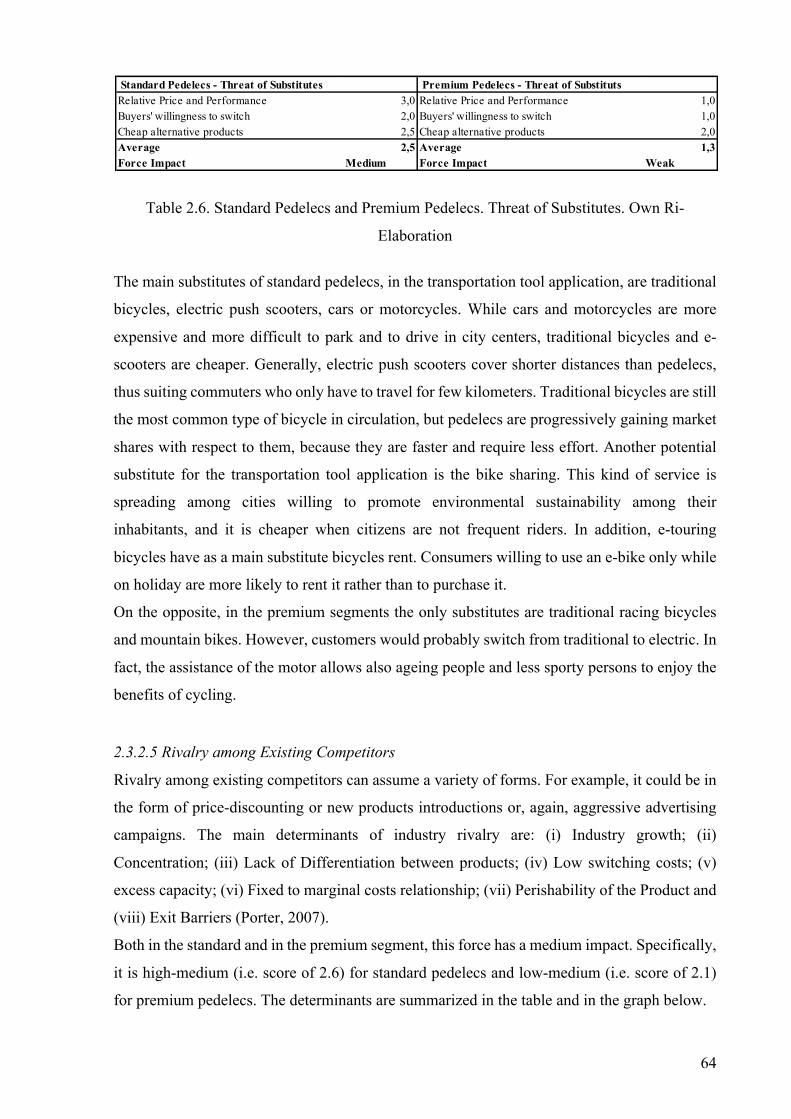
64
Table 2.6. Standard Pedelecs and Premium Pedelecs. Threat of Substitutes. Own Ri-
Elaboration
The main substitutes of standard pedelecs, in the transportation tool application, are traditional
bicycles, electric push scooters, cars or motorcycles. While cars and motorcycles are more
expensive and more difficult to park and to drive in city centers, traditional bicycles and e-
scooters are cheaper. Generally, electric push scooters cover shorter distances than pedelecs,
thus suiting commuters who only have to travel for few kilometers. Traditional bicycles are still
the most common type of bicycle in circulation, but pedelecs are progressively gaining market
shares with respect to them, because they are faster and require less effort. Another potential
substitute for the transportation tool application is the bike sharing. This kind of service is
spreading among cities willing to promote environmental sustainability among their
inhabitants, and it is cheaper when citizens are not frequent riders. In addition, e-touring
bicycles have as a main substitute bicycles rent. Consumers willing to use an e-bike only while
on holiday are more likely to rent it rather than to purchase it.
On the opposite, in the premium segments the only substitutes are traditional racing bicycles
and mountain bikes. However, customers would probably switch from traditional to electric. In
fact, the assistance of the motor allows also ageing people and less sporty persons to enjoy the
benefits of cycling.
2.3.2.5 Rivalry among Existing Competitors
Rivalry among existing competitors can assume a variety of forms. For example, it could be in
the form of price-discounting or new products introductions or, again, aggressive advertising
campaigns. The main determinants of industry rivalry are: (i) Industry growth; (ii)
Concentration; (iii) Lack of Differentiation between products; (iv) Low switching costs; (v)
excess capacity; (vi) Fixed to marginal costs relationship; (vii) Perishability of the Product and
(viii) Exit Barriers (Porter, 2007).
Both in the standard and in the premium segment, this force has a medium impact. Specifically,
it is high-medium (i.e. score of 2.6) for standard pedelecs and low-medium (i.e. score of 2.1)
for premium pedelecs. The determinants are summarized in the table and in the graph below.
Standard Pedelecs - Threat of Substitutes Premium Pedelecs - Threat of SubstitutsRelative Price and Performance 3,0 Relative Price and Performance 1,0Buyers' willingness to switch 2,0 Buyers' willingness to switch 1,0Cheap alternative products 2,5 Cheap alternative products 2,0Average 2,5 Average 1,3Force Impact Medium Force Impact Weak
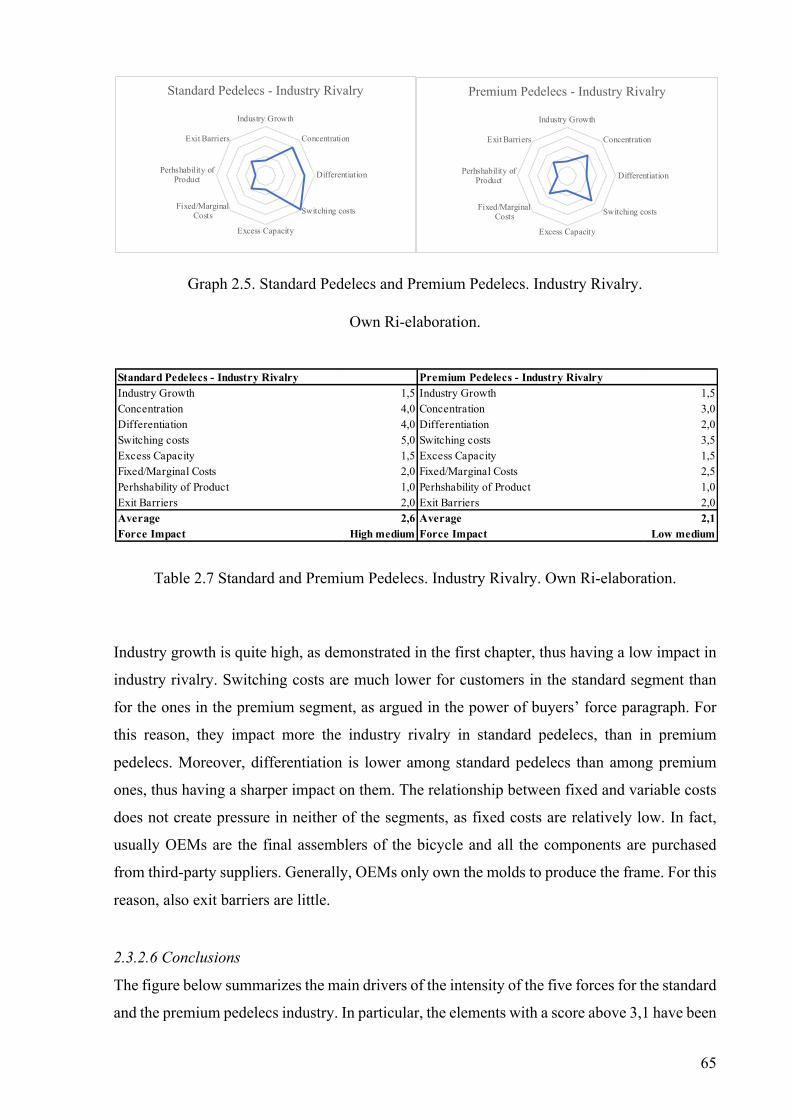
65
Graph 2.5. Standard Pedelecs and Premium Pedelecs. Industry Rivalry.
Own Ri-elaboration.
Table 2.7 Standard and Premium Pedelecs. Industry Rivalry. Own Ri-elaboration.
Industry growth is quite high, as demonstrated in the first chapter, thus having a low impact in
industry rivalry. Switching costs are much lower for customers in the standard segment than
for the ones in the premium segment, as argued in the power of buyers’ force paragraph. For
this reason, they impact more the industry rivalry in standard pedelecs, than in premium
pedelecs. Moreover, differentiation is lower among standard pedelecs than among premium
ones, thus having a sharper impact on them. The relationship between fixed and variable costs
does not create pressure in neither of the segments, as fixed costs are relatively low. In fact,
usually OEMs are the final assemblers of the bicycle and all the components are purchased
from third-party suppliers. Generally, OEMs only own the molds to produce the frame. For this
reason, also exit barriers are little.
2.3.2.6 Conclusions
The figure below summarizes the main drivers of the intensity of the five forces for the standard
and the premium pedelecs industry. In particular, the elements with a score above 3,1 have been
Industry Growth
Concentration
Differentiation
Switching costs
Excess Capacity
Fixed/MarginalCosts
Perhshability ofProduct
Exit Barriers
Standard Pedelecs - Industry Rivalry
Industry Growth
Concentration
Differentiation
Switching costs
Excess Capacity
Fixed/MarginalCosts
Perhshability ofProduct
Exit Barriers
Premium Pedelecs - Industry Rivalry
Standard Pedelecs - Industry Rivalry Premium Pedelecs - Industry RivalryIndustry Growth 1,5 Industry Growth 1,5Concentration 4,0 Concentration 3,0Differentiation 4,0 Differentiation 2,0Switching costs 5,0 Switching costs 3,5Excess Capacity 1,5 Excess Capacity 1,5Fixed/Marginal Costs 2,0 Fixed/Marginal Costs 2,5Perhshability of Product 1,0 Perhshability of Product 1,0Exit Barriers 2,0 Exit Barriers 2,0Average 2,6 Average 2,1Force Impact High medium Force Impact Low medium
66
highlighted. For what concerns standard pedelecs, the power of supplier is the most critical
force. The concentration of suppliers, and in particular of group-sets and drive-unit
manufacturers is high and the players sustain substantial switching costs to change supplier. In
the drive-unit case and, specifically for mid-drive motor pedelecs, the frame is tailored to a
specific drive-unit, thus OEMs cannot change supplier without modifying the whole vehicle.
Furthermore, there are no substitutes of drive-units which OEMs can use to produce a pedelec.
In addition, the low customers’ switching costs in the threat of entry, in the industry rivalry
force and in the power of buyers, as well as low product differentiation in the power of buyers
and in the industry rivalry force are pivotal elements in standard pedelecs industry structure. In
fact, customers can easily change from one bicycle brand to the other. Moreover, as stated in
the value chain analysis, the brand asset is not relevant for standard pedelecs’ consumers, thus
they do not perceive strong differentiation between different companies’ products.
If premium pedelecs are considered, the main determinants of the intensity of Porter’s five
forces are the lack of substitutes for drive-units in the power of suppliers’ force and the low
customers’ switching costs in the threat of entry, in the power of buyers and in industry rivalry
force. In particular, the lack of substitutes for drive-units is more relevant for premium than for
standard pedelecs. In fact, premium pedelecs’ customers are more demanding in terms of
motor’s quality and performance, as stated in the value chain analysis. Furthermore,
notwithstanding the fact that premium pedelecs’ customers are more affectionate to a specific
bicycle brand than standard pedelecs’ ones, customers’ switching costs are low. In fact, it is not
difficult to change from a pedelec to another, as these vehicles are quite easy to drive.
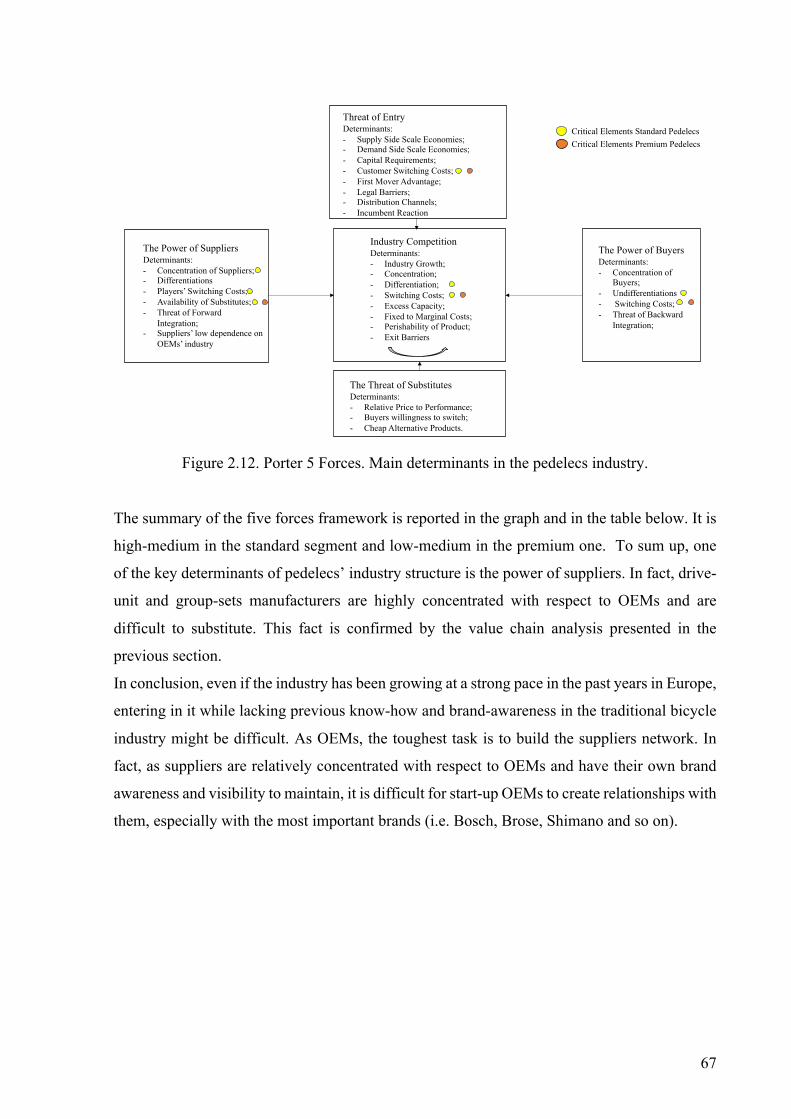
67
Figure 2.12. Porter 5 Forces. Main determinants in the pedelecs industry.
The summary of the five forces framework is reported in the graph and in the table below. It is
high-medium in the standard segment and low-medium in the premium one. To sum up, one
of the key determinants of pedelecs’ industry structure is the power of suppliers. In fact, drive-
unit and group-sets manufacturers are highly concentrated with respect to OEMs and are
difficult to substitute. This fact is confirmed by the value chain analysis presented in the
previous section.
In conclusion, even if the industry has been growing at a strong pace in the past years in Europe,
entering in it while lacking previous know-how and brand-awareness in the traditional bicycle
industry might be difficult. As OEMs, the toughest task is to build the suppliers network. In
fact, as suppliers are relatively concentrated with respect to OEMs and have their own brand
awareness and visibility to maintain, it is difficult for start-up OEMs to create relationships with
them, especially with the most important brands (i.e. Bosch, Brose, Shimano and so on).
The Power of BuyersDeterminants:- Concentration of
Buyers;- Undifferentiations- Switching Costs;- Threat of Backward
Integration;
Threat of EntryDeterminants:- Supply Side Scale Economies;- Demand Side Scale Economies;- Capital Requirements;- Customer Switching Costs;- First Mover Advantage;- Legal Barriers;- Distribution Channels;- Incumbent Reaction
The Power of SuppliersDeterminants:- Concentration of Suppliers;- Differentiations- Players’ Switching Costs;- Availability of Substitutes;- Threat of Forward
Integration;- Suppliers’ low dependence on
OEMs’ industry
Industry CompetitionDeterminants:- Industry Growth;- Concentration;- Differentiation;- Switching Costs;- Excess Capacity;- Fixed to Marginal Costs;- Perishability of Product;- Exit Barriers
Critical Elements Standard PedelecsCritical Elements Premium Pedelecs
The Threat of SubstitutesDeterminants:- Relative Price to Performance;- Buyers willingness to switch;- Cheap Alternative Products.

68
Graph 2.6. Five Forces Summary Standard and Premium Pedelecs.
Table 2.8. Five Force Summary. Standard and Premium Pedelecs
2.4 Pedelecs Industry Analysis: Conclusions
Pedelecs have determined the expansion of the customer base in the bicycle industry. On the
one hand, they allow a broader category of people to cycle despite their physical situation (i.e.
ageing persons or physically impaired). On the other hand, governments in the European Union
and in other developed countries are pushing toward a more sustainable mobility and
environment protection, thus pedelecs have been seen as a tool to reduce pollution and traffic
congestion in city centers. In fact, they are relatively cheap, as they require neither insurance
nor vehicle registration and enjoy all the benefits of traditional bicycles (i.e. riding on bicycle
lanes and moving flexibly around cities).
The demand potential provided by an increasing awareness towards environmental protection,
coming both from governments, which started to ban conventionally-fueled modes of
transportation from city centers, and citizens, and the population’s desire of a healthier and
sustainable lifestyle has attracted many players to this industry. Traditional bicycle OEMs
entered the industry, by differentiating their product base.
In addition, many world-wide multinationals such as Bosch, Shimano, Continental, Panasonic,
Yamaha and many more have entered the market in the most value-adding value chain step in
the pedelecs industry, and have provided the necessary progresses in technology to make the
product’s characteristics suitable to developed-countries customers’ needs. Demand potential
has thus pushed technology progresses which then contributed to a further demand’s boost.
Threat of Entry
The Power ofSuppliers
The Power ofBuyers
Threat ofSubstitutes
Industry Rivarly
Five Forces Summary Standard PedelecsThreat of Entry
The Power ofSuppliers
The Power ofBuyers
Threat ofSubstitutes
Industry Rivarly
Five Forces Summary - Premium Pedelecs
Standard Pedelecs - Five Forces Summary Premium Pedelecs - Five Forces SummaryThreat of Entry 2,4 Threat of Entry 2,6The Power of Suppliers 3,3 The Power of Suppliers 3,5The Power of Buyers 2,6 The Power of Buyers 2,0Threat of Substitutes 2,5 Threat of Substitutes 1,3Industry Rivarly 2,6 Industry Rivarly 2,1Average 2,7 Average 2,3Force Impact High medium Force Impact Low medium

69
Even though some start-ups were born, most of the players active in the pedelecs industry were
already operating in other related industries, such as the traditional bicycle’s or the automotive
ones. As such, they already had either the brand and the bicycle technology or the motor’s
technology know-how, two necessary competences to succeed in this market.

70
71
3. Overview of the Pedelecs Market and Industry: Evidence from Italy
Italy is among the countries in the European Union with the lowest rate of diffusion of the
pedelecs innovation. In fact, with respect to other European countries where this new kind of
bicycle has already spread among citizens, in Italy it is still a novelty and the potential of its
diffusion are still uncertain.
The Italian pedelecs market has been growing at an impressive pace in the latest years (see
chapter 1.5.3.1). The purpose of this section is to understand the impact of electrification in the
Italian bicycle market and industry, the motives behind the growth and the future possible
evolutions of the pedelecs market and industry in Italy
3.1 Pedelecs Market in Italy
3.1.1 Italian Market Overview
Cycling industry is an important sector of the Italian economy. According to a report from
Legambiente (2017) on the economy of cycling, the overall value of the bicycle market in Italy
is around 6,2 billions of euros. This number considers not only the value of the production of
bicycles and bicycle’s parts but also the one of the positive externalities generated by fuel-
savings, cycle-tourism and cycling’s health benefits. Furthermore, according to a study by
Ancma in cooperation with The European Ambrosetti House (2014), the opportunity-cost of
using a two-wheeler vehicle in Italy instead of an auto or other bigger vehicles is of 2,5 billion
of euros, in terms of 72,8 million of days saved every year in transportation times. Pedelecs
have the potential to further increase these benefits as they can be used by a wider portion of
the population, are faster than traditional bicycles and are cheaper than motorcycles or cars.
As stated in chapter 1, pedelecs market in Italy has been growing at a double-digit rate in the
last few years. There are various reasons behind this growth. First of all, according to Mr.
Nigrelli (2019), the progresses in technology have been pivotal for the diffusion of this kind of
vehicle in the Italian market. The e-bike has been in the market for over 20 years, but, in the
beginning, the target of this product were only elderly people. In fact, the first pedelecs were
not suited to Italian customers, who are typically demanding on the esthetics and on the design
side. The vehicle was heavy, it had a hub motor and lead-acid batteries with scarce autonomy.
The entrance of Bosch in the market with its start-up dedicated to e-bike drive systems in 2011,
has been crucial and has allowed to put in the market e-bikes which were completely different
than the ones that previously were in the market. The technology implemented by Bosch
allowed to produce lighter and more efficient vehicles, suited to the demanding Italian market.

72
Furthermore, Bosch’s drive-system has opened the way to new applications in the pedelecs
market, namely the e-mountain bike and the e-road, thus creating new market segments, beyond
the commuting one.
Secondly, Italian national government and municipalities are favoring the adoption of
environmentally-sustainable modes of transportation, while actively contrasting the usage and
the purchase of conventionally-fueled vehicles. Thirdly, pedelecs have widened traditional
bicycle’s consumer base, allowing also physically impaired, old or non-sporty people to access
cycling. In particular, cycle-tourism has become attractive for a wider category of users, as
cycling is easier and less effort-demanding, thanks to the motor’s assistance. Furthermore,
people are increasingly interested in having healthy and environmentally sustainable life-style
and to keep fit.
To sum up, the electrification of the bicycle has had two main impacts in the Italian bicycle
market. On the one hand it has enlarged the possible customer based, as it allows also physically
impaired, unfit and older people to enjoy the benefits of cycling. On the other hand, it has
provided the government and municipalities with an efficient way to lighten traffic jams,
improve urban mobility and reduce emissions in cities’ centers.
Notwithstanding the rapid growth of the latest years, the diffusion of pedelecs in the Italian
market is still in its early stages. In fact, according to a Legambiente report (2017) in Italy there
is one pedelec every 1000 citizens. This proportion is much larger in other European countries,
such as The Netherlands, where there is one pedelec every 66 citizens. Furthermore, only a
small part of Italian citizens (i.e. 2 out of 10) know what a pedal-assisted bicycle is, according
to Mr. Nigrelli (2019). Thus, if Roger’s (2005) diffusion of innovation model is adopted, the
Italian market is still in the “knowledge” phase of innovation adoption. To solve this issue, and
promote the adoption of pedelecs among Italian citizens, many initiatives encouraging pedelecs
usage have been organized throughout the Italian territory. For instance the “Bike-Up Festival”,
a three days event where potential buyers can visit the stands of the pedelecs producers and try
the vehicles for free and the “Giro d’Italia – E”, a competition dedicated to electric road bikes,
which takes place at the same time of the internationally famous “Giro d’Italia” competition,
were organized to increase the awareness about what pedelecs are among Italian citizens.
3.1.2 Italian Government and Municipalities Policies
The Italian government has been adopting regulations to discourage the purchase of polluting
vehicles. In fact, since the 1st of March 2019 whoever buys a new car overtaking a certain
threshold of CO2 emissions is subject to the payment of a fixed amount of tax. The higher the
emissions, the higher the amount to be paid to the government. On contrary, governmental
73
incentives and initiatives to promote environmentally friendly modes of transportation have
spread around the Italian territory. The purpose of these policies it to limit PM-10 emissions
and to reduce pollution, especially in cities’ centers. Those regulations, together with bans of
conventionally-fueled vehicles from cities’ centers are a driver in the adoption of pedelecs, as
well as electric vehicles in general.
Some of the initiatives are at national level, while some others are restricted to a particular
region or city. For instance, at national level, in 2010 the Ministry of Environment allocated 14
million of State funds to promote sustainable mobility. Those funds have been addressed to
municipalities which want to invest in pedelecs rental systems, charging columns installations
or construction of bicycle parking-lots in a public area.
At regional level, for example, the Veneto region in early 2000s has allocated funds to the
capital towns of Treviso, Venice, Padua, Rovigo and Verona to subsidize pedelecs purchases
among its citizens. The project had a great success and lead to the selling of 6,840 new vehicles.
For what concerns municipalities’ initiatives, the municipality of Brescia promoted pedelecs
usage among the municipality employees by purchasing some vehicles which they can use to
commute to work. Moreover, in recent years, other municipalities such as Bologna, and
Bussolengo offered subsidies for the purchase of e-bikes. In addition, the municipality of
Cesena undertook a 2.0 mobility project, offering 0,5 euros to people who decide to commute
by bike for each kilometer run, up to a limit of 2,5 euros per day.
To sum up, the joint action of the bans of conventionally-fueled vehicles and the incentives
provided for the purchase of pedelecs have been a driver for the growth of this market and have
the potential to further boost pedelecs’ sales growth, especially for professional usage. In fact,
as conventionally fueled means of transportations are banned from cities’ centers, some
professional activities, such as delivery services, could switch to e-bikes to be free to circulate
in city centers.
3.1.3 Cycle -Tourism and growth of the potential customer base
As cycling became easier with the advent of pedelecs, more people have become interested and
can have access to a cycle-holiday. Cycle-Tourism is a growing phenomenon, both in Italy and
in the European Union and it includes both holiday cycling (i.e. when the bicycle is used as the
main mode of transportation during the holiday) and cycling on holiday (i.e. when excursions
with the bicycle are made when on holiday).
On the holiday cycling side, in recent years many investments have been undertaken to promote
cycle-tourism. The most relevant example is the EuroVelo project, the European cycling route
network, which involves all European countries where 19 different cycling routes have been
74
built. Three of these routes, namely: (i) the Sun Route, which goes from Malta up until Sweden;
(ii) Via Romea-Francigena, which goes from the Italian region of Puglia to the English Channel
and (iii) the Mediterranean Route, that runs between Spain and Cyprus go throughout the Italian
territory. In 2016 cycling tourism was worth 44 billions euros in the European Union, 2 billions
in Italy. Italian National Institute on Tourism Research (i.e. Isnart) estimated 77,6 million of
cycle-tourists’ presences in Italy in 2018, accounting for the 8,4% of the total tourism in Italy
(Isnart and Legambiente, 2019). According to Isnart, in 2018 the cycle-tourism presences were
up by 41% with respect to 2013. This positive trend is confirmed by the growth of the bike
rental stores in Italy. The data of Confartigianato (2018), the most representative association of
Italian small and medium enterprises, states that rental bike stores have grown by 48,4% from
2012 to 2017. Together with the further development of more infrastructure, pedelecs have the
potential to further increase these numbers. In fact, for what concerns holiday cycling, while
with a traditional bicycle people typically ride for 40-60 kilometers per day, with an e-bike they
could easily get to 100, without any additional effort and without having to worry about running
out of charge, as new advancements in battery’s technology and material have increased a lot
its autonomy (Nigrelli, 2019).
On the cycling on holiday side, when bicycles are used for daily excursions, e-mountain bikes
have had the most relevant diffusion in Italy as the data provided by Mr. Nigrelli testify (i.e.
see chapter 1, paragraph 1.5.3.1). In fact, the possibility that pedelecs provide to users to
complete steep ascents with limited efforts has attracted many people to this sport, thus
enlarging the customer base also to older and unfit people.
New projects are being realized to enhance and sustain cycle-tourism in Italy and in Europe.
An example of these is BikeSquare, which is an online platform, born from the idea of four
friends from the Piemonte region, where users can find out the different cycling routes existing
in the selected geographic area, and places where they can rent e-bikes.
3.1.4 Pedelecs Market Potential in Italy: Interview with Pietro Nigrelli
Mr. Pietro Nigrelli is the head of Confindustria Ancma’s bicycle segment. Confindustria is the
main Italian association representative of service and manufacturing enterprises in Italy and
Ancma is the division dedicated to bicycles and motorcycles manufacturers. Ancma counts
more than 170 enterprises among its associates. Mr. Nigrelli was available for a phone interview
on the 29th of May 2019. After a brief description of the evolution of the pedelecs market in
Italy, Mr. Nigrelli praised its growth potential. He declared that what is most surprising about
this vehicle is the desire that consumer show to try this product and the requests that are being
received by retailers. However, the numbers of pieces sold are still low in absolute terms.

75
According to Mr. Nigrelli, the pedelec can change the paradigm of urban mobility in Italy. In
fact, it allows people to take 8-10 kilometers trip without making any effort. In addition, the 25
km/h speed limit is not that much of an obstacle considering the amount of time that people
spend queuing, stuck in traffic jams. The only true barrier to pedelecs’ diffusion is the lack of
cycling lanes and infrastructure, such as parking lots. As of today, the adoption of pedelecs by
Italian citizens is still low, as well as the product’s awareness. Despite this, the market is
growing at a double-digit rate, and it is not possible to predict when it would stop. Even though
many players have joined the market, there is still room for new entrants, according to Mr.
Nigrelli. Most of the players which started to operate in the pedelecs industry, come from the
traditional bicycle’s one, while some of them from the motorcycle industry. Ancma believes
that this market is really attractive and that the entrance of new players in the market can be
sustained by its growth. Moreover, barriers to entrance are quite low according to Mr. Nigrelli,
considering that the typical pedelecs producers, as for the traditional bicycle industry, are
assemblers. The industry is, in fact, horizontally integrated. In addition, Mr. Nigrelli could not
identify a substitute product with the potential of undermining pedelecs’ diffusion. On the
opposite, suppliers’ power is quite high, as the drive-unit value could reach the 50% of the
whole pedelecs’ value in the case of low-end products.
For what concerns industry trends, consolidation is not happening yet in the Italian pedelecs
industry. In fact, the market is too young, and the product cycle is at its early stages. Players
prefer to stay independent for now, according to Mr. Nigrelli’s view.
On the opposite, in the European Union some automotive groups made acquisitions in order to
enter in the market or to strengthen their position in it. In fact, the German group Mahle, active
in the automotive sector has recently acquired the Spanish start-up Ebikemotion, which
produces e-bike drive-units. Furthermore, in 2017, Bosch eBikeSystems has taken over COBI,
a German start-up producing highly technological displays for e-bikes. In addition, in August
2019, Bosch set up a joint-venture with the German bicycle part manufacturer Magura with the
aim of improving the after-sale service by providing its customers with a complete assistance.
Both acquisitions increased Bosch’s vertical integration. On the bicycle side, Accell Group,
which is the owner, among others, of the Italian Atala has acquired Velosophy, a Netherland
company specialized in the production of e-cargo bikes, in order to widen its product range.
3.2 Pedelecs Industry in Italy
As Mr. Nigrelli declared, the Italian pedelecs market has a great growth potential, thus it could
be attractive for many companies. As such, the next section investigates the players operating
in this market in Italy, first by detecting how many, and which type of players joined the market
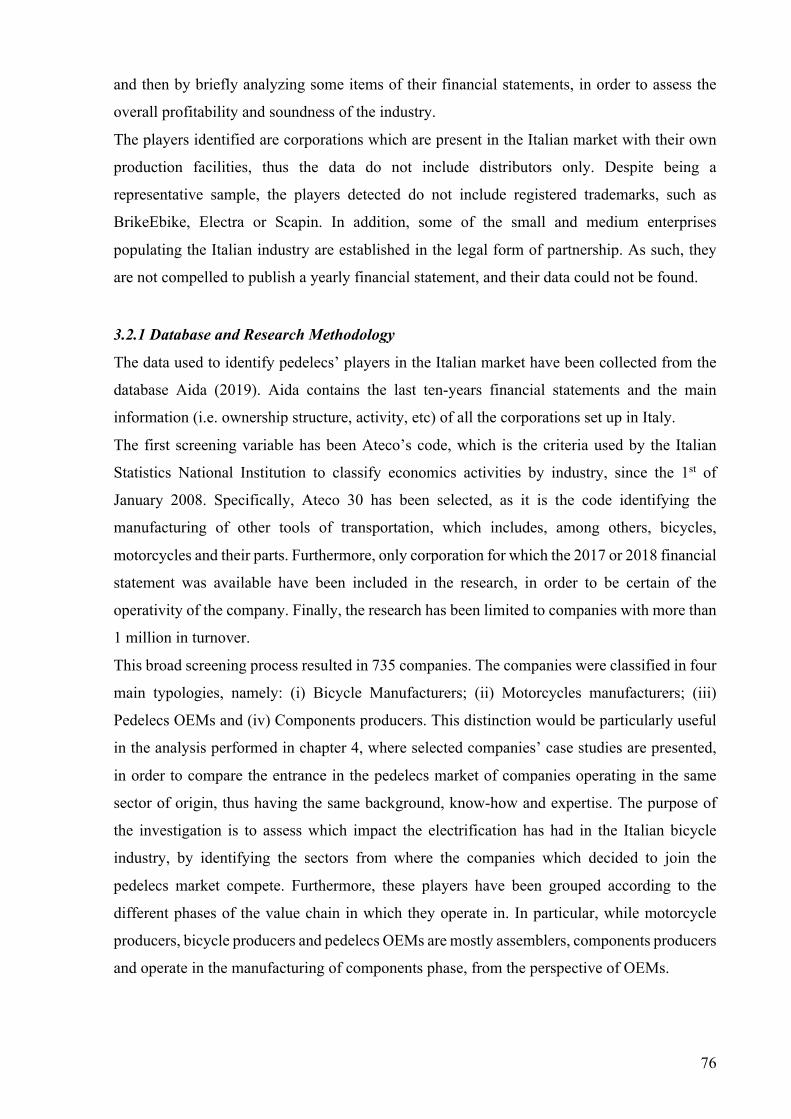
76
and then by briefly analyzing some items of their financial statements, in order to assess the
overall profitability and soundness of the industry.
The players identified are corporations which are present in the Italian market with their own
production facilities, thus the data do not include distributors only. Despite being a
representative sample, the players detected do not include registered trademarks, such as
BrikeEbike, Electra or Scapin. In addition, some of the small and medium enterprises
populating the Italian industry are established in the legal form of partnership. As such, they
are not compelled to publish a yearly financial statement, and their data could not be found.
3.2.1 Database and Research Methodology
The data used to identify pedelecs’ players in the Italian market have been collected from the
database Aida (2019). Aida contains the last ten-years financial statements and the main
information (i.e. ownership structure, activity, etc) of all the corporations set up in Italy.
The first screening variable has been Ateco’s code, which is the criteria used by the Italian
Statistics National Institution to classify economics activities by industry, since the 1st of
January 2008. Specifically, Ateco 30 has been selected, as it is the code identifying the
manufacturing of other tools of transportation, which includes, among others, bicycles,
motorcycles and their parts. Furthermore, only corporation for which the 2017 or 2018 financial
statement was available have been included in the research, in order to be certain of the
operativity of the company. Finally, the research has been limited to companies with more than
1 million in turnover.
This broad screening process resulted in 735 companies. The companies were classified in four
main typologies, namely: (i) Bicycle Manufacturers; (ii) Motorcycles manufacturers; (iii)
Pedelecs OEMs and (iv) Components producers. This distinction would be particularly useful
in the analysis performed in chapter 4, where selected companies’ case studies are presented,
in order to compare the entrance in the pedelecs market of companies operating in the same
sector of origin, thus having the same background, know-how and expertise. The purpose of
the investigation is to assess which impact the electrification has had in the Italian bicycle
industry, by identifying the sectors from where the companies which decided to join the
pedelecs market compete. Furthermore, these players have been grouped according to the
different phases of the value chain in which they operate in. In particular, while motorcycle
producers, bicycle producers and pedelecs OEMs are mostly assemblers, components producers
and operate in the manufacturing of components phase, from the perspective of OEMs.
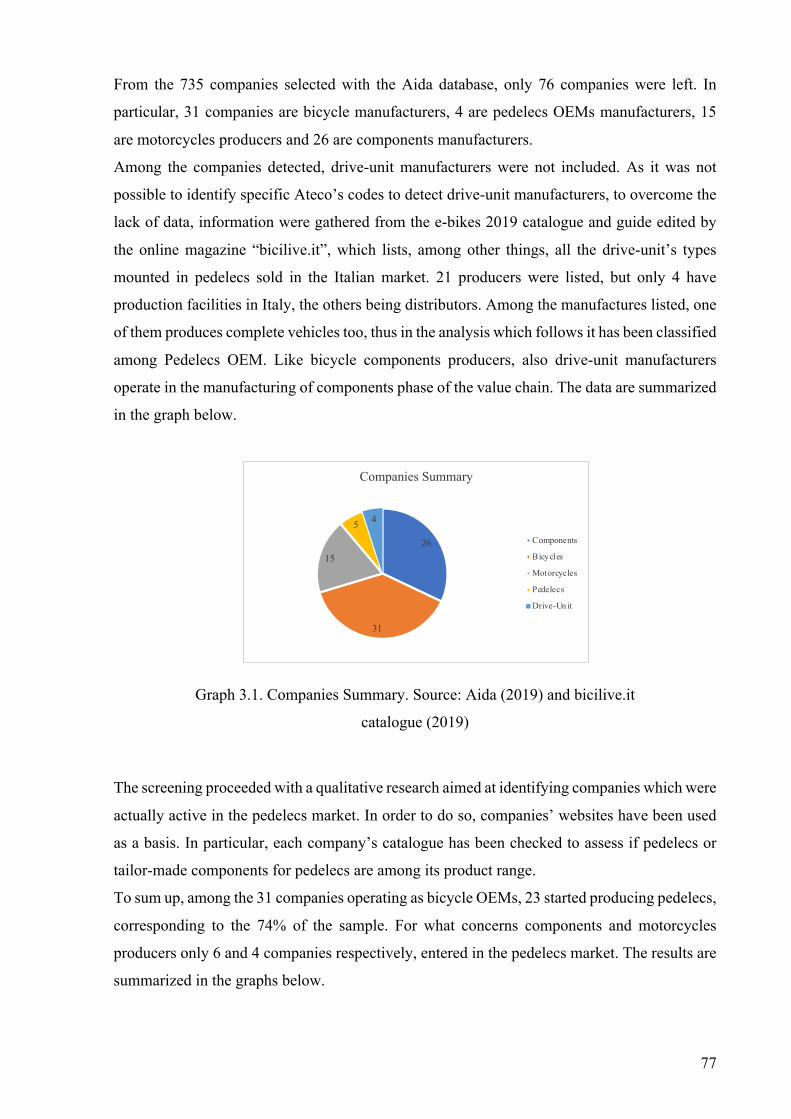
77
From the 735 companies selected with the Aida database, only 76 companies were left. In
particular, 31 companies are bicycle manufacturers, 4 are pedelecs OEMs manufacturers, 15
are motorcycles producers and 26 are components manufacturers.
Among the companies detected, drive-unit manufacturers were not included. As it was not
possible to identify specific Ateco’s codes to detect drive-unit manufacturers, to overcome the
lack of data, information were gathered from the e-bikes 2019 catalogue and guide edited by
the online magazine “bicilive.it”, which lists, among other things, all the drive-unit’s types
mounted in pedelecs sold in the Italian market. 21 producers were listed, but only 4 have
production facilities in Italy, the others being distributors. Among the manufactures listed, one
of them produces complete vehicles too, thus in the analysis which follows it has been classified
among Pedelecs OEM. Like bicycle components producers, also drive-unit manufacturers
operate in the manufacturing of components phase of the value chain. The data are summarized
in the graph below.
Graph 3.1. Companies Summary. Source: Aida (2019) and bicilive.it
catalogue (2019)
The screening proceeded with a qualitative research aimed at identifying companies which were
actually active in the pedelecs market. In order to do so, companies’ websites have been used
as a basis. In particular, each company’s catalogue has been checked to assess if pedelecs or
tailor-made components for pedelecs are among its product range.
To sum up, among the 31 companies operating as bicycle OEMs, 23 started producing pedelecs,
corresponding to the 74% of the sample. For what concerns components and motorcycles
producers only 6 and 4 companies respectively, entered in the pedelecs market. The results are
summarized in the graphs below.
26
31
15
5 4
Companies Summary
Components
Bicycles
Motorcycles
Pedelecs
Drive-Un it
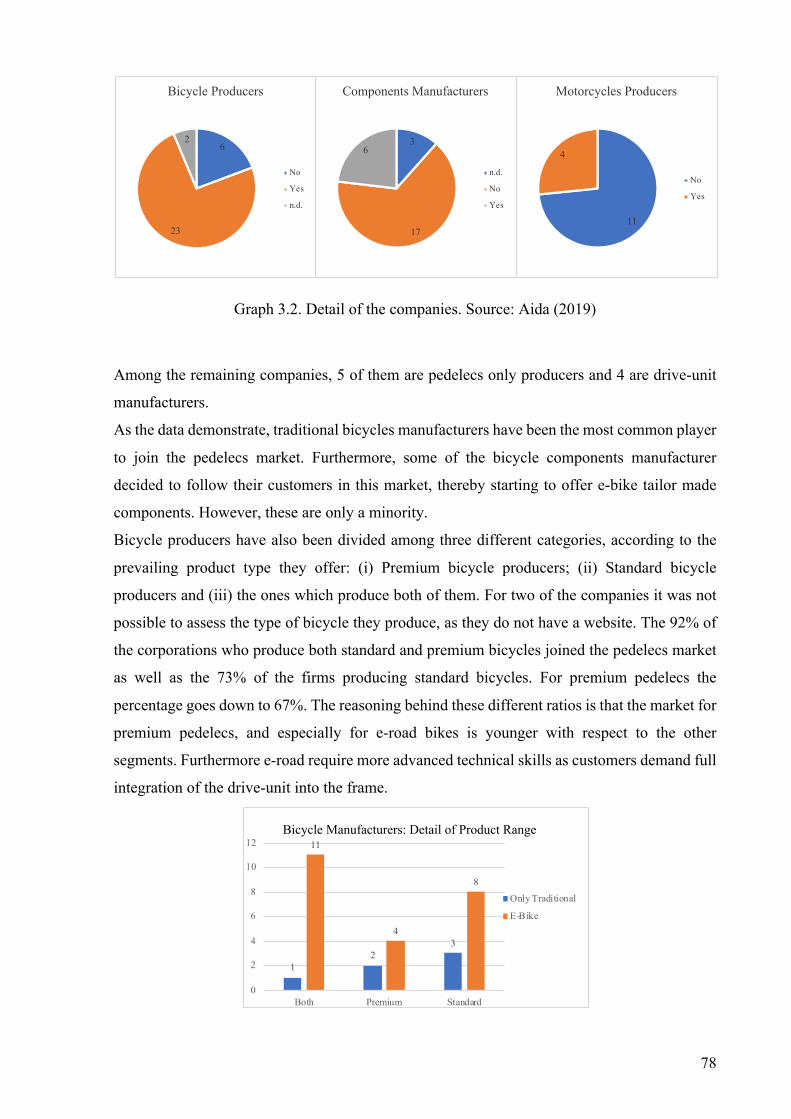
78
Graph 3.2. Detail of the companies. Source: Aida (2019)
Among the remaining companies, 5 of them are pedelecs only producers and 4 are drive-unit
manufacturers.
As the data demonstrate, traditional bicycles manufacturers have been the most common player
to join the pedelecs market. Furthermore, some of the bicycle components manufacturer
decided to follow their customers in this market, thereby starting to offer e-bike tailor made
components. However, these are only a minority.
Bicycle producers have also been divided among three different categories, according to the
prevailing product type they offer: (i) Premium bicycle producers; (ii) Standard bicycle
producers and (iii) the ones which produce both of them. For two of the companies it was not
possible to assess the type of bicycle they produce, as they do not have a website. The 92% of
the corporations who produce both standard and premium bicycles joined the pedelecs market
as well as the 73% of the firms producing standard bicycles. For premium pedelecs the
percentage goes down to 67%. The reasoning behind these different ratios is that the market for
premium pedelecs, and especially for e-road bikes is younger with respect to the other
segments. Furthermore e-road require more advanced technical skills as customers demand full
integration of the drive-unit into the frame.
11
4
Motorcycles Producers
No
Yes
6
23
2
Bicycle Producers
No
Yes
n.d.
3
17
6
Components Manufacturers
n.d.
No
Yes
12
3
11
4
8
0
2
4
6
8
10
12
Both Premium Standard
Only Traditional
E-Bike
Bicycle Manufacturers: Detail of Product Range
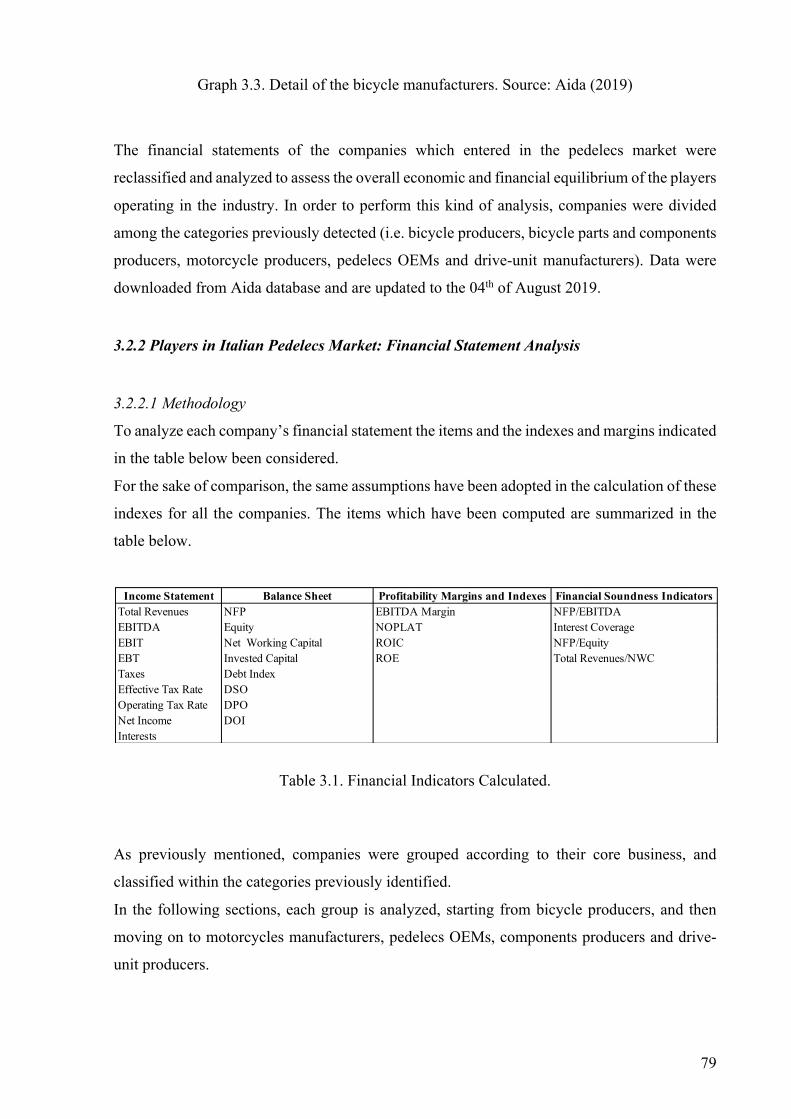
79
Graph 3.3. Detail of the bicycle manufacturers. Source: Aida (2019)
The financial statements of the companies which entered in the pedelecs market were
reclassified and analyzed to assess the overall economic and financial equilibrium of the players
operating in the industry. In order to perform this kind of analysis, companies were divided
among the categories previously detected (i.e. bicycle producers, bicycle parts and components
producers, motorcycle producers, pedelecs OEMs and drive-unit manufacturers). Data were
downloaded from Aida database and are updated to the 04th of August 2019.
3.2.2 Players in Italian Pedelecs Market: Financial Statement Analysis
3.2.2.1 Methodology
To analyze each company’s financial statement the items and the indexes and margins indicated
in the table below been considered.
For the sake of comparison, the same assumptions have been adopted in the calculation of these
indexes for all the companies. The items which have been computed are summarized in the
table below.
Table 3.1. Financial Indicators Calculated.
As previously mentioned, companies were grouped according to their core business, and
classified within the categories previously identified.
In the following sections, each group is analyzed, starting from bicycle producers, and then
moving on to motorcycles manufacturers, pedelecs OEMs, components producers and drive-
unit producers.
Income Statement Balance Sheet Profitability Margins and Indexes Financial Soundness IndicatorsTotal Revenues NFP EBITDA Margin NFP/EBITDAEBITDA Equity NOPLAT Interest CoverageEBIT Net Working Capital ROIC NFP/EquityEBT Invested Capital ROE Total Revenues/NWC Taxes Debt IndexEffective Tax Rate DSOOperating Tax Rate DPONet Income DOIInterests
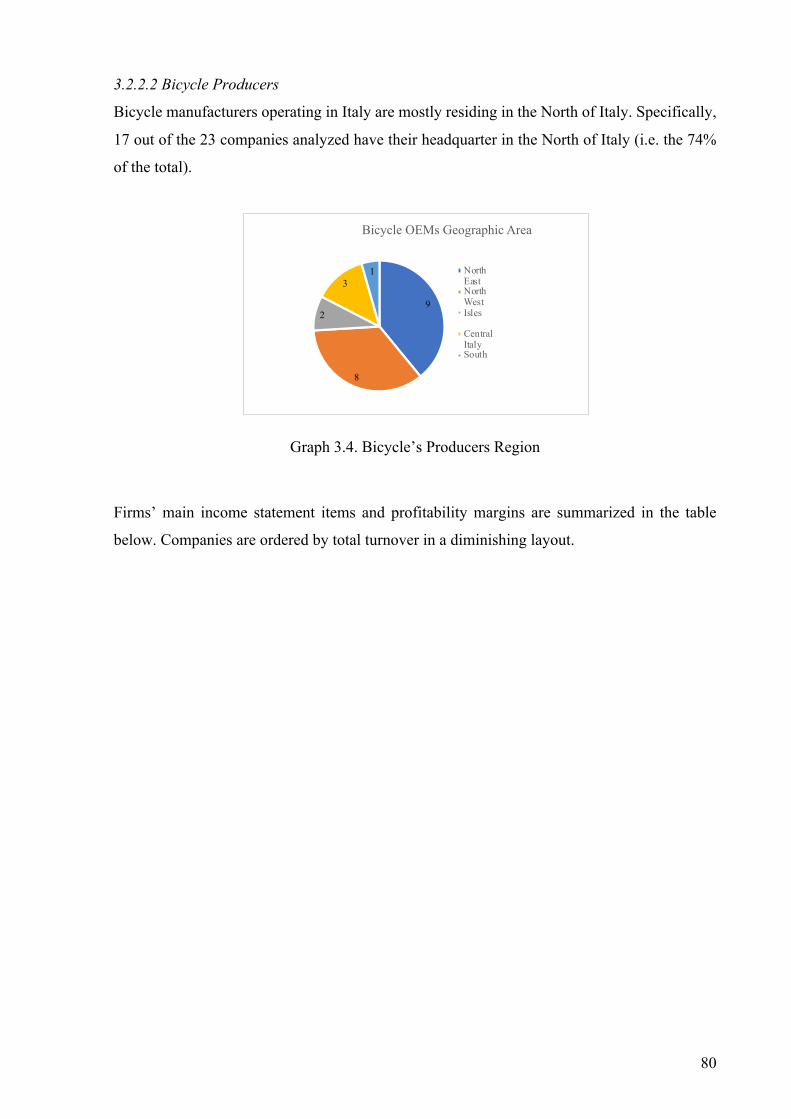
80
3.2.2.2 Bicycle Producers
Bicycle manufacturers operating in Italy are mostly residing in the North of Italy. Specifically,
17 out of the 23 companies analyzed have their headquarter in the North of Italy (i.e. the 74%
of the total).
Graph 3.4. Bicycle’s Producers Region
Firms’ main income statement items and profitability margins are summarized in the table
below. Companies are ordered by total turnover in a diminishing layout.
9
8
2
31
Bicycle OEMs Geographic Area
NorthEastNorthWestIsles
CentralItalySouth
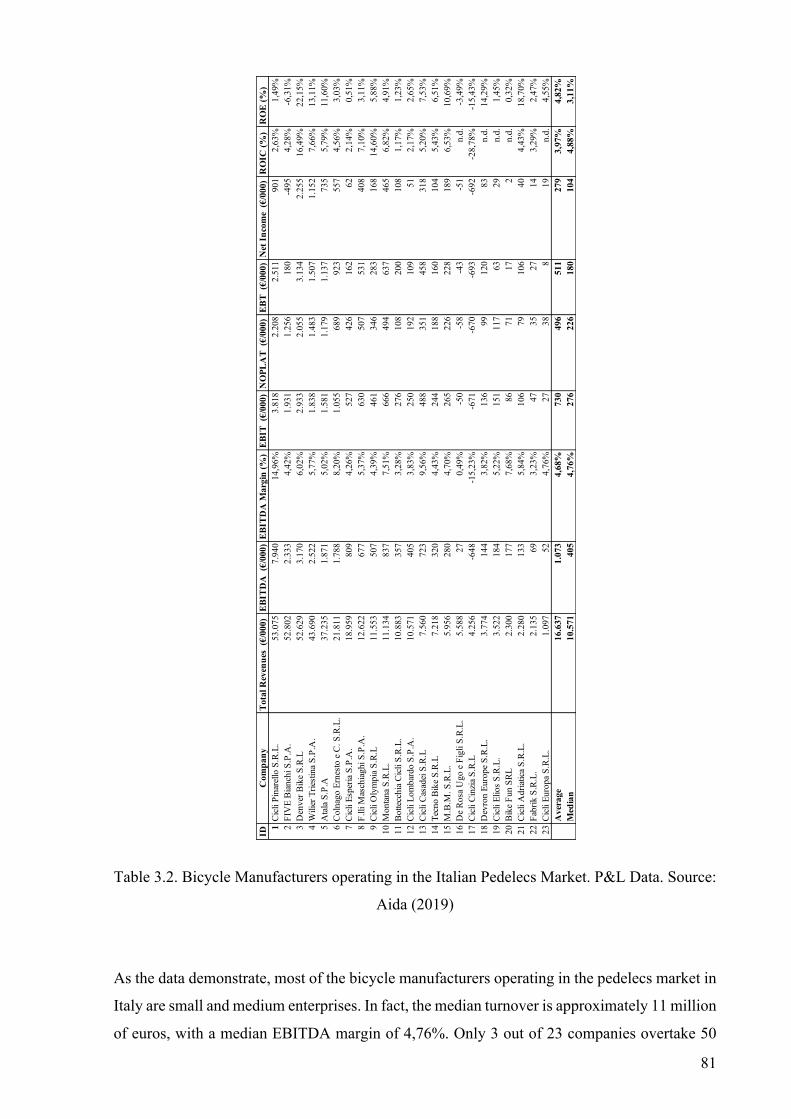
81
Table 3.2. Bicycle Manufacturers operating in the Italian Pedelecs Market. P&L Data. Source:
Aida (2019)
As the data demonstrate, most of the bicycle manufacturers operating in the pedelecs market in
Italy are small and medium enterprises. In fact, the median turnover is approximately 11 million
of euros, with a median EBITDA margin of 4,76%. Only 3 out of 23 companies overtake 50
IDC
ompa
nyTo
tal R
even
ues
(€/0
00)
EBIT
DA
(€/
000)
EBIT
DA
Mar
gin
(%)
EBIT
(€/
000)
NO
PLA
T (€
/000
)EB
T (€
/000
)N
et In
com
e (€
/000
)R
OIC
(%)
RO
E (%
)1
Cic
li P
inar
ello
S.R
.L.
53.0
757.
940
14,9
6%3.
818
2.20
82.
511
901
2,63
%1,
49%
2F
IVE
Bia
nchi
S.P
.A.
52.8
022.
333
4,42
%1.
931
1.25
618
0-4
954,
28%
-6,3
1%3
Den
ver
Bik
e S
.R.L
52.6
293.
170
6,02
%2.
933
2.05
53.
134
2.25
516
,49%
22,1
5%4
Wili
er T
ries
tina
S.P
.A.
43.6
902.
522
5,77
%1.
838
1.48
31.
507
1.15
27,
66%
13,1
1%5
Ata
la S
.P.A
37.2
351.
871
5,02
%1.
581
1.17
91.
137
735
5,79
%11
,60%
6C
olna
go E
rnes
to e
C. S
.R.L
.21
.811
1.78
88,
20%
1.05
568
992
355
74,
56%
3,03
%7
Cic
li E
sper
ia S
.P.A
.18
.959
809
4,26
%52
742
616
262
2,14
%0,
51%
8F
.lli M
asch
iagh
i S.P
.A.
12.6
2267
75,
37%
630
507
531
408
7,10
%3,
11%
9C
icli
Oly
mpi
a S
.R.L
11.5
5350
74,
39%
461
346
283
168
14,6
0%5,
88%
10M
onta
na S
.R.L
.11
.134
837
7,51
%66
649
463
746
56,
82%
4,91
%11
Bot
tecc
hia
Cic
li S
.R.L
.10
.883
357
3,28
%27
610
820
010
81,
17%
1,23
%12
Cic
li L
omba
rdo
S.P
.A.
10.5
7140
53,
83%
250
192
109
512,
17%
2,65
%13
Cic
li C
asad
ei S
.R.L
7.56
072
39,
56%
488
351
458
318
5,20
%7,
53%
14T
ecno
Bik
e S
.R.L
7.21
832
04,
43%
244
188
160
104
5,43
%6,
51%
15M
.B.M
. S.R
.L.
5.95
628
04,
70%
265
226
228
189
6,53
%10
,69%
16D
e R
osa
Ugo
e F
igli
S.R
.L.
5.58
827
0,49
%-5
0-5
8-4
3-5
1n.
d.-3
,49%
17C
icli
Cin
zia
S.R
.L4.
256
-648
-15,
23%
-671
-670
-693
-692
-28,
78%
-15,
43%
18D
evro
n E
urop
e S
.R.L
.3.
774
144
3,82
%13
699
120
83n.
d.14
,29%
19C
icli
Elio
s S
.R.L
.3.
522
184
5,22
%15
111
763
29n.
d.1,
45%
20B
ike
Fun
SR
L2.
300
177
7,68
%86
7117
2n.
d.0,
32%
21C
icli
Adr
iatic
a S
.R.L
.2.
280
133
5,84
%10
679
106
404,
43%
18,7
0%22
Fab
rik
S.R
.L.
2.13
569
3,23
%47
3527
143,
29%
2,47
%23
Cic
li E
urop
a S
.R.L
.1.
097
524,
76%
2738
819
n.d.
4,55
%A
vera
ge16
.637
1.07
34,
68%
730
496
511
279
3,97
%4,
82%
Med
ian
10.5
7140
54,
76%
276
226
180
104
4,88
%3,
11%
82
million of turnover. Overall, companies’ core business is generating value, as only one of them
has a negative EBITDA margin. Moreover, only 3 of them suffered a loss in the year considered
(i.e. the latest available in Aida database). The median ROIC is 4,88%, thus the profitability of
bicycle OEMs is generally positive, even though margins are thin.
The table below reports balance sheet’s data.
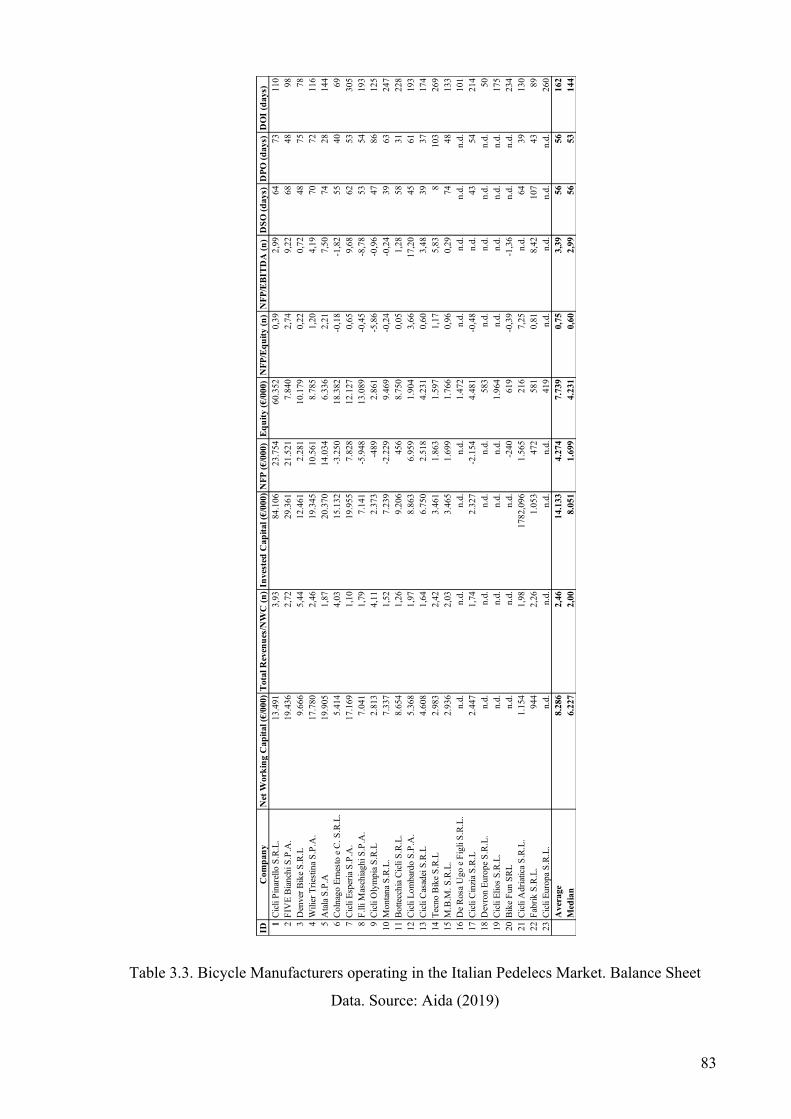
83
Table 3.3. Bicycle Manufacturers operating in the Italian Pedelecs Market. Balance Sheet
Data. Source: Aida (2019)
IDC
ompa
nyN
et W
orki
ng C
apita
l (€/
000)
Tota
l Rev
enue
s/NW
C (n
)In
vest
ed C
apita
l (€/
000)
NFP
(€/0
00)
Equi
ty (€
/000
)N
FP/E
quity
(n)
NFP
/EBI
TDA
(n)
DSO
(day
s)D
PO (d
ays)
DO
I (da
ys)
1C
icli
Pin
arel
lo S
.R.L
.13
.491
3,93
84.1
0623
.754
60.3
520,
392,
9964
7311
0
2F
IVE
Bia
nchi
S.P
.A.
19.4
362,
7229
.361
21.5
217.
840
2,74
9,22
6848
98
3D
enve
r B
ike
S.R
.L9.
666
5,44
12.4
612.
281
10.1
790,
220,
7248
7578
4W
ilier
Tri
estin
a S
.P.A
.17
.780
2,46
19.3
4510
.561
8.78
51,
204,
1970
7211
6
5A
tala
S.P
.A19
.905
1,87
20.3
7014
.034
6.33
62,
217,
5074
2814
4
6C
olna
go E
rnes
to e
C. S
.R.L
.5.
414
4,03
15.1
32-3
.250
18.3
82-0
,18
-1,8
255
4069
7C
icli
Esp
eria
S.P
.A.
17.1
691,
1019
.955
7.82
812
.127
0,65
9,68
6253
305
8F
.lli M
asch
iagh
i S.P
.A.
7.04
11,
797.
141
-5.9
4813
.089
-0,4
5-8
,78
5354
193
9C
icli
Oly
mpi
a S
.R.L
2.81
34,
112.
373
-489
2.86
1-5
,86
-0,9
647
8612
5
10M
onta
na S
.R.L
.7.
337
1,52
7.23
9-2
.229
9.46
9-0
,24
-0,2
439
6324
7
11B
otte
cchi
a C
icli
S.R
.L.
8.65
41,
269.
206
456
8.75
00,
051,
2858
3122
8
12C
icli
Lom
bard
o S
.P.A
.5.
368
1,97
8.86
36.
959
1.90
43,
6617
,20
4561
193
13C
icli
Cas
adei
S.R
.L4.
608
1,64
6.75
02.
518
4.23
10,
603,
4839
3717
4
14T
ecno
Bik
e S
.R.L
2.98
32,
423.
461
1.86
31.
597
1,17
5,83
810
326
9
15M
.B.M
. S.R
.L.
2.93
62,
033.
465
1.69
91.
766
0,96
0,29
7448
133
16D
e R
osa
Ugo
e F
igli
S.R
.L.
n.d.
n.d.
n.d.
n.d.
1.47
2n.
d.n.
d.n.
d.n.
d.10
1
17C
icli
Cin
zia
S.R
.L2.
447
1,74
2.32
7-2
.154
4.48
1-0
,48
n.d.
4354
214
18D
evro
n E
urop
e S
.R.L
.n.
d.n.
d.n.
d.n.
d.58
3n.
d.n.
d.n.
d.n.
d.50
19C
icli
Elio
s S
.R.L
.n.
d.n.
d.n.
d.n.
d.1.
964
n.d.
n.d.
n.d.
n.d.
175
20B
ike
Fun
SR
Ln.
d.n.
d.n.
d.-2
4061
9-0
,39
-1,3
6n.
d.n.
d.23
4
21C
icli
Adr
iatic
a S
.R.L
.1.
154
1,98
1782
,096
1.56
521
67,
25n.
d.64
3913
0
22F
abri
k S
.R.L
.94
42,
261.
053
472
581
0,81
8,42
107
4389
23C
icli
Eur
opa
S.R
.L.
n.d.
n.d.
n.d.
n.d.
419
n.d.
n.d.
n.d.
n.d.
260
Ave
rage
8.28
62,
4614
.133
4.27
47.
739
0,75
3,39
5656
162
Med
ian
6.22
72,
008.
051
1.69
94.
231
0,60
2,99
5653
144
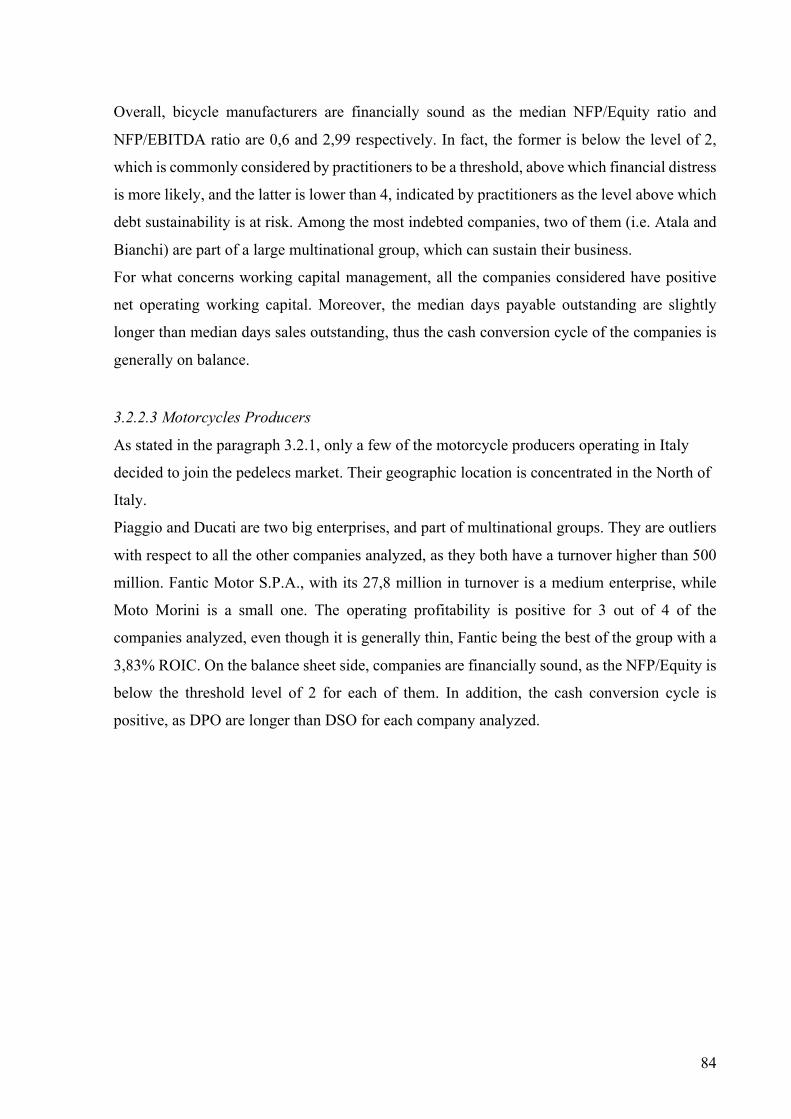
84
Overall, bicycle manufacturers are financially sound as the median NFP/Equity ratio and
NFP/EBITDA ratio are 0,6 and 2,99 respectively. In fact, the former is below the level of 2,
which is commonly considered by practitioners to be a threshold, above which financial distress
is more likely, and the latter is lower than 4, indicated by practitioners as the level above which
debt sustainability is at risk. Among the most indebted companies, two of them (i.e. Atala and
Bianchi) are part of a large multinational group, which can sustain their business.
For what concerns working capital management, all the companies considered have positive
net operating working capital. Moreover, the median days payable outstanding are slightly
longer than median days sales outstanding, thus the cash conversion cycle of the companies is
generally on balance.
3.2.2.3 Motorcycles Producers
As stated in the paragraph 3.2.1, only a few of the motorcycle producers operating in Italy
decided to join the pedelecs market. Their geographic location is concentrated in the North of
Italy.
Piaggio and Ducati are two big enterprises, and part of multinational groups. They are outliers
with respect to all the other companies analyzed, as they both have a turnover higher than 500
million. Fantic Motor S.P.A., with its 27,8 million in turnover is a medium enterprise, while
Moto Morini is a small one. The operating profitability is positive for 3 out of 4 of the
companies analyzed, even though it is generally thin, Fantic being the best of the group with a
3,83% ROIC. On the balance sheet side, companies are financially sound, as the NFP/Equity is
below the threshold level of 2 for each of them. In addition, the cash conversion cycle is
positive, as DPO are longer than DSO for each company analyzed.
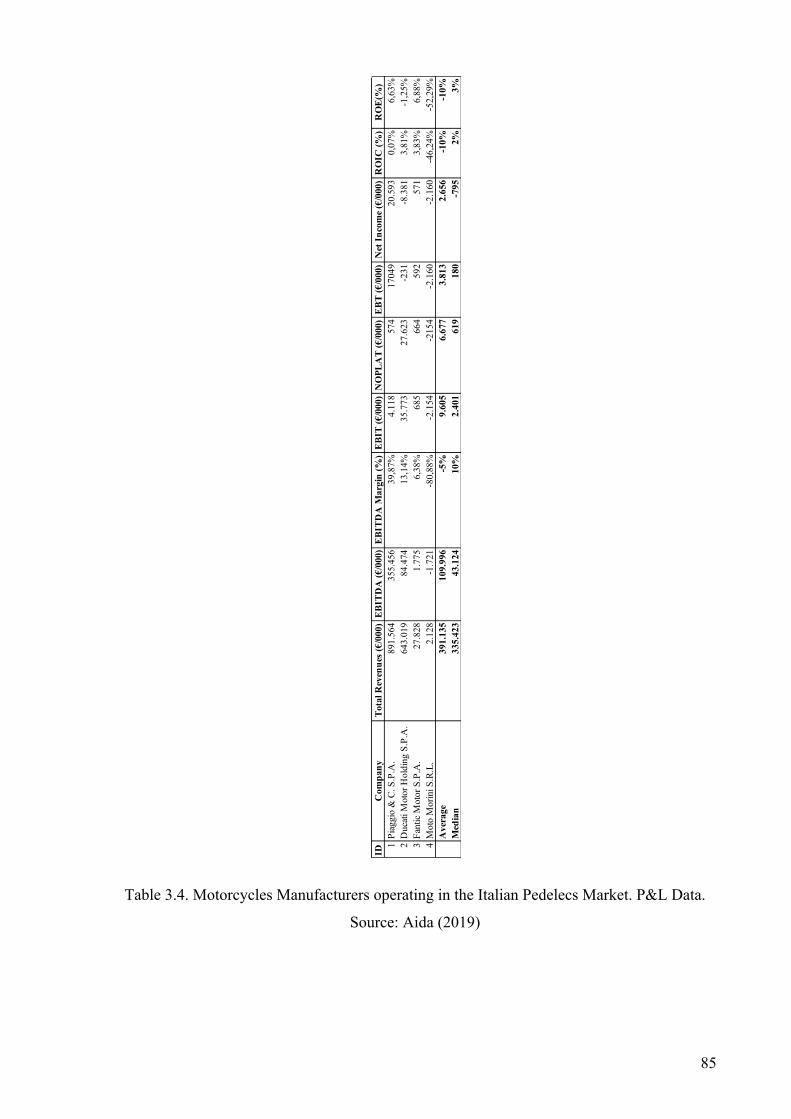
85
Table 3.4. Motorcycles Manufacturers operating in the Italian Pedelecs Market. P&L Data.
Source: Aida (2019)
ID
Co
mp
an
yT
ota
l R
ev
en
ues (
€/0
00
)E
BIT
DA
(€
/00
0)
EB
IT
DA
Ma
rg
in (
%)
EB
IT
(€
/00
0)
NO
PL
AT
(€
/00
0)
EB
T (
€/0
00
)N
et
In
co
me (
€/0
00
)R
OIC
(%
)R
OE
(%)
1Pi
aggi
o &
C. S
.P.A
.89
1.56
435
5.45
639
,87%
4.11
857
417
049
20.5
930,
07%
6,63
%2
Duc
ati M
otor
Hol
ding
S.P
.A.
643.
019
84.4
7413
,14%
35.7
7327
.623
-231
-8.3
813,
81%
-1,2
5%3
Fant
ic M
otor
S.P
.A.
27.8
281.
775
6,38
%68
566
459
257
13,
83%
6,88
%4
Mot
o M
orin
i S.R
.L.
2.12
8-1
.721
-80,
88%
-2.1
54-2
154
-2.1
60-2
.160
-46,
24%
-52,
29%
Av
era
ge
39
1.1
35
10
9.9
96
-5%
9.6
05
6.6
77
3.8
13
2.6
56
-10
%-1
0%
Med
ian
33
5.4
23
43
.12
41
0%
2.4
01
61
91
80
-79
52
%3
%
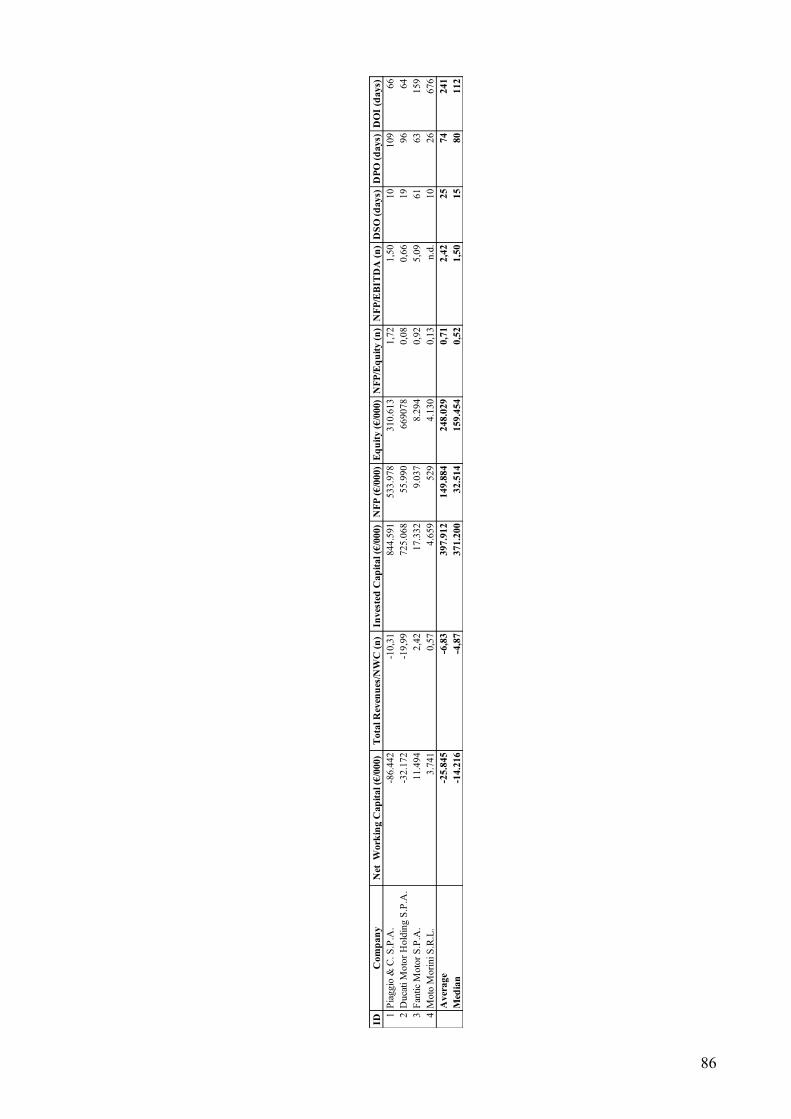
86
IDC
ompa
nyN
et W
orki
ng C
apita
l (€/
000)
Tota
l Rev
enue
s/NW
C (n
)In
vest
ed C
apita
l (€/
000)
NFP
(€/0
00)
Equi
ty (€
/000
)N
FP/E
quity
(n)
NFP
/EBI
TDA
(n)
DSO
(day
s)D
PO (d
ays)
DO
I (da
ys)
1Pi
aggi
o &
C. S
.P.A
.-8
6.44
2-1
0,31
844.
591
533.
978
310.
613
1,72
1,50
1010
966
2D
ucati
Mot
or H
oldi
ng S
.P.A
.-3
2.17
2-1
9,99
725.
068
55.9
9066
9078
0,08
0,66
1996
643
Fant
ic M
otor
S.P
.A.
11.4
942,
4217
.332
9.03
78.
294
0,92
5,09
6163
159
4M
oto
Mor
ini S
.R.L
.3.
741
0,57
4.65
952
94.
130
0,13
n.d.
1026
676
Ave
rage
-25.
845
-6,8
339
7.91
214
9.88
424
8.02
90,
712,
4225
7424
1M
edia
n-1
4.21
6-4
,87
371.
200
32.5
1415
9.45
40,
521,
5015
8011
2
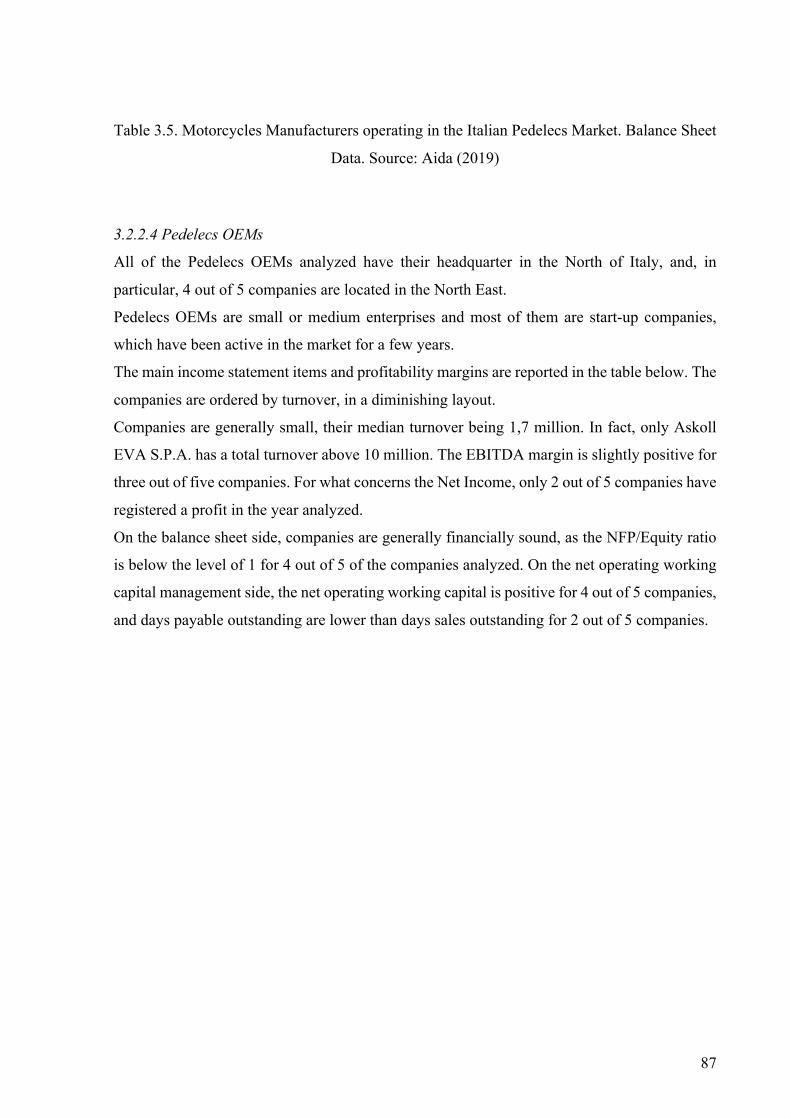
87
Table 3.5. Motorcycles Manufacturers operating in the Italian Pedelecs Market. Balance Sheet
Data. Source: Aida (2019)
3.2.2.4 Pedelecs OEMs
All of the Pedelecs OEMs analyzed have their headquarter in the North of Italy, and, in
particular, 4 out of 5 companies are located in the North East.
Pedelecs OEMs are small or medium enterprises and most of them are start-up companies,
which have been active in the market for a few years.
The main income statement items and profitability margins are reported in the table below. The
companies are ordered by turnover, in a diminishing layout.
Companies are generally small, their median turnover being 1,7 million. In fact, only Askoll
EVA S.P.A. has a total turnover above 10 million. The EBITDA margin is slightly positive for
three out of five companies. For what concerns the Net Income, only 2 out of 5 companies have
registered a profit in the year analyzed.
On the balance sheet side, companies are generally financially sound, as the NFP/Equity ratio
is below the level of 1 for 4 out of 5 of the companies analyzed. On the net operating working
capital management side, the net operating working capital is positive for 4 out of 5 companies,
and days payable outstanding are lower than days sales outstanding for 2 out of 5 companies.
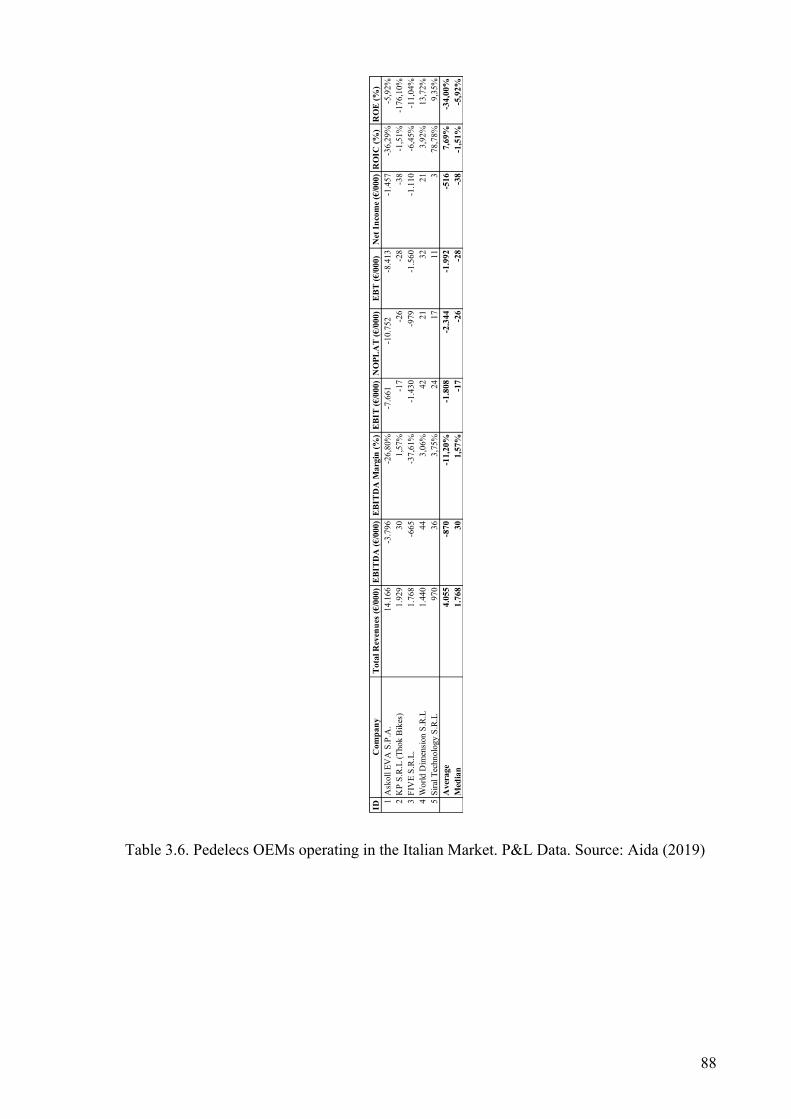
88
Table 3.6. Pedelecs OEMs operating in the Italian Market. P&L Data. Source: Aida (2019)
IDC
om
pa
ny
To
tal
Rev
enu
es (
€/0
00
)E
BIT
DA
(€
/00
0)
EB
ITD
A M
arg
in (
%)
EB
IT (
€/0
00
)N
OP
LA
T (
€/0
00
)E
BT
(€
/00
0)
Net
In
com
e (€
/00
0)
RO
IC (
%)
RO
E (
%)
1A
skol
l EV
A S
.P.A
.14
.166
-3.7
96-2
6,80
%-7
.661
-1
0.75
2 -8
.413
-1.4
57-3
6,29
%-5
,92%
2K
P S.
R.L
(Tho
k B
ikes
)1.
929
301,
57%
-17
-26
-28
-38
-1,5
1%-1
76,1
0%3
FIV
E S.
R.L
.1.
768
-665
-37,
61%
-1.4
30-9
79-1
.560
-1.1
10-6
,45%
-11,
04%
4W
orld
Dim
ensi
on S
.R.L
1.44
044
3,06
%42
2132
213,
92%
13,7
2%5
Sira
l Tec
hnol
ogy
S.R
.L97
036
3,75
%24
1711
378
,78%
9,35
%A
ver
ag
e4
.05
5-8
70
-11
,20
%-1
.80
8-2
.34
4-1
.99
2-5
16
7,6
9%
-34
,00
%
Med
ian
1.7
68
30
1,5
7%
-17
-26
-28
-38
-1,5
1%
-5,9
2%

89
Table 3.7. Pedelecs OEMs operating in the Italian Market. Balance Sheet Data. Source: Aida
(2019)
ID
Com
pan
yN
et
Work
ing C
ap
ital (€
/000)
Tota
l R
even
ues/N
WC
(n
)In
veste
d C
ap
ital (€
/000)
NF
P (
€/0
00)
Eq
uit
y (
€/0
00)
NF
P/E
qu
ity (
n)
NF
P/E
BIT
DA
(n
)D
SO
(d
ays)
DP
O (
days)
DO
I (
days)
1A
skol
l EV
A S
.P.A
.10
.156
1,39
29
.630
5.00
224
.628
0,20
n.d.
41
79
115
2K
P S
.R.L
(T
hok
Bik
es)
1.57
11,
23
1.71
21.
690
2179
,11
55,9
138
922
93
FIV
E S
.R.L
.8.
070
0,22
15
.187
5.13
610
.051
0,51
n.d.
3129
512
4W
orld
Dim
ensi
on S
.R.L
541
2,66
54
646
581
0,17
10,5
476
2587
5S
iral
Tec
hnol
ogy
S.R
.L-6
2-1
5,72
21
-16
37-0
,43
-0,4
426
104
79A
verage
4.0
55
-2,0
49.4
19
2.4
55
6.9
64
15,9
122,0
043
49
204
Med
ian
1.5
71
1,2
31.7
12
1.6
90
81
0,2
010,5
438
29
115

90
3.2.2.5 Components Manufacturers
Bicycle components’ manufacturers which decided to follow their customers into the e-bike
market by developing specific product varieties are the 20% of the players identified with the
methodology described in paragraph 3.2.1. 5 out of 6 of these companies have their headquarter
in the North East of Italy, and in particular in the Veneto Region and only one in Lombardy.
The main income statement items and profitability indexes are reported in the table below.
Companies are ordered by turnover, in a diminishing layout.
As depicted in the table below, on average, components manufacturers active in the pedelecs
market are smaller than bicycle manufacturers. In fact, only one firm has a turnover which is
higher than 20 million. Nonetheless, the median EBITDA margin and the median ROIC are
both positive, respectively 6,58% and 5,74% and both higher than the median indexes for
bicycle manufacturers.
As balance sheet data demonstrate, components’ manufacturers are generally financially sound.
The median NFP/Equity index is 0,01 and none of the companies has an index above the level
of 0,32. Furthermore, their debt is generally sustainable. In fact, the median NFP/EBITDA
index is 0,05 and the indicator is above the threshold level of 4 only for one company.
Furthermore, the net operating working capital is positive for 5 out of 6 companies. In addition,
the median DPO is higher than the median DSO, meaning that companies generally obtain a
longer payment dilation from their supplier than they grant to their clients, thus managing
efficiently their cash conversion cycle.
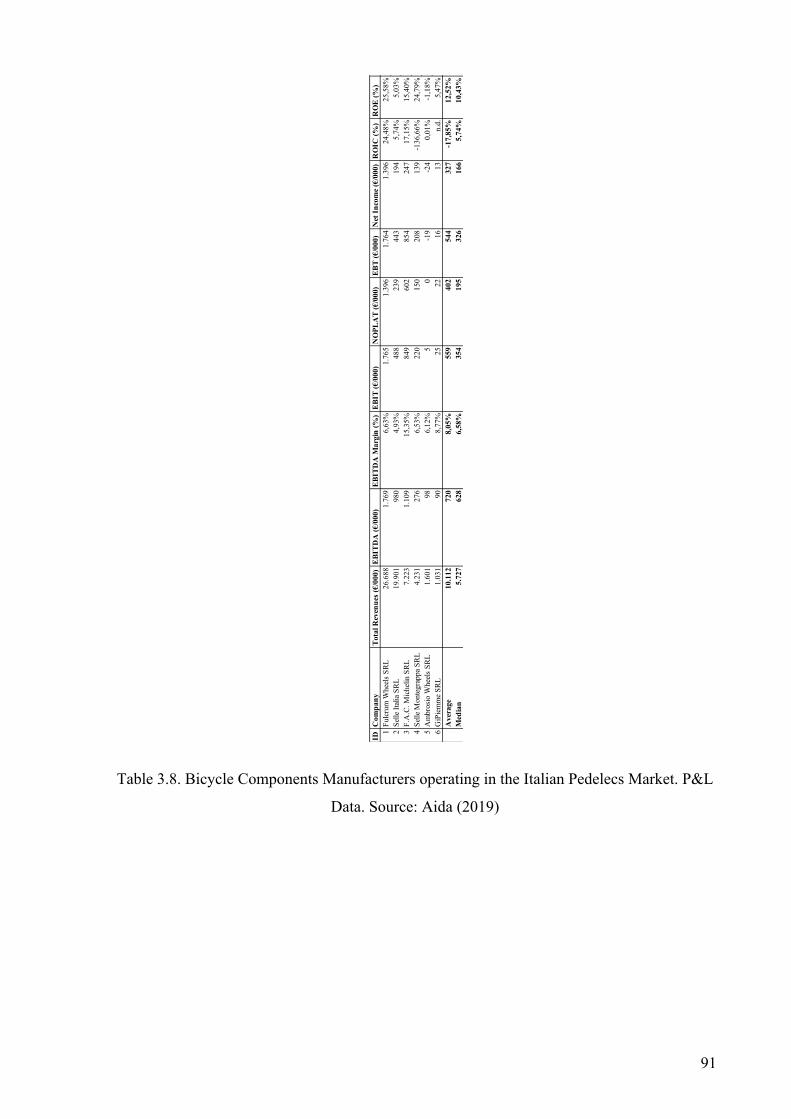
91
Table 3.8. Bicycle Components Manufacturers operating in the Italian Pedelecs Market. P&L
Data. Source: Aida (2019)
IDC
om
pa
ny
Tota
l R
even
ues
(€
/000
)E
BIT
DA
(€/0
00)
EB
ITD
A M
arg
in (
%)
EB
IT (
€/0
00
)N
OP
LA
T (
€/0
00
)E
BT
(€
/000
)N
et I
nco
me
(€/0
00
)R
OIC
(%
)R
OE
(%
)
1Fu
lcru
m W
heel
s SR
L26
.688
1.76
96,
63%
1.76
51.
396
1.76
41.
396
24,4
8%25
,58%
2Se
lle It
alia
SR
L19
.901
980
4,93
%48
823
944
319
45,
74%
5,03
%3
F.A
.C. M
iche
lin S
RL
7.22
31.
109
15,3
5%84
960
285
424
717
,15%
15,4
0%4
Selle
Mon
tegr
appa
SR
L4.
231
276
6,53
%22
015
020
813
9-1
36,6
6%24
,79%
5A
mbr
osio
Whe
els
SRL
1.60
198
6,12
%5
0-1
9-2
40,
01%
-1,1
8%6
GiP
iem
me
SRL
1.03
190
8,77
%25
2216
13n.
d.5,
47%
Av
erag
e10
.112
72
08
,05
%5
59
402
544
327
-17,8
5%
12,5
2%
Med
ian
5.7
27
62
86
,58
%3
54
195
326
166
5,7
4%
10,4
3%

92
Table 3.9. Bicycle Components Manufacturers operating in the Italian Pedelecs Market.
Balance Sheet Data. Source: Aida (2019)
3.2.2.6 Drive-Unit Manufactures
As for the other companies analyzed, most of the drive-unit manufacturers have their
headquarter in the North of Italy.
ID
Com
pan
yN
et
Work
ing C
ap
ital (€
/000)
Tota
l R
even
ues/N
WC
(n
)In
veste
d C
ap
ital (€
/000)
NF
P (
€/0
00)
Eq
uit
y (
€/0
00)
NF
P/E
qu
ity (
n)
NF
P/E
BIT
DA
(n
)D
SO
(d
ays)
DP
O (
days)
DO
I(d
ays)
1Fu
lcru
m W
heel
s SR
L5.
307
5,03
5.70
124
65.
455
0,05
0,14
3810
272
Selle
Ital
ia S
RL
4.82
94,
124.
159
300
3.85
90,
080,
3181
6957
3F.
A.C
. Mic
helin
SR
L3.
879
1,86
3.50
8-4
323.
940
-0,1
1-0
,39
7378
156
4Se
lle M
onte
grap
pa S
RL
-193
-21,
90-1
10-6
7056
0-1
,20
-2,4
351
839
5A
mbr
osio
Whe
els
SRL
1.32
21,
212.
741
667
2.07
40,
326,
8015
418
231
36
GiP
iem
me
SRL
n.d.
n.d.
n.d.
-423
8-0
,02
-0,0
555
n.d.
250
Average
3.0
29
-1,9
43.2
00
18
2.6
88
-0,1
50,7
375
84
135
Med
ian
3.8
79
1,8
63.5
08
121
2.9
67
0,0
10,0
564
78
106
93
Drive-unit manufacturers can be divided into two classes, specifically the ones which only
produce drive-unit for pedelecs (i.e. Bikee Bike S.R.L. and Zehus S.P.A.) and the ones which
have a different core-business (i.e. Oli S.P.A. and Polini Motori S.P.A.) and decided to diversify
their product range by entering in the pedelecs market.
Two of the drive-unit producers are start-up companies, while the other two have a stable
business. Both the start-up companies have a negative EBITDA margin, and a negative ROE.
Polini Motori S.P.A. presented a good economic performance in the year considered. However,
this is not true for Oli S.P.A., which has a slightly positive EBITDA margin, but has registered
a loss in the year considered.
On the balance sheet side, the companies are heterogenous. Generally, they are financially
sound, as neither of them has a NFP/Equity ratio above the threshold level of 2. Finally, all but
one company have longer days payable outstanding than days sales outstanding, thus they
manage efficiently their cash conversion cycle. The data are summarized in the two tables
presented below.
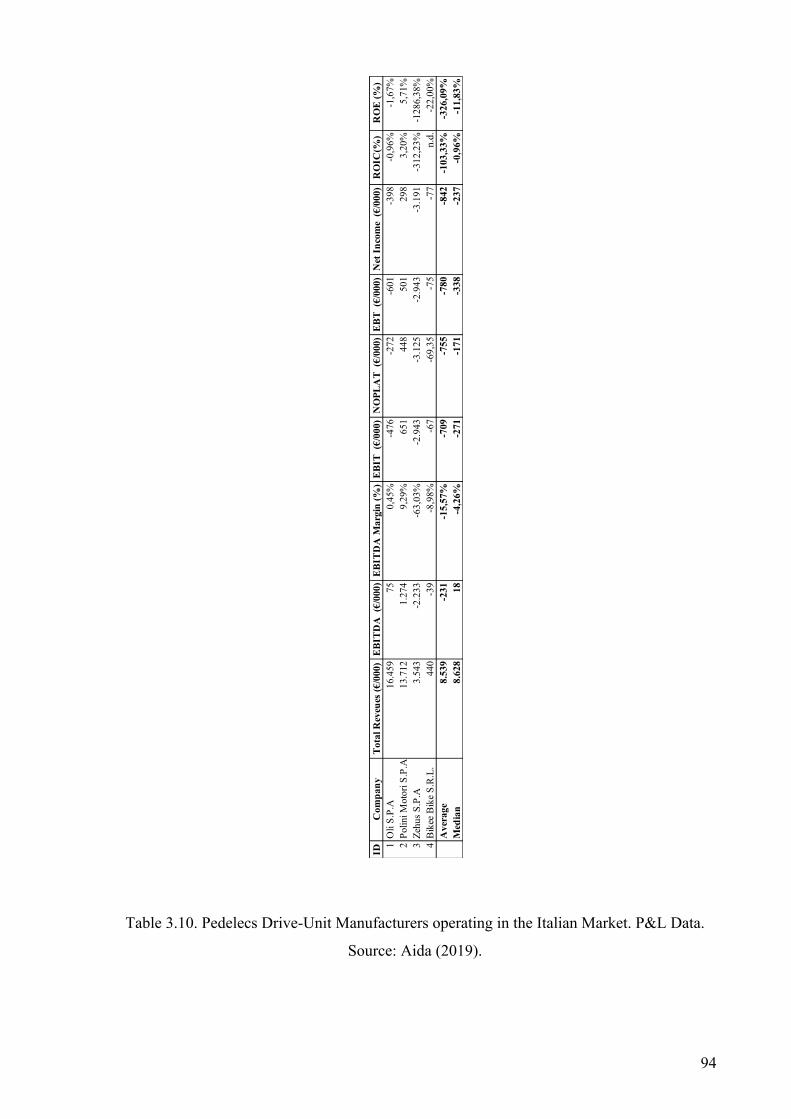
94
Table 3.10. Pedelecs Drive-Unit Manufacturers operating in the Italian Market. P&L Data.
Source: Aida (2019).
IDC
ompa
nyTo
tal R
eveu
es (€
/000
)EB
ITD
A (
€/00
0)EB
ITD
A M
argi
n (%
)EB
IT (
€/00
0)N
OPL
AT
(€/0
00)
EBT
(€/0
00)
Net
Inco
me
(€/0
00)
RO
IC(%
)R
OE
(%)
1O
li S.
P.A
16.4
5975
0,45
%-4
76-2
72-6
01-3
98-0
,96%
-1,6
7%2
Polin
i Mot
ori S
.P.A
13.7
121.
274
9,29
%65
144
850
129
83,
20%
5,71
%3
Zehu
s S.P
.A3.
543
-2.2
33-6
3,03
%-2
.943
-3.1
25-2
.943
-3.1
91-3
12,2
3%-1
286,
38%
4Bi
kee B
ike S
.R.L
.44
0-3
9-8
,98%
-67
-69,
35-7
5-7
7n.
d.-2
2,00
%A
vera
ge8.
539
-231
-15,
57%
-709
-755
-780
-842
-103
,33%
-326
,09%
Med
ian
8.62
818
-4,2
6%-2
71-1
71-3
38-2
37-0
,96%
-11,
83%
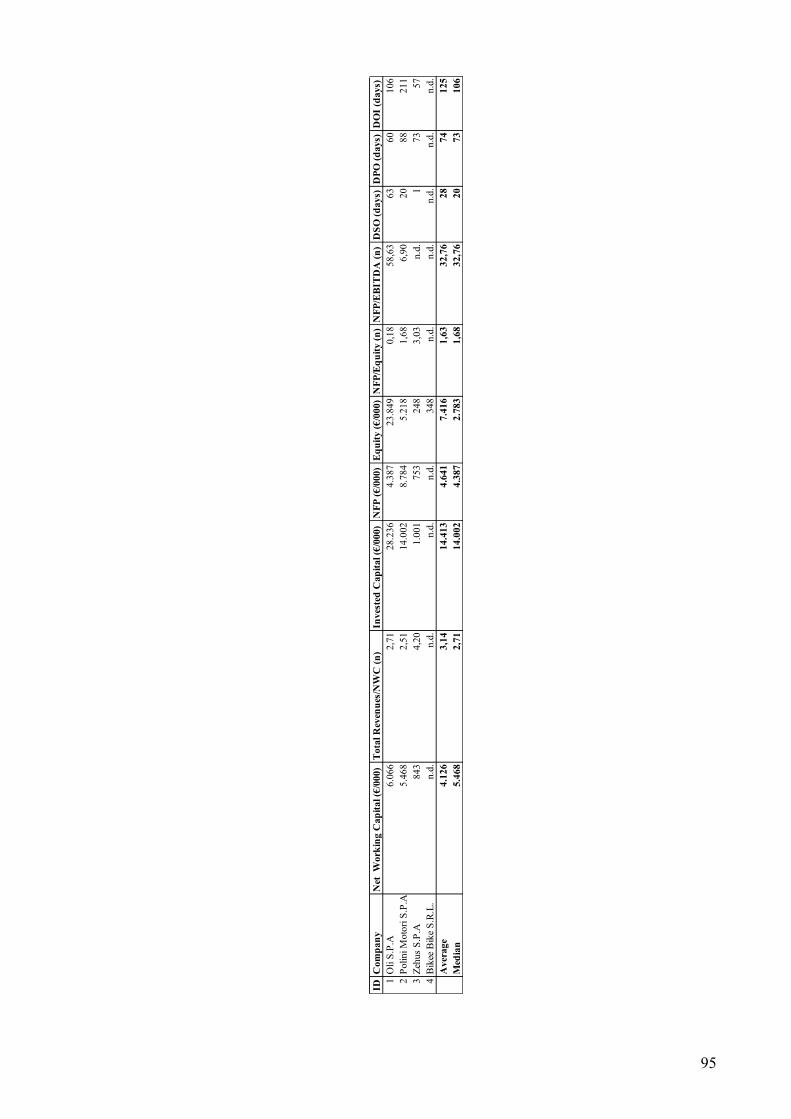
95
ID
Co
mp
an
yN
et
Wo
rk
ing
Ca
pit
al
(€/0
00
)T
ota
l R
ev
en
ues/N
WC
(n
)In
veste
d C
ap
ita
l (€
/00
0)
NF
P (
€/0
00
)E
qu
ity
(€
/00
0)
NF
P/E
qu
ity
(n
)N
FP
/EB
IT
DA
(n
)D
SO
(d
ay
s)
DP
O (
da
ys)
DO
I (
da
ys)
1O
li S.
P.A
6.06
62,
7128
.236
4.38
723
.849
0,18
58,6
363
6010
62
Polin
i Mot
ori S
.P.A
5.46
82,
5114
.002
8.78
45.
218
1,68
6,90
2088
211
3Ze
hus S
.P.A
843
4,20
1.00
175
324
83,
03n.
d.1
7357
4Bi
kee B
ike S
.R.L
.n.
d.n.
d.n.
d.n.
d.34
8n.
d.n.
d.n.
d.n.
d.n.
d.A
vera
ge
4.1
26
3,1
41
4.4
13
4.6
41
7.4
16
1,6
33
2,7
62
87
41
25
Med
ian
5.4
68
2,7
11
4.0
02
4.3
87
2.7
83
1,6
83
2,7
62
07
31
06
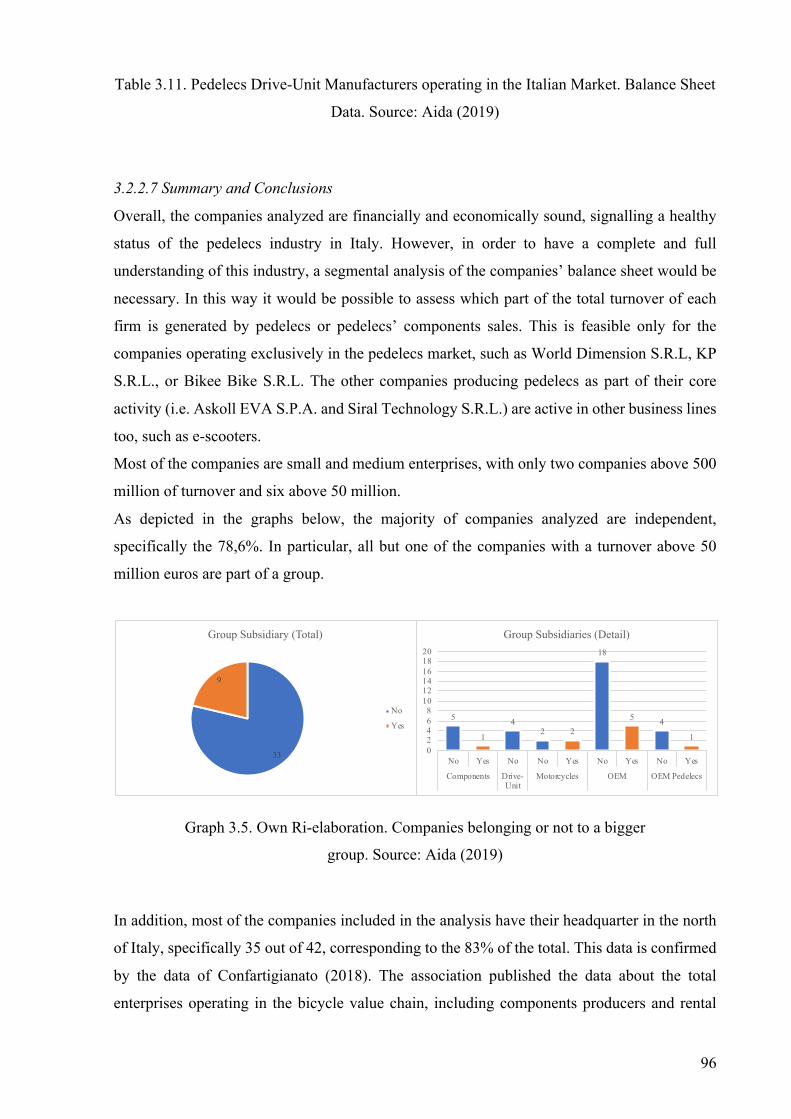
96
Table 3.11. Pedelecs Drive-Unit Manufacturers operating in the Italian Market. Balance Sheet
Data. Source: Aida (2019)
3.2.2.7 Summary and Conclusions
Overall, the companies analyzed are financially and economically sound, signalling a healthy
status of the pedelecs industry in Italy. However, in order to have a complete and full
understanding of this industry, a segmental analysis of the companies’ balance sheet would be
necessary. In this way it would be possible to assess which part of the total turnover of each
firm is generated by pedelecs or pedelecs’ components sales. This is feasible only for the
companies operating exclusively in the pedelecs market, such as World Dimension S.R.L, KP
S.R.L., or Bikee Bike S.R.L. The other companies producing pedelecs as part of their core
activity (i.e. Askoll EVA S.P.A. and Siral Technology S.R.L.) are active in other business lines
too, such as e-scooters.
Most of the companies are small and medium enterprises, with only two companies above 500
million of turnover and six above 50 million.
As depicted in the graphs below, the majority of companies analyzed are independent,
specifically the 78,6%. In particular, all but one of the companies with a turnover above 50
million euros are part of a group.
Graph 3.5. Own Ri-elaboration. Companies belonging or not to a bigger
group. Source: Aida (2019)
In addition, most of the companies included in the analysis have their headquarter in the north
of Italy, specifically 35 out of 42, corresponding to the 83% of the total. This data is confirmed
by the data of Confartigianato (2018). The association published the data about the total
enterprises operating in the bicycle value chain, including components producers and rental
5
1
42 2
18
5 4
102468
101214161820
No Yes No No Yes No Yes No Yes
Components Drive-Unit
Motorcycles OEM OEM Pedelecs
Group Subsidiaries (Detail)
33
9
Group Subsidiary (Total)
No
Yes

97
stores. The 67% have their headquarter in the North of Italy, while about 19% in the Central
Italy and the 6% and the 8% respectively in the Isles and in the South of Italy.
Graph 3.6. Analyzed Companies’ Geographic Region. Source: Aida (2019).
3.2.3 Pedelecs Industry in Italy: Conclusions
As previously stated, the majority of the players who joined the pedelecs market are traditional
bicycles manufacturers. The state of the art of Italian pedelecs’ industry is therefore in line with
the value chain analysis presented in chapter 2. In fact, the majority of the players along the
value chain are vehicles’ assemblers, while drive-unit manufacturers are a minority.
Specifically, 32 out of 42 companies are pedelecs manufacturers while only 4 are drive-unit
producers.
6 start-ups have recently joined the market in the form of corporations, namely the 14% of the
total players analyzed.
In the next chapter the case studies of some of the companies analyzed are presented, in order
to understand the reasoning behind their choice of joining the pedelecs market, which are the
key success factors to operate in it, and the main difficulties that they had to face in order to
enter. Furthermore, firms have been asked if the entrance in this market has required the
acquisition of new skills and capabilities to compete in it and in which ways these capabilities
have been acquired (i.e. by hiring personnel, or by undertaking strategic partnerships by other
firms, or by means of M&A deals).
2213
24 1
Analyzed Companies' Geographic Region
North-EastNorth-WestIslesCentral ItalySouth

98
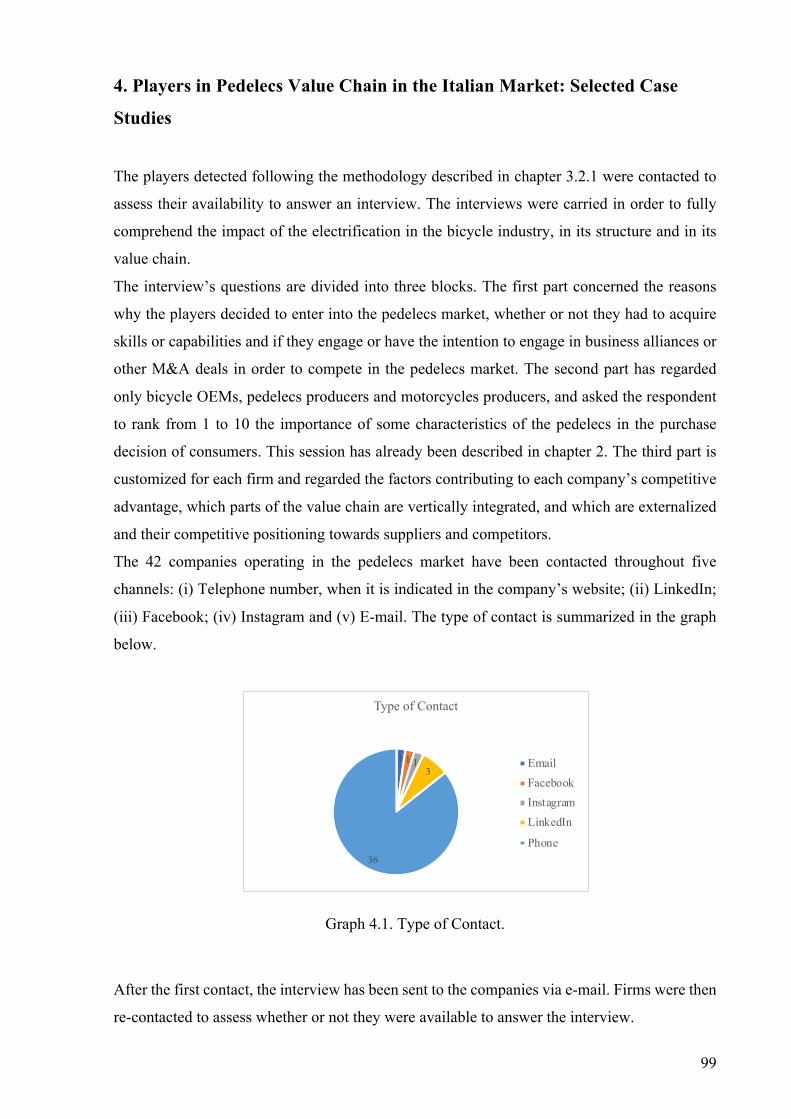
99
4. Players in Pedelecs Value Chain in the Italian Market: Selected Case
Studies
The players detected following the methodology described in chapter 3.2.1 were contacted to
assess their availability to answer an interview. The interviews were carried in order to fully
comprehend the impact of the electrification in the bicycle industry, in its structure and in its
value chain.
The interview’s questions are divided into three blocks. The first part concerned the reasons
why the players decided to enter into the pedelecs market, whether or not they had to acquire
skills or capabilities and if they engage or have the intention to engage in business alliances or
other M&A deals in order to compete in the pedelecs market. The second part has regarded
only bicycle OEMs, pedelecs producers and motorcycles producers, and asked the respondent
to rank from 1 to 10 the importance of some characteristics of the pedelecs in the purchase
decision of consumers. This session has already been described in chapter 2. The third part is
customized for each firm and regarded the factors contributing to each company’s competitive
advantage, which parts of the value chain are vertically integrated, and which are externalized
and their competitive positioning towards suppliers and competitors.
The 42 companies operating in the pedelecs market have been contacted throughout five
channels: (i) Telephone number, when it is indicated in the company’s website; (ii) LinkedIn;
(iii) Facebook; (iv) Instagram and (v) E-mail. The type of contact is summarized in the graph
below.
Graph 4.1. Type of Contact.
After the first contact, the interview has been sent to the companies via e-mail. Firms were then
re-contacted to assess whether or not they were available to answer the interview.
1 1 13
36
Type of Contact
EmailFacebookInstagramLinkedIn
Phone

100
The companies interviewed were segmented for core business, as explained in chapter 3.2.1.
Specifically: (i) Bicycle Producers; (ii) Components Producers; (iii) Motorcycles Producers;
(iv) OEMs Pedelecs and (v) Drive-Unit Manufacturers. The graph and the table below show,
respectively, the number of companies interviewed for each of the afore-mentioned categories
and the number of answers for each category.
Graph 4.2. Company Core Business
Table 4.1. Companies Answer Summary
Overall, 20 out of 42 companies answered the interview, with a response rate of 47,6%.
Interview’s answers were provided in three main ways: (i) by telephone; (ii) by e-mail and (iii)
by appointment. Respondents are employed in a variety of roles within the companies
interviewed. Most of them are managers, specifically, project, production or marketing
managers while a few are sales assistants, and some are the companies’ CEOs.
6
4
4
23
5
Company Core Business
Components
Drive Unit
Motorcycles
OEMOEM Pedelecs
Answer Components Drive Unit Motorcycles Bicicyle OEM OEM Pedelecs TotalNo 3 1 2 14 2 22Yes 3 3 2 9 3 20
Total 6 4 4 23 5 42
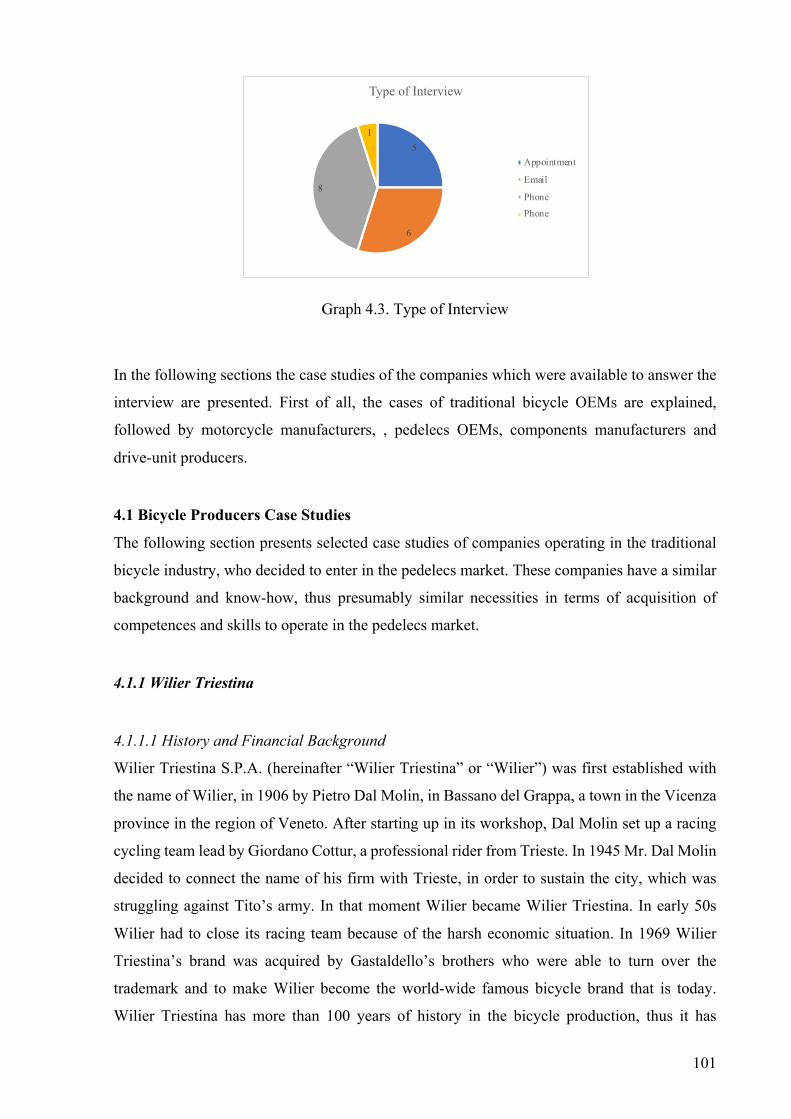
101
Graph 4.3. Type of Interview
In the following sections the case studies of the companies which were available to answer the
interview are presented. First of all, the cases of traditional bicycle OEMs are explained,
followed by motorcycle manufacturers, , pedelecs OEMs, components manufacturers and
drive-unit producers.
4.1 Bicycle Producers Case Studies
The following section presents selected case studies of companies operating in the traditional
bicycle industry, who decided to enter in the pedelecs market. These companies have a similar
background and know-how, thus presumably similar necessities in terms of acquisition of
competences and skills to operate in the pedelecs market.
4.1.1 Wilier Triestina
4.1.1.1 History and Financial Background
Wilier Triestina S.P.A. (hereinafter “Wilier Triestina” or “Wilier”) was first established with
the name of Wilier, in 1906 by Pietro Dal Molin, in Bassano del Grappa, a town in the Vicenza
province in the region of Veneto. After starting up in its workshop, Dal Molin set up a racing
cycling team lead by Giordano Cottur, a professional rider from Trieste. In 1945 Mr. Dal Molin
decided to connect the name of his firm with Trieste, in order to sustain the city, which was
struggling against Tito’s army. In that moment Wilier became Wilier Triestina. In early 50s
Wilier had to close its racing team because of the harsh economic situation. In 1969 Wilier
Triestina’s brand was acquired by Gastaldello’s brothers who were able to turn over the
trademark and to make Wilier become the world-wide famous bicycle brand that is today.
Wilier Triestina has more than 100 years of history in the bicycle production, thus it has
5
6
8
1
Type of Interview
Appointment
PhonePhone
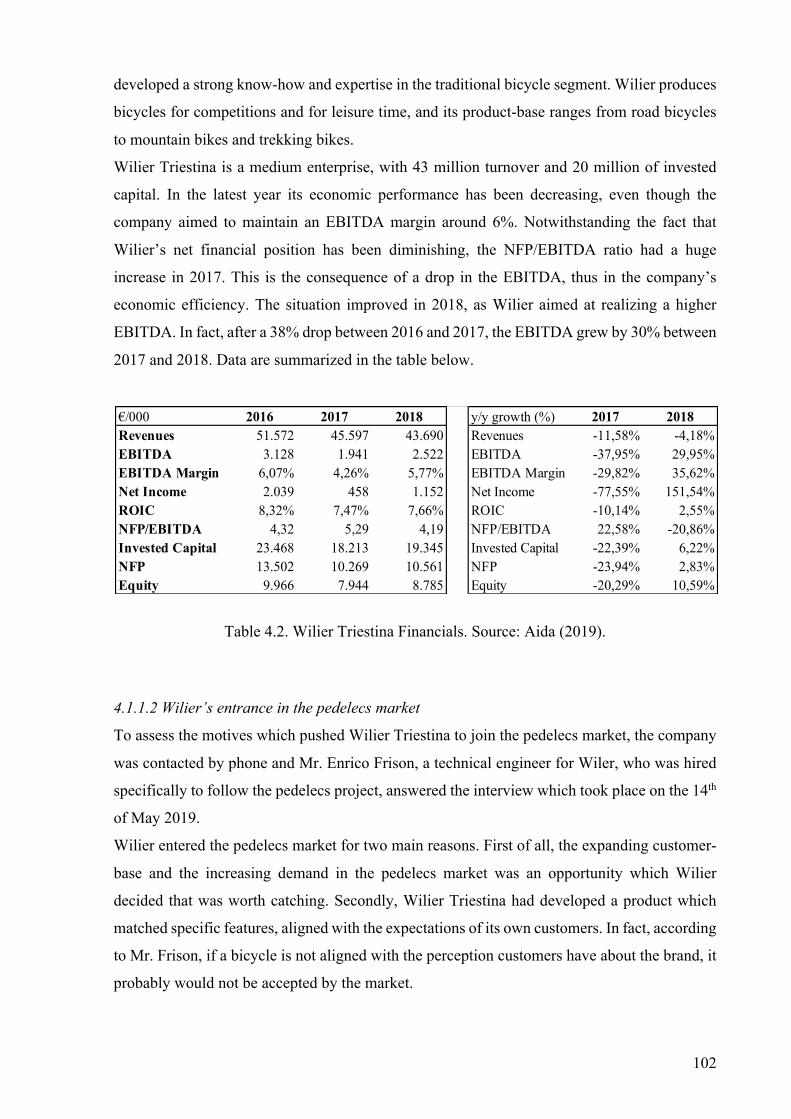
102
developed a strong know-how and expertise in the traditional bicycle segment. Wilier produces
bicycles for competitions and for leisure time, and its product-base ranges from road bicycles
to mountain bikes and trekking bikes.
Wilier Triestina is a medium enterprise, with 43 million turnover and 20 million of invested
capital. In the latest year its economic performance has been decreasing, even though the
company aimed to maintain an EBITDA margin around 6%. Notwithstanding the fact that
Wilier’s net financial position has been diminishing, the NFP/EBITDA ratio had a huge
increase in 2017. This is the consequence of a drop in the EBITDA, thus in the company’s
economic efficiency. The situation improved in 2018, as Wilier aimed at realizing a higher
EBITDA. In fact, after a 38% drop between 2016 and 2017, the EBITDA grew by 30% between
2017 and 2018. Data are summarized in the table below.
Table 4.2. Wilier Triestina Financials. Source: Aida (2019).
4.1.1.2 Wilier’s entrance in the pedelecs market
To assess the motives which pushed Wilier Triestina to join the pedelecs market, the company
was contacted by phone and Mr. Enrico Frison, a technical engineer for Wiler, who was hired
specifically to follow the pedelecs project, answered the interview which took place on the 14th
of May 2019.
Wilier entered the pedelecs market for two main reasons. First of all, the expanding customer-
base and the increasing demand in the pedelecs market was an opportunity which Wilier
decided that was worth catching. Secondly, Wilier Triestina had developed a product which
matched specific features, aligned with the expectations of its own customers. In fact, according
to Mr. Frison, if a bicycle is not aligned with the perception customers have about the brand, it
probably would not be accepted by the market.
€/000 2016 2017 2018 y/y growth (%) 2017 2018Revenues 51.572 45.597 43.690 Revenues -11,58% -4,18%EBITDA 3.128 1.941 2.522 EBITDA -37,95% 29,95%EBITDA Margin 6,07% 4,26% 5,77% EBITDA Margin -29,82% 35,62%Net Income 2.039 458 1.152 Net Income -77,55% 151,54%ROIC 8,32% 7,47% 7,66% ROIC -10,14% 2,55%NFP/EBITDA 4,32 5,29 4,19 NFP/EBITDA 22,58% -20,86%Invested Capital 23.468 18.213 19.345 Invested Capital -22,39% 6,22%NFP 13.502 10.269 10.561 NFP -23,94% 2,83%Equity 9.966 7.944 8.785 Equity -20,29% 10,59%
103
The turning point, which lead Wilier to enter the pedelecs market, has been the development of
new technologies that allow the integration of the motor and the battery into the frame. Since
then, the cooperation with ebikemotion, a Spanish start-up, which was recently acquired by the
multinational automotive group Mahle, began. Moreover, Wilier could count on its strong
know-how in the dynamics and the geometries of traditional bicycles, which could also be
applied to pedelecs. The greatest advantage of Wilier, according to Mr. Frison, has been its
ability to develop a frame tailored to host the afore-mentioned innovations. The most
challenging part in pedelecs’ project for Wilier is the electrical one, especially for its high-end
e-road model. The main reason for this is the full integration of the motor and of the battery
into the frame, which requires advanced technical skills. In fact, Wilier Triestina had to acquire
some competences, especially in the electronic part of the bicycle in order to enter the market.
Wilier offers six different models of e-bikes, specifically four varieties of e-mountain bikes,
one e-touring and one e-road. The e-road Cento1Hybrid is the newest product and with its 11,9
kg is the lightest e-road in the market, with a fully integrated drive-unit supplied by
ebikemotion.
In the future, Wilier would keep investing in the pedelecs project. As one of the key success
factors to operate in the pedelecs market is to continue innovating, according to Mr. Fison,
Wilier’s intentions are to invest in integration and to create lighter vehicles to keep the pace of
innovation.
Wilier is willing to improve the quality of the its bicycles’ and pedelecs’ components and would
start producing them itself, for high-end product varieties. The direction taken is toward
increasing vertical integration. Wilier’s continuing investments in research and development,
the quality of the components and the company’s flexibility are the factors rendering its
competitive advantage sustainable in the middle term, according to Mr. Frison. In fact, in order
to suit customers’ needs and desires the bicycle not only has to be performant but also has to
have a catching design. This is true particularly in the Italian market.
Because of the early stages of diffusion of innovation in the Italian market, Wilier decided not
to engage in specific business alliances or other kinds of agreements with other companies for
the time being, as the Italian market is too young.
4.1.2 Cicli Pinarello S.R.L.
4.1.2.1 History and Financial Background
Cicli Pinarello S.R.L (hereinafter “Pinarello” or “Cicli Pinarello”) was founded by Giovanni
Pinarello in 1953. Mr. Pinarello was a passionate of cycling and was a professional himself.

104
After competing in the “Giro d’Italia”, where he was the last one in the rank, he decided to start
his own bicycle workshop. In 1975 a Pinarello bike run in the “Giro d’Italia” competition for
the first time. Since then, Giovanni Pinarello’s company continued its growth and became one
of the world’s market leaders in the road bicycle segment. In 2017 the private equity fund L.
Catterton acquired the majority of Cicli Pinarello, thus providing the company with new
resources to sustain its growth. Cicli Pinarello was involved in a subsidiary merger in 2017.
As demonstrated in the table below, 2017 has been a transitionary year. The effects of the
merger, executed in the form of a leveraged buy-out, are clearly observable by the upsurge of
both the equity and the Net Financial Position which went, respectively, from 12,6 million euros
to 60 million euros and from 632 thousand euros to 24 million euros. The company has grown
in dimensions, as the invested capital went from 13 million to 84 million in 2018. For this
reason, there has been a considerable drop in ROIC from 2016 to 2018. Total turnover increased
from 2016 to 2018, while the EBITDA margin declined by one percentage point. These
information are summarized in the table below. The growth rate has been computed between
2016 and 2018, because of the lack of comparable data in 2017.
Table 4.3. Cicli Pinarello Financials. Source: Aida (2019).
4.2.2.2 Cicli Pinarello’s entrance in the pedelecs market
Sergio Meneghin, Cicli Pinarello’s export manager, was available to answer the questions about
Pinarello’s entrance in the pedelecs market, on a phone call which took place on the 31st of May
2019.
Mr. Meneghin declared that Cicli Pinarello’s choice to join the pedelecs market was strategic
and it answered to new market scenarios. The customer base has broadened, creating new
opportunities for the road segment. In fact, ex-professional cyclists or older passionate riders,
have become potential clients. Pinarello’s project of its first pedelec, the Nytro, began in 2014
€/000 2016 2017 2018 16-18 growth(%) 2018Total Revenues 52.438 0 53.075 Total Revenues 1,21%EBITDA 8.294 n.d. 7.940 EBITDA -4,27%EBITDA Margin 15,82% n.d. 14,96% EBITDA Margin -5,42%Net Income 5.148 -489 901 Net Income -82,49%ROIC 39,85% -0,07% 2,63% ROIC -93,41%NFP/EBITDA 0,08 -468,70 2,99 NFP/EBITDA 3825,78%Invested Capital 13.267 91.102 84.106 Invested Capital 533,96%NFP 632 31.572 23.754 NFP 3658,25%Equity 12.635 59.530 60.352 Equity 377,67%
105
and was not connected to the acquisition of Pinarello by the fund Catterton. The development
of the Nytro has been carried on with the cooperation of Fazua, a German based start-up,
established in 2013 in Munich. Fazua developed a drive-unit specific for sport cyclists, that
offers a natural pedaling feeling and allows the almost complete integration of the drive-unit
into the frame. As those characteristics suited Pinarello’s philosophy and the expectations of
Pinarello’s customer base, a strategic partnership was implemented with Fazua. Pinarello
invested a lot in the frame’s R&D, in order to create a pedelec model which both matched
Pinarello’s customers’ expectations and differentiated itself from the others, as those are the
key factors to succeed in the road segment, according to Mr. Meneghin. According to Mr.
Meneghin, buying a Pinarello bicycle is the last step for a cyclist, the customer has to feel to
have bought “the best product in the market” (Meneghin, 2019). According to Mr. Meneghin,
it is the strong investment in R&D that guarantees the sustainability of Pinarello’s competitive
advantage. In fact, with the Nytro, the company has been able to develop an electric bicycle
with all the features of a professional road bicycle.
Pinarello did not have to acquire specific skills or competences to join the pedelecs market. As
of today, Cicli Pinarello has three pedelecs product varieties: Nytro, the Nytro gravel and the
E-Treviso.
4.2.2.3 Cicli Pinarello’s Strategic Partnership with Fazua
Cicli Pinarello engaged in a strategic partnership with Fazua in order to develop a product
corresponding to its customers’ expectations. On Pinarello’s side, the alliance has been crucial.
In fact, the technical features of the motor are pivotal for a road pedelec. As one of the most
important characteristics in a road bicycle is the center of gravity, the drive-unit should interfere
with it as little as possible. Pinarello started cooperating with Fazua because it has developed a
product which matches these features. While other companies are cooperating with Fazua
today, Pinarello has been the first one. The strategic partnership has advantages on both side:
Pinarello has developed its e-road, with the characteristics it desired and Fazua strengthened its
reputation and brand-awareness by cooperating with one of the most well-known bicycle brands
in the world. In fact, according to Mr. Meneghin, Pinarello is a reference point for the road
bicycle market in the world.
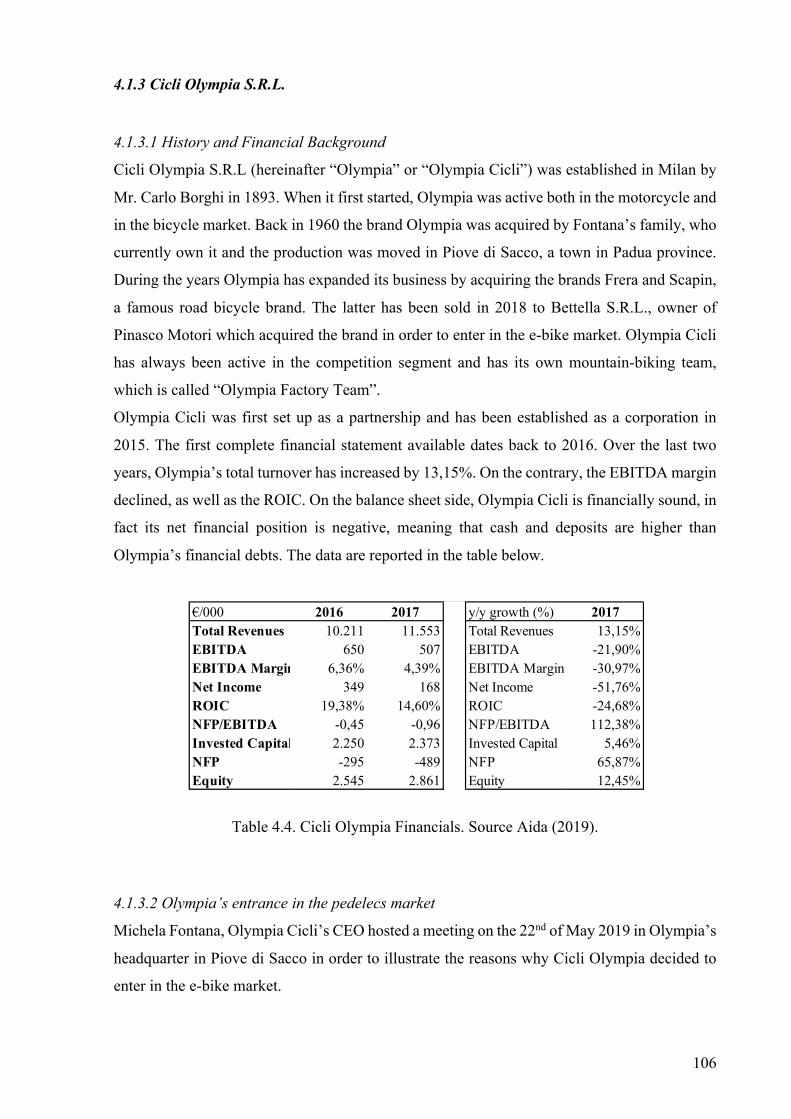
106
4.1.3 Cicli Olympia S.R.L.
4.1.3.1 History and Financial Background
Cicli Olympia S.R.L (hereinafter “Olympia” or “Olympia Cicli”) was established in Milan by
Mr. Carlo Borghi in 1893. When it first started, Olympia was active both in the motorcycle and
in the bicycle market. Back in 1960 the brand Olympia was acquired by Fontana’s family, who
currently own it and the production was moved in Piove di Sacco, a town in Padua province.
During the years Olympia has expanded its business by acquiring the brands Frera and Scapin,
a famous road bicycle brand. The latter has been sold in 2018 to Bettella S.R.L., owner of
Pinasco Motori which acquired the brand in order to enter in the e-bike market. Olympia Cicli
has always been active in the competition segment and has its own mountain-biking team,
which is called “Olympia Factory Team”.
Olympia Cicli was first set up as a partnership and has been established as a corporation in
2015. The first complete financial statement available dates back to 2016. Over the last two
years, Olympia’s total turnover has increased by 13,15%. On the contrary, the EBITDA margin
declined, as well as the ROIC. On the balance sheet side, Olympia Cicli is financially sound, in
fact its net financial position is negative, meaning that cash and deposits are higher than
Olympia’s financial debts. The data are reported in the table below.
Table 4.4. Cicli Olympia Financials. Source Aida (2019).
4.1.3.2 Olympia’s entrance in the pedelecs market
Michela Fontana, Olympia Cicli’s CEO hosted a meeting on the 22nd of May 2019 in Olympia’s
headquarter in Piove di Sacco in order to illustrate the reasons why Cicli Olympia decided to
enter in the e-bike market.
€/000 2016 2017 y/y growth (%) 2017Total Revenues 10.211 11.553 Total Revenues 13,15%EBITDA 650 507 EBITDA -21,90%EBITDA Margin 6,36% 4,39% EBITDA Margin -30,97%Net Income 349 168 Net Income -51,76%ROIC 19,38% 14,60% ROIC -24,68%NFP/EBITDA -0,45 -0,96 NFP/EBITDA 112,38%Invested Capital 2.250 2.373 Invested Capital 5,46%NFP -295 -489 NFP 65,87%Equity 2.545 2.861 Equity 12,45%

107
The need to answer new market requests and counteract the slowing demand of traditional
bicycles have been the main motives for Olympia to join the e-bike market.
Ms. Fontana has clearly stated Olympia’s value proposition, both in the traditional bicycle and
pedelecs market. The above-average price to quality relationship, the flexibility of being a small
firm and the good after-sale service are among the factors creating and sustaining Olympia’s
competitive advantage, as well as the key to succeed in the pedelecs market.
Ms. Fontana stated that the pedelecs market requires more financial resources to operate in, as
drive units producers have a high bargaining power with respect to small and medium OEMs.
In fact, they ask for a precise production plan at the beginning of the year and upfront payments.
According to Ms. Fontana, the pedelecs market is a chance for Olympia to grow, as it forces
higher investments and financial commitment, especially on the inventory side. In addition,
R&D on the frame shape and design is pivotal as every frame is tailor made for a specific drive
unit. For small and medium enterprises like Olympia it is important to have the right product
for the market, as each model requires lots of investment. Furthermore, pedelecs market is also
challenging on the logistic side. In fact, as the European Union has posed trade barriers against
fully-assembled pedelecs imported from China, many companies including Olympia had to
reorganize their own logistic and to assemble their final product either in Italy or in other
European countries to avoid the payment of heavy duties. In order to face the afore-mentioned
challenges, Cicli Olympia had to acquire some competence from the market, and in particular
technical skills on the electronic components side and on the assembly side.
Cicli Olympia, being a small, family-run firm, has not engaged in strategic partnerships with
other companies in order to compete in the pedelecs market, nor it has intention to for the time
being. As of today, Cicli Olympia has a wide range of electric bicycles, in the mountain bike
and in the city and trekking bikes categories.
4.1.4 Atala SPA
4.1.4.1 History and Financial Background
Atala S.P.A.’s brand (hereinafter “Atala”) was established in 1907 by Mr. Angelo Gatti, ex-
manager of Fabbrica Italiana Velocipedi Edoardo Bianchi. In 1938 the brand was acquired by
Mr. Cesare Rizzato, who first started producing bicycle frames in 1921 in Padova with the Ceriz
brand. During 1980s the company went through a distressed period, due to the increasing costs
of the workforce. In 2002 the company Atala S.P.A. was established after the brand was sold
by the Rizzato family to a group of entrepreneurs from Milan. In 2009 the headquarter of the
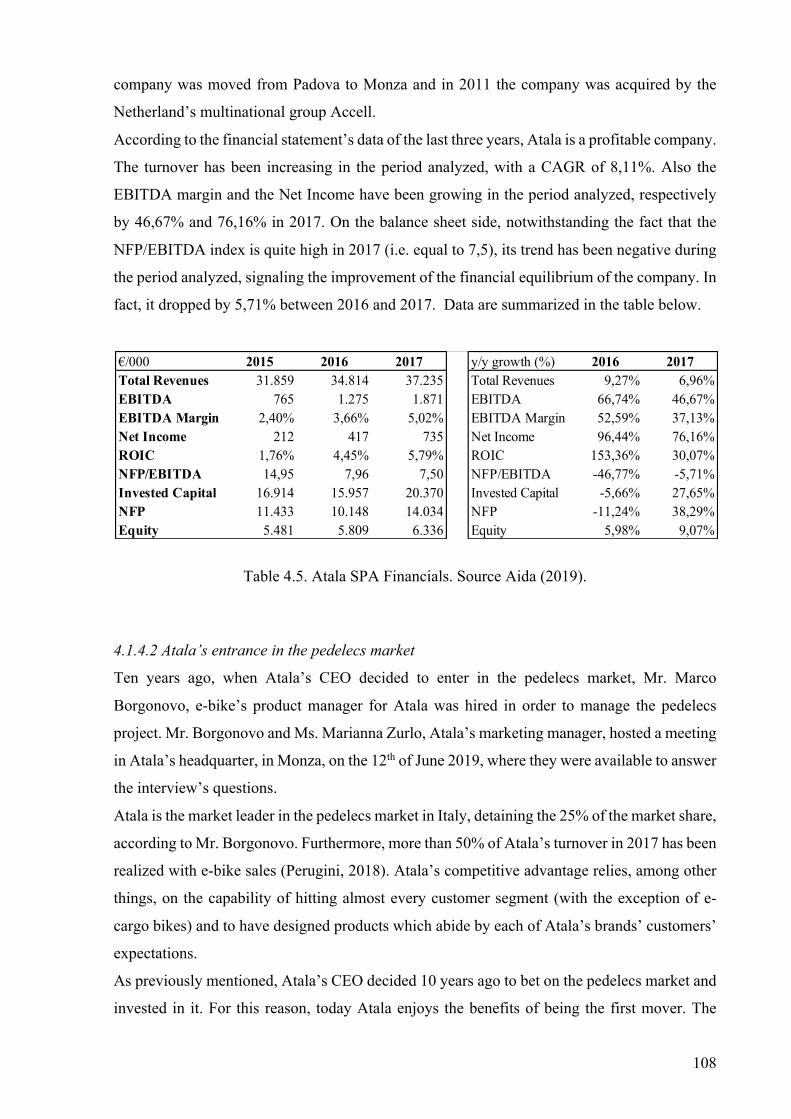
108
company was moved from Padova to Monza and in 2011 the company was acquired by the
Netherland’s multinational group Accell.
According to the financial statement’s data of the last three years, Atala is a profitable company.
The turnover has been increasing in the period analyzed, with a CAGR of 8,11%. Also the
EBITDA margin and the Net Income have been growing in the period analyzed, respectively
by 46,67% and 76,16% in 2017. On the balance sheet side, notwithstanding the fact that the
NFP/EBITDA index is quite high in 2017 (i.e. equal to 7,5), its trend has been negative during
the period analyzed, signaling the improvement of the financial equilibrium of the company. In
fact, it dropped by 5,71% between 2016 and 2017. Data are summarized in the table below.
Table 4.5. Atala SPA Financials. Source Aida (2019).
4.1.4.2 Atala’s entrance in the pedelecs market
Ten years ago, when Atala’s CEO decided to enter in the pedelecs market, Mr. Marco
Borgonovo, e-bike’s product manager for Atala was hired in order to manage the pedelecs
project. Mr. Borgonovo and Ms. Marianna Zurlo, Atala’s marketing manager, hosted a meeting
in Atala’s headquarter, in Monza, on the 12th of June 2019, where they were available to answer
the interview’s questions.
Atala is the market leader in the pedelecs market in Italy, detaining the 25% of the market share,
according to Mr. Borgonovo. Furthermore, more than 50% of Atala’s turnover in 2017 has been
realized with e-bike sales (Perugini, 2018). Atala’s competitive advantage relies, among other
things, on the capability of hitting almost every customer segment (with the exception of e-
cargo bikes) and to have designed products which abide by each of Atala’s brands’ customers’
expectations.
As previously mentioned, Atala’s CEO decided 10 years ago to bet on the pedelecs market and
invested in it. For this reason, today Atala enjoys the benefits of being the first mover. The
€/000 2015 2016 2017 y/y growth (%) 2016 2017Total Revenues 31.859 34.814 37.235 Total Revenues 9,27% 6,96%EBITDA 765 1.275 1.871 EBITDA 66,74% 46,67%EBITDA Margin 2,40% 3,66% 5,02% EBITDA Margin 52,59% 37,13%Net Income 212 417 735 Net Income 96,44% 76,16%ROIC 1,76% 4,45% 5,79% ROIC 153,36% 30,07%NFP/EBITDA 14,95 7,96 7,50 NFP/EBITDA -46,77% -5,71%Invested Capital 16.914 15.957 20.370 Invested Capital -5,66% 27,65%NFP 11.433 10.148 14.034 NFP -11,24% 38,29%Equity 5.481 5.809 6.336 Equity 5,98% 9,07%
109
entrance in this market required the acquisition of some technical capabilities, especially in the
beginning, when the electric components were not as technologically advanced as they are
today, and they were not supplied in modular packages. Technical skills were therefore required
in order to buy motors, batteries and displays which all function together.
Atala benefitted also from being part of a large multinational group. In fact, one key factor in
maintaining Atala’s first mover advantage in the e-bike segment has been the possibility to
produce bicycles with Bosch’s drive unit, thanks to the financial support and bargaining power
of its parent company, Accell. The dialogue with Bosch is held at a group level, thus Atala
enjoys group synergies. The relationship with Bosch has been extremely important, as Bosch
has been the first company to introduce in the market a mass-produced mid-drive unit which
could be integrated into the bicycle’s frame.
Despite the competitive advantage gained during the last ten years, according to Mr.
Borgonovo, the pedelecs market is moving really fast and other bicycle manufacturers have
begun to produce mid-drive motor pedelecs which are cheaper than Bosch’s pedelecs but with
an acceptable quality for consumers. Therefore, it was to maintain Atala’s own consumer target,
specifically middle-end consumers, who care both about quality and price, that Atala started
cooperating with Oli S.P.A. to design and produce a mid-drive motor, cheaper than Bosch’s but
with comparable performances for its e-bikes. Thanks to this strategic relationship Atala
managed to have a cheaper but performing product which suited its customers’ needs.
4.1.4.3 The non-equity joint venture with Oli S.P.A.
As previously mentioned, Atala needed to find a drive-unit manufacturer who could supply a
product which, at the same time, is cheaper than Bosch’s drive-unit but has a comparable
performance. Mr. Borgonovo explained that it is for this reason that a non-equity joint venture
was established with Oli S.P.A., (see paragraph 4.5.1), an industrial multinational group that
was willing to enter in the pedelecs market. While having a good know-how in the electric
motors part, Oli needed Atala’s expertise in the vehicle’s dynamic and application in order to
fully develop its own product. The cooperation successfully resulted in the development of the
motor AM-80, which is now mounted in some of Atala’s pedelecs and allowed Atala to cut by
17% the price of some of its models previously mounting Bosch’s motors, thus meeting its
customers’ expectations.
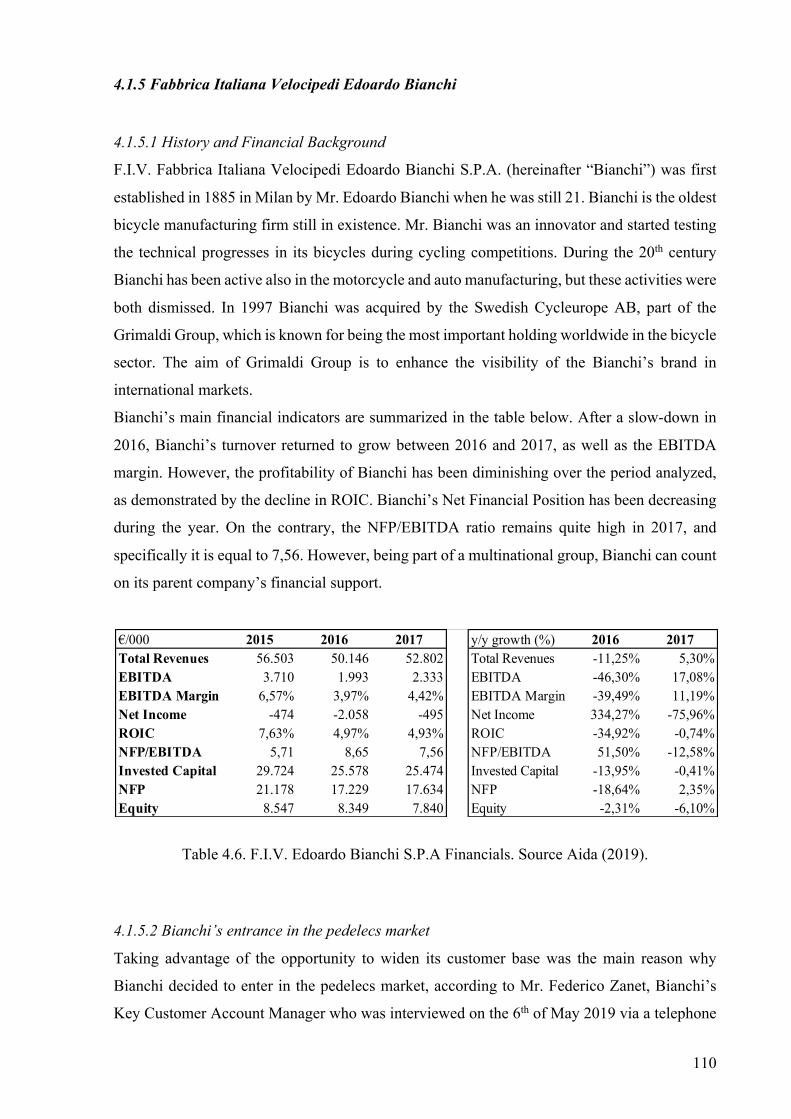
110
4.1.5 Fabbrica Italiana Velocipedi Edoardo Bianchi
4.1.5.1 History and Financial Background
F.I.V. Fabbrica Italiana Velocipedi Edoardo Bianchi S.P.A. (hereinafter “Bianchi”) was first
established in 1885 in Milan by Mr. Edoardo Bianchi when he was still 21. Bianchi is the oldest
bicycle manufacturing firm still in existence. Mr. Bianchi was an innovator and started testing
the technical progresses in its bicycles during cycling competitions. During the 20th century
Bianchi has been active also in the motorcycle and auto manufacturing, but these activities were
both dismissed. In 1997 Bianchi was acquired by the Swedish Cycleurope AB, part of the
Grimaldi Group, which is known for being the most important holding worldwide in the bicycle
sector. The aim of Grimaldi Group is to enhance the visibility of the Bianchi’s brand in
international markets.
Bianchi’s main financial indicators are summarized in the table below. After a slow-down in
2016, Bianchi’s turnover returned to grow between 2016 and 2017, as well as the EBITDA
margin. However, the profitability of Bianchi has been diminishing over the period analyzed,
as demonstrated by the decline in ROIC. Bianchi’s Net Financial Position has been decreasing
during the year. On the contrary, the NFP/EBITDA ratio remains quite high in 2017, and
specifically it is equal to 7,56. However, being part of a multinational group, Bianchi can count
on its parent company’s financial support.
Table 4.6. F.I.V. Edoardo Bianchi S.P.A Financials. Source Aida (2019).
4.1.5.2 Bianchi’s entrance in the pedelecs market
Taking advantage of the opportunity to widen its customer base was the main reason why
Bianchi decided to enter in the pedelecs market, according to Mr. Federico Zanet, Bianchi’s
Key Customer Account Manager who was interviewed on the 6th of May 2019 via a telephone
€/000 2015 2016 2017 y/y growth (%) 2016 2017Total Revenues 56.503 50.146 52.802 Total Revenues -11,25% 5,30%EBITDA 3.710 1.993 2.333 EBITDA -46,30% 17,08%EBITDA Margin 6,57% 3,97% 4,42% EBITDA Margin -39,49% 11,19%Net Income -474 -2.058 -495 Net Income 334,27% -75,96%ROIC 7,63% 4,97% 4,93% ROIC -34,92% -0,74%NFP/EBITDA 5,71 8,65 7,56 NFP/EBITDA 51,50% -12,58%Invested Capital 29.724 25.578 25.474 Invested Capital -13,95% -0,41%NFP 21.178 17.229 17.634 NFP -18,64% 2,35%Equity 8.547 8.349 7.840 Equity -2,31% -6,10%
111
call. Furthermore, the improvement in the pedelecs technology drove prices down and allowed
the design and production of esthetically beautiful pedelecs which answered to Bianchi’s
consumers’ needs and expectations about Bianchi’s products.
Mr. Zanet declared that Bianchi needed to hire an engineer in order to manage the pedelecs
project. In fact, the electric bicycle is more complex than the traditional one, because of the
motor and the electric components in it. In addition, the cooperation with the most important
drive-unit producers has been crucial for the development of Bianchi’s pedelecs. Each frame is
designed by cooperating with them, to tailor it to the selected drive unit. As of today, Bianchi
has a broad catalogue of electric bicycles, in order to hit all the market segments it covers in
the traditional bicycle market.
4.1.5.3 The Strategic Partnership with Polini Motori S.P.A.
Bianchi has undertaken a strategic partnership with Polini Motori S.P.A. in order to developed
two e-bikes models.
The objective of the partnership for Bianchi was to develop products which both meets its
customers’ expectations and could be presented to the public as “Made in Italy”, which is
perceived as a synonym of quality. In fact, Polini (see paragraph 4.5.2) has built an efficient,
small and highly performant motor, has an optimal reputation in the motors segment, and
prestige for being a “Made in Italy” product.
4.1.6 Lombardo Bikes
4.1.6.1 History and Financial Background
Cicli Lombardo S.P.A. (hereinafter “Lombardo”) was established in 1952 by Gaspare
Lombardo in Buseto Palizzolo, in the province of Trapani in Sicily. The company is still in the
hands of Lombardo family and nowadays has a European presence. In 2007 the first branch
was opened in Germany.
Lombardo is a small-medium enterprise and its total turnover in 2017 was of 10,5 million.
During the period analyzed, the total turnover has increased with a CAGR of 7,93%. For what
concerns its core-business profitability, EBITDA has increased over the latest years, in
particular by 14% in 2016 and by 7% in 2017. Furthermore, even if the Net Financial Position
has decreased, between 2016 and 2017, the NFP/EBITDA indicator remains quite high and
might create some issues on the debt sustainability’s side. In fact, its value of 17,20 in 2017 is
well above the level of 4, indicated by practitioners as the threshold level above which the
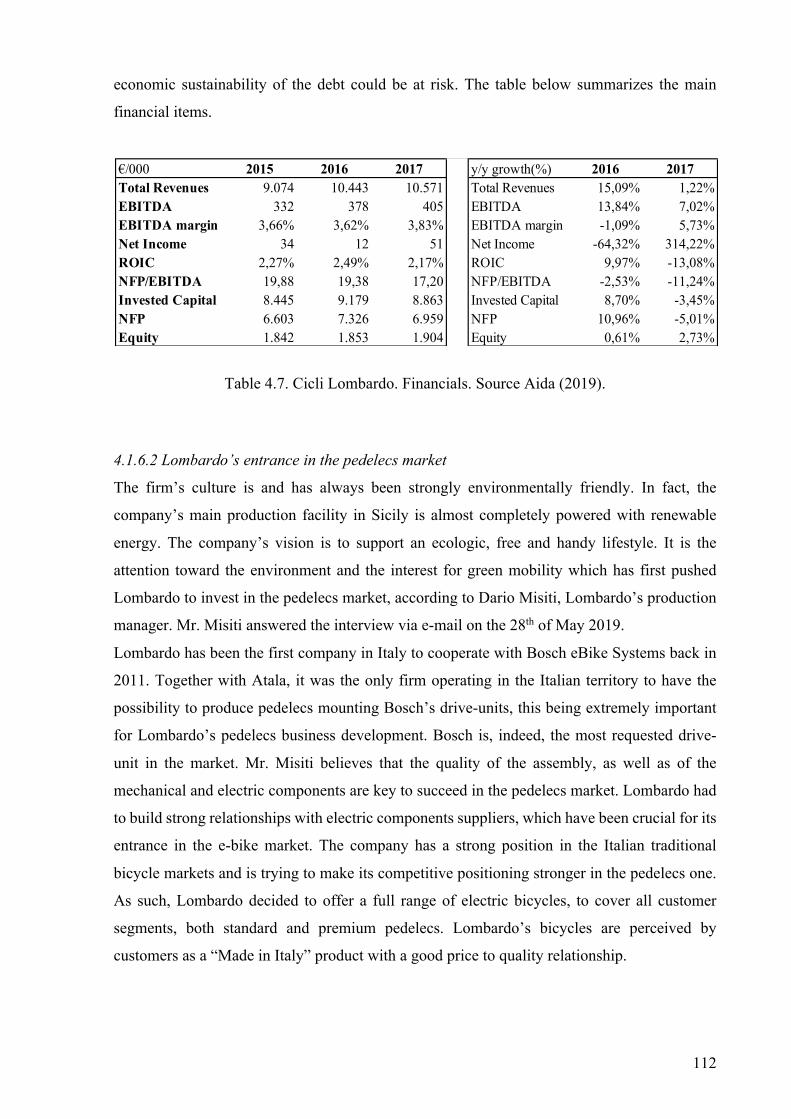
112
economic sustainability of the debt could be at risk. The table below summarizes the main
financial items.
Table 4.7. Cicli Lombardo. Financials. Source Aida (2019).
4.1.6.2 Lombardo’s entrance in the pedelecs market
The firm’s culture is and has always been strongly environmentally friendly. In fact, the
company’s main production facility in Sicily is almost completely powered with renewable
energy. The company’s vision is to support an ecologic, free and handy lifestyle. It is the
attention toward the environment and the interest for green mobility which has first pushed
Lombardo to invest in the pedelecs market, according to Dario Misiti, Lombardo’s production
manager. Mr. Misiti answered the interview via e-mail on the 28th of May 2019.
Lombardo has been the first company in Italy to cooperate with Bosch eBike Systems back in
2011. Together with Atala, it was the only firm operating in the Italian territory to have the
possibility to produce pedelecs mounting Bosch’s drive-units, this being extremely important
for Lombardo’s pedelecs business development. Bosch is, indeed, the most requested drive-
unit in the market. Mr. Misiti believes that the quality of the assembly, as well as of the
mechanical and electric components are key to succeed in the pedelecs market. Lombardo had
to build strong relationships with electric components suppliers, which have been crucial for its
entrance in the e-bike market. The company has a strong position in the Italian traditional
bicycle markets and is trying to make its competitive positioning stronger in the pedelecs one.
As such, Lombardo decided to offer a full range of electric bicycles, to cover all customer
segments, both standard and premium pedelecs. Lombardo’s bicycles are perceived by
customers as a “Made in Italy” product with a good price to quality relationship.
€/000 2015 2016 2017 y/y growth(%) 2016 2017Total Revenues 9.074 10.443 10.571 Total Revenues 15,09% 1,22%EBITDA 332 378 405 EBITDA 13,84% 7,02%EBITDA margin 3,66% 3,62% 3,83% EBITDA margin -1,09% 5,73%Net Income 34 12 51 Net Income -64,32% 314,22%ROIC 2,27% 2,49% 2,17% ROIC 9,97% -13,08%NFP/EBITDA 19,88 19,38 17,20 NFP/EBITDA -2,53% -11,24%Invested Capital 8.445 9.179 8.863 Invested Capital 8,70% -3,45%NFP 6.603 7.326 6.959 NFP 10,96% -5,01%Equity 1.842 1.853 1.904 Equity 0,61% 2,73%
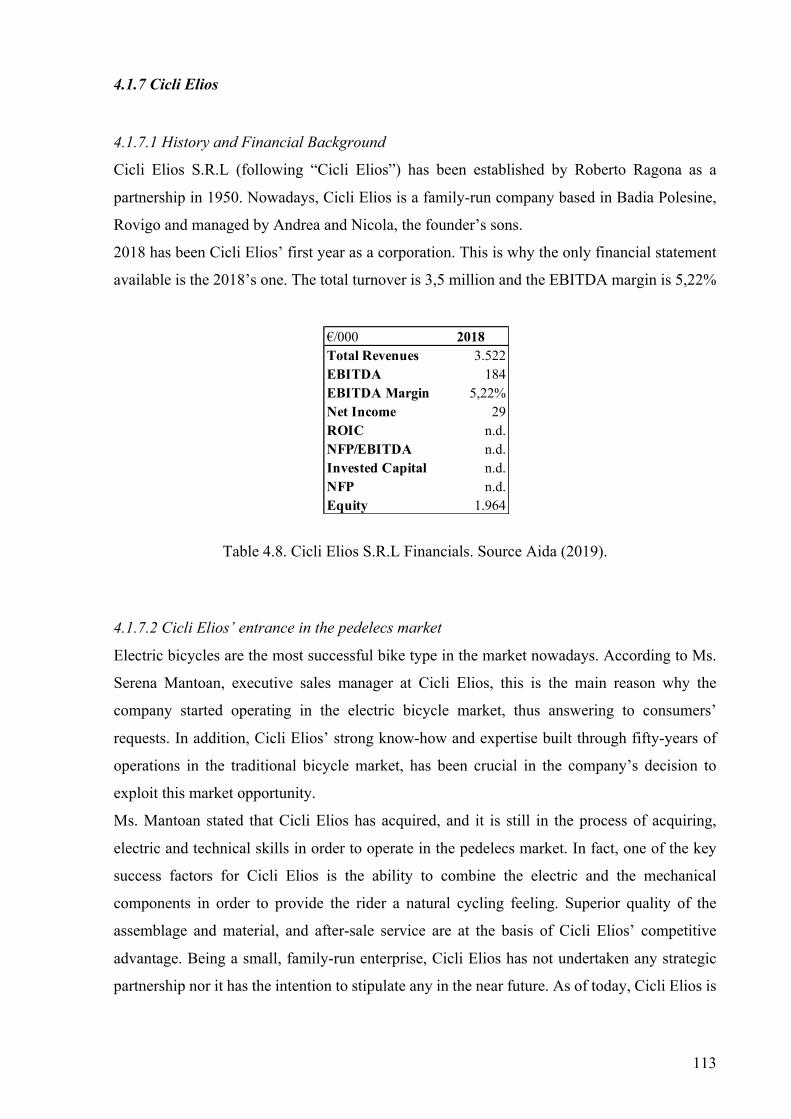
113
4.1.7 Cicli Elios
4.1.7.1 History and Financial Background
Cicli Elios S.R.L (following “Cicli Elios”) has been established by Roberto Ragona as a
partnership in 1950. Nowadays, Cicli Elios is a family-run company based in Badia Polesine,
Rovigo and managed by Andrea and Nicola, the founder’s sons.
2018 has been Cicli Elios’ first year as a corporation. This is why the only financial statement
available is the 2018’s one. The total turnover is 3,5 million and the EBITDA margin is 5,22%
Table 4.8. Cicli Elios S.R.L Financials. Source Aida (2019).
4.1.7.2 Cicli Elios’ entrance in the pedelecs market
Electric bicycles are the most successful bike type in the market nowadays. According to Ms.
Serena Mantoan, executive sales manager at Cicli Elios, this is the main reason why the
company started operating in the electric bicycle market, thus answering to consumers’
requests. In addition, Cicli Elios’ strong know-how and expertise built through fifty-years of
operations in the traditional bicycle market, has been crucial in the company’s decision to
exploit this market opportunity.
Ms. Mantoan stated that Cicli Elios has acquired, and it is still in the process of acquiring,
electric and technical skills in order to operate in the pedelecs market. In fact, one of the key
success factors for Cicli Elios is the ability to combine the electric and the mechanical
components in order to provide the rider a natural cycling feeling. Superior quality of the
assemblage and material, and after-sale service are at the basis of Cicli Elios’ competitive
advantage. Being a small, family-run enterprise, Cicli Elios has not undertaken any strategic
partnership nor it has the intention to stipulate any in the near future. As of today, Cicli Elios is
€/000 2018Total Revenues 3.522EBITDA 184EBITDA Margin 5,22%Net Income 29ROIC n.d.NFP/EBITDA n.d.Invested Capital n.d.NFP n.d.Equity 1.964
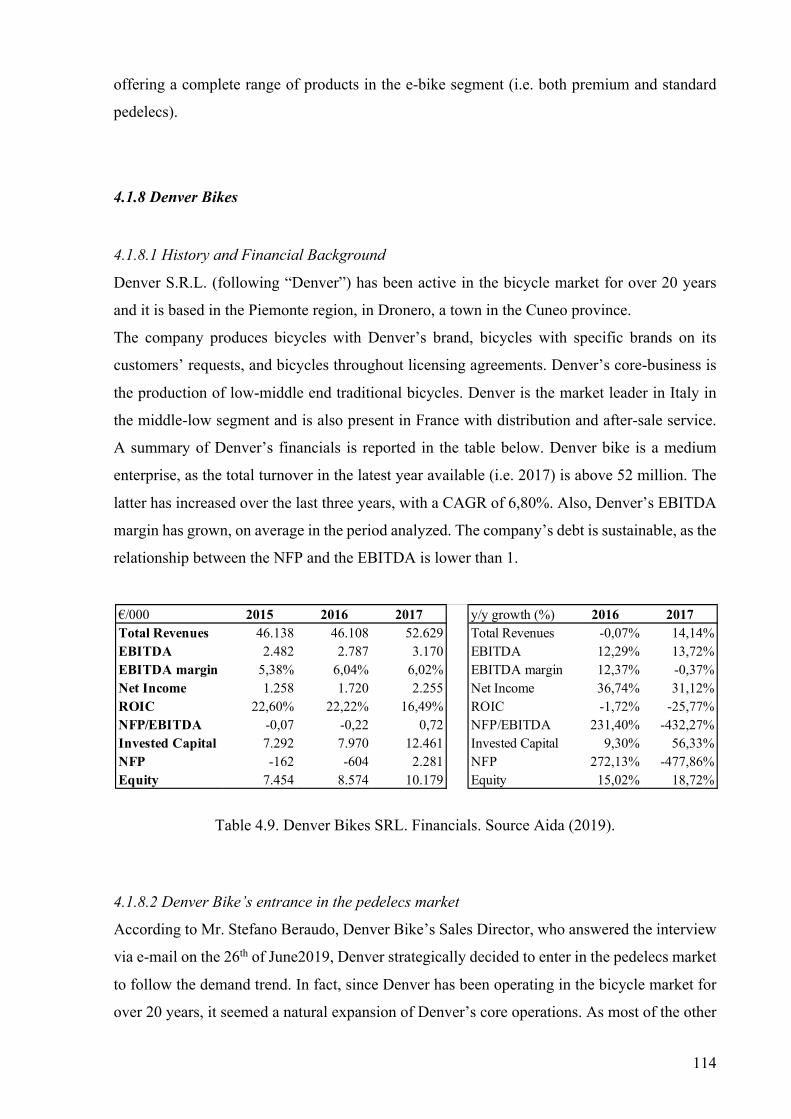
114
offering a complete range of products in the e-bike segment (i.e. both premium and standard
pedelecs).
4.1.8 Denver Bikes
4.1.8.1 History and Financial Background
Denver S.R.L. (following “Denver”) has been active in the bicycle market for over 20 years
and it is based in the Piemonte region, in Dronero, a town in the Cuneo province.
The company produces bicycles with Denver’s brand, bicycles with specific brands on its
customers’ requests, and bicycles throughout licensing agreements. Denver’s core-business is
the production of low-middle end traditional bicycles. Denver is the market leader in Italy in
the middle-low segment and is also present in France with distribution and after-sale service.
A summary of Denver’s financials is reported in the table below. Denver bike is a medium
enterprise, as the total turnover in the latest year available (i.e. 2017) is above 52 million. The
latter has increased over the last three years, with a CAGR of 6,80%. Also, Denver’s EBITDA
margin has grown, on average in the period analyzed. The company’s debt is sustainable, as the
relationship between the NFP and the EBITDA is lower than 1.
Table 4.9. Denver Bikes SRL. Financials. Source Aida (2019).
4.1.8.2 Denver Bike’s entrance in the pedelecs market
According to Mr. Stefano Beraudo, Denver Bike’s Sales Director, who answered the interview
via e-mail on the 26th of June2019, Denver strategically decided to enter in the pedelecs market
to follow the demand trend. In fact, since Denver has been operating in the bicycle market for
over 20 years, it seemed a natural expansion of Denver’s core operations. As most of the other
€/000 2015 2016 2017 y/y growth (%) 2016 2017Total Revenues 46.138 46.108 52.629 Total Revenues -0,07% 14,14%EBITDA 2.482 2.787 3.170 EBITDA 12,29% 13,72%EBITDA margin 5,38% 6,04% 6,02% EBITDA margin 12,37% -0,37%Net Income 1.258 1.720 2.255 Net Income 36,74% 31,12%ROIC 22,60% 22,22% 16,49% ROIC -1,72% -25,77%NFP/EBITDA -0,07 -0,22 0,72 NFP/EBITDA 231,40% -432,27%Invested Capital 7.292 7.970 12.461 Invested Capital 9,30% 56,33%NFP -162 -604 2.281 NFP 272,13% -477,86%Equity 7.454 8.574 10.179 Equity 15,02% 18,72%

115
companies which started to operate in the pedelecs market, Denver had to acquire competences
and skills in the electric components part and its interaction with the mechanical part in order
to compete in the pedelecs market.
4.1.9 Cicli Casadei S.R.L.
4.1.9.1 History and Financial Background
Cicli Casadei S.R.L (following “Cicli Casadei”) has been active in the bicycle market for over
30 years, as it was established in the early 80s by Rosanna and Giancarlo Casadei. The
company’s headquarter is in San Giuseppe di Comacchio, in the Ferrara province. Cicli Casadei
has always been a family-run firm.
Cicli Casadei is a small enterprise, with a total turnover of 7,5 million in 2018. Notwithstanding
the slight drop in total turnover in the last three years, Cicli Casadei’s EBITDA margin has
increased over the period analyzed, signaling an improvement in efficiency. On the balance
sheet side, the company has a slightly high NFP/EBITDA ratio, specifically, equal to 3,48 in
2018, which might raise some concerns on the sustainability of its debt burden in the next future.
Data are summarized in the table below.
Table 4.10. Cicli Casadei SRL Financials. Source Aida (2019).
4.1.9.2 Cicli Casadei’s entrance in the pedelecs market
Cicli Casadei’s entrance in the pedelecs market has been due to an increasing demand of this
kind of vehicles by the final user, according to Mr. Claudio Casadei, Cicli Casadei’s CEO, who
replied to the interview via e-mail on the 21st of May 2019.
As Cicli Casadei is a small-medium family run firm, it has not, nor is planning to undertake
strategic partnerships or M&A deals in order to keep competing in the pedelecs market. The
€/000 2016 2017 2018 y/y growth (%) 2017 2018Total Revenues 7.803 7.824 7.560 Total Revenues 0,27% -3,37%EBITDA 601 672 723 EBITDA 11,71% 7,57%EBITDA Margin 7,71% 8,59% 9,56% EBITDA Margin 11,41% 11,32%Net Income 191 238 318 Net Income 24,39% 33,85%ROIC 4,39% 5,86% 5,20% ROIC 33,65% -11,25%NFP/EBITDA 4,02 2,11 3,48 NFP/EBITDA -47,56% 65,30%Invested Capital 6.192 5.429 6.750 Invested Capital -12,33% 24,32%NFP 2.417 1.416 2.518 NFP -41,41% 77,82%Equity 3.775 4.013 4.231 Equity 6,30% 5,44%
116
quality of the materials used, and a quick after-sale service are the elements which build Cicli
Casadei’s competitive advantage. Those elements are also two of the key success factors to
operate in the pedelecs market, according to Cicli Casadei’s CEO. Cicli Casadei is today active
in the pedelecs market with a broad product range, especially in the e-city and e-touring
segment.
4.1.10 Cases Summary
The majority of the bicycle OEMs interviewed have been active in the traditional bicycle
market for many years and some of them have a history more than 100 years long. Thus, they
all have developed know-how and expertise in the traditional bicycle market, which they have
applied to the pedelecs production either. Most of the bicycle OEMs who joined the pedelecs
market decided to do so because of the strong increase in the demand for pedelecs. In particular,
the latter has been cannibalizing the demand of traditional bicycles in the latest years. For
bicycle OEMs expanding their product base by adding pedelecs has been a natural expansion
of their traditional core business, and a new opportunity to exploit.
The majority of the players interviewed stated that as pedelecs are more complex vehicles with
respect to traditional bicycles, they needed to acquire some skills and competences to operate
in the market, especially in the electric components side. In fact, the electric and the mechanical
part of the bicycle have to fit together in a pedal-assisted bike, to render the pedaling natural.
Key success factors in the pedelecs market vary among premium and standard producers. While
the reliability of the vehicle and a good price to quality relationship are crucial for players
operating in the standard segment, the design and, in particular, the correspondence of the
pedelec’s design with each brands’ peculiar customers’ expectation about the design of a
product with that specific brand, is pivotal for premium pedelecs producers. Furthermore,
another key factor to succeed in the pedelecs market is the quality of the electric components.
For this reason, some of the respondents decided to undertake strategic partnerships with
electric components supplier. In fact, as demonstrated in the industry analysis in chapter 2, the
drive-unit element is a both a consumers’ purchase decision driver and a cost driver along
pedelecs’ value chain. The choice of the partner was strategic in all cases analyzed. In fact, as
previously mentioned, the correspondence of the product’s design to each players’ customers’
expectations, is crucial for the success of that product in the market.
As previously mentioned, the drive-unit is one of the most relevant components of pedelecs.
Therefore, one of the main impacts of electrification in the bicycle OEMs’ value chain has been
the introduction of a new type of supplier, which is generally bigger in size than OEMs.
Furthermore, as stated in the value chain and Porter analysis in chapter 2, the drive-unit
117
manufacturers have a high bargaining power with respect to bicycle manufacturers. In fact,
some of the players interviewed lack of bargaining power against drive-unit suppliers.
Specifically, they have difficulties both to obtain the supplying by some of the most important
drive-unit manufacturers (i.e. Bosch) and to order the exact number of pieces they need, as
drive-unit manufacturers oblige the producers to buy a minimum number of units.
In addition, among the key-success factors which are necessary to compete in the pedelecs
market, all the respondent named the quality of the after-sale service. In fact, all the electronic
components made the bicycle more complex and added a new channel of after-sale service that
need to be managed.
To sum up, the pedelecs market is perceived a natural expansion of the traditional bicycle
market, thus it is not surprising that the majority of the players producing bicycles in Italy have
decided to join it, and in particular, the 74% of them, according to the data gathered in chapter
3. Moreover, companies decided to stay independent for the time being. In fact, as pedelecs
market is still in its early stages in Italy, companies prefer to wait and assess which direction
the market development would take.
4.2 Motorcycles Producers
4.2.1 Fantic Motor S.P.A.
4.2.1.1 History and Financial Background
Fantic Motor S.P.A. (hereinafter “Fantic” or “Fantic Motor”) was established in 1968, in
Barzago a small town in the province of Lecco, in Lombardy, by Mr. Mario Agrati and Henry
Keppel. In the beginning the firm produced minibikes and go-karts, which were designed for
the American market. In 1995 the firm went bankrupt, and the brand was acquired by Mr.
Federico Fregnan, an entrepreneur from Treviso, from the Veneto region, during a public
auction in 2002. Twelve years later, in 2014, Venetwork, a network of entrepreneurs in the
Veneto region, acquired Fantic Motor for 2 million euros and began to implement a five-year
investment plan of 5 million euros. Since 2014 the company has been growing at an impressive
pace.
Fantic’s growth in the last three years is demonstrated by the analysis of its financial statements.
In fact, Fantic Motor’s turnover bumped in the last three years, going from approximately 10
million, in 2016, to almost 28 million in 2018, with a CAGR of 68,40%. Fantic’s profitability
has been positive in the latest years, with an EBITDA margin of 6,38% in 2018 and a ROIC of
3,83% respectively. In 2018 the company got an equity injection of about 4,5 million, at the

118
same time increasing its net indebtment and its invested capital. The data are summarized in
the table below.
Table 4.11. Fantic Motor S.P.A.. Financials. Source Aida (2019).
4.2.1.2 Fantic’s entrance in the pedelecs market
In 2014, the e-bike segment was increasing at a double-digit rate and environmental protection
and sustainability were becoming important issues for governments. Moreover, people from all
over the world have started caring about these issues, and to choose the products they consume
accordingly. For this reason, as a part of Fantic’s business turnaround, investments in the e-
bike sector began in 2014, when Fantic became part of Venetwork. Back in 2014 Fantic planned
to reach a 3% market share in the European market within five years (Brillo, 2014). In 2019 a
new production facility dedicated entirely to e-bikes was inaugurated in Santa Maria di Sala, in
the province of Venice.
Since 2014, when the acquisition of Fantic from Elektra Group was completed, Fantic’s
business turnaround has been driven by Mr. Mariano Roman, the company’s CEO. According
to his answers on a phone interview on the 26th of June 2019, Fantic acquired skills and
competences in order to compete in the e-bike market. In particular, a team was built which
combined the know-how Fantic previously had on the motorcycles’ side with new skills on the
e-bike’s side.
Mr. Roman stated that design and ability to continuously innovate are among the factors behind
Fantic’s competitive advantage. In fact, strong technical skills and the ability of producing
products of great design which are appealing to customers are the key factors to be successful
in the pedelecs market, according to Mr. Roman. Fantic has been working to have these factors.
On the design’s side, Fantic has a team of dedicated designers among its partners. Furthermore,
on the technical side, Fantic undertook strategic partnerships with some of its suppliers, and in
particular with SRAM and Brose in order equip its products with the best components in the
€/000 2016 2017 2018 y/y growth (%) 2017 2018Total Revenues 9.813 14.740 27.828 Total Revenues 50,21% 88,79%EBITDA 495 958 1.775 EBITDA 93,52% 85,18%EBITDA Margin 5,05% 6,50% 6,38% EBITDA Margin 28,83% -1,91%Net Income 263 328 571 Net Income 24,48% 74,15%ROIC 7,49% 5,35% 3,83% ROIC -28,60% -28,41%NFP/EBITDA 0,34 3,51 5,09 NFP/EBITDA 935,40% 45,13%Invested Capital 3.752 7.275 17.332 Invested Capital 93,88% 138,25%NFP 168 3.363 9.037 NFP 1903,70% 168,75%Equity 3.584 3.912 8.294 Equity 9,14% 112,03%
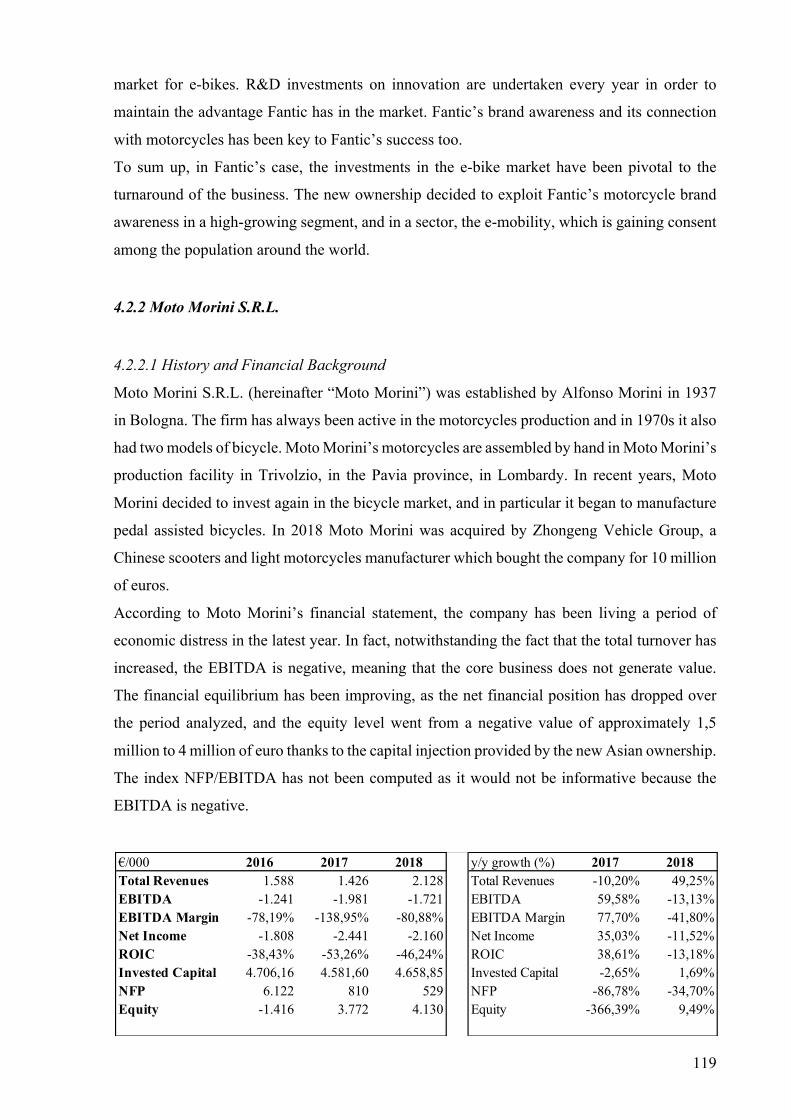
119
market for e-bikes. R&D investments on innovation are undertaken every year in order to
maintain the advantage Fantic has in the market. Fantic’s brand awareness and its connection
with motorcycles has been key to Fantic’s success too.
To sum up, in Fantic’s case, the investments in the e-bike market have been pivotal to the
turnaround of the business. The new ownership decided to exploit Fantic’s motorcycle brand
awareness in a high-growing segment, and in a sector, the e-mobility, which is gaining consent
among the population around the world.
4.2.2 Moto Morini S.R.L.
4.2.2.1 History and Financial Background
Moto Morini S.R.L. (hereinafter “Moto Morini”) was established by Alfonso Morini in 1937
in Bologna. The firm has always been active in the motorcycles production and in 1970s it also
had two models of bicycle. Moto Morini’s motorcycles are assembled by hand in Moto Morini’s
production facility in Trivolzio, in the Pavia province, in Lombardy. In recent years, Moto
Morini decided to invest again in the bicycle market, and in particular it began to manufacture
pedal assisted bicycles. In 2018 Moto Morini was acquired by Zhongeng Vehicle Group, a
Chinese scooters and light motorcycles manufacturer which bought the company for 10 million
of euros.
According to Moto Morini’s financial statement, the company has been living a period of
economic distress in the latest year. In fact, notwithstanding the fact that the total turnover has
increased, the EBITDA is negative, meaning that the core business does not generate value.
The financial equilibrium has been improving, as the net financial position has dropped over
the period analyzed, and the equity level went from a negative value of approximately 1,5
million to 4 million of euro thanks to the capital injection provided by the new Asian ownership.
The index NFP/EBITDA has not been computed as it would not be informative because the
EBITDA is negative.
€/000 2016 2017 2018 y/y growth (%) 2017 2018Total Revenues 1.588 1.426 2.128 Total Revenues -10,20% 49,25%EBITDA -1.241 -1.981 -1.721 EBITDA 59,58% -13,13%EBITDA Margin -78,19% -138,95% -80,88% EBITDA Margin 77,70% -41,80%Net Income -1.808 -2.441 -2.160 Net Income 35,03% -11,52%ROIC -38,43% -53,26% -46,24% ROIC 38,61% -13,18%Invested Capital 4.706,16 4.581,60 4.658,85 Invested Capital -2,65% 1,69%NFP 6.122 810 529 NFP -86,78% -34,70%Equity -1.416 3.772 4.130 Equity -366,39% 9,49%
120
Table 4.12. Moto Morini S.R.L. Financials. Source Aida (2019).
4.2.2.2 Moto Morini’s entrance in the pedelecs market
In 2017 Moto Morini has launched its first e-bike in the market. However, the e-bike production
is still a secondary business for Moto Morini, according to Alberto Monni, head of production
at Moto Morini, who answered the interview via email on the 31st of July 2019.
The decision to enter in the e-bike market has been strategic, as the company believes that the
future of transportation is electric. The company has therefore decided to start investing in the
e-bike world, also to gain expertise and competences in the e-mobility market. Furthermore,
today’s technology is well-developed and has allowed to produce vehicles which are suitable
for urban mobility, without letting the design down. In order to develop the pedelecs project,
Moto Morini cooperated with Zehus S.P.A., a university spin-off which designed an e-bike
system that fits in a tiny rear bike hub, without wires and without any need of recharge, as it
collects energy from the cyclists’ pedaling when they do not need the motor’s assistance.
Moto Morini’s aim in the pedelecs project is to maintain the same level of quality and elegance
which is typical of its hand-made assembled motorcycles, thus it has used high-quality
components and its know-how in the motorcycles’ design in its pedelecs. In fact, according to
Mr. Monni, pedelecs’ design and innovation in the drive-unit’s side are the key success factors
to compete in the market.
4.2.3 Cases Summary
As of today, motorcycles producers who entered in the pedelecs market in Italy are a minority.
Nonetheless, the e-mobility is starting to be seen as a market opportunity also in the motorcycles
industry. For instance, Fantic Motor exploited the surge of pedelecs market to turnaround the
business and to restate its brand equity. Furthermore, Moto Morini chose to enter the pedelecs
market to exploit an opportunity on one side, and to start acquiring skills in e-mobility on the
other In fact, while e-motorcycles have not yet well-spread in the market, the transition toward
e-mobility, which has involved autos and bicycles would probably involve motorcycles too in
the next few years.
Both the players interviewed mentioned the importance of design and innovation as key success
factors to operate in the pedelecs market. The know-how they acquired in the design of the
motorcycles and the expertise in the motors’ side have been two useful factors to enter in the
market. Moreover, both the players interviewed cooperate with drive-unit manufacturers to

121
produce their pedelecs. They exploited their competences in the motorcycles market, especially
in the pedelecs design and esthetics while relying on partners for the electronic components.
4.3 Pedelecs Producers
4.3.1 World Dimension S.R.L.
4.3.1.1 History and Financial Background
World Dimension S.R.L. (hereinafter “World Dimension”) was established in 1999, in
Sant’Arcangelo di Romagna, in the province of Ravenna in the Emilia-Romagna region. E-
bikes manufacturing has always been World Dimension’s core business, thus the company has
developed a strong expertise in the pedelecs field. World Dimension is known for its Italian
design and the quality of its after-sale service.
In 2018, World Dimension’s total turnover was 1,4 million. The latter has been increasing in
the period analyzed. On the contrary, the EBITDA margin is worsening, and the marginality is
becoming thinner, thus signaling that the company might have issues on the economic
efficiency side. In particular, the EBITDA dropped by 31% between 2017 and 2018. The
company is highly indebted, as the NFP/EBITDA index has a level of 10,54 in 2018, thus the
sustainability of the debt is at risk in the near future. The data are summarized in the table
below.
Table 4.13. World Dimension S.R.L. Financials. Source Aida (2019).
4.3.1.2 World Dimension’s decision to make pedelecs its core business.
The decision to invest in the pedelecs market back in 1999, when the technology was not as
advanced and established as it is today, was taken because the founders strongly believe in e-
€/000 2016 2017 2018 y/y growth (%) 2017 2018Total Revenues 1.294 1.408 1.440 Total Revenues 8,81% 2,32%EBITDA 67 64 44 EBITDA -3,63% -31,29%EBITDA Margin 5,15% 4,56% 3,06% EBITDA Margin -11,43% -32,85%Net Income 15 18 11 Net Income 21,42% -37,70%ROIC n.d. n.d. 3,92% ROIC n.d. n.d.NFP/EBITDA n.d. n.d. 10,54 NFP/EBITDA n.d. n.d.Invested Capital n.d. n.d. 546 Invested Capital n.d. n.d.NFP n.d. n.d. 465 NFP n.d. n.d.Equity 52 70 81 Equity 34,25% 15,90%

122
mobility as a solution for urban mobility, according to Sabrina Togni, sales assistant for World
Dimension, who answered the interview via phone on the 06th of June 2019. In the beginning
people worried about the reliability of the pedelecs, as technology was still at its early stages,
and having a good after-sale service was pivotal for customers. For this reason, World
Dimension invested a lot also on the spare parts side and on providing an optimal after-sale
service for its clients. In fact, part of World Dimension’s competitive advantage is in the high
quality of its after-sale assistance, which is among the factors that, according to Ms. Togni are
crucial to be successful in the pedelecs market.
When World Dimension first started out, the most relevant skills it had to acquire were
technical. Technicians have been fundamental to fully understand the product and its
functioning.
World Dimension offers a wide range of model types, to answer to different consumers’ needs.
The quality of World Dimension products has improved over the years and the “Made in Italy”
brand has been reinforced. In fact, since the introduction of anti-dumping laws against fully-
assembled Chinese products, World Dimension has been reorganizing the production and
would start assembling and producing bicycle parts from 2021.
4.3.2 Askoll EVA
4.3.2.1 History and Financial Background
Askoll EVA S.P.A. (following “Askoll EVA”) is a division of Askoll Group. Askoll Group has
been active in the electric motors market for over 40 years, since 1978, its core-business being
the production of high-performing, low-consuming electric motors. The idea of Askoll’s
founder, Elio Marioni, was to implement the synchronous technology to electric motors. This
application allows to save more than 50% of energy with respect to traditional electric motors.
In 2015, after having spent three years on R&D, with the cooperation of a team of technicians
hired from the main bicycle, motorcycle and automotive producers, Askoll EVA division was
established as a spin-off of Askoll Group and was quoted in the Alternative Investment Market
(hereinafter “AIM”) in Milan capital market. Askoll Group has decided to enter in the
sustainable mobility market, by producing a range of electric vehicles (i.e. e-scooters and
pedelecs) exploiting its know-how and expertise in the electric motors and their components.
Askoll EVA is a start-up. Its total turnover has been constantly increasing in the last three years,
with a boost in 2018. In fact, it went from the 3,6 million in 2017 to over 14 million in 2018.
On the profitability’s side, Askoll EVA’s EBITDA margin is negative in 2018, even though it
has been improving over the last three years. On the balance sheet side, the net financial position
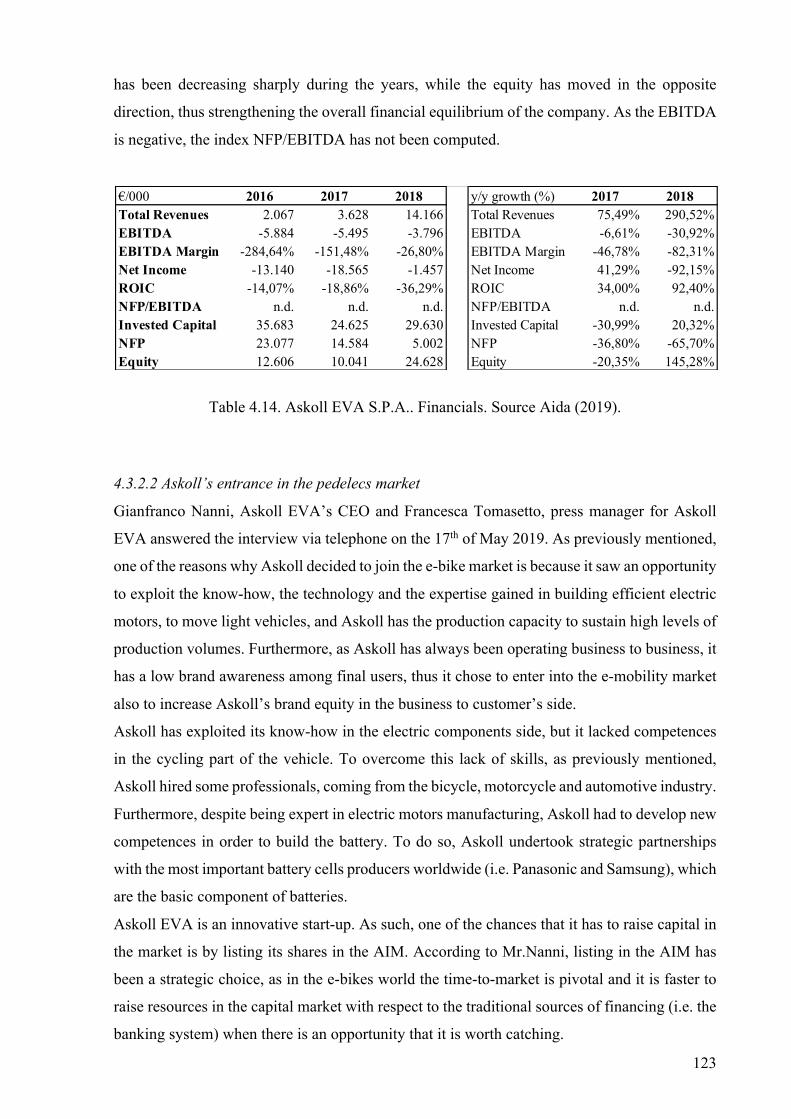
123
has been decreasing sharply during the years, while the equity has moved in the opposite
direction, thus strengthening the overall financial equilibrium of the company. As the EBITDA
is negative, the index NFP/EBITDA has not been computed.
Table 4.14. Askoll EVA S.P.A.. Financials. Source Aida (2019).
4.3.2.2 Askoll’s entrance in the pedelecs market
Gianfranco Nanni, Askoll EVA’s CEO and Francesca Tomasetto, press manager for Askoll
EVA answered the interview via telephone on the 17th of May 2019. As previously mentioned,
one of the reasons why Askoll decided to join the e-bike market is because it saw an opportunity
to exploit the know-how, the technology and the expertise gained in building efficient electric
motors, to move light vehicles, and Askoll has the production capacity to sustain high levels of
production volumes. Furthermore, as Askoll has always been operating business to business, it
has a low brand awareness among final users, thus it chose to enter into the e-mobility market
also to increase Askoll’s brand equity in the business to customer’s side.
Askoll has exploited its know-how in the electric components side, but it lacked competences
in the cycling part of the vehicle. To overcome this lack of skills, as previously mentioned,
Askoll hired some professionals, coming from the bicycle, motorcycle and automotive industry.
Furthermore, despite being expert in electric motors manufacturing, Askoll had to develop new
competences in order to build the battery. To do so, Askoll undertook strategic partnerships
with the most important battery cells producers worldwide (i.e. Panasonic and Samsung), which
are the basic component of batteries.
Askoll EVA is an innovative start-up. As such, one of the chances that it has to raise capital in
the market is by listing its shares in the AIM. According to Mr.Nanni, listing in the AIM has
been a strategic choice, as in the e-bikes world the time-to-market is pivotal and it is faster to
raise resources in the capital market with respect to the traditional sources of financing (i.e. the
banking system) when there is an opportunity that it is worth catching.
€/000 2016 2017 2018 y/y growth (%) 2017 2018Total Revenues 2.067 3.628 14.166 Total Revenues 75,49% 290,52%EBITDA -5.884 -5.495 -3.796 EBITDA -6,61% -30,92%EBITDA Margin -284,64% -151,48% -26,80% EBITDA Margin -46,78% -82,31%Net Income -13.140 -18.565 -1.457 Net Income 41,29% -92,15%ROIC -14,07% -18,86% -36,29% ROIC 34,00% 92,40%NFP/EBITDA n.d. n.d. n.d. NFP/EBITDA n.d. n.d.Invested Capital 35.683 24.625 29.630 Invested Capital -30,99% 20,32%NFP 23.077 14.584 5.002 NFP -36,80% -65,70%Equity 12.606 10.041 24.628 Equity -20,35% 145,28%

124
According to Mr. Nanni, Askoll’s competitive advantage is in its ability to fully produce the
electronic parts of the vehicles on its own. Moreover, Askoll is also able to customize products
on the basis of its customers’ needs.
Askoll’s products range from standard-type e-bikes (i.e. e-city, e-folding and e-trekking), to e-
scooters. The decision not to produce e-mountain bike or e-road bikes is strategic. In fact, the
latter are premium bicycles and the brand asset is highly valuable, but, as previously mentioned,
Askoll lacks in brand equity. Moreover, Askoll’s objective is to supply drive unit to premium
bicycles producers, thus utilizing its ability to produce highly efficient electric motors as an
asset to enter into the premium pedelecs segment without producing them directly. In fact,
according to Mr. Nanni, while the bicycle market is fragmented and competition is high, in
drive-units market industry rivalry is lower and the market is contended among 4 or 5 big
players, thus there are higher chances to compete successfully.
In the pedelecs market Askoll’s market share is currently 2% but the company has great chances
to grow, especially if the e-bike sharing starts to spread among Italian cities.
4.4.2.3 Askoll’s partnership with battery cells producers
Mr. Nanni declared that Askoll engaged in strategic partnerships with the main battery cells
producers around the world. While being expert in the electric motors production, Askoll lacked
in competences on the battery’s side. Therefore, the main reason behind these partnerships is
for Askoll EVA to reach full independence in the production of all the electric parts of the
vehicles.
4.3.3 KP S.R.L. - Thok E-Bikes
4.3.3.1 History and Financial Background
KP S.R.L. (following “Thok Bikes”) is a start-up, producing only e-mountain bikes. It was born
from the idea of Stefano Migliorni, a famous Italian athlete who competed many years in
mountain bikes competition, and a friend of his, Livio Suppo, who has been the marketing
manager of Ducati first and later team principal of the Honda MotoGP team, with whom he
shared the passion for mountain bikes. Mr. Suppo realized that the e-mountain bike allowed
him to fill the gap between his physical shape and Mr. Migliorini’s. The two friends presented
the idea of their start-up to two entrepreneurs from Piemonte region, managers of TCN Group,
a company specialized in precision machining., who decided to invest in the project. Thok’s
design was developed with the cooperation of Drudi Performance, the design firm of Aldo
Drudi, who has a long-time expertise in the design of riders’ helmets and MotoGP liveries.
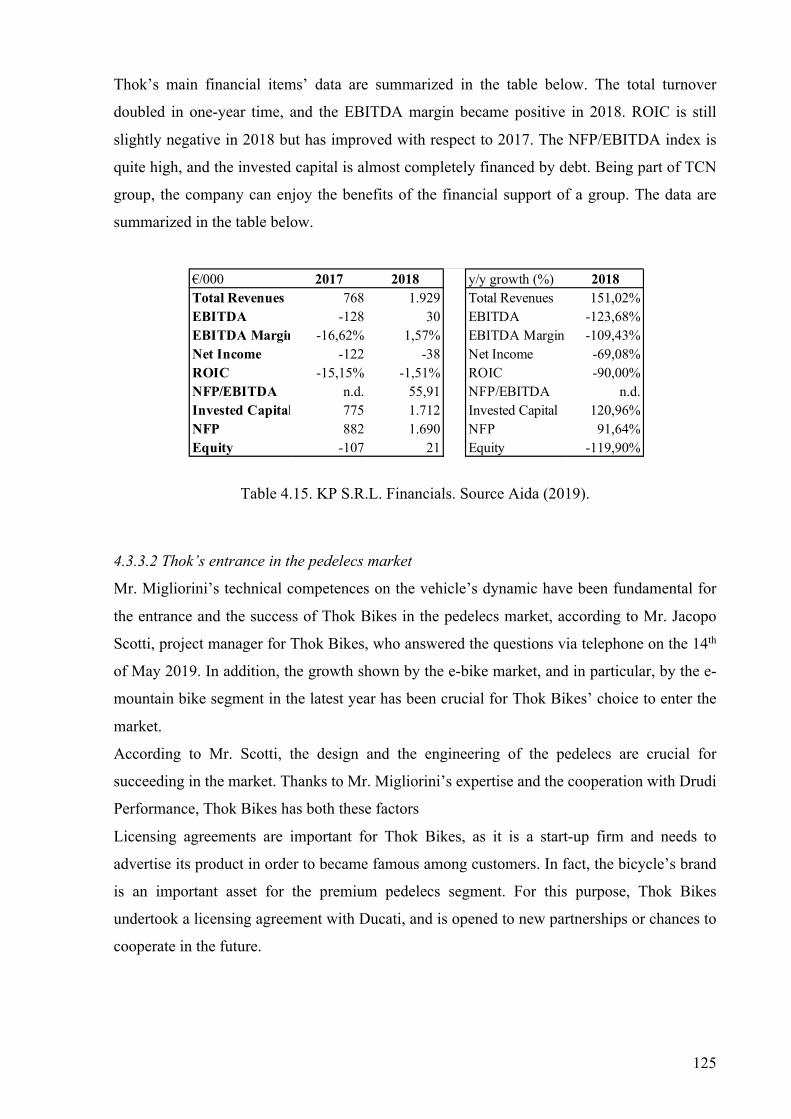
125
Thok’s main financial items’ data are summarized in the table below. The total turnover
doubled in one-year time, and the EBITDA margin became positive in 2018. ROIC is still
slightly negative in 2018 but has improved with respect to 2017. The NFP/EBITDA index is
quite high, and the invested capital is almost completely financed by debt. Being part of TCN
group, the company can enjoy the benefits of the financial support of a group. The data are
summarized in the table below.
Table 4.15. KP S.R.L. Financials. Source Aida (2019).
4.3.3.2 Thok’s entrance in the pedelecs market
Mr. Migliorini’s technical competences on the vehicle’s dynamic have been fundamental for
the entrance and the success of Thok Bikes in the pedelecs market, according to Mr. Jacopo
Scotti, project manager for Thok Bikes, who answered the questions via telephone on the 14th
of May 2019. In addition, the growth shown by the e-bike market, and in particular, by the e-
mountain bike segment in the latest year has been crucial for Thok Bikes’ choice to enter the
market.
According to Mr. Scotti, the design and the engineering of the pedelecs are crucial for
succeeding in the market. Thanks to Mr. Migliorini’s expertise and the cooperation with Drudi
Performance, Thok Bikes has both these factors
Licensing agreements are important for Thok Bikes, as it is a start-up firm and needs to
advertise its product in order to became famous among customers. In fact, the bicycle’s brand
is an important asset for the premium pedelecs segment. For this purpose, Thok Bikes
undertook a licensing agreement with Ducati, and is opened to new partnerships or chances to
cooperate in the future.
€/000 2017 2018 y/y growth (%) 2018Total Revenues 768 1.929 Total Revenues 151,02%EBITDA -128 30 EBITDA -123,68%EBITDA Margin -16,62% 1,57% EBITDA Margin -109,43%Net Income -122 -38 Net Income -69,08%ROIC -15,15% -1,51% ROIC -90,00%NFP/EBITDA n.d. 55,91 NFP/EBITDA n.d.Invested Capital 775 1.712 Invested Capital 120,96%NFP 882 1.690 NFP 91,64%Equity -107 21 Equity -119,90%

126
4.3.4. Case Studies Summary
Pedelecs manufacturers are heterogeneous. Each of the players interviewed has a different
background and expertise. Nonetheless, the possibility of taking advantage of a market
opportunity has been a common driver among the three of them.
While Askoll EVA exploited the know-how accumulated in the electric motor and its
component in the over 40 years of activity of its parent company, and World Dimension saw in
the pedelecs market an opportunity to render Italian cities greener and to improve urban
mobility, Thok focused on the e-mountain bike market niche, exploiting Migliorini’s expertise,
background and personality. All the companies analyzed are rather new in the market, as Askoll
EVA and Thok are both start-ups and World Dimension has a 20-years history.
The players interviewed who undertook strategic partnerships did it for very different reasons.
In fact, while Askoll implemented strategic partnerships with battery cells producers to be
independent in the drive-unit production, Thok’s licensing agreement with Ducati has been
undertaken for marketing reasons. This is also due to Askoll’s and Thok’s differing consumer
targets. In fact, while Askoll is active in the standard pedelecs market, where the brand asset is
not crucial, Thok operates in the e-mountain bikes market niche, where brand building is
pivotal.
4.4 Components Manufacturer
4.4.1 Selle Italia
4.4.1.1. History and Financial Background
Selle Italia S.R.L. (hereinafter “Selle Italia”) was set up in 1897 in Corsico, near Milan in the
North West of Italy. The company’s original mission was to produce travel saddles. In 1970s,
Selle Italia was acquired by Bigolin’s family and the company’s headquarter was moved to
Asolo, a town in the province of Treviso, in the Veneto region. Nowadays, Selle Italia is one of
the market leaders in the production of high-end saddles dedicated to professional cyclists.
Selle Italia is a medium enterprise, with a total turnover equal to 19,9 million in 2017. The latter
returned to increase in 2017, after a slow-down in 2016. On the contrary, both the EBITDA
margin and the ROIC have been decreasing during the last three years, raising concerns about
the economic efficiency of the company. Notwithstanding the fact that the net financial position
worsened in the period considered, the company can be said to be financially sound, as the
index of NFP/EBITDA is slightly positive, with a value of 0,31 in 2017.

127
Table 4.16. Selle Italia SRL Financials. Source Aida (2019).
4.4.2.2 Selle Italia’s entrance in the pedelecs market
Massimo Perozzo, Selle Italia’s marketing manager hosted a meeting on the 15th of April 2019
in order to answer the interview. After exposing some premises on the e-bike sector, describing
it as the highest growing segment in the bicycle market in the latest years, Mr. Perozzo
explained the reasons why Selle Italia has decided to produce a tailor-made saddle for e-bikes.
Consumers desire a product which is “e-bike ready”, thus the bike’s design and all its
components have to fit together and to have a catching design. Therefore, the need to answer
consumers’ needs has been the main driver for Selle Italia to enter the market. In fact, saddles
are a particular component of bicycles, as they can be changed by consumers as they please.
After some market analysis, Selle Italia found out to have already the proper technology for
producing e-bike saddles. The latter have to be comfortable and make it easy for the rider to lift
the bike. As the motor assists the cyclist, the weight of the saddle is not important to the final
consumer as it is in road bicycles. On the other hand, as saddles are one of the three contact
points of the cyclist with the bicycle and the ground, they are important for the riders’ comfort.
The creation of a new saddle for e-bikes has mostly required investments in the marketing side.
Selle Italia has a well-established brand awareness, built over the years thanks to the quality of
its products and the prestige of having a “Made in Italy” product. Moreover, the amount of
successes of athletes using their saddles in competitions have contributed to build Selle Italia’s
brand awareness.
€/000 2015 2016 2017 y/y growth (%) 2016 2017Total Revenues 21.488 18.838 19.901 Total Revenues -12,33% 5,64%EBITDA 1.383 1.067 980 EBITDA -22,87% -8,09%EBITDA Margin 6,44% 5,66% 4,93% EBITDA Margin -12,02% -13,00%Net Income 197 158 194 Net Income -19,41% 22,39%ROIC 5,28% 8,41% 5,74% ROIC 59,35% -31,76%NFP/EBITDA -0,16 -1,25 0,31 NFP/EBITDA 690,42% -124,41%Invested Capital 3.382 2.325 4.159 Invested Capital -31,25% 78,85%NFP -219 -1.335 300 NFP 509,67% -122,44%Equity 3.601 3.661 3.859 Equity 1,65% 5,43%
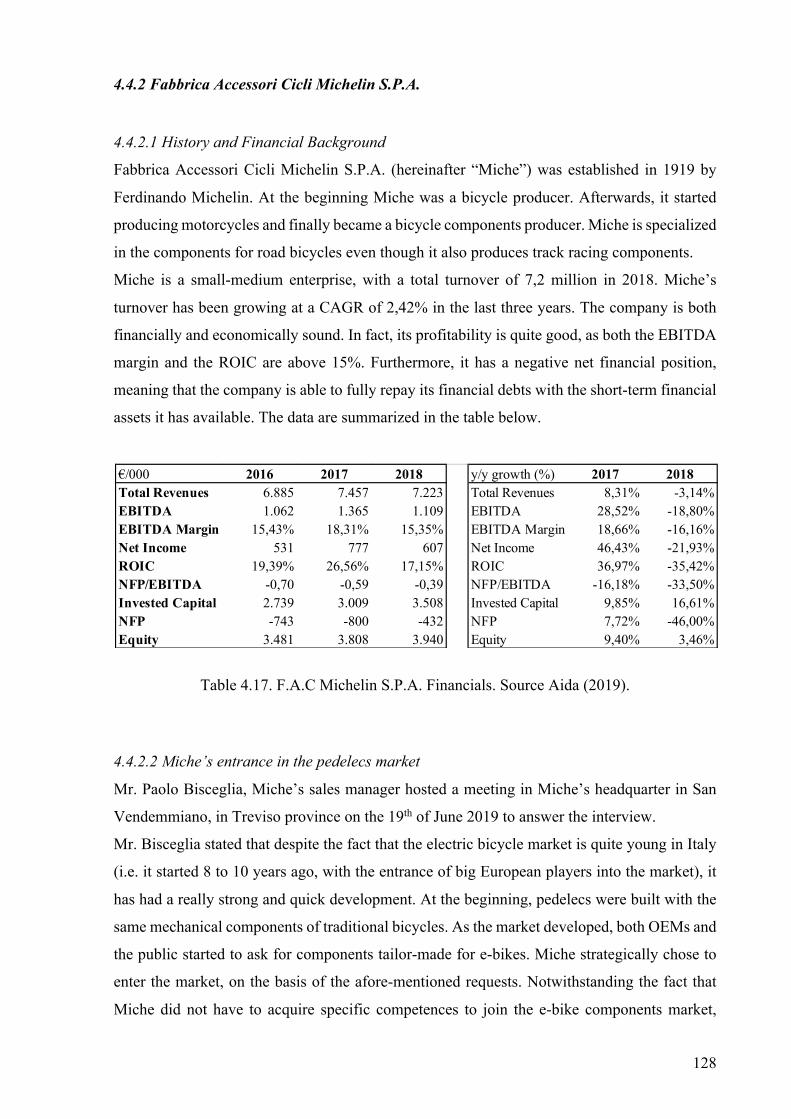
128
4.4.2 Fabbrica Accessori Cicli Michelin S.P.A.
4.4.2.1 History and Financial Background
Fabbrica Accessori Cicli Michelin S.P.A. (hereinafter “Miche”) was established in 1919 by
Ferdinando Michelin. At the beginning Miche was a bicycle producer. Afterwards, it started
producing motorcycles and finally became a bicycle components producer. Miche is specialized
in the components for road bicycles even though it also produces track racing components.
Miche is a small-medium enterprise, with a total turnover of 7,2 million in 2018. Miche’s
turnover has been growing at a CAGR of 2,42% in the last three years. The company is both
financially and economically sound. In fact, its profitability is quite good, as both the EBITDA
margin and the ROIC are above 15%. Furthermore, it has a negative net financial position,
meaning that the company is able to fully repay its financial debts with the short-term financial
assets it has available. The data are summarized in the table below.
Table 4.17. F.A.C Michelin S.P.A. Financials. Source Aida (2019).
4.4.2.2 Miche’s entrance in the pedelecs market
Mr. Paolo Bisceglia, Miche’s sales manager hosted a meeting in Miche’s headquarter in San
Vendemmiano, in Treviso province on the 19th of June 2019 to answer the interview.
Mr. Bisceglia stated that despite the fact that the electric bicycle market is quite young in Italy
(i.e. it started 8 to 10 years ago, with the entrance of big European players into the market), it
has had a really strong and quick development. At the beginning, pedelecs were built with the
same mechanical components of traditional bicycles. As the market developed, both OEMs and
the public started to ask for components tailor-made for e-bikes. Miche strategically chose to
enter the market, on the basis of the afore-mentioned requests. Notwithstanding the fact that
Miche did not have to acquire specific competences to join the e-bike components market,
€/000 2016 2017 2018 y/y growth (%) 2017 2018Total Revenues 6.885 7.457 7.223 Total Revenues 8,31% -3,14%EBITDA 1.062 1.365 1.109 EBITDA 28,52% -18,80%EBITDA Margin 15,43% 18,31% 15,35% EBITDA Margin 18,66% -16,16%Net Income 531 777 607 Net Income 46,43% -21,93%ROIC 19,39% 26,56% 17,15% ROIC 36,97% -35,42%NFP/EBITDA -0,70 -0,59 -0,39 NFP/EBITDA -16,18% -33,50%Invested Capital 2.739 3.009 3.508 Invested Capital 9,85% 16,61%NFP -743 -800 -432 NFP 7,72% -46,00%Equity 3.481 3.808 3.940 Equity 9,40% 3,46%
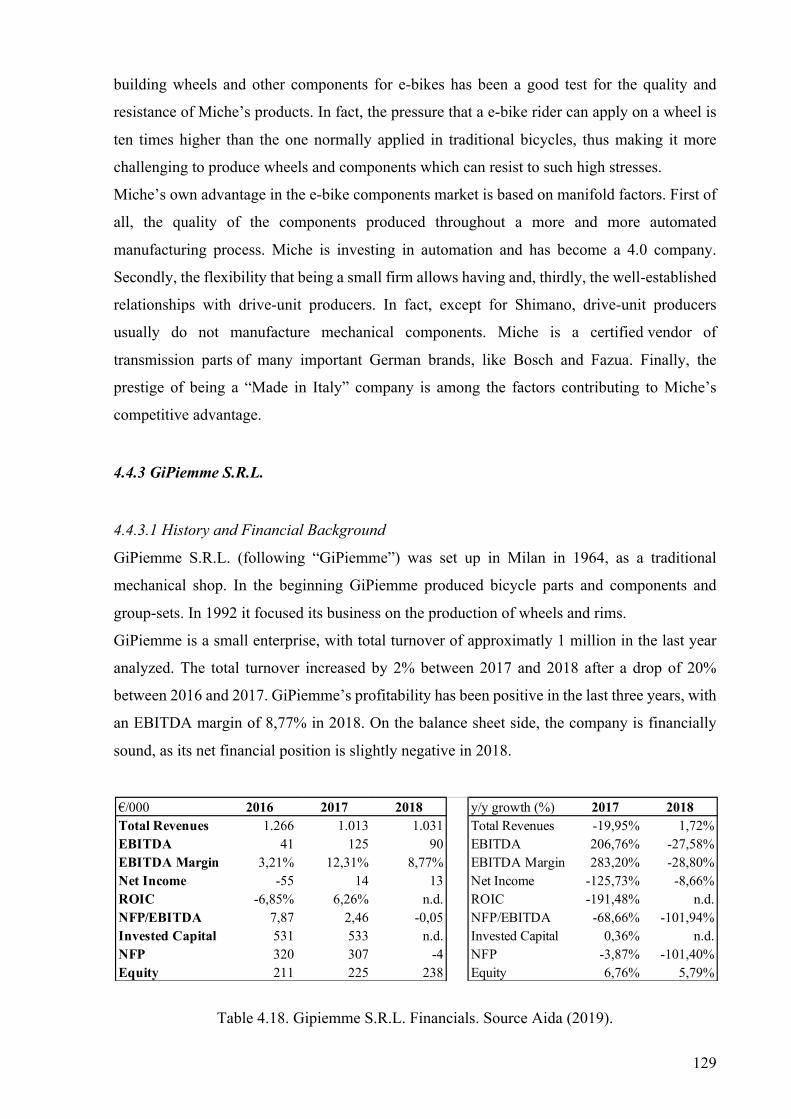
129
building wheels and other components for e-bikes has been a good test for the quality and
resistance of Miche’s products. In fact, the pressure that a e-bike rider can apply on a wheel is
ten times higher than the one normally applied in traditional bicycles, thus making it more
challenging to produce wheels and components which can resist to such high stresses.
Miche’s own advantage in the e-bike components market is based on manifold factors. First of
all, the quality of the components produced throughout a more and more automated
manufacturing process. Miche is investing in automation and has become a 4.0 company.
Secondly, the flexibility that being a small firm allows having and, thirdly, the well-established
relationships with drive-unit producers. In fact, except for Shimano, drive-unit producers
usually do not manufacture mechanical components. Miche is a certified vendor of
transmission parts of many important German brands, like Bosch and Fazua. Finally, the
prestige of being a “Made in Italy” company is among the factors contributing to Miche’s
competitive advantage.
4.4.3 GiPiemme S.R.L.
4.4.3.1 History and Financial Background
GiPiemme S.R.L. (following “GiPiemme”) was set up in Milan in 1964, as a traditional
mechanical shop. In the beginning GiPiemme produced bicycle parts and components and
group-sets. In 1992 it focused its business on the production of wheels and rims.
GiPiemme is a small enterprise, with total turnover of approximatly 1 million in the last year
analyzed. The total turnover increased by 2% between 2017 and 2018 after a drop of 20%
between 2016 and 2017. GiPiemme’s profitability has been positive in the last three years, with
an EBITDA margin of 8,77% in 2018. On the balance sheet side, the company is financially
sound, as its net financial position is slightly negative in 2018.
Table 4.18. Gipiemme S.R.L. Financials. Source Aida (2019).
€/000 2016 2017 2018 y/y growth (%) 2017 2018Total Revenues 1.266 1.013 1.031 Total Revenues -19,95% 1,72%EBITDA 41 125 90 EBITDA 206,76% -27,58%EBITDA Margin 3,21% 12,31% 8,77% EBITDA Margin 283,20% -28,80%Net Income -55 14 13 Net Income -125,73% -8,66%ROIC -6,85% 6,26% n.d. ROIC -191,48% n.d.NFP/EBITDA 7,87 2,46 -0,05 NFP/EBITDA -68,66% -101,94%Invested Capital 531 533 n.d. Invested Capital 0,36% n.d.NFP 320 307 -4 NFP -3,87% -101,40%Equity 211 225 238 Equity 6,76% 5,79%
130
4.4.3.2 GiPiemme’s entrance in the pedelecs market
Ms. Alice Bernardi, Sales Director for GiPiemme answered the interview via telephone on the
2nd of July 2019. Ms. Bernardi stated that the decision to start manufacturing specific wheels
for e-bikes was taken after GiPiemme’s clients began to ask for tailor-made products.
Specifically, GiPiemme has exploited its high flexibility to produce customized wheels for
customers. No specific competence has been acquired in order to enter the market, but some
adaptations were made to the previous products’ standards. In particular, the wheels and the
rims had to be able to bear higher pressures.
4.4.4 Cases Summary
The growth prospects and the rapid development of the pedelecs market in Italy has involved
also bicycle components manufacturers. The public started to desire an “electric-ready”
product, with specific components and accessories, tailor-made for electric bicycles. This
request from the public has driven the entrance of some component producers into the e-bike
market. As of today, only 6 over the 26 players analyzed started manufacturing pedelecs’ tailor-
made components.
As declared by the players interviewed, while OEMs had to acquire some competences and
develop new skills to operate in the pedelecs market, component manufacturers did not. In fact,
only some adaptation to their already established range of products were necessary to start
competing in the pedelecs market. For wheels and rims for instance, adjustments were made in
terms of the overall pressure that the components could sustain. For saddles, the product’s
design was renewed, in order to give consumers the perception of an “electric-ready” product.
4.5 Drive-Unit Manufacturers
4.5.1 Oli S.P.A. (Olieds)
4.5.1.1 History and Financial Background
Oli S.P.A. (hereinafter “Oli”) is a multinational group, leader in the manufacturing of electric
and pneumatic vibrators. In 2014 the group division OLI eBike Systems was established in
order to manufacture drive-units for pedelecs and exploit the 50-years of experience in the
electric motors field provided by the parent Oli.

131
The financial statement analysis summarized in the table below refers to Oli, as the division of
OLI eBike Systems has not been set up as a separate entity. While the total turnover has
increased in the last three years, with a CAGR of 17,58%, the company is neither economically
nor financially sound. In fact, the EBITDA is slightly positive only in 2017, while the ROIC is
negative. Furthermore, the net financial position grew by approximately 5 million between
2016 and 2017.
Table 4.19. Oli S.P.A. Financials. Source Aida (2019).
4.5.1.2 Oli’s entrance in the pedelecs market
Mr. Marco Manuzzi, project manager for the e-bike division hosted a meeting on the 10th of
June 2019 to answer the interview, in OLI eBikeSystems branch in Forlì Cesena. Mr. Manuzzi
stated that Oli’s decision to enter the e-bike market was almost casual. Oli’s CEO, Mr. Giorgio
Gavioli is a passionate cyclist and, back in 2014 when the project started, the e-bike market was
growing at a double-digit rate. Therefore, Mr. Gavioli decided to pursue the project to
manufacture a highly performing drive-unit for pedelecs, to diversify Oli’s product base and to
exploit a market opportunity in a field where Oli had already a well-developed know-how,
being a manufacturer of electric and pneumatic vibrators. Competences were acquired in order
to enter in the market, in particular a team of engineers and technicians who were experts in the
e-bike segment was set up. The prototype and testing phase of the project lasted two years and
was carried on in cooperation with two famous Italian bicycle manufacturers (i.e. Atala and
Bianchi). Cooperation with OEMs has been necessary to develop the motor. In fact, while Oli
had a strong know-how in electric motors, it lacked in skills about the application of the motor
to the bicycle. Specifically, how the motor had to work and which feelings should be transmitted
to the rider.
One of the key success factors of being a drive-unit manufacturer is to have a good production
capacity and knowledge about the specific application of the motor to the pedelec. Oli
developed an electric motor which is highly efficient, it is fluid and pleasant to use, and can
€/000 2015 2016 2017 y/y growth (%) 2016 2017Total Revenues 11.906 12.600 16.459 Total Revenues 5,83% 30,63%EBITDA -857 -1.164 75 EBITDA 35,88% -106,43%EBITDA Margin -7,20% -9,24% 0,45% EBITDA Margin 28,39% -104,92%Net Income 1.669 1.088 -398 Net Income -34,83% -136,54%ROIC -3,78% -4,10% -0,96% ROIC 8,47% -76,45%NFP/EBITDA n.d. n.d. 58,63 NFP/EBITDA n.d. n.d.Invested Capital 22.883 23.505 28.236 Invested Capital 2,72% 20,13%NFP -276 -742 4.387 NFP 168,95% -691,15%Equity 23.159 24.247 23.849 Equity 4,70% -1,64%
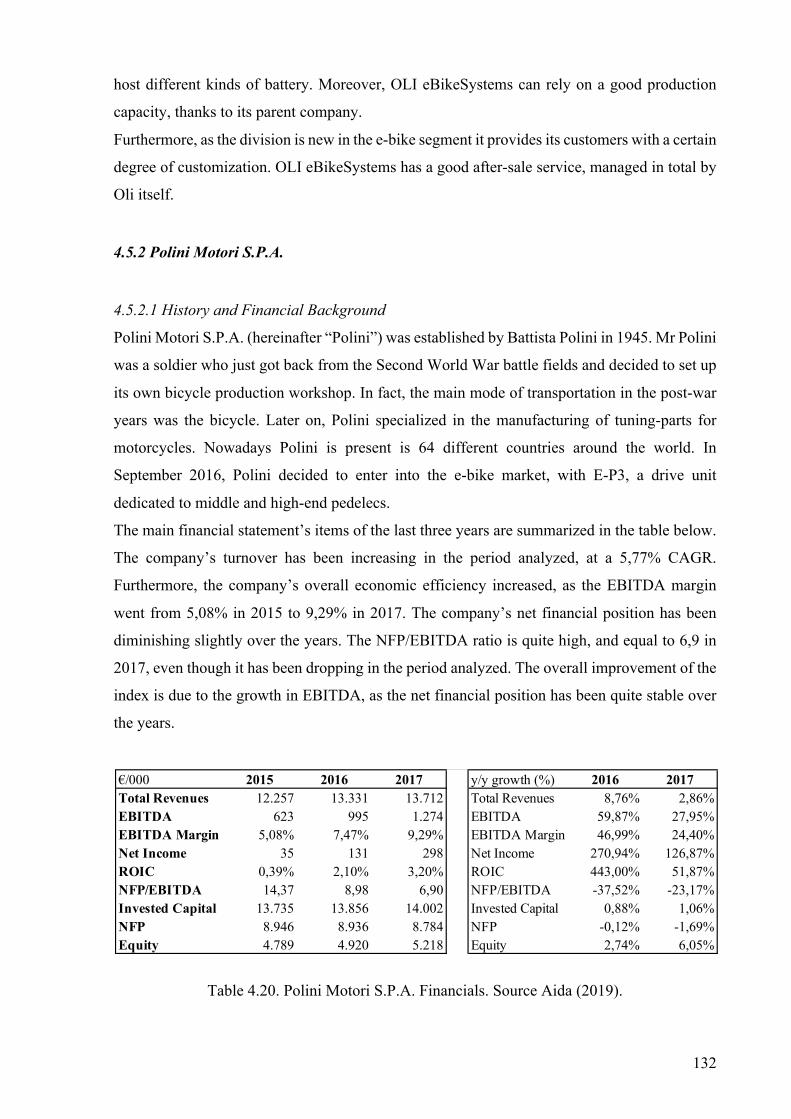
132
host different kinds of battery. Moreover, OLI eBikeSystems can rely on a good production
capacity, thanks to its parent company.
Furthermore, as the division is new in the e-bike segment it provides its customers with a certain
degree of customization. OLI eBikeSystems has a good after-sale service, managed in total by
Oli itself.
4.5.2 Polini Motori S.P.A.
4.5.2.1 History and Financial Background
Polini Motori S.P.A. (hereinafter “Polini”) was established by Battista Polini in 1945. Mr Polini
was a soldier who just got back from the Second World War battle fields and decided to set up
its own bicycle production workshop. In fact, the main mode of transportation in the post-war
years was the bicycle. Later on, Polini specialized in the manufacturing of tuning-parts for
motorcycles. Nowadays Polini is present is 64 different countries around the world. In
September 2016, Polini decided to enter into the e-bike market, with E-P3, a drive unit
dedicated to middle and high-end pedelecs.
The main financial statement’s items of the last three years are summarized in the table below.
The company’s turnover has been increasing in the period analyzed, at a 5,77% CAGR.
Furthermore, the company’s overall economic efficiency increased, as the EBITDA margin
went from 5,08% in 2015 to 9,29% in 2017. The company’s net financial position has been
diminishing slightly over the years. The NFP/EBITDA ratio is quite high, and equal to 6,9 in
2017, even though it has been dropping in the period analyzed. The overall improvement of the
index is due to the growth in EBITDA, as the net financial position has been quite stable over
the years.
Table 4.20. Polini Motori S.P.A. Financials. Source Aida (2019).
€/000 2015 2016 2017 y/y growth (%) 2016 2017Total Revenues 12.257 13.331 13.712 Total Revenues 8,76% 2,86%EBITDA 623 995 1.274 EBITDA 59,87% 27,95%EBITDA Margin 5,08% 7,47% 9,29% EBITDA Margin 46,99% 24,40%Net Income 35 131 298 Net Income 270,94% 126,87%ROIC 0,39% 2,10% 3,20% ROIC 443,00% 51,87%NFP/EBITDA 14,37 8,98 6,90 NFP/EBITDA -37,52% -23,17%Invested Capital 13.735 13.856 14.002 Invested Capital 0,88% 1,06%NFP 8.946 8.936 8.784 NFP -0,12% -1,69%Equity 4.789 4.920 5.218 Equity 2,74% 6,05%
133
4.5.2.2 Polini’s entrance in the pedelecs market
Mr. Davide Burini, employee at Polini Motori S.P.A., replied to the interview with an article
sent by email on the 15th of May 2019. The choice of joining the pedelecs market was based on
the belief that Polini’s know-how, the brand and the prestige of being a “Made in Italy” product
could make the difference in the pedelecs drive unit market, which is led by foreign brands.
Polini is well-known around the world for being innovative and for producing reliable products.
The development of the new drive-unit for e-bikes has been managed in Polini’s R&D offices,
by its technicians and engineers, thus it was not necessary to acquire specific competences or
skills. Polini’s EP-3 is a highly efficient motor and has a limited volume. It is suited for middle
and high-end pedelecs. Bicycle OEMs are starting to value the product and choosing Polini as
a partner for their next products.
The company strongly believes in its brand equity, thus it decided not to customize its product
to answer to OEMs specific requests. Since 2016, when the product was first launched in the
market, more and more OEMs decided to tailor some of their products to Polini’s motor. The
partnership with Bianchi was undertaken in order to reinforce the “Made in Italy” brand and
offering the public a complete “Made in Italy” product.
4.5.3 Bikee Bike S.R.L.
4.5.3.1 History and Financial Background
Bikee Bike S.R.L. (hereinafter “Bikee Bike”) is an Italian start-up that produces mid-drive
conversion kits to transform traditional bicycles in electric. It was established in 2014 by two
brothers, Luca and Matteo Spaggiari, from Reggio-Emilia in the Emilia-Romagna region. Their
idea was to produce a motor powerful enough to face both off-road paths and mountain and hill
trails covering the whole Italian territory, and that is also light and easy to mount on as many
bicycles as possible. Bikee Bike’s system has won many awards since it was patented in 2014
and has been acknowledged by some Italian bicycle OEMs for bearing an interesting technical
improvement with respect to the electric motors in the market.
Financial data are summarized in the table below. The turnover has been increasing a lot in the
last three years, even though the EBITDA margin has still a negative value in 2017.
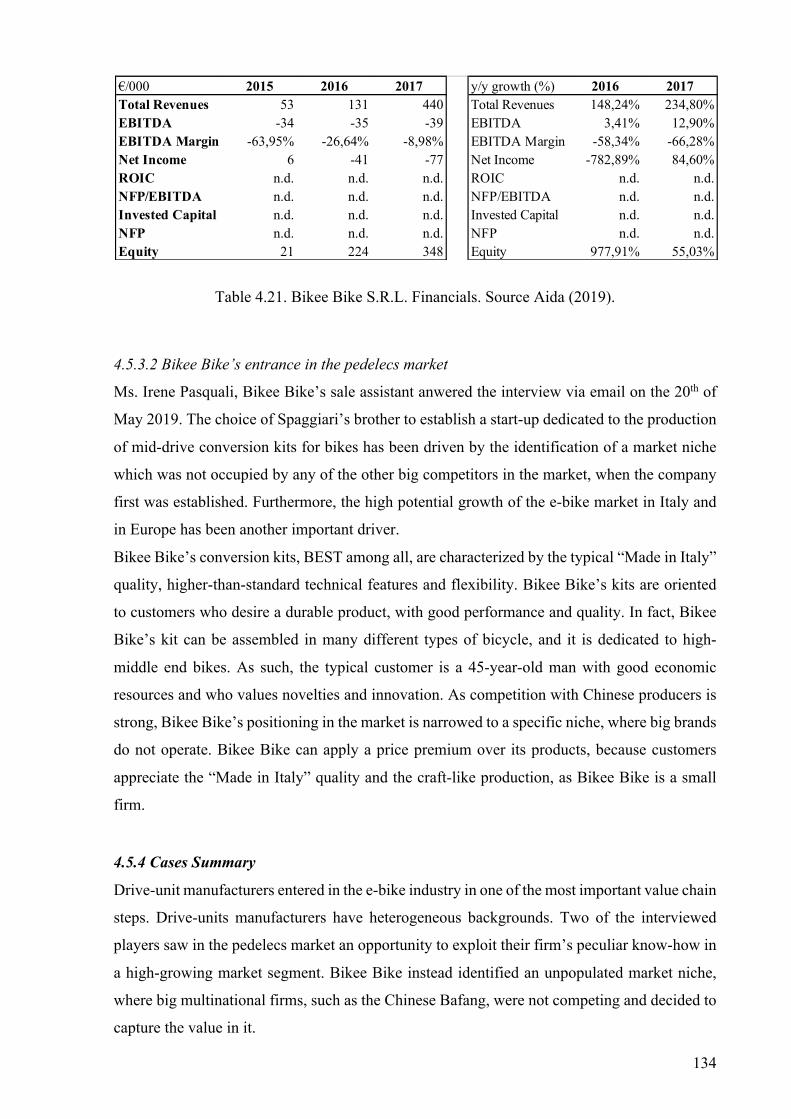
134
Table 4.21. Bikee Bike S.R.L. Financials. Source Aida (2019).
4.5.3.2 Bikee Bike’s entrance in the pedelecs market
Ms. Irene Pasquali, Bikee Bike’s sale assistant anwered the interview via email on the 20th of
May 2019. The choice of Spaggiari’s brother to establish a start-up dedicated to the production
of mid-drive conversion kits for bikes has been driven by the identification of a market niche
which was not occupied by any of the other big competitors in the market, when the company
first was established. Furthermore, the high potential growth of the e-bike market in Italy and
in Europe has been another important driver.
Bikee Bike’s conversion kits, BEST among all, are characterized by the typical “Made in Italy”
quality, higher-than-standard technical features and flexibility. Bikee Bike’s kits are oriented
to customers who desire a durable product, with good performance and quality. In fact, Bikee
Bike’s kit can be assembled in many different types of bicycle, and it is dedicated to high-
middle end bikes. As such, the typical customer is a 45-year-old man with good economic
resources and who values novelties and innovation. As competition with Chinese producers is
strong, Bikee Bike’s positioning in the market is narrowed to a specific niche, where big brands
do not operate. Bikee Bike can apply a price premium over its products, because customers
appreciate the “Made in Italy” quality and the craft-like production, as Bikee Bike is a small
firm.
4.5.4 Cases Summary
Drive-unit manufacturers entered in the e-bike industry in one of the most important value chain
steps. Drive-units manufacturers have heterogeneous backgrounds. Two of the interviewed
players saw in the pedelecs market an opportunity to exploit their firm’s peculiar know-how in
a high-growing market segment. Bikee Bike instead identified an unpopulated market niche,
where big multinational firms, such as the Chinese Bafang, were not competing and decided to
capture the value in it.
€/000 2015 2016 2017 y/y growth (%) 2016 2017Total Revenues 53 131 440 Total Revenues 148,24% 234,80%EBITDA -34 -35 -39 EBITDA 3,41% 12,90%EBITDA Margin -63,95% -26,64% -8,98% EBITDA Margin -58,34% -66,28%Net Income 6 -41 -77 Net Income -782,89% 84,60%ROIC n.d. n.d. n.d. ROIC n.d. n.d.NFP/EBITDA n.d. n.d. n.d. NFP/EBITDA n.d. n.d.Invested Capital n.d. n.d. n.d. Invested Capital n.d. n.d.NFP n.d. n.d. n.d. NFP n.d. n.d.Equity 21 224 348 Equity 977,91% 55,03%
135
OLI eBikeSystems’ value proposition is to manufacture a highly efficient motor that could beat
Bosch’s in terms of price for the final user. The cooperation with bicycle OEMs has been crucial
for Oli to be able to develop an efficient product which also matches consumer’s expectations
about the vehicle’s dynamic. Like Oli, Polini supplies to the market a “Made-in-Italy” and
efficient drive-unit. However, Polini targets high-end pedelecs.
In addition, know-how and pre-developed skills in electronic components or motors were
fundamental in all of the three cases. In fact, while Polini had already expertise in the motor
components market, Oli could exploit its parent company’s know-how and Bikee Bike’s
founders have expertise in automotive electric motors’ development.
4.6 Conclusions The electrification of the bicycle has attracted heterogeneous players to the market, with
different backgrounds and know-hows. While some of the players added product types to their
previous product range (i.e. bicycle OEMs), some others chose to diversify their offer, with
respect to their core-business (i.e. Askoll and Oli).
As expected, most of the players active in the market come from traditional bicycle production
and decided to catch the opportunity provided by an increasing demand of electric bicycles.
Among these players, no M&A deals were implemented for two main reasons. On one side,
bigger players with more financial resources preferred to engage in strategic partnerships with
drive-unit producers rather than pursuing acquisitions or other more financially and
strategically demanding operations, as the market is still too young in Italy and the trend that
the market will take cannot be clearly identified for the time being. On the other side, smaller
players are mostly family run small and medium enterprises which want to keep their
independence and the control of their own company.
The choice of some bicycle OEMs of undertaking strategic partnerships with drive-unit
manufacturers is in line with the value chain and the Porter analysis performed in chapter 2. In
fact, the value chain segment where drive-unit manufacturers operate is crucial in the
determination of companies’ competitive advantage in the pedelecs industry, both from the cost
drivers and the consumers’ purchase decision drivers point of view. The drive-unit is, indeed,
one of the most expensive components of pedelecs and the drive-unit’s performance and battery
autonomy drives consumers’ purchase decision. Furthermore, drive-unit producers are more
concentrated with respect to OEMs. For these reasons, drive-unit manufacturers have a high
bargaining power with respect to OEMs, as stated in the Porter Five Forces analysis. The drive
unit has had an impact also on the relevance of the after-sale service segment of the value chain.
In fact, bicycle OEMs needed to improve and strengthen their after-sale service in order to deal
136
with electronic components, as pedelecs are more complex vehicles with respect to traditional
bicycles. To sum up, OEMs’ partnerships with drive-unit manufacturers are highly valuable
from a strategic point of view, as the drive-unit quality and performance is one of the main
determinants of each company’s competitive advantage in the pedelecs industry.
In addition, while bicycle OEMs have an established know-how and expertise in how the
bicycle is built and the dynamic it should have, they lack in skills on the electric part of the
bicycle. Thus, most of the players stated that they needed to acquire technical competences, in
order to fill this knowledge gap and most of them did so by hiring personnel.
Motorcycles manufacturers joined the industry both to exploit the growth in demand, provided
by the expanding customer base, and to start operating in the e-mobility market. In fact,
pedelecs are currently more attractive to consumers than electric motorcycles. However, as
environmental concerns grow around the globe and legislators might enforce anti-pollution
regulation, motorcycle producers need to gain expertise in the e-mobility technologies and
markets. The players interviewed exploit both their know-how in motorcycles design and in the
motor technology to join the pedelecs industry. In addition, while for bicycle OEMs the
electrification of the bicycle has raised some issues in the drive-unit’s after-sale service,
motorcycle producers have an established after-sale service, as they are used to deal with motors
assistance. This is testified by the fact that while the majority of bicycle OEMs indicated the
quality of the after-sale service as a key factor to succeed in the market, motorcycle producers
perceived it more as a “surviving” factor. As bicycle OEMs, also motorcycle manufacturers
have undertaken strategic partnerships with drive-unit manufacturers in order to enter in the
industry and successfully compete in it.
Pedelecs OEMs which joined the market have heterogenous backgrounds. While World
Dimension got early in the market, because of its belief in a sustainable urban mobility, the
other two players interviewed (i.e. Askoll EVA and Thok Bikes) are two start-ups. The latter
decided to exploit their peculiar know-hows, respectively in electric motors and in mountain
bikes, and to enter the market. Also in the pedelecs OEM’s case, the form of inter-company
cooperation that has been implemented is strategic partnerships. However, the reasoning behind
these is different with respect to bicycle OEMs. In fact, Askoll EVA implemented strategic
partnerships with bicycle cells producers in order to be independent in the production of the
drive-unit, that, as previously mentioned, is pivotal in the determination of a company’s
competitive advantage in the pedelecs industry. Furthermore, Thok Bikes undertook a
marketing partnership with Ducati to enhance its brand awareness among consumers.
For what concerns the components producers, their choice to enter in the pedelecs market has
mostly been strategic. In fact, the tendency in the market is to provide customers with an “e-

137
bike ready” product, with specific features and tailor-made components. For this reason, they
decided to follow their customers, in order to catch a market trend and answer their clients’
needs.
Finally, drive-unit manufacturers who have joined the market have exploited the opportunity
provided by the introduction of a new value chain step, with respect to the traditional bicycle’s
value chain. They did so to diversify their product base and to catch an interesting market
opportunity.
As in the afore-mentioned cases, also drive-unit manufacturers choose the strategic alliance
form in order to establish inter-company cooperation relationships.
To sum up, companies which joined the pedelecs Italian market, came from various
backgrounds and have exploited their own peculiar know-how. As of today, the Italian market
is young. In fact, as Mr. Nigrelli, head of the bicycle segment of ANCMA, declared, the product
cycle is still at its early stages, the market is growing at a double-digit rate, and it is not possible
to predict when it would stabilize. For this reason, companies decided to stay independent and
to engage in strategic partnerships in order to obtain the skills and competences they could not
or that it would be difficult to obtain differently in the market.
While the Italian market is still too young and companies have not undertaken M&A deals,
some were carried on by European players. Among all, Bosch eBikeSystems recently set up a
joint venture with the German component producer MAGURA, by acquiring a 50% stake of
MAGURA Bike Parts, a subsidiary of the group MAGURA. Their cooperation is aimed at
providing a comprehensive after-sale service to their customers and pushing ahead innovation,
by exploiting their synergies in the bicycle and e-bikes market, thus meeting their customers’
current and future needs. In this way Bosch eBikeSystems would operate in two of the most
crucial value chain segments in the pedelecs industry, namely drive-unit manufacturing and the
after-sale service. Furthermore, the multinational automotive group Mahle has acquired the
Spanish start-up ebikemotion Technologies in 2017, thus strengthening its position in the e-
mobility market. Ebikemotion is known for the manufacturing of lightweight rear wheel hub
motors which can be integrated unobtrusively into the bicycle. With the acquisition of
ebikemotion Mahle aims at becoming one of the world’s leading drive-units provider and
entered in the e-bike market in one of the most critical steps of the value chain in the pedelecs
industry, for the determination of a company’s competitive advantage.

138
139
Conclusions
The electrification of the bicycle has had many impacts both in the bicycle market and industry.
The technological progresses that have characterized the electric bicycle over the years have
been driven by the rapid growth in demand, especially in the Asian market, and particularly in
China. In fact, because of China’s industrialization, Chinese people started to move from the
countryside to the city centers and needed a cheap and fast vehicle to commute every day.
As technological innovations allowed the production of faster and more efficient e-bikes
suitable to the needs of more advanced countries, the demand started to grow also in developed
countries.
Thanks to this new kind of bicycles, cycling has become accessible to a wider category of users
(i.e. ageing people, non-sporty people or people with health issues). Furthermore, as it is faster
and require less effort with respect to the traditional bicycle it is more likely than the latter, to
substitute cars in the urban mobility environment.
Governments in most of the developed countries have been seeing e-bikes favorably. In fact,
these vehicles are ecological, as they emit little CO2 with respect to conventionally-fueled
vehicles and are smaller than cars and motorcycles thus they have the potential to improve
urban mobility by reducing traffic jams if used as commuting vehicles.
The electrification of the bicycle has also had impact in the recreational side of the bicycle
market. In fact, the motor’s assistance has widened the traditional bicycle’s customer base.
The growth in the e-bike market has attracted many players into the industry. In fact, most of
the traditional bicycle manufacturers joined the market. Furthermore, as one of the most
important components of pedelecs is the drive-unit, also some big multinational groups active
in the automotive sector entered in the market by starting to manufacture motors for pedelecs,
in this way exploiting their know-how.
Both the value chain and the industry structure of the bicycle industry have been modified. In
fact, a new value chain step has been added, as a new kind of suppliers (i.e. drive-unit
manufacturers) entered in the industry. As previously mentioned, drive-units are one of the
crucial components for pedelecs, and the players manufacturing it have a high bargaining power
with respect to bicycle OEMs.
The focus of this document has been the impact of electrification in the Italian bicycle market
and industry. In fact, even if the pedelecs innovation is still unknown to the majority of Italian
citizens, as only 20% of the population know what an e-bike is, Italy is among the countries in
the European Union in which the pedelecs market has been growing more in the latest years
(i.e. with a CAGR of 18% in the past three years). The growth potential of the pedelecs Italian
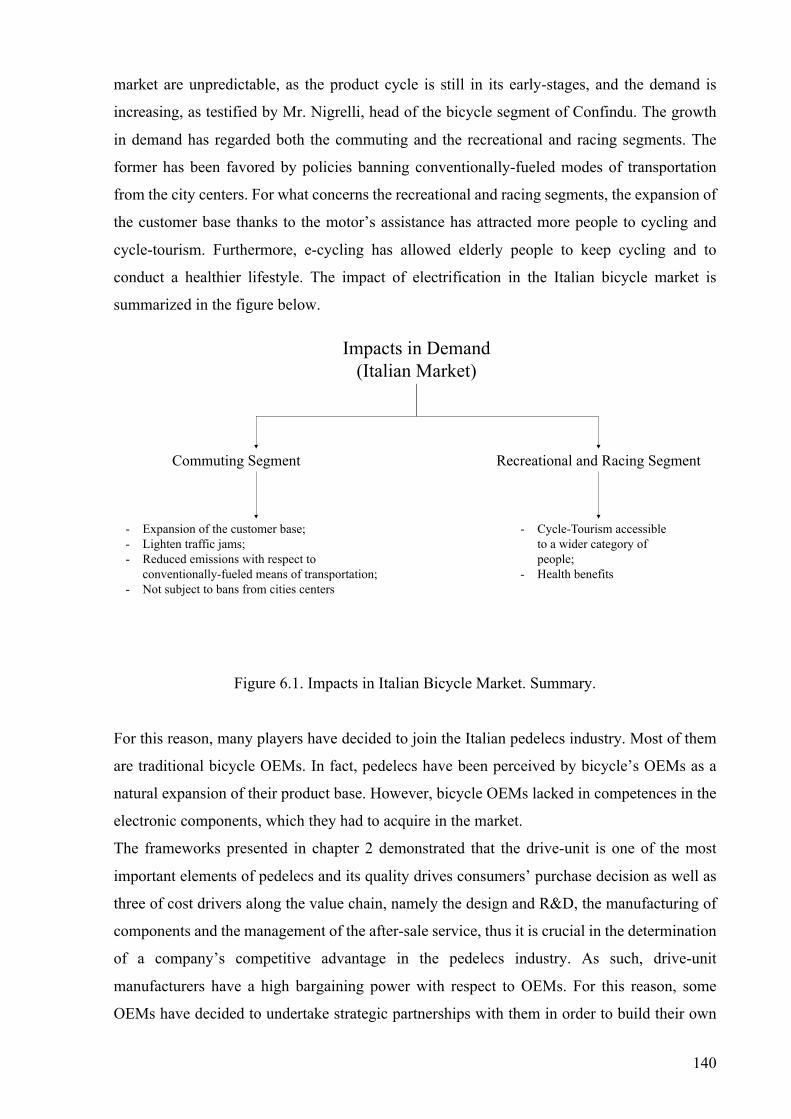
140
market are unpredictable, as the product cycle is still in its early-stages, and the demand is
increasing, as testified by Mr. Nigrelli, head of the bicycle segment of Confindu. The growth
in demand has regarded both the commuting and the recreational and racing segments. The
former has been favored by policies banning conventionally-fueled modes of transportation
from the city centers. For what concerns the recreational and racing segments, the expansion of
the customer base thanks to the motor’s assistance has attracted more people to cycling and
cycle-tourism. Furthermore, e-cycling has allowed elderly people to keep cycling and to
conduct a healthier lifestyle. The impact of electrification in the Italian bicycle market is
summarized in the figure below.
Figure 6.1. Impacts in Italian Bicycle Market. Summary.
For this reason, many players have decided to join the Italian pedelecs industry. Most of them
are traditional bicycle OEMs. In fact, pedelecs have been perceived by bicycle’s OEMs as a
natural expansion of their product base. However, bicycle OEMs lacked in competences in the
electronic components, which they had to acquire in the market.
The frameworks presented in chapter 2 demonstrated that the drive-unit is one of the most
important elements of pedelecs and its quality drives consumers’ purchase decision as well as
three of cost drivers along the value chain, namely the design and R&D, the manufacturing of
components and the management of the after-sale service, thus it is crucial in the determination
of a company’s competitive advantage in the pedelecs industry. As such, drive-unit
manufacturers have a high bargaining power with respect to OEMs. For this reason, some
OEMs have decided to undertake strategic partnerships with them in order to build their own
Impacts in Demand (Italian Market)
Commuting Segment
- Expansion of the customer base;- Lighten traffic jams;- Reduced emissions with respect to
conventionally-fueled means of transportation;- Not subject to bans from cities centers
Recreational and Racing Segment
- Cycle-Tourism accessible to a wider category of people;
- Health benefits
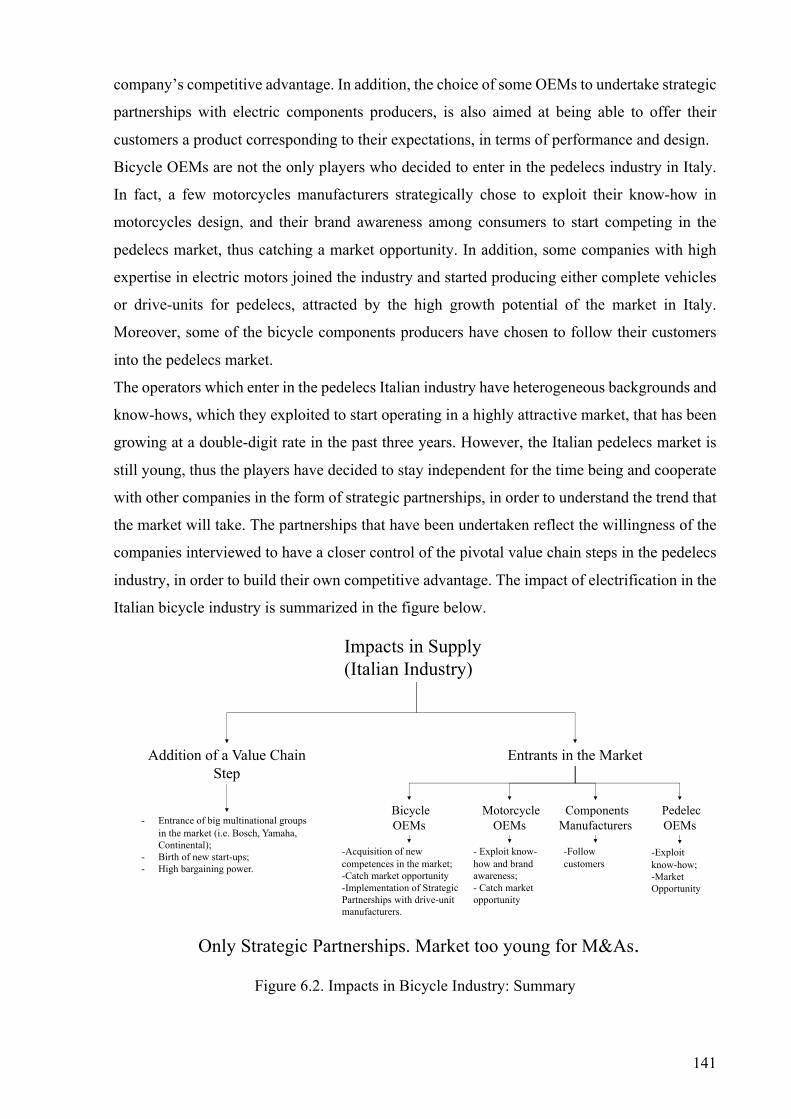
141
company’s competitive advantage. In addition, the choice of some OEMs to undertake strategic
partnerships with electric components producers, is also aimed at being able to offer their
customers a product corresponding to their expectations, in terms of performance and design.
Bicycle OEMs are not the only players who decided to enter in the pedelecs industry in Italy.
In fact, a few motorcycles manufacturers strategically chose to exploit their know-how in
motorcycles design, and their brand awareness among consumers to start competing in the
pedelecs market, thus catching a market opportunity. In addition, some companies with high
expertise in electric motors joined the industry and started producing either complete vehicles
or drive-units for pedelecs, attracted by the high growth potential of the market in Italy.
Moreover, some of the bicycle components producers have chosen to follow their customers
into the pedelecs market.
The operators which enter in the pedelecs Italian industry have heterogeneous backgrounds and
know-hows, which they exploited to start operating in a highly attractive market, that has been
growing at a double-digit rate in the past three years. However, the Italian pedelecs market is
still young, thus the players have decided to stay independent for the time being and cooperate
with other companies in the form of strategic partnerships, in order to understand the trend that
the market will take. The partnerships that have been undertaken reflect the willingness of the
companies interviewed to have a closer control of the pivotal value chain steps in the pedelecs
industry, in order to build their own competitive advantage. The impact of electrification in the
Italian bicycle industry is summarized in the figure below.
Figure 6.2. Impacts in Bicycle Industry: Summary
Impacts in Supply (Italian Industry)
Addition of a Value Chain Step
- Entrance of big multinational groups in the market (i.e. Bosch, Yamaha, Continental);
- Birth of new start-ups;- High bargaining power.
Entrants in the Market
Bicycle OEMs
-Acquisition of new competences in the market;-Catch market opportunity-Implementation of Strategic Partnerships with drive-unit manufacturers.
Motorcycle OEMs
- Exploit know-how and brand awareness;- Catch market opportunity
-Follow customers
PedelecOEMs
Components Manufacturers
-Exploit know-how;-Market Opportunity
Only Strategic Partnerships. Market too young for M&As.

142
143
Sources AIDA [online]. (2019). Bureau Van Dijk. A Moody’s Analytics Company.
ANCMA (2019). Dati bici 2018.
ANSOFF, I. (1957). Strategies for Diversification. Harvard Business Review [online].
Available online at:
http://sgpwe.izt.uam.mx/files/users/uami/sppc/13O/Gestion_y_Control_Estrategico_I/Lectura
_10._Ansoff_Igor_Strategies_for_Diversification.pdf. Accessed on: 05/07/2019.
BElettriche (2018). I motori per bici elettriche. Available online at:
https://www.bicielettriche.bikeitalia.it/info-bici-elettriche/motori-bici-elettriche. Accessed:
22/05/2019
Bicilive.it Network, (2019). La guida completa alla scelta della ebike Catalogo delle Bici
Elettriche.
CANTOREGGI, N., THIERNO, D. (2006). Evaluation d’Impact sur la santé Promotion du
vélo à assistance électrique (VAE). République et canton de Genève, Département de
l’economie et de la santé, Direction général de la santé. Available online at:
http://www.impactsante.ch/pdf/EIS_VAE_2006.pdf. Accessed on: 08/06/2019
CHERRY C., ET AL. (2009). Comparative Environmental Impacts of Electric Bikes in
China. Transportation Research Part D, 14 (5), pp. 281-290. Available online at:
https://www.sciencedirect.com/science/article/pii/S1361920908001387. Accessed on:
10/06/2019
COCCIA F.M., BONFANTI A., ET AL. (2019). 1°Rapporto Isnart e Legambiente.
Cicloturismo e Cicloturisti in Italia. Isnart e Legambiente.
CONEBI. (2018). European Bicycle Industry and Market Report 2018 edition (2017
statistics).
CONEBI (2017). European Bicycle Industry and Market Report 2017 edition (2016 statistics)
[online]. Available online at: http://www.conebi.eu/facts-and-figures/. Accessed: 10/06/2019
144
DESMOND, K. (2019). Electric Motorcycles and Bicycles. A history including Scooters,
Tricycles, Segways and Monocycles. United States of America: Mc. Farland & Company,
Inc., p.3.
DONOVAN, D. (1999). The dawn of the mega-supplier. Bain & Company [online]. Available
online at: https://www.bain.com/insights/copy-of-perform-improv-templates/. Accessed on:
10/07/2019
European Council’s Directive 2002/24/EC. Available online at: https://eur-
lex.europa.eu/LexUriServ/LexUriServ.do?uri=CONSLEG:2002L0024:20081211:IT:PDF.
Accessed: 06/06/2019
European Council’s Directive 2006/66/EC. Available online at: https://eur-
lex.europa.eu/legal-content/EN/TXT/PDF/?uri=CELEX:32006L0066&from=EN. Accessed
on: 07/06/2019
Evan Cycles. (2017). Electric Bikes: Past, Present and Future. Available online at:
https://www.evanscycles.com/coffeestop/news/head-electric-bikes-past-present-and-future.
Accessed: 30/05/2019
GORENFLO, C. ET AL. (2017). Usage Patterns of Electric Bicycles: An Analysis of the
WeBike Project. Journal of Advanced Transportation [online]. Available online at:
https://www.hindawi.com/journals/jat/2017/3739505/. Accessed: 05/06/2019
GREGG, J. (2014). Building a Strategic Foundation for New Market Entry. Navigate
Consulting [online]. Available online at:
https://www.slideshare.net/johngregg/2014navigateessentials-foundations-of-market-entry-
strategies. Accessed: 10/07/2019.
HEINEN, E., ET AL. (2009). Commuting by Bicycle: An Overview of the Literature.
Transport Reviews [online], 30 (1), pp. 59-96. Available online at:
https://doi.org/10.1080/01441640903187001. Accessed: 05/06/2019
HELMS, M., NIXON, J. (2010). Exploring SWOT analysis. Where are we now? A review of
academic research from the last decade. Journal of Strategy and Management, 3 (3), pp. 215-
251.
145
Japan Bicycle Promotion Institute (2019). Japanese Bicycle Production, import and export
(Twelve-Month Year to Date 2018). Available online at:
http://www.jbpi.or.jp/images/english/Japanese_bicycle_production_import_and_export_Twel
ve-Month_Year_to_Date_2018.pdf. Accessed: 10/06/2019
JOHNSON M., GEOFF R., (2015). Extending life on the bike: Electric bike use by older
Australians. Journal of Transport & Health [online], 2 (2), pp. 276-283. Available online at:
https://www.sciencedirect.com/science/article/pii/S2214140515000109. Accessed:
05/06/2019.
JOHNSON, M., ROSE, G. (2013). Electric bikes-cycling in the New World City: an
investigation of Australian electric bicycle owners and the decision making process for
purchase. Proceedings of the 2013 Australasian Transport Research Forum, Brisbane 2-4
October 2013. Available online at:
https://www.researchgate.net/publication/286696561_Electric_bikes_-
_cycling_in_the_New_World_City_An_investigation_of_Australian_electric_bicycle_owners
_and_the_decision_making_process_for_purchase. Accessed: 15/06/2019
JORNA R., MALLENS M., (2013). Pro-E-Bike. Promoting electric bikes and scooters for
delivery of goods and passenger transport in urban areas. IEE Project, Contract
IEE/12/856/SI2.644759. Available on line at: http://www.pro-e-bike.org/wp-
content/uploads/2014/02/Pro-e-bike-D.2.1.MOB-EN-2014-02-04.pdf. Accessed: 20/05/2019.
KROESEN, M. (2017). To what extent do e-bikes substitute travel by other modes? Evidence
from The Netherlands. Transportation Research Part D [online]. 53, pp. 377-387
KPMG INTERNATIONAL (2014). Future State 2030: The Global Megatrends Shaping
Governments. [online]. Available online at:
https://assets.kpmg/content/dam/kpmg/pdf/2014/02/future-state-2030-v3.pdf. Accessed:
20/06/2019
LIN X., ET AL., (2018). The death of a transport regime? The future of electric bicycles and
transportation pathways for sustainable mobility in China. Technological Forecasting &
Social Change [online], 132, pp.257-267. Available online at:
146
https://www.sciencedirect.com/science/article/pii/S0040162516306801. Accessed:
03/06/2019
MACARTHUR, J. ET AL. (2014). E-Bikes in the North America: Results from an on-line
survey. Transportation Research Board, 93rd Annual Meeting. Available online at:
https://journals.sagepub.com/doi/10.3141/2468-14. Accessed: 15/06/2019
MANTHEY, N., (2013). Pedelecs: a changing image. GoPedelec Handbook, pp.48-49.
Accessed: 05/06/2019
McKinsey and Company. (2017). Electrifying insights: How automakers can drive electrified
vehicle sales and profitability. Available online at:
https://www.mckinsey.com/~/media/McKinsey/Industries/Automotive%20and%20Assembly/
Our%20Insights/Electrifying%20insights%20How%20automakers%20can%20drive%20elect
rified%20vehicle%20sales%20and%20profitability/Electrifying%20insights%20-
%20How%20automakers%20can%20drive%20electrified%20vehicle%20sales%20and%20pr
ofitability_vF.ashx. Accessed on: 07/07/2019.
NEUPERT, H. (2013). Pedelec riding is simply unimaginable! Extraenergy.org [online].
Available at:
http://extraenergy.org/main.php?language=en&category=information&subcateg=99&id=3238
0. Accessed: 05/06/2019
NIGRELLI, P., (2019). Phone Interview. 29/05/2019
O’DONOGHUE, J. (2017). Going Electric: Celebrating Japan’s powerful e-bikes. The Japan
Times [online]. Available at: https://www.japantimes.co.jp/life/2017/11/18/lifestyle/going-
electric-celebrating-japans-powerful-e-bikes/#.XSssWJMzZp8. Accessed: 06/06/2019
PICTET (2016). Megatrend: Come cambiano le nostre vite?. [online]. Available online at:
https://www.am.pictet/it/blog/articoli/tecnologia-e-innovazione/megatrend-come-cambiano-
le-nostre-vite. Accessed: 20/06/2019
PORTER, M. (1985). Competitive Advantage. Creating and Sustaining Superior
Performance. First Free Press Edition, 1985. New York: 1985.

147
PORTER, M. (2007). Understanding Industry Structure. Harvard Business School [online].
Available online at: https://hbr.org/product/understanding-industry-structure/707493-PDF-
ENG. Accessed on: 10/07/2019.
QUINTAVALLE, E. (2018). Rapporto Artibici 2018. Artigianato e filiera della bicicletta.
Confartigianato.
ROETYNK, A. (2010), PRESTO Cycling Policy Guide Electric Bicycles. Executive Agency
for Competitiveness and Innovation (EACI). Available online at:
https://ec.europa.eu/energy/intelligent/projects/sites/iee-
projects/files/projects/documents/presto_policy_guide_electric_bicycles_en.pdf. Accessed on
15/05/2019
ROGERS, E, (2005). Diffusion of Innovations. Free Press: New York.
ROSE G., (2011). E-bikes and urban transportation: emerging issues and unresolved
questions. Transportation [online], 39 (1), pp. 81-96. Available online at:
https://link.springer.com/article/10.1007/s11116-011-9328-y. Accessed: 17/06/2019
RUAN, Y. ET AL. (2014). Government’s role in disruptive innovation and industry
emergence: The case of the electric bike in China. Technovation [online], 34, pp. 786-796.
Available on-line at: https://www.sciencedirect.com/science/article/pii/S0166497214001254.
Accessed: 10/06/2019.
SHIMANO STEPS (2019). Quarter of European commuters willing to switch to e-bike.
Shimano Steps News [online]. Available online at: https://www.shimano-steps.com/e-
bikes/europe/en/news/quarter-of-european-commuters-willing-to-switch-to-e-bikes. Accessed
on: 06/06/2019
STATISTA [online]. (2017). Hamburg:
Taking Off SRL (2018). Italian Bike Festival. Survey Profilazione Utenti. Taking Off SRL
148
The NPD Group (2018). The U.S. Bike Specialty Market Pedals Ahead, with Mountain and
Electric Bicycles Leading the Pack Available online at:
https://www.npd.com/wps/portal/npd/us/news/press-releases/2018/the-us-bike-specialty-
market-pedals-ahead-with-mountain-and-electric-bicycles-leading-the-pack/. Accessed:
07/06/2019
United Nations (2018). 68% of the population projected of living in urban areas by 2050 says
the U.N. Available online at: https://www.un.org/development/desa/en/news/population/2018-
revision-of-world-urbanization-prospects.html. Accessed on: 25/06/2019
VOSPER, R. (2019). Rick Vosper: The Reality of IBD e-bike market share, part one. Bicycle
Retailer and Industry News [online]. Available on-line at:
https://www.bicycleretailer.com/opinion-analysis/2019/03/11/rick-vosper-reality-ibd-e-bike-
market-share-part-one#.XSWzT5MzZp8. Accessed: 15/06/2019
WEINERT, J. et al. (2007). The Transition to Electric Bikes in China: history and key reasons
for rapid growth. Transportation [online], 34 (3), pp. 301-318. Available online at:
https://link.springer.com/article/10.1007/s11116-007-9118-8. Accessed: 05/06/2019.
ZUEV, D. ET AL. (2018). Where is the politics? E-bike mobility in urban China and
civilizational government. Environmental Innovation and Societal Transitions [online].
Available online at: https://www.sciencedirect.com/science/article/pii/S2210422417300503,
30, p. 19-32. Accessed: 05/06/2019
WALKER, P.(2019). Ebike laws around the world. Rad Power Bikes [online]. Available at:
https://blog.radpowerbikes.com/ebike-laws-around-the-world. Accessed on: 06/06/2019
149
Websites ACTIVE BIKE., (2014). [online].Cicli Elios presentation video. Available online at:
https://www.youtube.com/watch?v=gKQRT0cx05w. Accessed: 07/08/2019.
BRILLO, N. (2014). [online]. Venetwork compra Fantic Motors per 2 milioni. Milano
Finanza. Available online at: https://www.milanofinanza.it/news/venetwork-compra-fantic-
motor-per-2-milioni-201410140824299394. Accessed: 07/08/2019
InSella (2019). [online]. AM80, il Sistema elettrico made-in-Atala. Available online at:
https://www.insella.it/news/am80-il-sistema-elettrico-made-atala-140361.Accessed:
05/08/2019
PERUGINO, G. (2018). Atala, un’azienda completa e moderna con e-bike strepitose. Tutto
Bici Tech [online]. Available online at:
https://www.tuttobicitech.it/article/2018/11/19/1542576153/atala-un-azienda-completa-e-
moderna-con-e-bike-strepitose-review-giorgio-perugini-tuttobicitech. Accessed: 08/08/2019
Wikipedia, (2019). [online]. Atala (firm). Webpage. Available online at:
https://it.wikipedia.org/wiki/Atala_(azienda). Accessed: 05/08/2019
Note: Companies’ websites and the interviews undertaken with companies’ managers have
been used for the redaction of the relative paragraphs.
Copyright © 2022 FDOKUMEN