UNIVERSITÀ DEGLI STUDI DI PADOVA - Padua Thesis
160
UNIVERSITÀ DEGLI STUDI DI PADOVA DIPARTIMENTO DI SCIENZE ECONOMICHE E AZIENDALI “M. FANNO” CORSO DI LAUREA MAGISTRALE IN BUSINESS ADMINISTRATION TESI DI LAUREA “THE CURRENT STATE OF THE ITALIAN PLASTIC RECYCLING INDUSTRY AND THE ONGOING TRENDS TOWARDS M&A ACTIVITY” RELATORE: CH.MO PROF. ANTONIO ZOTTI LAUREANDO: DAVIDE SIEGFRID PEZ MATRICOLA N. 1179599 ANNO ACCADEMICO 2019 – 2020
-
Upload
khangminh22 -
Category
Documents
-
view
4 -
download
0
Transcript of UNIVERSITÀ DEGLI STUDI DI PADOVA - Padua Thesis

UNIVERSITÀ DEGLI STUDI DI PADOVA
DIPARTIMENTO DI SCIENZE ECONOMICHE E AZIENDALI
“M. FANNO”
CORSO DI LAUREA MAGISTRALE IN BUSINESS
ADMINISTRATION
TESI DI LAUREA
“THE CURRENT STATE OF THE ITALIAN PLASTIC RECYCLING
INDUSTRY AND THE ONGOING TRENDS TOWARDS M&A
ACTIVITY”
RELATORE:
CH.MO PROF. ANTONIO ZOTTI
LAUREANDO: DAVIDE SIEGFRID PEZ
MATRICOLA N. 1179599
ANNO ACCADEMICO 2019 – 2020


I
Index
List of figures ........................................................................................................................... V
List of tables .......................................................................................................................... VII
Introduction .............................................................................................................................. 1
1. Introduction to Plastic Recycling ........................................................................................ 3
1.1 What is plastic? ............................................................................................................... 3
1.1.1 Definition ................................................................................................................... 3
1.1.2 Plastic resins .............................................................................................................. 3
1.1.3 History ........................................................................................................................ 5
1.2 Macro data ....................................................................................................................... 6
1.2.1 Plastic production ...................................................................................................... 6
1.2.2 Plastic waste trade ..................................................................................................... 8
1.2.3 The link between plastic recycling and waste management .................................... 9
1.2.4 Recycled plastics market ......................................................................................... 12
1.3 The three megatrends driving the industry ................................................................ 13
1.3.1 EU Guidelines package ........................................................................................... 13
1.3.2 Chinese ban on imports (“National Sword Operation”) ....................................... 14
1.3.3 Shifting in consumers’ perceptions ........................................................................ 18
1.4 Literature review .......................................................................................................... 19
1.5 Closing remarks on the introduction to plastic recycling ......................................... 25
2. Industry analysis through selected frameworks .............................................................. 27
2.1 Plastic recycling industry in a value chain framework ............................................. 27
2.1.1 Value chain analysis framework ............................................................................ 27
2.1.2 Plastic recycling: activities performed, and players involved ................................ 28
2.1.3 Chemical recycling .................................................................................................. 33
2.1.4 Cost drivers .............................................................................................................. 37
2.1.5 Activities driving clients’ purchase decision .......................................................... 39
2.2 Plastic recycling industry’s competitive environment ............................................... 40

II
2.2.1 Analysing the competitive environment: Porter’s Five Forces ............................. 41
2.2.2 Porter’s Five Forces driving plastic recycling industry ......................................... 42
2.2.2.1 Threat of new entrants ....................................................................................... 42
2.2.2.2 Threat of substitutes........................................................................................... 44
2.2.2.3 Bargaining power of suppliers .......................................................................... 45
2.2.2.4 Bargaining power of buyers .............................................................................. 47
2.2.2.5 Degree of rivalry among existing competitors .................................................. 48
2.2.2.6 Conclusions ....................................................................................................... 49
2.3 Plastic recycling industry: SWOT analysis ................................................................ 50
2.3.1 Strengths .................................................................................................................. 51
2.3.2 Weaknesses .............................................................................................................. 52
2.3.3 Opportunities ........................................................................................................... 52
2.3.4 Threats ..................................................................................................................... 53
2.3.5 Conclusions ............................................................................................................. 54
2.4 Plastic recycling industry analysis: results ................................................................. 54
3. The Italian case: overview of plastic recycling industry and market ............................ 57
3.1 Plastic recycling in Italy ............................................................................................... 57
3.1.1 Italian market overview ........................................................................................... 57
3.1.2 The current state of recycling ................................................................................. 61
3.1.3 Corepla ..................................................................................................................... 62
3.1.4 Development and issues of the Italian plastic recycling industry – interview with
Mr Walter Regis................................................................................................................ 65
3.2 Economic and financial performance of Italian plastic recyclers ............................ 67
3.2.1 Research method: identifying the players .............................................................. 67
3.2.2 Italian plastic recycling industry: financial statement analysis ............................ 70
3.2.2.1 Basic recyclers ................................................................................................... 70
3.2.2.2 Integrated compounders .................................................................................... 73
3.2.2.3 Specialized compounders .................................................................................. 76
3.2.2.4 Fully integrated recyclers .................................................................................. 79

III
3.2.2.5 Closing remarks ................................................................................................. 82
4. Evidence from the Italian plastic recycling industry: selected players ......................... 85
4.1 Pebo Spa ......................................................................................................................... 86
4.1.1 Pebo: historical development, financials, and offerings........................................ 86
4.1.2 Pebo: growth strategy and thoughts about M&A trends ....................................... 88
4.2 I.L.P.A.V. Spa ................................................................................................................ 88
4.2.1 I.L.P.A.V.: historical development, financials, and offerings ............................... 88
4.2.2 I.L.P.A.V.: growth strategy and thoughts about M&A trends ............................... 90
4.3 Dieffe Srl ........................................................................................................................ 91
4.3.1 Dieffe: historical development, financials, and offerings...................................... 91
4.3.2 Dieffe: growth strategy and thoughts about M&A trends ..................................... 92
4.4 Caldara Plast Srl ........................................................................................................... 93
4.4.1 Caldara Plast: historical development, financials, and offerings ......................... 93
4.4.2 Caldara Plast: growth strategy and thoughts about M&A trends ......................... 94
4.5 Skymax Spa ................................................................................................................... 95
4.5.1 Skymax: historical development, financials, and offerings ................................... 95
4.5.2 Skymax: growth strategy and thoughts about M&A trends .................................. 97
4.6 Nuova Gandiplast Srl ................................................................................................... 98
4.6.1 Nuova Gandiplast: historical development, financials, and offerings .................. 98
4.6.2 Nuova Gandiplast: growth strategy and thoughts about M&A trends ................ 100
4.7 Dentis recycling Italy Srl ............................................................................................ 100
4.8 Zeta Polimeri Srl ......................................................................................................... 101
4.8.1 Zeta Polimeri: historical development, financials, and offerings ....................... 101
4.8.2 Zeta Polimeri: growth strategy and thoughts about M&A trends ....................... 103
4.9 Garbo Srl ..................................................................................................................... 104
4.9.1 Garbo: historical development, financials, and offerings ................................... 104
4.9.2 Garbo: growth strategy and thoughts about M&A trends ................................... 106
4.10 Ansa Termoplastici S.r.l. .......................................................................................... 107

IV
4.10.1 Ansa Termoplastici: historical development, financials, and offerings ............ 107
4.10.2 Ansa Termoplastici: growth strategy and thoughts about M&A trends ........... 109
4.11 Interviews: conclusions ............................................................................................. 109
5 Selected transactions ......................................................................................................... 113
5.1 Hera Spa’s acquisition of Aliplast Spa (2017) .......................................................... 113
5.1.1 Hera Group ............................................................................................................ 113
5.1.2 Aliplast ................................................................................................................... 114
5.1.3 Hera-Aliplast deal.................................................................................................. 116
5.2 Sirmax Spa’s acquisition of S.E.R. Srl (2019) .......................................................... 119
5.2.1 Sirmax .................................................................................................................... 119
5.2.2 S.E.R. ..................................................................................................................... 120
5.2.3 Sirmax-S.E.R deal ................................................................................................. 121
5.3 Gurit Holding AG’s acquisition of Valplastic Srl (2019) ........................................ 123
5.3.1 Gurit ....................................................................................................................... 123
5.3.2 Valplastic ............................................................................................................... 125
5.3.3 Gurit-Valplastic deal ............................................................................................. 126
5.4 Schwarz Group’s acquisition of Sky Plastic Group AG (2019) .............................. 127
5.4.1 Schwarz Group ...................................................................................................... 127
5.4.2 Sky Plastic Group .................................................................................................. 128
5.4.3 Schwarz-Sky Plastic Deal ...................................................................................... 129
5.5 Transactions: conclusions .......................................................................................... 130
Conclusions............................................................................................................................ 133
Sources ................................................................................................................................... 137
Appendix................................................................................................................................ 145

V
List of figures
Figure 1.1 Main types of thermoplastics and thermosets. Source: Plastics Europe, 2017 ........ 4
Figure 1.2 Geographical breakdown of global plastic production. Source: Ellen MacArthur
Foundation, 2017........................................................................................................................ 7
Figure 1.3 Global distribution of polymer demand, by type. Source: Statista, 2018 ................. 7
Figure 1.4 Projected global generation of municipal solid waste, 2016-2050. Source: World
Bank, 2018 ................................................................................................................................ 10
Figure 1.5 Population and municipal solid waste generation share by key country, 2018,
Source: Statista, 2019 ............................................................................................................... 11
Figure 1.6 Global waste generation breakdown, by material type, 2016. Source: World Bank,
2018 .......................................................................................................................................... 11
Figure 1.7 Breakdown of sectors of application for plastics, 2016. Source: CSIRO, 2017 ..... 12
Figure 1.8 Breakdown of plastics consumption, by polymer, 2016. Source: CSIRO, 2017 ..... 13
Figure 1.9 Export of plastic waste to China, selected countries, 2002-2018. Source: UN
Comtrade, 2019 ........................................................................................................................ 17
Figure 1.10 Global exports of plastic waste, selected cuntries, 2002-2018. Source: UN
Comtrade, 2019 ........................................................................................................................ 18
Figure 2.1 Generic value chain’s structure. Source: Porter, 1998 .......................................... 28
Figure 2.2 Plastic recycling: value chain's man activities. Own Ri-elaboration..................... 29
Figure 2.3 Comparison between mechanical recycling's value chain and chemical recycling's
value chain. Own Ri-elaboration.............................................................................................. 36
Figure 2.4 Representation of the most cost-impacting activities of the plastic recycling value
chain. Own Ri-elaboration ....................................................................................................... 39
Figure 2.5 Representation of the activities of the plastic recycling value chain which mostly
affect clients’ purchase decisions. Own Ri-elaboration ........................................................... 40
Figure 2.6 Porter Five Forces. Source: Porter, 1985 .............................................................. 41
Figure 2.7 Threat of new entrants. Own Ri-Elaboration ......................................................... 43
Figure 2.8 Threat of substitutes. Own Ri-Elaboration ............................................................. 44
Figure 2.9 Power of suppliers. Own Ri-Elaboration ............................................................... 46

VI
Figure 2.10 Power of buyers. Own Ri-Elaboration ................................................................. 47
Figure 2.11 Rivalry among existing competitors. Own Ri-Elaboration................................... 48
Figure 2.12 Five forces analysis' results. Own Ri-Elaboration ............................................... 49
Figure 2.13 SWOT analysis’ framework. Source: Gürel, Tat, 2017 (Own Ri-Elaboration) ... 51
Figure 2.14 SWOT analysis' results. Own Ri-Elaboration ...................................................... 54
Figure 3.1 Plastics application in the Italian packaging industry, breakdown by packaging type,
2018. Source: Unionplast, 2019 ............................................................................................... 58
Figure 3.2 Breakdown of recycled plastic demand (volume) by Italian manufacturers, 2018.
Source: Unionplast, 2019 ......................................................................................................... 59
Figure 3.3 Estimated recycled plastic demand in Italy. Own estimation based on the companies
identified in chapter 3.2.1 ......................................................................................................... 60
Figure 3.4 Industrial structure of the Italian plastic recycling system. Own Ri-Elaboration on
information from Fondazione per lo sviluppo sostenibile, 2019 .............................................. 62
Figure 3.5 Members of Corepla’s consortium, 2019. Source: Corepla, 2019 ......................... 63
Figure 3.6 Geographic location of Corepla's sorting centres. Source: Corepla, 2019 ........... 64
Figure 3.7 Process through which the panel of companies to be analysed has been built ...... 69
Figure 3.8 Positioning along the plastic recycling’s value chain of the 34 companies identified
as the main Italian plastic recyclers ......................................................................................... 70
Figure 3.9 Main linear regressions performed on basic recyclers' data ................................. 73
Figure 3.10 Main linear regressions performed on integrated compounders’ data ................ 76
Figure 3.11 Main linear regressions performed on specialized compounders' data ............... 79
Figure 3.12 Main linear regressions performed on fully integrated recyclers ........................ 82
Figure 3.13 Ebitda margin evolution of main Italian recyclers (median value within the panel
described at 3.2.1). Source: Aida, 2020 ................................................................................... 83

VII
List of tables
Table 1.1 List of the six major countries exporting plastic scrap (ranked by exported value in
2018). Source: UN Comtrade, 2019 ........................................................................................... 8
Table 1.2 List of the seven major countries importing plastic scrap (ranked by imported volume
in 2018). Source: UN Comtrade, 2019 ....................................................................................... 9
Table 2.1 Threat of new entrants. Own Ri-Elaboration ........................................................... 43
Table 2.2 Threat of substitutes. Own Ri-Elaboration ............................................................... 44
Table 2.3 Power of suppliers. Own Ri-Elaboration ................................................................. 46
Table 2.4 Power of buyers. Own Ri-Elaboration ..................................................................... 47
Table 2.5 Rivalry among existing competitors. Own Ri-Elaboration ...................................... 49
Table 2.6 Five forces analysis' results. Own Ri-Elaboration ................................................... 50
Table 3.1 Summary of plastic scraps import and export, Italy, 2016-2018. Source: UN
Comtrade, 2019 ........................................................................................................................ 60
Table 3.2 Financial indicators calculated. Own Ri-Elaboration on Aida's data ..................... 70
Table 3.3 Basic recyclers, P&L data. Own Ri-Elaboration on Aida's data ............................. 71
Table 3.4 Basic recyclers, Balance sheet data. Own Ri-Elaboration on Aida's data .............. 72
Table 3.5 Integrated compounders, P&L data. Own Ri-Elaboration on Aida's data .............. 74
Table 3.6 Integrated compounders, Balance sheet data. Own Ri-Elaboration on Aida's data 75
Table 3.7 Specialized compounders, P&L data. Own Ri-Elaboration on Aida's data............. 77
Table 3.8 Specialized compounders, Balance sheet data. Own Ri-Elaboration on Aida's data
.................................................................................................................................................. 78
Table 3.9 Fully integrated recyclers, P&L data. Own Ri-Elaboration on Aida's data ............ 80
Table 3.10 Fully integrated recyclers, Balance sheet data. Own Ri-Elaboration on Aida's data
.................................................................................................................................................. 81
Table 4.1 Details of companies interviewed ............................................................................. 86
Table 4.2 Pebo Spa, financials. Source: Aida, 2020 ................................................................ 87
Table 4.3 I.L.P.A.V. Spa, financials. Source: Aida, 2020 ........................................................ 89
Table 4.4 Dieffe Srl, financials. Source: Aida, 2020 ................................................................ 92
VIII
Table 4.5 Caldara Plast Srl, financials. Source: Aida, 2020 ................................................... 94
Table 4.6 Skymax Spa, financials. Source: Aida, 2020 ............................................................ 96
Table 4.7 Nuova Gandiplast Srl. Source: Aida, 2020 .............................................................. 99
Table 4.8 Dentis Recycling Italy Srl, financials. Source: Aida, 2020 .................................... 101
Table 4.9 Zeta Polimeri Srl, financials. Source: Aida, 2020.................................................. 102
Table 4.10 Garbo Srl, financials. Source: Aida, 2020 ........................................................... 105
Table 4.11 Ansa Termoplastici Srl, financials. Source: Aida, 2020 ...................................... 108
Table 5.1 Hera Spa, financials. Source: S&P Capital IQ, 2020 ............................................ 114
Table 5.2 Aliplast Spa, financials. Source: Aida, 2020 .......................................................... 116
Table 5.3 Sirmax Spa, financials. Source: Aida, 2020 ........................................................... 120
Table 5.4 S.E.R. Srl. financials. Source: Aida, 2020 .............................................................. 121
Table 5.5 Gurit Holding AG, financials. Source: S&P Capital IQ, 2020 .............................. 125
Table 5.6 Valplastic Srl, financials. Source: Aida, 2020 ....................................................... 126
Table 5.7 Sky Plastic Group AG, financials. Source: Amadeus, 2020 ................................... 129

1
Introduction
Desirable features such as lightness and durability have imposed plastic has a key material in
almost every aspect of our everyday life. During the last seventy years, plastic production has
grown by a compound annual rate of 8,5% (Statista, 2018), reaching 360 million tons in 2018.
Unfortunately, the great degree of application in every sector is not without consequences:
impact on environment, animal life and human being is multiple. Main issues are greenhouse
gas emissions, plastic pollution, marine litter, plastics ingested by fishes; all these effects are
estimated to cost around $13 bln per year by the OECD (OECD, 2018).
Manufacturing and refining plastics are very greenhouse gas-intensive activities (indeed, they
are deemed to be among the most intensive industries). Cracking, polymerization, and
plasticization of olefins into plastic resins is not only emissions-intensive, but also energy-
intensive. The Center for International Environmental Law (CIEL) estimates that the cracking
activity for producing ethylene was responsible for nearly 200 mln tons of CO2e, in 2015; this
has the same magnitude of 43,5 mln passenger vehicles in terms of CO2 emissions. Moreover,
CIEL estimates that, by 2050, greenhouse gas emission from plastic production could reach
almost 56 gigatons, thus becoming nearly impossible to stop global temperature increase at 1,5
C° (1,5 C° increase is the maximum extent bearable by the Planet, as estimated by the
Intergovernmental Panel on Climate Change). (Intergovernmental Panel on Climate Change,
2018)
Plastic waste volume remaining in the environment after use is massive. OECD’s estimates
point out that nearly 6.300 mln tons of plastic waste have been generated in the period between
1950 and 2015. Considering an historical global recycling rate of just 9% and a 12% share of
plastic waste gone through energy recovery, we are left with almost 80% of the whole plastic
waste produced in the period dumped in landfill or directly in the natural environment.
Moreover, OECD’s models show that, every year, we dump up to additional 13 mln tons of
plastic waste (OECD, 2018).
Almost every place on the Earth is linked to the oceans, thus a huge amount of post-consumer
plastic ends up in the oceans every year because of poor waste management. One of the first
studies trying to examine plastic scrap floating on world’s oceans was carried out in 2014. It
quantified near-surface plastic debris in nearly 5,25 trillion individual fragments for a total of
269.000 estimated tons (Moore, 2019). Estimated plastic leakage into the sea amounts to 1,5-
4% global plastic production, which accounts for over 80% of ocean litter. Plastic waste can be
carried by marine currents and rivers for considerably long distances, thus affecting every part

2
of the globe; when in the sea, sunlight, waves, and wind contribute to break it down into
microplastics. Microplastics are small fragments of plastic (size smaller than 5 mm)
accumulating in the ocean, where their tiny size makes it easy for marine life to eat them. When
breaking down, chemicals contained in plastic goods are released into water, into the
atmosphere and in fishes we eat (Teach the Earth, 2012). The most important issue caused by
marine plastic litter are, indeed, the ingestion by numerous marine species. Species like turtles,
seabirds, fishes, and whales die after ingesting plastic scrap mistaken for food. Microplastic has
been found in more than one hundred marine species. Moreover, that is how plastic waste enters
the food chain. (European Commission, 2018)
This is the context in which plastic recycling stands out as the main solution for decoupling
industrial manufacturing from further virgin plastic production; indeed, it provides us a perfect
example of the Circular Economy concept, since players operating in this industry aim to close
the loop between waste and new consumables.
The purpose of this work is to introduce the plastic recycling industry, with its strengths and its
drawbacks, the current global trends that are shaping the industry, and the current state of this
industry in Italy. More, thanks to the insights obtained from the several analytic tools utilized,
this work aims at highlighting potential trends in the M&A activity within the industry
(maintaining the focus on Italy). Indeed, ongoing trends (see chapter 1.3) in global trade,
regulation and customers’ demand are transforming the industry, boosting its growth, and
changing its competitive dynamics, making it attractive for important players operating in
adjacent sectors. In fact, last years have already witnessed the acquisitions of various of the
most important companies belonging to the Italian plastic recycling industry from varied
buyers, both Italian and foreign.
After introducing plastics (with an overview on their main categories, their production, and
their history) and the plastic waste management, the plastic recycling industry is analysed with
the goal of identifying its main competitive drivers and their potential developments. The
analysis is conducted relying on the information and the insights obtained from the interviews
granted by some of the most important plastic recyclers in Italy, together with industry reports.
Then, the focus shifts to Italy, considering the main players in the country and deepening their
economic performance.
Eventually, four selected transactions involving Italian plastic recyclers are presented; the aim
is to link the analysis performed in the previous chapters to actual M&A operations recently
occurred, thus looking for confirmation of the potential trends identified.

3
1. Introduction to Plastic Recycling
The first chapter introduces plastics, highlighting their major categories and features. After an
overview on global macro data about plastic production and trade, the plastic recycling market
and its link with the waste management industry are presented.
Next, the major global trends that are shaping the plastic recycling industry are addressed,
specifically: the EU regulation, the Chinese ban on import and the shifting in consumers’
perception of environmental issues and recycling.
1.1 What is plastic?
Plastic is a general term which in fact identifies a large category of materials, thus making the
term “plastics” preferable. After the introduction of the basic elements characterizing plastics,
two different categories (thermoplastics and thermosets) will be identified and context will be
provided through brief historic highlights.
1.1.1 Definition
Plastics are defined as “organic synthetic or processed materials that are mostly thermoplastic
or thermosetting polymers of high molecular weight and that can be made into objects, films,
or filaments”. (The Merriam-Webster, 2019)
Raw materials utilized to produce plastics are natural products such as crude oil, cellulose, coal,
and natural gas; they contain carbon and hydrogen elements, and they may also contain other
elements such as oxygen, nitrogen, chlorine, or fluorine. Plastics are compounds of large
molecules, called polymers. Polymers are formed by monomers which are joined together in a
chain. (Deloitte, 2015; Plastics Europe, 2019)
Plastics permeate our everyday life. Being able to cover a wide range of applications, they are
found both in industry and in households. Plastics are considered cheap (mostly), lightweight
and durable materials, that can be moulded and exploited for several purposes; these qualities
justify the huge rise in production over the last seventy years.
1.1.2 Plastic resins
Plastics are divided into two different categories: thermoplastics and thermosets.
1. Thermoplastics. They soften when heated and they become more fluid as additional heat
is applied. Thermoplastics are not subjected to chemical changes when heated. Indeed,

4
they can be heated, shaped, and hardened again and again (repeatedly). Thanks to these
properties, thermoplastics are ideal candidates for recycling. This group of plastics
involves polyethylene terephthalate (PET), high-density polyethylene (HDPE), low-
density polyethylene (LDPE), polyvinylchloride (PVC), polypropylene (PP), and
polystyrene (PS). These are just the most common kinds of thermoplastics while the
actual number is larger. Looking at the global plastics demand, thermoplastics constitute
almost 85% of the overall demand. (Plastics Europe, 2017)
2. Thermosets. Plastics that cannot be reheated for being remoulded after the first forming
and shaping. Such a feature makes thermosets better than thermoplastics as regard
mechanical properties and heat/chemical resistance (indeed, they are utilized in
electronic appliances or sealed products) but, at the same time, it causes a loss in
versatility and dramatically reduces the chances of being recycled. Thermosets include
polyurethane (PU), frequently used in sport equipment, thermal insulation, furniture;
epoxy resins, applied to adhesives, sports/electrical/automotive equipment; phenolics,
which are used in furnace, automotive components. Thermosets account for 15% of the
overall plastic demand in the EU. (Plastics Europe, 2017)
1. Figure 1.1 Main types of thermoplastics and thermosets. Source: Plastics Europe, 2017
Polyethylene (PE)
Polyamides (PA)
Polypropylene (PP)
Polycarbonate (PC)
ABS
SAN
PEEK
POM
PBT
Expanded polystyrene (EPS)
Polyarylsulfone (PSU)
Polystyrene (PS)
Thermoplastic elastomers (TPE)
Polyethylene Terephthalate (PET)
Poly methyl methacrylate
(PMMA)
Polyvinyl-chloride (PVC)
Fluoropolymers
Etc.
Polyurethane (PUR)
Unsaturated polyester
Epoxy resins
Vinyl ester
Silicone
Melamine resin
Unsaturated polyester
Phenolic resins
Phenol – formaldehyde
Urea – formaldehyde
Acrylic resins
Etc.
THERMOPLASTICS THERMOSETS

5
1.1.3 History
Since ancient times, man has always strived for discovering new materials to go beyond
possibilities found in nature. At first, it employed natural materials which present useful
properties (strength, durability, malleability, resistance to heat). Then, man started to modify
natural materials through chemistry, examples of this approach are rubber and collagen. The
timeline below presents the most significant highlights of the milestones marking plastics’
history.
• 1855. Alexander Parkes invents “Parkesine” working on camphor. Nowadays, this is
considered as the first thermoplastic material, known as celluloid.
• 1869. John Wesley Hyatt treated cellulose with camphor, deriving a material easily
crafted and shaped, resembling materials like ivory or tortoiseshell.
• 1899. Casein plastic is patented by Krische and Spittler, in Germany. It found wide use
in manufacturing dyed objects.
• 1907. The first fully synthetic form of plastic (Bakelite) was invented by Leo Hendrik
Baekeland in an attempt to find a good insulator which could ease the electrification’s
development in USA. This was the first plastic not containing molecules that can be
found in nature. The Bakelite proved to be a perfect fit as an insulator, but it found many
more applications, since it is easily moulded, heat resistant, durable, and relatively cheap
to produce.
• 1913. Fritz Klatte, a German inventor, patented a new process to produce PVC, which
is, as of today, one of the most employed and studied materials in industrial production.
• 1930s. During the Thirties, plastics developed not just through the production of new
polymers, but also (and mostly) through the industrialisation of processes and materials.
These are the years of the screw per-plasticisation in injection moulding, the invention
of nylon (by W. H. Carothers, in DuPont’s research facility), and the first
commercialization of polyethylene (PE).
• 1940s. Pushed by the war, plastic industry continues its industrial development and new
polymers were patented: polyacrylonitrile, polyethylene-terephthalate (PET), Teflon,
Acrylonitrile-butadiene-styrene (ABS). The American Monsanto started using LDPE
for manufacturing bottles, giving a huge impact to the sector.
• 1973. Introduction of PET bottles.
• 1990s. Plastics’ development focused on high performance polymers for high tech
applications. Significant examples are polyacetylene (presenting outstanding electrical

6
conductivity), studies at Cambridge on light-emitting polymers, and the
commercialization of the first biodegradable plastics.
During last decades, notwithstanding the development of new plastic materials, people became
more and more aware of the environmental issue posed by plastic consumption. Ocean plastic
leakage, infinite decay, potential threat to human health, these are all issues that plastic forced
humankind to face. (Science History Institute, 2019; British Plastics Federation, 2014)
1.2 Macro data
In managing post-consumer and post-industrial plastic waste, the Society has three options (not
to mention leakage): landfill, energy recovery and recycling. Even though global recycling rate
is estimated in 14-18%, recycling rates vary from country to country according to the stage of
development of the economy and the regulator’s attitude towards recycling. (OECD, 2018)
Developed mature economies with a good tradition in waste management and great incentives
from the Regulator (typical examples are Europe and Japan), achieve recycling rates near 30%
(slightly higher than the landfill rate). Then, countries like U.S. and Australia are within a group
of developed economies with a scarce tradition in recycling and large employment of traditional
waste managing methods, such as incineration and landfill; these countries present much lower
recycling rates (around 10%). Developing economies behave differently; in this group there are
countries presenting a great industrial demand as China, India, and Brazil: these countries have
inadequate collection schemes, but the industrial demand drives the recycling rate to an
adequate level. In the same group, we see underdeveloped economies with low industrial
demand (e.g. African countries) which present very low recycling rates, as the waste is much
more valuable on the local market and the tradition for recycling is less developed.
(D’Ambrières, 2019)
1.2.1 Plastic production
Global plastic production (including every type of polymer) amounts to 348 million tons in
2017 (Statista, 2018), which means, starting from 1,5 million metric tons in 1950, an historical
compound annual growth rate of 8,5% per year.
Forecasts by the Ellen MacArthur Foundation, estimates plastic production per annum to
quadruple by 2050, reaching nearly 1.300 million tons (Ellen MacArthur Foundation, 2017).
We can see below a geographical breakdown of global plastic production.

7
2. Figure 1.2 Geographical breakdown of global plastic production. Source: Ellen MacArthur
Foundation, 2017
Looking at the segmentation of plastics demand by polymer (Statista, 2018), it is immediately
clear the dominance of polypropylene (PP) with a market share of 26% and polyethylene
(LDPE, LLDPE, HDPE) with a combined market share of 38%. Then we can find polyvinyl-
chloride (17%) and polyethylene terephthalate (8%).
3. Figure 1.3 Global distribution of polymer demand, by type. Source: Statista, 2018
Europe
19%
North
America
18%
Latin America
4%
Middle East
and Africa
7%
CIS
2%
ASIA
50%
-China, 29%
-Japan, 4%
-Rest of Asia, 17%
26%
17%
17%
12%
9%
8%
4%
3%
2%
2%
Polypropylene (PP)
High-density polyethylene (HDPE)
Polyvinyl chloride (PVC)
Linear low-density polyethylene (LLDPE)
Low-density polyethylene (LDPE)
Polyethylene terephthalate (PET)
Polystyrene (PS)
Acrylonitrile butadiene styrene (ABS)
Expandable Polystyrene (EPS)
Propylene carbonate (PC)

8
1.2.2 Plastic waste trade
Even though the free trade flow of plastic waste could increase global recycling rate (without
trade barriers, plastic scrap would be exported to countries where recycling is cheaper), global
trade in plastic waste is deemed modest, overall (OECD, 2018).
UN Comtrade reported that just 4% (14 million tons) of plastic waste generated during 2018
was exported (UN Comtrade, 2019). It is noticeable that both import and export data are
concentrated in a few countries. Looking at export data, we can see that three countries prevail:
USA accounts for 13,2% of total exports (coherently with the estimated low rate of internal
recycling), Germany reaches 12,2% and Japan 11,6% (data in dollar value).
1. Table 1.1 List of the six major countries exporting plastic scrap (ranked by exported value
in 2018). Source: UN Comtrade, 2019
As anticipated, the same holds for imports. In fact, the first seven countries account for more
than half of global imports (53,1%, in terms of volume), as summarized in the table below.
Exporting country Exported value ($.000) % on total
USA 446.473 13,2%
Germany 414.691 12,2%
Japan 393.628 11,6%
Belgium 176.862 5,2%
France 172.178 5,1%
Netherlands 162.202 4,8%

9
2. Table 1.2 List of the seven major countries importing plastic scrap (ranked by imported
volume in 2018). Source: UN Comtrade, 2019
Note that, as regard imports, the current scenario is the result of the recent regulatory turmoil
in China (the same applies to various south-eastern Asian countries) that imposes heavy
restrictions on imports. Until 2017, China showed a clear supremacy with respect to imports,
but year 2018 marks the start of the enforcement of the “National Sword” policy. This was a
severe and permanent ban on plastic waste (and other materials) import, which, by the
beginning of the year shocked the global market: the main market for exporting plastic waste,
capable of absorbing nearly half of it (historically), has gone.
1.2.3 The link between plastic recycling and waste management
Plastic recycling industry is, by its nature, deeply bound with plastic industry, which provides
raw materials for the functioning of the recycling industry; but that is not the only industry with
a very strong interdependence with plastic recycling. Plastic recycling heavily relies on waste
management industry (sometimes they intersect) for receiving a suitable amount of plastic
waste, complying with the qualitative requirements of the industry.
Waste management has a much broader scope than plastic, it plays a very important role in the
urban context, for protecting human health and environment. Waste management involves
different aspects of the society: lifestyles, resource consumption, job, income level, culture.
(International Solid Waste Association, 2002)
The situation is very different from country to country, since waste management is strongly
dependent on local organizational, financial, and technical resources. Notwithstanding the
differences, important progresses have been achieved all over the world, recently, thanks to the
efforts for increasing awareness of both the public and governments.
Importing country Imported tons % on total
Malaysia 872.531 11,8%
Hong Kong 598.046 8,1%
Netherlands 555.419 7,5%
Thailand 552.727 7,5%
Germany 468.022 6,3%
USA 442.291 6,0%
Turkey 436.910 5,9%

10
This industry can be divided into three main groups: municipal solid waste management (MSW)
including commercial and institutional waste; industrial waste; hazardous waste. The activities
inside the perimeter of waste management are waste prevention, waste collection,
transportation, and storage; recycling itself is sometimes listed among these activities.
Companies focusing on these activities are belonging to public authorities or they are private.
Municipal waste usually concerns the local public authorities, while industrial waste and
hazardous waste often go under the responsibility of private companies. (International Solid
Waste Association, 2002)
In 2016, municipal solid waste generation amounts to 2,02 billion tons; forecasts by the World
Bank (based on population development and GDP growth) suggest that municipal solid waste
generation could reach 3,4 billion tons by 2050, implying a CAGR equal to 1,5%.
4 Figure 1.4 Projected global generation of municipal solid waste, 2016-2050. Source: World
Bank, 2018
As written above, the amount of waste generated is not proportionally distributed among
countries. Different income levels and different consumption patterns generate huge differences
in waste generation per capita. The perfect example is USA since it produces nearly 12% of
global waste (the same amount as India) even though it accounts just for 4,4% of the global
population. (World Bank, 2018)
2,0
2,6
3,4
2016 2030 2050
Bln
to
ns

11
5. Figure 1.5 Population and municipal solid waste generation share by key country, 2018,
Source: Statista, 2019
Looking at the breakdown of waste generation by material (data provided by Statista and
referring to 2016), we notice the considerable importance of green and food waste, accounting
for 44% of global waste generation. Plastic highlights its relevance, reaching a 12% share.
6. Figure 1.6 Global waste generation breakdown, by material type, 2016. Source: World
Bank, 2018
18,8%
18,1%
4,4%
2,8%
2,0%
1,7%
1,7%
1,2%
1,1%
0,9%
0,8%
0,8%
0,5%
15,6%
12,0%
11,7%
3,9%
2,4%
2,2%
2,2%
2,0%
1,5%
1,5%
1,5%
0,7%
1,4%
0% 5% 10% 15% 20%
China
India
United States
Brazil
Russia
Mexico
Japan
Germany
Turkey
United Kingdom
Italy
South Africa
Canada
Share of global municipal
solid waste
Share of global population
14%
2%
2%
4%
5%
12%
17%
44%
0% 10% 20% 30% 40% 50%
Other
Wood
Rubber and leather
Metal
Glass
Plastic
Paper and cardboard
Food and green

12
1.2.4 Recycled plastics market
Production data about recycled plastic are nearly unknown, however Geyer, Jambeck and Law
provided estimates based on the global recycling rate. Being global recycling rate assessed at
18% and having virgin plastic production reached 348 million tons (2017), production of
recycled plastic translates into nearly 63 million tons (OECD, 2018); the compound annual
growth rate of recycled plastic market is estimated by Transparency Market Research in 6,9%
in the period 2016-2024, surging from $31,5 bln to $56,8 bln (CSIRO, 2017).
Post-consumer plastics market is segmented according to two dimensions: sector of application
and polymer type. Looking at sectors in which recycled plastics are utilized, we notice three
main segments: packaging (split between food contact and non-food contact) is, by far, the most
important, reaching 69% of the global market; then we have the construction sector,
representing a 14,4% share; last of the three, there is the automotive sector (8,45%). Every
segment is expected to growth, thanks to growing global population, together with the rising
income level per capita in developing countries. (CSIRO, 2017)
7. Figure 1.7 Breakdown of sectors of application for plastics, 2016. Source: CSIRO, 2017
Turning to recycled plastic polymers, there are four main polymer types which account for 95%
(2017) of the market: PET, HDPE, PP, LDPE. It has to be noticed the outstanding importance
of PET (used mainly in packaging, bottles in particular) in the recycled plastic market, since it
reaches a share of 55% of the market; moreover, it is forecasted to grow further, as a result of
the increasing environmental concerns in developing countries (e.g. China and India) and the
utilization of PET bottles. (CSIRO, 2017)
41,10%
27,90%
14,40%
8,45%
8,15% Non-food packaging
Food contact
packaging
Construction
Automotive
Others

13
8. Figure 1.8 Breakdown of plastics consumption, by polymer, 2016. Source: CSIRO, 2017
1.3 The three megatrends driving the industry
In recent years, different trends affecting the plastic recycling industry have manifested. Three
of them are particularly important in driving plastic recycling towards change.
1. The changing legislative environment driving Europe towards higher and higher
recycling rates.
2. The recent strict ban imposed on import by China, formerly the most important plastic
waste importer.
3. The increasing awareness among consumers about environmental sustainability.
1.3.1 EU Guidelines package
The European Commission adopted an Action Plan in December 2015, aiming at orienting the
Union towards the Circular Economy. In this document, plastics are recognized as a key priority
for improving the overall state of recycling. Goals set in that occasion were confirmed in 2017
and further addressed in 2018 formalizing “A European Strategy for Plastics in a Circular
Economy”. (European Commission, 2018)
Europe is considered in the perfect position for leading the global change in this matter, thanks
to its history and culture. Pursuing these goals, it will contribute to boost employment (200.000
new jobs are estimated, if goals are reached), innovation and prosperity in the Union.
The Commission calls the private sector and the citizens for action, for contributing to shape
the new circular economic model in their countries. Because it is recognized that, even if the
55%32,88%
3,76%
3,52%4,84%
PET
HDPE
PP
LDPE
Others

14
European Union will propose concrete actions for achieving its vision, the contribution of all
actors involved in the value chain is required for making it real.
The Action Plan presents fundamental commitments at European level to be achieved by 2030;
measures are divided in four thematic sections: enhancing plastic recycling quality; limiting
plastic waste and littering; sustain investments in circular economy solutions; lead global
actions. After the presentation of this strategy, the European Parliament adopted (on October
24, 2018) a plan for banning single-use plastic goods in participating countries by 2021.
(European Commission, 2018)
The most important goals set by the Action Plan are:
1. By 2030 all packaging must be reusable or recyclable.
2. Granting the utilization of 10 million tons of recycled plastic, by 2025.
3. Achieving a 55% recycling rate for plastic packaging, by 2030 (50% by 2025).
In 2019, with the Directive 2019/904, the European Union indicates further goals to be achieved
by Member States:
1. Plastic bottles shall contain at least 25% of recycled plastic, by 2025, reaching 30% by
2030.
2. By 2025, 77% of single-use plastic items produced during a year should be collected
and directed to recycling (the target is 90% by 2029).
Objectives are very ambitious, considering that, according to European Union’s estimates,
currently, recycled plastics cover just 6% of total European demand of plastic (which accounts
for 49 million tons); it means that, the utilization of plastic recycling should be tripled, going
from nearly 3 million tons per year to 10 million tons, in five years.
It is clear that achieving a three-fold increase in production will be disruptive for the industry,
granting a great boost in demand for European plastic recyclers, since goods manufacturers are
required to quickly adapt to these directives, if they want to be compliant with European
requirements by 2025 (and 2030).
1.3.2 Chinese ban on imports (“National Sword Operation”)
Political and economic developments imposed new emerging markets in China from 1978
onwards. This meant that developed countries (mostly western countries) started to import
plenty of goods manufactured in China. At that time, China was not an attractive market for

15
products manufactured in developed countries. This trade mismatch made ocean freighters
(which have carried Chinese goods) returning nearly empty. (Rico C., 2018)
Developed countries exploited this imbalance, using the same ships (previously coming back
to China almost empty) for exporting their waste, thus addressed two different needs: European
countries, US and Japan found a suitable place for managing plastic waste, avoiding sending it
to landfills or incinerators; China (and other south-eastern countries) could enter the recycling
business and use the recycled commodities for manufacturing new products (that would be sent
to developed countries, closing the loop). From the beginning of the current century, Chinese
regulators have increasingly felt the need for pollution/waste control; for this reason, China has
implemented harsher and harsher polices concerning waste import (plastic scrap in particular).
The establishment of an environmental regulatory system for the industry has been commenced
from the Eighties (Brooks A.L. et al., 2018) but started to heavily impact the country and the
world from 2013, reaching its climax in 2018, through two important initiatives: Green Fence
Operation (2013) and National Sword Operation (announced in 2017 and activated in 2018).
China’s need of affordable raw plastics to satisfy the increased demand for plastic products
showed the inadequacy of local recycling factories (both in volume and quality) and the
dangerous environmental impacts of contaminated plastic imported from abroad.
Chinese Government has started working from 2012 to enhance the quality of imported plastic
scraps and limit the number of unregulated plants; the result of this effort was the “Green Fence
Operation”. The Green Fence Operation consisted in a temporarily (from February 2013 to
November 2013) stricter enforcement of policies on foreign scrap by Chinese authorities
targeting the quality of imported waste-derived raw materials and the functioning of the local
industry (involved in illegal trading with foreign countries). The Green Fence Operation
organized direct inspection of the content of containers (also allowing the inspection of
individual bales) setting strict quality requirements on imported plastic waste. E.g. law
prohibited physical contamination of waste higher than 1,5% (in weight). (Velis C., 2014)
This initiative affected both recyclers and shippers: the formers bear the risk of being forced to
pay for the return of the rejected containers, the latter could have the license revoked. Foreign
recyclers have been forced to make huge investments in quality controls and advanced sorting
processes. (Powell J., 2013)
Under the Green Fence Operation, western countries proved not prepared to manage the boosted
supply of waste as they relied (until 2013) too much on the Chinese market. (Velis C., 2014)

16
The temporary direct effect of the Green Fence Operation can be assessed looking at import’s
data. United Nations Commodity Trade reports a sudden decrease in plastic scrap import in
2013: it decreased by almost 1 million tons, from 8.877.000 tons (2012) to 7.881.000 tons (11%
decrease). (UN Comtrade Database)
The Green Fence Operation caused strict limitations in plastic waste accepted at China’s border,
resulting in many cargos being sent back to their origin. In fact, this produced a widespread
effect since other countries were used to export their waste to China and had not developed
necessary infrastructures. Export and import value (in US dollars) faced a reduction of $446
million and $298 million respectively, from 2012 to 2013. (Brooks A.L., Wang S., Jambeck
J.R., 2018)
As stated, the Green Fence Operation was not permanent. But after some years China went
deeper in fighting waste import: after months of rumblings in the recycling industry in 2017, it
announced to the World Trade Organization the implementation (from January 2018 onwards)
of a new ban on solid waste import, called “National Sword”. This ban is thought as permanent
and includes a list of twenty-four types of solid waste including textiles, paper and (as the most
prominent) plastics. The National Sword Operation became effective from the beginning of
2018, and it had a huge impact on plastic waste management all over the world. (Wang W. et
al., 2019; Higgs M.M., 2019)
As regard plastics, the ban includes (among other) waste made of polyethylene, polystyrene,
polyvinylchloride, and polyethylene-terephthalate (PET). It is important to notice that, also for
materials not covered by the ban, China has imposed a prohibitive quality standard, not
accepting waste containing more than 0,5% of contaminants. (Wang W. et al., 2019)
National Sword’s ban started operating from 1st January 2018. Before this ban, Asian countries
were still the main destination of plastic wastes exported by developed countries. China alone
in 2016 received nearly 56% of global exports, while other Asian developing countries were
the main destinations of another 20% of the global export of plastic waste. Looking at the huge
importance that China has had in receiving plastic scrap, it is clear that China’s ban posed a
serious issue for developed countries that, in the short term, will probably divert to other
countries their waste and increase utilization of virgin plastic (Morgan Stanley estimates a 2%
increase in global polyethylene supply in result of National Sword Ban). (Wang W. et al., 2019;
Morgan Stanley, 2018)

17
In the following pages the evolution of global import and global export of plastic waste (defined
as “waste, parings and scrap, of plastics” by the UN Comtrade, commodity number 3915) is
displayed and the reaction of top importers and top exporters in terms of regulation is
highlighted.
The four most important exporters of plastic waste in terms of value have been selected (USA,
Japan, Germany, and United Kingdom) and data from UN Comtrade database have been
extracted.
First, the focus has been put on exports to China. The path followed is very similar: a surge
from the early 2000s with a peak in 2011 or 2012, followed by a sharp decline. We can
immediately notice that, even though UK is among the four top exporters of plastic waste, its
exports to China are much more moderate than those of the other three countries. From the
graph below it can be noticed the impact of the Green Fence Operation and of the National
Sword. All three of Japan, Germany and UK reached their high in 2012 before experimenting
a sudden fall during the next year, when the Green Fence started operating: this amount to 18%
for the United States, 13% for Japan and Germany, and 42% for UK. Remembering the Green
Fence was temporary, it explains the rise happened immediately in 2014 in export value of
USA, Germany, and UK.
9. Figure 1.9 Export of plastic waste to China, selected countries, 2002-2018. Source: UN
Comtrade, 2019
Turning to global exports, USA is the top exporter, reaching more than one billion US dollar in
export value in 2011 and always leading the group.
0
100
200
300
400
500
600
20
02
20
03
20
04
20
05
20
06
20
07
20
08
20
09
20
10
20
11
20
12
20
13
20
14
20
15
20
16
20
17
20
18
$ m
ln
USA Japan Germany UK

18
The following graph shows if the increasingly harsh restrictions imposed by China have just
led to divert exports to other countries (with more favourable legislations) or if main exporters
have been forced to find new solutions at home.
10. Figure 1.10 Global exports of plastic waste, selected cuntries, 2002-2018. Source: UN
Comtrade, 2019
Taking into consideration the chart depicting global export of plastic waste, it is noticeable that
the impact of Chinese regulation directly affects the global market. Looking at the consistently
decreasing path, we can say that there is no adequate possibility of allocating the huge amount
of plastic rejected by China.
1.3.3 Shifting in consumers’ perceptions
People face environmental issues every day, and they are called by media for action. This results
in citizens (and so consumers) adopting more sustainable behaviours, and endorsing
organization that support social and environmental change. Indeed, multiple studies shown that
people’s concern for environmental issues has risen and risen over the decades (so much that
Brown and Wahlers defined the Nineties as the “Decade of the Environment”, in 1998),
becoming one of the top priorities in developed countries, as USA (Cude, 2007).
The new perceptions of people translate into new consumption habits of consumers that reward
sustainable brands, as highlighted by a Nielsen’s study in 2015 (“The sustainability
imperative”). Many business actions are taken to demonstrate brand’s sustainability. From
supporting NPOs (not-for-profit organizations) and civic associations, to sourcing raw materials
taking into consideration the environmental impact, to recycling (Nielsen, 2015).
0
200
400
600
800
1.000
20
02
20
03
20
04
20
05
20
06
20
07
20
08
20
09
20
10
20
11
20
12
20
13
20
14
20
15
20
16
20
17
20
18
$ m
ln
USA Japan Germany UK

19
Notwithstanding the means, data presents a consistent connection between brand’s perceived
sustainability and company’s performance. Overall, corporations which have committed to
environmental and social sustainability have outperformed corporations which have not: in fact,
in the year of the study, the formers have grown by 4%, while the latter reached just 1% growth.
The study investigates key aspects which drive consumers’ purchase (limited to consumer
brands). A large part of consumers (45% of interviewed) deems as a key purchase driver the
fact that the company producing the goods is known for its environmentally friendliness; a
similar share (41%) considers the low environmental impact of the packaging. Retail data
supports these findings, since in 2014 65% of global sales have been generated by brands that
commit (and show it through TV ads, packaging or any other kind of marketing
communication) to social/environmental values (Nielsen, 2015). Notably, already in 2007,
empirical studies (Cude, 2007) had shown the great consumers’ propensity for buying products
related to the concept of recycling: almost 65% of the individuals studied, declared a preference
for this kind of products.
Moreover, consumers’ preference for environmental-friendly products translates in higher
willingness to pay. In fact, a share equal to 66% of consumers says that it would pay more for
sustainable goods, in 2015 (it was 55% in 2014 and 50% in 2013). Contrary to what it could be
expected, this is not just a trend affecting wealthy people in developed countries; it is, instead,
a phenomenon spread across income levels, geographies, and ages. Willingness to pay more
seems more rooted into developing markets’ consumers, young (specifically, Millennials) and
medium-low income people. (Nielsen, 2015)
Nowadays it is clear that companies feel the need to incorporate these trends in their marketing
strategies for remaining competitive (Mahapatra, 2013). This because environmental
responsibility is critical for brand reputation, and brand reputation is key in outperforming
competitors (Nielsen, 2015). People, as consumers, strive for being more and more responsible,
expecting the same attitude from companies.
1.4 Literature review
For better understanding the dynamics behind the evolution of the plastic recycling industry
and the competition within it, the existing literature on circular economy and recycling
industries has been reviewed.
With the growing importance of resource recycling, scholars have started to dedicate more and
more resources to study the subject. As the number of papers published is considered as a sign

20
of the development of a field of study, it is important to notice 7.041 publications over the
matter on Web of Science database. Research has been mainly focused on environmental issues
(prevented or caused), technical matters and policy, but some specific waste recycling industries
have been dealt with, too. (Wang et al., 2019)
Recycling is a constituent part of the Circular Economy’s concept; the latter must be introduced
for obtaining a clear picture of the former.
From several years, Circular Economy has been one of the most debated topics by
environmental and managerial researchers. At its core, Circular Economy is a revolutionary
concept driving the current open production system towards a closed one. Indeed, the linear
consumption model involving the extraction, the processing, and the eventual disposal of
resources is challenged and a circular consumption model is proposed; the latter conceives
different means for keeping the extracted resources in the loop, generating more value and
extending products’ life (Urbinati et al., 2017). Commonly, the representation of Circular
Economy is given by mean of four loops (Ellen MacArthur Foundation, 2013), that indicate the
basic pillars of the new paradigm.
1. Product-life extension. Product design must play an important role in retaining value
through repairing or maintaining products.
2. Reuse. Changes in consumption habits lead to the retention of the entire value added
which is embedded in the products, by reutilizing them.
3. Remanufacturing. Industrial process by which an end-of-life product (or part of a
product) returns to a brand-new state.
4. Recycling. Industrial treatment applied to materials, transforming them to turn them into
new products. (Urbinati et al., 2017)
The pillars above, defined as “loops” constitutes a hierarchical system of business models
linked to more efficient uses of resources. This hierarchical view has been introduced by Stahel
and Reday-Mulvey during the early Eighties and developed by several other authors (Planing,
2015).
Why the Circular Economy concept has got the attention of the public, the enterprises, and the
policy makers? Different drivers have been highlighted by the literature. First, the rising
pressure to limit the environmental impacts deriving from business and household consumption
(Tura et al., 2019). Second, the dynamics of commodities’ prices have changed. Indeed,
commodities’ price has been declining over the entire 20th century (CAGR equals -1,2%), thus

21
making corporations disregarding the importance of commodities consumption. But from 2000
on commodity prices become more volatile while undertaking a consistent rising path, thus
making industrial manufacturers increasingly prone to these price dynamics and willing to
safeguard their resources supply through the recovery of end-of-life raw materials. Third, new
information technologies have enabled corporations to conceive innovative solutions and
business models that were unimaginable until recent times (Tura et al., 2019; Planing, 2015).
Last, multiple authors point out the importance of the shifting in consumers’ behaviour that will
result in a different concept of products bought; indeed, eventually, consumers’ purchase will
be result-oriented with ownership leaving room for performance (Planing, 2015).
Despite the rising attention towards Circular Economy, the global economic system struggles
to adjust. Literature has showed several barriers hindering the adoption of circular economy’s
business models. Heavy business model changes require investments in new technologies; this
has shown the lack of adequate financial resources faced by many firms (Tura, 2019).
Moreover, the current economic model has shaped the current institutions (defined as “formal
and informal rules that organise social, political and economic relations”, according to North,
1990), generating rigidities in the system, e.g. industrial policies which foster liner economic
models. Example of these difficulties is the waste transport regulation, which in many cases
prevent cross-border shipment of waste. (Tura, 2019)
Literature (Urbinati et al., 2017; Mayyas et al., 2012) highlights two main aspects that must be
considered for value creation under Circular Economy. First, enterprises must direct their
efforts to product design, facilitating the recovery of products’ materials and products’ parts for
remanufacturing or recycling. Second, converting the current linear consumption/economic
model to a circular one, requires companies to extend their responsibility over the products they
create, maintaining the ownership over the products (“product as a service” business model) or
contributing (e.g. financially) to end-of-life products management.
Undoubtedly, for adapting to this new paradigm, firms need to revolutionise their existing
business models; this gave rise to a new strand of research focusing on circular business model
innovation. Currently, not many authors have contributed to design frameworks to implement
a circular business model into existing businesses. Research has been focused on requirements
enterprises need to adhere, barriers that hamper circular practices to spread and drivers
promoting business model innovation towards sustainability.
Vermeulen (2015) highlights the link between the ongoing global trends and necessary business
model evolution. The impact on the environment (e.g. climate change) caused by population’s

22
growth, consumption’s rise, and land exploitation directs firms’ business models towards the
limitation of the dependence on virgin resources, the development of a reverse supply-chain,
and the shifting to a renewable energy system. In reorganizing the supply-chain and the whole
industrial structure, the importance of assets and resources sharing emerges (Mathews and Tan,
2011). Sharing natural resources, infrastructure, physical resources, recycling materials is
fundamental to establish a cross-industrial cooperation of enterprises that will drive to the
reduction of negative externalities and to the capture of mutual benefits (Urbinati et al., 2017).
In the process of formation of the Circular Economy, the recycling industry is inserted. As one
of the four loops of the new paradigm, the recycling industry plays an important role for the
functioning of other industries’ circular business models.
Plastic recycling has been the subject of two wide strands of research, focused on process
technologies utilized and their impact on the environment. Multiple authors (Singh, 2017;
Ragaert et al., 2017) have discussed over the different recycling processes, categorizing them
into four different forms.
1. Primary recycling. It is the extrusion of uncontaminated polymers comparable to virgin
plastics. Municipal solid waste is usually not suitable for primary recycling due to its
high level of contamination.
2. Secondary recycling. It is a form of mechanical recycling, differing from primary
recycling for the quality of products treated. Indeed, plastic waste processed presents
higher level of contamination, thus requiring efforts in purifying the input utilized.
3. Tertiary recycling. Also known as chemical recycling, tertiary recycling envisages
different techniques (e.g. solvolysis, thermolysis) united by the aim of bringing plastic
waste back to its original constituting materials (petroleum-based products).
4. Quaternary recycling. Better known as energy recovery, it addresses materials which
are impossible to recycle. Energy is recovered through incineration and land filling is
avoided.
Secondary plastic waste recycling emerges as the most consolidated reality, and purification is
deemed of the utmost importance, since waste collection usually do not provide certainty about
the polymers contained in the waste arriving the recycling facilities. Indeed, mixing polymers
leads to properties degradation because of the different melting points (Singh, 2017; Ragaert et
al., 2017; Hopewell et al., 2009).
23
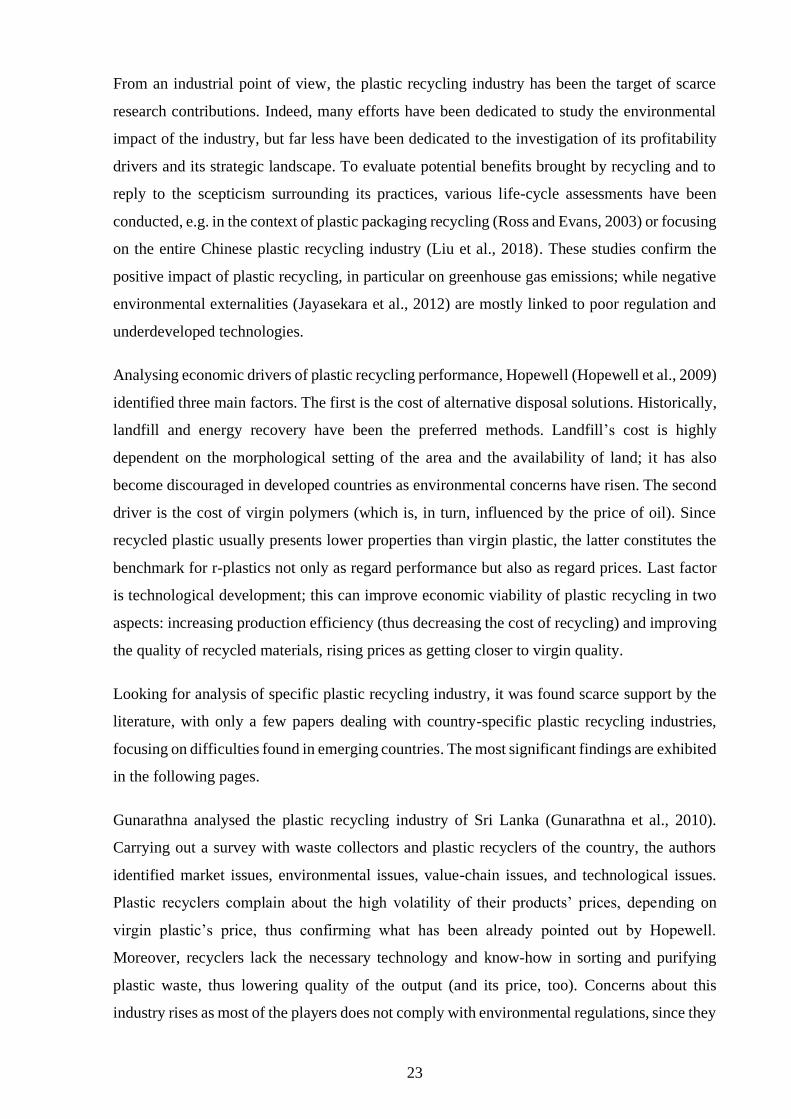
From an industrial point of view, the plastic recycling industry has been the target of scarce
research contributions. Indeed, many efforts have been dedicated to study the environmental
impact of the industry, but far less have been dedicated to the investigation of its profitability
drivers and its strategic landscape. To evaluate potential benefits brought by recycling and to
reply to the scepticism surrounding its practices, various life-cycle assessments have been
conducted, e.g. in the context of plastic packaging recycling (Ross and Evans, 2003) or focusing
on the entire Chinese plastic recycling industry (Liu et al., 2018). These studies confirm the
positive impact of plastic recycling, in particular on greenhouse gas emissions; while negative
environmental externalities (Jayasekara et al., 2012) are mostly linked to poor regulation and
underdeveloped technologies.
Analysing economic drivers of plastic recycling performance, Hopewell (Hopewell et al., 2009)
identified three main factors. The first is the cost of alternative disposal solutions. Historically,
landfill and energy recovery have been the preferred methods. Landfill’s cost is highly
dependent on the morphological setting of the area and the availability of land; it has also
become discouraged in developed countries as environmental concerns have risen. The second
driver is the cost of virgin polymers (which is, in turn, influenced by the price of oil). Since
recycled plastic usually presents lower properties than virgin plastic, the latter constitutes the
benchmark for r-plastics not only as regard performance but also as regard prices. Last factor
is technological development; this can improve economic viability of plastic recycling in two
aspects: increasing production efficiency (thus decreasing the cost of recycling) and improving
the quality of recycled materials, rising prices as getting closer to virgin quality.
Looking for analysis of specific plastic recycling industry, it was found scarce support by the
literature, with only a few papers dealing with country-specific plastic recycling industries,
focusing on difficulties found in emerging countries. The most significant findings are exhibited
in the following pages.
Gunarathna analysed the plastic recycling industry of Sri Lanka (Gunarathna et al., 2010).
Carrying out a survey with waste collectors and plastic recyclers of the country, the authors
identified market issues, environmental issues, value-chain issues, and technological issues.
Plastic recyclers complain about the high volatility of their products’ prices, depending on
virgin plastic’s price, thus confirming what has been already pointed out by Hopewell.
Moreover, recyclers lack the necessary technology and know-how in sorting and purifying
plastic waste, thus lowering quality of the output (and its price, too). Concerns about this
industry rises as most of the players does not comply with environmental regulations, since they

24
do not take adequate measures for avoiding water contamination. Evidence from the industry
suggests an additional issue for the Sinhalese plastic recycling industry: scarcity of supply due
to unstructured collection system; this issue highlights (once more) the importance of the entire
supply chain constituting the environment in which recyclers operate. It is important to notice
that economic constraints listed by Gunarathna confirm what has been suggested by the other
authors (Hopewell et al., 2009; Singh, 2017; Ragaert et al., 2017).
In 2011, Pacheco (Pacheco et al., 2011) published a paper on the plastic recycling of Rio the
Janeiro. Again, researchers tried to shed light on industry’s issues in a developing country. The
goal was to identify the main difficulties for the recyclers and to assess production capacity in
the area. The study has been carried out with in-company visits and survey questionnaires.
Eventually, local recyclers pointed out the lack of fiscal incentives and the poorly performed
waste separation as the main difficulties encountered in their business, thus clearly implying a
very low profitability in their industry and, once again, the utmost importance of waste
separation. Additionally, the high cost of energy is deemed to be very detrimental to the
industry’s development.
Investigating on further insights about recycling industry’s profitability, it was clear the scarcity
of material focusing on this matter. Even though some authors (Uvarova et al., 2020; Li et al.,
2015) deepened profitability aspects related to recycling industries (tyre recycling industry in
Latvia and e-waste recycling in China, respectively), these works proved very country-specific
and not overlapping with plastic recycling industry. The only relevant aspect (for the purpose
of this work) which derives from these studies is the low profitability requiring public subsides
and/or incentives, with regard to the waste collection phase of the value-chain.
The review of the literature available showed a flourishing stand of research on Circular
Economy, focusing on structuring a theoretical framework for dealing with its innovative
effects, on barriers hindering the adoption of circular practices and on drivers helping the
transition. This helped in identifying the global macro trends behind plastic recycling industry
evolution and some of the issues it must deal with. But when it comes to the specificity of the
recycling industry and, precisely, to the plastic recycling industry, most of the research has been
carried out focusing just on the technological/processing side of recycling and its positive
impacts on the environment (both in limiting greenhouse gas emissions and in avoiding
resource consumption). Niche research has been dealt with plastic recycling industry in
developing countries, helping in defining main difficulties encountered.

25
Industry analysis utilizing structured theoretical frameworks and adopting a strategic focus on
competition has been found lacking, thus it is believed that the present work can address the
matter, enriching current analysis with insights deriving from well-established frameworks,
traditionally utilized for analysis competition dynamics and the strategic environment of an
industry (chapter two). Moreover, in chapter three the focus will be narrowed down to Italy,
thus providing the possibility of checking results from literature analysis and frameworks
application on the plastic recycling industry of a developed country.
1.5 Closing remarks on the introduction to plastic recycling
The first chapter highlighted the high relevance of plastics in the modern globalized world,
describing their developments, their main types, and their main applications.
Then, recycled plastics have been introduced, pointing out their positive impact on the
environment and their growing industrial application.
Moreover, the three main global trends (“megatrends”) have been discussed in 1.3, as they are
deemed to contribute to a turmoil within the industry in the next future, boosting both demand
and supply, thus positioning plastic recyclers in a perfect spot for standing out as one of the
next most significant industries.
Literature’s contribution has helped in shaping the basic requirements for recycling industries
to be set up but lacks specific insights about players’ competition and growing strategies. This
work will address the abovementioned matters.

26

27
2. Industry analysis through selected frameworks
In this chapter, plastic recycling industry is deeply analysed through the application of well-
established frameworks, considered as pillars of strategic industry analysis by the literature.
First, through the value chain framework, the main players and the main activities are presented.
Then, the competitive environment is depicted according to the five forces that shape
competition, identified by Michael Porter. Last, the industry is characterized according to the
SWOT matrix, for identifying its future developments together with its strengths and
weaknesses it has (and will have) to face.
2.1 Plastic recycling industry in a value chain framework
In the next pages, the main activities necessary in plastic recycling are introduced and analysed.
The goal is to present and characterize the main players and to assess which are the critical
activities carried out in this industry.
2.1.1 Value chain analysis framework
The original value chain/value system concept has been presented by Michael Porter in 1985.
The framework constitutes a systematic approach for examining the set of activities performed
by a firm, how they interact and their relationship with activities carried on by other players in
the industry (namely suppliers and buyers). Describing all the activities needed for obtaining
specific products or services (performed within and around a firm) results useful for
understanding the sources of the competitive advantages. The firm obtains a competitive
advantage performing these strategic activities better or more cheaply than its competitors.
This analysis can be performed at industry level or at firm level. Although competitors have
typically similar value chains, there are usually some differences, these differences may be used
to build the firm’s specific competitive advantage.
The value chain is taught to show total value created. It is made by “value activities” and
“margin”. The formers are defined as “physically and technologically distinct activities a firm
performs”, while the latter is “the difference between total value and the collective cost of
performing the value activities” (Porter, 1998).
Value activities are divided in primary activities (those directly involved in the creation of the
product) and support activities. In every industry we can find five types of primary activities:
inbound logistics, operations, outbound logistics, marketing and sales, service; each of these
can be further split up in other distinct activities, depending on the industry and on the specific

28
firm. Support activities present four basic categories: procurement, technology development,
human resources management, firm’s infrastructure.
11. Figure 2.1 Generic value chain’s structure. Source: Porter, 1998
2.1.2 Plastic recycling: activities performed, and players involved
On the basis of the interviews conducted with Italian plastic recyclers together with industry-
specific reports and literature review, main activities involved in plastic recycling are pointed
out: waste generation, collection, sorting, procurement, size-reduction, purification, extrusion,
compounding and, all along this chain of activities, product development.
The players and the steps of the plastic recycling chain are similar across countries, although
there are some country-specific features regarding the first phases of the process (in particular,
waste collection and sorting).
INBOUND LOGISTICS
OPERATIONSOUTBOUND LOGISTICS
MARKETING & SALES
SERVICE
PROCUREMENT
TECHNOLOGY DEVELOPMENT
HUMAN RESOURCE MANAGEMENT
FIRM INFRASTRUCTURE
MA
RG
INS
SUPPORT ACTIVITIES
PRIMARY ACTIVITIES

29
12. Figure 2.2 Plastic recycling: value chain's man activities. Own Ri-elaboration
Players that may be involved in the activities represented above are listed:
Multiutilities and municipal utilities
Post-industrial plastic recyclers
Post-consumer plastic recyclers
There are two main sources of plastic waste: industrial companies (“post-industrial waste” or
“pre-consumer waste”) and households (“post-consumer waste”). These different origins come
with differences in terms of contamination level and polymers composition. The stream of
waste can be mixed or “pure”; this depends on the role of waste collection that can be origin-
specific (industrial, commercial etc) and even resin- or colour-specific. (International Solid
Waste Association, 2014)
After consumption, goods are disposed, becoming post-consumer waste. With the aim of
recycling, plastic waste (post-consumer) can be collected through two ways: source-separation
and post-separation. In the former, households divide plastics from other kinds of waste, while
in post-separation waste get separated at a separation centre (after collection). We can also
mention two different collection schemes: by curb side picking and via drop-off locations
(Groot et al., 2014). For making these schemes cost-efficient, most of curb side collectors
collect the whole range of recyclables (paper, aluminium, glass, steel, and plastic). (Hopewell,
2009)
Collection Sorting Procurement Size Reduction
CompoundingExtrusionPurification Product
Development

30
Post-industrial plastic waste is generated during finished goods manufacturing (defective
products, cuttings, trimmings etc). Post-industrial plastic waste is usually purer than the post-
consumer one and easier to be recycled: its origin is clearly known, and it did not have contacts
with contaminants of any kind. Differently from post-consumption plastic, industrial waste is
usually collected directly on-site (at the manufacturer’s plant), by plastic recyclers or traders.
At waste collection stage, the industry’s organization may be very different from country to
country, with a clear distinction between municipal solid waste collection and industrial waste
collection. As regard municipal solid waste, usually (as in Italy) there is the coexistence of state-
owned enterprises (SOEs) and private companies. The formers operate in a circumscribed area
(typically coinciding with multiple towns), while the latter have broader scope. Most of the
players are multiutility companies, involved not just in environmental services (waste
management) but also in water and energy distribution. Historically, these activities have been
carried on in a near-monopoly environment (for each geographic area) characterized by the
strong presence of the State, but (e.g. in Italy) the sector has entered a process for increasing
competition. Providing a wide range of services to a relatively large share of population and
having experienced a near-monopoly situation, these players are typically large and strong
groups, with interests in different countries (if not state-owned). Perfect examples of
multiutility companies which are still strongly influenced by the State are Hera Group (46,6%
hold by municipalities, the remaining part free floating in the market) and A2A (50% owned
by two municipalities), both Italian companies reaching more than €6 bln revenues per year and
offering services ranging from waste collection to energy distribution.
The next step involves sorting. Since collectors pick all kinds of waste but recycling works only
for specific streams of waste, sorting companies take on the responsibility for separating the
different materials (types of material sorted are country-specific) to be directed to material-
specific recyclers, energy recovery plant or landfill. This step is fundamental since a well-
performed sorting can produce purer streams of raw materials for recyclers; this ensures less
steps of purification, thus granting better economics for recycling companies.
Thanks to separate collection of waste, plastic scrap gets automatically sorted from other
materials during waste collection. The first sorting of plastic waste according to polymer type
is performed by sorting centres, operating a rough selection, and removing gross impurities.
Turning to industrial waste, the picture changes: waste does not need separation, since it is
already homogeneous. It may be then collected not only by waste management companies, but
also directly by post-industrial plastic recyclers, taking on the responsibility of logistic services.

31
Of course, not all the plastic collected is going towards recycling. In 2016, Plastics Europe
Market Research Group and Conversio Market & Strategy GmbH highlighted that plastic
recycling is still quite marginal. In Europe, estimated recycling rate is around 30%. Alternative
ways for managing waste (incineration 42% and landfill 28%) can still represent valid economic
alternative and this leads to recycling rates lower than those of other materials like metals or
paper. It is important to notice that, for packaging (accounting for 59% of plastic waste
generated, according to Statista) recycling rate is much higher, reaching 41% in 2016 (Plastics
Europe, 2019).
The sorted waste is bought by recycling companies for mechanical or chemical recycling (still
a small minority). Depending on the accuracy of sorting of plastic waste at the beginning of the
stream, recycling companies perform different kind of activities for purifying plastic materials
and getting the purest stream possible of waste in terms of polymers and colours. Large part of
the quality of recycled plastic derives from the precision of this pre-processing splitting.
(Deloitte, 2017)
The next activity, purification, can be performed during sorting and in different moments of the
processing activity. It is aimed at obtaining pure flows of just one kind of plastic polymer
(removing all the impurities); often it is important to separate different plastic colours, too.
Purification and further sorting of plastic polymers by colour is performed before and during
mechanical processing. This phase is very important in post-consumer plastic recycling, since
waste is much more contaminated when collected and plastic polymers’ mix is very varied.
Main kinds of sorting techniques can be performed at sorting centres or at recycling plants, as
part of the purification process.
• Manual sorting. Usually it can be just the first step of sorting, useful for facilitating the
future automatic process. Rough contaminants are removed, and a first chromatic
division is carried out. In other cases, a basic confirmation by sight of the waste flows
is required before getting to the specific processing line.
• Optical sorting (post-grinding). Ground material is placed (automatically) in a
machine’s hermetic chamber where special cameras check the spectrum of the material.
This allows to identify remaining impurities and missorted colours.
• Flotation sorting (post-grinding). The flow of waste is immersed in a static liquid where,
according to their weight, different plastic polymers sink or float.
(Paprec Group)

32
Plastic scrap, after being sorted and packed, is bought by plastic recyclers. Within recyclers, it
is possible do distinguish between companies which recycle only industrial waste and
companies which recycle both industrial and post-consumer plastic waste. The formers rely on
direct connections with large manufacturers for ensuring a predictable volume of supply
presenting a relatively constant quality (i.e. purity), they can work with various industries
(waste origin is not of the utmost importance) and they are likely to be located near large
industrial manufacturers utilizing plastic materials, since these are suppliers of industrial plastic
waste. Post-consumer plastic recyclers are typically focused on a restricted geographic area,
thus being forced to work with local waste management companies, since those are the only
ones managing this kind of waste.
The industry is further split into two kind of recyclers. Specialised recyclers, which produce
just high quality or special kind of pellets, present a small-medium size, and need specific
suppliers; they tend to have a tailored approach, working together with their clients for
developing products complying with their requirements. On the other hand, there are larger
companies that produce more commoditized plastic materials (e.g. PET). These companies are
typically larger, since reaching the right scale is fundamental for presenting an appealing
offering to customers.
Recyclers operate a size reduction of plastic waste (shredding/grinding) and various purification
steps. They may operate extrusion and compounding, depending on their business model.
After plastic scrap has gone through a first sorting and through purification, it is washed, dried,
and directed to mechanical processing. The mechanical recycling can be split into two: primary
(mechanical reprocessing into a product with equivalent properties) and secondary (mechanical
reprocessing into products showing lower properties). Alternative terms for indicating primary
recycling are “closed-loop recycling”, as for secondary recycling is “downgrading”. It is
possible to obtain primary recycling only if polymers can be effectively purified from
contaminants. (Hopewell, 2009)
The most common process is simple and involves size reduction (pellets, flakes, or powder),
different purification steps (further removal of contaminants left), extrusion. In this process
plastic waste is grinded into flakes; flakes are melted together, then the material is pushed
towards a perforated plate and cut into pellets. Finally, it is cooled in water (“palletisation”).
During the process, before extrusion, plastic materials can be mixed (compounding) for
obtaining required product features (mechanical properties, chemical properties, specific
colours). (Hopewell, 2009)

33
Compounding involves mixing and blending different plastic polymers with chemical additives
to enhance chemical and mechanical properties of the resulting products. Mixing/blending is
performed in a molten state, usually with copolymers (e.g. PEVA, ABS) and additives such as
light and heat stabilizers, antioxidants, lubricants. (Hahladakis, 2017)
To achieve the right distribution of the various materials utilized, compounding is typically
done through extrusion: the screw transporting the resins is filled sequentially with the different
components, these are heated, melted, and pushed towards the die. The output is cooled in water
and granulated.
Players producing the final compound, need further process know-how and an effective product
development activity to be carried on together with clients for better understanding their needs
and achieving tailor-made solutions. Since compounding is the last activity performed for
recycling plastic, players carrying on this activity are the ones which directly sell only to the
final customers (plastic goods manufacturers). The compounding phase is the step that brings
customization to the product, allowing different mixes or blends, companies can create their
own proprietary products or develop new products, together with the most important customers.
Everything considered, compounding is key for avoiding commoditization, thus reaching
higher margins and lock-in customers in long term commercial relationships.
The main players involved in the activities previously described are multiutility companies
(involved in waste management), post-industrial plastic recyclers, post-consumer plastic
recyclers. Each of these players may be engaged in different steps; moreover, as it will be seen
in next chapters, the structure of this chain is evolving, with more and more players trying to
integrate backwards or forwards.
2.1.3 Chemical recycling
As alternative to mechanical processing (primary and secondary recycling), there exists tertiary
recycling either described as chemical or feedstock recycling (Hopewell, 2009). These are
general terms for describing technologies that convert plastic waste into basic chemicals. These
technologies include solvolysis, methanolysis, glycolysis and pyrolysis (Ragaert et el., 2017).
The following introduction to chemical recycling and to its influence over the plastic recycling
industry is based both on literature and the in-depth phone interview with Mr Guido
Fragiacomo, CEO of Garbo, the Italian innovation leader in chemical plastic recycling (the
company is further presented in chapter four).
Innovative technologies based on chemical reactions for recycling plastic waste have been
developed and a multitude of pilot plants is now spreading across Europe. It must be noticed

34
that industrial scalability of these technologies is not reached yet and both environmental and
economic results must be assessed.
Typically, chemical recycling processes are polymer-specific and, as of today, the greatest
attention has been focused on PET, PE, and PP. Next, the most adopted and the most promising
methods are introduced.
• Solvolysis entails the reaction of PET and specific solvents under different states.
Variations of the process are mainly based on high temperature or high pressure,
acidic/basic conditions, and solvents to split the polyester chain into two components:
terephthalic acid (TPA) and ethylene glycol (EG). Hydrolysis is a specific form of
solvolysis in which the solvent is water. Solvolysis presents two main issues: TPA
obtained has low purity and industrial processing can be very costly (in particular,
handling the substances obtained through the process).
• Methanolysis is again focused on PET regeneration. By subjecting PET waste to high
temperature, methanol, and pressure (between 20 atm and 40 atm), it is possible to
obtain ethylene glycol (EG) and (dimethyl terephthalate) DMT. Exactly like solvolysis,
methanolysis is effective in obtaining virgin polymers/monomers from plastic waste,
but it is difficult to be efficiently implemented at industrial scale because of the high
costs associated with the process.
• Glycolysis is probably the first process adopted in the chemical recycling of plastic. By
means of a chemical reaction, the PET contained in post-industrial and post-consumer
waste is selectively reacted with ethylene glycol (EG) and transformed into BHET (bis-
hydroxy-ethylene-terephthalate), an intermediate product which, if subject to a
purification process, can be reutilized for the production of PET, substituting raw
materials (in particular, PTA and EG) of fossil origin.
• Pyrolysis is a widely adopted technology, used for plastic waste that mechanical
recycling cannot handle. For example, mixed PE/PP multilayer packaging and fibre-
reinforced materials are either impossible to be mechanically recycled or far too costly.
Differently from mechanical recycling, pyrolysis can deal with highly contaminated and
highly heterogeneous plastic waste (Vermeulen, 2011). The process requires high
temperatures (500° C, in absence of oxygen). The high heat allows to fragment the
polymer’s macrostructure to obtain smaller molecules (Angyal et al., 2007).
The concept behind chemical recycling is to take plastic waste one (or more) steps back to its
original constituents. What makes the difference along the spectrum of techniques going under

35
the name of “chemical recycling” can be summarized in two features: how many steps
backwards plastic materials are taken and the cost of input.
As regard the former, glycolysis shows the best performance, since it produces BHET, an
intermediate product, easily converted into PET. Methanolysis and hydrolysis work very
differently, indeed, even though they manage to effectively treat plastic waste (PET), their
output is constituted by monomers; to get again PET from monomers (thus closing the loop)
requires a longer and more costly process than what is required for managing BHET. This
aspect is even more pronounced in pyrolysis, which brings back plastic materials to substances
near to crude oil.
Turning to inputs, pyrolysis is, by far, the most suitable process for highly contaminated
materials, along with mixed plastics, not addressed by other technologies. Glycolysis is simple
and effective, but requires high-quality, not contaminated (and thus, costly) inputs. Finally,
methanolysis and hydrolysis processes need a long pre-treatment phase, in which waste is
purified.
The output of chemical processing is not constituted by plastic polymers such as PET or PP,
but by monomers or intermediate products that should be converted into plastic products again.
This highlights the main difference between the value chain of mechanical recyclers and the
value chain of chemical recycling: final customers are very different. Indeed, mechanical
recyclers obtain recycled polymers that can be directly utilized by industrial manufacturers in
their process for producing new goods, on the other hand, chemical recyclers obtain
intermediate products (e.g. BHET, PTA, EG) that will be sold to virgin plastic producers
(players positioned one step back on the value chain with respect to industrial manufacturers).
The graph below compares the two different value chains, showing the common origin of inputs
utilized and the different customers served.

36
13. Figure 2.3 Comparison between mechanical recycling's value chain and chemical
recycling's value chain. Own Ri-elaboration
During recent years, various companies have tried to develop new technologies based on the
processes above, struggling to overcome their main issues (and the attached costs); the most
promising companies, proposing the most innovative technologies are briefly presented below.
• Garbo Srl (Italian company further presented in chapter four) enhanced the traditional
(discussed above) recycling through glycolysis by developing a state-of-the-art reactor
able to process every kind of waste (PET). With no regards to contaminants or foreign
matter, after a basic shredding, it manages to react PET selectively, obtaining BHET.
Thanks to its flexibility, the potential of this innovation is huge: it is able to greatly
extend the range of plastic waste that can be recycled (by now, the post-consumer
recycling system is focused just on recycling plastic bottles), maintaining a cost efficient
process (pre-treatment is simple and cheap, since it requires just shredding).
• Carbios, France-based, has invented a new chemical recycling process relying on
biological tools. Indeed, it utilizes enzymes for de-polymerizing a single polymer (for
example PET) constituting plastic waste. After de-polymerization, monomers obtained
need multiple purification steps before re-polymerization. Carbios’ technology is
Plastic producersIndustrial
manufacturers
3 Procurement
4 Size-reduction
5 Purification
6 Product development
7 Extrusion/Compounding
3 Procurement
4 Size-reduction
5 Purification
6 Chemical reaction
1 Collection
2 Sorting
Mechanical recycling Chemical recycling

37
particularly suitable for polyesters and polyamides (because enzymes can easily identify
them) and explicitly addresses packaging waste. Not needing advanced sorting
techniques, this process promises a better economic performance with respect to
mechanical recycling and traditional chemical recycling processes.
• Gr3n developed (in Switzerland) what they call “DEMETO” technology (De-
polymerization by Microwave Technology). The core of the process is a reactor which,
by means of microwaves and chemical agents, can bring PET polymers back to
constituent monomers. The idea behind the process is a perfect example of circular
economy, since it not only allows to indefinitely recycle PET, but also exploits by-
products of the process (i.e. chemical agents left after de-polymerization) in subsequent
processing cycles.
Concluding, chemical recycling is clearly on the edge of innovation in the plastic recycling
industry, it can offer r-plastic showing the same performance as virgin plastic and it can give
plastic goods indefinite life. Nevertheless, nowadays there are still little indications about the
scalability of these processes, since they are all at a start-up phase and they are deemed to bear
high costs associated with the sorting treatment or heavy (and negative) impact on the
environment (thus balancing the positive of limiting the production of virgin plastics).
2.1.4 Cost drivers
Key activities driving recycling cost have been subject to changes in recent times, thanks to the
megatrends described in the first chapter. They also slightly differ according to the business
model, that, in turn, varies between post-industrial plastic recyclers and post-consumer plastic
recyclers. The analysis is mainly conducted taking into consideration interviews with Italian
plastic recyclers (2019/2020), further described in chapter four.
As regard post-consumer waste, the European directive 2008/98/EC (“Waste framework
directive”), in Article 11(1), states that separate collection systems to be implemented must be
“economically practicable”. Even though in the “Guidelines on the interpretation of key
provisions of Directive 2008/98/EC on waste” it is clarified that the expression “economically
practicable” has to be taken into consideration in comparison to alternative waste management
solutions, various interpretations have been given to the Directive. In fact, European waste
collection is often run, subsidized or greatly supported by the State, since it acts for the public
benefit and it is often managed by non-for-profit organization, producing losses (as Corepla
does, in Italy). Turning to post-industrial waste, as noticed before, the collection activity is very
different. Usually the player which takes care of collection is a recycler (or a trader). In this

38
case, the higher purity of waste flow, not requiring a complex separate collection system, lowers
down the cost of performing this activity.
Overall, collection is deemed to bring high costs, but subsidies from the State neutralize its
impact.
Waste procurement’s impact has changed over last years, Chinese ban has stopped the export
from Europe, generating an oversupply for European recyclers. This phenomenon begun to
manifest from 2013, with the introduction of the “Green Fence” policy in China and reached its
climax with the “National Sword Operation” (2018) and the following limitations on export
imposed by other countries in the south-east of Asia. In particular, lower quality plastic waste
has seen its price heavily decreasing. The first sorting, dividing plastic from other kinds of
waste, is generally performed directly by households (post-consumer waste) or it is redundant
(in case of industrial production, during the processing waste is naturally sorted). However, the
next sorting and purification activities are still the most relevant activities in terms of cost,
accounting for more than 50% of direct cost of processing.
Size reduction (shredding or grinding) is fundamental in the recycling process and many players
stop here in their processing. It is an activity relying on a basic technology but, being energy-
intensive, it results in relevant (although predictable) costs. It is very similar with respect to
polymer and waste origin.
During the extrusion, the whole activity behind the development of a specific recipe is finalised.
Technology is consolidated but requires a specific know-how for obtaining high performance.
Shredding and extrusion (that may involve compounding) constitute the actual “processing” of
the industry; as we said, they are energy-intensive activities, thus their relevance depends on
the country-specific cost on energy, which can span a range of 10-15% of production cost.
Among further costs attributable to processing, machineries’ maintenance is deemed to be the
heaviest.
After that first separation, different purification activities (according to polymer type, colour,
weight) are performed along the production flow; these can be costly if the raw material utilized
is post-consumer waste of low quality (it requires more steps to be purified).
Sorting/purification activities are the main difference between post-industrial and post-
consumer recyclers in terms of cost, the latter forced to make many more steps for obtaining an
intermediate product ready for extrusion.
Within indirect activities, the costliest activity for producing recycled plastic is product
development. Indeed, most of the companies offering recycled plastic granules, offers a “tailor-

39
made” product, namely a different recipe (which is a compound of plastic materials and
additives) for each client. For specific clients and specific sectors (e.g. the automotive sector)
needing strict requirements to be satisfied, the research and the development (sometimes carried
out together with the client) may last for years. This results in high indirect costs in terms of
time and know-how utilized, thus impacting heavily on the firm.
Most critical activities driving cost have been summarized below.
14. Figure 2.4 Representation of the most cost-impacting activities of the plastic recycling
value chain. Own Ri-elaboration
Medium level of criticality
High level of criticality
2.1.5 Activities driving clients’ purchase decision
Activities driving clients’ purchase decision are those activities influencing the product’s
features that are considered of the utmost importance by customers (i.e. plastic goods
manufacturers). These activities, likewise cost drivers, are evolving following macroeconomic
trends in consumer behaviour and legislation. Before analysing which activities have the
heaviest impact on purchase decision, it is important to highlight what are the product’s features
clients care about, according to interviews conducted with Italian plastic recyclers (2019/2020).
The direct substitute of recycled plastic is virgin plastic, so this is the natural benchmark for the
industry as regard price and performance. Recent changes in legislation, pushed every
manufacturer to (or plan to) increase the utilization of recycled plastic in the production.
Notwithstanding the legislation goals in terms of recycling, final customers demand the same
product quality, regardless of its composition (recycled plastic or virgin plastic). This means
that, the first consideration made by clients is about technical (mechanical, weight, colour etc)
requirements to be fulfilled; in other terms, technical similarity between recycled plastic and
virgin plastic is paramount.
The next factor considered by clients is price. Indeed, in most cases, recycled plastic materials
follow the typical dynamics of commodity products: when basic technical requirements are
fulfilled, the most important purchase driver becomes the price. The only way to avoid
commoditization is to develop specific projects together with clients; these projects, usually
Collection Sorting ProcurementSize-
reductionPurification
Product
developmentCompoundExtrusion

40
oriented to specific industry’s high-performance requirements may take long time and need a
deep know-how in recipes and processing.
For being able to offer these elements, two activities become very influent. The first one is
procurement: since processing is quite standard, the way for offering recycled products at lower
price is achieving cheap procurement; this results from market trends and relationships with
suppliers. Procurement is also very important in terms of quality: in fact, quality of final
products and the economic sustainability of processing are largely driven by inputs’ quality (i.e.
plastic waste).
The second very important activity is product development, including product and recipe
development and conjoint projects with clients. It is key to avoid commoditization, to charge
higher prices, to match virgin plastic features, thus establishing long-term business relationships
with clients.
To match qualitative features of virgin plastic, purifying raw materials used as input is key.
This is the area in which plastic recyclers always strive for keep up with technological
development of the industry.
Most important activities to be carried on for fulfilling clients’ expectations (as depicted above)
are highlighted below.
15 Figure 2.5 Representation of the activities of the plastic recycling value chain which
mostly affect clients’ purchase decisions. Own Ri-elaboration
Medium level of criticality
High level of criticality
2.2 Plastic recycling industry’s competitive environment
For a deeper understanding of the competitive dynamics of the plastic recycling industry, the
Porter’s Five Forces framework has been applied. The framework will assess the competition’s
state in the industry and how this influences its attractiveness. The focus is global, but some
western Economies’s trends are pointed out, when needed, because of their relevant magnitude.
Collection Sorting ProcurementSize-
reductionPurification
Product
developmentCompoundExtrusion

41
2.2.1 Analysing the competitive environment: Porter’s Five Forces
As Porter perfectly outlines, a fundamental factor determining a firm’s profitability is its
environment. The key aspect of the environment in which the firm operates is its industry, and
the competition dynamics rooted in it. Industry’s attractiveness is defined by five forces shaping
competition dynamics: the entry of new competitors, the threat of substitutes, the buyers’
power, the suppliers’ power, the rivalry among existing firms. The intensity of these forces
differs from industry to industry, and may evolve over time, impacting the elements of
profitability – prices, costs, required investments. (Porter, 1985; Porter, 2008)
The strength of one of the five forces depends on the industry structure’s characteristics.
Industry structure is reasonably stable but may be affected by structural shifts, paradigm
change; that is why the most important trends, from a strategical point of view, influence the
industry structure.
The Porter’s five-forces framework enables firms to manage industry’s complexity and identify
the strategic changes which can improve their profitability the most. This derives from
understanding firm’s strengths and weaknesses, as well as its strategic positioning.
16. Figure 2.6 Porter Five Forces. Source: Porter, 1985
Rivalry determinants• Industry growth• Commitment to the leadership• Number of competitors• Exit barriers• Differentiation• Products’ perishability
BUYERSSUPPLIERS
NEW ENTRANTS
SUBSTITUTES
INDUSTRY COMPETITORS
Threat of new entrants
Bargaining power of buyers
Threat of substitutes
Bargaining power of suppliers
Intensity of rivalry
Entry barriers• Supply-side scale economies• Demand side scale economies• Customer switching costs• Capital requirements• Access to distribution• Incumbent advantages• Regulations• Retaliation
Determinants of buyer power• Buyer concentration• Standardization• Buyer switching costs• Ability to backward integrate
Determinants of supplier power• Differentiation • Switching costs• Absence of substitutes• Threat of forward integration• Suppliers concentration• Weak dependence on the
industry for revenues
Threat of substitution• Relative price performance• Accessibility• Propensity to substitute

42
2.2.2 Porter’s Five Forces driving plastic recycling industry
Based on the interviews carried out with important players of the Italian plastic recycling
industry, a score from 1 to 5 is assigned to every constituent of each of the five forces. The
resulting score for each of the five forces is the average of the scores assigned to its constituents.
The final outcome will be the average of the scores assigned; note that the lower the final rating,
the higher the attractiveness. Moreover, in the following pages, the aspects that are on the edge
of change following powerful global trends are highlighted.
2.2.2.1 Threat of new entrants
New competitors joining the industry bring additional pressure on prices, costs, and
investments, due to their battle for gaining market shares. This pressure is especially heavy
when newcomers enter in the industry as a result of a diversification process, because they can
leverage assets and skills already existing. If the threat of entry is high, incumbents are forced
to keep prices low and to continue investing for deter other firms to join the industry, thus
limiting the profits.
There are two factors that contribute to the threat of new entrants: barriers to entry and (1)
expected retaliation. The former is split into (2) supply-side economies of scale, (3) demand-
side benefits of scale, (4) customer switching costs, (5) capital requirements, (6) incumbency
advantages independent of size, (7) unequal access to distribution channels, (8) restrictive
government policy (Porter, 2008). The strength of the force is inversely related to the barriers
above mentioned.
In the plastic recycling industry, threat of new entrants is quite weak since important
investments, authorisations for operating and specific process know-how are needed.

43
17. Figure 2.7 Threat of new entrants. Own Ri-Elaboration
3. Table 2.1 Threat of new entrants. Own Ri-Elaboration
In particular, the most relevant factor is the incumbents’ advantage: a deep process know-how
(and qualified workforce) is required for successfully operating in this industry. Indeed, for
mastering own recipes and avoiding unplanned (and costly) downtimes, firms need experience
and must rely on qualified workforce (employed in production and laboratory). Since the
industry is still young and relatively small, finding the right employees is assessed to be
difficult.
Plastic recycling, as every kind of recycling, is heavily regulated: authorisations are needed for
managing waste and operating a facility in a specific area. According to most respondents,
getting these authorisations may require even more than one year.
012345
Supply-side scale economies
Demand-side scale
economies
Customer swithcing costs
Capital requirements
Incumbency advantages
Access to distribution
channels
Regulation
Retaliation
Threat of new entrants
Threat of new entrants
Supply-side scale economies 1,5
Demand-side scale economies 3
Customer swithcing costs 2,5
Capital requirements 1,5
Incumbency advantages 1
Access to distribution channels 2,5
Regulation 1,5
Retaliation 2,5
Average 2,0
Strenght Weak

44
The third aspect to be considered in assessing the relevance of entry barriers is the scale. The
most important clients require huge and consistent volume of supply, thus forcing new players
who want to be competitive to get into the plastic recycling industry equipped with relevant
production capacity. Machineries and spare parts needed (spare parts are very relevant, since
this process makes machineries subject to quick deterioration) are a significant investment for
potential new entrants.
2.2.2.2 Threat of substitutes
Alternative products (or services) which can offer the same benefits to buyers, are called
“substitutes”. They may be overlooked because they do not seem directly related to the
industry’s product (e.g. videoconferencing as a substitute for travel). Substitutes can undermine
industry’s profitability by enlarging the range of competitors. (Porter, 2008)
Threat of substitutes is measured by (1) the relative price performance of products, (2) the
switching cost burden and (3) their accessibility.
The immediate substitute for recycled plastic is virgin plastic.
18. Figure 2.8 Threat of substitutes. Own Ri-Elaboration
4. Table 2.2 Threat of substitutes. Own Ri-Elaboration
012345
Relative price performance
Propensity to substituteAccessibility
Threat of substitutes
Threat of substitutes
Relative price performance 3
Propensity to substitute 2
Accessibility 5
Average 3,3
Strenght Strong

45
Every consideration about recycled plastic is carried on taking virgin plastic as benchmark.
Taking into consideration mechanical, chemical, and aesthetical performances, virgin plastic is
superior, but it has to be noticed that state-of-the-art recycling leads to results that are closer
and closer to those of virgin plastic. In fact, excluding some particular applications (aerospace
industry or pharma industry), r-plastic manage to reach every sector.
Historically, r-plastic’s price has always been inferior to virgin’s, but it has to be noticed that
the picture is changing. Indeed, thanks to the new consumer perception of environment-friendly
products and regulation’s pushing towards the adoption of recycled materials, last year, some
polymer of recycled plastic has surpassed their virgin counterparts, in price.
Accessibility of substitutes is very high, since supply of virgin plastic is massive in every
country, thus pushing the link (with respect to price and performance benchmarking) between
virgin and recycled plastic.
Propensity to substitute recycled plastic is assessed low. More, the opposite holds: regulation
forcing producers to utilise a set percentage of recycled plastic in their process, is making
substitute virgin plastic with recycled materials.
2.2.2.3 Bargaining power of suppliers
Powerful suppliers can erode margins by charging high prices or limiting quantity; this results
in a serious profitability issue if industry participants are not in the position for charging in turn
high prices to their clients.
Constituents of suppliers’ power are: (1) suppliers’ concentration, (2) weak dependence on the
industry for revenues, (3) switching costs, (4) differentiated offer, (5) availability of substitutes,
(6) credibility of forward integration (Porter, 2008).
Power of suppliers (i.e. waste management companies, plastic waste traders and waste
producers) is assessed as medium-low, overall. The assessment takes into consideration marked
differences between post-industrial recyclers and post-consumer recyclers.

46
19. Figure 2.9 Power of suppliers. Own Ri-Elaboration
5. Table 2.3 Power of suppliers. Own Ri-Elaboration
In particular, the weak dependence on the plastic recycling industry for revenues is a remarkable
advantage for suppliers. Indeed, suppliers can be divided into two main groups: post-industrial
waste suppliers and post-consumer waste suppliers. The formers clearly do not look at their
waste as a primary source of income, the latter are usually quasi-monopolist relying on
country’s subsides for integrated their revenues.
Suppliers’ strength may differ on the basis of the specific polymers considered. Indeed, lack of
differentiation in product offerings and the oversupply situation cause by the Chinese ban on
import, place, at least temporarily, western post-consumer waste suppliers (e.g. Corepla, in
Italy) in a position of weakness. On the other end, specific polymers’ scrap (e.g. polyamide)
originated by the processing activity of industrial manufacturers presents limited availability.
This limited availability imposes specialized recyclers to establish long term relationships with
their suppliers.
012345
Suppliers' concentration
Weak dependance on the
industry for revenues
Switching costs
Differentiation
Absence of substitutes
Credibility of forward
integration
Power of suppliers
Power of suppliers
Suppliers' concentration 3
Weak dependance on the industry for revenues 4,5
Switching costs 2,5
Differentiation 1,5
Absence of substitutes 1,5
Credibility of forward integration 2
Average 2,5
Strenght Medium

47
It is worth to notice the trend of multiutility companies forward integrating towards plastic
recyclers for enhancing margins and reputation. Notwithstanding this trend, the threat of
forward integration is not perceived by players in the industry; moreover, multiutility
companies are not the only suppliers to deal with.
2.2.2.4 Bargaining power of buyers
Similarly to suppliers, strong buyers can squeeze profitability by forcing prices down or
requiring higher quality products (or services), thus increasing costs.
Buyers have bargaining power if: (1) they are concentrated, (2) products they buy are
standardized, (3) they face low switching costs, (4) they can credibly threat backward
integration (Porter, 2008).
20. Figure 2.10 Power of buyers. Own Ri-Elaboration
6. Table 2.4 Power of buyers. Own Ri-Elaboration
In the plastic recycling industry, the first three aspects (buyers’ concentration, standardization
of products and switching costs) are linked together. Indeed, recyclers choose to offer
standardized or tailor-made products. If they opt for the latter, they incur in high fixed costs for
012345
Buyers' concentration
Standardization of products
Switching costs
Credibility of backward
integration
Power of buyers
Power of buyers
Buyers' concentration 2
Standardization of products 2,5
Switching costs 3
Credibility of backward integration 2
Average 2,4
Strenght Medium-low

48
product developing but they can leverage the time necessary for the development and the
specific performance features obtained for tying up customers in long-term business
relationships (i.e. switching costs are high). The downside of this choice is that, after having
channelled so much time and money for developing a product, recyclers tend to increase the
volume of supply towards that specific customer, thus increasing buyers’ concentration and
further increasing switching costs.
On the other hand, if recyclers choose to produce standardized products, their link with specific
clients fades away (decreasing the risk of clients’ concentration) but the burden of high
switching costs (for buyers) vanish as well. The entire equilibrium between risk and profitability
stands on managing to acquire skills and practices which enable to develop a customized
product for each client, maintaining a cost-efficient approach.
Overall, it appears that the most competitive players have managed to adopt practices above
mentioned, thus heavily reducing buyers’ power.
2.2.2.5 Degree of rivalry among existing competitors
Cap on profitability may derive also from a fierce rivalry among incumbents, through price
cuts, product/service improvements and the launch of new products.
Rivalry among existing competitors is high if: (1) industry growth is weak, (2) number of
competitors is high (or they are equal size), (3) exit barriers are high, (4) products lack of
differentiation, (5) high commitment in getting the leadership, (6) capacity needs to be
expanded by large increments, (7) products’ perishability (Porter, 2007).
21. Figure 2.11 Rivalry among existing competitors. Own Ri-Elaboration
012345
Industry growth
Commitment for getting the
leadership
Number of competitors
Exit barriers
Products' lack of
differentiation
Product's perishability
Rivalry among existing competitors

49
7. Table 2.5 Rivalry among existing competitors. Own Ri-Elaboration
As shown in the previous pages, industry is growing and is projected to grow faster during next
years. This will help in keeping low internal rivalry. Products are not perishable and when there
is the possibility of customizing the r-plastic offering (avoiding standardization), price
competition can be overcome.
2.2.2.6 Conclusions
The overall assessment of the five forces driving plastic recycling industry’s attractiveness is
summarized by the graphs below.
22. Figure 2.12 Five forces analysis' results. Own Ri-Elaboration
Rivalry among existing competitors
Industry growth 1,5
Commitment for getting the leadership 2
Number of competitors 3
Exit barriers 4
Products' lack of differentiation 2,5
Product's perishability 1
Average 2,3
Strenght Medium-low
Rivalry determinants• Industry growth• Commitment to the leadership• Number of competitors• Exit barriers• Differentiation• Products’ perishability
BUYERSSUPPLIERS
NEW ENTRANTS
SUBSTITUTES
INDUSTRY COMPETITORS
Threat of new entrants
Bargaining power of buyers
Threat of substitutes
Bargaining power of suppliers
Intensity of rivalry
Entry barriers• Supply-side scale economies• Demand side scale economies• Customer switching costs• Capital requirements• Access to distribution• Incumbent advantages• Regulations• Retaliation
Determinants of buyer power• Buyer concentration• Standardization• Buyer switching costs• Ability to backward integrate
Determinants of supplier power• Differentiation • Switching costs• Absence of substitutes• Threat of forward integration• Suppliers concentration• Weak dependence on the
industry for revenues
Threat of substitution• Relative price performance• Accessibility• Propensity to substitute

50
8. Table 2.6 Five forces analysis' results. Own Ri-Elaboration
As shown by the table above, the most relevant force impacting on the industry is the threat of
substitutes, but competition with virgin plastic seems about to be overcome, because of
regulation pushing to substitute part of virgin plastic utilized in production with recycled plastic.
Overall, the industry does not show particular weaknesses in this period, since demand is high
(thanks to new European legislation) and supply is massive (following the Chinese import ban);
moreover, the power of buyers can be limited by investing in developing tailor-made products.
Authorisations required for operating in this industry, along with heavy initial investments and
scarcity of qualified workforce, help in maintaining sufficiently high barriers to entry.
The overall intensity of the five forces is assessed as medium and it is projected to loosen in the
next future.
2.3 Plastic recycling industry: SWOT analysis
The SWOT analysis (S-strengths, W-weaknesses, O-opportunities, T-threats) came to light
during 1960’s thanks to studies among which we can find the research at SRI International (led
by R. Stewart), aimed to examine in depth the strategic planning process of Fortune 500
companies. (Humphrey, 2005)
SWOT analysis is a tool deployed by organizations for strategic planning, over the years it has
been widely utilized for industry analysis, too.
Every organization is analysed by two points of view: external and internal. Opportunities and
threats are external factors related to the environment in which the organization operates,
strengths and weaknesses are internal factors related to the organization itself. External
opportunities and threats refer to technological, competitive, economic, political, social, and
legal trends; internal strengths and weaknesses can be related to the product/service offerings,
the financial structure, the competitive position, the strategic assets etc. (Gurel, Tat, 2017)
Porter's five forces
Threat of new entrants 2,0
Threat of substitutes 3,3
Power of suppliers 2,5
Power of buyers 2,4
Rivalry among existing competitors 2,3
Average 2,5
Strenght Medium

51
23. Figure 2.13 SWOT analysis’ framework. Source: Gürel, Tat, 2017 (Own Ri-Elaboration)
In the context of this paper, the SWOT analysis is performed for identifying the most important
trends underlying plastic recycling industry and the drivers behind recycled plastic demand.
Keeping the focus on most developed countries (in terms of recycling), this framework
highlights the relevant strengths and weaknesses of recycled plastic underlying the competition
versus virgin plastics. Moreover, it glances at future developments which can boost demand for
recycled plastic or that can create difficulties to the industry.
2.3.1 Strengths
Utilizing recycled plastics present advantages in terms of environmental protection and cost.
Our planet is resource constrained and our current lifestyle in unsustainable, both in terms of
consumption and in terms of the production processes we rely on. This is the reason why the
global economy is shifting from a linear model (production-use-dispose) to a circular one
(production-use-recycling) and plastic recycling is certainly an appropriate example of this
trend. Producing one ton of plastic through recycling is estimated to save about 16 oil barrels,
5.774 Kwh of energy and 23 m3 of landfill area (Stanford, 2019).
Comparing air pollution caused by production of virgin plastics with that deriving from the
production of recycled plastic, it can be shown the great impact recycling has; depending on
the specific polymer, saving in direct emission of greenhouse gas range from three quarters to
nine tenths (Deloitte, 2015).
Another important aspect to consider is the price of recycled plastic: at least up to now, recycled
plastic has been cheaper than virgin plastic. As regard this aspect, it can be noticed that during
2019, price of some polymers of recycled plastic soared (driven by new consumers’ sentiments
about environmental protection and circular economy). (Milner and Brooks, 2019)
STRENGHTS WEAKNESSES
THREATSOPPORTUNITIES
SWOT
INTERNAL FACTORS
EXTERNAL FACTORS

52
2.3.2 Weaknesses
Recycled plastics present three specific weaknesses that could harm its adoption. First, not
being completely pure, they do not always meet performance requirements met by virgin
plastics. Takatori (plastics covered by his research are PP and ABS) points out a set of
performance’s issues comparing recycled plastics with virgin ones: oxidative degradation
(exposure to sunlight deteriorates plastics in general), impact strength, bending strength and
tensile strength (Takatori, 2014). This can limit r-plastics demand in some sectors requiring
high performance (such as high tech, food, or pharma).
The problem abovementioned is exacerbated by the progressive deterioration of mechanical
properties as the material is repeatedly recycled (Oblak, 2016). It is clear that limiting the
number of recycling cycles a material can go through, poses difficulties as regard the
substitution of virgin plastics with r-plastics.
Lastly, supply of raw material (i.e. plastic scrap) is not accessible in every part of the world.
Indeed, as we have seen in the previous sections, waste management is not equally developed
everywhere.
2.3.3 Opportunities
Plastic recycling’s path is clearly linked with plastic production and plastic demand. Estimates
by EMF were presented in chapter one, assessing that plastic production will quadruple by
2050. Moreover, global plastic demand is forecast to growth by 4% per annum in the period
between 2017 and 2025 (Grand View Research estimates). It results that the plastic industry is
still on a growing trend (despite the rising of recycling), this will drive up the demand for all
kind of plastics, including recycled plastics.
Consumers’ awareness of the environmental issues posed by virgin plastic production and
consumption is rising (as exhibited in Chapter 1). Studies (Cude B., 2007) has proved a clear
consumers’ preference for products made by recycled materials (the study indicated highlights
a 64% preference for the recycled plastic products).
While consumers are striving to be protective to the Planet, they have the same expectations
from companies. Nielsen’s 2015 study confirmed this trend, showing that not only 66% of
consumers state they are willing to pay more for sustainable brands (as shown in the paragraph
above). Moreover, this point is proven by the market: consumer goods brands’ revenues have
grown around 4% globally for companies showing a strong commitment to sustainability, while

53
others’ grown less than 1%. The combination between consumers’ attention for the
environment and companies catching this sentiment, is expected to boost (among others)
recycled plastic demand.
Last, the third actor in this industry: the governments. Authorities realized the imminent issue
posed by excessive plastic consumption and they are taking decisive actions for addressing it.
China (followed by India and various countries of southeast Asia) banned imports of plastic
waste from 2018. Considering that, until the ban, China alone was the destination of more than
50% of total plastic scrap exported globally, it results clear that the problem posed is serious:
western countries do not have the capacity for handle the whole amount of plastic waste they
previously exported. Although it is true that this can be a problem in the short run, it is arguable
that Chinese ban forces western countries’ recycling industries (among which plastic recycling
industry) to rapidly grow. The abundance of plastic waste remaining in western countries (and
previously exported) gives recycling companies availability of cheap raw materials and the
chance to grow further, thanks to a swift growth of the market.
2.3.4 Threats
In this document, plastic recycling mainly refers to “mechanical plastic recycling”, that is the
processing method which has consolidated during decades and on which this industry relies. As
discussed previously in this chapter, during the last years, a particular set of technologies have
developed (they already existed, now they are gaining popularity and impact), these new
technologies go under the name “chemical recycling”. Chemical recycling technologies have
in common the aim of leading back plastic waste to its chemical constituents (monomers).
Notwithstanding the fact that the full potential of this innovation is yet to be proven and the
roll-out at industrial stage of these technologies is expected to take five to ten years, plastic
recycling industry will have to face this disruptive innovation, eventually. The introduction of
such a different technology would require drastic changes from current players (Ragaert K. et
al., 2017). As highlighted before, this kind of technologies presents the advantage of indefinite
recycling cycled and the possibility of processing plastic materials that are usually avoided by
mechanical recyclers (e.g. highly contaminated goods). This could lead to create a
complementarity between the two systems, with chemical recyclers processing just plastics
waste that cannot be recycled through mechanical processing. As of today, the main advantage
of mechanical recycling versus chemical recycling is cost, since the latter has not proven to be
economically viable, yet.

54
Recycled plastics can be challenged by substitute materials, an example of substitute materials
which started to be developed in the effort to fight against plastic pollution is biodegradable
plastic. The term indicates plastic made by petrochemical feedstock combined with chemical
additives that attract microbes which break the plastics down. They are an alternative to single
use plastic and, since they do not need recycling, they reduce production of plastic waste (raw
material for the recycling industry). Overall, they can be an alternative (than recycling) solution
to plastic pollution, thus being a threat for this industry. It has to be notice that, biodegradable
plastics are currently posing issues as regard end-of-life waste management, since they require
special treatments and not always guarantee the required level of performance. (Narancic, 2018)
2.3.5 Conclusions
Plastic recycling industry is in turmoil; mega trends in regulation, consumer perception,
consumption habits and corporate commitment in safeguarding the environment generate rapid
development in the industry and boost the demand for recycled plastics. The shift towards
circular economy represents the main strength of recycled plastics, even though there is still the
need of virgin plastic polymers, since they guarantee better performance in some technical
products. The most important threat to the status quo of this industry is disruptive innovation
(chemical recycling) requiring pivotal changes in production process and paving the way for
the entry of new players.
24. Figure 2.14 SWOT analysis' results. Own Ri-Elaboration
2.4 Plastic recycling industry analysis: results
From the application of these three major industry analysis frameworks, the favourable position
of the plastic recycling industry stands out markedly.
STRENGHTS
• Natural resources saving
• Lower cost with respect to virgin plastic
• Pollution avoidance
WEAKNESSES
• Lower performance with respect to virgin plastic
• Every time plastic is recycled, it becomes less pure
• In most of the World, waste supply is not
developed
THREATS
• Disruptive technologies (chemical recycling)
• Plastic substitutes (e.g. biodegradable plastics)
OPPORTUNITIES
• Growing global plastic demand
• Eco-friendly trend among consumers
• Attention to CSR by companies
• Regulatory development
SWOT
INTERNAL FACTORS
EXTERNAL FACTORS

55
Both trends in supply and demand turn out favourably for plastic recycling. As regard supply,
we noticed the changes in European legislation, pushing for product design conceived for future
recycling, thus facilitating recyclers’ tasks. Furthermore, the Chinese ban on import generated
an oversupply of plastic scraps, thus lowering prices for some materials for plastic recycling.
This eases the procurement phase, which, as explained in 2.1.4 is the heaviest activity driving
cost of production.
Demand shows positive developments, too. Plastic demand has been on a growing path for
years and it is about to be boosted by recent regulation changes, as the recent European
directives, setting ambitious goals as regard recycled plastics utilization. The result is a
weakened position of buyers since they are required to progressively (but rapidly) shifting form
virgin plastic to recycled plastic; buyers can realistically threat plastic recyclers with backward
integration.
Consumers’ growing interest for environmentally sustainable products (requiring recycled
plastics) together with legislative boundaries trying to limit the use of virgin plastics, acts to
prevent the most immediate threats and to overcome the greatest weaknesses.
Purer inputs and process know-how, together with technology advancements prove
fundamental for matching qualitative features of virgin plastics, that are the obvious benchmark
for the industry. Moreover, if size-reducing activities produce flakes or granules that are
perceived as commodities on the market, managing to compound these recycled materials in
customized blends is the way to escape commoditization. Indeed, mastering the compounding
activity allow recyclers to develop tailored blends of plastics (and additives) together with the
clients, thus differentiating their products, establishing stronger relationships with their clients
and, eventually, rising prices. This suggests competitive advantages and higher margins for
those players having integrated downwards.
At a glance plastic recycling industry enjoys strong positive trends both on demand and supply,
thus presenting a promising future. Activities performed along the value chain are quite
standard (both in process and technology applied); profitability is suggested to be concentrated
on the end-side of the value chain, where extruders and compounders operate.

56

57
3. The Italian case: overview of plastic recycling industry and market
In this third chapter the focus is narrowed, since industry analysis is brought from a global
perspective to a country-based perspective, assuming the Italian plastic recycling industry as
subject. In subchapter 3.1, the historical and the current state of plastic recycling in Italy will
be introduced, and the main issues encountered will be presented thanks to the interview
conducted with the president of the national association of plastic recyclers (Assorimap), Walter
Regis.
The second part of this section (3.2) addresses financial statement analysis of the most relevant
plastic recycling companies of the country, clustered according to their degree of vertical
integration.
The goal of this chapter is to shed light on Italy-specific features and to compare findings from
the literature and interviews-based industry analysis performed in chapter two with feedbacks
from financials of Italian companies.
3.1 Plastic recycling in Italy
Plastic recycling in Italy has been relevant for years; indeed, Italy is one of the most developed
countries in Europe in this field. Recycled plastic finds massive application in important sectors
such as packaging and construction, which are both sectors where the share of recycled plastic
utilized is rising.
The goals set by the European Legislator imposed stricter discipline and new challenges for the
Italian recycling system. This system has its own specificities, relying on consortia established
by the State.
In the next pages, the current state of Italian plastic recycling system will be shown, and its
market developments will be discussed.
3.1.1 Italian market overview
In 2018, the Italian plastic industry closely followed the trend of the whole country’s economy,
exhibiting a contraction in the last period of the year and registering just a limited growth,
overall.
Plastic demand in Italy accounted for nearly 14% of total European demand (converters’
demand estimated by Plastics Europe, 2019), reaching 7,17 million tons in 2017, namely the
second largest share in Europe, after Germany. The most important sectors of application are
packaging, construction and furniture, agriculture.

58
Packaging (flexible and rigid) is the largest sector of application for plastic materials. In 2018,
in Italy, there were nearly 3.000 firms operating in this sector, generating a turnover of €12
billion (+1,2% with respect to 2017). Export reached 40% of total packaging production.
Comparing 2018 with 2017, volumes are stable at 3,11 million tons, but there has been a partial
replacement of virgin polymers with recycled plastics: the latter grew by 6% reaching a total
10% share in the Italian packaging sector. As regard flexible packaging, main uses are food
contact and industrial packaging, application exhibiting a large employment of polyethylene
and polypropylene; turning to rigid packaging, it is utilized for bottles and personal care and
for applications requiring a larger diversification of materials utilized, but PET use is
predominant (40%). (Unionplast, 2019)
25. Figure 3.1 Plastics application in the Italian packaging industry, breakdown by
packaging type, 2018. Source: Unionplast, 2019
Construction and furniture sectors group together over 1.200 firms, accounting for € 1,35 billion
of turnover originated by plastic products (nearly equal to 2017). Export share is stable, too
(nearly 32%), while volumes have grown by 20.000 tons, reaching 1,23 million tons in 2018.
Recycled polymers find a much larger employment here, accounting for 28% of the total
plastics in this sector. The largest share of plastic production for the construction sector is
attributable to pipes (mostly HDPE), section bars (PVC) and insulating materials (usually made
of polystyrene). Turning to furniture, it can be noticed that the market is very mature, and this
reflects on sales, not being growing in recent years; most important goods are outdoor and office
furniture, employing mostly polypropylene. (Istituto per la promozione delle plastiche da
riciclo, Unionplast, 2019)
In Italy, the third sector of application for plastic materials is agriculture. Over last years, this
sector has suffered international competition; year 2018 continued along this path, with a slight
70%
7%
23%
Primary
Secondary
Tertiary

59
decline to €640 million turnover, lower margins and lower export. Of the total 220.000 tons of
plastics employed, 17% is recycled plastic (37.400 ton); recycled plastic finds consistent
utilization in all the three main goods produced for this sector: film (polyethylene), irrigation
pipes (PVC and HDPE), crates (HDPE). (Istituto per la promozione delle plastiche da riciclo,
Unionplast, 2019)
According to Ecocerved’s data, the volume of recycled raw materials (“secondary raw
materials”) produced in Italy from plastic waste (namely plastic waste shredded/grinded and
extruded) amounts to 896.000 tons in 2017, highlighting a 9,7% increment since 2014. Within
this amount, 40% is constituted by packaging. (Fondazione per lo sviluppo sostenibile, 2019)
Demand (volume) of industrial manufacturers (players immediately following recyclers
performing extrusion/compounding in the value-chain depicted in chapter two) for recycled
plastic has been growing during the period 2016-2018 by a CAGR of 4,5%, according to
Unionplast’s report (Unionplast, 2019), reaching 1,125 mln tons in 2018. As shown in the graph
below, plastic recycled from post-consumer waste accounts for 71% of the total demand (as of
2018); moreover, post-consumer’s share is slightly gaining relevance thanks to the Chinese ban.
Indeed, before the ban, post-consumer plastic waste was the main target of export towards
China and the ban resulted in an immediate increase in supply of this materials.
26. Figure 3.2 Breakdown of recycled plastic demand (volume) by Italian manufacturers,
2018. Source: Unionplast, 2019
In an effort to estimate the value of Italian industrial manufacturers’ demand, a bottom-up
approach has been adopted. Main Italian plastic recyclers have been identified in 98 firms
operating in the country (see chapter 3.2.1 for details about the panel’s construction). These
firms have been grouped (when possible) according to their activities and degree of integration
68% 69% 71%
32% 31% 29%
2016 2017 2018
Post-industrial
Post-consumer
1,030 mln tons 1,090 mln tons 1,125 mln tons

60
and their revenues were observed. Within the group, the interest was on companies performing
extrusion/compounding because these companies are the direct suppliers of industrial
manufacturers requiring recycled plastic raw materials, thus their turnover is deemed to be a
proxy for industrial manufacturers’ demand. This proxy presents some caveats: players not
focused on extrusion/compounding may be dedicating a minor part of their business to these
activities; on the flip side, also extruders and compounders may present a little revenues’ stream
originated from the selling of shredded plastic waste; trade balance is not considered.
Estimated demand’s value results on a steep growing path, presenting a compound annual
growth rate of 12,4% in the period between 2016 and 2018, reaching €636 mln in the last year.
27. Figure 3.3 Estimated recycled plastic demand in Italy. Own estimation based on the
companies identified in chapter 3.2.1
Italy’s export of plastic scrap is relevant, since it is the twelfth country in the world for trade
value of its exported plastic waste. However, it is important to highlight the imbalance between
import and export, as exhibited in the table below.
9. Table 3.1 Summary of plastic scraps import and export, Italy, 2016-2018. Source: UN
Comtrade, 2019
503566
636
0
100
200
300
400
500
600
700
2016 2017 2018
€ m
ln
CAGR 12,4%
Italy 2018 2017 2016
$.000
Import 109.447 113.798 103.880
Export 75.946 75.171 59.585
Delta (33.501) (38.626) (44.294)

61
3.1.2 The current state of recycling
Following the direction pointed out by European legislation, plastic recycling in Italy is focused
on plastic packaging, which, as illustrated above, is the main application for plastic materials.
The country has made great progresses over the last decade, being at the forefront of European
recycling. Plastic packaging recycling has reached 1.020 kilotons in 2018, that account for an
increment of nearly 45% with respect to 2009; this means a recycling rate equal to 45% (it
places Italy at the third position in Europe in terms of recycling rate, after Germany and Spain).
Nevertheless, there is still room for improvement since European goal is set at 50% for 2025
and 55% for 2030. (Fondazione per lo sviluppo sostenibile, 2019)
Additional challenges for Italy will be posed by the single-use plastic European directive, in
terms of technology and organizational system. This Directive aims at establishing a minimum
utilization rate of recycled plastic for bottles below 3 litres capacity (25% by 2025, 30% by
2030). (EU Directive 2019/904)
One of the most important metrics for evaluating recycling efficiency is the recycling yield,
calculated as the ratio between the secondary raw materials obtained after processing and the
waste utilized as input (in kg). Plastic shows a noticeable recycling yield of about 80%, lower
than paper’s yield (92%), but higher than glass and wood. (Fondazione per lo sviluppo
sostenibile, 2019)
For managing the process flow of this industry and obtaining the maximum benefit for the
community, the State pushed for the creation of a system including private companies,
consortia, and municipalities. The conjoint action of these entities sets out the following supply
chain, specific of Italy; its peculiarity is the role of Corepla, that will be discussed in chapter
3.1.3.

62
28. Figure 3.4 Industrial structure of the Italian plastic recycling system. Own Ri-Elaboration
on information from Fondazione per lo sviluppo sostenibile, 2019
3.1.3 Corepla
Italy has been among the pioneers in this industry. Indeed, the development of the plastic
recycling industry begun already during the Sixties, initially addressing industrial waste. The
industry has grown over following decades, getting to the 21st century at the forefront of plastic
material recovery and machineries design. (Corepla, 2019)
During Nineties, the ancestor of Corepla, the Replastic consortium, has been established by the
Italian government, with the aim of dealing with liquid containers recycling (i.e. post-consumer
recycling). In 1997, thanks to d.lgs 22/97, Corepla (“National Consortium for the Collection
and Recycling of Plastic packages”) replaced Replastic as part of the “Conai system”, a non-
for-profit entity in charge of managing and/or organizing waste collection and sorting in the
country. As of 2018, 7.231 Italian municipalities have signed the agreement with Corepla, this
means that as much as 91% of country’s municipalities (95% of citizens) are involved in this
system. (Corepla, 2018)
HouseholdsMunicipalities or
delegated entities
Collection
platforms
Sorting
centres
Recycling
companies
Industrial
manufacturers
COREPLA

63
The consortium is financed by the “environmental contribution Conai” and by the proceeds
from selling post-consumer waste (sold through online auctions). Its goals, addressing all kind
of plastic packaging being utilized in Italy, are listed below:
1. Supporting municipalities in implementing best practices for plastic waste collection,
through the design of services and the economic compensation for the cost borne.
2. Guaranteeing that plastic packaging waste will be directed to sorting centres, where it
can be properly prepared for recycling.
3. Providing free collection platforms for firms not covered by the municipal system.
4. Educating households, institutions and companies to proper recycling practices, and
sustainable consumption habits.
Corepla involves in the activities of the consortium all the players operating along the plastic
packaging value chain: importers/producers of raw plastic material (that will be utilized for
packaging production), plastic packaging producers, auto-producers of plastic packaging (and
importers of plastic packaged goods), plastic recyclers (post-consumer). Players’ involvement
is different among different player categories, taking into consideration that the Law assigns
the responsibility of plastic waste generation just to plastic packaging producers (the first two
categories listed), thus committing these firms to adhere to Corepla consortium. (Corepla, 2019)
According to d.lgs. 152/2006, if not joining an alternative system envisaged by the law, players
indicated above are obliged to become part of the consortium; number of consortium’s members
(as of 2018) are displayed below. (Corepla, 2019)
29. Figure 3.5 Members of Corepla’s consortium, 2019. Source: Corepla, 2019
64 84 111
2.323
0
500
1.000
1.500
2.000
2.500
Auto producers of
plastic packaging
Raw plastic material
importers/producers
Plastic recyclers
Plastic packaging
producers

64
Corepla, using the economic resources gathered through the Environmental Contribution Conai
and the sale of plastic waste, instructs sorting centres to properly manage collected plastic
waste, operating the first separation between polymers (and, if possible, colours). Through the
years, Corepla pushed for enhancing technical capabilities of these centres, for example by
requiring the utilization of optical detectors, thus reaching the goal of obtaining as many as
fifteen separated streams of waste (extraordinary result, in Europe). Sorting centres are
unequally distributed over the country, both in terms of capacity and number. In 2018, Corepla
have been managing 33 centres, spread as follows.
30. Figure 3.6 Geographic location of Corepla's sorting centres. Source: Corepla, 2019
Among duties of Corepla there is making collection platforms available for private entities: it
manages or collaborates with 103 companies, divided in PIA (collecting packaging from
commercial and industrial activities), PIFU (managing drums and tanks) and PEPS (taking care
of expanded polystyrene). PIA, PIFU and PEPS constitute Corepla collection system for
industrial companies.
It is important to notice that the Corepla collection system for industrial companies assists
(through financial contribution and collection coordination) just the recycling of materials for
which market dynamics do not work; indeed, without Corepla’s intervention, recycling would
not be economically viable for these materials. Beyond this, there exists a considerable amount
of plastic waste generated by commercial and industrial entities that presents attractive
economic features. This waste is usually plastic packaging with concentrated geographic origin
and showing a high level of homogeneity (as regard polymers and colours) and a low degree of
contamination. Since in this segment of the market collection is economically attractive, a large
number of private entities (independent from Corepla) focused on specific industrial plastic
waste collection has emerged, taking care of nearly 380.000 tons of plastic waste (as of 2019).
36%
15%
49%
Northern Italy
Centeral Italy
Southern Italy

65
Plastic packaging waste managed by Corepla is constantly growing, in 2019 it was able to
collect 1.366 thousand tons, with a 12% increment with respect to the previous year (while the
increment between 2017 and 2018 has been 13,6%). As much as 90% of this waste is packaging
waste, the remaining 10% is constituted by different sort of materials, that are not designated
to be recycled. These materials could be plastic waste (technically) impossible to recycle,
plastic waste for which a proper recycling value chain has not been constituted, materials
different from plastic. This increase in collected waste contributed to reach an increment equal
to 7,3% in the amount of waste directed towards recycling (from Corepla’s collection).
Corepla’s history is characterized by a quasi-monopoly position in the market, being the only
one entity which must (by Law) facilitate the activities along the recycling value chain.
Recently, this role has been challenged by a new operator, Coripet, which is a non-for-profit
consortium (constituted on a voluntary base) dealing only with PET food-contact packaging
(i.e. bottles); it has been recognized by the Ministry of the Environment in 2018. Producers of
this kind of packaging can comply with the Extended Producer Responsibility (EPR) adhering
to Coripet. Coripet’s aim is the so called “bottle to bottle”: collection of post-consumer PET
bottles that will be directed to the most suitable recycler, which will produce recycled PET for
new bottles. Other independent consortia play a marginal role in the industry.
3.1.4 Development and issues of the Italian plastic recycling industry – interview with Mr
Walter Regis
Mr Walter Regis is the president of Assorimap, the national association of plastic recyclers.
Assorimap represents the interests of Italian plastic recyclers in front of the Parliament and
relevant ministers (Ministry of the Environment and Ministry of Economic development). Mr
Walter Regis was available to set-up a phone interview on the 17th January 2020, during which
he outlined the role of Assorimap and described the main issues characterizing plastic recycling
industry’s development in the country.
Assorimap has been established in 1978 and it can attest all the changes occurred to the industry,
from the advent of Conai (1997) organizing separate collection, to the industrial development
of Italian SMEs that are now well-established national and international realities. More than
70% of the most important industrial post-consumer recyclers adhered to Assorimap,

66
accounting for almost 90% of recycled plastic produced in Italy. Post-industrial recyclers are
considered separately, since their size and strategy are often different (they are typically less
developed than post-consumer recyclers).
During Nineties, Italian plastic recyclers lacked the proper industrial setting and mindset for
growing, competing, and accelerating the recycling process which was spreading across Italy.
According to Mr Regis, one of the most important issues faced by Italian recyclers in this
industrialization process was the reliability and availability of supply: industrial operators need
large volume of supply for reaching economies of scale and repay important investments in
fixed assets and meet clients’ requirements, but this was not granted by the monopolist system
led by Corepla. After years of development of both industrial recyclers and separated collection,
numbers still do not fully satisfy the industry. Indeed, there is still production capacity to be
exploited, but the existing plastic waste collection system seems not able to cope with it.
A further issue to be highlighted is the current impossibility to recycle all kinds of plastic waste
produced. Indeed, even though there is a high number of polymers that can be recycled, for
starting an industrial recycling process of a specific polymer it is necessary to have a huge
volume of supply for that polymer, in fact each production line can work just with one polymer
and this becomes economically impracticable without proper volume. This means that, for
beginning the recycling of a specific polymer, enough volume of waste made of that polymer
needs to be generated and the collection and separation system must be able to obtain a pure
stream of waste and to guide it to the right recyclers. Recommendations are the continuous
development of the current collection and separation systems and the planning of the production
of plastic goods considering what are the technical and economical possibilities of recycling
(i.e. choosing the right polymers, thus granting the proper volume for running recycling
activities cost-efficiently).
In setting up its plastic recycling system, Italy has followed European directives and
recommendations, focusing on plastic packaging. This moved from the consideration that
packaging is the main application for plastic. The choice has had a great impact on recycling
efficiency, but its results are limited, since many different plastic goods (different from
packaging) are currently not-recyclable (there is not a proper system in the country). According
to Mr Regis, now it is time to start thinking about extend the scope of our system, to include
more and more plastic goods. This would not only reduce the amount of plastic directed to
energy recovery (incineration) but would also help in increasing the supply to Italian plastic
recyclers.

67
From a technological point of view, it must be noticed the importance to keep up with
continuous developments occurring to the industry. Advanced processes for purifying plastic
waste allow recyclers (especially for certain types of polymers, such as PET) to obtain a very
similar quality to virgin plastic. Advances are a great chance for the industry, but players need
to invest for sustaining the competition (both from Italian players and foreign ones). Keeping
up with competition as regard technology is particularly important for Italian players because
they suffer from country-specific issues in competing with foreigners. Indeed, Italian plastic
recyclers must bear very high costs, allegedly higher than European average with respect to
three aspects. The first is the cost of energy: electricity’s cost in Italy is the highest in Europe
(Eurostat, 2019), and this is clearly a considerable weakness since processing in this industry is
energy intensive (Mr Regis estimates in 30% the impact of the energy on the production cost,
excluding procurement). Second, waste procurement has not always been simple, as the only
counterparty for post-consumer recyclers has been Corepla, thus posing limits to the market.
Last, Mr Regis highlights labour cost as a structural problem for industrial firms in Italy.
A last thought concerns industry development through mergers and acquisitions or different
internal growth’s options. The number of recycling companies has not grown, but the plastic
recycling is deemed to attract various players from adjacent industries, interested in stepping
into it. Mr Regis notices industrial companies and investment funds, both involved. Multiutility
companies are the most representative of the first group: they seem very attract to downward
integrate their business, acquiring companies in the waste sorting business or directly into
plastic recycling. Interestingly enough, according to Mr Regis, virgin plastic producers and
chemical companies appear to be lagging behind in this process.
3.2 Economic and financial performance of Italian plastic recyclers
For the purpose of financial analysis, a panel of relevant companies has been chosen,
meaningful financial statements’ captions have been identified and main financial ratios have
been calculated. The goal of checking Italian plastic recycling industry’s financials is to verify
if actual data corroborate the hypothesis deriving from industry analysis (e.g. higher
profitability on the end-side of the value chain) based on interviews conducted in chapter two
and three.
3.2.1 Research method: identifying the players
As a complete list of Italian plastic recyclers is not available, different datasets have been taken
into consideration, then subsequent and sequential screening tools have been utilized for
narrowing down the initial list and obtaining the most precise panel possible of Italian plastic

68
recyclers. The focus is on companies performing size-reduction of plastic waste and/or
extrusion and compounding (utilizing size-reduced plastic waste); sorting centres, waste
management companies and companies recycling resins different from plastics are excluded.
For constituting the initial (gross) list of companies, two datasets have been adopted. The first
one is Aida (2020), a database including thorough and complete information on Italian
companies: historical financial statements (up to ten years) and other relevant information such
as legal seat, ownership structure or activity. Within Aida, a screening based on Ateco codes
has been done. Ateco codes constitute a system (adopted by the Italian Institute of Statistics,
Istat) for classifying companies according to their main activity. In particular, 38322 code has
been chosen; this is the Ateco code identifying companies which has as main activities the
recovery and preparation for recycling of plastic materials, aiming at producing plastic raw
materials and synthetic resins. The screening returned 465 firms.
As secondary source, ENF recycling directory (2020) has been used; it is the world’s largest
directory of recycling companies and, as such, it provides a useful integration tool for the
previous list. Additional 21 companies were found on ESN recycling, thus getting to 486
companies overall.
For the purpose of this work, there is the need of having the most recent financial data available,
thus companies for which Aida does not provide for 2018 financials were discarded. Remaining
companies were 251. Another important assessment to be made concerns companies’ status,
indeed just companies that are active (and generating turnover) have been deemed meaningful:
212 firms result.
The remaining group of companies comprises active companies for which financial information
is updated and available but presents an issue: the Ateco code considered pools together plastic
recyclers and rubber recyclers. For overcoming this inconvenient (and checking for other
potential issues) a qualitative analysis on every single company (212) has been conducted
through companies’ websites, the press and specialized magazines. Eventually, the panel
considers 98 firms focused on plastic recycling and performing plastic waste shredding and/or
compounding.
With the aim of focusing the research on industrially structured entities, presenting the
relevance and the development required by industry analysis, a €6 mln turnover floor has been
set. Remaining corporations were 34.
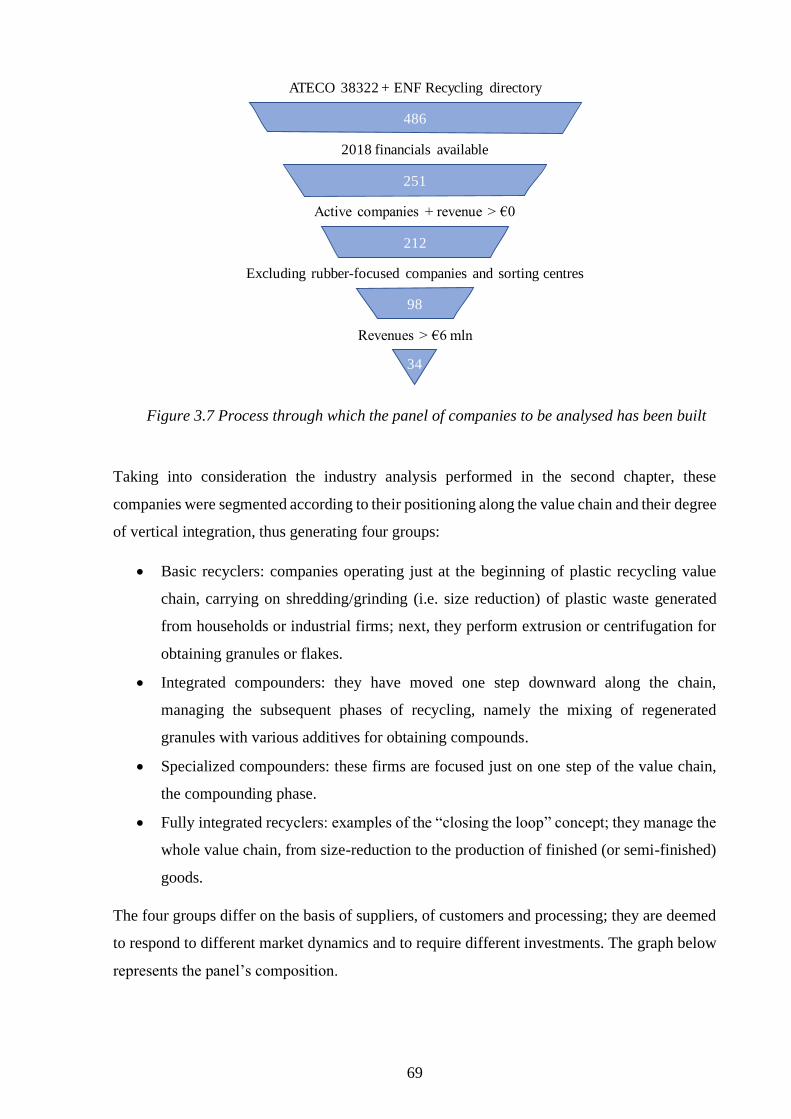
69
31. Figure 3.7 Process through which the panel of companies to be analysed has been built
Taking into consideration the industry analysis performed in the second chapter, these
companies were segmented according to their positioning along the value chain and their degree
of vertical integration, thus generating four groups:
• Basic recyclers: companies operating just at the beginning of plastic recycling value
chain, carrying on shredding/grinding (i.e. size reduction) of plastic waste generated
from households or industrial firms; next, they perform extrusion or centrifugation for
obtaining granules or flakes.
• Integrated compounders: they have moved one step downward along the chain,
managing the subsequent phases of recycling, namely the mixing of regenerated
granules with various additives for obtaining compounds.
• Specialized compounders: these firms are focused just on one step of the value chain,
the compounding phase.
• Fully integrated recyclers: examples of the “closing the loop” concept; they manage the
whole value chain, from size-reduction to the production of finished (or semi-finished)
goods.
The four groups differ on the basis of suppliers, of customers and processing; they are deemed
to respond to different market dynamics and to require different investments. The graph below
represents the panel’s composition.
ATECO 38322 + ENF Recycling directory
2018 financials available
Active companies + revenue > €0
Excluding rubber-focused companies and sorting centres
Revenues > €6 mln
486
251
212
98
34

70
32. Figure 3.8 Positioning along the plastic recycling’s value chain of the 34 companies
identified as the main Italian plastic recyclers
3.2.2 Italian plastic recycling industry: financial statement analysis
Captions and ratios listed below have been analysed with the aim of assessing profitability and
financial soundness of the industry. Information base has been obtained from Aida database,
all the assumptions made for calculating ratios and indexes held for every single company, thus
granting comparability of results.
10. Table 3.2 Financial indicators calculated. Own Ri-Elaboration on Aida's data
Companies are grouped according to the features described in chapter 3.2.1 (degree of
integration and position in the value chain). The goal is to go deeper in analysing the Italian
plastic recycling industry, looking for differences in economic and financial performances
across different clusters of firms. This is important to corroborate key findings from chapter
two about industry growth and profitability attached to specific activities and to lay the
foundation for reasoning about the M&A activity in the industry.
3.2.2.1 Basic recyclers
The most basic processing activity involved in plastic recycling is size reduction (through
shredding or grinding). According to companies interviewed and data about panel’s companies,
a large number of small Italian recyclers have focused their activity on size reduction. The
Basic recyclers
Specialized compounders
Integrated compounders
Fully integrated recyclers
PROCUREMENT SIZE-REDUCTION PURIFICATION GRANULES/FLAKES COMPOUNDING MANUFACTURING
#10 #11 #9 #4
Income statement Profitability Balance Sheet Financial soundness Efficiency ratios
Revenues EBITDA % NWC Revenues/NWC DSO
CAGR 2016-2018 EBIT % Invested capital NFP/Equity DPO
EBITDA ROIC NFP NFP/EBITDA DOI
EBIT ROE Equity
NOPAT
EBT
Effective tax rate
Net income

71
reason is constituted by the lower barriers to entry: process know-how is pretty basic
(technology and process are well-established) and tailoring the output for specific clients is
much less important than for compounders. The companies here defined as “basic recyclers”
have moved one step further, adding several purification steps and processing shredded/grinded
waste for obtaining recycled granules or flakes. Allegedly, basic recyclers operate in a very
competitive environment, where price is a major purchase driver. Tables presented in the next
pages will shed light on the existence of potential drivers for margins.
The geographic location of these companies is the North of Italy for eight out of ten; the other
two are in Terni (Monteplast) and in Teramo (C.I.E.R.).
11. Table 3.3 Basic recyclers, P&L data. Own Ri-Elaboration on Aida's data
CompanyRevenues
(€.000)
CAGR
2016-18
EBITDA
(€.000)EBITDA % EBIT (€.000) EBIT %
MONTELLO S.P.A. 140.118 26,3% 39.297 28,0% 30.757 22,0%
DENTIS RECYCLING ITALY S.R.L. 28.205 14,7% 5.400 19,1% 4.480 15,9%
C.I.E.R. S.R.L. 21.669 4,0% 968 4,5% 178 0,8%
EUROFED S.R.L. 20.890 32,1% 2.925 14,0% 2.753 13,2%
B & P RECYCLING S.R.L. 18.458 5,5% 2.057 11,1% 343 1,9%
DIEFFE S.R.L. 9.598 1,4% 283 2,9% 249 2,6%
TREGENPLAST S.R.L. 9.536 5,8% 1.610 16,9% 1.434 15,0%
VALPLASTIC S.R.L. 9.251 9,8% 505 5,5% 451 4,9%
ZETA POLIMERI - S.R.L. 7.669 24,2% 1.431 18,7% 1.138 14,8%
MONTEPLAST S.R.L. 6.860 2,1% 180 2,6% 112 1,6%
Average 27.225 12,6% 5.466 12,3% 4.190 9,3%
Median 14.028 7,8% 1.521 12,6% 795 9,0%
Standard deviation 40.329 11,2% 11.988 8,5% 9.439 7,7%
CompanyNOPAT
(€.000)
EBT
(€.000)
Effective tax
rate %
Net income
(€.000)ROIC ROE
MONTELLO S.P.A. 22.237 26.307 27,7% 19.020 18,3% 17,3%
DENTIS RECYCLING ITALY S.R.L. 3.257 4.469 27,3% 3.248 NA 19,7%
C.I.E.R. S.R.L. 263 -89 -47,7% -132 1,8% -5,0%
EUROFED S.R.L. 1.942 2.895 29,4% 2.043 1175,3% 95,4%
B & P RECYCLING S.R.L. 201 333 41,5% 195 23,8% 31,1%
DIEFFE S.R.L. 213 638 14,8% 544 NA 32,9%
TREGENPLAST S.R.L. 1.034 1.435 27,9% 1.034 NA 55,1%
VALPLASTIC S.R.L. 299 264 33,7% 175 -221,8% 32,4%
ZETA POLIMERI - S.R.L. 1.027 1.092 9,7% 985 24,3% 39,8%
MONTEPLAST S.R.L. 60 47 46,1% 25 1,6% 2,2%
Average 3.053 3.739 21,0% 2.714 146,2% 32,1%
Median 663 865 27,8% 765 18,3% 31,7%
Standard deviation 6.815 8.059 26,5% 5.824 462,3% 28,4%

72
12. Table 3.4 Basic recyclers, Balance sheet data. Own Ri-Elaboration on Aida's data
Basic recyclers of the panel present a wide range of sizes: the median turnover is around €14
mln (median turnover is deemed more meaningful than the average because of the presence of
Montello, by far the largest recycler of the entire sample), employees’ average is 28 (while,
when considering the entire panel, the average is 36). Basic recyclers represent nearly 38% of
the entire panel in terms of revenues.
All the firms achieve positive returns, the median operative profitability is high: median
Ebitda% is 12,6%, nearly 50% higher than the entire panel. This is the group presenting the
highest profitability (median values) both in terms of margins (Ebitda% and Ebitda) and return
on capital invested. Indeed, return on capital invested of basic recyclers places at the top within
the Italian recyclers, benefitting from the relatively low invested capital with respect to players
showing a higher integration of activities (i.e. integrated compounders and fully integrated
recyclers).
For trying to explain which is the driver for basic recyclers’ margins, different linear regressions
between main economic and financial captions have been performed. Revenues proved to be
the main driver for profitability, indeed, the linear regression of Ebitda% over revenues shows
a positive correlation, with a relatively high R2 (0,47); the same holds for Invested capital,
Company NWC (€.000)Revenues/
NWC
Invested
capital (€.000)NFP (€.000) Equity (€.000)
MONTELLO S.P.A. 30.518 4,59 x 129.023 19.230 109.793
DENTIS RECYCLING ITALY S.R.L. 1.579 17,87 x 13.764 -2.694 16.458
C.I.E.R. S.R.L. 6.384 3,39 x 13.751 11.108 2.643
EUROFED S.R.L. -727 -28,74 x 238 -1.902 2.140
B & P RECYCLING S.R.L. -8.749 -2,11 x 601 -25 626
DIEFFE S.R.L. 2.044 4,70 x 3.011 1.357 1.654
TREGENPLAST S.R.L. -250 -38,11 x 479 -1.398 1.877
VALPLASTIC S.R.L. -1.024 -9,04 x -279 -819 540
ZETA POLIMERI - S.R.L. 1.490 5,15 x 4.892 2.415 2.477
MONTEPLAST S.R.L. 2.725 2,52 x 3.586 2.433 1.154
Average 3.399 -3,98 x 16.907 2.970 13.936
Median 1.534 2,96 x 3.299 666 2.009
Standard deviation 10.280 17,04 x 39.740 6.928 34.008
CompanyNFP/
Equity
NFP/
EBITDADSO (days) DPO (days) DOI (days)
MONTELLO S.P.A. 0,18 x 0,49 x 73,9 87,7 87,8
DENTIS RECYCLING ITALY S.R.L. -0,16 x -0,50 x 60,5 61,4 67,1
C.I.E.R. S.R.L. 4,20 x 11,47 x 165,0 111,9 61,3
EUROFED S.R.L. -0,89 x -0,65 x 67,7 73,4 24,6
B & P RECYCLING S.R.L. -0,04 x -0,01 x 88,1 109,1 122,9
DIEFFE S.R.L. 0,82 x 4,80 x NA 28,5 NA
TREGENPLAST S.R.L. -0,74 x -0,87 x 48,9 89,7 NA
VALPLASTIC S.R.L. -1,52 x -1,62 x 25,9 62,9 82,3
ZETA POLIMERI - S.R.L. 0,98 x 1,69 x 84,5 52,6 77,8
MONTEPLAST S.R.L. 2,11 x 13,49 x 115,1 93,7 NA
Average 0,49 x 2,83 x 81,1 77,1 74,8
Median 0,07 x 0,24 x 73,9 80,6 77,8
Standard deviation 1,67 x 5,41 x 40,3 26,3 29,7

73
explaining 0,43 of margins’ variability. This result suggests the existence of economies of scale
related to this step of the value chain and support the (on average) larger size of these players
with respect to the entire panel.
Turning to balance sheet figures, the sample is financially sound: the median D/E ratio
approximates zero (0,07x), since many firms hold cash; this reflects on NFP/Ebitda ratio, which
is very low (the median is 0,24x). Monteplast and C.I.E.R. are a notable exceptions, since they
approach a distress situation: Monteplast is not only the smallest of the group, but it also
presents the lowest operating margin (Ebitda margin equals 2,6%) and an alarming debt
position, indeed, with €2,5 mln of net debt, it shows a NFP/Ebitda ratio of nearly 13,5x; C.I.E.R.
relies on higher revenues and a significantly higher profitability (Ebitda% equals 4,5%, still far
below the average), but its debt burden weighs 11,47x the Ebitda. Although the panel is small,
the relation between debt over equity ratio and Ebitda margin suggests an inverse relationship
between profitability and indebtedness; at the same time, no link between leverage and invested
capital has been found.
33. Figure 3.9 Main linear regressions performed on basic recyclers' data
3.2.2.2 Integrated compounders
A great number of Italian recyclers have moved downward along the value chain, mastering the
compounding activity. During the extrusion, specific chemical additives are mixed with
recycled polymers. Compounding is performed for obtaining secondary raw materials that can
0%
5%
10%
15%
20%
25%
30%
35%
0 30.000 60.000 90.000 120.000 150.000
Ebitda% vs Revenues (€.000)
R2 = 0,47
-160%
-110%
-60%
-10%
40%
90%
140%
190%
0 40.000 80.000 120.000
Ebitda% vs Invested Capital (€.000)
R2 = 0,43
-200%
-100%
0%
100%
200%
300%
400%
500%
0,0% 5,0% 10,0% 15,0% 20,0% 25,0% 30,0%
D/E vs Ebitda%
R2 = 0,14
-2,00 x
-1,00 x
0,00 x
1,00 x
2,00 x
3,00 x
4,00 x
-500 39.500 79.500 119.500
NFP/Ebitda vs Invested capital (€.000)
R2 = 0,01

74
be immediately utilized by industrial manufacturers. With compounding, recyclers can tailor
their offerings on specific clients, developing peculiar products that meet clients’ requirements
as regard chemical/physical properties and colour.
Competitive dynamics are different from the group previously analysed, since customer type
changes. While basic recyclers sell part of their products to compounders (which have had, de
facto, outsourced part of the recycling process), the integrated compounders’ customers are
industrial manufacturers, which requires customized product’s features as regard colour,
mechanical and chemical properties. As seen in the second chapter, specific and tailored
technical features needed by customers require deep process know-how and facilitate long-
standing business relationships.
Eleven out of thirty-four companies of the panel perform extrusion, 54% of these operates in
the North of Italy, 2 in the central Italy and 3 in the South.
13. Table 3.5 Integrated compounders, P&L data. Own Ri-Elaboration on Aida's data
CompanyRevenues
(€.000)
CAGR
2016-18
EBITDA
(€.000)EBITDA % EBIT (€.000) EBIT %
PEBO S.P.A. 36.244 8,2% 3.975 11,0% 2.920 8,1%
SKYMAX S.P.A. 19.967 0,1% 4.678 23,4% 4.168 20,9%
BREPLAST - S.P.A. 18.511 -14,0% -1.444 -7,8% -5.096 -27,5%
AGRICOLA IMBALLAGGI - S.R.L. 16.678 8,6% 2.173 13,0% 923 5,5%
CALDARA PLAST S.R.L. 15.712 19,7% 1.691 10,8% 1.265 8,0%
S.E.R. S.R.L. 15.304 3,4% 1.062 6,9% 711 4,6%
I.L.P.A.V. SPA 13.399 -3,8% 1.355 10,1% 482 3,6%
MAGMA S.P.A. 13.284 -4,0% 1.086 8,2% 594 4,5%
MIREX SPA 10.784 5,0% 903 8,4% 363 3,4%
POLYRANN S.R.L. 9.978 11,1% 647 6,5% 595 6,0%
ROMEI S.R.L. 6.908 14,8% 1.243 18,0% 913 13,2%
Average 16.070 4,5% 1.579 9,9% 712 4,6%
Median 15.304 5,0% 1.243 10,1% 711 5,5%
Standard deviation 7.701 9,6% 1.639 7,7% 2.261 11,8%
CompanyNOPAT
(€.000)
EBT
(€.000)
Effective tax
rate %
Net income
(€.000)ROIC ROE
PEBO S.P.A. 2.063 2.824 29,3% 1.996 14,2% 20,5%
SKYMAX S.P.A. 2.989 4.201 28,3% 3.012 27,4% 31,4%
BREPLAST - S.P.A. -5.096 -3.672 0,0% -3.672 -95,5% -268,0%
AGRICOLA IMBALLAGGI - S.R.L. 640 612 30,7% 424 3,3% 3,3%
CALDARA PLAST S.R.L. 856 1.074 32,3% 727 11,1% 20,5%
S.E.R. S.R.L. 508 686 28,5% 490 9,3% 8,8%
I.L.P.A.V. SPA 328 595 32,0% 404 4,2% 9,4%
MAGMA S.P.A. 396 303 33,4% 202 2,9% 3,4%
MIREX SPA 236 445 34,8% 290 1,8% 3,1%
POLYRANN S.R.L. 432 596 27,3% 433 19,5% 16,5%
ROMEI S.R.L. 708 929 22,4% 720 42,1% 22,8%
Average 369 781 27,2% 457 3,7% -11,6%
Median 508 612 29,3% 433 9,3% 9,4%
Standard deviation 2.002 1.904 9,6% 1.618 35,1% 85,5%

75
14. Table 3.6 Integrated compounders, Balance sheet data. Own Ri-Elaboration on Aida's
data
This is the most numerous group of the panel (containing eleven out of thirty-four companies),
and it is the group where the median recycler has a largest size. The median turnover is assessed
at €15,3 mln, with Pebo (a company belonging to System Group, a leading player in plastic
pipelines manufacturing) as the largest player. Median turnover is nearly 25% higher with
respect to the remaining recyclers, and it has been growing by 4,5% CAGR over the period
2016-2018.
Firm’s size (both revenues and invested capital were used as proxies) does not explain
profitability within the panel. Possibly based on their proximity to customers, companies
carrying over extrusion and compounding activities are virtually all (excluding Breplast, which
is part of Montello Group) able to extract positive margins (median Ebitda margin equals
10,1%). Interestingly, excluding the two outperformers (Montello and Breplast, apart from
constituting an industrial group, they are respectively the best and the worst performers of the
entire panel), the integrated compounders are the companies showing the best operating
Company NWC (€.000)Revenues/
NWC
Invested
capital (€.000)NFP (€.000) Equity (€.000)
PEBO S.P.A. 7.221 5,02 x 16.205 6.491 9.714
SKYMAX S.P.A. 4.383 4,56 x 13.153 3.552 9.600
BREPLAST - S.P.A. -3.781 -4,90 x 4.182 2.812 1.370
AGRICOLA IMBALLAGGI - S.R.L. 7.077 2,36 x 20.935 8.137 12.798
CALDARA PLAST S.R.L. 4.262 3,69 x 8.184 4.645 3.539
S.E.R. S.R.L. 2.558 5,98 x 6.388 817 5.570
I.L.P.A.V. SPA -567 -23,62 x 7.787 3.505 4.282
MAGMA S.P.A. 2.326 5,71 x 13.391 7.525 5.866
MIREX SPA 5.283 2,04 x 13.388 3.978 9.411
POLYRANN S.R.L. 1.079 9,25 x 2.446 -177 2.623
ROMEI S.R.L. 321 21,50 x 1.643 -1.518 3.161
Average 2.742 2,87 x 9.791 3.615 6.176
Median 2.558 4,56 x 8.184 3.552 5.570
Standard deviation 3.356 10,85 x 6.103 3.073 3.666
CompanyNFP/
Equity
NFP/
EBITDADSO (days) DPO (days) DOI (days)
PEBO S.P.A. 0,67 x 1,63 x 32,6 63,7 38,0
SKYMAX S.P.A. 0,37 x 0,76 x 108,1 60,5 90,4
BREPLAST - S.P.A. 2,05 x -1,95 x 91,7 245,3 86,4
AGRICOLA IMBALLAGGI - S.R.L. 0,64 x 3,74 x 130,4 98,7 158,6
CALDARA PLAST S.R.L. 1,31 x 2,75 x 103,6 90,4 NA
S.E.R. S.R.L. 0,15 x 0,77 x 110,1 58,6 20,3
I.L.P.A.V. SPA 0,82 x 2,59 x 41,6 72,3 85,4
MAGMA S.P.A. 1,28 x 6,93 x 177,4 106,7 53,1
MIREX SPA 0,42 x 4,41 x 138,4 29,9 114,5
POLYRANN S.R.L. -0,07 x -0,27 x 73,5 33,2 2,0
ROMEI S.R.L. -0,48 x -1,22 x 101,4 115,1 NA
Average 0,65 x 1,83 x 100,8 88,6 72,1
Median 0,64 x 1,63 x 103,6 72,3 85,4
Standard deviation 0,71 x 2,61 x 41,6 59,0 48,9

76
profitability (average Ebitda% equals 11,6%), apparently rewarding the deeper vertical
integration of these players.
Looking at the balance sheet’s side, it can be noticed the higher invested capital (mostly fixed),
coherent with the additional activities performed (requiring additional machineries).
Companies in this group seem financially sound, as NFP/equity results lower than 1x and
NFP/Ebitda (median value) is around 1,6x. As highlighted below, a positive relation between
the latter ratio and fixed assets’ level is suggested.
Average DSO are thirty-one days longer than DPO, signalling a poor management of cash
conversion cycle. Indeed, the median length of their cash cycle is nearly 117 days, considerably
higher than the median result of the entire sample.
34. Figure 3.10 Main linear regressions performed on integrated compounders’ data
3.2.2.3 Specialized compounders
The third group considered comprises recyclers which have specialized in one single activity
of the plastic recycling’s value chain: compounding. They have chosen to focus on the last
activity before actual products manufacturing; this allows specialized compounders to directly
approach final customers.
-10%
0%
10%
20%
30%
0 5.000 10.000 15.000 20.000 25.000
Ebitda% vs Invested capital (€.000)
R2 = 0,09
-100%
-50%
0%
50%
100%
150%
200%
250%
-10,0% 0,0% 10,0% 20,0% 30,0%
D/E vs Ebitda%
R2 = 0,38
0
10.000
20.000
30.000
40.000
0 5.000 10.000 15.000 20.000 25.000
Revenues vs Invested capital (€.000)
R2 = 0,25
-4,00 x
-2,00 x
0,00 x
2,00 x
4,00 x
6,00 x
8,00 x
0 3.500 7.000 10.500 14.000
NFP/Ebitda vs Fixed assets (€.000)
R2 = 0,41

77
Compounding is (allegedly) the most know-how intensive process within the plastic recycling’s
set of activities; moreover, it is exactly the phase in which recyclers can tailor their products on
customers’ specific needs, with respect to chemical, physical and aesthetic features. According
to the analysis exhibit in chapter two (based on interviews with recycling companies’
Management), compounding is one of the most important activities in driving customers’
purchase decision. These reasons suggest compounding as the most value-adding activity.
Specialized recyclers are the least integrated players of the entire panel, presenting a thinner
structure than the other recyclers.
Four of the companies of the panel are specialized compounders, three of them have their seat
in the North of Italy, employing an average of 22 employees per company.
15. Table 3.7 Specialized compounders, P&L data. Own Ri-Elaboration on Aida's data
CompanyRevenues
(€.000)
CAGR
2016-18
EBITDA
(€.000)EBITDA % EBIT (€.000) EBIT %
SIR S.R.L. 42.909 23,3% 2.233 5,2% 1.290 3,0%
KOREMPLAST S.R.L. 14.448 2,9% 1.004 6,9% 422 2,9%
ASOLO POLIMERI SRL 11.764 13,7% 778 6,6% 526 4,5%
PLASTINORD S.R.L. 6.853 13,9% 255 3,7% 114 1,7%
Average 18.994 13,5% 1.067 5,6% 588 3,0%
Median 13.106 13,8% 891 5,9% 474 3,0%
Standard deviation 16.251 8,3% 838 1,5% 500 1,1%
CompanyNOPAT
(€.000)
EBT
(€.000)
Effective tax
rate %
Net income
(€.000)ROIC ROE
SIR S.R.L. 792 563 38,6% 346 4,2% 13,7%
KOREMPLAST S.R.L. 301 341 28,6% 244 8,3% 40,4%
ASOLO POLIMERI SRL 367 472 30,1% 330 10,1% 26,1%
PLASTINORD S.R.L. 75 106 34,3% 69 2,8% 5,3%
Average 384 370 32,9% 247 6,3% 21,4%
Median 334 407 32,2% 287 6,3% 19,9%
Standard deviation 300 199 4,5% 127 3,4% 15,3%

78
16. Table 3.8 Specialized compounders, Balance sheet data. Own Ri-Elaboration on Aida's
data
This small group includes just four companies, signalling the choice of deep specialization as a
niche option for Italian players. The size of these four recyclers is varied: Sir is the third largest
recycler in Italy, Plastinord is the smallest company of the panel, the median turnover is nearly
€13 mln (in line with the panel’s median). Specialized compounders are the fastest growing
recyclers, with median CAGR 2016-18 reaching 13,8%.
By looking at profitability, specialized compounders appear, by far, as the worst performers:
average Ebitda% equals 5,6% (the average Ebitda% of the entire panel is 9,9%), median Roic
is 6%, while the median result of the entire panel is 8% (as regard return on invested capital, it
has to be noticed that fully integrated recyclers achieve worse results). Both operating
profitability and Roic’s variance are not explained by turnover or invested capital.
Average specialized compounders’ fixed assets are €3,4 mln, where the panel’s average is
almost €8 mln; this was expected since these players are the least integrated of the panel. The
linear regression of revenues over fixed assets presents R2=0,99, showing that revenues’
variance is almost entirely explained by fixed assets.
The entire specialized compounders’ group differentiates from the remaining Italian recyclers
for its hardly reassuring financial soundness. Differently from the other categories of Italian
recyclers, NFP/Ebitda ratio is consistently high, with Sir’s ratio, the group’s leader, reaching
almost 7x. Median D/E of the group is 3,64x and, according to the most significant linear
regressions performed, its variance is explained mostly by revenues and fixed assets.
Company NWC (€.000)Revenues/
NWC
Invested
capital (€.000)NFP (€.000) Equity (€.000)
SIR S.R.L. 9.023 4,76 x 18.034 15.516 2.519
KOREMPLAST S.R.L. 1.722 8,39 x 3.849 3.245 604
ASOLO POLIMERI SRL 1.693 6,95 x 3.668 2.404 1.263
PLASTINORD S.R.L. 1.468 4,67 x 2.931 1.627 1.304
Average 3.476 6,19 x 7.120 5.698 1.422
Median 1.707 5,85 x 3.758 2.825 1.284
Standard deviation 3.700 1,81 x 7.287 6.578 798
CompanyNFP/
Equity
NFP/
EBITDADSO (days) DPO (days) DOI (days)
SIR S.R.L. 6,16 x 6,95 x 125,9 133,1 84,7
KOREMPLAST S.R.L. 5,37 x 3,23 x 94,6 89,6 38,9
ASOLO POLIMERI SRL 1,90 x 3,09 x 124,6 108,1 13,6
PLASTINORD S.R.L. 1,25 x 6,37 x 124,0 72,6 76,1
Average 3,67 x 4,91 x 117,3 100,8 53,3
Median 3,64 x 4,80 x 124,3 98,9 57,5
Standard deviation 2,46 x 2,03 x 15,1 25,9 33,1

79
35. Figure 3.11 Main linear regressions performed on specialized compounders' data
3.2.2.4 Fully integrated recyclers
The last group analysed takes into consideration recyclers which have not limited their
integration from size-reduction to compounding but have taken up the activity immediately
following plastic recycling: goods manufacturing. They have vertically integrated the industry,
managing to shred/grind the waste coming from households or industrial firms, which is then
purified, mixed with the proper plastics or additives, extruded and eventually, within the same
production cycle, utilized for obtaining finished or semi-finished goods.
They are able to actually “closing the loop” by producing simple products from plastic waste.
Firms considered in this group produce hoses, plastic bags, coils, panels, furniture components,
boxes, and similar basic objects. While they share with other recyclers the same dynamics in
managing suppliers and part of the processing activity, they differ widely in client-side
management; indeed, their relationships are usually with commercial companies or final
consumers.
Nine of the companies of the panel are fully integrated, eight of them have their seat in the
North of Italy, employing an average of 56 employees per company.
0%
2%
4%
6%
8%
0 10.000 20.000 30.000 40.000 50.000
Ebitda% vs Revenues (€.000)
R2 = 0,00
0%
2%
4%
6%
8%
0 5.000 10.000 15.000 20.000
Ebitda% vs Invested capital (€.000)
R2 = 0,02
0,00 x
2,00 x
4,00 x
6,00 x
8,00 x
0 2.500 5.000 7.500 10.000
NFP/Ebitda vs Fixed assets (€.000)
R2 = 0,35
0,00 x
2,00 x
4,00 x
6,00 x
8,00 x
0 10.000 20.000 30.000 40.000 50.000
NFP/Ebitda vs Revenues (€.000)
R2 = 0,27

80
17. Table 3.9 Fully integrated recyclers, P&L data. Own Ri-Elaboration on Aida's data
CompanyRevenues
(€.000)
CAGR
2016-18
EBITDA
(€.000)EBITDA % EBIT (€.000) EBIT %
ALIPLAST S.P.A. 87.084 2,6% 12.645 14,5% 11.076 12,7%
A.M.P. RECYCLING S.R.L. 26.607 30,2% -149 -0,6% -692 -2,6%
FOREVER PLAST S.P.A. 26.190 2,2% 1.523 5,8% 978 3,7%
LUCY PLAST SPA 12.686 5,1% 1.325 10,4% 426 3,4%
LABORPLAST SRL 11.041 13,4% 631 5,7% 256 2,3%
3 P PLAST S.R.L. 9.368 -2,3% 565 6,0% 207 2,2%
NUOVA GANDIPLAST - S.R.L. 8.095 1,7% 1.496 18,5% 1.321 16,3%
ANSA TERMOPLASTICI S.R.L. 7.302 8,8% 361 4,9% -71 -1,0%
MECOPLAST S.R.L. 7.067 -1,9% 1.195 16,9% 980 13,9%
Average 21.716 6,6% 2.177 9,1% 1.609 5,7%
Median 11.041 2,6% 1.195 6,0% 426 3,4%
Standard deviation 25.673 10,1% 3.967 6,3% 3.602 6,8%
CompanyNOPAT
(€.000)
EBT
(€.000)
Effective tax
rate %
Net income
(€.000)ROIC ROE
ALIPLAST S.P.A. 8.394 12.775 24,2% 9.682 21,5% 30,1%
A.M.P. RECYCLING S.R.L. -434 -710 37,2% -446 -9,6% -10,4%
FOREVER PLAST S.P.A. 713 917 27,1% 669 9,8% 30,2%
LUCY PLAST SPA 280 355 34,3% 233 3,1% 7,2%
LABORPLAST SRL 198 245 22,6% 190 11,2% 6,4%
3 P PLAST S.R.L. 165 95 20,1% 76 3,2% 3,0%
NUOVA GANDIPLAST - S.R.L. 944 1.284 28,5% 918 NA 37,5%
ANSA TERMOPLASTICI S.R.L. -71 -107 -0,4% -108 -1,1% -12,7%
MECOPLAST S.R.L. 715 907 27,0% 662 28,3% 70,2%
Average 1.211 1.751 24,5% 1.319 8,3% 17,9%
Median 280 355 27,0% 233 6,5% 7,2%
Standard deviation 2.727 4.178 10,8% 3.164 12,2% 26,5%

81
18. Table 3.10 Fully integrated recyclers, Balance sheet data. Own Ri-Elaboration on Aida's
data
Size, measured by turnover, is very varied, spanning from €7 mln (Mecoplast) to nearly €87
mln (Aliplast). Consistently with the rest of the industry, fully integrated recyclers have been
growing during last years, even though CAGR is more moderate (2,6%). For assessing the
convenience of vertical integration, Ebitda margin and ROIC have been considered. Earnings
before interest, taxes, depreciation and amortization shows that operating profitability of fully
integrated recyclers is lower than integrated compounders and basic recyclers’, positioning at
the same level of specialized compounders’ profitability (Ebitda% equals 6%).
Trying to identify main drivers for profitability, several linear regressions have been performed.
Most relevant regressions seem to highlight the notable impact of turnover level on Ebitda
margin: interestingly, the relation between the two figures seems inverse. Considering its
different scale in revenues, Aliplast has been initially taken out of the sample for the sake of
this regression; including it would lead a very different result, since revenues would not have
been useful for explain any part of profitability’s variance.
Invested capital required for the full integration of recycling activities is considerable (median
equals €5,9 mln), thus (coupled with lower marginality) generating a return on invested capital
(median value is 6,3%) far below the Roic of basic recyclers (19,1%). Leverage and debt
Company NWC (€.000)Revenues/
NWC
Invested
capital (€.000)NFP (€.000) Equity (€.000)
ALIPLAST S.P.A. 7.820 11,14 x 37.068 4.922 32.145
A.M.P. RECYCLING S.R.L. -1.979 -13,45 x 4.301 -2 4.302
FOREVER PLAST S.P.A. 1.399 18,72 x 7.708 5.493 2.215
LUCY PLAST SPA 1.659 7,65 x 8.815 5.559 3.256
LABORPLAST SRL -789 -13,99 x 1.767 -1.210 2.977
3 P PLAST S.R.L. 289 32,44 x 5.091 2.586 2.504
NUOVA GANDIPLAST - S.R.L. NA NA NA NA 2.450
ANSA TERMOPLASTICI S.R.L. 3.170 2,30 x 6.708 5.861 847
MECOPLAST S.R.L. -311 -22,76 x 1.993 1.050 943
Average 1.407 2,76 x 9.181 3.032 5.738
Median 844 4,98 x 5.899 3.754 2.504
Standard deviation 3.042 18,61 x 11.547 2.812 9.961
CompanyNFP/
Equity
NFP/
EBITDADSO (days) DPO (days) DOI (days)
ALIPLAST S.P.A. 0,15 x 0,39 x 101,4 67,9 69,8
A.M.P. RECYCLING S.R.L. 0,00 x 0,01 x 1,8 51,5 51,8
FOREVER PLAST S.P.A. 2,48 x 3,61 x 48,4 35,9 20,3
LUCY PLAST SPA 1,71 x 4,20 x 141,1 157,3 132,5
LABORPLAST SRL -0,41 x -1,92 x 34,6 105,9 53,2
3 P PLAST S.R.L. 1,03 x 4,58 x 120,9 152,1 83,0
NUOVA GANDIPLAST - S.R.L. NA NA 55,0 NA NA
ANSA TERMOPLASTICI S.R.L. 6,92 x 16,22 x 70,2 75,6 293,0
MECOPLAST S.R.L. 1,11 x 0,88 x 126,1 157,8 35,4
Average 1,63 x 3,50 x 77,7 100,5 92,4
Median 1,07 x 2,24 x 70,2 90,8 61,5
Standard deviation 2,34 x 5,63 x 47,2 49,9 87,9

82
sustainability do not cause concerns, since both NFP/Equity and NFP/Ebitda (median values)
are assessed at 1,1x and 2,2x, respectively .
As it can be appreciated in the charts below, NFP/Ebitda ratio is consistent across different
levels of revenues and fixed assets.
36. Figure 3.12 Main linear regressions performed on fully integrated recyclers
3.2.2.5 Closing remarks
Overall, plastic recycling industry is composed by small to medium firms, usually located in
the North of the country (74%). Coherently with findings from chapter two, namely the growth
in plastic production, the increased availability of plastic scraps and the change in consumers’
preferences towards sustainability, growth is consistent across every recyclers’ group, leading
to a CAGR 2016-18 of 10,2%.
Margins are quite thin but diffusely positive (median Ebitda margin is 8,3%) and improving
over the period 2016-2018.
-10%
0%
10%
20%
0 5.000 10.000 15.000 20.000 25.000 30.000
Ebitda% vs Invested capital (€.000)Excluding Aliplast
R2 = 0,37
-20,0%
-10,0%
0,0%
10,0%
20,0%
30,0%
40,0%
0 5.000 10.000 15.000 20.000 25.000 30.000
ROIC vs Revenues (€.000)Excluding Aliplast
R2 = 0,20
-5,00 x
0,00 x
5,00 x
10,00 x
15,00 x
20,00 x
0 20.000 40.000 60.000 80.000 100.000
NFP/Ebitda vs Revenues (€.000)
R2 = 0,10
-5,00 x
0,00 x
5,00 x
10,00 x
15,00 x
20,00 x
0 10.000 20.000 30.000 40.000
NFP/Ebitda vs Revenues (€.000)
R2 = 0,05

83
37. Figure 3.13 Ebitda margin evolution of main Italian recyclers (median value within the
panel described at 3.2.1). Source: Aida, 2020
Financial soundness of the industry is remarkable. Leverage is moderate, as can be seen from
D/E ratio around 80% (2018), and debt sustainability is very pronounced, since NFP/Ebitda
ratio is assessed at 1,7x (2018).
A certain degree of risk is attached to cash conversion cycle; indeed, its length is 80 days and
DSO are longer than DPO (median values), meaning that plastic recycling companies are forced
to grant longer payment dilations to their clients than they are granted from suppliers.
Across clusters (i.e. the four groups identified before) there are differences to be noticed. First,
basic recyclers and integrated compounders have shown greater propensity to establish a larger
size, indeed their average turnover is 15% higher than the median. Moreover, basic recyclers
have shown the most rapid growth of the four groups (CAGR 2016-2018 is 25,3%, while
specialized compounders reach 16,2%).
Median operating profitability of Italian recyclers is 8,3%. The worst performers are the
specialized compounders (median Ebitda% equals 5,9%), suggesting the relevance of
procurement among the activities performed along the value chain, as all the other three kinds
of recyclers have integrated the initial phases of recycling (i.e. procurement and size-reduction).
Noticeably, fully integrated recyclers producing finished (or semi-finished) goods perform just
slightly better than specialized compounders, meaning that the most integrated companies’
profitability resemble the Ebitda margin of the least integrated recyclers (i.e. specialized
compounders); a possible explanation can be found in the kind of products produced by
integrated recyclers: the organization and the machineries available to these companies enable
to produce just simple goods or components which could be prone to commoditization.
6,3%
7,5%
8,3%
4,5%
5,0%
5,5%
6,0%
6,5%
7,0%
7,5%
8,0%
8,5%
2016 2017 2018
Ebitda margin evolution, 2016-2018

84
Different industrial structures bring different requirements in terms of investments. This is
noticeable considering the level of fixed assets with respect to invested capital, since it is clearly
correlated with the number of activities performed by the firm (namely, its vertical integration).
Being integrated companies more capital-intensive than size-reducers, they need higher
margins and/or higher revenues for obtaining acceptable returns on invested capital (ROIC).
Interestingly, full integration seems leading lack of the operating profitability required to justify
its higher investments in fixed assets, leading to a return on invested capital of 6,5%. Moreover,
turnover seems to drive operating profitability, thus suggesting the need for fully integrated
recyclers to growth further, expanding their turnover and achieving scale economies for
justifying the high investments in machineries.
In stark contrast with the rest of the industry, specialized compounders show a difficult financial
situation. They present a much higher leverage with respect to the other Italian recyclers
(median NFP/Ebitda ratio equals 4,8x, median D/E ratio is 3,64x). A possible explanation of
their high leverage could be found in their high pace growth; indeed, specialized compounders
are the fastest growing recyclers in Italy, as they reached a median CAGR of 13,8% during the
period considered.
Concluding, evidence from selected Italian recyclers confirms the growing path undertaken by
global plastic recycling industry and the favourable economic conditions (reflected in the
enhancement of profitability over last years). Moreover, it highlights the relevance of
companies performing extrusion (i.e. basic recyclers and integrated compounders): they
outperform the rest of Italian recyclers by turnover, operating profitability, and financial
soundness. The size seems to be a profitability driver, while the full vertical integration
struggles to show significative advantages.

85
4. Evidence from the Italian plastic recycling industry: selected players
All the players identified according to the methodology detailed in chapter 3.2.1 were contacted
for arranging an interview. The aim was to support the industry analysis with insights from the
senior Management of the most important Italian plastic recyclers (see chapter two), while
deepening real company-specific cases for comparing different business models and discussing
players’ view on the future developments of the industry.
The interview was constituted by open-ended questions, divided into three groups: industry’s
structure and competitive dynamics, company’s competitive strategy, future developments of
the industry (including company-specific plans and an overview of the potential M&A activity
within the industry).
The 34 companies were approached by phone (30) or e-mail (4). After the first contact, all the
companies received the interview’s draft for a better understanding of the project. Eventually,
the companies which had shown interest were re-contacted for arranging the interview.
Nine companies agreed to be interviewed: nine of them resulted from the 34 selected group,
one additional interview was held with Garbo Srl. The latter was the only company in Italy
which could offer the chance to gain insights about the innovative developments brought to the
industry by the chemical recycling. Interviews were held by-phone (8) or in-person (2).
Interviewees were company’s CEOs, entrepreneurs, or managers (from procurement
department, G&A or the technical department). The table below summarizes the companies
involved, people interviewed, means of contact and interviews’ dates.

86
19. Table 4.1 Details of companies interviewed
4.1 Pebo Spa
4.1.1 Pebo: historical development, financials, and offerings
Pebo is a company established in Arezzo (Tuscany) in 1987, specialized in LDPE and HDPE
recycling. The Company, operating with more than 50 employees in a 30.000 m2 area, is part
of System Group, which, operating 13 plants and exporting worldwide, is a leading player in
plastic pipeline manufacturing.
Pebo has innovative plants and machineries available for washing and grinding waste coming
from households (post-consumer waste mostly managed by Corepla) and industrial firms,
moving on with grinding and compounding (mixing processed waste with chemical additives).
Recycled polyethylene is directed to nearly one hundred clients (both Italian and foreigners),
the most part of those working under the influence of System Group.
Pebo is growing at a compound annual growth rate of 2,9% over the period 2014-2018,
confirming the rising path of the industry. Last two years have been particularly positive,
contributing to a 17% growth in sales. Over the same years, the company have managed to
largely improve its Ebitda margin, which doubled, reaching a remarkable 11% in 2018 (median
value for companies performing extrusion is 8,4%). Along the same path, Roic has jumped
from 5,4% to 13,5%. These large improvements occurred exactly during the same years of
Company Interviewee Role Means Date
Dieffe Srl M. Durat Owner Phone 06/12/2019
Caldara Plast Srl A. Piras Technical manager Phone 13/12/2019
Skymax Spa C. Stockreiter CEO In-person 08/01/2020
Nuova Gandiplast Srl D. Franchina Procurement manager In-person 10/01/2020
I.L.P.A.V. Spa G. Cilio G&A manager Phone 21/01/2020
Dentis Recycling Srl N.A. N.A. Phone 17/01/2020
Pebo Spa S. Cavalli General manager Phone 17/01/2020
Zeta Polimeri Srl L. Zulato Procurement manager Phone 01/06/2020
Garbo Srl G. Fragiacomo Owner Phone 11/02/2020
Ansa Termoplastici A. Conterno Owner/CEO Phone 22/06/2020

87
Chinese ban on foreign plastic waste import, which can explain margins’ enhancement due to
cheap procurement. Additional explanation for this phenomenon could be the turnover’s
increase, bringing scale economy effects to lower the incidence of fixed costs.
Debt level has always been kept under control, averaging at €5,5 mln over the period 2014-
2018 and granting a reassuring NFP/Ebitda ratio of 1,6x. (AIDA, 2020)
20. Table 4.2 Pebo Spa, financials. Source: Aida, 2020
For deepening Pebo’s business model and growth strategy, Mr Sandro Cavalli (managing
director of Pebo) has been contacted. Mr Cavalli agreed to give an interview on the 17th of
January 2020.
Mr Cavalli pointed out that, even though the Company is part of a group, Pebo is set free to
operate on the market according to its best competitive strategy.
The Company is focused on recycling high-density polyethylene (95% of its production, in
volume) through a process starting from purification and arriving to extrusion. A significant
production capacity of 45.000 tons per year allows Pebo to operate on a global scale, selling
polyethylene compounds mostly outside Italy, with System Group’s companies being a relevant
share of the whole clientele.
Investments in innovative machineries and the long experience in the market grant Pebo a deep
process know-how. This expertise is fundamental for Pebo’s value proposition: guaranteeing
customers reliable supplies (i.e. qualitatively constant) of recycled plastics which show
technical features comparable to virgin polymers.
PEBO SPA 2014 2015 2016 2017 2018
€.000
Total revenues 32.376 32.662 30.976 34.189 36.244
EBITDA 1.780 2.193 1.716 2.978 3.975
EBITDA Margin 5,5% 6,7% 5,5% 8,7% 11,0%
NOPAT 746 906 620 1.547 2.178
Net income 511 837 507 1.416 1.996
Equity 5.491 6.328 6.302 7.718 9.714
NFP 4.855 6.234 5.256 5.014 6.398
Invested capital 10.345 12.562 11.558 12.732 16.112
ROIC 7,5% 8,8% 4,9% 13,4% 17,1%
NFP/EBITDA 2,7x 2,8x 3,1x 1,7x 1,6x
CAGR '14-'18 2,9%

88
4.1.2 Pebo: growth strategy and thoughts about M&A trends
Pebo has a clear strategy for the next future, which is based on two pillars. The first is quality
enhancement through constant investments in equipment, machineries, and personnel; this is
not only fundamental for maintaining the leadership in its segment of the market, but it can be
also instrumental to move towards new segments. As explained in the previous chapters,
different sectors of application require different level of quality and different chemical and
mechanical properties (the most important examples are the automotive industry and food-
contact packaging).
The evolution of the industry seems clear to Mr Cavalli, who points out the entrance of new
kind of players in the sector. These players are mostly large multinational companies,
diversifying their business or vertically integrating their activities (examples mentioned are
Hera Group and A2A, leading multiutility companies in Italy). To counter the increasing
average size of Italian recyclers, Pebo is considering to developing its own size through
business partnerships with players operating in the same steps of the value chain or through a
merger. The aim is to acquire bargaining power with both suppliers and customers, thus
protecting Pebo’s leadership against large newcomers (this is the second pillar of Pebo’s
growth strategy).
4.2 I.L.P.A.V. Spa
4.2.1 I.L.P.A.V.: historical development, financials, and offerings
I.L.P.A.V. has been established in 1974 in Ragusa (Sicily), with the aim of becoming one of
the most relevant players of the South of Italy. Qualified experts working for I.L.P.A.V. have
contributed for achieving quality certifications, proving the remarkable efforts of the Company
towards environment and production quality.
The Company’s production process involves washing, shredding and extrusion of low-density
polyethylene (LDPE) waste. The origin of the plastic scrap used as inputs is mainly from
agricultural businesses and industrial packaging (with LDPE from separated collection
managed by Corepla constituting just a small minority). This choice results from the industrial
organization of the region, showing agricultural-related activities as the main business, and
takes advantage of the higher purity of materials resulting from the activity of these firms.
Company’s revenues lay just below the median value for its group (the median value of
revenues for companies performing extrusion belonging to the panel is €15,7 mln); moreover
they are almost stable, in fact they present a CAGR equal to -1,3% over the period 2014-2018.

89
This results from production capacity boundaries, which have been reached around 2012; plan
for overcoming these limits are discussed next (4.2.2).
Although the slight decrease in turnover, I.L.P.A.V. managed to improve its Ebitda, reaching a
10,1% Ebitda margin. Additionally, net income shows an impressive surge over the period
considered.
Consistently with the remaining companies constituting the sample, I.L.P.A.V. presents a sound
financial situation: NFP has constantly decreased from 2014, for arriving at €3,5 mln in 2018,
which means a NFP/Ebitda ratio of 2,6x (slightly below the sample’s average value). (AIDA,
2020)
21. Table 4.3 I.L.P.A.V. Spa, financials. Source: Aida, 2020
Mr Giuseppe Cilio, in charge of G&A activities at the Company, agreed to a phone interview,
which took place on 21st of January 2020.
I.L.P.A.V.’s proximity to a great number of potential suppliers, in an area where just a few
well-established recyclers operate, is deemed to be a considerable advantage since decades.
Indeed, lack of competition and low logistic costs have helped I.L.P.A.V. in lowering
procurement costs and offering a competitive price to its clients.
The Company shows a considerable degree of vertical integration, since it manages (with
proprietary vehicles) waste collection from local businesses, waste purification, shredding of
LDPE scrap and extrusion through which it obtains regenerated granules. Granules obtained
can be amber-coloured or black, depending on the quality of inputs utilized (chosen under
clients’ requirements). I.L.P.A.V.’s clients are mainly plastic bags producers, located in Italy;
client’s concentration is very high, since 65% of total turnover is due to one only customer. Mr
Cilio highlighted that, even though clientele is still highly concentrated, the process for
I.L.P.A.V. SPA 2014 2015 2016 2017 2018
€.000
Total revenues 14.103 14.827 14.477 13.926 13.399
EBITDA 1.083 1.064 905 1.197 1.355
EBITDA Margin 7,7% 7,2% 6,2% 8,6% 10,1%
NOPAT 273 376 279 337 532
Net income 177 282 142 292 404
Equity 4.052 4.158 4.017 4.168 4.282
NFP 4.265 4.378 3.806 3.617 3.505
Invested capital 8.318 8.536 7.823 7.785 7.787
ROIC 3,5% 4,5% 3,3% 4,3% 6,8%
NFP/EBITDA 3,9x 4,1x 4,2x 3,0x 2,6x
CAGR '14-'18 -1,3%

90
diversifying revenues sources has started some years ago and is planned to reach its goal with
further investments in production capacity that will boost company’s sales involving new
customers.
I.L.P.A.V. relies on five production lines that sum up to 24.000 tons of production capacity.
The large capacity makes the company one of largest players recycling low-density
polyethylene waste in Italy and the largest in the South of Italy. This leads to two competitive
advantages for the company: the first is the possibility to reach scale economies that positively
impact on product’s price offered (which is, according to Mr Cilio, is the main purchase driver
for customers); the second is the rising of switching costs for the largest company’s clients,
since they see I.L.P.A.V. as the only one player (looking for new suppliers in the North of Italy
or outside the country would lead to a steep rise in logistics costs) which can provide the volume
they need.
4.2.2 I.L.P.A.V.: growth strategy and thoughts about M&A trends
For building on its production capacity advantage, I.L.P.A.V. has already invested in a new
production plant. This new plant will bring production capacity to almost 40.000 tons on
recycled granules per year (+66%), thus consolidating its leadership in the southern area and
catching up with the growing trend in the industry. Moreover, the increase in production
capacity and the related new stream of revenues will help I.L.P.A.V. to overcome customers’
concentration.
In the next future, significant changes in the Italian plastic recycling industry are deemed to
occur. In particular, the most important trend sees recyclers moving downwards along the value
chain, towards compounding or even finished (or semi-finished) products’ production. Indeed,
size-reduction and purification bring high costs (energy, labour, maintenance) which are
difficult to justify with value added though these activities. Additionally, compounding and
finished products’ sale, according to Mr Cilio, can guarantee higher profitability.
This trend is faithfully represented by I.L.P.A.V.’s plans, which entail the opening of a brand-
new plant that will be dedicated to plastic bags production. This decision is based on three main
aspects considered by the Management.
1. Secure a way out for granules produced, thus allowing production plants to work at full
capacity.
2. Fully integrate recycling activities, for mastering the next step of the value chain,
enhancing profitability.
3. Distancing from the overwhelming concentration of clients.

91
4.3 Dieffe Srl
4.3.1 Dieffe: historical development, financials, and offerings
Dieffe Srl (hereinafter “Dieffe”) was established in 1990, by three entrepreneurs with different
backgrounds, as an import-export company which partnered with Slovakian state petrochemical
top management for commercializing virgin plastics (especially polypropylene and low-density
polyethylene) in Italy, to companies manufacturing gardening items.
During 2000s, Dieffe begun to foresee that the market was about to turn towards recycled
materials. Always careful and ready to seize new opportunities, the Company started to work
on new solutions based on regenerated plastics, trying to maintain quality and competitive
prices. Dieffe was able to develop new solutions, working with its client base and with a Czech
partner (fundamental for its reliability and technical skills).
Having seen the receptivity of the market and the adequate level of technical skills developed,
the Company decided to open a production plant (starting to operate in 2009) in Czech Republic
together with one of its partners.
Today, Dieffe is focused on post-industrial waste recycling (polypropylene, low-density
polyethylene, high-density polyethylene, and polystyrene). It partners with carefully selected
suppliers (operating in different markets) which can guarantee reliable volume and pure
materials. Dieffe’s clients’ range is wide: it spaces from producers of household items and
furnishing products, to the automotive and construction industries.
From 2009 (year in which the new plant came into operation) to 2014, the company shows a
vigorous growth in revenues starting from €4,29 mln and reaching €9,40 mln five years after
(CAGR ’09-‘14: 17%); then, Dieffe’s revenues stabilized around €9,5 mln (CAGR ’14-’18:
0,6%). EBITDA margin is quite low, averaging at 3,5% between 2014 and 2018, while net
income shown a considerable and consistent improvement due to income from the Czech
subsidiary (CAGR ’14-’18: 18,0%).
During the last five years, debt level stabilized slightly over €2 mln, with cash and cash
equivalents reducing over the years. It is noticeable a deteriorating situation with NFP/Ebitda
ratio reaching 5x, which is considerably above panel’s median value (1,69x).
The table below shows main financials of Dieffe between 2014 and 2018 (AIDA, 2020).

92
22. Table 4.4 Dieffe Srl, financials. Source: Aida, 2020
Mr Marco Durat, Ceo of Dieffe, was able to be interviewed by phone, the interview took place
on the 6th of December 2019.
Dieffe competes in the post-industrial recycling environment. Mr Durat judges fundamental the
selection of the right suppliers: being able to partner with large industrial manufacturers and
the possibility to rely on accurate internal analysis for assessing the quality of the waste utilized
as input are key elements for sustaining Dieffe’s offerings. These enable Dieffe to count on
reliable and predictable supplies (both in volume and quality). During its whole history, Dieffe
has nurtured long-term relationships with its suppliers, thus being able to offer highly reliable
products to its clients.
The distinctive trait of the company is the high quality of the service, that supports every aspect
of the Dieffe’s product offering: specific certifications, products monitoring, high traceability
of products.
The company is careful in avoiding clients’ concentration in terms of revenues, geography, and
market.
4.3.2 Dieffe: growth strategy and thoughts about M&A trends
Dieffe has always relied on internal organic growth, adding year by year new production lines.
The strategy for growing will remain the same in the near future. It is not perceived a need for
external growth and strategic partnerships.
Fundamental for maintaining a relevant competitive position within the industry is to keep up
with technological advancements in terms of output’s quality, traceability of supply chain and
DIEFFE SRL 2014 2015 2016 2017 2018
€.000
Total revenues 9.390 9.353 9.399 9.654 9.632
EBITDA 257 410 386 338 283
EBITDA Margin 2,7% 4,4% 4,1% 3,5% 2,9%
NOPAT 185 297 273 265 229
Net income 280 397 355 475 544
Equity 1.153 1.340 1.335 1.110 1.654
NFP 1.037 811 1.412 NA 1.407
Invested capital 2.190 2.151 2.747 NA 3.061
ROIC 6,9% 13,6% 9,9% NA 7,5%
NFP/EBITDA 4,0x 2,0x 3,7x NA 5,0x
CAGR '14-'18 0,6%

93
compliance with certification. Dieffe is convinced to have the assets that required for supporting
this technological development.
Mr Durat highlights the increasing activity in the industry as regard M&A operations, following
the macroeconomic trends regarding recycling. Interested buyers (aside from financial
investors) are chemical companies which are worried about the shift in demand from virgin
plastic to regenerated materials and try to get into this complementary market (both with
acquisitions and joint ventures). The most important synergies for chemical companies,
according to Mr Durat, are both on the supply side (being chemical companies huge producers
of waste) and on the conjoint development and distribution of new products (e.g. under
licensing agreements).
4.4 Caldara Plast Srl
4.4.1 Caldara Plast: historical development, financials, and offerings
Caldara Plast Srl (Caldara Plast), was established in 1963 in Erba (Como). Since then, it
engaged in the business of plastics processing, regeneration, and trading. The founder was
Innocente Cadara, precursor of the circular economy concept, who saw plastic industrial waste
as a great opportunity for reintroducing scraps (destined to the landfill) into the economy, as
regenerated plastics.
The business has been brought in the twenty-first century by three sons of Innocente:
Massimiliano, Attilio and Alessandro. In the early 2000s, Caldara Plast started its integration
process: during 2011, the company stepped decisively into further vertical integration of its
business opening a second production site (in Alzate Brianza, Como), dedicated only to the
compounding activity.
Plastic waste comes from firms operating in different industries, such as household items and
gardening, biomedical, communication, electronic, automotive. The main products are
compounds based primarily on acrylonitrile butadiene styrene (ABS), polycarbonate,
polystyrene, polyamide. Clients are plastic traders (when dealing with relatively small amount
of compound) or large industrial clients (some located in Italy and others in different European
countries).
Nowadays, Caldara Plast operates mainly as a post-industrial plastic recycler and compounder
with around 40 employees and nearly €13 mln of turnover. The Company showed a remarkable
growth path during the last five years: indeed, total revenues have grown at 10,2% CAGR over

94
the period. Ebitda margin (excluding 2017) is above the average and stable around 11%.
(AIDA, 2020)
23. Table 4.5 Caldara Plast Srl, financials. Source: Aida, 2020
Caldara Plast agreed to arrange a phone interview. Mr A. Piras (technical manager) and Ms F.
Gilardoni (G&A activities, speaking on behalf of M. Caldara) have been available on the 13 th
December 2019.
Caldara Plast stands out for being one of the players which have integrated various activities
along the value chain. It is the first link in the chain, taking care of the collection of plastic
waste directly on the client’s site, then it selects and regenerates plastic scraps bought.
Moreover, Caldara Plast not only takes care of selection and regeneration of plastic scrap, it
further processes these regenerated plastics for obtaining compounds.
The vertical integration on which Caldara Plast relies, allows the Company to get high margins,
thanks to a cheap procurement (because it has a direct connection with waste producers,
providing collection services) and the offer of a wide range of products (from regenerated
plastics, to various particular compounds).
The company can rely on a good diversification in terms of suppliers, thus being able to cope
with demand’s fluctuations, always guaranteeing the same quality.
4.4.2 Caldara Plast: growth strategy and thoughts about M&A trends
Caldara Plast’s Management is striving for sustaining the growth towards three directions. First,
the implementation on new products in the compound offering, second, sustaining technical
skills through partnerships with universities (Caldara Plast support a project for developing
biopolymers) at University of Pisa) and new technicians. Last, Caldara Plast is trying to expand
CALDARA PLAST SRL 2014 2015 2016 2017 2018
€.000
Total revenues 10.659 10.775 10.959 12.610 15.712
EBITDA 1.221 1.275 1.263 2.018 1.691
EBITDA Margin 11,5% 11,8% 11,5% 16,0% 10,8%
NOPAT 393 385 468 1.141 826
Net income 196 248 284 955 727
Equity 1.907 2.060 2.246 2.973 3.539
NFP 4.045 5.565 4.566 4.322 4.746
Invested capital 5.951 7.626 6.812 7.294 8.285
ROIC 6,7% 6,5% 6,1% 16,7% 11,3%
NFP/EBITDA 3,3x 4,4x 3,6x 2,1x 2,8x
CAGR '14-'18 10,2%

95
in new geographic markets (i.e. Spain and Germany) for distancing from the excessive
fragmentation of the Italian market.
Caldara Plast has never been part of M&A operations and it is confident about continuing to
grow organically. Their view on M&A trends in this industry considers two possible assets to
be acquired inorganically: clientele and authorisations/certifications. The latter, in particular,
can gain relevance for companies form other industries or other countries, since it can be very
difficult (or time consuming) to obtain specific authorisations for running recycling activities
in Italy.
4.5 Skymax Spa
4.5.1 Skymax: historical development, financials, and offerings
Skymax Spa (“Skymax”) is the Italian branch of Sky Plastic Group AG, a leading European
recycler and compounder established in 1993 in Austria. The Group operates two plant: the first
in Austria (Haimburg), the second one in Italy (Fonte).
Sky Plastic works mainly with post-consumer waste, specifically with four polymers:
polypropylene, polystyrene, LDPE and HDPE. Waste comes mostly from local waste
collectors; utilizing post-consumer waste, various sorting and purifying activities are required
and performed in the production plant.
Sky Plastic’s products find application in various sectors, such as: gardening, furniture,
construction, home appliances and automotive.
The company has been acquired in 2019 by GreenCycle Stiftung & Co. KG, in turn owned by
the Schwarz Group (one of the largest retail group in the world, running Lidl and Kaufland’s
retail chains). Thanks to this acquisition, Skymax is now part of an integrated group, which
masters almost every activity in the plastic circular chain (see chapter 5.4).
Looking at Company’s financials, stable revenues are highlighted (around €20 mln) but it can
be noticed a rising Ebitda margin: starting from 15,2% in 2014, Skymax reached 23,4% in 2018,
thus positioning the Company’s performance at the second place within the panel identified in
chapter 3.1.2. The largest enhancement is due to a decrease in the incidence of services on
revenues.
From the financial point of view, the Company seems particularly sound; in fact, despite last
year debt’s growth (probably financing part of the additional invested capital), NFP/Ebitda ratio

96
has been 0,4x on average (note that panel’s average is 2,91x), in the period 2014-2018. (AIDA,
2020)
24. Table 4.6 Skymax Spa, financials. Source: Aida, 2020
For assessing Skymax’s specific competitive advantages and competitive strategy, the
Company has been reached and Mr. Clemens Stockreiter, the CEO of Sky Plastic Group, was
able to answer the questions in-person, at Skymax’s offices in Fonte on the 8th of January 2020.
It has been immediately highlighted that the company has to be considered as part of Sky Plastic
Group and as a portfolio company of the Schwarz Group. Connections and synergies with the
Schwarz Group are detailed in chapter 5.4 and will not be repeated in this section. It must be
noticed that, since the acquisition has taken place at the end of 2019, the impact of synergies
with the Schwarz Group cannot be assessed by looking at the financials above.
Sky Plastic is focused mainly on post-consumer waste recycling, utilizing post-industrial waste
only for specific product requirements. Post-consumer waste is bought by local consortia (such
as Corepla, in Italy) or similar collectors’ organizations. Differently from post-industrial
recyclers, Sky Plastic can rely on advanced purification techniques, thus being able to recycle
both kind of plastic waste (post-industrial and post-consumer).
The Company presents two main competitive advantage with respect to competitors: deep
process know-how and vertical integration.
Thanks to the deep process know-how, Sky Plastic is able to provide tailor-made compounds
(derived from owned recipes) to its diversified range of clients. Developing a specific recipe
for each client helps the Company to retain its clients (develop a similar recipe with another
supplier would be very time consuming, thus raising switching costs), establishing long-term
business relationships and thus reducing revenues’ volatility.
SKYMAX SPA 2014 2015 2016 2017 2018
€.000
Total revenues 20.805 21.631 19.910 20.282 19.967
EBITDA 3.164 3.569 3.152 3.509 4.678
EBITDA Margin 15,2% 16,5% 15,8% 17,3% 23,4%
NOPAT 1.850 2.229 1.859 2.244 2.979
Net income 1.803 2.238 1.869 2.253 3.012
Equity 6.191 7.679 8.539 8.823 9.600
NFP 2.068 1.078 1.399 (127) 3.552
Invested capital 8.259 8.758 9.939 8.696 13.153
ROIC 22,2% 27,0% 21,2% 22,6% 34,3%
NFP/EBITDA 0,7x 0,3x 0,4x 0,0x 0,8x
CAGR '14-'18 -1,0%

97
According to Mr. Stockreiter, the main competitive advantage of Sky Plastic is vertical
integration. Indeed, as mentioned before, Sky Plastic is part of the Schwarz Group, which
controls leading retail chains and recently engaged in the recycling business. Within the
Schwarz Group are performed almost all the activities belonging to the plastic recycling circular
chain:
1. Waste generation. Supermarkets become the perfect spots to collect a huge amount of
plastic tertiary packaging. Moreover, we can see supermarket stores as the origin of
post-consumer waste, since they are the place where households buy products that will
be turned to waste.
2. Waste collection services. The Schwarz’ portfolio company GreenCycle is an
international waste management company, addressing different kind of waste, not
limited to plastic.
3. Transportation.
4. Recycling. Plastic recycling will be now performed through Sky Plastic Group.
After the production of new finished plastic products (the only step not performed internally),
products are back to the supermarket, thus closing the loop. This vertical integration within
such a large group (considering the entire group, revenues reach and exceed €100 bln) provides
Sky Plastic with considerable knowledge of the whole value chain, unmatchable purchasing
power and reliable (with regard to quality and volume) supply.
4.5.2 Skymax: growth strategy and thoughts about M&A trends
During its history, Sky Plastic Group has pursued growth through internal development,
increasing production capacity and process know-how. From Austria, the group has expanded,
exploiting replicable processes and the proximity to the industrially developed north eastern
area of Italy. This made Sky Plastic Group one of the first companies in Europe to have
developed its business in multiple countries (Austria and Italy).
Details about the Schwarz-Sky Plastic deal, its rationale and its impact on Skymax’s strategy
are discussed in chapter 5.4.
Leveraging the expertise, the resources deriving from belonging to a large group and the
favourably oriented trends within the industry, Sky Plastic’s Management evaluate further
geographical expansion in the area as an option for growth.
Mr. Stockreiter’s view on the M&A activity in this industry points out that plastic recycling is
on the edge of turmoil. Responding to global megatrends in legislation, trade and customer

98
perceptions, plastic recycling industry has come to the attention of large players operating in
proximate businesses trying to enter in this market, upward or downward integrating their
operations. Thus, in the next future, the most likely scenario involves these large industrial
players trying to reach different degrees of vertical integration by acquiring plastic recyclers.
Buyers’ industries can be varied ranging from chemical companies, to waste management
companies, to retailers and, with them, the specific reason for acquiring a plastic recycler, but
the path towards vertical integration seems clear. Industry consolidation is deemed as a residual
option for Italian recyclers.
4.6 Nuova Gandiplast Srl
4.6.1 Nuova Gandiplast: historical development, financials, and offerings
The Company has its origin in 1965, in Gandino (Bergamo, Italy), when Gianfranco Picinali
started to produce packaging bags, serving the burgeoning textile industry of the region.
Precisely looking at textile companies, the founder begun to reason about the fate of all the
plastic scrap deriving from packaging utilized by these firms, coming up with the idea of
collecting and recycling that plastic.
As one of the first pioneers in Europe, in 1973, Mr. Picinali conceived a process recovering and
recycling plastic waste. At that time, machinery and processes for this industry were not
developed, so the founder had to contribute to the design of machines, with continuous
adaptations and improvements. The Company (named “Gandiplast” at that time) started
recycling its own plastic waste, but soon agreed to accept plastic waste from other companies
of the area.
The Company, from the beginning of its activity, strived for effectively “closing the loop”;
indeed, it has always used post-consumer plastic for producing recycled plastic waste bags,
which are sold as final products and can be recycled again, after use. Moreover, Nuova
Gandiplast utilizes its own production scraps for new products, thus enormously reducing its
waste of resources.
Nowadays, Nuova Gandiplast is a company recognized in Europe for the quality of its plastic
trash bags, produced utilizing only low-density polyethylene polymers recovered from
commercial packaging (even if not “post-industrial” in a narrow sense, it is still benefiting from
a high level of purity).
While suppliers of raw materials (both as regard waste and plastic granules) are in Italy (nearby
Nuova Gandiplast, for the most), most products are marketed outside of the country.

99
Specifically, French, German, and eastern Europe markets are of the utmost importance for the
company.
Company’s revenues have grown by 4,5% CAGR over the period 2014-2018, reaching full
production capacity in 2018, thus a slowing down is expected in 2019. Ebitda margin shows an
impressive enhancing due to raw materials’ reduced incidence on revenues; this probably
originated from the price reduction in raw materials’ procurement (Nuova Gandiplast is among
the plastic recyclers which have benefitted from Chinese ban). (Financial data obtained from
AIDA, 2020)
25. Table 4.7 Nuova Gandiplast Srl. Source: Aida, 2020
Mr. Damiano Franchina (the manager in charge of purchasing and environmental offices)
granted an in-person interview, followed by a company visit on the 10th of January 2020.
Nuova Gandiplast masters an integrated process that starts from plastic waste recovered from
commercial packaging and obtains trash bags made of recycled LDPE. Since the internal
production of recycled plastic granules is slightly inferior to the volume required for satisfying
the demand of trash bags, the Company relies on a small number of external suppliers. These
are consolidated business relationships, very important for Nuova Gandiplast because of the
specific qualitative features they can provide.
Being among the pioneers in the industry, Nuova Gandiplast can leverage a deep know-how of
both the process and the market. It can boast exceptional efficiency rates in production and a
fine compound which is recognized in Europe for its quality.
Since the Company has integrated its process until final products, the main competition has
(mostly) shifted forward from plastic recycled to trash bags. Although this allows Nuova
Gandiplast to own a further step of the value chain (final products production), it has to be
NUOVA GANDIPLAST SRL 2014 2015 2016 2017 2018
€.000
Total revenues 6.794 7.454 7.834 7.802 8.095
EBITDA 173 329 556 1.109 1.496
EBITDA Margin 2,6% 4,4% 7,1% 14,2% 18,5%
NOPAT (51) 108 266 707 959
Net income (7) 93 271 679 918
Equity 1.319 1.412 1.683 2.032 2.450
NFP (1.055) (747) NA NA NA
Invested capital 264 665 NA NA NA
ROIC NM 40,9% NA NA NA
NFP/EBITDA -6,1x -2,3x NA NA NA
CAGR '14-'18 4,5%

100
noticed that it is competing in a market of commodities with low unitary margins, which
presents the risk of large competitors located in more favourable jurisdictions relying on lower
production costs. Despite this, the Company has been able to generate great performances (as
shown above) thanks to the considerable reduction in price of raw materials, due to the Chinese
ban on import, which has caused an excess in supply. Moreover, relying on trustful commercial
partnerships with both clients and suppliers, Nuova Gandiplast is deemed able to mitigate future
risks.
4.6.2 Nuova Gandiplast: growth strategy and thoughts about M&A trends
Nuova Gandiplast has always had the goal of obtaining the most efficient production process,
not only in terms of product quality but also in terms of low environmental impact. Indeed, it
has developed organically over the years, adding a second production line for processing its
own recovered industrial waste.
According to Mr. Franchina, a more integrated system in the Italian country is desirable and
Nuova Gandiplast is in the right position for managing the change. Unfortunately, the Company
has recently reached full capacity, thus meeting a cap in its expansion; in fact, not only market
conditions are judged uncertain but also implementing new production lines is difficult because
of space constraints imposed by the buildings in which the Company is operating. Options
evaluated for further growth are mainly business partnerships with other operators.
In Mr. Franchina’s view, the Italian industry has reacted (and it is still reacting) to major global
trends. Specifically, responding to the Chinese ban on imports on plastic waste, players already
operating in the waste management industry has shown interest for entering the plastic recycling
business; the aim is to overcome the limitations on waste exports, by exporting regenerated
plastic (instead of waste).
4.7 Dentis recycling Italy Srl
Dentis is a Cuneo-based company established in 1987 and specialized in PET recycling. Plastic
waste utilized as input can have a double origin: post-consumer (coming from separated
collection) and post-industrial. Thanks to its production capacity of 40.000 tons per year, Dentis
is one of the most relevant players of the country.
Dentis recycling is among the founding partners of Coripet, a consortium established on a
voluntary base and recognized in 2018 by the Ministry of Environment. The goal of the
consortium is the direct management of PET bottles. Entities associated to Coripet are PET

101
bottles producers, plastic converters and PET recyclers, notable examples are: Dentis recycling,
Aliplast, Ferrarelle, Lete, Gruppo Sanpellegrino, Garda Plast.
With a turnover equal to more than €28 mln, Dentis recycling is the fifth Italian recycler by
size. Dentis’ performance is remarkable also in terms of operating margin, 19% Ebitda margin
is the third best of the entire panel.
Additionally, net financial position is negative, meaning that the company is holding cash and
confirming the financial soundness of the industry. (AIDA, 2020)
26. Table 4.8 Dentis Recycling Italy Srl, financials (for the period 2014-2017, data
considered are those of De.Co.Ro. Srl). Source: Aida, 2020
On the 17th of January 2020, company’s Management agreed to be interviewed for better
understanding competitive dynamics of plastic recycling industry and to get insights on the
development of the Italian recycling industry.
Unfortunately, due to the confidentiality of information provided, the Company prefers not to
be directly quoted in this work. For this reason, even though insights gained during the
interview have been useful for developing the competitive analysis in chapter two, the
discussion about Dentis’ competitive strategy, growth plans and thoughts on M&A activity is
not reported.
4.8 Zeta Polimeri Srl
4.8.1 Zeta Polimeri: historical development, financials, and offerings
The company has been established in 1992 in Buronzo (Vercelli, Piedmont) by Domenico
Zulato, who could rely on a strong technical background accumulated during the Eighties in the
processing of plastic materials.
DENTIS RECYCLING ITALY SRL 2014 2015 2016 2017 2018
€.000
Total revenues 23.312 20.517 21.449 24.684 28.205
EBITDA 2.512 2.539 2.866 5.100 5.400
EBITDA Margin 10,8% 12,4% 13,4% 20,7% 19,1%
NOPAT 1.368 1.337 1.461 3.044 3.252
Net income 2.039 2.146 1.604 3.319 3.248
Equity 23.857 25.743 26.987 29.946 16.458
NFP 10.127 5.303 2.511 1.826 (2.694)
Invested capital 33.984 31.046 29.497 31.772 13.764
ROIC 4,6% 3,9% 4,7% 10,3% 10,2%
NFP/EBITDA 4,0x 2,1x 0,9x 0,4x -0,5x
CAGR '14-'18 4,9%

102
Zeta Polimeri is a plastic recycler specialized in the extrusion of polyamide and thermoplastics
waste to produce recycled polymers that will be utilized for plastic moulding or synthetic yarn
production. Main sectors for the application of Zeta Polimeri’s products are the textile,
automotive, domestic appliances, and power industries.
Since 2020, the Company is part of Gruppo Radici, a leading player in specialty chemicals and
synthetic fibres production.
Main financials of Zeta Polimeri are displayed on the table below (AIDA, 2020).
Company’s revenues grew by 70% during the period considered (2014-2018), which implies
an impressive compound annual growth rate of 14,3%. The growth is particularly pronounced
during the last couple of years, which have seen the introduction of a new product line: recycled
granules to produce synthetic yarn.
Zeta Polimeri is one of the best performers (within the selected panel) in terms of profitability;
indeed, it managed to largely improve its Ebitda margin during the years, reaching 18,7% in
2018. The improvement is mostly due to raw materials procurement, whose incidence as a
percentage of sales decreased by seven percentage points. Additionally, it seems that the
Company managed to sustain the growth keeping the same organizational structure, since
personnel’s cost is almost stable during the period.
Net debt level remained nearly unchanged during last five years, together with the surge in
Ebitda level drove down the financial soundness indicator considered (NFP/Ebitda).
27. Table 4.9 Zeta Polimeri Srl, financials. Source: Aida, 2020
For deepening the understanding of Zeta Polimeri, Ms Laura Zulato (the purchasing manager
of the Company) has been contacted and a phone interview was held on the 1st of June 2020.
ZETA POLIMERI SRL 2014 2015 2016 2017 2018
€.000
Total revenues 4.493 4.739 4.968 5.708 7.669
EBITDA 379 482 480 626 1.431
EBITDA Margin 8,4% 10,2% 9,7% 11,0% 18,7%
NOPAT 75 135 187 313 1.036
Net income 51 101 144 263 985
Equity 893 994 1.235 1.492 2.477
NFP 2.124 2.208 2.014 2.078 2.415
Invested capital 3.017 3.202 3.249 3.569 4.892
ROIC 2,5% 4,5% 5,8% 9,6% 29,0%
NFP/EBITDA 5,6x 4,6x 4,2x 3,3x 1,7x
CAGR '14-'18 14,3%

103
Zeta Polimeri has always been focused on the recycling of polyamide fibres coming from the
textile industry. Activities performed are the size-reduction and the extrusion. The output
obtained is constituted by recycled granules which find application in the three specific
industries: automotive, domestic appliances and power. During the last two years, the
Management chose to introduce a new product line, starting to produce a new kind of granules
specifically designed for the processing of synthetic yarn, thus addressing customers coming
from the same industry of its suppliers. This development of Zeta Polimeri’s offering helped in
maintaining a diversified customers’ portfolio.
The strategic issue was posed by the high concentration of suppliers. Indeed, there are very few
players (i.e. industrial manufacturers) processing polyamide yarn, thus making of the utmost
importance to nurture long term relationships with suppliers.
The offering of Zeta Polimeri is distinguished by the constant quality of its products (which, as
discussed before, is a key clients’ requirement), obtained thanks to the long-term relationships
with suppliers and the post-sale customer service, granting by the know-how of professionals
like Mr Domenico Zulato, which has more than thirty years of experience divided between
plastic materials processing and plastic recycling.
Moreover, the traceability of the entire Zeta Polimeri’s supply chain, allows the Company’s to
best exploit the recent trends in plastic consumption. Indeed, a significant number of plastic
converters started looking for green solutions to be introduced in their offerings. For those
clients, the possibility to rely on certified recycled products is fundamental.
4.8.2 Zeta Polimeri: growth strategy and thoughts about M&A trends
During its thirty years of history, Zeta Polimeri has always grown through production capacity
development and investing in technical expertise for keeping its offering’s value in line with
industry’s requirements. This path has been successful, leading the Company to double its
revenues over the last 10 years, always maintaining a high profitability.
In 2020, Zeta Polimeri has been acquired by Gruppo Radici, a leading Italian player in the
sectors of specialty chemicals, high-performance polymers, synthetic fibres and non-woven.
Being Gruppo Radici a major supplier of Zeta Polimeri, this was a chance to overcome one of
the main issues of its business, namely the scarcity of polyamide waste’s suppliers. Securing a
proper volume of homogeneous waste allows the Company to strengthen its offering and to
grow further.

104
On the other hand, Gruppo Radici’s transaction constitutes the perfect example of the vertical
integration trend seen by several players interviewed, with a large group lacking the internal
resources for entering the promising plastic recycling industry and choosing to directly acquire
a seasoned recycler, getting closer to closing the loop of activities within the group.
According to Ms Zulato, in the next future the path of vertical integration will be followed by
more and more Italian plastic recyclers, especially becoming target of large groups (as Gruppo
Radici is), thus strengthening bargaining power with respect to suppliers or customers.
4.9 Garbo Srl
4.9.1 Garbo: historical development, financials, and offerings
The Company has been established during 1997 under the name of Garbo Servizi srl, in Cerano
(Novara, Piedmont). Garbo is the leader in the recovery of products contained in the micro
abrasive mixtures utilized for cutting silicon wafers (fundamental for fabricating
semiconductors and photovoltaic panels). The first pilot plant opened in 1999, near a primary
silicon wafers producer. Products recovered includes silicon carbide and polyethylene glycol,
thus starting to build the know-how that is currently utilized for plastic chemical recycling.
In year 2000, Garbo Servizi srl started a joint venture with a German company designing
chemical processing machineries (AKW Apparate + Verfahren GmbH), which lead to the
establishment of SiC Processing GmbH. The growth of the photovoltaic sector allows the
advanced technology developed by SiC Processing to be spread in several plants around the
world.
In 2006 the joint venture has been terminated and Garbo srl was established, focusing (together
with its traditional activity) on developing innovative recycling technologies.
Recently, Garbo has managed to develop a revolutionary technology enabling to chemically
recycling plastic waste: the ChemPET project. The technology (and the process) developed
enables Garbo to obtain BHET, an intermediate in PET production, from the processing of those
PET scraps that currently outside mechanical recycling industry’s scope.
Notice that even though extensive trials have been performed with the pilot plant, the industrial
plant is not active yet, so considerations regarding economic profitability must be proved in the
next future.

105
For the same reason, financials of the company are not meaningful, since they depict the
historical business of Garbo (recovery of micro abrasive mixture form the cutting of silicon
wafer). They have been reported for the sake of completeness. (AIDA, 2020)
28. Table 4.10 Garbo Srl, financials. Source: Aida, 2020
For deepening the competitive strategy and the business model of one of the most innovative
players in the world, a phone interview was set on the 11th of February 2020. The person
interviewed was Mr Guido Fragiacomo, owner and Ceo of Garbo Srl.
Mr Fragiacomo, after giving an overview on chemical recycling (see chapter two), highlighted
the most important features characterizing Garbo’s offerings and the rationale behind its
strategy.
Garbo relies on glycolysis to return PET waste to its intermediate constituent, BHET; the latter
is then sold to PET producers, as raw material.
The choice of focusing on PET recycling through glycolysis derives from several reasons. First,
decades spent in the abrasive mixtures’ recovery activity allowed Garbo to accumulate a deep
know-how in liquid polymers processing; this know-how constitute an edge in managing BHET
(which behaves similarly to liquid polymers). Moreover, the company was looking for the
opportunity to diversify its business, distancing from the highly volatile silicon market and
plastic recycling seemed to be the right fit. Among different plastic polymers, PET was chosen
because, as explained in chapter two, it is (currently) nearly the only plastic polymer which can
be truly recycled through a chemical process; indeed, glycolysis allows to obtain BHET, which,
in the production process of PET is positioned just one step back with respect to the final
product (thus, converting the output of chemical recycling into second life raw materials is
straightforward).
GARBO SRL 2014 2015 2016 2017 2018
€.000
Total revenues 5.786 7.468 10.059 7.494 10.254
EBITDA 354 1.539 1.417 1.938 1.538
EBITDA Margin 6,1% 20,6% 14,1% 25,9% 15,0%
NOPAT (1.413) 418 424 1.054 608
Net income (1.768) 94 316 930 509
Equity 941 1.035 1.351 2.281 2.790
NFP 2.989 1.374 2.068 1.383 2.503
Invested capital 3.930 2.409 3.419 3.664 5.292
ROIC NM 10,6% 17,6% 30,8% 16,6%
NFP/EBITDA 8,4x 0,9x 1,5x 0,7x 1,6x
CAGR '14-'18 15,4%

106
The strategy of Garbo focuses on the entire spectrum of PET waste, excluding bottles. This is
a precise choice of the company, originating from a simple (but accurate) observation: PET is
one of the most utilized plastic polymers, thus being also among the most important plastic
waste category in terms of volume; currently, within this huge volume of PET waste, bottles
are almost the only waste category that is recycled, thus directing a considerable amount of PET
waste to landfill or incineration. Offering a process for recycling that waste allows Garbo to
benefit from an over-supply situation, where no other recycling company competes with Garbo
for acquiring this waste, which ends up costing nearly zero €/tons.
By now, main concerns about chemical recycling have not been about its effectiveness (in fact,
plastic derived from chemically recycled intermediates shows outstanding technical properties,
e.g. Garbo’s BHET received food-grade certification) but about its economic viability. Indeed,
when recycling PET waste different from bottles, the main issue is to purify this varied,
contaminated material; thus, the pre-treatment phase (constituted by different purification steps)
becomes of the utmost importance for chemical recyclers. Difficulties attached to the pre-
treatment phase (for example the manpower required) make the process economically
unsustainable for many players. However, this is exactly the area in which Garbo shows its
competitive advantage against other chemical recyclers. The Company has developed a
technology (a reactor) able to make PET selectively react with excess of ethylene glycol (EG);
functioning of this reactor requires just that input materials (i.e. waste) is shredded before
entering the reactor, with basically no additional purification needed. It will be the reactor itself
to “purify” the waste from contaminants, making selectively reacting PET polymers. Huge
savings in this area allows Garbo to offer better economic performance than competitors.
Note that, as highlighted above, the industrial plant has not started operating, yet.
4.9.2 Garbo: growth strategy and thoughts about M&A trends
Since ChemPET project is still a start-up, Mr Fragiacomo was asked about the strategy for
growing and the partnerships (or potential partnerships) the Company could leverage in the
future.
In this period, Garbo’s efforts have been directed to secure the sale of its output. The output of
Garbo’s process is BHET, which will be then utilized in PET production, so Garbo looked for
a partnership with PET producers. The result is an exclusive partnership with Plastipak
Packaging (through its subsidiary Plastipak Italia Preforme s.r.l.) one of the global leaders in
PET packaging production.

107
For the future, an alternative solution for securing sales is integrating the production step
immediately following BHET production, which is PET creation. PET is deemed to have such
a huge market that demand would not be an issue, according to Mr. Fragiacomo. Moreover, the
required technology for PET production (i.e. polycondensation) is available to Garbo, thus
making this option a viable strategy.
Mr Fragiacomo highlights that the most important partnerships will be upstream, with waste
management companies or other kinds of suppliers. Indeed, a potential issue for the industrial
operativity of the plant (or of the several plants, that will operate when the technology will be
spread abroad) is to secure a constant and adequate volume of supply presenting a suitable
degree of homogeneity. For this reason, Garbo has to discuss commercial or strategic
partnerships with waste management players of the countries in which it wants to operate,
examples are Corepla (Italy) and Veolia Environment (France-based global leader in waste
management).
To further grow Garbo’s proprietary chemical recycling technology, company’s plans entail the
sale of licensed turnkey plants to companies interested into entering the business. A partner for
the realization of new plants has already been found and several contacts interested in this
project have been reached.
4.10 Ansa Termoplastici S.r.l.
4.10.1 Ansa Termoplastici: historical development, financials, and offerings
Ansa Termoplastici has been established in 1973, in Bergamo as a post-industrial plastic waste
recycler (specialized in the compounding activity). At the beginning, the business of the
Company was closely related to two major Italian chemical companies at that time, Montedison
and EniChem, which were the reliable suppliers of the four materials processed by Ansa
Termoplastici: polymethylmethacrylate, ABS, polystyrene and polycarbonate.
During the early 2000s (2003/2004) the Company experienced a deep economic crisis
originated by the issues of the Italian chemical industry, which led Ansa to lose its main
suppliers. This turmoil drove the Company to downsize its operations and to integrate its main
activity (compounding based on post-industrial plastic waste) with compounding based on
mixes of r-polymers and virgin polymers.
Ansa Termoplastici faced a second moment of crisis in the period post 2008, which led the
Management to redefine the strategy of the company, implementing the extrusion activity; the

108
implementation required almost three years of training for the employees, who started the
extrusion machineries in 2013.
Nowadays, Ansa has continued along its integration path, starting the production of finished
goods for gardening and construction. The Company is also under the influence of an Italian
holding (Sover Polimeri Plastici Industriali Srl), which controls several companies in Europe
specialized in the manufacturing of solutions for the construction of walls and roofs (these
companies goes under the name “Rodeca”).
Ansa Termoplatici shows a solid growth path during the last five years (CAGR equals 5,3%)
which started back into 2013, the year in which, facing the deteriorating performances, the
Company moved toward extrusion.
Although positive, profitability is below median both for fully integrated recyclers and the
whole panel (the median Ebitda margin for the whole panel is 8,3%), with operating profits
struggling for remunerating the invested capital. The latter has considerably grown in 2018; a
possible explanation is the further integration of the manufacturing of finished products within
the scope of Ansa’s activity.
29. Table 4.11 Ansa Termoplastici Srl, financials. Source: Aida, 2020
For better understanding Ansa Termoplastici’s competitive offering, Mr Alessandro Conterno
has been reached and agreed to be interviewed on the 22nd of June 2020. Mr Conterno is the
ultimate owner of the Company and its Ceo.
Ansa Termoplastici developed through different phases of crisis, progressively integrating more
activities of the plastic recycling’s value chain, thus widening its offering.
ANSA TERMOPLASTICI SRL 2014 2015 2016 2017 2018
€.000
Total revenues 5.935 6.376 6.166 6.622 7.302
EBITDA 215 324 393 471 361
EBITDA Margin 3,6% 5,1% 6,4% 7,1% 4,9%
NOPAT (45) 35 68 34 (65)
Net income (195) (127) (96) (32) (108)
Equity 893 994 1.235 1.492 2.477
NFP 2.124 2.208 2.014 2.078 2.415
Invested capital 3.017 3.202 3.249 3.569 4.892
ROIC NM 1,1% 2,1% 1,1% NM
NFP/EBITDA 9,9x 6,8x 5,1x 4,4x 6,7x
CAGR '14-'18 5,3%

109
The integration of several activities allowed the Company to escape customers’ and suppliers’
concentration (which was very pronounced during the early 2000s, putting the Company a
dangerous position, as explained above).
Nowadays, Ansa offers four main product lines: compounds based on recycled polymers,
compounds based on a mix of r-polymers and virgin polymers, extruded recycled plastic,
finished products.
As regard extrusion, the Company can rely on a sophisticated know-how, which makes Ansa
appreciated by its clients, which face higher switching costs for substituting their supplier (once
they have developed a specific product with Ansa, it is very difficult to replicate the same result
with other suppliers). Turning to compounds, Ansa target a specific market segment, where
clients require just small volume of compounds; these clients are not interesting for the major
compounders.
As regard finished products, Ansa is developing its offering through the e-commerce channel,
with the aim of disintermediating the sale to final users.
4.10.2 Ansa Termoplastici: growth strategy and thoughts about M&A trends
During its history, Ansa has mostly relied on organic development, initially linking its activity
to the business of its main suppliers, then diversifying its activities and its offerings.
On the path of progressive integration followed, the Company is now focused on booting its
new e-commerce offerings. Basic finished products obtained from recycled plastics can lack of
attractiveness for distributors; this is why disintermediate distribution will prove effective in
the future.
According to Mr Conterno, the M&A activity’s impact on the plastic recycling industry will be
uneven. Indeed, in his view, the main target of possible acquisition will be players operating in
the post-consumer segment, while post-industrial recyclers (as smaller and more specialized
recyclers) remaining almost unaffected.
The overview on the future on the plastic recycling industry considers a path towards
consolidation, as size will become one of the main competitive advantages.
4.11 Interviews: conclusions
The Italian plastic recycling industry is populated by SMEs, which are usually family-run
businesses developed over several decades. Interestingly, within the group of interviewed
recyclers (which have been selected among the most relevant players in Italy), it is noticeable

110
a significant diversity in terms of business models adopted. First of all, the degree of vertical
integration greatly differs, with size-reduction and extrusion as common activities performed
by all the interviewees. Indeed, while Nuova Gandiplast is the perfect example of a fully-
integrated recycler (mastering all phases of the recycling process, from size-reduction to the
production of finished products), other players limit their activity to size-reduction, extrusion
and compounding (i.e. Caladara Plast, Skymax, I.L.P.A.V., Dieffe and Pebo), and finally Dentis
and Zeta Polimeri’s processing includes just size-reduction and extrusion. Moreover, players
are characterized by the origin of the waste processed and the polymers addressed by their
activity. In fact, post-industrial waste is the only kind of raw material utilized by Dieffe, Nuova
Gandiplast, and I.L.P.A.V. and Zeta Polimeri, while Skymax, Caldara, and Pebo have the ability
to process even post-consumer waste; among these players there are recyclers interested in
commodity plastics such as polyethylene, PET and polypropylene (i.e. Dentis, Dieffe, Skymax,
I.L.P.A.V., Pebo) while other others (i.e. Caldara and Zeta Polimeri) present a specific know-
how for processing niche materials as polyamide and ABS.
Thanks to the macro trends presented in chapter one (rising consumers’ awareness, EU
regulation and Chinese ban) the Italian recyclers are deemed to be placed in a favourable
position for growth and development. As expected, several of the players interviewed have been
able to follow the favourable macroeconomic conditions, pushing for growth. Indeed, when not
stable, Italian recyclers’ revenues show an impressive growth rate (see Caldara Plast, Nuova
Gandiplast and Zeta Polimeri). In particular, the Chinese ban’s influence has been clearly
perceived by players operating with post-consumer waste or tertiary packaging made of LDPE
(i.e. Skymax, Pebo, Nuova Gandiplast).
Supporting the issue pointed out by Mr Regis about historical difficulties in the industry as
regard the availability of supply (in terms of volume and quality), several players have
highlighted the importance to secure long term business relationships with their suppliers to
guarantee a constancy of volumes and qualitative features of their product offerings. This is
viewed as an authentic competitive advantage (as well as a barrier to entry the industry) by
post-industrial waste recyclers.
Confirming the high barriers to entry exhibited in chapter two, all the players interviewed are
long-lasting companies with at least twenty-five years of experience in the industry. Most of
these companies have pursued an organic growth strategy; a possible reason behind this choice
is their ownership structure: indeed, the large majority of these companies is a family-run SME,
which highly value independence and want to maintain the control of the firm. This choice has
probably slowed down the growth, keeping the companies small and within Italian borders. It

111
is significant that the only recyclers which have reached a certain degree of internationalization
constituting part of larger groups (i.e. Pebo, Dentis, Skymax) are among the largest and best
performing in Italy.
Plans for the next future and thoughts about M&A activity in the industry have been discussed
with interviewees. There is a general understanding that the Italian plastic recycling industry is
going towards a phase of pronounced development characterized by a dynamic M&A activity.
The most likely path is deemed to be the vertical integration, with large groups entering the
industry by integrating downwards or upwards; in particular, the interest of chemical companies
is clearly perceived by the interviewees.
In fact, two of the players interviewed have been involved in recent transactions. The first is
Skymax which, as part of Sky Plastic Group, has been acquired by the Schwarz Group in 2019,
one of the largest retail operators in the world (see chapter 5.4), the second one is Zeta Polimeri,
that has been acquired by Radici Group, one of its main suppliers of post-industrial waste.
As regard strategies for the next future, plans for rapidly increasing firm’s size are in place.
Indeed, gaining bargaining power against suppliers and customers is deemed a necessity for
contrasting large multinational groups entering the industry. This will be achieved through
strategic partnerships with other Italian players (thus maintaining the independence, as in the
case of Pebo and Nuova Gandiplast) or through M&A activity in which recyclers will constitute
the target for the integration strategy of their main suppliers or customers (see Zeta Polimeri
and Skymax). Interestingly, the I.L.P.A.V.’s strategy follows a slightly different path: it is still
pursuing an organic growth (adding two production lines for recycling polyethylene) aiming at
reaching economies of scale both in production and bargaining power, but it is also moving
downwards the value chain, opening a new plant for the production of plastic bags, thus partly
securing the sale of its regenerated polymers and differentiating its sources of revenues.

112

113
5 Selected transactions
Thanks to Capital IQ and Merger Market databases, main transactions having Italian companies
operating in the recycling industry as targets have been identified. They will be summarized
next (presenting the buyer, the target and the deal’s rationale), checking for confirmations on
potential trends in the industry and the rationale behind newcomers’ moves for entering in the
plastic recycling business.
5.1 Hera Spa’s acquisition of Aliplast Spa (2017)
5.1.1 Hera Group
Established during 2002 in Bologna, Hera Group is one of the main multiutility companies in
Italy. The Group is listed since 2003 on Borsa Italiana (MTA) and is part of the FTSE MIB
index (in the “blue chip” segment).
Hera Group originated (1st November 2002) from the merger of eleven city-owned multiutility
enterprises operating in the North of Italy (for the most part in the Emilia-Romagna area),
focused on energy, water, and waste management. Municipalities have remained among
shareholders of the Group; indeed, even after the listing, 47,6% of its shares is controlled by
state-owned entities.
During the last eighteen years, the Group has consistently and rapidly grown both organically
(investing in infrastructures and technology) and inorganically, with a long stream of
acquisitions of competitors and companies active in adjacent sectors, which has made total
revenues of Hera growing by a nearly 11% CAGR from 2002 to 2019.
Nowadays, Hera Group is presenting revenues over €7,2 bln, in 2019, has more than 9.000
employees and provides services to nearly 300 municipalities in Italy. Its operations are divided
in three main business activities.
1. Water services: collection, treatment, distribution, sewerage and purification. Through
its integrated service, Hera reached 3,6 million citizens, with 289,3 mln m3 of water
sold, in 2019.
2. Energy: gas, electricity, district heating and efficiency services. Hera is the third most
important player in gas and electricity sale and gas distribution. In 2018, the Company’s
gas business served 3,6 mln households, in 245 municipalities; turning to electricity,
sales reached 12,8 TWh of electricity sold, in 2018, to nearly 1,2 mln customers.

114
3. Environment: waste management and hygiene services. Through its subsidiaries
(Herambiente, Marche Multiservizi and AcegasApsAmga), Hera is active in more than
220 Italian municipalities, handling nearly 7,2 mln tons of waste. Its offering is
characterized by the integration of cleaning services, households, and industrial waste
collection (both urban and special), recovery and recycling of the whole spectrum of
waste.
(Gruppo Hera, 2020)
Main financials of Hera are presented below (S&P Capital IQ, 2020). Looking at the
Company’s financials, what stands out is the impressive revenues’ growth: organic growth and
acquisitions over the last five years have led to a CAGR higher than 11%. While Ebitda is
growing, its growth is much slower than revenues’ growth and profitability is steadily declining
to 13,1% in 2019; indeed, Ebitda margin seems quite low for the Italian industry, where
comparable multiutility companies such as Acea Spa and Iren Spa present higher and/or
growing margins.
The Company chose a balanced capital structure (D/E around 1,1x during the period
considered) and managed to keep nearly constant financial soundness indicators, as
NFP/Ebitda, always between 3,1x and 3,6x, during the period considered.
30. Table 5.1 Hera Spa, financials. Source: S&P Capital IQ, 2020
5.1.2 Aliplast
Aliplast has been established in 1982 in Ospedaletto di Istrana (Treviso, Veneto), by Roberto
Alibardi. The Company started to operate as a plastic waste collector in Italy, for then
integrating all the activities along the value chain over the decades. Indeed, already in 1985,
Aliplast integrated downwards, taking over the recycling activity. From the Eighties, it began
HERA SPA 2015 2016 2017 2018 2019
€ mln
Total revenues 4.729 5.391 5.926 6.445 7.266
EBITDA 788 794 849 891 949
EBITDA Margin 16,7% 14,7% 14,3% 13,8% 13,1%
NOPAT 284 291 355 358 408
Net income 181 207 251 282 386
Equity 2.358 2.418 2.545 2.661 2.809
NFP 2.847 2.735 2.651 2.731 3.438
Invested capital 5.205 5.153 5.196 5.392 6.246
ROIC 5,6% 5,6% 6,9% 6,9% 7,6%
NFP/EBITDA 3,6x 3,4x 3,1x 3,1x 3,6x
CAGR '15-'19 11,3%

115
a long stream of investments in technology and research that allowed, in 1992, to start the
production of film for packaging obtained from plastic waste, thus achieving full integration.
The Company developed during the decades becoming an international group including eight
companies spread over Italy, Spain, France, and Poland.
Nowadays, Aliplast is a leader in plastic recycling, managing 80.000 tons of plastic waste per
year (mainly PET, LDPE, HDPE, and PP). The company is well known for its pioneering
“closing the loop” approach. Indeed, the Company has integrated the whole recycling process:
it takes care of waste collection (at least with respect to post-industrial waste), it runs sorting
facilities and recycling plants, eventually it produces PE film for packaging (obtaining finished
products like PE film, it effectively closes the loop).
Aliplast shows a wide offering, including different regenerated polymers and finished products.
In particular: PET flakes and granules, LDPE granules for filming and blow moulding, HDPE
and PP granules for blow moulding, rigid PET film (obtained mixing recycled polymers with
virgin ones; suitable for food-contact applications), flexible PET film. Supplies for input
materials come from industrial or commercial companies (tertiary packaging) and households
(PET post-consumer bottles). (Aliplast, 2018)
As a fundamental pillar of the Aliplast’s approach towards recycling, there is the PARI System,
this system (which has had Aliplast as the main developer) entails the autonomous management
of a company’s own plastic waste. The PARI System is based on the company’s ability to
collect and directing to recycling an amount of plastic waste which is at least 60% of the total
volume of plastic released for consumption to the market. As a result, some of the main clients
of Aliplast (purchasing plastic film for packaging) also become its main suppliers (namely
Aliplast buys post-commercial packaging from these companies). (Aliplast, 2020)
This approach is not only sustainable, but it also constitutes a competitive advantage for
Aliplast. Indeed, acquiring plastic waste presenting almost no contamination, a clear
traceability and a certain composition (which is perfectly known, since plastic film that has
become waste, has been produced by Aliplast itself) allows the Company to obtain recycled
polymers presenting technical features nearly identical to virgin polymers.
The most relevant highlights on Financial statements of Aliplast Spa are presented on the table
below (AIDA, 2020).
Even though revenues are almost stable during the period, it is immediately noticeable the size
of the company (note that financials presented do not refer to the consolidated group’s financial

116
report), which is the largest (by far) within the group of plastic recyclers that are fully integrated.
Moreover, it is the second largest Italian plastic recycler, after Montello.
During the period 2014-2016, profitability (Ebitda margin) has suddenly risen from 5,6% to
14,5%, and then stabilized. In fact, the Company managed to slightly increase revenues from
sales, boosting total revenues with other revenues, while maintaining production costs almost
constant. This result is remarkable with respect to comparable recyclers (fully integrated
recyclers have a median Ebitda margin of 8,2%) and with respect to the entire panel of recyclers
considered (median Ebitda margin equals 8,3%).
From 2014 on, it can be noticed the considerable reduction in net debt level, which result in
comforting financial indicators, as NFP/Ebitda below 0,5x.
Invested capital, historically around €23 mln, soared to €35 mln in 2017, for new equity
investments worth €8 mln.
31. Table 5.2 Aliplast Spa, financials. Source: Aida, 2020
5.1.3 Hera-Aliplast deal
On the 11th of January 2017, Hera Group announced that its subsidiary Herambiente signed a
binding agreement with Aliplast Srl, for the acquisition of Aliplast Group. The deal entailed the
acquisition of the entire shareholders’ equity through three steps: the first 40% of share was to
be acquired during 2017, a further 40% would be purchased by March 2018, and the remaining
20% by June 2022. The Enterprise Value of Aliplast Group has been estimated in nearly €100
mln, which implies an EV/Ebitda multiple of 6,5x. (Gruppo Hera, 2017)
This transaction fits with the growth strategy of Hera Group, always opened to evaluate
inorganic options. Indeed, during its history, M&A activity has contributed to 40% of Hera’s
ALIPLAST SPA 2014 2015 2016 2017 2018
€.000
Total revenues 81.424 86.831 82.755 82.629 87.084
EBITDA 4.584 9.072 12.036 11.932 12.645
EBITDA Margin 5,6% 10,4% 14,5% 14,4% 14,5%
NOPAT 1.407 4.697 6.980 7.619 8.442
Net income 1.329 3.750 6.930 7.489 9.682
Equity 11.117 14.367 20.797 29.922 32.145
NFP 12.411 8.307 1.835 5.916 5.121
Invested capital 23.528 22.674 22.632 35.837 37.266
ROIC 5,6% 20,0% 30,8% 33,7% 23,6%
NFP/EBITDA 2,7x 0,9x 0,2x 0,5x 0,4x
CAGR '14-'18 1,7%

117
development through 41 transactions. The strategy is to extract value for Hera’s shareholders,
thanks to non-dilutive deals creating synergies through scale economies and cross-selling.
Target companies of these transactions are divided into two main groups:
1. Multiutility companies. These target companies are usually State-owned and run
activities under service concession arrangements. The geographical scope is focused on
the North-east of Italy since synergies are facilitated by geographical proximity.
2. Mono-business companies. They are enterprises running free-market activities like
waste management and sale of energy, usually controlled by private investors. These
transactions (about waste management businesses) have a broader geographical scope,
including the whole country. Indeed, the possibility of relying on waste management
plants (e.g.) near clients’ locations, is of the utmost importance for the efficiency of
logistics.
(Gruppo Hera, 2020)
Among the main goals of Hera Group, there is the promotion on Circular Economy’s practices,
taking responsibility of its central role, as a waste management company, in this paradigm shift.
In this regard, meaningful is the join of Circular Economy 100 Network (CE100), in 2017.
CE100 is the world most recognized program promoting Circular Economy in the business
world, set up by the Ellen MacArthur Foundation bringing together some of the most relevant
companies from all over the world (e.g. Google, Intesa Sanpaolo, Unilever) together with
innovators and academics for the launch of circular partnerships and research projects. (Gruppo
Hera, 2019)
The constant efforts towards sustainability led Hera to anticipate the achievement of Circular
Economy goals set by the European Union, indeed, areas served by the Group present the
following statistics:
1. In 2018, Hera Group sent to landfill just 5% of waste handled; the EU goal was to
achieve a 10% landfill rate by 2035.
2. EU target for packaging recycling rate has been set at 70%, to be achieved by 2030;
Hera Group reached 72% just in 2018.
3. The overall recycling rate for the Group (including different materials from plastic
packaging) is 53% (in 2018), while European goal is 55% to be achieved by 2025.
Hera’s services focus on every kind of waste, from glass, to wood, to plastic, through collection
services addressing both households (the total amount of urban waste handled by Hera’s sorting

118
centres reached 433.000 tons, in 2019) and industrial companies. With the aim of enhanced the
efficiency of waste management and of extracting value from waste handled, Group’s strategy
has turned towards materials recovery and recycling, not limiting anymore to collection and
sorting. (Gruppo Hera, 2019)
The acquisition of Aliplast fits into the context of Hera’s sustainability goals, entailing the
repositioning of the Company’s activities from waste collection to waste recovery and
recycling. Being, by far, the largest integrated Italian recycler, Aliplast was the proper target to
decisively enter the plastic recycling business. Moreover, it is one of the most technologically
advanced in the industry, offering finished products presenting technical features almost
identical to products obtained from virgin polymers. Indeed, Aliplast’s assets and process know
how allows Hera to close the loop and offering high quality services to its clients, with fully
integrated solutions from tailored waste collection, to the sale of finished products obtained
from plastic waste collected. (Gruppo Hera, 2017)
In addition, this transaction support the growth of Herambiente’s industrial clients’ portfolio,
coherently with the previous acquisitions of Waste Recycling (treatment and recovery of
industrial special waste) and Geo Nova (disposal facilities for hazardous waste originated
mainly from industrial companies). The aim is to complete the offering addressed to industrial
clients, widening the range of services related to waste management and waste recovery.
(Gruppo Hera, 2017)
The Hera-Aliplast transaction is exemplifying of the interest around plastic recycling industry
by large players operating upward in the value chain or in adjacent sectors, motivated by
offering enhancement and sustainability goals (multiutilities were, indeed, among the most
interested players identified by Italian recyclers interviewed). In this case, two patterns can be
seen. The first is the vertical integration, with Hera (leader in plastic waste collection and
sorting) taking over all the activities downward the value chain, for managing value-adding
activities which are deemed to grow in the next future. The second pattern is the horizontal
integration obtained by Hera, which was already offering integrated solutions for waste
categories different from plastic and which can now provide a full spectrum of waste
management services to its industrial clients.
By its side, Hera Group, together with financial resources, provides Aliplast a huge network of
industrial suppliers, thus improving procurement’s stability and giving the chance to avoid
suppliers’ concentration.

119
5.2 Sirmax Spa’s acquisition of S.E.R. Srl (2019)
5.2.1 Sirmax
The ancestor of Sirmax is Sirte Spa, established back in 1964 near Vicenza (Veneto), in Isola
Vicentina. The activity was focused on two dimensions: thermoplastic polymers
distribution/reselling and polyolefins (PE, PP) or styrene plastic production.
In 1997, Sirte merged with Maxplast Srl, a Padua-based company, established in 1992 in
Cittadella and specialized in polypropylene compounds; Sirmax Spa originated from the
merger, maintaining as main activities production and distribution of thermoplastic polymers.
The Company grew opening new plants and extending its network abroad, branching out in
France, Spain, Germany and Poland, during the early 2000’s. Together with new openings in
North America and Brazil, Sirmax achieved a strategic partnership with Borealis, the Austrian
leader in polypropylene and polyethylene production, becoming its official distributor.
Nowadays, Sirmax is a well-known provider of plastic compounds and plastic resins,
particularly active in Europe, where it is the second most important compounder of
polypropylene. Its offering is divided between PP polymers (the core offering), engineering
polymers and sustainable polymer (based on recycled plastic).
Sirmax’s deep know-how in plastic compounding makes it the perfect partner for players of a
large variety of sectors, presenting different requirements in terms of technical and aesthetical
features. Main clients of Sirmax operate in the following industries: automotive, home
appliances, household products, power tools, furniture, electric/electronical appliances.
Production plants are spread around the world, being in Italy, Brazil, Poland, United States and
India.
Sirmax’s financials are presented on the table below (AIDA, 2020).
The Company shows an impressive growing path during the period considered; indeed, a 16%
CAGR has been achieved. The growth highlighted on the table have been fuelled by a precise
strategy, entailing green field operations for backing international expansion (in fact, during the
period 2014-2018, the Company opened two new branches in North America and Brazil)
together with acquisitions (in 2016, Sirmax acquired Nord Color s.r.l., an Italian techno-
polymer producer) and the joint-venture Autotech Sirmax India (expansion in India has been
obtained thanks to a partnership with Autotech Polymers India Private Limited, Indian pioneer
in the plastic industry).

120
The Company seems financially sound, as NFP/Equity ratio is consistently under 100% and
NFP/Ebitda averaging at 2,6x. Profitability, represented by Ebitda margin and Roic, has been
improving until 2019, which, despite the growth in revenues, sees a decrease in the Ebitda due
to an unusual consumption of raw materials’ stock.
The impressive growth in capital invested (14,3% CAGR) is largely explained by the
investments in new plants abroad and the consolidation on Nord Color Srl.
32. Table 5.3 Sirmax Spa, financials. Source: Aida, 2020
5.2.2 S.E.R.
S.E.R. Società Europea di Rigenerazione was founded in Salsomaggiore Terme (Parma, Italy),
in 1988, by engineer Michele Robbe.
The Company is a plastic recycler carrying on the size-reduction activity together with
subsequent extrusion and compounding. Input materials origin both from post-consumer waste
(i.e. packaging coming from urban separate collection) and post-industrial waste (mainly from
automotive and house appliances industries).
S.E.R.’s offerings include polymers and compounds based on low-density polyethylene, high-
density polyethylene, polypropylene and polystyrene, addressing a wide span of application
sectors.
The Company has been an associate of Assorimap (see chapter three) and also served (in the
person of its founder and Ceo) as Italian recyclers’ representative in the Board of Directors of
Corepla.
After thirty years of growth, the Company has passed €15 mln revenues and employs around
30 employees.
SIRMAX SPA 2014 2015 2016 2017 2018
€.000
Total revenues 157.449 172.866 215.549 257.028 286.128
EBITDA 10.397 13.936 20.432 25.600 22.166
EBITDA Margin 6,6% 8,1% 9,5% 10,0% 7,7%
NOPAT 5.250 10.335 12.607 13.528 12.432
Net income 5.116 7.568 14.263 11.541 11.724
Equity 45.020 51.525 63.391 68.734 70.861
NFP 31.321 43.669 48.864 41.521 59.513
Invested capital 76.341 95.194 112.255 110.255 130.375
ROIC 6,7% 13,5% 13,2% 12,1% 11,3%
NFP/EBITDA 3,0x 3,1x 2,4x 1,6x 2,7x
CAGR '14-'18 16,1%

121
On the table below (AIDA, 2020) it is noticeable the consistent growth of the Company during
the last five years period. Starting from nearly €11 mln revenues in 2014, S.E.R. grew each
year, passing €15 mln revenues in 2018, thus implying a CAGR of 8,5% over the period.
Along with growth, the Company managed to enhance its Ebitda margin by 3,5 percentage
points. What is noticeable is the trend of raw materials’ cost; indeed, its incidence over revenues
decreases in 2017, and the same does its absolute value, despite the growth in revenues, thus
suggesting a decrease in raw materials’ prices during that year. Interestingly, the year after
(2018) sees a considerable increase in the incidence of raw materials, in stark contrast with the
context provided by chapter one, which described that, with the entry into force of the Chinese
ban, prices of many kinds of plastic scrap immediately plunged.
The improvement in marginality coupled with revenues growth, clearly reflects on net income,
which started from a warrying situation with no earnings in 2014, to €490.000 income after four
years.
Historically, S.E.R. presents a negative net financial position, thanks to the large cash accounts
it holds. This did worsen during the period, reaching nearly €800.000 net debt in 2018. Debt
increase can be linked to the new investments in fixed assets (which soared, leading to a 65%
increment in the invested capital) backing efforts for growing and necessary in such a capital-
intensive industry.
33. Table 5.4 S.E.R. Srl. financials. Source: Aida, 2020
5.2.3 Sirmax-S.E.R deal
On the 13th of March, Sirmax announced the acquisition of S.E.R.; the transaction included the
entire shareholders’ equity, which is transferred from Mr Robbe (founder and Ceo of S.E.R.)
S.E.R. SRL 2014 2015 2016 2017 2018
€.000
Total revenues 11.047 13.084 14.322 14.805 15.304
EBITDA 370 468 788 841 1.062
EBITDA Margin 3,4% 3,6% 5,5% 5,7% 6,9%
NOPAT 14 105 329 367 582
Net income 7 88 290 327 490
Equity 4.385 4.474 4.764 5.091 5.570
NFP (516) (1.012) (334) (583) 817
Invested capital 3.870 3.462 4.430 4.508 6.388
ROIC 4,0% 2,7% 9,5% 8,3% 12,9%
NFP/EBITDA -1,4x -2,2x -0,4x -0,7x 0,8x
CAGR '14-'18 8,5%

122
to Sirmax Spa, the former Ceo maintaining its office. No disclosure about financial details of
the transaction has been granted. (Sirmax, 2019)
During its long history, Sirmax has rapidly grown with the stated aim of becoming a
multinational group and extending its product offering. For achieving this goal, the Company
has undertaken both greenfield and brownfield investments.
Examples of the first approach are brand new plants opened in Poland (2006), Brazil (2014)
and U.S.A. (2015), which helped Sirmax in increasing its production capacity (mainly focusing
on polypropylene compounds) and getting closer to its clients.
On the other hand, the Company has completed strategic acquisitions during the years,
implementing new solutions in its products’ portfolio and deepening its know-how in techno-
polymers production. The most important are: Arcomax (acquired by Sirmax for consolidating
its distribution network, in 2002), Nord Color (taken over in 2015, strengthening Sirmax’s
products’ portfolio with complementary techno-polymers), Microtec (Italy-based biopolymers
producer, acquired in 2019) and S.E.R..
Receptive to global trends, Sirmax’s strategy has leaned towards sustainability, incorporating
new solutions and businesses based on the principles of Circular Economy. This turning is
embodied in the strategic plan 2019-2021, which includes nearly €80 mln to invest for doubling
Sirmax’s turnover and diversifying Sirmax’s business into sustainable products. (Sirmax, 2019)
This plan entails two guidelines: post-consumer plastic recycling and bio-based polymers. The
latter has led to the acquisition of the Venice-based Microtec in 2019. The target is a bio-based
compound producer, specialized in compostable flexible packaging solutions. The total
investment will be of nearly €20 mln, including both the acquisition and the extension of the
currently operating plant. (Polimerica, 2019)
Instead, for entering the post-consumer plastic recycling business, Sirmax has identified S.E.R.
as the suitable target. Alongside with commitments for sustainable developments, the main goal
of Sirmax was to respond to its main clients’ requirements for new green solutions. Indeed, the
acquisition of S.E.R. has allowed the two companies to exploit know-how synergies and starting
projects with the main Sirmax’s clients for the development of polymers which obtained
(entirely or partially) from recycled plastic and that can be used for structural components for
the automotive sector and the house appliance sector.
The important commitment of Sirmax to post-consumer plastic recycling did not stop to the
acquisition of S.E.R.; indeed, for supporting the whole production of a company of the size of

123
Sirmax, a different scale was needed. For this reason, the Company heavily invested for the
revamping and the enlargement of S.E.R.’s facilities in Italy (investing almost €12 mln for
doubling production capacity to 34 ktons and building a new R&D laboratory) and announced
the project of a new recycling plant in Anderson (Indiana, U.S.A.). The latter will be a
duplication of S.E.R.’s facilities and processes, which will have an estimated cost of $17,6 mln.
Concluding, it’s clear that, on the path for becoming a global player in the Circular Economy,
the acquisition of S.E.R. is instrumental for Sirmax. The main asset acquired by the Company
is the plastic recycling know-how of a long-standing Italian player. This allows Sirmax to enrich
its product offering with green solutions that are required my its main clients and gives Sirmax
the chance to replicate S.E.R.’s processes for rapidly expanding its production capacity.
5.3 Gurit Holding AG’s acquisition of Valplastic Srl (2019)
5.3.1 Gurit
Gurit (Gurit Holding AG) is a Switzerland-based group, leading supplier of high-performance
plastic composites. The holding is listed on the Swiss Exchange (SIX).
The Group has been founded in Wattwil (Switzerland) by George P. Heberlein, in 1835, initially
operating as manufacturer of synthetic fibres for the textile industry. It is 1929 the year in which
Gurit begun the path for becoming the today’s entity; indeed, that year several factories
producing rubber and synthetic foam have been opened, thus entering the business of synthetic
materials production. During Sixties, Gurit acquired a series of companies (Còltene, Arova,
Worbla), entering the dental products business and reinforcing its know-how in synthetic fibres
production. In year 1968, Gurit established a joint venture with the leading American chemical
company, Essex Chemical. The joint venture (Gurit-Essex) was focused on the production of
components for the automotive industry.
Between year 1999 and 2000, Gurit sold its shares of the joint venture to the partner (now Dow
Chemical) and spun-off Heberlein textile, the Company’s division dedicated to textile industry.
These operations allowed Gurit to narrow its portfolio of activities down to chemical and
plastics, focusing on adhesive/sealing systems, dental and health care products, and other highly
technical materials. This progressive process for narrowing down Gurit’s focus continued in
2006, when the Group decided to separately list Medisize, the Group’s company dedicated to
the healthcare business.
Together with this divestment path, Gurit begun a sequence of acquisitions for becoming a
leading global player in composite materials. The Company acquired Stesalit (dedicated to the

124
aerospace industry) in 2000, SP Systems (materials for wind/marine energy) in 2002, AIK
(aerospace) in 2002, ATC (structural composites) in 2003, China Techno Foam (PVC) in 2009,
Red Maple (manufacturer of equipment for composites production) in 2009, Balseurop (balsa
wood materials).
Nowadays, Gurit Holding AG is a leading group in manufacturing and supplying of high-tech
composite materials, with a specific focus on core materials for wind turbines blades. The
Group provides advanced composites for other industries, among which aerospace, marine
energy, automotive and transportation.
Gurit strives for sustainability, promoting a transition towards renewable energy, a carbon
neutral business and a transition to sustainable materials. In 2019, the adherence to
environmentally sustainable principles has been explicitly incorporated into Company’s vision:
“With passion for a sustainable future”.
Gurit Holding AG’s main consolidated financials are presented on the table below (S&P Capital
IQ, 2020).
The Group presents almost flat revenues until 2018, the year in which JSB Group (leader in
core materials kits production for wind turbines blades) has been acquired. Only JBS’s last
quarter has been consolidated by Gurit in 2018 financial statements (explaining most part of
the 21% growth in revenues); the full impact of JBS’s consolidation can be seen in 2019, when
it is noticeable an additional 36% increase in total revenues.
There has been no capital increase during the period, but nearly the entire amount of earnings
has been retained. Net debt’s level is subject to a particularly rapid change between 2017 and
2018, when it passed from nearly €40 mln of cash available, to €75,6 mln of net debt. This
originated from nearly €100 mln of debt raised during the year, which is probably instrumental
to the acquisition of JBS and Valplastic. New debt raised do not create concerns, apparently,
since NFP/Ebitda and D/E ratios are much below warning thresholds.

125
34. Table 5.5 Gurit Holding AG, financials. Source: S&P Capital IQ, 2020
5.3.2 Valplastic
Valplastic was established in year 2000, in Carmignano di Brenta (Padua), as part of the IMP
Group. The Group is active since 1949 in the textile industry (manufacturing synthetic fibres)
and the construction industry. The Group entered the 21st Century expanding the scope of its
activities; indeed, it has established two new companies (Valplastic in Italy and I.M.P. Polowat
in Poland) specialized on the production of polyester fibres originated from the recycling of
post-consumer PET.
According to the mission of developing high-performance synthetic fibres while limiting the
environmental impact, the Company has grown supporting the main business of IMP Group,
namely textile activity. Valplastic’s offering is focused on regenerated PET granules and
regenerated PET flakes, obtained from urban post-consumer waste (i.e. mainly plastic bottles).
Valplastic’s financials (AIDA, 2020) show a significant decrease in revenues (CAGR equals -
10,4% during the period considered) highlighting difficulties of the parent company, which
constitutes Valplastic’s main client and a possible shift of the activities towards the other
recycling company of the Group, I.M.P. Polowat (located in Poland). Operative profitability is
negative, thus being in stark contrast with Ebitda margin shown by Valplastic’s peers,
suggesting the need for further analysis; a possible explanation of the reduced marginality could
be the lack of transparency of the Group’s organization: indeed, the Group does not provide
consolidated financial statements, thus leaving room to intragroup practices which can lead to
a company’ specific profitability that does not reflect the real operative performance of the
Company.
GURIT HOLDING AG 2015 2016 2017 2018 2019
€.000
Total revenues 339.489 332.473 321.145 387.856 527.396
EBITDA 41.444 45.646 43.610 52.067 72.063
EBITDA Margin 12,2% 13,7% 13,6% 13,4% 13,7%
NOPAT 22.798 26.769 25.582 35.401 47.330
Net income 21.323 24.587 23.550 18.975 33.596
Equity 169.527 180.227 194.710 118.138 137.883
NFP (19.200) (35.100) (30.900) 75.603 50.010
Invested capital 150.327 145.127 163.810 193.741 187.893
ROIC 14,3% 17,8% 17,6% 21,6% 24,4%
NFP/EBITDA -0,5x -0,8x -0,7x 1,5x 0,7x
CAGR '15-'19 11,6%

126
35. Table 5.6 Valplastic Srl, financials. Source: Aida, 2020
5.3.3 Gurit-Valplastic deal
On the 1st of July 2019, Gurit announced the completion of the acquisition of Valplastic Srl’s
PET recycling facilities which would have been conferred to the newly incorporated Gurit Italy
PET Recycling Srl. The transaction resulted in nearly €2 mln (cash) for the entire recycling
facilities. (Gurit Holding AG, 2020; Gurit Holding, 2019)
The transaction is part of Gurit’s revised strategy, leaning towards sustainability. The
Company’s plan is to shift from the use of thermosets (which, as highlighted in chapter one, are
very difficult to be recycled) to the utilization of more sustainable thermoplastics. Among
thermoplastics, PET is deemed the most suitable for Gurit’s wind turbines blades’ core
materials. The Company has invested for five new production lines for PET extrusion between
2019 and 2020.
Within the program for improving the sustainability impact of Group’s activities, there is the
development of KerdynTM Green, a lightweight core material entirely made of recycled PET
bottles, which shows outstanding properties in terms of high temperature bearing, chemical
resistance and mechanical properties. The goal is to continue investing in PET recycling and
research on thermoplastics for being able to substitute a wide range of current product offerings
with recycled PET.
The acquisition of Valplastic is instrumental to Gurit’s plan under three aspects:
1. The acquisition of an operating plant with a production capacity of 35.000 tons/year
enables Gurit to rapidly enter the plastic recycling industry and to dispose of a
considerable production volume for supporting an entirely new Gurit’s product line.
VALPLASTIC SRL 2014 2015 2016 2017 2018
€.000
Total revenues 14.364 8.419 7.670 8.571 9.251
EBITDA (428) (584) 133 (1) 505
EBITDA Margin -3,0% -6,9% 1,7% 0,0% 5,5%
NOPAT (535) (643) 118 (48) 268
Net income (528) (863) (109) (237) 175
Equity 1.579 716 584 357 540
NFP 945 187 (557) (347) (819)
Invested capital 2.524 903 27 9 (279)
ROIC NM NM 13,1% NM NM
NFP/EBITDA -2,2x -0,3x -4,2x 234,3x -1,6x
CAGR '14-'18 -10,4%

127
2. The high performance required to Gurit’s products impose to dispose of high-quality
feedstock, strictly controlled and properly blended for extrusion. For securing the
constant quality and volume of recycled PET needed, the direct control of this step of
the value chain is fundamental.
3. The plan of the Company will not stop at the acquisition of Valplastic but will proceeds
with capacity expansion (which is fundamental for sustaining the products lines of a
manufacturer with the size of Gurit). For increasing capacity while maintaining the high
quality of products and adhering to the “region-for-region” approach of Gurit, the
possibility to replicate Valplastic’s facilities in other countries is of the utmost
importance. It is clear that the choice of Gurit to directly invest in Valplastic’s plants,
allows the Group to acquire a specific and replicable process know-how that would have
been unreachable, otherwise.
(Gurit Holding AG, 2019)
This transaction, similarly to the Sirmax-S.E.R. case, entails a leading producer of plastic
specialties which directs its future strategy towards sustainability, responding to the shift in
global demand. New clients’ requirements push leading players to rapidly respond to the trend;
the fastest solution for adapting is deemed to acquire a seasoned plastic recycler that brings
immediate production capacity and a know-how that is not only replicable but also fundamental
for achieving the high-level performance Gurit’s (or Sirmax’s) clients are used to.
5.4 Schwarz Group’s acquisition of Sky Plastic Group AG (2019)
5.4.1 Schwarz Group
The Schwarz Group is a family-owned German group of companies which runs the fourth
largest retail business (Deloitte, 2020) under the Lidl and Kaufland brands.
The history of the Group begun during the Sixties when Josef Schwarz opening the first cash
and carry store in Heilbronn, followed by a supermarket in Backnang. In 1973, the first Lidl
opened, while the first hypermarket started operating in 1984, in Neckarsulm (which is still the
Group’s headquarter). The Nineties saw the expansion of Lidl and Kaufland’s businesses all
over Europe, beginning from France and Czech Republic.
Nowadays, the Schwarz Group can count on over 12.000 branches, spread over more than 30
countries around the world. The activities are divided into five different divisions:
1. Discount supermarkets: under the brand Lidl, the Group is represented by 10.800 stores
(as of 2019), distributed over 30 countries.

128
2. Hypermarkets: Kaufland is defined as a “full-range” retailer, as it offers a wide range
of food and non-food products.
3. Production: Schwarz Group operates Mitteldeutsche Erfrischungsgetränke, Bonback,
Bon Gelati, and Solent, which are active in food production for suppling Lidl and
Kaufland.
4. Recycling: GreenCycle is the vehicle through which the Schwarz Group pursues its
strategy towards sustainability. Mainly operating under the brand PreZero, GreenCycle
is a leading waste management company active in recycling, energy management and
logistics.
(Schwarz Dienstleistung KG, 2019)
The Schwarz Group is a major supporter of the Economy’s shifting towards a circular model
and has confirmed the commitment to sign up the Ellen MacArthur Foundation’s Global
Commitment. Schwarz’s Management has formalized a detailed list of goals pursued thanks to
the coordination of its different business areas. As part of these efforts, in 2018 the Group
conceived a strategy for a sustainable revolution of plastic management along its value chain
(it is named “REset Plastic”, and it is explained in 5.4.3).
5.4.2 Sky Plastic Group
Sky Plastic Group has been established in 1993 in Haimburg (Austria) as a plastic recycler and
compounder. Nearly ten years later, the Group expanded, opening a new production plant in
Fonte (Italy), which operates as Skymax Spa. Overall, the Group employs nearly 150 employees
(110 in Austria and 40 in Italy) and presents a total production capacity of 105.000 tons/year.
Sky Plastic Group’s offering includes PP, LDPE, HDPE, and PS compounds, obtained from
both post-consumer (the most part) and post-industrial plastic waste, collected (by third parties)
in Germany, Austria, and Italy. The range of application sectors for Sky Plastic products is
wide, spanning from automotive, to construction and home appliances.
Main consolidated financials of Sky Plastic Group are then presented (Amadeus, 2020).

129
36. Table 5.7 Sky Plastic Group AG, financials. Source: Amadeus, 2020
5.4.3 Schwarz-Sky Plastic Deal
On the 1st of October 2019, GreenCycle Stiftung & Co. KG, the recycling arm of the Schwarz
Group, announced the acquisition of Sky Plastic Group (effective from the beginning of the
year). The two parties agreed to not disclose financial details of the transaction. (Sky Plastic
Group AG, 2019)
As introduced before, the Schwarz Group strives for sustainability and, for this reason, it has
conceived a broad strategic plan focused on limiting the environmental impact of plastic
utilization: REset Plastic. This strategy is based on five pillars:
1. Reduce. It entails the constant efforts in seize opportunities for limiting the utilization
of plastic materials along the entire Group’s value chain.
2. Redesign. With particular regard to packaging, the Schwarz Group’s focus has been put
also on the designing activity. The goal is to design effective packaging solutions which
present the lowest weight and the highest level of recycled materials possible.
3. Remove. It entails the cooperation between the Group and external organizations trying
to remove plastic waste from the environment.
4. Research. The Schwarz Group has established important partnerships with research
institutes and industry organizations focusing on enhancing recycling practices,
experimenting alternative materials, and reducing plastic utilization.
5. Recycle. In the Group’s view it includes collection, sorting and recycling, always
keeping the focus on “closed-loop” solutions.
(Schwarz Dienstleistung KG, 2019)
SKY PLASTIC GROUP AG 2014 2015 2016 2017 2018
€.000
Total revenues NA 50.832 44.548 45.756 48.787
EBITDA NA 5.960 3.721 6.382 6.165
EBITDA Margin NA 11,7% 8,4% 13,9% 12,6%
NOPAT NA 3.483 1.396 3.133 2.493
Net income NA 3.293 1.188 2.672 2.277
Equity NA 12.831 7.630 10.258 12.286
NFP NA 14.716 18.606 17.224 33.534
Invested capital NA 27.547 26.236 27.482 45.821
ROIC NA NA 5,1% 11,9% 9,1%
NFP/EBITDA NA 2,5x 5,0x 2,7x 5,4x
CAGR '15-'19 -1,4%

130
Established in 2009 as a result of Lidl’s consolidated experience in waste disposal, GreenCycle
operates sustaining the fifth pillar of the REset Plastic strategy, being an international waste
management company active in managing the waste disposal activities for Schwarz Group’s
companies and for third parties (services provided to third parties are offered under the brand
PreZero). This business area has seen the entry of a new entity: Tönsmeier Group. Tönsmeier
is one of the largest waste disposal companies in Germany (revenues reaching nearly €500 mln
in 2017), which entered in the Group during 2018, acquired by GreenCycle.
Sky Plastic Group’s acquisition fits as part of these efforts for reinforcing Group’s waste
treatment activities and pursuing the goals set with REset Plastic strategy.
It is important to highlight that the two parties had a long-standing business partnership. Indeed,
Sky Plastic Group was already processing raw materials originated from the disposal services
of GreenCycle. From this perspective, the operation constitutes a significant vertical integration
for GreenCycle which appropriates the next three activities performed along its value chain
(shredding, extrusion, and compounding).
As highlighted by Dietmar Böhm, CEO of GreenCycle, Sky Plastic Group’s acquisition was an
outstanding opportunity for rapidly acquiring a deep know-how in plastic recycling industry,
accumulated over 26 years. According to Mr Böhm, this serves two purposes, the first is to
enhance the value-added of GreenCycle’s activity, the second is to use Sky Plastic as a platform
for further growth. (Sky Plastic Group AG, 2019)
In fact, further growth is needed to support the ambitious REset’s holistic approach, which
encompasses the entire spectrum of activities of the Schwarz Group. The goal is to effectively
close the loop within the Group’s activities, utilizing the retail business as a pivot for the circular
practices. Indeed, discounts and hypermarkets (i.e. Lidl and Kaufland) naturally produce a huge
amount of plastic waste in the form of commercial packaging, which is highly valuable thanks
for its homogeneity and the ease of collection; at the same time, large retailers become the
proper vehicle for selling goods obtained with plastic recycled by the other companies
belonging to the Group.
5.5 Transactions: conclusions
Considering the main transactions occurred during last three years in the plastic recycling
industry, different players and different specific deal rationales can be seen. However, some
common underlying strategies and trends can be identified.

131
Notwithstanding the core business of the buyer (virgin plastic production, specialty materials
development, waste management, retail), all of the companies explicitly include sustainability
goals in their strategic plans (Schwarz and Sirmax) and/or in their vision (Gurit). Plans towards
sustainability are presented as an inorganic growth’s path or a comprehensive program like the
Schwarz’s REset Plastic strategy. Their commitment is certified by adherence to prestigious
international organizations (e.g. Ellen MacArthur Foundation) striving for spreading circular
economy practices around businesses and households.
Three out of four cases present the traits of vertical integration, with Hera and Schwarz
acquiring plastic recyclers for integrating their waste management business with activities
positioned immediately downwards the value chain, thus getting closer and closer to close the
loop of consumption-recycle-reuse.
Interesting to notice is also the entry into the plastic recycling industry as a response to clients’
requirements. Indeed, both Gurit and Sirmax’s deal rationales were based on seize the
opportunity to widen their product offerings with green solutions meeting clients’ expectations.
This suggests a confirmation of the demand’s shifting constituting one of the macro trends
presented in chapter one.
An additional fundamental feature underlying these investments is the future potential. Indeed,
acquiring a well-established plastic recycler give the buyer the chance to rapidly enter the
business (thus meeting clients’ expectations) and leverage the acquired company as a platform
for future growth through the replication of process and product know-how within new plants.
This goal is clearly stated by Sirmax, Gurit and Schwarz.
Concluding, these main transactions seem to confirm the general interest into plastic recycling,
which sees large multinational groups vigorously entering the industry with plans for a further
growth. Particular attention seems to be paid to vertical integration, with buyers acquiring
integrated recyclers acting downwards (as in the case of Hera-Aliplast or Schwarz-Sky Plastic)
or upwards (Gurit-Valplastic) along their value chain. Interestingly, incumbent players of the
Italian plastic recycling industry have not pursued inorganic growth options during the last
period, apparently preferring organic growth to external consolidation.

132

133
Conclusions
Plastics’ impact on our society has been massive, as they found application in virtually every
sector, from households to industrials. The rapid growth (the estimated compound annual
growth rate of plastic production for the period 1950-2017 is 8,5%) and the various technical
developments in the industry have brought innovation in many aspects of our everyday life.
This outstanding growth of the utilization of plastic materials had consequences: the huge
amount of plastic waste generated poses serious threats to the environment, the wildlife and
human health. For overcoming this issue, the establishment of a plastic recycling industry stood
out. The plastic recycling industry, especially in developed countries, experienced a rapid
development during last decades, struggling for catching up with waste generation.
The analysis conducted through the Value Chain and the Five Forces frameworks (which relied
on insights got from top Italian plastic recyclers’ Management, in-depth interviewed) helped to
identify the industry’s structure and the dynamics regulating competition among recyclers. In
fact, the relevance of waste collection emerges, requiring state subsides; moreover, the
importance of extrusion and compounding is twofold: they heavily impact on production costs
(they are energy intensive and they rely on machineries which require costly maintenance
activities) and they are of the utmost importance in driving customers’ purchase decisions (since
they are the activities embodying the entire company’s effort in R&D for obtaining tailor-made
products which lock customers in long-term business relationships). Second, barriers to entry
are highlighted. In particular, heavy regulation, a pronounced incumbent advantage based on
process know-how and high initial investments.
The plastic recycling industry is on the edge of a turmoil caused by three major global macro
trends. First, regulation (i.e. EU guidelines package) started to push plastic goods (or
packaging) manufacturers to utilized a higher percentage or recycled plastics in their products
(thus affecting recycled plastics’ demand); moreover, it imposes member countries to enhance
their recycling systems (increasing the amount of waste directed towards recycling) and
companies to design plastic packaging to be fully recyclable (thus impacting on supply).
Second, the Chinese ban on import forces western countries (which were used to export most
of their plastic waste to China) to suddenly manage a much larger amount of plastic waste. This
gives the industry an opportunity for growing and leads the market to an oversupply state. Third,
the final consumers’ preferences that are shifting towards environmental-friendly products
force manufacturers to implement greener solutions in their offerings, thus boosting demand
for recycling polymers.

134
As highlighted in chapter three, the favourable economic conditions reflect on the current state
of the Italian plastic recycling industry. Indeed, Italy has always been at the forefront of plastic
recycling and nowadays it has developed a flourishing industry made of small and medium
enterprises (mostly family-run). Italian plastic recyclers show considerable growth (10,7%
CAGR between 2016-2018), improving operating profitability and a reassuring financial
soundness, thus confirming the favourable global trends previously described. It must be
noticed that this growth is unevenly distributed, since the most relevant contribution is given
by a handful of large companies (i.e. Montello, Sir, Dentis, AMP Recycling, Eurofed) which
generate almost 22% of the 2018 turnover of the entire panel (the entire panel includes 98
companies), and which reached a median CAGR 2016-2018 of 26,3%.
As the industry becomes faster growing and profitable, it attracts the interest of primary
enterprises from all over the world, which aim at entering the plastic recycling industry.
Acquirers belong to a varied set of industries adjacent to plastic recycling and have different
rationales, but some common underlying strategies and trends are noticeable. Sustainable vision
and inorganic strategic plans combined, thus pushing players operating along the industry’s
value chain to integrate upward or downward, getting closer and closer to closing the loop,
realizing actual circular economy projects.
Alternatively, responding to novel customers’ requirements, chemical specialty companies
seem willing to widen their product offerings with new solutions based on recycled polymers;
for rapidly implementing this strategy, they must overcome industry’s barriers to entry through
direct acquisition of long-standing recyclers with deep process know-how, authorisations and
operating plants.
Indeed, the Italian plastic recycling industry has witnessed important M&A transactions during
the last years, with waste management companies, major retailers and chemical companies
entering the business acquiring some of the most important Italian operators.
Country’s specificities regard the advanced state of recycling in Italy (i.e. technological
development and high recycling rates), which constitutes a considerable advantage (mostly as
regard the quality and the volume of supply) for foreign investors looking for acquisition targets
(see chapter 3.1). On the other hand, Italian recyclers may show difficulties when compared to
foreign recyclers, with respect to the high costs associated to labour and energy (see chapter
3.1.4 for the contribution of Mr Regis, head of Assorimap).
On the basis of main Italian recyclers’ view and the analysis performed, the M&A activity is
forecasted to further strengthening during the next years, as macrotrends will continue to

135
support the industry’s development and attractiveness. The most promising trend is the vertical
integration, as companies plan to close the loop within their industries and must meet new
environmental-friendly customers’ expectations.

136

137
Sources
AIDA [online]. (2020). Bureau Van Dijk. A Moody’s Analytics Company.
ALIPLAST (2018). Rethink Recycle Resource.
ALIPLAST. Il Sistema. Available at: http://www.aliplastspa.com/sistema-pari/il-sistema.
Accessed on 10/05/2020.
AMADEUS [online]. (2020). Bureau Van Dijk. A Moody’s Analytics Company.
ANDREWS G. (2012). Plastics in the Ocean Affecting Human Health. Teach the Earth.
Available online at:
https://serc.carleton.edu/NAGTWorkshops/health/case_studies/plastics.html. Accessed on:
28/12/2019.
ANGYAL A., MISKOLCZI N., BARTHA L. (2007). Petrochemical feedstock by thermal
cracking of plastic waste. Journal of analytical and applied pyrolysis.
ANTIKAINEN M., LAMMI M., PALOHEIMO H., RÜPPE T., VALKOKARI K. (2015).
Towards Circular Economy Business Models: Consumer Acceptance of Novel Services. The
International Society for Professional Innovation Management.
AWAJA F., PAVEL D. (2005). Recycling of PET. European Polymer Journal.
BRITISH PLASTICS FEDERATION. Available at:
https://www.bpf.co.uk/plastipedia/plastics_history/Default.aspx. Accessed on: 07/12/2019.
CENTER FOR INTERNATIONAL ENVIRONMENTAL LAW (2019). Plastic & Climate:
The Hidden Costs of a Plastic Planet.
COREPLA (2018). Il futuro del riciclo della plastica nella circular economy.
COREPLA (2019). Relazione sulla gestione 2018.
CSIRO (2017). The Recycled Plastics Market: Global Analysis and Trends.
CUDE B. (2007). Consumer perceptions of environmental marketing claims: an exploratory
study. Journal of Consumer Studies and Home Economics.
D’AMBRIÈRES, W. (2019). Plastics recycling worldwide: current overview and desirable
changes. Field Actions Science Reports.
DELOITTE (2015). Increased EU Plastics Recycling Targets: Environmental, Economic and
Social Impact Assessment.

138
DELOITTE (2017). Blueprint for plastics packaging waste: Quality sorting & recycling.
DELOITTE (2020). Global power of retailing 2020.
ELLEN MACARTHUR FOUNDATION (2013). Towards the Circular Economy Vol. 2:
Opportunities for the Consumer Goods Sector.
ELLEN MACARTHUR FOUNDATION (2017). Rethinking the future of plastic.
EU DIRECTIVE 2019/904.
EUROPEAN COMMISSION (2018). A European Strategy for Plastics in a Circular Economy.
EUROPEAN PET BOTTLE PLATFORM. How to keep a sustainable PET recycling industry
in Europe. Available at: https://www.epbp.org/. Accessed on: 03/06/2019.
EUROSTAT. Statistiche sul prezzo dell’energia elettrica. Available at:
https://ec.europa.eu/eurostat/statistics-
explained/index.php?title=Electricity_price_statistics/it#Prezzi_dell.27energia_elettrica_per_i
_consumatori_non_domestici. Accessed on: 04/02/2020.
FISCHER A., PASCUCCI S. (2017). Institutional incentives in circular economy transition:
The case of material use in the Dutch textile industry. Elsevier, Journal of cleaner production.
FONDAZIONE PER LO SVILUPPO SOSTENIBILE (2019). L’Italia del riciclo 2019.
FUNK K. (2003). Sustainability and Performance. MIT Sloan Management Review.
GEISSDOERFER M., SAVAGET P., BOCKEN N. M. P., HULTINK E. J. (2016). The
Circular Economy: a new sustainability paradigm? Elsevier, Journal of Cleaner Production.
GEORGE N., KURIAN T. (2014). Recent Developments in the Chemical Recycling of
Postconsumer Poly(ethylene terephthalate) Waste. Industrial & Engineering Chemistry
Research.
GEYER, R., J. JAMBECK AND K. LAW (2017), Production, use, and fate of all plastics ever
made. Science Advances.
GROOT J., BING X., BOS-BROUWERS H., BLOEMHOF-RUWAARD J. (2014). A
comprehensive waste collection cost model applied to post-consumer plastic packaging waste.
Science direct.

139
GRUPPO HERA (2017). Herambiente acquisisce Aliplast. Available at:
https://www.gruppohera.it/gruppo/investor_relations/comunicati_price_sensitive/price_sensiti
ve_hp1/pagina395.html. Accessed on 06/05/2020.
GRUPPO HERA (2019). Bilancio di Sostenibilità 2018.
GRUPPO HERA. Investor relations. Available at:
https://www.gruppohera.it/gruppo/investor_relations/progetti_strategici/investimenti_dismissi
oni_ma/. Accessed on 04/05/2020.
GUNARATHNA G. P.N., BANDARA N.J.G.J. LIYANAGE S. (2010). Analysis of Issues and
Constraints Associated with Plastic Recycling Industry in Sri Lanka. Department of Forestry
and Environmental Science, University of Sri Jayewardenepura, Sri Lanka.
GUREL E., TAT M. (2017). SWOT analysis: a theoretical review. The Journal of International
Social Research.
GURIT HOLDING AG (2019). Gurit reports successful closing of acquisition of PET recycling
operation in Italy. Available at: https://www.gurit.com/News--Media/Media-Releases/Media-
Release?newsid={5B41D7CC-4949-4ECF-869B-6F25B0565C56}. Accessed on 21/05/2020.
GURIT HOLDING AG (2020). Annual Report 2019.
HAHLADAKIS J. N., VELIS C. A., WEBER R., IACOVIDOU E., PURNELL P. (2017). An
overview of chemical additives present in plastics: Migration, release, fate and environmental
impact during their use, disposal and recycling. Journal of Hazardous Materials.
HASSANPOUR M. (2015). A Survey of Economic Indices of Plastic Wastes Recycling
Industry. Iranian Journal of Health, Safety & Environment.
HOOK L., REED J. (2018). Why the world’s recycling system stopped working. Financial
Times. Available at: https://www.ft.com/content/360e2524-d71a-11e8-a854-33d6f82e62f8.
Accessed on: 10/06/2019.
HOPEWELL J., DVORAK R., KOSIOR E. (2009). Plastics recycling: challenges and
opportunities. Philosophical Transactions of the Royal Society.
HOPKINSON P., ZILS M., HAWKINS P., ROPER S. (2018). Managing a Complex Global
Circular Economy Business Model: Opportunities and Challenges. California Management
Review.

140
HUMPHREY A. (2005). SWOT Analysis for Management Consulting. SRI alumni association
newsletter.
INTERGOVERNMENTAL PANEL ON CLIMATE CHANGE (2018). Global warming of
1.5°C.
INTERNATIONAL SOLID WASTE ASSOCIATION (2002). Industry as a partner for
sustainable development.
INTERNATIONAL SOLID WASTE ASSOCIATION (2014). Global recycling markets:
plastic waste.
JAYASEKARA P. M., BANDARA N. J. G. J., JAYAWEERA M. W. (2012). Overview of
Water Pollution Associated with Plastic Recycling Industry in Sri Lanka. Paper presented at the
Proceedings of International Forestry and Environment Symposium.
KOJIMA M. (2014). Policy for Fostering "Sound" Recycling Industries. Institute of
Developing Economies, Japan External Trade Organization.
KRAJNC D., GLAVIC P. (2005). How to compare companies on relevant dimensions of
sustainability. Elsevier, Ecological economics.
LACY P., KEEBLE J., MCNAMARA R. (2014). Innovative Business Models and
Technologies to Create Value in a World without Limits to Growth. Accenture.
LI J., YANG J., LIU L. (2015). Development potential of e-waste recycling industry in China.
Waste Management & Research.
LIU M., TAN S., ZHANG M., HE G., CHEN Z., FU Z., LUAN C. (2020). Waste paper
recycling decision system based on material flow analysis and life cycle assessment: A case
study of waste paper recycling from China. Elsevier, Journal of Environmental Management.
LIU Z., ADAMS M., COTE R. P., CHENA Q., WUE R., WENF Z., LIUB W., DONG L.
(2018). How does circular economy respond to greenhouse gas emissions reduction: an
analysis of Chinese plastic recycling industries. Elsevier, Renewable and Sustainable Energy
Reviews.
MARKETLINE (2017). A new future for plastic.
MAYYAS A., QATTAWIA A., OMARA M., SHANA D. (2012). Design for sustainability in
automotive industry: a comprehensive review. Renew, Sustain, Energy.
MCKINSEY (2018). How plastics-waste recycling could transform the chemical industry.

141
MCKINSEY (2018). No time to waste: What plastics recycling could offer.
MERGERMARKET [online]. (2019). Acuris.
MILNER L., BROOKS B. (2019). Europe’s plastic recycling drive pits consumer demand
against economic realities. S&P Global.
MOORE C. (2019). Plastic pollution. Encyclopædia Britannica. Available at:
https://www.britannica.com/science/plastic-pollution. Accessed on: 02/01/2109.
MORGAN STANLEY (2018). Has the Environment reached peak plastic?
NARANCIC T., O’CONNOR K. E. (2018). Plastic waste as a global challenge: are
biodegradable plastics the answer to the plastic waste problem?. Microbiology Society.
NIELSEN (2015). The sustainability imperative.
OBLAK P., GONZALEZ-GUTIERREZ J., ZUPANČIČ B., AULOVA A., EMRI I. (2015).
Processability and mechanical properties of extensively recycled high density polyethylene.
Science Direct.
OECD (2018). OECD environment policy paper no. 12, “Improving Plastics Management:
trends, policy responses, and the role of international co-operation and trade”.
OKE S. A., JOHNSON A. O., POPOOLA I. O., CHARLES-OWABA O.E., OYAWALE F. A.
(2006). Application of Fuzzy Logic Concept to Profitability Quantification in Plastic Recycling.
The Pacific Journal of Science and Technology.
PACHECO E. B. A. V., RONCHETTI L. M., MASANET E. (2011). An overview of plastic
recycling in Rio de Janeiro. Elsevier, Resource, conservation and recycling.
PAPREC GROUP. Sorting plastic waste. Available at:
https://www.paprec.com/en/understanding-recycling/recycling-plastic/sorting-plastic-waste.
Accessed on: 27/07/2019
PLANING P. (2015). Business Model Innovation in a Circular Economy Reasons for Non-
Acceptance of Circular Business Models. Open Journal of Business Model Innovation.
PLASTICS EUROPE (2017). Plastics – the facts 2017.
PLASTICS EUROPE (2018). Annual Review 2017-2018.
PLASTICS EUROPE (2018). Plastics – the facts 2018.
PLASTICS EUROPE (2019). Plastics – the facts 2019.

142
PLASTICS INDUSTRY ASSOCIATION (2018). Size and Impact.
PLASTICS RECYCLERS EUROPE (2016). Making more from plastics waste.
POLIMERICA (2019). Sirmax investe in riciclo e biopolimeri. Available at:
https://www.polimerica.it/articolo.asp?id=22387. Accessed on 18/04/2020.
PORTER M. E. (1985). Competitive advantage: creating and sustaining superior performance.
The Free Press.
PORTER M. E. (2008). The Five Competitive Forces That Shape Strategy. Harvard Business
Review.
PORTER, M. E. (2007). Understanding Industry Structure. Harvard Business School.
RAGAERT K., DELVA L., VAN GEEM K. (2017). Mechanical and chemical recycling of
solid plastic waste. Science Direct.
RECYCLING TODAY (2019). Sirmax invests in Indiana recycling facility. Available at:
https://www.recyclingtoday.com/article/sirmax-italy-invests-indiana-plastics-recycling-plant/.
Accessed on 22/05/2020.
RICICLO ENF [online]. (2020). Il Più Grande Elenco Mondiale di Aziende del Riciclo.
ROSS S., EVANS D. (2003). The environmental effect of reusing and recycling a plastic-based
packaging system. Elsevier, Journal of Cleaner Production.
S&P CAPITAL IQ [online]. (2020). S&P Global Market Intelligence.
SARKER S. M. A. N., ALAMGIR M. Z., HASAN K. R., DEY P. (2017). A Comprehensive
Analysis on Ship Recycling Industry in Bangladesh: A Supply Chain Management Perspective.
International Conference on Business and Management.
SCARPELLINI S., MARÍN-VINUESA L. M., ARANDA-USÓN A., PORTILLO-
TARRAGONA P. (2019). Dynamic capabilities and environmental accounting for the circular
economy in businesses. Emerald Publishing.
SCHWARZ DIENSTLEISTUNG KG (2019). Acting responsibly. Available at:
https://jobs.schwarz/wir-als-arbeitgeber/unsere-verantwortung. Accessed on 01/05/2020.
SCIENCE HISTORY INSTITUTE. The history and future of plastics. Available at:
https://www.sciencehistory.org/the-history-and-future-of-plastics. Accessed on 07/12/2019.

143
SINGH N., HUI D., SINGH R., AHUJA I.P.S., FEO L., FRATERNALI F. (2017). Recycling
of plastic solid waste: A state of art review and future applications. Elsevier, Composites.
SIRMAX (2019). Sirmax buys S.E.R. moving towards the circular economy with “green”
compounds. Available at: https://old.sirmax.com/media/sirmax-buys-ser-moving-towards-
circular-economy-%E2%80%9Cgreen%E2%80%9D-compounds. Accessed on 07/04/2020.
SKY PLASTIC GROUP AG (2019). GreenCycle acquires Sky Plastic Group AG. Available
at: https://www.skyplastic.com/greencycle-acquires-sky-plastic-group-ag/. Accessed on
24/05/2020.
SMITH D. N., HARRISON L. M., SIMMONS A. J. (1998). A survey of schemes in the United
Kingdom collecting plastic bottles for recycling. Elsevier, Resources, conservation and
recycling.
STANFORD (2019). Benefits of recycling. Available at: https://lbre.stanford.edu/pssistanford-
recycling/frequently-asked-questions/frequently-asked-questions-benefits-recycling. Accessed
on: 10/11/2019.
STATISTA (2018). Plastic Industry Worldwide.
STATISTA (2018). Plastic Waste in Europe.
STATISTA (2018). Recycling in the US.
TAKATORI E. (2014). Material recycling of polymer materials & material properties of the
recycled materials. International Polymer Science and Technology.
THE MERRIAM-WEBSTER.COM DICTIONARY. plastic (n.). Available at:
https://www.merriam-webster.com/dictionary/plastic. Accessed on: 24/11/2019.
TURA N., HANSKI J., AHOLA T., STÅHLE M., PIIPARINEN S., VALKOKARI P. (2019).
Unlocking circular business: A framework of barriers and drivers. Elsevier, Journal of Cleaner
Production.
UNIONPLAST (2019). Il Ruolo delle Associazioni di Categoria a Sostegno delle Politiche
Circolari.
UNIONPLAST (2019). Settori di impiego della plastica: andamento, innovazione per la
sostenibilità, norme tecniche. Plastica, seconda vita.
UNITED NATIONS ENVIRONMENT PROGRAMME (2018). Single-use plastics: a
roadmap for sustainability.

144
URBINATI A., CHIARONI D., CHIESA V. (2017). Taxonomy of circular economy business
models. Elsevier, Journal of Cleaner Production.
UVAROVA I., ATSTAJA D., KORPA V., ERDMANIS M. (2020). Financial Viability of
Circular Business Models in Tyre Recycling Industry in Latvia. Proceedings of the 2020
International Conference “Economic Science for Rural Development”.
VERMEULEN W.J. (2015). Self-governance for sustainable global supply chains: can it
deliver the impacts needed? Business, Strategy and Environment.
WANG M., LIU P., GU Z., CHENG H., LI X. (2019). A Scientometric Review of Resource
Recycling Industry. International Journal of Environmental research and Public Health.
WORLD BANK (2018). What a waste 2.0.

145
Appendix
The following pages presents the draft of the interview conducted with major Italian recyclers’
Management. This draft has been sent to the interview before performing the actual interview
(in-person or by phone). As shown below, it is divided in three blocks: the first (A) is focused
on the industry’s dynamics (it is a constituent part of Chapter two), the second (B) block ignites
the discussion about the specificities of the Company’s business model, the last (C) block tries
to link industry analysis with M&A activity within the industry, collecting insights on drivers
for integration and potential synergies.
A. Industry analysis
1. Breve descrizione della filiera/supply chain del settore del riciclo della plastica: quali
sono i player principali, il loro ruolo, la struttura.
2. Dove si colloca la vostra azienda nella filiera del riciclo della plastica? Quali attività
svolge?
3. Qual è il grado di integrazione verticale nel settore?
4. Qual è il tipico grado di integrazione orizzontale dei player che operano nel settore
riciclo della plastica?
5. Con quale tipologia di clienti si rapporta la vostra azienda? In che settore operano?
[Esempio: “forniamo plastica riciclata a soggetti che producono food packaging”,
oppure “forniamo il nostro prodotto ad aziende che lo lavorano ulteriormente per
ottenere specifici compound”]
6. Breve descrizione del numero, delle dimensioni, delle radici geografiche dei clienti.
[La domanda ha lo scopo di approfondire ulteriormente l’argomento clienti, stabilendo
se vi sia una forte dipendenza della vostra azienda nei confronti di un ridotto numero
di clienti molto importanti, o se vi sia invece una clientela maggiormente frammentata]
7. Quali delle caratteristiche del prodotto che offrite guidano maggiormente l’acquisto da
parte dei vostri clienti? Indicarne massimo 2.
[Esempi: purezza della plastica riciclata, disponibilità nel produrre grandi volumi,
costo, personalizzazione del prodotto sulla base di esigenze specifiche, etc.]

146
8. Quale tipologia di fornitori avete?
[Esempi: aziende municipalizzate che raccolgono i rifiuti nella vostra zona; aziende
private che raccolgono scarti industriali; aziende chimiche che forniscono prodotti
chimici necessari alle vostre lavorazioni]
9. Breve descrizione del numero, delle dimensioni, delle radici geografiche dei fornitori.
[La domanda vuole indagare la dipendenza della vostra azienda da un numero
relativamente basso di fornitori, come piuttosto le dimensioni dei vostri fornitori
principali, rispetto alle vostre]
10. Per aziende che operano nel vostro settore, esistono switching cost nel caso in cui
volessero sostituire i fornitori attuali con nuovi fornitori?
[Switching cost: costi, impedimenti e difficoltà in generale derivanti dall’interruzione
dei rapporti con i fornitori attuali e dalla loro sostituzione con nuovi fornitori]
11. Per i clienti di aziende come la vostra, esistono switching cost nel caso in cui volessero
smettere di collaborare con voi e acquistare questi prodotti da un’altra azienda?
[Esempio: “i prodotti che forniamo ai nostri clienti sono spesso sviluppati in
collaborazione con loro, il processo di sviluppo di questi prodotti non è né semplice, né
breve, quindi per i clienti non è facile sostituire la nostra azienda con un altro
fornitore”]
12. Quali sono le principali barriere all’entrata in questo settore?
[Esempi: pesanti investimenti iniziali, autorizzazioni/regolamentazione, contatti con i
fornitori, reperire nuovi clienti]
13. Nel processo di riciclo della plastica quali sono le attività che incidono maggiormente
dal punto di vista del costo?
[Esempi: acquisto rifiuti, triturazione/macinazione, estrusione, compounding]
14. Quali sono i settori di applicazione della plastica riciclata che presentano una maggiore
marginalità?

147
15. Esistono dei vincoli dal punto di vista normativo nei settori di applicazione della plastica
riciclata? [es: applicazione nel settore food]
16. Scelta dell’utilizzo di plastica riciclata al posto della plastica vergine: per il cliente è
solo un tema di costo? Oppure concorrono altri fattori? [es: CSR, eco-friendly sentiment
dei consumatori ultimi]
17. Stop alle esportazioni di rifiuti in plastica verso la Cina: quali effetti ha avuto sul vostro
business?
18. Negli ultimi anni ha iniziato ad emergere il riciclo chimico dei rifiuti in plastica come
futura alternativa al riciclo meccanico. Quale impatto avrà sul settore nei prossimi anni,
secondo voi?
19. Qual è la logica nella localizzazione geografica di un impianto di riciclo? Esiste un tema
di grandezza del bacino di popolazione nelle vicinanze dell’impianto?
[Ovvero, come posso garantirmi la disponibilità di rifiuti in plastica necessaria a far
operare l’impianto?]
B. Company’s specific features
20. Quali sono i vantaggi competitivi (sostenibili) della vostra azienda nei confronti dei
concorrenti?
21. Quali sono gli obiettivi di crescita/evoluzione dell’azienda nel medio periodo?
[Esempi: estendere l’offerta (nuovi polimeri), integrazione verticale (esempio: non
limitarsi al riciclo ma passare anche alla produzione di prodotti finiti), acquisizione di
competenze specifiche]
C. M&A activity within the plastic recycling industry

148
22. Negli anni l’azienda si è evoluta grazie a fusioni/acquisizioni/partnership con altri
operatori/aziende del settore? Ha intenzione di farlo nel futuro prossimo? Se si, quali
motivazioni ci sono dietro queste operazioni?
23. Siete a conoscenze di operazioni di fusione/acquisizione (o simili) riguardanti altre
aziende del settore (in Italia)?
24. Quali sinergie si cerca di creare in questo settore, con queste operazioni?
[Esempi: “attualmente e nel prossimo futuro si crede sia/sarà necessario raggiungere
dimensioni superiori a livello aziendale e di impianti per poter raggiungere economie
di scala e poter avere maggior potere contrattuale nei confronti dei fornitori o dei
clienti, per questo la possibilità di una fusione tra aziende simili può diventare una
possibilità importante”; oppure “diventerà necessario essere in grado di produrre tipi
di plastica molto particolari, per questo diventa importante acquisire aziende che
abbiano sviluppato un know-how specifico”]