Head of Office - Padua@Research
198
Head of Office: University of Padova Department of Agronomy, Food, Natural resources, Animals and Environment Ph.D. Course in: Animal and Food Science Series: 30° BIOSTIMULANT EFFECTS OF DIFFERENT PRODUCTS ON THE METABOLISM OF AGRO-FOOD PLANTS EFFETTO BIOSTIMOLANTE DI DIVERSI PRODOTTI SUL METABOLISMO DI PIANTE DI INTERESSE AGRARIO Coordinator: Prof. Stefano Schiavon Supervisor: Dott. Paolo Carletti Ph.D. student: Giovanni Battista Conselvan
-
Upload
khangminh22 -
Category
Documents
-
view
3 -
download
0
Transcript of Head of Office - Padua@Research

Head of Office: University of Padova
Department of Agronomy, Food, Natural resources, Animals and Environment
Ph.D. Course in: Animal and Food Science
Series: 30°
BIOSTIMULANT EFFECTS OF DIFFERENT PRODUCTS ON THE METABOLISM OF AGRO-FOOD
PLANTS
EFFETTO BIOSTIMOLANTE DI DIVERSI PRODOTTI SUL METABOLISMO DI PIANTE DI
INTERESSE AGRARIO
Coordinator: Prof. Stefano Schiavon
Supervisor: Dott. Paolo Carletti
Ph.D. student: Giovanni Battista Conselvan

II

III
Declaration
I declare that this thesis has not previously been submitted as an exercise for a
degree at the University of Padova, or any other university, and I further declare that the
work embodied in it is my own.
______________________________________

IV
V
Table of Contents
Abstract 1
List of the Manuscripts 5
List of other Contributions 6
1 Introduction 7 1.1 Plant biostimulants 7 1.2 Biostimulant categories 8 1.3 Humic substances 11 1.3.1 Structure of humic substances 11 1.3.2 Biostimulant activity of humic substances 12 1.3.3 Humic substances extracted from leonardites 15 1.4 New techniques to study biostimulant activity of humic substances 16 1.5 Fungicides with biostimulant-like activity 19 1.6 References 21
2 Aim and Objectives 33
3 Manuscript I 35
4 Manuscript II 89
5 Manuscript III 123
6 Manuscript IV 161
7 General Conclusions 191

VI

1
Abstract
Sustainable and environmentally friendly agriculture represents the main strategy to meet
rising food needs and to contribute to a stable planet. To achieve these goals, one of the most
promising solutions is the adoption of plant biostimulants. Biostimulants are natural
compounds which, at low concentrations, are able to enhance plant nutrient uptake, nutrient
efficiency, tolerance to abiotic/biotic stresses, and crop yield. Humic substances (HS) fall
within the biostimulants definition, as they have positive effects on the uptake of macro and
micronutrients that considerably improve the metabolism, the growth and yields of relevant
agricultural crops.
With this background, the aims of this Ph.D. project were to i) evaluate metabolic and
biochemical status of plants treated with HS to elucidate the action mechanisms of plant
biostimulants. This might permit the development of a second generation of biostimulants
where synergies and complementary mechanism can be functionally designed. ii) investigate
potential biostimulant effects of a fungicide compound.
In manuscript I Arabidopsis thaliana plants were treated with HS for eight hours. Root proteins
were studied by MS spectrometry coupled with iTRAQ (Isobaric Tag for Relative and
Absolute Quantification) technique. 902 protein spots were identified for HS treated roots,
where 291 proteins were differentially expressed. Bioinformatic tools such as DAVID, KEGG,
IIS and Cytoscape were used to interpret the biological function, pathway analysis and
visualization of the network amongst the identified proteins. From this analysis, it was possible
to evaluate that most of the differentially expressed proteins were functionally classified into
response to inorganic substances, redox homeostasis, energy metabolism, protein synthesis,
cell trafficking and division. With the present study an overview of the metabolic pathways
most modified by HS biological activity is provided. Moreover, from the analysis of
interactomes and DAVID clusters it was possible to observe previously undiscovered HS
effects, i.e. on the Ubiquitin and RACK1A interactome subnetworks.
In manuscript II Arabidopsis thaliana plants, grown in hydroponic conditions, were treated for
8 h with indole-3-acetic acid (IAA), HS from International Humic Substances Society (IHSS)
and HS from earthworm faeces (EF), respectively. Humic substances structural characteristics
were analysed by 1H NMR an FT-IR spectroscopies. Root and leaf free amino acids, sugar
alcohols and carbohydrates contents, and leaf amino acids from protein hydrolysis were
identified and quantify by gas chromatography-mass spectrometry (GC/MS), and liquid

2
chromatography-mass spectrometry (LC/MS) techniques. Canonical discriminant analysis
(CDA) was used to evaluate the influence of the treatments on the studied parameters. EF
treatment had the highest influence on metabolites profiles compared to the control, IAA and
IHSS. CDA analysis highlighted a clear distinction between EF and IHSS plant physiological
responses, depending on the different chemical and structural properties of the HS. IAA-treated
plants resulted not significant different from the control. A better understanding of the specific
effects of different HS, also related to their chemical characteristics, might serve as a basis for
the identification of marker compounds for HS bioactivity.
In manuscript III the biostimulant activity of HS extracted from four leonardites is analysed on
maize seedlings. After 48 h of treatment with five concentrations (0, 0.1, 0.5, 1, and 10 mg C
L−1) of HS, root growth and morphology, glutamine synthetase (GS) activity, glutamate
synthase (GOGAT) activity, total protein content, soluble sugars content, phenylalanine
ammonia-lyase (PAL) activity, soluble phenols, and free phenolic acids were analyzed. HS
from different leonardites had similar spectroscopic pattern, with small differences. HS_USA
best enhanced total root growth, root surface area, and proliferation of secondary roots. Plant
nutrient use efficiency was enhanced by HS_4, HS_USA and HS_B, with increment of GS and
GOGAT enzymes activity and total protein production. HS stimulated also PAL enzyme
activity, followed by a higher production of total soluble phenols. This study found that,
although the activity of the HS depended on the origin of the leonardite, these compounds can
be attributed to the biostimulant products, eliciting plant growth, nitrogen metabolism, and
accumulation of phenolic substances.
In the manuscript IV it was investigated the potential biostimulant side-effects of sedaxane.
Physiological changes in disease-free maize seedlings at increasing application doses (25, 75
and 150 μg a.i. seed-1
) under controlled sterilised conditions were analysed. Sedaxane had
significant auxin-like and gibberellin-like effects, with maximum benefits attained at the
intermediate dose. Root length (+60% vs. untreated controls), area (+45%) and forks (+51%)
were significantly increased. Sedaxane enhanced leaf and root glutamine synthetase (GS)
activity resulting in greater protein accumulation. Sedaxane also improved leaf phenylalanine
ammonia-lyase (PAL) activity, which may be responsible for the increase in shoot antioxidant
activity (phenolic acids). It is concluded that, in addition to its protective effect, sedaxane can
facilitate root establishment and intensify nitrogen and phenylpropanoid metabolism in young

3
maize plants, and may be beneficial in overcoming biotic and abiotic stresses in early growth
stages.
As a general conclusion, even if HS were extracted from different sources were applied on
different plant species, they displayed similar biological activities. Proteomics and
metabolomics studies confirmed that “–omics” techniques are essential tools to have a
‘panoramic’ view on metabolic changes happening inside an organism after a positive or
negative external perturbation.

4

5
List of the Manuscripts
This Ph.D. Project is composed by the following four Manuscripts (the manuscripts are named
“Manuscript” followed by roman number in the text).
Manuscript I Antonio Masi, Giovanni Battista Conselvan, Micaela Pivato, Giorgio
Arrigoni, Tayyaba Yasmin, Sohaib Roomi, Paolo Carletti (2017). Protein
profiling of Arabidopsis roots treated with humic substances. (to be
submitted to Plant and Soil)
Manuscript II Giovanni Battista Conselvan, David Fuentes, Cristina Peggion, Ornella
Francioso, Andrew Merchant, Paolo Carletti (2017). Effects of humic
substances and indole-3-acetic acid on Arabidopsis sugar and amino acid
metabolic profile. (under revision to Plant and Soil)
Manuscript III Giovanni Battista Conselvan, Diego Pizzeghello, Ornella Francioso,
Michele Di Foggia, Serenella Nardi, Paolo Carletti (2017). Biostimulant
activity of humic substances extracted from leonardites. Plant Soil. doi:
10.1007/s11104-017-3373-z
Manuscript IV Dal Cortivo Cristian, Giovanni Battista Conselvan, Paolo Carletti, Giuseppe
Barion, Luca Sella, Teofilo Vamerali (2017). Biostimulant effects of seed-
applied sedaxane fungicide: morphological and physiological changes in
maize seedlings. Front Plant Sci. https://doi.org/10.3389/fpls.2017.02072

6
List of other Contributions
The other Contributions (chronologically listed in the follow table) represent the writing
production (Abstract of Poster/Abstract of Oral Presentation) related to attendance as author to
international conferences and disseminating scientific contributions.
Contribution I Proteomic profiling of Arabidopsis roots treated with humic substances –
Abstract and poster
Micaela Pivato, Giorgio Arrigoni, Giovanni Battista Conselvan, Serenella
Nardi, Sohaib Roomi, Antonio Masi, Paolo Carletti.
Congresso ItPA, 23-28 giugno 2015, Milano.
Contribution II Suoli sottoposti ad agricoltura conservative: studio dei parametric chimico-
biologici – Abstract and poster
Conselvan G. B., Pinto S., Nardi S., Furlan L., Chiarini F., Menta C.,
Carletti P.
XXXIII convegno SICA, X convegno IHSS – Italian Chapter, 16-18
settembre 2015, Bologna.
Contribution III Network analysis of differentially expressed proteins in Arabidopsis roots
treated with humic substances – Abstract and oral presentation
Carletti P., Conselvan G.B., Pivato M., Arrigoni G., Roomi S., Masi A.,
Nardi S.
XXXIII convegno SICA, X convegno IHSS – Italian Chapter, 16-18
settembre 2015, Bologna
Contribution IV The biostimulant activity of humic substances: a proteomic approach –
Abstract and poster
Conselvan G. B., Pivato M., Arrigoni G., Roomi S., Masi A., Nardi S.,
Carletti P.
1st DAFNAE postgraduate scientists meeting Legnaro, 22-23 settembre
2016.

7
1 Introduction
1.1 Plant biostimulants
Last decade mankind entered in a new geological epoch, the Anthropocene, where humans are
the largest driver of planetary changes (Steffen et al. 2015). To achieve human development at
all scales (from local farms to cities, nations and the world), global sustainability is considered
to be a fundamental prerequisite (Folke et al. 2005). By 2050 the global population will grow
from seven to nine billion people (Godfray et al. 2010), requiring an increase in global food
production of between 60 and 110 % (Pardey et al. 2014). In this ‘event’, agriculture plays a
crucial role; it is considered the world’s largest driver of global environment change, and also
the most affected by these changes (Field et al. 2014). To meet rising food needs and to
contribute to a stable planet, reducing environmental impacts, sustainable agriculture is the
only strategy (Rockström et al. 2017). This could be achieved following some important
policies: (1) improving efficiency in the use of resources; (2) applying direct actions to
conserve, protect and enhance natural resources; (3) protecting and improving rural livelihood,
equity and social well-being; (4) enhancing resilience of people, communities and ecosystems;
(5) applying responsible and effective governance mechanisms (FAO 2014).
To actualize these strategies, one of the most innovative solutions is the use of plant
biostimulants. Biostimulants are compounds that “contain substance(s) and/or micro-
organisms whose function when applied to plants or the rhizosphere is to stimulate natural
processes to enhance/benefit nutrient uptake, nutrient efficiency, tolerance to abiotic stress,
and crop quality” (EBIC 2017). The definition of biostimulant is not univocal, because it may
be a substance (single chemical compound or a group of compounds with a well-known
established origin) or a microorganism (du Jardin 2015). Biostimulants are considered as
borderline substances between fertilizers and plant protection products, because they do not
contain any nutrient for plants, and do not give direct protection against pest (du Jardin 2015;
La Torre et al. 2016).
Because of a lack of formal definition, the regulatory situation of biostimulants is very
complex. In EU biostimulants could be placed on the market following the Regulation EC No
2003/2003 on fertilizers or the Regulation EC No 1107/2009 on plant protection products (du
Jardin 2015).

8
Despite this regulatory situation, the global market of biostimulants is continuously growing; in
2021 it is expected to reach $ 2.91 billion in sales, with an annual growth rate of 10.4 %. In
terms of area of application, the biostimulant market will reach 24.9 million hectares by 2021,
with an annual growth rate of 11.7%. In 2015 Europe accounted for the largest market, while
Asia-Pacific region is the fast-growing market from 2016 to 2021 (Biostimulant market 2016).
The main drivers of this market are: (1) growing importance for organic products; (2) increase
of application of biostimulants in developing countries; (3) acceptance among customers of
these products, as they satisfy specific crop needs (Povero et al. 2016).
1.2 Biostimulant categories
International organizations and scientists recognized six main categories of biostimulants:
protein hydrolysates and amino acids, seaweed extracts, chitosan, inorganic compounds,
microbial inoculants and humic substances (HS) (Calvo et al. 2014; du Jardin 2015; EBIC
2017).
Protein hydrolysates and amino acids
Proteins hydrolysates consist of a mixture of peptides and amino acids with animal or plant
origin. The individual amino acids include both the twenty structural and non-protein amino
acids. These products are usually obtained by chemical, thermal or enzymatic hydrolysis of
agroindustrial by-products, from plant (crop) or animal (epithelial or connective tissues)
residues (Calvo et al. 2014; du Jardin 2015).
Protein hydrolysates and amino acids have multiple effects on treated plants. In maize, alfalfa
hydrolyzates enhanced N uptake and assimilation, regulating the activity of enzymes involved
in N metabolism (NADH-dependent glutamate dehydrogenase, nitrate reductase, nitrite
reductase glutamine synthetase and glutamate synthase) and the gene expression of nitrate
reductase (Ertani et al. 2013; Schiavon et al. 2008). In the same plants, these hydrolysates
stimulated the activity of enzymes of TCA cycle, suggesting that there was a cross talk
between C and N metabolism. Exogenous application of amino acids played a signaling role in
regulating nitrogen adsorption by roots (Miller et al. 2007). Protein hydrolysates and specific
amino acids (e. g. proline and betaine) stimulate plant defenses to biotic and abiotic stress,
increasing the tolerance to salinity, drought, temperature and oxidative condition (Ashraf and
Foolad 2007; Chen and Murata 2011). When they are applied to soils, protein hydrolysates
increase microbial biomass and activity, soil respiration and fertility (du Jardin 2015).

9
Seaweed extracts
From ancient times seaweed has been used as soil amendment and fertilizer, but only from
1950s seaweed extracts are used as commercial products in agriculture and horticulture
(Craigie 2011; Khan et al. 2009). Most of the extracts are from the phylum of brown algae,
including Ascophyllum nodosum, Fucus, Laminaria, Sargassum, and Turbinaria spp. (Sharma
et al. 2012). These extracts are a complex mixture of organic and mineral compounds,
including unique polysaccharides like lamarin, fucoidan and alginates, and particular hormones
which are not present in terrestrial plants (Khan et al. 2009). Concentration of carbon, nitrogen
lipid and ash varies significantly from one species to another, and the content of indole-3-acetic
acid (IAA) range from 3 to 47 ng/g (Sharma et al. 2012).
Seaweed extract are recognized to have several biostimulant activities. They are known to
improve growth and yield in agricultural and horticultural crops. Thanks to the presence of
different phytohormones (e.g. auxin and cytokinin), seaweed extracts enhanced root
development in several crop species after foliar application. They are known to increase
nutrient uptake and the accumulation of macro (N, P, K, Ca, S, Mg) and micronutrients (Zn,
Mn, Fe) (Calvo et al. 2014). Seaweed extracts have also an influence on plant metabolism and
physiology. Fan et al. (2013) demonstrated that, in treated spinach, brown algal extracts
increased the transcription of enzymes involved in N metabolism, antioxidative capacity and
glycine betaine synthesis, improving the production of proteins, antioxidant capacity, phenols
and flavonoid content. In Brassica napus seaweed extracts upregulated the expression of genes
involved in carbon fixation, N and S metabolism (Jannin et al. 2013). Moreover, seaweed
extracts enhance tolerance to abiotic stress such as drought, salinity and extreme temperatures,
and when they are applied to soils they increase microbial activity and diversity (Calvo et al.
2014).
Chitosan
Chitosan is a co-polymer of N-acetyl-D-glucosamide and D-glucosamide, and it derives from
the deacetylation of chitin. Thanks to its properties, chitosan is used in several industries, like
food, cosmetic, medical and agricultural. In plants chitosan elicits multiple physiological
responses binding a wide range of cellular components, such as DNA, plasma membrane, and
cell wall constituents, but also binding receptors responsible for defense gene activation (du
Jardin 2015; Pichyangkura and Chadchawan 2015). Thanks to these properties, chitosan was
extensively studied as biostimulant product on cereals, ornamental, fruit and medicinal crops.
10
On several vegetables, soil or foliar application of chitosan enhances growth and yield,
meanwhile on ornamentals it stimulates the flowering process. It is well known that chitosan
increases plant resistance to biotic and abiotic stresses: in treated plants chitosan induced
enzyme activity in the Reactive Oxygen Species (ROS) scavenging system, the phenolic
compound biosynthesis, and the activity of the nitric oxide pathway. Moreover, chitosan
application prolongs fruit shelf life, decreasing the incidence of infection and preventing the
weight loss (it reduces the respiration rate) (Pichyangkura and Chadchawan 2015).
Inorganic compounds
Alluminium (Al), cobalt (Co), sodium (Na), selenium (Se) and silicon (Si) are called beneficial
elements, because at low concentrations they can promote plant growth and may be essential
for particular taxa. It has been reported that these five compounds have beneficial influences on
different functions: plant growth, quality of plant products, nutrient uptake and resistance to
herbivory, pathogen attacks and abiotic stresses (heavy metals, salinity, drought, extreme
temperature and UV radiation) (Pilon-Smits et al. 2009).
Microbial inoculants
Microbial inoculants are bacteria, fungi, or arbuscular mycorrhizal fungi (AMF) which are
isolated from different environments such as soil, plants, plants residues, water and composted
manures. In the last two decades, the use of microbial inoculants is gradually increasing, not
only for their agronomical benefits, but also as a tool to solve numerous environmental
problems. It has been well documented that microbial inoculants improve plant nutrient uptake
and nutrient status. In several crops (e.g. cotton, wheat, sugarcane and corn) the inoculation of
Azospirillum spp. increased the nitrogen content. Different microorganisms were recognized to
increase the absorption of macro (P and K) and micronutrients enhancing their solubilization,
with a consequent indirect induction of root biomass, root surface area, and root hair growth.
Microbial inoculants can positively modify plant hormone status through the production or
degradation of auxins, cytokinins, gibberellins, and ethylene. These hormones have a direct
influence on several physiological processes, such as root initiation, root and shoot elongation,
root hair formation, seed germination, floral induction and fruit growth. Moreover, the
application of microbial inoculants increase plant tolerance to drought and salinity stress
(Calvo et al. 2014).
Humic substances.
They will be deeply described in the following chapter.

11
1.3 Humic substances
Humic substances (HS) are widely considered as a group of plant biostimulants.
HS are natural organic amorphous mixture of molecules deriving from the chemical
degradation and microbial decomposition of plant and animal residue in the soil (a process
called humification) (Nardi et al. 2009). Plant lignin, polysaccharides, melanin, cutin, proteins,
lipds, nucleic acids are some of the components which are involved in this process. HS are the
most abundant component of organic matter on earth, present on both terrestrial and aquatic
systems (Nardi et al. 2002).
They have a great influence on soil fertility, participating in several agronomic, environmental,
and geochemical processes. Indeed, HS have on the soil (a) physical effects, contributing to the
formation and stability of soil structure and porosity; (b) physico-chemical effects, improving
nutrient adsorption and availability; (c) chemical effects, participating to chemical reactions
(e.g. production of secondary carbonates which contribute to soil carbon sequestration); (d)
biological effects, affecting the diversity and biological activity of soil microorganisms
(Bronick and Lal 2005; du Jardin 2012; Nardi et al. 2009).
In addition to the effects on soil properties, HS have also an important impact on plant
physiology, enhancing crop yield, plant growth, nutrient uptake and resistance to biotic and
abiotic stresses (Nardi et al. 2002). HS influence the absorption of macro and micronutrients,
improving the metabolism, growth and yield of agricultural crops (Nardi et al. 2009; Puglisi et
al. 2009). Thanks to their hormone-like activity, HS induce root architecture changes through
the lateral roots and root hair production (Canellas and Olivares 2014; Trevisan et al. 2010).
HS have also an influence on primary and secondary metabolism, improving N assimilation,
energy and phenol products production (Nardi et al. 2007; Schiavon et al. 2010; Vaccaro et al.
2015).
1.3.1 Structure of humic substances
Many authors think that it is essential to know the composition and structure of HS to better
predict and understand their relationship with the soil and their influence on plant physiology
and metabolism (Schulten and Leinweber 2000).
The composition of HS was studied by Schulten and Leinweber (2000), where they identified
the primary molecular building blocks: aliphatic chains, quinones, phenols and sugar-like
groups. These functional groups are responsible for most of the functions attributed to HS.

12
However, due to the source and the environments where they originated, HS have a high
variability in the chemical composition and molecular structure. Thanks to this heterogeneity
HS perform ecologically and environmentally vital tasks (MacCarthy 2001).
Nowadays, the supramolecular structure theory of Piccolo (2002) is one of the proposed
theories to describe the structure of HS. HS are considered as heterogeneous supramolecular
association of small molecules with various origin, which are held together by weak forces
such as dispersive hydrophobic interactions (van der Waals, -, and CH-) and hydrogen
bonds. Polar groups constitute the external layer, whereas plant macromolecules make up the
hydrophobic interior domain. Because the interconnections between molecules are very week,
slight changes in the pH will cause humic polymers to fracture in smaller aggregates. The
fractured molecules probably reform micelles, associating with other free radicals, metals or
impurities. These processes of micellization and disaggregation could continue indefinitely,
causing huge changes in the physical makeup of HS (Muscolo et al. 2013; Šmejkalová and
Piccolo 2008).
HS can be subdivided into three main fractions: humic acids, fulvic acids and humins. At
alkaline pH values humic acids (HA or high-molecular-weight (HMW) fraction) are extracted
from soil or another matrix. HA have average molecular weights (MW) from 2000 Da for
aquatic materials to greater than 106 Da for solid-derived materials, mainly composed by
aromatic and aliphatic molecules, where phenol and carboxylic acid functional groups are the
most abundant (Nardi et al. 2009). Fulvic acids (FA or low-molecular-weight (LMW) fraction)
are extracted at all pH values; they have an average MW of 600-900 Da, and they are mainly
composed by carboxyl (COOH) and hydroxyl (COH) groups. The third fraction is composed
by humins, which are not soluble at any pH value, are the most resistant fraction to microbial
degradation, and are considered the last product of the humification process. Humins present
several functional groups in their structure such as esters, methoxy alkanes, polar aromatic
groups, and sugar derivatives (de Melo et al. 2016; de Oliveira et al. 2017; Nardi et al. 2009).
1.3.2 Biostimulant activity of humic substances
Several studies reported the beneficial effects of HS on plant growth and physiology.
The most reported and studied effect of HS on plant is the effects on roots. It has been
demonstrated that HS have two main type of phenotypic effects on root development: 1)
micromorphological effects, increasing hairs and lateral roots proliferation; 2)

13
macromorphological effects, increasing root dry weight, secondary root number, and root
thickness (Canellas and Olivares 2014; Canellas et al. 2002; Mora et al. 2012; Nardi et al.
2009; Trevisan et al. 2010). Many authors reported that these positive influences could be due
to an auxin-like activity (Cacco and Dell’Agnola 1984; Nardi et al. 1988; Piccolo et al. 1992).
Muscolo et al. (1998) demonstrated that this auxin-like activity was due to the presence of the
auxin indole-3-acetic acid (IAA) in HS. More recently also Schiavon et al. (2010) and Trevisan
et al. (2010) reported that HS, which induced root growth on tested plants, contained IAA. The
hormone-like activity could be also explained by a similar action of HS to IAA. This was
demonstrated on carrot cell cultures where LMW humic fraction interacted with cellular
membranes on the same way as IAA (Muscolo et al. 2007). Trevisan et al. (2010) demonstrated
also that in Arabidopsis lateral root primordia HS activated the auxin synthetic reporter
DR5::GUS in a way comparable to exogenously applied auxins. These data were further
supported by the enhancement of the transcription of the early auxin responsive gene IAA19.
Auxins are one of the most important morphogenic compounds involved in the regulation of
plant growth and development. Auxins are best represented by indole-3-acetic acid (IAA),
which is produced in the apical meristem of the shoot and can be transported to the roots via
phloem. IAA is involved in the root system architecture with a pivotal role in primary root,
lateral root and root hair development (Hager 2003). Auxin signals elicit groups of pericycle
cells to re-enter the cell cycle and establish lateral root mitotic sites. Auxins also have an
influence on the plasma membrane H+-ATPase activity, which excretes H
+ ions into the cell
wall compartment and takes up K+ ions through an inside rectifying K
+ channel. The auxin-
enhanced H+ pumping lowers the cell wall pH, activates pH-sensitive enzymes and proteins
within the wall, and initiates cell-wall loosening and extension growth. (Benfey et al. 2010;
Casimiro et al. 2001; Hager 2003). Quaggiotti et al. (2004) reported that low molecular weight
humic substances were able to influence H+-ATPase enzyme activity on maize plants,
increasing of two-fold the mRNA levels of the H+-ATPase isoform MHA2. This study was
also confirmed by Canellas et al. (2009) who demonstrated that HA increased root area of
treated maize plants due to also an enhancement of ATPase activity in root cells. Moreover,
when H+-ATPase enzyme is activated, it generates the proton motive force necessary for the
ion and metabolite transport across the plasma membrane (Morsomme and Boutry 2000). In
maize roots treated with HS was observed a higher nitrate uptake related to the stimulation of
H+-ATPase activity (Pinton et al. 1999).

14
Lateral root development is also stimulated by HS through the influence of nitric oxide (NO)
signaling. Root development stimulation and the H+-ATPase activation elicited by HA or
external IAA was found to depend on mechanisms which use NO as messenger (Zandonadi et
al. 2007).
Another area of study seeking to understand how HS influence plant growth and development
is the role of reactive oxygen species (ROS) (Berbara and García 2014; García et al. 2014;
García et al. 2012). ROS signaling is involved in different plant metabolic processes, including
regulation and development of plant growth, response to biotic and abiotic stresses, and cell
death (Suzuki et al. 2012). In rice plants treated with HA an increment of ROS production and
accumulation in roots, with a concomitant increase in root growth was observed (Berbara and
García 2014). ROS produced by NADH oxidase enzymes create a Ca2+
gradient in the apical
root region, leading to secondary root growth (Mori and Schroeder 2004).
The results reported above, demonstrate that there is not a single mechanism responsible for
the beneficial effects of HS on plant growth, but there is a complementary and interconnected
signaling pathway which include both hormonal networks and secondary messengers (Garcia
et al. 2016).
It is widely documented that HS have also influences on primary and secondary metabolism.
As described above, HS enhance root growth and development. In these growing cells/organs,
there is a higher activity of N metabolism, of respiratory pathway and glycolysis to support the
elevated protein synthesis and energy request (Fernie et al. 2004).
N metabolism is the basis of amino acids, proteins, enzymes and nucleotide generation. N is
assimilated as nitrate (NO3-) or ammonium (NH4
+) by plant roots (Stitt et al. 2002). The
ammonium, derived from nitrate or directly from ammonium uptake, is further assimilated into
N organic compounds. Decreasing pH at the root surface, HS facilitate H+/NO3
- symport (Nardi
et al. 2000) and stimulate nitrate uptake (through H+-ATPase) and transport in the plant
(Quaggiotti et al. 2004). HS also influence the activity of several enzymes involved in the N
metabolism. Panuccio et al. (2001) and Ertani et al. (2011) observed that on treated plants HS
induced a higher activity of glutamine synthetase (GS; EC 6.3.1.2), glutamate synthase
(GOGAT; EC 1.4.7.1), malate dehydrogenase (MDH; EC 1.1.1.37), glutamate dehydrogenase
(GDH; EC 1.4.1.3) and phosphoenolpyruvate carboxylase (PEPC; EC 4.1.1.31). These
enzymes are responsible for the incorporation of NH4+
into organic compounds.
HS are also reported to influence glycolysis, tricarboxylic acid cycle (TCA) and carbohydrate

15
metabolism. Nardi et al. (2007) observed that on maize plant, the Fraction III of HS and humic
acids (HA) extracted from Fulvudand soil positively influenced the activity of glycolysis
enzymes glucokinase (GKC; EC 2.7.1.2), phosphoglucase isomerase (PGI; EC 5.3.1.9), PPi-
dependent phosphofructokinase (PPi-PFK; EC 2.7.1.90) and pyruvate kinase (PK; EC
2.7.1.40), and TCA cycle enzymes citrate synthase (CS; EC 2.3.3.1) and malate dehydrogenase
(MDH; EC 1.1.1.37). Canellas et al. (2013) reported that maize plants treated with HS had a
lower leaf content of free carbohydrates with a reduction by 60 % of glucose, fructose, and
starch compared to the control. This suggests that these humic materials positively affect a
wide range of physiological processes, requiring an over-working of the respiratory pathway to
produce energy for different metabolic pathways (Fernie et al. 2004).
HS have also a strong influence on secondary metabolism. Schiavon et al. (2010) demonstrated
that HS enhanced the expression of the phenylalanine ammonia-lyase (PAL; EC 4.3.1.24) and
tyrosine ammonia lyase (TAL; EC 4.3.1.23) that catalyse the first main step in the biosynthesis
of phenolics. PAL converts phenylalanine to trans-cinnamic acid and TAL tyrosine to p-
coumaric acid. The expression of PAL/TAL was accompanied by phenol accumulation in
leaves. Also Olivares et al. (2015) reported a significant increase of PAL activity in tomato
leaves treated with humates extracted from vermicompost and a decrease of the field incidence
of Phytophora infectans, and Hernandez et al. (2015) observed similar trends (enhance on PAL
activity) in lettuce.
1.3.3 Humic substances extracted from leonardites
HS can be extracted from humified organic matter (e.g. from soil), from compost,
vermicompost, or from mineral deposits such as leonardite or coal (du Jardin 2012).
Leonardite is an oxidized form of lignite with a medium-brown coal-like appearance. It is
found at shallow depth over more compact coal in various coal mines around the world, mainly
in the USA (Fernandez et al. 1996; Stevenson 1979). This brown coal, particularly enriched in
humic C (30–80%), is used to manufacture a wide range of commercial HS products.
It was demonstrated that HS from leonardites encode for typical characteristics of HS
biostimulants, enhancing plant growth, yield and resistance to biotic and abiotic stresses.
On tomato plants (hybrids Astona and Gloria) under salt stress, the treatment with Humilton®
60S (23.6% humic acid and 1.1% fulvic acid from leonardite) ameliorated the negative
consequences of osmotic stress exposure, improving water uptake and total dry weight per

16
plant. Moreover, the fresh fruit weight increased to 16.6% for Gloria and to 45.3% for Astona
(Casierra-Posada et al. 2009). On Arnica montana, after two years of application, Powhumus®
WSG 85 (HS extracted from leonardite) significantly induced more generative shoot and
flower heads with higher diameter in comparison to the controls (Sugier et al. 2013). David et
al. (2014) demonstrated that potassium humate salts extracted from lignite, and potassium
humate regenerated from lignite with two oxidizing agents (nitric acid and hydrogen peroxide),
positively influenced root growth and division, starch and protein contents in treated Zea mays
seedlings. Low molecular weight fraction of HS extracted from leonardites enhanced growth,
leaf width and area index of snap bean seedlings; treated plants had also double root surface
area and length compare to the control (Qian et al. 2015). Moreover, in an in vitro study, HS
from leonardite significantly enhanced primary root growth and number of lateral root of birch
shoot explants, by influencing polar auxin transport (PAT), and alcohol dehydrogenase (ADH;
EC 1.1.1.1) and glutamine synthetase (GS; EC 6.3.1.2) gene transcript levels in roots (Tahiri et
al. 2016; Tahiri et al. 2015).
1.4 New techniques to study biostimulant activity of humic substances
In the plant cell, DNA is continuously transcribed into RNA, which is translated into proteins.
Proteins are intrinsic in the maintenance of biochemical pathways which lead to the production
of metabolites. In the field of molecular research “omics technologies” have become the new
mantra (Debnath et al. 2010) and the most important are genomics, transcriptomics, proteomics
and metabolomics. Genomics is the study of the complete set of genetic materials in an
organism and it comprises the sequencing and analysis of genes (Bartel 2004). Transcriptomics
evaluates the RNA produced by DNA transcription of a cell, tissue or organism at precise time
point. Proteomics aims to study the total protein content of a cell or sub-cellular compartment
while metabolomics analyses the metabolites (amino acids, lipids, organic acids, or nucleotides
and so on) present in a cell or tissue (Davies 2010). Transcriptomics, proteomics and
metabolomics are all dynamic domains, as affected by interactions between the organism and
external stimuli (Capozzi and Bordoni 2013).
For genomics and transcriptomics, microarray is the most common analysis for gene
expression profiling. Microarray uses information created by genome sequencing
(www.genomesonline.org) and form several sequences of expressed sequence tag (ESTs),

17
which provide information on genes expressed in specific cells, tissue and organs (Davies
2010).
For proteomics analysis two techniques are used: two-dimensional Polyacrylamide Gel
Electrophoresis (2D-PAGE) linked to mass spectrometry for protein identification, and shotgun
proteomics. With 2D-PAGE ca. 1000-2000 proteins can be separated and detected by gel-gel
comparisons (on internet several images of 2D-PAGE separations are available). Alternatively,
with shotgun proteomics all proteins are digested into peptides which are analyzed using liquid
chromatography–mass spectrometry (LC-MS) techniques (Davies 2010). With mass
spectrometer, it is possible to enhance quantitative accuracy by identifying and quantifying
many peptides for each protein in a single experiment (Larance and Lamond 2015). Three
methodologies are mainly used for the relative quantification of samples: (1) label-free
quantification (protein quantification by using data derived from spectra of MS/MS, number of
peptides identified and intensity of each peptide observed) (Cox et al. 2014); (2) in vivo
metabolic stable labeling (isotope label is introduced into every protein during cell growth and
division, which generates a labeled standard for every protein in the sample) (Bantscheff et al.
2012); (3) in vitro stable-isotope labelling (tandem mass tags (TMTs) and isobaric tags for
absolute and relative quantification (iTRAQ) are the two most popular chemical labelling
methods which target primary amides of peptides using stable-isotopes labels) (Bantscheff et
al. 2012).
A wide range of technologies are used for metabolomics, based on spectrometry and high-
resolution chromatography linked to different detection methods (mainly mass spectrometry).
Most of the instruments used for metabolomics analyses are Nuclear Magnetic Resonance
(NMR) spectrometry, gas chromatography-mass spectrometry (GC-MS) and liquid
chromatography-mass spectrometry (LC-MS) (Davies 2010).
Datasets generated from -omics experiments are usually a large list of genes, proteins or
metabolites identifications. To give a biological meaning to these large datasets, several
Bioinformatics tools have been developed. Gene Ontology is used for the functional annotation
(molecular function, biological process and cellular component) of the identified molecules
(Ashburner et al. 2001). Once molecules are functionally annotated, other tools could be
applied for the identification of functional patterns and overrepresentation of biological
functions or processes present in the –omics dataset (e.g. DAVID (Huang et al. 2009), KEGG
(Kanehisa et al. 2016), geneMANIA (Warde-Farley et al. 2010), IIS (Carazzolle et al. 2014).

18
Finally, visualization tools largely contribute to illustrate and study molecule-molecule
interactions and cellular organizations (e.g. Cytoscape (Shannon et al. 2003)).
In the last decade, these new molecular “omics” approaches have been used to characterize the
complex network of mechanisms responsible for the beneficial effects of HS on plant
metabolism. In 2011, Trevisan et al. applied a transcriptomic approach based on the detection
of cDNA-AFLP markers to identify the genes potentially involved in the regulation of the
response to HS in Arabidopsis thaliana. 133 transcript-derived fragments were identified to be
differentially expressed after HS treatment, where 75% were up-regulated and 25% down-
regulated compared to the control. Using BlastGO (Conesa et al. 2005) software 94 of 133
detected sequences were functionally annotated. The majority of the annotations were
attributed to ‘metabolic process’ and ‘cellular process’ confirming that HS treatments could
affect primary metabolism acting on gene transcription. Most of the genes were expressed at
the seedling developmental stage, in particular in root tip, where seem to target vesicle
trafficking, transport mechanism, gene transcription, protein regulation and Ca2+ signalling. In
Brassica napus Jannin et al. (2012) characterized changes in gene expression after three days
of treatment with humic acids. With microarray analysis, more than 300 genes from root and
shoot tissues were identified to be differentially expressed in treated plants. According to DFCI
annotations (http://compbio.dfci.harvard.edu) these genes were classified in nine clusters which
covered the major metabolic functions in plants: general cell metabolism, nitrogen and sulphur
metabolism, carbon metabolism and photosynthesis, stress responses, fatty acids,
phytohormones, plant development, senescence and transport of ions and water. Carletti et al.
(2008) carried out the first proteomics study on the effects of HS on plasma membrane (PM)-
enriched root extracts. With 2D-PAGE analysis 63 spots were found to be affected by HS; in
particular, 22 spots were upregulated and 38 were downregulated. Then, by liquid
chromatography-tandem mass spectrometry (LC-MS/MS) 42 differentially expressed proteins
were identified. Using the FunCat functional annotation scheme (Ruepp et al. 2004), the
identified proteins were categorized in: energy and metabolism, cellular transport, transport
facilitation and transport routes, interaction with environment, signalling, defence and cell
rescue. Another proteomics study, similar to that one of Carletti et al. (2008), was conducted
by Gao et al. (2015) to analyse the effects of water soluble humic material (WSHM) on the
growth of Bradyrhizobium liaoningense CCBAU05525 and its nodulation on soybean. From the
2D-PAGE analysis of Bradyrhizobium liaoningense cells, 15 up-regulated and 15 down-

19
regulated proteins were identified after treatment with WSHM. The differentially expressed
proteins were then identified using a matrix assisted laser desorption ionization-time of flight-
mass spectrometry (MALDI-TOF-MS), and it was reported they were involved in nitrogen and
carbon metabolism, nucleic acid metabolism, signalling, energy production, and
transmembrane transports. Metabolomics studies or studies targeting the effects of HS on
subsets of plant metabolism are still scarce. Marino et al. (2013) observed metabolomics
changes induced by low molecular weight humic acids (HA) on pear and quince leaf explants
grown in vitro. Callus fragments were collected and metabolic profiles were detected through
high resolution-magic angle spinning nuclear magnetic resonance (HR-MAS NMR)
spectroscopy. 18 metabolites were identified in both leaf explants, and in treated samples HA
enhanced the production of asparagine.
1.5 Fungicides with biostimulant-like activity
Fungicides are chemical and biological compounds used to kill pathogenic fungi or inhibit
fungal spores germination (McGrath 2004) and represent the most used molecules, together
with insecticides, in the seed coating practice of many crops.
Recently, more attention is given to direct influences of fungicides on the physiological
processes of plants, besides the control on pathogens. It has been observed that several
fungicides have also these additional “secondary effects” on plant physiology (Berdugo et al.
2012).
Wu and von Tiedemann (2001) studied the physiological effects of the strobilurin azoxystrobin
(AZO) and the traizole epoxiconazole (EPO) on Triticum aestivum L. cv. Nandu. They
highlighted that after fungicide application the senescence was significantly delayed due to an
increase of the total superoxide dismutase (SOD, EC 1.15.1.1) activity and a reduction of
superoxide (O2-) levels. Additionally, levels of hydrogen peroxide (H2O2) were significantly
elevated in treated plants, playing a role as second messengers in inducing the expression
antioxidant genes. Also in another study it was demonstrated that the application of BASF
strobilurin F500 on wheat plants was able to enhance growth, nitrogen uptake and resistance to
stress, and to delay senescence decreasing levels of Acetil-CoA carboxylase (ACC EC 6.4.1.2)
enzyme and ethylene formation (Köhle et al. 2002). Fletcher et al. (2010) reported that azole
fungicides have an influence on the physiology of treated plants, increasing the chlorophyll

20
content in winter wheat plants, delaying leaves senescence, and protecting plants from several
abiotic stresses.
Some studies also demonstrated the influence of succinate dehydrogenase inhibitors (SDHIs)
on plant physiology. Berdugo et al. (2012) reported that Bixafen (SDHI fungicide) application
on wheat plants delayed the senescence of leaves, significantly enhanced the leaf green area
duration, photosynthetic activity and grain yield. In treated plants, it was also observed a lower
tissue temperature of leaves, which is a suitable indicator of tissue vitality and higher
photosynthetic activity. The application of the SDHI fungicide isopurazam mixed with the
triazole epoxiconazole was tested on wheat plants to study the effects on photosystem II (PSII)
efficiency, biomass, and yield (Ajigboye et al. 2014). The mixture enhanced the efficiency of
PSII photochemistry, associated to increment of CO2 assimilation rate, stomatal conductance
and transpiration rate. In treated plants, it was also observed a 28% increase in biomass and 4%
increase in grain yield. These data were also confirmed by another the study of Ajigboye et al.
(2017). Under drought conditions winter wheat plants treated with Sedaxane (novel SDHI seed
treatment) had higher efficiency of PSII photochemistry, photosynthesis activity and biomass
production compared to controls. From the analysis of the microarray study of sedaxane
responsive genes emerged that most of the differentially expressed genes were involved in
defence, chlorophyll synthesis and cell wall modification.

21
1.6 References
Ajigboye OO, Lu CG, Murchie EH, Schlatter C, Swart G, Ray RV (2017) Altered gene
expression by sedaxane increases PSII efficiency, photosynthesis and growth and
improves tolerance to drought in wheat seedlings. Pesticide Biochemistry and
Physiology 137: 49-61. doi: 10.1016/j.pestbp.2016.09.008.
Ajigboye OO, Murchie E, Ray RV (2014) Foliar application of isopyrazam and epoxiconazole
improves photosystem II efficiency, biomass and yield in winter wheat. Pesticide
Biochemistry and Physiology 114: 52-60. doi: 10.1016/j.pestbp.2014.07.003.
Ashburner M, Ball CA, Blake JA, Butler H, Cherry JM, Corradi J, Dolinski K, Eppig JT,
Harris M, Hill DP, Lewis S, Marshall B, Mungall C, Reiser L, Rhee S, Richardson JE,
Richter J, Ringwald M, Rubin GM, Sherlock G, Yoon J, Gene Ontology C (2001)
Creating the gene ontology resource: Design and implementation. Genome Research
11: 1425-1433.
Ashraf M, Foolad M (2007) Roles of glycine betaine and proline in improving plant abiotic
stress resistance. Environmental and Experimental Botany 59: 206-216.
Bantscheff M, Lemeer S, Savitski MM, Kuster B (2012) Quantitative mass spectrometry in
proteomics: critical review update from 2007 to the present. Analytical and
Bioanalytical Chemistry 404: 939-965. doi: 10.1007/s00216-012-6203-4.
Bartel DP (2004) MicroRNAs: genomics, biogenesis, mechanism, and function. cell 116: 281-
297.
Benfey PN, Bennett M, Schiefelbein J (2010) Getting to the root of plant biology: impact of
the Arabidopsis genome sequence on root research. Plant Journal 61: 992-1000. doi:
10.1111/j.1365-313X.2010.04129.x.
Berbara RL, García AC (2014) Humic substances and plant defense metabolism.
Physiological mechanisms and adaptation strategies in plants under changing
environment. Springer.
Berdugo CA, Steiner U, Dehne HW, Oerke EC (2012) Effect of bixafen on senescence and
yield formation of wheat. Pesticide Biochemistry and Physiology 104: 171-177. doi:
10.1016/j.pestbp.2012.07.010.
Biostimulant market (2016) Biostimulants market by active ingredient (humic acids, fulvic
acids, seaweed, microbials, trace minerals, vitamins, and amino acids), application

22
method (foliar, soil, and seed), crop type, & by region - global trends & forecasts to
2021.
Bronick CJ, Lal R (2005) Soil structure and management: a review. Geoderma 124: 3-22. doi:
10.1016/j.geoderma.2004.03.005.
Cacco G, Dell’Agnola G (1984) Plant growth regulator activity of soluble humic complexes.
Canadian journal of soil science 64: 225-228.
Calvo P, Nelson L, Kloepper JW (2014) Agricultural uses of plant biostimulants. Plant and
Soil 383: 3-41. doi: 10.1007/s11104-014-2131-8.
Canellas LP, Balmori DM, Medici LO, Aguiar NO, Campostrini E, Rosa RCC, Facanha AR,
Olivares FL (2013) A combination of humic substances and Herbaspirillum
seropedicae inoculation enhances the growth of maize (Zea mays L.). Plant and Soil
366: 119-132. doi: 10.1007/s11104-012-1382-5.
Canellas LP, Olivares FL (2014) Physiological responses to humic substances as plant growth
promoter. Chemical and Biological Technologies in Agriculture 1: 3. doi:
10.1186/2196-5641-1-3.
Canellas LP, Olivares FL, Okorokova-Façanha AL, Façanha AR (2002) Humic acids isolated
from earthworm compost enhance root elongation, lateral root emergence, and plasma
membrane H+-ATPase activity in maize roots. Plant Physiology 130: 1951-1957. doi:
10.1104/pp.007088.
Canellas LP, Spaccini R, Piccolo A, Dobbss LB, Okorokova-Facanha AL, Santos GD, Olivares
FL, Facanha AR (2009) Relationships between chemical characteristics and root
growth promotion of humic acids isolated from brazilian oxisols. Soil Science 174:
611-620. doi: 10.1097/SS.0b013e3181bf1e03.
Capozzi F, Bordoni A (2013) Foodomics: a new comprehensive approach to food and
nutrition. Genes & nutrition 8: 1-4.
Carazzolle MF, de Carvalho LM, Slepicka HH, Vidal RO, Pereira GAG, Kobarg J, Meirelles
GV (2014) IIS - Integrated Interactome System: a web-based platform for the
annotation, analysis and visualization of protein-metabolite-gene-drug interactions by
integrating a variety of data sources and tools. PLoS One 9: 13. doi:
10.1371/journal.pone.0100385.

23
Carletti P, Masi A, Spolaore B, De Laureto PP, De Zorzi M, Turetta L, Ferretti M, Nardi S
(2008) Protein expression changes in maize roots in response to humic substances.
Journal of Chemical Ecology 34: 804-818.
Casierra-Posada F, Rodriguez CA, Fischer G (2009) Reducing negative effects of salinity in
tomato (Solanum lycopersicum L.) plants by adding leonardite to soil. In: G Fischer, S
Magnitskiy, S Nicola (eds) International Symposium on Tomato in the Tropics. Int Soc
Horticultural Science, Leuven 1.
Casimiro I, Marchant A, Bhalerao RP, Beeckman T, Dhooge S, Swarup R, Graham N, Inzé D,
Sandberg G, Casero PJ (2001) Auxin transport promotes Arabidopsis lateral root
initiation. The Plant Cell 13: 843-852.
Chen TH, Murata N (2011) Glycinebetaine protects plants against abiotic stress: mechanisms
and biotechnological applications. Plant, cell & environment 34: 1-20.
Conesa A, Götz S, García-Gómez JM, Terol J, Talón M, Robles M (2005) Blast2GO: a
universal tool for annotation, visualization and analysis in functional genomics
research. Bioinformatics 21: 3674-3676.
Cox J, Hein MY, Luber CA, Paron I, Nagaraj N, Mann M (2014) Accurate proteome-wide
label-free quantification by delayed normalization and maximal peptide ratio extraction,
termed MaxLFQ. Molecular & cellular proteomics 13: 2513-2526.
Craigie JS (2011) Seaweed extract stimuli in plant science and agriculture. Journal of Applied
Phycology 23: 371-393.
David J, Smejkalova D, Hudecova S, Zmeskal O, von Wandruszka R, Gregor T, Kucerik J
(2014) The physico-chemical properties and biostimulative activities of humic
substances regenerated from lignite. Springerplus 3. doi: 10.1186/2193-1801-3-156.
Davies H (2010) A role for “omics” technologies in food safety assessment. Food Control 21:
1601-1610.
de Melo BAG, Motta FL, Santana MHA (2016) Humic acids: Structural properties and
multiple functionalities for novel technological developments. Mater Sci Eng C-Mater
Biol Appl 62: 967-974. doi: 10.1016/j.msec.2015.12.001.
de Oliveira DAV, Botero WG, Santos JCC, da Silva RM, Pitombo LM, do Carmo JB, Rosa
LMT, de Oliveira LC (2017) Interaction study between humin and phosphate: possible
environmental remediation for domestic wastewater. Water, Air, & Soil Pollution 228:
265. doi: 10.1007/s11270-017-3447-9.

24
Debnath M, Prasad GBKS, Bisen PS (2010) Omics Technology. Molecular diagnostics:
promises and possibilities. Springer Netherlands, Dordrecht.
du Jardin P (2012) The science of plant biostimulants–A bibliographic analysis, Ad hoc study
report. European Commission.
du Jardin P (2015) Plant biostimulants: Definition, concept, main categories and regulation.
Scientia Horticulturae 196: 3-14. doi: 10.1016/j.scienta.2015.09.021.
EBIC (2017) European Biostimulant Industry Council, http://www.biostimulants.eu/.
Ertani A, Francioso O, Tugnoli V, Righi V, Nardi S (2011) Effect of commercial
lignosulfonate-humate on Zea mays L. metabolism. J Agric Food Chem 59: 11940-
11948. doi: 10.1021/jf202473e.
Ertani A, Schiavon M, Muscolo A, Nardi S (2013) Alfalfa plant-derived biostimulant stimulate
short-term growth of salt stressed Zea mays L. plants. Plant Soil 364: 145-158. doi:
10.1007/s11104-012-1335-z.
Fan D, Hodges DM, Critchley AT, Prithiviraj B (2013) A commercial extract of brown
macroalga (Ascophyllum nodosum) affects yield and the nutritional quality of spinach
in vitro. Communications in soil science and plant analysis 44: 1873-1884.
FAO (2014) Building a common vision for sustainable food and agriculture: Principles and
approaches. Rome: Food and Agriculture Organization of the United Nations.
Fernandez ER, Benlloch M, Barranco D, Duenas A, Ganan JAG (1996) Response of olive trees
to foliar application of humic substances extracted from leonardite. Scientia
Horticulturae 66: 191-200. doi: 10.1016/s0304-4238(96)00914-4.
Fernie AR, Carrari F, Sweetlove LJ (2004) Respiratory metabolism: glycolysis, the TCA cycle
and mitochondrial electron transport. Curr Opin Plant Biol 7: 254-261. doi:
10.1016/j.pbi.2004.03.007.
Field CB, Barros VR, Mach K, Mastrandrea M (2014) Climate change 2014: impacts,
adaptation, and vulnerability. Cambridge University Press Cambridge and New York.
Fletcher RA, Gilley A, Sankhla N, Davis TD (2010) Triazoles as plant growth regulators and
stress protectants. Horticultural Reviews, Volume 24: 55-138.
Folke C, Hahn T, Olsson P, Norberg J (2005) Adaptive governance of social-ecological
systems. Annu Rev Environ Resour 30: 441-473. doi:
10.1146/annurev.energy.30.050504.144511.

25
Gao TG, Xu YY, Jiang F, Li BZ, Yang JS, Wang ET, Yuan HL (2015) Nodulation
characterization and proteomic profiling of Bradyrhizobium liaoningense
CCBAU05525 in response to water-soluble humic materials. Sci Rep 5: 13. doi:
10.1038/srep10836.
Garcia AC, Olaetxea M, Santos LA, Mora V, Baigorri R, Fuentes M, Zamarreno AM, Berbara
RLL, Garcia-Mina JM (2016) Involvement of hormone- and ROS-signaling pathways
in the beneficial action of humic substances on plants growing under normal and
stressing conditions. Biomed Res Int: 13. doi: 10.1155/2016/3747501.
García AC, Santos LA, Izquierdo FG, Rumjanek VM, Castro RN, dos Santos FS, de Souza
LGA, Berbara RLL (2014) Potentialities of vermicompost humic acids to alleviate
water stress in rice plants (Oryza sativa L.). J Geochem Explor 136: 48-54. doi:
10.1016/j.gexplo.2013.10.005.
García AC, Santos LA, Izquierdo FG, Sperandio MVL, Castro RN, Berbara RLL (2012)
Vermicompost humic acids as an ecological pathway to protect rice plant against
oxidative stress. Ecological Engineering 47: 203-208. doi:
10.1016/j.ecoleng.2012.06.011.
Godfray HCJ, Beddington JR, Crute IR, Haddad L, Lawrence D, Muir JF, Pretty J, Robinson
S, Thomas SM, Toulmin C (2010) Food security: the challenge of feeding 9 billion
people. Science 327: 812-818. doi: 10.1126/science.1185383.
Hager A (2003) Role of the plasma membrane H+-ATPase in auxin-induced elongation
growth: historical and new aspects. J Plant Res 116: 483-505. doi: 10.1007/s10265-
003-0110-x.
Hernandez OL, Calderin A, Huelva R, Martinez-Balmori D, Guridi F, Aguiar NO, Olivares
FL, Canellas LP (2015) Humic substances from vermicompost enhance urban lettuce
production. Agron Sustain Dev 35: 225-232. doi: 10.1007/s13593-014-0221-x.
Huang DW, Sherman BT, Lempicki RA (2009) Systematic and integrative analysis of large
gene lists using DAVID bioinformatics resources. Nature protocols 4: 44-57. doi:
10.1038/nprot.2008.211.
Jannin L, Arkoun M, Etienne P, Laîné P, Goux D, Garnica M, Fuentes M, San Francisco S,
Baigorri R, Cruz F (2013) Brassica napus growth is promoted by Ascophyllum
nodosum (L.) Le Jol. seaweed extract: microarray analysis and physiological
characterization of N, C, and S metabolisms. J Plant Growth Regul 32: 31-52.

26
Jannin L, Arkoun M, Ourry A, Laîné P, Goux D, Garnica M, Fuentes M, Francisco SS,
Baigorri R, Cruz F, Houdusse F, Garcia-Mina J-M, Yvin J-C, Etienne P (2012)
Microarray analysis of humic acid effects on Brassica napus growth: Involvement of N,
C and S metabolisms. Plant Soil 359: 297-319. doi: 10.1007/s11104-012-1191-x.
Kanehisa M, Sato Y, Kawashima M, Furumichi M, Tanabe M (2016) KEGG as a reference
resource for gene and protein annotation. Nucleic Acids Research 44: D457-D462. doi:
10.1093/nar/gkv1070.
Khan W, Rayirath UP, Subramanian S, Jithesh MN, Rayorath P, Hodges DM, Critchley AT,
Craigie JS, Norrie J, Prithiviraj B (2009) Seaweed extracts as biostimulants of plant
growth and development. J Plant Growth Regul 28: 386-399. doi: 10.1007/s00344-009-
9103-x.
Köhle H, Grossmann K, Jabs T, Gerhard M, Kaiser W, Glaab J, Conrath U, Seehaus K, Herms
S (2002) Physiological effects of the strobilurin fungicide F 500 on plants. In: H Lyr,
PE Russell, HW Dehne, HD Sisler (eds) Modern fungicides and antifungal compounds
III, Andover, UK.
La Torre A, Battaglia V, Caradonia F (2016) An overview of the current plant biostimulant
legislations in different European Member States. J Sci Food Agric 96: 727-734. doi:
10.1002/jsfa.7358.
Larance M, Lamond AI (2015) Multidimensional proteomics for cell biology. Nature reviews
Molecular cell biology 16: 269.
MacCarthy P (2001) The principles of humic substances. Soil Science 166: 738-751.
Marino G, Righi V, Simoni A, Schenetti L, Mucci A, Tugnoli V, Muzzi E, Francioso O (2013)
Effect of a peat humic acid on morphogenesis in leaf explants of pyrus communis and
cydonia oblonga. Metabolomic analysis at an early stage of regeneration. Journal of
Agricultural and Food Chemistry 61: 4979-4987. doi: 10.1021/jf4004785.
McGrath MT (2004) What are fungicides. The Plant Health Instructor.
Miller AJ, Fan X, Shen Q, Smith SJ (2007) Amino acids and nitrate as signals for the
regulation of nitrogen acquisition. Journal of Experimental Botany 59: 111-119.
Mora V, Baigorri R, Bacaicoa E, Zamarreno AM, Garcia-Mina JM (2012) The humic acid-
induced changes in the root concentration of nitric oxide, IAA and ethylene do not
explain the changes in root architecture caused by humic acid in cucumber.

27
Environmental and Experimental Botany 76: 24-32. doi:
10.1016/j.envexpbot.2011.10.001.
Mori IC, Schroeder JI (2004) Reactive oxygen species activation of plant Ca2+ channels. A
signaling mechanism in polar growth, hormone transduction, stress signaling, and
hypothetically mechanotransduction. Plant Physiology 135: 702-708.
Morsomme P, Boutry M (2000) The plant plasma membrane H+-ATPase: structure, function
and regulation. Biochim Biophys Acta-Biomembr 1465: 1-16. doi: 10.1016/s0005-
2736(00)00128-0.
Muscolo A, Cutrupi S, Nardi S (1998) IAA detection in humic substances. Soil Biology &
Biochemistry 30: 1199-1201.
Muscolo A, Sidari M, Francioso O, Tugnoli V, Nardi S (2007) The auxin-like activity of humic
substances is related to membrane interactions in carrot cell cultures. Journal of
Chemical Ecology 33: 115-129.
Muscolo A, Sidari M, Nardi S (2013) Humic substance: Relationship between structure and
activity. Deeper information suggests univocal findings. Journal of Geochemical
Exploration 129: 57-63. doi: 10.1016/j.gexplo.2012.10.012.
Nardi S, Arnoldi G, Dell'Agnola G (1988) Release of the hormone-like activities from
Allolobophora rosea (Sav.) and Allolobophora caliginosa (Sav.) feces. Canadian
Journal of Soil Science 68: 563-567.
Nardi S, Carletti P, Pizzeghello D, Muscolo A (2009) Biological activities of humic
substances. In: PM Huang, N Senesi (eds) Biophysico-Chemical Processes in
Environmental Systems. John Wiley & Sons, Hoboken, USA.
Nardi S, Muscolo A, Vaccaro S, Baiano S, Spaccini R, Piccolo A (2007) Relationship between
molecular characteristics of soil humic fractions and glycolytic pathway and krebs
cycle in maize seedlings. Soil Biology & Biochemistry 39: 3138-3146. doi:
10.1016/j.soilbio.2007.07.006.
Nardi S, Pizzeghello D, Gessa C, Ferrarese L, Trainotti L, Casadoro G (2000) A low molecular
weight humic fraction on nitrate uptake and protein synthesis in maize seedlings. Soil
Biology and Biochemistry 32: 415-419.
Nardi S, Pizzeghello D, Muscolo A, Vianello A (2002) Physiological effects of humic
substances on higher plants. Soil Biology & Biochemistry 34: 1527-1536.

28
Olivares FL, Aguiar NO, Rosa RCC, Canellas LP (2015) Substrate biofortification in
combination with foliar sprays of plant growth promoting bacteria and humic
substances boosts production of organic tomatoes. Scientia Horticulturae 183: 100-108.
Panuccio MR, Muscolo A, Nardi S (2001) Effect of humic substances on nitrogen uptake and
assimilation in two species of pinus. Journal of Plant Nutrition 24: 693-704.
Pardey PG, Beddow JM, Hurley TM, Beatty TKM, Eidman VR (2014) A bounds analysis of
world food futures: global agriculture through to 2050. Australian Journal of
Agricultural and Resource Economics 58: 571-589. doi: 10.1111/1467-8489.12072.
Piccolo A (2002) The supramolecular structure of humic substances: A novel understanding of
humus chemistry and implications in soil science. In: DL Sparks (ed) Advances in
Agronomy, Vol 75. Elsevier Academic Press Inc, San Diego.
Piccolo A, Nardi S, Concheri G (1992) Structural characteristics of humic substances as related
to nitrate uptake and growth regulation in plant systems. Soil Biology and Biochemistry
24: 373-380.
Pichyangkura R, Chadchawan S (2015) Biostimulant activity of chitosan in horticulture.
Scientia Horticulturae 196: 49-65. doi: 10.1016/j.scienta.2015.09.031.
Pilon-Smits EAH, Quinn CF, Tapken W, Malagoli M, Schiavon M (2009) Physiological
functions of beneficial elements. Current Opinion in Plant Biology 12: 267-274. doi:
10.1016/j.pbi.2009.04.009.
Pinton R, Cesco S, Iacolettig G, Astolfi S, Varanini Z (1999) Modulation of NO 3-uptake by
water-extractable humic substances: involvement of root plasma membrane H+
ATPase. Plant and soil 215: 155-161.
Povero G, Mejia JF, Di Tommaso D, Piaggesi A, Warrior P (2016) A systematic approach to
discover and characterize natural plant biostimulants. Frontiers in Plant Science 7: 435.
doi: 10.3389/fpls.2016.00435.
Puglisi E, Fragoulis G, Ricciuti P, Cappa F, Spaccini R, Piccolo A, Trevisan M, Crecchio C
(2009) Effects of a humic acid and its size-fractions on the bacterial community of soil
rhizosphere under maize (Zea mays L.). Chemosphere 77: 829-837. doi:
10.1016/j.chemosphere.2009.07.077.
Qian S, Ding WM, Li YC, Liu GD, Sun JA, Ding QS (2015) Characterization of humic acids
derived from Leonardite using a solid-state NMR spectroscopy and effects of humic

29
acids on growth and nutrient uptake of snap bean. Chem Speciation Bioavail 27: 156-
161. doi: 10.1080/09542299.2015.1118361.
Quaggiotti S, Ruperti B, Pizzeghello D, Francioso O, Tugnoli V, Nardi S (2004) Effect of low
molecular size humic substances on nitrate uptake and expression of genes involved in
nitrate transport in maize (Zea mays L.). Journal of Experimental Botany 55: 803-813.
Rockström J, Williams J, Daily G, Noble A, Matthews N, Gordon L, Wetterstrand H, DeClerck
F, Shah M, Steduto P, de Fraiture C, Hatibu N, Unver O, Bird J, Sibanda L, Smith J
(2017) Sustainable intensification of agriculture for human prosperity and global
sustainability. Ambio 46: 4-17. doi: 10.1007/s13280-016-0793-6.
Ruepp A, Zollner A, Maier D, Albermann K, Hani J, Mokrejs M, Tetko I, Güldener U,
Mannhaupt G, Münsterkötter M (2004) The FunCat, a functional annotation scheme for
systematic classification of proteins from whole genomes. Nucleic acids research 32:
5539-5545.
Schiavon M, Ertani A, Nardi S (2008) Effects of an Alfalfa protein hydrolysate on the gene
expression and activity of enzymes of the Tricarboxylic Acid (TCA) Cycle and nitrogen
metabolism in Zea mays L. J Agric Food Chem 56: 11800-11808. doi:
10.1021/jf802362g.
Schiavon M, Pizzeghello D, Muscolo A, Vaccaro S, Francioso O, Nardi S (2010) High
molecular size humic substances enhance phenylpropanoid metabolism in maize (Zea
mays L.). Journal of Chemical Ecology 36: 662-669.
Schulten H-R, Leinweber P (2000) New insights into organic-mineral particles: composition,
properties and models of molecular structure. Biology and Fertility of Soils 30: 399-
432. doi: 10.1007/s003740050020.
Shannon P, Markiel A, Ozier O, Baliga NS, Wang JT, Ramage D, Amin N, Schwikowski B,
Ideker T (2003) Cytoscape: a software environment for integrated models of
biomolecular interaction networks. Genome research 13: 2498-2504. doi:
10.1101/gr.1239303.
Sharma S, Lyons G, McRoberts C, McCall D, Carmichael E, Andrews F, Swan R, McCormack
R, Mellon R (2012) Biostimulant activity of brown seaweed species from Strangford
Lough: compositional analyses of polysaccharides and bioassay of extracts using mung
bean (Vigno mungo L.) and pak choi (Brassica rapa chinensis L.). Journal of applied
phycology 24: 1081-1091.

30
Šmejkalová D, Piccolo A (2008) Aggregation and disaggregation of humic supramolecular
assemblies by NMR diffusion ordered spectroscopy (DOSY-NMR). Environmental
science & technology 42: 699-706.
Steffen W, Broadgate W, Deutsch L, Gaffney O, Ludwig C (2015) The trajectory of the
Anthropocene: the great acceleration. The Anthropocene Review 2: 81-98. doi:
doi:10.1177/2053019614564785.
Stevenson F (1979) Humates: facts and fantasies on their value as commercial soil
ammendments. Crops and Soils Magazine (USA).
Stitt M, Müller C, Matt P, Gibon Y, Carillo P, Morcuende R, Scheible WR, Krapp A (2002)
Steps towards an integrated view of nitrogen metabolism. Journal of experimental
botany 53: 959-970.
Sugier D, Kolodziej B, Bielinska E (2013) The effect of leonardite application on Arnica
montana L. yielding and chosen chemical properties and enzymatic activity of the soil.
Journal of Geochemical Exploration 129: 76-81. doi: 10.1016/j.gexplo.2012.10.013.
Suzuki N, Koussevitzky S, Mittler R, Miller G (2012) ROS and redox signalling in the
response of plants to abiotic stress. Plant, Cell & Environment 35: 259-270.
Tahiri A, Delporte F, Muhovski Y, Ongena M, Thonart P, Druart P (2016) Change in ATP-
binding cassette B1/19, glutamine synthetase and alcohol dehydrogenase gene
expression during root elongation in Betula pendula Roth and Alnus glutinosa L.
Gaertn in response to leachate and leonardite humic substances. Plant Physiol Biochem
98: 25-38. doi: 10.1016/j.plaphy.2015.11.004.
Tahiri A, Destain J, Thonart P, Druart P (2015) In vitro model to study the biological
properties of humic fractions from landfill leachate and leonardite during root
elongation of Alnus glutinosa L. Gaertn and Betula pendula Roth. Plant Cell Tissue
Organ Cult 122: 739-749. doi: 10.1007/s11240-015-0807-2.
Trevisan S, Botton A, Vaccaro S, Vezzaro A, Quaggiotti S, Nardi S (2011) Humic substances
affect Arabidopsis physiology by altering the expression of genes involved in primary
metabolism, growth and development. Environmental and Experimental Botany 74: 45-
55. doi: 10.1016/j.envexpbot.2011.04.017.
Trevisan S, Pizzeghello D, Ruperti B, Francioso O, Sassi A, Palme K, Quaggiotti S, Nardi S
(2010) Humic substances induce lateral root formation and expression of the early
31
auxin-responsive IAA19 gene and DR5 synthetic element in Arabidopsis. Plant biology
(Stuttgart, Germany) 12: 604-614. doi: 10.1111/j.1438-8677.2009.00248.x.
Vaccaro S, Ertani A, Nebbioso A, Muscolo A, Quaggiotti S, Piccolo A, Nardi S (2015) Humic
substances stimulate maize nitrogen assimilation and amino acid metabolism at
physiological and molecular level. Chemical and Biological Technologies in
Agriculture 2. doi: 10.1186/s40538-015-0033-5.
Warde-Farley D, Donaldson SL, Comes O, Zuberi K, Badrawi R, Chao P, Franz M, Grouios C,
Kazi F, Lopes CT (2010) The GeneMANIA prediction server: biological network
integration for gene prioritization and predicting gene function. Nucleic acids research
38: W214-W220.
Wu YX, von Tiedemann A (2001) Physiological effects of azoxystrobin and epoxiconazole on
senescence and the oxidative status of wheat. Pesticide Biochemistry and Physiology
71: 1-10. doi: 10.1006/pest.2001.2561.
Zandonadi D, Canellas L, Façanha A (2007) Indolacetic and humic acids induce lateral root
development through a concerted plasmalemma and tonoplast H+ pumps activation.
Planta 225: 1583-1595.

32

33
2 Aim and Objectives
In the last decade, research and policymakers designed sustainable agriculture as the solution to
the critical necessity to meet rising food needs and simultaneously to reduce environment
impacts. One of the most innovative solutions to achieve these goals, is represented by
biostimulant products, which at low doses efficiently increase plant yield and stress resistance.
Although already commercialized, these compounds are still unknown under many aspects. It
is well documented that biostimulants induce several responses in treated plants and that these
responses are a result of a complex network of action mechanisms. There is an urgent need
among the scientific community and commercial enterprises to better elucidate the
causal/functional mechanism of biostimulants.
This project aimed to study, by means of proteomics and metabolomics approaches, metabolic
and biochemical status of plants treated with a known biostimulant, humic substances from
earthworm faeces, highlighting proteins and metabolites involved in biological processes
leading to increased plant growth. The elucidation of and action mechanisms of plant
biostimulants will allow a development of second generation of biostimulants where synergies
and complementary mechanism can be functionally designed.
Biostimulants can be obtained or extracted from several matrixes, such as protein hydrolisates,
soil, compost, and mineral deposits products. Although humic substances with biostimulant
effects from leonardites are really diffuse, studies on their impact on plant physiology and
biochemistry are still scarce.
A second aim of the PhD project was to study and compare the biostimulant activity of humic
substances extracted from different leonardites, analyzing their influence on root morphology
and primary and secondary metabolism of treated plants. These results can provide new
evidence and deepen the knowledge on these biostimulants that are considered “benchmark” in
the humic substances biological activity research.
Finally, the third aim of this PhD project aimed to evaluate new compounds with possible
secondary biostimulant effects. To this purpose, a succinate dehydrogenase inhibitor (SDHI)
fungicide, generally seed-applied on maize, was tested in sterile condition to evidence possible
plant growth promoting effects. The biostimulant activity of the fungicide could be an
additional benefit, over and above its protective role against seed- and soil-borne diseases,
which could be exploited in the cultivation of maize.

34

35
3 Manuscript I
Protein profiling of Arabidopsis roots treated with humic substances
Antonio Masi1, Giovanni Battista Conselvan
1, Micaela Pivato
1, Giorgio Arrigoni
23, Tayyaba
Yasmin4, Sohaib Roomi
4, Paolo Carletti
1*
1 Dipartimento di Agronomia, Animali, Alimenti, Risorse Naturali e Ambiente (DAFNAE),
Università degli Studi di Padova, Viale dell’Università 16, 35020 Legnaro (Padova), Italy
2 Proteomics Center, Università degli Studi di Padova, 35131 Padova, Italy
3 Department of Biomedical Sciences, Università degli Studi di Padova, 35131 Padova, Italy
4 Department of Biosciences, COMSATS Institute of Information Technology, 44000,
Islamabad, Pakistan
*corresponding author
to be submitted to Plant and Soil

36
Abstract
Background and aim Humic substances (HS) influence the chemical and physical properties
of the soil, and are also known to affect plant physiology and nutrient uptake. This study
aimed to elucidate plant metabolic pathways and physiological processes influenced by HS
activity.
Methods Arabidopsis roots were treated with HS for eight hours. Root proteins were studied
by MS spectrometry coupled with iTRAQ (Isobaric Tag for Relative and Absolute
Quantification) technique. 902 protein spots were identified for HS treated roots, where 291
proteins were differentially expressed. Bioinformatic tools such as DAVID, KEGG, IIS and
Cytoscape were used to interpret the biological function, pathway analysis and visualization
of the network amongst the identified proteins.
Results From this analysis it was possible to evaluate that most of the differentially expressed
proteins were functionally classified into response to inorganic substances, redox
homeostasis, energy metabolism, protein synthesis, cell trafficking and division.
Conclusions With the present study an overview of the metabolic pathways most modified by
HS biological activity is provided. Moreover, from the analysis of interactomes and DAVID
clusters it was possible to observe previously undiscovered HS effects, i.e. on the Ubiquitin
and RACK1A interactome subnetworks.
Keywords
Proteomics, biostimulant, response to inorganic substances, ubiquitin, cell wall, redox
homeostasis.

37
Introduction
Humic substances (HS) are complex, heterogeneous, mixtures of polydispersed organic
compounds with different functional groups and molecular masses. These compounds
represent the end products of microbial decomposition and chemical degradation of dead
biota and are considered both the major components of soil organic matter (Nardi et al. 2002)
and the most abundant naturally occurring organic molecules on Earth (Sutton and Sposito
2005). They are yet to be separated into pure components (Muscolo et al. 2013) while they
are traditionally obtained from soils or sediments by means of dilute base solutions (Schnitzer
and Monreal 2011).
HS influence the chemical and physical properties of the soil and its overall health as they
participate in many agronomic, environmental, and geochemical processes (Nardi et al.
2009). HS are also known to affect plant physiology (Nardi et al. 2002) and the composition
and function of rhizosphere microorganisms (Varanini and Pinton 2001). HS can be used
directly on plants at low concentrations (Aguiar et al. 2012) given their well-known ability to
enhance plant growth, yield and nutrient uptake. For this reason HS constitute a category of
plant biostimulants as defined in du Jardin (2012) and Calvo et al. (2014).
The mechanisms of action of HS and other biostimulants are still debated. HS have been
found to affect plant growth in different ways such as interacting with certain morphological
and physiological processes related to plant growth (Jindo et al. 2011; O'Donnell 1973;
Vaughan and Malcom 1985; Yang et al. 2004), root hair formation (Nardi et al. 2009;
Schmidt et al. 2011), lateral root development and root hair formation (Nardi et al. 2009), and
root cell elongation (Canellas and Olivares 2014). Some authors demonstrated that these
positive effects could be due to an auxin-like effect (Canellas et al. 2011; Mora et al. 2014;
Trevisan et al. 2010). Indole-3-acetic acid (IAA), a plant hormone of the auxin class, is
known to have a pivotal role in root development, eliciting pericycle cells to re-enter the cell
cycle and establish lateral root mitotic sites (Canellas and Olivares 2014). Moreover, the HS
influence on IAA expression, coupled with NO-signalling (Zandonadi et al. 2010) increases
plasma membrane (PM) H+-ATPase activity in the root (Canellas et al. 2002; Nardi et al.
1991; Zandonadi et al. 2007), inducing cell-wall loosening, extension growth and nutrient
uptake in root cells (Hager 2003). Other studies reported that HS also have an influence on
root cell elongation and differentiation regulating the content of reactive oxygen species
(ROS) (Garcia et al. 2016). HS are reported to upregulate glycolysis and tricarboxylic acid

38
cycle (TCA) (Nardi et al. 2007), nitrate uptake (Quaggiotti et al. 2004) and metabolism
(Vaccaro et al. 2009) and phenylpropanoid metabolism (Schiavon et al. 2010).
In the last decade, new molecular “omics” approaches have been used to characterize the
complexity of signal cascades and biochemical reactions responsible for the beneficial effects
of HS on plant metabolism. Just a few papers (Carletti et al. 2008; Gao et al. 2015; Jannin et
al. 2012; Trevisan et al. 2011) have been published using these techniques for analysing plant
responses to HS. From the fundamental research perspective, studies on the transcriptomics
and proteomics effects of HS will help to clarify how these biostimulants elicit plant growth,
nutrient uptake, and stress-tolerance responses. Zandonadi et al. (2013) recently evidenced
the need of efforts directed towards the development of standardized, accessible and cost-
effective methods to quantify and qualify the biostimulant bioactivity. Such studies also
would offer the potential to find biological markers to be used during product development
(Calvo et al. 2014).
Despite the significant contribution of proteomic analysis in elucidating cell metabolism,
proteomic analysis of HS treatment has been performed previously only in one study (Carletti
et al. 2008) in maize root plasma membranes, based on 2D PAGE and gel image analysis. In
the present work, we applied the iTRAQ (Isobaric Tag for Relative and Absolute
Quantification) system to assess the changes in the proteome of Arabidopsis roots following
HS treatment. With iTRAQ technique, peptides from previously digested protein samples are
chemically labeled with isobaric tags, allowing the simultaneous identification and
quantification of up to four or eight samples in the same MS/MS spectrum (Ross et al. 2004).
Compared to classical proteomics based on 2D PAGE, iTRAQ labelling techniques present
several advantages: i) a larger number of proteins can be identified; ii) relative quantification
is more robust; iii) less abundant proteins are visualized, that cannot be seen in 2D gels; iv)
study of hydrophobic proteins that cannot be easily separated in gel electrophoresis (Putz et
al. 2012).
Within the more general aim of contributing to understand the physiological mechanisms
underlying plant responses to HS, this work aims to highlight major biological functions or
processes altered in response to HS biostimulation. To this scope proteomics data have been
sifted by means of DAVID (Huang et al. 2009b), KEGG (Kanehisa et al. 2017; Kanehisa et
al. 2016), IIS (Carazzolle et al. 2014) and Cytoscape (Cline et al. 2007) software.

39
Materials and Methods
Preparation of Humic Extract
The faeces of Nicodrilus [=Allolobophora (Eisen)=Aporrectodea (Oerley)] caliginosus
(Savigny) and Allolobophora rosea (Savigny) (Minelli et al. 1995) were collected from the
Ah horizon of an uncultivated couchgrass, Agropyron repens L., growing in soils classified
as Calcaric Cambisol (CMc-F.A.O. classifi- cation) (FAO-UNESCO 1997). Earthworm
culture conditions, HS extraction, and extract purification were conducted as reported in
(Carletti et al. 2008). HS extraction was performed with 0.1M KOH (1:10 w/v) at 130 rpm
for 16 h at 50 °C. The extracts were centrifuged at 7000 rpm for 30 min, and filtered on
Whatman filter N. 2 paper (Whatman, Boston, USA). Humic extract was desalted by using
14 kDa cut-off dialysis Visking (Medicell, London, UK) tubing with distilled water. Distilled
water was changed daily until neutral pH was reached (Conselvan 2017). Subsequently, the
extracts were desalted on ion exchange Amberlite IR-120 (H+ form), assessed for organic
carbon content, and lyophilized before conducting the following analyses. Humic substances
chemical characterization can be retrieved in Carletti et al. (2008).
Plants growth and treatment conditions
Arabidopsis (A. thaliana) plants were hydroponically grown in a growth chamber as
described previously (Destro et al. 2011). After vernalization, Arabidopsis thaliana wild-type
seeds were germinated in the dark before being transferred to the hydroponic system.
Seedlings were grown in pools containing Murashige and Skoog basal salt mixure (Sigma-
Aldrich) solution for 28 days, and the medium was changed every 7 days. Growth condition
were: 14 hours of light at 20 °C, 10 hours of dark at 18°C and constant 60% relative
humidity. After 28 days of pre-cultivation, plants were partitioned in two hydroponic system
batches: one, containing Murashige and Skoog solution, was kept as control (CTRL), in the
other 1 mg C/L of HS from earthworm faeces was added to the solution. After 8 hours of
treatment, about 200 mg of plant roots (about 12 plants) were pooled and collected for each
treatment, snap frozen in liquid nitrogen, and immediately treated for extraction. Two
independent biological replicates were performed.
Root Protein Extraction
Protein extraction was performed as described by Lan et al. (2011). Briefly, roots (ca. 150-
250 mg) were ground in liquid nitrogen; 50 mL pre-cooled acetone (-20°C), 10% TCA and

40
0.07% 2-mercaptoethanol were added and mixed vigorously. After 2 hours of precipitation at
-20°C, proteins were collected by centrifuging at 35,000 g on an Avanti J-E with a JA-20
rotor (Beckman Coulter, Brea, USA) at 4°C for 30 min. The supernatants were removed, and
the protein pellets were washed twice with cold acetone containing 0.07% 2-mercaptoethanol
and 1 mM phenylmethanesulfonyl fluoride and a third time with cold acetone without 2-
mercaptoethanol. Protein pellets were extracted using protein extraction buffer composed of
6 M urea, 50 mM triethylammonium bicarbonate, pH 8.5, and 2% CHAPS. In addition to the
protocol of Lan et al. (2011), 1% PVPP was added to the extraction buffer to improve the
purification from impurities such as polyphenols, and four cycles of sonication (10’’ at 72
Hz, 10’’ pause) were performed to improve protein solubilization. Protein extracts were then
centrifuged at 19,000 g on an Avanti J-E with a JA-20 rotor (Beckman Coulter) for 20 min at
4°C. Eventually, supernatants were collected, and the protein concentrations were determined
using a protein Bradford assay kit (Sigma Aldrich). Extracted proteins were then precipitated
overnight with 80% acetone at -20 °C.
In situ Trypsin digestion and iTRAQ labeling
To further clean the sample from the detergent present in the extraction buffer, protein pellets
were loaded into a pre-casted 4-12% SDS gel and the electrophoretic run was stopped as soon
as the protein extracts entered the running-gel. They were then excised from the gels as
single, narrow bands, and in-situ digestion and peptide extraction were performed as
described elsewhere (Ahou et al. 2014). The resulting peptide solution was desalted on a C18
solid-phase extraction cartridge and 1 g of each sample was analysed by LC-MS/MS to
check the digestion efficiency (details of the instruments and instrumental methods are given
in the following section). Peptides belonging to the two studied conditions (control and HS)
were labelled with the iTRAQ reagents (ABSciex) according to the manufacturer’s
instructions, and for the two biological replicates swapping was used following the latin
square experimental design. Prior to mixing the samples in a 1:1 ratio, 1 g of each sample
was analysed separately by LC-MS/MS (details of the instruments and instrumental methods
are given in the following section). The resulting data were checked against the database
setting the iTRAQ labelling as a variable modification. All the peptides were correctly
identified as being iTRAQ-modified at the N-terminus and at each lysine residue. The
samples were then pooled and dried under vacuum for following analysis.

41
Strong cation exchange fractionation
Strong cation exchange chromatography was performed on a strong cation exchange
cartridge (AB Sciex) as previously described (Tolin et al. 2013). The labelled samples were
dissolved in 500 l of buffer A (10 mM KH2PO4, 25% acetonitrile, pH 3) and loaded onto the
cartridge using a syringe pump with a 50 L/min flow rate. The cartridge was washed 3 times
with 500 L of buffer A. Peptides were eluted in a stepwise manner with increasing
concentrations of KCl in buffer A. The labelled peptides were eluted in eight fractions (500
L per fraction) with the following concentrations of KCl in the buffer A: 50, 100, 120, 140,
160, 180, 200, and 350 mM. The volume of each fraction was reduced under vacuum to
remove acetonitrile. Samples were desalted using C18 cartridges (Sep-Pack, C18, Waters,
Milford, USA) according to the manufacturer’s instructions. Samples were finally dried
under vacuum and kept at -20 °C until MS analysis.
LC-MS/MS Analysis
Samples were re-suspended in H2O/0.1% formic acid and 1 g of each fraction underwent
LC-MS/MS analysis. The MS analyses were conducted with a LTQ-Orbitrap XL mass
spectrometer (Thermo Fisher Scientific, Pittsburgh, CA, USA) coupled online with a nano-
HPLC Ultimate 3000 (Dionex- Thermo Fisher Scientific). Samples were loaded onto a
homemade 10 cm chromatographic column packed into a pico-frit (75 m id, 10 m tip, New
Objectives) with C18 material (ReproSil, 300 A°, 3 m). Peptides were eluted with a linear
gradient of acetonitrile/0.1% formic acid from 3% to 50% in 90 min at a flow rate of 250
nL/min. According to the method described by Kocher et al. (2009), the instrument
performed a full scan at high resolution (60,000) on the Orbitrap, followed by MS/MS scans
on the three most intense ions with CID fragmentation on the linear trap. MS/MS scans were
performed on the same ions with higher energy collision dissociation fragmentation on the
Orbitrap (with a resolution of 7,500) to obtain low mass range data suitable for protein
quantification. The peptides reliably identified in each sample were inserted in an exclusion
list that was used to perform (under the same chromatographic and instrumental conditions) a
second LC-MS/MS run for each sample fraction. Nano-HPLC-MS/MS analysis was
performed on a nanoAcquity system (Waters) connected to an LTQ-Orbitrap XL hybrid mass
spectrometer (Thermo Electron) equipped with a PicoView nanospray interface (New
Objective). Peptide mixtures were loaded onto a 75-mm i.d., 25-cm length C18 BEH column
(Waters) packed with 1.7-mm particles with a pore size of 130 A ° and were separated using

42
a segmented gradient in 90 min from 5% to 40% solvent B (acetonitrile with 0.1% formic
acid) at a flow rate of 300 nL min and a column temperature of 35_C. Solvent A was 0.1%
formic acid in water. The LTQ-Orbitrap XL hybrid mass spectrometer was operated in
positive ionization mode. The MS survey scan for all experiments was performed in the
Fourier transform cell recording a window between 350 and 1,600 mass-to charge ratio (m/z).
The resolution was set to 60,000 at m/z 400, and the automatic gain control was set to
500,000 ions. The m/z values triggering MS/MS were put on an exclusion list for 90 s. The
minimum MS signal for triggering MS/MS was set to 5,000. In all cases, one microscan was
recorded. For high-energy collision dissociation, the applied acquisition method consisted of
a survey scan to detect the peptide ions followed by a maximum of three MS/MS experiments
of the three most intense signals exceeding a minimum signal of 5,000 in survey scans. For
MS/MS, we used a resolution of 7,500, an isolation window of 2 m/z, and a target value of
100,000 ions, with maximum accumulation times of 400 ms. Fragmentation was performed
with normalized collision energy of 50% and an activation time of 30 ms.
Database Search and Quantification
The raw LC-MS/MS files were analysed using Proteome Discoverer 2.4 (Thermo Fisher
Scientific). The software was connected to a Mascot Search Engine server, version 2.2.4
(Matrix Science, London, UK). The spectra were searched against an A. thaliana database
(downloaded from ARATH Uniprot database version dated January 2013). Enzyme
specificity was set to trypsin with two missed cleavages. Peptide and fragment tolerance was
set to 10 ppm and 0.6 Da, respectively. Methylthiocysteine, 4-plex iTRAQ at the N-terminus
and Lys were set as fixed modifications, while methionine oxidation was selected as a
variable modification. Based on the search against the corresponding randomized database,
false discovery rates (FDR) of 5% and 1% were calculated by the Proteome Discoverer. The
data were pre-filtered to exclude MS/MS spectra containing less than 5 peaks or with a total
ion count below 50. Were considered as positive hits all proteins identified and quantified
with at least two independent peptides with a high degree of confidence (FDR 1%). The
quantification was performed normalizing the results on the median value of all measured
iTRAQ reporter ratios. The list of quantified proteins was exported to Excel for further
filtering and statistical analyses, which were conducted after removing from the final list the
proteins that showed a discordant trend in the replicates. A ratio of treated to control ≥ 1.3
(fold change ≥ +30%) was set as the threshold for increased content, while a ratio of treated
to control ≤ 0.769 (fold change ≥ -30%) was taken to indicate decreased protein content.

43
Bioinformatics Analysis
Functional analysis of proteins was carried out by using DAVID V 6.7
(https://david.ncifcrf.gov; Huang et al. (2009a; 2009b)), a web based tool for functional
annotation against large list of genes in order to understand the biological meaning behind the
long list of genes. DAVID analysis was performed separately for up-and down-regulated
genes. We used a list of genes that were found to be expressed in roots (Birnbaum et al.
2003) as background list in the study. The gene ontologies (biological process, molecular
function and cellular compartment), protein domains and pathways were analysed. For the
false positives linked with large list of genes, the output was filtered from DAVID on
corrected p-values, using the Benjamini correction method (p <0.05). The groups with
highest enrichment scores have more biological significance than the groups with low
enrichment score in the study. Only the clusters having an enrichment score ≥ 1.3 for both up
and down-regulated genes were considered.
Identified proteins were analysed by means of KEGG Mapper – Search&Color Pathway on-
line tool (http://www.genome.jp/kegg/tool/map_pathway2.html) (Kanehisa et al. 2017;
Kanehisa et al. 2016) against Arabidopsis thaliana database using Uniprot ID as object.
Protein interactomes were built with Integrate Interactome System (IIS) platform
(http://bioinfo03.ibi.unicamp.br/lnbio/IIS2/index.php; Carazzolle et al. (2014). Different
interactome networks were built either based on the full list of identified proteins (Fig. S1;
supplementary material) or based only on differentially expressed proteins (Fig. S2;
supplementary material). In both cases networks were obtained either including only
interactions between the input nodes or expanding the network to first neighbours’ nodes
(Bernardo et al. 2017). IIS output networks were visualized and analysed using Cytoscape
3.5.1 software (Shannon et al. 2003).

44
Results
iTRAQ labelling and Mass spectrometry
Following iTRAQ labelling, mass spectrometry analysis of HS treated samples of
Arabidopsis roots resulted in identification of 902 different protein species, which were
consistently found in the two biological replicates. Proteins with a fold-change ≥1.3 were
considered as up-regulated and proteins with a fold-change ≤0.77 were considered as down-
regulated proteins. In total 182 identified proteins were found to be over expressed, the
ubiquitin-activating enzyme E1 1 (AT2G30110) being the highest with 3.1 fold change.
Similarly, 110 proteins resulted to be repressed. The over and under expressed proteins are
shown in Table S1 and Table S2, supplementary material, respectively.
The differentially expressed proteins were subjected to gene ontology via DAVID platform
analysis in order to identify major biological processes involved in the response to HS.
Pathway analysis and protein interaction network analysis were carried out to highlight the
most regulated pathways and the interaction amongst the identified proteins. KEGG Pathway
Most informative maps are TCA cycle (KEGG pathway entry: ath00020) (Fig. S3;
supplementary material), Glyoxylate and dicarboxylate metabolism (ath00630) (Fig. S4;
supplementary material), and Proteasome (ath03050) (Fig. S5; supplementary material).
Functional Classification, pathway and interactome analysis of differentially expressed
proteins
DAVID functional annotation cluster analysis produced 16 enriched functional clusters for
182 up-regulated genes under high stringency conditions (Table 1). Response to inorganic
substances is the most enriched cluster having enrichment score (ES) of 15.49. Other major
groups of up-regulated proteins relate to protein synthesis / translation ES (8.87), metabolic
process/respiration (ES 5.22), response to heat (E.S 3.85), cell wall macromolecule metabolic
process (ES 2.12), cellular redox homeostasis (ES 1.99) and cell division (ES 1.36).
Similarly, seven clusters were found for down regulated proteins (Table 2): response to
inorganic substances (ES 4.75), nucleosome organization (ES 2.72), protein catabolic
processes (ES 1.83) and peroxydase activity (ES 1.68).
Analyzing the 903 identified proteins with IIS platform and visualizing them with Cytoscape
software, two different interactomes were obtained. One, including only interactions between
the input nodes, consisted of 246 proteins (Fig. S2, supplementary material). The other one,
where the network was expanded to the first neighbour nodes, was built with 1941 proteins

45
(Fig. S1, supplementary material). From the interactome of 246 proteins, it was possible to
subdivide proteins for Cellular Component GO term (Fig. 1).
Table 1 List of the most significant clusters, with an enrichment score (ES) 1.3, for the up-regulated proteins.
Cluster were produced using DAVID database.
Category GO ID Name ES Proteins p value Annotation
cluster
GOTERM_BP_FAT GO:0010035 Response to
inorganic
substance
15.49 30 1.37E-13
1
GOTERM_BP_FAT GO:0006412 Protein synthesis/
translation
8.87 25 1.54E-08
2
SP_PIR_KEYWORDS - Cell membrane 5.44 13 4.67E-05 3
GOTERM_BP_FAT GO:0045333 Metabolic
process/cellular
respiration
5.22 9 7.54E-08
4
GOTERM_BP_FAT GO:0006732 Coenzyme
metabolic process
4.91 11 3.35E-05
5
GOTERM_BP_FAT GO:0009408 Response to heat 3.85 6 0.0110 6
GOTERM_CC_FAT GO:0043233 Organelle lumen 3.34 18 0.0011 7
KEGG_PATHWAY ath00630 Glyoxylate and
dicarboxylate
metabolism
2.46 4 0.0323 8
INTERPRO IPR018120 Glycoside
hydrolase, family
1, active site
2.19 4 0.0013
9
INTERPRO
IPR017937 Thioredoxin,
conserved site
2.18 4 0.0036
10
GOTERM_BP_FAT GO:0044036 Cell wall
macromolecule
metabolic process
2.12 5 0.0018
11
GOTERM_BP_FAT GO:0045454 Cell redox
homeostasis
1.99 6 0.0147
12
SMART SM00517 PolyA 1.95 3 9.88E-04 13
KEGG_PATHWAY ath01066 Biosynthesis of
alkaloids derived
from terpenoid
and polyketide
1.62 9 0.0305
14
GOTERM_BP_FAT GO:0019725 Cellular
homeostasis
1.52 7 0.0284
15
SP_PIR_KEYWORDS - Cell division 1.36 4 0.0373 16

46
Table 2 List of the most significant clusters, with an enrichment score (ES) 1.3, for the down-regulated
proteins. Cluster were produced using DAVID database.
Category GO ID Name ES Proteins
n.°
P. value Annotation
cluster
GOTERM_BP_FAT GO:0010035 Response to
inorganic
substance
4.75 14 1.63E-05
1
SMART SM00414 Histidone H2A 2.72 3 7.38E-04
2
GOTERM_BP_FAT GO:0034728 Nucleosome
organization
2.39 5 1.21E-04
3
GOTERM_BP_FAT GO:0030163 Protein catabolic
process
1.83 5 7.30E-04
4
SP_PIR_KEYWORDS
Peroxidase 1.68 4 0.0133
5
GOTERM_CC_FAT GO:0005730 Nucleolus 1.47 8 0.0050 6
GOTERM_MF_FAT GO:0045735 Nutrient reservoir
activity
1.45 4 0.0094 7
Fig. 1 Interactome of 246 proteins detected in Arabidopsis roots treated with HS. The interactome created with
IIS website included only proteins with interactions between the input protein dataset. Proteins were visualized
with Cytoscape 3.5.1 and they were distributed according to Cellular Components (GO) classification. Nodes
marked in green were associated with significantly up-regulated proteins, red nodes denoted down-regulated
proteins and grey nodes were proteins with no significant change. Labels report protein UniProt ID.
.

47
Discussion
In order to decipher the metabolic readjustments that follow to the HS treatment, altered
proteins are discussed in functional categories based on DAVID clusterization.
Response to inorganic substances
In this study, we identified a large number of proteins clustered as responses to inorganic
substances and responses to Cd that were differentially expressed following HS treatment.
Many of these are also involved in redox homeostasis, such as ROS scavenging as catalase 3
(AT1G20620), peroxidase 34 (AT3G49120) which were up-regulated and down expressed
proteins as Glutathione S-transferase 1 (AT1G02930), Peroxidase 45 (AT4G30170),
Peroxidase 49 (AT4G36430) and [Cu-Zn] Superoxide dismutase (AT1G08830) (details
below in redox homeostasis paragraph).
The group also contains some of the overexpressed enzymes of glycolysis and TCA cycle as
Aconitate hydratase 2 (AT2G05710), Aconitate hydratase 3 (AT4G26970) citrate synthase
(AT2G44350) and Glucose-6-phosphate isomerase (AT5G42740) (see energy metabolism
section). Similarly, some other identified proteins of diverse function were over expressed as
heat shock cognate 70 kDa protein 1 (AT5G02500), heat shock cognate 70 kDa protein 3
(AT3G09440), protein disulfide-isomerase 2 (AT1G77510) and down regulated as
proteasome subunit alpha type-3 (AT2G27020) and proteasome subunit alpha type-5-A
(AT1G53850).
The most upregulated protein in our analysis was the ubiquitin-activating enzyme E1
(AT2G30110), involved in the first step in conjugating multiple ubiquitins to proteins
targeted for degradation. Mutant analysis suggests that this gene is involved in defense
response, and that ubiquitination plays a role in plant defence signalling (Bachmair et al.
2001; Hatfield et al. 1997)
Ubiquination importance in HS responsive proteins is also evidenced in IIS interactome (Fig.
2). Ubuiquitin UBQ3 is resulted to have direct interaction with 86 among differentially
expressed proteins (57 up-regulated, 29 down regulated) for a total of 262 of the identified
proteins.

48
Fig. 2 Interactome of 262 proteins detected in Arabidopsis roots treated with HS directly interacting with
Ubiquitin. The interactome created with IIS website included only proteins with interactions between
themselves. Proteins were visualized with Cytoscape 3.5.1 and they were distributed according to Cellular
Components (GO) classification, with Ubiquitin (Ubq3) as central node. Nodes marked in green were associated
with significantly up-regulated proteins, red nodes denoted down-regulated proteins while grey nodes were
proteins with no significant change. Labels report protein UniProt ID
The DAVID clusterization of our differentially expressed proteins as response to Cd is
clearly incidental as no Cd was present in the nutrient solution or the HS, as confirmed by
previous elemental analyses by ICP (data not shown). However, in soil, the functional
moieties of HS such as alcoholic, carboxylic and phenolic groups play a vital role in
homeostasis of metal ions by reversibly fixing the metals via S-containing ligands (Kalis et
al. 2006). The increase in uptake of heavy metals with addition of HS was reported in plants
in various studies (Evangelou et al. 2004; Halim et al. 2003), and is likely due to the presence
of a high number of oxygenated functional groups in HS enabling interaction with metal ions,
leading to the formation of complexes and that might interact with plant nutrition (Berbara
and Garcia 2014; Schiavon et al. 2010). This DAVID cluster is based on plant responses to
49
Cd pollution and HS-responsive proteins happen to belong to pathways highly represented in
the plant responses to inorganic stimuli.
Redox homeostasis
We identified a number of proteins related to redox homeostasis whose expression increased
in response to HS, including protein catalase 3 (AT1G20620), peroxidase 34 (AT3G49120),
disulfide-isomerase 2 (AT1G77510), 2-Cys peroxiredoxin BAS1 (AT3G11630),
nucleoredoxin-1 (AT1G60420), disulfide isomerase-like (PDIL) protein (AT3G54960)
(Table S1; supplementary material). The proteins glutathione peroxidase 2, GPX2
(AT2G31570), Protein DJ-1 homolog A, DJ1A (AT3G14990), glutathione S-transferase U19
(GSTU19) (AT1G78380), glutathione S-transferase F7 (AT1G02920), Superoxide dismutase
[Cu-Zn] 1, CSD1 (AT1G08830) resulted down-regulated by HS treatment (Table S2;
supplementary material).
Reactive oxygen species (ROS) such as hydrogen peroxide (H2O2) and hydroxyl radical (OH-
), superoxide (O2-) and singlet oxygen (
1O2) have been considered as an unavoidable process
of normal aerobic metabolism in plants (Dinakar et al. 2010). Different cellular molecules
including proteins, DNA, RNA and lipids may be destroyed by ROS (Shah et al. 2001), and
plant cells have evolved enzymatic and non-enzymatic mechanisms against these deleterious
effects of ROS (Zhang et al. 2009). Antioxidant enzymes such as CAT (EC 1.11.1.6), CSD
(EC 1.15.1.1) and POD (EC 1.11.1.7) as well as other small molecules antioxidant
(glutathione, ascorbic acid and carotenoids) are used against oxidative stress by plants
(Tewari et al. 2008).
Our results confirm the study of García et al. (2012) which showed that the antioxidant
system of rice roots responds to HA in a similar way as they do against stress. For example,
the activity of CAT and POX were increased after 8 hours of treatment with HA. Muscolo et
al. (1993) also reported the morphogenetic influence of HS on leaf explant of Nicotiana
plumbaginifolia due to stimulation of peroxidases and esterase. The study of Cordeiro et al.
(2011) also presents the up-regulation of ROS and CAT in maize after the application of HA
extracted from Oxisol. However, when applied in combination with environmental stresses,
such as drought (de Vasconcelos et al. 2009) or salinity (Aydin et al. 2012), also opposite
effects on these proteins have been observed. Among the identified proteins 25 peroxidase
isoforms were found (Table S1 and Table S2; supplementary material) of which PER34
(AT3G49120) was up-regulated while PER45 (AT4G30170) and PER49 (AT4G36430), were
down-regulated. These proteins belong to Class III peroxidases, comprising catalytically

50
flexible enzymes with a great number of isoforms (a total of 73 in Arabidopsis), which have
been found to regulate a wide range of physiological processes in plants such as cell wall
metabolism, auxin catabolism, wound healing, generation of ROS. These enzymes use
various electron donors such as phenolic compounds, auxin, secondary metabolites or lignin
precursors for reduction of H2O2 (Passardi et al. 2005).
The contrasting expression level of peroxidase isoforms found in our results could reflect
post translational modifications or different cellular localization of the isoforms. While it is
known that HS stimulate root growth and this is accompanied by enhanced PRX activity, in
this study we could detect a clear increase only in PER34; it seems noteworthy, to this regard,
that Arabidopsis seedlings overexpressing AtPrX34 exhibited significantly longer roots
indicating its involvement in the reactions that promote cell elongation (Passardi et al. 2006).
Taken together, these evidences point to PER34 as a major player in the peroxidase-mediated
response to HS.
Protein disulfide isomerase 2 (PDI) (AT3G54960) was up-regulated in our study; PDIs are
enzymes of the oxidoreductase family and are involved in the formation, rearrangement and
reduction of disulfide bonds in proteins of eukaryotes (Cho et al. 2011). The proper folding of
target proteins by PDI is necessary for the stability, trafficking, catalytic activity and
communication with other proteins; PDI has been seen to be involved in many different
physiological processes and responses to various types of stress (Lu and Christopher 2008).
Treatment with HS also resulted in lower expression of peroxiredoxin-2D (AT1G60740)
while 2-Cys peroxiredoxin (2-Cys Prx) (AT3G11630), was up-regulated. Peroxiredoxins are
ubiquitous thioredoxin-dependent peroxidases having cysteine as active site for reduction of
peroxides, believed to play a chaperone function resulting from a redox-dependent
conformational switch (Cerveau et al. 2016). Multiple sites of subcellular localization have
been reported for peroxiredoxins suggesting a site-specific functions in plant cells (Dietz
2011), thus justifying the simultaneous up and down regulation of the two isoforms.
We identified three isoforms of dihydrolipoyl dehydrogenases (LPD), belonging to the group
of redox homeostasis proteins, that are components of both mithocondrial and plastidic
pyruvate dehydrogenase complexes (mtPDC and plPDC; Nishida 2007) converting pyruvate
to acetyl-CoA and NADH. Only plastidial lipoamide dehydrogenase LPD1 (AT3G16950)
was up-regulated, whereas the mitochondrial lipoamide dehydrogenase-1 (MTLPD1,
AT1G48030), and the mitochondrial isoform dihydrolipoyl dehydrogenases-2 (MTLPD2,
AT3G17240) were found unchanged as well as their partners in the PDC complex such as

51
pyruvate dehydrogenase (PDH; E1; AT1G24180) and dihydrolipoyl acetyltransferase (E2;
AT3G13930).
Plant glutathione peroxidases (GPX) are ubiquitous in nature; in Arabidopsis eight GPX
genes are found to be expressed in different plant compartments, tissues and developmental
phases, and multiple signals can induce their expression. In this study, probable glutathione
peroxidase-2 (AT2G31570) was down-regulated by HS. This enzyme has been reported to
play a role in redox signalling transduction pathways (Passaia and Margis-Pinheiro 2015).
Proteins belonging to the redox homeostasis category have seemingly opposite expression
patterns; some of them being up- and other down-regulated. One major reason explaining this
apparent discrepancy is related with these proteins’ subcellular localization (e.g. cytosolic vs.
extracellular) and/or specificity for different substrates acting as electron donors, as in the
case of peroxidases.
At a deeper glance, however, it is possible to draw also some additional considerations. ROS
are likely to result from accelerated energy processes in glycolysis and TCA cycle, which are
necessary for sustaining the increased ATP demand for biosynthetic processes due to HS
stimulation. Up-regulation of ROS scavenging enzymes could then be interpreted as the need
to counteract dangerous radicals generated by enhanced respiration. Down-regulation of
several ROS metabolizing proteins may result in higher peroxide level, which in turn may act
as a signal activating cell metabolic processes (Noctor et al. 2015), and interfere with auxin
metabolism and cell wall remodelling. These effects are all known to be implicated in the
response to HS. Moreover, Garcia et al. (2016) reported that ROS could act as signals. The
ROS production, after HS treatment, create a Ca2+
gradient in the apical root region, leading
to secondary root growth.
Energy Metabolism/Respiration
A large number of differentially expressed enzymes/proteins identified from Arabidopsis
roots were found to be involved in plant energy metabolism.
Many of these enzymes are related to carbohydrate metabolism including glycolysis, TCA
and pentose phosphate pathway and were over expressed such as aconitase 1 (AT4G35830),
aconitase 2 (AT2G05710), aconitase 3 (AT4G26970), glucose-6-phosphate 1-dehydrogenase
(AT5G40760), citrate synthase 4 (AT2G44350), succinate dehydrogenase [ubiquinone]
flavoprotein subunit 1 (AT5G66760), phosphoenolpyruvate carboxylase 1 (AT1G53310) and
phosphoenolpyruvate carboxylase 3 (AT3G14940), while the enzyme malate dehydrogenase

52
(AT3G15020) was repressed in this study. These results are briefly described in KEGG
Pathways (Fig. S3; supplementary material)
The glycolytic pathway is important in plants as it provides fuel for respiration and major
carbon skeletons for the synthesis of various vital compounds such as nucleic acids, amino
acids, fatty acids, isoprenoids and other secondary metabolites (Plaxton 1996). The role of
glycolysis in opposing various stresses including drought, salt, cold and anoxia has been
widely reported in literature (Kosova et al. 2014). Thus, the known HS effect on plant stress
relief (Aguiar et al. 2016) can be, at least partially, ascribed to their action on the glycolytic
pathway.
One of the up-regulated enzymes in our study is glucose-6-Phosphate dehydrogenase (G6PD)
(AT5G40760), catalyzing the oxidation of glucose-6-phosphate to 6-phosphogluconate, the
key step in the pentose phosphate pathway (PPP). PPP is the primary source of NADPH in
various biosynthetic processes such as fatty acid metabolism, integration of nitrogen into
amino acid and resistance against oxidative destruction. An intermediate in PPP, ribose-5-
phosphate is used for phenylpropanoid production through shikimate pathway (Scharte et al.
2009). G6PD is highly regulated: besides transcriptional control, also redox regulation and
cellular NADPH/NADP+ ratio have been shown to regulate the activity of diverse G6PD
isoforms (Schurmann and Buchanan 2008). In a previous study, the low molecular weight
humic extracts were found to stimulate the Pi level and energetic metabolism, resulting
specifically in higher Glucose-6-phosphate and ATP level (Zancani et al. 2009).
In our study two isoforms of Phosphoenolpyruvate carboxylase (PEPC-1) (AT1G53310) and
PEPC-3 (AT3G14940) were up-regulated. PEPC (EC 4.1.1.31) is the key enzyme which
stimulates the irreversible beta-carboxylation of PEP to produce oxaloacetate and inorganic
phosphate (Pi) in the presence of HCO3. PEPC is allosterically inhibited by L-malate and is
activated by its positive effector, Glc-6-P. It is further regulated by both reversible
phosphorylation by the enzyme PPCK (PEPC kinase) and by monoubiquitination (Shi et al.
2015). In plant, non-photosynthetic tissues PEPC ensures an anaplerotic flux of intermediates
to TCA cycle. Consistently with our results, Muscolo et al. (2007) have also shown an
enhancement of Phosphoenolpyruvate carboxylase activity in response to HS.
Malate dehydrogenase (MDH, EC 1.1.1.37) is an important regulatory enzyme of energy
metabolism in eukaryotes and catalyzes the conversion of malate to oxaloacetate by using
NAD as cofactor. Eukaryotic cells possess two isoforms of MDH, one at mitochondria and
the other at cytosol. Mitochondrial MDH is used in TCA cycle while cytosolic MDH
participates in gluconeogenesis or shuttle systems for transferring the reducing equivalents

53
across mitochondrial membrane (Goward and Nicholls 1994). In our study five isoforms of
MDH were identified but only one mitochondrial isoform mitMDH-2 (AT3G15020) was
down-regulated while the others were not changed. Similar results of down regulation of
MDH in maize root cell membrane extracts after HS application was described by Carletti et
al. (2008). In maize leaf, enzymatic extracts, Nardi et al. (2007) reported the enhancement in
MDH activity after treatment with HS fractions. However, enzyme extract activity essay does
not distinguish the MDH isoforms; furthermore, different regulation might occur in leaves
compared to roots.
In mitochondria, aconitase (ACO; EC 4.2.1.3) plays an important role in TCA cycle by
catalyzing the isomerization reaction of citrate to isocitrate via cis-aconitate. The cytosolic
isoform is involved in glyoxylate cycle (Moeder et al. 2007). We identified three isoforms of
aconitase which were all upregulated: aconitase 1 (AT4G35830, cytoplasmic and
mitochondrial), aconitase 2 (AT2G05710, mitochondrial) and aconitase 3 (AT4G26970,
mitochondrial). Adjacent spots of aconitase were also reported as differentially expressed by
Carletti et al. (2008) in HS-treated maize roots. Our results are also supported by the study of
Trevisan et al. (2011) in which gene expression of metabolic enzymes including aconitase
was induced after treatment with HS.
Another enzyme that was up-regulated in our current study is citrate synthase 4
(AT2G44350). In all organisms, citrate synthase is a key enzymes in TCA cycle catalyzing
the condensation reaction of oxaloacetate and acetyl-CoA to form the six-carbon citrate
(Schmidtmann et al. 2014). Increase in citrate synthase activity by HS was observed in maize
seedlings (Nardi et al. 2007).
Flavoprotein subunit 1 (AT5G66760), a component of the mitochondrial succinate
dehydrogenase complex (EC 1.3.5.1), was also increased in our study. Succinate
dehydrogenase is involved in both the oxidation of succinate to fumarate and the reduction of
ubiquinone to ubiquinol, respectively (Figueroa et al. 2001).
ATP-citrate lyase (ACL) catalyzes the formation of acetyl-CoA and oxaloacetic acid from
citrate and CoA in the cytosol. The ACL in plant is composed of two subunits, ACLA and
ACLB. Here, we observed higher expression of ATP-citrate lyase subunit B (AT3G06650)
after HS treatment. ACL is necessary for normal growth and development and is not
compensated for by any other source of acetyl-CoA in cell. The decreased level of this
enzymes resulted in reduction of cytosolic acetyl-CoA–derived metabolites (Fatland et al.
2005).

54
Taken together, the activation of expression of the above mentioned enzymes involved in
glycolysis, pentose phosphate pathway and TCA cycle due to HS may result in an increase in
the production of NAD(P)H, ATP and carbon skeletons needed for various vital cellular
processes such as biosynthesis of macromolecules (proteins, nucleic acids, amino acids, fatty
acids, secondary metabolites), which, in turn may explain the known effect of HS on plant
growth.
The stimulation of energy metabolism related enzymes after HS treatment has been reported
previously by many researchers: up-regulation of various metabolic processes and signalling
pathways associated to plant development (Pizzeghello et al. 2013; Trevisan et al. 2010),
increase in photosynthesis and respiration in plants (Jannin et al. 2012; Nardi et al. 2002),
stimulation of glycolysis and TCA cycle related enzymes in maize (Nardi et al. 2007) and in
Pinus nigra callus (Muscolo et al. 2007). Quaggiotti et al. (2004) also found that HS can
stimulate carbon and nitrogen metabolism by overexpression of various enzymes of
glycolysis and TCA cycle. In another study, the effect of HS on phosphate level and energy
metabolism was described in tobacco suspension culture in which the HS, small in size and
hydrophilic in nature, were found to stimulate the Pi level and energetic metabolism,
resulting specifically in higher Glucose-6-phosphate and ATP level (Zancani et al. 2009).
Cell wall metabolism
Cell wall is contained in the outermost extracellular matrix in plant cells and its regulation is
important for proper size and shape, mechanical resistance, interaction with environment,
defence against pathogens, development and growth (Reiter 2002). Cell wall is the first
compartment getting in contact with the exogenous agents, thus unsurprisingly its proteome
resulted modified by the HS-treatment. In our study, many of differentially expressed
enzymes related to cell wall metabolism were up-regulated (Fig. 1), as for example the
enzyme glycerophosphodiester phosphodiesterase (GDPD) (AT5G55480) (EC 3.1.4.46). This
enzyme plays a vital role in many physiological processes in living organisms, by converting
glycerophosphodiester to glycerol-3-phosphate and alcohols during glycerol metabolism
(Cheng et al. 2011). GDPD and its homologs have been found to be involved in cell wall
organization and in root hair morphogenesis in Arabidopsis (Hayashi et al. 2008). An
important cell wall related protein which was also up-regulated is RAF1 (AT3G10740),
bifunctional alpha-L-arabinofuranosidase/ beta-D-xylosidase. RAF1 is located in roots and
shoots in many types of cells, in particular in vascular tissues (Chavez Montes et al. 2008).
Alpha-xylosidase (AT1G68560) was increased after treatment with HS. This enzyme is

55
responsible for removing xylosyl residues from xyloglucan oligosaccharides and triggers
xyloglucan mobilization. Xyloglucan is the central hemicellulose in primary cell walls of
most seed plants and plays an important role in regulating and separating the cellulose
microfibrils during growth (Sampedro et al. 2010). These evidences point to readjustments in
cell wall composition which are likely required in remodeling and redefining the root organ
size, architecture and root hair morphogenesis when stimulated by HS (as found in Trevisan
et al. (2010)).
Protein synthesis, folding, and degradation
The involvement of HS in stimulation of protein synthesis in plants has been previously
observed in many studies: in Arabidopsis roots (Trevisan et al. 2011), maize roots (Carletti et
al. 2008) and guava leaves (Dantas et al. 2007). Canellas et al. (2002) also observed that the
HA-IAA groups may be able to access receptors and resulted in activation of protein
synthesis in maize roots.
Our differentially expressed proteins comprise 26 ribosomal proteins (RPs) mostly up
regulated. Ribosomes are the basic and essential components of every cell and catalyse
numerous transpeptidal esterase reactions during protein synthesis. Ribosomal proteins (RPs)
are not only vital for protein synthesis but also play a central role in cell division, growth and
metabolism. The role of RPs as regulatory components in addition to their housekeeping
function in developmental processes has been indicated by various mutational studies (Byrne
2009).
Ribosomal proteins are regulated by various regulators: for example, the application of BAP
(cytokinin) and IAA (auxin) increased the transcription of RPS15aF while ABA treatment
decreased it. Abiotic stresses like temperature and mechanical stress increased the transcript
of RPS15aA, RPS15aD and RPS15aF (Hulm et al. 2005).
This could suggest an overall increase in ribosome production in HS treated root, which is
consistent with enhanced protein synthesis leading to higher biomass production.
From the analysis of the interaction between the differentially expressed proteins of the
interactome, we highlighted an interesting network, which has as central node RACK1A
(AT1G18080) protein. RACK1A is a scaffold protein, formed by WD40 repeats, which can
simultaneously interact with several molecules (Nilsson et al. 2004). It is located on the back
of 40S ribosome subunit and, interacting with eIF6 (AT3G55620 or AT2G39820) protein, it
could directly regulate protein translation (Adams et al. 2011; Guo et al. 2009). RACK1A
gene expression is controlled by growth promoting extracellular stimuli, suggesting the role

56
of this protein in the cellular adaptation processes that occur during cell division (McCahill et
al. 2002). In our study RACK1A was not significant differentially expressed, but it could be a
central node for the influence of HS on cell responses. Based on the study of Guo et al.
(2011) it can be hypothesized that HS influence the expression of proteins which respond to
redox homeostasis: GPX2 (AT2G31570), DJ1A (AT3G14990), CSD1 (AT1G08830),
GTU19(AT1G78380). Signals might be received by RACK1A which directly interacts with
ribosomal and cytoskeleton proteins: RPL21A (AT1G09590), RPL25E (AT4G39200),
RPL27C (AT4G15000), ACT2 (AT3G18780) (Fig. 3).
Fig. 3 Interactome sub-network with RAC1A protein (Q24456) as central node. this sub-network was obtained
from the interactome of 246 proteins detected in Arabidopsis roots treated with HS. Nodes marked in green
were associated with significantly up-regulated proteins, red nodes denoted down-regulated proteins and grey
nodes were with no significant change. Labels report protein UniProt ID.
The enzyme lysyl-tRNA synthetase (AT3G11710), which is up-regulated in our experiment,
has a key role in conversion of genetic information from mRNA to protein by catalyzing the
formation of Lysyl-tRNA (Freist and Gauss 1995). The enzyme is also found to be linked
with many other secondary functions such as activation of gene expression (Lee et al. 2004),
and by serving as a cytokine (Park et al. 2005).
Our data report an increase of several isoforms of poly(A)-binding protein (PABP2,
AT1G49760; AT2G23350; AT4G27000; AT4G34110). After attaching with 3’ end of
mRNA, PABP interacts with eukaryotic translation initiation factor 4F complex enhancing
the translation process inside the cell (Sachs and Varani 2000). The role of PABP is also
found to be correlated with nuclear export of mRNAs (Brune et al. 2005) and stability
(Behm-Ansmant et al. 2007). In Arabidopsis thaliana, a total of eight different isoforms of
PABP have been characterized (Belostotsky 2003).

57
Various heat shock protein cognates (AT4G24280, AT5G49910, AT1G79930, AT3G09440)
were also over produced in response to HS. The 70-kD heat shock proteins (Hsp70s) are
found in all cellular compartments of almost all organisms and have been found to be crucial
for protein folding, protein translocation, and stress responses (Latijnhouwers et al. 2010).
Two of the up-regulated Hsp70S have been described in Arabidopsis as stromal isoforms
cpHsc70-1 (At4g24280) and cpHsc70-2 (At5g49910). In one knockout study a mutation in
cpHsc70-1 resulted in abnormal leaves, impaired root development and retardation in growth
(Su and Li 2008b).
Another up-regulated protein belonging to the class of protein folding is the Luminal-binding
protein 1 (AT5G28540), also known as BIP1. Immunoglobulin-binding proteins (BiP) are
molecular chaperones of the Hsp70 family and have a key role in regulation and control of
translocation and folding of proteins inside the ER. Three genes as BIP1, BIP2 and BIP3 are
found in Arabidopsis; BIP1 and BIP2 being ubiquitous in nature, while BIP3 has been shown
to be expressed only under stress conditions in the majority of organs. Many stresses, both
biotic and abiotic such as fungus, insect, cold, drought and nutrient deficiency were seen to
induce BIP expression (Alvim et al. 2001; Chen and Lee 2011).
Plant proteasomes (26S proteasomes) contain two subparticles: the core particle (CP) or 20S
proteasome where proteins are degraded, and the regulatory particle (RP) or 19S proteasome.
26S proteasomes are in charge of the ATP-dependent degradation of ubiquitin tagged
proteins (Sadanandom et al. 2012) including normal, mutated, misfolded and damaged
proteins (Kurepa and Smalle 2008; Tolin et al. 2013). The ubiquitin-proteasome system plays
a role in nearly all aspects of cell homeostasis including plant development, response to plant
hormones (Sullivan et al. 2003) and signalling in response to abiotic and biotic stimuli
(Smalle and Vierstra 2004). Moreover, the 20S particle can also degrade proteins in a
ubiquitin-independent manner, mainly for oxidized proteins (Foyer and Allen 2003). In this
study HS treatment resulted in differential expression of some proteasome subunits such as
26S proteasome non-ATPase regulatory subunit 14 (AT5G23540), Proteasome subunits
alpha type-3 (AT2G27020), alpha type-5-A (AT1G53850), beta type-2-B (AT4G14800) and
beta type-7-A (AT3G27430) all of which are down-regulated and belong to the 20S (CP)
subparticle, and the 26S protease regulatory subunit S10B homolog B (AT1G45000) which is
up-regulated and belongs to the 19S (RP) subparticle. The involvement of the proteasome
complex may be seen as a component of cell metabolic remodelling in the response to HS
treatment, coherently with the view that the proteolytic capacity of a cell is the result of a

58
careful balancing act that reflects environmental conditions and developmental stage (Kurepa
and Smalle 2008)
26S proteasome is ubiquitin and ATP dependent proteasome and is involved in protein
degradation in the nucleus and the cytosol (Voges et al. 1999; Pickart and Cohen, 2004).
Various catalytic activities such as trypsin-like, chymotrypsin-like peptidylglutamyl-peptide
hydrolase were performed by 20S core particle of 26S proteasome (Voges et al. 1999; Groll
et al. 1997). In Arabidopsis 26S proteasome are found to be involved in both basal defense
and R gene mediated defense (Yao et al. 2012).
This observation is confirmed by KEGG pathways analysis, pointing to the majority of the
identified ribosomal proteins being up-regulated while those of the proteasome (Fig. S5;
supplementary material) being down-regulated.
All these observations indicate that up-regulation of ribosomal proteins is a major HS effect
in Arabidopsis roots, which may be related with enhanced protein synthesis which is required
to sustain growth.
Cell Trafficking and division
DAVID analysis on our proteomic data identified many differentially expressed proteins
related to cell vesicle trafficking and growth such as Actin-7 (AT5G09810), Actin-2
(AT3G18780), Dynamin-related protein 1C (AT1G14830), Patellin-1 (AT1G72150),
Patellin-2 (AT1G22530), Patellin-4 (AT1G30690), all of which were up-regulated. Two
other proteins involved in actin metabolism were also found to be upregulated, namely
GDPDL4 (AT5G55480), reported to be involved in actin nucleation and VHA-B1, V-type
proton ATPase subunit B1 (AT1G76030), involved in actin filament assembly (Ma et al.
2012). The involvement of actin in plant responses to HS has been already highlighted in
previous works (Carletti et al. 2008) as well as transport processes and vesicles trafficking
related genes (Trevisan et al. 2011).
The role of actin in cellular processes is diverse and ranges from cell division and
morphogenesis to cell motility (Pollard and Cooper 2009). Actin is also found to be important
for tip growth (polarized cell extension) in plants (Menand et al. 2007), whose implications
are of particular relevance in this study.
Dynamin-related protein 1C (AT1G14830) was also over expressed in this study. Dynamin is
the key component of clathrin-mediated membrane trafficking, crucial for numerous stages of
growth and development in plants. Unlike other organisms, plants require both classical

59
dynamin (DRP2) as well as dynamin-related proteins (DRP1) for clathrin-mediated
membrane trafficking (Backues et al. 2010).
Patellin is a phosphoinositide-binding protein that plays a role in membrane trafficking
during the expansion and maturation stages of cytokinesis, in particular cell-plate formation
(McMichael and Bednarek 2013).
Among the proteins implicated in cell division processes also the HSP90-like protein GRP94
(also known as SHD, AT4G24190) might be considered. While its fold change of 1.23
suggests some up-regulation by HS, it is slightly lower than the selected threshold of >1.3 for
consideration in our current study; however, it seems relevant to us that this gene was found
to be highly expressed in (Trevisan et al. 2011). GRP94 is a glucose-regulated protein of
endoplasmic reticulum and is involved in various developmental and physiological functions
in multicellular organisms (Marzec et al. 2012); Arabidopsis plants with silent GRP94
showed abnormal phenotype in roots and shoot meristem (Ishiguro et al. 2002).
Heat response
HS caused a significant increase in expression of heat responsive proteins in this study: heat
shock 70 kDa protein 6 (AT4G24280); Heat shock 70 kDa protein 3 (AT3G09440); Heat
shock 70 kDa protein 7 (AT5G49910); Probable mediator of RNA polymerase II
transcription subunit 37e (AT5G02500); Mediator of RNA polymerase II transcription
subunit 37a (AT5G28540); Lipocalin (AT5G58070).
The 70-kD heat shock proteins (Hsp70s) are molecular chaperones involved in a variety of
cellular processes including protein folding, protein transport across membranes, modulation
of protein activity, regulation of protein degradation, and prevention of irreversible protein
aggregation. Plant Hsp70s are encoded by a multiple-gene family (Su and Li 2008a). It is
well-known that Hsps are ubiquitous proteins found in plant and animal cells, which were
initially described to be involved in heat shock, but they are known to be induced by a wide
variety of stresses, including cold, drought, salt, UV-light, wound, and biotic stresses (Wen et
al. 2017).
Lipocalin (TIL, AT5G58070) is another heat responsive protein which was overexpressed in
this study. Lipocalins are small extracellular proteins and have been implicated in freezing
and oxidative stress tolerance in Arabidopsis (Charron et al. 2008), probably by contrasting
lipid peroxidation triggered by heat stress as shown in Arabidopsis TIL1 knockout mutants
(Chi et al. 2009).

60
Chromosome organization
The eukaryotic cells package and organize the nucleoprotein into a complex structure called
chromatin. The basic unit of chromatin is called nucleosome and consists of the genomic
DNAs wrapped over two copies of four histone molecules: H2A, H2B, H3, and H4
(Schneider and Grosschedl 2007). Biological studies showed that histone variants are
involved in numerous processes including cell cycle, DNA damage response and
transcription (Arnaudo et al. 2011). Cellular machinery can change specifically the histone
molecules to regulate the gene expression (Heyse et al. 2009). The adjustment of histone
molecules in order to monitor gene expression is very important for cell wall development
(Dhawan et al. 2009), flowering time control (Cao et al. 2008), seed development (Liu et al.
2007), root growth (Yao et al. 2013) and plant defense responses (Palma et al. 2010; Xia et
al. 2013). The modification of histone by methylation and ubiquitination can either activate
or repress transcription depending upon their targets (Berke et al. 2012; Quan and Hartzog
2010).
In this study, treatment with humic substances resulted in repression of Histone H2B.11
(AT5G59910), Histone H2B.6 (AT3G45980), Probable histone H2A.7 (AT5G59870) and
Probable histone H2A.2 (AT3G20670), while Histone H2A variant 1 (AT3G54560) is up-
regulated. The rationale behind the existence of multiple genes for the same histone protein is
unclear. The reasons for the presence of multiple histone genes may be either simply for
backup in case of inactivating gene mutations or may be required for synthesis of multiple
histones needed for chromatin assembly during DNA replication. The simultaneous reduction
in expression of histones is probably related to transcriptional control resulting in coordinated
cell cycle and root growth.
Integration with previous results and validation of proteomic analysis results
In this work we have provided a thorough proteomic analysis in Arabidopsis roots treated
with HS obtained at our laboratory, following a standardized procedure for extraction,
purification and characterization providing a product with homogeneous and stable properties
over time.
Identical experimental conditions in terms of HS quality, concentration, exposure time,
growth chamber settings (temperature, humidity, daylength) were previously used to treat
Arabidopsis plants also in another study, aimed at studying the effects of HS on gene
expression by a transcriptomic approach based on the detection of cDNA-AFLP markers

61
(Trevisan et al. 2011). When comparing our proteomic results with that transcriptomic
analysis, we found an overall similar effect in terms of proportion of up-regulated to down-
regulated genes/proteins: while 63% of total altered proteins were up-regulated, 75% of
differentially expressed genes were up-regulated in the study from Trevisan et al. (2011).
Together, these evidences point to a predominant effect of HS in up-regulating gene
expression.
More in details, four enzymes that are up-regulated in our study (AT3G16460, AT4G35830,
AT2G26080, and AT1G57720) were also found to be up-regulated at gene expression level.
Those results properly represent an independent confirmatory evidence and validation of our
current experimental results by alternative gene expression analysis. It is expected that more
confirmations would come from genome-wide microarray or RNA-seq data analysis, bearing
in mind that due to post-transcriptional and post-translational modifications, and different
protein species stability and turnover rate, it is not always possible to directly correlate
transcript with protein expression levels.

62
Conclusions
With the present work, an overview of metabolic pathways influenced by HS activity is
presented, only in part previously observed. Taken together, our results point to the activation
of enzymes involved in glycolysis, pentose phosphate pathway and TCA cycle to support the
production of NAD(P)H, ATP and carbon skeletons needed for various vital cellular
processes. Stimulation of energy metabolism may explain the known beneficial effects of HS
on plant growth. Up-regulation of ROS scavenging enzymes may be interpreted as the need
to counteract dangerous radicals generated by accelerated energy processes in glycolysis and
TCA cycle. Up-regulation of ribosomal proteins, HSPs and actin are likely representative of a
co-ordinately enhanced protein synthesis, folding, trafficking and transport across membranes
which is required to sustain growth. Our findings also point to readjustments in cell wall
composition which are likely to be required in root remodelling and root hair morphogenesis.
Finally, the interactome analysis highlighted the possible role of RACK1A as a central node
in cell responses to HS.
Acknowledgements
PhD grant for Giovanni Battista Conselvan funded by MIUR “L 170”. The project was
financially supported by Padova University - CPDA112850. Paolo Carletti was financially
supported by University of Padova DOR1751800/17.

63
References
Adams DR, Ron D, Kiely PA (2011) RACK1, A multifaceted scaffolding protein: Structure
and function. Cell Commun Signal 9: 24. doi: 10.1186/1478-811x-9-22.
Aguiar NO, Medici LO, Olivares FL, Dobbss LB, Torres-Netto A, Silva SF, Novotny EH,
Canellas LP (2016) Metabolic profile and antioxidant responses during drought stress
recovery in sugarcane treated with humic acids and endophytic diazotrophic bacteria.
Ann Appl Biol 168: 203-213. doi: 10.1111/aab.12256.
Aguiar NO, Olivares FL, Novotny EH, Dobbss LB, Balmori DM, Santos-Júnior LG, Chagas
JG, Façanha AR, Canellas LP (2012) Bioactivity of humic acids isolated from
vermicomposts at different maturation stages. Plant Soil 362: 161-174. doi:
10.1007/s11104-012-1277-5.
Ahou A, Martignago D, Alabdallah O, Tavazza R, Stano P, Macone A, Pivato M, Masi A,
Rambla JL, Vera-Sirera F, Angelini R, Federico R, Tavladoraki P (2014) A plant
spermine oxidase/dehydrogenase regulated by the proteasome and polyamines.
Journal of Experimental Botany 65: 1585-1603. doi: 10.1093/jxb/eru016.
Alvim FC, Carolino SMB, Cascardo JCM, Nunes CC, Martinez CA, Otoni WC, Fontes EPB
(2001) Enhanced accumulation of BiP in transgenic plants confers tolerance to water
stress. Plant Physiol 126: 1042-1054. doi: 10.1104/pp.126.3.1042.
Arnaudo AM, Molden RC, Garcia BA (2011) Revealing histone variant induced changes via
quantitative proteomics. Critical reviews in biochemistry and molecular biology 46:
284-294. doi: 10.3109/10409238.2011.577052.
Aydin A, Kant C, Turan M (2012) Humic acid application alleviate salinity stress of bean
(Phaseolus vulgaris L.) plants decreasing membrane leakage. African Journal of
Agricultural Research 7: 1073-1086.
Bachmair A, Novatchkova M, Potuschak T, Eisenhaber F (2001) Ubiquitylation in plants: a
post-genomic look at a post-translational modification. Trends in Plant Science 6:
463-470. doi: 10.1016/S1360-1385(01)02080-5.
Backues SK, Korasick DA, Heese A, Bednarek SY (2010) The Arabidopsis dynamin-related
protein2 family is essential for gametophyte development. The Plant cell 22: 3218-
3231. doi: 10.1105/tpc.110.077727.
Behm-Ansmant I, Branlant C, Motorin Y (2007) The Saccharomyces cerevisiae Pus2 protein
encoded by YGL063w ORF is a mitochondrial tRNA: Ψ27/28-synthase. Rna 13:
1641-1647.

64
Belostotsky DA (2003) Unexpected complexity of poly(A)-binding protein gene families in
flowering plants: Three conserved lineages that are at least 200 million years old and
possible auto- and cross-regulation. Genetics 163: 311-319.
Berbara RLL, Garcia AC (2014) Humic substances and plant defense metabolism. In: P
Ahmad, MR Wani (eds) Physiological mechanisms and adaptation strategies in plants
under changing enviornoment: volume 1. Springer Science+Business Media, New
York.
Berke L, Sanchez-Perez GF, Snel B (2012) Contribution of the epigenetic mark H3K27me3
to functional divergence after whole genome duplication in Arabidopsis. Genome
Biol 13. doi: 10.1186/gb-2012-13-10-R94.
Bernardo L, Morcia C, Carletti P, Ghizzoni R, Badeck FW, Rizza F, Lucini L, Terzi V (2017)
Proteomic insight into the mitigation of wheat root drought stress by arbuscular
mycorrhizae. J Proteomics. doi: 10.1016/j.jprot.2017.03.024.
Birnbaum K, Shasha DE, Wang JY, Jung JW, Lambert GM, Galbraith DW, Benfey PN
(2003) A gene expression map of the Arabidopsis root. Science 302: 1956-1960. doi:
10.1126/science.1090022.
Brune C, Munchel SE, Fischer N, Podtelejnikov AV, Weis K (2005) Yeast poly(A)-binding
protein Pab1 shuttles between the nucleus and the cytoplasm and functions in mRNA
export. Rna-a Publication of the Rna Society 11: 517-531. doi: 10.1261/rna.7291205.
Byrne ME (2009) A role for the ribosome in development. Trends in Plant Science 14: 512-
519. doi: 10.1016/j.tplants.2009.06.009.
Calvo P, Nelson L, Kloepper JW (2014) Agricultural uses of plant biostimulants. Plant Soil
383: 3-41. doi: 10.1007/S11104-014-2131-8.
Canellas LP, Dantas DJ, Aguiar NO, Peres LEP, Zsogon A, Olivares FL, Dobbss LB,
Facanha AR, Nebbioso A, Piccolo A (2011) Probing the hormonal activity of
fractionated molecular humic components in tomato auxin mutants. Ann Appl Biol
159: 202-211. doi: 10.1111/j.1744-7348.2011.00487.x.
Canellas LP, Olivares FL (2014) Physiological responses to humic substances as plant
growth promoter. Chemical and Biological Technologies in Agriculture 1: 3. doi:
10.1186/2196-5641-1-3.
Canellas LP, Olivares FL, Okorokova-Facanha AL, Facanha AR (2002) Humic acids isolated
from earthworm compost enhance root elongation, lateral root emergence, and plasma
membrane H+-ATPase activity in maize roots. Plant Physiol 130: 1951-1957.

65
Cao Y, Dai Y, Cui S, Ma L (2008) Histone H2B monoubiquitination in the chromatin of
flowering locus C regulates flowering time in Arabidopsis. The Plant cell 20: 2586-
2602. doi: 10.1105/tpc.108.062760.
Carazzolle MF, de Carvalho LM, Slepicka HH, Vidal RO, Pereira GAG, Kobarg J, Meirelles
GV (2014) IIS - Integrated Interactome System: a web-based platform for the
annotation, analysis and visualization of protein-metabolite-gene-drug interactions by
integrating a variety of data sources and tools. PLoS One 9: 13. doi:
10.1371/journal.pone.0100385.
Carletti P, Masi A, Spolaore B, De Laureto PP, De Zorzi M, Turetta L, Ferretti M, Nardi S
(2008) Protein expression changes in maize roots in response to humic substances.
Journal of Chemical Ecology 34: 804-818.
Cerveau D, Ouahrani D, Marok MA, Blanchard L, Rey P (2016) Physiological relevance of
plant 2-Cys peroxiredoxin overoxidation level and oligomerization status. Plant, Cell
and Environment 39: 103-119. doi: 10.1111/pce.12596.
Chavez Montes RA, Ranocha P, Martinez Y, Minic Z, Jouanin L, Marquis M, Saulnier L,
Fulton LM, Cobbett CS, Bitton F, Renou JP, Jauneau A, Goffner D (2008) Cell wall
modifications in Arabidopsis plants with altered alpha-L-arabinofuranosidase activity.
Plant Physiol 147: 63-77. doi: 10.1104/pp.107.110023.
Chen WT, Lee AS (2011) Measurament and modification of the expression level of the
chaperone protein and signaling regulator GRP78/BIP in mammalian cells. In: PM
Conn (ed) Methods in enzymology: unfolded protein response and cellular stress, Vol
490, Pt B. Elsevier Academic Press Inc, San Diego.
Cheng Y, Zhou W, El Sheery NI, Peters C, Li M, Wang X, Huang J (2011) Characterization
of the Arabidopsis glycerophosphodiester phosphodiesterase (GDPD) family reveals a
role of the plastid-localized AtGDPD1 in maintaining cellular phosphate homeostasis
under phosphate starvation. The Plant journal : for cell and molecular biology 66:
781-795. doi: 10.1111/j.1365-313X.2011.04538.x.
Cho EJ, Yuen CY, Kang BH, Ondzighi CA, Staehelin LA, Christopher DA (2011) Protein
disulfide isomerase-2 of Arabidopsis mediates protein folding and localizes to both
the secretory pathway and nucleus, where it interacts with maternal effect embryo
arrest factor. Molecules and cells 32: 459-475. doi: 10.1007/s10059-011-0150-3.
Cline MS, Smoot M, Cerami E, Kuchinsky A, Landys N, Workman C, Christmas R, Avila-
Campilo I, Creech M, Gross B, Hanspers K, Isserlin R, Kelley R, Killcoyne S, Lotia
S, Maere S, Morris J, Ono K, Pavlovic V, Pico AR, Vailaya A, Wang PL, Adler A,

66
Conklin BR, Hood L, Kuiper M, Sander C, Schmulevich I, Schwikowski B, Warner
GJ, Ideker T, Bader GD (2007) Integration of biological networks and gene
expression data using Cytoscape. Nature protocols 2: 2366-2382. doi:
10.1038/nprot.2007.324.
Cordeiro FC, Santa-Catarina C, Silveira V, de Souza SR (2011) Humic acid effect on catalase
activity and the generation of reactive oxygen species in corn (Zea mays). Bioscience,
biotechnology, and biochemistry 75: 70-74. doi: 10.1271/bbb.100553.
Dantas BF, Pereira MS, Ribeiro LD, Maia JLT, Bassoi LH (2007) Effect of humic substances
and weather conditions on leaf biochemical changes of fertigated guava tree, during
orchard establishment. Rev Bras Frutic 29: 632-638. doi: 10.1590/s0100-
29452007000300040.
de Vasconcelos ACF, Zhang XZ, Ervin EH, Kiehl JD (2009) Enzymatic antioxidant
responses to biostimulants in maize and soybean subjected to drought. Sci Agric 66:
395-402.
Destro T, Prasad D, Martignago D, Bernet IL, Trentin AR, Renu IK, Ferretti M, Masi A
(2011) Compensatory expression and substrate inducibility of gamma-glutamyl
transferase GGT2 isoform in Arabidopsis thaliana. Journal of Experimental Botany
62: 805-814. doi: 10.1093/jxb/erq316.
Dhawan R, Luo H, Foerster AM, Abuqamar S, Du HN, Briggs SD, Mittelsten Scheid O,
Mengiste T (2009) HISTONE MONOUBIQUITINATION1 interacts with a subunit
of the mediator complex and regulates defense against necrotrophic fungal pathogens
in Arabidopsis. The Plant cell 21: 1000-1019. doi: 10.1105/tpc.108.062364.
Dietz KJ (2011) Peroxiredoxins in plants and cyanobacteria. Antioxid Redox Signal 15:
1129-1159. doi: 10.1089/ars.2010.3657.
Dinakar C, Abhaypratap V, Yearla SR, Raghavendra AS, Padmasree K (2010) Importance of
ROS and antioxidant system during the beneficial interactions of mitochondrial
metabolism with photosynthetic carbon assimilation. Planta 231: 461-474. doi:
10.1007/s00425-009-1067-3.
du Jardin P (2012) The science of plant biostimulants – a bibliographic analysis,
http://ec.europa.eu/enterprise/sectors/chemicals/files/fertilizers/final_report_bio_2012
_en.pdf.
Evangelou MWH, Daghan H, Schaeffer A (2004) The influence of humic acids on the
phytoextraction of cadmium from soil. Chemosphere 57: 207-213. doi:
10.1016/j.chemosphere.2004.06.017.

67
FAO-UNESCO (1997) World soil map, revised legend. FAO, Wageningen, Netherlands.
Fatland BL, Nikolau BJ, Wurtele ES (2005) Reverse genetic characterization of cytosolic
acetyl-CoA generation by ATP-citrate lyase in Arabidopsis. The Plant cell 17: 182-
203. doi: 10.1105/tpc.104.026211.
Figueroa P, Leon G, Elorza A, Holuigue L, Jordana X (2001) Three different genes encode
the iron-sulfur subunit of succinate dehydrogenase in Arabidopsis thaliana. Plant
Molecular Biology 46: 241-250. doi: 10.1023/a:1010612506070.
Foyer CH, Allen JF (2003) Lessons from redox signaling in plants. Antioxidants and Redox
Signaling 5: 3-5.
Freist W, Gauss DH (1995) Lysyl-transfer-RNA synthetase. Biol Chem Hoppe-Seyler 376:
451-472.
Gao TG, Xu YY, Jiang F, Li BZ, Yang JS, Wang ET, Yuan HL (2015) Nodulation
characterization and proteomic profiling of Bradyrhizobium liaoningense
CCBAU05525 in response to water-soluble humic materials. Sci Rep 5: 13. doi:
10.1038/srep10836.
Garcia AC, Olaetxea M, Santos LA, Mora V, Baigorri R, Fuentes M, Zamarreno AM,
Berbara RLL, Garcia-Mina JM (2016) Involvement of hormone- and ROS-signaling
pathways in the beneficial action of humic substances on plants growing under
normal and stressing conditions. Biomed Res Int: 13. doi: 10.1155/2016/3747501.
García AC, Santos LA, Izquierdo FG, Sperandio MVL, Castro RN, Berbara RLL (2012)
Vermicompost humic acids as an ecological pathway to protect rice plant against
oxidative stress. Ecological Engineering 47: 203-208. doi:
10.1016/j.ecoleng.2012.06.011.
Goward CR, Nicholls DJ (1994) Malate dehydrogenase: a model for structure, evolution, and
catalysis. Protein Science 3: 1883-1888.
Guo J, Wang J, Xi L, Huang W-D, Liang J, Chen J-G (2009) RACK1 is a negative regulator
of ABA responses in Arabidopsis. Journal of Experimental Botany. doi:
10.1093/jxb/erp221.
Guo JJ, Wang SC, Valerius O, Hall H, Zeng QN, Li JF, Weston DJ, Ellis BE, Chen JG
(2011) Involvement of Arabidopsis RACK1 in protein translation and Its regulation
by abscisic acid. Plant Physiol 155: 370-383. doi: 10.1104/pp.110.160663.
Hager A (2003) Role of the plasma membrane H+-ATPase in auxin-induced elongation
growth: historical and new aspects. J Plant Res 116: 483-505. doi: 10.1007/s10265-
003-0110-x.

68
Halim M, Conte P, Piccolo A (2003) Potential availability of heavy metals to phytoextraction
from contaminated soils induced by exogenous humic substances. Chemosphere 52:
265-275. doi: 10.1016/s0045-6535(03)00185-1.
Hatfield PM, Gosink MM, Carpenter TB, Vierstra RD (1997) The ubiquitin-activating
enzyme (E1) gene family in Arabidopsis thaliana. The Plant Journal 11: 213-226. doi:
10.1046/j.1365-313X.1997.11020213.x.
Hayashi S, Ishii T, Matsunaga T, Tominaga R, Kuromori T, Wada T, Shinozaki K, Hirayama
T (2008) The glycerophosphoryl diester phosphodiesterase-like proteins SHV3 and its
homologs play important roles in cell wall organization. Plant and Cell Physiology
49: 1522-1535. doi: 10.1093/pcp/pcn120.
Heyse KS, Weber SE, Lipps HJ (2009) Histone modifications are specifically relocated
during gene activation and nuclear differentiation. BMC Genomics 10. doi:
10.1186/1471-2164-10-554.
Huang DW, Sherman BT, Lempicki RA (2009a) Bioinformatics enrichment tools: paths
toward the comprehensive functional analysis of large gene lists. Nucleic Acids
Research 37: 1-13. doi: 10.1093/nar/gkn923.
Huang DW, Sherman BT, Lempicki RA (2009b) Systematic and integrative analysis of large
gene lists using DAVID bioinformatics resources. Nature protocols 4: 44-57. doi:
10.1038/nprot.2008.211.
Hulm JL, McIntosh KB, Bonham-Smith PC (2005) Variation in transcript abundance among
the four members of the Arabidopsis thaliana RIBOSOMAL PROTEIN S15a gene
family. Plant Science 169: 267-278. doi: 10.1016/j.plantsci.2005.04.001.
Ishiguro S, Watanabe Y, Ito N, Nonaka H, Takeda N, Sakai T, Kanaya H, Okada K (2002)
SHEPHERD is the Arabidopsis GRP94 responsible for the formation of functional
CLAVATA proteins. Embo Journal 21: 898-908. doi: 10.1093/emboj/21.5.898.
Jannin L, Arkoun M, Ourry A, Laîné P, Goux D, Garnica M, Fuentes M, Francisco SS,
Baigorri R, Cruz F, Houdusse F, Garcia-Mina J-M, Yvin J-C, Etienne P (2012)
Microarray analysis of humic acid effects on Brassica napus growth: Involvement of
N, C and S metabolisms. Plant Soil 359: 297-319. doi: 10.1007/s11104-012-1191-x.
Jindo K, Martim SA, Navarro EC, Pérez-Alfocea F, Hernandez T, Garcia C, Aguiar NO,
Canellas LP (2011) Root growth promotion by humic acids from composted and non-
composted urban organic wastes. Plant Soil 353: 209-220. doi: 10.1007/s11104-011-
1024-3.

69
Kalis EJJ, Temminghoff EJM, Weng LP, Van Riemsdijk WH (2006) Effects of humic acid
and competing cations on metal uptake by Lolium perenne. Environ Toxicol Chem
25: 702-711. doi: 10.1897/04-576r.1.
Kanehisa M, Furumichi M, Tanabe M, Sato Y, Morishima K (2017) KEGG: new
perspectives on genomes, pathways, diseases and drugs. Nucleic Acids Research 45:
D353-D361. doi: 10.1093/nar/gkw1092.
Kanehisa M, Sato Y, Kawashima M, Furumichi M, Tanabe M (2016) KEGG as a reference
resource for gene and protein annotation. Nucleic Acids Research 44: D457-D462.
doi: 10.1093/nar/gkv1070.
Kocher T, Pichler P, Schutzbier M, Stingl C, Kaul A, Teucher N, Hasenfuss G, Penninger
JM, Mechtler K (2009) High precision quantitative proteomics using iTRAQ on an
LTQ orbitrap: a new Mass spectrometric method combining the benefits of all. J
Proteome Res 8: 4743-4752. doi: 10.1021/pr900451u.
Kosova K, Vitamvas P, Prasil IT (2014) Proteomics of stress responses in wheat and barley-
search for potential protein markers of stress tolerance. Front Plant Sci 5: 14. doi:
10.3389/fpls.2014.00711.
Kurepa J, Smalle JA (2008) Structure, function and regulation of plant proteasomes.
Biochimie 90: 324-335. doi: 10.1016/j.biochi.2007.07.019.
Lan P, Li W, Wen TN, Shiau JY, Wu YC, Lin W, Schmidt W (2011) iTRAQ protein profile
analysis of Arabidopsis roots reveals new aspects critical for iron homeostasis. Plant
Physiol 155: 821-834. doi: 10.1104/pp.110.169508.
Latijnhouwers M, Xu XM, Moller SG (2010) Arabidopsis stromal 70-kDa heat shock
proteins are essential for chloroplast development. Planta 232: 567-578. doi:
10.1007/s00425-010-1192-z.
Lee SW, Cho BH, Park SG, Kim S (2004) Aminoacyl-tRNA synthetase complexes: beyond
translation. Journal of cell science 117: 3725-3734. doi: 10.1242/jcs.01342.
Liu YX, Koornneef M, Soppe WJJ (2007) The absence of histone H2B monoubiquitination
in the Arabidopsis hub1 (rdo4) mutant reveals a role for chromatin remodeling in seed
dormancy. The Plant cell 19: 433-444. doi: 10.1105/tpc.106.049221.
Lu DP, Christopher DA (2008) Endoplasmic reticulum stress activates the expression of a
sub-group of protein disulfide isomerase genes and AtbZIP60 modulates the response
in Arabidopsis thaliana. Mol Genet Genomics 280: 199-210. doi: 10.1007/s00438-
008-0356-z.

70
Ma B, Qian D, Nan Q, Tan C, An L, Xiang Y (2012) Arabidopsis vacuolar H+-ATPase (V-
ATPase) B subunits are involved in actin cytoskeleton remodeling via binding to,
bundling, and stabilizing F-actin. The Journal of biological chemistry 287: 19008-
19017. doi: 10.1074/jbc.m111.281873.
Marzec M, Eletto D, Argon Y (2012) GRP94: An HSP90-like protein specialized for protein
folding and quality control in the endoplasmic reticulum. Biochimica et biophysica
acta 1823: 774-787. doi: 10.1016/j.bbamcr.2011.10.013.
McCahill A, Warwicker J, Bolger GB, Houslay MD, Yarwood SJ (2002) The RACK1
scaffold protein: a dynamic cog in cell response mechanisms. Mol Pharmacol 62:
1261-1273. doi: 10.1124/mol.62.6.1261.
McMichael CM, Bednarek SY (2013) Cytoskeletal and membrane dynamics during higher
plant cytokinesis. New Phytol 197: 1039-1057. doi: 10.1111/nph.12122.
Menand B, Yi KK, Jouannic S, Hoffmann L, Ryan E, Linstead P, Schaefer DG, Dolan L
(2007) An ancient mechanism controls the development of cells with a rooting
function in land plants. Science 316: 1477-1480. doi: 10.1126/science.1142618.
Minelli A, Omodeo P, Rota E, Sambugar B (1995) Anellida Clitellata, Aphanomeura. In: A
Minelli, S Rufo, S La Posta (eds) Checklist delle specie della fauna italiana.
Calderoni, Bologna.
Moeder W, Del Pozo O, Navarre DA, Martin GB, Klessig DF (2007) Aconitase plays a role
in regulating resistance to oxidative stress and cell death in Arabidopsis and Nicotiana
benthamiana. Plant Mol Biol 63: 273-287. doi: 10.1007/s11103-006-9087-x.
Mora V, Bacaicoa E, Baigorri R, Zamarreno AM, Garcia-Mina JM (2014) NO and IAA key
regulators in the shoot growth promoting action of humic acid in Cucumis sativus L. J
Plant Growth Regul 33: 430-439. doi: 10.1007/s00344-013-9394-9.
Muscolo A, Felici M, Concheri G, Nardi S (1993) Effects of earthworm humic substances on
esterase and peroxidase-activity during growth of leaf explants of Nicotiana
plumbaginiflia. Biology and Fertility of Soils 15: 127-131. doi: 10.1007/bf00336430.
Muscolo A, Sidari M, Attinà E, Francioso O, Tugnoli V, Nardi S (2007) Biological activity
of humic substances Is related to their chemical structure. Soil Science Society of
America Journal 71: 75. doi: 10.2136/sssaj2006.0055.
Muscolo A, Sidari M, Nardi S (2013) Humic substance: relationship between structure and
activity. Deeper information suggests univocal findings. J Geochem Explor 129: 57-
63. doi: 10.1016/j.gexplo.2012.10.012.

71
Nardi S, Carletti P, Pizzeghello D, Muscolo A (2009) Biological activities of humic
substances. In: PM Huang, N Senesi (eds) Biophysico-chemical processes in
environmental systems. John Wiley & Sons, Hoboken, USA.
Nardi S, Concheri G, Dellagnola G, Scrimin P (1991) Nitrate uptake and ATPase activity in
oat seedlings in the
presence of two humic fractions. Soil Biology & Biochemistry 23: 833-836.
Nardi S, Muscolo A, Vaccaro S, Baiano S, Spaccini R, Piccolo A (2007) Relationship
between molecular characteristics of soil humic fractions and glycolytic pathway and
krebs cycle in maize seedlings. Soil Biology & Biochemistry 39: 3138-3146. doi:
10.1016/j.soilbio.2007.07.006.
Nardi S, Pizzeghello D, Muscolo A, Vianello A (2002) Physiological effects of humic
substances on higher plants. Soil Biology & Biochemistry 34: 1527-1536.
Nilsson J, Sengupta J, Frank J, Nissen P (2004) Regulation of eukaryotic translation by the
RACK1 protein: a platform for signalling molecules on the ribosome. EMBO Rep 5:
1137-1141. doi: 10.1038/sj.embor.7400291.
Nishida I (2007) Plastid metabolic pathways for fatty acid metabolism. In: H Daniell, CD
Chase (eds) Molecular biology and biotechnology of plant organelles: chloroplasts
and mitochondria. Springer Netherlands.
Noctor G, Lelarge-Trouverie C, Mhamdi A (2015) The metabolomics of oxidative stress.
Phytochemistry 112: 33-53. doi: 10.1016/j.phytochem.2014.09.002.
O'Donnell R (1973) The auxin-like effects of humic preparations from leonardite. Soil
Science 116: 106-112.
Palma K, Thorgrimsen S, Malinovsky FG, Fiil BK, Nielsen HB, Brodersen P, Hofius D,
Petersen M, Mundy J (2010) Autoimmunity in Arabidopsis acd11 is mediated by
epigenetic regulation of an immune receptor. PLoS Pathog 6. doi:
10.1371/journal.ppat.1001137.
Park SG, Ewalt KL, Kim S (2005) Functional expansion of aminoacyl-tRNA synthetases and
their interacting factors: new perspectives on housekeepers. Trends Biochem Sci 30:
569-574. doi: 10.1016/j.tibs.2005.08.004.
Passaia G, Margis-Pinheiro M (2015) Glutathione peroxidases as redox sensor proteins in
plant cells. Plant Science 234: 22-26. doi: 10.1016/j.plantsci.2015.01.017.
Passardi F, Cosio C, Penel C, Dunand C (2005) Peroxidases have more functions than a
Swiss army knife. Plant cell reports 24: 255-265. doi: 10.1007/s00299-005-0972-6.

72
Passardi F, Tognolli M, De Meyer M, Penel C, Dunand C (2006) Two cell wall associated
peroxidases from Arabidopsis influence root elongation. Planta 223: 965-974. doi:
10.1007/s00425-005-0153-4.
Pizzeghello D, Francioso O, Ertani A, Muscolo A, Nardi S (2013) Isopentenyladenosine and
cytokinin-like activity of different humic substances. J Geochem Explor 129: 70-75.
doi: 10.1016/j.gexplo.2012.10.007.
Plaxton WC (1996) The organization and regulation of plant glycolysis. Annu Rev Plant
Physiol Plant Molec Biol 47: 185-214. doi: 10.1146/annurev.arplant.47.1.185.
Pollard TD, Cooper JA (2009) Actin, a central player in cell shape and movement. Science
326: 1208-1212. doi: 10.1126/science.1175862.
Putz SM, Boehm AM, Stiewe T, Sickmann A (2012) iTRAQ analysis of a cell culture model
for malignant transformation, including comparison with 2D-PAGE and SILAC. J
Proteome Res 11: 2140-2153. doi: 10.1021/pr200881c.
Quaggiotti S, Ruperti B, Pizzeghello D, Francioso O, Tugnoli V, Nardi S (2004) Effect of
low molecular size humic substances on nitrate uptake and expression of genes
involved in nitrate transport in maize (Zea mays L.). Journal of Experimental Botany
55: 803-813.
Quan TK, Hartzog GA (2010) Histone H3K4 and K36 methylation, Chd1 and Rpd3S oppose
the functions of Saccharomyces cerevisiae Spt4-Spt5 in transcription. Genetics 184:
321-U329. doi: 10.1534/genetics.109.111526.
Reiter W-D (2002) Biosynthesis and properties of the plant cell wall. Curr Opin Plant Biol 5:
536-542. doi: 10.1016/s1369-5266(02)00306-0.
Ross PL, Huang YLN, Marchese JN, Williamson B, Parker K, Hattan S, Khainovski N, Pillai
S, Dey S, Daniels S, Purkayastha S, Juhasz P, Martin S, Bartlet-Jones M, He F,
Jacobson A, Pappin DJ (2004) Multiplexed protein quantitation in Saccharomyces
cerevisiae using amine-reactive isobaric tagging reagents. Molecular & Cellular
Proteomics 3: 1154-1169. doi: 10.1074/mcp.M400129-MCP200.
Sachs AB, Varani G (2000) Eukaryotic translation initiation: there are (at least) two sides to
every story. Nat Struct Biol 7: 356-361. doi: 10.1038/75120.
Sadanandom A, Bailey M, Ewan R, Lee J, Nelis S (2012) The ubiquitin-proteasome system:
Central modifier of plant signalling. New Phytol 196: 13-28. doi: 10.1111/j.1469-
8137.2012.04266.x.

73
Sampedro J, Pardo B, Gianzo C, Guitian E, Revilla G, Zarra I (2010) Lack of alpha-
xylosidase activity in Arabidopsis alters xyloglucan composition and results in growth
defects. Plant Physiol 154: 1105-1115. doi: 10.1104/pp.110.163212.
Scharte J, Schon H, Tjaden Z, Weis E, von Schaewen A (2009) Isoenzyme replacement of
glucose-6-phosphate dehydrogenase in the cytosol improves stress tolerance in plants.
Proceedings of the National Academy of Sciences of the United States of America
106: 6. doi: 10.1073/pnas.0812902106.
Schiavon M, Pizzeghello D, Muscolo A, Vaccaro S, Francioso O, Nardi S (2010) High
molecular size humic substances enhance phenylpropanoid metabolism in maize (Zea
mays L.). Journal of Chemical Ecology 36: 662-669.
Schmidt MWI, Torn MS, Abiven S, Dittmar T, Guggenberger G, Janssens IA, Kleber M,
Kogel-Knabner I, Lehmann J, Manning DAC, Nannipieri P, Rasse DP, Weiner S,
Trumbore SE (2011) Persistence of soil organic matter as an ecosystem property.
Nature 478: 49-56. doi: 10.1038/nature10386.
Schneider R, Grosschedl R (2007) Dynamics and interplay of nuclear architecture, genome
organization, and gene expression. Genes & Development 21: 3027-3043. doi:
10.1101/gad.1604607.
Schnitzer M, Monreal CM (2011) Quo vadis soil organic matter research? A biological link
to the chemistry of humification. In: DL Sparks (ed) Advances in Agronomy, Vol
113.
Schurmann P, Buchanan BB (2008) The ferredoxin/thioredoxin system of oxygenic
photosynthesis. Antioxid Redox Signal 10: 1235-1273. doi: 10.1089/ars.2007.1931.
Shannon P, Markiel A, Ozier O, Baliga NS, Wang JT, Ramage D, Amin N, Schwikowski B,
Ideker T (2003) Cytoscape: a software environment for integrated models of
biomolecular interaction networks. Genome research 13: 2498-2504. doi:
10.1101/gr.1239303.
Shi J, Yi K, Liu Y, Xie L, Zhou Z, Chen Y, Hu Z, Zheng T, Liu R, Chen Y, Chen J (2015)
Phosphoenolpyruvate carboxylase in Arabidopsis leaves plays a crucial role in carbon
and nitrogen metabolism. Plant Physiol 167: 671-681. doi: 10.1104/pp.114.254474.
Smalle J, Vierstra RD (2004) The ubiquitin 26S proteasome proteolytic pathway. Annual
Review of Plant Biology.
Su P-H, Li H-m (2008a) Arabidopsis stromal 70-kD heat shock proteins are essential for
plant development and important for thermotolerance of germinating seeds. Plant
Physiol 146: 1231-1241. doi: 10.1104/pp.107.114496.

74
Su PH, Li HM (2008b) Arabidopsis stromal 70-kD heat shock proteins are essential for plant
development and important for thermotolerance of germinating seeds. Plant Physiol
146: 1231-1241. doi: 10.1104/pp.107.114496.
Sullivan JA, Shirasu K, Deng XW (2003) The diverse roles of ubiquitin and the 26S
proteasome in the life of plants. Nat Rev Gen 4: 948-958. doi: 10.1038/nrg1228.
Sutton R, Sposito G (2005) Molecular structure in soil humic substances: The new view.
Environmental Science & Technology 39: 9009-9015. doi: 10.1021/es050778q.
Tewari A, Singh R, Singh NK, Rai UN (2008) Amelioration of municipal sludge by Pistia
stratiotes L.: role of antioxidant enzymes in detoxification of metals. Bioresource
technology 99: 8715-8721. doi: 10.1016/j.biortech.2008.04.018.
Tolin S, Arrigoni G, Trentin AR, Veljovic-Jovanovic S, Pivato M, Zechman B, Masi A
(2013) Biochemical and quantitative proteomics investigations in Arabidopsis ggt1
mutant leaves reveal a role for the gamma-glutamyl cycle in plant's adaptation to
environment. Proteomics 13: 2031-2045. doi: 10.1002/pmic.201200479.
Trevisan S, Botton A, Vaccaro S, Vezzaro A, Quaggiotti S, Nardi S (2011) Humic substances
affect Arabidopsis physiology by altering the expression of genes involved in primary
metabolism, growth and development. Environmental and Experimental Botany 74:
45-55. doi: 10.1016/j.envexpbot.2011.04.017.
Trevisan S, Pizzeghello D, Ruperti B, Francioso O, Sassi A, Palme K, Quaggiotti S, Nardi S
(2010) Humic substances induce lateral root formation and expression of the early
auxin-responsive IAA19 gene and DR5 synthetic element in Arabidopsis. Plant Biol
12: 604-614. doi: 10.1111/j.1438-8677.2009.00248.x.
Vaccaro S, Muscolo A, Pizzeghello D, Spaccini R, Piccolo A, Nardi S (2009) Effect of a
compost and its water-soluble fractions on key enzymes of nitrogen metabolism in
maize seedlings. J Agric Food Chem 57: 11267-11276. doi: 10.1021/jf901808s.
Varanini Z, Pinton R (2001) Direct versus indirect effetcs of soil humic substances on plant
growth and nutrition. In: R Pinton, Z Varanini, P Nannipieri (eds) The Rizosphere.
Marcel Dekker, Basel, Switzerland.
Vaughan D, Malcom RE (1985) Influence of humic substances on growth and physiological
processes. In: D Vaughan, RE Malcom (eds) Soil Organic Matter and Biological
Activity. Martinus Nijhoff/ Junk W, Dordrecht.
Wen F, Wu X, Li T, Jia M, Liu X, Li P, Zhou X, Ji X, Yue X (2017) Genome-wide survey of
heat shock factors and heat shock protein 70s and their regulatory network under

75
abiotic stresses in Brachypodium distachyon. PLoS One 12: e0180352. doi:
10.1371/journal.pone.0180352.
Xia ST, Cheng YT, Huang S, Win J, Soards A, Jinn TL, Jones JDG, Kamoun S, Chen S,
Zhang YL, Li X (2013) Regulation of transcription of nucleotide-binding leucine-rich
repeat-encoding genes SNC1 and RPP4 via H3K4 trimethylation. Plant Physiol 162:
1694-1705. doi: 10.1104/pp.113.214551.
Yang P, Fu H, Walker J, Papa CM, Smalle J, Ju YM, Vierstra RD (2004) Purification of the
Arabidopsis 26 S proteasome: biochemical and molecular analyses revealed the
presence of multiple isoforms. The Journal of biological chemistry 279: 6401-6413.
doi: 10.1074/jbc.M311977200.
Yao XZ, Feng HY, Yu Y, Dong AW, Shen WH (2013) SDG2-mediated H3K4 methylation is
required for proper Arabidopsis root growth and development. PLoS One 8. doi:
10.1371/journal.pone.0056537.
Zancani M, Petrussa E, Krajňáková J, Casolo V, Spaccini R, Piccolo A, Macrì F, Vianello A
(2009) Effect of humic acids on phosphate level and energetic metabolism of tobacco
BY-2 suspension cell cultures. Environmental and Experimental Botany 65: 287-295.
doi: 10.1016/j.envexpbot.2008.09.012.
Zandonadi D, Canellas L, Façanha A (2007) Indolacetic and humic acids induce lateral root
development through a concerted plasmalemma and tonoplast H+ pumps activation.
Planta 225: 1583-1595.
Zandonadi DB, Santos MP, Busato JG, Peres LEP, Facanha AR (2013) Plant physiology as
affected by humified organic matter. Theor Exp Plant Physiol 25: 12-25.
Zandonadi DB, Santos MP, Dobbss LB, Olivares FL, Canellas LP, Binzel ML, Okorokova-
Facanha AL, Facanha AR (2010) Nitric oxide mediates humic acids-induced root
development and plasma membrane H+-ATPase activation. Planta 231: 1025-1036.
doi: 10.1007/s00425-010-1106-0.

76
Supplementary material
Fig. S1 Interactome of 903 detected proteins in Arabidopsis roots treated with HS. The network was built with
ISS website, using first neighbors expansion, deletion of nodes with degree 0 and 1. Nodes marked in green
were associated with significantly up-regulated proteins, red nodes denoted down-regulated proteins and grey
nodes were proteins with no significant change. Labels report protein UniProt ID. Not labelled proteins are first
neighbors (see Carazolle et al., 2014).

77
Fig. S2 Interactome of differentially expressed proteins detected in Arabidopsis roots treated with HS. The
interactome created from IIS website included only proteins with interactions between themselves and first
neighbors (Carazolle et al., 2014; Bernardo et al., 2017). Nodes marked in green were associated with
significantly up-regulated proteins, red nodes denoted down-regulated proteins and grey nodes were proteins
with no significant change. Labels report protein UniProt ID.

78
Fig. S3 Regulatory changes on the pathways of Citrate cycle (TCA cycle), with highlighted up-regulated
proteins (green), down-regulated proteins (red) and proteins without fold-change (pink). Labels report EC
numbers.

79
Fig. S4 Regulatory changes on the pathways of glyoxylate and dicarboxylate metabolism, with highlighted up-
regulated proteins (green) and proteins without fold-change (pink). Labels report EC numbers.

80
Fig. S5 Regulatory changes on the proteasome, with highlighted up-regulated proteins (green), down-regulated
proteins (red) and proteins without fold-change (pink). Labels report EC numbers.

81
Table S1. Up-regulated proteins with decreasing fold change. Abbreviations. P., plasma membrane, C., cytoplasm; PO., peroxisome; CH.,
chloroplast; M., mitochondria; V., vacuole; CW., cell wall; CS., cytoskeleton; MM., Membrane; EC., extra cellular; G., Golgi apparatus; V.,
Vacuole; EM., Endo membrane; ER., endoplasmic reticulum; CHR., Chromosome
UniProt ID Locus
name
description Fold
Change
Coverage
%
Unique
Peptides
Localization
P93028 AT2G30110 Ubiquitin-activating enzyme E1 1 3.14 1.8 2 P
P34795 AT5G42740 Glucose-6-phosphate isomerase 2.86 3.6 2 C
Q84W89 AT2G42520 DEAD-box ATP-dependent RNA helicase 2.60 7.3 2 PO
Q9SZ30 AT4G26900 Imidazole glycerol phosphate synthase 2.57 3.7 2 CH,
P61837 AT3G61430 Aquaporin PIP1-1 2.57 20 4 M, V, P, CH,
Q9ZVA5 AT1G78860 F9K20.9 protein 2.53 26 2 CW,
Q9C658-2 AT1G26110 Isoform 2 of Protein decapping 5 2.52 5.3 3 C
Q8LF21 AT1G14830 Dynamin-related protein 1C 2.52 3.3 2 C, P, MM,
Q9S7Y7 AT1G68560 Alpha-xylosidase 1 2.44 3.4 4 EC, CW, CH,
Q683F9 AT4G36195 Prolyl carboxypeptidase like protein 2.44 6.3 3 CW, V, P,
Q9LRX8 AT3G24830 60S ribosomal protein L13a-2 2.42 12.6 3 C, R,
Q8L7N0 AT5G16070 At5g16070 2.38 3.4 2 C
Q9XI10 AT1G21680 DPP6 N-terminal domain-like protein 2.30 3.3 3 CW, V, P,
Q56ZI2 AT1G22530 Patellin-2 2.27 26.5 12 P, CH,
Q84WU7 AT3G51330 Aspartyl protease family protein 2.26 5 3 P
Q93W22 AT1G66580 60S ribosomal protein L10-3 2.16 26 1 V, C, R, P,
Q9ZPI1 AT3G11710 Lysine--tRNA ligase 2.08 6.5 4
Q9C8Y9 AT1G66280 Beta-glucosidase 22 2.08 43.7 17 ER, CH,
P29976 AT4G39980 Phospho-2-dehydro-3-deoxyheptonate aldolase
1
2.07 6.5 1 CH
F4J9K9 AT3G05900 Neurofilament protein-related protein 2.04 34.8 18 C
Q9C522 AT3G06650 ATP-citrate synthase beta chain protein 1 2.04 3.3 2 C, MM
P51418 AT2G34480 60S ribosomal protein L18a-2 2.03 22.5 6 C, R, P,
F4HV16 AT1G47600 Myrosinase 4 2.03 6.5 3 EM
Q8RX87 AT5G20250 Probable galactinol--sucrose galactosyltransferase 6
2.02 4.1 3 CH
Q9SU40 AT4G12420 Monocopper oxidase-like protein SKU5 2.02 5.1 2 EC, CW, P
Q9M8T0 AT3G02880 Probable inactive receptor kinase At3g02880 2.01 14.2 8 CW, P,
Q9FJ62 AT5G55480 Probable glycerophosphoryl diester
phosphodiesterase 1
1.99 10.4 7 P
Q94C86 AT3G16850 Glycoside hydrolase family 28 protein / polygalacturonase (Pectinase) family protein
1.98 5.5 2 CW, V
Q9SZ51 AT4G31840 Early nodulin-like protein 15 1.97 22 5 P
O80763 AT1G60420 Probable nucleoredoxin 1 1.97 3.6 2 C
O80988 AT2G26080 Glycine dehydrogenase [decarboxylating] 1.97 2 2 M, CH,
Q9FE65 AT1G69620 60S ribosomal protein L34-2 1.96 17.7 2 C, R, P,
O82762 AT2G25970 F17H15.1/F17H15.1 1.96 18 9 C
Q9SF53 AT3G09500 60S ribosomal protein L35-1 1.95 30 5 Nu, C, R,
Q9LM92 AT1G20580 At1g20580/F2D10_6 1.95 14 2 Nu
Q9LKR3 AT5G28540 Mediator of RNA polymerase II transcription
subunit 37a
1.94 45 4 CW, V, P, ER,
CH, Q9STW6 AT4G24280 Heat shock 70 kDa protein 6, chloroplastic 1.90 23 4 M, CH
Q56WK6 AT1G72150 Patellin-1 1.89 24.3 12 EC, V, P, CH,
Q9S791 AT1G70770 AT1G70770 protein 1.87 7.7 4 ER, P

82
Q7PC86 AT1G15210 ABC transporter G family member 35 1.86 1 2 P, CH,
Q9SR37 AT3G09260 Beta-glucosidase 23 1.83 17 13 V
Q94BT2 AT3G07390 Auxin-induced in root cultures protein 12 1.80 10 3 EC, P
Q9FN52 AT5G23020 Methylthioalkylmalate synthase 3, chloroplastic 1.79 4.4 2 CH
P43287 AT2G37170 Aquaporin PIP2-2 1.79 14.4 3 P, CH,
Q9LXC9 AT5G09650 Soluble inorganic pyrophosphatase 1,
chloroplastic
1.79 9.7 4 CH
Q8LA13 AT3G58510 DEAD-box ATP-dependent RNA helicase 11 1.78 9 3 Nu, PO, P,
Q9SR13 AT3G04610 AT3g04610/F7O18_9 1.78 10.8 5 C, N
Q9M9K1 AT3G08590 Probable 2,3-bisphosphoglycerate-independent
phosphoglycerate mutase 2
1.77 12.3 4 EC, C
P51422 AT3G55750 60S ribosomal protein L35a-4 1.77 22.5 3 C, R,
F4K0F7 AT5G60640 Protein disulfide-isomerase A1 1.77 29.1 13 M, ER, P, CH
O22126 AT2G45470 Fasciclin-like arabinogalactan protein 8 1.76 23.3 9 EC, CW, P, A
Q8VZH2 AT4G33090 AT4g33090/F4I10_20 1.76 2.3 2 P
Q940M2 AT4G39660 Alanine--glyoxylate aminotransferase 2
homolog 1, mitochondrial
1.75 5.0 2 M, P
Q8S9L6 AT4G21410 Cysteine-rich receptor-like protein kinase 29 1.74 4 2 V, P, CH,
Q9C525-2 AT1G66270 Isoform 2 of Beta-glucosidase 21 1.73 37.9 10 V
P16181 AT3G48930 40S ribosomal protein S11-1 1.72 33.7 5 CW, C, R,
B9DG18 AT1G20620 AT1G20620 protein 1.71 10.3 1 EC, CW, M, V,
PO, R, P, CH
O04310 AT3G16460 Jacalin-like lectin domain-containing protein 1.68 28 16 C
A8MS66 AT2G29960 Peptidyl-prolyl cis-trans isomerase 1.68 11.5 2 C, ER, MM
Q38882 AT3G15730 Phospholipase D alpha 1 1.67 3.6 3 M, V, P, CH,
F4J110 AT3G63460 Protein transport protein SEC31 1.65 4 4 C, G, MM
Q9SG80 AT3G10740 Alpha-L-arabinofuranosidase 1 1.65 4.6 2 EC, CW,V,
Q8VX13 AT3G54960 Protein disulfide isomerase-like 1-3 1.64 6.9 3 ER, P, CH
B9DHK3 AT5G14540 AT5G14540 protein 1.64 7.7 3 C, N
Q9SZ11 AT4G26690 Probable glycerophosphoryl diester phosphodiesterase 2
1.63 9.7 6 CW, P,
Q96321 AT3G06720 Importin subunit alpha-1 1.63 14.8 8 CW, Nu, C, EM,
F4JBY2 AT3G60750 Transketolase 1.62 10.8 6 CH
Q9LTX9 AT5G49910 Heat shock 70 kDa protein 7, 1.62 22.7 6 EC, CH,
Q43291 AT1G09590 60S ribosomal protein L21-1 1.62 21.9 6 Nu, C, R, CH,
O23006 AT2G17120 LysM domain-containing GPI-anchored protein
2
1.62 19.4 8 P
Q42262 AT4G34670 40S ribosomal protein S3a-2 1.60 20.6 2 CW, Nu, C, R,
P, F4I8B9 AT1G65010 Putative WEB family protein At1g65010 1.59 3.7 1 CH
Q9SRH6 AT3G01290 Hypersensitive-induced response protein 3 1.59 21 6 M, V, P
Q9LFE4 AT5G16730 WEB family protein At5g16730 1.59 6.7 4 CH
P46286 AT2G18020 60S ribosomal protein L8-1 1.59 34.1 8 Nu, V, C, R, P,
CH,
O23628 AT3G54560 Histone H2A variant 1 1.59 22 2 CHR,
Q8GYH9 AT3G46280 Protein kinase-like protein 1.58 4 2 ER
Q39043 AT5G42020 Mediator of RNA polymerase II transcription
subunit 37f
1.58 49.6 7 CW, Nu, V, ER,
P, O04318 AT3G16390 Nitrile-specifier protein 3 1.58 6.2 2 CH
Q9ZWA8 AT1G03870 Fasciclin-like arabinogalactan protein 9 1.58 15 4 P
Q9S7C0-2 AT1G79930 Isoform 2 of Heat shock 70 kDa protein 14 1.58 11.3 9 P

83
Q9MAH0 AT1G53310 Phosphoenolpyruvate carboxylase 1 1.57 17.3 13 EC, C
Q9FGK5 AT5G47520 Ras-related protein RABA5a 1.57 10.9 2 P
O82663 AT5G66760 Succinate dehydrogenase [ubiquinone] flavoprotein subunit 1
1.56 7.9 4 CW, M,
F4JWM1 AT5G18380 40S ribosomal protein S16-3 1.56 41.7 6 C, R, CH,
Q42560 AT4G35830 Aconitate hydratase 1 1.54 19.9 9 EC
P92994 AT2G30490 Trans-cinnamate 4-monooxygenase 1.53 11 6 CW, ER, P,
Q9ZQX4 AT4G02620 V-type proton ATPase subunit F 1.53 13.3 2 V, P
O82772 AT3G03640 Probable inactive beta-glucosidase 25 1.53 5.6 3 ER
Q9SZV4 AT4G30010 AT4g30010/F6G3_40 1.52 20 2 M, PL
Q9FN93 AT5G59680 Probable LRR receptor-like serine/threonine-
protein kinase At5g59680
1.52 7.5 6 ER
Q9SK27 AT2G25060 Early nodulin-like protein 1 1.52 16.5 3 P
Q9FVT2 AT1G57720 Probable elongation factor 1-gamma 2 1.51 14.3 7 CW, V,
Q9SMT7 AT3G48990 4-coumarate--CoA ligase-like 10 1.51 21 12 EC, CH
Q7Y175 AT4G15410 UBA and UBX domain-containing protein At4g15410
1.51 10.9 4 N
F4IB69 AT1G51850 Leucine-rich repeat protein kinase family
protein
1.51 3.8 4 P
O82089 AT3G56240 Copper transport protein CCH 1.50 14.8 5 CH
Q9FXA2 AT1G49760 Polyadenylate-binding protein 8 1.50 21.9 11 C, N
P43286 AT3G53420 Aquaporin PIP2-1 1.50 13.9 4 V, P, CH,
F4JEJ0 AT3G13790 Beta-fructofuranosidase, insoluble isoenzyme
CWINV1
1.49 3.6 2 EC, CW,
Q05758 AT3G58610 Ketol-acid reductoisomerase 1.49 7.9 5 EC, CW, M,
CH,
Q56XG6 AT5G11170 DEAD-box ATP-dependent RNA helicase 15 1.49 9.6 4 CW, Nu, EC,
O50008 AT5G17920 5-methyltetrahydropteroyltriglutamate--
homocysteine methyltransferase
1.48 45.6 20 EC, PO, C, P,
Q9C500 AT1G47200 WPP domain-containing protein 2 1.48 11.7 2 NM, G, P,
Q56ZQ3 AT2G14720 Vacuolar-sorting receptor 4 1.48 17 10 V, G,, P
Q9FLT0 AT5G61780 100 kDa coactivator-like protein 1.48 17 6 C, ER
Q9LV70 AT5G48430 Aspartyl protease family protein 1.47 5.4 2 ER
Q9ASV5 AT4G39690 AT4g39690/T19P19_80 1.47 3.7 2 M
C0LGL4 AT2G28960 Probable LRR receptor-like serine/threonine-protein kinase At2g28960
1.46 2.4 2 ER
Q9ASR1 AT1G56070 At1g56070/T6H22_13 1.46 29 23 Nu, C, P, CH,
Q680P8 AT4G33865 40S ribosomal protein S29 1.46 48 3 C, R,
F4KHD5 AT5G40450 Uncharacterized protein 1.46 12.2 30 P, CH
O22173 AT2G23350 Polyadenylate-binding protein 4 1.45 14 7 C, N
P19456 AT4G30190 ATPase 2, plasma membrane-type 1.45 9.8 8 P
B3H533 AT1G45000 AAA-type ATPase family protein 1.45 6.9 2 CW, Nu, P,
Q93W34 AT4G27000 Polyadenylate-binding protein RBP45C 1.44 16.9 6 C, N
Q9S7L9 AT1G22450 Cytochrome c oxidase subunit 6b-1 1.43 45 8 M, CH,
Q9LXG1 AT5G15200 40S ribosomal protein S9-1 1.43 49.5 13 CW, Nu, C, R,
P,
O49299 AT1G23190 Probable phosphoglucomutase 1.43 22.9 12 C, P, CH,
Q9LXB8 AT5G09530 Hydroxyproline-rich glycoprotein family protein
1.43 26.8 4 ER
C0Z361 AT5G56500 Chaperonin 60 subunit beta 3 1.43 17 3 M, CH,
Q9ZVA4 AT1G78850 D-mannose binding lectin protein with Apple-
like carbohydrate-binding domain
1.43 41.5 10 EC, CW, P

84
F4K5C7 AT5G07090 40S ribosomal protein S4-2 1.42 66 17 C, R, P,
P42731 AT4G34110 Polyadenylate-binding protein 2 1.42 26.4 13 C
Q9FJI5 AT5G40760 Glucose-6-phosphate 1-dehydrogenase, cytoplasmic isoform 2
1.41 20.4 12 C
Q9SGE0 AT1G08200 Similar to dihydroflavonol reductase 1.41 5.1 2 EC, C, N
Q94CE5 AT3G22200 Gamma-aminobutyrate transaminase POP2,
mitochondrial
1.41 4.8 2 M, P
Q9SRG3 AT1G77510 Protein disulfide isomerase-like 1-2 1.40 32 8 ER, P, CH,
P0DH99 AT1G07940 Elongation factor 1-alpha 1 1.40 36 17 Nu, M, V, P, CH,
F4I035 AT1G48860 3-phosphoshikimate 1-carboxyvinyltransferase 1.40 3.9 2 CH
F4IVR2 AT2G33210 Chaperonin CPN60-like 1 1.40 22 3 M, P, CH,
Q9SIP7 AT2G31610 40S ribosomal protein S3-1 1.40 41.2 3 V, C, R, P, CH,
F4KBN2 AT5G44720 Molybdenum cofactor sulfurase family protein 1.39 11 2 Mi
O48723 AT2G26560 Phospholipase A 2A 1.39 9.3 3 CH, C, MM
Q1H583 AT1G54000 GDSL esterase/lipase At1g54000 1.39 50 15 V, EC, CW, V,
P,
Q84VW9 AT3G14940 Phosphoenolpyruvate carboxylase 3 1.39 4.8 1 C
O23654 AT1G78900 V-type proton ATPase catalytic subunit A 1.38 39.6 21 V, CW, V, P, CH,
Q9SQR1 AT3G04010 At3g04010 1.37 3 2 P
Q9M9P3 AT3G03250 Probable UTP--glucose-1-phosphate
uridylyltransferase 2
1.37 15.8 6 P
F4KHS2 AT5G59090 Subtilase 4.12 1.37 21.8 14 EC
Q9LF30 AT5G15520 40S ribosomal protein S19-2 1.36 25.9 1 Nu, C, R,
B9DG17 AT1G72370 40S ribosomal protein SA 1.36 39.5 9 C, R, P, CH,
Q9SP02 AT5G58710 Peptidyl-prolyl cis-trans isomerase CYP20-1 1.36 19.1 2 EC, ER, CH,
Q9FM96 AT5G56360 Glucosidase II beta subunit protein PSL4 1.36 11.3 7 EM
Q9FKV0 AT5G44380 Berberine bridge enzyme-like protein 1.36 5.7 3 CW
P22953 AT5G02500 Probable mediator of RNA polymerase II
transcription subunit 37e
1.35 45.8 12 EC, CW, Nu, C,
R, P, CH, Q8VZ19 AT1G77940 60S ribosomal protein L30-2 1.35 41 4 C, R,
P17094 AT1G43170 60S ribosomal protein L3-1 1.35 55 25 CW, NU, V, C, R, P,
P11574 AT1G76030 V-type proton ATPase subunit B1 1.35 33.7 7 V, P, CH,
Q8L7E3 AT4G20110 Vacuolar-sorting receptor 7 1.34 23 14 G, P
F4ISU2 AT2G32240 Uncharacterized protein 1.34 45.8 61 P, C
Q29Q26 AT2G17390 Ankyrin repeat-containing 2B 1.34 16.6 5 P
P83483 AT5G08670 ATP synthase subunit beta-1 1.33 56.1 28 CH, P, M
Q8VZT4 AT1G29370 Kinase-related protein 1.33 6.4 5 N
P59223 AT3G60770 40S ribosomal protein S13-1 1.33 41 7 CW, Nu C, R, CH
A8MS28 AT4G15000 60S ribosomal protein L27-3 1.33 30.5 4 C, R,
P53492 AT5G09810 Actin-7 1.33 40 5 CW, Nu, M, CS,
P, Q9M5K5 AT3G16950 Dihydrolipoyl dehydrogenase 1.33 24.6 12 Nu, CH,
Q96291 AT3G11630 2-Cys peroxiredoxin BAS1 1.32 7.9 2 EC, CH
Q9LFW1 AT5G15650 UDP-arabinopyranose mutase 2 1.32 37.5 3 CW, G, R, P,
F4K1Y4 AT5G60980 Nuclear transport factor 2 and RNA recognition
motif domain-containing protein
1.32 20.2 9 Intra cellular
Q9LTF2 AT5G52650 40S ribosomal protein S10-3 1.32 37.4 6 CW, C,R
Q9LMK7 AT1G07140 Ran-binding protein 1 homolog a 1.32 37.7 8 NM, M
Q42290 AT3G02090 Probable mitochondrial-processing peptidase
subunit beta
1.32 43.9 20 CW, Nu, M

85
Q96292 AT3G18780 Actin-2 1.32 37.1 4 CS
Q9LX13 AT5G10160 (3R)-hydroxymyristoyl-[acyl carrier protein]
dehydratase-like protein
1.31 13.7 3 CW, CH,
Q9SJ44-3 AT2G36060 Isoform 3 of Ubiquitin-conjugating enzyme E2 variant 1C
1.31 27 1 C,N
Q9FKK7 AT5G57655 Xylose isomerase 1.31 11.3 2 V, ER, P
O65719 AT3G09440 Heat shock 70 kDa protein 3 1.31 42.2 10 EC, CW, V, C,
R, P, CH, Q9SE60 AT3G59970 Methylenetetrahydrofolate reductase 1 1.31 12.5 4 C
Q8RXU5 AT3G60245 60S ribosomal protein L37a-2 1.31 9.8 2 C, R,
Q9SVG4-2 AT4G20830 Isoform 2 of Reticuline oxidase-like protein 1.31 13.7 8 EC, CW, M, V,
P Q9SMU8 AT3G49120 Peroxidase 34 1.31 29.8 6 EC, CW, V, P,
Q84WV1 AT5G26360 Putative chaperonin gamma chain 1.30 10.8 6 C
Q94C59 AT1G30690 Patellin- 1.3 7.2 3 C, P,
O80517 AT2G44790 Uclacyanin-2 1.30 30.2 5 P
A8MR02 AT5G26280 TRAF-like family protein 1.30 33.3 9 CH, MM
Q9SIB9 AT2G05710 Aconitate hydratase 2 1.30 17.7 9 CW, M, P, CH
P20115-2 AT2G44350 Isoform 2 of Citrate synthase 4 1.30 15 6 CW, M, CH,
Q9LST0 AT5G60160 AT5g60160/f15l12_20 1.30 6 3 V, P
Q94A28 AT4G26970 Aconitate hydratase 3 1.30 17.9 14 M, CH
Q9FGT8 AT5G58070 Outer membrane lipoprotein-like 1.30 7.5 2 M, V, ER, P

86
Table S2. Down-regulated proteins with decreasing fold change. Abbreviations. P., plasma membrane, C., cytoplasm; PO., peroxisome;
CH., chloroplast; M., mitochondria; V., vacuole; CW., cell wall; CS., cytoskeleton; MM., Membrane; EC., extra cellular; G., Golgi
apparatus; V., Vacuole; EM., Endo membrane; ER., endoplasmic reticulum; CHR., Chromosome
UniProt ID Locus name Description Fold
Change
Coverage
%
Unique
Peptides Localization
O04922 AT2G31570 Probable glutathione peroxidase 2 0.76 51.5 10 C
O23237 AT4G36430 Peroxidase 49 0.76 7.9 2 EC, CW,
Q9SMW7 AT1G17880 BTF3b-like factor 0.76 26.7 5 N
O49499 AT4G34050 Caffeoyl-CoA O-methyltransferase 1 0.76 28.6 8 C
Q9FNQ2 AT5G61130 Glucan endo-1,3-beta-glucosidase-like protein 2 0.76 11.4 2 CW, P
O22711 AT1G60740 Peroxiredoxin-2D 0.76 6.2 2 P
Q9C787 AT1G69510 Putative uncharacterized protein 0.76 11.7 2 N
Q9LZW6 AT5G01800 AT5g01800/T20L15_70 0.75 11.1 3 EM
P47999 AT2G43750 Cysteine synthase] 0.75 11.8 2 EC, M, CH,
O04331 AT5G40770 Prohibitin-3, mitochondrial 0.75 27.4 7 Nu, M, V, P,
Q9SHC8 AT2G45140 Vesicle-associated protein 1-2 0.75 20.1 5 ER, C, P
A2RVJ8 AT5G10010 At5g10010 0.75 4.9 2 Nu
O23715 AT2G27020 Proteasome subunit alpha type-3 0.75 8.4 2 EC, V, P,
Q940G5 AT4G25900 Aldose 1-epimerase family protein 0.75 10.1 4 CW, P, CW,
EC
F4IWI5 AT3G27430 Proteasome subunit beta type 0.74 6.4 2 V
Q9LK88 AT3G27890 NADPH:quinone oxidoreductase 0.74 27.1 5 M, PO, P, CH,
Q9SIP1 AT2G31670 At2g31670 0.74 23.2 6 PO, CH,
O80840 AT2G45790 Phosphomannomutase 0.74 7.7 2 C
A8MR12 AT5G23540 26S proteasome non-ATPase regulatory subunit 14 0.74 5.8 2 C
F4J7G9 AT3G11820 Syntaxin-121 0.74 25.1 6 P
P58684 AT2G39960 Probable signal peptidase complex subunit 2 0.74 25.5 5 ER
Q0WUY5 AT3G07660 Putative uncharacterized protein At3g07660 0.74 3.0 2 N
Q42342 AT5G53560 Cytochrome b5 isoform A 0.73 44.0 7 V, ER, P, CH,
P43333 AT1G09760 U2 small nuclear ribonucleoprotein A' 0.73 9.2 2 Nu, CH,
P17745 AT4G20360 Elongation factor Tu 0.73 8.9 3 EC, Nu, CH,
Q9SUR0 AT4G23670 AT4G23670 protein 0.73 49 8 V
Q9SLJ2 AT1G54410 At1g54410 0.73 23.5 3 CH
Q8LGE7 AT5G18800 NADH dehydrogenase [ubiquinone] 1 alpha
subcomplex subunit 8-B
0.73 14.2 2 CH, M
Q38867 AT3G56070 Peptidyl-prolyl cis-trans isomerase CYP19-3 0.73 14.5 2 C
Q9ZUG4 AT2G05830 Isoform 2 of Methylthioribose-1-phosphate isomerase
0.72 11.3 3 EM
O80837 AT2G45820 Remorin 0.72 52.1 11 P
Q9C505 AT1G69410 Eukaryotic translation initiation factor 5A-3 0.72 36.1 2 C
Q9FMN0 AT5G42890 Putative uncharacterized protein 0.72 28.5 4 PO
Q96253 AT1G51650 ATP synthase subunit epsilon, mitochondrial 0.72 47.1 4 M
Q94K48 AT3G62530 Armadillo/beta-catenin-like repeat-containing
protein
0.72 11.8 2 Nu, M, CH
Q93XZ7 AT5G42570 At5g42570 0.72 35.3 8 ER, P
Q9LKA3 AT3G15020 Malate dehydrogenase 2, mitochondrial 0.72 30.8 3 EC, M,
Q39243 AT4G35460 Thioredoxin reductase 1 0.72 16.5 1 M, C, CH,
Q9FWR4 AT1G19570 Isoform 2 of Glutathione S-transferase DHAR1,
mitochondrial
0.71 31.1 6 EC, M, V, PO,
P, CH,

87
Q9FPF0 AT3G14990 Isoform 2 of Protein DJ-1 homolog A 0.71 23.3 6 V, P,
O81149 AT1G53850 Proteasome subunit alpha type-5-A 0.71 30.4 7 R,P
Q9SUQ8 AT4G23690 Dirigent protein 6 0.71 15.5 2 EM
Q93W30 AT2G35605 Expressed protein 0.71 28.8 2 N
Q41931 AT1G62380 1-aminocyclopropane-1-carboxylate oxidase 2 0.71 27.8 6 CW
Q9LHH7 AT3G12290 5,10-methylenetetrahydrofolate
dehydrogenase/5,10-methenyltetrahydrofolate
cyclohydrolase
0.71 8.7 2
CH
Q9SRR8 AT3G07480 2Fe-2S ferredoxin-like protein 0.70 15.1 2 M, CH,
Q9ZRW8 AT1G78380 Glutathione S-transferase U19 0.70 39.8 11 P, CH,
Q9SRY5 AT1G02920 Glutathione S-transferase F7 0.69 55.5 6 V
Q9SDS7 AT1G12840 V-type proton ATPase subunit C 0.69 4.3 2 V, P, CH
Q9C835 AT3G66654 Cyclophilin-like peptidyl-prolyl cis-trans isomerase
family protein
0.69 8.5 2 G, P
Q9FE29 AT4G15610 CASP-like protein At4g15610 0.69 10.9 2 P
Q9FGF3 AT5G64430 At5g64430 0.68 8.6 3 CH
O82326 AT2G14880 Expressed protein 0.68 13.5 2 CH
P49200 AT5G62300 40S ribosomal protein S20-1 0.68 44.4 2 CW, C, R
O04311 AT3G16450 AT3G16450 protein 0.68 29 6 EC, N
Q8LBY9 AT5G05960 At5g05960 0.68 35.3 5 EM
F4HUG9 AT1G14210 Ribonuclease T2 family protein 0.68 13.8 3 EM
F4KGV2 AT5G10450 14-3-3-like protein GF14 lambda 0.68 25.6 2 CW, C, P, CH,
O80858 AT2G30930 Expressed protein 0.68 68.9 9 P, CH
Q9LIN3 AT3G26420 AT3g26420/F20C19_14 0.67 13.9 4 C, N
Q9SBA5 AT5G16760 Inositol-tetrakisphosphate 1-kinase 1 0.67 8.2 2 C
B3H4B6 AT4G39200 40S ribosomal protein S25-4 0.67 15.9 2 C, R,
Q96522 AT4G30170 Peroxidase 45 0.67 71.1 17 EC, EM
Q9LK64 AT3G13080 Isoform 2 of ABC transporter C family member 3 0.67 0.9 1 V, EC, V, P,
Q9SI54 AT2G03870 At2g03870 0.66 31.3 6 RNC
F4IZR4 AT3G03100 Putative NADH dehydrogenase [ubiquinone] 1
alpha subcomplex subunit 12
0.66 12.6 2 M
B9DFR9 AT2G45960 AT2G45960 protein 0.65 13.9 1 V, P, CH,
B3H778 AT4G24830 Argininosuccinate synthase 0.65 8.4 3 CH
Q8VYC5 AT1G18270 Ketose-bisphosphate aldolase class-II-like protein 0.65 2 2 M, N
Q9M2G1 AT3G58550 At3g58550 0.65 13 2 ANC M
P42760 AT1G02930 Glutathione S-transferase F6 0.64 52.9 6 CW, M, V,
Q9FJE8 AT5G59870 Probable histone H2A.7 0.63 15.3 2 CHR, Nu,
Q9LSP5 AT3G17020 AT3g17020/K14A17_14 0.63 11 2 P
Q9FZK4 AT1G27310 F17L21.10 0.63 16.4 2 NM
Q9M011 AT5G01650 Light-inducible protein ATLS1 0.62 22.6 2 CH
Q94A16 AT2G47320 Peptidyl-prolyl cis-trans isomerase CYP21-3 0.62 8.7 2 M
Q9ZPY5 AT2G46540 At2g46540/F11C10.23 0.62 23.1 2 M
O49453 AT4G28440 Uncharacterized protein At4g28440 0.61 18.3 2 C
Q43725 AT3G59760 Cysteine synthase, mitochondrial 0.61 17.4 4 M, CH
Q42338 AT3G48140 AT3G48140 protein 0.60 32.9 3 PO
Q9LU05 AT5G44610 At5g44610 0.60 5.9 2 P
P24704 AT1G08830 Superoxide dismutase [Cu-Zn] 1 0.60 31.6 5 C

88
Q9ZVF1 AT2G01540 Calcium-dependent lipid-binding domain-
containing protein
0.58 11.7 2 V, P,
Q9C6U3 AT3G08030 Putative uncharacterized protein T8G24.2
(Fragment)
0.58 8.7 2 CW
Q3E902 AT5G27700 40S ribosomal protein S21-2 0.57 24.4 3 C, R, P, CH,
Q9FMA8 AT5G38940 Germin-like protein subfamily 1 member 11 0.57 30.5 3 EC, CW
Q9SFF9 AT3G05950 Germin-like protein subfamily 1 member 7 0.57 24.9 4 EC, EM
Q9SF20 AT3G11780 F26K24.7 protein 0.57 21.6 3 V, P,
Q9FMA9 AT5G38930 Germin-like protein subfamily 1 member 10 0.57 10.7 1 EC, CW,
P31166 AT1G27450 Isoform 2 of Adenine phosphoribosyltransferase 1 0.57 21.9 3 CW, C, P, CH,
Q9FY99 AT5G13110 Glucose-6-phosphate 1-dehydrogenase 2 0.55 5 2 CH
O49006 AT3G14310 Pectinesterase/pectinesterase inhibitor 3 0.55 4.7 2 EC, CW, P,
Q8L8Y0 AT1G58380 40S ribosomal protein S2-1 0.54 46.5 3 C, R, P, CH,
O23629 AT3G45980 Histone H2B.6 0.52 29.3 1 CHR, Nu,
Q9ZVF2 AT2G01530 MLP-like protein 329 0.52 35.1 3 N
Q681K2 AT2G41475 Embryo-specific protein 3, (ATS3) 0.51 11.7 2 EM
P56757 ATCG00120 ATP synthase subunit alpha 0.46 3 1 CH, M
P40283 AT5G59910 Histone H2B.11 0.46 29.3 1 CHR, Nu,
Q9FIC6 AT5G39150 Germin-like protein subfamily 1 member 17 0.45 15.4 2 EC, EM
P43296 AT4G39090 Cysteine proteinase RD19a 0.44 14 4 V
O24633 AT4G14800 Proteasome subunit beta type-2-B 0.43 14 2 V
Q9LHQ5 AT3G20670 Probable histone H2A.2 0.43 26.5 2 CHR, Nu,
Q8LAJ9 AT1G22520 At1g22520 0.40 23.2 2 M
B3H5Q0 AT5G39190 Germin-like protein subfamily 1 member 20 0.36 13 2 EC
P0C1T5 AT5G09978 Elicitor peptide 7 0.35 22.3 2 M
Q9C681 AT1G51060 Probable histone H2A.1 0.35 26.5 2 CW, Nu,
Q56W16 AT1G52370 AT1G52370 protein 0.17 5.2 2 R
Q8GYZ3 AT1G19130 Putative uncharacterized protein
At1g19130/F14D16_18
0.17 10.4 2 C
Q9FX82 AT1G16690 Enhancer of polycomb-like transcription factor
protein
0 2.7 1 N
Q9S7A0 AT3G03910 Probable glutamate dehydrogenase 3 0 8.8 1 M

89
4 Manuscript II
Effects of humic substances and indole-3-acetic acid on Arabidopsis sugar
and amino acid metabolic profile
Giovanni Battista Conselvana, David Fuentes
b, Andrew Merchant
b, Cristina Peggion
c, Ornella
Franciosod, Paolo Carletti
a,*
a Dipartimento di Agronomia, Animali, Alimenti, Risorse Naturali e Ambiente (DAFNAE),
Università di Padova, Viale dell’Università 16, 35020 Legnaro (Padova), Italy
b School of Life and Environmental Sciences, The University of Sydney, 380 Werombi Road,
Camden, NSW 2570, Australia
c Department of Chemical Sciences, University of Padova, 35131 Padova, Italy
d Dipartimento di Scienze Agrarie, Università di Bologna, Viale Fanin 44, 40127 Bologna,
Italy
* corresponding author
under revision to Plant and Soil

90
Abstract
Background and aim Humic substances (HS) are known to influence plant physiological
processes, enhancing crop yield, plant growth and nutrient uptake. The present study sought
to gain a better understanding of the specific effects of HS application on the abundance of
metabolites in plant tissues, using mass spectrometry analyses.
Methods Arabidopsis thaliana plants, grown in hydroponic conditions, were treated for 8 h
with indole-3-acetic acid (IAA), HS from International Humic Substances Society (IHSS)
and HS from earthworm faeces (EF), respectively. Humic substances structural
characteristics were analyzed by 1H NMR an FT-IR spectroscopies. Root and leaf free amino
acids, sugar alcohols and carbohydrate contents, and leaf amino acids from protein hydrolysis
were identified and quantified by gas chromatography-mass spectrometry (GC/MS), and
liquid chromatography-mass spectrometry (LC/MS). Canonical discriminant analysis (CDA)
was used to evaluate the influence of the treatments on the studied parameters.
Results EF treatment had the highest influence on metabolite profiles compared to the
control, IAA and IHSS. CDA analysis highlighted a clear distinction between EF and IHSS
plant physiological responses, depending on the different chemical and structural properties
of the HS. IAA-treated plants showed not significant difference from the control.
Conclusions A better understanding of the specific effects of different HS, also related to
their chemical characteristics, might serve as a basis for the identification of marker
compounds for HS bioactivity.
Keywords
Humic substances, metabolomics, biostimulant, auxin-like activity, FT-IR, 1H NMR

91
Introduction
Humic substances (HS) are a mixture of heterogeneous organic compounds resulting from
the microbial decomposition and chemical degradation of plant and animal residue in the soil
(Carletti et al. 2008; Nardi et al. 2009). They are present in both terrestrial and aquatic
environments, being the most abundant component of organic matter on earth (Nardi et al.
2002; Salma et al. 2010). Thanks to their oxygenate functional groups (e.g. carboxylic and
phenolic hydroxyl), HS are one of the most reactive fractions of organic carbon (Nardi et al.
2017). HS have a supramolecular structure, resulting from the association of small molecules
by hydrogen bonds and dispersive hydrophobic interactions (van der Waals, -, and CH-
bondings) (Baigorri et al. 2007; Piccolo 2001). Polar groups constitute the external layer,
whereas plant macromolecules make up the hydrophobic interior domain. HS can be
extracted from different humified organic matter (e.g. from soil compost, vermicompost, or
mineral deposits such as leonardite or coal) (du Jardin 2012). Humic substances influence
soil fertility, by improving the structure, porosity and supply of nutrients (Bronick and Lal
2005; Nardi et al. 2009) as well as influencing plant physiological processes that enhance
crop yield, plant growth and nutrient uptake (Nardi et al. 2002). These properties allow HS to
be considered as a class of biostimulants (Calvo et al. 2014). Biostimulants are substances
that at low concentrations, increase plant nutrient uptake, nutrient efficiency, resistance to
biotic and abiotic stress, and crop quality (European Biostimulant Industry Council 2013).
Despite these properties, little is known regarding the mechanistic effects of HS. HS are
known to have a direct influence on lateral root induction, root hair production, and H+-
ATPase activity, thanks to their hormone-like activity (Pizzeghello et al. 2015), which could
partly be attributed to small bioactive molecules (e.g. auxin) present within the HS
supramolecular structure (Canellas and Olivares 2014; Canellas et al. 2002; Mora et al. 2014;
Olaetxea et al. 2015). Zandonadi et al. (2007) demonstrated that HS induce nitric oxide (NO)
production in sites of lateral root emergence. NO plays a role in different plant physiological
processes, including root and root hair formation and elongation (Lombardo and Lamattina
2012). Plant responses to HS in terms of H+-ATPase activity induce a decrease in cell wall
pH, triggering the activity of enzymes and proteins involved in cell-wall loosening and
extension growth (Hager 2003).

92
Moreover, the activation of H+-ATPase enzyme enhances the electrochemical proton gradient
that drives ion transport across cell membranes via secondary transport systems, improving
plant nutrient uptake (Baldotto et al. 2009; Morsomme and Boutry 2000).
HS are reported to induce changes in both primary and secondary metabolism. Nardi et al.
(2007) demonstrated that enzymes involved in glycolysis and tricarboxylic acid cycle (TCA)
were upregulated after maize plants were treated with 1 mg C L-1
(1 mg carbon L-1
) of HS
and also enhance also N uptake/assimilation and N metabolism. Decreasing pH at the root
surface, HS facilitate H+/NO3
- symport (Nardi et al. 2000) and stimulate nitrate uptake,
transport and the activity of enzymes involved in nitrogen metabolism (Quaggiotti et al.
2004; Vaccaro et al. 2015). Moreover, phenylpropanoid metabolism and enzymes linked to
cell protection have been found to be positively affected by treatment with HS (Garcia et al.
2016).
In the last decade, new molecular approaches (genomics, transcriptomics, and proteomics)
have been used to characterize the effects of HS on plant metabolism. Trevisan et al. (2011),
performed transcriptomic analysis and Gene Ontology classification and detected that HS
regulate a large number of genes involved in developmental and metabolic processes,
transcription regulation, and RNA metabolism. In Brassica napus, after three days of
treatment, HS significantly influenced the expression of more than 300 genes involved in the
major metabolic plant functions: respiration and photosynthesis, general cell metabolism,
fatty acids, nitrogen/sulphur, phytohormones, plant development, senescence, responses to
stress, and transport of ions and water (Jannin et al. 2012). Carletti et al. (2008) reported that
42 plasma membrane proteins related to energy, metabolism, and cellular transport were
differentially expressed after the treatment of maize roots with HS. In treated soybean
Bradyrhizobium liaoningense CCBAU05525, water-soluble humic materials influenced the
expression of proteins involved in nitrogen and carbon metabolism, nucleic acid metabolism,
signaling, energy production, and transmembrane transports (Gao et al. 2015). Metabolomic
studies or studies targeting the effects of HS on subsets of plant metabolism are still scarce.
Nevertheless, using these broad, quantitative profiling techniques, it is possible to better
understand the metabolic and biochemical status of an organism, and to monitor changes in a
biological system (Griffin and Shockcor 2004; Ren et al. 2015). In a rare example of
metabolomics techniques applied to studies on HS responses, Marino et al. (2013)
demonstrated through 1H HR-MAS NMR analyses, that pear and quince calli treated with
humic acids had a higher production of asparagine compared to the control.
Amino acids are organic compounds with an essential role in biological processes, being the

93
building blocks of peptides and proteins (Gu et al. 2015). Carbohydrates, produced during the
photosynthesis, are a source of energy for the plant growth and a source of carbon skeletons
for organic compounds (Trouvelot et al. 2014). They have also a pivotal function as signal
molecules necessary for the coordination of the plant metabolism with growth, development,
and responses to biotic and abiotic stresses (Rolland et al. 2006). In addition, both cyclic and
acyclic sugar alcohols are common in the soluble components of plant tissues. Sugar alcohols
are commonly involved in the response to tolerance to low temperatures, drought, or salt-
stress (Moing 2000). The combined detection and quantification of amino acids,
carbohydrates, and sugar alcohols are useful tools to study metabolic responses of organisms
to external or internal perturbations (Yanes et al. 2011).
The present study sought to gain a better understanding of the specific effects of HS
application on the abundance of metabolites in plant tissues through mass spectrometry
analyses. To address this aim and isolate HS specific effects from that of more general
growth modulating hormones, Arabidopsis thaliana plants were treated for eight hours with
indole-3-acetic acid (IAA), HS from International Humic Substances Society (IHSS), and HS
from earthworm faeces (EF). The tested humic substances were characterized by means of
FT-IR and 1H-NMR spectroscopies. Free amino acids, amino acids from proteins hydrolysis,
sugar alcohols, and carbohydrates profiles of each treatment were identified by gas
chromatography-mass spectrometry (GC/MS), and liquid chromatography-mass spectrometry
(LC/MS) techniques.

94
Materials and methods
Preparation of Humic Extract from earthworm faeces
The faeces of Nicodrilus [=Allolobophora (Eisen)=Aporrectodea (Oerley)] caliginosus
(Savigny) and Allolobophora rosea (Savigny) (Minelli et al. 1995) were collected from the
Ah horizon of an uncultivated couchgrass, Agropyron repens L., grown in soils classified as
Calcaric Cambisol (CMc-F.A.O. classification) (FAO-UNESCO 1997). Earthworm culture
conditions, HS extraction, and extract purification were conducted as reported in (Carletti et
al. 2008). HS extraction and purification was performed with 0.1 N KOH. The extract was
desalted by using 14 kDa cut-off dialysis Visking (Medicell, London, UK) tubing against
distilled water. Subsequently, the extract was desalted on ion exchange Amberlite IR-120 (H+
form), assessed for organic carbon content, and lyophilized before conducting the following
analyses. Elliott Soil Humic Acid Standard (code 1S102H) (Saint Paul, MN; USA) purchased
by the International Humic Substances Society (IHSS) was used in this work as a reference.
Chemical and structural properties (FT-IR, and 1H NMR)
Elemental analysis (C, H, N, O) was carried out using an elemental analyser (CHNS-O mod.
EA 1110) as per Conselvan et al. (2017). The oxygen has been evaluated by difference.
Elemental analysis for IHSS was taken from the IHSS website (http://humic-substances.org).
All analyses were performed in triplicate.
IR spectra were recorded with a Bruker ALFA FT-IR Spectrophotometer (Bruker, Ettlingen,
Germany) equipped with a single reflection diamond ATR sampling module. The spectra
were collected from 4000 to 400 cm-1
and averaged over 64 scans (resolution 4 cm-1
). The
spectral data were processed with Grams/386 spectroscopic software (Galactic Industries,
Salem, NH, USA).
1H NMR spectra were carried out with a Bruker Avance 600 MHz instrument at 298 K. The
samples (15 mg) were dissolved in 600 μL of DMSO-d6 and the spectra were acquired using
512 scans. DMSO-d6 is valid solvent for humic substances measurements because hydrogen
bonds are dissipated and their aggregation is avoided. The partially deuterated solvent
(DMSO) was used as the internal reference (chemical shift of the residual peak, 2.5 ppm).
Spectra were acquired using Bruker standard pulse sequences.
The CPMG (Carr-Purcell-Meiboom-Gill) pulse train is a fundamental component of pulse
sequences used for the measurement of dynamic processes by NMR spectroscopy. This pulse

95
sequence suppresses the effect of diffusion. This is very beneficial and can be used to
enhance S/N, and reduce experimental time.
Outcomes are derived from relative integrated areas of typical regions in the 1H-NMR
spectrum (Ferrari et al. 2011). Integrals were evaluated by AMIX-Viewer Bruker on the
following integration areas: amide group in peptides and aromatics (9.46–7.63 ppm);
−CH=CH−, aromatic amino acids, lignin (7.53–6.52 ppm); carbohydrates, β protons in
peptides, lignin, ethers (6.40–2.60 ppm); side chain protons in amino acids (2.34–2.04 ppm);
−CH2−, chains of lipids, waxes and cuticles (2.04–0.96 ppm); terminal CH3 groups (0.96–0
ppm). Each integrated area is the average value on three independent calculations, standard
error is <5%.
Plant growth and treatment conditions
Arabidopsis (A. thaliana) (ecotype Columbia) plants were grown hydroponically in a growth
chamber as described previously in Destro et al. (2011). After vernalisation for two days at 4
°C, Arabidopsis thaliana wild-type seeds were transferred to the hydroponic system. For the
first 30 days seedlings were grown in pools containing half force of Murashige and Skoog
basal salt mixture (Sigma-Aldrich) and Murashige and Skoog vitamin solution 1000x
(Sigma-Aldrich) (Murashige and Skoog 1962), and for the last 30 days they were grown with
full force (4.3 g L-1
of salt mixture and 1 mL L-1
of vitamin solution). The medium was
changed every 3 days. Growth condition were: 10 hours of light at 21 °C, 1 hour of half-light
intensity with a decrease of temperature from 21 °C to 18 °C, 12 hours of dark at 18°C, 1
hour of half-light intensity with an increase of temperature from 18 °C to 21 °C, and constant
60% relative humidity. The irradiance at the plant level was of 100-200 mol photons m-2
s-1
.
After 60 days of pre-cultivation, plants were partitioned in four hydroponic system batches:
one, containing Murashige and Skoog solution, was kept as control (CT); one containing
Murashige and Skoog solution and 34 nM of indole-3-acetic acid (IAA); one containing
Murashige and Skoog solution and 1 mg C L-1
of HS from International Humic Substances
Society (IHSS); and one containing Murashige and Skoog solution and 1 mg C L-1
of HS
from earthworm faeces (EF) (Trevisan et al. 2010). The concentration of IAA was
corresponding to the content of IAA measured in the humic substances extracted from
earthworm faeces (EF) (34 0.31 nM) as reported in Trevisan et al. (2010). The EF and
IHSS concentrations were chosen based on previous studies (Carletti et al. 2008; Nardi et al.
2000; Trevisan et al. 2011).

96
Each hydroponic system batch was replicated 4 times. After 8 hours of treatment, one plant
root sample (approx. 200 mg) and two plant leave samples (approx. 600 mg for each one)
were collected for each batch, weighted, snap frozen in liquid nitrogen, and freeze dried.
Summarizing, for each treatment 8 leaf and 4 root biological replicates were obtained.
Free amino acids, sugar alcohols, and carbohydrates extraction
The extraction procedure has been described earlier (Merchant et al. 2006). Approximately
40 mg of dried leaf or root material were weighed into a 2 mL screw-cap micro-tube. 1 mL of
methanol/chloroform/water (12:5:3) was added and incubated at 75 °C for 30 min. The water
fraction of the extraction mixture consisted of a 0.1 % solution of penta-erythritol internal
standard. After cooling, samples were centrifuged (11,400 g for 3 min) and 800 mL of the
supernatant removed and placed into a clean 2 mL round bottomed micro-tube. A further 200
mL of chloroform and 500 mL of ultrapure water were added to facilitate the separation of
phases. The mixture was vortexed for 30 seconds, centrifuged (11,400 g for 3 min) and left to
stand for 15 min to allow phase separation. 700 mL of the upper phase (the water–methanol
soluble fraction) were transferred to a clean 1.5 mL micro-tube.
Protein hydrolysis
Approximately 20 mg of dried leaf material were weighted and placed into a Vacuum
Hydrolysis Tube (Thermo Scientific, Waltham, USA). 1 mL of 6 N HCl was pipetted into the
tube, a screw was added and vacuum was created with a pump. Tubes were left for 24 h at
110 °C on a block heater (Thermo Scientific, Waltham, USA). After cooling, 3 mL of
ultrapure water were added into each tube, mixed, and 2 mL of each solution were pipetted
into a clean 2 mL micro-tube. Samples were then frozen at -20 °C until analysis (Leaf et al.
1958). Thryptophan is easily degraded by acid hydrolysis in 6 N HCl and therefore it cannot
be detected.
Analysis of carbohydrates and sugar alcohols
For the carbohydrates and sugar alcohols analyses, gas chromatography (GC) techniques
used by Merchant et al. (2006) were followed accordingly. 50 µL of dried extract were
suspended in 450 µL anhydrous pyridine to which a solution of 1:10 ratio mixture of
trimethylchloroacetamide (TMCS) and bis-trimethylsilyl-trifluroavetamide (BSTFA) was
added for derivatization. Samples were incubated for 35 min at 75 °C and analyzed by GC-

97
MS within 24h. The analysis was carried out on an Agilent 6890 Gas Chromatograph with
QQQ 7000 Mass selective detector (Agilent Technologies, Santa Clara, United States).
Samples were injected in a split splitless injector at 300 °C with a 20:1 split injection onto a
HP-5 column (30 m, 0.25 mm ID, 0.25 µm film thickness) with helium carrier gas at a
constant flow of 1 mL/min. The temperature program had an initial oven temperature set of
60 °C for 2 min, ramping to 220 °C at 10
°C min
-1 for 5 min then to 300 °C at 10 °C min
-1 for
5 min. GC-MS results were identified based on retention times relative to standards and
extracted ions. Peak areas were integrated and their relative quantities were calculated by the
Mass Hunter software (version B.07.01, Agilent Technologies), used for peak integration.
Analysis of amino acids
LC-MS analysis of the amino acids extract was carried out on a 1290 Infinity LC system
(Agilent Technologies) coupled to a 6520 QTOF Mass selective detector (Agilent
Technologies). 3.5 uL of sample was injected into a Zorbax SB-C18 column (2.1 x 150 mm,
3.5 µm) and separation was achieved by gradient elution with water and methanol (98 : 2 %
starting mix). The QTOF was tuned to operate at the low mass range <1700 AMU and data
acquisition was done in scan mode (60-1000 m/z) and ionization was positive ion mode. LC-
MS results were identified based on their retention times relative to standards as well as their
formula mass. Peak areas were integrated and their relative quantities were calculated by the
Mass Hunter software (version B.07.01, by Agilent).
Statistical analysis
The data represent the means of measurements from four different batches per treatment. For
each measurement, the average standard error is reported. Analysis of variance (one-way
ANOVA) was performed using the SPSS 23 (IBM Corp) software with type of treatment as
factor, and was followed by pairwise post hoc analyses (Duncan test) to determine which
means differed significantly at P < 0.05. Levene and Mauchly’s tests were applied to check
homoscedasticity and sphericity, respectively, to ensure that assumptions of the model were
met as recommended in Field (2013).
Data were further processed with the SAS software 9.1 (SAS institute). Canonical
discriminant analysis (CDA) was performed to determine which set of variables best predicts
group membership and to visualize the data by condensing the multiple treatment variables
onto one or more axes. The analysis seeks to derive a reduced set of discriminant (canonical)

98
functions that best describe the separation of the studied plots, which in our case were the
treatment of Arabidopsis plants. The method also applies a stepwise procedure in order to
select the set of variables that has the highest correlation with the factor and assesses the
relative importance of each independent variable. The consistency and overall robustness of
the separation was evaluated by the Mahalanobis quadratic distance, an index that measures
the squared distances between classes, i.e. between the centroids of each cloud, thus
reflecting the actual separation between the treatments (Carletti et al. 2009).

99
Results
Chemical characterization
The chemical characterizations of IHSS and EF are reported in Table 1. The elemental
composition was very similar between samples, but IHSS had a higher content of C (58.13%)
and of H (3.68%), meanwhile EF had a higher content of O (36.50%) and N (4.41%).
Table 1 Elemental composition (%) of humic substances from International Humic Substances Society (IHSS)
and from earthworm faeces (EF). Data are mean SE, n=3
Humic
substance
H2O Ash C H O N S P
IHSS* 8.2 0.88 58.13 3.68 34.08 4.14 0.44 0.24
EF - - 55.97 0.17 3.12 0.10 36.5 0.12 4.41 0.16 - -
* Data of the elemental analysis for IHSS were taken from the IHSS website (http://humic-substances.org)
FTIR spectra
The humic acids spectra were characterized by similar functional groups (Fig. 1). A broad
band centered at about 3270 cm− 1
was assigned to the OH stretching vibrations in alcohols,
phenols and carboxylic acids. The aliphatic groups were confirmed by the presence of two
peaks at around 2920-40 and around 2840 cm–1
, due to the asymmetrical and symmetrical
stretching of methylene (-CH2-) groups, respectively (Giovanela et al. 2004). The carboxyl
groups were established by the band at about 1708-20 cm− 1
, assigned to the C=O stretching
vibration. It was stronger in IHSS than EF. Other bands at around 1610 cm− 1
can be mainly
due to C=C stretching of aromatic rings (Pizzeghello et al. 2015; Tinti et al. 2015) and
aromatic carboxylic acids. The region between 1480 and 1300 cm-1
was assigned to CH2 and
CH3 bending, and C-OH deformation of COOH, and COO- symmetric stretching. The band at
around 1220-40 cm-1
may be due to C–O stretch and O–H deformation of COOH, phenols
and unsaturated ethers. Usually, the region between 1100 - 1000 cm− 1
is attributed to C–O
stretch of alcohols and carbohydrates.

100
Fig. 1 FT-IR spectra of humic substances from International Humic Substances Society (IHSS), blue line, and
from earthworm faeces (EF), red line.
Concerning the EF, its spectrum was characterized by the typical bands associated with
amide I (1645 cm−1
) and amide II (1540 cm−1
) (Carletti et al. 2010). However we cannot
exclude the contribution of C=C stretch in aromatic rings. In addition, the content of
carboxylic groups was not so relevant as that of IHSS because of i) the lack of the band at
2607 cm−1
, attributed to hydrogen-bond of carboxylic acids dimers (Bellamy 1975), ii) the
appearance of a weak shoulder at 1708 cm-1
and iii) the low intensity of the band at 1226
cm−1
. This feature highlighted the weak acidic character of EF. In this case, the strong band at
1028 cm−1
is attributed to alumino-silicate (Madejova 2003; Tinti et al. 2015) not completely
removed during the extraction process.
One-Dimensional 1H NMR Spectra
The spectra are characterized by typical resonance as described in previous paper by Simpson
et al. (2001) and Ferrari et al. (2011). As shown in Fig. 2 different regions corresponding to
functional groups/molecular moieties can be seen at: 9.00–7.60 ppm are due to protons in
peptides and aromatics; 7.60–6.59 ppm are assigned to −CH=CH− and aromatic amino acids,
lignin; 5.55–3.00 ppm are characteristic of protons in carbohydrates, β protons in peptides,
lignin, ethers; 2.35–2.07 ppm are attributed to side chain protons in amino acids; 2.05–0.97
ppm are assigned to protons in −CH2−, chains of lipids, waxes and cuticles; 0.96–0 ppm are
proton in terminal -CH3 groups. In more detail, the IHSS spectrum was dominated by the
large contribution of long aliphatic chains (-CH2)n and terminal methyl groups as also
Ab
sorb
an
ceu
nit
s
3500 3000 2500 2000 1500 1000
Wavenumber (cm-1)
3062
2942
2607
1720
1617
1420 1246
3276
2881 1645
1549
1447
1225
1028
IHSS
EF

101
supported by IR spectrum (Fig. 1). A small contribution appeared from the α-proton in
peptides (∼4–4.5 ppm) and sugar-like components (3-4.4 ppm). In contrast, the aromatic
signal (∼7.60–6.59 ppm) was considerable and in particular, the broad signal from ∼7.5–8.5
ppm may mainly include the presence of condensed aromatic rings. The most intense peak
was apparent at approximately 1.9 ppm and the other peaks were observed at approximately
at 2.1, 3.8, 5.8 ppm. The presence of well-resolved peaks in the spectrum suggests that some
simple chemical compounds are incorporated into and/or coexist in IHSS.
EF spectrum was dominated by strong signals of long aliphatic chains in (-CH2) and in
terminal methyl groups, and by a prominent signal of sugar like (3-4.4 ppm) and aromatic
(∼7.60–6.59 ppm) compounds. However it showed less prominent peaks with respect to
IHSS. The integration of the various chemical shift areas of IHSS and EF are given in Table
2. Aromatics and cumulative aliphatic protons accounted for 12.13% and 45.15 % in IHSS
and 11.28% and 34.94 % in EF, respectively. Protons in carbohydrates and peptides
accounted for 28.27% in IHSS and 45.58% in EF, respectively.
Fig. 2 1H NMR spectra of (from bottom to top) humic substances extracted from International Humic
Substances Society (IHSS), blu line, and earthworm faeces (EF), black line. Spectra were registered at 298 K in
DMSO-d6.

102
Table 2 Integrated areas of typical resonances expressed as percentage and calculated on HS from IHSS (IHSS),
and HS from earthworm faeces (EF)1H NMR spectra. Integrals were evaluated by AMIX-Viewer Bruker and
each integrated area is the average value on three independent calculations, standard error is <5%.
Humic substance Terminal CH3
groups
−CH2−, chains of
lipids, waxes and
cuticles
Side chain protons
in amino acids
Carbohydrates,
β protons in
peptides,
lignin, ethers
−CH=CH−,
aromatic
amino acids,
lignin
Amide group in
peptides and
aromatics
0-0.96 ppm 0.97-2.05 ppm 2.07–2.35 ppm 3.00-5.55 ppm 6.59-7.60 ppm 7.60-9.00 ppm
IHSS 11.79 34.36 4.22 28.27 12.13 10.47
EF 9.30 26.64 3.97 45.58 11.28 3.24
MCW extracted metabolites
Out of the 40 metabolites investigated, 23 were found in roots and 20 in leaves of treated and
untreated plants, respectively. In roots five metabolites were carbohydrates, one was sugar
alcohol, and 17 were amino acids. The treatment of Arabidopsis plants with EF and IHSS
considerably influenced metabolite contents (Table 3) in roots (P ≤ 0.05). EF induced a
significant reduction (P ≤ 0.05) of all detected root carbohydrates (ranging from - 48 % to -
54 %) and of myo-inositol (- 48 %) compared to the control. Also for 12 of 17 detected root
amino acids similar reduction was observed (P ≤ 0.05), ranging from - 40 % compared to
control for proline, although not significant, and - 54 % for glutamine. Plant treated with
IHSS had the lowest production of mannose (38 0 g g-1
dw) and proline (163 38 g g-1
dw) (Table 3) in roots (P ≤ 0.05).
In leaves 5 carbohydrates, 1 sugar alcohol, and 14 amino acids were identified (Table 3). For
carbohydrates, IAA and IHSS treatment showed a significant increase of + 16 % and + 22 %
(P ≤ 0.05) of fructose respectively compared to the control. Meanwhile sucrose content was
40 % and 22 % lower for plants treated with EF and IHSS (P ≤ 0.05) respectively. EF
treatment resulted in a significant reduction of leaf sugar alcohol (- 23 %), and of leaf
glutamine, asparagine, threonine, glutamic acid, and proline production (respectively - 17 %,
- 19 %, - 20 %, - 21 %, and – 10 % compared to the control) (P ≤ 0.05).
Amino acids from proteins hydrolysis
After the hydrolysis of leaf proteins, 13 amino acids were found in treated and control
samples (Table 4). Plants treated with IAA had a significant lower concentration of serine,
alanine, and glutamic acids (Table 4) (P ≤ 0.05). In samples of IHSS treated plants it was
detected a significant higher concentration of arginine, aspartic acid, proline, and
phenylalanine (P ≤ 0.05), but a significant decrease of glycine, serine, alanine, and glutamic

103
acid (P ≤ 0.05). EF induced a significant increment of arginine, proline, leucine, and
phenylalanine (P ≤ 0.05), with the highest influence for phenylalanine (+ 28 % compared to
untreated), and a significant reduction of glycine, serine, alanine, and glutamic acid
concentrations (- 20 %, -33 %, -36 %, and -31%, respectively P ≤ 0.05).

104
Table 3 Average values (mean SE) of the identified carbohydrates, sugar alcohol, and free amino acids in roots and leaves of control plants (CT), plants treated with
auxin (IAA), HS from IHSS (IHSS), and HS from earthworm faeces (EF). Values are expressed in μg g -1
of dry matter. Letters indicate significant differences among
treatments (P 0.05) based on Duncan post hoc tests.
Metabolite Roots Leaves
CT IAA IHSS EF CT IAA IHSS EF
Carbohydrates Fructose 510 ± 74a 478 ± 121
ab 340 ± 54
ab 238 ± 34
b 276 ± 9
b 321 ± 14
a 338 ± 20
a 294 ± 4
ab
Glucose 1 523 ± 61a 488 ± 102
a 373 ± 46
ab 250 ± 31
b 1839 ± 342 1516 ± 204 1549 ± 237 1405 ± 172
Glucose 2 555 ± 57a 528 ± 98
a 395 ± 39
ab 265 ± 35
b 2753 ± 521 2254 ± 330 2303 ± 376 2081 ± 287
Sucrose 12038 ± 2320ab
14413 ± 1456a 12768 ± 3756
ab 6305 ± 1304
b 22400 ± 1647
a 20391 ± 1528
ab 17694 ± 599
b 13546 ± 1217
c
Mannose 365 ± 156a 415 ± 125
a 38 ± 0
b 33 ± 0
b 428 ± 68 343 ± 54 429 ± 37 388 ± 23
Sugar alcohol Myo Inositol 398 ± 51a 373 ± 84
a 275 ± 39
ab 190 ± 23
b 664 ± 57
a 583 ± 37
ab 566 ± 31
ab 509 ± 31
b
Amino acids Glutamine 18211 ± 1763a 21210 ± 4782
a 20769 ± 3530
a 8531 ± 491
b 2247 ± 72
a 2146 ± 100
a 2097 ± 88
ab 1864 ± 92
b
Lysine 14 ± 1
a 13 ± 2
a 11 ± 1
ab 7 ± 1
b 39 ± 3 38 ± 3 36 ± 2 38 ± 4
Arginine 41 ± 6 44 ± 10 34 ± 6 22 ± 2 757 ± 43 780 ± 46 755 ± 25 729 ± 45
Asparagine 370 ± 87 366 ± 114 219 ± 53 219 ± 46 202 ± 13
a 206 ± 6
a 177 ± 11
ab 164 ± 5
b
Alanine 83 ± 19 66 ± 10 51 ± 8 43 ± 17
Threonine 140 ± 14
a 110 ± 28
ab 86 ± 11
ab 73 ± 14
b 59 ± 2
a 56 ± 3
a 53 ± 2
ab 47 ± 2
b
Glutamic acid 178 ± 40 176 ± 66 87 ± 15 66 ± 10 336 ± 17
a 321 ± 20
a 293 ± 16
ab 264 ± 19
b
Proline 325 ± 23
ab 353 ± 63
a 163 ± 58
c 198 ± 34
bc 2876 ± 67
a 2882 ± 79
a 2663 ± 115
ab 2583 ± 51
b
Valine 54 ± 5
a 47 ± 8
a 45 ± 3
a 27 ± 2
b 346 ± 26 324 ± 20 323 ± 28 308 ± 30
Methionine 6 ± 0
a - 5 ± 0
ab 4 ± 0
b 30 ± 2 30 ± 1 30 ± 1 27 ± 1
Isoleucine 75 ± 4
a 59 ± 11
ab 65 ± 6
a 42 ± 5
b 192 ± 20 188 ± 17 194 ± 20 176 ± 21
Leucine 79 ± 2
a 64 ± 10
a 70 ± 6
a 41 ± 6
b 159 ± 14 152 ± 13 160 ± 13 149 ± 14
Tyrosine 30 ± 3
a 28 ± 5
a 25 ± 2
ab 17 ± 2
b 168 ± 21 157 ± 16 161 ± 16 159 ± 22
Phenylalanine 42 ± 5
a 42 ± 9
a 42 ± 5
a 23 ± 1
b 427 ± 71 356 ± 40 380 ± 50 388 ± 66
Tryptophan 32 ± 3
a 31 ± 6
a 30 ± 3
a 18 ± 1
b 139 ± 7 179 ± 27 194 ± 31 179 ± 35
Histidine 14 ± 1 15 ± 5 12 ± 1 8 ± 1 - - - -
Aminobutyric Acid 1120 ± 97a 1170 ± 141
a 995 ± 164
a 538 ± 38
b - - - -

105
Table 4 Average values (mean SE) of the identified amino acids after protein hydrolysis of leaves samples from
control plants (CT), plants treated with auxin (IAA), with HS from IHSS (IHSS), and with HS from earthworm
faeces (EF). Values are expressed in ug/mg -1
of dry matter. Letters indicate significant differences among
treatments (P 0.05) based on Duncan post hoc tests.
Aminoacids Leaves
CT IAA IHSS EF
Lysine 4.88 ± 0.40 4.91 ± 0.25 5.63 ± 0.18 5.43 ± 0.34
Arginine 7.80 ± 0.45b 8.51 ± 0.24
b 10.00 ± 0.30
a 9.66 ± 0.38
a
Glycine 11.75 ± 0.73ab
12.08 ± 0.48a 10.25 ± 0.43
bc 9.77 ± 0.42
c
Serine 15.91 ± 0.86a 13.11 ± 1.01
b 10.81 ± 0.59
bc 10.66 ± 0.67
c
Alanine 9.25 ± 0.90a 7.23 ± 0.35
b 6.46 ± 0.25
b 5.92 ± 0.30
b
Aspartic acid 22.64 ± 1.56b 24.46 ± 1.53
b 28.95 ± 1.30
a 25.92 ± 1.6
ab
Threonine 0.84 ± 0.35 0.85 ± 0.20 0.91 ± 0.24 1.03 ± 0.32
Glutamic acid 50.62 ± 3.98a 40.72 ± 3.36
b 38.97 ± 2.30
b 34.99 ± 0.80
b
Proline 10.19 ± 0.39b 11.59 ± 0.41
ab 13.22 ± 0.75
a 12.88 ± 0.55
a
Valine 5.31 ± 0.49 5.70± 0.33 6.23 ± 0.41 6.68 ± 0.44
Isoleucine 3.68 ± 0.41 3.97 ± 0.27 4.38 ± 0.38 4.76 ± 0.36
Leucine 13.81 ± 0.81b 15.62 ± 0.29
ab 15.76 ± 0.82
ab 16.2 ± 0.78
a
Phenylalanine 7.84 ± 0.52b 8.87 ± 0.21
ab 9.84 ± 0.32
a 10.06 ± 0.52
a
Canonical discriminant analysis
CDA was used to evaluate the influence of the treatments on the studied parameters. It was not
possible to perform CDA analysis on roots data as the number of observations was not enough
to generate a model.
The scatter plot of MCW extracted metabolites is reported in Fig. 3. The CDA model explained
93.3 % of the variability (Wilk’s Lambda value = 0.003, F = 2.79, P 0.001); particularly Can
1 explained 68.5 %, well distinguishing between CT and IAA vs. IHSS and EF, whereas Can 2
explained 24.8 %, discriminating IHSS from EF. Analyzing the Malahanobis quadratic
distances of the four clouds (Table S1 of the supplementary material), it was possible to
determine that IHSS and EF were significantly different from CT (P 0.01 and P 0.05
respectively) and from IAA (P 0.01 and P 0.05 respectively), and EF from IHSS (P
0.05). Sucrose (P 0.001), glutamine (P 0.05), threonine (P 0.01), and glutamic acid (P
0.05) significantly contributed to the CDA model (Table S2). Moreover, sucrose (P 0.001),
asparagine (P 0.05), threonine (P 0.05), and glutamic acid (P 0.05), correlate well with
Can1, meanwhile sucrose (P 0.05), glutamine (P 0.05), and threonine (P 0.01) with Can
2 (Table S2).

106
In Fig. 4 the scatter plot of amino acids from proteins hydrolysis is reported. The model well
distinguished IHSS and EF from CT (P 0.001), and from IAA (P 0.05) (Table S3) (95% of
the variability interpreted, Wilk’s Lambda value = 0.005, F = 2.21, P 0.01); Can 1 explained
87.4% of the model variability, and Can 2 9.5%. Arginine, glycine, serine, alanine, proline,
phenylalanine, and glutamic acid significantly contributed to construction of CDA model
(Table S4); the above amino acids plus aspartic acid, valine, isoleucine, and leucine
significantly correlated with Can 1, and only glycine with Can 2 (Table S4).
Fig. 3 Scatter plot of CDA of carbohydrates, sugar alcohol, and free amino acids. The separation of the samples is
based on the treatment condition. Additional axes show the most important variables contributing to the formation
of the canonical variables (Can 1 explained 68.5 %, whereas Can 2 explained 24.8 %). The extension of each
arrow from the plot center indicates the importance of the variable in the canonical structure according to Pearson
correlation coefficients and its direction reports the increase or decrease of the variable.
CT = control; IAA = auxin; IHSS = humic substances from International humic substances society; EF = humic
substances from earthworm faeces

107
Fig. 4 Scatter plot of CDA of amino acids derived from the protein hydrolysis. The separation of the samples is
based on the treatment condition. Additional axes show the most important variables contributing to the formation
of the canonical variables (Can 1 explained 87.4% of the model variability, and Can 2 9.5%). The extension of
each arrow from the plot center indicates the importance of the variable in the canonical structure according to
Pearson correlation coefficients and its direction reports the increase or decrease of the variable.
CT = control; IAA = auxin; IHSS = humic substances from International humic substances society; EF = humic
substances from earthworm faeces
108
Discussion
It is well documented that HS increase plant growth, root system development (Canellas et al.
2002; Trevisan et al. 2010; Zandonadi et al. 2007), and several physiological processes
(Conselvan et al. 2017; Nardi et al. 2009). In growing cells/organs there is a higher production
of proteins, demand of amino acids, and over-working of the respiratory pathway to support
the elevated active protein synthesis and energy request (Fernie et al. 2004; Hildebrandt et al.
2015).
Eight hours of treatment with HS from earthworm faeces induced a significant reduction of the
concentration of all detected carbohydrates and most of the free amino acids in roots, compared
to the control, probably related to an overall increase in plant metabolism. From IR, NMR
spectra and CDA analysis of sugars and amino acids we could observe that HS with different
chemical structure (IHSS and EF) caused different physiological answers in treated plants.
HS influence on carbohydrate concentration
Arabidopsis plants treated with EF had a significant reduction of sucrose, fructose, glucose,
and mannose content in roots, and sucrose in leaves (Table 3). It is known that HS have an
influence on carbohydrate metabolism, affecting the level and distribution of sugars in treated
plants. Canellas et al. (2013) reported that maize plants treated with HS had a lower leaf
content of free carbohydrates with a reduction by 60 % of glucose, fructose, and starch
compared to the control. Nardi et al. (2007) demonstrated that on maize plant the Fraction III
of HS and humic acids (HA) extracted from Fulvudand soil positively influenced the activity
of glycolysis (glucokinase, phosphoglucose isomerase, PPi-dependent phosphofructokinase
and pyruvate kinase) and TCA cycle enzymes (citrate synthase and malate dehydrogenase).
Sucrose is synthetized in leaves and it is the major end product of photosynthesis and transport
sugar in plants. It is a source of energy and carbon for organic and storage compounds (Rolland
et al. 2006; Winter and Huber 2000) as well as the starting point for the respiratory pathway,
being the principal substrate for glycolysis. A lower concentration of sucrose in roots and
leaves could be due to a higher activity of glycolysis to support metabolic processes stimulated
by HS leading to enhanced plant growth. Such a response was also hypothesized by Canellas et
al. (2013) as an effect of HS and Aspergillus treatment. This mechanism is also consistent with

109
the reduction of glucose concentration in roots and leaves, and fructose in roots. Although in
roots of EF treated plants all carbohydrates were significantly lower in concentration, leaf
sugars concentration might be replenished by higher photosynthesis, which has been
previously reported as an effect of HS treatment (Aguiar et al. 2016).
HS influence on amino acid concentration
Free amino acids are the building blocks of proteins, but they are also involved in numerous
cellular reactions and they influence different physiological processes as plant growth and
development, resistance to biotic and abiotic stress, production of metabolic energy (Galili et
al. 2014; Hildebrandt et al. 2015; Pratelli and Pilot 2014). Free amino acids could be catalyzed
through deamination reaction: nitrogen is removed as ammonium from the amino acids and
transferred to storage compounds. If required, ammonium can be re-assimilated by glutamine
synthase and used to produce new amino acids. The remaining carbon skeletons of catalyzed
amino acids are commonly converted to precursors or intermediate of tricarboxylic acid (TCA)
cycle (Hildebrandt et al. 2015).
The lower concentration of free amino acids in EF treated plants might may be due to the
higher protein production to support enhanced plant growth. This hypothesis is confirmed by
the higher concentrations of leucine, proline, arginine, and phenylalanine obtained with protein
hydrolysis extraction (Table 4). However, it cannot be ruled out that free amino acids are
depleted for energy purposes. Finally, free amino acids contents might not be restored to
control levels due to the short treatment duration of eight hours.
Amino acids could also be precursors for the synthesis of several secondary metabolites (e.g.
phenylpropanoids, alkaloids, glucosinolates) involved in some plant functions such as
signaling (e.g. hormones), structure (e.g. lignin), defense (e.g. glucosinolates), and protection
(e.g. pigments) (D'Auria and Gershenzon 2005). In particular the aromatic amino acids
(phenylalanine, tyrosine, and tryptophan) are the precursors for the biosynthesis of numerous
natural products, such as pigments, alkaloids, hormones, and cell wall components (Maeda and
Dudareva 2012). In EF treated roots the lower concentration of phenylalanine among free
amino acids could be related to higher production of lignin (Rennie and Scheller 2014), or
phenolic compounds with signaling function (Murphy et al. 2000; Suzuki et al. 2004).

110
Increased phenylalanine ammonia-lyase (PAL; EC 4.3.1.5) activity with consequent
phenylalanine degradation is a known effect of HS extracted from various sources (Conselvan
et al. 2017). In roots of plants treated with EF was also detected a lower tryptophan
concentration with respect to untreated ones. The importance of this amino acid is related to the
auxin indole-3-acetic acid biosynthesis (IAA) (Mano and Nemoto 2012). Auxins are directly
involved in the plant growth and development (Quint and Gray 2006). In particular, IAA is
responsible for root system architecture and different stages of root development (Overvoorde
et al. 2010), with a pivotal role in primary root, lateral root, and root hair development (Benfey
et al. 2010). The hypothesis that, in EF treated plants, free tryptophan is consumed to produce
IAA is supported by Trevisan et al. (2010) where they found that HS have an influence on the
regulation of auxin-inducible genes. However, in our study, IAA treatment did not have the
same activity on tryptophan concentration like EF. These observations could suggest that, even
if HS are known to have an auxin-like activity, they also have a direct influence on the auxin
metabolic pathway, which could only in part explained with the presence of IAA in the HS
matrix.
CDA analysis
CDA analysis successfully distinguished the different treatments (Fig. 3 and 4, Tables S1 and
S3). HS, both EF and IHSS, were significantly different from CT and IAA, although CT and
IAA scatters were not discriminated by the model. This suggests that IAA treatment, with the
concentration found in HS (Trevisan et al. 2010), was not able to induce the same responses
elicited by HS. Although the auxin-like effect of HS has been debated at length (Nardi et al.
2002), this results confirms the hypothesis that the activity of HS is not only due to the IAA
present in HS molecules, but also because of other compounds with a similar activity (Nardi et
al. 2009). HS may behave as a signal of the rhizosphere, perhaps eliciting phytohormone
production at a plant and/or at a soil biota level. Moreover, CDA analysis of the MCW
extracted compounds (Fig. 3) highlighted a clear distinction between EF and IHSS scatter
plots. This result accounts for HS compositional differences. Rose et al. (2014) reported that
plant responses to HS are not always the same, but they depend on the source and structure of
HS, plant type, and environment conditions. The responses elicited by HS have been found to
depend on their structure (Canellas et al. 2012): diversely structured humic extracts may cause
the different plant physiological responses. In our case study, IHSS and EF were characterized
111
by different functional groups and structures. IHSS showed a slightly higher aromatic and
aliphatic features (hydrophobic fraction of HS) with respect to EF. Aguiar et al. (2013);
Canellas et al. (2010); Martinez-Balmori et al. (2014) demonstrated that aliphatic and aromatic
components are capable to induce lateral root emergence and stimulate plant growth. The
hydrophobic humic components are able to incorporate bioactive molecules into HS structure
and protect them against degradation (Piccolo 1996). The organic acids present in plant roots
exudates can disaggregate HS into smaller humic molecules (Piccolo and Spiteller 2003). The
released bio-active molecules can then access cell membranes and induce physiological
responses. The lower content of hydrophobic compounds in EF could facilitate the
disaggregation of HS by the organic acids present in root exudates, thus making more available
biological active molecules entrapped in HS structure.
Moreover, the higher content of carbohydrates and peptide components (hydrophilic fraction of
HS) in EF could explain the higher induction of plant physiological responses. Piccolo et al.
(1992) and Nardi et al. (2007) demonstrated that low molecular fraction of humic acids,
characterized by high content of hydrophilic compounds, significantly increased nitrogen
uptake, glycolytic pathway and Krebs cycle in maize seedlings.
In conclusion, with the present study, we confirm that plants under HS treatments enhance
protein and energetic metabolism to support/uphold a higher growth rate and we corroborate
that HS extracted from different sources do not elicit the same plant responses. In particular,
the relative abundances of aliphatic and aromatic compounds and the presence of
carbohydrates and peptide components, as revealed by spectrometric analyses, might be
responsible for the different effects of the HS. Auxin-like activity have been previously
advocated to explain responses to HS. Our results demonstrate differences between plants
treated with IAA and HS, highlighting that responses in terms of carbohydrates and amino acid
concentrations can only in part be ascribed to the effects of IAA entrapped in the HS matrix.
The presence of other molecules entrapped in the HS matrix could be advocated to justify their
biostimulant effects.
Present results can contribute to identifying HS-responsive metabolites, also in relation to the
substances structural characteristics, which can be chosen as markers of these compounds
bioactivity.

112
Acknowledgements
PhD grant for Giovanni Battista Conselvan funded by MIUR “L 170”. Paolo Carletti was
financially supported by University of Padova DOR1751800/17. This work has been realized
thanks to the University of Padova – University of Sydney Memorandum of Understanding.
113
References
Aguiar NO, Medici LO, Olivares FL, Dobbss LB, Torres-Netto A, Silva SF, Novotny EH,
Canellas LP (2016) Metabolic profile and antioxidant responses during drought stress
recovery in sugarcane treated with humic acids and endophytic diazotrophic bacteria.
Ann Appl Biol 168: 203-213. doi: 10.1111/aab.12256.
Aguiar NO, Olivares FL, Novotny EH, Dobbss LB, Balmori DM, Santos LG, Chagas JG,
Facanha AR, Canellas LP (2013) Bioactivity of humic acids isolated from
vermicomposts at different maturation stages. Plant Soil 362: 161-174. doi:
10.1007/s11104-012-1277-5.
Baigorri R, Fuentes M, Gonzalez-Gaitano G, Garcia-Mina JM (2007) Simultaneous presence
of diverse molecular patterns in humic substances in solution. J Phys Chem B 111:
10577-10582. doi: 10.1021/jp0738154.
Baldotto LEB, Baldotto MA, Giro VB, Canellas LP, Olivares FL, Bressan-Smith R (2009)
Performance of 'Victoria' pineapple in response to humic acid application during
acclimatization. Rev Bras Cienc Solo 33: 979-990. doi: 10.1590/S0100-
06832009000400022
Bellamy LJ (1975) The infra-red spectra of complex molecules, London.
Benfey PN, Bennett M, Schiefelbein J (2010) Getting to the root of plant biology: impact of
the Arabidopsis genome sequence on root research. Plant Journal 61: 992-1000. doi:
10.1111/j.1365-313X.2010.04129.x.
Bronick CJ, Lal R (2005) Soil structure and management: a review. Geoderma 124: 3-22. doi:
10.1016/j.geoderma.2004.03.005.
Calvo P, Nelson L, Kloepper JW (2014) Agricultural uses of plant biostimulants. Plant Soil
383: 3-41. doi: 10.1007/s11104-014-2131-8.
Canellas LP, Balmori DM, Medici LO, Aguiar NO, Campostrini E, Rosa RCC, Facanha AR,
Olivares FL (2013) A combination of humic substances and Herbaspirillum
seropedicae inoculation enhances the growth of maize (Zea mays L.). Plant Soil 366:
119-132. doi: 10.1007/s11104-012-1382-5.
Canellas LP, Dobbss LB, Oliveira AL, Chagas JG, Aguiar NO, Rumjanek VM, Novotny EH,
Olivares FL, Spaccini R, Piccolo A (2012) Chemical properties of humic matter as

114
related to induction of plant lateral roots. European Journal of Soil Science 63: 315-
324. doi: 10.1111/j.1365-2389.2012.01439.x.
Canellas LP, Olivares FL (2014) Physiological responses to humic substances as plant growth
promoter. Chemical and Biological Technologies in Agriculture 1: 3. doi:
10.1186/2196-5641-1-3.
Canellas LP, Olivares FL, Okorokova-Façanha AL, Façanha AR (2002) Humic acids isolated
from earthworm compost enhance root elongation, lateral root emergence, and plasma
membrane H+-ATPase activity in maize roots. Plant Physiology 130: 1951-1957. doi:
10.1104/pp.007088.
Canellas LP, Piccolo A, Dobbss LB, Spaccini R, Olivares FL, Zandonadi DB, Facanha AR
(2010) Chemical composition and bioactivity properties of size-fractions separated
from a vermicompost humic acid. Chemosphere 78: 457-466. doi:
10.1016/j.chemosphere.2009.10.018.
Carletti P, Masi A, Spolaore B, De Laureto PP, De Zorzi M, Turetta L, Ferretti M, Nardi S
(2008) Protein expression changes in maize roots in response to humic substances.
Journal of Chemical Ecology 34: 804-818. doi: 10.1007/s10886-008-9477-4.
Carletti P, Roldán ML, Francioso O, Nardi S, Sanchez-Cortes S (2010) Structural
characterization of humic-like substances with conventional and surface-enhanced
spectroscopic techniques. Journal of Molecular Structure 982: 169-175.
Carletti P, Vendramin E, Pizzeghello D, Concheri G, Zanella A, Nardi S, Squartini A (2009)
Soil humic compounds and microbial communities in six spruce forests as function of
parent material, slope aspect and stand age. Plant Soil 315: 47-65. doi: 10.1007/s11104-
008-9732-z.
Conselvan GB, Pizzeghello D, Francioso O, Di Foggia M, Nardi S, Carletti P (2017)
Biostimulant activity of humic substances extracted from leonardites. Plant Soil. doi:
10.1007/s11104-017-3373-z.
D'Auria JC, Gershenzon J (2005) The secondary metabolism of Arabidopsis thaliana: growing
like a weed. Current Opinion in Plant Biology 8: 308-316. doi:
10.1016/j.pbi.2005.03.012.
Destro T, Prasad D, Martignago D, Bernet IL, Trentin AR, Renu IK, Ferretti M, Masi A (2011)
Compensatory expression and substrate inducibility of gamma-glutamyl transferase

115
GGT2 isoform in Arabidopsis thaliana. Journal of Experimental Botany 62: 805-814.
doi: 10.1093/jxb/erq316.
du Jardin P (2012) The Science of Plant Biostimulants–A bibliographic analysis, Ad hoc study
report. European Commission.
European Biostimulant Industry Council E (2013) Economic over- view of the biostimulants
sector in Europe,17 April 2013.
FAO-UNESCO (1997) World soil map, revised legend. FAO, Wageningen, Netherlands.
Fernie AR, Carrari F, Sweetlove LJ (2004) Respiratory metabolism: glycolysis, the TCA cycle
and mitochondrial electron transport. Current Opinion in Plant Biology 7: 254-261. doi:
10.1016/j.pbi.2004.03.007.
Ferrari E, Francioso O, Nardi S, Saladini M, Dal Ferro N, Morari F (2011) DRIFT and HR
MAS NMR characterization of humic substances from a soil treated with different
organic and mineral fertilizers. Journal of Molecular Structure 998: 216-224.
Field A (2013) Discovering statistics using IBM SPSS statistics. Sage.
Galili G, Avin-Wittenberg T, Angelovici R, Fernie AR (2014) The role of photosynthesis and
amino acid metabolism in the energy status during seed development. Front Plant Sci 5.
doi: 10.3389/fpls.2014.00447.
Gao TG, Xu YY, Jiang F, Li BZ, Yang JS, Wang ET, Yuan HL (2015) Nodulation
characterization and proteomic profiling of bradyrhizobium liaoningense
CCBAU05525 in response to water-soluble humic materials. Sci Rep 5. doi:
10.1038/srep10836.
Garcia AC, Olaetxea M, Santos LA, Mora V, Baigorri R, Fuentes M, Zamarreno AM, Berbara
RLL, Garcia-Mina JM (2016) Involvement of hormone- and ROS-signaling pathways
in the beneficial action of humic substances on plants growing under normal and
stressing conditions. Biomed Res Int: 13. doi: 10.1155/2016/3747501.
Giovanela M, Parlanti E, EJ S-S, MMD S (2004) Elemental compositions, FT-IR spectra and
thermal behavior of sedimentary fulvic and humic acids from aquatic and terrestrial
environments. Geochemical Journal 38: 255-264.
Griffin JL, Shockcor JP (2004) Metabolic profiles of cancer cells. Nat Rev Cancer 4: 551-561.
doi: 10.1038/nrc1390.

116
Gu HW, Du JH, Neto FC, Carroll PA, Turner SJ, Chiorean EG, Eisenmane RN, Raftery D
(2015) Metabolomics method to comprehensively analyze amino acids in different
domains. Analyst 140: 2726-2734. doi: 10.1039/c4an02386b.
Hager A (2003) Role of the plasma membrane H+-ATPase in auxin-induced elongation
growth: historical and new aspects. J Plant Res 116: 483-505. doi: 10.1007/s10265-
003-0110-x.
Hildebrandt TM, Nesi AN, Araujo WL, Braun HP (2015) Amino acid catabolism in plants.
Molecular Plant 8: 1563-1579. doi: 10.1016/j.molp.2015.09.005.
Jannin L, Arkoun M, Ourry A, Laîné P, Goux D, Garnica M, Fuentes M, Francisco SS,
Baigorri R, Cruz F, Houdusse F, Garcia-Mina J-M, Yvin J-C, Etienne P (2012)
Microarray analysis of humic acid effects on Brassica napus growth: Involvement of N,
C and S metabolisms. Plant Soil 359: 297-319. doi: 10.1007/s11104-012-1191-x.
Leaf G, Gillies NE, Pirrie R (1958) The amino acid composition of cytochrome c from horse
heart. Biochemical Journal 69: 605-611.
Lombardo M, Lamattina L (2012) Nitric oxide is essential for vesicle formation and trafficking
in Arabidopsis root hair growth. Journal of experimental botany 63: 4875-4885. doi:
10.1093/jxb/ers166.
Madejova J (2003) FTIR techniques in clay mineral studies. Vibrational Spectroscopy 31: 1-
10. doi: 10.1016/s0924-2031(02)00065-6.
Maeda H, Dudareva N (2012) The shikimate pathway and aromatic amino acid biosynthesis in
plants. In: SS Merchant (ed) Annual Review of Plant Biology, Vol 63.
Mano Y, Nemoto K (2012) The pathway of auxin biosynthesis in plants. Journal of
Experimental Botany 63: 2853-2872. doi: 10.1093/jxb/ers091.
Marino G, Righi V, Simoni A, Schenetti L, Mucci A, Tugnoli V, Muzzi E, Francioso O (2013)
Effect of a peat humic acid on morphogenesis in leaf explants of pyrus communis and
cydonia oblonga. Metabolomic analysis at an early stage of regeneration. J Agric Food
Chem 61: 4979-4987. doi: 10.1021/jf4004785.
Martinez-Balmori D, Spaccini R, Aguiar NO, Novotny EH, Olivares FL, Canellasa LP (2014)
Molecular characteristics of humic acids isolated from vermicomposts and their
relationship to bioactivity. J Agric Food Chem 62: 11412-11419. doi:
10.1021/jf504629c.

117
Merchant A, Richter A, Popp M, Adams M (2006) Targeted metabolite profiling provides a
functional link among eucalypt taxonomy, physiology and evolution. Phytochemistry
67: 402-408. doi: 10.1016/j.phytochem.2005.11.027.
Minelli A, Omodeo P, Rota E, Sambugar B (1995) Anellida Clitellata, Aphanomeura. In: A
Minelli, S Rufo, S La Posta (eds) Checklist delle Specie della Fauna Italiana. Calderoni,
Bologna.
Moing A (2000) Sugar alcohols as carbohydrate reserves in some higher plants. Developments
in Crop Science 26: 337-358. doi: 10.1016/S0378-519X(00)80017-3.
Mora V, Bacaicoa E, Baigorri R, Zamarreno AM, Garcia-Mina JM (2014) NO and IAA Key
Regulators in the Shoot Growth Promoting Action of Humic Acid in Cucumis sativus
L. J Plant Growth Regul 33: 430-439. doi: 10.1007/s00344-013-9394-9.
Morsomme P, Boutry M (2000) The plant plasma membrane H+-ATPase: structure, function
and regulation. Biochim Biophys Acta-Biomembr 1465: 1-16. doi: 10.1016/s0005-
2736(00)00128-0.
Murashige T, Skoog F (1962) A revised medium for rapid growth and bio assays with tobacco
tissue cultures. Physiologia plantarum 15: 473-497. doi: 10.1111/j.1399-
3054.1962.tb08052.x.
Murphy A, Peer WA, Taiz L (2000) Regulation of auxin transport by aminopeptidases and
endogenous flavonoids. Planta 211: 315-324. doi: 10.1007/s004250000300.
Nardi S, Carletti P, Pizzeghello D, Muscolo A (2009) Biological activities of humic
substances. In: PM Huang, N Senesi (eds) Biophysico-Chemical Processes in
Environmental Systems. John Wiley & Sons, Hoboken, USA.
Nardi S, Ertani A, Francioso O (2017) Soil‐root cross‐talking: The role of humic substances.
Journal of Plant Nutrition and Soil Science.
Nardi S, Muscolo A, Vaccaro S, Baiano S, Spaccini R, Piccolo A (2007) Relationship between
molecular characteristics of soil humic fractions and glycolytic pathway and krebs
cycle in maize seedlings. Soil Biol Biochem 39: 3138-3146. doi:
10.1016/j.soilbio.2007.07.006.
Nardi S, Pizzeghello D, Gessa C, Ferrarese L, Trainotti L, Casadoro G (2000) A low molecular
weight humic fraction on nitrate uptake and protein synthesis in maize seedlings. Soil
Biology and Biochemistry 32: 415-419.

118
Nardi S, Pizzeghello D, Muscolo A, Vianello A (2002) Physiological effects of humic
substances on higher plants. Soil Biology & Biochemistry 34: 1527-1536.
Olaetxea M, Mora V, Bacaicoa E, Garnica M, Fuentes M, Casanova E, Zamarreno AM, Iriarte
JC, Etayo D, Ederra I, Gonzalo R, Baigorri R, Garcia-Mina JM (2015) Abscisic Acid
Regulation of Root Hydraulic Conductivity and Aquaporin Gene Expression Is Crucial
to the Plant Shoot Growth Enhancement Caused by Rhizosphere Humic Acids. Plant
Physiology 169: 2587-2596. doi: 10.1104/pp.15.00596.
Overvoorde P, Fukaki H, Beeckman T (2010) Auxin control of root development. Cold Spring
Harbor Perspectives in Biology 2. doi: 10.1101/cshperspect.a001537.
Piccolo A (1996) Chapter 5 - Humus and Soil Conservation. Humic Substances in Terrestrial
Ecosystems. Elsevier Science B.V., Amsterdam.
Piccolo A (2001) The supramolecular structure of humic substances. Soil Science 166: 810-
832.
Piccolo A, Nardi S, Concheri G (1992) Structural characteristics of humic substances as related
to nitrate uptake and growth regulation in plant systems. Soil Biology and Biochemistry
24: 373-380.
Piccolo A, Spiteller M (2003) Electrospray ionization mass spectrometry of terrestrial humic
substances and their size fractions. Analytical and bioanalytical chemistry 377: 1047-
1059.
Pizzeghello D, Cocco S, Francioso O, Ferrari E, Cardinali A, Nardi S, Agnelli A, Corti G
(2015) Snow vole (Chionomys nivalis Martins) affects the redistribution of soil organic
matter and hormone‐like activity in the alpine ecosystem: ecological implications.
Ecology and evolution 5: 4542-4554. doi: 10.1002/ece3.1727.
Pratelli R, Pilot G (2014) Regulation of amino acid metabolic enzymes and transporters in
plants. Journal of Experimental Botany 65: 5535-5556. doi: 10.1093/jxb/eru320.
Quaggiotti S, Ruperti B, Pizzeghello D, Francioso O, Tugnoli V, Nardi S (2004) Effect of low
molecular size humic substances on nitrate uptake and expression of genes involved in
nitrate transport in maize (Zea mays L.). Journal of Experimental Botany 55: 803-813.
doi: 10.1093/jxb/erh085.
Quint M, Gray WM (2006) Auxin signaling. Current Opinion in Plant Biology 9: 448-453. doi:
10.1016/j.pbi.2006.07.006.
119
Ren S, Hinzman AA, Kang EL, Szczesniak RD, Lu LJ (2015) Computational and statistical
analysis of metabolomics data. Metabolomics 11: 1492-1513. doi: 10.1007/s11306-
015-0823-6.
Rennie EA, Scheller HV (2014) Xylan biosynthesis. Current Opinion in Biotechnology 26:
100-107. doi: 10.1016/j.copbio.2013.11.013.
Rolland F, Baena-Gonzalez E, Sheen J (2006) Sugar sensing and signaling in plants:
Conserved and novel mechanisms. Annual Review of Plant Biology.
Rose MT, Patti AF, Little KR, Brown AL, Jackson WR, Cavagnaro TR (2014) A meta-analysis
and review of plant-growth response to humic substances: practical implications for
agriculture. In: DL Sparks (ed) Advances in Agronomy, Vol 124. Elsevier Academic
Press Inc, San Diego.
Salma I, Mészáros T, Maenhaut W, Vass E, Majer Z (2010) Chirality and the origin of
atmospheric humic-like substances. Atmos Chem Phys 10: 1315-1327. doi:
10.5194/acp-10-1315-2010.
Simpson AJ, Burdon J, Graham CL, Hayes MHB, Spencer N, Kingery WL (2001)
Interpretation of heteronuclear and multidimensional NMR spectroscopy of humic
substances. European Journal of Soil Science 52: 495-509. doi: 10.1046/j.1365-
2389.2001.00402.x.
Suzuki H, Xia YJ, Cameron R, Shadle G, Blount J, Lamb C, Dixon RA (2004) Signals for
local and systemic responses of plants to pathogen attack. Journal of Experimental
Botany 55: 169-179. doi: 10.1093/jxb/erh025.
Tinti A, Tugnoli V, Bonora S, Francioso O (2015) Recent applications of vibrational mid-
Infrared (IR) spectroscopy for studying soil components: a review. Journal of Central
European Agriculture 16.
Trevisan S, Botton A, Vaccaro S, Vezzaro A, Quaggiotti S, Nardi S (2011) Humic substances
affect Arabidopsis physiology by altering the expression of genes involved in primary
metabolism, growth and development. Environ Exp Bot 74: 45-55. doi:
10.1016/j.envexpbot.2011.04.017.
Trevisan S, Pizzeghello D, Ruperti B, Francioso O, Sassi A, Palme K, Quaggiotti S, Nardi S
(2010) Humic substances induce lateral root formation and expression of the early
auxin-responsive IAA19 gene and DR5 synthetic element in Arabidopsis. Plant biology
(Stuttgart, Germany) 12: 604-614. doi: 10.1111/j.1438-8677.2009.00248.x.

120
Trouvelot S, Heloir MC, Poinssot B, Gauthier A, Paris F, Guillier C, Combier M, Trda L,
Daire X, Adrian M (2014) Carbohydrates in plant immunity and plant protection : roles
and potential application as foliar sprays. Front Plant Sci 5. doi:
10.3389/fpls.2014.00592.
Vaccaro S, Ertani A, Nebbioso A, Muscolo A, Quaggiotti S, Piccolo A, Nardi S (2015) Humic
substances stimulate maize nitrogen assimilation and amino acid metabolism at
physiological and molecular level. Chemical and Biological Technologies in
Agriculture 2. doi: 10.1186/s40538-015-0033-5.
Winter H, Huber SC (2000) Regulation of sucrose metabolism in higher plants: localization
and regulation of activity of key enzymes. Critical Reviews in Plant Sciences 19: 31-67.
doi: 10.1080/07352680091139178.
Yanes O, Tautenhahn R, Patti GJ, Siuzdak G (2011) Expanding coverage of the metabolome
for global metabolite profiling. Analytical chemistry 83: 2152-2161. doi:
10.1021/ac102981k.
Zandonadi D, Canellas L, Façanha A (2007) Indolacetic and humic acids induce lateral root
development through a concerted plasmalemma and tonoplast H+ pumps activation.
Planta 225: 1583-1595.
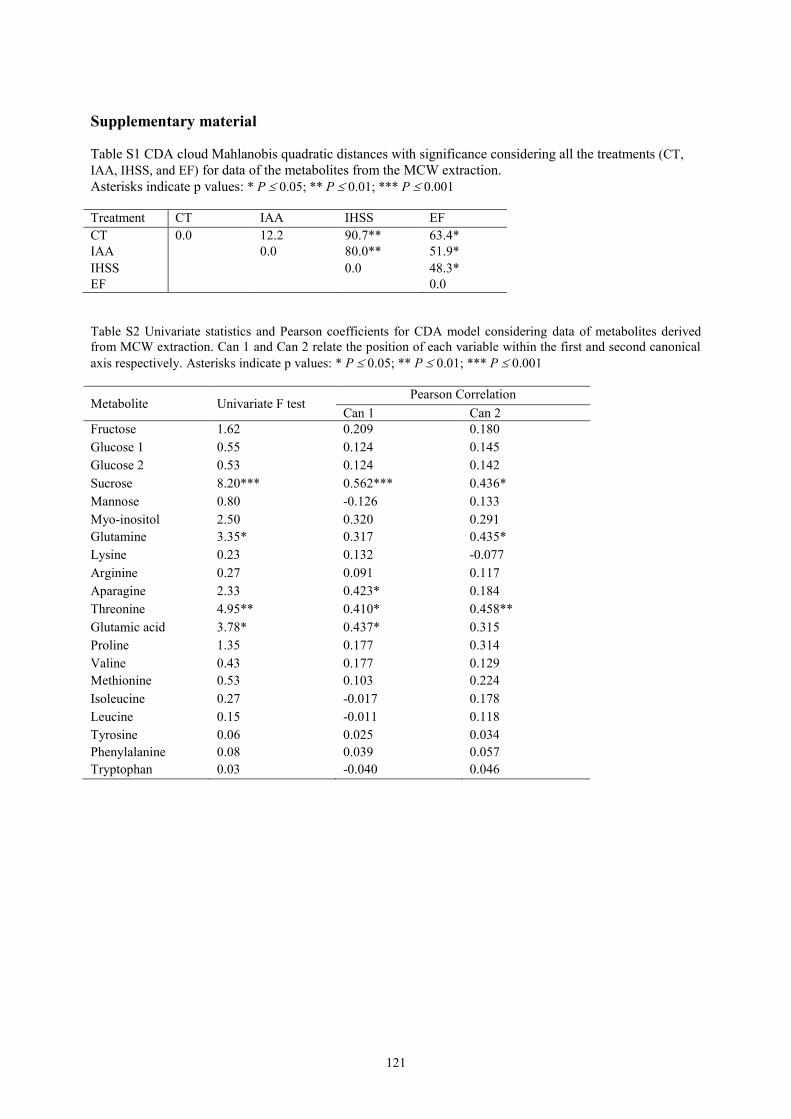
121
Supplementary material
Table S1 CDA cloud Mahlanobis quadratic distances with significance considering all the treatments (CT,
IAA, IHSS, and EF) for data of the metabolites from the MCW extraction.
Asterisks indicate p values: * P 0.05; ** P 0.01; *** P 0.001
Treatment CT IAA IHSS EF
CT 0.0 12.2 90.7** 63.4*
IAA 0.0 80.0** 51.9*
IHSS 0.0 48.3*
EF 0.0
Table S2 Univariate statistics and Pearson coefficients for CDA model considering data of metabolites derived
from MCW extraction. Can 1 and Can 2 relate the position of each variable within the first and second canonical
axis respectively. Asterisks indicate p values: * P 0.05; ** P 0.01; *** P 0.001
Metabolite Univariate F test Pearson Correlation
Can 1 Can 2
Fructose 1.62 0.209 0.180
Glucose 1 0.55 0.124 0.145
Glucose 2 0.53 0.124 0.142
Sucrose 8.20*** 0.562*** 0.436*
Mannose 0.80 -0.126 0.133
Myo-inositol 2.50 0.320 0.291
Glutamine 3.35* 0.317 0.435*
Lysine 0.23 0.132 -0.077
Arginine 0.27 0.091 0.117
Aparagine 2.33 0.423* 0.184
Threonine 4.95** 0.410* 0.458**
Glutamic acid 3.78* 0.437* 0.315
Proline 1.35 0.177 0.314
Valine 0.43 0.177 0.129
Methionine 0.53 0.103 0.224
Isoleucine 0.27 -0.017 0.178
Leucine 0.15 -0.011 0.118
Tyrosine 0.06 0.025 0.034
Phenylalanine 0.08 0.039 0.057
Tryptophan 0.03 -0.040 0.046

122
Table S3 CDA clouds Mahlanobis quadratic distances with significance considering all the treatments (CT, IAA,
IHSS, and EF) for amino acids derived from proteins hydrolysis.
Asterisks indicate p values: * P 0.05; ** P 0.01; *** P 0.001
Treatment CT IAA IHSS EF
CT 0.0 11.4 36.4*** 41.5***
IAA 0.0 14.5* 16.9*
IHSS 0.0 3.0
EF 0.0
Table S4 Univariate statistics and Pearson coefficients for CDA model considering data of the amino acids
derived from proteins hydrolysis. Can 1 and Can 2 relate the position of each variable within the first and second
canonical axis respectively. Asterisks indicate p values: * P 0.05; ** P 0.01; *** P 0.001
Amino acid Univariate F test Perason Correlation
Can 1 Can 2
Lysine 0.79 0.282 -0.132
Arginine 8.41*** 0.715*** -0.113
Glycine 4.52* -0.531*** 0.393*
Serine 4.93** -0.625*** 0.002
Alanine 6.89** -0.692*** -0.035
Aspartic acid 1.61 0.379* -0.020
Threonine 0.09 0.086 -0.025
Proline 5.25** 0.309*** 0.205
Valine 2.26 0.441* -0.152
Isoleucine 1.98 0.414* -0.147
Leucine 1.91 0.434* 0.026
Phenylalanine 3.57* 0.540** -0.033
Glutamic acid 4.67** -0.588*** -0.247

123
5 Manuscript III
Biostimulant activity of humic substances extracted from leonardites
Giovanni Battista Conselvana, Diego Pizzeghello
a*, Ornella Francioso
b, Michele Di Foggia
c,
Serenella Nardia, Paolo Carletti
a
a Dipartimento di Agronomia, Animali, Alimenti, Risorse Naturali e Ambiente (DAFNAE),
Università di Padova, Viale dell’Università 16, 35020 Legnaro (Padova), Italy
b Dipartimento di Scienze Agrarie, Università di Bologna, Viale Fanin 44, 40127 Bologna,
Italy
c Dipartimento di Scienze Biomediche e Neuromotorie, Università di Bologna, Via Belmeloro
8/2, 40126 Bologna, Italy
*Corresponding author: [email protected]; Tel.: +39-049-827-2915
Plant and Soil

124
Abstract
Background and aims Biostimulants are natural compounds that enhance plant growth and
plant nutrient use efficiency. In this study, biostimulant effects of humic substances (HS)
extracted from leonardites were analysed on the metabolism of maize plants grown in
hydroponic conditions.
Methods HS extracted from four leonardites were tested for their auxin-like and gibberellin-
like activities. Then, 11 day old maize seedlings were treated for 48 h with five concentrations
(0, 0.1, 0.5, 1, and 10 mg C L-1
) of HS. After sampling, root growth and morphology,
glutamine synthetase (GS) activity, glutamate synthase (GOGAT) activity, total protein
content, soluble sugars content, phenylalanine ammonia-lyase (PAL) activity, soluble phenols,
and free phenolic acids were analysed.
Results HS from leonardites had similar spectroscopic pattern, with small differences. The HS
from the South Dakota lignite (HS_USA) had more carboxylic groups, whereas the three from
Turkish mines had more aromatic and aliphatic structures. HS_USA best enhanced total root
growth, root surface area, and proliferation of secondary roots. Plant nutrient use efficiency
was enhanced by HS_4, HS_USA and HS_B, with increment of GS and GOGAT enzymes
activity and total protein production. HS stimulated also PAL enzyme activity, followed by a
higher production of total soluble phenols, p-hydroxybenzoic acid, p-coumarilic acid, and
chlorogenic acid.
Conclusion This study found that, although the activity of the HS depended on the origin of the
leonardite, these compounds can be attributed to the biostimulant products, eliciting plant
growth, nitrogen metabolism, and accumulation of phenolic substances.
Keywords
Humic substances, leonardite, biostimulant, glutamine synthetase, glutamate synthase,
phenylalanine ammonia-lyase, FT-IR.

125
Introduction
The development of sustainable and environmentally friendly agricultural systems represents a
major policy challenge in many countries (Povero et al. 2016). In the last two decades, farming
expectations have changed and farmers are expected to produce food, whilst protecting
biodiversity, soil, air and water quality (OECD 2013). Although fertilizers are powerful tools
for increasing yield and plant health (Hirel et al. 2001), farmers must optimize product
application to avoid nutrient pollution and to preserve the economic margin.
One of the most promising solutions to achieve these goals is the use of plant biostimulants. In
2012 Europe has become a leading market for biostimulants, while the biostimulants global
market is expected to grow over the next years, reaching $2,524.02 million in sales by 2019,
with an annual growth rate of 12.5% (Calvo et al. 2014; Povero et al. 2016).
Biostimulants are compounds containing substances and microorganisms able to enhance plant
nutrient uptake, nutrient efficiency, tolerance to abiotic/biotic stresses, and crop quality
(European Biostimulant Industry Council 2013). Furthermore, when applied to the soil,
biostimulants may stimulate rhizosphere microbes and soil enzymes, the photosynthetic
process, and the production of hormones or growth regulators in plants (Calvo et al. 2014).
Biostimulants are considered as borderline substances between plant protection products and
fertilizers, as they do not give direct protection against pest and do not have nutritional activity
(La Torre et al. 2016). For this reason, there is not yet a legal definition of biostimulants (du
Jardin 2015). Despite this, international organizations and scientists recognized six main
categories: microorganisms, protein hydrolysates, seaweed extracts, chitosan, inorganic
compounds and humic substances (HS) (Calvo et al. 2014; du Jardin 2015; European
Biostimulant Industry Council 2016).
Among these categories, HS or humates have a positive effect on the uptake of macro and
micro nutrients that considerably improve the metabolism, the growth and yields of relevant
agricultural crops (Bronick and Lal 2005; Ferreras et al. 2006; Nardi et al. 2009; Puglisi et al.
2009). The positive effects of HS on plant metabolism are well recognized as hormone-like
activity (auxin, gibberellin or cytokine-like activity) in terms of changes in root architecture
through the lateral roots and root hair production (Canellas et al. 2011; Mora et al. 2012;
Pizzeghello et al. 2013; Trevisan et al. 2010b). HS increase root plasma membrane H+-ATPase
activity, enhancing nitrate and other nutrient uptake, contributing to cell wall loosening, cell

126
enlargement and organ growth (Jindo et al. 2012; Zandonadi et al. 2007). Moreover, TCA
cycle, phenylpropanoid metabolism, and uptake and metabolism of nitrate have been found to
be positively influenced by treatment with HS (Quaggiotti et al. 2004; Vaccaro et al. 2009).
However, HS effects on plant growth cannot be overgeneralized due to their different origin
(e.g. from volcanic soil, compost, vermicompost or brown coal), dosage (differs from types
culture media) as well as plant species (Nardi et al. 2009; Rose et al. 2014).
Leonardite is an oxidized form of lignite with a medium-brown coal-like appearance. It is
found at shallow depth over more compact coal in various coal mines (Stevenson 1979) around
the world, mainly in the USA (Fernandez et al. 1996). This brown coal, particularly enriched in
humic C (30-80%), is used to manufacture a wide range of commercial HS products.
Akinremi et al. (2000) demonstrated that leonardite increased dry matter yield and nutrient
uptake (N, P, K, and S) when applied to canola. In greenhouse conditions, HS from leonardites
enhanced the resistance of tomato plants under salinity stress (Casierra-Posada et al. 2009).
Arnica montana L. treated with HS from leonardite had higher floral stems’ number, flower
heads’ number, and yield compared to control plants (Sugier et al. 2013). A low molecular
weight fraction of HS from leonardite enhanced the seedling’s, root surface area, root length,
and total root number of snap bean (Qian et al. 2015). David et al. (2014) demonstrated that
potassium humate salts extracted from lignite, and potassium humate regenerated from lignite
with two oxidizing agents (nitric acid and hydrogen peroxide), positively influenced root
growth and division, starch and protein contents in treated Zea mays seedlings.
Leonardite is thus referred to as a benchmark humic material with respect to responses on plant
growth. Although the effects of leonardite on crop production, resistance to stress, and soil
microbial activity have already been reported, much less attention has been devoted to their
impact on plant physiology and biochemistry (Bulgari et al. 2015). Moreover, comparison of
leonardite from different sources and the growth effects of these differently sourced materials
are scarse in the literature. This study seeks to gain a better understanding of the importance of
leonardite origin on their biological activity.
HS extracted from four leonardites were characterized by FT-IR. The effects of these HS on
Zea mays plants grown under controlled conditions were studied by evaluating: (1) roots
growth parameters like total root length, area, diameter, thin roots length, and number of tips
and forks; (2) the responses of enzymes involved in nitrogen and phenylpropanoid metabolism,
(3) proteins, sugars, and total phenols content in roots and leaves.

127
Materials and Methods
Leonardites origin and humic substances extraction
Leonardites have been supplied by LandLab srl (Quinto Vicentino, Vicenza, Italy). The
leonardite named LE_USA are from South Dakota mines, while the others, LETU_4, LE_A,
and LE_B are from Turkish mines.
Humic substances were extracted from the four leonardites (LE_USA; LETU_4; LE_A; LE_B)
with 0.1M KOH (1:10 w/v) at 130 rpm for 16 h at 50 °C. The extracts were centrifuged at 7000
rpm for 30 min, and filtered on Whatman filter N. 2 paper (Whatman, Boston, USA). Humic
extract was desalted by using 14 kDa cut-off dialysis Visking (Medicell, London, UK) tubing
with distilled water. Distilled water was changed daily until neutral pH was reached.
Subsequently, the extracts were desalted on ion exchange Amberlite IR-120 (H+ form)
(Stevenson 1994). 20 ml of humic extracts were freeze-dried for IR, CNS, and ash content
determination and the remaining extracts were kept frozen for use on plant treatments.
Humic carbon content of the extracts in each step of the extraction was determined in triplicate
by following a modified version of the method of Walkley and Black (1934). Humic
substances (HS) were labelled as HS_USA, HS_4, HS_A, and HS_B.
Chemical and FTIR characterization
The ash content of leonardites and humic substances was determined gravimetrically after dry
combustion in a muffle furnace at 550 °C for 6 h. The moisture content was determined at 105
°C. The pH was measured potentiometrically on pulverized samples by adding deionized water
(1:2.5 w/v, dry weight basis). The electrical conductivity (EC) for leonardites only, was
potentiometrically determined after water extraction (2:5 w/v) and filtration through Whatman
filter N. 2 paper.
Total C, N, and S contents were measured in triplicate on each sample by using CNS (Carbon,
Nitrogen and Sulphur) Vario Macro elemental analyzer (Elementar, Hanau, Germany).
IR spectra were recorded with a Bruker ALFA FT-IR Spectrophotometer (Bruker, Ettlingen,
Germany) equipped with a single reflection ATR sampling module. The spectra were collected
from 4000 to 400 cm-1
and averaged over 64 scans (resolution 4 cm-1
). The spectral data were
processed with Grams/386 spectroscopic software (Galactic Industries, Salem, NH, USA).

128
Curve-fitting analysis in the region between 1900-900 cm-1
was used to determine the area
under each of the individual bands by using Grams/386 spectroscopic software (version 6.00,
Galactic Industries Corporation, Salem, NH).
Bioassay to test the biological activity of HS from leonardites
The biological activity of HS_USA, HS_4, HS_A, and HS_B was assessed by checking the
growth reduction of watercress (Lepidum sativum L.) roots and the increase of the length of
lettuce (Lactuca sativa L.) shoots (Audus 1972).
Watercress and lettuce seeds were surface-sterilized by immersion in 8% hydrogen peroxide
(Sigma, St. Louis, MO) for 15 minutes. After rinsing 5 times with sterile distilled water, 20
seeds were aseptically placed on filter paper in a Petri dish. For watercress, the filter paper was
wetted with 1.2 mL of H2O (control); or 1.2 mL of 0.1, 1, 10, and 20 mg L-1
indole-3-acetic
acid (IAA) (Sigma, St. Louis, MO) to obtain the calibration curve; or 1.2 mL of a serial
dilution (10 mg C L-1
, 1 mg C L-1
, 0.1 mg C L-1
, 0.001 mg C L-1
, and 0.00001 mg C L-1
) of the
HS. For lettuce, the experimental design was the same as for watercress, except that the sterile
filter paper was wetted with 1.4 mL of the above HS (dilutions 10 mg C L-1
, 1 mg C L-1
, 0.1
mg C L-1
, 0.001 mg C L-1
, and 0.00001 mg C L-1
) and the calibration curve was a serial
dilution of 0, 0.01, 0.1, and 10 mg L-1
gibberellic acid (GA) (Sigma).
The seeds were germinated in the dark at 25 °C. After 48 h for watercress and 72 h for lettuce,
the seedlings were removed and the root or shoot lengths were measured.
A linear regression model (Y = a + bX) was applied to describe the dose-response relationship.
In the case of IAA, GA and HS doses a mathematical transformation to log(x) (where x is the
original dose value) was needed before regression analysis (Pizzeghello et al. 2013).
Plant material and growth conditions
Plant material was grown as reported in Carletti et al. (2008). Seeds of Zea mays L. (var. DKC
5401, DeKalb, Italy) were soaked in distilled water for one night. Seeds were left to germinate
on filter paper wetted with 1 mM CaSO4 for 60 h in the dark at 25 °C. Germinated seedlings
were transplanted into 3 L beakers containing an aerated Hoagland solution (Hoagland and
Arnon 1950) with a density of 24 plants per beaker.
The nutrient solution was renewed every 48 h and had the following composition: 40 μM
KH2PO4, 200 μM Ca(NO3)2, 200 μM KNO3, 200 μM MgSO4,10 μM FeNaEDTA, 4.68 μM

129
H3BO3, 0.036 μM CuCl2 · 2H2O, 0.9 μM MnCl2 · 4H2O, 0.086 μM ZnCl2, 0.011 μM NaMoO ·
2H2O.
Plants were grown in a climate chamber with 11 h of light per day, air temperature between 21
and 27 °C, relative humidity of 70/85%, photon flux density of 280 mol m-2
s-1
. Nine days after
transplanting, HS_USA, HS_4, HS_A, and HS_B were added to the nutrient solution contained
in the beakers at different concentrations: 0 (control), 0.1, 0.5, 1 and 10 mg C L-1
. Each
concentration was replicated 3 times. The addition of the products to the nutrient solution was
performed only once. After 48 h, plants were randomly harvested, fresh samples of roots and
leaves were carefully washed and dried with blotting paper, and weighted (data not shown).
The treatment period was chosen according to previous experience on studies of HS from
various origins and their related biostimulant activity (Ertani et al. 2011; Quaggiotti et al.
2004).
A subsample of the plant material was immediately frozen with liquid nitrogen and kept at -80
°C for physiological analyses. Dry weight measurement was performed in triplicate for each
treatment using aliquots of approximately 1 g plant fresh tissue.
For each beaker roots and leaves were weighed. The samples were placed in a drying oven for
2 days at 70 °C and allowed to cool for 2 h inside a closed bell jar. The dry weight was
measured per plant (data not shown).
Root scanning
Root scanning was rapidly performed before the sampling process using an Epson Expression
10000XL 1.0 system (Regent Instruments Company, Canada) as reported in Ding et al. (2014).
Three plants for each beaker were randomly picked for root scanning, for a total of 9 plants for
each measurement. The following parameters were recorded with a root image analysis system
using the image analysis software WinRHIZO Pro (Regent Instruments, QC, Canada): root
total length (TRL) (cm), surface area (cm2), average diameter (mm), number of tips, and length
of fine roots (cm) (0 < L < 0.5).
Protein extraction and determination
Fresh leaf and root samples were ground to a homogenous powder in liquid nitrogen (N2).
Proteins were extracted with 38 mM KH2PO4 and 62 mM K2HPO4 buffer at a pH 7. The
protein concentration in the extract was determined according to Bradford (1976), using a

130
Jasco V-530 UV/vis spectrophotometer (Jasco Corporation, Tokyo, Japan) at 595 nm. The
protein concentration was expressed as mg of protein per g of fresh root or leaf.
Enzyme extraction and essay conditions
To extract the enzymes involved in N reduction and assimilation, fresh leaves and roots were
ground to a homogenous powder in liquid N2. For the extraction of the enzymes two different
buffers were used. Each activity essay was done in triplicate.
Glutamine synthetase (GS; EC 6.3.1.2) was extracted by homogenising 0.6 g of ground roots
or leaves with 2.4 mL of a 1 mM Tris(hydroxymethyl)aminomethane HCl (Tris-HCl), 25 mM
KH2PO4, 10 mM L-cysteine hydrochloride monohydrate, 3 % (w/v) bovine serum albumin
solution, at 4 °C at pH 7.8 (Baglieri et al. 2014). After 10 minutes, the extract was filtered
through three layers of muslin and centrifuged at 15000 g for 25 min at 4 °C. 200 L of
supernatant was incubated with 200 L of reaction buffer (50 mM Tris-HCl, 20 mM MgSO4,
80 mM L-glutamate, 30 mM NH2OH, 24mM ATP; pH 7.8) at 37 °C for 25 minutes. The
reaction was stopped with stopping solution (370 mM FeCl2 · 6H2O and 670 mM HCl).
Samples were centrifuged at 15000 g for 15 minutes. The amount of -glutamyl hydroxamate
in the supernatant was photometrically (540 nm) determined against an immediately stopped
parallel sample (Jezek et al. 2015). A standard curve was made using -glutamyl hydroxamate
(GHA) (Sigma). The enzyme activity was expressed as mol of GHA produced per g of fresh
root or leaf per minute.
Glutamate synthase (GOGAT; EC 1.4.7.1) was extracted by homogenizing 0.5 g of ground
roots or leaves with 2 mL of a 100 mM Tris-HCl at pH 8.2, 10 mM MgCl2 · 6H2O, 2 mM -
mercaptoethanol, 10 % (v/v) glycerol and 1 mM Na2EDTA solution. After 15 minutes, the
extract was filtered through two layers of muslin and centrifuged at 15000 g for 30 minutes at 4
°C. The supernatant was centrifuged a second time at 15000 g for 15 minutes at 4 °C. For the
enzymatic essay, 100 L of extract were added to 900 L of reaction buffer (41.6 mM HEPES
at pH 7.5, 1 mM NADH, 10 mM EDTA, 20 mM glutamine) and 300 L (for leaf extract) or
900 L (for root extract) of 10 mM -ketoglutaric acid. GOGAT was assayed
spectrophotometrically by monitoring NADH oxidation at 340 nm according to Avila et al.
(1987). GOGAT activity was expressed as nmol NADH reduced per g of fresh root or leaf per
minute.
For the phenylalanine ammonia-lyase (PAL; EC 4.3.1.5) essay, 1 g of ground leaves were

131
homogenized with 0.1 g of poly(vinylpolypyrrolidone) (PVPP) and 5 mL of 100 mM
potassium phosphate buffer (pH 8.0) containing 1.4 mM -mercaptoethanol. After 10 minutes,
the extract was filtered through two layers of muslin and centrifuged at 15000 g for 20 minutes
at 4 °C. 60 L of supernatant was incubated with 400 L of 100 mM Tris-HCl buffer (pH 8.8),
140 L of 100 mM phosphate buffer and 200 L of 40 mM phenylalanine at 37 °C for 30
minutes. The reaction was stopped with 200 L 6 M HCl (El-Shora 2002). After centrifuging
at 10000 g for 15 minutes, the absorbance of the supernatant was measured at 280 nm against
an immediately stopped parallel sample. A standard curve was made using cinnamic acid
(Sigma). PAL activity was expressed as nmol cinnamic acid produced per mg protein per
minute.
Extraction and measurement of soluble phenols
Soluble phenolic acids were extracted by homogenizing 200 mg of crushed leaves with 600
mL of pure methanol. The extract was maintained in ice for 30 minutes and centrifuged at
15000 g for 30 minutes at 4 °C. Total phenols were measured according to Arnaldos et al.
(2001). 1 mL of 2% Na2CO3 and 75 μL of Folin-Ciocalteau reagent (Sigma-Aldrich) were
added to 50 μL of phenolic extract. After 15 minutes of incubation at 25 °C in the dark, the
absorbance was measured at 725 nm. A standard curve was made by using gallic acid (Sigma).
The soluble phenols content was expressed as mg of gallic acid equivalent (GAE) per g of
fresh leaf.
Quantitative determination of free phenolic acids by HPLC
Leaves (5 g) were homogenized in methanol (20 mL) with an Ultra Turrax T25 dispenser at
13500 rpm for 30 seconds until uniform consistency. Samples were filtered the first time
through a filter paper (589 Schleicher) and a then through cellulose acetate syringe filters (0.45
mm). The extract was then ready for HPLC analysis.
The liquid chromatography system was a Jasco X-LC system consisting of a PU-2080 pump, a
MD-2015 multi-wavelength detector, a AS-2055 autosampler, and a CO-2060 column oven.
The separation of phenolic acids was carried out on a Tracer Extrasil ODS2 column (5 m, 250
x 4.6 mm, Teknokroma) operating at 35 °C. The flow rate was set to 1 mL min-1
. The mobile
phase consisted of water (0.1% formic acid)(A) and methanol (0.1% formic acid) (B). The
gradient elution was as follows: 25–70% B over 15 minutes and 70–100% B over 5 minutes to

132
clean the column. Chlorogenic acid, ferulic acid, p-coumaric acid, caffeic acid, and gallic acid
were quantified using an HPLC diode array detector (DAD)at 325 nm. Identification of p-
coumaric acid was performed at 310 nm. ChromNAV chromatography data system was used
as software.. All standards were dissolved in methanol and the calibration curves were
generated with concentrations ranging from 0.3 mg L-1
to 30 mg L-1
(Nicoletto et al. 2013).
Quantitative determination of sugars by HPLC
The liquid chromatography used in these analyses was the same reported above. The separation
of sugars was achieved on a HyperRez XP Carbohydrate Pb++
analytical column (8 m, 300 x
7.7 mm, ThermoScientific), operating at 80 °C. Isocratic elution was made using water at a
flow rate of 0.6 mL min-1
. Standards of -D-glucose, -D-fructose, and sucrose were dissolved
in water and the calibration curves were generated with concentrations ranging from 100 mg L-
1 to 1000 mg L
-1 (Nicoletto et al. 2013).
Statistical analysis
The data represent the means of measurements from three different beakers per treatment. For
each measurement, the average standard error is reported. Analysis of variance (two-way
ANOVA) was performed using the SPSS 23 (IBM Corp) software with leonardite type and
concentration as factors, and was followed by pairwise post hoc analyses (Student-Newman
Keuls test) to determine which means differed significantly at P 0.05. Levene and Mauchly’s
tests were applied to check homoscedasticity and sphericity, respectively, to ensure that
assumptions of the model were met as recommended in Field (2013).
For each analytical parameter, linear and logarithmic regressions were also performed using
SPSS 23 software with concentrations of HS as independent variable to evaluate the presence
of dose-response curves.

133
Results
Chemical characterization
The main chemical characteristics for each leonardite are displayed in Table 1. The pH ranged
from alkaline for LE_USA to acid for LETU_4, LE_A, and LE_B. It is interesting to note that
the EC was high in LE_USA and low in LETU_4. LE_USA had high C, N, and S content
while LETU_4 had a high mineral content.
Characteristics of HS are shown in Table 2. HS had similar pH values as a consequence of
Amberlite IR-120 treatment. HS_4 had the highest C content (50.48%), whereas HS_USA had
the highest S content (5.63%).

134
Table 1 Physical and chemical parameters of leonardites from different origin. Data are mean SE, n=3
Treatment [H+]
pH
EC
(μS cm-1
)
C*
(g kg-1
)
N
(g kg-1
)
S
(g kg-1
)
DW
(%)
Moisture
(%)
Ash**
(%)
LE_USA 8.57±0.05 1400±58 29.81±0.51 3.39±0.15 6.69±0.12 90.00±0.14 10.00±0.14 62.29±0.64
LETU_4 5.29±0.03 128±5 17.84±0.45 0.38±0.02 1.37±0.23 92.55±3.84 7.45±0.86 73.76±1.13
LE_A 3.81±0.05 1002±21 16.04±1.10 0.55±0.04 1.07±0.31 81.00±0.40 19.00±0.40 66.69±0.85
LE_B 3.85±0.04 906±11 17.35±0.64 0.56±0.05 1.02±0.15 81.14±0.37 18.86±0.37 66.94±1.23
EC = Electrical Conductivity
DW = Dry Weight
* = g kg-1
of DW** = % of DW
Table 2 Elemental analysis and pH of humic substances extracted from leonardites. Data are mean SE, n=3
Treatment [H+]
pH*
C**
(g kg-1
)
N
(g kg-1
)
S
(g kg-1
)
HS_USA 2.35±0.01 45.16±0.31 1.06±0.09 5.63±0.52
HS_4 2.64±0.04 50.48±0.15 1.38±0.13 2.86±0.38
HS_A 2.63±0.03 46.94±0.23 1.72±0.27 1.35±0.29
HS_B 2.58±0.01 47.95±0.17 1.76±0.02 1.51±0.41
* = pH measured after amberlite purification of the extract
** = g kg-1
of DW

135
FTIR characterization
The main functional groups of HS_USA, HS_4, HS_A, and HS_B are displayed in Fig. 1. In
all spectra there are vibrational bands which are assigned to the same functional groups such as
the broad band from 4000 to 3000 cm-1
arises from (O–H) stretching vibration. The shape of
this region suggests that the O-H groups formed several hydrogen bonds. The broad shoulder
in the 2700-2400 cm-1
region is undoubtedly due to OH stretching of intermolecular hydrogen
bonding in carboxylic acids or alcohols (Rao, 1963). The presence of peaks at around 1700 and
1220 cm−1
might be due to C=O and C–O stretching motions of carboxylic acids. The peaks
appearing at 2910 and 2852 cm-1
toghether with those at around 1420 and 1370 cm-1
are due to
(C-H) stretching and bending motions in aliphatic substances respectively. The strong band at
around 1580 cm−1
is highly characteristic of aromatic rings skeletal vibration (Bellamy, 1975).
Since the position and intensity of this band are dependent on the type of substitution, the
conjugation with C=C or C=O should justify the great intensification of this band in all spectra.
Other bands that can be useful in identifying the aromatic compounds are the C-H stretching
motion at around 3100-3000 cm-1
and the C-H out of plane deformation between 900 cm-1
and
650 cm-1
. The variable intensity of the bands at around 1030 cm-1
, 520 cm-1
and 463 cm-1
may
be due to mineral impurities.
Deconvolution fitting procedure on the pattern of HS from different leonardites gave eight
Gaussian curve centered at 1700, 1580, 1420, 1210, 1130, 1030, 917 cm-1
(Fig. 2). The
percentage area for each band considerably changed in relation to different leonardite origin. In
particular, the content of COOH (1700 cm-1
) linked to aromatic rings (Bellamy, 1975) was
higher in HS_USA and progressively decreased in others. In contrast, the aromatic C=C
skeletal stretching (1580 cm-1
) gradually increased from HS_USA to HS_B. The considerable
intensification of this band in HS_A and HS_B might suggest the presence of different polar
substituents in the aromatic ring (Bellamy, 1975). As well as the coupled C-O stretching and
OH in plane deformation modes (1210 cm-1
), which are typical in aryl acids and phenols
(Bellamy. 1975), was highest in HS_A and HS_B. At lower frequencies, the C–O and C-C
(1130 cm-1
) were only present in HS_USA and HS_4, with highest amount in HS_4. The C-O-
C stretching in ethers (1030 cm-1
) appeared in all samples but the lowest percentage was
detected in HS_4. Finally, the coupled C-OH bending out of plane and CH bending (917 cm-1
)
was considerably higher in USA.

136
Fig. 1 FT-IR spectra of HS extracted from leonardites (HS_USA, HS_4, HS_A, and HS_B).
Fig. 2 Histograms of HS of the ATR/FTIR peak areas processed by Gaussian curve fitting.

137
Bioassay to test the biological activity
IAA concentration in growth media inhibited the elongation of watercress roots in a dose-
dependent response (P ≤ 0.001) (Table 3). In a similar way, the increasing concentrations of
HS_USA, USA_4, and HS_A caused significant decreases of watercress roots elongation. In
all cases, a logarithmic model explained the best fit of our data (R2 = 98–99%, P ≤ 0.05). Only
in HS_B there was not a significant dose-dependent response. The b value coefficient was used
to compare the auxin-like effect between HS (Table 3). The lower b value was related to the
higher auxin-like activity: HS_A had the highest activity, HS_4 the lowest one, while in
HS_USA b value was intermediate. For the gibberellin-like activity (Table 3), the dose-
dependent response induced by GA was significant (P ≤ 0.05) in the elongation of lettuce
shoots. Also in this experiment, the best fit was obtained with logarithmic dose-response curve
(R2 = 99%) for HS_USA (P ≤ 0.05) and HS_A (P ≤ 0.05). The high b value corresponded to a
large GA-like activity. Consequently, HS_USA had the highest GA-like activity, and HS_A
the lowest one. No GA-like activity was observed for HS_4 and HS_B.
Table 3 Parameters of the regression curves [Y = a + b*log(X)] between concentration and root length of
watercress plantlets or steam length of lettuce plantlets treated with indole-3-acetic acid (IAA) or
gibberellic acid (GA) or with the humic substances extracted from leonardites
Treatment R2 b P df
IAA 0.99 -1.76 0.001 1215
HS_USA 0.99 -0.21 0.040 277
HS_4 0.99 -0.11 0.050 291
HS_A 0.98 -0.46 0.043 316
HS_B ns ns ns ns
GA 0.93 0.72 0.037 262
HS_USA 0.99 0.29 0.048 249
HS_4 ns ns ns ns
HS_A 0.99 0.07 0.050 247
HS_B ns ns ns ns
df = degree of freedom;
ns = not significant.
Total root length and other morphological parameters of maize plants
Total radicular length for each seedling was calculated as the sum of the lengths of all radicular
nodal segments, using automatic linearization with WinRHIZO software. In maize seedlings
treated for two days with HS, root diameter, number of forks, and number of thin roots were

138
significantly affected by treatment (P ≤ 0.05) and concentration (P ≤ 0.05) (Table 4). As a
result, a stimulation of total root length (TRL) (P ≤ 0.05), and enhanced root surface area (P ≤
0.05) was obtained. Among HS and with respect to untreated plants, HS_USA affected the
greatest number of forks (2305 vs 974), number of thin roots (624 vs 349), TRL (743 mm vs
429 mm), and root surface area (89 cm2 vs 51 cm
2), whereas HS_A had the highest effect on
root diameter (0.39 mm vs 0.38 mm) and number of tips (477 vs 396). The concentrations
stimulated in a wider way the aforesaid parameters (Table 4). Indeed, TRL was up to 1.92 fold
higher compared to untreated for HS_4 at 0.1 mg C L-1
(treatment × concentration interaction
significant at P ≤ 0.05), the number of forks raised up to 2.96 fold compared to untreated for
HS_USA at 0.5 mg C L-1
(treatment × concentration interaction significant at P ≤ 0.05), and
the number of thin roots were up to 1.99 fold compared to untreated for HS_B at 1 mg C L-1
(treatment × concentration interaction significant at P ≤ 0.05). Finally, although not statistically
significant, HS_A at 0.1 mg C L-1
gave the highest number in root tips (1.30 fold compared to
untreated).
For all the HS linear and logarithmic regression models were tested and they did not explain
the data distribution of tested root growth parameters. Parameters (R2 and P value) are reported
in Supplementary material (Table S1).

139
Table 4 Effect of different concentrations of HS extracted from leonardites on root growth morphological parameters of maize seedlings analysed by WhinRhizo software. Total
root length (TRL) is calculated as the sum of the length of primary and lateral roots
Treatment Dose TRL Area Diameter Tips Forks Thin roots
(mg C L-1
) (cm) (cm2) (mm) (n) (n) (cm)
Control 0 429±26cCc*
51±3cCb
0.38±0.006abcdABab
396±21 974±78deBb
349±25bCd
HS_USA 0.1 734±12abc
90±16abc
0.38±0.013abc
492±59 2436±555ab
615±101ab
0.5 757±97ab
97±12ab
0.41±0.009ab
372±41 2880±394a 618±81
ab
1 787±28a 87±3
abc 0.35±0.009
cd 428±63 2130±98
abc 669±36
a
10 695±96abc
79±10abc
0.36±0.007abcd
390±27 1774±347bcde
594±94ab
743±43A 89±5
A 0.379±0.006
AB 420±25 2305±199
A 624±38
A
HS_4 0.1 825±117a 98±12
a 0.38±0.008
abcd 483±72 2005±372
bcd 716±107
a
0.5 505±72abc
57±8abc
0.35±0.007abcd
415±35 1054±148de
429±68ab
1 606±46abc
65±6abc
0.34±0.007cd
431±23 1321±127cde
530±44ab
10 594±73abc
67±10abc
0.35±0.015bcd
488±43 1341±286cde
507±64ab
615±41B 69±5
B 0.359±0.005
C 451±20 1378±127
B 530±37
B
HS_A 0.1 613±61abc
76±8abc
0.39±0.007abc
516±45 1401±148cde
494±47ab
0.5 562±59abc
74±10abc
0.41±0.020a 490±49 1194±188
cde 438±41
ab
1 665±35abc
83±6abc
0.39±0.01abc
433±43 1813±120bcde
568±27ab
10 442±18bc
52±2c 0.37±0.005
abcd 458±10 940±43
de 354±19
b
562±29B 70±4
B 0.394±0.006
A 477±19 1299±92
B 455±24
B
HS_B 0.1 551±44abc
58±5abc
0.33±0.007d 327±27 1139±121
cde 491±42
ab
0.5 444±35bc
55±5bc
0.39±0.010abc
340±14 871±95e 363±29
b
1 798±140a 95±17
ab 0.38±0.007
abcd 512±108 1814±401
bcde 694±118
a
10 630±53abc
73±6abc
0.37±0.010abcd
455±16 1447±173cde
537±51ab
588±40B 68±5
B 0.368±0.006
BC 399±25 1273±113
B 506±36
B
0.1 665±45ab
78±6a 0.373±0.007
b 421±27 1688±185
a 564±38
ab
0.5 559±40b 69±5
a 0.392±0.007
a 414±22 1451±198
a 456±33
c
1 706±37a 81±4
a 0.365±0.006
b 464±28 1741±116
a 609±32
a
10 586±35b 67±4
a 0.367±0.005
b 450±14 1358±124
a 494±33
bc
*In the same column differences among treatment mean (capital letters), concentration (italicized letters) and treatment × concentration (lowercase) were at P ≤ 0.05 by
Student Newman Keuls test.

140
GS and GOGAT activity
Treatment significantly influenced both roots (P ≤ 0.001) and leaves GS enzyme activity (P ≤
0.001) (Table 5). Among treatments, HS_4 and HS_B were the most effective in roots (P ≤
0.05), whereas HS_4, HS_A, and HS_USA were the most active in leaves (P ≤ 0.05). In
particular, HS_4 always showed high values in GS enzyme activity, up to 1.63 fold higher than
untreated roots (1 mg C L-1
) (P ≤ 0.05), and 1.49 fold higher than untreated leaves (10 mg C L-
1) (P ≤ 0.05). The activity of GOGAT enzyme was also affected by treatment in both roots (P ≤
0.001) and leaves (P ≤ 0.001) (Table 5). In roots, strong effects were induced by HS_USA and
HS_4, and in leaves by HS_B. In fact, GOGAT activity was 1.97 and 1.87 fold higher than
untreated roots (HS_USA 0.1 C mg L-1
) (P ≤ 0.05) and leaves (HS_B 1 mg C L-1
) (P ≤ 0.05),
respectively (treatment × concentration interaction significant at P ≤ 0.05).

141
Table 5 Glutamine synthetase (GS) and glutamate synthase (GOGAT) activities of leaves and roots per plant of
maize seedlings after treatment with HS extracted from leonardites. Data are mean SE, n=9
Treatment Dose
(mg C L-1
) GS
(mol GHA g-1
fw min
-1)
GOGAT
(nmol NADH g-1
fw min
-1)
Roots Leaves Roots Leaves
Control 0 0.101±0.008cdefCc*
0.090±0.004cdCc
0.36±0.05bcB
0.08±0.08bcBC
HS_USA 0.1 0.098±0.009cdef
0.102±0.008abcd
0.71±0.01a 0.09±0.09
bc
0.5 0.084±0.005def
0.110±0.007abcd
0.59±0.02ab
0.05±0.05c
1 0.091±0.001cdef
0.102±0.006abcd
0.56±0.03ab
0.07±0.07bc
10 0.135±0.003abc
0.119±0.007abc
0.62±0.05ab
0.07±0.07bc
0.102±0.004C 0.108±0.003
B 0.62±0.02
A 0.07±0.005
C
HS_4 0.1 0.148±0.008ab
0.126±0.004ab
0.63±0.08ab
0.10±0.10b
0.5 0.157±0.005ab
0.128±0.010ab
0.61±0.09ab
0.10±0.10b
1 0.165±0.012a 0.119±0.008
abc 0.65±0.06
a 0.07±0.07
bc
10 0.155±0.007ab
0.134±0.008a 0.62±0.06
ab 0.10±0.10
b
0.156±0.004A 0.127±0.003
A 0.63±0.03
A 0.09±0.005
B
HS_A 0.1 0.085±0.008def
0.097±0.004bcd
0.13±0.00c 0.08±0.08
bc
0.5 0.073±0.001ef 0.108±0.008
abcd 0.13±0.03
c 0.10±0.10
b
1 0.057±0.008f 0.108±0.003
abcd 0.12±0.00
c 0.08±0.08
bc
10 0.098±0.018cdef
0.119±0.003abc
0.08±0.03c 0.08±0.08
bc
0.078±0.006D 0.108±0.003
B 0.12±0.01
C 0.08±0.004
BC
HS_B 0.1 0.125±0.001abcd
0.088±0.005cd
0.15±0.01c 0.12±0.12
ab
0.5 0.115±0.002bcde
0.102±0.001abcd
0.17±0.02c 0.14±0.14
a
1 0.119±0.003bcde
0.083±0.007d 0.20±0.01
c 0.15±0.15
a
10 0.131±0.011abcd 0.092±0.002cd
0.18±0.01c 0.14±0.14
a
0.122±0.003B 0.091±0.002
C 0.18±0.00
C 0.14±0.004
A
0.1 0.114±0.006b 0.103±0.004
b 0.40±0.07 0.09±0.006
0.5 0.107±0.007c 0.112±0.004
a 0.38±0.06 0.09±0.009
1 0.108±0.008c 0.103±0.004
b 0.38±0.06 0.09±0.010
10 0.130±0.006a 0.116±0.004
a 0.37±0.06 0.10±0.007
* In the same column differences among treatment mean (capital letters), concentration (italicized letters) and
treatment × concentration (lowercase) were at P ≤ 0.05 by Student Newman Keuls test.
Proteins and soluble sugars content
The treatment with HS affected the proteins content and concentration (P ≤ 0.05) of maize
plants (P ≤ 0.005) (Table 6). In roots, HS_4 and HS_USA had the highest effects at 1 and 10
mg L-1
(P ≤ 0.05) highlighting values 1.81 and 1.73 fold untreated, respectively. In leaves only
HS_A at 0.5 mg C L-1
increased the protein content (1.19 fold untreated) (P ≤ 0.05).

142
Sucrose content was considerably influenced by treatments (P 0.005) (Table 7). This led a
general decrease in sugars with respect to the control, however for HS_4 the effect was the
opposite at low doses (0.1 and 0.5 mg C L-1
), with sucrose content increasing up to 3.39 and
2.07 fold compared to untreated plants, respectively. Fructose content was positively
influenced by HS treatment (P 0.05). Whereas for glucose content HS treatment had little
effect. Although not statistically significant, the trend showed that HS_B induced a widespread
increase in the amount of both glucose and fructose.
Table 6 Roots and leaves protein content per plant of maize seedlings after treatment with HS extracted from
leonardites. Data are mean SE, n=9
Treatment
Dose
(mg C L-1
)
Protein
(mg g fw-1
)
Roots Leaves
Control 0 0.99±0.07bCb*
8.56±0.34bcABbc
HS_USA 0.1 1.16±0.06b 8.23±0.50
cd
0.5 1.09±0.04b 7.56±0.26
cd
1 1.52±0.36ab
9.37±0.35a
10 1.72±0.11a 7.16±0.36
d
1.37±0.10B 8.08±0.24
B
HS_4 0.1 1.54±0.12ab
8.82±0.27b
0.5 1.58±0.02ab
9.08±0.34ab
1 1.79±0.02a 9.06±0.15
ab
10 1.61±0.09ab
8.72±0.63bc
1.63±0.04A 8.92±0.18
A
HS_A 0.1 1.19±0.12b 8.33±0.26
cd
0.5 1.11±0.07b 10.2±0.13
a
1 1.17±0.15b 9.95±0.08
a
10 1.28±0.06ab
7.68±0.12cd
1.19±0.05C 9.06±0.23
A
HS_B 0.1 1.13±0.03b 8.43±0.17
abcd
0.5 1.01±0.05b 8.57±0.25
bc
1 1.02±0.03b 8.72±0.25
bc
10 1.09±0.04b 7.80±0.43
cd
1.06±0.02C 8.38±0.15
AB
0.1 1.25±0.05ab
8.45±0.16abc
0.5 1.20±0.05ab
8.87±0.23ab
1 1.37±0.11a 9.28±0.14
a
10 1.42±0.06a 7.84±0.23
c
* In the same column differences among treatment mean (capital letters), concentration (italicized letters) and
treatment × concentration (lowercase) were at P ≤ 0.05 by Student Newman Keuls test.

143
Table 7 Sucrose, glucose, and fructose amount in leaf per plant of maize seedlings after treatment with HS
extracted from leonardites. Data are mean SE, n=9
Treatment Dose Sucrose Glucose Fructose
(mg C L-1
) (mg kg-1
fw)
Control 0 611±288AB*
5820±485 1978±185
HS_USA 0.1 159±14 6273±580 2334±52
0.5 130±67 6242±637 2403±290
1 143±4 5999±604 2211±254
10 143±14 5520±221 2427±124
144±13B 6009±233 2343±83
HS_4 0.1 2073±472 5833±210 1666±125
0.5 1266±404 6265±165 2034±47
1 529±509 4973±803 1609±200
10 88±40 6297±636 2895±184
989±323A 5842±284 2051±202
HS_A 0.1 162±16 6099±137 2347±858
0.5 92±10 5334±434 2325±428
1 145±13 5287±568 2048±334
10 174±36 5453±678 2254±320
143±14B 5543±343 2243±206
HS_B 0.1 160±10 6123±800 2408±257
0.5 193±26 7792±761 3153±169
1 219±61 7128±520 2933±354
10 210±59 5945±452 2192±171
195±19B 6747±376 2672±174
0.1 639±325 6082±328 2189±206
0.5 420±200 6408±392 2479±187
1 259±114 5847±394 2200±211
10 154±22 5804±237 2442±131
* In the same column differences among treatment mean (capital letters) were at P ≤ 0.05 by Student Newman
Keuls test.

144
PAL activity, soluble phenols content, and phenolic acids
PAL activity in maize leaves was significantly influenced by treatment (P 0.001) and
concentration (P 0.001) (Table 8). HS_4, in the range at 0.5 and 1 mg C L-1
gave the highest
PAL activity. In particular, at 0.5 mg C L-1
the PAL activity increased up to 3.70 fold relative
to the control (treatment × concentration interaction significant at P 0.01). PAL activity was
also increased by HS_A at 1 mg C L-1
up to 1.54 fold compared to untreated. A general
increase of soluble phenolic content was induced by HS treatment (P 0.001) (Table 8)with
HS_4 and HS_A showing the highest effects. In particular, HS_A at 10 mg C L-1
and 0.5 mg C
L-1
showed a strong effect in the content of p-hydroxybenzoic acid (3.25 fold untreated) and p-
coumaric acid (2.3 fold untreated), respectively. Finally, HS_USA at 1 mg C L-1
and HS_B at
10 mg C L-1
increased the chlorogenic acid (1.21 fold compared to untreated) (Table 8).
Linear and logarithmic regression curves were tested and they did not explain the data
distribution of the enzymes activities, phenols, phenolic acids, proteins, and sugars contents.
Parameters (R2 and P value) are reported in Table S1.

145
Table 8 Phenylalanine ammonia-lyase activity (PAL), soluble phenols content, and phenolic acid profile per plant
of maize seedlings after treatment with HS extracted from leonardites. Data are mean SE, n=9.
nd, not detected
* In the same column differences among treatment mean (capital letters), concentration (italicized letters) and
treatment × concentration (lowercase) were at P ≤ 0.05 by Student Newman Keuls test
Treatment Dose PAL Soluble
phenols Phenolic acid (mg kg
-1 fw)
(mg C L
-1) (nmol cinn. acid
mg−1
prot min−1
)
(mg gallic
acid g−1
fw)
Chlorogenic p-Cumaric Ferulic p-
Hydroxybenzoic
Control 0 2.52±0.25bCb*
15.8±0.2bC
80±5 4.3±0.3 5.0±0.9 12±3cB
HS_USA 0.1 1.96±0.53b 18.5±0.3
a 88±1 5.0±0.4 6.0±1.0 10±2
0.5 2.15±0.47
b 15.7±0.2
b 96±2 5.4±0.1 7.0±1.6 13±0
1 2.80±0.55
b 16.0±0.2
b 97±1 4.8±0.1 5.0±1.3 18±0
10 2.43±0.80b 15.4±0.1
b 11±2 5.7±1.2 5.0±0.6 24±6
2.34±0.28C 16.4±0.3
C 98±8 5.2±0.2 6.2±0.5 16±2
AB
HS_4 0.1 3.19±0.57b 19.7±0.4
a 82±1 4.3±1.0 8.0±2 13±0
0.5 9.32±0.60a 18.0±0.2
a 73±6 4.0±0.8 6.0±2.4 nd
1 8.17±0.55a 19.6±0.4
a 90±7 3.8±1.0 6.0±1.8 nd
10 7.60±0.39a 19.6±0.3
a 70±0 4.2±0.3 5.0±1.6 nd
7.07±0.73A 19.2±0.23
A 79±5 4.1±0.3 6.6±0.8 13±0
B
HS_A 0.1 3.60±1.19b 19.1±0.5
a 79±2 3.6±0.1 2.0±0.2 25±2
0.5 3.70±0.52b 18.8±0.6
a 47±1 10±6.7 6.0±4.1 9±3
1 3.88±0.82b 18.5±0.2
a 84±1 4.2±0.0 2.0±0.2 29±1
10 2.80±0.69b 19.9±0.4
a 83±1 4.0±0.0 2.0±0.4 39±6
3.50±0.40B 19.1±0.24
A 73±7 5.5±1.6 3.4±0.9 26±4
A
HS_B 0.1 2.18±0.18b 16.0±0.3
b 71±9 4.3±0.4 4.0±0.6 16±3
0.5 1.46±0.48b 18.7±0.3
a 93±2 5.2±0.8 6.0±1.9 23±0
1 2.57±0.61b 18.6±0.8
a 94±5 4.6±0.0 5.0±0.1 29±2
10 1.69±0.38b 16.7±0.4
b 97±0 4.9±0.0 6.0±0.5 28±5
1.97±0.22C 17.5±0.34
B 89±6 4.8±0.2 5.5±0.5 24±2
A
0.1 2.67±0.39b 18.3±0.3 80±6 4.3±0.2 5.3±0.9 14.±3.0
ab
0.5 3.42±0.62a 17.8±0.3 77±1 6.2±1.5 6.8±1.0 11.±3.2
b
1 3.81±0.52a 18.2±0.3 91±3 4.4±0.2 4.7±0.6 19.±5.0
ab
10 3.06±0.52ab
17.9±0.4 90±7 4.7±0.3 5.0±0.5 23.±5.8a

146
Discussion
Several studies have reported possible relationships between the effects of leonardite on plant
growth and their capacity to improve nutrient uptake and assimilation (Aguirre et al. 2009;
Tahiri et al. 2015). Ertani et al. (2011) demonstrated that, in maize, HS from leonardite
enhanced the production of N assimilates and promoted photosynthesis through the increase in
chlorophyll content and stimulation of RuBisCo enzyme activity. These effects were mainly
attributed to a complex macromolecular system mainly composed of polyaromatic rings, and
may depend on the origin and characteristics of HS (Nardi et al. 2009).
This study showed that four different HS from leonardites had the same main functional
components, but deconvolution fitting analysis gave more information on semi-quantitative
differences between leonardites. In terms of functional groups distribution, HS_USA had the
highest content in carboxyl groups bound to aromatic rings with few polar substituents. In
contrast, HS_4 and in particular in HS_A and HS_B, the aromatic component was dominant
and was composed by polar substituents and aliphatic structures. This feature has been related
to low rank coals. Overall, HS differently but significantly affected the growth of watercress
root and lettuce seedlings in a logarithmic curve model. These effects are reported to reflect
strong biostimulant properties (Scaglia et al. 2016). However, the magnitude and nature of
these effects were different depending on the type of leonardite. IAA-like activity decreased in
the order HS_A > HS_USA > HS_4, whereas HS_USA and HS_A had the highest and lowest
GA-like activity, respectively. These results partially agree with those of Ertani et al. (2011)
who found GA-like activity in a humic acid from leonardite, while other authors reported
auxin-like properties (O'Donnell 1973). However, the intensities of IAA and GA-like activities
were comparable with those found from humic and fulvic acids extracted from soil of natural
ecosystems (Pizzeghello et al. 2015) and HS extracted from vermicompost (Scaglia et al.
2016).
The relationship between the biological activity and the structure of HS is very important to
understand their effects in treated plants (Muscolo et al. 2007). However, the molecular
structure is still debated. Recently, HS are described as supramolecular structures formed by
relatively small molecules held together by non-covalent intermolecular interactions (e.g.,
hydrogen-bonding, charge-transfer, van der Waals and π-π) (Piccolo 2001). The exterior
domain consists of polar groups (e.g., carboxylic acids) where their distribution is particularly

147
relevant to determine HS solubility and biological reactivity (Muscolo et al. 2007). High
content of carboxylic acids, proteins, and amino acids has been related to IAA-like activity.
The carboxyl groups presence is a proxy for the bioavailability of auxin entrapped into the HS
molecular structure (Napier 2004). Whereas the hydrophobic domain, composed by aromatics
and amides functional groups, is related to GA-like activity (Pizzeghello et al. 2015). Such
distinction might not always be applicable and it is possible that leonardite properties might be
modified according to the functional groups exposed to the surrounding aqueous environment
(Carletti et al. 2010). Nevertheless, our FT-IR spectra of HS confirmed a different content in
carboxyl and aromatics rings that may justify their biological activity.
The most general trait in plant responses to HS pertains to growth and architecture of the
rooting system, mainly affecting lateral root formation (Canellas and Olivares 2014; Nardi et
al. 2009). Rooting is vital for plant survival in relation to nutrition and growth requirements,
synthesis and accumulation of secondary metabolites and interaction with nitrogen-fixing
organisms (Saini et al. 2013). Root is also the first plant organ targeted by HS in soil. In this
study, among the leonardites, HS_USA had the strongest effect in maize root architecture,
leading to an overall stimulation of elongation and proliferation of secondary roots as well
increasing root diameter. HS_A and HS_USA, which showed high auxin-like activity in the
bioassay, showed the highest morphological changes on maize root apparatus, resulting in a
higher root surface area, increase of total radicular length and root diameter. This confirms the
effect of the carboxylic components in HS. Primary root elongation, and increasing lateral
roots are known to be an auxin-triggered mechanism (De Smet et al. 2006), which has been
recently proven to be driven by the auxin entrapped in the HS themselves (Trevisan et al.
2010a). Effects on root architecture are indeed accompanied by changes in the biochemistry of
energy generation and transport system across plasma membranes (Canellas et al. 2002;
Zandonadi et al. 2007). Regarding root diameter, our results agree with previous findings
which demonstrated that HS induced a higher rate of differentiation of cells of the root central
cylinder relative to untreated plants. The augmented thickness of cells wall has been shown to
be due to a higher production of lignin in HS-treated plants (Concheri et al. 1996; Nardi et al.
2000).
HS increased the enzymes involved in N assimilation (Baglieri et al. 2014). In particular, GS
and GOGAT enzyme activities were widely affected by the presence of HS. These enzymes
work in close association as the incorporation of ammonium (NH4+) into organic compounds

148
by GS leads to the production of glutamate from glutamine and α-ketoglutarate by GOGAT.
The GS/GOGAT system is the main metabolic route for N assimilation in higher plants
(Mokhele et al. 2012), and its stimulation confirms the capability of HS from leonardites, to
interact with the plant nitrate metabolism inducing an increase in N organic compounds, as
supported by the augmented protein content recorded. Such results are consistent with previous
ones, obtained with HS from other sources such as earthworms coprolites and lignosulfonate-
humates (Carletti et al., 2008; Ertani et al. 2011).
In addition to nitrogen metabolism, HS may modulate C metabolism by increasing the activity
of enzymes involved in glycolysis and the Krebs cycle (Nardi et al. 2007). In our study, after
the application of HS from leonardites, the content of carbohydrates, such as glucose and
fructose, sharply increased in the leaves. Carbohydrates, which represent the basis of plant
metabolism (Winter and Huber 2000), not only provide the energy required for various
metabolic pathways, but also provide carbon skeletons for nitrogen metabolism, thus their
increase may justify the improved activity of nitrogen assimilation.
The activity of PAL, synthesized in response to HS treatment, results in the accumulation of
phenolic compounds. PAL is an enzyme which, catalyzing the first metabolic step from
primary to secondary metabolism (Douglas 1996), deaminates phenylalanine to produce
cinnamic acid. As a consequence, HS_4 and HS_A enhanced the soluble phenols and strongly
increased phenolics such p-hydroxybenzoic acid, p-coumaric acid and chlorogenic acid. The
stimulation of secondary metabolism is also justified by the enhanced activity of primary
metabolism. In addition, a greater concentration of phenols recorded in plants after treatment
with leonardites is likely to be the result of a weak uncoupling of oxidative phosphorylation,
which in turn increases the metabolic processes requiring glucose (Muscolo and Sidari 2006).
In conclusion, with this work, we aimed to test and compare the biostimulant activity of HS
extracted from different leonardites. Overall, HS from leonardites positively affected root
architecture, with a stimulation of the elongation and proliferation of secondary roots. They
enhanced plant nutrient uptake and nutrient use efficiency, and influenced N metabolism,
increasing GOGAT and GS enzymes activity, and hence protein production. The carboxyl
groups resulted as proxy for the bioavailability of the auxin entrapped into the HS molecular
structure, whereas the hydrophobic domain is related to GA-like activity. From this study it
was found that: (1) HS from leonardites have strong biostimulant properties, (2) the leonardite

149
origin has an influence on composition of the main functional groups, and, as a consequence,
on their biological activity.
Acknowledgments
PhD grant for Giovanni Battista Conselvan funded by MIUR “L 170”. This work has been
supported also by DOR1692027/16 funding. The authors thank LandLab srl which have
supplied the leonardites, and David Fuentes and Andrew Merchant for kindly improving the
English of the manuscript.

150
References
Aguirre E, Lemenager D, Bacaicoa E, Fuentes M, Baigorri R, Zamarreno AM, Garcia-Mina
JM (2009) The root application of a purified leonardite humic acid modifies the
transcriptional regulation of the main physiological root responses to Fe deficiency in
Fe-sufficient cucumber plants (vol 47, pg 215, 2008). Plant Physiology and
Biochemistry 47: 966-966. doi: 10.1016/j.plaphy.2009.06.004.
Akinremi OO, Janzen HH, Lemke RL, Larney FJ (2000) Response of canola, wheat and green
beans to leonardite additions. Can J Soil Sci 80: 437-443. doi: 10.4141/S99-058.
Arnaldos TL, Munoz R, Ferrer MA, Calderon AA (2001) Changes in phenol content during
strawberry (Fragaria x ananassa, cv. Chandler) callus culture. Physiol Plant 113: 315-
322. doi: 10.1034/j.1399-3054.2001.1130303.x.
Audus (1972) J. Plant Growth Substances Chemistry and Physiology. Hill, L. Ed. London; 1,
pp 24-65.
Avila C, Botella JR, Cánovas FM, de Castro IN, Valpuesta V (1987) Different characteristics
of the two glutamate synthases in the green leaves of lycopersicon esculentum. Plant
Physiology 85: 1036-1039. doi: 10.1104/pp.85.4.1036.
Baglieri A, Cadili V, Mozzetti Monterumici C, Gennari M, Tabasso S, Montoneri E, Nardi S,
Negre M (2014) Fertilization of bean plants with tomato plants hydrolysates. Effect on
biomass production, chlorophyll content and N assimilation. Scientia Horticulturae 176:
194-199. doi: 10.1016/j.scienta.2014.07.002.
Bellamy L.J. (1975) The infra-red Spectra of complex Molecules. Vol. 2 Chapman and Hall
London.
Bradford M (1976) A rapid and sensitive method for the quantitation of microgram quantities
of protein utilizing the principle of protein-dye binding. Anal. Biochem. 72: 248-254.
Bronick CJ, Lal R (2005) Soil structure and management: a review. Geoderma 124: 3-22. doi:
10.1016/j.geoderma.2004.03.005.
Bulgari R, Cocetta G, Trivellini A, Vernieri P, Ferrante A (2015) Biostimulants and crop
responses: a review. Biol Agric Hortic 31: 1-17. doi: 10.1080/01448765.2014.964649.
Calvo P, Nelson L, Kloepper JW (2014) Agricultural uses of plant biostimulants. Plant Soil
383: 3-41. doi: 10.1007/s11104-014-2131-8.

151
Canellas LP, Dantas DJ, Aguiar NO, Peres LEP, Zsogon A, Olivares FL, Dobbss LB, Facanha
AR, Nebbioso A, Piccolo A (2011) Probing the hormonal activity of fractionated
molecular humic components in tomato auxin mutants. Ann Appl Biol 159: 202-211.
doi: 10.1111/j.1744-7348.2011.00487.x.
Canellas LP, Olivares FL (2014) Physiological responses to humic substances as plant growth
promoter. Chemical and Biological Technologies in Agriculture 1: 3. doi:
10.1186/2196-5641-1-3.
Canellas LP, Olivares FL, Okorokova-Façanha AL, Façanha AR (2002) Humic acids isolated
from earthworm compost enhance root elongation, lateral root emergence, and plasma
membrane H+-ATPase activity in maize roots. Plant Physiology 130: 1951-1957. doi:
10.1104/pp.007088.
Carletti P, Lorena Roldan M, Francioso O, Nardi S, Sanchez-Cortes S (2010) Structural
characterization of humic-like substances with conventional and surface-enhanced
spectroscopic techniques. Journal of Molecular Structure 982: 169-175. doi:
10.1016/j.molstruc.2010.08.028.
Carletti P, Masi A, Spolaore B, De Laureto PP, De Zorzi M, Turetta L, Ferretti M, Nardi S
(2008) Protein expression changes in maize roots in response to humic substances.
Journal of Chemical Ecology 34: 804-818. doi: 10.1007/s10886-008-9477-4.
Casierra-Posada F, Rodriguez CA, Fischer G (2009) Reducing negative effects of salinity in
tomato (Solanum lycopersicum L.) plants by adding leonardite to soil. In: G Fischer, S
Magnitskiy, S Nicola (eds) International symposium on tomato in the tropics. Int Soc
Horticultural Science, Leuven 1. doi: 10.17660/ActaHortic.2009.821.14.
Concheri G, Nardi S, Reniero F, DellAgnola G (1996) The effects of humic substances within
the Ah horizon of a Calcic Luvisol on morphological changes related to invertase and
peroxidase activities in wheat roots. Plant Soil 179: 65-72. doi: 10.1007/bf00011643.
David J, Smejkalova D, Hudecova S, Zmeskal O, von Wandruszka R, Gregor T, Kucerik J
(2014) The physico-chemical properties and biostimulative activities of humic
substances regenerated from lignite. Springerplus 3. doi: 10.1186/2193-1801-3-156.
De Smet I, Vanneste S, Inzé D, Beeckman T (2006) Lateral root initiation or the birth of a new
meristem. Plant Molecular Biology 60: 871-887. doi: 10.1007/s11103-005-4547-2.

152
Ding YZ, Feng RW, Wang RG, Guo JK, Zheng XQ (2014) A dual effect of Se on Cd toxicity:
evidence from plant growth, root morphology and responses of the antioxidative
systems of paddy rice. Plant Soil 375: 289-301. doi: 10.1007/s11104-013-1966-8.
Douglas CJ (1996) Phenylpropanoid metabolism and lignin biosynthesis: from weeds to trees.
Trends in Plant Science 1: 171-178. doi: 10.1016/1360-1385(96)10019-4.
du Jardin P (2015) Plant biostimulants: definition, concept, main categories and regulation.
Scientia Horticulturae 196: 3-14. doi: 10.1016/j.scienta.2015.09.021.
El-Shora HM (2002) Properties of phenylalanine ammonia-lyase from marrow cotyledons.
Plant Science 162: 1-7. doi: 10.1016/s0168-9452(01)00471-x.
Ertani A, Francioso O, Tugnoli V, Righi V, Nardi S (2011) Effect of commercial
lignosulfonate-humate on Zea mays L. metabolism. Journal of Agricultural and Food
Chemistry 59: 11940-11948. doi: 10.1021/jf202473e.
European Biostimulant Industry Council E (2013). Economic over- view of the biostimulants
sector in Europe,17 April 2013. http://www.biostimulants.eu/wp-
content/uploads/2013/04/ Biostimulant_economics_17April2013.pdf
Fernandez ER, Benlloch M, Barranco D, Duenas A, Ganan JAG (1996) Response of olive trees
to foliar application of humic substances extracted from leonardite. Scientia
Horticulturae 66: 191-200. doi: 10.1016/s0304-4238(96)00914-4.
Ferreras L, Gomez E, Toresani S, Firpo I, Rotondo R (2006) Effect of organic amendments on
some physical, chemical and biological properties in a horticultural soil. Bioresource
Technology 97: 635-640. doi: 10.1016/j.biortech.2005.03.018.
Field A (2013) Discovering statistics using IBM SPSS statistics. SAGE Publications Ltd.
Hirel B, Bertin P, Quilleré I, Bourdoncle W, Attagnant C, Dellay C, Gouy A, Cadiou S,
Retailliau C, Falque M, Gallais A (2001) Towards a better understanding of the genetic
and physiological basis for nitrogen use efficiency in maize. Plant Physiology 125:
1258-1270. doi: 10.1104/pp.125.3.1258.
Hoagland DR, Arnon DI (1950) The water-culture method for growing plants without soil.
Circular California Agricultural Experiment Station 347.
Jezek M, Geilfus CM, Muhling KH (2015) Glutamine synthetase activity in leaves of Zea mays
L. as influenced by magnesium status. Planta 242: 1309-1319. doi: 10.1007/s00425-
015-2371-8.

153
Jindo K, Martim SA, Navarro EC, Pérez-Alfocea F, Hernandez T, Garcia C, Aguiar NO,
Canellas LP (2012) Root growth promotion by humic acids from composted and non-
composted urban organic wastes. Plant Soil 353: 209-220. doi: 10.1007/s11104-011-
1024-3.
La Torre A, Battaglia V, Caradonia F (2016) An overview of the current plant biostimulant
legislations in different European Member States. J Sci Food Agric 96: 727-734. doi:
10.1002/jsfa.7358.
Mokhele B, Zhan X, Yang G, Zhang X (2012) Review: Nitrogen assimilation in crop plants
and its affecting factors. Canadian Journal of Plant Science 92: 399-405. doi:
10.4141/cjps2011-135.
Mora V, Baigorri R, Bacaicoa E, Zamarreno AM, Garcia-Mina JM (2012) The humic acid-
induced changes in the root concentration of nitric oxide, IAA and ethylene do not
explain the changes in root architecture caused by humic acid in cucumber.
Environmental and Experimental Botany 76: 24-32. doi:
10.1016/j.envexpbot.2011.10.001.
Muscolo A, Sidari M (2006) Seasonal fluctuations in soil phenolics of a coniferous forest:
effects on seed germination of different coniferous species. Plant Soil 284: 305-318.
doi: 10.1007/s11104-006-0040-1.
Muscolo A, Sidari M, Francioso O, Tugnoli V, Nardi S (2007) The auxin-like activity of humic
substances is related to membrane interactions in carrot cell cultures. Journal of
Chemical Ecology 33: 115-129. doi: 10.1007/s10886-006-9206-9.
Napier R (2004) Plant hormone binding sites. Annals of botany 93: 227-233.
Nardi S, Carletti P, Pizzeghello D, Muscolo A (2009) Biological activities of humic
substances. In: PM Huang, N Senesi (eds) Biophysico-Chemical Processes in
Environmental Systems. John Wiley & Sons, Hoboken, USA.
Nardi S, Pizzeghello D, Reniero F, Rascio N (2000) Chemical and biochemical properties of
humic substances isolated from forest soils and plant growth. Soil Science Society of
America Journal 64: 639-645.
Nardi S, Muscolo A, Vaccaro S, Baiano S, Spaccini R, Piccolo A (2007) Relationship between
molecular characteristics of soil humic fractions and glycolytic pathway and krebs
cycle in maize seedlings. Soil Biology & Biochemistry 39: 3138-3146. doi:
10.1016/j.soilbio.2007.07.006.
154
Nicoletto C, Santagata S, Tosini F, Sambo P (2013) Qualitative and healthy traits of different
Italian typical artichoke genotypes. Cyta-Journal of Food 11: 108-113. doi:
10.1080/19476337.2012.700951.
O'Donnell R (1973) The auxin-like effects of humic preparations from leonardite. Soil Science
116: 106-112.
OECD (2013) OECD Compendium of Agri-environmental Indicators. OECD Publishing.
Piccolo A (2001) The supramolecular structure of humic substances. Soil Science 166: 810-
832. doi: 10.1016/S0065-2113(02)75003-7.
Pizzeghello D, Cocco S, Francioso O, Ferrari E, Cardinali A, Nardi S, Agnelli A, Corti G
(2015) Snow vole (Chionomys nivalis Martins) affects the redistribution of soil organic
matter and hormone‐like activity in the alpine ecosystem: ecological implications.
Ecology and evolution 5: 4542-4554. doi: 10.1002/ece3.1727.
Pizzeghello D, Francioso O, Ertani A, Muscolo A, Nardi S (2013) Isopentenyladenosine and
cytokinin-like activity of different humic substances. Journal of Geochemical
Exploration 129: 70-75. doi: 10.1016/j.gexplo.2012.10.007.
Povero G, Mejia JF, Di Tommaso D, Piaggesi A, Warrior P (2016) A systematic approach to
discover and characterize natural plant biostimulants. Frontiers in Plant Science 7: 435.
doi: 10.3389/fpls.2016.00435.
Puglisi E, Fragoulis G, Ricciuti P, Cappa F, Spaccini R, Piccolo A, Trevisan M, Crecchio C
(2009) Effects of a humic acid and its size-fractions on the bacterial community of soil
rhizosphere under maize (Zea mays L.). Chemosphere 77: 829-837. doi:
10.1016/j.chemosphere.2009.07.077.
Qian S, Ding WM, Li YC, Liu GD, Sun JA, Ding QS (2015) Characterization of humic acids
derived from Leonardite using a solid-state NMR spectroscopy and effects of humic
acids on growth and nutrient uptake of snap bean. Chem Speciation Bioavail 27: 156-
161. doi: 10.1080/09542299.2015.1118361.
Quaggiotti S, Ruperti B, Pizzeghello D, Francioso O, Tugnoli V, Nardi S (2004) Effect of low
molecular size humic substances on nitrate uptake and expression of genes involved in
nitrate transport in maize (Zea mays L.). Journal of Experimental Botany 55: 803-813.
doi: 10.1093/jxb/erh085.
Rose MT, Patti AF, Little KR, Brown AL, Jackson WR, Cavagnaro TR (2014) A meta-analysis
and review of plant-growth response to humic substances: practical implications for

155
agriculture. In: DL Sparks (ed) Advances in Agronomy, Vol 124. Elsevier Academic
Press Inc, San Diego.
Saini S, Sharma I, Kaur N, Pati PK (2013) Auxin: a master regulator in plant root
development. Plant Cell Reports 32: 741-757. doi: 10.1007/s00299-013-1430-5.
Scaglia B, Nunes RR, Rezende MOO, Tambone F, Adani F (2016) Investigating organic
molecules responsible of auxin-like activity of humic acid fraction extracted from
vermicompost. Sci Total Environ 562: 289-295. doi: 10.1016/j.scitotenv.2016.03.212.
Stevenson F (1979) Humates: facts and fantasies on their value as commercial soil
ammendments. Crops and Soils Magazine (USA).
Stevenson F (1994) Humus Chemistry: Genesis, Composition, Reactions, 2nd edn. Wiley, New
York, NY.
Sugier D, Kolodziej B, Bielinska E (2013) The effect of leonardite application on Arnica
montana L. yielding and chosen chemical properties and enzymatic activity of the soil.
Journal of Geochemical Exploration 129: 76-81. doi: 10.1016/j.gexplo.2012.10.013.
Tahiri A, Destain J, Thonart P, Druart P (2015) In vitro model to study the biological
properties of humic fractions from landfill leachate and leonardite during root
elongation of Alnus glutinosa L. Gaertn and Betula pendula Roth. Plant Cell Tissue
Organ Cult 122: 739-749. doi: 10.1007/s11240-015-0807-2.
Trevisan S, Francioso O, Quaggiotti S, Nardi S (2010a) Humic substances biological activity at
the plant-soil interface: From environmental aspects to molecular factors. Plant
Signaling & Behavior 5: 635-643. doi: 10.4161/psb.5.6.11211
Trevisan S, Pizzeghello D, Ruperti B, Francioso O, Sassi A, Palme K, Quaggiotti S, Nardi S
(2010b) Humic substances induce lateral root formation and expression of the early
auxin-responsive IAA19 gene and DR5 synthetic element in Arabidopsis. Plant Biology
12: 604-614. doi: 10.1111/j.1438-8677.2009.00248.x.
Vaccaro S, Muscolo A, Pizzeghello D, Spaccini R, Piccolo A, Nardi S (2009) Effect of a
compost and its water-soluble fractions on key enzymes of nitrogen metabolism in
maize seedlings. Journal of Agricultural and Food Chemistry 57: 11267-11276. doi:
10.1021/jf901808s.
Walkley A, Black IA (1934) An examination of Degtjareff method for determining soil organic
matter and a proposed modification of the chromic acid titration method. Soil Science
37: 29-38.

156
Winter H, Huber SC (2000) Regulation of sucrose metabolism in higher plants: localization
and regulation of activity of key enzymes. Critical Reviews in Plant Sciences 19: 31-67.
doi: 10.1080/07352680091139178.
Zandonadi D, Canellas L, Façanha A (2007) Indolacetic and humic acids induce lateral root
development through a concerted plasmalemma and tonoplast H+ pumps activation.
Planta 225: 1583-1595. doi: 10.1007/s00425-006-0454-2.

157
Supplementary material
Table S1 Parameters (R2
and P value) of linear and logarithmic regression analyses between concentrations and
studied parameters of maize seedlings treated with humic substances (HS) from leonardites. Data are subdivided
for HS.
Linear Logarithmic
Treatment Parameter R2 P value* R
2 P value
HS_USA TRL 0.063 0.103 0.400 0.001
Area 0.039 0.203 0.430 0.001
Diameter 0.045 0.170 0.012 0.486
Tips 0.001 0.861 0.014 0.449
Forks 0.015 0.496 0.400 0.001
Thin Roots 0.072 0.083 0.450 0.000
GS roots 0.142 0.008 0.005 0.626
GS leaves 0.131 0.011 0.194 0.002
GOGAT roots 0.017 0.383 0.082 0.048
GOGAT leaves 0.001 0.867 0.012 0.453
Proteins roots 0.210 0.001 0.203 0.001
Proteins leaves 0.084 0.046 0.035 0.201
Sucrose 0.032 0.511 0.153 0.134
Glucose 0.019 0.607 0.003 0.831
Fructose 0.067 0.332 0.188 0.093
PAL 0.142 0.008 0.003 0.728
Soluble phenols 0.131 0.011 0.016 0.390
Chlorogenic acid 0.017 0.383 0.211 0.074
p-Cumaric acid 0.001 0.867 0.251 0.048
Ferulic acid 0.210 0.001 0.043 0.440
p-Hydroxybenzoic acid 0.084 0.046 0.193 0.116

158
HS_4 TRL 0.033 0.234 0.208 0.002
Area 0.019 0.366 0.139 0.012
Diameter 0.054 0.126 0.184 0.003
Tips 0.066 0.089 0.078 0.063
Forks 0.020 0.360 0.116 0.022
Thin Roots 0.034 0.225 0.226 0.001
GS roots 0.086 0.043 0.438 0.001
GS leaves 0.156 0.005 0.453 0.000
GOGAT roots 0.016 0.388 0.085 0.044
GOGAT leaves 0.004 0.680 0.000 0.903
Proteins roots 0.104 0.026 0.536 0.000
Proteins leaves 0.000 0.951 0.016 0.390
Sucrose 0.106 0.220 0.048 0.174
Glucose 0.022 0.587 0.002 0.760
Fructose 0.391 0.010 0.083 0.071
PAL 0.086 0.043 0.443 0.000
Soluble phenols 0.156 0.005 0.683 0.000
Chlorogenic acid 0.016 0.388 0.018 0.405
p-Cumaric acid 0.004 0.68 0.013 0.489
Ferulic acid 0.104 0.026 0.000 0.985
p-Hydroxybenzoic acid 0.000 0.951 0.266 0.003

159
HS_A TRL 0.010 0.527 0.161 0.007
Area 0.014 0.443 0.174 0.005
Diameter 0.020 0.363 0.019 0.368
Tips 0.011 0.507 0.131 0.016
Forks 0.393 0.017 0.110 0.028
Thin Roots 0.010 0.514 0.131 0.016
GS roots 0.003 0.735 0.084 0.045
GS leaves 0.158 0.005 0.231 0.001
GOGAT roots 0.051 0.121 0.170 0.004
GOGAT leaves 0.001 0.845 0.000 0.982
Proteins roots 0.057 0.103 0.096 0.032
Proteins leaves 0.063 0.085 0.021 0.331
Sucrose 0.025 0.558 0.151 0.0136
Glucose 0.009 0.722 0.021 0.596
Fructose 0.012 0.691 0.055 0.380
PAL 0.003 0.735 0.070 0.069
Soluble phenols 0.158 0.005 0.681 0.000
Chlorogenic acid 0.051 0.121 0.026 0.550
p-Cumaric acid 0.001 0.845 0.031 0.517
Ferulic acid 0.057 0.103 0.112 0.205
p-Hydroxybenzoic acid 0.063 0.085 0.377 0.019

160
HS_B TRL 0.063 0.085 0.229 0.001
Area 0.091 0.044 0.193 0.003
Diameter 0.006 0.625 0.042 0.178
Tips 0.050 0.140 0.005 0.636
Forks 0.092 0.043 0.123 0.018
Thin Roots 0.095 0.040 0.243 0.001
GS roots 0.100 0.034 0.125 0.014
GS leaves 0.091 0.044 0.002 0.762
GOGAT roots 0.006 0.625 0.094 0.034
GOGAT leaves 0.050 0.140 0.088 0.040
Proteins roots 0.092 0.043 0.015 0.409
Proteins leaves 0.095 0.040 0.008 0.542
Sucrose 0.022 0.582 0.112 0.185
Glucose 0.003 0.836 0.124 0.181
Fructose 0.000 0.944 0.308 0.026
PAL 0.100 0.034 0.057 0.103
Soluble phenols 0.091 0.044 0.269 0.000
Chlorogenic acid 0.006 0.625 0.102 0.229
p-Cumaric acid 0.050 0.140 0.100 0.233
Ferulic acid 0.092 0.043 0.007 0.756
p-Hydroxybenzoic acid 0.095 0.040 0.533 0.003
* significant at P < 0.05 TRL = total root length; GS = glutamine synthetase; GOGAT = glutamate synthase; PAL =
phenylalanine ammonia-lyase

161
6 Manuscript IV
Biostimulant effects of seed-applied sedaxane fungicide:
morphological and physiological changes in maize seedlings
Dal Cortivo C. 1
, Conselvan G.B. 1
, Carletti P. 1*
, Barion G. 1, Sella L.
2, Vamerali T.
1
1 Department of Agronomy, Food, Natural Resources, Animals and the Environment,
University of Padua, Padua, Italy
2 Department of Land, Environment, Agriculture and Forestry, University of Padua, Padua,
Italy.
* Corresponding author. E-mail address: [email protected]
These authors contributed equally to this work.
Frontiers in Plant Science

162
Abstract
Most crops are routinely protected against seed-born and soil-borne fungal pathogens through
seed-applied fungicides. The recently-released succinate dehydrogenase inhibitor (SDHI),
sedaxane®, is a broad-spectrum fungicide, used particularly to control Rhizoctonia spp., but
also has documented growth-enhancement effects on wheat. This study investigates the
potential biostimulant effects of sedaxane and related physiological changes in disease-free
maize seedlings (3-leaf stage) at increasing application doses (25, 75 and 150 μg a.i. seed-1
)
under controlled sterilized conditions.
We show sedaxane to have significant auxin-like and gibberellin-like effects, which effect
marked morphological and physiological changes according to an approximate saturation
dose-response model. Maximum benefits were attained at the intermediate dose, which
significantly increased root length (+60%), area (+45%) and forks (+51%), and reduced root
diameter as compared to untreated controls. Sedaxane enhanced leaf and root glutamine
synthetase (GS) activity resulting in greater protein accumulation, particularly in the above-
ground compartment, while glutamate synthase (GOGAT) activity remained almost
unchanged. Sedaxane also improved leaf phenylalanine ammonia-lyase (PAL) activity, which
may be responsible for the increase in shoot antioxidant activity (phenolic acids), mainly
represented by p-coumaric and caffeic acids.
We conclude that, in addition to its protective effect, sedaxane can facilitate root
establishment and intensify nitrogen and phenylpropanoid metabolism in young maize plants,
and may be beneficial in overcoming biotic and abiotic stresses in early growth stages.
Keywords
Biostimulant; hormone-like activity; nitrogen metabolism; phenolic acids; root branching;
Succinate Dehydrogenise Inhibitor (SDHI)
163
Introduction
In intensive agriculture, seed coating is a technique of applying several compounds, such as
pesticides, fertilizers and biostimulant substances, to the seed surface so they can start to act
on the seedlings during germination and/or at the seed-soil interface immediately after
sowing (Ehsanfat and Modarres-Sanavy 2005).
Protecting field crop plants from soil- and seed-borne pathogens during germination and in
early growth stages is crucial to ensure safe and fast establishment (Mathre et al. 2001).
Fungicides are chemical and biological compounds that kill pathogenic fungi or inhibit
fungal spore germination (McGrath 2004), and, together with insecticides, are the molecules
most frequently used in the seed coatings of many crops.
A fungicidal seed treatment is commonly composed of a trace quantity of fungicide evenly
distributed among the seeds along with the adhesive substances needed to bind them to the
seed surface (Sharma et al. 2015). Modern seed dressing fungicide formulations are often a
mixture of several active ingredients with different modes of action (systemic and contact),
which broadens the spectrum of control to include a wide range of pathogens and reduces the
likelihood of resistance onset (Kitchen et al. 2016). Common fungicide combinations for
cereals are triticonazole + prochloraz (Krzyzinska et al. 2005; Vermeulen et al. 2017), both
sterol-inhibiting fungicides, and fludioxonil + metalaxyl-M (Mondal 2004), the former a non-
systemic phenylpyrrole, which inhibits transport-associated phosphorylation of glucose, the
latter an acilalanine RNA synthesis inhibitor.
Substances on the seed surface can affect germination, as they may vary considerably in the
degree to which they attract or repel moisture (Scott 1989). When applied in high
concentrations, fungicides have been reported to have potential direct negative effects on
seed germination, rootlet growth, and emergence (Minamor 2013). In many cases, the effects
of seed-applied fungicides on plants vary according to growing conditions: under low
pathogen pressure, they do not improve crop emergence and grain yield of wheat, but under
high pressure from Fusarium graminearum they do (May et al. 2010). Environmental factors
may also play a role (Cox and Cherney 2014). Seed coating is expected to suppress
arbuscular mycorrhizal fungi, hindering their colonization of roots and consequently reducing
their beneficial effects on plant growth (Channabasava et al. 2015; Chiocchio et al. 2000).
In the search for highly effective active ingredients, attention is currently focused on useful
secondary effects of fungicides on seedling development, regardless of genotype and growing
conditions. Several fungicides have been found to have positive side-effects on plant

164
physiology (Berdugo et al. 2012): The ubiquinol oxidase inhibitor (Qol) Strobilurin family is
known to increase several morphological traits of maize, such as leaf number and area, and
shoot and root biomasses (Lazo and Ascencio 2014). Strobilurins have also been found to
increase tolerance to abiotic stresses, as they can delay senescence of the photosynthetic leaf
area, change the balance of the phytohormones, and increase CO2 assimilation in wheat
(Köhle et al. 2002; Wu and von Tiedemann 2001). The azole fungicide class also influences
the physiology of treated plants by increasing the chlorophyll content in winter wheat plants,
delaying leaf senescence, and protecting plants from several abiotic stresses (Fletcher et al.
2010).
Recent studies have demonstrated the influence of pyrazole-carboxamide succinate
dehydrogenase inhibitors (SDHIs) on plant physiology (Ajigboye et al. 2016; Ajigboye et al.
2014). These comprise a relatively new class of fungicide (since 2000), and now include
various active ingredients, such as boscalid, bixafen, isopyrazam and sedaxane, which can
disrupt fungal respiration causing a breakdown in energy/ATP production (Avenot and
Michailides 2010). The SDHI sedaxane (Syngenta Crop Protection, Basel, Switzerland) has
recently been released for use as a treatment for local and systemic protection of cereal seeds,
seedlings and roots against pathogenic fungi, both seed-borne (Ustilago nuda, Tilletia caries,
Monographella nivalis, Pyrenophora graminea) and soil-born (Rhizoctonia solani, R.
cerealis, Gaeumannomyces graminis, Typhula incarnata) (Ajigboye et al. 2016; Zeun et al.
2013). When sedaxane moves from the seed to the soil and into the plant tissues, it has been
found to improve the development of the roots and lower stems of cereals (Swart 2011).
Previous research has described wheat responding positively to sedaxane in terms of greater
biomass, better growth and drought resistance (Ajigboye et al. 2016). These morpho-
physiological reactions are also known to be induced by biostimulants (Calvo et al. 2014),
defined as substances that at low doses are able to enhance hormone biosynthesis, nutrient
uptake from the soil, resistance to biotic/abiotic stresses, crop quality, and root growth
(Kauffman et al. 2007).
Given all this, the present study aimed to investigate the potential biostimulant activity of
seed-applied sedaxane on maize plants, and the possible physiological mechanisms
underlying the morphological changes. To this end, we: i) carried out a bioassay (Audus test)
to determine the biostimulant activity of sedaxane, ii) measured the morphological variations
in pot-cultivated, disease-free maize plants at increasing fungicide doses, and iii) studied the
response of the enzymes involved in nitrogen and phenylpropanoid metabolism, and the
protein, sugar and total phenol contents in the leaves and roots of the same plants.

165
Materials and Methods
Characteristics of sedaxane
In this study, we used the fungicide formulation Vibrance® 500 FS, a commercial flowable
concentrate for seed treatment containing 500 g sedaxane® L-1
, i.e., 43.7% w/w of AI
(density 1.17 g mL-1
; pH 6.39). Sedaxane is the ISO common name for a mixture of two cis-
isomers, 2’-[(1RS,2RS)-1,1’-bicycloprop-2- yl]-3-(difluoromethyl)-1-methylpyrazole-4-
carboxanilide and two trans-isomers 2’-[(1RS,2SR)-1,1’- bicycloprop-2-yl]-3-
(difluoromethyl)-1-methylpyrazole-4-carboxanilide (IUPAC). Its minimum purity is 960 g
kg-1
, with ranges of 820-890 g kg-1
for the 2 trans-isomers (SYN508210 - 50:50 mixture of
enantiomers), and 100-150 g kg-1
for the 2 cis-isomers (SYN508211 - 50:50 mixture of
enantiomers) (EFSA 2012).
Pot trial set-up and plant analysis
Plants of the maize hybrid Hydro (Syngenta, Basel, Switzerland) were grown in cylindrical
PVC pots (50 cm high, 9 cm diameter, 3.1 L volume) in a greenhouse in the L. Toniolo
experimental farm of the University of Padua (Legnaro, NE Italy). The pots were filled with a
sterilized mixture (36 h in an oven at 120 °C) of silty-loam soil collected from a field on the
experimental farm (pH 8.4), and fine sand (1:1 w/w) to facilitate water drainage and root
collection, to which was added a standard dose of pre-sowing fertilizer (about 100 kg N ha-1
,
150 kg P2O5 ha-1
and 300 kg K2O ha-1
). Maize seeds were treated with three increasing doses
of sedaxane: 25, 75 and 150 μg AI seed-1
, corresponding to label doses of 2.5, 7.5 and 15 mL
of the commercial product Vibrance® 500 FS (500 g AI L-1
) in 50,000 seeds. Plants grown
from treated seeds were compared with untreated controls. The experimental design was
completely randomized with 6 replicates.
Three seeds per pot were sown at the end of June, and immediately after emergence plants
were thinned to one per pot. At harvest, growth measurements were taken from three
pots/plants, and enzymatic activity assays were carried out with a further three.
Water stress was avoided throughout the experiment by regularly watering the plants. Before
plant harvest, which took place 20 days after sowing (DAS) at the 3-leaf stage, SPAD (Soil
Plant Analysis Development) was measured in the last fully-developed leaf with a 502
chlorophyll meter (Konica-Minolta, Hong Kong). Fresh and dry (oven-dried for 24 h at 105
°C) weights were measured on three replicate samples of shoots, and roots were collected,
gently washed of soil, and stored in a 15% v/v ethanol solution until morphological

166
characterization. Root length, surface area, diameter, and number of tips and forks were
measured by analysis of 1-bit 400-DPI images of the roots acquired with a flatbed scanner
(Epson Expression 11000XL, Epson, Suwa, Japan) using the WinRhizo software (Regent
Instruments, Ville de Québec, Canada).
Three replicates were stored at -80 °C until analysis, then shoot and root tissue samples were
taken from them for enzymatic activity assays. Each enzymatic assay (n = 9) was carried out
in triplicate on each plant.
A further trial was performed following the same procedure and timing of the main
experiment, and using the same sand-soil mixture (1:1 w/w), but this time it was not
sterilized. We took SPAD readings, and measured fresh and dry weights, and root
morphological parameters of plants grown in unsterilized soil, as reported above
(Supplementary Material, Table SM1).
Bioassay to test the biological activity of sedaxane
In order to investigate the biological activity of sedaxane, we measured the reduction in root
growth in the model plant watercress (Lepidium sativum L.) to assess auxin-like activity, and
the increase in shoot length in lettuce (Lactuca sativa L.) to assess gibberellin-like activity
(Audus 1972).
Watercress and lettuce seeds were surface-sterilized by immersion in 8% hydrogen peroxide
for 15 minutes. After rinsing 5 times with sterile distilled water, 20 seeds were aseptically
placed on filter paper in a Petri dish. In the case of watercress, the filter paper was moistened
with 1.2 mL of H2O (controls), or with 1.2 mL of 0.1, 1, 10 and 20 mg L-1
indoleacetic acid
(IAA, natural auxin) (Sigma-Aldrich, St. Louis, MO, USA) to obtain the calibration curve, or
with 1.2 mL of a serial dilution of the tested product Vibrance containing 500 g L-1
of AI
sedaxane. The experimental design for lettuce was the same as for watercress, except that the
sterile filter paper was moistened with 1.4 mL of the above solutions, while the calibration
curve was a progression of 0.0001, 0.001, 0.01 and 0.1 mg L-1
gibberellic acid (GA) (Sigma-
Aldrich, St. Louis, MO, USA).
Seeds were germinated in the dark at 25 °C. After 48 h, the watercress seedlings were
removed from the dishes and the roots measured with a digital gauge; after 72 h, the lettuce
seedlings were removed and the shoots measured with a digital gauge.
A linear regression model (y = a + bx) was used to describe the dose-response relationship
after logarithmic transformation of IAA, GA and the sedaxane doses, where x was the
sedaxane concentration (g L-1
) and y the root or shoot length (mm) (Conselvan et al. 2017).

167
Protein extraction and determination
Fresh leaf and root samples, previously stored at -80 °C, were ground to a homogenous
powder with liquid N2. Proteins were extracted by homogenizing 0.5 g of root or shoot
materials with 5 mL of 38 mM KH2PO4 and 62 mM K2HPO4, pH 7, at 4 °C. After 2 minutes,
the extract was filtered through three layers of muslin and centrifuged at 15,000 g for 20 min
at 4 °C. A 50 µL supernatant sample was incubated with 50 µL of Milli-Q water and 2.5 mL
of 0.00117 M Bradford reagent. After 15 min, the protein concentration in the extract was
determined according to Bradford (1976), using a Jasco V-530 UV/Vis spectrophotometer
(Jasco Corporation, Tokyo, Japan) at 595 nm wavelength. The protein concentration was
expressed as mg of protein per g of fresh root or shoot.
Enzyme extraction and assay conditions
To extract the enzymes involved in N reduction and assimilation pathways, fresh shoot and
root samples were ground to a homogeneous powder with liquid N2. Each activity assay was
carried out in triplicate and with 3 biological repetitions using specific buffers for enzyme
extraction.
Glutamine synthetase (GS; EC 6.3.1.2) was extracted by homogenizing 0.6 g of root or shoot
material at 4 °C with 2.4 mL of a solution of 1 mM Tris(hydroxymethyl)aminomethane HCl
(Tris-HCl), 25 mM KH2PO4, 10 mM L-cysteine hydrochloride monohydrate and 3% (w/v)
bovine serum albumin at pH 7.8 (Baglieri et al. 2014). After 10 min, the extract was filtered
through two layers of gauze and centrifuged at 15,000 g for 25 min at 4 °C. A 200 L sample
of supernatant was incubated with 200 L of reaction buffer (50 mM Tris-HCl, 20 mM
MgSO4, 80 mM L-glutamate, 30 mM NH2OH, 24 mM ATP, pH 7.8) at 37 °C for 25 min.
Reaction was blocked with a stopping solution (0.5 mL of 370 mM FeCl2·6H2O and 670 mM
HCl). Samples were centrifuged at 15,000 g for 15 min. The amount of -glutamyl
hydroxamate in the supernatant was determined photometrically (wavelength 540 nm)
against an immediately-stopped parallel sample (Jezek et al. 2015). A standard curve was
made using authentic -glutamyl hydroxamate (GHA) proportional to absorbance intensity.
Enzyme activity was expressed as mol of GHA produced per g of fresh root or leaf tissue
per minute (Conselvan et al. 2017).
Glutamate synthase (GOGAT; EC 1.4.7.1) was extracted by homogenizing 0.5 g of root or
shoot material with 2 mL of a solution of 100 mM Tris-HCl, pH 8.2, 10 mM MgCl2·6H2O, 2

168
mM -mercaptoethanol, 10% (v/v) glycerol and 1 mM Na2EDTA. After 15 min, the extract
was filtered through two layers of gauze and centrifuged at 15,000 g for 30 min at 4 °C. The
supernatant was centrifuged a second time at 15,000 g for 15 min at 4 °C. For the enzyme
assay, 100 L of extract was added to 900 L of reaction buffer (41.6 mM HEPES, pH 7.5, 1
mM NADH, 10 mM EDTA, 20 mM glutamine) and 300 L (for leaf extract) or 900 L (for
root extract) of 10 mM -ketoglutaric acid. The reaction time was 2 min for the shoot extract,
and 1.5 min for the root extract at 30 °C. GOGAT was assayed spectrophotometrically by
monitoring NADH oxidation at wavelength 340 nm according to Avila et al. (1987). GOGAT
activity was expressed as nmol NADH reduced per g of fresh root or shoot per minute.
For the phenylalanine ammonia-lyase (PAL; EC 4.3.1.5) assay, 1 g of shoot material was
homogenized with 0.1 g of poly(vinylpolypyrrolidone) (PVPP) and 5 mL of 100 mM
potassium phosphate buffer (pH 8.0) containing 1.4 mM -mercaptoethanol. After 10 min,
the extract was filtered through two layers of gauze and centrifuged at 15,000 g for 20 min at
4 °C. A 60 L sample of supernatant was incubated with 400 L of 100 mM Tris-HCl buffer
(pH 8.8), 140 L of 100 mM phosphate buffer and 200 L of 40 mM phenylalanine, at 37 °C
for 30 min. Reaction was stopped with 200 L 6 M HCl (El-Shora 2002). After centrifuging
at 10,000 g for 15 min, the absorbance of the supernatant was measured at 280 nm against an
immediately-stopped parallel sample. A standard curve was made using authentic cinnamic
acid at increasing dilutions. PAL activity was expressed as nmol cinnamic acid produced per
mg of protein in the sample per minute.
Soluble phenols extraction and determination
Soluble phenolic acids were extracted by homogenizing 200 mg of leaf material with 600 mL
of pure methanol. The extract was kept on ice for 30 min then centrifuged at 15,000 g for 30
min at 4 °C. Total phenols were measured according to the procedure described by Arnaldos
et al. (2001). In brief, 1 mL of 2% Na2CO3 and 75 μL of Folin-Ciocalteau reagent (Sigma-
Aldrich, St. Louis, MO, USA) were added to 50 μL of the phenolic extract. After incubation
in the dark for 15 min at 25 °C, absorbance was measured at 725 nm. A standard curve was
made using authentic gallic acid. The soluble phenol content was expressed as mg of gallic
acid equivalent (GAE) per g of fresh shoot material.
Free phenolic acid concentrations were revealed on 0.1 g shoot samples treated with 5 mL
80% (v/v) acetonitrile (ACN) in 10 mL tubes for 5 min at room temperature with agitation
(70 rpm). After centrifugation (5 min, 10,000 RCF), clear supernatant was filtered at 0.2 µm

169
(Acrodisc syringe filters with GHP membranes) and kept in clean tubes at -20 °C until
processing. HPLC analysis was carried out according to the method described by Adom et al.
(2003) with modifications. Samples were manually shaken, then 200 µL was extracted and
placed in vials for HPLC autosampling. The mobile phase was 0.25% (v/v) trifluoroacetic
acid (TFA, solvent A) and pure ACN (solvent B). The HPLC gradient was linear: after 2 µL
sample injection, solvent B was kept at 4% for 1.16 min, then increased gradually to 12%
over 1.16 min, to 23% over 4.63 min, to 95% over 1.85 min, and to 100% over 1.16 min,
with final rate maintained for a further 2.78 min. The duration of the analysis was 11.58 min
at a solvent flow rate of 1.1 mL min-1
. The HPLC equipment (Shimadzu, Kyoto, Japan) had a
UV diode array detector (SPD-M20A) at wavelength 282 nm, and an Ultra Tech sphere C18
analytical column (33 mm × 4.6 mm i.d., 1.5 m particle size; Cil Cluzeau, Sainte-Foy-La-
Grande, France) kept at 36 °C. Control sample solutions of shoots containing known phenolic
acid concentrations were analyzed at the beginning of each new batch analysis, and
measurement accuracy was verified by checking expected concentrations.
Each peak was identified by analyzing the retention time and absorbance spectrum of each
pure compound (i.e., p-Coumaric, caffeic, syringic, vanillic and t-ferulic acids;
supplementary Fig. 1). The coefficients of determination of all calibration curves were >
99%.
Quantitative determination of sugars
Shoots (5 g) were homogenized in methanol (20 mL) with an Ultra Turrax T25 at 13,500 rpm
for 30 s until they attained uniform consistency. Samples were filtered once through filter
paper (589 Schleicher), and a second time through cellulose acetate syringe filters (0.45 µm).
The extract was then ready for HPLC analysis, for which we used a Jasco X-LC liquid
chromatography system (Jasco Inc., Easton, MD, USA) consisting of a PU-2080 pump, an
MD-2015 multiwavelength detector, an AS-2055 autosampler, and a CO-2060 column oven
interfaced to a PC using the ChromNAV chromatography data system software (Jasco Inc.,
Easton, MD, USA).
Sugars were separated in a HyperRez XP Carbohydrate Pbþþ analytical column (7.7 mm ×
300 mm; ThermoFisher Scientific, Waltham, MA, USA), operating at 80 °C. Isocratic elution
was carried out with water at a flow rate of 0.6 mL min-1
. D-()-glucose and D-()- fructose
were quantified by a calibration method. Standards were dissolved in water and the
calibration curves were generated with concentrations ranging from 100 mg L-1
to 1,000 mg

170
L-1
(Nicoletto et al. 2013).
Statistical analysis
The data are the means of measurements from three different pots per treatment. The analysis
of variance (ANOVA) was performed in the SPSS 23 (IBM Corp) software, and was
followed by pairwise post-hoc analyses (Student-Newman-Keuls test) to determine
significant differences among means at P 0.05.
171
Results
Audus test and effects of sedaxane on shoot and root growth
Ahead of the analysis, the Audus test was used to determine the biostimulant properties of the
active ingredient sedaxane. As with the natural auxin IAA, which reduces root elongation in
the model plant watercress and is dose-proportional, increasing concentrations of sedaxane
led to a progressive reduction in root length, suggesting an auxin-like effect (Fig. 1). We also
found sedaxane to exhibit gibberellin-like activity, as it enhanced the shoot growth of lettuce
and had a similar dose-proportionality to exogenous gibberellic acid (Fig. 2). Both regression
curves were significant (P < 0.02 for root responses, P ≤ 0.05 for shoot responses), revealing
the hormone-like activity of this fungicide.
Under sterile conditions, fungicide treatment did not significantly enhance plant growth,
although the medium dose of sedaxane (75 μg seed-1
) appreciably increased shoot (+21%)
and root (+10%) biomasses as compared to untreated controls (Table 1). The effects of the
seed treatments were more evident on other root features: Root length increased by 60% and
root area by 45% at the intermediate fungicide dose. While root diameter was slightly smaller
(P > 0.05), the number of root tips and forks increased, most noticeably with the intermediate
(tips +27%, forks +51%) and maximum doses (tips +17%, forks +48%), although only the
root branching increase was significant. These results show that root stimulation by sedaxane
may be dose-dependent up to saturation.

172
R2 b P
IAA 0.99 -1.76 0.00
Sedaxane 0.79 -0.197 0.02
Fig. 1 Audus test: auxin-like activity of sedaxane measured as root length variations in watercress. Linear
regression analysis (below) performed on 20 samples and averaged over 5 replicates. Note that the x axis has a
logarithmic scale.
y = -0.197ln(x) + 18.112 R² = 0.7917
4
8
12
16
20
0.001 0.01 0.1 1 10 100 1000
Ro
ot
len
gth
(m
m)
Sedaxane (g L-1)
Sedaxane - IAA activity
y = -1.764ln(x) + 11.371 R² = 0.9945
4
8
12
16
20
0.01 0.1 1 10 100
Ro
ot
len
gth
(m
m)
IAA (mg L-1)
IAA
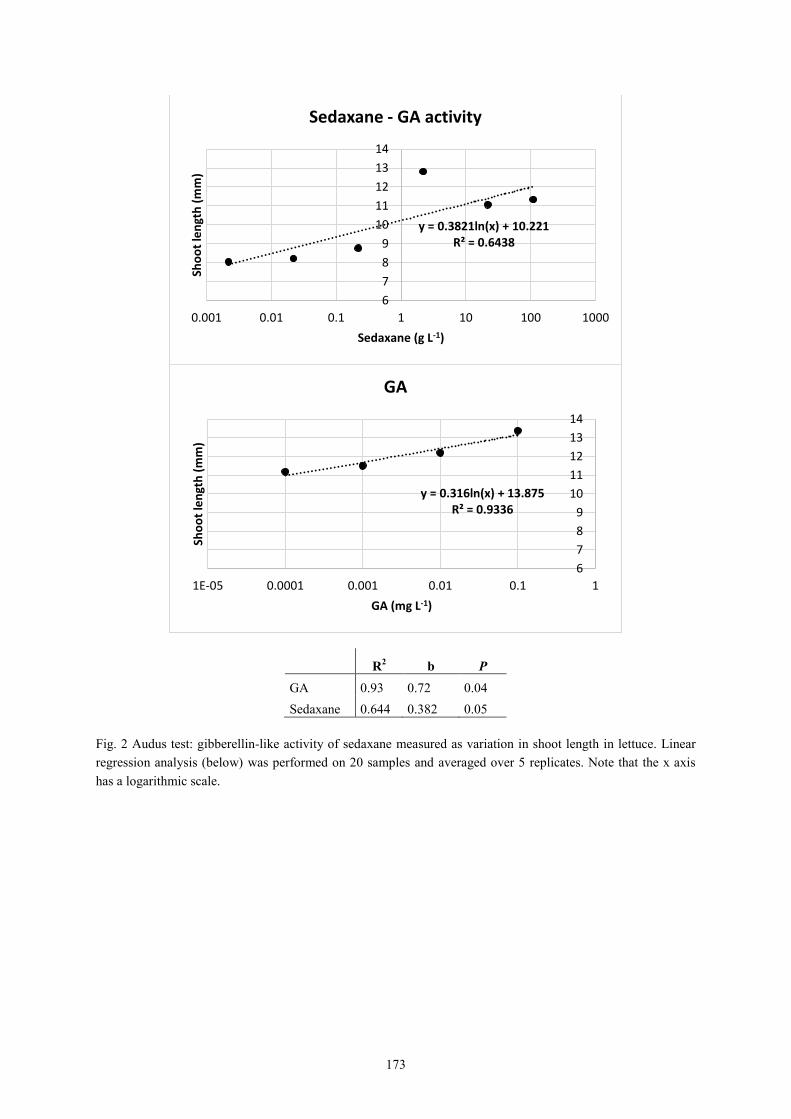
173
R2 b P
GA 0.93 0.72 0.04
Sedaxane 0.644 0.382 0.05
Fig. 2 Audus test: gibberellin-like activity of sedaxane measured as variation in shoot length in lettuce. Linear
regression analysis (below) was performed on 20 samples and averaged over 5 replicates. Note that the x axis
has a logarithmic scale.
y = 0.3821ln(x) + 10.221 R² = 0.6438
6
7
8
9
10
11
12
13
14
0.001 0.01 0.1 1 10 100 1000
Sho
ot
len
gth
(m
m)
Sedaxane (g L-1)
Sedaxane - GA activity
y = 0.316ln(x) + 13.875 R² = 0.9336
6
7
8
9
10
11
12
13
14
1E-05 0.0001 0.001 0.01 0.1 1
Sho
ot
len
gth
(m
m)
GA (mg L-1)
GA
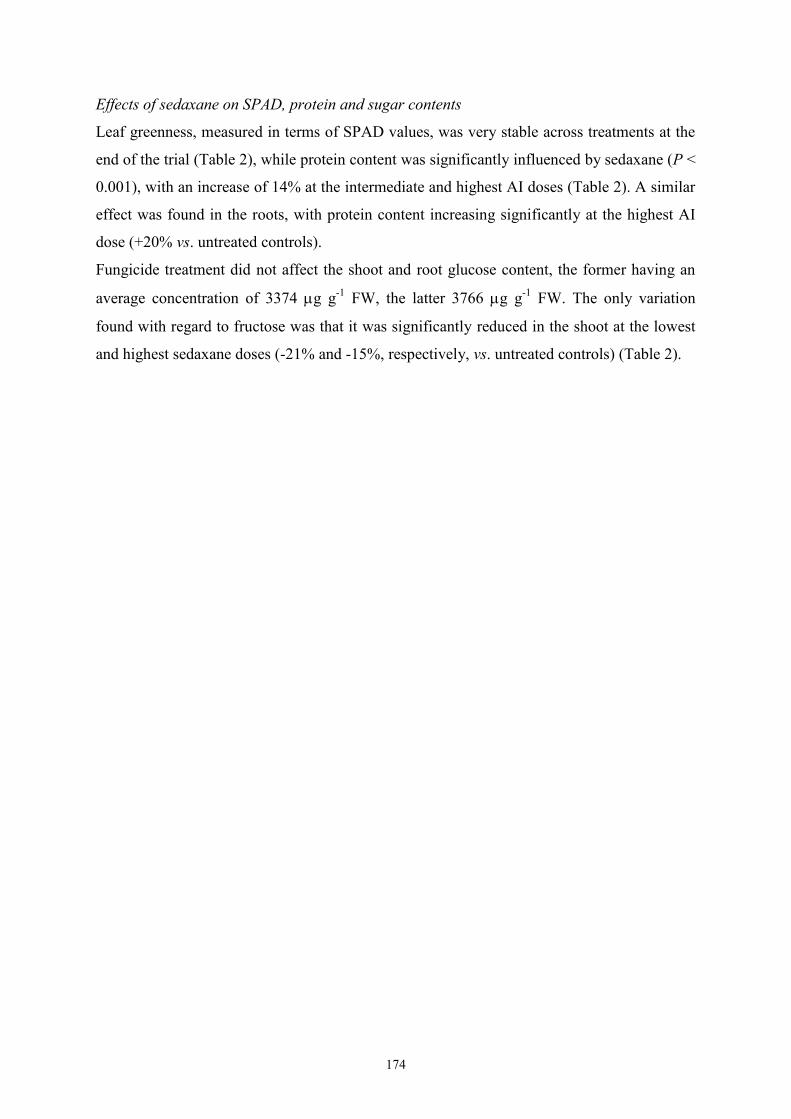
174
Effects of sedaxane on SPAD, protein and sugar contents
Leaf greenness, measured in terms of SPAD values, was very stable across treatments at the
end of the trial (Table 2), while protein content was significantly influenced by sedaxane (P <
0.001), with an increase of 14% at the intermediate and highest AI doses (Table 2). A similar
effect was found in the roots, with protein content increasing significantly at the highest AI
dose (+20% vs. untreated controls).
Fungicide treatment did not affect the shoot and root glucose content, the former having an
average concentration of 3374 g g-1
FW, the latter 3766 g g-1
FW. The only variation
found with regard to fructose was that it was significantly reduced in the shoot at the lowest
and highest sedaxane doses (-21% and -15%, respectively, vs. untreated controls) (Table 2).

175
Table 1 Main shoot and root parameters (mean ± SE; n = 3) in Zea mays at 20 days after sowing (DAS) in sterilized pot soil under increasing seed-applied doses of
sedaxane. Letters indicate significant differences among treatments within the same parameter (Student-Newman-Keuls test, P ≤ 0.05). In brackets: % variation vs.
untreated controls.
Sedaxane
dose
(μg seed-1
)
Shoot Root
DW
(g plant-1
)
DW
(g plant-1
)
Length
(m plant-1
)
Area
(m2 plant
-1)
Diameter
(mm)
Tips
(n plant-1
)
Forks
(n plant-1
)
0 0.50±0.07a 0.24±0.03
a 130.2±35
b 0.23±0.04
b 1.81±0.13
a 6657±1769
a 10594±2280
a
25 0.52±0.04a (+3) 0.25±0.03
a (+3) 167.4±6
ab (+29) 0.26±0.01
ab (+14) 1.54±0.03
a (–15) 6180±957
a (–7) 12649±1681
ab (+19)
75 0.61±0.04a (+21) 0.26±0.01
a (+10) 208.0±24
a (+60) 0.33±0.03
a (+45) 1.59±0.10
a (–12) 7784±994
a (+17) 15985±1849
b (+51)
150 0.53±0.04a (+6) 0.24±0.01
a (+1) 184.9±16
ab (+42) 0.31±0.02
ab (+37) 1.68±0.10
a (–7) 8467±405
a (+27) 15711±718
b (+48)
Table 2 Leaf SPAD values, shoot and root protein, glucose, and fructose contents (mean ± SE; n = 9) in Zea mays at 20 days after sowing (DAS) in sterilized pot soil
under increasing seed-applied doses of sedaxane. Letters indicate significant differences among treatments within the same parameter (Student-Newman-Keuls test, P
≤ 0.05). In brackets: % variation vs. untreated controls.
Sedaxane dose
(μg seed-1
)
Shoot
Root
SPAD
Protein
(mg g-1
FW)
Glucose
(μg g-1
FW)
Fructose
(μg g-1
FW)
Protein
(mg g-1
FW)
Glucose
(μg g-1
FW)
Fructose
(μg g-1
FW)
0 34.6±0.8 a 5.6±0.1
b 3328±170
a 1005±24
a 1.5±0
b 3819±128
a 1322±56
a
25 34.1±0.2a (-1) 5.9±0.1
ab (+5) 3310±33
a (–1) 792±35
b (–21) 1.5±0.1
b 3724±163
a (–2) 1418±109
a (+7)
75 34.7±0.9a (+0.5) 6.4±0.2
a (+14) 3340±113
a 1012±59
a (+1) 1.5±0.1
b 3665±140
a (–4) 1476±125
a (+12)
150 34.3±0.8a (–0.5) 6.4±0.2
a (+14) 3518±70
a (+6) 855±14
b (–15) 1.8±0
a (+20) 3859±384
a (+1) 1313±191
a (–1)
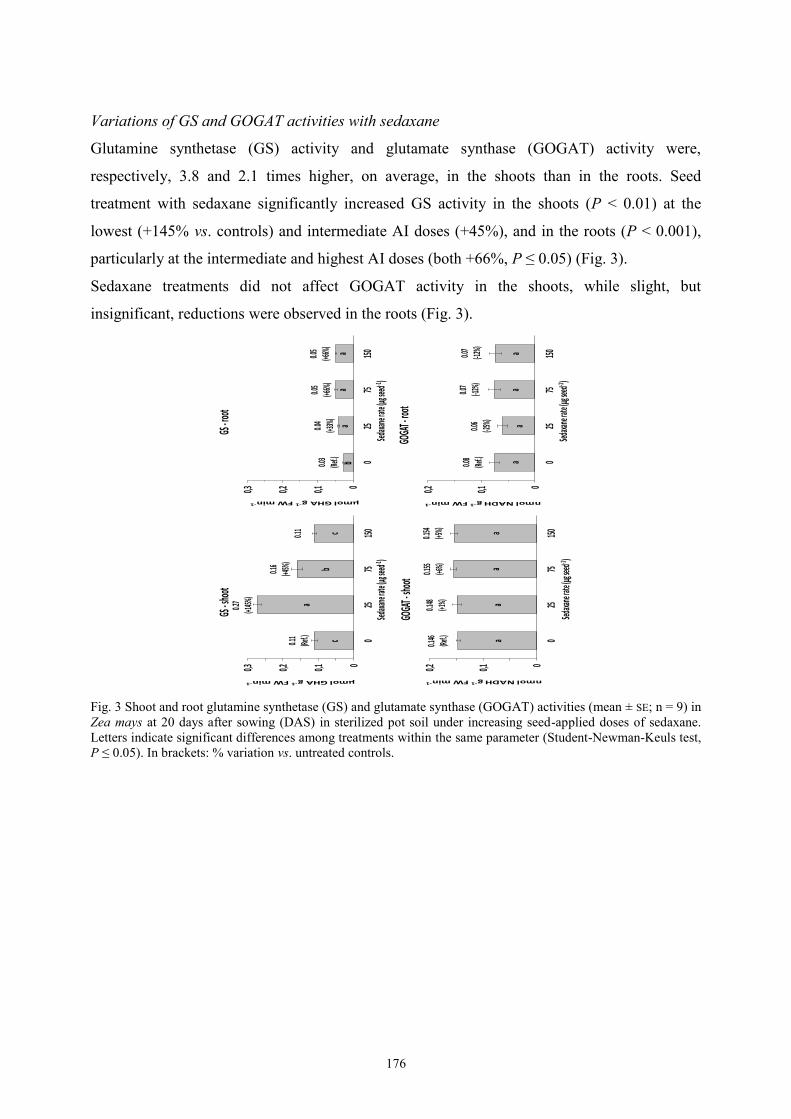
176
Variations of GS and GOGAT activities with sedaxane
Glutamine synthetase (GS) activity and glutamate synthase (GOGAT) activity were,
respectively, 3.8 and 2.1 times higher, on average, in the shoots than in the roots. Seed
treatment with sedaxane significantly increased GS activity in the shoots (P < 0.01) at the
lowest (+145% vs. controls) and intermediate AI doses (+45%), and in the roots (P < 0.001),
particularly at the intermediate and highest AI doses (both +66%, P ≤ 0.05) (Fig. 3).
Sedaxane treatments did not affect GOGAT activity in the shoots, while slight, but
insignificant, reductions were observed in the roots (Fig. 3).
Fig. 3 Shoot and root glutamine synthetase (GS) and glutamate synthase (GOGAT) activities (mean ± SE; n = 9) in
Zea mays at 20 days after sowing (DAS) in sterilized pot soil under increasing seed-applied doses of sedaxane.
Letters indicate significant differences among treatments within the same parameter (Student-Newman-Keuls test,
P ≤ 0.05). In brackets: % variation vs. untreated controls.
aa
aa
00,10,2
025
75150
nmolNADHg-1FWmin-1
Sedaxa
nera
te(µg
seed
-1 )
GOGA
T-roo
t
0.08
(Ref.)
0.06
(-25%
)
0.07
(-12%
)0.0
7(-1
2%)
aa
aa
00,10,2
025
75150
nmolNADHg-1FWmin-1
Sedaxa
nera
te(µg
seed
-1 )
GOGA
T-sho
ot
0.146
(Ref.)
0.148
(+1%)
0.155
(+6%)
0.154
(+5%)
c
a
bc
00,10,20,3
025
75150
μmolGHAg-1FWmin-1
Sedaxa
nera
te(µg
seed
-1 )
GS-s
hoot
0.11
(Ref.)
0.27
(+145%
)
0.16
(+45%
)0.1
1
ba
aa
00,10,20,3
025
75150
μmolGHAg-1FWmin-1
Seda
xaner
ate(µ
gseed
-1 )
GS-r
oot
0.03
(Ref.)
0.04
(+33%
)
0.05
(+66%
)
0.05
(+66%
)

177
Effect of sedaxane on leaf phenylpropanoid metabolism
A significant increase in soluble phenolic acids in the shoots was observed at the lowest
sedaxane dose (+14% vs. untreated controls), while values similar to controls were detected at
greater AI doses (P ≤ 0.05) (Table 3). However, when individual compounds were analyzed,
large differences among treatments were detected for caffeic acid, and, to a lesser extent, for
syringic and p-coumaric acids (P≤0.05). Significantly higher concentrations of caffeic acid
were found in all treated plants compared with untreated controls (P ≤ 0.05). Sedaxane
increased caffeic acid by 41-58%, depending on the dose, and p-coumaric acid, the most
abundant phenolic compound, by 23% at the lowest and 19% at the intermediate dose. There
were only slight differences in the vanillic and t-ferulic acid contents in treated plants as
compared with controls (P > 0.05).
The ANOVA revealed a significant increase (P ≤ 0.05) in PAL enzyme activity in the shoots
with the lowest and highest fungicide doses (+29% and +43%, respectively) as compared with
untreated controls (Table 3).

178
Table 3 Shoot phenylalanine ammonia-lyase activity (PAL), soluble phenol content and phenolic acid profiles (mean ± SE; n = 9) of Zea mays at 20 days after sowing
(DAS) in sterilized pot soil under increasing seed-applied doses of sedaxane. Letters indicate significant differences among treatments within the same parameter
(Student-Newman-Keuls test, P ≤ 0.05). In brackets: % variation vs. untreated controls.
Sedaxane dose
(μg seed-1
)
PAL
(nmol cinn. acid mg−1
prot. min−1
)
Soluble phenols
(as mg gallic acid
g−1
FW)
Vanillic acid
(μg g−1
FW)
Caffeic acid
(μg g−1
FW)
Syringic acid
(μg g−1
FW)
p-coumaric acid
(μg g-1
FW)
t-ferulic acid
(μg g-1
FW)
0 3.1±0.12b 36.4±1.5
b 0.78±0.06
a 2.88±0.24
b 11.7±0.6
b 21±0.9
b 0.72±0.04
25 3.99±0.28a (+29) 41.4±0.8
a (+14) 0.63±0.06
a (-19) 4.14±0.24
a (+44) 14.6±0.9
a (+25) 25.8±1.9
a (+23) 0.83±0.07 (+15)
75 3.08±0.22b
(-1) 35.1±1b
(-4) 0.63±0.03a (-19) 4.55±0.43
a (+58) 13.8±0.6
ab (+18) 24.9±0.6
a (+19) 0.82±0.03 (+14)
150 4.42±0.26a (+43) 35.2±2
b (-3) 0.63±0.05
a (-19) 4.06±0.34
a (+41) 12.4±0.6
ab (+6) 21.9±1
b (+4) 0.74±0.03 (+3)

179
Discussion
Sedaxane belongs to the new class of succinate dehydrogenase inhibitors, and is currently used
as a seed-coating fungicide on various crops in several countries, with registration approval
being increasingly granted worldwide. It is a broad-spectrum antifungal agent, and is of
particular interest in combatting Rhizoctonia solani and Mycosphaerella reliana in maize.
In light of previous results on root stimulation in wheat (Barchietto et al. 2012), we
investigated the side-effects of sedaxane in maize over and above its protective capacity, and
found that seed treatment significantly modified morphological traits and physiological
activities in disease-free plants grown in sterile soil.
The Audus test is considered to be the most reliable bioassay in terms of reproducibility and
repeatability for verifying and quantifying the biostimulant activity of molecules in plants, and
can be used to ascertain whether an exogenous compound has auxin- and/or gibberellin-like
activity (Conselvan et al. 2017). Auxin (IAA) is the most important hormone in plants, and is
involved in several plant growth and development phases, such as embryogenesis,
organogenesis, tissue patterning and tropisms (Davies 2010). Molecular genetic studies have
brought to light the central role of auxin in primary root elongation, lateral root initiation, and
root hair development (De Smet et al. 2006; Overvoorde et al. 2010). The phytohormone
gibberellin (GA) also modulates plant development by lengthening roots and stems, and
expanding leaves (Fleet and Sun 2005). We used an Audus bioassay to demonstrate that
sedaxane has both auxin- and gibberellin-like activity, as the confirmation of its biostimulant
properties.
Although the improvements in aerial and root biomasses detected in this trial were not
significant, we found that root length and area, and the number of root tips and branches
increased almost in proportion to the dose of sedaxane, consistent with results reported by
Colla et al. (2014) on maize coleoptile elongation with protein hydrolysates. All these root
morphology modifications are known responses to biostimulant compounds (Calvo et al.
2014). Root development is essential for plant survival as it plays a crucial role in water and
nutrient acquisition for growth, the synthesis and accumulation of secondary metabolites, and
interaction with soil organisms (Saini et al. 2013).
The data collected from this trial are consistent with Barchietto et al. (2012) regarding
stimulation of wheat shoots and roots by seed-applied sedaxane. At 30 days after sowing

180
(DAS), they observed significant increases in root length in treated plants as compared with
controls, and no differences in root biomass, as in our case study at 20 DAS. Interestingly, they
also found that at 60 DAS root length was unaffected by sedaxane seed treatment, whereas root
biomass increased significantly (+39-87%, according to variety).
In the sterile soil conditions of our trial, the SPAD value was very stable across treatments, but
this was not the case in the supplementary trial we carried out in unsterile soil conditions to
investigate the potential effect of sedaxane in field-like conditions, where we found a slight but
significant increase in SPAD (up to 7%) (Table SM1). This result is in line with practical
expectations in the field given the correlation between SPAD and photosynthetic activity, the
N status of the plant and protein contents (Prost and Jeuffroy 2007; Sim et al. 2015).
It should be noted that sedaxane may affect not only fungal mitochondria but also the SDH
complex II of plants, partially inhibiting its activity (Avenot and Michailides 2010). Fuentes et
al. (2011) reported better photosynthetic performance in Arabidopsis plants with compromised
expression of the flavoprotein subunit of SDH than in wild-type plants. Inhibition of the SDH
subunit also resulted in an increase in the number and aperture of leaf stomata, which
significantly increased CO2 assimilation, in turn enhancing growth and protein production.
Araújo et al. (2011) obtained similar results with tomato plants with antisense inhibition of the
iron-sulfur subunit of SDH. However, the higher SPAD values of sedaxane-treated maize
observed in our supplementary study with unsterilized soil may also be related to a slowing
down of chlorophyll molecule degradation, as reported for fungicides of the Strobilurin class
(Grossmann and Retzlaff 1997; Xu and Huang 2009). However, this hypothesis needs to be
confirmed by studying SDH activity and chlorophyll content in sedaxane-treated plants.
The higher protein content in sedaxane-treated seedlings may be ascribed to better nitrogen
metabolism through the activity of the enzymes involved. In fact, the GS/GOGAT metabolic
pathway is the main route of N assimilation in higher plants (Mokhele et al. 2012), allowing
ammonium taken up directly or originating from nitrate to be assimilated into amino acids (Xu
et al. 2012). The GS enzyme is also critical for re-assimilation of the NH4+ constantly released
in large amounts via photorespiration, phenylalanine consumption for lignin biosynthesis, and
protein catabolism (Lea and Miflin 2011). GS activity, which increased significantly following
sedaxane application, therefore plays a pivotal role in many aspects of plant development
(Seabra and Carvalho 2014), as it is a key component in nitrogen use efficiency (NUE) and
plant yield (Thomsen et al. 2014).

181
GS and GOGAT enzyme activities have been previously reported to be affected by
biostimulants (Baglieri et al. 2014). Our data are consistent with those of Ajigboye et al.
(2016), who found that improvements in the photosynthetic efficiency, growth, and biomass of
sedaxane-treated wheat plants were associated with up- or down-regulation changes in gene
expression, and consequent modifications of physiological processes, particularly under
drought stress conditions. In particular, sedaxane is reported to induce transcriptional
regulation of genes and transcriptional factors, altering the flavonoid and phenolic metabolism
(Ajigboye et al. 2016). Our study confirmed that sedaxane stimulates phenylpropanoid
metabolism in maize as we found an increase in PAL enzyme activity, although, unexpectedly,
the effect was not observed at the intermediate dose. The PAL enzyme catalyzes the first
metabolic step from primary to secondary metabolism (Douglas 1996), deaminating
phenylalanine to produce cinnamic acid. As a consequence, there was an increase in the total
content of phenolic compounds in shoot tissues from seedlings treated with the lowest
concentration of sedaxane, but not at the highest dose. However, there were substantial changes
in the concentrations of individual phenolic acids in relation to fungicide application: In
particular, there was a considerable increase in caffeic acid in treated plants, which may be of
interest in view of its weak auxin-like effect (Ishikura et al. 2001; Lavee et al. 1986; Nagasawa
et al. 2016). The main precursor of lignin in the cell wall of gramineous plants is p-coumaric
acid, and a greater abundance of it in sedaxane-treated plants could contribute to more intense
cell activity and division. Vanillic and p-coumaric acids are also reported to be antifungal
phenols, meaning that sedaxane may also contribute indirectly to plant defense (Lattanzio et al.
2006; Pusztahelyi et al. 2015; Zabka and Pavela 2013). Stimulation of the secondary
metabolism may also be explained by enhanced primary metabolism activity, as evidenced by
the protein and sugar contents (Table 2).
As with other SDHIs studied in wheat, all the physiological changes brought about by
sedaxane may also delay senescence, and improve the yield and protein content of maize plants
(Abdelrahman et al. 2017; Bayles 1999; Dimmock and Gooding 2002; Zhang et al. 2010), but
this requires further investigation in current field conditions.
We conclude that sedaxane has a considerable effect on rooting power of maize, particularly on
the length, surface area and number of lateral roots. This study found that sedaxane exhibits
biostimulant activity in maize seedlings due to its hormone-like activities, corroborated by the
fact that most of the observed effects are saturated at moderate doses, as with phytohormones.

182
We have high expectations that seed treatment with this fungicide will facilitate plant
establishment, and may provide particular benefits under adverse soil and climatic conditions.
Stimulation of the enzyme activities involved in N assimilation and phenylpropanoid
metabolism is in agreement with previous findings on this active ingredient and other SDHI
fungicides, and is consistent with improved N status and antioxidant activity.
As the fungicide doses tested here are within the recommended label range, the biostimulant
activity of sedaxane is an additional benefit, over and above its protective role against seed-
and soil-borne diseases, which could be exploited in the cultivation of maize. Although further
studies are needed to see whether these improvements also influence final growth and yield,
our preliminary results suggest that, as things currently stand, roots may be enhanced in the
early growth stages, even in non-sterile soil.
Contributions
CDC oversaw the greenhouse trial, assisted with the laboratory analyses, collected and
analyzed the data, and wrote the first draft of the manuscript; GBC performed all the enzymatic
and biological assays, and also collected and analyzed the data, carried out the literature
research and improved the manuscript content; GB performed the HPLC analysis and assisted
with analysis of the statistical data; PC helped design the experiment, analyzed the data and
improved the manuscript content; LS helped revise the text; TV conceived the research idea,
and corrected and arranged the final version of this work. All authors contributed to the
interpretation and discussion of the results.
Funding
We gratefully thank Syngenta Crop Protection (Basel, Switzerland) for funding this research.
Giovanni Battista Conselvan was funded by a PhD grant from MIUR under “Law no. 170”,
and Paolo Carletti received DOR1692027/16 funding.
Acknowledgments
We thank Adriano Massignan for technical assistance in the greenhouse trial, Dr. Michael
Feitknecht for valuable revision of the text, and Tessa Say for revising the English text.

183
References
Abdelrahman M, El-Sayed M, Jogaiah S, Burritt DJ, Tran L-SP (2017) The “STAY-GREEN”
trait and phytohormone signaling networks in plants under heat stress. Plant Cell Rep
36: 1009-1025. doi: 10.1007/s00299-017-2119-y.
Adom KK, Sorrells ME, Liu RH (2003) Phytochemical profiles and antioxidant activity of
wheat varieties. J Agric Food Chem 51: 7825-7834. doi: 10.1021/jf030404l.
Ajigboye OO, Lu C, Murchie EH, Schlatter C, Swart G, Ray RV (2016) Altered gene
expression by sedaxane increases PSII efficiency, photosynthesis and growth and
improves tolerance to drought in wheat seedlings. Pestic Biochem Physiol.
Ajigboye OO, Murchie E, Ray RV (2014) Foliar application of isopyrazam and epoxiconazole
improves photosystem II efficiency, biomass and yield in winter wheat. Pestic Biochem
Physiol 114: 52-60. doi: 10.1016/j.pestbp.2014.07.003.
Araújo WL, Nunes-Nesi A, Osorio S, Usadel B, Fuentes D, Nagy R, Balbo I, Lehmann M,
Studart-Witkowski C, Tohge T, Martinoia E, Jordana X, DaMatta FM, Fernie AR
(2011) Antisense inhibition of the iron-sulphur subunit of succinate dehydrogenase
enhances photosynthesis and growth in tomato via an organic acid–mediated effect on
stomatal aperture. Plant Cell 23: 600-627. doi: 10.1105/tpc.110.081224.
Arnaldos TL, Munoz R, Ferrer MA, Calderon AA (2001) Changes in phenol content during
strawberry (Fragaria x ananassa, cv. Chandler) callus culture. Physiol Plant 113: 315-
322. doi: 10.1034/j.1399-3054.2001.1130303.x.
Audus LJ (1972) Plant growth substances. Leonard Hill, London.
Avenot HF, Michailides TJ (2010) Progress in understanding molecular mechanisms and
evolution of resistance to succinate dehydrogenase inhibiting (SDHI) fungicides in
phytopathogenic fungi. Crop Prot 29: 643-651. doi: 10.1016/j.cropro.2010.02.019.
Avila C, Botella JR, Cánovas FM, de Castro IN, Valpuesta V (1987) Different characteristics
of the two glutamate synthases in the green leaves of lycopersicon esculentum. Plant
Physiology 85: 1036-1039. doi: 10.1104/pp.85.4.1036.
Baglieri A, Cadili V, Mozzetti Monterumici C, Gennari M, Tabasso S, Montoneri E, Nardi S,
Negre M (2014) Fertilization of bean plants with tomato plants hydrolysates. Effect on
biomass production, chlorophyll content and N assimilation. Scientia Horticulturae 176:
194-199. doi: 10.1016/j.scienta.2014.07.002.
184
Barchietto T, Prévot C, Rambach O, Petit M, Seng JM, Schlatter C (2012) Sedaxane: towards a
new concept in plant protection? Phytoma 653: 7-10.
Bayles R (1999) The interaction of strobilurin fungicides with cereal varieties. Plant Var Seeds
12: 129-140.
Berdugo CA, Steiner U, Dehne HW, Oerke EC (2012) Effect of bixafen on senescence and
yield formation of wheat. Pestic Biochem Physiol 104: 171-177. doi:
10.1016/j.pestbp.2012.07.010.
Bradford M (1976) A rapid and sensitive method for the quantitation of microgram quantities
of protein utilizing the principle of protein-dye binding. Anal Biochem 72: 248-254.
Calvo P, Nelson L, Kloepper JW (2014) Agricultural uses of plant biostimulants. Plant Soil
383: 3-41. doi: 10.1007/s11104-014-2131-8.
Channabasava, Lakshman HC, Jorquera MA (2015) Effect of fungicides on association of
arbuscular mycorrhiza fungus Rhizophagus fasciculatus and growth of Proso millet
(Panicum miliaceum L.). J Soil Sci Plant Nutr 15: 35-45.
Chiocchio V, Venedikian N, Martinez A, Menendez A, Ocampo J, Godeas A (2000) Effect of
the fungicide benomyl on spore germination and hyphal length of the arbuscular
mycorrhizal fungus Glomus mosseae. Int Microbiol 3: 173-175.
Colla G, Rouphael Y, Canaguier R, Svecova E, Cardarelli M (2014) Biostimulant action of a
plant-derived protein hydrolysate produced through enzymatic hydrolysis. Front Plant
Sci 5: 448. doi: 10.3389/fpls.2014.00448.
Conselvan GB, Pizzeghello D, Francioso O, Di Foggia M, Nardi S, Carletti P (2017)
Biostimulant activity of humic substances extracted from leonardites. Plant Soil. doi:
10.1007/s11104-017-3373-z.
Cox WJ, Cherney JH (2014) Soybean seed treatments interact with locations for populations,
yield, and partial returns. Agron J 106: 2157-2162. doi: 10.2134/agronj14.0074.
Davies PJ (2010) The plant hormones: their nature, occurrence, and functions. In: PJ Davies
(ed) Plant Hormones: Biosynthesis, Signal Transduction, Action! Springer Netherlands,
Dordrecht.
De Smet I, Vanneste S, Inzé D, Beeckman T (2006) Lateral Root Initiation or the Birth of a
New Meristem. Plant Molecular Biology 60: 871-887. doi: 10.1007/s11103-005-4547-
2.

185
Dimmock J, Gooding MJ (2002) The effects of fungicides on rate and duration of grain filling
in winter wheat in relation to maintenance of flag leaf green area. J Agric Sci 138: 1-16.
Douglas CJ (1996) Phenylpropanoid metabolism and lignin biosynthesis: From weeds to trees.
Trends in Plant Science 1: 171-178. doi: 10.1016/1360-1385(96)10019-4.
EFSA (2012) Conclusion on the peer review of the pesticide risk assessment of the active
substance sedaxane. EFSA Journal 10: 2823.
Ehsanfat S, Modarres-Sanavy SAM (2005) Crop protection by seed coating. Commun Agric
Appl Biol Sci 70: 225-229.
El-Shora HM (2002) Properties of phenylalanine ammonia-lyase from marrow cotyledons.
Plant Science 162: 1-7. doi: 10.1016/s0168-9452(01)00471-x.
Fleet CM, Sun T-p (2005) A DELLAcate balance: the role of gibberellin in plant
morphogenesis. Current Opinion in Plant Biology 8: 77-85. doi:
10.1016/j.pbi.2004.11.015.
Fletcher RA, Gilley A, Sankhla N, Davis TD (2010) Triazoles as Plant Growth Regulators and
Stress Protectants. In: J Janick (ed) Horticultural Reviews. John Wiley & Sons, Inc.,
Oxford, UK.
Fuentes D, Meneses M, Nunes-Nesi A, Araújo WL, Tapia R, Gómez I, Holuigue L, Gutiérrez
RA, Fernie AR, Jordana X (2011) A deficiency in the flavoprotein of arabidopsis
mitochondrial complex II results in elevated photosynthesis and better growth in
nitrogen-limiting conditions. Plant Physiol 157: 1114-1127. doi:
10.1104/pp.111.183939.
Grossmann K, Retzlaff G (1997) Bioregulatory effects of the fungicidal strobilurin kresoxim-
methyl in wheat (Triticum aestivum). Pest Sci 50: 11-20.
Ishikura Y, Kojima Y, Terazawa M (2001) Effects of phenolic compounds on seed germination
of shirakamba birch, Betula platyphylla var. japonica. Eur J For Res 2: 17-25.
Jezek M, Geilfus CM, Muhling KH (2015) Glutamine synthetase activity in leaves of Zea
mays L. as influenced by magnesium status. Planta 242: 1309-1319. doi:
10.1007/s00425-015-2371-8.
Kauffman GL, Kneivel DP, Watschke TL (2007) Effects of a biostimulant on the heat
tolerance associated with photosynthetic capacity, membrane thermostability, and
polyphenol production of perennial ryegrass. Crop Science 47: 261-267. doi:
10.2135/cropsci2006.03.0171.

186
Kitchen JL, van den Bosch F, Paveley ND, Helps J, van den Berg F (2016) The Evolution of
Fungicide Resistance Resulting from Combinations of Foliar-Acting Systemic Seed
Treatments and Foliar-Applied Fungicides: A Modeling Analysis. PLoS One 11: 21.
doi: 10.1371/journal.pone.0161887.
Köhle H, Grossmann K, Jabs T, Gerhard M, Kaiser W, Glaab J, Conrath U, Seehaus K, Herms
S (2002) Physiological effects of the strobilurin fungicide F 500 on plants. In: WH
Dehne, HB Deising, U Gisi, KH Kuck, PE Russell, H Lyr (eds) Modern Fungicides and
Antifungal Compounds III. Agroconcept, Bonn, Germany. .
Krzyzinska B, Glazek M, Maczynska A (2005) Seed treatment for control leaf spot diseases of
spring wheat. Acta Agrobot 58: 37-43.
Lattanzio V, Lattanzio VM, Cardinali A (2006) Role of phenolics in the resistance mechanisms
of plants against fungal pathogens and insects. In: F Imperato (ed) Phytochemistry:
Advances in research. Research Signpost, Trivandrum, Kerala, India
Lavee S, Harshemesh H, Avidan N (1986) Phenolic acids - possible involvement in regulating
growth and alternate fruiting in olive trees. ActaHortic 179: 317-328. doi:
10.17660/ActaHortic.1986.179.46.
Lazo JV, Ascencio J (2014) Some morphometric and physiological responses induced by
fungicide Opera (R) (Pyraclostrobin plus Epoxiconazole) in corn (Zea mays L.). Rev
Fac Agron 31: 39-59.
Lea PJ, Miflin BJ (2011) Nitrogen assimilation and its relevance to crop improvement. Annu
Plant Rev 42: 1-40.
Mathre DE, Johnston RH, Grey WE (2001) Small grain cereal seed treatment. American
Phytopathological Society from
http://wwwapsnetorg/education/AdvancedPlantPath/Topics/SeedTreatment/.
May WE, Fernandez MR, Lafond GP (2010) Effect of fungicidal seed treatments on the
emergence, development, and grain yield of Fusarium graminearum-infected wheat and
barley seed under field conditions. Can J Plant Sci 90: 893-904. doi:
10.4141/cjps09173.
McGrath MT (2004) What are fungicides. The Plant Health Instructor.
Minamor AA (2013) Effect of two fungicides (Caocobre and Ridomil) on germination and
radicle elongation of cocoa (Theobroma cacao L) seedlings. IJPAS 15: 79-86.

187
Mokhele B, Zhan X, Yang G, Zhang X (2012) Review: Nitrogen assimilation in crop plants
and its affecting factors. Canadian Journal of Plant Science 92: 399-405. doi:
10.4141/cjps2011-135.
Mondal KK (2004) Evaluation of seed-dressing fungicides against sclerotinia root rot of
buckwheat. Fagopyrum 21: 105-107.
Nagasawa K, Wang B, Nishiya K, Ushijima K, Zhu Q, Fukushima M, Ichijo T (2016) Effects
of humic acids derived from lignite and cattle manure on antioxidant enzymatic
activities of barley root. J Environ Sci Health B 51: 81-89.
Nicoletto C, Santagata S, Tosini F, Sambo P (2013) Qualitative and healthy traits of different
Italian typical artichoke genotypes. Cyta-Journal of Food 11: 108-113. doi:
10.1080/19476337.2012.700951.
Overvoorde P, Fukaki H, Beeckman T (2010) Auxin control of root development. Cold Spring
Harb Perspect Biol 2: a001537.
Prost L, Jeuffroy M-H (2007) Replacing the nitrogen nutrition index by the chlorophyll meter
to assess wheat N status. Agron Sustain Dev 27: 321-330. doi: 10.1051/agro:2007032.
Pusztahelyi T, Holb IJ, Pócsi I (2015) Secondary metabolites in fungus-plant interactions.
Front Plant Sci 6: 573. doi: 10.3389/fpls.2015.00573.
Saini S, Sharma I, Kaur N, Pati PK (2013) Auxin: a master regulator in plant root
development. Plant Cell Reports 32: 741-757. doi: 10.1007/s00299-013-1430-5.
Scott JM (1989) Seed coating and treatments and their effects on plant establishment. Adv
Agron 42: 43-83. doi: 10.1016/s0065-2113(08)60523-4.
Seabra AR, Carvalho HG (2014) Glutamine synthetase in Medicago truncatula, unveiling new
secrets of a very old enzyme. Front Plant Sci 6: 578-578.
Sharma KK, Singh US, Sharma P, Kumar A, Sharma L (2015) Seed treatments for sustainable
agriculture - A review. J Nat Appl Sci 7: 521-539.
Sim C, Zaharah A, Tan M, Goh K (2015) Rapid determination of leaf chlorophyll
concentration, photosynthetic activity and NK concentration of Elaies guineensis via
correlated SPAD-502 chlorophyll index. Asian J Agric Res 9: 132-138.
Swart GM (2011) Root health - the key to improving yield. Syngenta Crop Protection AG,
Basel, Switzerland.
Thomsen HC, Eriksson D, Møller IS, Schjoerring JK (2014) Cytosolic glutamine synthetase: a
target for improvement of crop nitrogen use efficiency? Trends Plant Sci 19: 656-663.

188
Vermeulen P, Flémal P, Pigeon O, Dardenne P, Fernández Pierna J, Baeten V (2017)
Assessment of pesticide coating on cereal seeds by near infrared hyperspectral imaging.
J Spectral Imaging 6: 1-7.
Wu YX, von Tiedemann A (2001) Physiological effects of azoxystrobin and epoxiconazole on
senescence and the oxidative status of wheat. Pestic Biochem Physiol 71: 1-10. doi:
10.1006/pest.2001.2561.
Xu G, Fan X, Miller AJ (2012) Plant nitrogen assimilation and use efficiency. Annu Rev Plant
Biol 63: 153-182. doi: 10.1146/annurev-arplant-042811-105532.
Xu Y, Huang B (2009) Effects of foliar-applied ethylene inhibitor and synthetic cytokinin on
creeping bentgrass to enhance heat tolerance. Crop Sci 49: 1876-1884.
Zabka M, Pavela R (2013) Antifungal efficacy of some natural phenolic compounds against
significant pathogenic and toxinogenic filamentous fungi. Chemosphere 93: 1051-1056.
Zeun R, Scalliet G, Oostendorp M (2013) Biological activity of sedaxane–a novel broad‐
spectrum fungicide for seed treatment. Pest Manag Sci 69: 527-534.
Zhang Y-J, Zhang X, Chen C-J, Zhou M-G, Wang H-C (2010) Effects of fungicides JS399-19,
azoxystrobin, tebuconazloe, and carbendazim on the physiological and biochemical
indices and grain yield of winter wheat. Pestic Biochem Physiol 98: 151-157.

189
Supplementary material
Table SM1 Main shoot and root parameters (mean ± SE; n = 3) in Zea mays at 20 days after sowing (DAS) in unsterilized pot soil at increasing seed-applied doses of
sedaxane. Letters indicate significant differences among treatments within the same parameter (Student-Newman-Keuls test, P ≤ 0.05). In brackets: % variation vs.
untreated controls.
Sedaxane
dose
(μg seed-1
)
Shoot Root
DW
(g plant-1
)
SPAD
DW
(g plant-1
)
Length
(m plant-1
)
Area
(m2 plant
-1)
Diameter
(mm)
Tips
(n plant-1
)
Forks
(n plant-1
)
0 0.35±0.03a 27.9±0.7
b 0.17±0.01
a 137.4±9
b 0.21±0.01
b 1.55±0.05
a 4285±215
b 9798±1010
a
25 0.34±0.05a (-3) 28.4±0.6
ab (+2) 0.17±0.01
a 155.5±21
ab (+13) 0.23±0.03
ab (+10) 1.49±0.01
ab (-4) 3804±618
b (-11) 10111±1277
a (+3)
75 0.42±0.02a (+20) 28.4±0.7
ab (+2) 0.19±0.005
a (+12) 156.6±11
ab (+14) 0.23±0.02
ab (+10) 1.50±0.04
ab (-3) 4190±399
b (-2) 10298±796
a (+5)
150 0.42±0.04a (+20) 29.9±0.6
a (+7) 0.20±0.01
a (+18) 189.1±19
a (+38) 0.27±0.02
a (+29) 1.43±0.03
b (-8) 5479±131
a (+28) 11628±958
a (+19)

190
Supplementary Figure 1 Sample chromatogram of phenolic aid HPLC determination. The mobile phase was
0.25% (v/v) trifluoroacetic acid (TFA, solvent A) and pure ACN (solvent B). The HPLC gradient was linear: after
2 µL sample injection, solvent B was kept at 4% for 1.16 min, then increased gradually to 12% in 1.16 min, to
23% in 4.63 min, to 95% in 1.85 min, to 100% in 1.16 min, and the final rate was maintained for a further 2.78
min. Analysis had a duration of 11.58 min at a solvent flow rate of 1.1 mL min-1. The HPLC equipment
(Shimadzu, Kyoto, Japan) had a UV diode array detector (SPD-M20A) at wavelength 282 nm, and an Ultra Tech
sphere C18 analytical column (33 mm × 4.6 mm i.d., 1.5 m particle size; Cil Cluzeau, Sainte-Foy-La-Grande,
France) kept at 36 °

191
7 General Conclusions
This Ph.D. project evaluated the biostimulant activity of humic substances (HS) and of a
fungicide on the metabolism of agro-food plants.
It is well documented that HS increase plant growth, root system, and several physiological
processes. These responses are a result of a complex network of mechanisms of action and
there is an urgent need to better elucidate the causal/functional mechanism of HS.
In the first case of study, the proteomic approach revealed its potential to disclose the
complexity of the plant metabolic response to HS. In treated roots of Arabidopsis plants, it was
possible to observe that HS from heartworm faeces influenced the expression of enzymes
involved in the energy metabolism and respiration, which have essential functions for various
cellular processes such as biosynthesis of macromolecules (proteins, nucleic acids, amino
acids, fatty acids, secondary metabolites). An acceleration of energy processes resulted in a
higher ROS production and consequent up-regulation of ROS scavenging enzymes. Higher
growth rate of roots was also evidenced by increased the expression of proteins involved in cell
trafficking, cell division and protein production.
These results were confirmed by the metabolomics study, where we could analyse and compare
sugars and amino acids profiles of Arabidopsis plants treated with HS extracted from different
sources. We observed that different humic compounds induced different responses on test
plants and the responses are only partially justified by the presence of hormones in the HS
matrix. We could observe that plants under HS treatment had a significant reduction of
carbohydrates and free amino acids concentrations in roots to support the stimulation of protein
and energetic metabolism, which uphold the higher growth rate.
Similar results were also observed in the third case of study, where the biostimulant activity of
HS extracted from four leonardites was tested. On treated maize seedlings, HS positively
stimulated the elongation and proliferation of secondary roots, and the production of total
soluble proteins. These effects were also supported by an enhancement of nitrogen metabolism,
with an increment of GOGAT and GS enzymes activity. It was also observed a higher
accumulation of phenolic compounds and higher activity of PAL enzyme. As in the proteomic
study, the stimulation of this secondary metabolism pathway could be a response to the higher
energy production and growth rate.
192
These three studies contributed to improve the knowledge on the mechanisms of action of HS.
Even if HS were extracted from different sources were applied on different plant species, they
displayed similar biological activities. Proteomics and metabolomics studies confirmed that “–
omics” techniques are essential tools to have a ‘panoramic’ view on metabolic changes
happening inside an organism after a positive or negative external perturbation.
In the last chapter of the Ph.D. project, we investigated the potential biostimulant activity of
sedaxane, a succinate dehydrogenase inhibitor fungicide, on maize seedling. Under sterile
conditions, sedaxane enhanced length and growth of roots, with a contemporaneous stimulation
of proteins production, nitrogen and phenols metabolism. These additional benefits of the
studied fungicide, could facilitate plant establishment, especially when soil and climate
conditions are adverse. This suggests that biostimulant activity might not be relegated to humic
or humic-like compounds, but different substances might induce positive responses in plants.
Future research will be oriented in better elucidating the relationship between biostimulants
chemical structure and plant physiological responses, also by means of proteomics and
metabolomics analyses. Further studies should address the biostimulant responses in field and
natural environments and in plants under stress condition.
This could help for developing a new generation of biostimulants from natural resources or
from other sources such as actual pesticides.