Accelerated life testing in mechanical design - Padua ...
106
Sede Amministrativa: Università degli Studi di Padova Sede Consorziata: Università degli Studi di Bologna Dipartimento di Tecnica e Gestione dei Sistemi Industriali, DTG Vicenza Dipartimento di Ingegneria Industriale, DIN Bologna ___________________________________________________________________ CORSO DI DOTTORATO DI RICERCA IN INGEGNERIA MECCATRONICA E DELL’INNOVAZIONE MECCANICA DEL PRODOTTO CICLO XXXII Accelerated life testing in mechanical design Test accelerati nella progettazione meccanica Coordinatore: Chiar.ma Prof.ssa Daria Battini Supervisore: Ing. Massimiliano De Agostinis Co-Supervisore: Ing. Giorgio Olmi Dottorando: Ing. Francesco Robusto
-
Upload
khangminh22 -
Category
Documents
-
view
1 -
download
0
Transcript of Accelerated life testing in mechanical design - Padua ...

Sede Amministrativa: Università degli Studi di Padova
Sede Consorziata: Università degli Studi di Bologna
Dipartimento di Tecnica e Gestione dei Sistemi Industriali, DTG Vicenza
Dipartimento di Ingegneria Industriale, DIN Bologna
___________________________________________________________________
CORSO DI DOTTORATO DI RICERCA IN INGEGNERIA MECCATRONICA
E DELL’INNOVAZIONE MECCANICA
DEL PRODOTTO
CICLO XXXII
Accelerated life testing in mechanical
design Test accelerati nella progettazione meccanica
Coordinatore: Chiar.ma Prof.ssa Daria Battini
Supervisore: Ing. Massimiliano De Agostinis
Co-Supervisore: Ing. Giorgio Olmi
Dottorando: Ing. Francesco Robusto


SOMMARIO
L'introduzione di nuovi prodotti sul mercato è un processo di lunga durata, che
comprende tipicamente sia fasi di progettazione che di sperimentazione. Sovente, la fase
di validazione sperimentale condiziona notevolmente i tempi complessivi del processo.
Infatti, in molti settori industriali, la procedura di sviluppo prodotto è basata su
metodologie di tipo trial and error. Prove di validazione intermedie vengono eseguite su
prototipi fisici in scala reale, ed in base all'esito di queste il design viene rielaborato (in
caso di esito negativo) o validato (se l'esito è positivo). L'efficienza di tale metodo sotto
il profilo temporale è, notoriamente, sub-ottimale.
Per migliorare l'efficienza di tale processo è, ad esempio, possibile sfruttare metodologie
di prova accelerate, che consistono nel sottoporre il prodotto ad una condizione di prova
più gravosa rispetto alle normali condizioni di lavoro. In tale modo, si può conseguire una
riduzione del numero di cicli necessari a portare a rottura il componente, con evidenti
ricadute vantaggiose sull'efficienza del processo. Un'ulteriore modalità di accelerazione
della prova consiste nel passare da prova sull'assieme globale a prova sui sottoassiemi o
singoli componenti.
È tuttavia obbligatorio, affinché i risultati ottenuti mediante tali metodologie di prova
siano utili per la progettazione, adottare opportune precauzioni. Ad esempio, è
fondamentale preservare la modalità di rottura originaria del componente. Per fare ciò, si
rende necessario, fra le altre cose, conoscere la relazione tra le condizioni al contorno
dell'intero assieme e le sollecitazioni dei singoli componenti. Nel presente elaborato, la
metodologia sopra descritta viene illustrata facendo riferimento alla sua applicazione a
componenti del settore serraturiero (dimostratore).
Sono stati effettuati numerosi test sperimentali, per caratterizzare la vita a fatica e la
resistenza all'usura dei materiali coinvolti nella costruzione del dimostratore.
Sono inoltre stati sviluppati modelli numerici FEM per determinare le sollecitazioni dei
sottoassiemi e componenti del dimostratore durante la fase di test.
Combinando i risultati sperimentali con quelli numerici, è stato possibile sviluppare un
modello analitico in grado di stimare con buona approssimazione la vita effettiva del
dimostratore, quando sottoposto a prove accelerate.
I principi alla base di questa procedura possono essere applicati, senza perdita di
generalità, a numerosi settori dell'industria.

ABSTRACT
The introduction of new products on the market is a time-consuming process, which
typically includes both design and testing phases. Often, the experimental validation
phase significantly affects the overall process time. Indeed, in many industrial sectors,
the product development procedure is based on trial and error methodologies.
Intermediate validation tests are performed on full-scale physical prototypes and, based
on their outcome, the design is updated (in the case of a negative result) or validated (if
the result is positive). The efficiency of this method in terms of time-resources is
notoriously sub-optimal.
To improve the efficiency of this process it is, for example, possible to exploit accelerated
test methodologies, which consist in subjecting the product to test conditions that exceed
its actual working conditions. In this way, a reduction in the number of cycles necessary
to bring the component to final failure can be achieved, with obvious beneficial effects
on the efficiency of the process. Another way to accelerate the test is to switch from
testing the top-level assembly to performing tests on subassemblies or individual
components.
It is however mandatory, to ensure that the results obtained with these test methods are
useful for the design, to take appropriate precautions. For example, it is essential to
preserve the original failure mode of the component. To do this, it is necessary, among
other things, to know the relationship between the boundary conditions of the entire
assembly and the stresses of the individual components. In the present paper, the
methodology described above is illustrated with reference to its application to locking
industry components (demonstrator).
Several experimental tests have been carried out, in order to characterize the fatigue life
and wear resistance of the materials involved in the construction of the demonstrator.
Numerical FEM models were also developed to determine the stresses of the sub-
assemblies and components of the demonstrator during the test phase.
Combining the experimental results with the numerical ones, it was possible to develop
an analytical model. Such model allows estimating the endurance of the demonstrator
when subjected to accelerated tests. The model has shown a good correlation with
experimental results.
The principles underlying this procedure can be applied, without any loss in terms of
generality, to many sectors of the industry.

TABLE OF CONTENTS
1. GENERAL CONSDERATION ABOUT ACCELERATED LIFE TESTING ........ 1
1.1 Introduction ........................................................................................................ 1
1.2 Qualitative accelerated tests ............................................................................... 2
1.3 Quantitative accelerated tests ............................................................................. 3
1.4 Usage rate acceleration ...................................................................................... 4
1.5 Overstress acceleration ...................................................................................... 5
1.6 Stress and overload levels .................................................................................. 5
2. ACCELERATED LIFE TESTING APPLIED TO A MECHANICAL DEVICE: A
GENERALIZED METHODOLOGY APPLIED TO A CASE OF STUDY ................... 9
2.1 Standard test and accelerated test ...................................................................... 9
2.2 Case study ........................................................................................................ 11
3. FINITE ELEMENT ANALYSES .......................................................................... 13
3.1 Materials behavior ........................................................................................... 13
3.2 Latch action with a force applied FE model .................................................... 14
3.3 Bending stress evaluation on the latch rod ...................................................... 20
3.4 Latch lever stress analysis ................................................................................ 23
3.5 Experimental validation ................................................................................... 26
3.6 Results summary .............................................................................................. 30
4. EXPERIMENTAL TESTS ..................................................................................... 33
4.1 Coating effect on the fatigue behavior of a free cutting steel [23] .................. 33
4.1.1 Materials and methods .............................................................................. 34
4.1.2 Results ...................................................................................................... 38
4.1.3 Discussion ................................................................................................. 46
4.1.4 Summary of the fatigue tests .................................................................... 50
4.2 Wear behavior of electrodeposited nickel coating on ZP5 zinc alloy [52] ...... 51
4.2.1 Materials and Methods ............................................................................. 52
4.2.2 Results ...................................................................................................... 57
4.2.3 Discussion ................................................................................................. 60
4.2.4 Further experimental tests at reduced distance ......................................... 62
4.2.5 Summary of the wear tests ....................................................................... 65
5. ANALYTICAL MODEL ....................................................................................... 67
5.1 Fatigue characterization ................................................................................... 68
5.2 Wear characterization ...................................................................................... 69
5.3 Stress characterization ..................................................................................... 71
5.4 Predictive analytical model .............................................................................. 73
5.5 Validation of the analytical model ................................................................... 76

5.6 Generalization of the case of study .................................................................. 78
6. ACCELERATED LIFE TESTING MACHINE DESIGN ..................................... 81
6.1 General design ................................................................................................. 81
6.2 Cam design ...................................................................................................... 83
6.3 Actuator movement .......................................................................................... 88
6.4 Summary of the test bench design ................................................................... 90
7. CONCLUSIONS .................................................................................................... 93
REFERENCES ............................................................................................................... 95

1
1. GENERAL CONSDERATION ABOUT ACCELERATED LIFE TESTING
1.1 Introduction
Product reliability contributes strongly to the quality of the product and to the
competitiveness of the company in the market: for this reason, companies invest millions
of euros in the study of the reliability of their products. The engineers' efforts are aimed
at assessing reliability based on product design, use, the type of material used, production
technologies and again depending on the fault and the main cause that triggered the fault.
The decisions related to the development of the component are taken as a function of the
results of the reliability tests carried out: they are generally carried out on a few units due
to the high costs of making the prototypes (or specimens) and due to the extended times
to perform a single complete test on the entire useful life of each test unit [1].
Although the designer’s considerations and the tests on the prototype indicate that the
product have a certain useful life, it is still necessary to validate these statements in order
to demonstrate and quantify the actual life of the product. This demonstration can be
complex, especially as regards the cases in which a useful life of years is expected. In
these cases, indeed, it is not at all practical and economical to implement a reliability test
at the nominal working conditions. It can be fundamental to overload the product and
make the boundary conditions of the test more burdensome. So, accelerated life test can
be derived in order to quickly extrapolate the information and data needed to quantify the
actual expected life [2].
Accelerated life tests can therefore be defined as follows: they are a set of methods and
techniques designed to shorten the analyzed product life, accelerating the degradation of
its performance while maintaining the fault modes unchanged. The purpose of these tests
is to quickly obtain the data that, properly analyzed and modeled, produce the desired
information on the useful life of the product in conditions of normal use. The direct
advantage of the use of such tests is obviously the saving of time and costs [1].
Both the single components of the product and the complete mechanical component can
be tested. The mechanical properties that can be tested during the accelerated life testing
are fatigue and wear resistance, creep resistance or fracture toughness, corrosion
resistance etc.
2
Reliability information are difficult to obtain due to experimental data processing.
Moreover, it is necessary to obtain a mathematical model that can correlate the
accelerated test results to the daily use in nominal conditions of operation of the product.
It can be useful to use statistical models that allow the correlation between the few results
obtained from the accelerated tests to the results expected during the use of the product
at the nominal conditions.
Furthermore, unlike electronic components, just few studies have been carried out on the
accelerated life testing of mechanical systems; this lack can be attributed to the high costs
of the specimens compared to the electronic ones. Moreover, mechanical components are
not characterized by a constant failure rate, unlike the electronic ones. In mechanical
components there are generally different degradation mechanisms: fatigue, creep or wear,
for example, each contributes in its own way to the total failure of the component. These
factors lead to an intrinsic difficulty in the test modeling. In order to carry out accelerated
life test, industries tend to invest a lot of money to implement a model for studying the
reliability of their own components or products [3].
To better understand the useful life characteristics of the product until the failure in short
time it is possible to perform two different accelerated test types [1]:
Qualitative accelerated tests;
Quantitative accelerated tests.
The accelerated qualitative tests allow to identify very quickly the cause or the main
causes that lead to the product failure without focusing on the reliability of the same.
The accelerated quantitative tests instead are used to predict the useful life of the product
under the nominal use conditions.
1.2 Qualitative accelerated tests
As briefly mentioned above, the purpose of these tests is to understand under what
conditions the product fails; further purpose is to identify any design defects. These tests
can be performed on the single component or on the full assembly.
It should be noted that qualitative accelerated tests do not work in the case of the main
failure mechanism is wear, as the mechanism is compromised by the extreme conditions
of the test [3].
Qualitative accelerated tests are also called Highly Accelerated Life Testing (HALT)
because they are shorter than conventional accelerated life testing (ALT) [4].

3
The problem related with qualitative testing is that it is really difficult to carry out the
test: it is essential to achieve the standard failure modes. Quality tests, if well executed,
provide a general indication of how the sample can fail, is not an absolute result and must
be validated at least through an accelerated quantitative test [4].
The most common highly accelerated test is generally called elephant test but, in the
literature, it can be characterized by different names: killer tests, torture tests, shake and
bake tests. This test, indeed, can be seen as an elephant walking on the product [1]: it is
not known exactly at what stress levels the sample is subjected but you are sure to take it
to extreme conditions of use, not associated with normal use of the product.
The elephant test procedure can be as follows [1]: it involves a single sample that will be
subjected to extreme stress levels (e.g. extreme temperatures and tensions). This test will
not certainly produce the failures that can occur during the normal use of the product but
will tend to reveal the project flaws; in this regard, several elephant tests can be conducted
to check different aspects of the product: what can happen if the product will be used at
the South Pole at twice the recommended speed?
However, Nelson [1] points out that the elephant test is well performed when the same
failures occur on the sample, in the same positions, which would be obtained under
normal use. It is therefore particularly difficult to design this test as there is the risk of
literally destroying the product without obtaining any information, especially in the case
of a new product. It will then be necessary to gradually increase stress and understand
how the product behaves before achieving the failure. This procedure is the most widely
used to conduct the quantitative test type.
1.3 Quantitative accelerated tests
The aim of quantitative Accelerated Life Testing (ALT) is to obtain concrete information
about the reliability of the product in a short period. These tests are also important to find,
depending on the normal use of the product, the main failure mode and its location.
To carry out an ALT it is important to know several parameters: test duration, number of
specimens, test goal, desired confidence interval, desired accuracy, costs, acceleration
factor, test environment (temperature, pressure, humidity stress level (tension, frequency,
amplitude...) and test conditions (material, surface treatment, heat treatment...) [4]
The key factor is the so-called acceleration factor [4], which allows the test to be carried
out at a higher speed than the standard one. It is possible to define it because it is assumed

4
that there is a relationship between the stress level and the life of the product [5]. The
acceleration factor (Equation 1.1) is a dimensionless number defined as the ratio between
the life of the product assessed under nominal conditions and the life under accelerated
conditions (overstress):
u
f
a
LA
L=
(1.1)
Where Af is the acceleration factor, Lu is the life of the product at the nominal stress level
and La is the product life under accelerated conditions. Experimental tests are required to
know the acceleration factor.
Nelson and Silverman cited some experimental models to determine the acceleration
factor (e.g. Arrhenius, Coffin-Manson, and Norris-Lanzberg models). The use of one of
these models to determine the acceleration factor, is fast but not very accurate.
The most important condition to determine stress levels during the ALT is that the
specimen should be subjected to the same failure for each level and that the failure is
exactly the same that occurs during normal use.
If this cannot be achieved, it is necessary to simply speed up the work cycle: for example,
increasing the test frequency.
Basically, two accelerated quantitative reliability test methodologies can be identified [1]:
usage rate acceleration and overstress acceleration.
1.4 Usage rate acceleration
This methodology is implemented when the product is normally not used continuously
(an elevator for example). In this case it is possible to test the product continuously,
without the natural breaks, so the failure appears earlier. The limitation of this method is
in products that by their nature, work practically continuously, (e.g. a computer). In such
situations, the acceleration of the frequency of use is not effective in stimulating a failure
mechanism, in this regard it is necessary to overstress the product, therefore accelerated
overload is introduced.

5
1.5 Overstress acceleration
This methodology is to be implemented when the product works in continuous or with a
very high rate of use (such as a bearing of a hydraulic turbine). In this case, higher loads
will be applied; the overload can be achieved by increasing loads or temperature, speed
or vibrational frequency etc. It is also possible to combine different stresses on the
product. Like the previous test class, failure is achieved in a short time, and time-to-failure
information (in overload conditions) is critical to obtaining failure data under normal
usage conditions.
1.6 Stress and overload levels
The load applied during the test must be appropriately chosen before running the test [1]:
it is necessary to apply high stresses in order to speed up the test, but not too high as they
may induce different failure modes with respect to those occurring under nominal
conditions. The stress levels should exceed the specifications, but cannot exceed the
design limits: therefore, with regard to Figure 1, the design limits should not be overcome
in both directions. If the different thresholds are not known, it is necessary to implement
a qualitative test.
Figure 1: Product stress limits [1]
The type of stress applied may vary depending on the test one wants to perform. Constant,
cyclical, step stress test, progressive or random stress [1] can be applied.
Constant stress is the most common load type for accelerated tests and each specimen is
generally tested at the same stress level (Figure 2). There are some advantages in

6
implementing this model. First of all, many products are subject to constant load and tests
could be very similar to reality; Moreover, it is relatively easy to implement a test that is
characterized by constant stress.
Figure 2: Constant stress test. (x) failure, (o) runout [1]
As explained by Nelson in [1], in step-stress loading, a specimen is subjected to
successively higher stress levels. A specimen is first subjected to a specified constant
stress for a specified length of time. If it does not fail, it is subjected to a higher stress
level for a specified time. The stress on a specimen is thus increased step by step until it
fails. Usually all specimens go through the same specified pattern of stress levels and test
times. Sometimes different patterns are applied to different specimens. Figure 3 depicts
two such patterns. Such data may be censored. Pattern 1 has six failures and three runouts.
Figure 3: Step stress tests [1]
Implementing step stress allows to achieve product failure more quickly with respect to
the constant stress method but there is also a disadvantage. Most products run at constant
7
stress - not step stress. Thus, the model must properly consider the cumulative effect of
exposure at successive stress levels.
There are different laws to be applied during the step stress test. Nelson in [6] describes
a step-stress model and data analysis. Schatzoff and Lane [7] use this model to optimize
planning of a step stress test with read-out data. Goba [8] references such work on
temperature accelerated testing of electrical insulation.
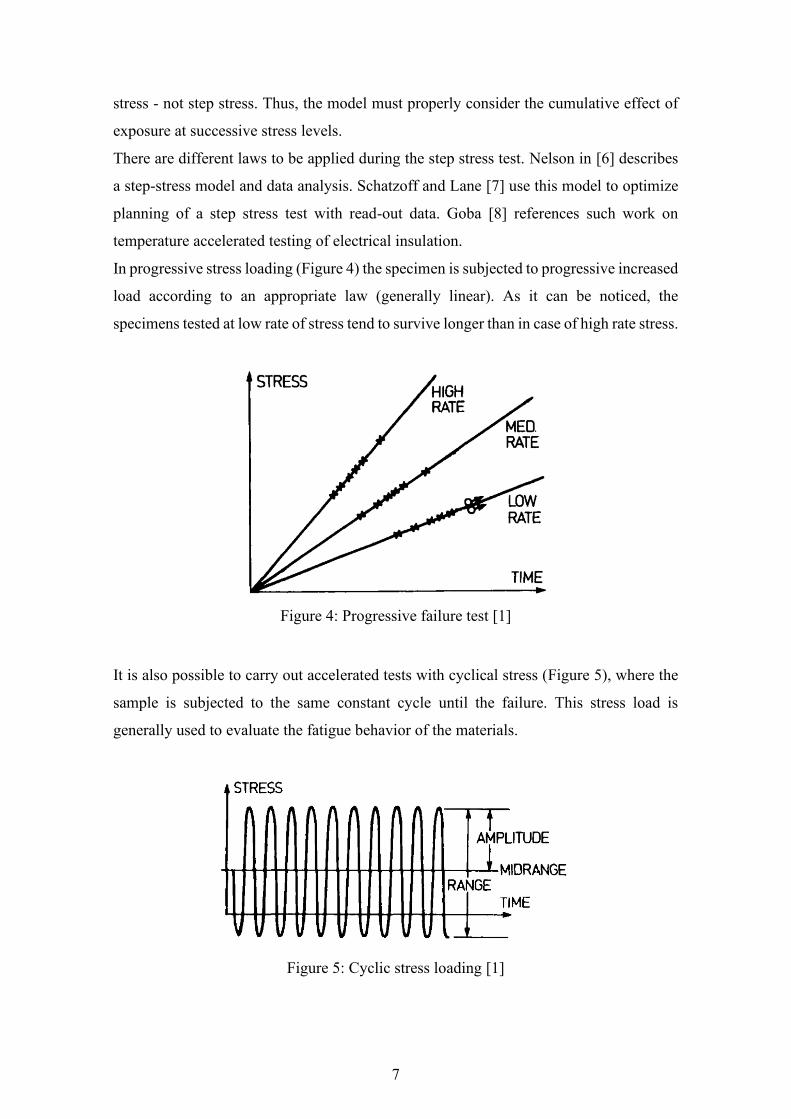
In progressive stress loading (Figure 4) the specimen is subjected to progressive increased
load according to an appropriate law (generally linear). As it can be noticed, the
specimens tested at low rate of stress tend to survive longer than in case of high rate stress.
Figure 4: Progressive failure test [1]
It is also possible to carry out accelerated tests with cyclical stress (Figure 5), where the
sample is subjected to the same constant cycle until the failure. This stress load is
generally used to evaluate the fatigue behavior of the materials.
Figure 5: Cyclic stress loading [1]

8
Some products undergo randomly changing levels of stress during their use, as depicted
in Figure 6. For example, bridge members and airplane structural components undergo
wind buffeting.
Figure 6: Random stress loading [1]
Then an accelerated test typically employs random stresses with the same distribution as
actual random stresses but at higher levels. Like cyclic stress tests, random stress models
employ some characteristics of the stress distribution as stress variables (say, the mean,
standard deviation, correlation function, and power spectral density). Then such a test is
regarded as a constant stress test; this, of course, is simplistic but useful. The test can then
be depicted as in Figure 2 where the horizontal line shows the mean stress. Moreover,
specimen life is modeled with a constant stress model, and the data are analyzed
accordingly [1].
9
2. ACCELERATED LIFE TESTING APPLIED TO A MECHANICAL
DEVICE: A GENERALIZED METHODOLOGY APPLIED TO A CASE
OF STUDY
2.1 Standard test and accelerated test
Many authors studied the statistical methods to be applied to accelerated life testing
[1,3,4,6,9–12]. Almost all the studies dealing with accelerated life testing, that are present
in the literature, are related to electronic component, due to their constant failure rate and
therefore a greater simplicity of the study [1,4,6,10]. Few authors focused on accelerated
life testing of mechanical components, but they mostly deal with very simple parts (ex.
bearings). Issue of novelty of the present work is to develop an accelerated life testing
procedure that can be applied to almost all the mechanical components, regardless their
complexity grade. In complex mechanical components, indeed, the failure could be
related to many different mechanisms. Moreover, the progressive degradation of a part of
the assembly can affect the stresses on the other parts. In these cases, the evaluation of
the actual service life of the components is not so trivial.
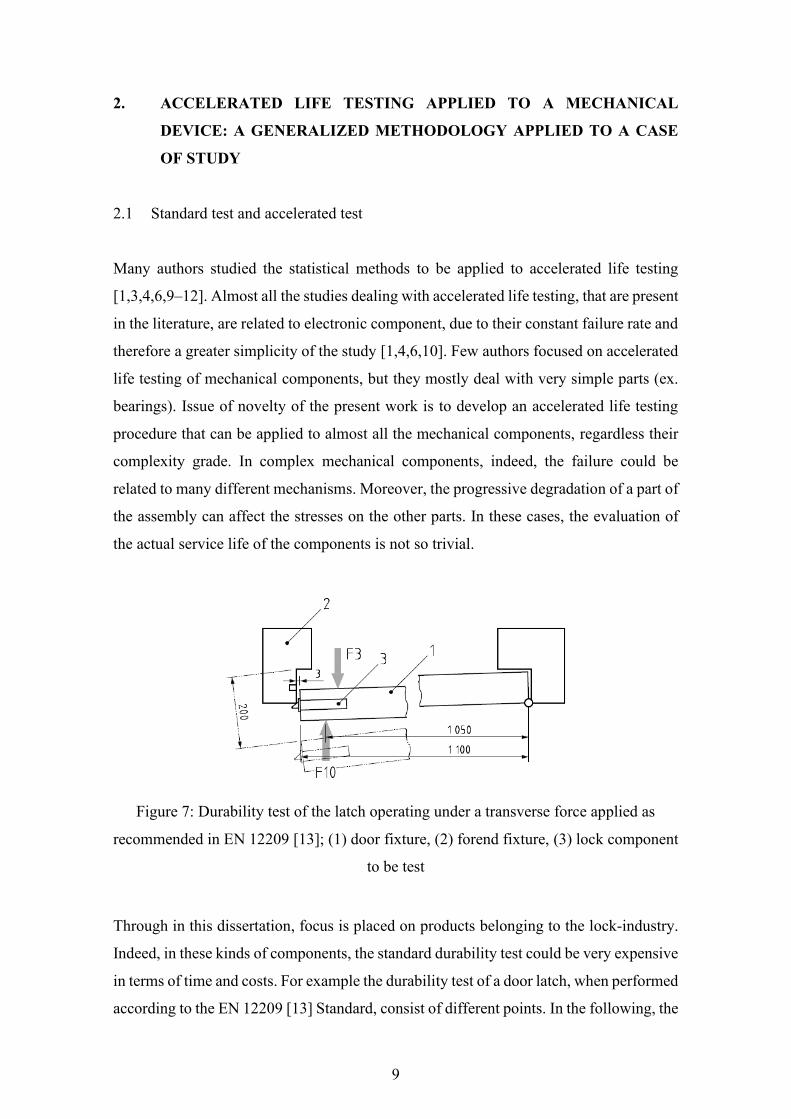
Figure 7: Durability test of the latch operating under a transverse force applied as
recommended in EN 12209 [13]; (1) door fixture, (2) forend fixture, (3) lock component
to be test
Through in this dissertation, focus is placed on products belonging to the lock-industry.
Indeed, in these kinds of components, the standard durability test could be very expensive
in terms of time and costs. For example the durability test of a door latch, when performed
according to the EN 12209 [13] Standard, consist of different points. In the following, the
10
test methodology proposed by the Standard is briefly commented in order to highlight all
the steps it requires, so as the reader can understand the fallout of such requirements in
terms of cost. It is paramount to underline that similar requirements are set by many
Standards dealing with product validation, not limited to the lock-industry. In order to
develop the test, a force F3=120 N should be applied on the door (Figure 7). Then the
door is opened to a distance of 200 mm from the frame and finally the door can be closed,
and the cycle can restart. The minimum test duration is 2·105 cycles with a maximum
frequency of 10 cycles/min. The test succeeds if all the components of the latch are still
working at the end of the test. Due to the limited frequency set out by the standard, the
whole test lasts approximately fourteen days. Besides increasing the test frequency, the
test duration may be cut down by overstressing the components of the latch.In order to
do so, it is mandatory to know the stress field along with the stress-life curves of the
materials, as well as the possible sources of non-linearity.
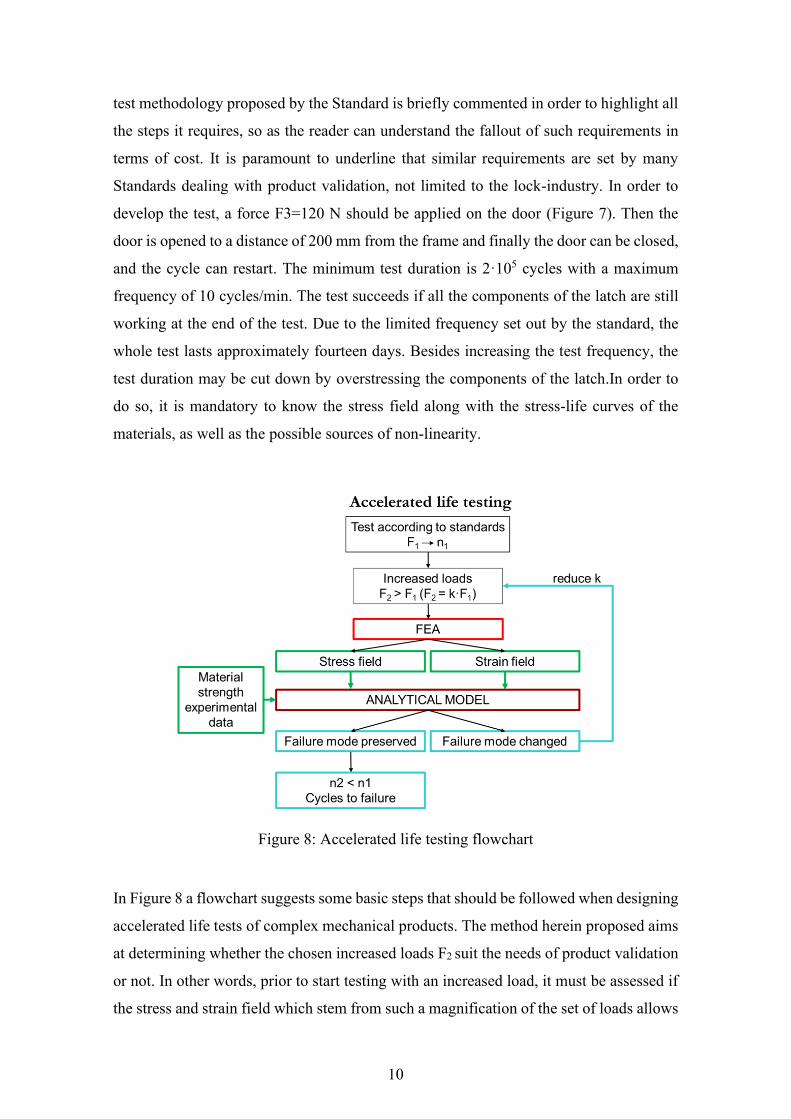
Figure 8: Accelerated life testing flowchart
In Figure 8 a flowchart suggests some basic steps that should be followed when designing
accelerated life tests of complex mechanical products. The method herein proposed aims
at determining whether the chosen increased loads F2 suit the needs of product validation
or not. In other words, prior to start testing with an increased load, it must be assessed if
the stress and strain field which stem from such a magnification of the set of loads allows

11
preserving the failure modes normally displayed by the product (i.e. under nominal
operating conditions) or if, on the flip side, it leads to an unacceptable change in the mode
of failure. Such an assessment can obviously be made by trial and error but implementing
a mixed numerical-analytical tool leads to considerable savings.
The first (implicit) step consists of assuming that testing under the actual load condition
(F1) is too expensive: thus, the product has to be tested under increased loads (F2=k·
F1>F1).
Leveraging FEA, it is possible to evaluate the stress-strain field of all the components of
the assembly involved in the test. At the same time, dedicated tests performed on the base
materials (e.g. fatigue, wear, corrosion tests) or a thorough literature data scanning may
provide useful thresholds of the base materials (e.g. fatigue limit). The FEA results,
combined with the aforementioned experimental data could be input (in green) in the
analytical model, which allows predicting the reduced service life of the components and
to correlate it to the effective life during the standard use. This model is also conceived
in such a way that it can detect if the failure mode changes due to the applied overload.
In this case, the procedure reverts to the definition of the amplification factor k: e.g. k is
reduced, and the cycle repeated until preservation of the standard failure mode is
achieved. In the flowchart the outputs are represented in light blue.
2.2 Case study
As stated above, the developed methodology will be illustrated by making reference to a
product belonging to the lock-industry (door latch): such a product will be referred to as
“demonstrator” in the following. The object of investigation is shown in Figure 9. The
operating principle of the mechanism will be briefly described in the following. The latch
lever (Id. 5 in red) is initially engaged in the strike plate (Id. 7). To open the door, it is
necessary to withdraw the latch. This operation can be done by applying a torque on the
follower (Id. 4 in yellow), which in turn sets the latch lever (Id. 1 in green) into rotation.
Such component is engaged onto the rightmost end of the latch rod (Id. 3 in blue) and
permits to retract the latch itself.

12
Figure 9: Locking device object of the analysis
During testing, the latch repeatedly slides on the strike plate and on the forend (Id. 6 in
grey). The relative motion between these parts, which takes place under non-negligible
pressures, ultimately produces severe wearing of the latch. This component is usually
made of materials like ZP5 zinc alloy [14], a material whose favorable cost makes it the
preferred choice for mass-production applications like the one described here. These
devices must sometimes work in a corrosive environment. In order to improve its
corrosion resistance, the latch is coated by an electrodeposited nickel coating [15]. The
friction coefficient between nickel and steel proved to be lower than the zinc alloy on
steel one (see 4.2). Due to the wear of the latch, and therefore a mutation of the friction
coefficient between the latch and the forend as well as between the latch and the strike
plate, the components behind the opening chain are undergo a change in the stresses they
are subjected to. The durability tests on this component shown that the main failure
mechanism of the latch lever (made of S420MC [16]) and the latch rod (made of 11
SMnPb 30 [17]) is fatigue. The bracket is a component (made of DX51D alloy) that
allows to guide the latch rod during the opening phase.
For the aforementioned reasons, it is particularly important to characterize the wear
behavior of the latch (electrodeposited nickel coating over ZP5 zinc alloy base material)
and the fatigue behavior of the S420MC steel and 11 SMnPb 30 free-cutting steel.

13
3. FINITE ELEMENT ANALYSES
In order to evaluate the stress field in terms of bending stresses and contact pressures of
the components involved during the accelerated life testing, several finite element
analyses were carried out by means of the ANSYS Workbench 17.1 software. As
explained in the next chapter, the wear behavior of the latch introduces a transition of the
friction coefficient during the test. So, different FEA were carried out using different
friction coefficients in the relevant contactareas. Moreover, three different levels for the
applied load were considered. The combination of the friction coefficient and the applied
load brings to a total of nine FEanalyses. For the sake of synthesis, not all the FEA results
will be shown in the following figures. In the last section of this chapter all the results
will be summarized.
3.1 Materials behavior
In this section, the mechanical properties used during the FEA will be presented. The
latch is made of ZP5 zinc alloy. The latch rod is machined from a bar of free cutting steel
11 SMnPb 30. The latch lever instead, is made of S420MC steel. Finally, the forend and
the strike plate are made of AISI 304 whereas the bracket is made of DX51D alloy. The
mechanical characteristics of these materials are reported in Table 1.
Table 1: Mechanical characteristic of the materials involved in the FEA
ZP5 EN 12844 [14]
Rp0,2 Yield strength 250 MPa
Rm Ultimate tensile stress 330 MPa
A% Elongation % 5 -
E Elastic modulus 85,000 MPa
ν Poisson’s ratio 0.29 -
11 SMnPb 30 [17]
Rp0,2 Yield strength 480 MPa
Rm Ultimate tensile stress 700 MPa
A% Elongation % 14 -
E Elastic modulus 210,000 MPa

14
ν Poisson’s ratio 0,3 -
AISI 304 [18]
Rp0,2 Yield strength 210 MPa
Rm Ultimate tensile stress 520 MPa
A% Elongation % 45 -
E Elastic modulus 193,000 MPa
ν Poisson’s ratio 0,29 -
DX51D+AZ [19]
Rp0,2 Yield strength 140 MPa
Rm Ultimate tensile stress 270 MPa
A% Elongation % 22 -
E Elastic modulus 210,000 MPa
ν Poisson’s ratio 0,29 -
S420MC [20]
Rp0,2 Yield strength 420 MPa
Rm Ultimate tensile stress 480 MPa
A% Elongation % 16 -
E Elastic modulus 210,000 MPa
ν Poisson’s ratio 0,3 -
3.2 Latch action with a force applied FE model
In order to simulate the mechanism action that takes place during the tests, a numerical
FE model conceived as follows has been developed. In particular the behavior of the
components during the door opening was analyzed. In Figure 10 the static scheme of the
mechanism is reported with an indication of the forces applied to the components during
the tests.

15
Figure 10: Static scheme of the mechanism
The problem is three-dimensional in nature, due to the geometry of components.
Accounting for the symmetry, a half mechanism could be analyzed in order to reduce the
computational cost. A symmetry region was therefore applied in the x-y plane (Figure
11). A fixed support was applied on the forend and to the bracket (A). The testing force
F3/2 (B), equal to half the actual force applied during testing (owing to symmetry) was
applied directly on the strike plate, which was in turn constrained to translate along the y
direction (C). In order to simulate the door opening, a displacement (D) along the x
direction was applied to the latch rod plate. A series of multistep analyses were carried
out without considering (in this phase) the materials nonlinearities. At the first step the
load F3 was applied on the strike plate. In the following steps the latch was retracted by
the aforementioned displacement.
In Figure 12 the contacts used in the finite element model are shown. The contacts
between the latch and the forend (A) and between the latch and the strike plate (B) were
set as frictional and the friction coefficients were parameterized in order to test different
friction coefficients. Indeed, as briefly noticed in the previous chapter, due to wear
affecting the latch, a transition in terms of friction coefficients is likely to take place
during the test. Consequently, three different friction coefficients were considered: 0.3,
0.7 and 0.9. These coefficients were selected, based on the outcomes of the experimental
campaign involving wear tests that is going to be described in the next chapter. In the
figures in this chapter the friction coefficient is always equal to 0.3. The contact between
the latch rod and the bracket, instead, was also set as frictional with a constant friction
coefficient of 0.15 (steel-steel contact), which is assumed not to change during the test (it

16
was validated by experimental tests). Finally, since simulating the actual stress
distribution inside the bolted joint between the latch and the latch lever is outside the
scope of this analysis, a bonded contact was applied there.
Figure 11: FEA of the latch action with a force applied (geometry and setup)
Figure 12: FEA of the latch action with a force applied (contact definition)

17
Figure 13: FEA of the latch action with a force applied (mesh)
In Figure 13, the mesh used during for the analyses is shown. A free meshing algorithm
was used. The mean element dimension was set to 0.5 mm resulting into a total of 567,284
elements SOLID186 and SOLID187 and 801,576 nodes.
The results, in terms of von Mises stresses, during the opening phase are shown in Figure
14.

18
Figure 14: FEA of the latch action with a force applied (von Mises stress results)
It was assessed that the maximum stress occurs always on the latch rod during the opening
phase. In order to evaluate the fatigue resistance of this component, the results in terms
of bending stresses (normal x stress) were analyzed. In Figure 15 the normal x stress
results are shown.
Finally, the contact pressure, between the latch and the strike plate and the latch and the
latch rod plate, was analyzed: this result is useful for performing the following wear
analysis, i.e. in order to evaluate the wear rate of the latch during the test. The contact
pressure results are shown in Figure 16.
At last, the latch withdrawal force was analyzed, using the probe command in the
simulation software, in order to carry out the further analyses presented in the next
sections.

19
Figure 15: FEA of the latch action with a force applied (normal x stress results)
Figure 16: FEA of the latch action with a force applied (contact pressure results)

20
In order to evaluate the maximum load to be applied during the accelerated life testing, a
series of FEA were carried out introducing the nonlinear material behavior. This check is
important in order to understand if the overstress applied to the model is such that the
intended failure mechanism can be maintained. In particular, a bilinear isotropic
hardening material behavior was chosen. It was assessed that, following load increase
during the accelerated test, the device could undergo a change in its failure mode.
However, as pointed out in the first chapter, in order to properly run an accelerated life
test, the failure mode of the standard test load must be kept unchanged. This means that,
if additional plastic deformations are introduced during the test, the original failure is
indeed improperly altered. As shown in Figure 17, as soon as the transverse force attains
F3 = 260 N, the forend begins showing non-negligible plastic strains. For this reason, all
the following analyses were limited to forces F3 ≤ 240 N, which means two-times the
nominal value of force F3.
Figure 17: Equivalent plastic strain F3 = 260 N
3.3 Bending stress evaluation on the latch rod
In order to evaluate the actual bending stress on the latch rod plate, some simplified
analyses were carried out. In particular, as shown in Figure 18, the latch rod was sliced
and just the last part of it was analyzed (rightmost end in Figure 9). The latch withdrawal
force, formerly evaluated by means of the probe tool in, was applied directly to the latch
rod plate. A symmetry region was applied on the x-y plane whereas a fixed support was
applied on the latch rod sliced surface. In this case also, the material nonlinearities were
not considered.

21
Figure 18: FEA bending stress on the latch rod plate (geometry and setup)
In order to evaluate the convergence of the solution a mesh refinement was applied on
the rounded zone of the latch rod plate using a sphere of influence with a radius of 1 mm
as shown in Figure 19. The mesh dimension in this zone was parameterized in order to
carry out the convergence test. In this case also, the bending stress was extracted as the
normal x stress.
Figure 20 shows the outcome of the convergence test. In order to achieve convergence of
the solution, a mesh refinement with a mean element size, inside the sphere volume, as
small as 0.02 mm was necessary.

22
Figure 19: FEA bending stress on the latch rod plate (mesh refinement)
Figure 20: Convergence test

23
Figure 21: Bending stress on the latch rod plate; mesh refinement
The nominal stress at this point, calculated according to the beam theory, is 121 MPa and,
comparing this one with the numerical one (287 MPa), it can be assessed that the stress
concentration factor in this zone is equal to 2.37.
3.4 Latch lever stress analysis
In order to evaluate the stress field in the latch lever, some further analyses were carried
out. As stated above, the latch withdrawal force was sampled by means of a probe tool in
previous analyses. Due to symmetry, the aforementioned reading is a half of the actual
force T (Figure 22), which must be borne by the latch lever.
24
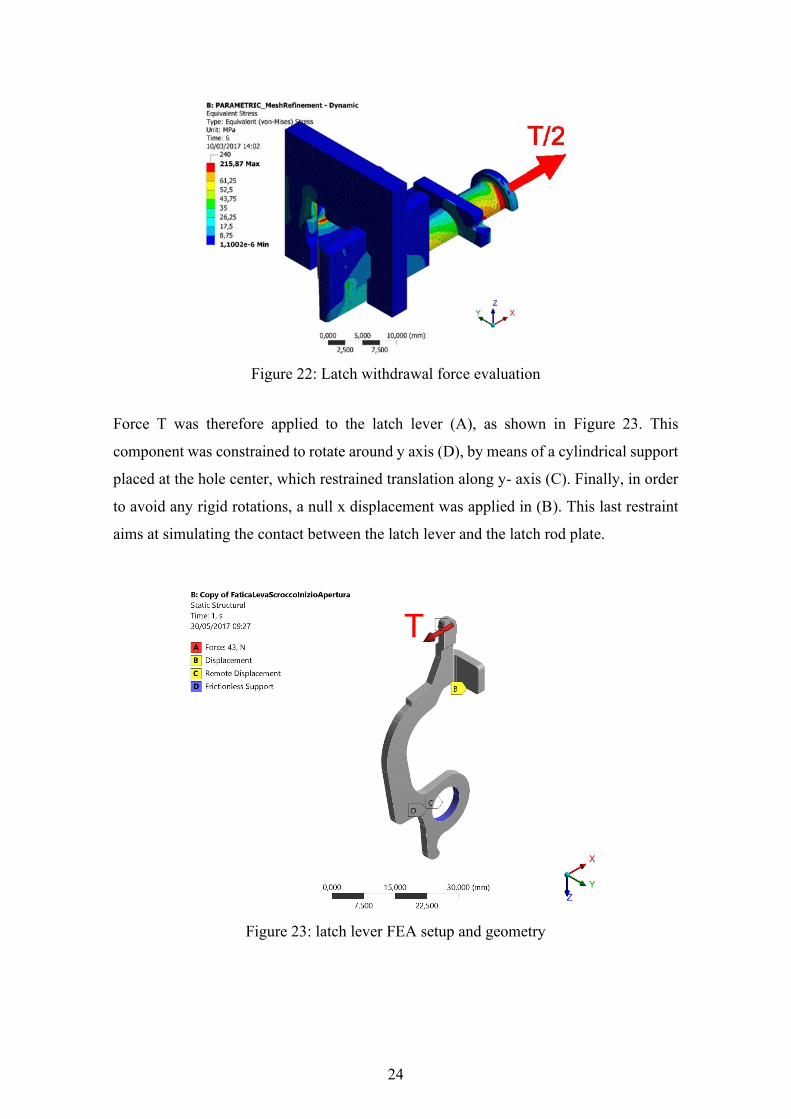
Figure 22: Latch withdrawal force evaluation
Force T was therefore applied to the latch lever (A), as shown in Figure 23. This
component was constrained to rotate around y axis (D), by means of a cylindrical support
placed at the hole center, which restrained translation along y- axis (C). Finally, in order
to avoid any rigid rotations, a null x displacement was applied in (B). This last restraint
aims at simulating the contact between the latch lever and the latch rod plate.
Figure 23: latch lever FEA setup and geometry
25
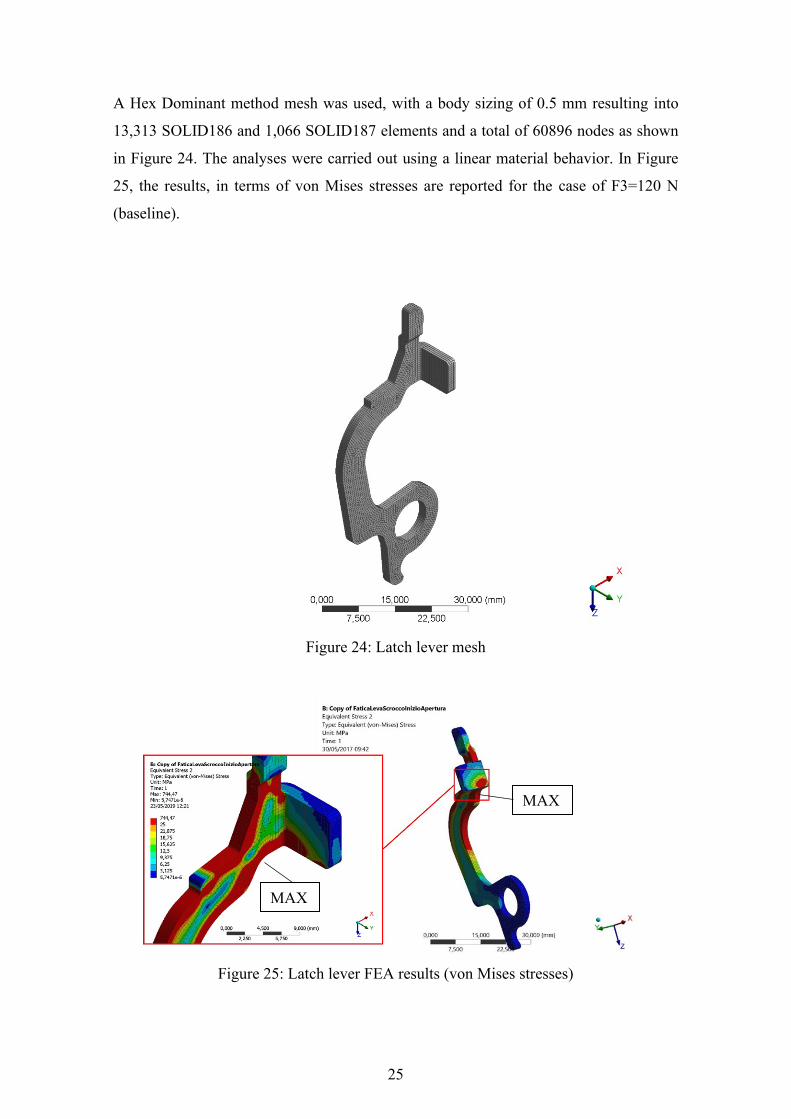
A Hex Dominant method mesh was used, with a body sizing of 0.5 mm resulting into
13,313 SOLID186 and 1,066 SOLID187 elements and a total of 60896 nodes as shown
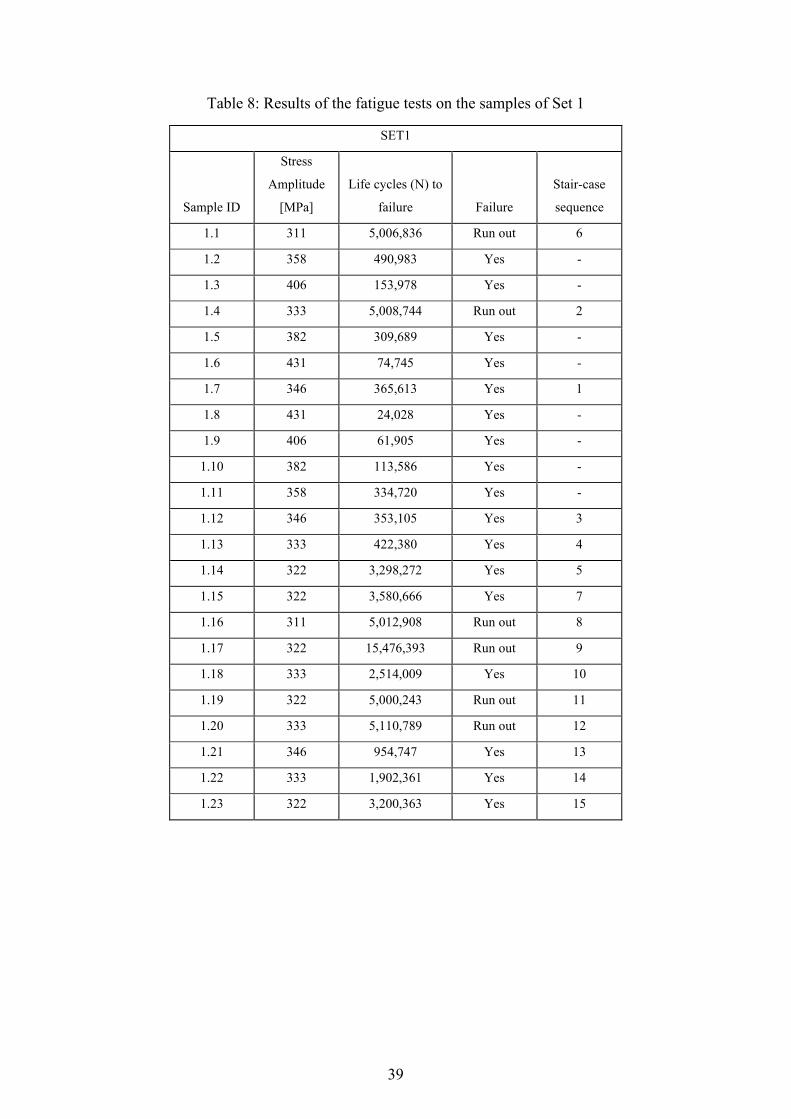
in Figure 24. The analyses were carried out using a linear material behavior. In Figure
25, the results, in terms of von Mises stresses are reported for the case of F3=120 N
(baseline).
Figure 24: Latch lever mesh
Figure 25: Latch lever FEA results (von Mises stresses)
MAX
MAX

26
As it can be noticed, the maximum stress on the latch lever shows up in the vicinity of
the cross-section restriction, close to the upper constraint. Since the failure mode of this
component is deemed to be fatigue, the maximum bending stress in this zone was
thoroughly evaluated. In order to do so, a local coordinate system needed to be defined,
in accordance with the picture of Figure 26. The origin was placed in the centroid of the
maximum bending area surface whereas the z axis was directed in the maximum stress
direction. The maximum bending stress was therefore evaluated for the all load
conditions.
Figure 26: Latch lever maximum bending stress
3.5 Experimental validation
In order to validate the FE analysis, a series of experimental tests was carried out. A strain
gauge (HBM 1-LY11-0.6/120) was applied to the latch lever as shown in Figure 27. This
position was selected, based on the constant stress trend in this component, according to
the FEA reported in Figure 30. A quarter bridge configuration plus dummy gauge for ΔT
compensation was used. The latch lever was then mounted into the device, which was in
turn constrained by means of suitable screws to a wooden plate (Figure 28). On the
fixture, two sleds were provided, in order to constrain the strike plate to move only along
the vertical direction. A downwards directed vertical force was then applied, by means of
a mass of 12.2 kg (120 N) directly hanging on the strike plate. During the test, the voltage
signal read by the strain gauge was processed through a NI9237 strain module, plugged

27
into a NI9184 carrier. Data sampling was made by means of a self-developed program
written in LabView. A typical strain output behavior obtained during the tests is shown
in Figure 29. The tests were carried out both in the lubricated and in the unlubricated
conditions. Ten replications for the unlubricated condition and twelve replications for the
lubricated one were totally carried out. The experimental results as a strain mean during
the opening phase are reported in Table 2. As it can be noticed, the results for dry and
lubricated surfaces are very close each other. This outcome can be related to the presence
of lubrication applied upon the industrial assembly phase. Comparing the general mean
of the two test conditions it is possible to assess that the strain is not affected by the
lubrication of the latch. Considering then a Young’s modulus of 210,000 MPa (Table 1)
it is possible to evaluate the stress at the gage application area using the Hooke’s law.
Figure 27: Strain gauge on the latch lever

28
Figure 28: Experimental validation tests
Figure 29: Strain gauge output during the tests

29
Table 2: Experimental results as a mean of the output strain
The strain general mean εx = 98.5 µε (for all the experimental tests) allows to assess that,
at the gage application area, the normal stress is equal to σexp = 20.6 MPa (Figure 30).
From the numerical FE models, it was assessed that, for the same load conditions, the
stress is equal to σnum = 21 MPa. It can be assessed that the model is therefore validated
with an error of 2%.

30
Figure 30: Latch lever results (bending stress evaluation)
3.6 Results summary
The aforementioned analyses were carried out considering different testing forces and
different friction coefficients. For the sake of synthesis, not all the results have been
presented in the previous section. In this section, a summary of the principal FEA results
used in the analytical model presented in chapter 5 are reported. In Table 3, the maximum
bending stress on the latch rod plate evaluated as explained in section 3.3 are reported.
Moreover, in Table 4 the FEA results in terms of maximum contact pressure on the latch,
evaluated according to section 3.2 are presented. Finally, in Table 5 the numerical results
relevant to the maximum bending stress on the latch lever, evaluated as explained in
section 3.4, are summarized.
Table 3: FEA results maximum bending stress on the latch rod plate [MPa] (normal x
axis stress Figure 21)
F3 = 120 N F3 = 180 N F3 = 240 N
µ = 0.3 250 290 328
µ = 0.7 280 324 367
µ = 0.9 300 346 394

31
Table 4: FEA results maximum contact pressure on the latch [MPa] (Figure 16)
F3 = 120 N F3 = 180 N F3 = 240 N
µ = 0.3 115 180 266
µ = 0.7 130 220 280
µ = 0.9 140 230 290
Table 5: FEA results maximum bending stress on the latch lever [MPa] (Figure 26)
F3 = 120 N F3 = 180 N F3 = 240 N
µ = 0.3 193 289 385
µ = 0.7 204 302 401
µ = 0.9 210 312 415

32

33
4. EXPERIMENTAL TESTS
In this chapter the experimental tests, needed to evaluate the mechanical behavior of the
materials involved in the accelerated testing, will be presented. In particular the fatigue
behavior of the free cutting steel 11 SMnPb 30 was experimentally determined (see 4.1).
Concerning the fatigue behavior of S420MC steel, the data presented by Klemenc in
[21,22], were used to develop the analytical model. Finally, the wear behavior of the
electrodeposited nickel coating on the zinc alloy ZP5 was experimentally determined
using slider on cylinder wear test (see 4.2).
4.1 Coating effect on the fatigue behavior of a free cutting steel [23]
Free cutting steels, which are commonly used in many mass production fields, such as
the automotive industry and household appliances, contain sulfur lead and some other
elements, which enhance machinability. For this reason, this class of materials is widely
used in the lock-industry, which is characterized by very large production batches, in
order to cut production costs. It must be observed that, in some cases, free cutting steel
components must withstand remarkably high fatigue loads, even in harsh environment.
For example, as indicated by Standard [13], the lock shall be mounted in a fixture being
similar to a door application. Afterwards, it is sprayed by neutral salt for a defined
duration: in this particular condition, it is required to comply with some standard
requirements and to pass specific tests, to ensure its ability to operate after environmental
exposure. To achieve acceptable material properties, thus improving wear resistance,
even in harsh environments, considering cost issues as well, the widespread procedure in
the lock industries is to use electrodeposited coatings over free cutting steel materials.
This is a very serious issue, as the failure of the locking devices may arise both from too
high wear, which is no longer compliant with the standard requirement, and from fatigue
damage. In particular, some authors indicate that coatings may have a detrimental effect
on the fatigue strength of the materials [24–28]. Therefore, it is important to clarify this
point, depending on the involved materials and coatings, and, in case, to search a
compromise. For these reasons, some free cutting steels have been investigated in the last
years [29–35]. However, a literature survey still indicates a lack of knowledge in this
field, in particular regarding the interaction between the material properties and the

34
coating alloy components and the related combined effect on the mechanical response
with particular reference to fatigue.
Metal coatings may also be suitably applied to improve the mechanical response of leaf
springs. Indeed, as indicated in [36] coatings yield the advantages of preventing fretting
fatigue damage as well as significantly incrementing the wear resistance as an effect of
friction reduction. However, the aforementioned reference, also confirms that coatings
may have the serious drawback of reducing the fatigue strength of the treated components
under cyclic loads. This outcome is often due to the weakening of the surface at the
interface between the part and the coating. The described issue can be overcome by an
additional surface treatment, for instance, a shot peening treatment with properly
optimized parameters, to be performed before coating to strengthen the surface. However,
such a treatment is not always affordable, due to its costs or the actual geometry of the
parts to be processed. This point confirms and stresses the need for results concerning the
fatigue response of coated parts, considering that the application of shot-peening or other
surface treatments, to counterbalance the possible detrimental effect of coating, could not
be available for many reasons.
11 SMnPb 30 is one of the most frequently used free cutting steels. In order to prevent
corrosion, electrodeposited nickel and zinc coatings are commonly applied on these
materials. The literature indicates that these coatings have some issues arising from
thickness control difficulties during the electrodeposition process. For this reason, they
are currently used mainly for decorative purposes, whereas, very few studies deal with
their industrial applications [37,38]. In the literature there are no data regarding the effect
of the coatings on the fatigue behavior of the free cutting steel 11 SMnPb 30. Moreover,
in this study, an ANOVA-based statistical method was used, making possible to assess
the significance or not significance of the aforementioned effects.
4.1.1 Materials and methods
The testing campaign involved 11 SMnPb 30 EN 10087 [17] (also referenced with the
number 1.0718), whose chemical composition is reported in Table 6. The fatigue testing
procedure was based on ISO 1143 Standard for rotating bending fatigue testing [39]. The
Standard defines the testing procedure, the load scheme and the specimen geometry. The
samples were manufactured with 6 mm diameter at gage and 10 mm diameter at the heads
as a good compromise to reduce production costs, while ensuring agreement with the

35
Standard. A sample drawing including its dimensions, as well as dimensional and
geometrical tolerances, is shown in Figure 31.
Table 6: Chemical composition of free cutting steel 11 SMnPb 30 [16]
C Si max Mn P max S Pb
≤0.14 0.05 0.90 to 1.30 0.11 0.27 to 0.33 0.20 to 0.35
Three different sets of specimens were involved in the experimental campaign: one
sample for each set is shown in Figure 32. The first set, referenced as 1, involved samples
that were fabricated without coating (in the “as received” conditions). Set 2 consisted of
samples that were treated by an electrodeposited zinc coating, referenced as Fe/Zn5/a,
according to ISO 2081 [40]. This process provides a 5-µm minimum zinc thickness and
a finishing by a clear chromate conversion process. Finally, Set 3 involved specimens
treated by an electrodeposited nickel coating Fe/Cu1/Zn5s in the framework of ISO 1458
[41]. This process provides a coating consisting of 1 µm (minimum) ductile, levelling
copper, plus 5 µm (minimum) sulfur-free nickel.
Figure 31: Smooth sample for fatigue tests under rotating bending according to [17]
The experimentation was preceded by dimensional checks and roughness measurements
that involved every sample. The measurements were made, using a micrometer screw
gage and a portable surface roughness tester as indicated in [42]. Measurements were
carried out with 4 replications at each head and with 6 replications at gage. Surface
roughness on both the heads and on the gage were measured over 8 replications. In
particular, roughness was averaged over 4 mm runs along the longitudinal axis,
considering 90° angled spots with two repetitions for each. Measurement at the gage was

36
performed only on the samples that got broken during fatigue testing, due to the
impossibility to correctly align the roughness tester in the unbroken ones. The retrieved
measurements were anyway sufficient to get evidence of the roughness mean value at
gage and to ensure the fulfilment of drawing specifications in the case of Set 1. Average
values of the diameter and surface roughness measurements are provided in Table 7 with
reference to the three sample Sets.
Figure 32: Specimens sets (a) Set 1: as received, (b) Set 2: zinc coated Fe/Zn5/a, (c) Set
3: nickel coated Fe/Cu1/Ni5s
The specimens were tested under rotating bending fatigue loads, at the Alma Mater Labs,
using a four-point rotating bending machine configuration, where the sample is loaded
under constant maximum nominal bending moment [42–46]. The fatigue testing was
aimed at the determination of the S-N curves and the endurance limits. A staircase method
was applied, to determine the endurance limit, according to Standard ISO 12107 [47]. A
life duration of 5·106 cycles was set as run-out threshold. A confidence analysis (90%
confidence level) was also performed based on the standard deviation of the endurance
limit (scattering of the experimental results) and on the size of the sequence that led to its
computation. The data in the finite life domain were processed according to the Standard:
both the linear and the quadratic model were worked out and the general linear test was
then applied, to assess the significance of the improvements arising from the latter. Lower

37
and upper bounds to be wrapped around the curves were determined, considering failure
probabilities of 10% and 90% and with a 90% confidence level.
Table 7: Dimensional and roughness (Ra) measurements
Specimen
ID
Gage diameter
Roughness
Ra [µm]
Specimen
ID
Gage diameter
Roughness
Ra [µm]
Specimen
ID
Gage diameter
Roughness
Ra [µm] Mean[mm]
St.
dev.
[mm]
Mean[mm]
St.
dev.
[mm]
Mean[mm]
St.
dev.
[mm]
1.1 5.989 0.012 2.105 2.1 6.007 0.011 1.515 3.1 6.069 0.008 1.748
1.2 5.999 0.007 0.897 2.2 6.009 0.011 1.590 3.2 6.060 0.017 1.715
1.3 5.995 0.005 0.825 2.3 6.015 0.007 - 3.3 6.063 0.005 1.815
1.4 5.996 0.012 - 2.4 6.010 0.005 0.757 3.4 6.060 0.009 1.767
1.5 5.987 0.005 1.067 2.5 6.025 0.004 1.153 3.5 6.059 0.011 1.705
1.6 5.992 0.007 0.780 2.6 6.012 0.005 - 3.6 6.058 0.009 -
1.7 6.007 0.007 1.842 2.7 6.039 0.009 0.527 3.7 6.055 0.009 2.198
1.8 5.989 0.015 1.165 2.8 6.009 0.009 1.427 3.8 6.048 0.007 2.357
1.9 5.988 0.005 1.010 2.9 6.014 0.005 0.653 3.9 6.058 0.008 1.002
1.10 5.997 0.006 0.825 2.1 6.012 0.004 0.650 3.10 6.058 0.013 1.882
1.11 6.001 0.010 1.620 2.11 6.014 0.006 0.680 3.11 6.041 0.014 -
1.12 5.996 0.007 1.235 2.12 6.018 0.004 0.660 3.12 6.059 0.008 1.353
1.13 5.989 0.005 1.098 2.13 6.015 0.004 0.645 3.13 6.050 0.010 2.472
1.14 6.010 0.007 1.505 2.14 6.015 0.008 - 3.14 6.052 0.011 -
1.15 5.992 0.012 0.827 2.15 6.020 0.006 0.810 3.15 6.068 0.010 1.373
1.16 5.994 0.009 - 2.16 6.013 0.006 - 3.16 6.052 0.013 -
1.17 6.002 0.011 - 2.17 6.009 0.009 1.645 3.17 6.056 0.010 -
1.18 5.994 0.007 0.770 2.18 6.008 0.004 - 3.18 6.044 0.009 2.133
1.19 5.995 0.006 - 2.19 6.012 0.006 0.790 3.19 6.054 0.012 3.072
1.20 5.997 0.009 - 2.20 6.017 0.008 - 3.20 6.051 0.011 -
1.21 5.995 0.009 0.767 2.21 6.011 0.004 0.875 3.21 6.062 0.010 -
1.22 5.997 0.004 1.185 2.22 6.015 0.004 0.745 3.22 6.047 0.015 2.355
1.23 6.004 0.010 0.987 2.23 6.007 0.007 - 3.23 6.062 0.010 1.532
1.24 6.004 0.009 - 2.24 6.016 0.003 0.952 3.24 6.061 0.016 -
1.25 5.998 0.008 - 2.25 6.038 0.015 - 3.25 6.056 0.011 1.437
At the end of the fatigue testing, crack surfaces were carefully analyzed for the
individuation of the crack nucleation point and of possible internal defects. For this
purpose, a Stemi 305 stereo microscope (by ZEISS, Oberkochen, Germany) was used.
Finally, further specimens coming from the same sets were used to experimentally
characterize the ultimate tensile strength (UTS) and the yield point (Rp0.2) of the material
with and without coatings. For this purpose, tensile tests were carried out.

38
4.1.2 Results
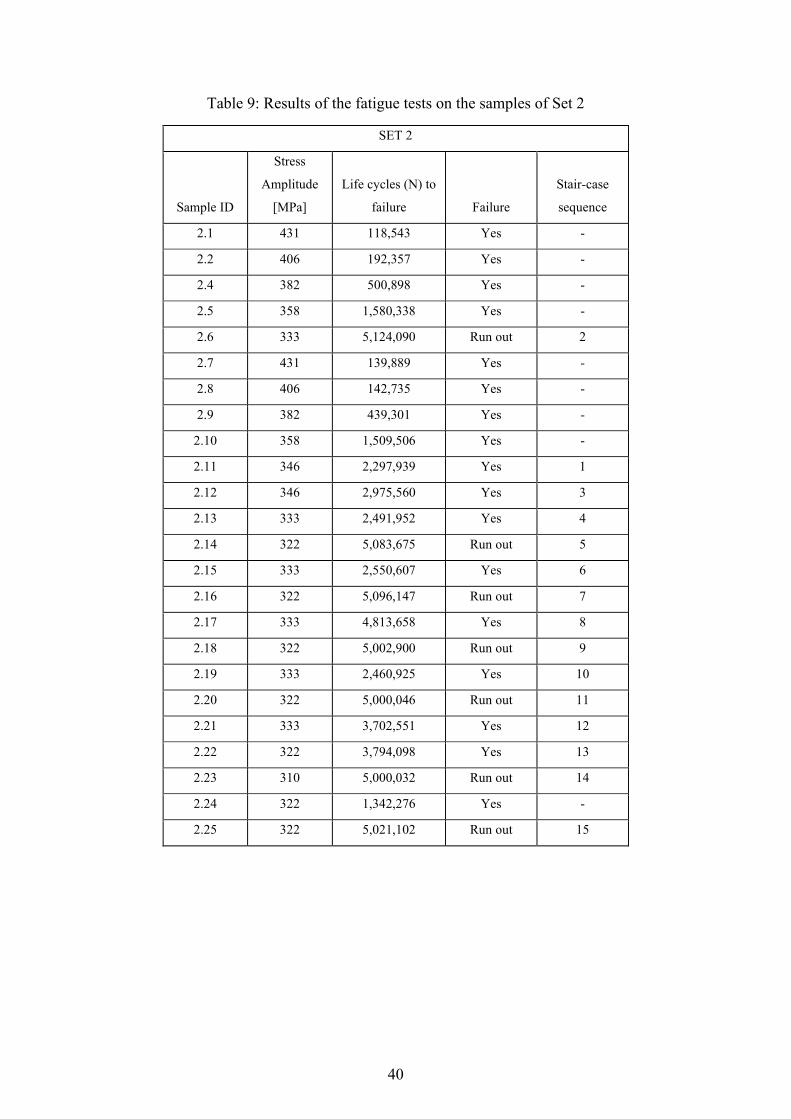
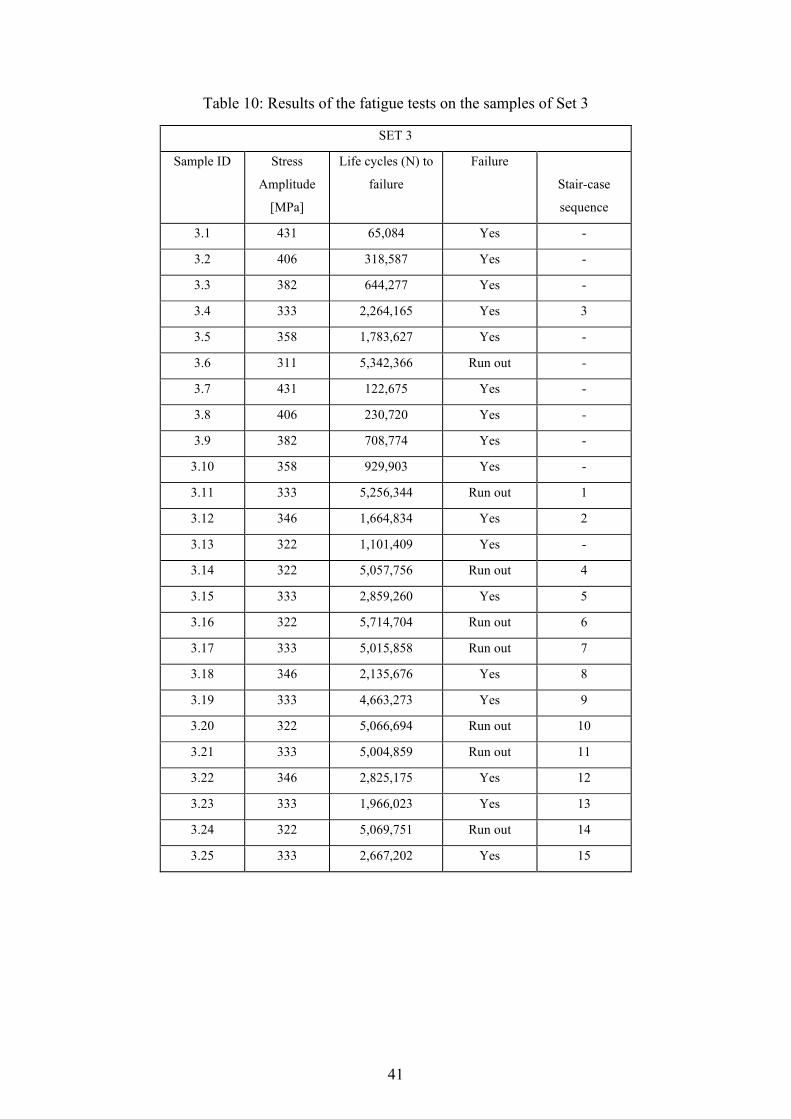
The experimental fatigue results are reported in Table 8 to Table 10. The tables provide
the sample identifier, as well as the maximum nominal bending stress (corresponding to
the stress amplitude) at the gage and the number of cycles to failure. Furthermore, in the
fourth column, an indication of the trial outcome (“Run out” or failure) is reported. In
particular, “Run out” indicates that the specimen survived testing after 5·106 cycles
whereas, “Yes” indicates failed specimens. It is necessary to point out that the failures
always occurred at the gage, far from the fillet. Finally, in the fifth column the samples
involved in the staircase are highlighted along with the indication of the related ordinal
number in the Failure/Run out sequence.
39
Table 8: Results of the fatigue tests on the samples of Set 1
SET1
Sample ID
Stress
Amplitude
[MPa]
Life cycles (N) to
failure Failure
Stair-case
sequence
1.1 311 5,006,836 Run out 6
1.2 358 490,983 Yes -
1.3 406 153,978 Yes -
1.4 333 5,008,744 Run out 2
1.5 382 309,689 Yes -
1.6 431 74,745 Yes -
1.7 346 365,613 Yes 1
1.8 431 24,028 Yes -
1.9 406 61,905 Yes -
1.10 382 113,586 Yes -
1.11 358 334,720 Yes -
1.12 346 353,105 Yes 3
1.13 333 422,380 Yes 4
1.14 322 3,298,272 Yes 5
1.15 322 3,580,666 Yes 7
1.16 311 5,012,908 Run out 8
1.17 322 15,476,393 Run out 9
1.18 333 2,514,009 Yes 10
1.19 322 5,000,243 Run out 11
1.20 333 5,110,789 Run out 12
1.21 346 954,747 Yes 13
1.22 333 1,902,361 Yes 14
1.23 322 3,200,363 Yes 15
40
Table 9: Results of the fatigue tests on the samples of Set 2
SET 2
Sample ID
Stress
Amplitude
[MPa]
Life cycles (N) to
failure Failure
Stair-case
sequence
2.1 431 118,543 Yes -
2.2 406 192,357 Yes -
2.4 382 500,898 Yes -
2.5 358 1,580,338 Yes -
2.6 333 5,124,090 Run out 2
2.7 431 139,889 Yes -
2.8 406 142,735 Yes -
2.9 382 439,301 Yes -
2.10 358 1,509,506 Yes -
2.11 346 2,297,939 Yes 1
2.12 346 2,975,560 Yes 3
2.13 333 2,491,952 Yes 4
2.14 322 5,083,675 Run out 5
2.15 333 2,550,607 Yes 6
2.16 322 5,096,147 Run out 7
2.17 333 4,813,658 Yes 8
2.18 322 5,002,900 Run out 9
2.19 333 2,460,925 Yes 10
2.20 322 5,000,046 Run out 11
2.21 333 3,702,551 Yes 12
2.22 322 3,794,098 Yes 13
2.23 310 5,000,032 Run out 14
2.24 322 1,342,276 Yes -
2.25 322 5,021,102 Run out 15
41
Table 10: Results of the fatigue tests on the samples of Set 3
SET 3
Sample ID Stress
Amplitude
[MPa]
Life cycles (N) to
failure
Failure
Stair-case
sequence
3.1 431 65,084 Yes -
3.2 406 318,587 Yes -
3.3 382 644,277 Yes -
3.4 333 2,264,165 Yes 3
3.5 358 1,783,627 Yes -
3.6 311 5,342,366 Run out -
3.7 431 122,675 Yes -
3.8 406 230,720 Yes -
3.9 382 708,774 Yes -
3.10 358 929,903 Yes -
3.11 333 5,256,344 Run out 1
3.12 346 1,664,834 Yes 2
3.13 322 1,101,409 Yes -
3.14 322 5,057,756 Run out 4
3.15 333 2,859,260 Yes 5
3.16 322 5,714,704 Run out 6
3.17 333 5,015,858 Run out 7
3.18 346 2,135,676 Yes 8
3.19 333 4,663,273 Yes 9
3.20 322 5,066,694 Run out 10
3.21 333 5,004,859 Run out 11
3.22 346 2,825,175 Yes 12
3.23 333 1,966,023 Yes 13
3.24 322 5,069,751 Run out 14
3.25 333 2,667,202 Yes 15

42
The results were then processed, in order to retrive the S-N curves in the finite life domain
and the endurance limits at Run out for the three specimen sets. S-N curves, together with
their upper (90% failure probability) and lower (10% failure probability) bounds at the
90% confidence level are respectively shown in Figure 33 to Figure 35 for the Sets 1, 2
and 3. These curves, plotted using a double logarithmic scale, were obtained by linear
regression, as the linear model always proved to be the most suitable, according to the
general linear test [47]. In the same figures, some specifications, with regard to the
specimen set and its feature, the load ratio and the testing frequency, are reported. Arrows
indicate the run outs.
Figure 33: S-N Curve along with his confidence bands and the endurance limit at 5
million cycles for Set 1

43
Figure 34: S-N Curve along with his confidence bands and the endurance limit at 5
million cycles for Set 2
Figure 35: S-N Curve along with his confidence bands and the endurance limit at 5
million cycles for Set 3
The relevant equations are provided in Table 11, in the terms of the coefficients of the
formulas in Equations 4.1 and 4.2, which refer to the (i-th) Set.
( ) ( ) ii SbbLogbbNLog +=+= 1010
(4.1)

44
110 110
bbb
i N=−
(4.2)
Table 11: Coefficients of the determined S-N curves, according to the linear model of
[23] with reference to Equations (4.1-4.2)
Set ID
1 41.30 -13.94 915 -0.072
2 39.95 -13.26 1031 -0.075
3 38.91 -12.85 1066 -0.078
The results of the tensile tests are reported in Table 12 to Table 14..
Table 12: Tensile test results for Set 1
Specimen ID E [GPa] Rp0.2 [MPa] UTS [MPa]
1.24 183 570 614
1.25 187 600 634
1.26 190 580 614
1.27 209 570 614
1.28 208 580 614
1.29 196 570 614
Mean 195 578 617
St Dev. 11.1 11.7 8.3
Table 13: Tensile tests results for Set 2
Specimen ID E [GPa] Rp0.2 [MPa] UTS [MPa]
2.3 191 570 617
2.26 195 570 617
2.27 197 610 640
2.28 198 590 638
2.29 174 580 617
2.30 196 570 610
Mean 192 582 623
St Dev. 9.1 16.0 12.5
0b 1b1
0
10b
b-
1
1
b

45
Table 14: Tensile tests results for Set 3
Specimen ID E [GPa] Rp0.2 [MPa] UTS [MPa]
3.26 203 600 631
3.27 204 580 628
3.28 202 590 632
3.29 203 600 632
3.30 200 590 631
Mean 203 592 631
St Dev. 1.3 8.4 1.5
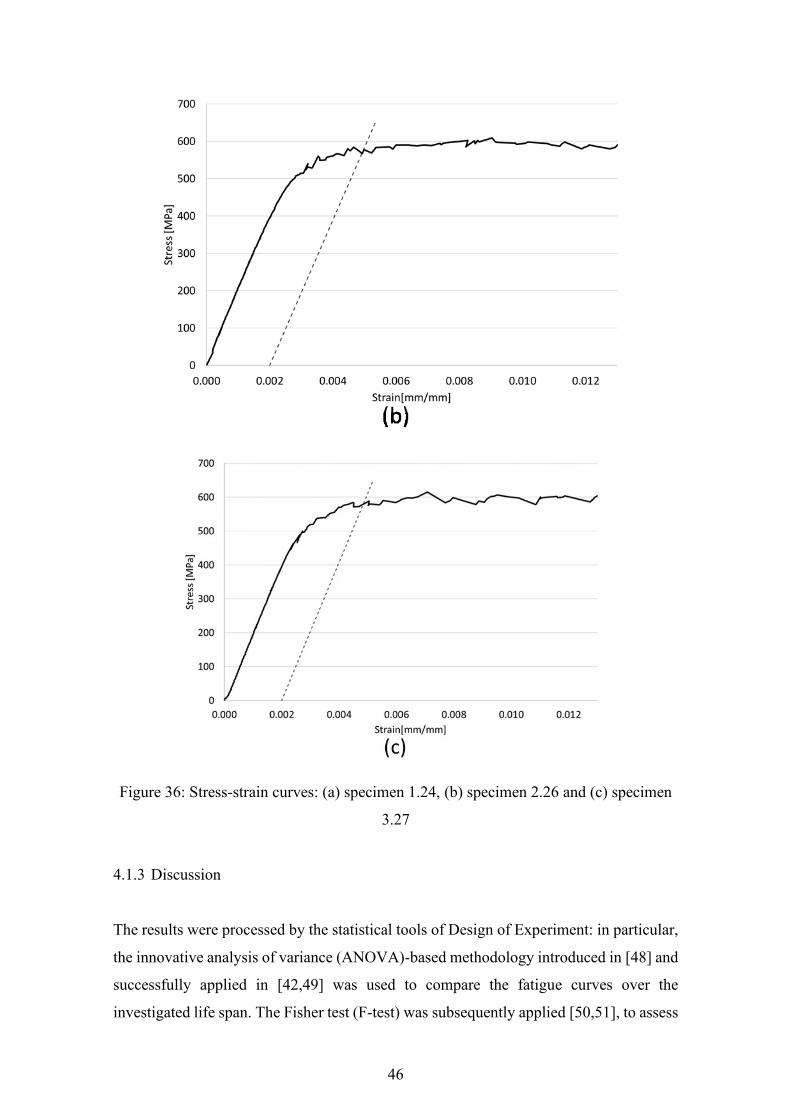
Experimental stress-strain curves with regard to specimens of the three sets are depicted
in Figure 36, where the graphical constructions for the estimation of the yield points is
also shown.
46
Figure 36: Stress-strain curves: (a) specimen 1.24, (b) specimen 2.26 and (c) specimen
3.27
4.1.3 Discussion
The results were processed by the statistical tools of Design of Experiment: in particular,
the innovative analysis of variance (ANOVA)-based methodology introduced in [48] and
successfully applied in [42,49] was used to compare the fatigue curves over the
investigated life span. The Fisher test (F-test) was subsequently applied [50,51], to assess

47
if the coatings had a significant effect (5% significance level) on the fatigue strength of
the material. The S-N curves related to the Sets 1, 2 and 3 are plotted together with the
related experimental data in Figure 37.
Figure 37: S-N Curves for Sets 1 to 3 plotted together with all the experimental data and
the average endurance limit at 5 million cycles
One-way ANOVA, as specifically described in [42,48,49], was applied to compare the
three curves (black, red and blue) corresponding to the Sets (1, 2 and 3). In particular, the
different strengths in the considered lifespan, i.e. the differences among the S-N curves,
were compared with respect to the experimental uncertainty. This was estimated as the
sum of the squares of the residuals, corresponding to the deviations between the
experimental and the predicted strengths, based on the S-N curves. The performed
statistical test indicates that the differences among the three curves are not significant. In
other words, it can be finally assessed that the three curves are statistically the same, as
the differences are confounded by the data scattering. The further step consisted in the
computation and subsequent comparison of the endurance limits at 5 million cycles,
following the determination of their confidence bands. The outcome of this processing is
depicted in the bar graph in Figure 38. The results are all very close with overlapped
bands, which suggests the endurance limits are not significantly affected by the presence
of coatings. As it can be noticed, for all sets, at an average, these limits turn out to be 53%
of the general UTS. This ratio is also in agreement with the commonly accepted ratios for
metallic materials.

48
Figure 38: Endurance limits at 5 million cycles with regard to the three Sets
Moreover, the tensile test results were also statistically processed by the same tool of
One-Way ANOVA. The outcome indicates that all the main features related to the static
response, i.e.: the Young’s modulus, the yield and the ultimate strengths are not
significantly affected by coatings, consistently with the previous outcomes concerned
with fatigue.
Finally, the facture surface was analyzed by the aid of a stereoscopic microscope and an
optical microscope, in order to detect the fatigue crack initiation point. Some examples
of fractures initiating from the surface are depicted in Figure 39 and Figure 40 with
examples for each of the three Sets involved in the experimental campaign. It was found
that the crack always starts from the surface for all the Set types. It can be remarked that,
considering the coated specimens, i.e. Sets 2 and 3, the presence of the coating did not
have a relevant role at triggering the nucleation. Indeed, the conducted surface analyses
indicate that the flaws started just beneath the external coated layer, from the external
surface of the steel part. This occurrence, highlighted in the detail of Figure 41, which
refers to the same sample of Set 2 in Figure 39, indicates a well comparable failure
mechanism with respect to that of the uncoated samples (Set 1).

49
Figure 39: Fracture surfaces observed by stereoscopic microscope for the three Sets.
(Set 1): specimen 1.18, 333 MPa, 2,514,009 cycles; (Set 2): specimen 2.13, 333 MPa,
2,491,952 cycles; (Set 3): specimen 3.13, 322 MPa, 1,101,409 cycles
Figure 40: Fracture surfaces observed by optical microscope for the three Sets. (Set 1):
specimen 1.7, 346 MPa, 365,613 cycles; (Set 2): specimen 2.8, 406 MPa, 142,735
cycles; (Set 3): specimen 3.13, 322 MPa, 1,101,409 cycles

50
Figure 41: Fracture surface of the specimen 2.13 observed by optical microscope
4.1.4 Summary of the fatigue tests
This section dealt with the effect of coating on the fatigue strength of a free cutting steel.
Three specimen sets were considered. One Set was tested in the “as received” conditions,
without coatings, a second one underwent a treatment of zinc coating and a third one was
nickel coated. All the experimental results were processed for the determination of the S-
N curves in the finite life domain and of the endurance limits at 5 million cycles. Some
specimens were utilized for tensile static tests, in order to estimate the Young’s modulus,
the yield strength and the ultimate tensile stress of the material. The results, statistically
processed, have indicated that the differences among the three sets, in terms of fatigue
strength, endurance limit and static mechanical properties, are not significant. The
average endurance limit, accounting for the three specimen Sets is 53% of the
corresponding ultimate tensile stress, consistently with the common accepted ratios for
metallic materials. The fracture surface analyses indicate that the fatigue cracks always
initiated from the specimen surfaces and that the presence of the external coating did not
trigger of facilitate flaw nucleation.
As remarked in the section 4.1, the scientific literature in the field of coatings for the
studied class of materials indicates these are mainly used to improve wear resistance or
to protect from corrosive environment. However, there is concern they may have a
detrimental effect on the fatigue response. The most interesting and original outcome of
this work is that the here studied electrodeposited Zinc and Nickel coatings do not

51
negatively affect the fatigue response and lead conversely to well comparable results to
those of the plain material. This consistency reflects also to the static properties of the
material.
Therefore, these results are likely to have a great relevance, considering the possible
application of coatings in the field of leaf springs, where they are mainly used to avoid
fretting wear occurrence. This study ensures the fatigue response under cyclic loads is not
compromised by the presence of external coatings, which makes it possible to avoid
additional expensive surface treatments, such as shot-peening, to strengthen the surface.
Moreover, these outcomes are expected to have a beneficial impact on the lock industry,
where coatings are widely utilized to improve the tribological behavior, even in harsh
environments.
Finally, considering the reported promising results for free-cutting steels: a follow-up of
this research will investigate in further details the improvement from the tribological point
of view the here involved coatings are able to provide.
4.2 Wear behavior of electrodeposited nickel coating on ZP5 zinc alloy [52]
Die-casting components, made of low strength materials, such as zinc alloys, are often
used in the industry due to their favorable manufacturing-related features and low cost.
These components must sometimes withstand cyclic loading in a corrosive environment.
As explained in the European Standard 12209 [13], which deals with the standard test
procedure for new lock components, these parts and devices should be tested in different
conditions. In particular, this Standard defines different product grades and the related
testing conditions. Each product, to be conforming to this Standard, must therefore pass
different tests (e.g. durability test of the latch action with a force applied, corrosion
resistance, …), aimed at assessing different features or capabilities. As explained in the
previous chapters, during the durability test of the latch action, the lock must be mounted
to a fixture, which is similar to a door. Afterwards, the door is opened by a force that is
cyclically applied for several cycles. During this process, the components may experience
a severe wear, due to the sliding between the components.
Due to process cost, the most widespread procedure adopted to improve the wear
resistance is to use electrodeposited nickel coatings on zinc alloys EN 12844 [14]. Indeed,
the combination of cheap materials as well of nickel coatings leads to cheaper products.

52
The testing procedure according to the current standard is very expensive in terms of time
and costs. In order to respond to this issue, Accelerated Life Tests can be a very promising
alternative to more economically assess the reliability of the product. Available
methodologies and applications have been proposed by several authors [53–59].
Many studies on the wear behavior of metal coatings were run [60–62], however, few of
them concern electroless nickel coatings [63–72], and, to the best of the authors’
knowledge, none of them is focused on the wear behavior of electrodeposited nickel
coating [15]. Therefore, the aim of this work is to determine the wear behavior of
electrodeposited nickel coating on ZP5 zinc alloy, assessing the influence of coating
thickness and applied load.
4.2.1 Materials and Methods
In the lock component under investigation, the latch is initially engaged in the strike plate.
Rotating the latch lever, it is possible to retract the latch rod. This component, bonded on
the latch, makes it possible to disengage the latch from the strike plate. The analyzed test
is focused on the latch durability under an applied load. As explained in the second
chapter, according to Standard [13], the testing procedure consists of different stages
(Figure 7): i- applying a force F3 equal to 120 N on the door; ii- opening the door by the
force F10; iii- closing the door. The minimum test duration is 2·105 cycles at a maximum
frequency of 10 cycles per minute. Since the wear mechanism occurs in the contact and
repeated sliding between the latch (made in ZP5 EN 12844 [14] Zn/Cu1Ni5s ISO 1458
[15]) and the forend (made in AISI 304 [18]), the wear behavior in an interaction between
these materials has been analyzed.
Laboratory tests were carried out by a slider-on-cylinder tribometer [73] (block-on-ring
contact geometry, according to ASTM G77 Standard [74]), in the unlubricated condition
and at ambient conditions (room temperature and humidity). The test scheme, according
to the aforementioned standard is shown in Figure 42. The test parameters were chosen
in order to simulate the actual test condition.

53
Figure 42: Block on ring wear tests [74]
In the slider on cylinder wear test (Figure 43), the slider represents the static element,
while the cylinder is the rotating one. Sliders were obtained directly from the actual
components (as shown in Figure 44): using a micro cutting machine, some 5x5x21 mm3
specimens were extracted from each latch. This component is made of ZP5 die-casting
alloy and treated by the electrodeposited nickel coating Zn/Cu1Ni5s ISO 1458 [15]. This
process provides a first layer of pure copper with a minimum thickness of 1 µm and a
subsequent layer of pure nickel coating with a minimum thickness of 5 µm. In order to
perform the test, the 5x5x21 mm3 specimens were fixed in a sample holder. As counter
material, a rotating AISI 304 cylinder with 40 mm diameter was used.

54
Figure 43: Slider on cylinder wear test
The hardness of the coating, experimentally evaluated by a micro-indentation test, was
430 HV 0.01. The hardness of the cylinder was evaluated by a Rockwell indentation test
and was estimated as 29 HRC. Moreover, the cylinder roughness (Ra) was equal to 0.2
µm whereas the slider roughness (Ra) was equal to 0.7 µm. The electrodeposition process
is known to provide a variable coating thickness on the components [75], as it is hard to
accurately control its actual extent during the manufacturing process. Indeed, as indicated
in the Standard [15] just the minimum coating thickness should be prescribed. The actual
coating thickness was measured (for each specimen) on a metallographic section using
an optical microscope (as shown in Figure 45). Five measurements per specimen were
done, thus determining the average values. The specimens were split into 3 groups,
depending on the total coating thickness (LOW coating thickness: 5-10 µm; MEDIUM
coating thickness: 10-15 µm; HIGH coating thickness: 15-20 µm; Table 15).

55
Table 15: Measured coating thickness.
Group Specimen ID Cu thickness Ni thickness Total coating
thickness
Low 2
6
4.4
3.8
5.0
6.1
9.4
9.9
7 4.1 5.7 9.8
Medium 9
5
3.7
4.2
7.4
10.5
11.1
14.7
3 4.5 7.9 12.4
High 1
4
7.8
5.5
8.9
13.3
16.7
18.8
8 7.1 10.2 17.3
Figure 44: Static specimen (slider)
The sliding tests were carried out by applying a vertical force on the slider. Tre different
levels of force (5 N, 10 N and 15 N) were used during the test, in order to investigate the
effect of contact pressure on the wear resistance of the coating. In particular, specimens
1, 2, and 3 were tested using 5 N of applied force, specimens 4, 5 and 6 were tested at 10
N whereas specimens 7, 8 and 9 were tested at 15 N. Moreover, in order to determine
how the wear resistance is affected by the aforementioned factors, with a sufficient
statistical evidence, the tests were replicated. In total, three replications per combination
of coating thickness and applied load (contact pressure) were performed. On a single

56
specimen three tests were made considering three different locations. A total of twenty-
seven wear test were made on nine specimens as indicated in Table 16.
The sliding velocity was set at 0.3 m/s (143,3 rpm) and the total distance was set at 500
m for each test. This distance was selected, in order to replicate the total actual sliding
distance of the durability test of the latch action with a force applied for the maximum
grade (Grade X: 200,000 cycles). The Standard, indeed, provide different product grades
and for which one provide a different test duration. During the test normal load, friction
force and vertical displacement were constantly monitored by bending load cells and a
linear variable displacement transducer (LVDT) respectively. The LVDT provides an
output signal being related to a combination of the wear of both the slider and the cylinder.
With the aim to determinate the contribution of the slider alone, profilometric
measurements of wear tracks were carried out at the end of each test by stylus
profilometry (tip with a 5 μm curvature radius): for each track, three measurements were
made. Finally, wear tracks on the sliders were observed by means of a 3D digital
microscope.
Table 16: Design of the experiment
COATING THICKNESS [µm]
5-10 10-15 15-20
APPLIED
FORCE [N]
5 Specimen 2 Specimen 3 Specimen 1
10 Specimen 6 Specimen 5 Specimen 4
15 Specimen 7 Specimen 9 Specimen 8

57
Figure 45: Metallographic section: coating thickness analysis (fresh specimen)
According to [74] the wear volume loss was evaluated by Equation 4.3:
21 14· ·
· 2sin sin 2sin8 2 2
r t b bSr
r r
− − = −
(4.3)
where r represents the cylinder radius, t is the specimen width, and b is the track width as
indicated in Figure 46.
Figure 46: Evaluation of the scar volume according to ASTM G77-17 [74]
4.2.2 Results
During the tests, the applied force, the tangential force and the LVDT output signal were
sampled. Such procedure made it possible to investigate the evolution of the friction
coefficient throughout a test. Typical trends of friction coefficient and of system wear
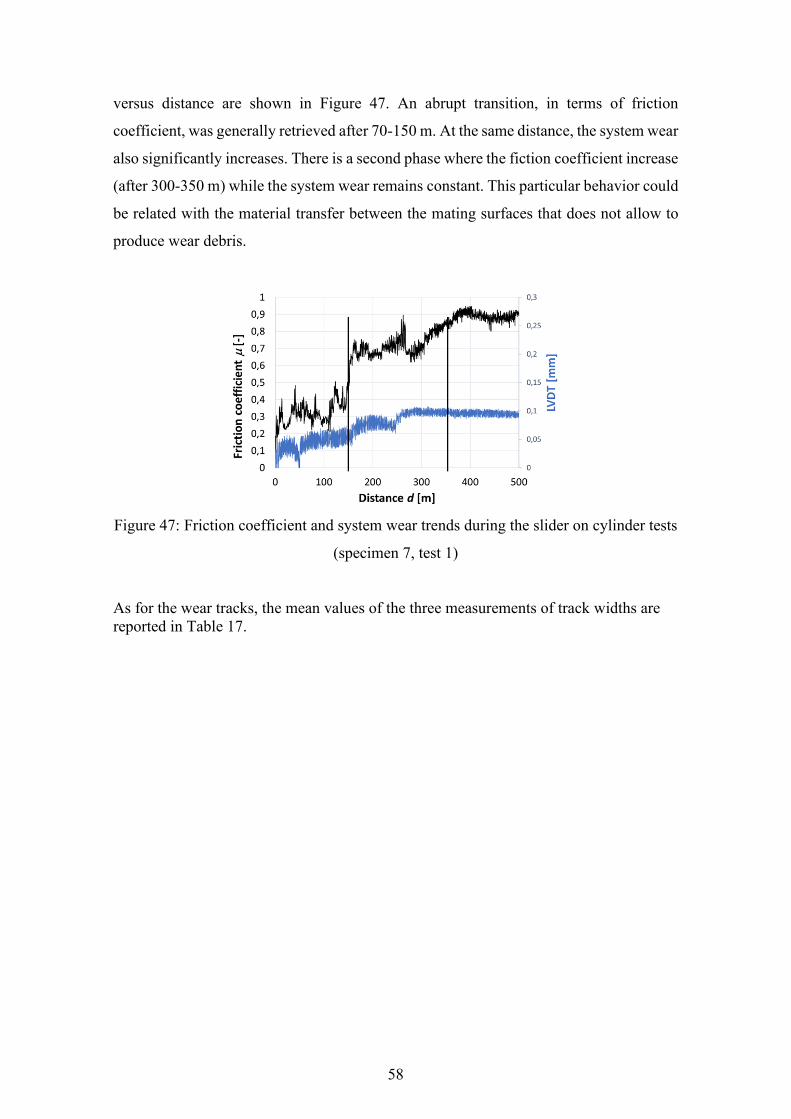
58
versus distance are shown in Figure 47. An abrupt transition, in terms of friction
coefficient, was generally retrieved after 70-150 m. At the same distance, the system wear
also significantly increases. There is a second phase where the fiction coefficient increase
(after 300-350 m) while the system wear remains constant. This particular behavior could
be related with the material transfer between the mating surfaces that does not allow to
produce wear debris.
Figure 47: Friction coefficient and system wear trends during the slider on cylinder tests
(specimen 7, test 1)
As for the wear tracks, the mean values of the three measurements of track widths are
reported in Table 17.

59
Table 17: Wear track measurements
Load [N] Specimen ID Wear track Width [mm]
5
1
1
2
3
2.499
2.174
2.175
2
1
2
3
2.675
1.748
2.350
3
1
2
3
2.878
2.149
2.025
10
4
1
2
3
2.938
3.088
3.208
5
1
2
3
3.151
2.670
3.117
6
1
2
3
3.519
3.123
3.262
15
7
1
2
3
4.143
3.904
3.537
8
1
2
3
3.904
3.928
3.867
9
1
2
3
3.965
3.927
4.239
In Figure 48 shows some representative 3D digital micrographs of wear tracks, taken on
high coating thickness sliders: a severe wear regime may be recognized. It can be noticed
that both the nickel coating and copper interlayer have been removed upon sliding,
confirming the results of the profilometric investigations. Under both load levels, the
substrate is clearly visible at the center of the wear tracks while, at the edges, a few debris
of the copper interlayer can be detected.

60
Figure 48: 3D digital micrographs of wear tracks on sliders: a) and b) low
magnifications of tracks on specimen 1 and 8 respectively, c) and d) high
magnifications of tracks edges on specimen 1 and 8 respectively
4.2.3 Discussion
Based on the test outputs it can be pointed out that there is a transition, in terms of friction
coefficient, after 100-150 m of total travel. This outcome suggests that the entire coating
thickness was worn out completely at this stage. Indeed, this transition can be due to the
change of the tribological state of the contact. Initially, there is a contact between the
AISI 304 bar and the nickel coating. After the aforementioned distance, , as an effect of
wearing of the coating, the contact involves the base material (ZP5), thus producing the
aforementioned abrupt variation of the friction coefficient. Moreover, focusing on the
LVDT, it can be noticed that the transition of the friction coefficient can be related to a
suddenly increase of the system wear.
After the tests, all the wear tracks were measured in order to calculate the volume loss.
Using the results reported in Table 17 and Equation 4.3 it was possible to obtain the scar

61
volume reported in Table 18. The same results are compared in Figure 49 in the form of
a bar graph with the indication of the scatter bands from maximum to minimum measured
values.
In order to detect the impact of each factor on the wear volume loss, these results were
treated by the statistical tools of two-way ANOVA and Fisher test. These tools make it
possible to assess if the factors involved in the experimental tests have a significant effect
on the wear volume loss.
The outcome of the performed analysis indicate that wear is strongly affected by the
applied load (p-value=2.4·10-8). Furthermore, there is no significant effect of the coating
thickness on the wear volume loss. This outcome, as mentioned before, suggests that the
coating thickness is worn out completely during the first stages of the test. Finally, no
significant interactions were found between applied load and coating thickness.
Table 18: Scar volume loss after 500 m evaluated with the Equation 4.3
Specimen ID Wear track Sr [mm3]
1
1
2
3
0.3253
0.2143
0.2144
2
1
2
3
0.3991
0.1113
0.2705
3
1
2
3
0.4974
0.2068
0.1730
4
1
2
3
0.5292
0.6156
0.6898
5
1
2
3
0.6530
0.5484
0.6324
6
1
2
3
0.9100
0.6354
0.7242
7
1
2
3
1.4863
1.2427
0.9236
8 1 1.2427

62
2
3
1.2663
1.2076
9
1
2
3
1.3020
1.2648
1.5917
Figure 49: Wear volume loss after 500 m on the slider on cylinder test
4.2.4 Further experimental tests at reduced distance
In order to evaluate a possible effect of the coating thickness on the wear behavior of the
nickel coating, further experimental tests were carried out. Focusing on the outcomes of
the aforementioned experimental tests it was decided to repeat the slider on cylinder wear
tests using a reduced sliding distance of 150 m corresponding to the sliding distance until
the transition between the two friction coefficient levels. Also in this case, three different
levels for the applied load (5 N, 10 N and 15 N) and three different levels for the coating
thickness (LOW coating thickness: 5-10 µm; MEDIUM coating thickness: 10-15 µm;
HIGH coating thickness: 15-20 µm) were analyzed. The coating thicknesses of the tested
specimens are reported in Table 19. However, in this case, a total of six replicates for

63
each condition were made. The wear volume loss Sr (reported in Table 20) was still
evaluated by the Equation 4.3.
Table 19: Measured coating thickness for specimens used in the “reduced-distance
tests”
Group Specimen ID Cu thickness Ni thickness Total coating
thickness
Low 16
19
4.3
4.1
5.5
5.6
9.8
9.7
17 3.8 6.1 9.9
Medium 14
10
4.1
4.3
9
10.3
13.1
14.6
26 3.9 10.1 14.0
High 20
22
6.5
4.8
12.9
15.1
19.4
19.9
15 6.2 12.7 18.9
Table 20: Wear track width and wear volume loss after 150 m evaluated with Equation
4.3
Specimen ID Wear track Width [mm] Sr [mm3]
10
1 2.219 0.2278
2 2.381 0.2815
3 2.555 0.3477
4 2.543 0.3430
5 2.307 0.2561
6 2.827 0.4714
14
1 1.880 0.1384
2 1.893 0.1413
3 1.846 0.1310
4 1.865 0.1351
5 1.358 0.0521
6 1.615 0.0877
15
1 2.747 0.4325
2 2.564 0.3516
3 2.604 0.3683
4 2.732 0.4252
5 2.242 0.2350
6 2.606 0.3692

64
17
1 2.862 0.4889
2 2.682 0.4025
3 2.648 0.3873
4 2.574 0.3555
5 2.598 0.3658
6 2.582 0.3589
19
1 2.541 0.3422
2 2.574 0.3555
3 2.698 0.4095
4 2.391 0.2849
5 2.244 0.2356
6 2.364 0.2755
20
1 2.089 0.1899
2 1.516 0.0725
3 2.032 0.1749
4 1.674 0.0977
5 1.933 0.1506
6 2.071 0.1851
22
1 2.419 0.2952
2 2.326 0.2623
3 2.831 0.4734
4 2.255 0.2391
5 2.345 0.2688
6 2.467 0.3130
26
1 2.848 0.4820
2 2.722 0.4208
3 2.814 0.4647
4 2.998 0.5620
5 2.730 0.4242
6 3.094 0.6182
The two-way ANOVA and F-Test were then used in order to determine the influence of
each factor on the nickel coating wear behavior. Again, the contact pressure proved to be
the only factor affecting the wear volume lost (p-value 3·10-17). Moreover, it was assessed
that there is a low interaction between the applied load and the coating thickness (p-value
2·10-2). In Figure 50 the results obtained during the tests are reported in form of bar graph
with the related error bands. Is simple to see that the wear volume is affected simply by
the applied load.

65
Figure 50: Wear volume loss after 150 m on the slider on cylinder test
4.2.5 Summary of the wear tests
The wear behavior of an electrodeposited nickel coating on a zinc alloy was analyzed.
The specimens were obtained directly from the actual component used in a lock
application. According to the ASTM G77-17 Standard [74], a 5x5x23 mm3 bars were
machined. Since in the actual application, wear occurs between the electrodeposited
nickel coating and an AISI 304 steel component, slider on cylinder wear tests were run,
using an AISI 304 cylindric geometry as the rotating element.
The specimens were prepared by the aid of a metallographic section, in order to determine
the actually generated coating thickness of the single specimen. So, the specimens were
split into three groups, depending of their uniform coating thickness. The wear tests were
run, with three different load levels.
It was assessed that there is a transition in terms of friction coefficient during the first
stage of test. This outcome indicates that the entire coating thickness was worn out at this
stage. The total wear volume that was lost after 500 m was evaluated according to the
American Standard [74]. In order to evaluate the significance of the effects of the applied

66
load and coating thickness on the wear of the tribological system, the wear volume results
were treated by statistical tools, in particular two-way ANOVA and F-test.
It was assessed that the applied load has a strong influence on the wear behavior of the
electrodeposited nickel coating. Conversely, the coating thickness does not significantly
affect the wear. This outcome also suggests that the whole coating is completely worn
out at the first stage of the test. Finally, it was assessed that the interaction between the
applied load and the coating thickness is not significant, meaning that load keeps its
significance regardless of coating thickness in the investigated range.
Focusing on the aforementioned wear tests results it was decided to carry out further
analyses at a reduced sliding distance of 150 m.
It was assessed that, the total volume lost after the wear tests, is strongly affected by the
applied load and there is a low interaction between the two factors. Finally, it was stated
that there is no significant effect of the coating thickness on the wear rate.

67
5. ANALYTICAL MODEL
As explained in the second chapter, in order to set up an accelerated life testing (Figure
51, it is mandatory to know the stress-strain field of the components involved in the test
as well as the stress-life curves of the materials. It is also necessary to evaluate every
possible source of nonlinearities.
In chapter 3, the FEAs that have been developed in order to define the stress field, in
terms of bending stresses (that brings until the fatigue failure of the components) and
contact pressures (that influence the wear rate of the material), have been presented.
Indeed, in order to accelerate the test, it is necessary to increase the load applied on the
device. This means that the components are therefore subjected to stresses that are not
necessarily linearly dependent on the applied load.
In chapter 4, the experimental tests were presented in order to define the fatigue behavior
of the 11 SMnPb 30 free cutting steel and the wear behavior of the electrodeposited nickel
coating on a zinc alloy. It was assessed that the fatigue behavior of the free cutting steel
is not influenced by the coatings. Moreover, the wear behavior of the nickel coating was
proven to be affected just by the applied load (see chapter 5).
In this chapter, the analytical model able to predict the actual service life of the lock
components, written in the software Wolfram Mathematica, is eventually discussed.
Figure 51: Accelerated life testing flowchart. A method applied to a case of study

68
5.1 Fatigue characterization
Since it is necessary to represent the fatigue behavior of the materials involved in the
accelerated life testing, the data presented in section 4.1 were used to describe the fatigue
curve of the free cutting steel 11 SMnPb 30. Moreover, the fatigue data reported in [22]
were used to describe the fatigue curve of the S420MC. The stress-life curve of the
materials, indeed, can be described by Equations 5.1 and 5.2 reported here below for the
sake of clarity.
( ) ( ) ii SbbLogbbNLog +=+= 1010
(5.1)
110 110
bbb
i N=−
(5.2)
Regarding the free cutting steel, the coefficients b0=41.3 and b1= -13.94 were chosen from
Table 11 for the uncoated material type. This choice was made because the validation test
(which will be used later to assess the accuracy of the analytical model) has been carried
out using a latch rod without any coating. The fatigue curve of this material is shown in
Figure 52 in double-logarithmic scale.
Figure 52: Free cutting steel 11 SMnPb 30 fatigue curve
Regarding the S420MC steel, the aforementioned analysis was carried out. In order to
describe its fatigue curve, the coefficients b0=25.15 and b1= -8.16 were used [22] and the
relative plot is reported in Figure 53 in double-logarithmic scale.
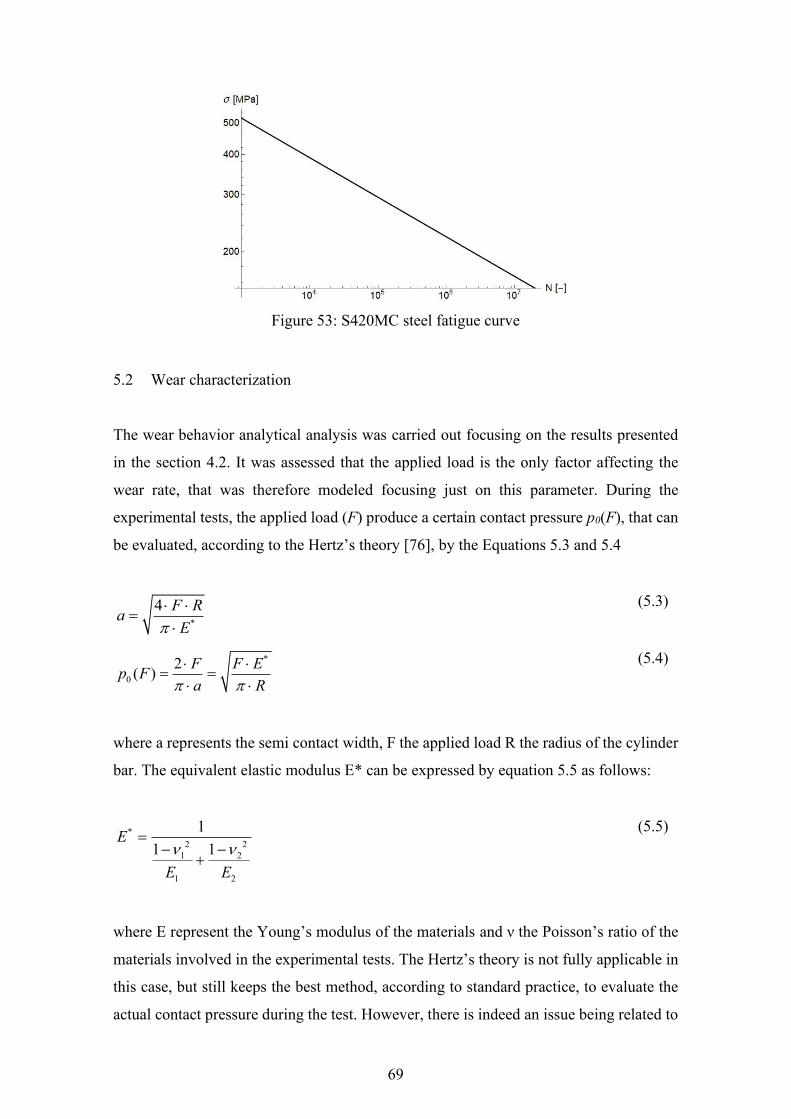
69
Figure 53: S420MC steel fatigue curve
5.2 Wear characterization
The wear behavior analytical analysis was carried out focusing on the results presented
in the section 4.2. It was assessed that the applied load is the only factor affecting the
wear rate, that was therefore modeled focusing just on this parameter. During the
experimental tests, the applied load (F) produce a certain contact pressure p0(F), that can
be evaluated, according to the Hertz’s theory [76], by the Equations 5.3 and 5.4
*
4 F Ra
E
=
(5.3)
*
0
2( )
F F Ep F
a R
= =
(5.4)
where a represents the semi contact width, F the applied load R the radius of the cylinder
bar. The equivalent elastic modulus E* can be expressed by equation 5.5 as follows:
*
2 2
1 2
1 2
1
1 1E
E E
=
− −+
(5.5)
where E represent the Young’s modulus of the materials and ν the Poisson’s ratio of the
materials involved in the experimental tests. The Hertz’s theory is not fully applicable in
this case, but still keeps the best method, according to standard practice, to evaluate the
actual contact pressure during the test. However, there is indeed an issue being related to

70
the accurate evaluation of the actual contact area during the test. The standard practice is
to evaluate the contact pressure using the Hertz’s theory. In particular, regarding the AISI
304 bar 195E GPa= [77] and 0.3 = were used whereas for the electrodeposited nickel
coating 205E GPa= [78] and 0.31 = .
After the slider on cylinder wear test, all the wear tracks were measured as explained in
section 4.2. It was therefore possible to evaluate the wear volume loss using Equation 4.3.
Since wear is affected just by the applied load, the wear volume loss was evaluated
grouping the results based on the applied load. The experimental results are reported in
Table 21.
Table 21: Experimental wear test results
Applied Load [N] 5 10 15
Contact pressure [MPa] 66.2 93.6 114.7
Wear volume lost after 500 m [mm3] 0.268 0.660 1.281
Standard deviation (500 m) [mm3] 0.121 0.112 0.186
Wear volume lost after 150 m [mm3] 0.138 0.316 0.420
Standard deviation (150 m) [mm3] 0.041 0.075 0.077
The wear rate was obtained by simply dividing the wear volume by the total sliding
distance. The data were fitted using a 4th-order function as shown in Equation 5.6.
-5 -7 2 -9 3
0 0 0 0( ) 1.571 10 p - 3.513 10 p + 3.56642 10 pWr p = (5.6)
In Figure 54 the wear rate graph is reported as a function of the contact pressure.
Figure 54: Wear rate as a function of the contact pressure
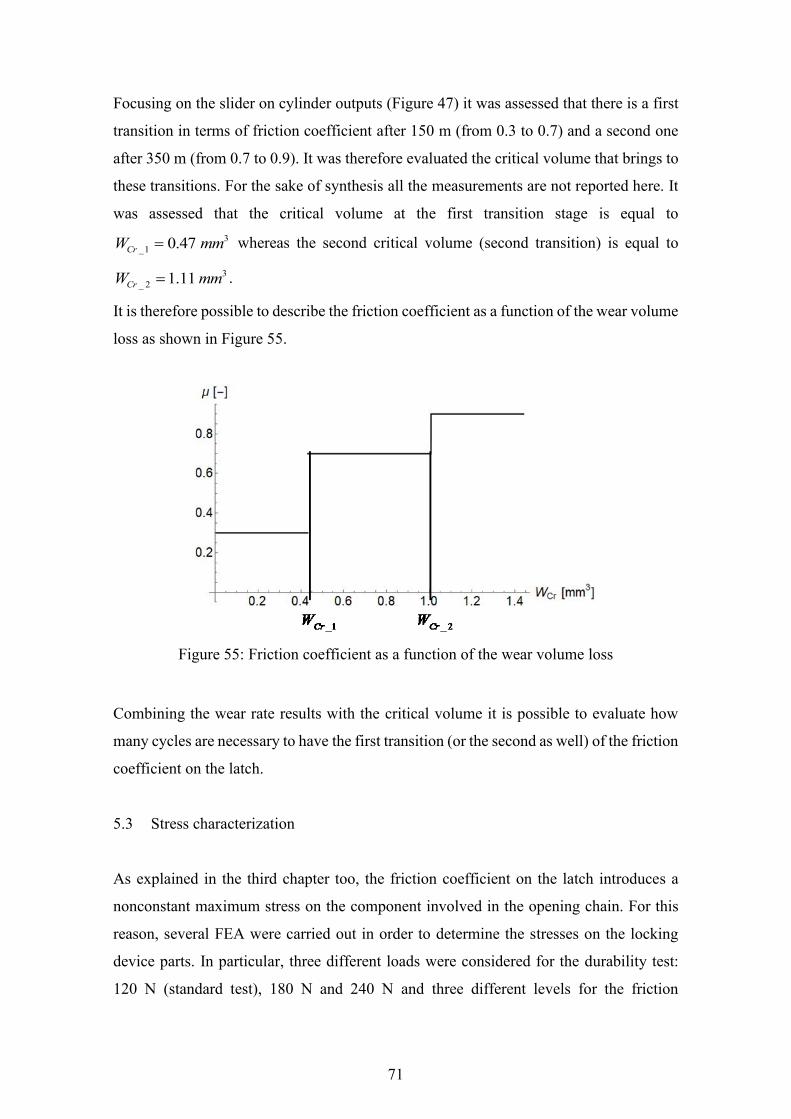
71
Focusing on the slider on cylinder outputs (Figure 47) it was assessed that there is a first
transition in terms of friction coefficient after 150 m (from 0.3 to 0.7) and a second one
after 350 m (from 0.7 to 0.9). It was therefore evaluated the critical volume that brings to
these transitions. For the sake of synthesis all the measurements are not reported here. It
was assessed that the critical volume at the first transition stage is equal to
3
_1 0.47 CrW mm= whereas the second critical volume (second transition) is equal to
3
_ 2 1.11 CrW mm= .
It is therefore possible to describe the friction coefficient as a function of the wear volume
loss as shown in Figure 55.
Figure 55: Friction coefficient as a function of the wear volume loss
Combining the wear rate results with the critical volume it is possible to evaluate how
many cycles are necessary to have the first transition (or the second as well) of the friction
coefficient on the latch.
5.3 Stress characterization
As explained in the third chapter too, the friction coefficient on the latch introduces a
nonconstant maximum stress on the component involved in the opening chain. For this
reason, several FEA were carried out in order to determine the stresses on the locking
device parts. In particular, three different loads were considered for the durability test:
120 N (standard test), 180 N and 240 N and three different levels for the friction

72
coefficient, namely 0.3, 0.7, 0.9. The FEA outputs were used to obtain the bending
stresses as a function of the applied load for the aforementioned friction coefficient. The
fitting law was chosen linear and in Equation 5.7, the three formulas represent the curve
of the maximum contact pressure at the latch (p_latch(F3)) as functions of the applied load
F3
0.3
0.7
0.9
_ ( 3) - 5.914 + 1.111 F3
_ ( 3) - 2.571 + 1.186 F3
_ ( 3) - 0.857 + 1.229 F3
p latch F
p latch F
p latch F
=
=
=
=
=
=
(5.7)
In Equations 5.8 and 5.9, are reported the relative curves of the maximum bending stress
on the latch rod and on the latch lever respectively, for the three different friction
coefficients. In this case also, the contacts do not introduce any nonlinearities on the
stresses, so a linear law was used.
0.3
0.7
0.9
_ _ ( 3) 29.543 + 1.389 F3
_ _ ( 3) 33.114 + 1.553 F3
_ _ ( 3) 35.257 + 1.665 F3
latch rod F
latch rod F
latch rod F
=
=
=
=
=
=
(5.8)
0.3
0.7
0.9
_ _ ( 3) 0.171 + 1.604 F3
_ _ ( 3) 1.171+ 1.671 F3
_ _ ( 3) 0.829 + 1.729 F3
latch lever F
latch lever F
latch lever F
=
=
=
=
=
=
(5.9)
In this case also, the contacts no introduce nonlinearities on the stresses, so a linear law
was used.
The force versus pressure and stresses curves are reported in Figure 56

73
Figure 56: FEA results as a function of the friction coefficient and of the applied force:
a) maximum contact pressure on the latch, b) maximum bending stress on the latch rod,
c) maximum bending stress on the latch lever
5.4 Predictive analytical model
In order to evaluate the actual service life of the device, during the accelerated test, it is
necessary to develop an analytical model taking as an input the experimental data and the
FEA results, and capable of giving in output the number of cycles to failure of the
components. As explained before, due to the contact pressure on the latch, wear
introduces a source of nonlinearity. During the opening phase, indeed, there is a transition
in terms of friction coefficient between the latch and the forend and the strike plate. This
transition introduces a stress increment on the components that are downstream the
opening mechanism.
It is important to point out that (almost always) the latch failure mechanism is wear,
whereas the latch rod and the latch lever often fail because of fatigue.
The critical wear volumes, up to the transition of the friction coefficient, were analyzed
and used to determine the actual number of cycles at each stress condition. Using a
cumulative damage model (Miner’s rule), it is then possible to predict the number of
cycles up to fatigue failure of each component.

74
From Equation 5.6, it is possible to evaluate the wear rate as a function of the applied
load and therefore of the contact pressure. The Equations 5.10 allow then to evaluate the
actual number of cycles up to the transitions of the friction coefficient.
_1
_1
_ 2 _1
_ 2
( _ ( 3))( _ ( 3))
( _ ( 3))( _ ( 3))
Cr
Cr
track
Cr Cr
Cr
track
Wn p latch F
Wr p latch F L
W Wn p latch F
Wr p latch F L
=
−=
(5.10)
Where _1 0( )Crn p represent the number of cycles to the first transition, _ 2 0( )Crn p the
number of cycles to the second transition, and trackL represent the total sliding length on
the latch during the accelerated test (equal to 3 mm in the case study). The number of
cycles at each friction coefficient depends on the contact pressure that depends on the
applied force. Therefore, the number of cycles _1 0( )Crn p and _ 2 0( )Crn p depend on the
applied load.
Using the Miner’s rule (reported in Equation 5.11), it is therefore possible to evaluate the
actual number of cycles up to failure for each component involved in the accelerated test.
1i
ii
n
N=
(5.11)
Where n represents the actual number of cycles at a determined stress and N is the number
of cycles up to fatigue failure at the same stress value.
In the case study, there are three stress levels corresponding to three friction coefficients.
The Miner’s rule can be written as follows (Equation 5.12) for the latch lever:
_1 _ 2
0.3 0.7
_
0.3
( _ ( 3)) ( _ ( 3))
( _ _ ( 3) ) ( _ _ ( 3) )
( _ ( 3))1
( _ _ ( 3) )
Cr Cr
latch lever
n p latch F n p latch F
N latch lever F N latch lever F
n p latch F
N latch lever F
= =
=
+ +
+ =
(5.12)
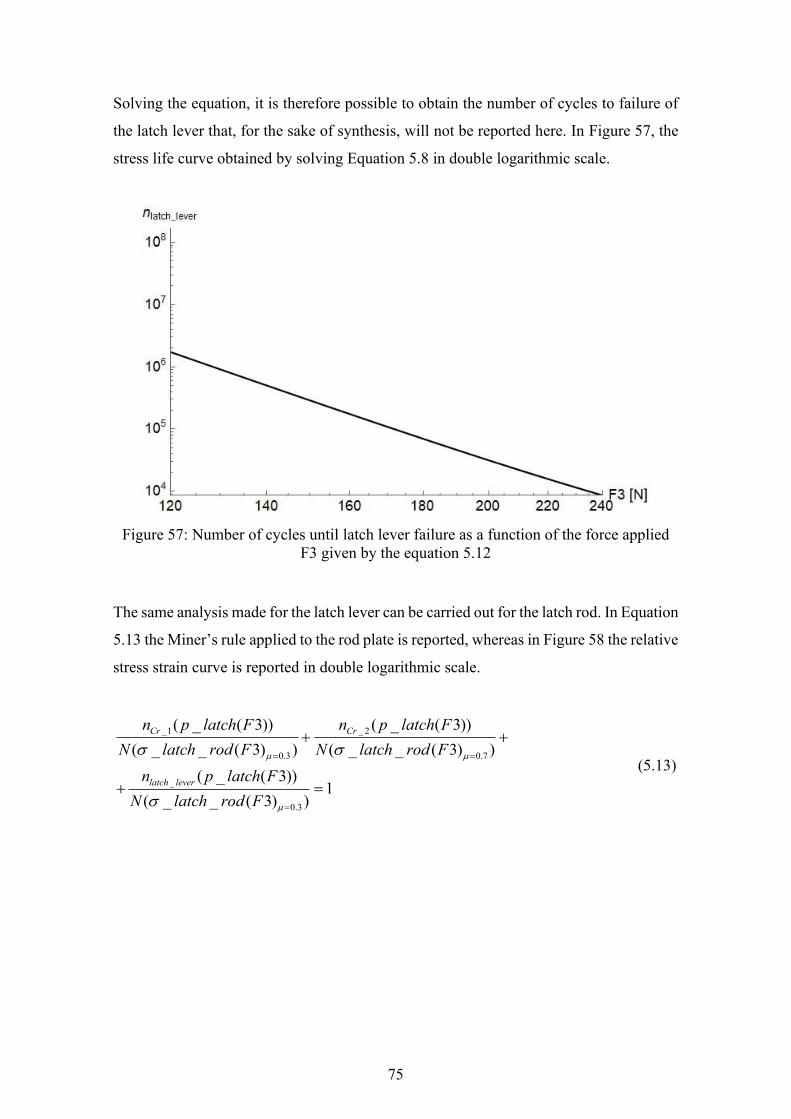
75
Solving the equation, it is therefore possible to obtain the number of cycles to failure of
the latch lever that, for the sake of synthesis, will not be reported here. In Figure 57, the
stress life curve obtained by solving Equation 5.8 in double logarithmic scale.
Figure 57: Number of cycles until latch lever failure as a function of the force applied
F3 given by the equation 5.12
The same analysis made for the latch lever can be carried out for the latch rod. In Equation
5.13 the Miner’s rule applied to the rod plate is reported, whereas in Figure 58 the relative
stress strain curve is reported in double logarithmic scale.
_1 _ 2
0.3 0.7
_
0.3
( _ ( 3)) ( _ ( 3))
( _ _ ( 3) ) ( _ _ ( 3) )
( _ ( 3))1
( _ _ ( 3) )
Cr Cr
latch lever
n p latch F n p latch F
N latch rod F N latch rod F
n p latch F
N latch rod F
= =
=
+ +
+ =
(5.13)

76
Figure 58: Number of cycles until latch rod prediction failure as a function of the force
applied F3 given by the equation 5.13
As it can be noticed, increasing the force F3, it is possible to reduce the actual service life
of the components involved in the accelerated life testing. A comparison between the two
curves plotted in Figure 57 and Figure 58, suggests that failure should always occur on
the latch lever.
5.5 Validation of the analytical model
In order to validate the analytical model, a series of experimental accelerated life tests
were carried out on a dedicated testing machine. The force was applied directly to the
door. Three load levels were considered: 120 N, 180 N and 240 N. A total of three
replications were made. The run out was set at 2·106 cycles. In Table 22 are reported the
results in terms of number of cycles up to the device failure. The failure always occurred
on the latch lever.
Table 22: Experimental validation tests
Applied Load [N] 120 180 240
Test 1 200,000 68,341 7,124
Test 2 200,000 61,974 7,932
Test 3 200,000 62,757 6,798

77
Mean 200,000 64,357 7,285
St. Dev. - 3472 584
The experimental results were used in order to validate the analytical model. In Table 23
the number of cycles up to failure given by the analytical model are reported.
Table 23: number of cycles up to failure given by the analytical model
Applied Load [N] 120 180 240
Number of cycles up to failure latch lever 1,725,310 69,682 8,608
Number of cycles up to failure latch rod 167,123,000 1,209,830 36,996
It can be stated that the device failure always occurs on the latch lever due to fatigue
degradation of this component. The analytical model results were therefore compared
with the experimental ones. In Table 24 the comparison is reported with the indication of
the error committed using the analytical model. The first force level (120 N) was not
taken into account because both the experimental and the analytical model shows that the
device survive at 200,000 cycles.
Table 24: Comparison between the analytical model and the experimental test
Applied Load [N] 180 240
Experimental failure 64,357 7,285
Latch lever prediction failure 69,682 8,608
Error 5,325 1,323
Error % 8.3% 18.2%
As it can be noticed there is a good agreement between the analytical forecast and the
experimental one. The same results are also collected in Figure 59, where the curve deals
with failure prediction by the analytical model, whereas the red points indicate actual
failures, which occurred during the experimental validation tests.

78
Figure 59: Comparison between the failure predicted by the analytical model and the
experimental results
5.6 Generalization of the case of study
In order to develop this study a locking device was used as a demonstrator. In this section
a generalization of the described method will be presented. For example, in the single-
axis hinges, of lift-off or fixed pin type, for use on access windows and doors (Figure 60),
the European Standard EN 1935 [79], many tests should be carried out. Hinges suitable
for side-hanging use are usually strong enough for top-hanging applications with hinged
elements of the same mass. However, the load bearing and wearing surfaces are totally
different for the two types of application.
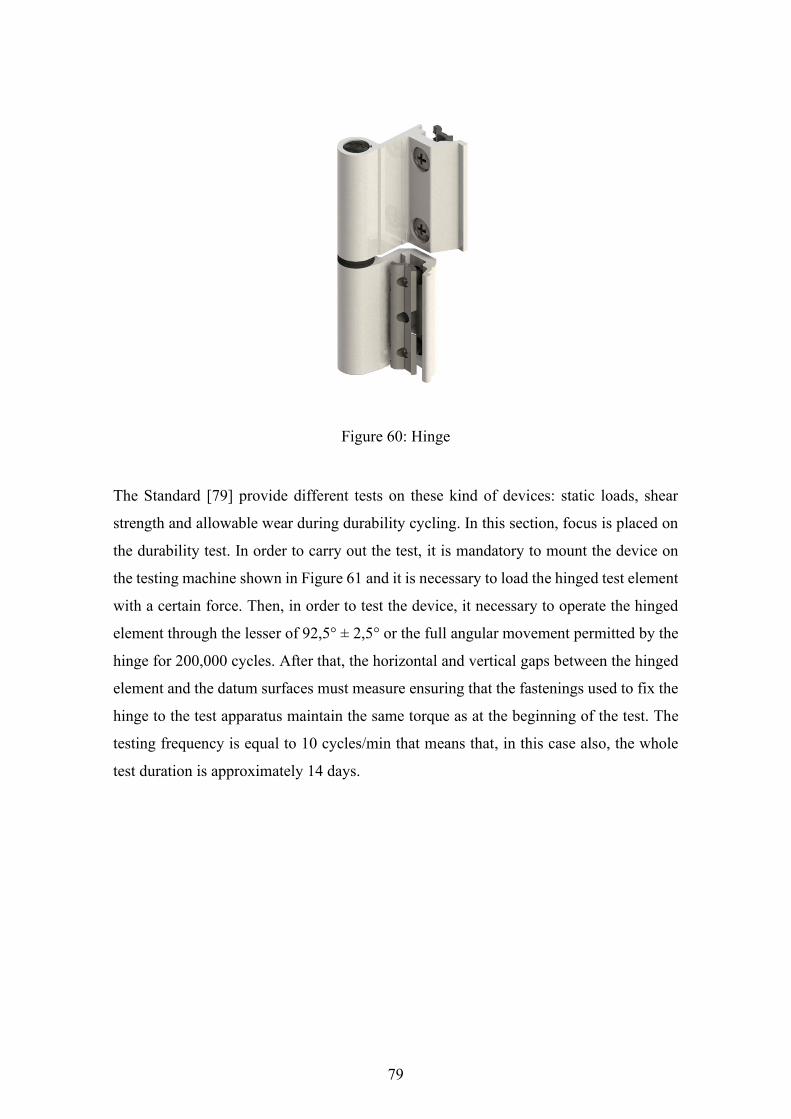
79
Figure 60: Hinge
The Standard [79] provide different tests on these kind of devices: static loads, shear
strength and allowable wear during durability cycling. In this section, focus is placed on
the durability test. In order to carry out the test, it is mandatory to mount the device on
the testing machine shown in Figure 61 and it is necessary to load the hinged test element
with a certain force. Then, in order to test the device, it necessary to operate the hinged
element through the lesser of 92,5° ± 2,5° or the full angular movement permitted by the
hinge for 200,000 cycles. After that, the horizontal and vertical gaps between the hinged
element and the datum surfaces must measure ensuring that the fastenings used to fix the
hinge to the test apparatus maintain the same torque as at the beginning of the test. The
testing frequency is equal to 10 cycles/min that means that, in this case also, the whole
test duration is approximately 14 days.

80
Figure 61: Test apparatus. (1) Hinge under test. (2) roller wheel in guide channel. (3)
Pneumatic or hydraulic cylinder. (4) Typical mechanism for applying a force at 90º. (5)
Lower hinge for support horizontal forces only. (6) Interchangeable door. (7) Rigidly
secured main frame.
During this test it is possible that the wear introduces a variation of the forces to which
the hinge is subjected and therefore the stresses in the device can increase. In order to
accelerate this test, it is possible to increase the door mass, but this can lead to a severe
wear and consequently a rapid degradation of the fatigue resistance of the hinge.

81
6. ACCELERATED LIFE TESTING MACHINE DESIGN
As explained in the first chapter, the test can be accelerated in two different ways. In the
previous chapters, focus was placed on the accelerated life testing by an incremented load.
Here, a new testing bench machine, which makes it possible to accelerate the test by
increasing the testing speed, is going to be presented.
The Standard [13], indeed, provides the test door specifications to carry out the test as
follows.
The test door leaf shall be 2,100 mm high and 1,100 mm wide. It shall have means of
attaching weights to the door to enable the door mass to be in the center of the door. The
test door and its frame shall have enough rigidity such that any distortion perpendicular
to the plane of the test door, taking place during the test sequence shall be no more than
5 mm at any position. The door mass to carry out the test should be above 200 kg door
mass as specified by the manufacturer. This means that, due to the inertial forces, the test
speed cannot be more that 10 cycles/min.
In order to speed up the test, is therefore necessary to reduce the moving masses. In the
next section a new test bench will be presented.
6.1 General design
The principle of the new design is to reduce the moving masses. So, it is necessary to
remove the door. For this purpose, a pneumatic actuator can be utilized in order to apply
the force on the latch. Moreover, since the device should be fixed in the testing machine
that must be rigid enough, the idea is to move the strike plate. The conceptual design of
such movement is shown in Figure 62. As it can be noticed, the pneumatic actuator is
integrated with the strike plate that can consequently be rigid enough. In this way, it is
possible to apply the load on the latch, simply introducing a pressure in the actuator
chamber. In order to simulate the door opening, it is necessary to introduce a mechanical
mechanism, such as a cam that, working on the lock device handle pin, makes it possible
to simulate the actual door movement. This coupling can be regarded as an efficient
system characterized by minimum wear over the elapsed testing time, so that almost no
maintenance is required.
A magnification of the conceptual mechanism, sketched in a section view to show the
lock device, is shown in Figure 63.

82
Figure 62: Test bench conceptual design
Figure 63: Test bench conceptual design magnification

83
6.2 Cam design
The cam is the organ that makes it possible to transform the rotary motion of the
crankshaft into the alternating motion of the handle pin. The transformation takes place
through the coupling, on the surface of the cam, of a wheel keyed on the rocker, which
is, in turn, connected to the square pin.
Figure 64: Cam profile design
Referring to Figure 64, in order to correctly size the riser, it is necessary to work out the
angle β as a function of the rotation of the cam (or of the time). To derive the β function,
a fifth degree interpolating polynomial fitting was used (Equation 6.1).
2 3 4 5
0 1 2 3 4 5( ) ·( ) ·( ) ·( ) ·( ) ·( )i i i i iy t a a t t a t t a t t a t t a t t= + − + − + − + − + − (6.1)
Where the constant a0, a1, a2, a3, a4 and a5 can be write as follow (Equation 6.2).

84
0
1
2
2
3 3
2
4 4
2
5 5
1
2
20 ( ) (8 12 ) (3 )
2
30 ( ) (14 16 ) (3 2 )
2
12 ( ) 6 ( ) ( )
2
i
i
i
f i f i f i
f i f i f i
f i f i f i
a y
a v
a a
y y v v T a a Ta
T
y y v v T a a Ta
T
y y v v T a a Ta
T
=
=
=
− − + − −=
− + + + − =
− − + − −=
(6.2)
Where y(t) is the angular position of β, v is its speed, a is the acceleration, t is the time.
The subscript i represents the initial state, whereas the subscript f indicates the final one.
The rotational speed of the crankshaft was imposed at n=60 rpm. The others boundary
condition of the case of study and the definition of the period T is defined as in the next
formulae (Equation 6.3).
i
f
i
f
2
i
2
f
i
y = 0 º; initial position
y = 13 º; final position
= 0 º/s; initial speed
= 0 º/s; final speed
= 0 º/s ; initial acceleration
= 0 º/s ; final acceleration
= 0.05s; initial time correspondin
v
v
a
a
t
f
f
g to the start of the lift
= 0.43s; final time corresponding at the maximum angle
T = i
t
t t
−
(6.3)
The resulting law is reported in Equation 6.4.
( ) ( ) ( )4 53
41.4 0.05 163.2 0.05 171. 5( 8 0.0)y t tt t − + − − = + ++ − (6.5)
Introducing the relation between the time and the angle (Equation 6.6)
2t
n
= =
(6.6)

85
The movement of the handle pin can be plotted as a function of the crankshaft rotation
angle (Figure 65).
Figure 65: Handle pin movement as a function of the crankshaft rotation angle (outward
phase)
Using the same criteria, it is therefore possible to evaluate the movement in the return
phase, considering the related boundary conditions in Equation 6.7.
i
f
i
f
2
i
2
f
i
y = 13 º; initial position
y = 0 º; final position
= 0 º/s; initial speed
= 0 º/s; final speed
= 0 º/s ; initial acceleration
= 0 º/s ; final acceleration
= 0.48 s; initial time correspondi
v
v
a
a
t
f
f
ng to the start of the lift
= 0.73 s; final time corresponding at the maximum angle
T = i
t
t t
−
(6.7)
For the sake of synthesis only the law (Equation 6.8) and the movement graph (Figure
66) are reported here.
3 4 5
13 145.2 0.5 871.3 0.5 1394.1 0.52 2 2
( )y t
=
− − + + − + −
+
− (6.8)

86
Figure 66: Handle pin movement as a function of the crankshaft rotation angle (return
phase)
Based on the desired geometrical position of the handle pin, it is finally possible to work
out the primitive profile of the cam, coming then to its final drawing.
β0 = 30 °; initial angle of the barbell
b = 36.74 mm; length of the barbell, measured center-center
d = 55.75 mm; distance between the rotation axes of the cam and the rocker
Referring to Figure 64, it is possible to describe the pitch curve in polar coordinates as
follows (Equation 6.9).
2 2
1 ( sin ) ( cos )a aO C b d b = + − (6.9)
And the final cam profile as in Equation 6.10.
( ) ( ) ( ) ( )22
1 ( ) a r a rO b Sin R Sin d b Cos R CosP = − + − − (6.10)
The pitch curve and the cam profile yielded by the previous analyses are depicted in
Figure 67 the pitch curve and the cam profile obtained from the previous analyses. For

87
the sake of completeness in Figure 68, the balance movement during an entire cycle is
shown.
Figure 67: Cam design. Profile curve (dashed line) and cam profile (continuous line)
Figure 68: Balance movement as a function of the time (one cycle)

88
6.3 Actuator movement
In order to carry out the test, the pneumatic actuator should apply the force at the correct
time. Thus, the movement of the actuator was studied, so that it was synchronized with
that of the crankshaft. The different phases are reported in Figure 69. The displacement
law must be consistent with the motion of the latch defined by the cam: first, the actuator
must put the strike plate and the latch in contact together (phase 1). Subsequently, when,
through the cam, the handle pin is lifted, and therefore the latch is retracted, the actuator
must bring the strike plate to a position, so that the lock disengaged (phase 2 and 3); then,
the actuator stops briefly to allow for the latch to return to its initial position (phase 4).
Finally, the actuator returns to its initial position, thus simulating the door closing (phase
5 and 6).
1
2
3
4

89
5
6
Figure 69: Testing phases
The reciprocal motion was studied by PTC Creo Parametric 5.0 as reported in Figure 70.
The strike plate in the initial phase, undergo in contact with the latch. This position persist
until the latch is retracted and the actuator is free to reach its final position; finally, it can
come back to the start position.
Figure 70: Actuator position as a function of the time cycle

90
The reciprocal movement between the cam and the actuator is shown in Figure 71. As it
can be noticed, there is a first phase, where the actuator puts the strike plate and the latch
in reciprocal contact. At this stage, the force is consequently applied by the actuator.
Then, the cam makes it possible to retract the latch from the strike plate and, when the
latch is completely disengaged, the actuator can reach the final position. At this stage, the
cam, working on the handle pin, can return to its initial position, releasing at the same
time the latch to its resting position. Finally, the actuator can return to the start position.
Figure 71: Graph of the reciprocal movement between the cam and the actuator
6.4 Summary of the test bench design
As explained in the first chapter, there are two ways to accelerate the test: increasing the
load applied on the device or increasing the speed test. In this chapter a brief presentation
of a new testing bench has been presented with the purpose of providing a general idea to
be developed.
The standard testing speed, as remarked by the Standard [13], should not exceed 10
cycles/min due to the huge moving masses. Therefore, the idea was to remove the door
in the test, and to directly apply the force on the strike plate. This procedure allows,
indeed, to reduce the moving masses and to increase the testing speed, as well as the
applied force.
0.0 0.2 0.4 0.6 0.8 1.0
0
5
10
15
t s
yt
ptmm
Cam
Actuator

91
In this case too, the latch is initially engaged with the strike plate. The latch movement
was controlled by a cam, which was accurately studied, in order to accurately simulate
door opening as recommend by the standard.
The actuator movement, as well as the strike plate movement, was then synchronized
with the cam, in order to apply the force on the latch, before the latch is retracted. After
the latch is disengaged, the strike plate may leave the lock device and, before coming
back, the latch must return to its resting position. In this way, when the strike plate comes
back, is it possible to accurately simulate the door closing.

92

93
7. CONCLUSIONS
Sometimes, the durability tests to be performed on mechanical devices according to the
standards can be very time-consuming. During the product development phase (design),
indeed, companies need to carry out reliability tests, in order to evaluate the actual service
life of the components during the standard use. Moreover, such development process is
generally based on trial and error methods that can be very expensive in terms of time
and costs. In this case, accelerated life testing can be an interesting option for cutting
down both development time and cost.
In the literature, some studies deal with accelerated life testing, but they generally focus
on the statistical methods to be applied on it. Almost all of these studies are related to
electronic components that, due to their constant failure rate, are simpler to be studied.
Just a few studies are related to simple mechanical components (e.g. bearings).
In this study, a general accelerated testing method was developed to be applied to
complex mechanical devices, where the combination of fatigue and wear can lead to a
nonlinear behavior during the test. Regarding the combination of fatigue and wear
mechanisms, some studies were carried out, but they deal with single component standard
specimens. In complex components, wear can, for instance, introduce a transition in terms
of friction coefficient that can, in turn, increase the stresses on the other components,
causing a nonlinear behavior.
In order to accelerate the test on a mechanical device, besides increasing the testing
frequency, it is necessary to increase the loads. FEA can be used in order to evaluate the
stress field on each component of the device. The experimental tests, then, can provide
the mechanical characterization of the materials involved in assembly. Finally, the
combination of FEAs and experimental test results can be used to develop an analytical
model able to predict the expected life of a component tested in extreme condition.
A locking device has been taken as a demonstrator of the accelerated life testing
methodology.
Several FEAs were carried out in order to detect the stress field (in terms of contact
pressures and bending stresses) of each component during the accelerated life test at
different load condition levels.
Moreover, experimental tests were carried out where no relevant data could be retrieved
in the literature.

94
Particularly, the effect of different coatings on the fatigue behavior of 11 SMnPb 30 free
cutting steel was analyzed. Fatigue tests were made on a four-point rotating bending
machine. For each sample type 30 specimens were tested in order to obtain the fatigue
curve and the fatigue limit of the material. The data were processed by statistical tools
ANOVA and F-Test and it was assessed that there is no significant effect of the coating
on the fatigue performance. The fatigue limit is 53% of UTS in agreement with the
commonly accepted ratios for metallic materials.
Then the effects of coating thickness and contact pressure on the wear rate of a nickel
coated zinc alloy was investigated using a sliding on cylinder testing machine. Three
different levels for the applied load and three different levels for the coating thickness
were analyzed. The sliding distance was set at 500 m, corresponding in the case of study
at the overall sliding distance after 200,000 cycles. The experimental results were
processed by means of a two-way ANOVA and fisher test. It was assessed that the coating
thickness implies no significant differences in terms of wear rate. The contact pressure
instead, proved to be highly effective on the wear rate. Focusing on the wear test output,
it was assessed that there is a first transition in terms of friction coefficient after 150 m
and a second one after 350 m. This outcome suggests that at the first stage the coating is
worn out but, in the wear track there is some residue of nickel still that worn out
completely at the second stage. Focusing on this result, further experimental tests were
carried out at a reduced sliding distance of 150 m. In this case also, the data processed
with the aforementioned statistical tools allowed to asses that the wear rate is strongly
affected just from the applied load.
Using the experimental and the numerical results an analytical model was developed. Due
to the contact pressure, the latch wear introduces a transition of the friction coefficient
that increases the stresses on the other components. The FEA allow to evaluate the stress
field of each component at different levels of friction coefficient and applied load. The
combination of the fatigue data and the Miner’s rule made it possible to predict the actual
number of cycles up to failure of each component. It was assessed that there is a good
correlation between the number of cycles up to failure given by the analytical model and
the experimental ones.

95
REFERENCES
1. Nelson, W. Accelerated testing : statistical models, test plans and data analyses;
John Wiley & Sons: New York, 1990; ISBN 0-471-52277-5.
2. R. E. Thomas, G. B. Gaines, M.M.E. CONSIDERATIONS FOR VALID
ACCELERATED LIFE TESTING. Conf. Electr. Insul. Dielectr. Phenom.
(CEIDP), Annu. Rep. 1983, 153–160.
3. Tebbi, O.; Guerin, F.; Dumon, B. Comparative study of accelerated testing models,
applications in mechanics. Proc. IEEE Int. Conf. Syst. Man Cybern. 2001, 4, 2099–
2104.
4. Silverman, M. HALT vs. ALT: When to use which technique? Proc. - Annu.
Reliab. Maintainab. Symp. 2006, 00, 310–312.
5. Borgia, O.; De Carlo, F.; Fanciullacci, N.; Tucci, M. Accelerated life tests for new
product qualification: A case study in the household appliance. In Proceedings of
the IFAC Proceedings Volumes (IFAC-PapersOnline); 2013; Vol. 46, pp. 269–
274.
6. Nelson, W. Accelerated Life Testing - Step-Stress Models and Data Analyses.
IEEE Trans. Reliab. 1980, R-29, 103–108.
7. Schatzoff, M.; Lane, T.P. A general step stress model for accelerated life testing.
Jt. Stat. Meet. 1987.
8. Goba, F.A. Bibliography on Thermal Aging of Electrical Insulation. IEEE Trans.
Electr. Insul. 1969, EI-4, 31–58.
9. Miller, R.; Nelson, W. Optimum Simple Step-Stress Plans for Accelerated Life
Testing. IEEE Trans. Reliab. 1983, R-32, 59–65.
10. Zhao, W.; Elsayed, E.A. A general accelerated life model for step-stress testing.
IIE Trans. (Institute Ind. Eng. 2005, 37, 1059–1069.
11. Srivastava, P.W.; Shukla, R. A log-logistic step-stress model. IEEE Trans. Reliab.
2008, 57, 431–434.
12. Zhang, C.; Chuckpaiwong, I.; Liang, S.Y.; Seth, B.B. Mechanical component
lifetime estimation based on accelerated life testing with singularity extrapolation.
Mech. Syst. Signal Process. 2002, 16, 705–718.
13. EN 12209 Building hardware – Mechanically operated locks and locking plates –
Requirements and test methods; European Committee for Standardization:
Brussels, 2016;

96
14. EN 12844 Zinc and zinc alloys — Casting — Specification; European Committee
for Standardization: Brussels, 1998;
15. ISO 1458 Metallic coatings — Electrodeposited coatings of nickel; 2002;
16. EN 10149-1 Hot rolled flat products made of high yield strength steels for cold
forming - Part 1: General technical delivery conditions; 2013;
17. EN 10087 Free-cutting steel - Technical delivery conditions for semi-finished
products, hot-rolled bars and rods; 1998;
18. ASTM A959 Specifying Harmonized Standard Grade Compositions for Wrought
Stainless Steels 1; ASTM International, 2016;
19. EN ISO 10364 : 2018 BSI Standards Publication Structural adhesives –
Determination of the pot life ( working life ) of multi-. 2018.
20. EN 10149-2 Hot rolled flat products made of high yield strength steels for cold
forming. Technical delivery conditions for thermomechanically rolled steels. 2016.
21. Klemenc, J.; Fajdiga, M. Estimating S-N curves and their scatter using a
differential ant-stigmergy algorithm. Int. J. Fatigue 2012, 43, 90–97.
22. Klemenc, J. Influence of fatigue-life data modelling on the estimated reliability of
a structure subjected to a constant-amplitude loading. Reliab. Eng. Syst. Saf. 2015,
142, 238–247.
23. Croccolo, D.; De Agostinis, M.; Fini, S.; Olmi, G.; Robusto, F. Coating effect on
the fatigue strength of a free cutting steel. Proc. Inst. Mech. Eng. Part C J. Mech.
Eng. Sci. 2019, 0, 1–12.
24. Carvalho, A.L.M.; Voorwald, H.J.C. Influence of shot peening and hard chromium
electroplating on the fatigue strength of 7050-T7451 aluminum alloy. Int. J.
Fatigue 2007, 29, 1282–1291.
25. Díaz, J.A.; Passarelli, M.; Berríos, J.A.; Puchi-Cabrera, E.S. Fatigue behavior of a
4340 steel coated with an electroless Ni-P deposit. Surf. Coatings Technol. 2002,
149, 45–56.
26. Mrva, P.; Kottfer, D.; Kaczmarek Effect of shot peening and NiAl coating on
fatigue limit of Mg-Al-Zn-Mn alloy. Arch. Metall. Mater. 2011, 56, 743–748.
27. Kralya, V.O.; Molyar, O.H.; Khimko, A.M.; Puhachevs’kyi, D.O. Fatigue
characteristics of VT22 titanium alloy with wear-resistant coatings. Mater. Sci.
2006, 42, 853–857.
28. Zhang, Y.Z.; Wu, Y.Y.; Yao, M. Effects of electroless deposition and shot peening
on fatigue strength of 3OCrMo4 steel. Mater. Sci. Technol. 1996, 12, 776–779.

97
29. Ramanujachar, K.; Subramanian, S. V Micromechanisms of tool wear in
machining free cutting steels. Wear 1996, 197, 45–55.
30. Lou, D.; Cui, K.; Jia, Y. Study on the machinability of resulfurized composite free-
cutting steels. J. Mater. Eng. Perform. 1997, 6, 215–218.
31. Ray, K.K.; Das, J.; Dixit, A.; Chakraborty, M.; Chakravorty, S.; Guha, S.N. Effect
of cold deformation on the machinability of a free cutting steel. Mater. Manuf.
Process. 2006, 21, 333–340.
32. Chen, S.-C.; Zhu, R.; Xue, L.-Q.; Lin, T.-C.; Li, J.-S.; Lin, Y. Effects of elemental
Sn on the properties and inclusions of the free-cutting steel. Int. J. Miner. Metall.
Mater. 2015, 22, 141–148.
33. Suzuki, T.; Li, Y.; Koizumi, Y.; Chiba, A. Quantitative evaluation in hot
workability of SUS303 free-cutting steel. Mater. Sci. Eng. A 2013, 563, 117–124.
34. Naghdy, S.; Akbarzadeh, A. Characterization of dynamic recrystallization
parameters for a low carbon resulfurized free - cutting steel. Mater. Des. 2014, 53,
910–914.
35. Joyot, P.; Rakotomalala, R.; Pantalé, O.; Touratier, M.; Hakem, N. A numerical
simulation of steady state metal cutting. Proc. Inst. Mech. Eng. Part C J. Mech.
Eng. Sci. 1998, 212, 331–341.
36. Aggarwal, M.L.; Khan, R.A.; Agrawal, V.P. Optimization of micro welds in leaf
springs used in automotive vehicles. Indian J. Eng. Mater. Sci. 2006, 13, 217–220.
37. Manuale di trattamenti e finiture; Tecniche Nuove, Ed.; Milano, 2003;
38. Straffellini, G. Friction and Wear - Methodologies for Design and Control;
Springer International Publishing, Ed.; Switzerland, 2015;
39. BSI BS ISO 1143 : 2010 BSI Standards Publication Metallic materials — Rotating
bar bending fatigue testing. 2010.
40. International Standard Organization ISO 2081, Metallic and other inorganic
coatings - Electroplated coatings of zinc with supplementary tratments on iron or
steel. In; 2008 ISBN 5935522004.
41. ISO 1456 Metallic and other inorganica coatings - Electrodeposited coatings of
nickel, nickel plus chromium, copper plus nickel and copper plus nickel plus
chromium;
42. Fini, S.; De Agostinis, M.; Robusto, F.; Olmi, G.; Bogojević, N.; Ćirić Kostić, S.;
Croccolo, D.; Vranić, A. Fatigue Response of As-Built DMLS Maraging Steel and
Effects of Aging, Machining, and Peening Treatments. Metals (Basel). 2018, 8,

98
505.
43. Croccolo, D.; De Agostinis, M.; Fini, S.; Olmi, G.; Vranic, A.; Ciric-Kostic, S.
Influence of the build orientation on the fatigue strength of EOS maraging steel
produced by additive metal machine. Fatigue Fract. Eng. Mater. Struct. 2016, 39,
637–647.
44. Croccolo, D.; De Agostinis, M.; Fini, S.; Morri, A.; Olmi, G. Analysis of the
influence of fretting on the fatigue life of interference fitted joints. In Proceedings
of the ASME International Mechanical Engineering Congress and Exposition,
Proceedings (IMECE); 2014; Vol. 2B.
45. Meneghetti, G.; Dengo, C.; Lo Conte, F. Bending fatigue design of case-hardened
gears based on test specimens. Proc. Inst. Mech. Eng. Part C J. Mech. Eng. Sci.
2018, 232, 1953–1969.
46. Atig, A.; Ben Sghaier, R.; Seddik, R.; Fathallah, R. A simple analytical bending
stress model of parabolic leaf spring. Proc. Inst. Mech. Eng. Part C J. Mech. Eng.
Sci. 2018, 232, 1838–1850.
47. ISO 12107 Metallic materials - Fatigue testing - Statistical planning and analysis
of data; 2012;
48. Olmi, G. Low cycle fatigue experiments on turbogenerator steels and a new
method for defining confidence bands. J. Test. Eval. 2012, 40.
49. Croccolo, D.; De Agostinis, M.; Fini, S.; Olmi, G.; Bogojevic, N.; Ciric-Kostic, S.
Effects of build orientation and thickness of allowance on the fatigue behaviour of
15–5 PH stainless steel manufactured by DMLS. Fatigue Fract. Eng. Mater.
Struct. 2018, 41, 900–916.
50. De Agostinis, M.; Fini, S.; Olmi, G. The influence of lubrication on the frictional
characteristics of threaded joints for planetary gearboxes. Proc. Inst. Mech. Eng.
Part C J. Mech. Eng. Sci. 2016, 230, 2553–2563.
51. Berger, P.D.; Maurer, R.E.; Celli, G.B. Experimental design: With applications in
management, engineering, and the sciences: Second edition; 2017;
52. Croccolo, D.; De Agostinis, M.; Fini, S.; Olmi, G.; Robusto, F.; Tonelli, L. WEAR
BEHAVIOR OF ELECTRODEPOSITED NICKEL COATING ON ZP5 ZINC
ALLOY (Under revision). Proc. Inst. Mech. Eng. Part C J. Mech. Eng. Sci.
53. Kececioglu, D. Reliability and Life Testing Handbook; Prentice-Hall: Englewood
Cliffs, 1993;
54. Lu, C.J.; Meeker, W.O. Using degradation measures to estimate a time-to-failure

99
distribution. Technometrics 1993, 35, 161–174.
55. Boulanger, M.; Escobar, L.A. Experimental design for a class of accelerated
degradation tests. Technometrics 1994, 36, 260–272.
56. Tseng, S.-T.; Yu, H.-F. A termination rule for degradation experiments. IEEE
Trans. Reliab. 1997, 46, 130–133.
57. Strelec, H. A model for accelerated life testing. Struct. Saf. 1993, 12, 129–136.
58. Carev, M.B.; Koenig, R.H. Reliability Assessment Based on Accelerated
Degradation: A Case Study. IEEE Trans. Reliab. 1991, 40, 499–506.
59. Jiang, J.; Xiao, G.; Wang, Y.; Liu, Y. Tribological behavior of nano-sized
SiCp/7075 composite parts formed by semisolid processing. Metals (Basel). 2018,
8.
60. Croccolo, D.; De Agostinis, M.; Fini, S.; Olmi, G.; Robusto, F.; Cavalli, O.;
Vincenzi, N. The influence of material, hardness, roughness and surface treatment
on the frictional characteristics of the underhead contact in socket-head screws. In
Proceedings of the American Society of Mechanical Engineers, Pressure Vessels
and Piping Division (Publication) PVP; 2018; Vol. 2.
61. Santecchia, E.; Cabibbo, M.; Hamouda, A.M.S.; Musharavati, F.; Popelka, A.;
Spigarelli, S. Investigation of the Temperature-Related Wear Performance of Hard
Nanostructured Coatings Deposited on a S600 High Speed Steel. Metals (Basel).
2019, 9, 332.
62. Tocci, M.; Pola, A.; Girelli, L.; Lollio, F.; Montesano, L.; Gelfi, M.; Tocci, M.;
Pola, A.; Girelli, L.; Lollio, F.; et al. Wear and Cavitation Erosion Resistance of
an AlMgSc Alloy Produced by DMLS. Metals (Basel). 2019, 9, 308.
63. Gines, M.J.L.; Tuckart, W.; Abraham, S. Dry sliding wear behavior of hard
chromium and nickel-based coatings in ball on ring test. In Proceedings of the
Proceedings - International Brazilian Conference on Tribology; 2010; pp. 287–
298.
64. Ye, Z.; Cheng, H.S.; Chang, N.S. Wear characteristics of nickel/silicon carbide
composite coating in lubricated reciprocating contacts. Tribol. Trans. 1996, 39,
527–536.
65. Zheng, C.; Liu, Y.; Qin, J.; Ji, R.; Zhang, S. Experimental study on the wear
behavior of HVOF sprayed nickel-based coating. J. Mech. Sci. Technol. 2018, 32,
283–290.
66. Khan, M.A.; Sundarrajan, S.; Duraiselvam, M.; Natarajan, S.; Kumar, A.S. Sliding

100
wear behaviour of plasma sprayed coatings on nickel based superalloy. Surf. Eng.
2017, 33, 35–41.
67. Kesavan, D.; Kamaraj, M. The microstructure and high temperature wear
performance of a nickel base hardfaced coating. Surf. Coatings Technol. 2010,
204, 4034–4043.
68. Panagopoulos, C.N.; Papachristos, V.D. The corrosive wear of nickel coating on
mild steel. J. Mater. Sci. 1996, 31, 2931–2936.
69. Zishan, C.; Hejun, L.; Qiangang, F. SiC wear resistance coating with added Ni, for
carbon/carbon composites. Surf. Coatings Technol. 2012, 213, 207–215.
70. Pursche, G.; Schmidt, G. Improved wear protection by modified electrodeposited
iron layers. SCHMIERUNGSTECHNIK 1985, 16, 83–86.
71. Schmidt, G.; Steinhäuser, S. Characterization of wear protective coatings. Tribol.
Int. 1996, 29, 207–214.
72. Chen, T.; Wu, F.; Wang, H.; Liu, D. Laser cladding in-situ Ti(C,N) particles
reinforced ni-based composite coatings modified with CeO2 nanoparticles. Metals
(Basel). 2018, 8.
73. Tonelli, L.; Martini, C.; Ceschini, L. Improvement of wear resistance of
components for hydraulic actuators: Dry sliding tests for coating selection and
bench tests for final assessment. Tribol. Int. 2017, 115, 154–164.
74. ASTM G77 Standard Test Method for Ranking Resistance of Materials to Sliding
Wear Using; ASTM International;
75. Yang-tao, X.; Yu-jie, D.; Wei, Z.; Tian-dong, X. Microstructure and texture
evolution of electrodeposited coatings of nickel in the industrial electrolyte. Surf.
Coatings Technol. 2017, 330, 170–177.
76. K. L., J. Contact mechanics.pdf; Cambridge University Press: Cambridge, 1985;
77. ASTM A276/A276M Standard Specification for Stainless Steel Bars and Shapes.
ASTM Int. 2017, 1–8.
78. Luo, J.K.; Flewitt, A.J.; Spearing, S.M.; Fleck, N.A.; Milne, W.I. Young’s
modulus of electroplated Ni thin film for MEMS applications. Mater. Lett. 2004,
58, 2306–2309.
79. EN 1935 Building hardware — Single-axis hinges — Requirements and test
methods. 2002.