Kenya Stabilization and Adjustment: Toward Accelerated Growth
185
Repoit No.9047-KE Kenya Stabilization and Adjustment: Toward Accelerated Growth October 17, 1990 Countrv Operations Division Eastern AfricaDepartment AfricaRegion FOR OFFICIAL USE ONLY Document of the World Bank Thisdocument has a restricted distribution andmaybe used by recipients only in the performance of their officialduties. Its contents may not otherwise bedisclosed withoutWorld Bank authorization. Public Disclosure Authorized Public Disclosure Authorized Public Disclosure Authorized Public Disclosure Authorized
-
Upload
khangminh22 -
Category
Documents
-
view
1 -
download
0
Transcript of Kenya Stabilization and Adjustment: Toward Accelerated Growth

Repoit No. 9047-KE
KenyaStabilization and Adjustment: TowardAccelerated GrowthOctober 17, 1990
Countrv Operations DivisionEastern Africa DepartmentAfrica Region
FOR OFFICIAL USE ONLY
Document of the World Bank
This document has a restricted distribution and may be used by recipientsonly in the performance of their official duties. Its contents may not otherwisebe disclosed without World Bank authorization.
Pub
lic D
iscl
osur
e A
utho
rized
Pub
lic D
iscl
osur
e A
utho
rized
Pub
lic D
iscl
osur
e A
utho
rized
Pub
lic D
iscl
osur
e A
utho
rized
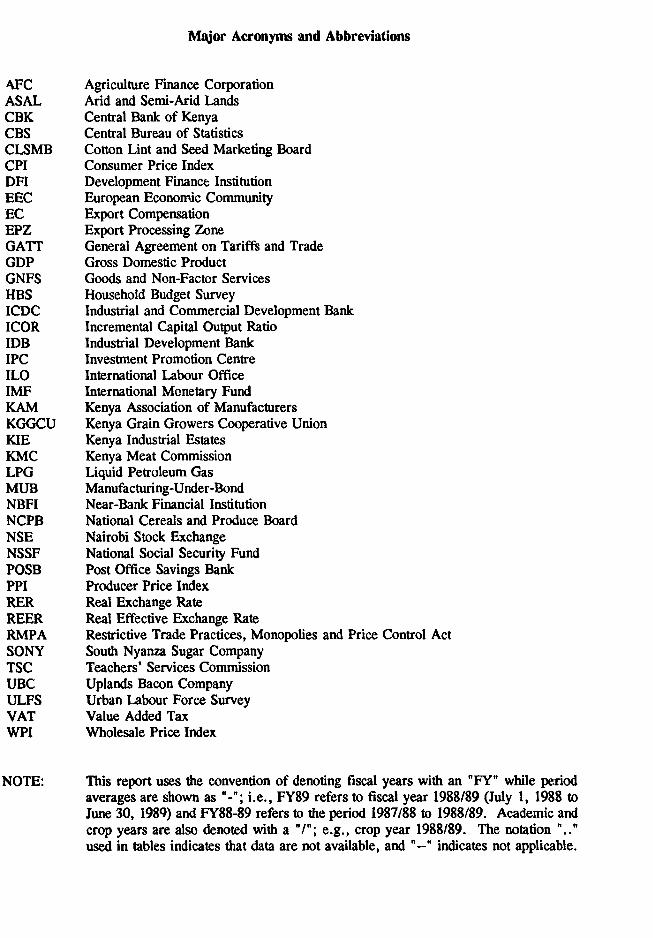
Major Acronyis and Abbreviations
AFC Agriculture Finance CorporationASAL Arid and Semi-Arid LandsCBK Central Bank of KenyaCBS Central Bureau of StatisticsCLSMB Cotton Lint and Seed Marketing BoardCPI Consumer Price IndexDFI Development Finance InstitutionEEC European Economic CommunityEC Export CompensationEPZ Export Processing ZoneGATT General Agreement on Tariffs and TradeGDP Gross Domestic ProductGNFS Goods and Non-Factor ServicesHBS Household Budget SurveyICDC Industrial and Commercial Development BankICOR Incremental Capital Output RatioIDB Industrial Development BankIPC Investment Promotion CentreILO International Labour OfficeIMF International Monetary FundKAM Kenya Association of ManufacturersKGGCU Kenya Grain Growers Cooperative UnionKIE Kenya Industrial EstatesKMC Kenya Meat CommissionLPG Liquid Petroleum GasMUB Manufacturing-Under-BondNBFI Near-Bank Financial InstitutionNCPB National Cereals and Produce BoardNSE Nairobi Stock ExchangeNSSF National Social Security FundPOSB Post Office Savings BankPPI Producer Price IndexRER Real Exchange RateREER Real Effective Exchange RateRMPA Restrictive Trade Practices, Monopolies and Price Control ActSONY South Nyanza Sugar CompanyTSC Teachers' Services ComrnissionUBC Uplands Bacon CompanyULFS Urban Labour Force SurveyVAT Value Added TaxWPI Wholesale Price Index
NOTE: This report uses the convention of denoting fiscal years with an "FY" while periodaverages are shown as "-"; i.e., FY89 refers to fiscal year 1988/89 (July 1, 1988 toJune 30, 1989) and FY88-89 refers to the period 1987/88 to 1988/89. Academic andcrop years are also denoted with a "/"; e.g., crop year 1988/89. The notation ".."used in tables indicates that data are not available, and "-" indicates not applicable.

FOR OFFICIAL USE ONLY
Preface
The last comprehensive economic memorandum for Kenya, Recent Economic Developmentsand Selected Policy Issues (7411-KE), was issued in September 1988. This report, prepared as abackground document for the Kenya Consultative Group Meeting to be held in Paris on November19-20, 1990, updates recent economic develooments, focusing on stabilization and structuraladjustment issues and prospects for accelerated growth.
The first part of this report reviews Kenya's economic performance over recent years. Theevolution of major macroeconomic aggregates is briefly analyzed in Chapter 1. Recent fiscaldevelopments are reported only briefly, since both the last economic report as well as the 1989report, Kenya: Public Expenditure Issues (7508-KE), extensively covered fiscal and expenditureissurs. This chapter includes a discussion of recent inflationary trends in Kenya and somemeasurement problems. Chapter 2 attempts to evaluate implementation of sectoral adjustmentprograms in agriculture, industry and trade, and finance. The Chapter also provides a brief analysisof the types of reforms that would need to be considered to deepen adjustment in these sectors.Chapter 3 adopts a slightly different approach from that of past economic reports. Since Kenya hasexperienced a marked economic recovery in recent years, the analysis and projections attempt toanswer the quesdon: what would it take for Kenya to achieve faster economic growth?
This report is based on the findings of a mission which visited Kenya from June 25 to July20, 1990. The mission consisted of: Ian Bannon (mission leader, Eastern Africa Department), NishaAgrawal (Eastern Africa Department), Colin Bruce (Eastern Africa Department), Gerard Byam(Eastern Africa Department), and Kathleen Jordan (Eastern Africa Department). Also contributingto this report were: Richard Anson (Regiona' Mission in Eastern Africa), Roboid Covington (EasternAfrica Department), Sudhir Shetty (Eastern Africa Department), and David Ndii (Regional Missionin Eastern Africa).
This document has a restricted distribution and may be used by recipients only in the performanceof their official duties. Its contents may not otherwise be disclosed without World Bank authorization.

TITLE: KENYA - STABILIZATION AND ADJUSTMENT: TOWARDACCELERATED GROWTH
COUNTRY: KENYA
REGION: EASTERN AFRICA
REPORT NO, TY CLASIFICATION MM/YY LANGUAGE9047-KE CEM Official Use 10/90 English
ABSTRACT: lIb report examines Kenya's recent growth and stabilization experience, progressin secol adjusment and th remaining medium-term agenda, and the need to adopt a bolder andm comprehensive reform effort in order to accelerate economic growth. Kenya has sustained a
marled ecoomic recovery over the past five years, averaging annual real growth of over S percent.The recovery, however, is somewhat fragile as it has relied excessively on foreign savings to financeimports and public expenditures. Over the past three years, the Government has made progress instabilzaon, reducing tde budget deficit and reliance on borrowing from the domestic baringsystem, but the level of government expenditures remains high and inflationary pressures haveresurfaced over the past two years. Implementation of the Government's sector adjustment programsin agricultre, industry and the financial sector, combined with a relatively improved macroeconomicfamework have cotibuted to the recovery in output and investment growth. Given Kenya's goodgrowth performance in recent years, the report examines the type of reform effort that would berequired to sstain and accelerate economic and social development. In addition to improvingmacrcnmi management, especially in fiscal policy, and deepening the reform process in keyproducdve sectrs, a fastr pace of development would require a major effort to reduce regulationsand controls on private sector activity, improve the quality and competence of the government itself,with particular emphasis on reform of parastatals and the civil service, as well as ensuring thateconomic growth is more equitable and environmentally sustainable.
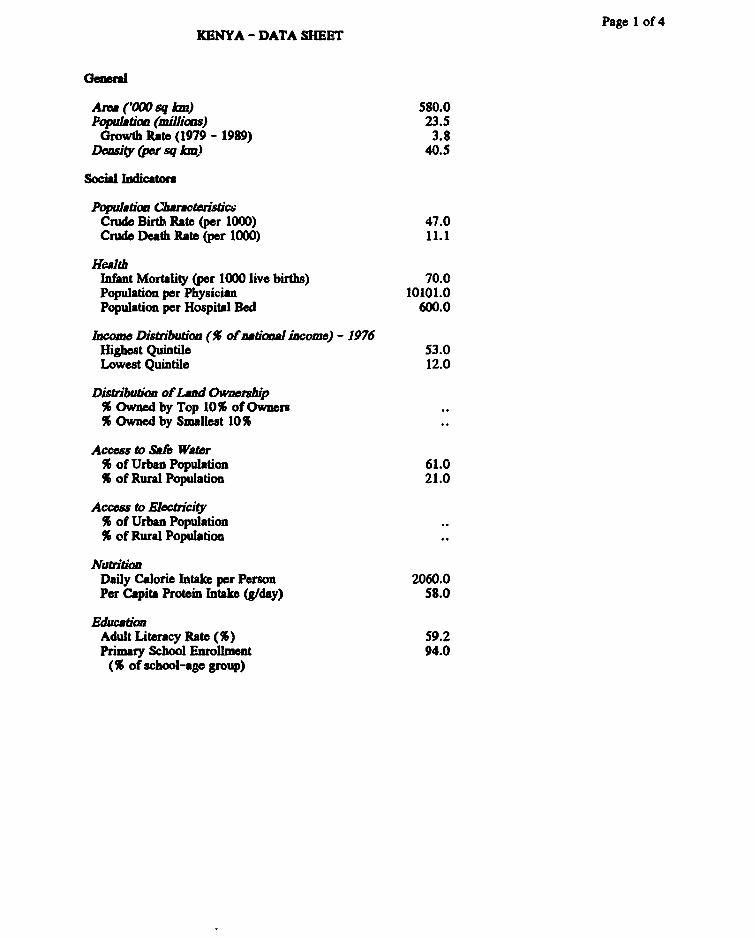
Page 1 of 4KENYA - DATA SHEET
Gema
Area ('000 sq Icn) 580.0Population (millions) 23.5
Growth Rate (1979 - 1989) 3.8Daity Ow sq ki) 40.5
Social dicatr
Poplation CaactedsticCrude Birth. Rate (per 1000) 47.0Crude Death Rate (per 1000) 11.1
HealdtInfant Mortality (per 1000 live births) 70.0Population per Physician 10101.0Population per Hospital Bed 600.0
lcome Distribution (X of awtioml income) - 1976Highest Quintile 53.0Lowest Quintile 12.0
Distrbution of Lnd Owrship% Owned by Top 10% of Owners% Owned by Smallest 10%
Access to Safe Water% of Urban Population 61.0% of Rural Population 21.0
Access to Electricity% of Urban Population% of Rural Population
NutriionDaily Calorie Intake per Person 2060.0Per Capita Protein Intale (glday) 58.0
EducationAdult Literacy Rate (%) 59.2Primary School Enrollment 94.0
(% of school-age group)

Gross National Product - 1989
TJ$ MII. 0fONP 9lS R4 1C 99
GNP at Market Prices 7894.6 100.0 5.5 4.1 5.5 4.7Gross Domestic Investment 2102.5 26.6 -0.1 3.4 9.3 6.6Gross National Savings 1373.4 17.4 -2.0 1.1 7.9 7.7Current Account Balance -584.2 -7.4 - - - -
Exports of Goods & NFS 1964.1 24.9 -0.0 3.8 4.6 10.1Imports of Goods & NFS 2593.3 32.8 -6.7 4.3 9.0 5.1GNP per capita 1/ 380.0
Output, Employment and Productivity - 1989
Agriculture 2198.0 31.0Industry 1415.2 19.9 ..
Manufacturing 827.8 11.7 ..
Services 3480.7 49.1 ..
Total 7093.9 100.0 10.9 100.0 652.1 100.0
Government Finance 2/(In fiscal years)
Current Receipts 1869.1 23.4 21.6Current Expenditure 1855.5 23.2 22.2
Current Surplus/Deficit 13.6 0.2 -0.6Capital Expenditures 574.3 7.2 6.9
I/ Calculated in accordance with Atlas methodology.2/ IMF estimates.

Money, Credit and Prices
Money Supply 1313.4 1346.5 1784.3 1983.3 2140.9 2417.6Bank Credit to Public Sector 541.7 598.3 883.8 1144.7 1055.4 995.2Bank Credit to Private Sector 847.2 970.7 1134.2 1284.4 1535.8 1775.6
Money as % of GDP 29.4 26.7 30.4 30.4 28.7 28.4Nairobi Consumer PI (1980 = 100) 171.7 190.1 200.7 215.0 238.0 263.1Annual percentage changes in:
Nairobi Consumer Price Index 9.1 10.7 5.6 7.1 10.7 10.6Bank Credit to Public Sector 11.8 10.4 47.7 29.5 -7.8 -5.7Bank Credit to Private Sector 10.2 14.6 16.8 13.2 19.6 15.6
Balance of Payments
Exports of Goods & NFS 3/ 1551.6 1871.4 1698.2 1869.2 1933.3Imports of Goods & NFS 4/ 1616.8 1858.7 2104.1 2306.3 2528.1
(of which Petroleum) 5/ 461.4 300.4 348.4 289.8 343.9Resource Gap (deficit = -) -65.2 12.7 -405.8 -437.1 -594.8
Factor Service Payments (net) -223.0 -258.6 -301.7 -360.0 -351.3Net Private Transfers 81.5 58.2 71.9 88.7 101.1
Balance on Current Account -206.7 -187.7 -635.6 -708.4 -845.0excl. Net Official Transfers
Net Official Transfers 110.1 148.9 142.3 256.0 279.8Balance on Current Account -96.6 -38.8 -493.3 -452.4 -565.2
incl. Net Official Transfers
Capital Account -17.9 128.9 366.7 376.4 643.3Long-term (net) -51.3 105.2 316.5 312.7 607.0Short-term (net) 45.8 20.9 56.2 53.4 52.4Errors and Omissions -12.4 2.8 -6.0 10.3 -16.1
Overall Balance -114.5 90.1 -126.6 -76.0 78.1
Monetary Movements 114.6 -90.0 126.6 76.1 -78.0Change in Reserves -22.8 -24.6 151. i -59.5 -110.5IMF Transactions 128.0 -67.1 -62.3 123.0 20.2Other 9.4 1.7 37.8 12.6 12.3
3/ Goods,f.o.b excluding aircraft and ships' stores but including re-exports.4/ Goods,f.o.b including defence imports and exc,uding cinematographic films, newspapers,
periodicals and aircrft lease.5/ Crude and derivatives.
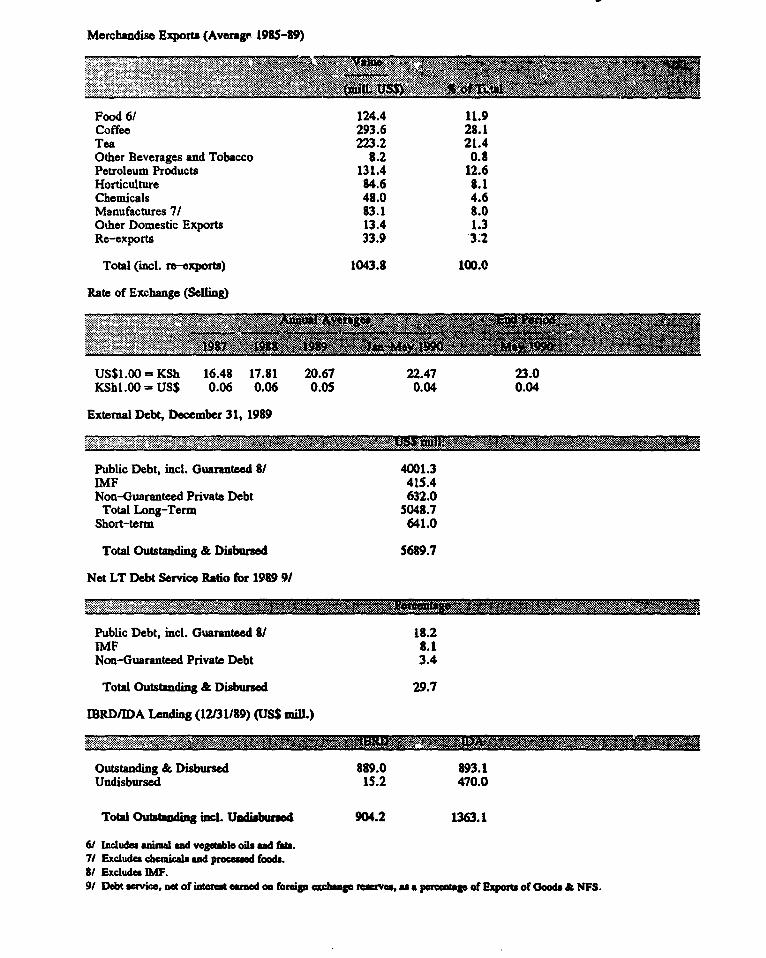
Merchandise Exports (Average 1985-89)
Food 6/ 124.4 11.9Coffee 293.6 28.1Tea 223.2 21.4Other Beverages and Tobacco 8.2 0.8Petroleum Products 131.4 12.6Horticulture 84.6 8.1Chemicals 48.0 4.6Manufactures 7/ 83.1 8.0Other Domestic Exports 13.4 1.3Re-exports 33.9 3.2
Total (incl. re-exports) 1043.8 100.0
Rate of Exchange (Selling)
US$1.00 = KSh 16.48 17.81 20.67 22.47 23.0KSh1.00 -USS 0.06 0.06 0.05 0.04 0.04
External Debt, December 31, 1989
Public Debt, incl. Guaranteed 8/ 4001.3IMF 415.4Non-Guaranteed Private Debt 632.0
Total Long-Term 5048.7Short-term 641.0
Total Outstanding & Disbursed 5689.7
Net LT Debt Service Ratio for 1989 9/
Public Debt, incl. Guaranteed 8/ 18.2IMF 8.1Non-Guaranteed Private Debt 3.4
Total Outstanding & Disbursed 29.7
IEBRD/IDA Leading (12131/89) (USS mill.)
Outstanding & Disbursed 889.0 893.1Undisbursed 15.2 470.0
Total Outanding incl. Undisbursed 904.2 1263.1
6/ Include aima nd vegeable oils nd fab.7/ Excludes chemicas and prcessd foods.8/ Excludes IMF.9/ Debt sevice, net of intereusaed om forei exchange rsrves.as a peratag of Expou of Goads A NFS.

TABLE OF CONTENTS
Sumnuary . .................................................. i
Chapter 1. Economic Growth and Stabilization ..........................
A. The Recent Economic Recovery ............. ................... 1Economic Growth, Investment and Employment ...................... 1
B. The Stabilization Path ....................................... 6Fiscal Policies ......................................... Monetary Policy ............. ............................ 11Inflation ......................................... 17The External Sector ....................................... 19Incentive Indicators ....................................... 23Short-Term Prospects ..................................... 4. 2
Annex 1.A: Measurement of Inflation in Kenya: Methodological Issues .... ..... 25Current MethodolGgy ...................................... 25Potential Biases and Inaccuracies ............ ................... 25Other Problems ........................................ 29
Chapter 2: Deepening Structural Adjustment ........................... 31
A. Reforming Agriculture ...................................... 31Structure and Reform Objecdves .......... ..................... 31Evaluation ............................................. 38The Medium-Term Agenda and Sources of Growth .................... 39
B. Adjustment in Industry and Trade .......... .................... 42Structure and Constraints . ................................... 42The Adjustment Program . ................................... 45Evaluation: The First Phase . ................................. 49The Medium-Term Agenda . .................................. 52
C. Strengthening the Financial System ......... .................... 55Structure and Constraints .................................... 55The Need for Adjustment .................................... 56Financial Sector Reforms .................................... 58The Medium-Term Agenda ................................... 60
Chapter 3: Growth Prospects . ................................... 63
A. Introduction .......................................... 63B. Toward Accderated Growth ............. .................... 63

C. Target Scenario ......................................... 67Growth Prospects ....................................... 69Consumption, Savings and Investment ............................ 70The Balance of Payments . ................................... 74Fiscal Performance ........................................ 76
D. Risks and Uncertainties . ..................................... 77Slippages in Policy Reform and Fiscal Discipline ..................... 77An Oil Shock ........................................... 80
Annex 3.A: Import Elasticities in Kenya: 1968-89 and Beyond .............. 85Approaches to the Specification of Import Elasticides ................... 85Econometric Results at a Glance ......... ...................... 86Unfinished Business ........................................ 89
Bibliographical Notes . ....................................... 93
Statistical Appendix .......................................... 99
Map
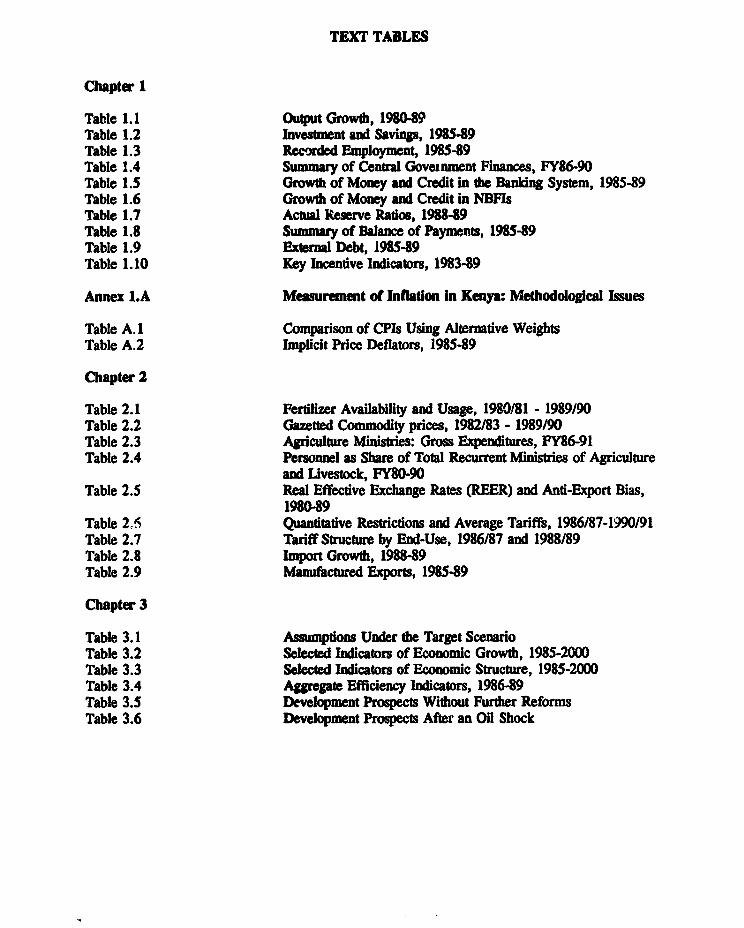
TEXT TABLES
Chapter 1
Table 1.1 Output Growth, 1980-89Table 1.2 Investment and Savings, 1985-89Table 1.3 Recordod Employment, 198549Table 1.4 Summary of Central Goveinent Finaces, FY86-90Table 1.5 Growth of Money and Credit in the Banldng System, 1985-89Table 1.6 Growth of Money and Credit in NBFIsTable 1.7 Actul Reserve Ratios, 1988-89Table 1.8 Summary of Balance of Payments, 1985-89Table 1.9 External Debt, 1985-89Table 1.10 Key Incentive Indicators, 198349
Annex l.A Measurement of Inflatn In Kenya: Methodological Issues
Table A. 1 Comparison of CPls Using Alternative WeightsTable A.2 Implicit Price Deflators, 1985-89
Chapter 2
Table 2.1 Fertlizer Availability and Usage, 1980181 - 1989/90Table 2.2 Gazetted Commodity prices, 1982/83 - 1989/90Table 2.3 Agriculture Ministries: Gross Expenditures, FY86-91Table 2.4 Personnel as Share of Total Recurrent Ministries of Agriculture
and Livestock, MY8O-90Table 2.5 Real Effective Exchange Rates (REER) and Anti-Export Bias,
1980489Table 215 Quantitative Restrictions and Average Tariffs, 1986/87-1990/91Table 2.7 Tariff Structure by End-Use, 1986/87 and 1988/89Table 2.8 Import Growth, 1988-89Table 2.9 Manufactured Exports, 1985-89
Chapter 3
Table 3.1 Aumptions Under the Target ScenarioTable 3.2 Selectd Indicators of Economic Growdt, 1985-2000Table 3.3 Seected Indicators of Economic Structure, 1985-2000Table 3.4 Aggregate Efficiency Indicators, 1986-89Table 3.5 Development Propects Without Further ReformsTable 3.6 Development Prospects After an Oil Shock
TEXI BOXES
Chapter 1
Box 1.1 Results of the 1986 Urbaa Labor Force SurveyBox 1.2 The Measurement of Inflation in KenyaBox 1.3 NBFIs and the Money Supply Target
Annex 3.A Measurement of Inflation In Kenya: Methodological L,ues
Box A. I Executive Cost of Living Indices
Chapter 3
Box 3.1 Kenya's Growth ImperativeBox 3.2 Smallholder Contribution to Agricultural Growth Prospects

Summary
Economic Growth and Stabilization. Kenya has enjoyed a marked economic recoveryover the past five years, reversing the relative stagnation of the first half of the 1980s. Followingrecovery from the severe drought in 1984, output and investment have responded to theGovernment's reform efforts and a relatively improved macroeconomic framework. Kenya'seconomic recovery is somewhat fragile, however, as it has relied on foreign savings, leaving theeconomy vulncrable to external shocks, and the remaining macroeconomic imbalances, unlesscorrected, threaten to undermine recent economic and stabilization gains. Since 1986-87, theGovernment has made progress toward stabilization, reducing the budget deficit and governmentborrowving from the domestic banking system, but the level of governrnent expenditures remains highand inflationary pressures have resurfaced over the past two years. To sustain Kenya's economicrecovery there is a need to both strengthen stabilization efforts and to deepen structural adjustment,especially toward greater export competitiveness. At the same time, however, Kenya faces a difficultexternal environment arising from the recent increase in world oil prices, which will place addedpressures on the balance of payments, the budget deficit and inflation.
ii. Economic growth slowed somewhat to 5 percent in 1989 compared to 5.2 percent in1988, largely due to lower agricultural growth. The more moderate growth in agriculture was aresult of the downturn in world coffee prices and inadequate rains in parts of the country.Manufacturing has continued to maintain annual growth rates close to 6 percent. The services sectorexpanded by 5.3 percent in 1989. Real fixed investment growth slowed considerably in 1989. Afteraveraging real aTnual growth of 6.5 percent over the period 1985-88, investment increased by only1.6 percent in 1989. Both public and private investment slowed, with public investment rising by1.5 percent and private investmnent by 1.7 percent. Although the gross investment rate at over 25percent of GDP over the past two years is high, Kenya has increasingly relied on foreign savings tofinance its capital formation. Sirce 1986, foreign savings have financed over one quarter of theeconomy's gross fixed investment. Domestic savings have maintained a downward trend since 1985as a result of both continued dissavings by the Central Governrnent and lower private savings. Therecently published 1986 Urban Labour Force Survey reveals a serious but largely static (since theprevious survey in 1977/78) urban unemployment problem in Kenya. The survey estimated an urbanunemployment rate of 16.2 percent, largely unchanged from 1977/78.
iii. Kenya's stabilization efforts have produced mixed results. While the budget deficithas been considerably reduced since 1987, the level of government spending remains high and theGovernment has found it difficult to restrain the growth of public sector employment and its attendantwage bill. After dropping sharply in 1988, money supply growth accelerated in 1989 and theeconomy appears to be overheating. Inflaton, fueled by a monetary overhang, international priceincreases, depreciation of the currency, price decontrol, and increases in agricultural producer prices,has remained above 10 percent. The Government's exchange rate policy has been appropriate butits external position has been affected by deteriorating terms of trade and the poor performance ofexports.
iv. The budget deficit (including grants), which peaked at 6.6 percent of GDP in FY87has been gradually reduced to 4.2 percent in FY90. Government spending, however, has remainedhigh at about 30 percent of GDP and the budget relies heavily on foreign financing. The budgetdeficit excluding grants has ranged between 6.5 and 7.1 percent of GDP over the past three years.

- ii -
The need to provide social services for a growing population, increased employment in the civilservice, transfers to parastatals, and increasing interest payments have all contributed to rising publicexpenditure levels.
v. As part of its stabilization program, the Government aims to contain monetaryexpansion and assign a greater role to market forces in credit allocation. Money supply growth (M2)has fluctuated over the past three years, falling from 11.2 percent in 1987, to 7.9 percent in 1988,and rising to 12.9 percent in 1989. This variability has been caused in large measure by fluctuationsin net foreign assets of the banking system. In recent years, the private sector has increased its shareof total credit from the banking system at the expense of the Central Government. The monetarypicture, however, changes considerably when near-bank financial institutions (NBFIs) are taken intoaccount. If NBFI deposits are included in a broader measure ot money supply (M3), the monetarystance in Kenya appears much more expansionary than indicated by trends in M2 alone. Theslowdown in money supply growth in 1988 as measured by M2 disappears when measured by M3,showing instead a steady acceleradon in monetary expansion since 1987--a pattern more in line withthe economy's recent inflation experience.
vi. The Government aims to adopt a market-determined interest rate structure in 1991.In recent years it has considerably raised interest rate ceilings and has removed controls on fees andcharges imposed by banks. As part of its interest rate policy, the Government has sought to widenthe spread between minimum and maximum rates to encourage commercial banks to enter the marketfor term lending, and has brought bank rates in line with those of NBFIs.
vii. The rise in inflation over the past two years has come at a time of growing concernover the accuracy of the index used to measure inflation in Kenya, the Nairobi Consumer Price Index(CPI). These concerns relate to the fact that the consumption weights and income brackets areoutdated, the inclusion of price controlled items, the treatment of housing costs, and the lack ofcoverage of price changes in rural and other urban areas. The Government is currently revising theCPI to correct some of these problems. In addition, there is a need to compute other indices suchas a Wholesale Price Index or a Producer Price Index.
viii. Kenya's current account deficit (including grants) widened to 6.9 percent of GDP in1989, largely as a result of worsening terms of trade and the lack of growth in non-traditionalexports. Tourism continued to show strong growth, with foreign exchange earnings in 1989 of $418million, equivalent to more than 40 percent of total merchandise exports. In 1989, merchandiseimports increased by 8.9 percent in dollar terms and 5 percent in volume terms. Merchandiseexports fell by 9.1 percent in dollar terms compared with growth of 11.8 percent in 1988. Thehigher current account deficit in 1989 was financed largely through long-term borrowing by theGovernment and parastatals. Over the past three years, increased aid flows, especially quick-disbursing assistance to support the Government's adjustment program, have played a major role infinancing Kenya's current account deficit. Kenya's external debt at the end of 1989 stood at $5.7billion. As a result of debt forgiveness from a number of bilateral donors, Kenya's debt service hasfallen from $696 million in 1986 to $594 million in 1989. The total debt service has declined overthe past two years, from 38.7 percent of exports of goods and services to 29.6 percent in 1989.
ix. Kenya's economy faces difficult and uncertain short-term prospects, in large measurethe result of the recent oil crisis. Although the short-term outlook for world oil prices remainsuncertain, Kenya will face increased financing needs of at least $350 million over 1991-92 to meet
- iii -
its oil import bill. Higher oil prices are also likely to dampen economic growth and place addedpressures on government spending. Lower economic growth is likely to impact negatively ongovernment revenues, making it increasingly difficult for the Government to meet its deficit reductionobjectives unless additional revenue measures are adopted.
x. Deepening Structural Adjustment. The Government's structural adjustment effortshave focused on developing and implementing sector reform programs in agriculture, industry andtrade, and the financial sector. At the start of this process, the Government faced an extensive policyreform agenda, but assigned priority to renewing economic growth, while recognizing that reformswould need to be phased and deepened over the longer term to make growth sustainable. Althoughthe depth and coverage of reforms, as well as implementation experience, have varied in each sector,they have a number of common objectives: (i) enhancing the role of markets and the private sector;(ii) reforming incentives to encourage growth, investment and exports; (iii) rationalizing pubficexpenditures and restructuring selected parastatals; and (iv) reducing regulations and controls oneconomic activity.
xi. In early 1987, the Government adopted an agricultural reform program to increasegrowth in the sector and support fiscal stabilization. The program focused on three inter-relatedstrategies: (i) intensifying production through improved supplies of key inputs (especially fertilizers);(ii) enhancing producer incentives and market dereguladon; and (iii) improving the allocation andefficiency of public investments and expenditure in agriculture, including initial steps to formulateand implement reforms in a number of agricultural parastatals. Of the steps the Government plannedto take, actions involving fertilizers, maize marketing, and radonalization of public expenditures wereconsidered particularly important.
xii. Implementation of the agriculture reform program was rmixed. Good progress wasmade in: maintaining appropriate producer prices, and taking steps toward market deregulation(especially maize and beef); liberalizing ferdlizer prices; carrying out the financial and organizadonalrestructuring of two parastatals, NCPB and SONY; and improving cost recovery in the sector.Disappointing progress occurred in: removing supply constraints in fertilizer availability, andincreasing use; improving the efficiency of parastatals; and rationalizing the pattern of expendituresin the sector, especially by controlling the growth of employment in agriculture ministries.
xiii. In 1987, the Government began implementing an industrial sector reform program to:improve efficiency in the sector; stimulate growth and private investment; and increase exports. Thestrategy to achieve these objectives involves shifting incentives away from import substitution,exposing domesdc producers to greater competidon, and reducing controls and regulations. The firstphase of this reform program was implemented during 1988-89, with inidal actions taken in severalareas including import liberalizadon, export and investment incentives, and regulatory reform.During the second phase of the reform effort (to be implemented during 1990-92), the Governmentintends to accelerate the export supply response by sharpening the focus on export promotion,including measures to move the trade regime closer to neutrality and providing specdfic support tonon-traditional exporters, while continuing to reduce the level and variability of effective protecdon.
xiv. Although the Government implemented some policy reforms in 1986-88, acomprehensive financial sector adjustment program was launched in early 1989. This programincludes policy and institutional reforms intended to develop a more efficient and market-orientedfinancial system. Reforms aim to increase the efficiency of financial intermediadon, remove

- iv -
distortions in the mobilization and allocation of financial savings, and develop more flexible monetarypolicy instruments. Institutional reforms were designed to restore public confidence in the financialsystem, encourage development of capital markets, and to upgrade the skills required to superviseand regulate financial intermediaries. Over the past two years measures have been taken to relaxcontrols on interest rates, develop and utilize indirect monetary policy instruments, strengthen theregulatory and supervisory capacity of the Central Bank, restructure tU.lubled financial institutionsand provide incentives for capital market activity.
xv. Growth Prospects. Kenya's good economic performance in recent years has promptedmany observers to suggest that Kenyan policy makers should now set their sights beyond Sub-SaharanAfrica and seek to emulate the experience of rapidly-developing economies. This reporl argues thatimproved econonic nmanagement combined with a deepening and faster pace of adjustment, Kenyacould accelerate economic growth. The set of projections contained in Chapter 3 suggest that abolder and more determined effort would make higher economic growth possible.
xvi. Macroeconomic policies for stability and economic growth, especially focusing onfiscal policies, are necessary but far from sufficient for sustained development. They need to besupported by appropriate sectoral and regulatory policies that remove structural constraints, efficientinvestments in social and economic sectors, and improved quality and cornpetence of theGovernment. In addition, poverty alleviation and improved environmental management requirespecial attention--both in their own right and because on their influence on the sustainability ofdevelopment.
xvii. Kenya has made considerable progress in structural adjustment. As Kenya enters adeepening phase in its adjustrnent process, it faces a different and more difficult set of issues in eachsector. In a sense, during the first phase of adjustment the Government attempted to address themore immediate and, arguably, the relatively easier adjustment constraints. In agriculture, improvingproducer incentives has played a major role in stimulating agricultural growth. To sustain andaccelerate agricultural growth, however, the Government's reform effort will have to focus on themore difficult areas of liberalizing agricultural marketing and input supply, improving institutionalarrangements for research, extension and credit, and increasing the efficiency of public spending inthe sector. In the industrial sector, import liberalization of raw materials, intermediates and capitalgoods, and selected price decontrol have contributed to higher manufactnring growth. A deepeningof adjustment in the industrial sector, however, will now need to focus on lowering the level ofprotection, reducing the anti-export bias, loosening the regulatory environment, and reducinggovernment ownership in the sector. In the financial sector, the Government is taking steps toliberalize financial markets and interest rates, and to deepen capital markets. These measures willpose new challenges in terms of implementing monetary policy, regulating a freer financial system,and introducing the necessary legal and institutional changes that can deepen capital and moneymarkets. Although the Government has made substandal progress in implementing financial sectorreforms, the sustainability and impact of these measures will depend critically on the Government'sability to contain the growth in public expenditures and the budget deficit.
xviii. Although Kenya has a dynamic private sector, in recent years there has been a growingpercepdon that excessive government regulations and lack of transparency in their application areconstraining new private sector initiatives, both domestic and foreign. When coupled with the stilllarge public sector claim on the economy's resources, the regulatory environment constraints theability and willingness of the private sector to respond to improved policies and incentives. Although

- v -
the Government has made some progress in this direction, much can still be done to reduce the scopefor discretion and arbitrariness in economic decision making by simplifying and reducing controlson the private sector. The successful adoption of automatic import licensing shows that the scopefor reducing rent seeking and enhancing transparency can be greatly enhanced by removingdiscretionary powers.
xix. In creating an efficient enabling environment for development, there is a clear needto improve the quality and competence of the Government itself. Although by Sub-Saharan Africanstandards, Kenya has a competent and professional public service, a more ambidous pace of reformwould require improvements in four principal areas. First, there is a need to strengthen the coreagencies that formulate and implement economic and sectoral policies. The success of reformprograms will depend as much on Government commitment to adjustment, as on the public sector'sability to design, adopt and manage them efficiently and credibly. A critical element in this processwill be the Government's ability to mobilize the requisite support for reforms from the politicalestablishment and the public at large. Second, there is a need to rationalize and divest governmentownership of public enterprises. As discussed in this and previous Bank economic reports, the sizeand efficiency of the parastatal sector in Kenya, especially in commercially-oriented areas, is sharplyat odds with the Government's strategy of assigning the private sector a leading role in developmentand limiting government intervention to what it does best.
xx. Third, within the public sector itself there is an urgent need to improve the policiesand mechanisms for expenditure allocation, and financial management and control. Improving theway public expenditure priorities are established, reviewed and implemented is necessary tostrengthen the quality and impact of adjustment programs. Strengthening the Govermnent's budgetradonalization program and improving its public investment programing are critical priorities.Fourth, there is a need to gradually revamp personnel and incentive policies in the public sector.The problem lies not only in the large size of public sector employment in Kenya but also the qualityof personnel, which is largely linked to incentive policies. As a number of Bank reports havepointed out, continued expansion in recruitment has severely squeezed recurrent expenditureallocations to essential non-wage operations and maintenance. This constrains the flexibility of fiscalpolicy and reduces the efficiency of resource use in the public sector, especially in areas that arecritical to underpin rapid economic growth such as the provision of infrastructure and social services.In addition, the large and growing size of the civil service as well as the need to control spendingseverely hampers the Government's ability to recruit, retain and motivate qualified staff. At present,many civil service posts in the lower grades are overfilled, while middle and higher grades areunderfilled. Given that public sector salaries are not competitive with the private sector, it is notsurprising that professional and technical expertise is in short supply within the Government. Amajor civil service reform effort would need to focus on reducing recruitment at lower grades andudlizing these savings to substandally improve remunerations for skilled and professional staff.
xxi. In addition to deepening adjustment in producdve sectors and the public sector, overthe longer term Kenya faces the need ensure that economic growth is more equitable andenvironmentally sustainable. The Government's development strategy emphasizes rapid economicgrowth to reduce poverty. Although there are no reliable data on the incidence of poverty in Kenya,social indicators suggest that the process of economic development has helped to alleviate poverty,especially in light of the country's explosive populadon growth. It would be difficult to argue thata strategy that placed less emphasis on economic growth would have improved condidons for thepoor in Kenya. Poverty alleviation, however, should be a developme -t goal in itself. Many aspects

-vi -
of the Government's growth strategy are designed to benefit the poor directly, especially labor-intensive and smallholder-based growth. In addition, however, there s a need to improve theeffectiveness and targeting of public expenditure in the social sectors to ensure they directly benefitthe poor, as weHl as considering direct interventions that protect the poor from the effects of reformmeasures and assist those left behind by economic growth.
xxii. Environmental problems in Kenya stem largely from population pressures on limitedland resources. Depletion of woodlands is a major cause of land degradadon and soil erosion,contributing to lower productivity, decreased water holding capacity, a reduction of dry season wateravailability, and encroachment on wildlife and natural habitats. Environmental problems areparticularly severe in ASAL areas, which are more susceptible to ecological damage from populationpressures. The Government's immediate environmental priorities are to inprove policies andinstitutions in the forestry sector, arrest the deterioration in the wildlife sector, and begin formulatinga strategy for environmentally sustinable development in ASAL areas. While these priorities areappropriate, over the medium term there is a need to develop and implement a comprehensivenational environmental management and action program which can lay an appropriate foundation forsustainable development over the long term.

Economic Growth and Stabilization
1.01 Kenya has enjoyed a notable economic recovery over the past five years, reversing therelative stagnation of the first half of the 1980s. Following recovery from the severe 1984 drought,output and investment have responded to the Government's reform efforts and a relatively improvedmacroeconomic framework. Kenya's recovery, however, is somewhat fragile as it has relied onforeign savings, leaving the economy vulnerable to external shocks, and the remaining domesticmacroeconomic imbalances, unless corrected, threaten to undermine recent economic and stabilizadongains. Since 1986-87, the Government has made progress toward stabilization, reducing the budgetdeficit and government borrowing from the domestic banking system, but the level of governmentexpenditures remains high and inflationary pressures have resurfaced over the past two years. Tosustain Kenya's economic recovery there is a need to both strengthen stabilization efforts and todeepen structural adjustment, especially toward greater export competitiveness.
1.02 The remainder of this chapter briefly reviews recent economic performance, focusingon major output, investment and employment trends over the 1985-89 period, the evolvingmacroeconomic framework, Kenya's external position, and key incentive indicators. Progress instructural adjustment and the need to deepen the process in agrculture, industry and trade, and thefinancial sector are discussed in Chapter 2.
A. The Recent Economic Recovery
Economic Growth, Investment and Employment
1.03 Economic Growth. Kenya's economy has sustained a marked economic recovery sincethe 1984 drought. Over the past five years, real GDP (at factor cost) has averaged annual growthof 5. 1 percent (Table 1.1). This is in sharp contrast with the relative stagnation that characterizedthe first half of the 1980s, with average annual GDP growth of only 3.3 percent (1980-84). As aresult of Kenya's good growth performance, output per capita has increased by 6 percent between1985 and 1989. Adjusted for the effects of changes in Kenya's extemal terms of trade, however,GDP per capita has remained approximately constant over the period.

2 Chapter 1: Economic Growth and Stabilization
Table 1.1Output Growth, 1980-89
(Kenya Pounds at Constant 1982 Prices, and Percentages)
19804 1985 1986 1987 1988 1989 19849
Growth rates (%):GDP market prices 2.1 4.3 7.2 5.9 6.0 4.6 5.6GDP factor cost 3.3 5.1 5.6 4.9 5.2 5.0 5.1Agriculture 2.8 1.0 4.9 4.2 4.7 4.0 4.4Manufacturing 3.7 4.5 5.8 5.7 6.0 5.9 5.6Services 4.1 5.6 6.7 5.1 5.4 5.3 5.6
GDP per capita (KE) 162 165 168 170 172 175 170Adjusted GDP ' 162 162 169 160 165 160 163
Real per capita GDP at factor coat adjusted for changes in Kenya's external terms of trade.
Sources: Satistical Appendix. Tables 2.2, 2.4 and 2.6; and Econoomic Survey, various years.
1.04 Economic growth slowed somewhat to 5.0 percent in 1989 compared to 5.2 percent in1988, largely due to lower growth in the agricultural sector. The more moderate 1989 growth inagriculture was a result of the downturn in world coffee prices, which fell by 23 percent in 1989,and inadequate rains in parts of the country. The manufacturing sector, which is greatly influencedby performance in agriculture, has continued to maintain annual growth rates close to 6 percent. Theservices sector, which accounts for about 42 percent of GDP expanded by 5.3 percent in 1989.Subsectors experiencing rapid real growth in 1989 included: electricity and water (8.4 percent); thefinancial system (7.5 percent); ownership of dwellings (6.8 percent); tourism; and governmentservices (5.5 percent). The rapid increase in government services was driven by salary increases forthe armed forces and continuing pressures on education spending, especially at the university level,to accommodate the new 8-4-4 education system. The tourism sector continued to play a major rolein Kenya's economy. Foreign exchange receipts increased by 6.7 percent to reach $418 million in1989 and arrivals increased by 5 percent.
1.05 Agriculture, Kenya's leading economic sector, has averaged growth of 4.4 percent overthe past five years. The growth in agricultural value added dropped somewhat to 4.0 percent in1989, following the good performance of the previous year, largely due to a 9 percent fall in coffeeoutput. Tea output, on the other hand, continued to rise. Over the past five years tea output hasaveraged growth of over 9 percent annually. Favorable weather conditions in tea growing regions,improved prices and government efforts to encourage expansion in area planted and processingcapacity, have been responsible for the steady increase in tea production. Maize producdon declinedin 1989 due to a reduction in area planted and somewhat unfavorable weather in parts of the countryduring the long rains, while wheat production increased by 3.8 percent due to higher prices, goodrains and improved yields. Cotton output increased for the first time in 1989 after several years ofstagnadon, with cotton sales to the Cotton Lint and Seed Marketing Board increasing by 27 percent,but the level remains about one thired that attained in 1985. Sugarcane output as reflected in factory

Chapter 1: Economic Growth and Stabilization 3
intake increased by 11 percent, due to expansion programs and improved cane crushing efficiency.The livestock sector, benefiting from the decontrol of prices in 1987, has continued to grow strongly.
1.06 Real manufacturing value added increased by 5.9 percent in 1989, slightly below the 6.0percent achieved in 1988. Employment in manufacturing industries increased by 2.8 percent in 1989,reaching an estimated 182,300 persons, implying a 3 percent improvement in average laborproductivity. Manufacturing's good growth performance has been influenced by the recovery inagriculture, ensuring adequate supplies of raw materials for agro-based industries, strong domesticdemand, government measures to encourage manufacturing growth (e.g., price decontrol, reductionsin corporate taxes), and the import liberalization program which, combined with increased foreigncapital flows, helped sustain the availability and timeliness of imported inputs for the sector. As inprevious years, most manufacturing subsectors recorded positive growth. The exceptions weregrainmill products (-21.9 percent), bakery products (-0.1 percent) and non-electrical machinery(4.3 percent). Subsectors recording strong growth in 1989 included metallic products (16.2 percent),petroleum and other chemicals (15.5 percent), and clay and glass products (10.3 percent).
1.07 Value added in the building and construction sector recorded real growth of 5.4 percentin 1989. Employment in the sector increased by 7.8 percent in 1989, to reach 67,400 persons.Cement consumption, usually a good indicator of construction activity, exceeded one million tons in1989, an increase of 7.7 percent over #he previous year. The continued growth in the sector'sactivities was a result of increases in commercial bank credit to the private construction sector andpublic sector projects. Credit extended by commercial banks for building and construction increasedby 34 percent in 1989. The public sector contributed to the growth in building and constructionthrough increased expenditure in road development, housing and the expansion of educationalfacilities for implementation of the 8-4-4 system.
1.08 Installed electricity capacity increased by 160 MW to 719 MW in 1989, largely as aresult of the coming on stream of the Kiambere project. Electricity generation increased marginallyby 56 GWH to 2,900 GWH in 1989. While hydro-based electricity increased by over 6 percent,thermal-based generation dropped by 50 percent in 1989. With the expected commissioning of theTurkwell project in 1990, hydro is expected to rise significantly.
1.09 Investment and Savings. Real fixed investment growth slowed considerably in 1989.After averaging real annual growth of 6.5 percent over the period 1985-88, investment increased byonly 1.6 percent in 1989 (Table 1.2). Both public and private investment slowed in 1989, withpublic investment risii ; by 1.5 percent and private investment by 1.7. In recent years, the patternof investinent growth has been greatly affected by bulky public sector investmnents such as theconstruction of silos for the National Cereals and Produce Board (NCPB) and large hydroelectricprojects, particularly in 1986 and 1988, when public investment recorded real growth of over 20percent. Private investmnent has also behaved erratically. After recovering in the mid 1980s and asurge in 1987, private fixed investment has averaged growth of only 1.1 percent over the past twoyears. While fixed investment has remained approximately constant since 1986, the past three yearshave seen a considerable build up in stocks. Large reserves of coffee and maize during 1988 and1989 largely explain the increase in stocks.
1.10 Although the gross investment rate at over 25 percent of GDP over the past two yearsis high and compares well with that for low- and middle-income economies, over the past three years

4 Chapter 1: Economic Growth and Stabilization
Table 1.2Investment and Savings, 1985-89
(As Percentages of GDP)
1985 1986 1987 1988 1989
Gross Investment 25.5 21.8 24 4 25.3 25.5Fixed Investment 17.5 19.6 19.7 20.4 20.1
Public 6.8 8.1 7.2 8.4 8.2Private 10.7 11.5 12.5 12.0 11.9
Change in Stocks 8.0 2.2 4.7 4.9 5.4
Financed by:Foreign Savings 1.1 -0.1 5.1 5.2 5.8
Grants' 1.9 2.1 1.8 3.1 3.4Net Borrowing -0.8 -2.2 3.3 2.1 2.4
Domestic Savings 24.4 21.9 19.3 20.1 19.7Central Government -1.2 -1.5 -1.9 -0.8 -1.2Private2 25.6 23.4 21.2 20.9 20.9
Memo Items:Real Growth inFixed Investment 0.6 11.9 6.0 8.7 1.6
Public 5.7 20.1 -6.7 22.7 1.5Private 5.1 5.8 16.9 -0.2 1.7
The contribution of grants is somewhat overstated since it is not possible to disaggregate capitaland current grant.
a Private savings is a rcsidual which includes all non-Central Governnent savings.
Source: Srdsucat Appendix, Tables 2.3 and S. 1.
Kenya has increasingly relied on foreign savings to finance its capital formation.' Since 1986,foreign savings have financed over one quarter of the economy's gross fixed investrnent. Domesticsavings have maintained a downward trend since 1985 as a result of both continued dissaving by theCentral Government and lower private savings. Domestic savings, which financed all grossinvestment in 1986, contributed only 77 percent in 1989. It is difficult to find an explanation forthe decline in the private savings rate. Interest rates have remained largely positive in recent yearsand while real wages have not recovered to the levels achieved in 1980, they have been rising since1985 (Table 1.10).
The gross domestic investment rate in 1988 was 18 percent for other low-income economies (low-income excluding Chinaand India), 25 percent for middle-income economies, and 23 percent for lower-middle-income economies (World Bank,1990b).

Chapter 1: Economic Growth and Stabilization 5
1.11 Employment trends. Official data only covers wage and salary employment in themodern sector, and in urban and rural small-scale enterprises (previously referred to as informalsector), which combined are esdmated to account for less than 20 percent of Kenya's total laborforce. In 1989, excluding small-scale agriculture, Kenya's economy generated 76,600 new jobs,represending a growth rate of 4.5 percent (Table 1.3). Job creation in the modern wage sectorincreased by 2.4 percent in 1989, significantly lower than the 4.1 percent achieved in 1988. In linewith the Government's strategy of encouraging the expansion of small-scale enterprises, the sectorhas been the most dynamic source of employment growth in recent years. Over the period 1985-89, employment growth in the small-scale sector averaged 10.8 percent annually, or an average of27,000 new jobs every year. Although employment growth in the Central Government moderatedsomewhat in 1989 (increasing by 3.8 percent), employment by the Teachers' Services Commission(TSC) and in parastatals has continued to grow rapidly. Over the past five years, employment inTSC has averaged annual growth of 5.3 percent, well above the growth in the total labor forcewhich is estimated to be expanding by about 4 percent annually.
Table 1.3Recorded Employment, 1985-89(In Thousands, and Percentages)
AverageGrowth
1985 1986 1987 1988 1989 1985-89
Wage Employment 1174 1227 1274 1327 1359 4.0
Private 600 621 647 671 678 3.3Agiculture 186 193 199 .97 194 1.4Manufacturing 124 130 136 142 143 3.6Other 290 298 312 332 341 4.2
Public 575 606 627 655 681 4.7Cental Govemment 252 260 274 271 281 4.0TSC 151 164 173 185 195 8.1Pamastatals 90 ICO 97 104 108 2.5Other publc 82 82 83 95 97 3.2
Smal-Scale Entetpris 255 281 312 346 390 10.8
Self-Employed 33 35 38 44 44 6.5
TOTAL 1462 1543 1624 1717 1793 5.3
Sommev Siddcat Append., TabIes 1.3 ad 5.8.
1.12 The recendy published 1986 Urban Labour Force Survey (ULFS), which updatesinformation since the last survey in 1977/78, reveals a serious but largely static urban unemploymentproblem in Kenya (Box 1.1). Although definidonal differences regarding labor force activity andunemployment in sample and questionnaire design do not permit a simple comparison between thetwo surveys, work carried out in the Long Range Planning Unit of the Ministry of Planning and

6 Chapter 1: Economic Growth and Stabilization
National Development indicates that although unemployment increased slightly, the differencebetween the two unemployment rates was statistically insignificant, implying that there has been littlechange in Kenya's urban unemployment problem between 1978 and 1986 (Republic of Kenya, 1988).The 1977/78 ULFS estimated an urban unemployment rate of 6.1 percent but it utilized a single dayas reference period. The 1986 ULFS, which relied on a one week reference period, found an urbanopen unemployment rate of 16.2 percent. When the unemployment rates for 1986 were adjusted forthe single day reference period, the corresponding rate became 6.9 percent. The overallunemployment rate for males declined slightly but that for women increased significantly, probablyrelated to inczeases in participation rates for women in urban areas. The ULFS also providesinformation on the extent of underemployment. The Long Range Planning Unit estimates thatunderemployment adds only one percent to the rate of open unzmployment.
B. The Stabilization Path
1.13 In 1987 there was a significant deterioration in Kenya's terms of trade following the endof the mini coffee boom in 1986. The current account deficit widened and the overall balance ofpayments reverted to a deficit. There was a major drain of foreign exchange reser'es and the importregime was tightened to control imports. The budget deficit increased and credit expansion remainedhigh. Inflation began to rise, fueled by large increases in the money supply during 1986. Partly dueto a slowdown in agriculture, GDP growth (at factor cost) fell below 5 percent. In view of thedeterioration in financial and economic conditions, and in line with the objectives set out in the 1986Sessional Paper, the Government in late 1987 adopted a major stabilization and structural adjustmentprogram. The program was supported by an 18-month Stand-by arrangement from the IMF and athree-year arrangement under the IMF's Structural Adjustment Facility, both of which becameeffective in February 1988. In early 1989, the Government requested support under a three-yearEnhanced Structural Adjustment Facility, currently in its second year of implementation. Theprogram was also supported by IDA sectoral adjustment lending for the agricultural, industrial, andfinancial sectors, with significant cofinancing by a number of donors.
1.14 The Govtriment's stabilization program aims to: (i) reduce the budget deficit to a moresustainable level that can be financed by foreign and non-inflationary domestic sources, and that doesnot crowd out the private sector; (ii) control monetary expansion and reduce the rate of inflation torates more in line with Kenya's major trading partners; (iii) maintain an appropriate exchange ratepolicy that supports the Government's import liberalization program and corrects for differentials indomestic and international infladon; (iv) limit the use of new nonconcessional foreign borrowing togradually reduce Kenya's debt service ratio; and (v) reduce the current account deficit and build upforeign exchange reserve levels.
1.15 Kenya's efforts to stabilize the economy have produced mixed results. While the budgetdeficit has been considerably reduced since 1987, the level of government expenditures remains highand the Government has found it difficult to restrain the growth of public sector employment and itsattendant wage and salary bill. After dropping sharply in 198, money supply growth acceleratedin 1989 and the economy appears to be overheating. Inflation, fueled by a monetary overhang,internadonal price increases, depreciation of the shilling, price decontrol, and increases in agriculturalproducer prices, has remained above 10 percent for the past two years. The Government's exchangerate policy has been appropriate but its external position has been adversely affected by deterioratingterms of trade and the poor performance of a number of its major exports. To provide the imports

Chapter 1: Economic Growth and Stabilization 7
Box 1.1Results of the 1986 Urban Labour Force Survey
Just over 70 percent of the working age population (15-64 years) are economically active.Of those employed, almost 80 percent have one job activity as a paid employee, about 20 percentare self-employed, and a small proportion have at least one activity of each type. Since 1977178,there appear to be increasing numbers of females joining the labor force. Participation rates forfemales, however, remain about one third lower than for males in all age groups between 20-64.
The overall rate of open urban unemployment is approximately 16 percent of theeconomically active population, 12 percent for males and 24 percent for femnales. Importantdeterminants of unemployment include age, sex, education, and location. One of the more importantand unambiguous changes since 1977/78 is the increase in the number of unemployed women.Whereas in 1977/78 unemployed men outnumbered women by a factor of three to one, in 1986 theunemployed included a majority of women. Rates are highest for the younger members of the laborforce (63 percent for males in the 15 to 19 age group and 45 percent for females in the 20 to 24 agegroup) and remain high for all males under 30 and femnales under 40. Unemployment rates are muchlower for those with an education beyond secondary school, and are highest for those who havecompleted between Form I and IV. The highest unemployment rates were in Nairobi (20 percent)and urban areas in Western (18 percent) and Rift Valley (18 peiwent) Provinces. Underemploymentin the 1986 UTLFS is estimated to increase the rate of unemployment by only one percent. Theunderemployed tend to be predominantly males in the 20-35 age bracket.
The labor force as a whole is becoming increasingly educated. The proportion of the laborforce reporting no formal education has dropped significantly, and the proportion with universitytraining has almost doubled since the previous ULFS. In general, males are still more educated thanfemales, but the gap seems to be narrowing. Skill development through various training programsis not as widespread as might have been anticipated since the majority of respondents cited no formaltraining for the jobs they hold. On the job training by employers, either while at work or in specialcourses, is important for paid employees. For the self-employed, acquisidion of job skills throughinformal methods such as friends and relatives is the dominant form of training.
T'he methods of job search are more varied in 1986 than in 1977/78. The percentage ofdirect approaches to employers among all job-seeking activities declined from over 60 percent in1977J78 to less than 20 percent in 1986. There appears to be a marked increase in the use offriends or relatives to secure work, by either providing information on available work or otherwisegaining advantages over other job seekers. Most Kenyans in urban areas experience an extendedperiod of job search. Sixty percent of job seekers have been looking for work for more than oneyear, and over 35 percent have been looking for over two years. Nevertheless, the period wasshorter than in 1977/78 when fewer searched for less than one year. Increases in the cost of livingand job search may play a role in this trend.
Source. RepubRc of Kenya, ]988.

8 Chapter 1: Economic Growth and Stabilization
needed to sustain economic growth, the Governrment has had to increase its reliance on external aid,leaving the economy vulnerable to further external shocks and uncertain aid flows.
Fiscal Policies
1.16 Containing Expenditures. As discussed in the last Kenya Country EconomicMemorandum (World Bank, 1988), the Government's ability to control the budget defiLut played akey role in Kenya's efforts to stabilize the economy and reduce inflation during the first half of the1980s. By FY84, the cash deficit (including grants) had been reduced to a manageable 3.9 percentof GDP and government spending absorbed 27 percent of GDP. Kenya's fiscal situation suffereda gradual deterioration during FY84-87. The overall cash deficit (including grants) increased from3.9 percent of GDP in FY84 to 5.0 percent in FY85 and 5.3 percent in FY86 (Table 1.4). Thebudget deficit continued to rise in FY87, peaking at 6.6 percent of GDP. The worsening fiscalstance in FY87 was the result of higher expenditure and lending levels which increased by 17 percentin nominal terms. Following adoption of the Government's stabilization program in 1987, the deficitwas substantially reduced, ranging between 4.2 and 4.7 percent of GDP during the past three years,but the Government has found it difficult to push the deficit below 4 percent of GDP. Moreover,governmnent spending has remained high at around 30 percent of GDP and reliance on external grantsalso remains high. The budget deficit excluding grants has ranged between 6.5 and 7.1 percent ofGDP over the past three years.
1.17 A number of factors account for the Government's difficulties in controlling the growthof expenditures.2 First, Kenya's high population growth rate and the Government's commitment tomeet demand for social services places enormous pressures on social expenditures. Spending oneducation in particular has been rising rapidly as a result of the demographic momentum, the highdemand for education, and the adoption of the 844 system, which added one year to primaryeducation and is placing increasing pressures on university enrollments. Second, public sectoremploym-ent, in the civil service and TSC, is the ma;> driving force behind the rapid increase inrecurrent spending. Third, interest payments on domestic debt are rising rapidly, as the Governmenthas shifted some deficit financing to nonbank sources through Treasury Bills and Bonds, and asdomestic interest rates have risen. Fourth, much of the fiscal adjustment during the mid-1980sfocused on reducing development expenditures rather than recurrent spending. Although this allowedthe Government to rationalize somewhat its public investment program, especially by cancelling anumber of marginal projects, there is a limit to how much development spending can be squeezedin a country such as Kenya without endangering essential infrastructure and human capitalinvestments. Moreover, as development spending is compressed this runs the risk of affectingproject-aid levels and, to the extent that the Government reduces its own contributions to t-ireign-assisted projects, threatening the viability of projects. Fifth, although accurate estimates are notavailable, transfers to parastatals are large and the Government is increasingly being called upon tohonor external debt of parastatals.'
2 Fiscl policy and public expenditure issues were extensively analyzed in the last Country Economic Memorandum (WorldBank, 1988a), and the recent Public Expenditure Rev;cw (World Bank, 1989a), respectively.
In this year's budget speech, the Vice-President and Minister for Finance expressed great concern over the widespread lackof financial control and discipline among parastatals. He noted that Treasury is increasingly forced to divert funds frombudgeted purposes to meet debt obligations which parastatals are unable to service.

Chapter 1: Economic Growth and Stabilization 9
Table 1.4Summary of CentraJ Govermnent Finances, FY86-90
(In Millions of Kenya Pounds)
Revised Prelini. Budget EstimateFY86 FY87 FY88 FY89 FY90 FY90
Revenue and grants 1269 1461 1796 2056 2590 2413Revenue 1215 1398 1637 1869 2204 2204Grants 55 63 159 187 386 209
Exnenditures 1597 1872 1991 2430 3016 2805Recurrent 1222 1378 1532 1856 2094 2145Development andNet Lending 375 494 459 54 922 660
Defic.t -328 411 -195 -374 -427 -392
Adjustment 37 3 -103 -5 - --
Cash Deficit -291 -408 -297 -379 -427 -392
Financing:Foreign (net) -48 2 72 200 355 316Domestic 339 406 226 179 72 75Bank 97 251 -6 103 39 45Nonbank 243 155 232 77 33 30
Memo Items (% of GDP):Expenditures 29.3 30.2 28.5 30.4 -- 30.1Deficit:Including grants 5.3 6.6 4.3 4.7 4.2 4.2Excluding grants 6.3 7.6 6.5 7.1 6.5 6.5
Nominal GDPmp 5456 6199 6997 7996 - 9333
The cash deficit for FY89 was increased by Kg 91.3 maillion to reflect the increase in the stock ofunpresenred checks at the er4 of June 30, 1989. which were largely liquidated through bank financingin early July 1989. ITc figure for domestic bank financing was adjusted accordingly. Nominal GDPon a fiScl basis is an averege of calendar years
Source: I eslimtes, and st 4gesdmares.

10 Chapter 1: Economic Growth and Stabilization
1.18 Preliminary data for FY89 show that the budget deficit reached 4.7 percent of GDP,slightly higher than the program target of 4.i percent. Excluding grants, the budget deficit increasedto 7.1 percent of GDP. Both revenue and expenditures were lower than anticipated. Revenueshortfalls were largely the result of lower grants and lower-than-programmed import duty collections,the latter reflecting lower than expected import levels. Total expenditures increased by 22 percentin nominal terms. Interest payments also increased by 22 percent, largely as a result of a 33 percentincrease in foreign interest payments. Foreign financing of the deficit was equivalent to 1.3 percentof GDP. When adjusted for the increase in the level of unpresented checks, which were largelyliquidated in early July 1989, domestic financing amounted to 2.3 percent of GDP. Foreignfinancing of the cash deficit amounted to K£ 200 million (2.5 percent of GDP), slightly higher thanthe programmed level. Bank financing, when adjusted for unpresented checks, reached 1.3 percentof GDP.
1.19 Preliminary estimates for FY90 suggest that the budget deficit was contained to 4.2percent of GDP (6.5 percent excluding grants), somewhat lower than the budgeted 4.6 percent. Newrevenue measures were introduced to raise an additional K£ 58 million, of which abou; K£ 25 millionwere generated by a sales tax increase and about K£ 10 million from customs duties. On January1, 1990 the manufacturing sales tax was replaced by a value added tax (VAT) which retained theoriginal 17 percent sales tax rate. In line with the Government's policy of placing greater relianceon cost recovery, user charges were introduced for health and education, and tariffs were raised forroad use and some agricultural services. These changes are expected to increase user chargecollecdons from about 0.6 percent of GDP in FY89 to 1.3 percent in FY90. To contain the deficit,the Government reduced development spending in line with a fall in foreign grants from the levelsprojected in the original FY90 budget. Interest payments increased by 13 percent, as a result ofhigher interest rates on domestic debt, which were partially offset by debt forgiveness from a numberof bilateral donors (Canada, France, Germany, Netherlands, United Kingdom, and United States).
1.20 The Government's stabilization program for FY91 aims to further reduce the budgetdeficit to 3.8 percent of GDP. This will be difficult to achieve, as considerable expenditure pressureswill remain throughout the coming fiscal year, especially from the rising intake in public universidesand the planned increase of civil service wages. Under these circumstances, it is likely that non-wage operations and maintenance expenditures will be further squeezed. Moreover, as liberalizadonof the financial system proceeds there will be increasing pressure on interest rates on domestic debtas the Government attempts to shift its financing needs toward nonbank sources. The Government'sstabilization efforts will need to focus increasingly on containing the growth of the public sector wagebill and on reducing transfers to parastatals.
1.21 Strengthening the Revenue Base. As part of its stabilization and adjustment efforts, theGovernment is attempting to increase the yield and efficiency of the tax system. Kenya's taxrevenues, which amounted to 21 percent of GDP in FY89, compare favorably with those of low- andmiddle-income countries. Kenya also has a relatively broad-based tax system, with taxes oninternational trade acccunting for only 16 percent of total revenues in FY90, and taxes on incomesand consumption of goods and services accounting for 29 percent and 58 percent, respectively.Kenya's tax structure, however, has had relatively low elasticity with respect to GDP (estimated at0.8 percent) which has required the continuous adoption of discretionary tax measures to maintaintax buoyancy. Moreover, personal and corporate tax rates have been high.

Chapter 1: Economic Growth and Stabilization 11
1.22 In recent years the Government has been attempting to address these problems. In 1990,the Government began implementing a Tax Modernization Program designed to improve taxcollection and admiristration. The program includes measures to computerize the tax system,improve coordination among the various departments responsible for tax collection, enhance training,and strengthen the institutional capacity for tax policy analysis. As part of its effort to increase theelasticity and economic efficiency of the tax system, on January 1, 1990 the Government replacedthe sales tax with a VAT that also includes all services. It was originally set at 17 percent, the sameas the sales tax, but was raised to 18 percent in June 1990.
1.23 To rationalize the tax structure and improve incentives, in 1988 investment allowanceswere increased and in 1989 the individual income tax rate was lowered from 50 percent to 45percent. The revenue loss from these measures was partly offset by the introduction in 1989 of apresumptive tax of 5 percent on the value of gross sales of agricultural produce, and by theintroduction of the VAT. The FY91 budget announced a further lowering of the corporate tax ratefrom 42.5 percent to 40 percent (following a reduction from 45 percent in the preceding year), andthe deductibility of contributions to registered pension plans and provident funds from taxable income(both personal and corporate). In order to promote foreign investment in the newly-created ExportProcessing Zones (EPZ), tax exemptions were provided for the first 10 years of operations in theEPZs, while a rate of 25 percent on income earned would be applied during the following ten years.Also, payments from an EPZ enterprise to non-residents will be exempt from withholding taxes forthe first 10 years. In order to stimulate Kenya's embryonic capital market, the Government alsoeliminated the double taxation of dividends, abolished the stamp duty for share transactions quotedin the stock exchange, and allowed the deductibility of legal fees and other costs associated with thepublic issue of shares, debentures and bonds.
1.24 As part of its industrial sector reform program, in addition to replacing a number ofquantitative restrictions with tariffs, the Government has begun to move away from reliance onimport duties to mobilize revenues. Under the trade liberalization program, import tariffs will beused primarily for protective purposes, increasingly relying on the VAT to raise revenues. Theprocess of lowering tariffs was initiated in the 1989 Budget. In June 1990, the Governmentannounced a duty reduction of about 5 percentage points on imported raw materials, intermediategoods and spare parts on all import schedules except 3C. To compensate for revenue losses, VATrates were increased. The import liberalization program is analyzed in greater detail in Chapter 2.
Monetary Policy
1.25 As part of its stabilization program, the Government aims to contain monetary expansionand assign a greater role to market forces in credit allocation. Money supply growth (M2) hasfluctuated over the past three years, falling from 11.2 percent in 1987, to 7.9 percent in 1988, andrising to 12.9 percent in 1989 (Table 1.5). This variability has been caused in large measure byfluctuations in net foreign assets (NFAs) of the banking system, which in turn reflected monetarymovements in Kenya's balance of payments. The composition of total credit shows a sharpcontraction in the growth of domestic credit from 28.6 percent and 20.4 percent in 1986 and 1987,respectively, to growth of 6.7 percent in 1988 and 6.9 percent in 1989.

12 Chapter 1: Economic Growth and Stabilization
Table 1.5Growth of Money and Credit in the Banking System, 1985-89
(Percentages at Year End)
1985 1986 1987 1988 1989
LIABILITIES 6 S 35.1 16.7 1.4 11.9Broad Money M2 (MI QM) 2.5 32.5 11.2 7.9 12.9Money (MI) -3.6 32.6 9.7 5.9 8.6Quasi-Money (QM) 12.6 32.4 13.3 10.8 18.6
Other Items (net) 61.2 57.2 57.4 -32.8 3.4
ASSETS (domestic) 13.0 28.6 20.4 6.7 6.9Credit to:
Central Government 9.8 55.6 30.0 -8.7 -3.0Other public sector 13.4 16.3 26.8 -2.8 -19.8Private sector 14.6 16.8 13.2 19.6 15.6
Memo Item:Private sector as %of total credit 61.9 56.2 52.9 59.3 64.1
M2/GDP 0.27 0.30 0.30 0.29 0.28
Source: Stadstca Appendix, Table 6. 1.
1.26 In recent years, the private sector has increased its share of total credit from the bankingsystem at the expense of the Central Government and public enterprises. After large increases in1986 and 1987, credit to the Central Government fell by 8.7 percent and 3.0 percent in the twosubsequent years. There was a simnilar trend for parastatals. Credit to the private sector, in contrast,grew by 19.6 percent in 1988 and a further 15.6 percent in 1989. As a result, the share of theprivate sector in total credit from the banking system rose from 53 percent in 1987 to 59 percent in1988 and 64 percent in 1989.
1.27 The monetary picture changes considerably when near-bank financial institutions (NBFIs)are taken into account. As discussed in Chapter 2, the rapid growth of NBFIs in Kenya is a recentphenomenon. Many of them were created during the 1980s to get around the tighter regulations thenexercised by the Central Bank of Kenya (CBK) on commercial banks. On paper, the NBFIs appearto be constituted as merchant or investment banks, which would normally undertake much of thewholesale end of the banking business and provide longer-term finance. In practice, however, NBFIsoperate as much at the short end of the market as commercial banks, taking retail deposits andmaking short-term loans. Moreover, NBFIs play an important role in Kenya's financial system.Deposits in NBFIs are substantial and averaged 14 percent of GDP during 1985-89, while the total

Chapter ?: Economic Growth and Stabilization 13
savings and time deposits of the banking system (i.e., the stock of quasi-money) averaged only 12percent. The growing importance of NBFIs suggests that they should be included in the analysis ofmonetary developments in Kenya.
1.28 Following a crisis of confidence in NBFIs during 1986, caused by the failure of anumber of these institutions, the growth rate of NBFI deposits fell from 14.8 percent in 1986 to 5.7percent in 1987. Following Government efforts to restore confidence, however, NBFI depositsincreased by 21.8 percent in 1988 and 22.8 percent in 1989. If NBFI deposits are included in somebroader measure of money supply (say, M3), the monetary stance appears much more expansionarythan indicated by trends in M2 alone. As shown in Table 1.6, the slowdown in money supplygrowth in 1988 as measured by M2 disappears when measured by M3, showing instead a steadyacceleration in money supply growth since 1987. As discussed below, this pattern is more in linewith Kenya's recent inflation experience.
1.29 The differences in the growth rates of liabilities of the two types of institutions are alsoreflected on the asset side. As compared with the domesdc credit of the banking system, which grewby modest amounts in 1988 (6.7 percent) and 1989 (6.9 percent), loans and advances from the NBFIsincreased by 15.9 percent in 1988 and 17.7 percent in 1989. Additionally, while credit to theCentral Government from the banking system fell by 3.0 percent in 1989, loans and advances to itfrom NBFIs increased by 28.3 percent. Thus, while the Government reduced its borrowing fromcommercial banks, it replaced some of this credit by sharply increasing its borrowing from NBFIs.
Table 1.6Growth of Money and Credit in NBFIs, 1985-89
(Percentages at Year End)
1985 1986 1987 1988 1989
Deposits in NBFIs 15.5 14.8 5.7 21.8 22.8
Credit to:Central Government 46.2 17.6 -0.3 -15.6 28.3Other public sector 2.9 113.9 23.4 158.9 -60.6Private sector 19.0 4.6 15.5 20.9 18.2
Total Credit 23.1 7.5 12.4 15.9 17.7
Mcmo Item:M3 (M2 + NBFIs) 6.6 26.5 9.5 12.1 16.1M3/GDP 0.41 0.44 0.43 0.43 0.43
Source: radsucat Appendix, Tables 6.1 and 6.3.

14 Chapter 1: Economic Growth and Stabilization
1.30 Monetary Policy Instruments. CBK currently has three main monetary policyinstruments: minimum reserve rados (cash and liquid asset ratios), rediscount and advance facilities,and credit ceilings. Of these, CBK has relied most heavily on quantitative credit ceilings toimplement its monetary and credit policies. These instruments, however, have not been entirelyeffective.
1.31 Since December 1986, all commercial banks have been required to maintain dailyminimum non-interest bearing cash balances with CBK, equivalent to 6 percent of their deposits.In addition, both commercial banks and NBFIs are required to maintain a minimum holding of liquidassets, primarily in Treasury bills (about 50 percent), cash and inter-bank balances. Since early1983, the minimum ratio of liquid assets to total deposit liabilities has been 20 percent for thecommercial banks and 24 percent for NBFIs. These reserve requirement ratios, however, have notbeen an effective monetary policy tool because the minimum reserve levels have been set below thosethat most of these institutions voluntarily hold for prudential and business reasons. This is reflectedin the fact that, on average, the actual cash and liquidity rados have been greater than legalminimums at the end of each quarter throughout 1988 and 1989 (Table 1.7). Because the financialinstitutions generally hold more reserves than legally required, and because these excess reserves arevariable and unpredictable, the reserve ratios have not been effective in controlling liquidity.
Table 1.7Actual Reserve Ratios, 1988-89
(Percentages)
i--- 1988 - 1989
Ql QZ Q3 Q4 QI Q2 Q3 Q4
Cash ratio 6.4 6.5 7.2 6.3 8.4 6.3 7.2 6.1
Liquid assets ratio:Banks 27.0 26.0 26.0 24.0 27.0 25.0 27.0 26.0NBFIs 28.4 24,8 27.1 28.0 26.6 30.0 29.0 29.0
Source: CentralBank of Kenya.
1.32 In principle, CBK may also use its rediscount and advance facilities as an instrument tocontrol credit expansion in the system. The rediscount applies to Treasury bills (T-bills), othergovernment paper and certain types of private paper with three months or less maturity. Advancescan also be provided for private paper up to six months maturity and Government paper of anymaturity. The interest rate charged on rediscounts and advances is calculated by adding a marginto the maximum interest rate accepted in the latest T-bill tender, and is meant to be a penalty rateto discourage borrowing and monetary expansion. Currently, the rediscount rate for governmentpaper and for bank borrowing when government paper is used as collateral is set at 1.5 percent abovethe T-bill rate; for private paper the rate is 2.5 percent above the T-bill rate. The rediscount facility,however, is rarely used, even for government paper. The loan facility, on the other hand, is used

Chapter 1: Economic Growth and Stabilization 15
much more frequently. Banks are able to accommodate any extra lending fairly painlessly byborrowing regularly and automatically from CBK.
1.33 Faced with these difficulties, the Government has resorted to quantitative credit ceilingsto control domestic credit expansion. In December 1987, for example, it was announced that thecommercial banks should limit the increase in outstanding lending to borrowers other than the CentralGovernment to not more than 0.8 percent per month, using the outstanding lending to such borrowersas of September 30, 1987 as the base. In December 1988, the limit was raised to 1.0 percent, anda new base of June 30, 1988 was set.
1.34 Although these credit ceilings can be a quick-acting policy measure to restrict creditexpansion, they not only introduce rigidities, reduce competition in the financial system, and distortresource allocation, but also have not been totally effective. Borrowers and lenders in Kenya oftensucceed in avoiding such controls. Avoidance has been possible partly by channelling bank lendingthrough wholly-owned NBFIs that are not subject to such ceilings. Moreover, other than the use ofmoral suasion, CBK imposed no other sanction on commercial banks that violated these ceilings.The ineffectiveness of these ceilings is illustrated by the fact that as of January 31, 1990, 11 of 26banks had exceeded their credit ceilings by an average of 10.6 percent. The four largest banks allexceeded their credit limits by between 4 percent and 40 percent. In response, CBK announced thatfrom May 31, 1990 noncomplying banks will be required to place a non-interest-bearing deposit atCBK equivalent to 20 percent of the excess credit.
1.35 Interest Rate Policy. Interest rates in Kenya have been used primarily to influencedevelopments in the financial system rather than as instruments of monetary policy. CBK has hadthree main objectives guiding interest rate policy. First, to maintain positive real interest rates inorder to encourage savings mobilization and hence to contribute to the stability of the financialsystem. Second, to move to more market-determined interest rates in order to ensure that funds flowto the most productive sectors and, by allowing greater market flexibility in setting rates, eliminateexisting biases against small businesses, agriculture, and term lending. Third, to harmonize thecompedtive position of banks and NBFIs by reducing artificial differentials between their maximumlending rates.
1.36 CBK succeeded in maintaining real positive interest rates during the 1984-87 period.In 1988, however, real deposit rates for savings accounts in both commercial banks and NBFIsbecame slightly negative. This happened for two reasons. First, in January 1988, the Governmentundertook a reform of the interest rate structure which involved lowering the minimum savings ratefor both banks and NBFIs from 11 percent to 10 percent. This reform was intended to give financialinstitutions more room to compete. Second, the lowering of nominal rates was accompanied by anunexpected jump in inflation, from 7.1 percent in 1987 to 10.7 percent in 1988. The combinationof lower nominal rates and higher inflation accounted for the negative real savings rate in 1988. Thissituation, however, was short lived. In April 1989, the Government announced further changes inthe structure of interest rates. The minimum savings rate was increased to over 12 percent, so thateven though inflation in 1989 was 10.5 percent, the real interest rate remained positive.
1.37 Research indicates that the transition from negative to positive interest rates, rather thanthe levels themselves, has a significant impact on the level of domestic savings (World Bank, 1990a).Once positive rates are achieved, however, savings tend to be unresponsive to further increases inreal interest rates. This is because two opposing effects come into play. As real interest rates

16 Chapter 1: Economic Growth and Stabilization
increase, some target savers--those saving to attain a particular level of savings-now have to saveless since they earn more interest on a given amount of savings. This income effect tends to leadto lower savings at higher rates of interest. The second effect works in the opposite direction. Asinterest rates increase, the opportunity cost of foregone savings rises. Hence, people subsdtute awayfrom the now dearer option of consuming toward the relatively cheaper option of saving. Thus, thenet effect of higher real interest rates on savings is theoretically indeterminate and empirically weak.Financial liberalization that allows real interest rates to rebound from very negative to near-zerolevels often has a positive effect on measured savings due to a move away from consumer durablesand possible reductions in capital flight.
1.38 On the demand side, positive real interest rates are likely to affect both the demand forirvestment and its composition. The adverse effect on investment levels, however, need not dampengrowth. First, a more efficient allocation of investment could impact positively on output andgrowth. As discussed above, Kenya has consistently enjoyed a high investment rate so that theconcern should be more on the efficiency of investment rather than merely its overall level. Second,interest rate ceilings have discriminated against term lending by encouraging banks and, to a certainextent NBFIs, to concentrate on short-term lending. Several local investors interviewed by themission expressed a willingness to pay significantly higher rates of interest provided credit isavailable.
1.39 The Government aims to adopt a market-determined interest rate structure by June 1991.In recent years, it has been taking steps in this direction. As shown in Table 6.4 (StatisticalAppendix) a number of interest rates have been raised to be more in line with market forces. Inthese recent revisions, one of the aims has been to widen the spread between minimum deposit ratesand the maximum lending rate to encourage commercial banks to lend for longer terms. Previously,the spread was kept low with the result that commercial banks were unable to offer significant premiafor longer-term deposits, thus tending to keep their funding base predominantly short term in nature.The relatively low spreads have also discouraged banks from expanding lending beyond the mostconservative ventures, often concentrating on real estate development.
1.40 In April 1989, the maximum rate that banks are allowed to charge on loans was split intotwo rates: one for short-term lending and one for lending with maturities of four years or more.This change brought the commercial banks' term lending rate in line with NBFIs. From November1989, the maximum rate for long-term lending was applied to loans of three years or more. Thesemoves to increase the flexibility in the structure of interest rates should enable banks and otherfinancial institutions to compete more effectively for longer-term deposits and to offer longer-terminvestment loans. In another important move toward market determination of interest rates,restrictions on commercial bank fees and charges were lifted as of April 1, 1990. Thus, financialinstitutions can vary fees and charges to attain more flexible effective interest rates on loans.
1.41 To harmonize conditions between commercial banks and NBFIs, CBK has reduced thedifferential between maximum lending rates for the two types of institutions. In June 1987, themaximum rate for NBFIs was lowered from 19 percent to 18 percent. In January 1988, themaximum commercial bank rate was raised from 14 percent to 15 percent. Finally, in April 1989,CBK raised the ceiling on long-term bank loans in line with the ceiling for NBFI lending.
Chapter 1: Economic Growth and Stabilization 17
Inflation
1.42 Inflation, which decreased to 5.6 percent in 1986 rose to 7.1 percent in 1987, 10.7percent in 1988, and remained approximately unchanged in 1989 (Table 1.9). This disappointingoutcome has come at a time of growing concern over the accuracy of the index used to measureinflation in Kenya, the Nairobi Consumer Price Index (CPI). There are several methodologicalproblems with the construction of this index. A brief summary is provided in Box 1.2, while a fullerdiscussion is contained in Annex 1.A.
1.43 A number of factors are likely to have contributed to the rise in inflation. In recentyears, the Government has made substantial progress in decontrolling prices and has frequentlyadjusted agricultural producer prices. Another powerful influence on the domestic rate of inflationis the rise in the price of imports, both due to increases in world prices as well as from thedepreciation of the shilling. Table 3.9 (Statistical Appendix) shows that import prices increased by35 percent between 1986 and 1989. Excluding oil, the import price index increased by 32 percentover the same period. Compounding the effects of rising import prices has been the need to adjustthe exchange rate. The shilling depreciated by 27 percent and 39 percent with respect to the USdollar and the SDR, respectively, over the same period (Table 6.5, Statistical Appendix). Sinceimports are equivalent to over 20 percent of Kenya's GDP, the domestic price of imports is likelyto have a significant influence on the rate of inflation. A recent econometric study (Killick andMwega, 1989) found that during the period 1971-88, a 1.0 percent increase in import prices wouldhave raised the domestic price level by about 0.21 percent.
1.44 A major factor behind the intensification of inflationary pressures in recent years hasbeen the expansionary stance of monetary policy. A recent econometric study of the link betweeninflation and monetary policy in Kenya found that monetary expansion provides a powerfulexplanation of inflation (Mwega, 1990).4 This study found that for the 1971-88 period, a 1.0percentage point increase in M2 in Kenya was associated (without a time lag) with a 0.25 percentincrease in the price level.
1.45 This result in itself probably cannot tully explain the recent buildup of inflationarypressures. As discussed above, the expansion in M2 in 1988 (7.9 percent) and 1989 (12.9 percent)was not particularly large. Two other factors need to be considered, the effects of lags and the useof a broader definition of money supply. In 1986 there was a marked increase in the growth of M2(32.5 percent). Although there are no studies on the length of transmission lags in Kenya, evidencefor other African countries suggests that these lags could be substantial. For example, a study of sixAfrican countries (Tegene, 1989) found that for five of the six countries, the effects of monetaryexpansion on inflation could be felt for as long as five quarters, and for one coantry the lags wereeven longer.' It is possible, therefore, that the Kenyan economy suffered from a monetary overhangthat was not sterilized, at least throughout 1987 and into 1988.
This result is consistent with other studies of inflation in Kenya such as Kiptui (1989), and Killick and Mwega (1989), allof which find that monetary expansion is among the most important factors in determining the rate of inflation in Kenya.
The study covered Egypt, Ghana, Morocco, Nigeria, Sudan and Tunisia.

1 8 Chapter 1: Economic Growth and Stabilization
Box 1.2The Measurement of Inflation in Kenya
In Kenya, the most frequently used measure of inflation is the percentage change in theNairobi Consumer Price Index (CPI). It is estimated separately for households in the lower incomegroup (KSh 0699 per month), middle income group (KSh 700-2,499), and upper income group (KSh2,500 and above), The Government uses a simple average of the three group indices. The IMFassigns weights of 0.78 for the lower group, 0.19 for the mniddle group, and 0.03 for the uppergroup, to compute a weighted CPI.
As a measure of price changes in Kenya, the CPI has several shortcomings. First, theconsumption basket of the various income groups is based on the Household Budget Survey of1974175 and therefore may not be representative of current consumption patterns in Kenya. Theincome ranges are also outdated. The revised CPI, currently under preparation, will include incomebrackets of KSh 0-1,999 per month for the lower group, KSh 2,000-7,999 per month for the middlegroup, and KSh 8,000 and above per month for the upper group. These revisions are appropriate.
Second, the CPI includes price-controlledl items, many of which are consumer staples.Among them are edible oils and fats, salt, charcoal, maize and maizemeal, rice, sugar, wheat flour,beers and stouts, bread, milk, and tea. Expenditure on these controlled items accounts for over 50percent of the food budget for each of the income groups. Because food accounts for 35-40 percentof each income group's total expenditure, the price controlled commodities can distort the measureof price changes, especially if controlled prices are revised infrequently. A recent report indicatedit can take anywhere from 90 days .o more than a year to obtain approval for price increases andto implement whatever revisions are allowed. With such delays and the steady devaluation of theexchange rate, the CPI may well understate changes in the prices of many items, especially importedones such as edible oils and fats. Price controls have resulted ir periodic shortages of somecontrolled items. In response, merchants have developed various non-price rationing mechanismssuch as queuing, selling items in short supply only to regular or otherwise favored customers, orselling the controlled items only to customers who buy other, often slower-moving, commodities.Unofficial or curbside markets have also emerged, where prices more accurately reflect the scarcityvalue of the controlled items.
Third, the treatment of housing costs is inadequate. The present methodology involves firstcalculating the change in the cost-of-living index excluding rent. It is then assumed that rent mirrorsthe change in the rest of the index. This procedure almost certainly understates the true rate ofinflation in Nairobi, and probably in other major urban centers, because rental housing has been oneof the fastest rising components of urban living costs.
Fourth, the CPI has the obvious disadvantage that it only covers Nairobi. It not only leavesout all rural areas, where about 80 percent of Kenyans live, but also excludes other urban areas.The effect of including other urban and rural areas on the measurement of inflation is uncertain.
Ihe Govermment has indicated it plans to revise the CPI. In addition to correcting thedeficiencies discussed above, there is a need to compute other indices such as a Wholesale PriceIndex or a Producer Price Index.

Chapter 1: Economic Growth and Stabilization 19
1.46 Another factor contributing to the recent bout of inflation is the rapid expansion of creditfrom NBFIs. As pointed out earlier, credit from NBFIs has grown much more rapidly than creditfrom the banking sector during 1988 and 1989. Although credit from NBFIs is likely to be lessinflationary in nature than credit from the banking sector, it nevertheless contributes to higheraggregate demand and hence inflationary pressures (see Box 1.3). In fact, econometric estimatesderived by Killick and Mwega (1989) suggest that the broader measure of money supply (M3), whichincludes the deposi;s of NBFIs, may provide a stronger explanation of inflation in Kenya than anarrower definition of money supply.
Box 1.3NBFIs and the Mloney Supply Target
Still at issue for monetary policy-makers in Kenya is the appropriate measure of moneysupply: MI--the narrow money supply definition, consisting of just currency and demanddeposits; M2--which adds savings and time deposits of the banking system to M 1; or perhaps M3--a broader measure that adds the deposits of NBFIs to M2. Researchers typically track MI, M2or both. M2 is usually considered to be broad enough to include all assets that have the propertiesof money. In Kenya, however, a case can be made for targeting a broader definition of moneysupply that includes the deposits of NBFIs. This is because the assets and liabilities of NBFIs aregenerally similar in nature to those of the commercial banks.
The two major differences between NBFIs and the commercial banks are that the formerare not allowed to accept checking deposits and to engage in foreign exchange transactions,wherea commercial banks can obviously do both. Because NBFIs cannot issues checks againstthe deposits they hold, they have to use the commercial banks as a clearing house. Hence, onaverage, they tend to hold about a quarter to a third of their assets in the form of deposits withcommercial banks. The rest of their assets consist of either Treasury bills (which they arerequired to hold) and loans to customers. Although their lack of checking facilities is likely toslow down somewhat the speed with which NBFIs can create credit, and hence fuel aggregatedemand, the fact that they accept deposits and make advances for purchases of commoditiesimplies that they do finance aggregate demand and hence contribute to inflationary pressures inthe economy.
The External Sector
1.47 In attempting to reduce external imbalances, Kenya has been hampered by adverseinternational prices and a relatively narrow merchandise export base. Following a mini-coffee boom(due to frosts in Brazil) and favorable oil prices in 1986, Kenya's external terms of trade droppedby 24 percent over the 1986-89 period. Kenya's merchandise exports are heavily dependent on fourmajor items-coffee, tea, horticultural products, and refined petroleum products--which togetheraccounted for almost 70 percent of total merchandise exports in 1989. A major bright spot inKenya's external position has been the rapid growth in tourism earnings, which irn 1989 wereestimated to have generated foreign exchange receipts equivalent to more than 40 percent of totalmerchandise exports. There are indications, however, that the spectacular growth in tourismrevenues may be tapering off.

20 Chapter 1: Economic Growth and Stabilization
1.48 Exchange Rate Policy. Until 1982, Kenya essentially followed a fixed exchange ratepolicy. After a 15 percent devaluation against the SDR in December 1982, the Government lhasfollowed a policy of broadly maintaining the real effective exchange rate which is pegged to a basketof currencies. During December 1985 - December 1989 the shilling depreciated by 60 percent interms of the SDR and by 33 percent against the US dollar. The real effecdve exchange rateappreciated occasionally during 1983-85, but has averaged a fairly steady depreciation over the penod1985-89 (30.3 percent). The exchange rate depreciated by 0.3 percent in nominal terms and 3.9percent in real effective terms in 1989.
1.49 The Balance of Payments. Although Kenya's current account deficit widened to 6.9percent of GDP in 1989, the overall balance recorded a surplus of $78 million following two yearsof deficits (Table 1.8). The worsening current account was largely the result of a higher trade deficitdue in part to an 11 percent deterioration in Kenya's external terms of trade. The 1989 trade deficitincreased by 32 percent in dollar terms to reach over $1 billion. For the first time in a decade,merchandise imports were more than double merchandise exports. The higher current account deficitwas more than offset by increased net official inflows in 1989. The overall surplus enabled theGovernment to build up foreign exchange reserves which at end-1989 were equivalent to 2.0 m3)nthsof merchandise imports.
1.50 Although Kenya's non-traditional exports performed relatively well in 1989, earningsfrom major traditional exports fell markedly. Merchandise exports fell by 9.1 percent in dollar termscompared to growth of 11.8 percent in 1988. The downturn in export earnings was mainly the resultof the fall in coffee prices and lower export volumes of petroleum products, as well as, volumedrops for a number of major traditional exports. The latter included: cement (-9 percent), soda ash(-9 percent), hides and skins (42 percent), fluorspar (-17 percent) and horticultural products (-17percent). Both the downturn in petroleum and cement exports are a result of lower regional demand,especially from Uganda. Tea and sisal were the only major exports that recorded higher prices andvolumes. Tea exports increased by 18 percent and sisal by 6 percent in volume terms. Prices inshilling terms increased by 24 percent for tea and 28 percent for sisal. The increase in the value oftea exports more than offset the drop in coffee earnings in 1989. Owing to the large buildup instocks, the volume of coffee exports increased by 8 percent despite a 23 percent drop in the shillingprice. Non-traditional exports, which in 1988 accounted for 18 percent of total merchandise exportsincreased by 8 percent in dollar terms in 1989. Export items recording high growth included leatherand leather products, iron and steel, and glassware.
1.51 Merchandise imports increased by 8.9 percent in dollar terms and 5.0 percent in volumeterms in 1989, somewhat slower than the growth rate of 10.8 percent in value and 12.3 percent involume recorded in 1988. Although all major imports (except resins and plastic materials, andagricultural machinery) increased in 1989, imports of petroleum and petroleum products had a majorimpact on the balance of trade, increasing by 21 percent in dollar terms. Other import itemsrecording strong growth in 1989 included industrial machinery, iron and steel, motor vehicles andchassis, pharmaceuticals, and fertilizers.
1.52 Kenya traditionally enjoys a surplus in its services account, in large measure due to thestrength of its tourism industry and the transportation and trans-shipment services it provides toneighboring countries. In 1988, however, the services balance turned negative largely as a result ofa large increase in outflows of investment income. Tourism revenues, which in 1987 overtook coffee

Chapter 1: Economic Growth and Stabilization 21
Table 1.8Summary of Balance of Payments, 1985-89
(In Millions of US Dollars)
1985 1986 1987 1988 1989
Trade Balance -331 -285 -713 -782 -1033Exports 942 1171 907 1014 922Imports 1273 1456 1620 1795 1954
Services (net) 43 39 _ -15 86
Transfers (net) 192 207 214 345 381
Current Account Balance -97 -39 -493 -452 -565
Capital Account -18 129 367 376 643
Long-teim (net) -51 104 317 313 607Short-term (net) 46 21 56 53 52Errors and omissions -12 3 -6 10 -16
OVERALL BALANCE -115 90 -127 -76 78
Monetaa Movements: 115 -90 127 76 -78Change in reserves -23 -25 1SI -0 -111IMF transactions 128 -67 -62 123 20Other 9 2 38 13 12
Memo Items:Import cover (months GNES) 3.4 3.1 1.9 1.9 2.0Current account deficitas % of GDP: incl. grants 1.6 0.5 6.2 5.4 6.9
excl. grants 3.4 2.6 8.1 8.5 10.3
Source: S&adsical Appendix, Table 3.2.
as Kenya's main foreign exchange earner, increased by 6.7 percent in 1989, a marked slowdowncompared to the rapid growth experienced over the previous five years. Tourism revenues averagedannual growth of over 17 percent in dollar terms over the period 1983-88. There is evidence thatthe growth in tourism may be levelling off, partly in response to the security problems experiencedin late 1988 and 1989. International arrivals, which reached 730,000 persons in 1989, grew by only5.0 percent, compared to average annual growth of 17.2 percent over the period 1983-88. Averagelength of stay also recorded a sharp drop in 1989 to 14.4 days from a roughly stable 16.0 days over

22 Chapter 1: Economic Growth and Stabilization
the preceding five years. Both official and private transfers increased by about 30 percent in 1989.Official transfers, mainly bilateral grants to the Government, peaked at $294 million in 1989.
1.53 The highei current account deficit in 1989 was financed largely through long-termborrowing by the Govermnent and parastatals. Over the past three years, increased aid flows,especially quick-disbursing assistance to support the Government's adjustment program, have playeda major role in financing Kenya's current account deficit. Disbursements on government long-termborrowing increased by 31 percent to reach $377 million in 1989, while disbursements to parastatalsincreased more than twofold to reach $162 million. Private long-term itiflows also increased sharplyfrom a negative $19 million in 1988 to $69 million in 1989 (Statistical Appendix Table 3.2). Grossofficial reserves increased by $106 million in 1989 and stood at $403 million, equivalent to 2.0months of imports of goods and nonfactor services.
1.54 External Debt. Kenya's total stock of external debt outstanding and disbursed at the endof 1989 (including IMF) stood at $5.7 billion, almost unchanged from the 1988 level (Table 1.9).Muldlateral and bilateral debt accounted for 38.2 percent and 20.9 percent, respectively, of totaldebt. As a result of debt forgiveness from a number of bilateral donors, Kenya's debt service hasfallen from $696 million in 1986 to $594 million in 1989. The total debt service ratio has declinedover the past two years, from 38.7 percent in 1987 to 29.6 percent in 1989. In additon, averageterms on new commitments have softened considerably over the past five years. The average interest
Table 1.9External Debt, 1985-89
(In Millions of US Dollars)
1985 1986 1987 1988 1989
Debt Outstanding and Disbursed 4,308.6 4,833.9 5,786.9 5,730.6 5,689.0Mult!1qt;ral 1,350.4 1,638.4 1,996.0 1,953.4 2,171.2Bilateral 1,108.7 1,333.0 1,566.0 1,501.3 1,189.1IMF 521.8 459.8 401.3 455.4 415.4Other' 341.4 565.9 718.0 629.2 641.4Non-guaranteed private 511.3 459.0 496.4 627.4 632.0Short-term 475.0 377.8 608.3 563.9 641.0
Total Debt Service 637.4 695.9 690.6 635.1 594.0Amortization 420.4 456.3 433.0 399.5 372.4
Interest 217.0 239.6 257.6 235.6 221.6
Total Debt Service Ratio (%) 3 38.8 35.6 38.7 32.9 29.6
t Supplesa cfedits, financial institutions, and export credits.2 Towl debt service as a share of expons of goods and services.
Source: Debtor Reporrfng SystenL

Chapter 1: Economic Growth and Stabilization 23
rate on new comnutments was 2.7 percent in 1989 (6.4 percent in 1985), average maturity was 31.2years (22.2 years in 1985), the grace period was 7.8 years (6.5 years in 1985), and the grant elementwas 60.3 percent (30.2 percent in 1985). As a result of debt forgiveness and softer terms, Kenyafaces a high but manageable external debt burden.
Incentive Indicators
1.55 Kenya's economy remains relatively free of major distortions in the structure ofincendves, with the exception of the structure of industrial protecdon. In addition, the lack ofprogress in reducing inflation during the past two years is a source of concern. Exchange rate andinterest policies have been appropriate. The exchange rate has devalued in real effecdve terms andthe Government has made substantial progress in liberalizing the financial sector and maintainingsubstandally positive real interest rates. The Governmnent has traditionally pursued an active wagepolicy in Kenya. Wage policy was initially accommodating, allowing wages to rise steadily duringthe late 1970s and early 1980s. In 1982, however, the Government began to recognize that for its
Table 1.10Key Incentive Indicators, 1983-89
(Percentages and Indices, 1980= 100)
1983 1984 1985 1986 1987 1988 1989
Exchange Rate (% change)Nominal (KSh/US$) -7.9 -12.7 -3.2 2.0 -0.3 -11.2 -13.9Real Effective -5.2 7.1 -1.4 -13.3 -9.6 -7.5 -4.3
Real Interest Rates'Savings -2.0 2.0 0.3 5.4 3.9 -0.7 2.4Lending 0.5 5.0 3.3 8.4 6.9 4.3 4.9
Index of Real Wages 2Private sector 81.6 83.5 82.5 84.6 87.4 91.6 90.2Public sector 86.4 85.3 84.1 86.0 83.4 34.5 86.8
Inflation 'Nairobi CPI index 157.5 171.8 190.1 200.8 215.1 238.4 263.4Annual increas 14.5 9.0 10.7 5.6 7.1 10.7 10.6
Commrclal banst' savings rate and maximum rates on loans for leos than threeyears. adjusted by the Nairobi CP[.Nomind avergc wag earminp per employee adjusted by Nairobi CPI.Average Nairobi CPI fbr all income groups.
Sowrce; SUsdcal Appendix, Tabks 6.2, 6.3, 11.I and 11.4.

24 Chapter 1: Economic Growth and Stabilization
stabilization efforts to succeed, wage levels would need to be adjusted. By relying on the system ofwage guidelines and minimum wages, the Government succeeded in reducing real wages in 1983 andcontaining their growth thereafter. Although fluctuating over the period, in 1989 average real wagesin the private and public sector were 90 percent and 87 percent, respectively, of the levels in 1980.As discussed above, inflation remains high, but the Government has made considerable progress inreducing price controls in the economy.
Short-Term Prospects
1.56 The Kenyan economy faces difficult and uncertain short-term prospects, in largemeasure the result of adverse external conditions. Recent developments in the Gulf and their impacton world oil prices will severely strain Kenya's balance of payments and budget. Although the short-term outlook for oil prices rem3ins uncertain, Kenya will face increased financing needs during theremainder of 1990, 1991 and 1992 to meet its oil import bill. The Government's decision to passon international oil price increases is appropriate, but even with lower oil import volumes in 1991and no grc,.vth thereafter, Kenya is likely to face additional financing needs of at least $350 millionover 1991-92. Higher oil prices are also likely to dampen economic growth in 1990 and 1991 andplace additional pressure on government spending. The combination of an economic slowdown, withits attendant negative effects on government revenues, and higher expenditure pressures will makeit difficult to meet the Government's budget deficit targets. Moreover, efforts to reduce importgrowth will need to focus on consumer goods, which tend to have higher import duties, furtherreducing government revenues.

Chapter 1: Economic Growth and Stabilization 25
ANNEX L.A
Measurement of Inflation in Kenya: Methodological Issues
L. The Government relies on the Nairobi Consumer Price Index (CPI) to measure domesticinflation in Kenya. The CPI recorded double-digit inflation in 1988 and 1989. This disappointingoutcome comes at a time of growing concern over the accuracy of this index among a cross-sectionof economic actors (consumers, businessmen, bankers, etc) in Kenya. The purpose of this note isto evaluate the methodology underlying the computation of the CPI and to identify possible sourcesof biases and inaccuracies.
Current Methodolgy
ii. The Nairobi CPI is a typical Laspeyre's cost-of-living index. To calculate the CPI,relative price changes in each of the commodities included in the index are estimated first and theseare then weighted appropriately. Hence, the accuracy of the index depends on two sets of factors:those relating to the accuracy of the base year expenditure weights, and those relating to the accuracyof the measurement of the commodity price changes over time.
iii. The Nairobi CPI is calculated separately for three income groups: lower, middle, andupper. These three indices are then averaged to obtain the index for Nairobi as a whole. The typicalconsumption basket for each income group is composed of different commodities. The expenditureweights required for the construction of the CPI are derived from detaiis of expenditure patternsobtained through a household survey of Nairobi residents. This survey is also used to determine theincome ranges that define the three income groups for which the indices are calculated.
Potential Biases and Inaccuracies
iv. Outdated Expenditure Weights. The CPIs were first introduced in August 1971. Theexpenditure weights used then were based on the results of a 1969 household survey for Nairobi.During the early 1970s, it was felt that relative prict j of various commoditdes had changed markedly,especially after the oil shock in 1973, and that these changes would have led to significant alterationsin the partern of expenditure. As a result, a Household Budget Survey (HBS) was conducted inNairobi in 1974/75. The weights and income groups were then updated on the basis of this survey,and are still being used at the present time, some 16 years later. Given the changes in incomes andreladve prices that have taken place in the Kenyan economy during this period, these weights are notlikely to be very representaive of current expenditure patterns, thereby reducing the reliability of theindex.
v. The 1984 Economic Survey indicates that an HBS was undertaken by the Central Bureauof Statistics (CBS) in 1982 covering both rural and urban households. It anticipated that the analysisof this survey would be completed by the end of 1984, and that a new index base would be prepared,bringing up to date the typical goods and services basket and revising the classificadon of incomegroups. However, there have been considerable delays in processing the results of the 1982 HBS

26 Chapter 1: Economic Growth and Stabilization
so that the commodity weights and the definitions of the income groups used in the construction ofthe CPI are still based on the 1974 survey. The Government is preparing a new CPI which is basedon revised expenditure weights obtained from the 1982 HBS. Given the magnitude of the changesthat are taking place in the Kenyan economy, these weights will soon need to be updated.
vi. Given the importance of having an accurate measure of inflation, it is vital that theGovernment carry out these household expenditure surveys fairly frequently and processes them asspeedily as possible (say, within one year). Lengthy delays defeat the very purpose for which these(reladvely expensive) surveys are undertaken, namely to keep the expenditure weights current andrepresentative.
vii. Income Weights. As stated above, CBS constructs separate CPIs for three incomegroups. These groups are defined as follows:
Lower Income Group -- households earning KSh 0 to 699 per month;Middle Income Group -- households earning KSh 700 to 2,499 per month; andUpper Income Group -- households earning KSh 2,500 and above per month.
To construct a CPI for Nairobi as a whole, the indices for these three groups need to be weightedappropriately. The appropriate weights would be the share of each group in total expenditure butwhen the Government refers to the average CPI, it simply takes an unweighted average of the threegroup indices. This is not appropriate, given that the three groups are far from equally representedin the economy. For example, IMF uses an atternative set of weights: 0.78 for the lower incomegroup; 0.19 for the middle income group; and 0.3 for the upper income group.
viii. Does the use of the two alternative sets of weights make much difference to the measuredrate of inflation? The answer is yes, since the three CPIs tend to differ significantly. Table A.1reports values for the three group-specific CPIs and for two alternative calculations of the averageCPI for the period 1985-89. The first is calculated using a simple arithmetic mean of the three CPIs;the second is calculated using the weights used by the IMF. The table indicates that although thetwo indices were fairly close, the difference between the two can be significant, as for example in1985 when the rate calculated by using an arithmetic mean measured inflation at 10.7 percentwhereas the rate obtained by using the IMF weights was 12.8 percent.
Table A.1Comparison of CPIs Using Alternative Weights, 1985-89
(Percentage Change, Annual Averages)
-Income groups-Lower Middle Upper Mean IMF Weights Difference
1985 13.0 11.1 8.0 10.7 12.8 +2.11986 4.0 7.7 5.3 5.7 4.7 -1.01987 5.1 8.3 7.8 7.1 5.8 -1.31988 8.3 12.0 11.8 10.7 9.1 -1.61989 9.8 10.9 10.9 10.5 10.0 -0.5
Soes: Satulca Appendx, Table 11.2; and staff estimates.
Chapter 1: Economic Growth and Stabilization 27
ix. A related issue is the appropriateness of the income brackets for the three income groups.The brackets currently used are clearly outdated. These are now being revised upwards to take intoaccount changes in inflation and real incomes over the period. The income brackets for the revisedCPI will be:
Lower Income Group -- households earning KSh 0 to 1,999 per month;Middle Income Group -- households earning KSh 2,000 to 7,999 per month;Upper Income Group - households earning KSh 8,000 and above per month.
x. Price-Controlled Itens. Price controls in Kenya are implemented either under theGeneral Order of the Restrictive Trade Practices, Monopolies and Price Control Act (RMPA) orunder Specific Price Control Orders. Currently, 18 commodities or commodity groups are controlledunder the General Order. These are typically intermediate products such as grain and cereal bags,chemicals, and iron sheets, and are not likely to figure directly in the average consumption basket.The 11 commodities controlled under Specific Orders, in contrast, are consumer staples and have ahigh weight in consumption baskets. The following items are currently subjected to price controlsunder Specific Orders: edible oils and fats; salt; charcoal; maize and maizemeal; rice; sugar; wheatflour; beers and stouts; bread; milk; and tea. The weight of price-controlled food items ranges from25 percent in the upper-income CPI to 44 percent for low income.
xi. The CBS reports that it collects data on prices by actually purchasing some of thecommodities included in the indices from various retail outlets. It reports that it purchases samplesof about 50 per cent of all goods included in the Lower Income Index, about 25 per cent of thoseincluded in the Middle Income Index, and about 20 per cent of those in the Upper Income Index.This procedure is also adopted for the price-controlled commodities. Despite this, the inclusion ofthese items is likely to create two kinds of inaccuracies in the measurement of thc CPI.
xii. The first inaccuracy arises from the infrequency of the revisions of the prices ofcontrolled commodities. Manufacturers and traders of these price-controlled items, when faced withcost increases, have to apply to the authorities to revise the prices they can charge. Because of thelengthy procedures involved, there can be inordinate delays in obtaining approvals. According toa recent study commissioned by the Kenya Association of Manufacturers (KAM, 1989), "it seldomtakes less than 90 days and sometimes even takes years between filing a request for approval andobtaining authority to proceed if the response is positive" (p. 53). This problem arises because thereis no legal requirement that the Government address the issue within a certain time limit. Lengthydelays, if widespread, would suggest that the CPI does not accurately measure underlying inflationarypressures in the economy. This would be particularly true for those items, such as edible oils andfats, rice, sugar, and wheat (for wheat flour) that are pardally or fully imported. Given the steadydevaluation in the Kenya shilling in recent years, the cost of importing these items is likely to havebeen rising rather steeply. If their prices, however, are only adjusted after lengthy lags, then thereliability of the CPI as a measure of the true rate of inflation is likely to be reduced.
xiii. Including price-controlled items in the CPI leads to a second related problem. For someof the controlled commodities, the price controls have resulted in periodic shortages. This has hadtwo consequences. First, in the regular shops, it has led to the development of various non-pricemechanisms to ration the scarce goods such as queuing, selling of these goods only to regular orotherwise favored customers, or tie-ins (selling the controlled items only to customers who alsopurchase other, slow-moving commodities). Second, it has also led to the development of unofficial

28 Chapter 1: Economic Growth and Stabilization
or curbside markets where prices more accurately reflect the scarcity value of these products, andcan be as much as twice official prices. Some of these extra costs to consumers, such as the costsof the queuing time involved in the purchase of scarce commodities, are difficult to quantify andhence cannot be measured accurately. Others, however, such as those incurred while purchasingscarce commodities at curbside prices, could perhaps be more easily measured and incorporated inthe actual price surveys of CBS.
xiv. Housing Costs. The cost of ho.,. ig is a major component of household expendituresand typically accounts for between 20-25 percent of total expenditures. Hence, to measure inflationaccurately, it is important to get a reliable measure of the increases in housing rental costs. The CBSconducts annual rent surveys in Nairobi, but because of problems with the quality of the datacollected, it does not actually use the data to measure changes in housing costs. Instead, it calculatesa cost-of-living index that excludes rent, and then assumes that the cost of housing increases at thesame rate as the rest of the index. This procedure is likely to distort the measurement of inflationin Nairobi. In the current revision of the CPI, an attempt will be made by the CBS to improve thequality of the rent data collected and to incorporate this information in the construction of the newCPI.
xv. Limited Coverage. Although the CPI is used to measure inflation for the country as awhole, it is based on the expenditure patterns of, and the price increases faced by, Nairobi residentsonly. Residents of Nairobi, however, make up less than one tenth of the total Kenyan population.While the cost of living increases in Nairobi might be indicative of those faced in other urban areas,they are less likely to reflect those faced by rural Kenyans who make up about 80 per cent of theKenyan population. Therefore, it is important to widen the coverage of the data collected in orderto get a more accurate measure of the rate of inflation prevailing in Kenya.
xvi. The CBS actually computes CPIs for several rural and urban populations. During the1970s and early 1980s the Economic Survey (ES) reported the value of an aggregate CPI for ruralareas. The 1979 ES, for example, states that "detailed studies in the rural areas are now beingundertaken and it is expected that by the end of 1979 prices for all commodity items will be collectedregularly from rural markets" (p. 60). The rationale for collecting data from rural areas and fromsmaller towns was that "the weighting of groups of commodities and the rises in prices of thesegroups varies between rural areas and the smaller towns and between the towns and Nairobi, so thatoverall price rises can vary quite markedly" (ES, 1979, p. 60). The early 1980s ESs all containreports to the effect that 'methods of price collection in rural areas have been strengthened and pricesare collected monthly from the rural markets" (for example, see: ES, 1980, p. 66). These Surveysalso reported that price rises in the rural areas frequently tended to differ significantly from thosein urban areas. For example, the ES of 1982 reports that for the period 1978-81, "there appears tobe a tendency for somewhat more inflation in the rural areas than in the towns" (p. 52). The ruralinflation rate for this period was estimated to be 12.5 percent annually, whereas that for Nairobi wasonly 10.6 percent. Over the 1980s, the pattern is mixed. During 1982-89 consumer inflation inrural areas was slightly higher than in Nairobi - an annual average of 10.1 percent compared to 9.7percent (Statistical Appendix, Table 11.1). Over the past four years (1985-89), however, inflationin Nairobi has been considerably higher than rural areas - 8.5 percent annually compared to 5.9percent. This indicates that the prevalent practice of excluding the rural inflation rate from thecalculations of the overall inflation rate in Kenya might introduce some serious inaccuracies in theestimates.

Chapter 1: Economic Growth and Stabilization 29
xvii. The CBS also collects data for various other urban centers such as Mombasa, Kisumuand Nakuru. Despite the fact that the it has been calculating CPIs for various urban and rural areas(it collects data on a quarterly basis for all provinces except North-Eastern) for several years now,no attempt has been made to incorporate these CPIs into a comprehensive measure of inflation inKenya. In fact, from the mid-1980s onward, the estimates for changes in the rural CPI are no longerpresented in the ES. These data, however, are still collected and are available on request from theGovernment. Given that the CBS has been using scarce resources to collect the required data fromvarious rural and urban areas, it would be appropriate to incorporate these data into an index thatis more representative of Kenya as a whole.
Other Problems
xviii. There are several alternative price indices that are readily available in Kenya and whichcould easily be used to supplement the information provided by the CPI. For example, from theNational Accounts data provided in current and constant prices, it is possible to compute implicitprice deflators for several of the major categories of expenditures. Thus, it is possible to calculatea series for the GDP deflator, the investment price index, the government price index, the exportprice index, the import price index, and so on. All of these indicators provide useful priceinformation and are worth monitoring and analyzing. In addition, these implicit price deflators couldalso be used to construct other price indices of interest such as ones for traded and non-tradedcommodities. It is also possible to compute an implicit consumer price deflator from the NationalAccounts data and to use this information to confirm the reliability of the information provided bythe Nairobi CPI. At the same time, there is a need to examine how these various deflators arecalculated. Table A.2 shows considerable variability among the various deflators.
Table A.2Implicit Price Deflators. 1985-89
(Percentage Changes)
1985 1986 1987 1988 1989Deflator
GNP 8.0 4.7 8.1 8.9 4.7GDP at market prices 8.3 8.8 4.8 8.0 9.1Private consumption 8.2 3.0 5.7 8.9 9.1Public consumption 17.0 13.9 11.5 -3.1 20.5Investment 10.3 16.8 6.7 8.7 7.7Exports 2.1 8.4 -8.6 13.7 9.0Imports 16.1 -2.9 1.6 8.7 15.4
Soare: S&affesdmues.
xix. In addition to utilizing the data on implicit deflators that are already available, it wouldbe useful to calculate and publish one or more additional price indices that can provide extremely

30 Chapter 1: Economic Growth and Stabilization
useful information, such as a Producer Price Index (PPI) and a Wholesale Price Index (WPI). A PPImeasures price changes in a basket of goods typically purchased by producers. Thus, it is a measureof the price increases in intermediate inputs. Together with the CPI, it can provide a useful indicatorof changes in the costs of production, and hence in the internadional competitiveness, of an economy.In many countries it is also a leading indicator of changes in the CPI, and can provide valuable earlywarnings on the build-up of inflationary pressures in the economy. The PPI is also useful as a guideto supply-side factors fueling inflation. For example, the typical basket of goods included in the PPI
has items such as construction materials, chemicals, petroleum products, etc. Increases in theseprices will ultimately result in increases in the prices of consumer items. By examining changes inthe PPI, it is possible to obtain a better understaiding of some of the factors underlying the observedchanges in the CPI.
xx. The WPI can be another useful indicator of trends in prices. It captures the priceincreases of commodities purchased by consumers at the wholesale rather thzn at the retail level.Hence, it differs from the CPI in that the services sectors, such as transportation and marketing, playa smaller role in it. The WPI is also a leading indicator of consumer inflation, and hence providesa valuable early signal of price trends in the economy.
Box A.1Executive Cost of Living Indices
A number of private consulting firms based in Nairobi have recently started computing anExecutive Cost of Living Index (ECOLI). This index is designed to reflect the spending pattemof executives. It is usually based on a small sample (about 10 to 20 respondents) of the firm's ownexecutives. The intention is to provide a better indication of how executives are affected by risingprices in Kenya. The information generated by these indices can be a valuable guide for firms,especially fbreign ones, in formulating their executive remuneration and cost-of-living adjustmentpackages.
These indices typically measure a much higher rate of inflation in Kenya as compared withthe official Nairobi CPI computed by the CBS. For example, according to one of these indices,the 1988 'without housing' average annual rate of inflation was 9.5 percent and the 'with housing'rate was 17.5 percent. For the same period, the official Nairobi CPI (including rent) measures arate of inflation of 10.7 percent. Even the official upper income CPI for 1988 records an inflationrate of only 11.8 percent.
It should be noted, however, that there is no reason why the rate of inflation as measuredby the Nairobi CPI should even approximate that measured by these ECOLIs. The expenditureweights used in the construction of the ECOLIs are based on consumption patterns that are notrepresentative of even the typical upper income Kenyan household included in the Nairobi CPI,let alone of the remainder of the sample. For purposes of the Nairobi CPI, the typical upperincome Kenyan is defined as one earning KShs 2,500 or more per month. The executives includedin the ECOLI typically spend between 10 to 40 times as much.

Deepening Structural Adjustment
2.01 Following successful stabilization efforts and some initial steps toward structural adjustmentduring the early 1980s, Kenya faced deteriorating economic conditions in 1985-86. Although theeconomy had stabilized by 1984, much of the initial progress in structural reforms was notmaintained or it was reversed. The combination of renewed macroeconomic imbalances and sluggisheconomic growth prompted the Government to reexamine the case for structural adjustment in 1986.Rather than addressing structural constraints on a broad front, as it had attempted in the early 1980s,the Government opted for a sectoral approach to structural adjustment. The approach followed bythe Government has been gradual and phased, largely dictated by a desire to minimize adjustmentcosts as well as the need to ensure adequate preparation for proposed reforms, developing internalconsensus to sustain the process and avoid straining the Government's implementation capacity.
2.02 The Government's structural adjustment efforts have focused on developing andimplementing sector reform programs in agriculture (initiated in early 1987), industry and trade(1988) and the financial sector (1989). At the start of this process, the Government faced anextensive policy reform agenda, but assigned immediate priority to renewing economic growth, whilerecognizing that reforms would need to be phased and deepened over the longer term to make highgrowth sustainable. Although the depth and coverage of reforms, as well as implementationexperience, have varied in each sector, they have a number of common objectives: (i) enhancing therole of markets and the private sector; (ii) reforming incentives to encourage growth, investment andexports; (iii) rationalizing public expenditures and restructuring selected parastatals; and (iv) reducingreguladons and controls on economic activity. The Government has made considerable progress inimplementing its adjustment programs, which has played a major role in Kenya's recent economicrecovery. This Chapter provides a detailed analysis of progress achieved, recent sectoraldevelopments, and the remaining medium-term agenda for fiuther deepening adjustment in these threekey sectors. Chapter 3 explores the need for extending adjustment to other areas in order toaccelerate growth.
A. Reforming Agriculture
Structure and Reform Objectives
2.03 Kenya's population is predominantly rural (about 80 percent) and the economy is heavilydependent on agriculture. Although agriculture's share of total output is declining, as the economyindustrializes and services grow in importance, agriculture will still remain the single most important

32 Chapter 2: Deepening Structural Adjustment
sector in terms of contribution to GDP (about 30 percent in 1989), employment, and merchandiseexports. Through strong backward and forward linkages, agriculture has been an engine of growthfor the services and industrial sectors. Since Independence, smallholder agriculture has been thedominant mode of production in terms of output, employment, and land area cultivated. This trendis partly due to the distribudon of land from European settlers to native Kenyans followingIndependence and to the rapidly rising population which has led to increasing land fragmentation.Of the 2.7 million smaliholders, about 80 percent have less than 2 hectares, and 30 percent of farmholdings are managed by women. Most smallholders combine subsistence food crop and livestockproduction (primarily maize, milk and meat) with varying amounts of cash crops, especially duringyears of favorable weather.
2.04 Crops account for 70 percent of agricultural sector production, livestock 25 percent, andforestry and fisheries 5 percent. These shares have changed little during the 1980s. About 85percent of cultivated area is in food crops. Maize is the major food commodity; it accounts for about22 percent of the total value of agricultural production, and 40 percent of total cropped area. Thevast majority of Kenya's agricultural production takes place in about 20 percent of the country's totalland, located in the productive medium- and high-potential areas. The smaller and more prosperousestate sector is involved mostly in Kenya's major export crops, coffee and tea, contributing about 35percent and 55 percent of total production, respectively, with the remainder produced largely bysmallholders. In districts with rising population densities, there is some evidence that farmers areintensifying production toward higher-value commodities (especially horticulture, tea and dairying)or being pushed to migrate to the less productive and environmentally fragile arid and semi-arid lands(ASALs).
2.05 The performance of agriculture during the quarter century since Independence has beenconsiderably better than the average for Sub-Saharan Africa. Kenya's rapid economic growth duringthe first decade following Independence was due, in no small measure, to the strong growth of theagricultural sector, which expanded at the impressive rate of 4.7 percent annually. Agriculturalgrowth, however, decelerated to an average 3.7 percent during the 1970s, and 3 percent over the1980s. Thus, agricultural growth during the 1980s has not been sufficient to keep up with Kenya'shigh population growth rate which may have reached close to 4 percent during the late 1980s.Although reliable data are not available, the number of rural households with insufficient incometo secure basic food needs has almost certainly increased during the 1980s. These average growthtrends for the 1980s, however, mask two quite distinct periods, both in terms of agriculturalperformance and Government policies toward the sector. Since 1986, agricultural growth hasincreased somewhat, averaging 4.1 percent over 1986-89, compared to average growth of 2.5 percentover 198&85. The latter period, however, includes one year of severe drought (1984).6 Excludingthe drought year, the underlying agricultural growth trend during the first half of the 1980s was 3.7percent.
2.06 Although adverse weather conditions contributed to poor agricultural performance duringthe late 1970s and early 1980s, by the mid 1980s it had become clear that the factors that hadcontributed to rapid growth (especially area expansion) had run their course, and that future growthwould have to rely overwhelmingly on improved yields, especially in the smallholder sector. Anumber of structural problems, however, constrained the shift from expansion to intensification and
Kenya suffcred droughts of varying severity in 1974, 1979. 1980, and 1984.

Chapter 2: Deepening Structural Adjustment 33
hampered future growth prospects. These included: (i) stagnation in the use of key inputs, especiallyferdlizers; (ii) inadequate producdon incentives; (iii) falling agricultural investment, both public andprivate; and (iv) inefficiencies in the delivery of essential agricultural services (extension, research,credit, and marketing) due to weaknesses in government and parastatal institudons. In light of theseproblems and the need to accelerate agricultural growth, in 1986 the Government began implementingthe first phase of an agricultural adjustment program, with the support of IDA and a number ofdonors.
2.07 The Government's 1986 Sessional Paper articulated a bold strategy for long-term economicgrowth, and provided the framework for the f;rst phase of the agricultural adjustment program(Republic of Kenya, 1986). The Sessional Paper placed agricultural growth and rural prosperity atthe heart of a strategy to rekindle economic growth and create productive employment. In line withthis strategy, the agricultural program aimed to accelerate growth, and support fiscal stabilizadon.To achieve these objecdves the program focused on three inter-related strategies: (i) intensifyingproducdon through improved supplies of key inputs (emphasizing fertilizers); (ii) enhancing producerincentives and market dereguladon; and (iii) improving the allocation and efficiency of publicinvestment and expenditures in agriculture, including inidal steps to formulate and implement reformsof a number of agricultural parastatals. Of the steps that the Government planned to take, acdonsinvolving fertilizers, maize rnarketing, and rationalizadon of public expenditures were consideredparticularly important.
2.08 Fertilizers. The major goal under the program was to increase the use of ferdlizers,especially by improving fertilizer pricing, import procedures and distribution. The main supplyconstraints were related to excessive government controls which limited the role of the private sectorin the ferdlizer distribudon system. Specific concerns were: inappropriate pricing levels andstructure, delayed pricing announcements, inadequate distribution margins and constrainedavailability; restrictive and arbitrary allocation of fertilizers and foreign exchange licenses for itsimportation; lack of coordination of ferdlizer aid; and the inadequacy of location-specific andprofitable fertilizer packages that could be recommended at the farm level.
2.09 The reform program has sought to gradually relax government controls and encourage theprivate sector to increase the supply of fertilizers. Measures taken include: adoption of an improvedpricing formula for domestic marketing of ferdlizers; increasing the number of major privateimporters and distributors (from about 15 in 1985 to 20 in 1989); introduction of smaller ferdlizerpackages (25 kg and 10 kg, in addidon to the 50 kg bags), which has enabled more smallholders topurchase fertilizer; and Government formulation and adoption of a fertilizer policy paper whichprovides an appropriate framework for further reform in the sector. In January 1990, theGovernment went further by fully decontrolling ferdlizer prices in the domestic market, in line withthe objectives in the ferdlizer policy paper.
2.10 Despite progress in ferdlizer reform, the results have been disappoindng. Table 2.1, showsthat average fertilizer availability and usage has actually fallen. Although usage increased by 20percent in 1988/89 it fell by 23 percent in 1989/90. Over the period covered by the reform program(1987-90) fertilizer usage has increased on average by only 0.7 percent. It is estimated that toachieve sustained agricultural growth of over 4 percent annually, fertilizer consumption of the rightfertilizer types should increase at an aggregate rate of about 11 percent per year. Although it is too

34 Chapter 2: Deepening Structural Adjustment
Table 2.1Fertilizer Availability and Usage, 1980/81 - 1989/90
(In Thousand Metric Tons, and Percentages)
Crop Stocks Stocks Estinated Annual %Year Forward Imports AvatL-ble Carried Usage Change
1980/81 40.2 129.7 169.8 40.7 129.1 ..1981/82 40.7 206.7 247.4 110.9 136.4 5.61982183 110.9 129.6 240.5 97.7 142.8 4.71983/84 97.7 120.0 219.7 19.2 198.5 39.01984/85 19.2 184.4 203.6 28.3 175.3 -11.71985/86 28.3 345.1 373.4 101.8 271.6 54.91986/87 101.8 230.1 331.9 104.8 227.1 -16.41987/88 105.3 225.3 330.3 92.4 237.9 4.71988/89 92.4 213.1 405.5 120.7 284.8 19.71989/90 120.7 195.6 316.3 97.3 219.0 -23.1
Estinated usage during 1984/S5 and 1985186 was greatly affected by the 1984 drought and the subsequent recovery.
Souerce: Ministry of Agriculture
early to fully assess the impact of fertilizer price decontrol, the sharp fall in availability and usage'- 1990 is worrying. It is important to note that this fall is not the result of price decontrol; ratherthe perverse effect reflects underlying structural and institutional constraints in the fertilizer subsector.
2.11 The reasons for the sharp fall in fertilizer consumption in 1989-90 are not entirely clear,especially given price decontrol, a 20-25 percent reducdon in retail prices and normal weather. Thefollowing factors, however, appear to have influenced fertilizer use: (i) during the first half of1989-90 the Government delayed the announcement of maximum retail prices for different fertilizers,causing uncertainty and a decline in fertilizer imports; (ii) in the second half of 1989-90, soon afterprice decontrol, the Kenya Grain Growers Cooperative Union (KGGCU), which controls 45 percentof the national fertilizer market, reduced prices by 24 percent, creating considerable uncertaintyamong retailers and importers; (iii) the coffee sector, which is the largest fertilizer consumer,experienced exceptional problems, both domestically (the presidential probe and delayed payments)and in the world market (depressed coffee prices), leading to sharply reduced fertilizer demand;(iv) continuing problems with the allocation system for commercial ferdlizer imports; and (v) a
reported diesel shortage which affected land preparation and hence fertilizer consumption.
2.12 Fertilizer price decontrol has had a positive impact at the retailer level. Retailers now havethe flexibility to set prices for their products and as a result there is a growing interest in markedngfertilizers, particularly in areas where retailers do not have to compete directly with KGGCU. Sinceit is unlikely that KGGCU will be able to maintain its lower pricing structure, it will be subjectedto increased competition once its prices rise, which is expected to lead to increased availability tolarger numbers of smallholders.

Chapter 2: Deepening Structural Adjustment 35
2.13 In addition to resolving these marketing problems, reform efforts will need to focus on anumber of areas. First, there has been insufficient transparency in, and application of, thc criteriafor allocating in-kind fertilizer aid (about 50 percent of annual requirements over the past four years),fertilizer quotas for commercial imports, and the granting of import and foreign exchange licenses.Comm.ercial fertilizer imports need to be liberalized to create a supportive environment for theprivate fertilizer trade. Second, the current importation system has relatively high costs, in partdue to e lack of transparency but also due to the relatively small size of fertilizer shipments.Third, there is a need to develop a comprehensive information system on demand and supply offertilizers in various parts of the country. Fourth, to increase fertilizer usage a number of demandconstrairts need to be removed such as speeding up payments to farmers, and improving researchard extension programs to promote fertilizer usage (including the development of soil testingfacilities).
2.14 Producer Incentives. Prior to the agricultural adjustment program, the Government hadalready started implementing pricing reforms for most commodities. The objective under theagriculture program was to sustain and improve pricing reforms, emphasizing timeliness of paymentsand the phased deregulation of markets. In particular, the National Cereals and Produce Board(NCPB) was incurring substantial losses and debts because of its inefficient operations and excessivecontrol of the maize market, an issue which the Government was prepared to address followingrecovery from the 1984 drought.
2.15 Over the period 1986-89, producer prices for the major domestically consumedcommodities were increased consistently (Table 2.2). Gazetted prices for maize,milk, and cotton,however, have not kept up with inflation. Given the recent emerging production surpluses in maizeand milk, there is now a need to introduce greater flexibility in their pricing systems in order toencourage greater reliance on market-based prices and traders. The level of producer prices is onlyone factor affecting farmer incentives. Equally important is the timeliness of payments. There havebeen improvements in payments to maize farmers since 1987/88, partly due to injection of fundsfrom the EEC to establish a crop purchase program in NCPB, as well as progress toward grainmarket liberalization. For the past three crop seasons (1987/88 through 1988/90) most maize farmersand buying agents were paid by NCPB within 1-2 weeks following delivery, rather than the previous4-9 months delay. No such improvements have been in evidence for other major crops, especiallycotton and coffee.
2.16 With respect to cotton, there -3ave been significant delays in approving the new Cotton Act,which includes provisions for the divestiture of the Cotton Lint and Seed Marketing Board (CLSMB),and a pricing system based on auctions. The Act was passed in 1989 but the improved pricingsystem remains to be implemented. These delays partly explain the recent poor performance of thecotton subsector. For coffee, after prolonged delays, the Governrnent approved in 1990 an improvedcoffee payments system designed to speed up payments for smallholders, but it has yet to beimplemented. Other constraints affecting the coffee subsector have been two major probes of thecoffee industry in the last three years, and farmer uncertainty over the roles of the Coffee Board ofKenya and the Kenya Planters Cooperative Un.on in coffee marketing and payments.
2.17 In late 1987, the Government announced a decision to reform NCPB with the objective ofturning it into a buyer and seller of last resort, and liberalizing trade and pricing at the producer andmiller levels. Key actions included: eliminating NCPB's legal monopoly in maize marketing, andallowing private traders and cooperatives to increase their market share; writing off NCPB's
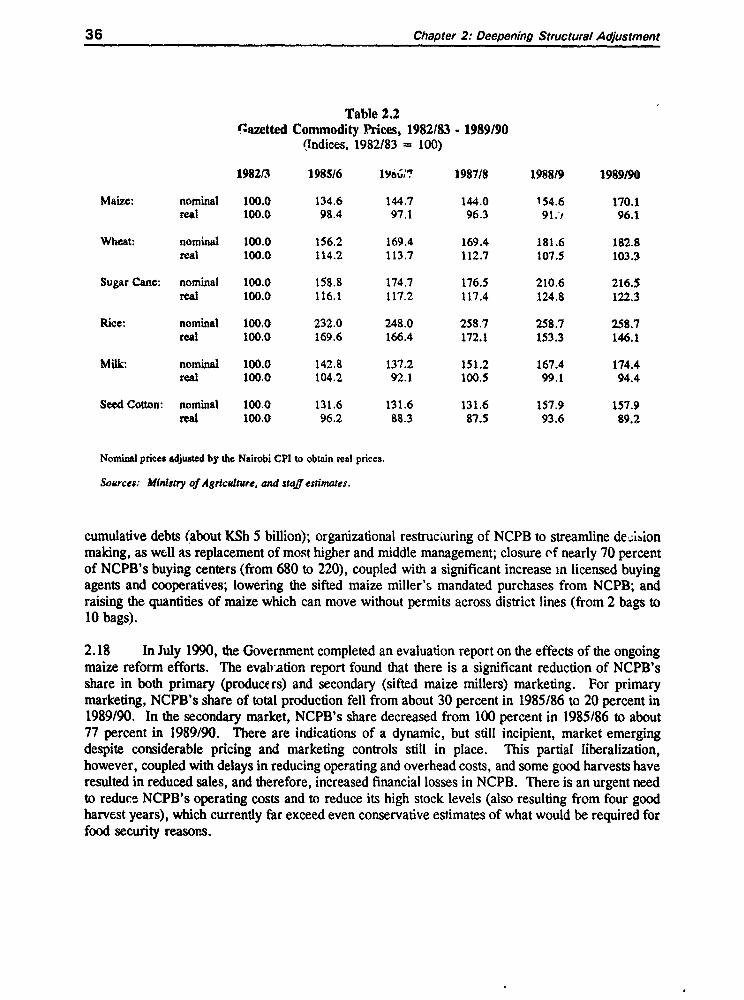
36 Chapter 2: Deepening Structural Adjustment
Table 2.2'.azetted Commodity Prices, 1982/83 - 1989/90
(Indices, 1982/83 100)
1982/3 1985/6 1966;7 1987/8 1988/9 1989190
Maize: nominal 100.0 134.6 144.7 144.0 154.6 170.1real 100.0 98.4 97.1 96.3 91.,/ 96.1
Wheat: nominal 100.0 156.2 169.4 169.4 181.6 182.8real 100.0 114.2 113.7 112.7 107.5 103.3
Sugar Cane: nominal 100.0 158.8 174.7 176.5 210.6 216.5real 100.0 116.1 117.2 117.4 124.8 122.3
Rice: nominal 100.0 232.0 248.0 258.7 258.7 258.7real 100.0 169.6 166.4 172.1 153.3 146.1
Milk: nominal 100.0 142.8 137.2 151.2 167,4 174.4real 100.0 104.2 92.1 100.5 99.1 94.4
Seed Cotton: nominal 100,0 131.6 131.6 131.6 157.9 157.9ral 100.0 96.2 88.3 87,5 93.6 89.2
Nominal prices adjusted by the Nairobi CPI to obtain real prices.
Sources: Ministry of Agric(dture, and stauf estimates.
cumulative debts (about KSh 5 billion); organizational restruciuring of NCPB to streamline desibionmaking, as well as replacement of most higher and middle management; closure of nearly 70 percentof NCPB's buying centers (from 680 to 220), coupled with a significant increase in licensed buyingagents and cooperatives; lowering the sifted maize miller's mandated purchases from NCPB; andraising the quantities of maize which can move without permits across district lines (from 2 bags to10 bags).
2.18 In July 1990, the Government completed an evaluation report on the effects of the ongoingmaize reform efforts. The evalv.ation report found that there is a significant reduction of NCPB'sshare in both primary (producers) and secondary (sifted maize millers) marketing. For primarymarketing, NCPB's share of total production fell from about 30 percent in 1985/86 to 20 percent in1989/90. In the secondary market, NCPB's share decreased from 100 percent in 1985/86 to about77 percent in 1989/90. There are indications of a dynamic, but still incipient, market emergingdespite considerable pricing and marketing controls still in place. This partial liberalization,however, coupled with delays in reducing operating and overhead costs, and some good harvests haveresulted in reduced sales, and therefore, increased financial losses in NCPB. There is an urgent needto reduce NCPB's operating costs and to reduce its high stock levels (also resulting from four goodharvest years), which currently far exceed even conservative estimates of what would be required forfood security reasons.

Chapter 2: Deepening Structural Adjustment 37
2.19 In early 1987, the Government decontrolled beef prices. Although no detailed analysis ofthe effects of price decontrol have been undertaken, available data suggests that the effects have beenpositive for both producers and consumers. Beef production has increased at about 4.0-4.5 percentper year since decontrol, suggesting a strong supply response and increased availability of meat.Immediately following price decontrol, consumer prices increased by about 20 percent, but since thenhave stabilized. The lack of adequate data precludes an assessment of the precise impact onconsumers. Although market prices have remained above the previously controlled prices, shortages' .e common during the period of price controls, suggesting that the effective price consumers paidfor meat was substantially above the mandated price.
2.20 Public E:xpenditures. The publi^ expenditure problems that confronted the sector included:inadequate allocations to agriculture, and excessive allocations to inefficient and loss-makingparastatals; a large number of projecn with low returns and questionable justification; a worseningimhalance between salary and non-salary operating costs, with salaries increasing from about 60percent of recurrent expenditures in FY81 to 75 percent in FY86; low or negligible cost recoveryin a number of services; and consumer subsidies for a number of commodities. To address theseproblems, the Government began implementing a budget rationalization program in agriculture inorder to: (i) increase the level of spending in agriculture; (ii) improve budgetary processes; (iii)contain ministerial personnel costs; (iv) progressively phase out food subsidies; (v) increase costrecovery for animal health services, the tractor hire service, and maize seed certification; and (vi)carry out a phased program of parastatal reform.
Table 2.3Agriculture Ministries: Gross Expenditures, FY86-91'
(In Millions of Kenya Pounds)
Actual Printed Revised Forward BudgetFY86 FY87 FY88 FY89 FY90 FY91
Pesonnel 40.5 47.1 53.8 57.9 60.9 64.5Goods & Services 25.8 34.5 36.3 45.7 44.5 41.5Capial Formation 10.6 28.3 37.6 38.2 32.0 26.2Finacial Investment 33.2 15.1 17.7 13.2 15.9 13.3G:ia?. 22.8 40.5 36.5 296.8 t 35.6 32.4
Total 132.9 16S.5 181.9 451.8 188.9 177.9
t ncludes Muins* of Agriculwute, Livestock, Supplies and Marketing, Regional Development (irription componen),and Rehab. Scine and Technology (agricultural researcb component).
2 Includs IKh 214 million wnito off of NCPB debt.
Scarce: Blger 4ownmu. and saf esemaes.
2.21 Although sigiiificant progress has been achieved in implementing process improvements,implementation of specific budget rationalization measures has lagged, and in many cases reformshave not been completed. The sectoral allocation to agriculture increased by about 15 percent in realterms in the first year of the program, but since FY88 nominal allocations have hardly kept up withinflation (Table 2.3). A large share of the increased allocations to agriculture have gone to cover

38 Chapter 2: Deepening Structural Adjustment
the additionai costs of two new Ministries created in 1987 (Supplies and Marketing, and LivestockDevelopment). On the positive side, there have been increases in allocations to research, extension,and animal health. The unusually large increase to agriculture in 1988/89 (150 percent in nominalterms) reflects a one-time write off of the debt of parastatals undergoing restructuring, particularlyNCPB and the South Nyanza Sugar Company (SON").
2.22 The share of recurrent expendituresabsorbed by salaries and allowances in the two Table 2.4main agriculture ministries has not changed Pesinnltries of Agriculture and Rvestock, FcrYSn 0much since FY85, totalling about 72 percent in (Percentages)FY90 (Table 2.4). Salary ceilings have beenregularly exceeded and employment hascontinued to grow, despite the fact that the Total SbareMinistries of Agriculture, and Livestockintroduced a hiring freeze over the past twoyears. The underlying issues of excessive intake FY80 12.0 22.0 54.6in the agricultural training institutes and the lax FY85 31.4 43.1 72W9enforcement of public sector employment FY86 35.7 51.5 69.3
policies hav been major constraints in meeng FY87 43.9 58.6 74.9policies have been major constraints In meeting FY88 45.7 61.8 74.0the budget rationalization objectives of the FY89 43.9 59.7 73.5agricultural reform program. On the positive FY90 47.7 66.5 71.7side, food subsidies have been reduced andsignificant progress has been achieved in costrecovery of animal health services. Between Sourc:staffestimates.
1985 and 1989, the Government has steadilyincreased the retail prices of major commodities, which have reduced the need for Treasury to coverlarger financial losses of NCPB (for maize), the National Irrigation Board (for rice), and KenyaCooperative Creameries (for milk). In late 1986, the Government began raising charges for livestockdipping and artificial inseminadon-collection rates, however, remain low.
2.23 Parastatal Reform. Progress on parastatal reform remains slow ard piecemeal, withGovernment commitment limited to implementation of reforms on a case-by-case basis, often onlyin response to a manifest crisis. Responsibilities for agricultural parastatals are now fragmentedamong a number of ministries, which reduces the opportunity for common approaches and centralizedsupervision. The process of reforming Uplands Bacon Company (UBC), the Kenya MeatCommission (KMC), and CLSMB has been protracted and ineffective. The Government is currentlyattempting to revive UBC and KMC by attracting private funding, but failure to attract privateinvestors suggests the Government is likely to continue running these enterprises. The divestitureof CLSMB is provided for under the Cotton Act approved in mid 1989 but there are as yet no firmplans for the new pricing system or a firm divestiture program. With respect to NCPB, althoughthere has been some progress in its restructuring, financial losses remain high -- KSh 770 millionbudgeted for FY91.
Evaluation
2.24 At a time when the Government is preparing the second phase of its agricultural adjustmentprogram, a preliminary evaluation suggests that progress has been mixed, with some clear gains butalso some equally clear failures. In retrospect, it is likely that more tangible benefits would have

Chapter 2: Deepening Structural Adjustment 39
been achieved if the Government's program had been more precisely defined and had relied on clearaction plans, appropriately sequenced and linked more explicitly with investment programscomplementary to the policy reforms.
2.25 As discussed above, agricultural growth has increased following implementation of thereform program, and remains better than most of Sub-Saharan Africa. This improved growthperformance appears to have been largely the result of favorable weather, coupled with improvedproducer prices, more timely payments for some commodities (maize and milk), price decontrol ofbeef, and improved fertilizer availability (except for 1989/90). Also, increased foreign exchangeavailability as a result of support from six donors for the reform program (about $230 million) helpedto alleviate foreign exchange constraints in 1987 and 1988, and probably helped to avoid shortagesof agricultural imports such as fertilizers.
2.26 Although no detailed study of the impact of the adjustment program on the poor has beenpossible, on balance it appears that the program has had a positive effect on some poor households.Smallholders, most of whom are poor, comprise about 60 percent of Kenya's population. Producerprice increases have clearly benefited these groups. Beef price decontrol appears to have alsobenefited pastoralists in ASAL areas, among the poorest groups in Kenya. On the negative side,consumer prices for maize meal, beef, sugar, milk, bread, and tea have increased several times inthe last three years. These increases reflect rising producer prices and costs, and the Government'sdesire to stimulate agricultural growth and reduce consumer subsidies. These increases are likelyto have a negative impact on the poor, especially the landless and those in urban areas (togetheraccounting for about 20 percent of the population), for whom there have been no offsetting outputprice increases as for smallholders. The precise impact is difficult to judge, as items which wereprice controlled or subsidized were often unavailable at official prices and to the extent thatGovernment reforms have led to increased growth, both lower-income urban dwellers and thelandless would have benefited somewhat from increased employment opportunities. Moreover, it ishardly likely that disadvantaged groups would have been better off with Government policies thatresulted in slower agricultural growth.
2.27 In sum, implementation of the agricultural reform program was mixed. Good progress wasmade in: maintaining appropriate producer prices, and taking steps toward market deregulation(especially maize and beef); carrying out the financial and organizational restructuring of twoparastatals, NCPB and SONY; and improving cost recovery for animal health services.Disappointing progress occurred in: removing supply constraints in fertilizer availability, andincreasing use; improving the efficiency of parastatals in the sector; and rationalizing the pattern ofpublic expenditures in agriculture. A weakening of Government commitment and capacity toimplement reforms has been due to a fragmentation of responsibilities (from two to five sectoralministries), and to some extent an apparent complacency on the part of the Government due toimproved economic performance during the program period.
The Medium-Term Agenda and Sources of Growth
2.28 A recent World Bank study (World Bank, 1990) which explored agricultural growthprospects in Kenya concluded that average agricultural growth of 4 percent per year to the end ofthe century would be attainable, provided there is a deepening of the adjustment program. Suchgrowth would have to come about as a result of intensification in production of crops and livestock,moderate expansion in exports of the three major agricultural commodities (coffee, tea, and

40 Chapter 2: Deepening Structural Adjustment
horticulture), combined with some diversification of agricultural exports to sustain emergingproduction surpluses. The major source of agricultural growth over the next decade would need tobe generated by smallholders in medium- and high-potential areas. Until the early 1980s, areaexpansion in medium- and high-potential regions accounted for at least 70 percent of agriculturalgrowth. High population growth, however, has t.ow exhausted the potential for expansion in theseareas, but smallholder producdvity remains low. These areas also account for the larger share ofKen,a's low-income population. On average and for most commodities, agricultural yields ofsmallholders are about one half of those in larger holdings and estate farms. Since smallholdersaccount for about 80 percent of total agricultural land, there is considerable potential for increasingyields nationwide by concentrating on smallholders. Increases in crop and livestock yields, and shiftstoward higher-value commodities would be the sources of growth. Currently, only about 12 percentof total agricultural land is used for high-value crops (coffee, tea, horticulture).
2.29 Although most of Kenya's future agricultural growth will come from medium- and high-potential land, ASAL areas can also contribute, in the long run, mostly from area expansion and theadoption of environmentally sustainable methods of producdon. The population of ASAL areas isestimated to be over 6 million people, most of whom have low incomes, nutrition and access tobasic social services.7 While ASAL areas cover about 80 percent of Kenya's total land area, thereare marked variations in producdon potential within ASAL areas. Promoting greater equity and foodsecurity in ASAL areas will need to focus on increased cereal and meat production in areas withrelatively higher potential. To achieve this, efforts will be required to develop and implementproduction technologies that are environmentally sustainable (e.g., zero grazing in the high potentialareas) and resolving current and potential conflicts with wildlife. ASAL areas will continue to playa major role in attracting tourism since nearly all of Kenya's prized wildlife game parks and reservesare located in these areas. Greater sharing of tourism revenues with local communities canconsiderably increase incomes in ASAL areas, and provide communities in dispersal areas with apotent incentive to help preserve wildlife as well as adopting cultivation and livestock practices whichcan coexist with wildlife resources.
2.30 To sustain high agricultural growth, the Government will need to deal with the issues thatwere only partially addressed during the first phase of the agricultural adjustment program, andextend reform efforts to additional areas. Reform efforts should be intensified in the areas ofproducer incentives (particularly timeliness of payments), fertilizer use, and the efficiency of publicexpenditure in agriculture. Additional areas include availability of rural financing, landadministration, and sector management. Inappropriate producer incentives result primarily fromdelayed and unreliable payments, and unnecessarily high marketing costs. This in turn is due to lackof competition and inefficiencies in the marketing of key agricultural commodities, especially maize,milk, cotton and coffee. Notwithstanding implementadon of some measures to improve marketingover the past four years, reforms have been patchy and often inordinately delayed, reducing farmerconfidence and motivation to increase marketable surpluses.
2.31 Having considerably raised producer prices in recent years, there is now a need to placegreater reliance on market-determined prices, especially for maize and milk, which are in surplus,and more effective steps to speed up payments to farmers. For maize, there is an urgent need for
7The 1979 Population Census estimated that 5 million people, or about 30 percent of Kenya's population lived in ASALsream (IFADfUNDP, 1988).
Chapter 2: Deepening Structural Adjustment 41
the Government to clarify the future role of NCPB, reduce its operating and overhead costs, and toeliminate maize movement controls. For milk, the Government needs to finalize, its new policies andsupporting acdons and, in order to promote greater efficiency and competidon in milk processing andmarketing, including the restructuring and decentralizadon of the Kenya Cooperative Creameries.For coffee, the Government has developed an improved payments system but implementation hasbeen delayed. There is also a need to clarify the roles of the Coffee Board and the Kenya PlantersCooperative Union. For cotton, there is a need to implement a divestiture plan for CLSMB andimproved pricing arrangements in accordance with the 1989 Cotton Act.
2.32 There is also a need for a more aggressive policy to promote yield-augmenting inputs,especially fertilizers. In addition to speeding up payments to farmers, measures are required toimprove extension and soil testing facilities, and address supply constraints by increasing competitionin the fertilizer market. In the area of public expenditure, a more determined effort is needed toimprove the selection and implementadon of public investments, ensure full funding of priorityprojects and programs, especially those that benefit smallholders, and improved balance betweenwage and nonwage operations and maintenance expenditures.
2.33 Kenya's smallholder sector is constrained by the lack of institutional credit to financeinvestment and working capital. The latter is particularly important to increase ferdlizer use amongsmallholders. The challenge is how to channel additional credit to a sector that, from the point ofview of commercial lenders, is inherently riskier and requires higher overheads. The Government'sattempts to address this problem have been limnited to requiring 17 percent of commercial banklending to be allocated to agriculture; attempting, with little success, to restructure the AgriculturalFinance Corporation (AFC), which has tended to concentrate on financing larger farmers and has apoor loan recovery record; and a recent proposal to establish a new Agricultural Development Bank.It is not clear, however, why the latter would succeed where AFC has failed.
2.34 Land laws and their administradon need to be improved. Currently, indigenous landownership practices operate alongside modern legal statutes. The process of moving toward amodern system of land ownership and legal administradon is little understood by many rural groups.The system for settling land disputes is inefficient, in many instances lacking in transparency, andcumbersome. Moreover, since women farmers are estimated to manage at least two fifths of Kenyansmallholdings, attention should be focused on the special needs of women farmers (World Bank,1989). With the advent of modern adjudication, land tide generally goes to men, reducing women'ssecurity and access to inputs, especially collateral-based credit. Thus, there is a need to explorealternative land tenure arrangements such as joint tidtling and recognition of usufruct.
2.35 The management of Kenya's agricultural sector has weakened considerably as a result ofa fragmentation of responsibilities, lack of coordination, and poor data base. Until 1987, most ofthe sector responsibilities were handled by the Ministry of Agriculture and Livestock Development.Five ministries now directly share responsibility for the agriculture sector, with no clear arrangementsor mechanisms to coordinate policy formuladon and implementadon, nor to rationalize investnentprograrns. Since the decision to increase the number of ministries is essentially a political one, overthe medium term there is a need to devise effective ways of improving coordination and radonalizingmanagement of sector policies and expenditures.

42 Chapter 2: Deepening Structural Adjustment
B. Adjustment in Inlustry and Trade
Structure and Constraints
2.36 Manufacturing has been a dynamic sector in the Kenyan economy since Independence. Asa result, its share of GDP rose from about 8 percent in 1964 to 13.3 percent of GDP in 1986.However, its growth had slowed by 1986-average annual growth of sectoral value added fell from12.4 percent in 1965-73 to 6.9 percent in 1973-80, and 4.2 percent in 1980-86. While thisdeceleration in manufacturing growth after 1980 occurred partly as a result of the Government'sstabilizadon program, exogenous shocks, and the loss of regional markets following dismantling ofthe East Africa community, it also reflected serious structural problems in the sector. Like manydeveloping countries, Kenya's industrial strategy was based on policies that protected domestic firmsfrom import competition. Hence, much of the sector's growth, particularly in the first decade afterIndependence, came from exploiting profitable opportunities for import substitution behind high tariffand non-tariff barriers.
2.37 Import restraints, in the form of quantitative restrictions (QRs) and high tariffs, were usedto pursue a variety of economic goals including protection of domestic producers, control of foreignexchange outflows, and revenue generation. QRs, which were applied through a highly discretionaryimport licensing system, were the principal means of regulating foreign exchange reserves. High andcascading tariffs along with QRs, provided greater effective protection to consumer goods andintermediate products relative to raw materials and capital goods. Moreover, the dispersion of tariffsand QRs resulted in a wide range of effective protection rates across manufacturing activities(between -167 percent and 1,020 percent according to a firm-level survey conducted in 1986 [WorldBank, 1987]). Since exemptions from tariffs and QRs were often granted on a case-by-case basis,effective protection also varied across firms in the same industry.
2.38 These import policies have produced an inward-looking manufacturing sector. Between1980 and 1985, the share of imports in the domestic supply of manufactures fell from 36 to 19percent. An analysis of the sources of manufacturing sector growth between 1976-83 shows the samepattern-almost 65 percent of growth in the expanding subsectors (including textiles and clothing,petroleum and chemicals, transport equipment, and electrical machinery) came from the displacementof imports. By the mid-1980s, however, import shares in most subsectors had fallen to levels whichlimited the ,,cope for further import substitution. In 1983, the share of imports in domestic supplywas less than 20 percent in the 13 subsectors that accounted for the bulk of manufacturing valueadded (including beverages, leather products, textiles and clothing).
2.39 Import barriers also adversely affected the performance of manufactured exports: (i) byincreasing the relative profitability of producing for the domestic market (relative to exports), theygenerated a strong anti-export bias; and (ii) by reducing the incentive for domestic producers to cutcosts or improve product quality, they hurt the competitiveness of Kenyan exports. Moreover, themain incentive given to manufactured exports, the export compensation scheme, has been ineffectivein offsetting this bias. Table 2.5 provides estimates of the anti-export bias (for non-traditionalexports) during the 1980s. Even without the effect of QRs (which would have been significantduring much of this period), in 1980 it was about 13 percent more profitable in shilling terms toproduce a dollar's worth of an import-substitute compared to a dollar's worth of an exportable, andthe disincendive remained at about this level in 1988. This bias against manufactured exports wasaccentuated by the overvaluation of the shilling during the early 1980s, which reduced the absolute

Chapter 2: Deepening Structural Adjustment 43
Table 2.5Real Effective Exchange Rates (REER) and Anti-Export Bias, 1980-89'
(Kenya Shillings, and Percentages)
1980 1985 1986 1988 1989
Trade-WeightedRER (KSh/$)' 7.6 6.9 7.1 7.6 8.0
Non-Traditional (NT) Non-Oil ExportEffective Subsidy (96) 7.5 7.4 7.4 4.3 4.2RIER for NT Exports (REER5 ) 8.1 7.4 7.6 7.9 8.3
Non-Petroleum ImportsEffective Duty (%) 21.5 18.1 17.0 17.6 14.4REER for Imports(REERJ,) 9.2 8.2 8.3 8.9 9.2
Anti-Export Bias '(REER,IREERx) 1.13 1.10 1.09 1.13 1.10
a The effective duty on imports includes only tariff protecti. n due to lack of data on the tariff equivalents of QRs. Theexport subsidy includes the export compensation scheme only.
I 'he tade weighted RER is the nominal exchange rate for 1980 adjusted by the trade weighted infation differentialbetween Kenya and its top twenty trading partners (in 1980). It differs from the IMF REER which is based on alarger numnber of tradig partners.The anti-export bias measures the relative profitability in local currency of producing a dollar's worth of an import-substaite compared to a dollar's worth of an exportable.
Sources: Staff es4imates.
profitability of exports.' As a result, the share of exports in gross manufacturing output fell from19 to 8 percent between 1980 and 1985, while manufactured exports fell by 40 percent in real terms,a steeper decline than for merchandise exports (16 percent).
2.40 Other instruments of industrial policy also affected sectoral performance during this period.Price controls, public ownership and licensing were used to pursue a variety of non-efficiencyobjectives, including the indigenization of ownership and management, subsidization of consumergood prices, and regional dispersion of economic activity. Most notable among these policies were:(i) subsidized interest rates that further encouraged investment in protected import-substitutingindustries; (ii) price controls that applied to a variety of indvstrial products; (iii) high effective taxrates and few incentives for investment or exports; and (iv) public ownership, either directly or
By dandard tWade-weighted measures, the real exchange rate (RER) appreciated by about II percent during 1980 84.following a depreciation of about 47 percent during the 1970s. Measures of the RER that focus more explicitlvon manufactured and non-traditional exports than the trade-weighted index show an even larger appreciation during theperiod.

44 Chapter 2: Deepening Structaral Adjustment
through state-owned development finance institutions (DFIs), and restrictions on foreign directinvestment.
2.41 In addition to the inward orientation inherent in the structure of incentives, industrialpolicies also had adverse effects on the structure and competitiveness of the manufacturing sector.High and variable effective protection, as in the Kenyan case, had adverse effects on the efficiencyof resource allocation because it favored inefficient activities such as electrical and transportequipment (for which domestic resource costs exceed foreign exchange savings), which expanded atthe expense of more efficient but less protected activities (e.g., animal feeds). At the firm level,protection from cheaper, and often higher quality imports reduced the incentives for producers inhighly-protected industries to operate efficiently (e.g., textiles and metal products). There is someevidence that efficiency in Kenyan manufacturing has suffered on both counts. A firm-level surveyundertaken in 1986 showed that while the dominant activities in the sector, including food processing,beverages and tobacco, were efficient, other subsectors such as electrical and transport machinery,textiles and clothing, were inefficient. More disturbingly, over a third of the sector's growthbetween 1976-85 occurred in these four inefficient sectors. The analysis of firm-level efficiency alsoshowed that while most activities were efficient when viewed as import-substitutes, their efficiencyfell substantially when viewed as potential exports. Although this conclusion does not necessarilyimply that protected firms focussed less on controlling costs, it demonstrates the difficulty that evenrelatively efficient segments of Kenyan industry would have faced in competing in export markets.
2.42 The public ownership policies pursued by the Government during the 1970s were anothermajor influence on sectoral efficiency. While Kenya's industrial sector has remained predominantlyprivate sector-owned and operated, the Government has investments in about 100 enterprises eitherdirectly or through the public-sector DFIs. While the objective was to encourage the developmentof African-Kenyan entrepreneurship and management, a high efficiency cost has been incurred.Although comprehensive and updated financial information on the public enterprise (PE) sector is notavailable, its financial and economic performance has been poor. A 1982 government reportestimated that the rate of return on investments in these enterprises was a minuscule 0.2 percent(Republic of Kenya, 1982). This conclusion is supported by the firm-level survey cited above, whichfound that while most parastatals were more protected than locally-owned private firms, they wereless efficient and less profitable (World Bank, 1987).
2.43 A further area of concern in the mid-1980s was the trend in manufacturing sectorinvestment. Real investment fell continuously between 1978 and 1985, and while time-series dataon capital stock are not available, it is likely that disinvestment occurred during this period. Thisview is supported by the estimate derived from the firm-level survey, according to which the realcapital stock in manufacturing in 1985 was about 85 percent of its 1979 value. While some of thisslowdown in investment could be attributed to the excess capacity that existed in the late-1970s, andto polidcal instability following the 1982 coup attempt, policy factors also contributed. Most notably,the strong anti-export bias, the lack of incentives for investment, the high effective tax rate oncorporate profits, and the delays and difficulties faced by foreign investors in repatriating profits andcapital, reduced the perceived returns from new investments in Kenya.
2.44 Hence, despite its rapid growth, and the efficiency of large segments within it, Kenya'sindustrial sector faced substantial challenges in the mid-1980s. Most importantly, it was clear thatgrowth of the manufacturing sector could no longer be sustained by the expansion of domesticdemand or the displacement of imports. Production would need to be oriented to more competitive

Chapter 2: Deepening Structural Adjustment 45
export markets. This would require improving the efficiency of manufacturing firms and theefficiency of resource allocation within the sector. Further, since capacity utilization rates in efficientsubsectors was already relatively high, it was necessary to increase investment.
The Adjustment Program
2.45 In 1987, the Government began implementing a series of stabilization and adjustmentmeasures to stem the deterioration in economic performance and improve the efficiency of resourceuse in the productive sectors. In the industrial sector, the Government's strategy, as articulated inSessional Paper No. I of 1986, noted the need for industrial restructuring to improve efficiency andto enhance export competitiveness. The current industrial sector reform program has three mainobjectives: improve efficiency in the sector; stimulate private investment; and increase the sector'snet foreign exchange earnings while diversifying its sources. The strategy for achieving these aimsinvolves reforms in two areas. First, trade policies would be reoriented so as to increase the relativeprofitability of producing for export, rather than the domestic market. Second, the absoluteprofitability of producing for both export and domestic markets would be enhanced through measuresto reduce regulatory and licensing requirements, and strengthen the export competitiveness of Kenyanfirms. By shifting incentives away from import substitution, exposing domestic producers to greaterimport competition, and reducing their set-up and operating costs, these reforms would promoteefficiency and improve the environment for exports, investment, and employment.
2.46 The first phase of this reform program was implemented during 1988-89, with initialactions taken in several areas including import liberalization, export and investment incentives, andregulatory reform. In the second phase of the reform effort (to be implemented during 1990-92),the Government intends to accelerate the export supply response by sharpening the focus on exportpromotion. This would involve pursuing more aggressive actions to increase the neutrality of thetrade regime, with the provision of infrastructural and institutional support to non-traditionalexporters.
2.47 Exchange Rate Policy. As part of the macroeconomic framework that underpinned theprogram, the Government undertook to follow a flexible exchange rate policy so as to reverse thereal appreciation that had occurred in the early 1980s. Due to significant nominal depreciations thathave been implemented since 1987, the real exchange rate (RER), by standard trade-weightedmeasures, depreciated by 10 percent in 1987-89, compared to an appreciation of about 11 percentin 1980-84. Since the RER is a key determinant of the absolute profitability of export production,it is not surprising that these trends in the RER are reflected in the decline in manufactured exportsthat occurred in 1980-84, and its partial recovery since then.
2.48 Inport Policies. Import policy reforms implemented since 1988 have sought to: (i) shiftfrom providing protection through QRs to the use of tariffs; and (ii) rely mainly on the VAT to raiserevenues, with tariffs being used primarily for protective purposes. Although the system of importlicensing remains in place, considerable success has been achieved in meeting both goals. Until June1988, imports were classified into four schedules, with the availability of all licenses being highlydiscretionary, time-consuming and uncertain. Further, imports in two of the four Schedules werecontrolled tightly, with licenses effectively operating as QRs. The reforms aimed at reducing thecoverage of QRs, replacing them with near-equivalent tariffs for imports that competed with domesticproduction; and improving the import licensing process to make it more transparent and speedy.These objectives have been achieved by: (i) Reclassifying imports into five schedules, of which four

46 Chapter 2: Deepening Structural Adjustment
Table 2.6Quantitative Restrictions and Average Tariffs, FY87-91
(Percentages)
Coverage of QRs Average Tariff Rate% of items % of Imports' Unweighted Import-weighted'
FY87 40.3 12.0 38.8 24.4PY90 29.6 7.0 46.3 24.1FY91 22.1 5.4 45.4 19.9
Import values refer to actual FY87 data to allow comparability.Weighted by actual imports; for FY90 and FY91, July-December 1989 import data are used to weight tariff rates.
Source: staff estimates.
(Schedules 1, 2, 3A, and 3B) are now subject to automatic licensing. The reduction in importscovered by QRs achieved since 1988 is shown in Table 2.6.9 (ii) Streamlining the import licensingsystem to improve the speed of processing and reduce uncertainty. The average lag from licenseapplication to foreign exchange allocation has fallen from over six months to about four weeks.Further, importers are now provided with explicit reasons for rejections of license applications, andapproval rates for licenses in the liberalized schedules have been consistently high since the newsystem was instituted in February 1989.
2.49 Along with the shift from QRs to tariffs, there has also been progress in reducing averagetariffs and simplifying the tariff structure. This process was initiated in 1988 by replacing mostspecific tariffs with ad valorem rates, reducing the number of tariff categories from 25 to 17, andrevising these so that similar rates apply to comparable products. The process of lowering tariffswas initiated in the FY90 Budget and continued in FY91. The latter resulted in an approximately5 percent reduction in the average tariff on all original Schedules except 3C. This reduction has beenachieved by shifting a large number of items to lower tariff categories, and by eliminating the highestrate category (135 percent). Hence, these tariff cuts correspond to a reduction in the dispersion oftariff rates, and a proportionately larger (than 5 percent) fall in the average tariff for Schedule 3Bitems (mainly competing imports). However, tariffs were raised when automatic licensing wasinstituted (in 1989 and 1990) for items that compete with domestic production (items on Schedule3B), although in most cases these higher tariffs provide less protection than had existed with QRs.The net effect of these tariff changes during 1988-90 has been to reduce both the unweighted andimport-weighted average tariffs (Table 2.6). Finally, to compensate for revenue losses on account
The composition of the schedules is: Schedule I-high-priority raw materials, intermediate and capital goods; Schedule2-bulk items that require ministerial approval; Schedule 3A-items similar to those in Schedule I, but less standardizcd;Schedule 3B-imports that compete with domestic production and are restricted only by tariffs; and Schedule 3C-othercompeting imports and luxury goods, restricted by QRs. including items restricted for public health and safety reasons.In gencral, consumer goods, intermediate inputs and capital goods are distributed across all schedules.

Chapter 2: Deepening Structural Adjustment 47
of the recent tariff cuts, VAT rates were increased, most notably with the imposition of a 5 percentVAT on some raw materials and capital goods that had been exempt.
2.50 In sum, Kenya's import policies are now somewhat less restrictive than in 1986. Thecoverage of QRs has been reduced and, for imports that compete with domestic production, theyhave been replaced in most cases with less than equivalent tariffs; the import licensing system hasbeen streamlined; and the levels and dispersion of tariffs have been reduced. As a result thevariability of effective protection across firms and subsectors has fallen, and the profitability ofproducing for the domestic market relative to exports is lower than in 1988.
2.51 Despite these improvements, a number of constraints remain. First, QRs on Schedule 3Cimports continue to protect a large proportion of domestic value added in the manufacturing sector,including a large share of food processing, textile, leather processing, and fabricated metal sub-sectors. Such protection is not transparent, provides variable protection even within the sameindustry, implies a revenue loss, and corresponds to nominal protection levels far in excess of thehighest statutory tariff rate. Second, despite the moderate average tariff (Table 2.7), the cascadingstructure of nominal tariffs still results in high and variable effective protection for intermediate andfinished good industries.'° Finally, the variability of effective protection is exacerbated by thefrequency of ad hoc duty exemptions provided to non-exporters for imports of capital andintermediate goods. These exemptions partly account for the substantial difference between statutoryand effective tariff rates, and are a significant source of revenue loss.
2.52 Export Incentives. Apart from direct assistance programs operated by the Ministry ofCommerce, the only export incentives have been schemes to provide exporters with access toimported inputs at: international prices. Reforms since 1988 are focussing on improving existingschemes as well as introducing new ones. The two schemes for duty-free access that existed in 1988were export compensation (EC) and manufacturing-under-bond (MUB). The EC scheme, in p!acesince 1974, provides exporters of eligible products (the list is modified periodically and currentlyincludes about 1,260 items) with a refund of 20 percent of the FOB export value to compensate forduties paid on imported inputs. EC has been plagued by delays in making payments to exporters,and has benefited only a few large exporters." In response to these problems, some steps have beentaken to broadea its coverage and ensure faster reimbursement. As a result, the coverage hasexpanded (from about 700 items in 1987), and the time required for reimbursement has fallen (about75 percent of applications are now approved, on average, within 36 days). Duty reimbursementsunder the EC scheme will now be available at the time of export (subject to the posting of a Customsbond by the exporter) rather than following certification of receipt of the export proceeds.
2.53 The MUB facility is available only to firms specialized in exports, and exempts these firmsfrom duties on all imported inputs subject to the posdng of Customs bond. Although the regulationsgoverning this scheme were clarified in June 1988 and the prohibition on domestic sales of rejects
iO The cascading of tariffs is evident from Table 2.7, which shows that in FY87 the average effective tariff on capital,intermediate and consumer goods were 20 percent, 22 percent, and 35 percent, respectively.
Since FY81, the top four exporters have received between 37 and 66 percent of each year's total payments under thescheme.
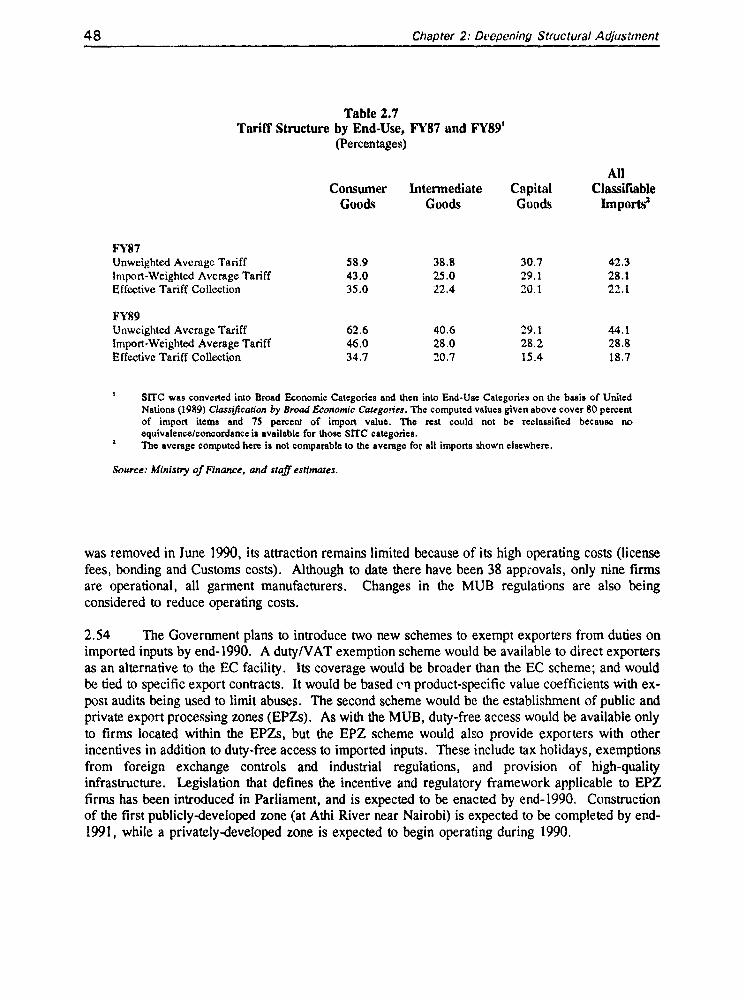
48 Chapter 2: Deepening Structural Adjustment
Table 2.7Tariff Structure by End-Use, FY87 and FY89'
(Percentages)
AllConsumer Intermediate Capital Classifiable
Goods Goods Goods Imports'
FY87Unweighted Average Tariff 58.9 38.8 30.7 42.3Import-Weighted Average Tariff 43.0 25.0 29.1 28.1Effective Tariff Collection 35.0 22.4 20.1 22.1
FY89Unweighted Average Tariff 62.6 40.6 29.1 44.1Import-Weighted Average Tariff 46.0 28.0 28.2 28.8Effective Tariff Collection 34.7 20.7 15.4 18.7
SITC was converted into Broad Economic Categories and then into End-Use Categories on the basis of UnitedNations (1989) Classilfcadton by Broad Economic Categories. The computed values given above cover 80 percentof import iters and 75 percent of impon value. The rest could not be reclassified because noequivalen"e/concordance is available for those SrrC categories.I`e average conmputed here is not comparable to the average for all imports shown elsewhere.
Source. Ministry of Finance, and staff estimates.
was removed in June 1990, its attraction remains limited because of its high operating costs (licensefees, bonding and Customs costs). Although to date there have been 38 approvals, only nine firmsare operational, all garment manufacturers. Changes in the MUB regulations are also beingconsidered to reduce operating costs.
2.54 The Government plans to introduce two new schemes to exempt exporters from duties onimported inputs by end-1990. A duty/VAT exemption scheme would be available to direct exportersas an alternative to the EC facility. Its coverage would be broader than the EC scheme; and wouldbe tied to specific export contracts. It would be based en product-specific value coefficients with ex-post audits being used to limit abuses. The second scheme would be the establishment of public andprivate export processing zones (EPZs). As with the MUB, duty-free access would be available onlyto firms located within the EPZs, but the EPZ scheme would also provide exporters with otherincentives in addition to duty-free access to imported inputs. These include tax holidays, exemptionsfrom foreign exchange controls and industrial regulations, and provision of high-qualityinfrastructure. Legislation that defines the incentive and regulatory framework applicable to EPZfirms has been introduced in Parliament, and is expected to be enacted by end-1990. Constructionof the first publicly-developed zone (at Athi River near Nairobi) is expected to be completed by end-1991, while a privately-developed zone is expected to begin operating during 1990.

C. iapter 2: Deepening Structural Adjustment 49
2.55 Regulatory Environment. As with exports, there are few incentives directed specificallyat encouraging manufactured investrnent. Four other regulatory and fiscal factors have acted todiscourage manufacturing investment by raising the operating and start-up costs for businesses: (i)investment approval, licensing, and other regulatory procedures have tended to be time-consumning,discretionary, and not sufficiently transparent; (ii) effective corporate tax rates have been relativelyhigh; (iii) many production and trade regulations are redundant, while others impose high efficiencvcosts (e.g., price controls); and (iv) procedures for remitting foreign payments of dividends, profits,and capital gains, and for approving technology and management contracts have been excessivelystringent.
2.56 Improvements have occurred in each of these areas si-ice 1988. The Government hasestablished a one-stop office in the Investment Promotion Center (IPC) to assist investors withapprovals. This unit has since been supplemented by the establishment of a Cabinet Sub-Committeechaired by the Vice President and Minister for Finance, which provides high-level coordination toeliminate administrative bottlenecks for investment approvals, and to streamline licensing procedures.The effective tax rate has fallen since 1988, with the corporate profit tax having been reduced from45 to 40 percent, and the implementation of measures to enhance investrnent allowances and allowthe tax-deductibility of exchange losses on foreign currency loans. Finally, an amendment to theForeign Investment Protection Act has eased the remittance of capital gains on equity investments,and allowed these to be denominated in foreign currency.
2.57 With regard to regulations that have adverse effects on economic efficiency, considerableprogress has been achieved on price decontrol. In 1988, the prices of 20 product categories weredecontrolled. These included farm equipment, soaps and detergents, paints, roofing tiles, electriccables and water pipes. Since then, several additional items including fertilizers, animal feeds andsoft drinks have been decontrolled. Currently, items within 18 product categories remain subject tothe General Price Control Order while 11 others (mostly consumer staples) are subject to SpecificPrice Control Orders. These estimates overstate the coverage of price controls since not all itemsin each of these categories are subject to controls. The Government's aim in placing products underthe General Order has been to control actual and potential monopoly power, and limit price increasesfor consumer products under Specific Orders. The strategy of gradual price decontrol attempts tobalance the adverse consequences that are anticipated on these counts with the gains that accrue fromdecontrol. To reduce the use of price controls in combatting market power, the Restrictive TradePracdces, Monopolies and Price Control Act was also enacted in 1989. The provisions of this Act,however, have not yet been applied systematically to promote domestiz competition.
Evaluation: nTe First Phase
2.58 Since these reforms in industrial and trade policies have been implemented only recently,it is difficult to evaluate their impact. Firm-level adjustments are not yet complete and it is too earlyto expect a sustained response to the policy changes. However, a preliminary assessment is possibleon the basis of recent trends in imports, manufactured exports and investment.
2.59 Imports. While import liberalization would be expected to lead to a rise in imports, twoqualifications are necessary in interpreting recent import growth. First, although the policy ofautomatic import licensing (for Schedule 1, 2, and 3A) was announced in June 1988, it was not fullyimplemented until early-1989. Hence, although some imports were licensed more liberally in 1988,the process of import liberalization effectively began only in 1989. Second, and as noted before,

50 Chapter 2: Deepening Structural Adjustment
the import policy changes during 1988-89 corresponded to reductions in protection only for importsin Schedules 1, 2 and 3A (mostly raw materials, capital goods, and non-competing intermediates).For compedng imports (Schedule 3B), the main change was in the form rather than the level ofprotecdon. The implication, therefore, is that import liberalization would be expected to have itsmain impact on imports primarily for industrial use.
Table 2.8Import Growth, 198849
(In Million of Kenya Pounds and Percentages)
1988 1989 % Cbange
Food and bevcrags 101.0 141.3 39.9For industry 74.2 98,8 33.2
Indusial non-food 641.6 757.8 318.1Fuel and lubricante 245.9 346.7 41.0Machinery and capitol equipment 414.3 476.5 15.0Transport 267.2 393.9 47.4
Passenger vehicles 43.2 62.7 45.1Parts, accessories 86.0 93.7 9.0
Consumer goods n.c.s. 56.3 70.6 25.3
Total Imports 176S.1 2239.0 26.8Real import growth(%)' 13.5 9.9 -
Import for industry' 1594.4 2005.3 25.8excluding KA, defase and fuelse 1256.7 1437.1 14.4
Nominal import adjusoe by import deflator In Statistical Appendix Table 2.7.t This figure overetimates inpots for industry because it covers import of passenger cars and pars.
aenys Airways, deten and *el impors are not coveted by inport liberalization measurea.
So*are.: Staff es*imates.
2.60 Table 2.8 shows the trends in imports by major category for 1988-89. Two aspects standout in terms of the impact of import liberalization policies. First, alitough the nominal value ofimports grew substandally in 1989, in real terms import growth actually slowed compared to 1988.Hence, factors other than liberalizadon probably account for the bulk of the expansion of imports inboth years. The second trend shown by the data supports this conclusion-the categories of importsthmt grew fastest in 1989 were those for household, rather than industrial consumption, and as notedbefore, since most of these imports are on Schedule 3B, these were not the items for whichprotection levels decreased. Notable in this regard are food and beverages, passenger motor vehicles(a large share of CKD units), and consumer goods n.e.s. Hence, while the reforms in import

Chapter 2: Deepening Structural Adjustment 51
policies have undoubtedly contributed to the recent import expansion, it appears to have beenaccommodated by other policies including the macroeconomic stance and more liberal licensing ofSchedule 3C imports (which officially remain subject to QRs).
Table 2.9Manufactured Exports, 1985.89'
(Percentages)
1985 1986 1987 1988 1989
SharesPoessoJ food and beverages 16.9 17.1 18.5 17.3 20.1Processed non-food ind. supplies 23.3 24.5 23.4 25.9 29.9Processed fuel and lubricants 46.1 38.0 38.1 38.0 31.4Machinery and capital equipment 1.0 1.5 1.5 1.8 1.8Transport cquipment 0.6 1.2 1.6 1.7 1.2Consumer goods n.e.s. 12.2 17.8 16.9 15.3 15.5
Nominal Growth RatesPtocessed food and beverages .. 3.5 1.8 9.7 35.8Processed non-food ind. supplies .. 7.2 -9.5 29.8 35.2Poessed fuel and lubricants .. -15.6 -5.3 17.0 -3.3Machineries and capital equipment .. 58.6 -2.6 38.2 16.4Transport equipment .. 105.7 28.2 29.0 -15.4Consumer goods n.e.s. .. 49.7 -10.5 6.3 19.0
Total .. 2.3 -5.6 17.3 17.0
' Manufctured expons are defined as BEC categories 12, 22, 32, 4.5 and 6.
Source: Staff estmates.
2.61 Manufactured Exports. Two related trends are notable with regard to manufacturedexports. As shown in Table 2.9, manufactured exports (defined broadly to include processed food,fuel and other raw materials) have grown in nominal terms by about 17 percent in each of the lasttwo years, reversing their decline between 1984 and 1987. Much of this growth has come fromprocessed raw materials-non-food supplies and fuels in 1988, and food, beverages, and non-foodsupplies in 1989. This implies that manufactured exports are now marginally more concentrated thanin 1987 with these three categ&ries accounting for about 81 percent of the total. The longer-termtrend indicates, however, a fall in concentration-the share of these categories has fallcn from about88 percent in 1984, due to the increases in exports of capital and transport equipment, and consumergoods, to regional markets. Despite their recent growth, the absolute levels of these exports remnainsmall, and Kenya's continued dependence on a relatively few processed raw materials is still a matterof concern, given the sharp swings in export prices and quantities for these products (e.g. thefluctuations in processed f-'el expoits in 1988 and 1989).

52 Chapter 2: Deepening Structural Adjustment
2.62 Investment. It is even more difficult to evaluate the impact of the recent reforms onmanufacturing sector investment than for imports or exports. The lags between improvements in thepolicy environment and sustained increases in capital formadon are long and uncertain. Gross fixedcapital formation in manufacturing averaged real growth of 20 percent annually during the period1985-88, reversing a fairly steady decline since 1979 (Statistical Appendix, Table 2.6). Thisrecovery preceded most of the recent reforms and was likely influenced by the generally improvedclimate after 1985 as well as some streamlining of investment regulations implemented before thestart of the industrial sector adjustment program in 1988. Real investment in manufacturing,however, dropped by 3.5 percent in 1989.
2.63 Despite the reforms implemented, the investment climate in Kenya is still not particularlyattractive, especially for foreign investors. The investment approval system is still viewed as overlydisc,etionary, procedures as not sufficiently speedy and transparent, and restrictions on foreigninvestrnent as too onerous. Although the IPC coordinates the process of investment approval, itcannot override the need for investors to procure additional approvals and licenses since itsrecommendations have no legal standing. Moreover, the roles of other government agencies in theinvestmnent approval process are not spelt out clearly, otten resulting in delays. While the reviewby the Cabinet Sub-Committee has reduced some of these delays, it is too ad hoc and cumbersometo function effectively as the m. in mechanism for expediting investment approvals. Redundanciesstill remain in production and trading regulations, and the remaining price controls continue toadversely affect efficiency and profitability through their impact on costs, quality, and margins. Inresponse to these concerns, the Government is currently reviewing the regulatory framework, andintends to take additional steps to eliminate redundant regulations and investnent approvals, simplifylicensing procedures, and make jvocedures regarding remittances of profits, interest and royaliiesmore speedy and transparent.
The Medium-Term Agenda
2.64 The Government's export development strategy lays out the actions it intends to implementwith regard to industrial and trade policy over the next two years. These actions include furtherreforms in import policies; more aggressive export promotion measures, including direct support tonascent exporters, and infrastructural investments to facilitate exports; and reforms in enterprise andtrade regulations. However, even if these policy measures are implemented and appropriateinfrastructural investments undertaken, there will remain a number of policy and institutional factorsthat, if not taclded, would constrain future growth.
2.65 Inport Policy. The medium-term reform objectives in this area are to: continue themovement in the incentive regime toward neutrality; enhance the transparency and non-discretionaryaspects of the system of import protection; and shift to using import tariffs primarily for protecdonpurposes rather than in raising revenue. The reforms that have already been undertaken constitutethe first steps toward achieving these aims. The Government intends to take additional actions in1991. Specifically, all remaining QRs on imports (with exceptions for reasons of health and safety)would be replaced by equivalent or lower tariffs; the process of tariff reduction would continue, andbe guided by the same principles as in the first phase, so as to reduce both the level and variabilityof effective protection; specific tariff exemptions granted to non-exporters would be reviewed to
Chapter 2: Deepening Structural Adjustment 53
reduce the intra-industry variations in protection and the ensuing revenue losses; and furtier increasesin VAT rates would be implemented if needed to compensate for revenue losses from tariffreductions.
2.66 These reforms would represent progress toward the Government's longer-term trade policyobjecdves. However, even with these reforms, effective protection would remain high and variable,particularly for subsectors (including textiles, food processing, and leather products) for which onlythe means of protection would have changed. Yet some of these subsectors are those in whichKenya's comparative advantage would be expected to lie. Therefore, it is essential that the processof tariff reducdon continue, and focus particularly on finished and intermediate good imports thatcompete with domestic production. With regard to increasing the transparency of protection, effortsto limit the number and scope of tariff exemptions granted to non-exporters would be required. Theattempt to restrict exemptions should focus particularly on those that favor specific firms within anindustry, thereby resulting in uneven effective protection even across firms producing the sameproduct. The transparency of the import protection system would be improved also by reducing thescope of import licensing with a view to eventually eliminating it. Widh most imports to be subjectto unrestricted licensing by mid-1991, the licensing system that is currently in place would beredundant in regulating the flow of imports. Retention of this system reduces the transparency ofthe Government's import policy, and could contribute to its discretionary application.
2.67 Export Promotion. Measures the Government intends to implement, most notably thedutyNVAT exemption scheme for pardal exporters and the incentives available to exporters locatedwithin designated Export Processing Zones (EPZs), would offset significantly the and-export biasimplied by the current trade system. The longer-term needs in this area are twofold: (i) To review,and rationalize as necessary, the muldple schemes currently in existence to provide exporters withduty-free access to inputs. In particular, the export compensadon scheme, which is GATT-countervailable because it provides a fixed rebate, and inefficient because it induces exporters toeconomize on their use of imported inputs by switching to cheaper and lower quality domestic inputs,should te phased out while the coverage of the duty/VAT exemption scheme is expanded; and (ii)To extend access to duty-free imports to indirect exporters. The schemes currently in operadoncover only direct exporters, thereby leaving out most small- and medium-scale firms that supplyinputs to exporters or use traders to export their products. Expanding the access to duty-free importscould be achieved by gradually shiffing the basis for the duty/VAT exempdon scheme from product-specific value coefficients to physical input-output coefficients as experience is gained inimplementing the scheme.
2.68 Reforms in the areas of import policy and export promodon would provide a powerfulimpetus to domestic producers for greater efficiency, both through enhanced import competition andincreased rivalry in export markets. Despite these changes in the incentive framework, twosignificant sources of inefficiency remain in the manufacturing sector-the operadon of industrialparastatals, and features of the business environment which constrain the operations of private firms.Actions are required in each area to increase domestic compedtion and improve the efficiency of keysubsectors.
2.69 Most industrial parastatals are inefficient, suffer large financial losses, and requiresubstantial budgetary support for their operatdons. Government efforts to improve their performancehave focussed on attempts to improve the oversight of parastatals and, to a lesser extent, restructuringand divestiture programs. For instance, the State Corporations Act was enacted in 1986 to strengthen

54 Chapter 2: Deeponing Structural Adjustment
the supervision and control of the financing and expenditure programs of parastatals; a programreview and forward budget system has been instituted by the Government Investments Division ofthe Treasury; and implementation of a program to set agreed performance targets for selectedenterprises has begun. However, there is little evidence that these efforts have succeeded inimproving the performance of the parastatal sector or that they would do so in the foreseeable future.A deepening of adjustment in the industrial sector would therefore need to focus on systematicrestructuring and divestiture of parastatals.
2.70 Despite numerous policy pronouncements, the Government has made little progress in therestructuring and divestiture of parastatals. It was intended originally that implementation guidelinesfor this general policy would be developed by the Task Force on Divestiture, established in 1983.Although the Task Force met until 1986, and produced a variety of recommendadons on restructunngand divestiture, its findings have never been released. Instead, the Government has decided torestructure the portfolio of two major DFIs and implicitly opted for a piecemeal approach to dealwith other parastatals. A study of the industrial sector DFIs and their portfolios was undertaken in1989, and on this basis a restructuring plan was designed for two government-owned DFIs. Themain objective of the program is to establish the commercial viability and sustainability of the DFIs,but as part of this process steps will be taken to restructure, divest or close firms in the DFIportfolios. More recently, the Government has begun to formulate restructuring programs for theparastatal textile sector and Kenya Airways.
2.71 This experience confirms that, despite the policy pronouncements and economic logic thatfavor a comprehensive restructuring of parastatals (including divestiture), the implementation of sucha policy faces serious obstacles. The Government has two sets of concerns. First, there is a lackof internal consensus within Government over the need and desirability of a comprehensive approachand therefore apprehension about the political backlash that might result from confronting theparastatal issue in a systemic manner, given the employment and patronage that are currentlygenerated through them. Second, the Government is concerned that under a comprehensivedivestiture program it would be difficult to ensure wide dispersal in the ownership of divested assets,exacerbating political and ethnic tensions if particular groups are seen to benefit dispropordonatelyfrom the sale of publicly-owned firms. Although to a certain extent ownership dispersal would bepossible by relying on the stock market to divest public shares, the Government is concerned that thethin market would be unable to absorb a large volume of newly-divested shares.
2.72 Although the current policy of reforming parastatals on a case-by-case basis gives theGovernment more control in designing and implementing restructuring and divestitures programs, thesystemic financial and operational problems that affect this sector argue for a more broad-basedapproach. Moreover, there is a strong case for exploring alternative approaches such as managementcontracts with the private sector and employee ownership schemes which, if properly designed,could go a long way to meeting the Government's efficiency and equity concerns. Such a strategy,combined with a gradual and selective divestiture program would be more likely to produce theefficiency gains from restructuring, which would be required to offset the losses in jobs andpatronage, and help create the necessary political consensus.
2.73 In addition to reforming the parastatal sector, if the changes in the incentive structurecurrently underway are to result in a corresponding shift in Kenya's industrial structure and producethe supply response required to sustain the reform process, resources must move from inefficientimportable and non-tradeable sectors to the producdon of efficient import substitution and exportable

Chapter 2: Deepening Structural Adjustment 55
goods. For this process to work, complementary reforms will be required to improve the regulatoryframework, and the availability of infrastructure and business services.
2.74 Regulatory Framework. The regulatory reforms that have been implemented havesucceeded mainly in eliminating redundant approvals, licenses and permits, and ensuring thatregulations are administered and designed so that they are transparent, non-discretionary, and areimplemented speedily. However, several regulations remain that reduce economnic efficiency bylimifing entry and/or expansion; artificially reducing the profitability of incumbent firms byconstraining their pricing, purchasing, and distribution decisions; and limiting the ability of firms toexit industries. Controls on pricing and procurement provide an example of the adverse economiceffects of such regulations. While there has been substandal progress on price decontrol since 1988,many potential exportables and inputs into goods that are potendal exportables remain price-controlled. These controls reduce the profitability of investments in these industries, and theincentives for incumbent firms to improve product quality. Stringent controls still apply to theprocurement and distribution of a variety of products, including industrial raw materials such as dairyproducts, cotton, maize-meal, and wheat. Parastatals such as Kenya Creameries, Kenya NationalTrading Corporation, and CSLMB are statutory monopolies in the distribution of these inputs, anddownstream industries are forced to rely on them, even if they have access to cheaper and betterimports. As in the cotton textile industry, efficiency and product quality have suffered as a result,raising costs and hurting export compeddveness.
2.75 Infrastructure and Business Services. While the policy and regulatory environment hasbeen the focus of reform efforts in Kenya, little attention has been given to improving the quality andavailability of services required for the operadon and growth of private businesses. These includeinfrastructure facilities, information services, entrepreneurial development, job training programs,and consultancy services. Constraints in these areas are particularly stringent for exporters. Forexample, programs to assist exporters, which are implemented through the Ministry of Commerce,have been ineffecdve in providing the range of services required to upgrade and reorient productsand facilides to compete effecdvely in demanding external markets. In particular, the supply ofconsultancy services in areas such as market research, product and packaging design, quality control,and production engineering, needs to be improved. Deficiencies in physical infrastructure affectdomestic and external trade. For instance, shortages of forklift and cold storage facilities at NairobiAirport limit the growth and quality of hordcultural exports, and inefficiencies in handling atMombasa Port and for transit and inland container traffic substantially raise transport costs.
C. Strengthening the Financial System
Structure and Constraints
2.76 Kenya has a diversified financial system, including commercial banks, near-bank financialinstitutions (NBFIs), building societies, development finance institudons (DFIs), the Nairobi StockExchange (NSE), insurance companies and pension funds. Despite this range of institutions and therapid growth in their numbers during the early 1980s, financialization of savings in the Kenyaneconomy remains at a low level. The share of domestic savings held as financial assets with theformal financial system averaged 30 percent in 1984-87, almost the same as in the late-1970s.Financial assets as a share of GDP averaged about 6 percent, significantly higher than other Sub-Saharan African countries but below the levels for developing countries in Asia and Latin America.

56 Chapter 2: Deepening Structural Adjustment
The ratio of broad money (M2) to gross output, which is used as a measure of the monetization oftransactions, fell from 34 percent to 29 percent between 1978-80 and 1984-87, largely from a switchin deposits to NBFIs, whose share of total deposits rose from 17 percent to 32 percent between 1978and 1987. If NBFI deposits are included in a broader definition of money (Chapter 1), the ratio ofM3 to GDP remained constant between the two periods (41 percent).
2.77 The most important sources of private sector credit have been commercial banks (trade,large-scale manufacturing and agriculture); NBFIs (domestic trade, small services, and real estate);building societies (housing and construction); and DFIs (long-term lending). Despite the expansionof the NBFI sector in the early-1980s, comnmercial banks still dominate the financial system, withabout 70 percent of total loans and advances in 1988. The four largest banks accounted for about58 percent of bank deposits and 65 percent of bank assets. Two of these are majority-owned andcontrolled by the Govermment (Kenya Commercial Bank and National Bank of Kenya), and hadover a quarter of commercial bank assets. The NBFI sector grew rapidly during 1976-83. Thenumber of NBFIs rose from 19 to 34; total deposits increased almost five-told (to KSh 8.7 billion);and the share of loans from 20 to 30 percent. It was also less concentrated than the banking sector,with the four largest institutions accounting for about 30 percent of NBFI deposits. To circumventCentral Bank of Kenya (CBK) regulations and supervision, commercial banks began setting up NBFIsin the early 1980s. By 1985, 12 of the largest NBFIs were affiliated with commercial banks.Although commercial banks and NBFIs compete for term deposits (mostly from parastatals andinsurance companies), they differ in their lending activities as a result of regulatory differences. Forinstance, only commercial banks could provide overdrafts, while hire-purchase and leasing activitieswere restricted to NBFIs. Moreover, since NBFIs were subject to higher interest rate ceilings, theymobilized longer-term liabilities by offering higher deposit rates, and provided more long-term fundsto a broader clientele, including small-scale firms.
2.78 Although the Government intervened only intermittently in the allocation of credit to theprivate sector,'2 it preempted a substantial and rising share of loanable funds for its own use, bothin financing the budget deficit and in funding parastatals directly or through the DFIs. TheGovernment's share of net domestic credit rose from about 20 percent in 1978 to 38 percent in 1986.Funds were also mobilized through the imposition of high liquidity requirements (held in the formof government paper) on banks and NBFIs, and by investing a large portion of the funds of theNational Social Security Fund (NSSF) and Post Office Savings Bank (POSB) in govermentsecurides.
The Need for Adjustment
2.79 The efficiency and depth of Kenya's financial system was affected by four sets ofconstraints. First, regulations varied both by type of financial institution and financial instrument.The most notable example was the difference in CBK regulations that applied to commercial banksand NBFIs. Relative to NBFIs, commercial banks were subject to lower loan rate ceilings, highercapital requirements and limits on private sector credit expansion, could not levy non-interest feesand service charges, were governed by a variety of liquidity and prudential requirements, and weresupervised more closely by CBK. Among financial instruments, debt financing benefited from
12 The only selectivccredit measure requiresthat commercial banks lend 17 percent of their deposit liabilities to agriculture.This requirement is gonerally not enforced and therefore largely ignored.

Chapter 2: Deepening Structural Adjustment 57
preferential tax treatment relative to equity financing due to the double taxation of dividends (at boththe corporate and individual levels); the withholding tax on capital gains realized by individualinvestors; and the taxation (at the corporate rate) of the premia realized by companies on sales oftheir shares.
2.80 These regulatory differences had adverse effects on the financial system and the availabilityof financing to the private sector. They led to excessive growth in the number of NBFIs andbuilding societies during the 1980s, and due to low entry barriers and inadequate supervision, mostwere under-capitalized and poorly managed. As compedtiion between these institutions andcommercial banks intensified, many of them invested in riskier assets, mismatched asset and liabilitymaturities, and squeezed their margins by offering higher rates than commercial banks for termdeposits. A credit squeeze in 1985-86 resulted in the failure of four indigenous banking groups, allof which owned NBFIs and/or building societies. By 1987 the systemic problems of illiquidity andinsolvency affected large parts of the NBFI sector. The differences in effective loan and deposit rateceilings also contributed to the segmentation of financial markets by maturity and risk. Theseceilings, which were undifferentiated by maturity or sector, provided no incentive for commercialbanks to broaden their loan maturities or to seek new clients. Hence, commercial banl lendingremained concentrated among few firms and sectors, relying mainly on overdraft financing. NBFIswere able to attract longer-term deposits, and lend at higher rates because they were subject to higherceilings and could legally charge additional service fees. As a result, they undertook more long-term, and often unsecured lending, to borrowers whose creditworthiness or asset positions did notqualify them for commercial bank loans. Moreover, the differences in the taxation of equityfinancing instruments stunted the growth of Kenya's capital market by reducing the demand forsecurities among investors. By raisilag the costs of public issues, the incentive for firms to raiseadditional equity was reduced, encouraging firms to become excessively leveraged.
2.81 The inadequate regulatory and legal framework for the financial system, and weaknessesin prudential supervision were a second important constraint. The application and enforcement oflaws regarding reporting, audit requirements and contracts was weak; the regulatory powers of CBKunder the Banking Act were limited; and its enforcement of banking regulations and supervision offinancial institutions was hindered by lack of staff and inadequate information. The effects of theseweaknesses were apparent in the growth of NBFIs and building societies in the early 1980s. Topromote indigenous financial institutions, the sector was subject to low entry barriers, and lessstringent liquidity, capital and reserve requirements. Building societies were not placed under theCBK's supervisory control until 1987. As these institutions expanded, many were under-capitalized,lacked adequately trained staff, and were subject to little supervision by CBK whose limitedsupervisory abilities were already overstretehed. Poor financial practices, fraud, and mismanagementled to increasing liquidity and solvency problems for many of these new institutions. Following thecollapse of four banking groups in 1985-86, the Government took steps to improve CBK's ability toregulate and supervise banks, NBFIs and building societies, and to impose more stringent licensingrequirements for new institutions. By this time, however, illiquidity and insolvency affected a largesegment of the financial system.
2.82 The third notable aspect of the policy environment was the weak monetary controlexercised by the CBK. The main instrument of monetary control was the use of ceilings oncommercial bank credit to the private sector. Through enforcement of these ceilings, the CBKattempted to offset the effect of large fiscal deficits on monetary expansion. This was the caseparticularly following the coffee booms of 1980 and 1986, during which rapid monetarv expansion

58 Chapter 2: Deepening Structural Adjustment
continued as a result of high public expenditures even after coffee prices fell. In addition to theefficiency costs of credit controls, these problems have been compounded by weak and selectiveenforcement of the ceilings, and lack of compliance by banks. Weak enforcement restricted theGovernment's ability to use monetary policy to control inflationary pressures stemming fromexpansionary fiscal policy. Selective application and enforcement of credit ceilings also contributedto the segrnentation of financial markets. The ceilings did not apply to NBFIs, and even amongcommercial banks their enforcement varied by institution, with the government-owned banks beingparticularly lax in their compliance. Hence, NBFIs and government-owned banks were able toexpand lending even in periods of tight liquidity. Banks for which the ceilings were strictly enforcedalso tightened their credit standards, pushing riskier clients to other banks and NBFIs.
2.83 The fourth feature of financial sector policy was the existence of specialized DFIs thatdirected credit to specific sectors. DFIs were established by the Government with considerable donorsupport in the 1960s and 1970s to alleviate perceived market failures in the provision of long-termcredit and equity. The largest DFIs provided equity and term loans to industrial enterprises,including small-scale firms, and loans for long-term agricultural investments. The Government ownsmost DFIs, and retains effective control in those in which it has a minority stake. In 1987, the DFIsector accounted for about 10 percent of the total assets of the financial system, and by the mid-1980s, the bulk of term lending, relying mainly on concessional funding from donors and theGovernment. In a systemic sense, the operations of the DFIs had two effects. First, they worsenedthe segmentation of the financial sector. Their activities, which were characterized by low fundingcosts, large spreads, and high arrears, made commercial banks even more reluctant to provide termlending. Second, the DFI sector constituted a significant financial drain on budgetary resources dueto their poor financial performance. Most were unprofitable, financially unsustainable, and sufferedfrom serious portfolio problems.
Financial Sector Reforms
2.84 Although the Government implemented some policy reforms in 1986-88, a comprehensivefinancial sector adjustment program was Ilunched in early 1989. This program included policv andinstitutional reforms intended to develop a more efficient and market-oriented financial system. Inparticular, reforms aimed to increase the efficiency of financial intermediation, remove distortionsin the mobilization and allocation of financial savings, and develop more flexible monetary policyinstruments. Institutional reforms were designed to restore public confidence in the financial systemand to upgrade the skills required to supervise and regulate financial institutions. Over the past twoyears measures have been taken to relax controls on interest rates, develop and initiate use of indirectmonetary policy instruments, strengthen the framework for the regulation and prudential supervisionof financial insdtutions, restructure troubled financial institutions and DFIs, and develop capitalmarkets.
2.85 Interest Rate Liberalization. As part of its reform program, the Government aims toachieve full interest rate liberalization by mid-1991. Substantial progress has been achieved since1988 in making the interest rate structure more market determined. Since 1989, the ceiling onsavings *;eposit rates (for commercial banks and NBFls) has been raised progressively from 10.0percent to 13.5 percent, ceiling lending rates for banks raised from 15.0 to 17.5 percent (for loansof up to 3 years), and from 18.0 to 19.0 percent for NBFI loans. Since April 1989, the ceiling onlong-term bank loan rates (currently those with maturities greater than 3 years) has been brought inline with the ceiling for NBFI lending. These changes in interest rate ceilings have harmonized the

Chapter 2: Deepening Structural Adjustment 59
interest rate structure across institutions, and allowed banks greater flexibility to vary interest ratesaccording to loan maturides. As for the transition to market-based rates, the most significant policychange has been CBK's removal in April 1990 of the requirement that the ceilings on loan interestrates included all lending-related charges and fees. With levies and charges now permitted, effectiveinterest rates on loans can significantly exceed the ceilings.
2.86 Monetary Policy. The Government intends to shift from credit controls to indirectmonetary policy instruments. Toward this end, it has taken steps to improve data availability andset up the institutional framework required to use reserve money management and open marketoperations to conduct monetary policy. CBK has improved the coverage and timeliness of monetarystatistcs, and has begun using a monetary programming framework based on forecasts of reservemoney changes. The Monetary Policy Committee, which was established in 1988, has assisted inthe improvement of databases and in the use of monetary programs. While Treasury bill (T-bill)rates remain controlled, the Government has taken measures to remove the policy and institutionalconstraints on the operation of T-bill and T-bond markets including the activation of auctions,reforms in the tendering mechanism, and the issue of a broader range of T-bills.
2.87 Regulation and Supervision. As noted above, the collapse of four banking groups in 1985-86 and the financial difficuldes of several other institutions were largely due to the lack of anadequate regulatory framework, and the limited capacity of CBK to supervise and monitor financialinstitutions. To address this problem, the Government has taken steps to strengthen both the iegaland technical capacity of CBK to carry out its regulatory and supervisory funcdons. The revisedBanking Act, approved in 1989, enhances CBK's role in several areas including the inspection ofinstitutions, the establishment of reporting, audit and provisioning requirements, the stipulation ofcapital adequacy requirements and exposure limits, and the assessment of penalties against non-compliant institutions. The Act also subjects building societies to more stringent licensing andoperating regulations, similar to those for NBFIs, and reduces further the regulatory differencesbetween NBFIs and commercial banks. To improve the effectiveness and coverage of CBK'ssupervision of financial institudons, efforts are being made to improve procedures and staffing. Newreporting formats and revised examination procedures have been developed, a computerized off-site surveillance data system has been installed, and the frequency of inspections increased. To copewith these increased supervision responsibilities, the staffing of the supervision unit within CBK hasbeen increased, and a training program for its staff has been implemented.
2.88 Restructuring of Financial Institutions. As a result of easy entry, lax regulation, andinadequate supervision, by 1987 it was estimated that 28 private financial institutions (4 banks and24 NBFIs) faced solvency problems on account of non-performing loans and inadequate security.Since these institutions accounted for about 15 percent of the total liabilities of all banks and NBFIs,to preserve public confidence in the banking system it was necessary to implement an orderlyrestructuring program. In 1989, the Government implemented a restructuring program for 10troubled institutions (including 2 NBFIs that were not among the 28 identified earlier) based on auditsand inspections by CBK staff. Implementation has consisted of the merger of these a'.'3 -s and NBFIsinto a new bank-the Consolidated Bank of Kenya. The establishment of this bank was assisted withpayouts from the Depositor Protection Fund, which was also strengthened and recapitalized as partof this exercise, and by the conversion of parastatal deposits into equity.
2.89 The Role of DFIs. In light of the operational and financial problems faced by DFIs, as wellas the segmentation of the financial market that results from their specialized lending, the

60 Chapter 2: Deepening Structural Adjustment
Government has prepared a program to restructure these institutions. The need for restructuring isheightened by the likely impact of other financial sector reforms under implementation, most notablywith regard to interest rate liberalizadon and changes in the regulatory framework for financialinstitutions. It is expected that these reforms would lead to increased provision of long-term creditby commercial banks and NBFIs, which would compete with the industrial DFIs for this marketniche. Without comprehensive restructuring, it is unlikely that the DFIs would be able to copeeffectively with competition from these new entrants. Given these concerns, it is necessary to reducethe number of DFIs, to broaden the activities of those that are judged to be viable, and to effectreforms to assure their commercial operation and long-term sustainability.
2.90 As a first step, a comprehensive restructuring plan has been drawn up for the two largestindustrial DFIs-Industrial Development Bank (IDB) and Industrial and Commercial DevelopmentCorporation (ICDC). The restructuring proposal covers changes in their mandates, autonomy,funding, organization, and lending/investment processes. Specific actions that would be implementedfor these DFIs include: restructuring of their balance sheets through phased divestiture andconsolidation of assets; use of mechanisms to ensure commercial and self-sustaining operations,including explicit budgetary compensation for projects in which DFI participation is sought on non-commercial grounds; organizational changes to improve accountability and institute performance-based incentive mechanisms; and improvements in collection and supervision practices. RestructuringIDB and ICDC along these lines is aimed at establishing them as viable and commercially-orientedDFIs, which would not rely for their operations on periodic capital injections from the budget orexternal donors.
2.91 Capital Markets. Several policy and institutional measures have been implemented tostimulate the development of capital markets. In the policy area, the reforms have focussed mainlyon enhancing the returns from equity investments, thereby reducing the bias favoring debtinstruments. These measures, some of which were announced in the FY91 Budget, include: removalof the Capital Issues Committee's role in regulating share issues; elimination of the double taxationof dividends by conversion of the withholding tax into a final tax; elimination of the corporate taxon the dividend income of unit trusts; exemption of the withholding tax on the dividend income ofcorporate tax-exempt bodies such as pension plans; abolition of stamp duties on retail sharetransactions; and tax deducdbility of all costs incurred in the issue of shares, debentures and bonds.The Government also adopted a revised Unit Trusts Act to liberalize regulations for establishingand operating investment trusts, including provisions that apply to foreign investors in these trusts.To strengthen the institutional and regulatory framework for the securities industry, the CapitalMarkets Authority Act was enacted in 1989. The Act defines the roles and responsibilities of variousparticipants, and provides for the implementation of investor protection measures by the CapitalMarket Authority (CMA), whose mandate would also include the development of the securitiesindustry.
The Medium-Term Agenda
2.92 Substantial progress has been achieved since 1988 in moving toward a market-determinedinterest rate structure. The most significant step in this direction was the removal by CBK in April1990 of all restrictions on the levies of lending-related fees and charges by banks and NBFIs.Therefore, institutions now have greater flexibility in setting their lending rates to reflect currentmarket conditions. The Government intends to fully liberalize interest rates in mid-1991. Progresstoward this goal and the sustainability of the reforms, however, is likely to hinge on the

Chapter 2: Deepening Strucural Adjustment 61
Governmnent's success in limiting the budget deficit and domestic borrowing. If the budget deficitremains at levels that require substantial domestic borrowing, the resulting increase in interest rateswould crowd out private investment and raise the costs of servicing government debt. In addition,high interest rates would likely generate considerable public pressure for a return to interest ratecontrols.
2.93 The shift to greater market determination of interest rates is a key precondition for a shiftto indirect instruments of monetary control. But the ceiling on T-bill rates remains a criticalconstraint on the use of open market operadons by CBK for monetary control. Full interest rateliberalization should be preceded by removal of the cap on T-bill rates. This measure would needto be supplemented by steps to improve the mechanism for T-bill issues, to develop a tradingportfolio of government securides (by converting part of the Government's overdraft into T-bills) anduse it to smooth liquidity fluctuations, and to issue bearer T-bills. These changes along with theimprovements in the use of monetary programming and the availability of monetary data would allowCBK to begin implementing open market operations on a regular basis in early-1991. Given its linkto interest rate liberalization, CBK's ability to use open market operations for monetary control alsodepends crucially on the Government's success in controlling the budget deficit.
2.94 With enactment of the Banking Act, and the strengthening of CBK's capacities toimplement its provisioms, the legal framework for the operation of financial institutions and CBK'sability to monitor their functioning have been improved. Most significantly, the licensing of financialinstitutions is now more stringent, and the regulatory differences between banks and Ni3FIs have beenreduced. Further, the new regulations regarding capital adequacy requirements, which were issuedin July 1990, link the capital of all institutions to total assets. CBK's on-site inspection and off-site surveillance functions have also been expanded, and the skills of its staff upgraded. Thesechanges address several of the regulatory and supervisory problems that existed in the mid-1980s.Entry of new institutions is now subject to greater scrutiny, and institutions are inspected andsupervised more systematically. Moreover, the restructuring in December 1989 of ten troubledfinancial institutions has helped cushion the rest of the financial system.
2.95 Despite these improvements, problems remain in two related areas. First, although thereis a more stringent regulatory framework in place, CBK still faces implementation constraints, l)artlydue to continuing shortages of trained personnel, but also because of difficulties in prosecutingviolators. Second, it is also now apparent that the incidence of illiquidity, insolvency, and violationsof the banking regulations are more widespread than was believed in 1987. To deal with thesystemic nature of these problems during the next phase of financial sector reforms, it will benecessary for the Government to focus on improving its implementation of prudential regulation andsupervision. These actions would include stricter enforcement of regulations including theimplementation of the loan classification and provisioning guidelines, use of penalties within thecontext of the Banking Act to deter violations, improvements in the quality of CBK inspections andsupervisions, and time-bound action programs to improve the financial condition of weak institutions.
2.96 Since the restructuring programs for IDB and ICDC focus on assuring commercialoperation and long-term sustainability, they could serve as models for similar programs to restructurethe other DFIs. The Government, however, must establish the viability of each DFI before initiatingsuch a restructuring exercise. DFIs were created to fill specific financial niches, which wereperceived to be under-served by the commercial banking sector. With the policy reforms of the lasttwo years, particularly the liberalization of interest rates, these niches will increasingly be served by

62 Chapter 2: Deepening Structural Adjustment
private financial instdtutions, thereby diminishing the relevance of the DFIs. Therefore, theGovernment should consider liquidating some of the DFIs or merging them with others that servea similar clientele. In deciding on whether to retain specific DFIs. the test should be whether theinstitution has the potential to complement the rest of the financial sector in terms of the range offinancial services it can provide. For instance, the small-scale lending clientele served by KenyaIndustrial Estates (KIE) already overlaps with those of both IDB and ICDC, and with interest ratedecontrol, it would be expected to compete with commercial banks as well. Given KIE's financialproblems, it is unlikely that it can become viable in a competitive environment, and rather thanrestructuring it, its lending operations should be merged with those of IDB or ICDC or itsperforming portfolio should be sold to commercial banks.
2.97 A recurrent concern among Kenyan policy makers has been the limited availability of long-term finance, either as loans or equity. Interest rate ceilings, quantitative credit controls, andgovernim;nt intervention in equity issues have contributed to the lack of development of long termfinancial instruments. The reforms that have been undertaken since 1988 have addressed several ofthese policy-induced constraints and, to this extent, the supply of term finance is expected to expand.However, some policy and structural constraints to the expansion of term finance remain, and thesewould need to be addressed in the next phase of reforms.
2.98 Among these policies are restrictions on the investments of insurance companies, whichare the largest institutional investors in Kenya. The Insurance Act of 1987 requires that lifeinsurance companies invest at least 25 percent of their assets in government securities, and anadditional 65 percent in specified assets (comprising government securities, stocks and debenturesof NSE-listed companies, real estate, and deposits in banks and NBFIs). Similar, but less restrictive,requirements apply to general insurers. The Act also prohibits insurance companies from anyinvestments in privately-held companies. Due to these restrictions, insurance companies haveoverinvested their predominantly long-term liabilities in government securides and real estate, andhave undertaken reverse term transformation by holding short-term assets such as bank and NBFIdeposits. Allowing insurance companies to lend and hold equity in non-publicly trade companieswould expand the availability of long-term funds to such firms and allow insurers to diversify intothe provision of venture capital. This step would also assist in the development of equity marketsby reducing the demand of insurance companies for NSE-quoted stocks, which have depressed themarket yields of these stocks.
2.99 The main structural constraint to the expansion of long-term funding, especially loans,remains the uncertain legal framework for financial transactions. Policy changes such as interest rateliberalizadon would be ineffective in increasing term lending if the enforcement of financial contractscontinues to be difficult because of time-consuming legal procedures and lack of clarity concerningthe rights of creditors. A particular problem in Kenya is the delay and cost involved with theappropriation of collateral by lenders in the event of default, especially when the collateral is land.Another aspect of the legal framework that needs to be improved by making it transparent and moreuniform are the standards of accounting, audit and information disclosure that apply both to financialinstitutions and publicly-traded companies.

Growth Prospects
A. Introduction
3.01 This chapter examines Kenya's longer-term growth prospects, drawing from the analysisin the preceding two chapters. The economy has performed relatively well in recent years,prompting many observers to suggest that Kenyan policy makers sLould now set their sightsbeyond Africa, and emulate the experience of rapidly-developing economies. Given recentprogress, the question then arises as to what type of development effort would be required toaccelerate and sustain higher economic growth in Kenya. The first part of this chapter brieflyexplores some of these issues. The discussion then focuses on economic projections that wouldbe consistent with accelerated growth, including a set of sensitivity analyses. The projectionspresented therefore constitute an optimistic but attainable scenario for Kenya. It should beemphasized that these are projections, not predictions. Thus, the extent to which Kenya'seconomy can come close to meeting these ambitious objectives will depend on the boldness anddetermination of the Government in addressing the economic, social and environmentalconstraints that currently preclude faster growth. Successfully implementing the comprehensiveset of reform measures discussed in Chapter 2 and Section B below would be difficult andessentially require the Government to abandon its previous gradual and cautious approach toreforms in favor of a faster adjustment pace. This would call for considerable effort on the partof the Government. not only in terms of policy design but also in mobilizing the necessarydomestic support, .rom political constituencies and the general public, as well as the donorassistance required to underpin a bold reform program. The projections are intended to show thatwith such a reform program and a reasonable set of assumptions, Kenya could hope to join theranks of rapidly-developing economies over the next decade.
B. Toward Accelerated Growth
3.02 Over the past five years Kenya has enjoyed a marked economic recovery, which hasbeen impressive by Sub-Saharan African standards. Kenya's improved economic performancerelative to the rest of the region, however, can no longer be grounds for complacency. Kenyahas the capacity and potential to join the ranks of the middle-income economies, provided it cancontinue to improve macroeconomic management and deepen structural adjustment. As Kenyaenters the decade of the 1990s, the challenge will be to accelerate rather than merely maintaineconomic growth. Faster economic development is more likely to take place if policies produce astable maccomic environment. Stability can be defined in terms of reasonably low infladon,

64 Chapter 3: Growth Prospects
an appropriately valued real exchange rate, sustainable fiscal and current account deficits, and theavoidance of foreign exchange crises (Fischer and Thomas, 1990).
3.03 In Kenya, as in most countries, fiscal policy is a key to successful macroeconomicstability both because of its direct economic effects on the cuirrent allocation of resources andbecause all methods of financing the deficit have potendally adverse macroeconomic consequenceswhen used to excess. Kenya's current stabilization problems are partly the result of high deficits.A contractionary monetary policy can, for a time, offset the inflationary effects of a fiscal deficit,but monetary authorities in Kenya, as in many developing countries, have only limited scope torun an independent monetary policy. Even if such independence can be increased in Kenya, thecombination of tight money and loose fiscal policy produces high interest rates that reduceinvestment by crowding out the private sector. The need for fiscal moderation does not mean,however, that a zero deficit is optimal. A country that is growing fast can afford to run a higherdeficit than a country that is growing slowly, and a country with a higher savings rate can run agiven deficit for longer than a country with a lower savings rate. Fiscal moderation has to bejudged by the specific circumstances of each country. In the 1986 Sessional Paper, theGovernment targets a budget deficit of 2.5 percent of GDP by the year 2000, which it regards asconsistent with its stabilization objecdves (Republic of Kenya, 1986). This appears as areasonable target for fiscal policy to aim at over the coming decade.
3.04 Macroeconomic policies for stability and economic growth are necessary but far fromsufficient for sustained development. They need to be supported by appropriate sectoral andregulatory policies that remove structural constraints, efficient investments in social and economicsectors, and improved quality and competence of the Government. In addition, povertyalleviation and improved environmental management require special attention - both in their ownright and because of their influence on the sustainability of development.
3.05 As discussed in the previous two chapters, since the mid-1980s Kenya has madeconsiderable progress in implementing its stabilization and sectoral adjustment programs. TheGovernment has lowered the budget deficit and reduced its borrowing from the banking system,maintained positive real interest rates, adopted an appropriate exchange rate policy, and generallyadhered to a prudent foreign borrowing strategy. The stabilization task, however, is far fromcomplete. The level of public expenditures remains high, especially the public sector wage bill,monetary expansion and inflation need to be restrained, and the economy continues to confront adifficult external position. In terms of structural adjustment, the Government has implementedgradual and cautious reform programs in the key sectors of agriculture, industry and the financialsystem. The analysis in Chapter 2 suggests that while the results in agriculture have been mixed,reform programs in industry and the financial sector have proceeded in line with theGovernment's overall adjustment objectives. To a considerable extent, Kenya's recent economicrecovery can be attributed to an improved macroeconomic environment and sectoral reformsimplemented by the Government.
3.06 As discussed in Chapter 1, Kenya's economic recovery remains vulnerable as a resultof domestic and external imbalances, and an uncertain international enr ..onrnent. There is littledoubt, however, that Kenya enters the 1990s in a stronger position than it did the decade of the1980s. During the second half of the 1980s, Kenya completed a first round of structuraladjustmnent reforms. Although the reforms themselves and the results have been far from radicalor spectacular, they have demonstrated a sustained Government commitment to grappling with

Chapter 3: Growth Prospects 65
difficult adjustment issues. Maintaining this commitment has been important given Kenya'sprevious lack of success in implementing and sustaining structural reforms in the early 1980s.Having laid a better foundadon for sustained economic growth, the task ahead should be to setthe stage for accelerated growth and development. At the same time, consolidating progress insectoral adjustment will be necessary but not kufficient to accelerate growth beyond the recenteconomic recovery or to absorb external rhocks.
3.07 As Kenya enters a deepening phase in its adjustment process, it faces a different, and toa considerable extent, more difficult set of issues in each of the sectors. In a sense, during thefirst phase of adjustment t.e Government attempted to address the more immediate and, arguably,the relatively easier adjustment constraints. In agriculture, improving producer incentives hasplayed a najor role in stimulating agricultural growth. To sustain and accelerate agriculturalgrowth, however, the Government's reform effort will have to focus on the more difficult areasof liberalizing agricultural marketing and input supply, improving institutional arrangements forL.searclh, extension and credit, and increasing the efficiency of public spending iii the sector. Inthe industrial sector, import liberalization of raw materials, intermediates and capital goods, andselected price decontrol have contributed to higher industrial growth. A deepening of adjustmentin the industrial sector will now need to focus on lowering the level of protection, reducing theanti-export bias, loosening the regulatory environment, and reducing government ownership in thesector. In the financial sector, the Government is taking steps to liberalize financial markets andinterest rates, and to deepen capital markets. These measures will pose new challenges in termsof implementing monetary policy, regulating a freer financial system, and introducing thenecessary legal and institutional changes that can deepen capital and money markets.
3.08 Kenya's economy is and will remain a mixed economy. The Government'sdevelopment strategy stresses the central role of markets and the private sector as the engine ofgrowth. As stated in the current Development Plan, for its part "the Government will.. .do whatit can do best" (Government of Kenya, 1989; p. 2). This means, the Government will: (i)ensure a stable political and economic environment; (ii) provide adrninistrative services thatcannot be readily provided by private enterprise; (iii) provide infrastructure that supports privateactivity; and (iv) ensure an enabling environment for the private sector. It will rely less oninstruments of direct control and increasingly on competitive forces in the economy, that canstimulate growth while simultaneously contributing to widely shared development (Government ofKenya, 1986).
3.09 Although Xenya has a dynamic private sector, the.-e is a growing perception thatexcessive government regulatdons and lack of transparency in their applicatdon are constrainingnew private sector initiadves, both domestic and foreign. When coupled with the still largepublic sector claim on the economy's resources, the regulatory environment constrains the abilityand willingness of the private sector to respond to improved policies and incentives. Althoughthe Government has made some progress in this direction (e.g., price decontrol), much can bedone to reduce the scope for discretion and arbitrariness in economic decision making bysimplifying and reducing controls on private sector activity. The successful adoption of automaticimport licensing shows that the scope for reducing rent seeking and enhancing transparency canbe greatly increased by remo *ing discretionary powers.

66 Chapter 3: Growth Prospects
3.10 In creating an efficient enabling enviromnent for development, a clear need is toimprove the quality and competence of the Government. Although by Sub-Saharan Africanstandards, Kenya has a competent and professional public service, a more ambitious pace ofdevelopment would require improvements in four key areas. First, thern is a n d to strengthenthe core agencies that formulate and implement economic and sectoral policies. The success ofreform programs will depend as much on Government commitment to adjustment, as on thepublic sector's ability to design, implement and manage them efficiently and credibly. Second,there is a need to rationalize and divest government ownership of public enterprises. Asdiscussed in this and previous Bank economic reports, the size and efficiency of the parastatalsector in Kenya is at odds with the Government's strategy of assigning the private sector aleading role in development and limiting government intervention to what it does best.
3.11 Third, within the public sector itself there is an urgent need to improve the mechain;qmsfor policy making, expenditure allocation, and financial management and control. Improving theway public expenditure priorities are established, reviewed and implemented is necessary tostrengthen the quality of adjustment programs. Strengthening the Governrnent's budgetradonalization program and improving its public investment program are critical priorides.Fourth, there is a need to gradually revamp personnel and incentive policies in the public sector.The problem lies not only in the large size of public sector employment in Kenya but also thequality of personnel, which is linked to incentive policies. As a number of Bank economic andsector reports have pointed out, continued expansion in recruitrnent has severely squeezedrecurrent expenditure allocadons to essential non-wage operations and maintenance. This reducesthe efficiency of resource use in the public sector ano constrains the flexibility of fiscal policy.In addition, the large and growing size of the civil serv ce as well as the need to control spendingseverely hampers the ability of the Government to recruit, retain and motivate qualified staff. Atpresent, many posts in the lower civil service grades (job groups A-G) are overfilled, whilemiddle grades (H-M) and higher grades (N-T) are underfilled (Republic of Kenya, 1990). Giventhat public sector saiaries are not competitive with the private sector, it is not surprising thatprofessional atid technical expertise is in short supply within the Government. In light of theneed for fiscal prudence, efforts should be made to considerably reduce recruitment at lowergrades and utilize part of the savings to improve remunerations for skilled and professionalgrades.
3.12 In addition to deepening the adjustment process in productive sectors and the publicsector, over the longer-term Kenya faces the need to ensure that economic growth is moreequitable and environmentally sustainable. The Government's development strategy emphasizesthe -d to ensure rapid growth to reduce the incidence of poverty. Much of the Government'sadjustment effort has benefited the poor directly (e.g., by improving producer incentives for thesmaliholder sector and nomadic pastoralists) and indirectly by stimulating economic growth andemployment. To a considerable extent, financing the rapid expansion in social services in Kenyasince Independence has been possible because of a development strategy that has sought toemphasize growth. Although there are no reliable data on the extent and incidence of poverty inKenya, social indicators suggest that the process of economic development has helped to alleviatepoverty, especially in light of the country's explosive populadon growth. Whatever the extent ofabsolute poverty in Kenya today, it would be difficult to argue &tl a development strategy thatplaced less emphasis on economic growth would have improved xile lot of the poor. Povertyalleviation, however, should be a development goal in itself. In Ker,a's case, the Government isfocusing its development strategy on the type of growth that can beniefit the poor directly. Labor

intensive and smallholder-based growth will reduce poverty. Because export production istypically labor intensive, whether based on the smallholder agriculture sector or manufacturedexports, it can have strong pro-poor effects. In addition, there is a need to improve theeffectiveness and targeting of public expenditures to ensure they reach the poor.
3.13 Human resource development in Kenya has been both an independent goal ofdevelopment and a critical instrument of economic progress. Kenya has recorded remarkableprogress in meeting the education and health needs of its population, and there are recentindications that fertility has begun to decline. These improvements have been the direct resuit ofdecisions by the Government and households to invest heavily in education and health programs.Despite considerable progress, much remains to be done to improve coverage and access by low-income groups. The Government now faces a difficult challenge. The need to ensure fiscaldiscipline implies that the wholesale expansion in social programs as a means of improving accessand reducing regional and income disparities will not be possible. Targeted expansion, combinedwith policies to selectively increase cost sharing and improve the efficiency of resource use insocial spending will be required. Thus, in the human resource area Kenya faces the need to domore with less.
3.14 Environmental problems in Kenya stem largely from population pressures on limitedland resources. Dcpletion of woodlands and forests is a major cause of soil erosion and landdegradation, contributing to lower productivity, decreased water holding capacity, a reduction ofdry season water resources, and encroachment on wildlife and natural habitats. Environmentalproblems are particularly severe in ASAL areas, which are more susceptible to ecological damageresulting from population pressures. These pressures are exacerbating conflicts with wildlife,particularly in dispersal areas around national parks where increased farming activities are cuttingoff the migration routes of wildlife and their access to dry season water and pasture. In additionto its importance in terms of biodiversity and habitat preservation, wildlife is the cornerstone ofKenya's tourism industry. Aside from its efforts to deal with forestry issues, the Government hasonly recently begun to perceive the need to strengthen overall environmental management inKenya. The Government's immediate priorities are to improve policies and institutions in theforestry sector, arrest the deterioration in the wildlife sector, and begin formulating a strategy forenvironmentally sustainable development in ASAL areas. While these priorities are appropriate,over the medium term there is a need to develop and implement a more comprehensiveenvironmental management and action program.
C. Target Scenario
3.15 The target scenario assumes that the stabilization policies are on course and thatstructural adjustment is deepened along the lines discussed above and in Chapter 2. Thesepolicies would further decentralize economic decision-maidng, encourage private sector activity,improve macroeconomic efficiency, stimulate nentraditional exports, strengthen the balance ofpayments, reduce Kenya's dependence on external financing and challenge the economy toaccelerate rather than merely maintain recent growth. The target scenario a!so assumes acontinuation of modest growth and inflation in the industrialized countries, limited recovery ofcoffee prices and a levelling off oi real interest rates in international markets (Table 3.1).

68 Chapter 3: Growth Prospects
Table 3.1Assumptions Under the Target Scenario
(Percentages)
Projected Annual % Growth Rate1989 199S 2000 1990-95 1995-2000
Economic ActivityG-V growth (% p.A.)' 3.8 3.0 3.0 - -
0-V inflation(1985 = 100)' 144.7 195.2 203.0 5.0 3.9
Domestic inflation (% p.a.) 10.5 5.5 5.5 7.7 5.5
Commodity price indices(1988 = 100)
Coffee 66.6 95.4 128.9 3.5 3.4ea 107.0 153.7 183.5 3.7 3.5
Petroleum lC-. 1 154.6 236.8 6.1 8.5Manufacturing 99.3 132.5 158.8 4.8 3.6
Imports: Income elasticities
Imports NFS2 0.8 1.3 1.0Food, etc. 0.8 1.1 1.0Fuel, etc. 0.8 1.1 1.5Primay intermediate 1.7 1.6 1.6Chemicals 1.2 2.0 1.9Capital goods 1.6 1.8 1.7Other consumet goods 0.6 1.0 1.0
S-V counties are France, Germay, Japan, the United Kingdom and the United States.2 Bawed on osdinary kest squsres estimates for 196S-89.' Mainly manufactues, nt included celwhere.
Source: Staff esdmates.

Growth Prospects
3.16 Under the target scenario, GDP at market prices is projected to grow at 5.6 percent perannum during 1990-95 and 7.0 percent during 1995-2000, compared to 5.8 percent during 1985-89 (Table 3.2). The corresponding projections for GDP at factor cost are 5.1 and 6.3 percentand reflects the assu.mption that coffee price recovery would be limited and that growth inindustrialized countries would be modest. Accelerated growth beyond this period would be basedon a strong agricultural sector, widespread rural non-farm activities with extensive backward andforward linkages to agriculture and industry, and a dynamic informal sector.
3.17 Although agriculture has thepotential to repeat and even exceed the1985-89 performance (4.4 percent per Box 3.1annum), the projected growth rates Kenya's Growth Jnperativehave been conservatively estimated at3.8 percent during 1990v95 and 4.0 Kenya must grow in order to create jobs and sustainpercent during 1995-2000 (Table 3.2). improvements in per capita incomes. Its population,percent dur tng ablet3eaher which is growing close to 4 percent per year, willThis reflects uncertainty about weather double in about 20 years. This population growthconditions and the behavior of major reflects high fertility levels as well as a reduction incommodity prices. Even so, the mortality. Fertility levels recently began to fall butperformance of the agricultul: sector this will have no effect on Kenya's labor supply overis predicated on yield increast.s (rather the next 15 years since all those who will have joinedthan expansion of land under the labor force by then are alive today.cultivation) which are expected to behighest among smallholders (Box An estimated 400,000 new jobs will have to be3.2). generated annually to absorb these workers. An even
larger number will be needed to reduce urban
3.18 Growth would also be driven unemployment below the current level of 16 percent.by a restructured, more efficient and A recent report found that employment growth hasexport-oriented manufacturing sector been rapid in the urban informal, rural nonfarm and,to a lesser extent, agricultural sectors (World Bankwhich would expand at a trend rate of 1988a) . This occurred because of policies which7.4 percent in 1990-95 and 11.0 supported agricultural growth, especially bypercent in 1995-2000 (Table 3.2). smallholders, and stimulated the demand for non-farmDuring 1985-89, the sector grew at activities. Many of these activities were in the5.7 percent per annum. Firms informal sector which is relatively unencumbered byemploying over 50 indiviuuals government interventions. The report concluded thataccounted for around 81 percent of economic growth above 5 percent, combined with athis growth and 88 percent of the strategy of rural and small-scale urbanemployment generated. In future, industrialization, and the promotion of rural nonfarmfirms employing fewer than 50 and urban informal activities, would permit Ken)a toindividuals are expected to increase the meet its employment targets over the coming decade.competitiveness and flexibility of thesector as a whole by serving as

70 Chapter 3: Growth Prospects
sources of low-cost inputs into larger-scale firms, and as conduits for labor skills and productdesigns. "
3.19 Services (including tourism) expanded at a trend rate of 5.4 percent in 1985-89.Tourism arrivals and gross foreign exchange receipts, which are partially captured in the servicesaccount, also grew steadily. However, the industry has greater potential. Currently, foreign,xchange 'leakages" are high: 62-78 percent for inclusive-beach-oily holidays when travel to andfrom Kenya is by a foreign carrier, and 34-45 percent for inclusive tours which cover beachresorts and safaris when international travel is by a foreign carrier (World Bank, 1990)." Whensimilar tours involve international travel on Kenya Airways, the "leakages" are estimated to be12-22 percent for beach hiolidays and 12-18 percent for beach and safari packages. KenyaAirways, however, transports only a small proportion of arrivals. In any case, other factors areundermining the potential of the industry, including: (a) the uncoordinated development which hasresulted in inappropriate mixes of rival forms of tourism activities; (b) inadequate infrastructure,including access roads in areas with considerable potential for expa 'on; and (c) unsustainabledevelopment of specific areas such as the Amboseli and Masai Mara Game Reserves.
3.20 The projections assume that these problems will be overcome, security will beimproved, the planned restructuring of Kenya Airways will improve its efficiency and carryingcapacity, and that new markets in areas which have a high growth potential such as Japan andAustralasia, will be exploited. As a result, the growth in tourism earnings would exceed thoserecorded in 1985-89. However, the overall service sector would only grow at marginally higherrates of 5.S percent in 1990-95 and 6.5 percent in 1995-2000 because Government, which isincluded in services, is expected to be rationalized.
3.21 Given the dynamism accorded to manufacturing, its share of GDP is projected to risefrom 10.2 percent in 1989 to 13.5 percent by end-2000. Because the projections have beencautious about agriculture, its share of GDP is expected to fall from 27.1 percent in 1989 to 21.5by end-2000. However, the share of services is expected to remain close to 41.0 percent of GDPthroughout the period.
Consumption, Savings and Investment
3.22 In keeping with the strategy articulated in the Sixth Development Plan, the projectionsshow domestic savings rise from 17.2 percent of GDP in 1985-89 to 20.7 percent of GDP in1990-95 and 22.7 percent of GDP in 1995-2000 (Table 3.4). Under this target scenario, savingsby the Central Government would need to rise by 1.0 percent per annum during 1995-2000 asfiscal discipline improves. Table 3.3 also shows total consumption contracting from 82.1 percentof GDP during 1985-89 to 81.0 percent of GDP (1990-95) and 79.1 percent of GDP (1995-2000),respectively, with the burden of adjustment falling on both public and private consumption.
At present, their activities range from food processing to the production of steel sinks but these smaller firms interactwith larger frms nuanly in garments, metal working, grain milling, baking and furniture manufacture.
14 Le-akage refers to the percentage of tourists' expenditure on inclusive tours which remains overseas as touroperators' and foreign airlines' costs and profits.

Table 3.2Selected Indicatons of Economic Growth, 1985-2000
(Percentages)
1985-89 1990-95 1995-2000
Average real growth rates (% p.a.)Gross domestic product (mp) 5.8 5.6 7.0Gross domestic product (fc) 5.0 5.1 6.3
Agriculture 4.4 3.8 4.0Manufacturing 5.7 7.4 11.0Services 5.4 5.5 6.5
Merchandise exports (fob) 2.8 6.1 7.7Coffee -4.5 3.6 3.5Tea 6.9 4.7 4.0Petroleum 0.4 1.9 2.0Horticulture 6.4 9.3 11.9Manufactures 6.0 9.0 11.5
Merchandise imports (cif) 8.5 a/ 5.2 8.7Food -1.9 4.9 3.6Petroleum and other energy 2.7 4.6 7.7Intermediate goods 11.5 7.6 11.9Capital goods 1I.2 al 4.9 9.5
Fixed investment 6.7 4.6 9.0Consumption 7.6 5.5 6.2
Central Government 5.5 4.6 5.7Private 7.9 5.8 6.3Per capita private - 1.6 2.4
Monetary growth rates (% p.a.)Broad money (M2) 13.5 8.1 12.5Domestic credit 13.9 12.2 17.?Private credit 15.1 22.3 22.9
Memo items:ICOR 4.6 bl 4.4 3.7Import elasticity (GNFS/GDPmp) 0.54 1.30 1.00Marginal savings rates
Gross national savings -0.17 0.30 0.25Gross domestic savings -0.10 0.30 0.27
Broad money (M2)/GDP 0.29 0.21 0.20Average annual foreign
exchange gap (US$ mi0ion) - 52.2 26.7
E Excludes pmWciI ipoiu and leases.bi 1989.
Source: Staff esarmes.

72 Chapter 3: Growth Prospects
Box 3.2Smallholder Contribution to Agricultural Growth Prospects
Three commodities illustrate the potential contribution of small-holder production to agriculturalgrowth prospects in the medium- to long-term. In the coffee subsector, production grew by 4.9percent per year during 1970-87. Production by small-holders (about 70 percent of nationalcoffee output) was vibrant and grew at a rate of 6.7 percent per annum during 1970-87. Thislargely resulted from increases in area under cultivation since yields were low because of lowlevels of input usage. In contrast, production by estates expanded by 2.7 percent due largely toimprovements in yield. Smallholders are expected to maintain their higher contribution togrowth. However, they will have to reverse inadequate application of inputs brought about by(i) insufficient finances to purchase inputs from sources other than cooperatives; and (ii) lack ofk-nowledge on the role of inputs in increasing output. The payments system would also have tobe improved. At present, payments to smallholders are staggered over nine months whileestates receive payments in about one week. Greater attention would also have to be given tocontroling the Coffee Berry Disease and to providing prernia for higher quality beans.Investments in on-farm irrigation systems and in processing capacity at factories and theprovision of competitive wages, especially for harvesting, would be necessary. Bank staffestit -,ate that with improvements in the payments system, extension, input availability and usage,irri ation systems, quota allocation (based on quality) and modest in-roads into the non-quotamarket production, output would grow at 4.1 percent per annum. Further improvements incultural practices and accelerated growth in export markets could simulate growth of 5.3 percentper annum.
Smallholders in the tea subsector, who account for about half of production, have also beenmore dynamic than the larger estates but their yields are about 50 percent lower. Thediscrepancy in yields is explained by inferior cultural practices, financial constraints, inadequateinput use and logistical problems associated with crop collection. Over the medium- to long-term, production could grow between 4.7 percent and 6.3 percent per annum. Performance atthe lower end of the range is premised on more timely payments to farmers which would enablethem to compete effectively for labor during the barvesting period, improvements in theavailability of fertilizers in appropriate packages, and investment in processing capacity.Growth at the higher eud of the range could occur if feeder roads and extension and researchare upgraded and if thn demand in traditional and non-traditional export markets strengthensconsiderably.
Increases in maize production in recent years have originated largely in improvements in yieldassociated with the use of new varieties and a strengthened extension program. But theseimprovements have largely benefited large scale commercial farms. Accordingly, smallholderestablishmrents are likely to derive the largest incremental benefit through use of hybnds andfertiizers. Research would need to be intensified to find high yielding varieties which aresuitable for high elevations as well as methods for dealing with maize smut and streak diseasesand striga infestation. If these problems are overcome, mnaize production could grow at about 4percent per annum. A higher growth performance of 6 percent a year would depend oncomplete liberalization of the internal maize marketing system.

Table 3.3Selected Indicators of Economic Structure, 1985-2000
(Percentages)
1985-89 1990-95 1995-2000
Economic structure as % of GDPAgriculture 26.6 25.8 23.0Industry 17.0 17.3 18.8
Manufacturing 11.0 i0.8 12.3Services 42.0 41.6 41.2Gross national savings 14.3 18.5 21.1
Central Govemment -1.4 -0.7 1.0Private savings 15.7 19.2 20.1
Gross domestic savings 17.2 20.7 22.7Gross investment 21.0 23.4 24.9Fixed investment 16.5 19.6 21.1Consumption 82.1 81.0 79.1
Central Government 16.7 16.9 16.5Private 65.4 64.0 62.6
Total Government Revenue 21.4 23.3 24.1Total Goverment Expenditure 27.7 27.6 26.9Fiscal deficit -6.3 -4.3 -2.8Current account -6.4 -4.5 -3.5Non-interest current account -3.7 *2.5 -2.2MLT debt service/exports 34.9 25.4 13.0MLT debt/exports 254.1 212.0 168.0MLT debt/GDP 62.5 54.5 46.2
Sourcc Sraff esdanzues.
3.23 During 1985-89, gross investment in Kenya averaged 21.0 percent of GDP. Grossfixed investment amounted to 16.5 percent of GDP (Table 3.3). Table 3.4 shows that the changein total factor productivity - a rough index of aggregate macroeconomic efficiency -- was onlymarginally positive in 1989 after negative outturns in 1987 and 1988. The Government's ownanalysis of resource use recognizes that public investments do not adequately reflect prioritiesindicated by rates of return and cost-effectiveness. There is also admission that some investmentsare underperforming because nonwage O&M expenditures have been neglected, leaving hospitals,for example, without adequate rnedical supplies, and roads unrepaired. In fact, the disrepair ofphysical infrastructure, including large sections of the highway system and the Mombasa Port,could become a binding constraint on Kenya's development prospect.

74 Chapter 3: Growth Prospects
Table 3.4Aggregate Efficiency Indicators, 1986-89
(Percentages)
1986 1987 1988 1989
Change in Total Factor Productivity' 0.5 -3.2 -O.S 0.8
Growth rae of:Value-added 2 5.6 4.9 5.2 5.0Factor inputs' 5.1 8.1 5.7 4.2
Labor 4.2 4.3 4.3 4.3Capital ' 6.2 14.5 5.1 4.1
The change in totl factor productivity is calculated as the difference between the rates of growth of value addedand factor inputs (abor and capital).
X At factor cost.Weighted by their income shares.Capital stock derived by using the perpettal inventory method.
Souce: Staff eadma:es.
3.24 The projections assume steady improvements in overall economic efficiency andincreases in the ratio of gross fixed investment to GDP from 16.5 percent of GDP in 1985-89 to19.6 percent in 1990-95 and 21.1 percent in 1995-2000 (Table 3.3). Public sector investmentprogramming would need to improve and private investment would also need to be buoyant.
The Balance of Payments
3.25 In line with the Sixth Development Plan, the target scenario assumes a reduction inforeign savings and an increase in domestic savings. The current account deficit (excludinggrants) is projected to shrink from 6.4 percent of GDP during 1985-89 to around 4.5 percent in1990-1995 and 3.5 percent in 1995-2000. The marginal deficit reduction during the first half ofthe decade takes into account the likelihood that imported inputs may be needed in largequantities before production can respond to the new export incentives. It also reflects the.ssumption that imports of other goods may increase with trade iiberalization. Thus, incomeelasticities of several groups of imports in Table 3.1 are set to rise significantly: from 0.8 percentin 1989 to 1.1 percent in 1995 for fuel, from 1.2 to 2.0 for manufacturing imports and from 0.6to 1.0 for other consumer goods (the methodology used to estimate import elasticities is discussedin Annex 3.A). In consequence, merchandise imports are projected to grow at 5.2 percent in1990-95.

3.26 The projections are cautious about the behavior of major commodity exports. Even ifall of coffee's production problems were corrected, developments in the international coffeemarket would sdll be a major determinant of the sector's long-term performance. Currently, thedomestic market absorbs about 10 percent of production and is expected to continue to expand atonly 2 percent per year. Eighty percent of Kenya's coffee (about 85,000 metric tonnes) goes toquota markets. The rest is exported to non-quota markets or stockpiled domestically. The non-quota market has been a good outlet for lower grades of coffee but has been unreliable for higherquality beans at renumneratve prices. The fate of the International Coffee Agreement is uncertainand so are the prospects for increasing Kenya's access to more remunerative markets.Accordingly, the annual real growth of coffee exports is projected at 3.6 percent during 1990-95and 3.5 percent during 1995-2000." Earnings from tea exports are expected to grow moremodestly during the projection period (4.7 percent per annum in 1990-95 and 4.0 percent in1995-2000) than earlier (6.9 percent per annum in 1985-89).
3.27 The projections recognize however, that the prospects for horticultural exports areparticularly good. At present, horticulture accounts for about 22 percent of merchandise exportearnings. Cut-flowers are responsible for 40 percent of this contribution. The Goverinmentestimates that export demand will grow at 8.7 percent per annum, partly because of plannedimprovements in research and extension services, husbandry, price and market information, pestand disease control, and the timely availability of cargo space and handling capacity." Bank staffestimate that production in this subsector could grow between 3.8 and 5.6 percent per annum,with export volume growth of between 8.0 and 16.0 percent. Performance at the higher end ofthe range is predicated on additional improvements such as provision of export incentives, agro-processing for selected commodities, and diversification into off-season markets in Europe."7Thus, export earnings from horticultural goods are set to rise by 9.3 percent in 1990-95 and 11.9percent in 1995-2000.
3.28 The target scenario is also optimistic about the prospects for manufacturing exports.On the domestic front, manufacturing would benefit from efforts to strengthen the generalenabling environment for the private sector, the proposed rationalization and reduction ofeffective protection, and reform of industrial parastatals. On the external front, conditions areexpected to be favorable for growth while specific preferential arrangements are expected tocontinue. This condition, coupled with a firm world market, could benefit a number ofmanufacturing activities. Textiles, for example, are expected to condnue to receive preferentialand quota-free access to Western European markets under the Lome Convention. At present, thisaccess and the quotas under the Muldfibre Agreement, are underutilized. An on-going diagnosticstudy of the industry is likely to confirm its export potential and to point to needed improvementsin producdon engineering and equipment to match the cost, quality and product requirements of
Table 3.3 indicates that the real growth rate of coffee earnings declined during 1985-89. However, this rate wasdistorted by a mini price boom in 1986 and a precipitous drop in prices in 1989.
16 The other consideration is Kenya's minuscule share (0.9 percent) of the horticultural trade, 89 percent of which iscurrently held by the Netherlands, Colombia, Israel and Italy.
17 Most horticultural production in Kenya is rainfed. Thc long rain crop is ready in June and usually coincides with thesummer crop in Europe. In the case of France, for instance, competition with French beans becomes vcry severe andhas resulted in a ban on imports of Kenyan beans during June to September.
76 Chapter 3: Growth Prospects
world markets. The projections take these factors into account and set earnings frommanufacturing exports to grow by 9.0 percent in 1990-95 and then to expand at an acceleratedpace of 11.5 percent during 1995-2000.
3.29 Faster export growth during the second half of the decade, 8.3 percent for goods andnonfactor services, will help to finance the strong demand for imports (goods and nonfactorservices) which is expected to rise at an annual rate 7.6 per cent. This explains the furthercontraction of the current account deficit to 3.5 percent of GDP during that period.
Fiscal Performance
3.30 The Government recognizes the need to reduce the crowding out of productive privatesector activity, increase private disposable incomes and improve investment efficiency.Accordingly, the projections show that the overall fiscal deficit would fall from 6.3 percent(excluding grants) of GDP in 1985-89 to 4.3 percent in 1990-95 and 2.8 percent in 1995-2000(Table 3.4). Total revenue is set to stabilize at arouna 24 percent of GDP. To improveallocative efficiency, revenue mobilization will depend more on indirect taxes as opposed to directtaxes. Thus, indirect taxes are projected to rise from 16.0 percent of GDP in 1990-95 to 17.0percent during the latter half of the decade. These projections envisage that the stabilization ofrevenue would be accomplished largely by improving the yield of existing taxes and not bycreating several new instruments. The improvements would come from a strengthening of taxenforcement, data collection and processing, coordination among different departments, manpowertraining and policy analysis. The Government is already receiving assistance under the TaxModernization Program to make these improvements. Increased cost-sharing, especially in thetransportation, education and health sectors, would also help to keep revenues on target.
3.31 Total government expenditure would fall from 27.7 percent of GDP in 1985-89 to 27.6percent during 1990-95 and 26.9 percent during 1995-2000. Recurrent expenditure would drop to26.0 percent of GDP during 1990-95 and 21.0 percent of GDP during 1995-2000. In the past,the Government's role as the employer of last resort led to a rising share of labor costs in totalrecurrent expenditure and limited the scope for overall expenditure reduction. The reductions thatwere achieved came from operations and maintenance and the locally financed developmentbudget. The projection period will require bolder financial discipline to achieve the fiscal targets,including the budgetary savings which are expected to become positive (1 percent of GDP) during1995-2000.
3.32 For internal consistency, the projections assume that the Central Government has firstclaim on domestic credit in the whole economy and that this pool of credit is determined jointlyby the net foreign assets in the balance of payments and the money supply.'8 A bold fiscal stancewould significantly reduce the Central Government's claim on domestic resources and wouldrelease credit for private sector activity, other things being equal. Accordingly, Table 3.2indicates that under the target scenario, credit to the private sector would grow at 22.3 percentand 22.9 percent per annum in 1990-95 and 1995-2000 respectively, compared with 15.1 percentduring 198549.
In turn, the supply of money is based on econometric estimates of the demand for money at given interest rates, ratesof inflation and levels of national income.

3.33 In brief, the target scenario is an optimistic but attainable growth path for the Kenyaneconomy during the period 1990-2000. By end-2000, agriculture would still be an importantpillar of the economy but export-oriented manufacturing would provide the momentum for growthand accelerated job creation. The rural, informal sector would be closely integrated into themonetary economy, providing goods and services to the manufacturing sector, and new jobopportunities. Kenya's wildlife and beaches would continue to attract a steady flow of Europeanand North American tourists but arrivals from new markets in Asia and Australasia would growmarkedly. The sector would also benefit from measures to increase net foreign exchange-etention and would thus remain a significant contributor to the viability of the balance ofpayments. The Government would be streamlined and more resources would be allocated toinvestmnent in infrastructure, operations and maintenance. Revenue mobilization would continueto be strong, enabling the Government to finance an increasing share of its own investment.Therefore, although the share of investment to GDP would rise, domestic savings would finance alarger proportion of gross investment. Accordingly, both the fiscal deficit and the currentaccount deficit would be smaller as a share of GDP.
3.34 Although Kenya's history of sound economic management justifies the optimism of thetarget scenario, there are risks and uncertainties. Among them is the possibility that theGovernment would waiver in its commitment to the structural adjustment process, particularly inpolitically sensitive areas such as the deregulation of agricultural marketing parastatals or reformsin the social sectors. Such slippages in policy may be accompanied by a deterioration in fiscaldiscipline. There is also a risk that the external environment cou'd become less favorable forgrowth in the wake of uncertainties over oil prices. The section below illustrates how these risksmight affect Kenya's medium to longer-term development prospects.
D. Risks and Uncertainties
3.35 The purpose of the section is to illustrate how risks and uncertainties might impact onthe target scenario set out above. While short-term consequences will be acknowledged, theprimary concern is how the economy might respond in the medium- to long-term. Two sets ofsensitivity analyses are presented, focusing on slippages in policy reforms, and on an oil shock.
Slippages in Policy Reform and FLscal Discipline
3.36 The first risk considered is a weakened commitment to the continuing policy reformprocess and to fiscal discipline. For simplicity it is assumed that no further policy reforms areimplemented in the agricultural, industrial and financial sectors but that the external environmentremains favorable for growth. Table 3.5 shows that under these circumstances real GDP growthcould decelerate (relative to the target scenario) to around 3.9 percent per annum during 1990-2000. Although the external environment is still favorable, merchandise exports would grow atonly 3.4 percent per year during 1990-95 (6.1 percent under the target scenario) and 3.2 percentduring 1995-2000 (7.7 percent under the target scenario).
3.37 The slippages in policy reform would also discourage iniflows of donor assistance. Thereasons rest in recent developments in the global political economy which are redefining thecriteria for and expectations of economic and financial partnerships between donors and aid

78 Chapter 3: Growth Prospects
recipients. Increasing emphasis is being placed on decentralized and transparent economicdecision-making '9 along the lines of reforms which are ongoing in the agricultural, industrial andfinancial sectors. If the Government reneges on its commitment to these reforms, the incentivesstructure could move not only against local investment but also foreign private and officialinflows. Assuming a shortfall in foreign exchange receipts for these reasons, Table 3.5 shows alower import growth of 1.2 percent per annum in 1990-95 (5.2 percent under the target scenario)and 4.7 percent in 1995-2000 (8.2 percent under the target scenario). Because of the likelydifficulties in raising external financing, the projections also show a smaller current accountdeficit in 1990-95 (3.9 percent compared with 4.5 percent under the target scenario) and 199S-2000 (2.8 percent compared with 3.5 percent under the target scenario), and a lower financinggap ($25.5 million and $13.3 million in 1990-95 and 1995-2000 respectively, compared with$52.2 million and $26.7 million under the target scenario).
3.38 The projections further assume that the deterioration in fiscal discipline is manifested asan increase in recurrent expenditure, probably on wages and salaries.20 It is tempting to expectsuch increases to translate into significantly larger ratios of fiscal deficits to GDP. While thismay happen in the short-run, a growing fiscal deficit would not be sustainable in the medium- tolong-term because: (i) the economy would become unstable, making it more difficult to mobilizeexternal resources; (ii) resort to non-inflationary financing would further crowd out private sectoractivity and could reduce incentives for exports; (iii) private investment would be squeezed andthe efficiency of public investment would decline as cutbacks are made in expenditures foroperations and maintenance; and (iv) as investment efficiency declines, higher levels ofinvestmnent would be needied to sustain growth; however adequate financing is unlikely to beavailable since domestic savings would fall and it would be difficult to attract foreign savings.Accordingly, Table 3.5 shows a revenue effort of 25.1 percent during 1990-95 and 30.7 percentduring 1995-2000 (23.3 percent and 24.1 percent respectively under the target scerario).Expenditures, meanwhile, would rise to 30.5 percent of GDP during 1990-95 and 32.7 percentduring 1995-2000 compared with 27.6 percent and 26.9 percent respectively under the targetscenario. The resulting fiscal deficit would be 4.5 percent during the first half of the decade and2.8 percent during the second half. Because reforms are not deepened, the environment forinvestment would deteriorate. The ICOR would rise to 5.5 for 1990-95 (4.4 under the targetscenario) and 4.7 percent for 1995-2000 (3.7 under the target scenario), and growth of credit tothe private sector would slow to 19.1 percent in 1990-95 and 15.0 percent during the 1995-2000,compared with 22.3 percent and 22.9 percent under the target scenario.
3.39 Total investment would also be lower if there are slippages in the reform program andin fiscal discipline. This may be explained by the reduction in the growth of credit to the privatesector as well as the shift toward higher wage expenditures at the expense of operadons and
*Political legitimacy and consensus are a precondition for sustainable development .... This implies above all a highlyparticipatory approach--less top-down, more bottom-up than in the past-which effectively involves ordinary people ...in the docisions that directly affect their lives.' (World Bank, 1989c).
29 lit post-independenee Kenya, commodity booms have tfiggered significant increases in government expenditure whichare in excess of revenue growth and unsustainable. One recent study of the 1976-79 coffee boom shows that this hada negative economic impact on capital formation. The reason lay in the fact that it exacerbated the risc in the relativeprice of nontraded capital goods or was expended on government consumption. See D.L. Bevan, P. Collier and J.W.Gunning, 'Fiscal Response to a Temporary Trade Shock: The Aftermath of the Kenyan Coffee Boom,' World BankEconomic Review, Vol. 3, September 1989, pp. 359-378.

Table 3.5Developmtent Prospects Without Further Reforms
1990-95 1995-2000
Average real growth rates (% p.a.)
Gross domestic product (mp) 3.8 3.9Merchandise exports (fob) 3.4 3.2Merchandise imports (cit) 1.2 4.7
Monetary variables growth rate (% p.a.)
Broad money (M2) 10.5 14.7Domestic credit 11.2 12.6Private credit 19.1 15.0
Economic structure and balances
Agriculture/GDP 25.7 23.8Manufacturing/GDP 11.1 12.6Services/GDP 42.2 42.3Gross national savingsJGDP 16.4 16.2Gross domestic savings/GDP 18.7 18.1Total investnent/GDP 20.7 19.3fixed investment/GDP 18.4 17.0Consumption/GDP 83.2 83.5
Fiscal deficit/GDP 4.5 2.0Revenue/GDP 25.1 30 7Expenditure/GDP 29.6 32.7
Current account deficit/GDP 3.9 2.8
Memo items:ICOR 5.5 4.7Margin-I savings ratesGross national savings 0.11 0.13Gross domestic iings 0.10 0.08
Average annual foreign exchange gap (US$m) 25.50 13.30
Source: Saff esimates.

80 Chapter 3: Growth Prospects
maintenance. Thus, Table 3.5 shows a total investrnent to GDP ratio of 20.7 percent ',n 1990-95(23.4 percent under the target scenario) and 19.3 percent in 1995-2000 (24.9 percent under thetarget scenario).
3.40 In essence therefore, slippages in policy reform and fiscal indiscipline would reduce thescope for balance of payments support, limnit access to foreign financing for investment and derailthe economy from the targeted growth path set by the Government.
3.41 During 1990-95 the current account would be financed primarily by bilateral andmultilateral flows from commitments which are projected to grow in dollar terms at the rate ofinflation in G-V countries. After 1992, official transfers are set to grow at the same rate. Theshare of quick-disbursing funds in bilateral and multilateral commitments would fall from about70 percent to 50 percent over the period. Commercial borrowing would continue to be limited.During 1995-2000, bilateral and multilateral commitments would still finance a large proportionof a now smaller current account deficit (as a share of GDP) but commercial borrowing by theprivate and governmental sectors is assumed to increase in dollar terms at the growth rate of theKenyan economy (measured as the real growth of GDP at factor cost). Bilateral and multilateralcommitments would continue to grow at the rate of G-V inflation and quick disbursing fundswould fall further to around 35 percent of commitments.
An Oil Shock
3.42 At present, Kenya is totally dependent on imports to meet its petroleum requirements.Crude, which comes primarily from the United Arab Emirates, is refined locally for domesticconsumption (around 82 percent) and for export to regional markets. Local oil explorations,which first began in the 1950s, have taken place offshore and primarily in Eastern and North-Eastern Provinces. Several recordings of offshore gas were made, but the finds were judged tobe uneconomic and the wel's were abandoned. Onshore drillings have produced fluorescence andgas shows but no commercial quantities have been found. Kenya is therefore vulnerable to theoil shock created by recent developments in the Persian Gulf.
3.43 Domestic oil prices are adjusted in line with changes in internaional prices anddepreciation of the exchange rate against the US dollar. In February 1990, for example,wholesale price increases ranged from 4 percent for regular motor gasoline to 48.7 percent forliquefied petroleum gas. Until September 1989, the wholesale price increases for liquefiedpetroleum gas (LPG), illuminating kerosene and light diesel oil were kept low in an attempt tocushion the impact on low-income consumers. However, subsequent adjustments for theseproducts have been among the highest in the group. LPG wholesale prices rose by 22 percent inSeptember 1989 and 48.7 percent in February 1990.
3.44 With these facts as background, the projections assume that significant increases in oilprices would adversely affect the import bill, government expenditure (especially if an attempt ismade to subsidize any group of consumers), domestic inflation and overall domestic activity.Taxes on petroleum and petroleum products account for 1.7 percent of current govermmentrevenue so that the net effects of an oil shock on current government revenue is likely to benegadve. Economic activity in the industrialized world would also be adversely affected.

3.45 Official crude oil prices averaged $17.3 per barrel during 1988 and rose onlymarginally in 1989 to $17.5 per barrel.2' The average price from January to June 1990 was$17.4 per barrel and was expected to fall slightly because of an oil glut in world markets and thelikelihood of continued producdon above OPEC quotas. Recent developments in the Persian Gulfhave increased uncertainty over future oil market conditions. Several countries have the capacityto increase production and the stocks in Western industrialized countries are substantial. At thevery best however, production, and to a greater extent, prices, should be expected to be volatile.
3.46 The projections illustrate the first round effect of higher prices ($31 per barrel duringthe remainder of 1990, $29 during the first half of 1991 and $26 during the second half) andincreases beyond 1991 which are identical to those in the target scenario. It is also assumed thatthe G-V countries grow at 1.5 percent during 1991-95 and at 3 percent per annum during 1995-90. Under these circumstances, Kenya's real GDP could grow at 4.6 percent in 1990-95 and 4.8percent during the latter half of the decade (Table 3.6). This growth performance assumesimprovements in incentives for agriculture and export-oriented manufacturing through sustainedstructural adjustment. It also assumes that donors would provide the same level of financialsupport as under the target scenario.
3.47 The oil shock would be expected to exacerbate inflationary pressures in theindustrialized countries. Higher widespread inflation (induced by the oil price increases) wouldtend to raise the unit value of manufactured exports globally. Kenya would be better off if theprices of its manufactured exports rsse faster than its costs of production. The projections assumethat the structural reforms would make Kenya manufactured exports more competitive under thesecircumnstances and that merchandise exports in general would grow at 5.2 percent annually during1990-95 and 5.5 percent annually during 1995-2000. Given trade liberalization and the flexibleexchange rate policy, impxrts would grow at 4.9 percent per annum during 1990-95 and by 5.4percent during 1995-2000.
3.48 With the confidence of an enhanced environment for domestic and foreign investmentand donor support, the economy could run a current account deficit of 5.1 percent in 1990-95 and4.0 percent in 1995-2000. (The corresponding ratios under the target scenario are 4.5 percentand 3.5 percent.) The higher deficits reflect the higher prices of oil, Kenya's status as a netimporter of oil, and the slowdown of activity in the industrialized countries. The financing gapswould also be larger than under the target scenario: $92.7 million in 1990-95 and $46.6 millionin 1995-2000 compared to $52.2 million and $26.7 under the target scenario.
3.49 As a consumer of oil, the Governmnent would be expected to increase its totalexpenditure as a share of GDP (27.9 percent in 1990-95 and 28.8 percent in 1995-2000,compared to 27.6 percent and 26.9 percent respectively under the target scenario), but revenuesfrom oil would also be expected to increase (23.4 percent of GDP in 1990-95 and 25.1 percent ofGDP compared with 23.3 percent and 24.5 percent respectively under the target scenario). Amanageable fiscal deficit of 4.5 percent and 3.8 percent for 1990-95 and 1995-2000 respectively,is therefore projected.
21 Data from the Commodity Report, World Bank News, July 26, 1990, pp. 3-5.

82 Chapter 3: Growth Prospects
Table 3.6Development Prospects After an Oil Shock
(Percentages)
1990-9S 1995-2000
Average real growth rates (% p.a.)
Gross domestic product 4.6 4.8Pnvate consumption per capita 1.7 1.0Merchandise exports (fob) 5.2 5.5Merchandise imports (cif) 4.9 5.4
Monetary variables growth rate (% p.a.)
Broad money (M2) 9.5 12.2Domestic credit 11.2 12.6Private credit 19.1 15.0
Economic structure and balances
Agriculture/GDP 25.8 23.7Manufacturing/GDP 10.7 11.5Services/GDP 41.7 41.5Gross national savings/GDP 16.0 17.2Gross domestic savings/GDP 18.3 19.0Total invesbnent/GDP 21.4 21.5fixed investmentlGDP 18.3 18.5CousumptionJGDP 83.5 82.8
Fiscal deficitlGDP 4.5 3.8Revenue/GDP 23.4 25.1Expenditure/GDP 27.9 28.8
Current account deficitlGDP S.1 4.0
Memo itens:ICOR 4.8 4.6Marginal savings rates
Gross national savings 0.14 0.18Gross domestic savings 0.14 0.15
Annual average foreign exchange gap (USS million) 92.70 46.60
&Sarce. s<cqffesinws.

3.50 Even though the external environment is not as buoyant as under the target scenario,the structural reforms help to maintain macroeconomic balances. Thus, the marginal nationalsavings ratio would recover somewhat to 0.18 during the second half of the decade. Similarly,total investment could reach 21.4 percent and 21.5 percent in 1990-95 and 1995-2000 respectivelyinstead of filling from 20.7 percent in 1990-95 to 19.3 percent in 1995-2000 when furtherreforms are not undertaken. Credit to the private sector would grow more slowly after the oilshock than under the target scenario (19.1 percent and 15 percent under the former compared to22.3 percent and 22.4 percent under the latter) but it would be used more efficiently than underthe scenario in which structural reforms have been discontinued and fiscal discipline hasdeteriorated. At the same time, the projections allow for a slight worsening of the incrementalcapital output ratio (4.8 in 1990-95 and 4.6 in 1995-2000, compared with 4.4 and 3.7 under thetarget scenario) as the economy adjt'sts to the new oil prices.
3.51 In summary, an oil shock is likely to dampen economic activity in Kenya but policyreforms which encourage market-driven adjustments to such a shock would help economicrecovery and preserve Kenya's longer-term development prospects.

Chapter 3: Development Prospects 85
ANNEX 3.A
Import Elasticities in Kenya: 1968-89 and Beyond
i. 71Ts Annex summarizes analytical work in progress on import elasticities in Kenyawhich guided the macroeconomic projections in Chapter 3. The data base for the exercisecomprised reasonably reliable and consistent annua; dme series for the period 1968-89.Throughout most of this period import restrictions were used to close the gap between thenotional demand for imports and the available foreign exchange, as well as to protect domesticproduction. The analysis summarized Delow is geared toward understanding how the income andprice elasticities of import demand are likely to change when those restrictions are lifted.
ii. This Annex is organized into three secdons. Secdon A reviews traditional approachesto import demand specification, states their weaknesses and suggests an alternative approach.Section B reports and analyzes the econometric results and enumerates their implicadons forimport behavior after trade liberalization. The broad conclusion is that generally, econometricesdmates which ignore import restrictions understate the "true' import and price elasticides ofdemand. Comparative static analysis suggests that with import liberalizadon in Kenya, theincome elasticides of demand for imports of goods and nonfactor services would rise to around1.00 but would be dominated by an aggregate price elasdcity of approximately -1.45. Section Clooks at the issues still outstanding with respect to import elasticities in Kenya.
Approaches to the Specification of Import Elasticities
imi. The traditional specificadon of import demand is:
In M = bo + b, In Y, + b2 In [Pt,/dP,] + u, (1)
where M is real imports, Y is real income, P. is import prices, P4 is domesdc prices and u is theerror term with the properties u,- NID (0,0Z). As the equadon is specified in logarithms, theparameters b, (usually b, >0) and b2 (usually b2<0) are the real income and price elasticities ofimport demand, respectively. This traditional approach has three major operational weaknesses.First, it tends to focus on aggregate imports but for developing countries in pardcular, differentcategories of imported items may behave very differently. Second, the tradidional approach tendsto emphasize aggregate real income even when imports and prices are treated at a disaggregatedlevel.' It is therefore unable to capture movements in imports, aggregate or disaggregate, whichmay be associated with changes in the sectoral origin of nadonal income. Third, it does not takeinto account trade restrictions which may suppress actual demand below its notional level.
Khan diwcus the problem of using agregate imports in the traditional demand equation but ignores the prmctice ofusing agregate income (Khan, 197Sb).

86 Chapter 3: Development Prospects
iv. To overcome these shortcomings, this Annux relates broad categories of imports toaggregate income as well as value added in specific sectors. The methodology of Chu et al.(0983) and more recently Faini et al. (1988) and Moran (1989) is also folowed by introducingindicators of foreign exchange availability into equation (1). The new specification is:
InM, bo + b, In Ys, + b2 In [P,/Pd, + b, ln F,+ b, In R. + b, ln M. , + u, (2)
where Ys is valued added in the sector, F is the sum of export earnings and net capital inflows,R is the end of years reserve position and M., is the lagged values of the dependent variable. Allvariables are expressed in millions of real Kenya pounds excepting prices which are in indicesderived therefrom.
v. Equation (2) is a mixed blessing. It disaggregates the relationship between categories ofimports and value added by sector and includes foreign exchange variables which, at least in theKenya case, were likely to have influenced import demand. However, it does not allow thestructural parameters - the real income and price elasticities of demand - to be recovered.2
Moreover, as with equation (1), prices are assumed to be exogenous.'
vi. Faini (1988) and Moran (1989) suggest an alternative specification which includes the foreignexchange constraint but which also allows uncondidonal elasticities to be recovered. Theequations, which are estimated and discussed in the next section, are as follows:
lnM, = ao + a, ln Ys, + a, In [P./PJ] + a, lnM,,+ ut (3)
In M, = bo + b, ln F, + b2 ln R,., + b, ln M.,+ v, (4)
where M is import supply.
Econometric Results at a Glance
vii. Equations (1) and (2) were estimated by the method of ordinary least squares (OLS);equations (3) and (4) used two-stage least squares (2SLS). The esdmates which appear to beeconomically meaningful and stadstically significant are reported in Tables A. l-A.4. Generally,sectoral value added did not appear to have greater explanatory power as the 'income' variablethan national income or GDP. Separate results for sectoral value added are therefore notreported. Similarly, no appreciable difference was found between weighted and unweightedaverage elasicities which were based on disaggregated data. These, therefore, are also not
2 If eq -tion (1) were the correa import demand function, b, and b, would be interpreted respectively as the real incomeand price elastieities. If equation (2) were the corr4et specification, b, and b2 would represent the influcnee of incomeand prices, given the influence of the other statistically significant variables.
The c.i.f. price of imports may be exogenous but policy-induced measures such as taxes, tariffs and non-tariff bariersmay affect the price that is actually paid. Similarly, domestic prices may be influenced considerably by governmentinterventions such a price controls. Thus, import prices may not be exogenous.

Chapter 3: Development Prospects 87
reported. On the contrary, thissection focuses on the range of Table A. lvalues which the various Selected Import Elasticities, 196849specifications and estimationtechniques yield for the elasicitiesof given variables. "Income' "Price' Foreign
Exchangeviii. The influence of foreignexchange availability (1.27 torforeign exchange and 0.34 for Imports 0.55a J -0.35 a/ 1.27(f)al* ~~(GNsFS) 0.78 b/ -1,45 bt 0.34(r),aIlagged reserves) appears to -1.60 cdominate the income (0.55) andthe price (-0.35) elasdcity of Food 0.13 di -0.86 c/ 0.34(r*)ademand for imports at the etc. 0.79 c/ -1.67 b/aggregate level (Table A. 1). Fuel 0.80 Ci -0.18 b/ 0.19(r9)aiWhen relative prices are Fel 1.02(G)a -0.39 clendogenized and foreign exchangeavailability is taken into account, Primary 1.10 b/ -0.37 aJ 1.40(X) althe "true" income of demand intermediate 2.16 a/ -0.49 clapproximates 1.00 and the price Manufacturing 0.38(G)I -0.34 c/ 0.20(X*)aielasticity levels out at .58(bG1 -1.344bl 0.16(r*)aapproximately -1.45 (Table A.4).Foreign exchange availability is Capital 1.28(G)a/ -1.04 ci 1.35 a/also dominant in the demand for Goods 3.79 bi -1.50 a/primary intermediate goods (1W40) Other .0.22(G)al -2.73 ci 0.85 s-and 'other consumer goods' Consumer 0.58 cf -3.70 b/(0.85) (Tables A.1 and A.3). GOodSThis result is consistent with apolicy stance which favored the ai Modified traditional (OIS) G - CDP
bt Modified traditional (2SLS) f - For.exc.imports of producer items and cl Traditional (OLS) r - Resrs.carefuily rationed imports of 41 Not stat. signf. x - Exp.consumption goods. Foreign 0 Laged variable ONFS
exchange availability appears to Source. Staffesitmesequal the influence of income(1.35 compared to 1.28) in thedemand for capital goods but isupstaged by income in the equation for fuel and lubricants (0.19 compared to 1.02). Theprobable explanation of the latter is that some fuel and lubricants are refined and re-exported, andthereby earn (instead of being constrained) by foreign exchange.
ix. The fact that constrained income elasticities and foreign exchange appear to dominatethe price elasticities is a particularly interesting finding because these approaches treat prices asexogenous. The intuitive conclusion suggested by this finding is that when prices wereexogenous, the controls over imports may have focused on foreign exchange allocadon. Theconverse is probably true. Indeed, once foreign exchange constraints are incorporatcd and pricesare endogenized, income elasticity rises and dominates the demand for capital goods andmanufacturing but price elasticity takes pride of place in the demand for other consumer goods.

88 Chapter 3: Development Prospects
x. Comparisons of statistically significant OLS and 2SLS estimates further suggest that asthe relative prices of imports rise with trade liberalization, it is likely to dampen import growth,ceteris paribus (Box A.1). The share of food and other consumer goods in imports would alsofall. Liberalization would cause the income elasticities of demand for imports of goods andnonfactor services in Kenya to rise butcause the price elasticity of demand tofall marginally; the income elasticity Box A.1of demand for food would fall but its Probable Liberalization Effectprice elasticity would rise; the incomeand price elasticities of demand forfuel would fall; the income elasticity 'Income" "Pric-e Dominant
of demand for primary intermediate Influencegoods would fall but the priceelasticity would remain virtually Imports A Falls Priceunchanged; and the income and price (GNFS) marginallyelasticities of demand formanufactured, capital and 'other Food V A Priceconsumer goods' would rise. Thesedominant influences suggest that as the 4iuel V V Incomeeconomy grows and trade is etc.liberalized, the shares of capital goods, p V Largely Incomemanufactured items, fuel and 'other Interm. unchangednconsumer goods' are likely to increase,ceteris paribus.' Furthermore, if the Manuf. A A Incomerelative prices of imports rise withuade liberalization, import growth Cap. A A Income
would be dampened, ceteris paribus, Other A A Priceand the share of food and other cons.consumer goods in total imports wouldfall. (An obvious limitation is that theconclusions are based on comparative -static analysis.)
Source: Saff sdmates.
xi. In summary, overall importsof goods and nonfactor services arelikely to become more income elasticafter trade liberalization (1.00compared to 0.55). Price elasticity would fai marginally (-1.60 to -1.45) but would continue todominate the influence of the income elasticity in a manner which is consistent with the findingsreported in Faini (1988).
4 Khan rightly warnis against extrapolating past behavior since it may have been heavily influenced by cyclical factors(iAhsn, 1975a). However, this does not seem to have beea the case in Kenya during 1968-89.
Chapter 3: DeveAopment Prospects 89
Unfinished Business
xii. The discussion above suggests a number of areas for further research. These include:
* Capital goods prices and income elasticities in all Tables are very large, possiblyreflecting the bulky nature of several items in this category. At a later stage it wouldbe useful to disaggregate this category of goods and to separate government importsfrom private imports.
* Foreign exchange receipts, including export earnings, are assumed to be exogenous inthis Annex. This is not likely to be the case in practice, because exports volume maybe determined in part by the availability of imported. inputs. In turn, the capacity toimport may be affected by export earnings. The precise linkages between thesevariables could be the subject of future investigation.
* The role of the exchange rate has been subsumed under the influence of changes inrelative prices. Research at a later stage could explore how the impact of exchange ratechanges would differ from other price-altering policy measures.
• Finally, it would be desirable to move from partial equilibrium analysis to a moreintegrated framework in which macroeconomic behavior, including trade performance,is determined simultaneously with other variables.

Chapter 3: Development Prospects
Table A.2Empirical Rests: Traditional Approach
(OLS Estimates)
importsof goods Food Fuels Primarand non- and and inter. Manu- Otherfactor beve- lubri- mediate factured Capital c o n s -services rages cants goods goods goods goods
Constant -3.70 -5.05 -2.1 -14.2 -9.16 -13.1 -4.83(-1.8) (-1.6) (-1.0) (-4.0) (-3.0) (-3.6) (-1.4)
National 0.78 0.79 0.80 1.70 1.15 1.63 0.58incone (4.6) (2.6) (4.0) (4.5) (4.2) (5.4) (2.1)
Relative -1.60 -0.86 -0.39 -0.40 -1.04 -1.04 -2.73price (-6.3) (4.0) (-5.9) (-2.7) (-5.5) (-2.5) (8.1)
Dummy 0.09 (a) -0.28 (c) 0.62 (b) 0.15 (a) -0.19 (e) 0.21 (a)
(1.7) (-1.9) (5.8) (1.9) (-1.9) (2.9)
Dumny 0.48 (b) -0.21 (b) 0.13 (a) -0.16 (d) -0.34 (f) -0.20 (c)
(3.9) (-1.4) (2.7) (-1.9) (-2.8) (-1.8)
Duammy 0.21 (d) 0.28 (b) -0.15 (g) 0.77 (b)(3.0) (2.0) (-1.9) (5.0)
Dummy 0.28 (c)(-3.3)
R2 adj. 0.68 0.51 0.80 0.66 0.89 0.70 0.69
D.W. 2.1 1.9 2.5 1.9 2.0 1.4 1.9
SSR 0.19 0.6 0.19 0.50 0.29 0.40 0.34
rho dummy (a) is one for the oil sock yea and zero otherwise; (b) is one for post-1973 (oil shock) period and zeroMtheise; (c) is one for the adjustment period beginning in 1987 ad zero otherwise; (d) is one for the adjutment period
n the etrly and late 1980s and zero otherwise; (e) is one for the droughts in the 1970s and 1980s and zero otherwise; (f)s one for the period after the second oil shock and zero otherwise; and (8) is one for the period years following the oilrice increase up to the commencanent of sector adjustent operations, and zero otherwise.

Chpter 3: Deveokpet PRospts 91
Table A.3Enpirical Reauts: Modilied Traditional Appkoach
(OLS Estimates)
Importsof goods Food Fubs PdmarYand nom- and and inter- Manu- Otherfator beve- lubri- mediate factured Capital cons-sricr rges cants goods goods goods goods
Constant 4.38 3.16 -7.SS -1617 4.84 -19.0 -0.74(3.0) (0.9) (-3.0) (4.3) (-2.2) (-6.2) (-0.47)
.ependnt* -0.55S 0.22* 0.21*tiablo (-3.1) (2.t) (2.3)
oveiap 1.27* 0.40 1.35 0.85mSchanw (6.6) (2.0) (9 I) (5.1)
Bip. GNFS 1.40(2.4)
Reseves 0.34* 0.19* 0.20*(3.6) (4.7) (2.5)
L'Ultional 0 55 1.10noome (4.6) (2.6)
3rs donL 1.02 0.38 1.28 -0.22product (4.9) (1.9) (5.5) (-1.9)A4pi. -1.51
('-1.5)Svcs 1.32
(2.0)
Reatve -0.35 -0.67 -0.07 -0.37 -0.34 -1.5 -0.30price (-2.8) (4.1) (-1.3) (-2.5) (-2.0) (-4.1) (-1.2)
Dummy 0.37 (d) 0.33 (a) -0.07 (h)(3.6) (3.7) (4.9)
Dummy 0.12 (d)(2.7)
R2 adj. 0.86 0.72 0.88 0.65 0.82 0.84 0.95
D.W. 2.S 2.4 2.3 2.0 2.0 2.3 2.7
BSR 0.08 0.32 0.06 0.38 0.20 0.21 0.14
,b) is a dme rad. See Table I f orir dfin tbons. *- rorf t agged values.

9-82 Chapter 3: Development Prospects
Table A.4Empirical Results: Modified Traditional Approach
(2SLS Estimates)
Inportsof goods Food Fuds Primaryand non- and and inter- Manu- Otherfactor beve- lubri- mediate factured Capital cons-services rages cants goods goods goods goods
(A) (B) (C) (D) (B) (F) (a)
Constant -6.01 -5.30 -7.60 -18.8 -14.1 -38.4 -5.30(-0.7) (-0.4) (-1.4) (-1.8) (-1.5) (-1.8) (-0.4)
Dependent* 1.30*variable (3.8)
;Iational 1.00 0.13 2.16 1.58income (1.3) (2.6) (2.0) (2.0)
c3ross 0.60 3.79 0.63domestic (1.4) (2.2) (-5)product
Rtelative -1.45 -1.67 -0.18 -0.48 -1.34 -3.01 -3.70price (-2.6) (-2.4) (-1.7) (-1.3) (-3.4) (-1.3) (2.0)
Dummy -1. 14 (g)(-2.4)
Fe adj. 0.34 0.43 0.55 0.51 0.57 0.38 0.64
D.W. 1.2 1.9 2.3 1.7 1.2 1.0 1.3
SSR 0.59 1.21 0.44 0.57 0.86 2.00 1.86
kil equations wed a consta term, foreign exchange and eerves as instruments. In addition (B) used a time trend and thetummy (b); (C) used a time trend also alonI wh dumieS (b) a(e); (D) ued the dummy (a); (E) used the dummy (c); ed (F) used the dummnies (c) and (f). See Table Ibr decription of dummies.
* refen to gged values.

Bibliographical Notes
This volume draws on a wide range of sources including formal and informal World Bank reports,outside sources, Government of Kenya documents, as well as informtion and data collected directlyby the mission, most often from relevant miristries and government agencies. Major data sourceson Kenya have been various issues of the Statistical Abstract, the Economic Survey (Central Bureauof Statistics), and the Econonic Report of the Central Bank of Kenya. The principal sources foreach chapter are noted below. These and other sources are then listed alphabetically by author ororganizadion in *e av-ompany.ng bibliography. The Statistical Appendix to this report contains aset of detailed technical notes explaining data sources and methodology.
Chapter 1
The review of recent econormic developments in Kenya draws heavily from the Economic Survey andthe Central Bank Economic Report. This chapter also reviews the results of the recently-releasedUrban Labour Force Survey, reported in the 1990 Economic Survey and on the paper by the Longkange Planning Unit of the Ministry of Planning and National Development. The analysis of recentfiscal developments relies on revised budgetary data prepared as part of the most recent PolicyFramework Paper for Kenya and the IMF's Enhanced Structural Adjustment Facility arrangement.The data differs somewhat from published government estimates recorded in the Statistical Appendixof this report. The analysis of inflatdon and its measurement is based0 on the mission's findings andrecent econometric research on inflation and money supply in Kenya.
Chapter 2
This chapter is based on internal World Bank analyzes of Kenya's experience with the implementatdonof sector adjustment programs in agriculture, industry, and the financial sector. The material andanalysis have been gathered as part of the World Bank's ongoing efforts to monitor and evaluateirnplerentation of three sector adjustment operations-Agriculture Sector Adjustment Operation I(ASAO 1), Industrial Sector Adjustment Credit (ISAC), and Financial Sector Adjustment Credit(FSAC)-and preparatory analytical work for follow up operations in Agriculture (ASAO It) andexports (Export Development Program-EDP). The analysis does not attempt to review compliancewith World Bank conditionality in these operadons, but rather to evaluate general progress in meetingthe Government's reform objecdves and suggesting a broad, medium-term reform agenda for adeepening of adjustment efforts.

94 RIbllographlcal Notes
Chapter 3
This chapter represents somewhat of a departure from previous World Bank Country EconomicMemoranda on Kenya. Instcad of presenting a base case or likely projecdon scenario and a low casescenario, the report develops a high or optimistic scenario as a way of exploring the viability ofaccelerated growth in Kenya. Sensitivity analysis is included to show some of the domestic andexternal constraints that could derail such an arabitious development agenda. The first part of thechapter relies on a recent working paper by Fischer and Thomas (prepared as a background paperfor the 1991 World Development Report) to provide an organizing framework for a discussion of thetypes of efforts that would be required by the Government to encourage faster and more equitablegrowth. The projections are based on a preliminary version of the World Bank's revised projectionmodel (RMSMX) applied to Kenya, which attempts to incorporate the monetawy and fiscal sectorsinto a comprehensive projection framework. It should be emphasized that these are not predictionsof the likely evolution of economic aggregates in Kenya. Achieving this target scenario wouldrequire a strong and sustained Government commitment to stabilization and a bolder program ofstructural reforms than the Government has been prepared to consider in the recent past, and a setof generally favorable external conditions. This chapter also summarizes recent economteric workcarried out by the mission on import elasticides in Kenya.
Central Bank of Kenya. Various years. Economic Report for the Financial Year. Nairobi: CentralBank.
Chu, K., E.C. Hwa and K. Krishnamurty. 1983. "Economic Instability and Adjustment of Imports,Capital Flows, and External Reserves: A Short-Run Dynamic Model," in D. Bigman and T. Taya(Eds.), Exchange Rate and Trade Stability: Causes, Consequences and Remedies.
Faini, R., L. Pritchett and F. Clavijo. 1988. Import Demand in Developing Countries. WorldBank PPR Working Papers, November.
Fischer, Stanley and Vinod Thomas. 1990. "Policies for Economic Development." Policy,Research, and External Affairs Working Papers. Background paper for the 1991 World DevelopmentReport. WPS 459. Washington, D.C.: World Bank.
Greenberg, E. and C.E. Webster, Jr. 1983. Advanced Econometrics: A Bridge to the Literature(New York, John Wiley & Sons).
IFAD, and UNDP. 1988. Republic of Kenya, Arid and Semi-Arid Lands (ASAL) DevelopmentProgramme. Report No. 0131-KE. Nairobi.
Kenya Association of Manufacturers. 1989. Government Controls and Their Impact on theManufacturing Sector. Prepared by The Pragma Corporation with African Development andConsultants. Nairobi.
Khan, M.S. 1975a. "Cyclical and Secular Income Elasticities of Demand for Imports," Review ofEconomics and Statistics, Vol. 57, pp. 351-361.
Khan, M.S. 1975b. "Tbe Structure and Behavior of Imports of Venezuela," Review of Economicsand Statistics, Vol. 57, pp. 221-224.
Killick, T. and F.M. Mwega. 1989. "Monetary Policy in Kenya, 1967-88." Overseas DevelopmentInstitute Working Paper (forthcoming).
Kiptui, M.C. 1989. "Fiscal Lags, Deficit Financing and Infladon in Kenya, 1967-86." Universityof Nairobi, M.A. Research Paper.
Ministry of Finance. 1990. "Public Sector Employment." Paper prepared for EmploymentWorkshop, Naivasha, May 28-30, 1990. Nairobi.
Moran, C. 1989. "Imports Under a Foreign Exchange Constraint," World Bank Economic Review,Vol. 3, No. 2, pp. 279-295.
Mwega, F.M. 1990. "An Econometric Study of Select Monetary Policy Issues in Kenya." OverseasDevelopment Institute Working Paper (forthcoming).

96 BibiIographical Notes
Republic of Kenya. 1982. Report and Recommendations of the Working Party on GovernmentExpenditures. Nairobi: Government Printer.
--. 1986. Sessional papet No. 1 of 1986 on Economic Management for Renewed Growth.Nairobi: Government Printer.
-----. 1988. Urban Labour Force Survey, 1986. Central Bureau of Stadstics and Long RangePlanning Unit, Ministry Of Planning and Nadional Development. Nairobi.
1989. Development Plan 1989-1993. Nairobi: Government Printer.
1990. Budget Speech. Speech delivered to the nadonal Assembly on 7th June, 1990, by theVice President and Minister for Finance, when presenting the budget for fiscal year 1990/91.Nairobi.
Various years. Economic Survey. Central Bureau of Statistics. Nairobi.
-. Various years. Statistical Abstract. Central Bureau of Statistics. Nairobi.
-. Various years. Esdmates of Recurrent Expenditure of the Government of Kenya. Nairobi.
Various years. Appropriation Accounts of the Government of Kenya. Nairobi.
Various years. Programme Review and Forward Budget. Ministry of Finance.Nairobi.
Tegene, A. 1989. "The Monetarist Explanadion of Inflation: The Experience of Six AfricanCountries." Journal of Economic Studies. 16 (1).
United Nations. 1989. "Classification by Broad Economic Categories." Statistical PaperSeries M. No. 53.
World Bank. 1987. Kenya. Industrial Sector Policies for Investment and Growth. Eastern andSouthern Africa Region. Report No. 6711-KE. Washington, D.C.
-. 1988a. Kenya. Recent Economic Developments and Selected Policy Issues. Eastern AfricaDepartment. Report No. 7411-KE. Washington, D.C.
-. 1988b. Employment and Growth in Kenya. Eastern Africa Department. Report No.7393-KE. Washington, D.C.
-. 1989a. Kenya. Public Expenditure Issues. Eastern Africa Department. Report No. 7508-KE. Washington, D.C.
1989b. Kenya, The Role of Women in Economic Development. A World BankCountry Study. Washington, D.C.
-. 1989c. Sub-Saharan Africa. From Crisis to Sustainable Growth. A Long-Term PerspectiveStudy. Washington, D.C.

-. 1990a. Second Report on Adjustment Lending: Policies for the Recovery of Growth. ReportNo. 8517. Washington D.C.
-. 1990b. World Development Report 1990. New York: Oxford University Press.
1990c. Kenya's Agricultural Growth Prospects and Strategy Options. Eastern AfricaDepartment. Report No. 8155-KE. Washington, D.C.
-. 1990d. Kenya. Rural Fmance Review. Eastern Africa Department. Report No. 8138-KE.Washinton, D.C.
-. 1990e. Kenya: Policy Framework Paper, 1990 to 1992. Prepared by the Government ofKenya in collaboration with the staffs of the IMF and the World Bank.SecM90424. Washington, D.C.
-. 1990f. Tourism Development in Kenya. Draft. Washington, D.C.
-. 1990g. Long-Term Outlook for the World Economy: Issues and Projections for the 1990s.Washington, D.C.
-. 1990h. Import Elasticities in Kenya: 1968-89 and Beyond. Draft. Washington, D.C.
-. 1990i. Commodity Reports. World development News. Washington, D.C.

Statistical Appendix

STATIMTCAL APPENDIX
Table of Contents
Table No.
Population and Employment1.1 Population Projections, 1979-20001.2 Population Projections by Sex and Age Groups, 1979-20001.3 Employment by Industry and Sector
National Income Accounts2.1 Gross Domestic Product by Origin at Current Prices2.2 Gross Domestic Product by Origin at Constant 1982 Prices2.3 Gross National Product by Expenditure at Current Prices2.4 Gross National Product by Expenditure at Constant 1982 Prices2.5 Gross Fixed Capital Formation by Industry at Currnt Prices2.6 Gross Fixed Capital Formation by Industry at Constant 1982 Prices2.7 Deflators (1982 = 100)2.8 Incremental Capital - Output Ratios
Balance of Payments and Trade3.1 Balance of Payments (in millions of Kenya Pounds)3.2 Balance of Payments (in millions of US Dollars)3.3 Merchandise Exports - Value and Volume3.4 Value of Exports by Destination3.5 Exports by Standard International Trade Classification -
Quantum, Price and Value Indices3.6 Merchandise Imports - Value3.7 Value of Imports by Origin3.8 Imports by Standard International Trade Classification -
Quantum, Price and Value Indices3.9 External Terms of Trade Indices3.10 Service Transactions and Transfers3.11 Foreign Exchange Reserves at Year's End
External Debt4.1 External Long-Term Public Debt Outstanding
Including Undisbursed as of December 31, 19894.2 External Public Debt DOD and Commitments by Creditor Type for 1979-894.3 External Public Debt Disbursements and Service Payments by Creditor Type
for 1979-894.4 IMP Position at Year's End
Public Finance5.1 Summary of Central Government Budget Operations5.2 Central Government Revenues5.3 Economic Classification of Central Government Expenditure5.4 Central Government Recurrent and Development Expenditure by Sector5.5 Central Government Expenditure by Sector5.6 Local Government Budget Operations5.7 Public Sector Fixed Capital Formation by Industry5.8 Public Sector Employment and Wage Bill
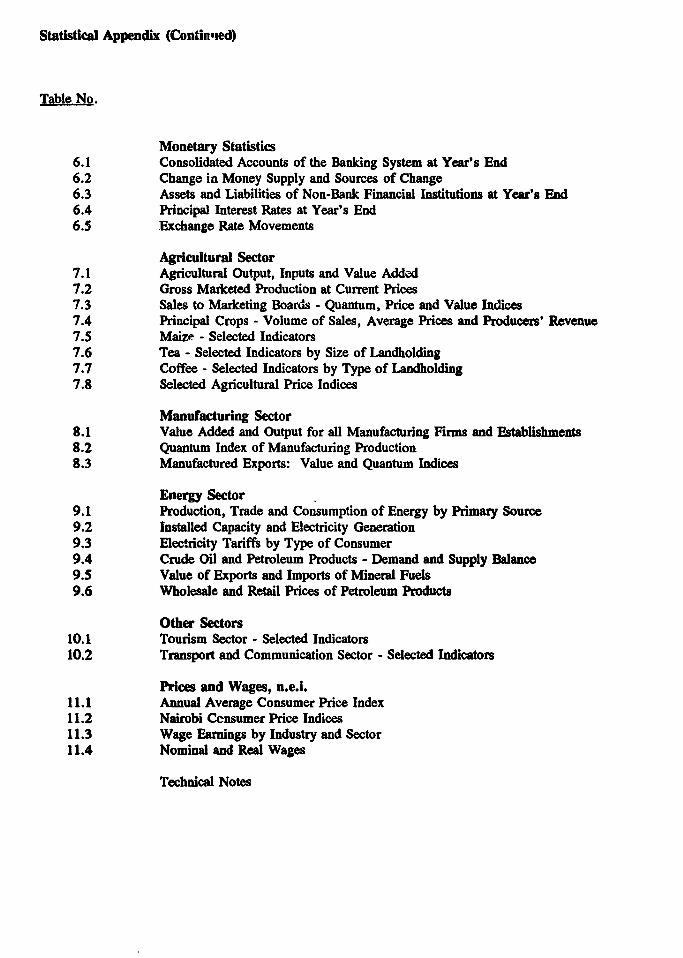
Statistical Appendix (Continuted)
Table No.
Monetary Statistics6.1 Consolidated Accounts of the Banking System at Year's End6.2 Change in Money Supply and Sources of Change6.3 Assets and Liabilities of Non-Bank Financial Institutions at Year's End6.4 Principal Interest Rates at Year's End6.5 Exchange Rate Movements
Agricultural Sector7.1 Agricultural Output, Inputs and Value Added7.2 Gross Marketed Production at Current Prices7.3 Sales to Marketing Boards - Quantum, Price and Value Indices7.4 Principal Crops - Volume of Sales, Average Prices and Producers' Revenue7.5 Maize - Selected Indicators7.6 Tea - Selected Indicators by Size of Landholding7.7 Coffee - Selected Indicators by Type of Landholding7.8 Selected Agricultural Price Indices
Manufacturing Sector8.1 Value Added and Output for all Manufacturing Firms and Establishments8.2 Quantum Index of Manufacturing Production8.3 Manufactured Exports: Value and Quantum Indices
Energy Sector9.1 Production, Trade and Consumption of Energy by Primary Source9.2 Installed Capacity and Electricity Generation9.3 Electricity Tariffs by Type of Consumer9.4 Crude Oil and Petroleum Products - Demand and Supply Balance9.5 Value of Exports and Imports of Mineral Fuels9.6 Wholesale and Retail Prices of Petroleum Products
Other Sectors10.1 Tourism Sector - Selected Indicators10.2 Transport and Communication Sector - Selected Indicators
Prices and Wages, n.e.i.11.1 Annual Average Consumer Price Index11.2 Nairobi Ccnsumer Price Indices11.3 Wage Earnings by Industry and Sector11.4 Nominal and Real Wages
Technical Notes

Table 1.1: POPULATION PROJEC1TONS, 1979-2000(In Thou_aad)
1979 7S39 16141
1980 65S1 16667
1981 7802 17342
1982 8126 18035
1983 8469 18741
1984 8829 19482
1985 9201 20241
1986 9S91 21021
1987 10006 21826
1988 10431 226S7
1989 10179 23S13
1990 11348 24397
1995 13972 29237
2000 17065 34792
1/ Dcfined *th age° ugp 15-59.
Souce: Ceatral Bureau of Statisics, St1dWW Absrac; adPopulstio Projecdos he Keny,l - 2000, Maru 193.

104 Statistical Appendix
Table 1.2: POPULATION PROJECTIONS BY SEX AND AGE GROUPS, 1979-2000(in Millions)
1979 7.6 7.7 5.3 2.1 1.7 5.8 0.4
1980 8.3 8.4 6.3 2.2 1.7 4.9 1.5
1981 8.6 8.7 6.6 2.3 1.8 6.0 0.6
1982 9.0 9.1 6.8 2.4 1.9 6.2 0.6
1983 9.3 9.4 7.1 2.6 2.0 6.5 0.7
1984 9.7 9.8 7.3 2.7 2.' 6.7 0.7
1985 10.1 10.2 7.6 2.8 2.2 7.0 0.7
1986 10.5 10.5 7.8 2.9 2.3 7.3 0.7
1987 10.9 10.9 8.1 3.0 2.4 7.6 0.7
1988 11.3 11.4 8.3 3.1 2.5 7.9 0.8
1989 11.7 11.8 8.6 3.3 2.6 8.3 0.8
1990 12.2 12.2 8.9 3.4 2.7 8.6 0.8
1995 14.6 14.6 10.3 4.0 3.3 10.6 1.0
2000 17.4 17.4 11.9 4.6 3.9 13.1 1.2
No¢t: For aumupioas undldyisg _mu proj@eia we Tebaca Note.
Soures: Cestrd Bureu of Stiiica, S3tbaed Absract; and Popuation Projeteions for Kenya,1980 - 2000, March 1983.

Table 1.3: EMPLOYMENT BY INDUSTRY AND SECTOR(In Thousands)
X g > > "''1'.)0WI# 990 9*1 1 9 .9 19* 195 :'19*6 1987 19*3 19*9
W geEmployees 972.3 1005.8 1024.3 1046.0 1093.3 1119.4 1174.4 1226.7 1274.1 1326.6 1359.0
Agriculture and forestry 254.6 231.4 235.5 223.8 231.1 235.4 240.9 248.4 253.0 260.1 257.1Mining and quarrying 2.6 2.3 2.2 3.0 3.5 4.1 4.8 3.8 3.7 3.9 4.1Manufacturing 138.4 141.3 146.3 146.8 148.8 153.1 158.8 166.2 172.9 179.4 182.3Electricity and water 9.9 10.1 10.2 14.0 17.2 17.4 17.8 18.2 19.2 20.4 22.4Construction 61.3 63.2 61.3 60.4 60.2 49.3 49.9 55.7 58.2 62.6 67.4Trade,restaurants nd botels 68.7 70.5 72.6 74.9 80.3 84.8 89.7 95.4 100.9 106.4 110.3Transport and communications 54.8 55.2 55.4 52.8 55.0 54.1 55.7 62.0 64.4 67.2 69.4Finance and business services 35.6 39.7 39.5 43.7 45.7 50.2 53.4 56.3 57.9 61.3 63.7Other services 1/ 346.4 392.1 401.3 426.6 451.5 471.1 503.4 520.7 543.9 565.3 582.3
Private Sector 547.6 534.2 540.2 540.4 565.5 578.0 599.7 620.9 646.7 671.2 678.4
Agriculture and forestry 193.9 172.5 173.6 167.5 177.3 181.3 186.0 192.9 198.8 197.3 194.0Mining and quarrying 2.0 1.7 1.5 1.8 2.1 2.6 3.2 2.3 3.2 3.3 3.5Manufacturing 112.0 111.4 116.7 116.0 117.1 119.7 123.6 130.1 136.1 141.8 143.0Electricity and water 0.1 0.1 0.2 0.2 0.1 0.0 0.0 0.0 0.2 0.2 0.2Construction 32.5 31.7 32.6 32.1 31.4 27.2 25.8 24.8 26.1 30.0 32.1Trade,restaurants and hotels 64.4 66.0 67.7 69.3 74.6 79.2 83.8 89.1 92.7 98.0 101.7Transport and communications 23.3 23.0 18.9 19.7 21.1 23.1 20.5 19.6 19.7 21.4 22.6Finamceandbusinesaservices 28.1 31.9 31.1 34.7 36.1 38.4 40.1 40.7 41.6 44.2 45.3Other services I/ 91.3 95.9 97.9 99.1 105.7 109.6 116.7 121.4 128.3 135.0 136.0
Public Sector 2t 424.7 471.6 484.1 505.6 527.8 541.4 574.7 605.8 627.4 655.4 680.6
Self-employed and family workers 63.0 61.9 62.1 62.7 63.2 32.4 33.4 35.4 38.1 43.9 44.3
Small scale enterprises 3/ 121.6 123.1 157.3 172.2 221.4 233.3 254.5 281.1 312.1 346.2 390.0
TOTAL, ' i' 16.9 1l90.8 1243.7' 1280.9 '1' I377.9 113851 'i4623 1$432 16243 1716.7 17933
Memo Items:Wage Employees 972.3 1005.8 1024.3 1046.0 1093.3 1119.4 1174.4 1226.7 1274.1 1326.6 1359.0
Regular .. .. .. .. 898.8 982.0 1031.4 1062.3 1093.7 1143.2 1163.0Casual .. .. .. .. 194.5 137.4 142.9 164.4 180.4 183.4 196.0
1/ Community. social and personal services.
2/ See Statitical Appendix Table 5.8 for details.
3/ lncludes urba '

Table 2.1: GROSS DOMESTIC PRODUCT BY ORIGIN AT CURRENT PRICES
(n Millions of Kenya Pounds)
;,:0 19;8 ;19.@? ::: ;j .; ., ,.< i., , .4 9 ., , Mov. 1-1979 1980 1981 1982 1983 1984 1985 1986 1987 1988 1989
Non-Mooetary Economy 119.0 131.7 150.8 164.7 199.6 215.1 246.9 263.8 297.4 341.9 389.0Forestry and fishing 15.7 17.2 20.0 22.7 26.3 29.6 35.0 39.1 45.5 54.7 62.1Building and construction 37.2 41.6 46.2 49.0 60.0 62.1 76.3 71.8 77.1 84.2 90.4Water collection 14.0 15.1 17.1 19.5 22.1 24.8 28.1 31.6 35.8 40.7 47.1Ownership of dwellings 52.1 57.8 67.4 73.6 91.2 98.6 107.5 121.4 139.0 162.3 189.4
Monetary Economy 1914.2 2166.7 2508.7 2884.S 3274.0 3657.8 4171.7 4851.2 5315.1 6049.2 6941.5Agriculture 671.2 711.9 819.1 964.1 1126.5 1244.3 1357.2 1598.1 1669.3 1902.7 2088.4Forestry and fishing 16.6 20.0 25.2 30.5 35.8 39.5 44.5 53.0 67.1 81.7 120.8Mining and quarrying 5.0 5.7 5.9 6.6 7.4 8.5 10.0 11.5 13.3 13.7 18.6Manufacturing 249.8 295.1 328.2 372.3 408.3 461.0 518.4 608.2 652.5 753.0 855.4Buildingandconstruction 82.3 105.2 121.0 135.8 137.6 133.6 161.5 175.1 210.8 284.1 386.9Electricity and water 15.3 16.5 20.8 24.8 37.6 43.2 49.5 52.1 55.2 57.6 64.0Trade, restaurants & hotels 214.1 244.7 274.0 306.7 371.0 439.7 520.6 561.0 628.3 712.0 829.1Transport, storage & comm. 114.7 127.8 143.4 185.2 215.9 250.3 296.4 341.1 393.4 433.7 485.8Finance & business services 117.6 135.7 168.8 209.7 248.7 269.0 314.9 365.2 418.7 501.8 576.9Ownership of dwellings 123.3 146.3 180.2 179.5 196.7 214.5 231.7 263.0 303.6 355.6 393.9Domestic services 19.2 23.3 28.6 32.8 35.6 44.9 51.8 63.0 71.8 83.9 97.5Government services 289.3 332.5 390.9 441.4 475.3 522.2 616.3 756.5 822.7 917.3 1077.8Other services 52.1 65.0 73.9 82.5 92.2 107.3 129.6 153.7 181.7 197.9 228.0Imputed bank service charges -56.1 -62.9 -71.2 -87.3 -114.5 -120.2 -130.6 -150.2 -173.0 -246.0 -281.6
Toeal ODP t Factor Cosi .;; i2?4<¢i'¢26$9.30493 .3 73.6 38i.9 418.7 5115.0 5612.5 6391.1 7330.5.Memo Items:Total GDP at Factor Cost 11 2033.2 2298.4 2659.5 3049.3 3473.6 3872.9 4418.7 5115.0 5612.5 6391.1 7330.5
Agriculture 703.4 749.1 864.3 1017.3 1188.6 1313.5 1436.7 1690.1 1781.9 2039.1 2271.3Industry 403.6 479.2 539.2 608.0 672.9 733.1 843.8 950.3 1044.6 1233.3 1462.4
Manufacturing 249.8 295.1 328.2 372.3 408.3 461.0 518.4 608.2 652.5 753.0 855.4Services 926.1 1070.1 1256.1 1424.0 1612.1 1826.3 2138.2 2474.6 2786.0 3118.7 3596.8
i/ See Technical Note for aggregation scheme.
Source: Cen:ral Bureau of Statistics, Economic Survey, various issues and Ministry of Planning.

Table 2.2: GROSS DOMESTIC PRODUCT BY ORIGIN AT CONSTANT 1982 PRICES(In Millions of Kenya Pounds)
';~~~~~ ',p t'0 ...........NW.... Sa S ...
.197.,*. 19'0 . 1931 V 1982 1983 1984 1935 1986 1987 1988 1989
Non-Monetary Economy 149.4 155.8 159.6 164.7 178.4 185.7 202.4 201.7 208.8 214.8 223.4Forestry and fishing 20.3 21.0 21.8 22.7 24.9 25.8 28.5 29.2 30.1 31.1 32.0Building and construction 45.4 48.1 48.0 49.0 57.2 59.1 70.6 65.3 67.7 68.2 71.5Water collection 18.4 18.7 19.0 19.5 19.9 20.3 20.7 21.1 21.7 22.6 23.4Ownership of dwellings 65.3 68.0 70.7 73.6 76.5 80.6 82.7 86.1 89.3 92.9 96.4
Monetary Economy 2512.2 2612.4 2774.0 2884.5 2946.5 2966.0 3110.9 3296.5 3459.6 3643.9 3826.6Agriculture 838.0 845.9 897.3 964.1 979.1 941.1 975.6 1023.4 1062.6 1109.3 1152.5Forestry and fishing 26.6 27.6 28.4 30.5 32.2 33.3 36.2 39.0 44.6 50.4 53.4Mining and quarrying 8.0 8.8 5.5 6.6 6.7 7.4 8.1 8.4 9.1 10.2 10.6Manufacturing 334.0 351.5 364.1 372.3 389.1 405.8 424.1 448.7 474.3 502.8 532.5Buildingandconstruction 118.3 126.6 136.7 135.8 112.0 104.5 108.1 112.1 116.7 121.7 128.3Electricity and water 21.8 21.3 24.6 24.8 26.1 26.8 29.0 31.2 33.6 36.5 39.5Trade, restaurants & hotels 303.3 318.4 322.5 306.7 315.3 332.6 355.2 390.0 412.5 436.3 455.5Transport, storage&comm. 140.9 148.8 151.7 185.2 201.5 202.3 206.5 215.4 224.9 234.0 241.1Finance & business services 170.1 169.2 221.3 209.7 226.0 222.5 244.5 261.0 274.5 291.3 313.1Ownership of dwellings 157.7 165.7 181.3 179.5 181.5 184.6 190.3 196.5 205.6 212.2 220.6Domestic services 24.1 28.3 30.7 32.8 34.9 37.2 39.8 44.0 48.7 55.3 62.4Government services 382.4 403.8 425.2 441.4 459.9 473.1 497.3 528.7 554.1 586.2 618.4Other services 68.2 75.0 78.0 82.5 86.3 94.2 99.1 104.1 111.7 119.7 127.9Imputed bank service charges -81. 1 -78.4 -93.4 -87.3 -104.1 -99.4 -103.0 -105.9 -113.4 -121.8 -129.1
Total OGDPt FIclor Cost .¢ '1' .2768, 3 304973 3124.9 ' 31517 .3313.3 3498.2 3668.4 3858.6 4050.0Memo Items:Total GDP at Factor Cost l1 2661.5 2768.2 2933.5 3049.3 3124.9 3151.7 3313.3 3498.2 3668.4 3858.6 4050.0
Agnculture 885.0 894.5 947.5 1017.3 1036.2 1000.2 1040.3 1091.5 1137.3 1190.7 1238.0Industry 545.8 574.9 597.9 608.0 610.9 623.9 660.5 686.8 723.1 761.9 805.8
Manufacturing 334.0 351.5 364.1 372.3 389.1 405.8 424.1 448.7 474.3 502.8 532.5Services 1230.8 1298.9 1388.2 1424.0 1477.8 1527.6 1612.5 1719.9 1808.1 1906.0 2006.2
It See Technical Note foT aggregation scheme.
Source: Central Bureau of Statistics, Economic Survey, various issues and Ministry of Planning.

Table 2.3: GROSS NATIONAL PRODUCT BY EXP
(In Millions of Kenya Pounds)
Prov. 0).;979'1980 1981 1982 1983 1984 1985 198PS 1987 1988 1989
GDP at Factor Cost 2033.2 2298.4 2659.5 3049.3 3473.6 3872.9 441S.7 5115.0 5612.5 639s.1 7330.5Non-Monetary 119.0 131.7 150.8 164.7 199.6 215.1 246.9 263.8 297.4 341.9 389.0Monetary 1914.2 2166.7 2503.7 2834.5 3274.0 3657.8 4171.7 4851.2 5315.1 6049.2 6941.5
Net Indirect Taxes 297.0 397.1 441.3 466.2 509.3 589.6 618.7 759.2 910.9 1079.0 1190.4Indirect Taxes 297.6 397.8 442.6 467.7 511.0 591.4 619.7 759.8 911.6 1079.2 1190.5Subsidies 0.6 07 1.2 1.6 1.7 1.8 1.0 0.6 0.7 0.2 0.1
_~DPi1 M k4P '. .~.k~~2330.2 7695$T3i~t wSI5.4.398Z.F'.44.62.5 5037.3 87i4i 42523.4 1476.2 8520.9
Resource Gap 136.5 299.4 251.8 131.8 17.8 61 5 53.6 -10.3 334.5 389.5 494.7Imports of GNFS I/ 736.6 1052.7 1048.7 1009.4 1014.2 1232.0 1328.4 1506.4 1734.1 2054.3 2492.4Exports of GNFS 600.1 753.3 796.9 877.6 996.3 1170.5 1274.8 1516.7 1399.6 1664.9 1997.7
Total Resources 2466.7 2994.9 3352.6 3647.2 4000.7 4523.9 5090.9 5863.9 6857.9 7859.6 9015.6
Consumption 1947.3 2207.2 2494.5 2879.5 3171.4 3598.2 3804.6 4585.5 5265.4 5966.5 6843.1Public 447.3 533.8 576.4 647.4 733.1 775.6 880.1 1075.9 1214.5 1287.5 1636.1Private 1503.1 1671.9 1914.3 2232.1 2438.3 2822.6 2920.3 3519.8 4050.9 4679.1 5207.0Statistical Discrepancy -3.1 . 3.8 -0.0 0.0 -0.0 4.2 -10.2 0.0 0.0 -0.0
Gross Investment 519.4 787.7 858.1 761.1 829.3 925.7 1286.3 1278.4 1592.6 1893.1 2172.6Gross fixed capital formation 543.6 621.0 724.7 668.2 717.5 807.2 880.4 1153.2 1286.7 1522.2 1712.1
Public 248.6 281.2 322.5 300.9 274.2 336.7 343.5 475.5 467.5 624.7 694.3Private 295.0 339.9 402.2 367.4 443.3 470.5 536.9 677.7 819.3 897.5 1017.8
Changes in stocks -24.2 166.7 133.4 99.5 111.9 118.6 405.9 125 2 305.8 370.9 460.4
Gross Domestic Savings 382.9 488.3 606.3 635.9 811.5 864.3 1232.8 1288.7 1258.0 1503.6 1677.9 0Net Factor Income -83.9 -84.0 -97.1 -139.4 -127.2 -150.2 -183.2 -209.6 -248.6 -320.6 -363.1Net Private Transfers 4.0 10.1 44.6 45.5 42.2 43.3 67.0 47.2 59.3 79.0 104.4Gross National Savings 303.0 414.4 553.8 542.1 726.5 757.4 1116.5 1126.3 1068.6 1262.0 1419.2
ot a*tt Markt rices 2246.3 2611.5 3003 3376.1 3855.7 4312.3 4854.1 5664.6 6274.8 7149.5 8157.9
I/ Data for 1989 excludes 120KL.nillion which represents the purchase of one and leasing of another aircraft
by Kenya Airways Corporation.
Source: Central Bureau of Shaistics, Economic Survey, various issues and Ministry of Planning.
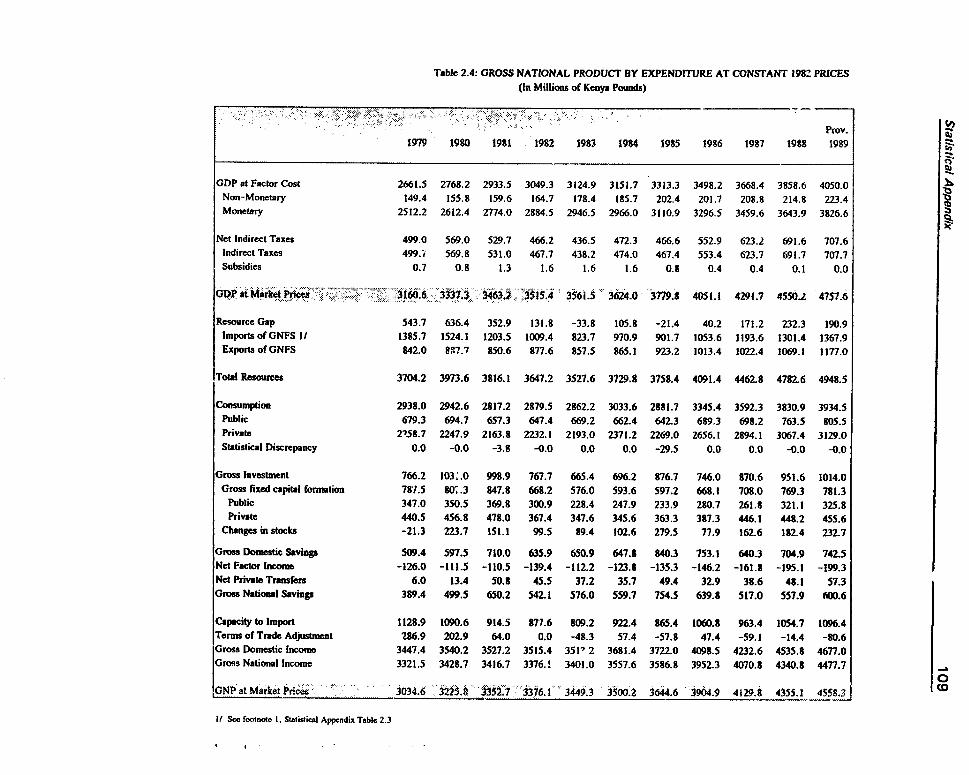
Table 2.4: GROSS NATIONAL PRODUCT BY EXPENDITURE AT CONSTANT 1982 PRICES(In Millions of Kenya Pounds)
PrOV.1979 1980 1981 1982 19S3 1984 1985 1986 1987 19S8 1989
GDP at Factor Cost 2661.5 2768.2 2933.5 3049.3 3124.9 3151.7 3313.3 3498.2 3668.4 3858.6 4050.0Non-Monetary 149.4 155.8 159.6 164.7 178.4 185.7 202.4 201.7 208.8 214.8 223.4Monetary 2512.2 2612.4 2774.0 2884.5 2946.5 2966.0 3110.9 3296.5 3459.6 3643.9 3826.6
Net Indirect Taxes 499.0 569.0 529.7 466.2 436.5 472.3 466.6 552.9 623.2 691.6 707.6Indirect Taxes 499.7 569.8 531.0 467.7 438.2 474.0 467.4 553.4 623.7 691.7 707.7Subsidies 0.7 0.8 1.3 1.6 1.6 1.6 0.8 0.4 0.4 0.1 0.0
01) at.a;r,et s, , 3160.6,33373 3 4 1, uI,54 3561-5 3624.0 3779.8 4051.1 4291.7 4550.2 47S7.6
Resource Gap 543.7 636.4 352.9 131.8 -33.8 105.8 -21.4 40.2 171.2 232.3 190.9ImportsofGNFS It 1385.7 1524.1 1203.5 1009.4 823.7 970.9 901.7 1053.6 1193.6 1301.4 1367.9Exports of GNFS 842.0 8P7.7 850.6 877.6 857.5 865.1 923.2 1013.4 1022.4 1069.1 1177.0
Total Resources 3704.2 3973.6 3816.1 3647.2 3527.6 3729.8 3758.4 4091.4 4462.8 4782.6 4948.5
Consumption 2938.0 2942.6 2817.2 2879.5 2862.2 3033.6 2881.7 3345.4 3592.3 3830.9 3934.5Public 679.3 694.7 657.3 647.4 669.2 662.4 642.3 689.3 698.2 763.5 805.5Private 2758.7 2247.9 2163.8 2232.1 2193.0 2371.2 2269.0 2656.1 2894.1 3067.4 3129.0Statistical Discrepancy 0.0 -0.0 -3.8 -0.0 0.0 0.0 -29.5 0.0 0.0 -0.0 -0.0
Gross Investnent 766.2 103:.0 998.9 767.7 665.4 696.2 876.7 746.0 870.6 951.6 1014.0Gross fixed capital formation 78'1.5 80,.3 847.8 668.2 576.0 593.6 597.2 668.1 708.0 769.3 781.3
Public 347.0 350.5 369.8 300.9 22.4 247.9 233.9 280.7 261.8 321.1 325.8Private 440.5 456.8 478.0 367.4 347.6 345.6 363.3 387.3 446.1 448.2 455.6
Changes in stocks -21.3 223.7 151.1 99.5 89.4 102.6 279.5 77.9 162.6 182.4 232.7
Gross Domestic Savings 509.4 597.5 710.0 635.9 650.9 647.8 840.3 753.1 640.3 704.9 742.5Net Factor Income -126.0 -111.5 -110.5 -139.4 -112.2 -123.8 -135.3 -146.2 -161.8 -195.1 -199.3Net Private Trastfers 6.0 13.4 50.8 45.5 37.2 35.7 49.4 32.9 38.6 48.1 57.3Gross National Savings 389.4 499.5 650.2 542.1 576.0 559.7 754.5 639.8 517.0 557.9 600.6
Capacity to Import 1128.9 1090.6 914.5 877.6 809.2 922.4 865.4 1060.8 963.4 1054.7 1096.4Terms of Trade Adjustment 286.9 202.9 64.0 0.0 -48.3 57.4 -57.8 47.4 -59.1 -14.4 -80.6Gross Domestic Income 3447.4 3540.2 3527.2 3515.4 351' 2 3681.4 3722.0 4098.5 4232.6 4535.8 4677.0Gross National Income 3321.5 3428.7 3416.7 3376.1 3401.0 3557.6 3586.8 3952.3 4070.8 4340.8 4477.7
0GON atMarket Prices ' 3034.6 3225.8 352. 3376.1 3449.3 3500.2 3644.6 3904.9 4129.S 4355.1 4558.3 t
If See footnotc I, Statistical Appcndix Table 2.3

Table 2.5 GROSS FIXED CAPITAL FORMATION BY INDUSTRY AT CURRENT PRICES(In Millions of Kenya Pounds)
.~~~~~~~~~~~~~~~~~~~~~~~~~~~~PvPtov.
1979 1980 1981 1982 1983 1984 1985 1986 1987 1988 1989
TotalCapitFatnatiam .$43.6 621.0 124.7 668.2 7171.5 807.2 880.4 1153.2 1286.7 1522.2 1712.1Agriculture and forestry 42.7 48.2 55.6 51.9 54.0 59.0 76.3 90.0 106.7 115.0 103.9Mining and quarrying 4.1 5.0 4.9 4.1 5.1 7.1 4.9 7.0 12.7 10.2 9.4Manufacturing 88.5 76.9 90.3 67.0 111.7 95.3 101.8 161.3 171.8 218.7 249.9Electricity and water 32.0 41.3 65.5 75.2 57.2 37.0 43.3 48.6 62.2 81.7 124.5Construction 25.7 33.4 32.9 28.9 59.4 68.3 31.5 50.3 70.2 70.5 65.2Trade, restaurants & hotels 17.3 28.3 19.7 21.8 26.4 24.8 34.5 24.9 24.9 36.4 33.6Transport and communication 101.7 102.8 113.5 101.5 110.1 149.9 164.2 289.0 306.7 269.3 349.2Finance & business services 8.3 10.2 23.7 9.4 16.7 18.4 19.2 13.5 21.6 38.4 47.1Ownership of dwellings 1l 94.8 106.6 120.6 126.5 114.1 134.8 132.5 172.8 194.1 213.5 233.9Government services 96.9 127.2 144.5 126.7 102.0 153.1 192.4 220.0 230.1 362.6 349.8Other services 31.8 41.3 53.6 55.3 60.7 59.5 80.0 75.9 85.8 106.0 145.7
Private Sector 2t 291.8 341.3 406.0 367.4 443.3 470.5 536.9 662.6 839.2 897.5 1017.8Agriculture and forestry 37.4 39.1 45.9 43.8 45.6 49.9 69.6 84.6 102.5Mining and quarrying 4.1 5.0 4.8 4.1 5.1 7.1 4.9 7.0 12.7Manufacturing 64.5 73.9 87.7 64.3 108.6 92.2 98.8 156.1 163.1Electricity and water -0.0 -0.1 0.0 0.0 0.0 0.0 14.2 12.7 1.0Construction 22.9 31.4 30.4 25.4 32.8 42.6 15.2 27.3 66.2Trade, restaurants & hotels 15.5 26.3 18.0 17.7 20.8 22.2 31.4 22.1 9.4Transport and communication 36.2 46.6 62.6 54.2 68.2 84.9 101.0 128.5 237.8Finance & business services 3.5 1.2 12.6 2.3 7.7 4.3 8.6 8.5 4.9Ownership of dwellings I/ 78.0 79.3 94.4 102.9 95.5 109.7 114.3 140.8 156.6Other services 29.8 38.8 49.6 52.7 59.0 57.5 78.9 75.1 85.0
Public Sector 3/ 248.6 281.2 322.5 300.9 274.2 336.7 343.5 475.5 467.5 624.7 694.3Memo Items:Total Capital Formation 41 543.6 621.0 724.7 668.2 717.5 807.2 880.4 1153.2 1286.7 1522.2 1712.1
Agriculture 42.7 48.2 55.6 51.9 54.0 59.0 76.3 90.0 106.7 115.0 103.9Industry 150.3 156.6 193.5 175.2 233.3 207.7 181.4 267.2 317.0 381.1 449.0Manufacturing 88.5 76.9 90.3 67.0 111.7 95.3 101.8 161.3 171.8 218.7 249.9
Services 350.6 416.3 475.6 441.2 430.1 540.5 622.7 796.0 863.1 1026.1 1159.2
I/ Includes traditional dwelings.
21 Derived residually.3/ Includes Central Government, Municipaities, Councils and parastatala (See Staistical Appendix Table 5.7 for details).41 See Technical Note for aggregation scheme.
Source: Central Bureau of Statistics, Economic Survey, various issues.

Table 2.6 GROSS FIXED CAPITAL FORMATION BY INDUSTRY AT CONSTANT 1982 PRICES(In Millions of Kenya Pounds)
- 7~ t 7 / , i > s;3 < > . e < g < 0; ; / Proj1979 1980 1931 19:82 1983 1984 1985 1986 1987 1988 1989
Tout apta foo.t7.. "3.I 7. 66.I 708.0 769.3 731.3Agriculture and forestry 62.5 63.1 64.9 51.9 44.0 40.7 51.2 54.0 59.1 60.9 48.2Miningandquarrying 6.6 7.6 6.0 4.1 3.6 4.9 3.1 3.6 6.7 5.4 4.1Manufacturing 137.7 110.1 109.7 67.0 81.0 65.7 65.2 83.9 89.6 112.5 108.6Electricity and water 42.7 49.9 76.0 75.2 49.5 27.0 29.1 29.9 35.7 43.4 60.1Construction 40.8 48.1 40.2 28.9 41.8 46.9 20.3 27.0 37.2 37.1 28.4Trade, restaurants & hotels 26.9 39.5 51.0 21.8 21.4 17.9 24.2 14.2 13.4 19.0 14.8Transportandcommunication 134.4 127.8 102.1 101.5 83.3 105.3 106.6 144.8 351.1 119.6 145.3Finance & business services 12.6 12.7 26.8 9.4 14.3 14.2 13.1 7.6 11.9 20.7 22.4Ownership of dwellings I/ 143.4 133.1 138.3 126.5 101.7 112.5 97.2 119.3 120.0 99.9 115.1Government services 130.6 160.2 169.3 126.7 88.0 114.7 132.1 138.1 133.9 192.9 165.1Other services 49.4 55.3 63.6 55.3 47.3 43.9 55.1 45.5 49.6 57.8 69.3
Private Sector 21 440.5 456.8 478.0 367.4 347.6 345.6 363.3 384.4 449.2 448.2 455.6Agriculture and forestry 55.2 52.4 54.2 43.8 37.4 35.6 47.4 50.7 55.2Mining and quarrying 6.6 7.6 6.0 4.1 3.6 4.9 3.1 3.6 6.7Manufacturing 98.9 105.6 106.6 64.3 78.7 63.5 63.3 79.1 85.0Electricity and water 0.0 0.0 0.0 0.0 0.0 0.0 0.0 -3.6 1.4Construction 36.5 45.1 37.3 25.4 23.2 29.3 18.8 25.4 34.9Trade, restaurants & hotels 24.5 36.6 21.5 17.7 16.3 16.1 22.0 12.7 4.5Transport and communication 47.8 56.8 70.7 54.2 50.7 59.2 65.0 64.4 113.8Finance & business services 5.7 1.8 14.2 2.3 6.7 3.1 5.5 4.6 1.8Ownership of dwellings 21 118.2 99.1 108.2 102.9 85.1 91.5 83.8 302.3 96.7Other services 47.2 52.0 59.2 52.7 46.1 42.4 54.4 45.2 49.1
Public Sector 31 347.0 350.5 369.8 300.9 228.4 247.9 233.9 280.7 261.8 321.1 325.8Memo ItemsTotal Capital Formation 4/ 787.5 807.3 847.8 668.2 576.0 593.6 597.2 668.1 708.0 769.3 781.3
Agriculture 62.5 63.1 64.9 51.9 44.0 40.7 51.2 54.0 59.1 60.9 48.2Industry 227.7 215.7 231.9 175.2 175.9 144.4 117.6 144.5 169.2 198.4 201.2
Manufacturing 137.7 110.1 109.7 67.0 81.0 65.7 65.2 83.9 89.6 112.5 108.6Services 497.3 528.6 551.0 441.2 356.0 408.4 428.3 469.6 479.7 510.0 531.9
It Includes traditiona dwdlings.21 Derived residually.31 Includes Central Government, Municipalities, Councds and pArastls (See Statisticd Appendix Table 5.7 for details).41 See Technical Note for aggregation schcme,
Source: Central Bureau of Statistics, Economic Survey, various issues.
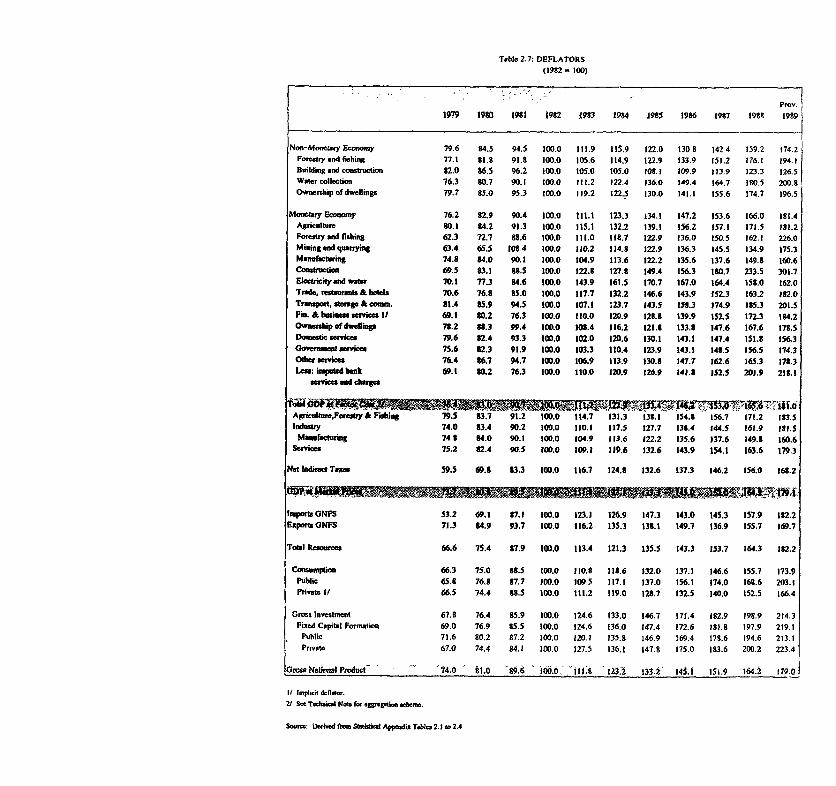
Table 2.7: DEFLATORS
(1982- 100)
Ptov.
1979 19S0 298; 192 (983 1984 1985 1986 1987 1988 1989
Non- Mooetary Economy 79.6 84.5 94.5 100.0 111.9 115.9 122.0 130 8 142 4 159.2 174.2
Forestry and fishing 77.1 8I.8 91.8 100.0 105.6 114.9 122.9 133.9 151.2 176.1 194.1
Buildingund construction 82.0 S6.5 96.2 100.0 105.0 105.0 108.1 109.9 113.9 123.3 126.5
Watercollection 76.3 80.7 90.1 100.0 111.2 122.4 136.0 149.4 164.7 280.5 200.8
Ownership of dwelings 79.7 85.0 95.3 100.0 119.2 122.5 130.0 142.1 155.6 174.7 196.5
Moctary Eony 76.2 82.9 90.4 100,0 111.1 123.3 134.1 147.2 153.6 166.0 282.4Agricultr 80.1 84.2 91.3 100.0 115.1 132.2 139.1 156.2 157.1 171.5 282.2Forestry ed fishing 62.3 72.7 88.6 100.0 111.0 118.7 122.9 136.0 150.5 162.1 226.0
Mining MdA quying 63.4 65.5 108.4 100.0 110.2 114.8 122.9 136.3 145.5 134.9 275.3
Manufacturing 74.8 84.0 90.1 100.0 104.9 113.6 122.2 135.6 137.6 149.8 160.6
Coesuction 69.5 83.1 .5 1200.0 122.8 127.8 149.4 156.3 280.7 233.5 301.7
Ebctricilynd rwate 70.1 77.3 14.6 100.0 143.9 161.5 170.7 167.0 164.4 158.0 162.0
Trad, resascnts&hbael 70.6 76.8 85.0 100.0 227.7 132.2 146.6 143.9 152.3 163.2 282.0
Trfspoart,sosge& comtm. 81.4 85.9 94.5 100.0 107.1 123.7 143.5 158.3 174.9 285.3 201.5
Fin. &tbusiam services 69.1 80.2 76.3 100.0 110.0 120.9 1228S 139.9 152.5 172.3 214.2Ownerip of dwellirg 78.2 U.3 99.4 100.0 102.4 116.2 121.5 133.8 147.6 167.6 178.5
Domestic service. 79.6 82.4 93.3 100.0 102.0 120.6 130.1 143.1 147.4 151.8 156.3
Oovcrnnaealrvi 75.6 82.3 91.9 100.0 103.3 110.4 123.9 143.1 148.5 156.5 174.3
Odt srvic 76.4 86.7 94.7 100.0 106.9 113.9 130.8 147.7 162.6 165.3 178.3
Les: insputed betk 69.1 80.2 76.3 100.0 110.0 120.9 126.9 241.8 152.5 201.9 218.2sevices Mt -t
AgriculForePrey&FisI 79.5 83.7 91.2 100.0 114.7 131.3 138.1 154.8 156.7 172.2 283.5Indtry 74.0 U3.4 90.2 100.0 110.1 117.5 227.7 13S.4 144.5 161.9 282.5
Masrtuetring 748 14.0 90.1 100.0 104.9 113.6 122.2 135.6 237.6 149.8 160.6
Services 75.2 82.4 90.5 200.0 109.1 119.6 132.6 143.9 154.1 163.6 179.3
Noet lliec Taes 59.5 69.8 83.3 100.0 116.7 124.8 132.6 137.3 146.2 156.0 168.2
Impote ONFS 53.2 69.1 87.1 100.0 123.1 126.9 147.3 143.0 145.3 157.9 182.2
Exports GNFS 71.3 14.9 93.7 100.0 116.2 135.3 138.1 149.7 136.9 155.7 169.7
Tolbi Resurces 66.6 75.4 87.9 100.0 113.4 121.3 135.5 143.3 153.7 164.3 182.2
Consumpian 66.3 75.0 88.5 100.0 110.8 128.6 132.0 137.1 146.6 155.7 173.9
t Public 65.8 76.8 87.7 100.0 1095 117.1 137.0 156.1 174.0 168.6 203.1
Pzivate If 66.5 74.4 88.5 100.0 111.2 119.0 128.7 132.5 140.0 152.5 166.4
Gross Investment 67.8 76.4 85.9 100.0 124.6 133.0 146.7 171.4 282.9 198.9 224.3
FixedC.pittlorFomtion 69.0 76.9 85.5 100.0 124.6 136.0 147.4 172.6 182.8 197.9 219.1
Public 71.6 80.2 87.2 100.0 120.1 135.8 146.9 169.4 17.6 194.6 213.1
Private 67.0 74.4 84.1 100.0 127.5 136.1 147.8 175.0 183.6 200.2 223.4
Grens Natml Product 74.0 81.0 89.6 I00.0. il 8 123.2 133.2 14.1 52.9 164.2 179.0
i/ Imti deflatr.
V See Telisal Net.e *oggregmion wceme.
Sour: Derived fro Stistia Appcedi Tsbla 2.1 to 2.4

Table 2.8: INCREMENTAL CAPITAL - OUTPUT RATIOS
1977 815.0 2798.1
1978 1007.4 3045.1 247.0 4.1
1979 766.2 3160.6 115.4 6.6 5.5
1980 1031.0 3337.3 176.7 5.8 6.8 7.8
1981 998.9 3463.2 125.9 7.9 9.5 9.9
1982 767.7 3515.4 52.2 14.7 12.4 10.8
1983 665.4 3561.5 46.1 14.4 13.4 10.8
1984 696.2 3624.0 62.5 11.1 10.4 9.7
1985 876.7 3779.8 155.8 5.6 6.5 7.5
1986 746.0 4051.1 271.3 2.7 4.0 5.4
1987 870.6 4291.7 240.5 3.6 3.3 4.1
1988 951.6 4550.2 258.6 3.7 4.1
1989 1/ 1014.0 4757.6 207.4 4.9
Note: Values are in millions of Kea pounds at constant 1982 prices.
1/ Provional.
Source: Staff estimates derived from Sttistical Appendix Table 2.4

Table 3.1: BALANCE OF PAYMENTS(In Millions of Kenya Pounds)
Prov.
.. 79 1980 1981 1982 1983 1984 1985 1986 1987 1988 1989
Trade (net) -154.2 -369.2 -344.3 -291.7 -181.5 -226.5 -271.8 -230.7 -587.4 -696.4 -1067.0
Exports,f.o.b. 1/ 380.3 457.5 485.3 509.9 615.8 745.1 773.8 949.4 747.6 902.8 952.7
Imports,f.o.b. 2/ 534.5 826.7 829.7 801.6 797.3 971.7 1045.6 1180.1 1335.0 1599.2 2019.6
Services (net) -66.2 -14.2 -4.6 20.5 36.4 12.9 35.0 31.4 4.2 -13.7 89.2
Receipts 242.4 315.8 336.7 403.3 405.2 458.2 536.6 597.3 682.8 769.3 1057.4
Payments 308.6 330.0 341.3 382.8 368.8 445.3 501.7 565.9 678.5 782.9 968.2
Transfers (net) 34.1 54.7 97.8 72.6 119.6 127.3 157.4 167.9 176.6 307.1 393.5
Receipts 46.5 61.9 112.4 89.6 142.9 154.3 181.2 196.2 211.7 342.1 444.3
Payments 12.4 7.2 14.6 17.0 23.3 27.0 23.8 28.3 35.1 35.1 50.8
. ~ ~ . '-~S$ 'i~s$ - ~.55 -~.3 . -9A -1 -4066 -0. -54
Capital Account (net) 253.8 252.8 148.9 62.0 69.2 125.5 -4.6 102.2 307.2 326.1 681.4
Private long-term 77.5 55.4 1.4 6.0 -3.6 6.8 3.8 25.2 37.0 -17.3 70.8
Government long-term 113.1 146.4 116.9 36.2 66.9 99.7 -20.3 3.8 162.3 256.4 389.6
Parastatals -1.1 1.3 23.0 3.8 15.4 -10.5 -25.7 56.3 61.6 39.4 166.9
Short-term 64.3 49.7 7.8 16.1 -9.5 29.6 37.6 16.9 46.3 47.6 54.2
Errors and omissions 3.1 3.7 12.0 28.5 13.7 -6.9 -10.2 2.3 -5.0 9.2 -16.7
i'S'W>o VS .........- *M0
Monetary Movements -70.6 72.2 90.2 108.1 -57.4 -32.3 94.2 -73.0 104.4 67.7 -80.5
Change in reserves -66.7 17.4 54.3 -16.6 -133.4 -43.0 -18.7 -20.0 124.6 -53.0 -114.2
Transactions with IMF -3.9 54.8 32.2 108.2 77.1 -1.6 105.2 -54.4 -51.3 109.5 20.9
Changes in other liabilities .. .. 3.8 16.5 -1.1 12.3 7.7 1.4 31.2 11.2 12.7
11 Excluding aircraft cnd ships atorma but including re-expozt3.
21 Indudes defence import and excludes cinematographic films.newspapers and periodicals and aircraft leaIss.
Source: Centl Burenu of Statistics, Economic Surver, various issues.

Table 3.2: BALANCE OF PAYMENTS(In Millions of US Dollars)
1983 19$4 1985 1986 1987 98 1989
Trade (net) -421.0 -975.6 -669.5 -458.4 -263.1 -321.0 -330.8 -284.7 -712.7 -781.8 -1032.5Exports,f.o.b. I/ 1037.9 1208.9 943.6 801.4 892.7 i055.9 941.8 1171.4 907.1 1013.6 921.9Imports,f.o.b. 2/ 1458.9 2184.5 1613.1 1259.8 1155.9 1376.9 1272.6 1456.1 1619.8 1795.4 1954.4
Services (net) -180.6 -37.5 -8.9 32.2 52.8 18.2 42.6 38.7 5.1 -15.3 86.3Receipts 661.7 834.5 654.7 633.9 587.4 649.3 653.1 737.0 828.5 863.7 1023.2Payments 842.2 872.1 663.5 601.6 534.7 631.1 610.6 698.3 823.3 879.0 936.9
Transfers (net) 93.1 144.5 190.2 114.1 173.4 180.4 191.6 207.1 214.2 344.7 380.8Receipts 126.9 163.6 218.5 140.7 207.2 218.6 220.5 242.1 256.8 384.1 430.0Payments 33.8 19.0 28.4 26.6 33.8 38.2 28.9 35.0 42.6 39.4 49.1
Caraet'Ag,tl§,t <1aoc4. % ~ > ~ 4 ~ x X g ~397. vwlfl4 ^ g6.7 -38.8 .*.-493,§ -w45.4 . 5 .4
Capital Account (net) 692.7 668.0 289.5 97.4 100.3 177.8 -5.6 126.1 372.7 366.1 659.4Private long-term 211.5 146.4 2.6 9.4 -5.2 9.6 4.6 31.1 44.9 -19.4 68.5Government long-term 308.7 386.9 227.2 56.8 97.0 141.2 -24.7 4.6 196.9 287.9 377.0Parastatals -3.0 3.4 44.6 5.9 22.3 -14.9 -31.2 69.5 74.7 44.2 161.5Short-term 175.5 131.3 15.1 25.3 -13.8 41.9 45.8 20.9 56.2 53.4 52.4
Errors and omissions 8.5 9.8 23.3 44.9 19.9 -9.8 -12.4 2.8 -6.0 10.3 -16.1
tB^tx9,~ 47=14 7 >, ' X.i4& '4i. 906.i M42.6 3 76. .9
Monetary Movements -192.7 190.8 175.4 169.8 -83.2 -45.7 114.7 -90.1 126.6 76.0 -77.9Change in reserves -182.1 46.0 105.5 -26.0 -193.3 -60.9 -22.8 -24.6 151.1 -59.5 -110.5Transactions with IMF -10.6 144.8 62.6 170.0 111.7 -2.3 128.0 -67.1 -62.3 123.0 20.2Changes in other liabilities .. .. 7.3 25.9 -1.6 17.4 9.4 1.7 37.8 12.6 12.3
Memo Item:Average Exchange Rate (Kshf$) 7.3 7.6 10.3 12.7 13.8 14.1 16.4 16.2 16.5 17.8 20.7
1/ Excluding aircraft and ships' stores but including re-exports.2V Includes defence imports and excludes cinematographic films,newspapers and periodicals and aircraft leases.
Source: Central Bureau of Statistics. Economic Survey, various issues.

Teblo 3.3: MERCHANDISE EXPORTS - VALUE AND VOLUME
1979 1980 t9l I92 2983 ' 1984 19t5 1986 t97 1988 1959
DoweAsc E xpes (in Million of Kd up Ptotlb)
Feoodndlive mieses 40.6 43.4 62.0 54.t 85.2 7t.1 67.6 93.7 110.6 135.3 135.9Maine, rmilled 5.4 0.0 0.2 0.3 12.2 5.9 1.2 14.7 19.5 21.7 15.6Pin .onid 9.3 8.9 12.0 14.5 20.9 25.9 24.4 24.2 25.8 25.1 37.1
BeoereNWd beco 174.7 262.5 171.9 223.5 2U45 395.5 421t.7 571.1 364.4 435.5 462.9Coffee, rad 110.6 102.1 109.4 144.6 160.1 203.6 230.6 312.5 194.6 244.5 203.8Tm 62.8 5S.0 61.1 77.6 123.4 289.5 191.7 172.8 163.4 1t5.3 271.9
Cnde mterial., inedible l1 39.1 45.0 40.6 49.7 48.2 49.8 56.4 59.6 66.3 89.8 114.1Siail Ar aed t 4.8 8.8 8.8 10.8 12.1 12.6 14.4 10.9 9.9 11.9 16.3
Mineral feeh 77.3 162.7 164.1 149.3 134.5 142.6 127.4 107.8 101.8 119.8 114.5Aniaml & ves. db & fib 0.5 0.6 0.6 0.3 0.9 2.6 1.3 0.6 O.J 1.0 2.3
O tmial 17.8 22.8 33.1 19.6 27.5 32.5 39.8 43.9 42.8 45.0 36.1Mmonfuna goo s2/ 33.1 41.3 31.3 46.1 47.7 50.1 60.1 64.0 59.2 23.1 101.7
CAemen 8.6 10.2 14.4 19.8 21.2 18.7 16.3 13.4 10.4 10.4 10.9Mc. & vramp. quipm 2.2 3.0 3.1 2.1 2.5 3.2 3.5 6.4 7.0 7.9 9.3Odmer.spml 0.3 0.4 0.2 0.1 0.1 0.6 0.3 10.9 06 0.2 3.0
Totl Dmeetc Esou 385.5 487.6 513.9 545.7 633.1 754.t 785.1 958.0 753.4 917.7 999.8Non-oil Expoeb 3508.2 324.9 349.t 396.5 49t.6 612.2 657 8. 50.1 651.6 797.9 885.4
Honeehr 9.7 11.4 12.6 13.6 17.5 54.2 53.0 66.1 77.1 94.8 79.3
Re--pos 27.3 28.2 23.4 22.9 19.1 22.1 26.3 28.9 36.5 34.2 19.9Food *.7 6.3 6.2 6.3 4.2 11.7 13.8 15.3 16.3 16.4 0.6Mah. &mnp. qipme 6.7 11.7 7.6 9.7 8.3 6.t 7.4 8.0 13.0 10.4 b.6
Y7, 7 1'--, 952.9 202 9.7
Expwb (ia Milim of US Dota)
Maim, onmilled 14.J 0.0 0.1 0.5 17.6 t.4 1.5 t1.1 23.6 24.3 25.2Oher fooed41 97.6 126.2 121.5 86.2 107.2 105.9 82.4 9.2 111.5 128.7 118.7Coffee 301.8 285.7 212.7 227.2 232.1 288.5 280.7 479.3 236.2 274.6 197.2Tea 171.5 153.3 128.8 122.0 178.9 268.5 233.3 213.2 191.2 208.0 263.1O lh n beoe d ebaeo 3.4 .2 2.7 2.6 4.3 3.3 7.t 12.1 7.8 6.4 7.0Pd etreeanWde areer8 211.0 430.0 319.1 234.6 194.9 202.0 155.1 133.1 123.6 134.5 110.8H lol2tre 26.6 30.0 24.5 21.4 25.4 76.2 64.5 tl.6 93.6 106.4 76.7C ttmcal 48.6 60.2 64.3 30.8 39.9 46.0 48.5 54.1 52.0 50.6 34.9Mao.. d samla 90.3 109.2 74.6 72.5 69.1 71.0 Z3.1 79.0 71.8 93.3 98.4Ohe memlhdie pods 51 161.2 172.0 106.3 96.1 7S.9 30.3 40.8 49.0 40.3 41.9 64.8
Taal,-^z 5l;lg.v;7w.w eiffi id6.71 flU
Voderne of Selesed Eqte (In Meti Tons, nlm elLrwe sacifmd
Coffee 77,259 20,06 86.171 IOD,9. 90,457 961924 104.679 126,498 99,977 90,131 9t.042iTc 94,023 74,789 75.350 80.413 99,938 91,198 126,303 116.456 134,627 13t,021 163,279hPeramprd..&ot.enertl6t 1,174 2,t25 1.411 2,080 765 795 732 34 684 828 646Siaal 25.959 759 36,397 40,445 38,942 39,120 40,024 31,696 27,913 30,937 32,856Cemenl 510,t26 530,393 668,037 737,422 736,318 602.993 485,839 495.623 353,249 346,640 311.884Maize. nmilld 120,475 20 991 949 122,514 47,434 17,683 227,951 247,6t8 167,237 110,241H4simcltere 21,300 22t300 23,300 24,600 28,900 103,700 4,500 110,400 136.900 151,508 132.808
Of Esddeg fmd.
V Eddit c . -d _4 _ feon.3Y letdia eleft aad *lpr m4/ teiag .Wal sd eozst ead ant ru5v Wr&gr..npm.61 t-alie*rbh
smm: C60ad a.efd3tink., _&l Ab_Rnaad Eknenia Swq, o Waam.

Table 3.4:
~t 19 C.' i98,Z 1983 1984 1985 3986 $87 1988 989
(In Millions of Kenya Pounds) 0
European Econooic Community 177.6 175.1 177.9 197.2 254.8 348.3 346.2 440.5 334.7 453.3 447.4 btUnited Kingdom 5.8 53.9 59.8 72.3 96.3 142.3 135.6 143.1 133.1 186.9 19S.7 1l
Other Western Europe 21.7 23.6 13.9 21.5 24.9 33.7 35.5 50.5 25.2 43.6 42.0
Eastent Europe 4.8 4.9 7.0 8.1 5.5 6.8 13.7 10.7 8.9 6.0 20.1
USA 16.7 16.9 19.5 35.2 39.1 38.3 54.1 85.8 42.6 46.2 49.4
C4nada 5.7 5.1 4.0 4.7 5.1 5.9 5.4 9.2 6.3 8.6 10.0
Africn Countries 99.0 141.0 157.3 160.1 195.7 202.8 206.9 211.4 219.7 243.9 227.1Uganda 37.7 66.4 52.6 58.5 71.5 67.6 70.1 72.6 69.7 83.7 65.9Tanzania 4.1 5.2 6.3 6.8 6.3 9.7 19.2 27.3 19.6 24.3 27.5Burundi 4.6 7.3 12.9 13.3 14.7 14.9 8.8 3.9 11.8 - -Sudan 7.7 9.9 12.4 18.9 24.6 21.0 30.1 21.5 22.2 - -Rwanda 8.6 12.6 21.6 21.9 24.8 26.6 25.3 25.2 23.8 - -Other I/ 36.4 39.5 51.5 40.7 53.9 62.9 53.5 55.9 72.7 135.9 133.7
Middle East 14.8 19.4 25.4 28.1 19.8 25.1 26.4 42.3 30.2 23.6 29.3
Far East and Australia 31.5 68.0 72.3 53.9 65.3 80.1 84.6 98.2 79.8 76.9 126.7Japan 5.1 3.8 3.7 3.5 4.6 6.1 6.2 8.6 7.0 13.7 12.2
All other countries 8.5 3.5 3.0 1.1 5.6 3.6 0.9 0.9 0.2 0.7 0.7
Sub total 380.3 457.5 485.3 509.9 615.8 745.1 773.8 949.4 747.6 902.8 952.7
Aircraft and ships stores 32.5 58.2 51.9 58.8 36.4 31.8 37.6 37.5 42.3 49.0 67.1
NW . 7"W7ziE W3T44i17V0J5rTh.IDomestic 385.5 487.6 513.9 545.7 633.1 754.8 785.1 958.0 753.4 917.7 999.3Reexports 27.3 28.1 23.4 22.9 19.1 22.1 26.3 28.9 36.5 34.2 19.9
(In Millions of US Dollars)Memo Items:
& 1 } F X ; W V !, P ;9 5ei.94 Kji .1 Domestic 1052.3 1288.6 999.1 857.8 917.8 1069.6 955.6 1182.0 914.2 1030.3 967.6Re-exports 74.4 74.1 45.4 36.0 27.7 31.3 32.0 35.6 44.2 38.4 19.3
It Data for 1988 and 1989 includes Burundi,Sudan and Rwands.
Source: Central Bureau of Statistics, Economic Survey, various issues.

Table 3.5: EXPORTS BY STANDARD INTERNATIONAL TRADE CLASSIFICATION - QUANTUM,PRICE AND VALUE INDICES(1982 2100)
:09 1980 1981 jOlt :983 to8 1985 1986 1987 188 18' -> > 40 ~~~ ~~logo iti. 13 97 1989 1989
Q-u IndicesFood nd live animals 37.8 80.0 89.0 100.0 105.0 102.0 114.0 126.0 125.0 120.0 133.0Bevra ges ad toacco 54.7 135.0 31.0 100.0 155.0 105.0 231.0 340.0 235.0 180.0 186.0Crude mtterials(inedible) I/ 120.8 117.0 116.0 100.0 101.0 110.0 116.0 119.0 121.0 153.0 113.0Mineral fuels 145.5 185.0 140.0 100.0 85.0 84.0 69.0 89.0 78.0 96.0 76.0Animal &veg. oils& fats 200.0 178.0 211.0 100.0 156.0 460.0 201.0 82.0 116.0 150.0 250.0Chemicals 144.2 127.0 125.0 100.0 92.0 94.0 106.0 95.0 99.0 88.0 108.0Manufactured goods 2V 89.2 111.0 89.0 100.0 83.0 78.0 77.0 99.0 98.0 130.0 133.0Mach. & transp. equipment 93.2 154.0 102.0 100.0 51.0 38.0 44.0 38.0 84.0 53.0 59.0Misc. manufactured articles 94.2 120.0 108.0 100.0 76.0 82.0 104.0 144.0 107.0 122.0 130.0
Non-oil Exports 94.2 92.0 94.0 100.0 100.0 98.0 108.0 121.0 119.0 121.0 127.0Coffee 76.5 79.3 85.3 100.0 89.6 96.0 103.6 225.3 99.0 89.9 97.1Tea 116.9 93.0 93.7 100.0 124.3 113.4 157.1 144.8 167.4 171.6 203.1
Price IndicesFood and live animals 90.0 95.0 95.0 100.0 126.0 167.0 155.0 188.0 137.0 171.0 162.0Beverages and tobacco 90.8 90.0 98.0 100.0 108.0 132.0 146.0 148.0 146.0 185.0 209.0Crude materials(inedible) 1/ 63.2 88.0 96.0 100.0 107.0 107.0 117.0 121.0 128.0 138.0 198.0Mineral fuels ,8.1 58.0 81.0 100.0 107.0 112.0 114.0 81.0 88.0 84.0 104.0Animal & veg. oils & hts 61.1 67.0 80.0 100.0 115.0 127.0 142.0 159.0 139.0 137.0 205.0Chemicals 69.4 72.0 76.0 100.0 120.0 125.0 134.0 167.0 162.0 161.0 178.0Manufactured goods 2/ 81.4 80.0 91.0 100.0 123.0 128.0 154.0 115.0 117.0 129.0 154.0Mach. & transp. equipment 79.6 80.0 87.0 100.0 179.0 223.0 208.0 322.0 202.0 293.0 314.0Misc. nanufactured articles 80.7 96.0 76.0 100.0 125.0 170.0 169.0 174.0 177.0 184.0 200.0
Non-oil Exports 83.2 91.0 93.0 100.0 124.0 154.0 151.0 174.0 138.0 165.0 171.0Coffee 100.0 94.3 88.7 100.0 123.6 146.8 153.9 214.5 135.9 188.2 145.3Tea 69.3 80.4 84.0 100.0 128.0 215.3 157.3 153.7 125.8 138.9 172.5
Value Indices4 _ r X .!. Tiii6LC7 . MJ ' $
Non-oil Exports 77.7 82.0 88.2 100.0 125.8 154.4 165.9 214.4 164.3 201.3 223.3Coffee 76.5 74.8 75.7 100.0 110.7 140.9 159.5 268.7 134.6 169.2 141.0Tea 81.0 74.8 78.7 100.0 159.1 244 2 247.0 222.7 210.5 238.8 350.4
U Exdcding fuds.2/ Exduding das and ped food.
Source: Ceal Bureu of St5ltica, Eomic Sivey, varioua isuca.

Table 3.6: MERCHANDISE IMPORTS - VALUE
(In Millions of Kenya Pounds)
Food and live animals 14.1 47.5 30.2 40.3 38.2 95.9 65.1 74.7 57.1 41.4 74.0Bveragws and tobacco 7.8 3.8 2.7 2.8 2.1 1.9 2.9 2.8 4.1 4.8 5.4Crude materials (inedible) tl 12.5 15.4 18.9 17.2 26.3 29.9 31.2 32.0 39.4 50.2 59.2Mineral fuels 147.9 325.1 348.0 334.5 333.5 335.8 379.1 243.4 287.1 258.2 355.4Animal & veg. oils & fats 15.8 22.6 24.2 26.2 45.9 35.7 47.8 46.5 41.6 63.5 71.2Chemicals 72.2 101.8 103.0 97.6 126.6 133.1 187.2 220.2 255.4 315.5 353.5Manufactured goods 21 101.0 130.0 105.0 105.2 103.8 133.8 150.8 168.6 202.3 284.8 351.5Machinery &transp. equipment 211.8 269.3 251.3 243.3 204.4 294.2 293.3 502.7 491.1 678.7 879.9Misc. manufactured articles 34.4 43.4 47.6 32.2 24.7 35.6 37.6 46.3 52.3 66.8 83.5Other misc. imports 2.5 0.0 1.5 1.0 0.0 1.3 1.2 0.7 0.4 1.3 5.3
Non-oil Imports 472.2 633.9 584.4 565.8 572.1 761.4 816.9 1094.5 1143.7 1507.0 1883.6
(in Millions of US Dollars)
Food,bev. and tobacco 3/ 103.1 195.3 110.9 109.0 125.0 189.2 140.9 152.9 124.7 123.2 145.7Petroleum and other energy 403.7 859.2 676.6 525.8 483.5 475.9 461.4 300.4 348.4 289.8 343.9Manufactured goods 21 369.5 458.2 296.8 215.9 186.3 240.0 229.3 265.2 309.0 394.7 421.0Other misc. imports 6.8 0.1 2.9 1.6 0.0 1.8 1.4 0.8 0.5 1.4 5.1Intermediate goods 231.3 309.7 237.1 180.4 221.8 231.0 265.7 311.2 357.7 410.6 399.4
Primary 34.2 40.7 36.8 27.0 38.2 42.4 37.9 39.5 47.8 56.4 57.3Manufactured 41 197.1 269.0 200.3 153.4 183.6 188.6 227.8 271.7 309.9 354.3 342.1
Capital goods 578.2 711.7 488.6 382.3 296.3 416.9 357.0 620.3 595.9 762.0 851.5ThtiI 'X 1~ '- -- -* 1694.S 2534.3, 1813.& it5. 131 1554.8 1455.7- : 736.2 981.R 2166.6Total (incl. Leases) 1692.5 2534.3 1813.0 1415.0 1312.9 1554.8 1455.7 1650.8 1736.2 2088.7 2208.0
If Exduding fuds.
2V Excluding chemieds and procssed food.
31 Including animal and vegble oils nd fats.
41 Chemicals.
Source: Central Bureau of Statistics, Statisical Abtract, various issues and staff estimates.
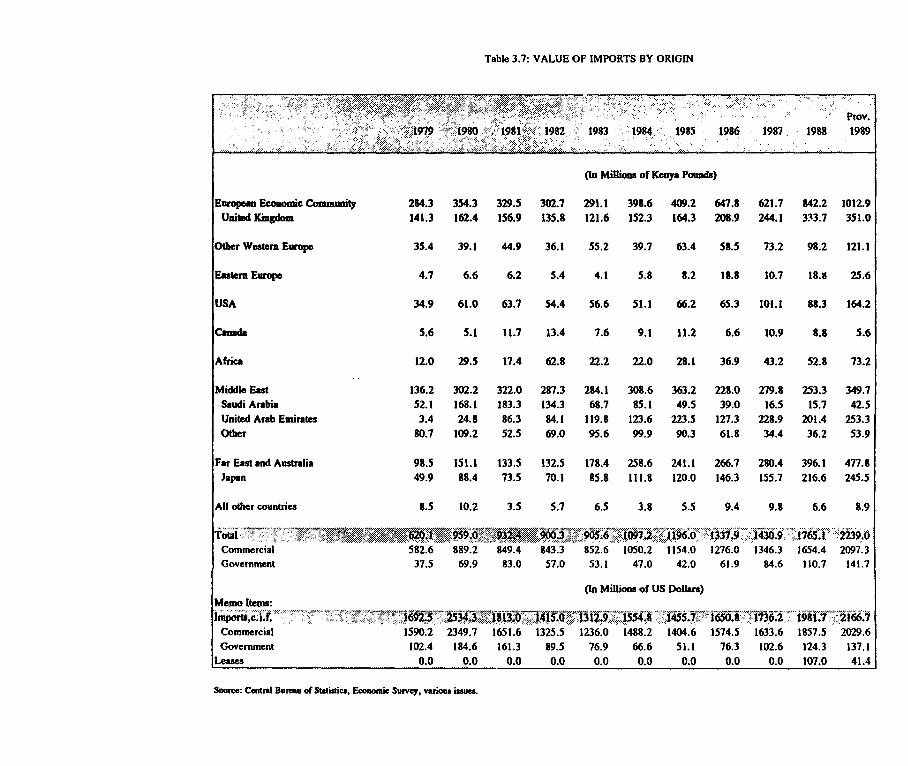
Table 3.7: VALUE OF IMPORTS BY ORIGIN
Prov.
" " 1 980;sv " - ' " "S 1979 ""1982 1983 1984. 1985 1986 1987. 1988 1989
(In Millions of Kenya Pounds)
European Economic Community 254.3 354.3 329.5 302.7 291.1 398.6 409.2 647.8 621.7 842.2 1012.9
United Kingdom 141.3 162.4 156.9 135.8 121.6 152.3 164.3 208.9 244.1 333.7 351.0
Other Western Europe 35.4 39.1 44.9 36.1 55.2 39.7 63.4 5S.5 73.2 98.2 121.1
Eatern Europe 4.7 6.6 6.2 5.4 4.1 5.8 8.2 18.8 10.7 18.X 25.6
USA 34.9 61.0 63.7 54.4 56.6 51.1 66.2 65.3 101.1 88.3 164.2
Canada 5.6 5.1 11.7 13.4 7.6 9.1 11.2 6.6 10.9 8.8 5.6
Africa 12.0 29.5 17.4 62.8 22.2 22.0 28.1 36.9 43.2 52.8 73.2
Middle East 136.2 302.2 322.0 287.3 284.1 308.6 363.2 228.0 279.8 253.3 349.7
Saudi Arabia 52.1 168.1 183.3 134.3 68.7 85.1 49.5 39.0 16.5 15.7 42.5
United Arab Emirates 3.4 24.8 86.3 84.1 119.8 123.6 223.5 127.3 228.9 201.4 253.3
Other 80.7 109.2 52.5 69.0 95.6 99.9 90.3 61.8 34.4 36.2 53.9
Far East and Australia 98.5 151.1 133.5 132.5 178.4 258.6 241.1 266.7 280.4 396.1 477.8
Japan 49.9 88.4 73.5 70.1 85.8 111.8 120.0 146.3 155.7 216.6 245.5
All other countries 8.5 10.2 3.5 5.7 6.5 3.8 5.5 9.4 9.8 6.6 8.9
~rttai * SE,RtS >', ; gg l 5w t Y 13i 9 6 530 A765.1
Commercial 582.6 889.2 849.4 843.3 SS2.6 1050.2 1154.0 1276.0 1346.3 1654.4 2097.3
Government 37.5 69.9 83.0 57.0 53.1 47.0 42.0 61.9 84.6 110.7 141.7
(In Millions of US Dollars)
Memo Items:,. . m1c.fi.js <.t.;.:1s: ' 't ' '§a 4-1' ' 'T57h o'.2. '1 9817 ~i6Commercial 1590.2 2349.7 1651.6 1325.5 1236.0 1488.2 1404.6 1574.5 1633.6 1857.5 2029.6
Government 102.4 184.6 161.3 89.5 76.9 66.6 51.1 76.3 102.6 124.3 137.1
Leases 0.0 0.0 0.0 0.0 0.0 0.0 0.0 0.0 0.0 107.0 41.4
Source: Centrl Bureau of Swistica, Ecnmomic Survey, various isse.

Table 3.8: IMPORTS BY STANDARD INTERNATIONAL TRADE CLASSIFICATION - QUANTUM,PRICE AND VALUE INDICES(1982= 100)
iAa tAbA 19M 1985 1986 19c7 los 1999
Qwuntum IndicesFood and live animals 77.7 122.0 63.0 100.0 85.0 206.0 158.0 115.0 -.0 69.0 107.0Beverages and tobacco 465.2 191.0 117.0 100.0 72.0 46.0 53.0 45.0 54.0 63.0 59.0Crude materials(inedible) 1/ 100.0 97.0 123.0 100.0 138.0 134.0 107.0 129.0 158.0 178.0 157.0Mineral fuels 111.3 130.0 107.0 100.0 92.0 90.0 91.0 94.0 100.0 98.0 101.0Animal & veg. oils & fats 45.7 68.0 83.0 100.0 72.0 63.0 86.0 112.0 117.0 165.0 141.0Chemicals 127.4 135.0 119.0 100.0 85.0 87.0 74.0 100.0 122.0 126.0 118.0Manufactured goods 2V 177.4 190.0 119.0 100.0 72.0 91.0 82.0 97.0 105.0 125.0 127.0Machinery & transp.equipment 134.0 160.0 124.0 100.0 60.0 84.0 77.0 104.0 102.0 134.0 152.0Misc. manufactured articles 198.2 216.0 171.0 100.0 73.0 103.0 83.0 105.0 107.0 107.0 128.0
.,.- -1s>iQ.; 9.f' 86.0 II.0 106.0 119.0 125.0Non-oil Imports 132.6 153.0 117.0 100.0 72.0 94.0 83.0 103.0 109.0 128.0 135.0
Price IndicesFood and live animals 49.4 97.0 120.0 100.0 111.0 116.0 102.0 161.0 126.0 150.0 171.0Beverages and tobacco 60.4 72.0 81.0 100.0 104.0 141.0 190.0 218.0 262.0 269.0 322.0Crude materials(inedible) I/ 73.2 94.0 88.0 100.0 111.0 130 0 169.0 155.0 145.0 164.0 220.0Mineral fuels 34.6 59.0 85.0 100.0 108.0 112.0 127.0 77.0 86.0 79.0 106.0Animal & veg. oils & fats 132.1 125.0 109.0 100.0 245.0 216.0 213.0 159.0 136.0 147.0 192.0Chemicals 57.6 77.0 89.0 100.0 153.0 156.0 258.0 227.0 214.0 256.0 308.0Nianufactured goods 2V 54.3 65.0 83.0 100.0 137.0 140.0 175.0 165.0 184.0 216.0 262.0Machinery & transp.equipment 65.2 71.0 84.0 100.0 139.0 145.0 156.0 198.0 198.0 208.0 239.0Misc. manufactured articles 52.8 64.0 86.0 100.0 105.0 108.0 141.0 137.0 152.0 193.0 202.0
~otaP' mi - . :6~- .,. ,5> 7& 87#.0 20 .o .0za 131.0 155.0 147.0 149.0 164.0 198.0Non-oil Imports 62.9 75.0 89.0 100.0 140.0 143.0 173.0 187.0 185.0 209.0 246.0
Value IndicesTotal Imports 68,9 106.5 103.6 100.0 100.6 121.9 132.8 148.6 158.9 196.1 248.7
Non-oil Imports 83.5 112.0 103.3 100.0 101.1 134.6 144.4 193.4 202.1 266.3 332.9
1/ Excluding fuels.
2/ Excluding chemicals and processed food.
Source: Central Bureau of Statistics, Economic Survey, various issues.

Table 3.9: EXTERNAL TERMS OF TRADE INDICES(1982= 100)
......... . 7 . .2
Merchandise GondsExport price index 68.8 83.0 91.0 100.0 120.0 144.0 142.0 152.0 126.0 145.0 156.0Import price index 52.0 68.0 87.0 100.0 128.0 131.0 155.0 147.0 149.0 164.0 198.0External terms of trade 132.4 122.1 104.6 100.0 93.8 109.9 91.6 103.4 84.6 88.4 78.8
Non-oil ItemsExport price index 83.2 91.0 93.0 100.0 124.0 154.0 151.0 174.0 138.0 165.0 171.0Import price index 62.9 75.0 89.0 100.0 140.0 143.0 173.0 187.0 185.0 209.0 246.0External terms of trade 132.4 121.3 104.5 100.0 88.6 107.7 87.3 93.0 74.6 78.9 69.5
Source: Centrl Bureau of Statistics, Economic Survey, various issues.

Tabe 3.10 SERVICES TRANSACTIONS AND TRANSFERS
'*..' t,--4,.,t9.5',C19*'19 2980. I<*n It9* 1915 2914 9195 9196 1967 2958 1919prov.~ ~ ~ ~ ~ ~ ~~~.
(in Millions of KC" 1ab)
Nmhot Swv Repi 219J0 295J4 311.6 367.7 3S0D.5 425.4 501.0 567.3 652.0 762.1 1045.1FreigAi and I _ 39.3 2S.6 19.3 29.1 36.5 39.5 33.9 30.0 31.4 40.7 52.1Other eamprttai 51.5 128.5 105.3 116.3 99.8 106.8 125.1 131.7 151.1 170.1 217.5Fomelpntrel 6S.1 I SS.5 96.2 122.9 130.0 1SI.7 204.4 24S.0 292. 349.3 432.1 Other 33.9 52.9 90.S 99.5 114.2 127.4 137.7 157.6 177.5 202.0 343.2
Fct orSes-fRIetlf 22.6 2D.0 25.1 35.6 24.7 32.8 35.6 30.0 30.3 7.2 12.3inveatm. maccm 19.0 16.1 16.9 20.0 24.6 32.7 35.5 29.3 30.6 7.0 12.1Olt. 3.6 3.9 8.2 15.6 0.2 0.2 0.2 02 0.2 0.2 0.2
Not serice Paye202.1 226.0 219.1 207.9 216.9 260.4 252.1 326.3 399.1 455.1 59SFI' lglmmdms -ce 97.7 137.7 228.7 125.0 96.0 152.6 169.5 139.2 213.7 256.0 329.4Oher trmnspoelation 18.7 23.3 23.3 24.9 30.1 32.9 33.2 39.5 37.3 47.7 75.7Foreign tvel 1.3 3.6 9.1 7.4 8.3 10.2 12.4 13.2 20.0 20.4 27.6Other U4.4 62.4 57.6 50.6 12.6 65.7 67.7 79.4 127.6 131.0 160.2
Factor Sela Paym 11 106.5 104.0 122.2 174.9 151.9 115.0 218.9 239.6 279.4 327.3 375.4lehnent i 91.0 91.6 106.4 109.7 139.9 171.3 204.2 222.9 259.9 304.6 347.8Oter 25.5 12.4 25.5 65.3 12.0 13.2 14.7 16.8 19.5 23.2 27.6
Sevices (nd) -66. -14.2 -4.6 20.5 36.4 12.9 35.0 31.4 4.2 -13.7 89.2NonfActor 17.7 69.8 92.5 159.9 163.6 165.0 21S.2 241.0 252.9 307.0 452.3Factor -33.9 -34.0 -97.1 -139.4 -127.2 -152.2 -1S3.2 -209.6 -243 6 -320.6 -363 1
;iCew&R LSPIS4 ,1543 S ,, .2 -2il. 32.1 44.3Stnvab 13.9 16.3 56.9 60.0 62.5 65.7 37.5 72.3 M 7 113.1 149.9Govenmen 32.6 45.6 55.5 29.6 60.4 5U.6 93.7 123.9 121.0 229.0 294.4
Tbii*fcr.t,, i:7gJ.3 i io .. bi.to 2 i-3' 33S. US0tPrivate 9.9 6.2 12.3 14.5 20.3 22.4 20.6 25.1 31.4 34.1 45.5Govermnent 2.5 1.0 2.3 2.5 3.0 4.6 3.2 3.3 3.7 1.0 5.3
Tnrmsfe(n(at) 34.1 54.7 97.8 72.6 119.6 127.3 157.4 167.9 176.6 307.1 393.5Private 4.0 10.1 44.6 45.5 42.2 43.3 67.0 47.2 59.3 79.0 104.4Governmnt 30.1 44.6 53.2 27.1 77.4 34.0 90.5 120.7 117.3 228.1 2MS.1
(In Millions of US Dollars)Mermo Ibm:Services (net) -230.6 -37.5 -8.9 32.2 52.8 28.2 42.6 38.7 5 1 -15.3 S6.3
Nonfactor 48.4 284.5 179.9 251.3 217.2 233.8 265.6 297.4 306 8 344.6 437 7Fsclor -.29.0 -222.0 -2551.8 -219.0 -134.4 -215.6 -223.0 -258.6 -301.7 -360.0 -351.3
Tnsferr (net) 93.1 144.5 190.2 114.1 173.4 150.4 191.6 207.1 214.2 344.7 3509Private 10.9 26.7 36.7 71.5 61.2 61.4 31.5 55.2 71.9 85.7 101.2Government 82.2 117.9 103.4 42.6 112.2 119.0 110.1 143.9 142.3 2560 2795
11 M.sly i i inome .im tida M. ea,.r_
Soe. Colal Bmas of SWiiecs, Enk Same. r,n;. hn. CA)

Table 3.11: FOREIGN EXCHANGE RESERVES AT YEAR'S END
SLE~~~~~~~~~~~~~~~~~~
(In Millions of Kenya Pounds)
Cefta1 Bank 237.6 186.1 124.8 144.9 273.2 313.5 328.9 343.0 219.6 259.1 335.3
Central Govenment 0.5 1.1 0.6 0.1 0.2 0.3 0.6 0.6 2.5 3.7 12.2
Reser Tranche- IMP -- -- 0.1 1.1 6.9 8.3 10.9 12.0 12.8 15.3 17.5
Commercial Banks 25.8 27.8 35.3 31.4 30.5 31.6 32.0 36.9 32.9 42.9 70.1
Gross Reserves 263.9 215.0 160.8 177.4 310.7 353.7 372.3 392.4 267.8 320.9 435.0
Change in Reserves 1/ -109.5 48.9 54.2 -16.6 -133.4 -43.0 -18.6 -20.1 124.6 -53.1 -114.1
LiabilitiesUse of IMF Credit 53.1 79.3 110.1 218.3 295.3 294.1 400.1 345.7 291.7 401.2 422.1
SDR AllocationtValuation 11.0 14.5 22.1 26.0 26.7 27.4 33.0 36.2 38.9 46.1 52.9
Other External Banks 4.9 2.2 2.3 9.0 3.8 6.1 8.1 4.3 4.7 4.2 4.0
Commercial Banks 26.7 26.0 22.0 28.1 31.3 40.7 40.7 42.7 73.4 77.9 84.1
Total Liabilities 95.7 121.9 156.5 281.3 357.1 368.1 481.9 428.8 408.7 529.4 563.0
Change in Net For. Assets 1/ -69.5 75.2 88.8 108.2 -57.5 -31.9 95.2 -73.1 104.4 67.6 -80.4
Memo Items: 2J
Reserves/lmp. GNFS (months) 4.3 2.5 1.8 2.1 3.7 3.4 3.4 3.1 1.9 1.9 2.0
Gross Reserves 720.3 568.0 312.7 278.7 450.4 448.3 457.3 489.1 324.3 345.0 402.7
Change in Reserves -298.9 129.4 105.3 -26.0 -193.3 -54.5 -22.8 -25.0 150.9 -57.1 -105.6
Total Liabilities 261.1 322.1 304.3 442.0 517.6 466.5 591.8 534.6 494.9 569.2 521.3
Net Position 459.2 245.9 8.4 -163.3 -67.2 -18.2 -134.5 -45.4 -170.6 -224.2 -118.6
Change in Net For. Assets -189.7 198.7 172.6 170.1 -83.4 -40.5 116.9 -91.1 126.5 72.7 -74.5
It/ Minus (-) denotes an accumulaion.
2/ In miion of US doLkrs unles otherwise specired (end year exchange rates are usd).
Souce: Cenal Bank of Kenya, Resarch Depatment; and Central Burau of Statiics.

Statistical Appendix 125
TAbW ..1: EXTBCNAL LONO-TERM PUBLIC DMBT OUTSTANDINGINCLUDING UNDISBURSED
(As of Decomber 31, 1929; In MIIIom of US Doluc)
Su_licrn Ctd 176.0 46.2 222.2Belgium 24.0 29.9 53.9Canads 9.6 - 9.6Inril 0.5 - 0.5Italy 3.2 1.4 4.6Switzerls 4.4 - 4.4
United Kingdom 133.8 14.9 141.7United Stems 0.5 - 0.5
Financial IntiOali 134.8 125.0 259.3Belgium - 2.1 2.3Cana 17.4 - 17.4Frmno 20.1 59.1 79.1Multiple lenders 63.1 10.3 74.1Nethertands - 1.6 3.6United KIindom 33.5 44.3 77.S
Mullibanrel Lcan 2171.2 309.2 2930.4African Dev. Bank 11.S 92.4 211.2African DeG. Fund 61.8 106.3 168.1BADEAIABEDA 15.6 6.5 22.1EEC 26.4 25.7 52.2Euopnn Dev. Ftnd 42.6 - 42.6European lnvesL Bank 70.3 57.2 12.0IBRD U39.0 15.2 904.2IDA t93.1 470.0 1363.1IFC 5.0 - 5.0
IFAD 21.0 20.6 41.6OPEC Speciml Fund 24.5 15.3 39.tSAFA (Sp. Ar Fund Af.) 2.4 - 2.4
Bilaterel La 1139.1 531.3 1727.4Ausri, 16.1 2.4 13.5Belgium 2.2 - 2.2Canad 44.6 33.9 73.5Chin 17.2 11.4 28.6Denmark 60.9 10.0 71.0Finland 4.9 - 4.9France 9.2 0.2 91.4Gemany, Fed. Rep. 63.6 U8.4 157.0India 2.5 0.7 3.1italy 40.4 157.3 19".1Iapan 235.9 91.1 327.0Nmehends 134.4 34.6 169.0Saudi Arabia 62.9 56.6 119.6Sweden 45.4 - 45.4Switzeld 6.5 - 6.5Ugad 33.6 - 33.6United Kingdom 64.7 12,7 77.4United Stale 239.3 35.6 27t.4Yugoslvia 10.3 - 10.3
Expert Crdt 3303 7J ' J37.1Ausri 14.1 - 14.1Frane 242.5 7.5 25.0Swiftedas 57.6 - 57.6Uniutd Kingdom 15.7 - 15.7V snitwS 0.2 - 0.2
__
NM Dom sxda aW.
Smm tRDX - -

Table 4.2: EXTERNAL PUBLIC DEBT DOD AND COMMITMENTS BY CREDITOR TYPE FOR 1979-89
(In Millions of US Dollars)
Cttitor Type 199 18 18 92 93 184 1985 1986 1987 1968 1989
_ _ _ ~~t3. : ~............... Z31.1 243 - ~i.8 46.5210 357.......... 428.1 48.9 4,0.3
Debt84 ,g g, gbi . ..........: 4.' 1isz9* 7a^ * 7.A,'i6k'8.9 3
Suppliers' credits 200.6 193.8 144.6 104.0 70.8 58.5 79.5 109.6 168.7 166.7 176.0
Financial institutions 165.4 329.4 379.5 337.4 271.8 199.3 124.1 151.6 131.2 114.5 134.8
Bonds 9.4 10.1 8.1 - - - - - - - -
Multilateral loaSD 514.9 649.6 722.2 898.1 1002.6 1104.9 1350.4 1638.4 1996.0 1953.4 2171.2
IBRD 273.7 308.3 351.4 423.6 506.4 582.9 750.9 931.2 1128.3 973.0 889.0
IDA 148.9 220.0 234.1 318.7 333.9 363.1 408.5 450.9 553.1 672.7 893.1
Other 92.3 121.3 136.7 155.8 162.3 158.8 191.0 256.3 314.6 307.7 389.1
Bilateral loans 603.9 656.3 739.8 792.7 833.2 970.8 1108.7 1333.0 1566.0 1501.3 1189.1
Export credits 338.6 358.7 316.8 291.5 ?41.4 133.9 137.8 304.7 419.0 348.0 330.3
Suppliers' credits 61.2 10.0 5.9 - - 98.9 - 43.9 24.7 52.6 11.9
Financial institutions 296.2 - 115.0 - - 2.7 64.9 - 32.2 66.6 86.0
Bonds - - - - - - - - - - -
Multilateral loans 191.2 236.8 180.0 286.5 170.0 211.1 31.3 142.4 174.4 203.3 543.6
IBRD 110.0 70.0 83.0 131.1 19.0 145.0 - 32.6 - - -
IDA 27.0 122.0 46.7 113.1 56.7 62.4 6.3 54.3 127.7 141.5 392.5
Otber 54.2 44.8 50.3 42.3 94.3 3.6 25.0 55.4 46.7 61.7 151.1
Bilateral loans 165.8 283.2 98.5 253.4 106.3 376.8 121.5 57.2 154.3 165.7 74.8
Export credits 12.4 - 41.6 43.3 12.6 65.6 34.6 146.6 - -
Memo Item:Averag terms an now commitenets:
Interest rate (%) 7.4 3.5 8.7 5.5 5.2 6.4 6.4 5.0 2.3 3.7 2.7
Concessional 0.6 1.4 1.6 1.5 1.8 2.0 3.1 1.1 1.4 1.5 0.9
Non-concessional 7.3 8.1 9.0 10.2 10.1 8.7 10.0 8.8 - 8.0 7.7
Private fncing 10.7 7.8 14.5 8.9 9.0 8.4 9.9 6.4 7.5 7.9 8.2
Maturity (years) 20.0 31.3 21.6 30.2 31.3 20.7 22.2 21.8 33.2 22.4 31.2
Grace periodl (years) 4.4 7.9 5.3 6.9 7.0 4.5 6.5 5.4 9.2 6.9 7.8
Grant element (%) 22.8 53.2 16.8 37.7 40.8 23.8 30.2 35.5 63.8 48.2 60.3
Note: Dat esdudes IMF.
Souoce: MRD,Dditor Reporing Sysem.

Table 4.3: EXTERNAL PUBLIC DEBT DISBURSEMENTS AND SERVICE PAYMENTS BY CREDITOR TYPE FOR 1979-S9(In Millions of US Dollars)
>, ,w, , j>, . ~ ~~~~~~~~~~~~~~~~~~~~~~~~~~~ ....
UN 'm~~~~~~~~~~~~~~~~~~~~~~~~~~~~~~~~~~~~~~~~~~~U'n,~~~~~~~~~~~~~~~~~~~~~~~~~~~~~~U
Suppliers' credits 39.1 25.4 5.8 - 2.3 17.2 32.5 40.0 49.0 24.0 37.2Financial instatuhbns 139.5 183.2 112.0 23.2 0.3 1.0 6.2 65.6 4.1 20.6 46.5
Multilabal loans 87.7 158.3 106.5 205.6 151.4 184.4 136.2 135.0 153.4 136.9 334.8IBRD 39.3 45.2 61.5 37.8 100.0 129.6 77.5 51.0 39.5 25.3 17.6IDA 21.5 71.6 14.8 85.4 19.3 35.6 35.0 29.8 73.3 135.5 226.9Otber 26.4 41.5 30.2 32.4 31.6 19.1 23.7 54.2 40.7 26.0 90.4Bibteral loas 134.3 92.9 173.7 125.4 136.3 294.1 80.0 173.4 146.9 84.0 49.2Export credits 74.3 69.3 49.4 55.9 23.3 9.4 4.5 131.2 37.4 15.4 3.1
~ ;___Suppliers'credits 22.4 25.2 26.3 27.0 26.2 22.0 23.7 15.8 18.0 16.3 15.4Financial institutions 7.8 17.4 58.6 63.6 64.3 72.9 32.2 43.1 27.3 31.0 25)Bonds - - - 74 - - - - - -Multilateral loans 7.5 12.8 15.7 21.2 27.2 32.9 46.2 58.2 83.2 93.7 95.3IBRD 6.4 10.6 11.7 15.6 17.2 21.7 33.6 42.8 60.4 77.2 75.9IDA 0.5 0.5 0.7 0.8 0.9 1.1 1.5 1.3 2.2 2.8 3.3Other 0.6 1.7 3.3 4.3 9.0 10.1 11.1 13.6 20.6 13.7 16.1Bilateral oan 22.5 26.8 29.7 29.6 36.2 54.2 72.8 74.7 80.9 56.0 45.7Export credits 12.1 41.2 31.9 40.3 36.9 30.3 31.0 45.8 49.2 36.0 24.3
Suppliers' credits 19.5 14.3 12.6 9.7 6.6 6.7 5.3 3.2 15.2 7.5 12.3Financial instituions 5.2 24.8 39.5 54.1 27.9 20.8 15.5 7.9 9.3 6.3 5.3Bonds 0.4 1.4 - - - - - - - - -Multilateral oans 30.9 36.7 36.1 38.4 44.9 58.1 63.3 85.2 100.4 100.6 S7.5IBRD 27.4 31.3 30.2 29.7 36.0 49.0 51.3 72.7 84.7 87.8 74.0IDA 1.0 1.2 1.6 1.8 1.9 2.6 3.2 3.8 4.5 5.2 5.0Other 2.5 4.2 4.3 6.3 7.0 6.5 3.2 8.7 11.2 7.6 8.4Bilateral lons 22.9 25.2 26.4 29.8 32.5 33.8 43.3 46.6 46.0 37.5 27.4Exportcredits 12.7 32.7 21.4 22.1 19.6 12.7 12.9 20.6 21.7 11.0 25.2
Note: Dat excludes IMF. N
Source: IBRD,Dbtor Reporting Systm.

Table 4.4: IMF POSITION AT YEAR'S END(In millions of SDR)
0979 1q80' 19A1 1982 1984 1984 198$ 1986* .1987 '1988 1989
Purchases 86.3 60.0 30.0 150.4 132.6 46.2 123.1 0.0 0.0 102.6 0.0
Debt Service 30.6 13.1 21.2 40.9 73.0 96.0 104.7 125.8 110.9 88.4 122.0Repurchases 30.6 7.0 7.2 16.9 43.0 58.0 69.7 89.8 83.9 67.4 98.0Charges .. 6.1 14.0 24.0 30.0 38.0 35.0 36.0 27.0 21.0 24.0
Net Use of Fund Credit 56.0 44.0 23.0 134.8 88.1 -10.6 54.6 -89.8 -83.9 63.6 -55.5(duumg period)
Quota 69.0 103.5 103.5 103.5 142.0 142.0 142.0 142.0 142.0 142.0 142.0
Use of Fund Credit 108.3 152.3 175.3 310.1 398.2 387.6 442.2 352.4 268.5 332.1 276.6
Fund holdings of Kenya currency 177.3 255.8 278.7 412.1 530.6 518.7 572.0 482.2 398.3 461.9 406.4
Reserve position in Fund -- -- 0.1 1.5 9.6 10.9 12.2 12.2 12.2 12.2 12.2
Source: IMF, International Financial Staistics, various issues.

Table 5. 1: SUMMARY OF CENTRAL GOVERNMENT BUDGET OPERATIONS(In Millions of Kenya Pounds)
Ptovisional
1978sn 1979/80 1980/81 1981/82 1982183 1983/84 1984/85 1985/86 1986/87 1987/88 1988/89 1989/90
Total Revenue 510.6 611.0 701.5 763.1 832.1 923.6 1019.6 1209.3 1389.6 1618.5 1917.5 2178.2Current 510.6 611.0 701.5 763.1 824.3 920.9 1016.9 1205.6 1386.7. 1614.3 1886.9 2173.7Capital .. .. .. .. 7.8 2.7 2.7 3.8 2.9y 4.1 30.6 4.4
Expenditure and Net Leading 651.8 719.9 870.4 989.8 890.3 1143.5 1346.0 1478.3 1889.7' 2042.2 2375.8 3093.9Cufrent Expenditure 484.6 536.4 661.7 834.9 861.4 984.6 1091.3 1250.8 1517.2 1731.0 1896.1 2368.1Capital Expenditur 114.1 149.1 188.8 143.2 142.0 133.3 217.8 177.0 324.6 281.9 417.0 650.9Net LAnding 53.0 34.4 20.0 11.8 -113.1 25.6 36.9 50.5 47.9 29.3 62.7 74.8
External Grnts 1/ 13.3 19.1 19.6 i9;8 56.3 49.9 70.5 54.8 62.8 15. 186.7 448.8
FPlming of DeficitExternal Leas (Net) 61.3 74.7 126.8 159.6 91.3 35.8 24.9 -95.0 1.5 71.5 200.0 339.6Totad Domestic Borrowing 157.1 23.9 67.5 167.9 245.6 156.3 87.6 204.2 406.4 225.9 88.0 72.2
Long-Tenn (net) 88.5 48.6 66.4 44.0 272.2 10.7 6.9 36.3 156.4 220.8 119.1 32.5Short-Term (net) 68.5 -24.7 1.1 123.9 -26.6 145.6 80.7 167.9 250.0 5.1 -31.1 39.7Changes in Cash Balnces 90.6 8.8 45.0 120.6 335.0 22.0 -143.5 -105.1 -29.5 32.9 16.4 -55.1
Memo Items:Current Surplus 26.1 74.6 39.9 -71.8 -37.1 -63.7 -74.4 -45.3 -130.5 -116.7 -9.2 -194.4O>verall Deficit (excl. grants) -141.1 -108.9 -168.9 -226.7 -58.2 -219.8 -326.4 -269.0 -500.1 -423.8 -458.3 -915.7
1/ Prior to 1982/83, program gants are excluded.
Source: Ccntral Bureau of Statitis, Economic Survey, various issues.

Table 5.2: CENTRAL GOVERNMENT REVENUES
(In Millions of Kenya Pounds)
197snl9 1979/o i980/i81 19i /82 1982183 19S3/S4 1984185 1985186 1986/S7 1987/88 1988/89 1989/90
Tax Revenue 419.7 515.1 608.6 676.2 715.4 811.8 886.0 1066.6 1240.7 1453.3 1643.7 1909.S
Direct Taxes 151.7 173.6 198.3 201.1 231.8 251.S 301.0 358.1 385.7 454.5 512.0 639.7
On income and profits 151.1 171.9 197.6 199.7 231.2 251.2 301.0 358.1 385.7 454.5 512.0 639.7
Other 0.7 1.8 0.7 1.5 0.6 0.6 0.0 0.0 0.0 0.0 0.0 0.0
Indirect Taxes 268.0 341.5 410.3 475.0 484.2 560.6 585.0 708.5 855.0 998.9 1131.7 1270.1
On goods and services 163.9 232.0 261.2 286.0 301.6 367.0 392.9 457.0 574.4 708.7 804.2 918.4
Sales tax 99.8 154.9 179.4 194.8 195.9 253.7 273.6 303.6 397.5 520.0 588.3 668.2
On local manufactures .. .. .. .. 123.3 146.5 158.0 191.0 241.8 301.3 351.3 416.6
On imports .. .. .. .. 72.6 107.2 115.6 112.6 155.8 218.7 237.0 251.6
Excise duties 49.0 59.5 60.2 64.0 74.0 79.4 78.8 89.0 106.3 123.1 137.4 158.8
Other taxes and licenses 15.1 17.6 21.6 27.3 31.8 33.9 40.5 64.4 70.6 65.7 78.5 91.4
On international trade 104.1 109.5 149.1 189.0 182.6 193.6 192.1 251.5 280.6 290.2 327.5 351.7
Import duties I/ 101.3 102.5 146.0 183.7 175.8 183.5 165.1 211.8 246.7 273.7 301.0 350.8
Export duties 2.8 7.0 3.1 5.3 6.8 10.1 27.0 39.6 33.9 16.5 26.6 0.9
Non-tax Revenue 85.6 92.8 88.8 121.8 116.2 111.3 133.6 145.7 148.9 165.1 273.8 268.3
Income from property 30.3 26.8 38.7 34.0 53.7 54.2 57.5 64.8 60.5 69.6 94.9 98.7
Current transfers 1.2 1.0 1.2 1.6 2.6 1.9 2.6 11.4 15.3 8.3 12.9 5.0
Sales of goods and services 39.9 46.2 32.8 34.6 30.7 27.5 36.9 38.9 43.4 51.1 76.9 102.0
Other 14.3 18.8 16.1 51.6 29.2 27.8 36.7 30.7 29.6 36.3 89.1 62.6
Statistical Discrepancy 5.3 3.0 4.1 -34.8 0.5 0.6 0.0 -3.0 -0.0 -0.0 -0.0 -0.0
%,~~~~~R% Wj. j .F"t1;3,ait9t 68 ti3 '52t.
Memo Items:Share of Total Revenue (%)
Tax Revenue 82.2 84.3 86.8 88.6 86.0 88.0 86.9 88.2 89. 8S9.S 85.7 87.7
Direct Taxes 29.7 28.4 28.3 26.4 27.9 27.3 29.5 29.6 27.8 28.1 26.7 29.4
Indirect Taxes 52.5 55.9 58.5 62.3 58.2 60.7 57.4 58.6 61.5 61.7 59.0 58.3
On international trade 20.4 17.9 21.3 24.8 21.9 21.0 18.8 20.8 20.2 17.9 17.1 16.1
Non-tax Revenue 16.8 15.2 12.7 16.0 14.0 12.0 13.1 12.1 10.7 10.2 14.3 12.3
I/ Before Export Compensaion payments.
Source: Central Burau of Ststidts, Economic Survey, various isuea.

Table 5.3: ECONOMIC CLASSIFICATION OF CENTRAL GOVERNMENT EXPENDITURE(In Milliom of Kenya Pounds)
197S/79 1979no 19801S1 19S1/82 1982Jt3 198344 1984185 1985t86 198641 198718l 19SStS9 1989190
Current Expeniture 484.6 536.4 661.7 834.9 861.4 . 984.6 1091.3 1250.8 1517.2 1731.0 1896.1 2368.1
Consumption sExpenditure 325.3 366.3 419.7 535.9 511.2 594.2 606.9 690.3 5123S 937.3 998.0 1341.9Wages and salaries 125.9 136.8 172.8 224.4 230.1 264.7 28S.7 335.8 39S.4 453.6 530.2 597.4Othergoods andservikes 199.4 229.5 247.0 311.5 281.1 329.6 318.2 354.5 414.4 483.7 467.8 744.6
Subsidies It 1.3 1.0 0.9 1.6 0.0 14.0 14.8 27.4 26.5 29.0 31.1 38.0Export corpestion .. .. .. .. .. 12.3 12.9 27.3 25.4 28.7 31.0 38.0
Intaest 42.5 48.1 68.1 118.5 145.9 173.7 195.9 266.1 300.2 370.4 463.4 505.2Domestic .. ,. .. .. .. 108.9 121.9 175.0 198.2 249.5 306.9 333.1Foreign .. .. .. .. .. 64.S 74.0 91.0 102.0 120.9 156.6 172.1
Trmfer 115.5 121.1 173.0 178.3 204.3 202.7 273.8 267.2 377.7 394.4 403.6 480.5To Houseds 2/ 12.0 13.3 11A. 17.0 23.0 19.S 26.4 48.7 32.8 39.2 41.8To Enterprises 31 7.6 4.4 19.5 S.4 8.4 11.1 0.4 1.0 - 7.0 -ToGenerO Govemrnment 91.5 101.3 140.1 150.7 167.1 165.1 214.4 208.9 331.0 324.4 352.5To Rest ofWorld 3.5 1.2 1.3 2.3 5.1 5.3 31.5 5.8 12.3 10.3 7.0ToOther 0.9 0.8 1.0 0.5 0.7 1.5 1.1 2.7 1.6 13.7 2.3
Others 0.1 0.0 0.0 0.0 0.0 0.0 -- 0.0 0.0 0.0 0.0 2.4
Capital Expaditure 114.1 149.1 183.8 143.2 142.0 133.3 217.8 177.0 324.6 281.9 417.0 650.9Grtss fixed capital formation 107.0 143.5 166.9 123.5 134.9 119.0 194.7 150.5 283.7 242.0 372.8 588.4Transfers 7.2 5.7 21.8 19.6 7.1 14.4 23.1 26.5 40.9 39.9 44.2 62.5
Net Lending 53.0 34.4 20.0 11.8 -113.1 25.6 36.9 50.5 47.9 29.3 62.7 74.8Psrch oseof eqity 4l 12.6 9.5 5.2 7.4 6.0 0.5 5.4 10.5 7.9 7.1 16.7 29.4Leans 51 63.4 55.6 65.6 70.7 31.2 30.7 35.5 47.5 46.4 27.3 61.0 55.5Lonn RepymentsloGovemrnment 22.9 30.7 50.8 66.3 150.2 5.6 4.0 7.4 6.4 5.1 15.0 10.0
Trotiitptiiluwt 6/ 7' a71) ., 9i9.t; 8 9Q3 1143. 5. i346.0.1 1473j t 889, 7 2042.2 .'2375.8 3093.9
Memo Item:Recurrent Account 477.5 549.3 689.3 830.3 967.7 1008.5 1026.7 1346.6 1626.3 1819.0 2264.7 2524.8Development Account 220.1 232.1 282.7 292.1 223.0 246.3 507.9 309.1 462.1 408.6 629.0 989.4Total 697.6 781.3 972.1 1122.3 1190.7 1254.7 1534.7 1655.7 2018.4 2227.6 2893.6 3514.1
less Public Debt Redenption 22.9 30.7 50.8 66.3 150.2 105.7 184.7 169.9 192.4 180.2 502.8 410.3less Loan Repayments to Gov't 22.9 30.7 50.8 66.3 150.2 5.6 4.0 7.4 6.4 5.1 15.0 10.0
Total Expenditure 61 651.8 719.9 870.4 989.8 890.3 1143.4 1346.0 14 8.4 1889.7 20422 2-375.8 3093.9
If Prior to 19831834, sbsidis csircIte esport coneestimin.2t HIlsuehod. sAd uninsserporatod enterpsrrn inecuding privete nonprofit inaitstioni31 FPsriss .*d nonfinsneril eeterprixs41 In orrerpriesa
51 L.n-. t. u.rhnid.merpri- sd gesersl go ,rcriet sergcra,61 Indudes rd bndmg.
Snurce Ccnnntr Buresa of Srstiies. Eronottis Sur.rwe _ri iton
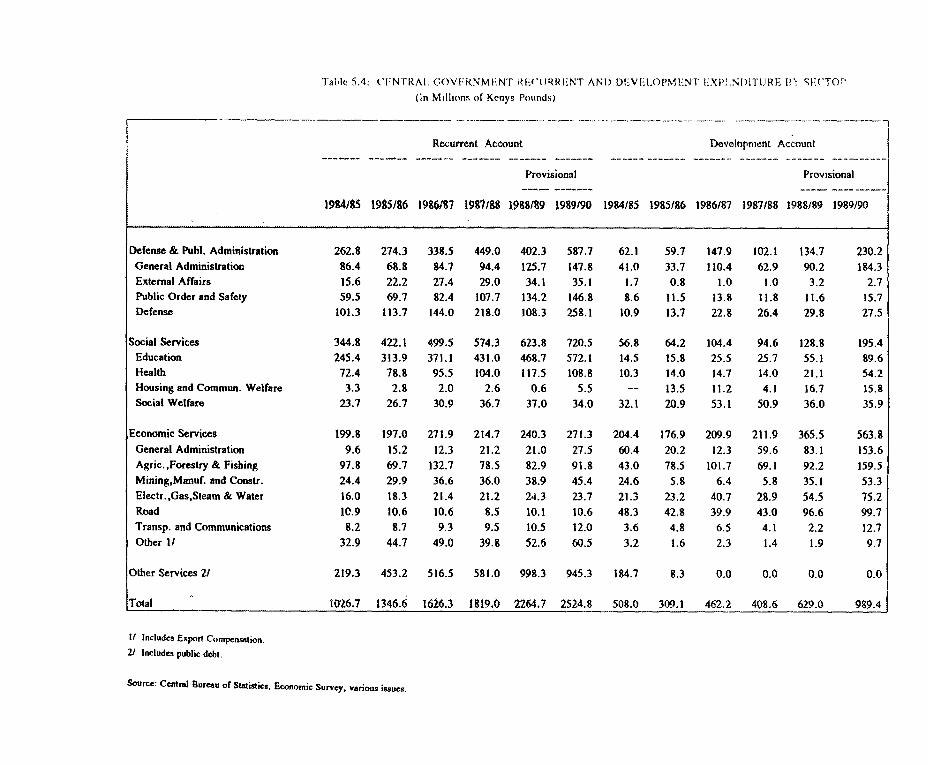
Table 5.4: (ENTRAL. C0VFRNMFNT Rfl('IRR.NT ANI) DEVELOPMENT FXi!ND)ITUIJRE 1 S.'(TOrt
(In Mdillons of Kenys Ptinlds)
Recurrent Account Development Account
Provisional Provisional
1984/85 1985/86 1986JS7 1987/88 1988189 1989190 1984185 1985186 1986/87 1987/88 1988189 1989/90
Defense & Pubi. Administration 262.8 274.3 338.5 449.0 402.3 587.7 62.1 59.7 147.9 102.1 134.7 230.2
General Administration 86.4 68.8 84.7 94.4 125.7 147.8 41.0 33.7 110.4 62.9 90.2 184.3
External Affairs 15.6 22.2 27.4 29.0 34.1 35.1 1.7 0.8 1.0 1.0 3.2 2.7
Public Order and Safety 59.5 69.7 82.4 107.7 134.2 146.8 8.6 11.5 13.8 11.8 11.6 15.7
Defense 101.3 113.7 144.0 218.0 108.3 258.1 10.9 13.7 22.8 26.4 29.8 27.5
Social Services 344.8 422.1 499.5 574.3 623.8 720.5 56.8 64.2 104.4 94.6 128.8 195.4
Education 245.4 313.9 371.1 431.0 468.7 572.1 14.5 15.8 25.5 25.7 55.1 89.6
Health 72.4 78.8 95.5 104.0 117.5 108.8 10.3 14.0 14.7 14.0 21.1 54.2
Housing and Commun. Welfare 3.3 2.8 2.0 2.6 0.6 5.5 -- 13.5 11.2 4.1 16.7 15.8
Social Welfare 23.7 26.7 30.9 36.7 37.0 34.0 32.1 20.9 53.1 50.9 36.0 35.9
Economic Services 199.8 197.0 271.9 214.7 240.3 271.3 204.4 176.9 209.9 211.9 365.5 563.8
General Administration 9.6 15.2 12.3 21.2 21.0 27.5 60.4 20.2 12.3 59.6 83.1 153.6
Agric.,Forestry& Fishing 97.8 69.7 132.7 78.5 82.9 91.8 43.0 78.5 101.7 69.1 92.2 159.5
Mining,Manuf. and Constr. 24.4 29.9 36.6 36.0 38.9 45.4 24.6 5.8 6.4 5.8 35.1 53.3
Electr.,Gas,Sleam & Water 16.0 18.3 21.4 21.2 24.3 23.7 21.3 23.2 40.7 28.9 54.5 75.2
Road 10.9 10.6 10.6 8.5 10.1 10.6 48.3 42.8 39.9 43.0 96.6 99.7
Transp. and Communications 8.2 8.7 9.3 9.5 10.5 12.0 3.6 4.8 6.5 4.1 2.2 12.7
Other 1/ 32.9 44.7 49.0 39.8 52.6 60.5 3.2 1.6 2.3 1.4 1.9 9.7
Other Services 2/ 219.3 453.2 516.5 581.0 998.3 945.3 184.7 8.3 0.0 0.0 0.0 0.0
Total 1026.7 1346.6 1626.3 1819.0 2264.7 2524.8 508.0 309.1 462.2 408.6 629.0 989.4
It Includes Export Compensation.
V Includes public debt.
Source: Central Bureau of Sittistics, Economic Survey, various issues.

Table 5.5: CENTRAL GOVERNMENT EXPENDITURE BY SECTOR
Defense & Pubi. Administration 324.9 334.0 486.4 551.2 537.0 817.9 3051.2 21.9General Administration 127.3 102.5 195.1 157.3 215.9 332.1 1130.3 8.1External Affairs 17.3 23.0 28.3 30.0 37.3 37.7 173.7 1.2Public Order and Safety 68.1 81.1 96.1 119.6 145.7 162.4 673.0 4.8Defense 112.2 127.3 166.8 244.3 138.1 285.6 1074.3 7.7
Social Services 401.7 486.3 603.9 668.9 752.6 915.9 3829.2 27.5Education 259.8 329.7 396.5 456.6 523.8 661.7 2628.1 18.9Health 82.7 92.7 110.3 117.9 138.5 163.0 705.2 5.1Housing and Commun. Welfare 3.3 16.3 13.2 6.6 17.3 21.3 78.2 0.6Social Welfare 55.8 47.6 83.9 87.7 73.0 69.9 417.8 3.0
Economic Services 404.2 373.9 481.8 426.6 605.8 835.1 3127.3 22.5General Administration 69.9 35.4 24.6 80.8 104.1 181.1 496.0 3.6Agric.,Forestry & Fishing 140.8 148.2 234.4 147.6 175.0 251.2 1097.2 7.9Mining,Manuf. and Constr. 49.0 35.7 43.1 41.8 74.0 98.7 342.3 2.5Electr.,Gas,Steam & Water 37.3 41.5 62.1 50.1 78.8 98.9 368.6 2.6Road 59.2 53.3 50.5 51.4 106.7 110.3 431.4 3.1Transp. and Communications 11.8 13.5 15.8 13.6 12.7 24.7 92.1 0.7Other 1/ 36.1 46.3 51.3 41.2 54.5 70.2 299.7 2.2
Other Services 2/ 404.0 461.5 516.5 581.0 998.3 945.3 3906.5 28.1
'i,9 0~ ~ ~~~~~j54. 1655.7 2(3B XS'1 2I~ 4.i' '3914.z2 100.0>
Note: Data in millions of Kenya pounds unless otherwise specified.
1/ Includes Export Compensation.2/ Includes public debt.
Source: Central Bureau of Stadistis, Economic Survey, various issue.

Table 5.6: LOCAL GOVERNMENT BUDGET OPERATIONS
(In Millions or Kenya Pounds)
.Ptislonel
1979 1980 1981 1982 1983 198 1985/16 1986187 1987/88 19881I9 1989/90
Total Revenue . ,' .473 512 62.0 80.9, 86,4 8.6i 114.7 107.2 111.0 135.2 220.4
Municipal Councils 37.6 39.9 49.8 66.0 70.6 60.2 97.2 85.0 96.8 102.7 180.5
Canest Revenue 31.7 32.2 37.6 51.2 52.7 46.9 52.7 54.0 77.9 72.5 113.1
Direct taxes 11 7.9 8.4 15.0 21.2 21.3 19.0 23.5 22.7 27.4 31.3 32.0
Indirect taxes 0.6 1.0 1.2 1.7 1.9 1.0 2.9 3.5 3.1 5.4 3.3
Nontax revenue 23.3 22.8 21.4 28.3 29.6 26.9 26.4 27.8 47.5 35.9 77.7
Trasfers 7.0 2.7 2.3 2.6 1.0 0.7 1.0 0.5 0.2 0.6 0.6
Capital Revenue 5.9 7.7 12.3 14.8 17.8 13.3 44.5 31.0 23.9 30.2 67.4
Loans raised 5.8 7.7 12.3 14.8 17.8 13.2 44.5 30.8 28.7 30.2 67.3
Lean repynment 0.0 0.0 0.0 0.1 0.1 0.1 0.0 0.2 0.1 0.1 0.1
Town,Urban ad County Councils 9.7 11.3 12.1 14.9 15.8 8.4 17.4 22.1 21.2 32.5 39.9
Cane Revenue 9.0 10.5 10.6 13.2 12.9 3.3 16.7 21.0 18.9 27.2 23.6
Direct taxes 11 1.0 0.9 1.3 0.9 1.1 1.0 2.1 1.0 1.2 2.3 2.2
Indirect taxes 3.8 4.6 4.4 6.1 5.6 4.7 10.4 3.3 7.9 9.8 7.2
Nontax revenue 4.3 5.0 4.9 6.2 6.3 2.6 4.2 11.7 9.9 15.2 14.2
Transfen 0.5 0.7 0.7 1.4 0.6 0.4 0.4 0.7 0.6 0.8 0.5
Capitl Reve 0.7 0.8 1.6 1.7 2.9 0.1 0.7 1.2 2.3 5.3 16.3
LoAns raisd 0.6 0.8 1.5 1.7 2.9 0.1 0.7 1.2 2.2 5.3 16.3
Ln n repaynent 0.0 0.0 0.0 0.0 0.0 0.1 0.0 0.0 0.0 0.0 0.0
Togjttne21; 7v 5oPt'U7i;t;~~~~h; 9z3 '>- 8s5.t $.75.g" 13;0;2 125i ~~~139;} 1il;2 '264.1i
Municipal CAoucilts 39.4 53.3 64.9 74.5 73.7 65.2 132.1 105.9 117.1 144.0 207.0
Cumat Expaendi 25.2 30.8 39.0 47.0 50.6 40.9 62.2 60.3 69.5 79.8 90.0
Trasfers 0.9 1.0 1.3 1.0 1.1 0.8 1.6 4.7 5.1 5.3 4.5
Capitl Expenditue 14.2 22.5 25.8 27.5 23.2 24.3 69.3 45.6 47.6 64.2 117.0
Gros fixed cap. formtion 9.2 16.6 19.7 20.5 16.3 15.7 54.3 31.4 32.1 46.3 93.8
Debt service 4.9 5.4 5.6 6.4 6.6 8.4 15.4 12.5 15.2 16.9 17.4
Transfors 0.1 0.5 0.6 0.6 0.3 0.2 0.2 1.7 0.4 1.0 0.9
Town.lUrbanafdCountyCouncils 9.6 11.1 13.3 16.8 12.5 10.3 18.1 19.3 22.0 37.1 57.1
Curevt Expenditure 7.8 *.0 9.2 11.1 11.7 7.2 13.3 15.4 17.5 25.2 23.6
Transfen 0.6 0.1 0.6 0.5 0.6 0.2 0.9 0.8 0.5 0.9 1.5
Capital Expenditure 1.8 3.1 4.1 5.7 0.3 3.2 4.3 3.9 4.5 12.0 23.4
Gross fixed cap. forniation 1.5 2.6 3.8 5.5 0.6 3.1 3.8 3.3 4.3 11.0 27.6
Debt service 0.3 0.3 0.3 0.2 0.2 0.1 0.3 0.3 0.2 0.7 0.3
Transfers 0.0 0.1 0.1 0.1 0.1 0.0 0.1 0.3 0.0 0.3 0.1
Ov ll Dehciti '-wi- : 0' - t o .. 16i . '-W.0 4.2 '-46.0 -43.7
Municipal Councils -3.8 -13.4 -15.0 -8.5 -3.2 -5.0 -34.8 -20.8 -20.3 -41.3 -26.5
Town,Urban and County Councils 0.1 0.2 -1.2 -1.9 3.3 -1.9 -0.7 2.9 -0.9 -4.6 -17.2
2/ PSid by bossebeld ad acefpris.2V 1seldes amesizsik paymet.
Soam: Cacrl Brs of Stde5tii, Esacr S5fecy. viaroba.
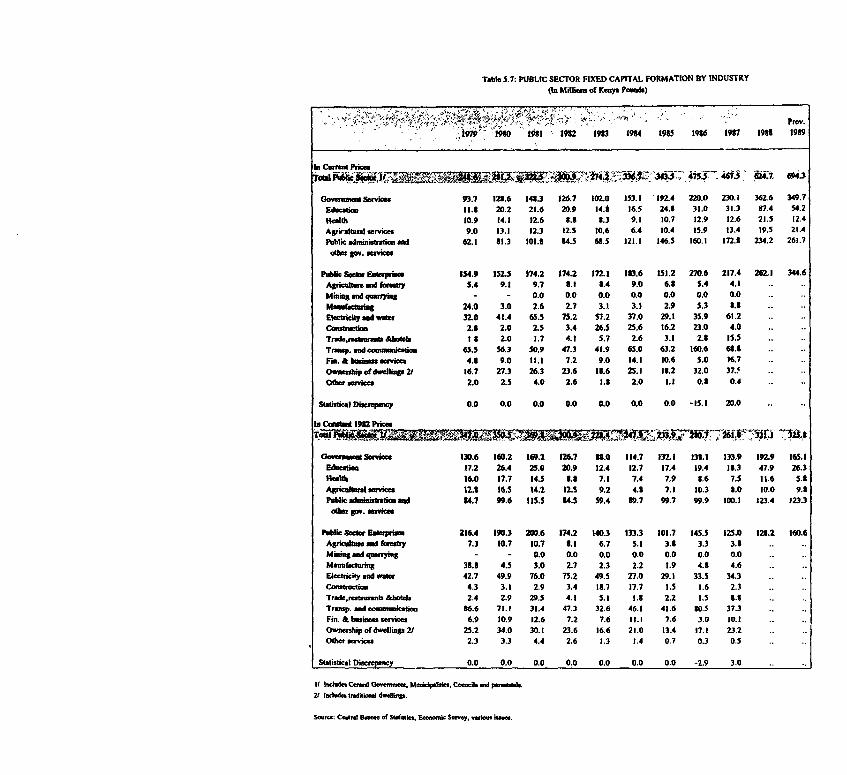
Table 5.7: YUBLIC SECTOR FIXED CAPiTAL FORMATION BY INDUSTRY(in Millber of Ka" PJs)
' ' ,,/ 14t3 t91t 93M2 9M3 1914 1935 19S6 197 "9 1939
In Curmt Prim
GoVWe,mt Service 93.7 128.6 14S.3 126.7 102.0 153.1 192.4 220.0 230.1 362.6 349.7
Edutioe 11.S 20.2 21.6 20.9 14.S 16.5 24.8 31.0 31.3 37.4 54.2
Health 10.9 14.1 12.6 3.3 8.3 9.1 10.7 12.9 12.6 21.5 12.4
Agrirnltnml ervice 9.0 13.1 12.3 12.5 10.6 6.4 10.4 15.9 13.4 19.5 2t.4
PubiclaminiscstionWAd 62.1 S1.3 101.S U4.5 6S.5 121.1 146.5 160.1 272.3 234.2 261.7
gOt n. erVices
Pnblc Socb, Ealaplw 154.9 252.5 174.2 174.2 172.1 133.6 151.2 270.6 217.4 262.1 344.6
Agsienltud fooey 5.4 9.1 9.7 S.1 5.4 9.0 6.8 5.4 4.1
Minag and qarsyih - - 0.0 0.0 0.0 0.0 0.0 0.0 0.0
Mamfac-St 24.0 3.0 2.6 2.7 3.1 3.1 2.9 5.3 3.3
Elwuicity nd wow 32.0 41.4 65.5 7S.2 57.2 37.0 29.1 35.9 61.2
Constmuctim 2.8 2.0 2.5 3.4 26.5 25.6 16.2 23.0 4.0
Trado,r st c&hoka I S 2.0 1.7 4.1 5.7 2.6 3.1 2.5 15.5
Tramp, and cmnwAlcation 65.5 56.3 50,9 47.3 41.9 65.0 63.2 160.6 63. .
Fin.Alboinassm v 4.0 9.0 It1. 7.2 9.0 14.1 10.6 5.0 16.7
Owmambip ofdwellia2/ 16.7 27.3 26.3 23.6 12.6 25.21 1.2 32.0 37.5
Odor .vro 2.0 2.5 4.0 2.6 2.S 2.0 1.1 0.3 0..
Stsitial Discrepwancy 0.0 0.0 0.0 0.0 0.0 0.0 0.0 -15.1 20.0
Is C_t 1962 Pica
GO eaUawSorvioa 130.6 160.2 169.2 226.7 30 114.7 132.21 13.1 133.9 292.9 126.1
Education 17.2 26.4 25.0 20.9 12.4 12.7 17.4 19.4 15.3 47.9 26.3
Healtl 16.0 17.7 14.5 8.3 7.1 7.4 7.9 3.6 7.5 11.6 5.l
Agfiulnati 12.1 16.S 14.2 22.5 9.2 4.5 7.1 10.3 3.0 10.0 9.3
publIc adSliuratan 54.7 99.6 2IS.5 54.5 59.4 S9.7 99.7 99.9 100.1 123.4 123.3
otdr g0v. ontC
PWik Selor Estetrmm 216.4 190.3 2C0.6 174.2 140.3 133.3 101.7 145.5 125.0 122.2 160.6
Agricaltamn nd kr-ay 7.3 10.7 10.7 3.2 6.7 5.1 3.3 3.3 3.15
Mining and qcafying - - 0.0 0.0 0.0 0.0 0.0 0.0 0.0
Mamlrctuing 35.3 4.5 3.0 2.7 2.3 2.2 1.9 4.5 4.6
Ekctricity ad Water 42.7 49.9 76.0 75.2 49.5 27.0 29.1 33.5 34.3
Construction 4.3 3.1 2.9 3.4 IS.7 17.7 1.5 1.6 2.3
Trad.rcatarant &botrl 2.4 2.9 29.5 4.1 5.1 2.5 2.2 1.5 5.S
Tranp. sd commnication 56.6 71.1 31.4 47.3 32.6 46.1 41.6 50.5 37.3
Fin. & busiss servie 6.9 10.9 12.6 7.2 7.6 11.1 7.6 3.0 10.1
Ownershipofdwellinge21 25.2 34.0 30.1 23.6 16.6 21.0 13.4 17.1 23.2
Otherf 2.3 3.3 4.4 2.6 1.3 1.4 0.7 0.3 0.5
Statistical Discrepncy 0.0 0.0 0.0 0.0 0.0 0.0 0.0 -2.9 3.0
2l Itn Coral oI"Wmet. Mckalpl. Ctooas sd pOetla.
21 tlalades baitaa dwaenp.
se: CostralBo of Stausen, Emwnk s5'ey'. aris isa.

Table 5.8: PUBLIC SECTOR EMPLOYMENT AND WAGE BILL
IT ?<Y ~rk .,.',t _ff >1913 <3934 11U -9*6 19317 198 197f9
d*lW6Wsg. kl ~ b~Jf~ 4qp>e<gy4 fl4i4j79C(tYf 71.414.*t i4B .65.4 aAgricrttmeand oresty 60.7 58.9 61.9 56.3 53.3 54.1 54.9 55.5 54.2 All 63.'Mmnmgsndqmmying 0.6 0.6 0.7 1.2 1.4 1.5 1.6 1.5 0.5 0.6 0.6Maeacuia 26.4 29.9 29.6 30.3 31.7 33.4 35.2 36.1 36.3 37.6 39.3Etrck* and warn 9.3 10.0 10.0 13.3 17.1 17.4 17.3 13.2 19.0 20.2 22.2Cmsrnctia. 23.L 31.5 23.7 23.3 23.1 22.1 24.1 30.9 32.1 32.6 35.3Trde. n -. I and hate 4.3 4.5 4.9 5.6 5.7 5.6 5.9 6.3 8.2 3.4 3.6T naspout ad coem _Actica 31.5 32.2 36.5 33.1 33.9 34.0 35.2 42.4 44.7 45.3 46.3FP. Sod bI Services 7.5 7.1 3.4 9.0 9.6 1 .8 13.3 15.6 16.3 17.1 13.4Oas c 21 255.1 296.2 303.4 327.5 345.3 361.5 336.7 399.3 415.6 430.3 446.3
Cses!w Govenmuss 197.3 214.3 214.5 216.7 226.4 211.1 252.0 259.7 274.4 270.5 29.3Teaben SeoviceoCe 31 - - 110.9 119.0 124.1 132.2 151.0 164.0 173.0 I35.1 195.1Porawatab 170.1 337.0 V7.4 95.7 97.6 95.4 90.4 100.1 97.3 103.9 307.9Loaa Gove_mms 33.3 39.6 39.7 41.3 45.2 47.7 45.6 43.3 43.5 50.6 41.3Odber 23.5 30.2 31.6 32.9 34.5 35.0 35.6 38.7 39.2 45.3 48.5
AgfkldWm and r"resby 28.9 23.3 27.0 25.9 27.3 28.4 30.3 35.4 37.4 50.4 52.5Mnungandquariymg 0.9 1.0 1.2 2.6 2.9 3.1 3.4 3.2 1.2 1.5 1.7v utacm 33.0 23.5 24.3 26.7 29.9 35.7 39.6 42.0 46.5 37.1 64.7Elaeicty c d ater 7.0 7.3 10.2 13.4 17.6 20.4 23.3 26.7 35.9 42.5 52.4Corsuctio 17.2 15.0 33.3 20.4 22.5 20.0 23.4 25.3 23.0 30.3 40.9Trnde.restwurastnd hbotel 3.5 4.6 6.2 7.9 3.3 3.9 9.6 10.7 15.6 17.0 19.6Traeeort tNWcomma,catios 31.9 35.7 45.2 46.5 49.3 53.7 57.9 75.9 35.6 97.7 111.1Fin. md business services 10.9 14.3 18.3 20.6 22.3 30.7 33.9 52.3 57.4 67.3 75.3Ofw tervie 21 171.1 212.1 265.9 300.5 332.5 366.7 430.9 476.0 497.0 600.7 693.1
Cenati Goverment 137.1 353.6 193.3 207.7 227.3 236.7 276.3 320.4 353.7 442.3 513.7Teachen Service Comm. 31 - - 79.3 94.3 103.6 120.7 343.2 IS0.0 196.5 215.3 233.2Partatals 116.1 133.6 39.3 97.1 107.1 124.3 139.9 146.3 147.2 161.3 213.8Locl Government 19.1 27.5 23.2 35.9 42.7 43.6 46.8 43.2 49.3 57.2 60.7Other 16.9 22.6 26.3 29.4 32.8 42.2 46.0 53.6 5t.0 6.2 81.1
WsPitmfnpFerEmptoy-eStYTt. 5SE&~ tI~J 'tf iTi. <9l. 791 16ii 1143.? i45.6' 1282.5 144.1. 134.6CcntralGovernment 694.9 715.1 901.2 953.5 1004.0 1024.A 1096.5 1233.5 1289.1 1635.2 1829.4Teachers Service Comm. 3/ - - 719.6 792.4 834.8 912.7 981.5 1097.6 1135.7 1166.0 1220.9Perastastls 682.5 714.4 1021.7 1014.6 1097.3 1302.7 1547.6 1461.5 1512 8 1552.5 2027.8LCl Government 565.1 694.4 710.3 869.2 944.7 914.7 1026.5 1113.4 1132.2 1130.6 1256.7Other 720.9 749.7 832.o S93.3 950.7 120t.0 1289.6 1386.0 1479.1 1506 0 1672.2
21 Comomunity.,ml son pernn serics.31 Data for 1979 id 1980 ire included in parstas.41 Is millions of Ke pounds.51 Arage wge eringa in ICmoys posp..
Seomc: Cenrs Dursu of Sti. E s , vs.

Table 6.1: CONSOLIDATED ACCOUNTS OF THE BANKING SYSTEM AT YEAR'S END(In Millions of Kenya Pounds)
.ittili97. 1980 , 1982 1983 -1984 1985 1986 1987 1981 I989
Money 518.7 530.0 597.2 689.3 745.7 816.4 787.0 1043.5 1144.4 1211.5 1315.8
Quasi-money 288.0 315.4 362.9 398.6 421.7 497.0 559.4 740.7 838.9 929.4 1101.9
Met foreign assets 179.4 113.2 16.0 -101.0 -11.3 20.2 -68.2 8.7 -64.1 -193.7 -87.9
Domestic Credit 691.8 779.9 967.9 1252.4 1253.4 1388.9 1569.0 2018.0 2429.1 2591.2 2770.8Central government (net) 156.1 166.0 292.9 484.1 391.5 436.0 478.5 744.4 967.7 883.5 857.3Other public bodies 46.9 26.0 23.7 50.4 92.9 105.7 119.9 139.5 176.9 171.9 137.9Private sector 488.7 587.9 651.3 717.8 769.0 847.2 970.7 1134.2 1284.4 1535.8 1775.6
Other items (net) -64.5 -47.7 -23.7 -63.6 -74.6 -95.7 -154.3 -242.5 -381.6 -256.6 -265.2
Source: Central Bureau of Statistics, Economic Survey, various issues.

Table 6.2: CHANGE IN MONEY SUPPLY AND SOURCES OF CHANGE(In Millions of Kenya Pounds)
{C79 a90 11 19 *-82. 1983 1984 980 i:4986 1987 A 1989
Money 43.2 11.3 67.2 92.0 56.5 70.7 -29.4 256.5 100.9 67.1 104.3
Quasi-money 47.1 27.5 47.5 35.7 23.1 75.2 62.5 181.3 98.2 90.5 172.5
Tot.)' * $$~ 1148 1271 79,6 145.9' 33.1 437.8 ; 99.0 157.5 24648
Net foreign assets 73.0 -66.2 -97.2 -117.0 89 6 31.5 -88.4 76.c -72.9 -129.6 105.8
Domestic Credit 78.2 88.1 188.0 284.5 1.0 135.5 180.2 449.0 411.0 162.1 179.6Central government (net) 10.7 9.8 126.9 191.2 -92.6 44.5 42.5 265.9 223.4 -84.2 -26.2Other public bodies 23.8 -20.9 -2.3 26.7 42.5 12.8 14.2 19.6 37.5 -5.0 -34.1Private sector 43.7 99.2 63.3 66.6 51.1 78.2 123.5 163.5 150.2 251.3 239.8
Other items (net) -60.8 16.8 24.0 -39.8 -11.0 -21.1 -58.7 -88.2 -139.1 125.0 -8.6
Source: Derived from Statistical Appendix Table 6.1

Table 6.3: ASSETS AND LIABILITIES OF NON-BANK FINANCIAL INSTITUTIONS AT YEAR'S END(In Millions of Kenya Pounds)
LiabiliesDeposits- 186.7 242,6 284.6 358.8 433.6 607.7 701.7 805.8 852.0 1037.9 1274.3
Central and local govermment 22.6 25.0 27.5 32.2 29.0 25.6 26.9 23.3 0.9 30.2 32.8Other public sector 52.3 67.5 85.9 138.8 136.9 161.2 155.0 146.8 137.0 144.3 190.5Other depositors 111.8 150.2 171.2 187.8 26.8 420.9 519.8 635.7 714.2 863.4 1051.0
Other liabilities 60.1 76.8 105.5 154.0 193.2 258.6 295.0 300.6 230.9 314.7 385.5
$5 ' 3:.. . .'I22 d ' S'1
AssetsCash and banks 34.1 42.4 32.1 69.5 64.1 103.2 98.9 123.5 66.2 0.3 142.3Other financial institutions 9.7 8.5 16.0 35.7 34.2 85.7 75.3 99.0 68.4 91.8 140.5Associated companies 43.0 37.5 40.4 12.1 4.8 15.6 10.4 12.7 13.6 12.2 22.0Investrments,Bills,Loansand Advances - 150.4 220.1 283.4 370.4 492.3 613.8 755.7 812.3 913.0 1058.0 1263.5
Central and local government 2.2 12.1 21.6 29.7 90.2 94.8 138.2 162.2 161.8 136.8 179.7Other public sector 1.4 1.2 1.3 5.3 3.2 2.9 3.0 7.2 9.0 24.0 7.9Private sector 146.8 206.8 260.4 335.5 398.9 516.2 614.5 642.8 742.2 897.2 1075.9
Other assets 9.7 11.1 18.2 25.1 31.5 48.0 56.4 58.9 53.7 75.7 91.6
Statistical Discrepancy -0.1 0.0 0.0 0.0 -0.0 0.0 0.0 -0.0 -32.0 114.0 -0.0
Source: Central Bureau of Statistics, Economic Survey and Statistical Abstract, various issues.

Table 6.4: PRINCIPAL INTEREST RATES AT YEAR'S END
(in Percentagea)
Ceatral Bank of KenaDisco rttfale-triasuybills 4.6 6.0 10.1 13.4 15.0 12.5 14.1 11.2 13.0 15.0 14.0
Advaoc canreasMybilob 7.5 8.0 10.0 14.5 14.5 12.0 12.0 12.0 12.0 15.0 15.5
Crp fm iemDiaon 7.0 8.5 10.3 13.8 13.3 11.3 11.3 11.3 11.3 16.0 16.5
Adynes 6.0 3.0 11.5 14.0 14.0 11.5 11.5 11.5 11.5 16.0 16.5
Other bill arnd noesDibcounts 7.5 8.5 11.5 14.5 14.5 12.0 12.0 12.0 12.0 16.0 16.5
Advane 7.5 8.0 11.5 15.0 15.0 12.5 12.5 12.5 12.5 16.0 16.5
K Bj comimc BakTiae Dqos
3-6 mnCKSh2miil. 5.1 7.0 10.8 12.3 12.0 11.0 11.0 11.0 9.5 11.5 11.5
> KSh2mill. 5.0 7.0 12.0 13.0 12.5 11.3 11.3 11.3 10.0 12.0 12.0
6-9 month<KSb2antill. 5.4 6.8 11.0 13.2 12.3 11.5 11.5 11.5 9.5 12.5 12.5
>KSla2mni1. 5.4 6.1 12.3 13.6 12.3 11.S H.11 I1.S 10.0 13.0 13.0
9-12 ni<KSh12mill. 5.6 6.4 11.3 13.4 12.5 11.8 11.S 11.S 9.5 12.5 12.5
> KSb 2mil. 5.6 6.4 12.5 13.S 13.0 12.0 12.0 12.0 10.0 13.0 13.0
12 na. (0.25- lidnlISh) 5.9 6.5- 11.5 13.5 13.0 I1.8- 11.8- 11.8- 9.5- 12.5- 12.5-
6.3 12.0 12.0 12.0 10.0 13.0 13.0
Sangdeposits 5.0 6.0 10.0 12.5 12.5 11.0 11.0 11.0 11.0 10.0 12.5-13.0
t sm &aancea(inmaximum) 11 10.0 11.0 14.0 16.0 15.0 14.0 14.0 14.0 14.0 15.0 15.5
0a, Prid _ibePotOlfAeSavinpsDepits 5.0 6.0 10.0 10.0 11.0 11.0 11.0 11.0 11.0 11.0 11.0
Agric.Finance Corp.IoawLmd pbclm - 9.0 12.0 12.0 12.0 12.0 12.0 12.0 12.0 12.0 12.0
SeaamcereplIan - 11.0 12.0 14.0 14.0 14.0 14.0 14.0 14.0 14.0 14.0
Otlef 9.0 10.0 13.0 13.0 13.0 13.0 13.0 13.0 13.0 13.0 13.0
Hire-prchae Companies andMefchant Banh:Dqeoits (time) 5.0- 3.0- 3.0- 13.3- 14.0- 13.0- 13.0- 13.0- 10.0- 10.0- 12.0-
8.0 11.0 12.0 16.3 16.5 14.5 14.5 14.5 13.5 15.0 15.0
L1as 10.0- 10.0- 14.0 16,0 20.0 19.0 19.0 19.0 18.0 I8.0 18.0
12.0 14.0
Buildinv SocietiesDeposits 6.0- 6.0- 8.0- 15.3 15.0- 13.0- 13.0- 13.0- 10.8- 11.0- I 1.8-
8.5 9.5 11.5 15.5 14.3 14.3 14.3 12.5 12.5 14.0
Loans 3.0- 11.0- 13.0- 16.0 16.0 16.0 16.0 16.0 14.5 14.5 16.5-
12.0 14.0 14.0 18.0
It Loas nd advtaovar 1ena thn 3 yonu.
Snar: Cetral Bwesw of 5tistin. E,:omlc Suny w ia. ano Cenrald Bnk of Kenya.

Table 6.5: EXCHANGE RATE MOVEMENTS
End of PeriodKshlSDR 9.7 9.7 12.0 14.1 14.4 15.2 17.7 19.1 23.4 25.0 28.4
US$/SDR 1.3 1.3 1.2 1.1 1.0 1.0 1.1 1.2 1.4 1.3 1.3
KshWUS$ 7.3 7.6 10.3 12.7 13.8 15.8 16.3 16.0 16.5 18.6 21.6
Period AverageKshJSDR 9.7 9.7 10.6 12.0 14.2 14.7 16.7 19.0 21.3 23.9 26.4
US$/SDR 1.3 1.3 1.2 1.1 1.1 1.0 1.0 1.2 1.3 1.3 1.3
Ksh/USS 7.5 7.4 9.0 10.9 13.3 14.4 16.4 16.2 16.5 17.7 20.6
Indices (1982 = 100) 1/Real Effective Rate 100.7 99.7 9O.4 100.0 94.8 101.5 100.0 86.7 78.4 72.5 69.7
% change -3.1 -1.0 -3.3 3.7 -5.2 7.1 -1.4 -13.3 -9.6 -7.5 -3.9
Nominal Effective Rate 106.6 107.6 105.7 100.0 91.9 97.4 93.1 82.9 77.1 73.6 73.4% change -0.3 0.9 -1.8 -5.4 -8.1 6.0 -4.4 -11.0 -7.0 -4.5 -0.3
Note: A reduction in the index indicates a devaluation.
I/ Based on annual average exchange rates.
Source: IMF.

Table 7.1: AGRICULTURAL OUTPUT, INPUTS, AND VALUE ADDED(In Millions of Kenya Pounds)
Prov.
1979 1980 1982 1983 1984 1985 1986 1987 1988 1989
Gross OutputAt current prices 747.6 791.2 917.5 1048.8 1274.1 1412.4 1562.9 1814.1 1873.4 2189.0 2381.6
Marketed production 313.8 353.3 386.9 448.9 555.5 788.8 755.9 938.3 817.7 945.7 1003.2
At constant 1982 prices 954.8 945.6 1010.1 1048.8 1121.6 1086.4 1142.4 1217.3 1246.4 1297.8 1345.1Marketed production 411.9 443.9 460.6 448.9 475.2 451.2 540.3 549.4 567.1 584.5 623.5
Value index 71.3 75.4 87.5 100.0 121.5 134.7 149.0 173.0 178.6 208.7 227.1Quantum index 91.0 90.2 96.3 100.0 106.9 103.6 108.9 116.1 118.8 123.7 128.3Price index 78.3 83.7 90.8 100.0 113.6 130.0 136.8 149.0 150.3 168.7 177.0
InputsAt current prices 76.4 79.3 98.4 84.7 147.5 168.0 205.7 216.0 204.1 286.3 293.2At constant 1982 prices 116.8 99.7 112.8 84.7 142.6 145.4 166.7 193.9 183.9 188.6 192.6
Value index 90.2 93.6 116.1 100.0 174.2 198.4 242.8 255.0 240.9 338.0 346.1Quantum index 137.8 117.6 133.2 100.0 168.3 171.6 196.8 228.9 217.0 222.6 227.4Price index 65.4 79.6 87.2 100.0 103.5 115.6 123.4 111.4 111.0 151.8 152.2
Value Added 1/At current prices 671.2 711.9 819.1 964.1 1126.5 1244.3 1357.2 1598.1 1669.3 1902.7 2088.4At constant 1982 prices 838.0 845.9 897.3 964.1 979.1 941.1 975.6 1023.4 1062.6 1109.3 1152.5
Value index 69.6 73.8 85.0 100.0 116.8 129.1 140.8 165.8 173.1 197.4 216.6Quantum index 86.9 87.7 93.1 100.0 101.6 97.6 101.2 106.1 110.2 115.1 119.5Price index 80.1 84.2 91.3 100.0 115.1 132.2 139.1 156.2 157.1 171.5 181.2
Note: Indices as wel as value of inputs ae derived.
Base year for indices, 1982.
I/ Mondary sector only, and excludes foresty and fishing.
Source: Central Bureau of Statisics, Economic Survey, various isues.

Table 7.2: GROSS MARKETED PRODUCTION AT CURRENT PRICES(In Millions of Kenya Pounds)
1979 1930 1981 1982 ~1983 1984 1985 1986 1987 1988 1989
Cereals 30.5 35.3 48.2 59.7 81.4 71.4 91.0 107.2 101.0 99.5 116.8Wheat 14.9 17.7 17.9 22.0 26.9 17.8 26.3 32.9 21.9 35.1 40.0Maize 9.4 10.4 23.6 30.8 49.0 49.1 54.6 66.5 68.1 54.2 69.9Rice 2.8 2.8 2.9 2.9 2.7 3.2 6.8 ..Others 3.4 4.3 3.7 4.0 2.9 1.3 3.4 7.8 11.1 10.2 7.0
Temporary Crops 46.2 57.3 62.9 64.6 63.2 68.0 83.2 120.5 122.2 105.3 126.7Pyrethrum 5.7 9.7 13.4 14.8 5.0 1.9 2.9 4.5 5.6 6.6 10.1Sugar Cane 23.3 29.5 30.9 29.4 34.3 41.0 46.8 52.8 55.5 68.8 78.4Others 17.2 18.0 18.6 20.4 23.8 25.1 33.5 63.3 61.1 29.9 38.2
Permanent Crops 182.7 204.5 195.6 232.9 316.6 551.8 459.4 550.8 404.8 501.6 509.7Coffee 105.7 118.9 102.5 122.9 166.3 227.7 191.9 288.3 192.2 278.1 243.9Sisal 6.6 9.7 8.5 12.6 15.5 17.3 15.0 15.4 13.5 13.8 16.6Tea 67.3 71.5 80.6 93.2 130.3 301.1 247.6 242.3 194.8 203.7 245.3Others 3.1 4.4 4.1 4.3 4.5 5.6 4.9 4.7 4.3 6.0 3.8
Cro0;,Su-tota) .5 ... 27.1; ' 3.7 3 .. 4. 6. 6.. 6 E. 68 1 706 1.77
Livestock and Products 54.3 56.3 80.2 91.7 94.3 97.6 122.4 159.8 189.7 239.3 250.1Cattle and calves 29.1 33.9 47.5 52.3 51.8 59.0 70.4 84.3 103.9 138.9 149.0Dairy produce 17.5 15.0 22.8 28.5 32.8 25.8 36.3 56.5 62.1 60.7 66.2Others 7.7 7.4 9.9 11.0 9.6 12.9 15.8 19.0 23.7 39.7 34.9
Total Gross Marketed Products 313.8 353.3 386.9 44B.9, 555.5 788.8 755.9 938.3 817.7 945.7 1003.2
Memo Item:Temporary industrial crops 46.2 49.2 53.1 53.9 51.2 58.5 65.9 92.7 103.4 93.4 102.6
Source: Central Bureau of Statistics, Economic Survey, various issucs.

Table 7.3: SALES TO MARKETING BOARDS - QUANTUM, PRICE, AND VALUE INDICES(1982-100)
Proy.1979 1980 1981 1982 1983 1984 1985 1986 1987 1988 1989
CerealsQuantum 69.5 58.7 35.5 100.0 105.8 16.7 93.6 104.3 92.4 86.5 97.0Price 84.6 90.3 93.9 100.0 129.8 139.8 160.7 171.2 179.5 193.6 198.8Value 58.8 53.0 80.3 100.0 137.3 121.2 150.4 178.6 165.9 167.5 192.8
Temporary Inbdtrial CropsQuantum 84.0 126.5 121.4 100.0 95.6 104.3 81.7 82.0 89.1 90.9 100.1Price 87.5 71.0 79.8 100.0 100.7 127.6 137.6 148.5 150.3 173.9 189.8Value 73.5 89.8 96.9 100.0 96.3 133.1 112.4 121.S 133.9 158.1 190.0
Pernameit CropsQuantum 92.5 108.2 99.8 100.0 116.4 122.0 112.2 130.9 121.4 142.9 132.0Price 86.4 91.9 84.1 100.0 118.0 185.7 144.9 181.6 140.7 158.2 154.2Value 79.9 99.4 83.9 100.0 137.4 226.6 162.6 237.7 170.8 226.1 203.5
Crops (Sub-toal)Quantum 86.5 102.4 106.8 100.0 111.4 102.0 110.3 128.0 119.0 130.4 131.6Price 87.4 83.8 85.6 100.0 117.9 178.8 145.3 180.0 142.7 159.1 167.4Value 75.6 85.8 91.4 100.0 131.3 182.4 160.3 230.4 169.8 207.5 220.3
Uvestock and Products(Jantum .. 80.6 82.0 100.0 100.3 145.9 82.2 92.7 105.1 126.1 127.2Price 63.6 73.8 85.9 100.0 100.3 105.0 118.9 134.8 150.2 157.4 181.0Value .. 59.5 70.4 100.0 100.6 153.2 97.7 125.0 157.9 198.5 230.2
Total Gros Marketed ProductsQuantum 88.1 95.2 98.9 100.0 110.7 117.9 104.6 120.8 116.2 125.2 130.3Price 85.1 79.6 84.0 100.0 116.9 174.S 139.9 170.8 144.2 161.8 160.9Value 75.0 75.8 83.1 100.0 129.4 206.1 146.3 206.3 167.6 202.6 209.7
Memo Items:Saies to Maret ing Boards I 3 t3.4 353, ^86.9 443. - 5S.4 .788.8 755.9 938i3 817.i 95; 10 3,i
Large Farms 148.2 168.8 178.6 216.7 271.3 386.2 346.6 515.5 432.1 500.4 508.3Small Farms 165.2 184.5 208.3 232.3 284.1 402.5 409.3 422.8 385.6 445.3 494.9
Note: Value indices were derived by multiplying quantum and price indies.
It In mdlions of Kenya Pounds.
Source: Central Bureau of Statidics, Economic Survey, various isus.

Table 7.4: PRINCIPAL CROPS - VOLUME OF SALES, AVERAGE PRICES AND PRODUCERS' REVENUE
WheatVolume of Sales ('000 mt) 201.0 215.7 203.4 234.7 242.3 135.4 193.5 224.7 148.3 220.2 233.2Aveago Price (OLShmt) 1436.4 1638.6 1666.7 1875.8 2220.0 2690.0 2710.0 2930.0 2950.0 3405.7 3428.0Produces' Revenue 14.4 17.7 17.0 22.0 26.9 18.2 26.2 32.9 21.9 37.5 40.0
Volume of Sales ('000 mt) 241.9 217.9 472.9 571.3 636.0 560.6 582.9 669.5 651.9 485.3 625.9Averag Price (KSh/mt) 888.9 953.7 1000.0 1070.0 1540.0 1750.0 1870.0 1980.0 2090.0 2142.3 2233.2Producers' Revenue 10.8 10.4 23.6 30.6 49.0 49.1 54.5 66.3 68.1 52.0 69.9
ss-cmVolum of Sales ('000 mt) 3147.6 3972.2 3822.0 3107.7 3200.0 3600.0 3500.0 3600.0 3700.0 3800.0 4300.0Avrag Price (KSh/mt) 133.0 133.0 145.1 170.0 227.0 227.0 270.0 297.0 300.0 358.3 368.0Produe' Revenue 20.9 26.4 27.7 26.4 36.3 40.9 47.3 53.5 55.5 68.1 79.1
CoffeeVolume of Sales ('000 mt) 75.1 91.3 90.7 88.4 95.3 118.5 96.6 114.9 104.9 124.6 113.1
Average Price (KShlmt) 28150.0 26348.0 22584.1 27800.0 34880.0 38440.0 39720.0 50200.0 36620.0 44650.0 43120.0Producers' Revenue 105.7 120.3 102.4 122.9 166.2 227.8 191.8 288.4 192.1 278.2 243.8
TeaVolume of Sales ('000 mt) 99.3 89.9 90.9 95.6 119.3 116.2 147.1 143.3 155.8 164.0 180.6Average Price (KSh/mt) 13566.9 15911.0 17740.0 19407.8 21840.0 51840.0 33660.0 33820.0 25000.0 20371.9 27170.0Producers' Revenue 67.4 71.5 80.6 92.8 130.3 301.2 247.6 242.3 194.8 167.0 245.3
Note: Revenue in millions of Kenya Pounds.
Source: Central Bureau of Statistics, Economic Survey, various issues.

Table 7.5: MAIZE - SELECTED INDICATORS
197/7 19798 "1980/81 -198 1/82 -1982/83 1983/84 198485 1985/86 1986/8 1987/8a 1988189
Area ('000 ha) .. 938.0 1120.0 1208.0 1236.0 1200.0 1130.0 1240.0 1200.0 1100.0 1200.0
Production ('000 mt) ... 1755.0 2340.0 2160.0 2070.0 1440.0 2610.0 2700.0 2250.0 2700.0
Average yield (mt/ha) i. . .6 1.9 1.7 1.7 1.3 2.1 2.3 2.0 2.3
Per capita production (kg) I/. . 103.2 132.3 117.4 108.3 72.5 126.5 126.0 101.2 117.0
Per capita consumption(kg)I/ 2/ . . 125.0 118.1 105.5 116.5 95.3 115.2 94.6 103.2 116.5
NCPB operationsDomestic sales ('000 mt) 373.5 476.1 699.3 268.2 396.0 619.2 794.7 391.5 223.2 500.4 412.2
Domestic sales as percentage . . 32.9 12.8 20.4 27.8 42.0 16.5 11.0 21.8 15.3
of consumption (%)Purchases ( '000 mt) 236.6 134.2 382.6 695.7 627.1 498.4 379.7 833.7 718.8 477.2 623.7
Note: Data by fiscal years.
It 1979 population includes the under - enumeration of population (See Technical Note).
2/ Assumes that consumption is production minus net exports and change in National Cereals and Produce Board (NCPB) stocks.
Source: National Cereals and Produce Board; and Ministry of Supply and Marketing.
a)
_

Table 7.6: TEA - SELECTED INDICATORS BY SIZE OF LANDHOLDING
Area ('000 ha)SmallMolders 48.9 50.7 53.6 54.7 55.0 56.5 56.5 56.5 56.9 57.7 57.9Estates 25.4 25.9 26.2 26.4 26.6 26.7 27.3 27.9 28.5 29.1 29.5Total 74.3 76.5 79.7 81.1 81.5 83.2 83.8 84.4 85.4 86.8 87.5
Production ('000 mt)Smallholders 37.6 34.0 35.8 39.9 51.0 52.7 71.3 68.1 76.9 84.7 100.6Estates 61.6 55.9 55.1 56.1 68.8 63.9 75.8 75.2 78.9 79.3 80.0Total 99.2 89.9 90.9 96.0 119.8 116.6 147.1 143.3 155.8 164.0 180.6
Average Yield (mtJha)Smallholders 769.3 670.7 668.1 729.5 927.9 932.8 1261.8 1204.3 1351.7 1468.0 1735.9Estates 2422.9 2162.5 2106.8 2126.3 2589.7 2391.6 2774.3 2699.8 2765.6 2726.2 2709.4Total 1335.1 1174.5 1140.0 1184.1 1469.4 1401.1 1754.8 1697.9 1823.9 1889.9 2064.6
Realproducerpet/ 21.1 21.9 2 1.7 .19.4 19.X I 41.5 24.4 23.2 16.0 118 .2L(1982 KShIkg)
I/ Nominal producer price is deflated by annual average Nairobi consumer price index (See Statistical Appendix Table 11.2).
Source: Tea Board of Kenya; and Central Bureau of Statistics, Economic Survey, various issues.

Table 7.7: COFFEE - SELECTED INDICATORS BY TYPE OF LANDHOLDING
"9''179' "91 ,::''."'' l9.0.. "9 2 ' ,'.,,,,2' . '19.31.4 1984185 1985186 1986187 1987188 l98819
Afea ('000 ha)Cooperatives 63.0 71.2 84.7 97.5 103.1 114.2 116.3 117.7 116.1 117.7 116.4Estates 20.0 31.2 32.9 33.6 33.6 35.7 35.7 38.6 38.4 38.6 36.7Total 83.0 102.4 117.6 131.1 136.7 149.9 152.0 156.3 154.5 156.3 153.1
Producho ('000 mt)Cooperatives 46.0 51.9 64.0 52.5 54.1 61.5 64.7 6S.4 67.9 84.3 78.3Estates 27.0 39.1 34.7 34.4 33.1 49.0 28.9 45.5 36.4 44.4 38.6Total 73.0 91.0 98.7 86.9 87.2 110.5 93.6 113.9 104.3 128.7 116.9
Averge Yield (mt/ba)Cooperatives 730.2 728.9 755.6 538.5 524.7 538.5 556.3 581.1 584.8 716.2 672.7Estates 1350.0 1253.2 1054.7 1023.8 985.1 1372.5 809.5 1178.8 947.9 1150.3 1051.8Total 879.5 888.7 839.3 662.9 637.9 737.2 615.8 728.7 675.1 823.4 763.6
Expouls ('000 nt)Sales to quota mrkets 71.0 82.0 78.0 84.0 78.0 83.4 79.8 110.3 90.7 73.2 86.7Sales to non-quot market 2.0 2.9 5.7 24.0 8.1 9.3 16.4 13.9 15.0 5.6 14.0
End-year stocks 22.3 19.8 30.9 20.0 21.3 56.3 49.3 60.7 58.9 102.3 120.7
'21 J f g v.8 3O25 K 30; *;2 7 r3y^W4,4 2 3.4 2'g N. ;t5(1982 KSh/kg)
Note: Dat by agriculturd yeas.
1/ Nominal producer price is deflatd by cnnucl average Nairobi consumer pice index (See Statistical Appendix Table 11.2).2/ Calendar yers beginning in 1979.
Source: Coffee Board of Kenya; and Central Bureau of Stistics, Economic Survey, various irsues.

Table 7.8: SELECTED AGRICULTURAL PRICE INDICES(1982=100)
1 1980 1981 ;1982% 1983 1984 1985 1986 1987 1988 199
Indices of Prices ReceivedSales to marketing boards 85.1 79.6 84.0 100.0 116.9 174.8 139.9 170.8 144.2 161.8 160.9
General index of agricultural 78.3 83.7 90.8 100.0 113.6 130.0 136.8 149.0 150.3 168.7 177.0output prices
Indices of Prices PaidPurchased inputs 68.4 94.2 97.4 100.0 104.2 125.1 120.7 123.2 129.6 145.5 152.2
Index of purchased consumer 63.3 69.9 82.7 100.0 113.8 134.0 154.8 159.9 167.8 178.6 184.0goods - nral areas
Weighted average 64.4 77.2 87.1 100.0 111.4 131.8 146.3 150.7 158.8 170.5 181.2
Ag~iuxa~ Tm~ns o~' T~d~ 1/ £~14 108.4 104.3 1~Xkk 102.0 g6c 93.. 98,9 94.(6 989.0~ 97.7.
11 Agricultural output price index divided by weighted average index of prices paid.
Source: Central Bureau of Statistics, Economic Survey, various issues.

Table 8.1: VALUE ADDED AND OUTPUT FOR ALL MANUJFACTURING FIRMS AND ESTABLISHMENT
(In Millions of Kenya Pounds)0
1979 1 1982 1983 1984 1985 1986 1987 1988 1989
VI 2 239.1 .. 429.0 484.4 542.7 ,08.2 6901 797.6 906.9
Food manufacturing 66.6 69.0 73.8 101.4 109.1 137.3 152.3 174.8 209.3 228.8 258.6
Beverages and tobacco 20.4 29.9 36.4 43.9 47.2 62.5 70.4 72.8 73.1 92.4 107.3
Chemicals (incl. petroleum) 28.1 27.2 35.9 38.4 41.3 53.7 59.8 62.1 68.2 81.2 94.0
Machinery and transp. equip. 29.9 49.3 51.8 58.4 62.9 59.8 68.7 76.0 76.6 76.4 85.2
Other manufactures 106.0 113.3 141.3 156.6 168.4 171.0 191.6 222.5 263.0 318.9 361.8
Valiueof Quput 1161.9 1360.0 1869.1 2224.3 2423.0 2950.7 3535.6 4296.7 5089.7 6102.7 7282.6
Food manufacturing 376.5 439.8 597.0 678.1 863.0 1107.9 1310.9 1619.7 1943.0 2246.6 2698.0
Beverages and tobacco 76.9 73.8 82.0 114.4 128.4 144.1 216.0 277.4 298.7 338.8 390.9
Chemicals (incl. petroleum) 217.3 262.9 332.2 486.8 473.8 592.6 709.5 895.1 1047.3 1535.2 1713.4
Machinery and transp. equip. 105.8 149.8 170.3 283.6 243.8 278.8 348.0 409.0 514.5 570.0 683.5
Other manufactures 385.4 433.7 686.5 661.5 714.0 827.2 951.1 1095.4 '286.2 1412.2 1796.S
Source: Central Bureau of Statistics, Statistical Abstract, various issues.
b
lb

Table 8.2: QUANTUM INDEX OF MANUFACTURING PRODUCTION(1982- 100)
j~~~~~~~~~~~~. I 19 86 Xt Z1 ; .19B* 0,9
1979 19C1 19$~~ 1982 1983 1984 1985' 1986' .1987. 1.988" 1~9W
Food Manufactring 97.9 107.6 96.9 100.0 105.8 113.6 120.2 128.3 139.8 148.4 151.5Beverages and Tobacco 101.8 104.5 106.0 100.0 99.2 104.2 111.8 128.4 150.3 156.1 157.8Textiles 113.7 120.3 126.8 100.0 109.6 124.3 130.1 139.2 143.7 147.2 151.0Clothing 60.3 70.9 97.8 100.0 104.7 95.1 90.7 91.3 92.6 94.8 97.5Leather and footwear 108.2 101.5 119.6 100.0 100.3 87.6 86.3 88.3 90.0 94.9 102.0Wood and corkproducts 98.6 102.4 95.1 100.0 83.1 69.4 50.3 50.9 51.6 50.3 51.6Furniture and fixtures 89.4 118.2 119.4 100.0 103.4 107.6 110.3 112.0 113.3 112.0 112.3Paper and paper products 109.4 109.5 94.9 100.0 90.7 96.0 103.0 110.0 119.0 132.6 136.3Printing and publishing 80.0 68.7 90.8 100.0 105.8 118.2 123.2 130.5 138.6 144.9 146.3Industrial chemicals 88.4 104.9 95.7 100.0 90.4 100.8 98.1 100.0 102.1 109.4 119.0Petroleum & other chemicals 72.8 104.2 110.6 100.0 104.9 130.7 137.2 148.9 162.0 183.0 211.3Rubber products 119.7 126.1 133.6 100.0 127.8 149.1 162.0 171.9 181.5 187.6 202.3Plastic products 120.1 126.8 107.9 100.0 107.8 113.7 120.9 125.6 129.6 123.8 133.8Pottery & glass products 136.0 159.7 109.2 100.0 119.4 155.5 159.3 159.6 160.7 168.9 186.3Non-metallic mineral products 92.6 101.4 100.2 100.0 98.0 86.9 97.8 108.3 114.4 112.8 117.9Metal products 151.2 145.1 132.6 100.0 109.2 100.2 106.3 117.0 130.3 149.2 173.3Non-electrical machinery 99.7 126.7 104.9 100.0 102.5 105.6 112.2 121.2 130.9 142.0 135.9Electrical machinery 109.2 113.0 102.1 100.0 98.9 105.4 110.6 116.6 120.5 135.5 138.7Transport equipment 83.0 85.1 101.8 100.0 116.8 100.1 87.2 76.7 70.7 79.1 82.4Miscellaneous manufactures 115.3 127.5 136.1 100.0 110.1 146.2 187.3 241.1 311.4 375.4 390.8
TotaMauf iu -9. 94,4 9?,8 10.Oi 104.5 108.8 113,9 120.6 127,4 135.0 143,0Growth rate (%) 7.6 5.3 3.6 2.2 4.5 4.1 4.6 5.9 5.7 6.0 5.9
Sourc: Central Bureau of Statistics, Economic Survey, various issues.

Table 8.3: MANUFACTURING EXPORTS - VALUE AND QUANTUM INDICES
Procossod food 23.8 28.8 41.0 30.9 36.0 44.0 40.1 38.4 42.6 48.1 65.8Beverage~s :td tobacco 1/ 1.2 2.3 1.4 1.6 3.0 2.4 6.4 9.8 6.4 5.7 7.2ChemliceIs 17.8 22.8 33.1 19.6 27.5 32.5 39.8 43.9 42.8 45.0 36.1Manufi igoods 23.7 28.1 26.1 33.1 34.3 33.5 34.2 28.0 29.5 44.1 84.3Machinrandtranap. eqlup. 2.2 3.0 3.1 2.1 2.5 3.2 3.5 6.4 7.0 7.9 9.3Misc. anunf.articles 9.4 13.2 12.2 13.0 13.4 16.6 25.9 36.0 29.7 39.0 17.4
Qaum Idcs(1982 = 100)Beverges and tobacco 1/ 54.7 135.2 81.4 100.0 155.0 105.0 231.0 340.0 235.0 180.0 186.0Chbemilas 144.0 127.0 125.0 100.0 92.0 94.0 106.0 95.0 99.0 88.0 108.0Manufactured goods 89.0 111.0 89.0 100.0 83.0 78.0 77.0 99.0 98.0 130.0 133.0Machinery and tranap. equip. 93.0 154.0 102.0 100.0 51.0 38.0 44.0 38.0 84.0 53.0 59.0Misc. mnuf.articles 94.0 120.0 108.0 100.0 76.0 82.0 104.0 144.0 107.0 122.0 130.0
Note: Excludes re.cpts
11 Excludes coffee and tea.
2/ Weighted 4ccording to the shares of 1982 export receipts which are:
Beverages & tobacco: 2.3%
Chemicals: 28.2% c
Manufactured goods: 47.7%X
Mach.and transp. equipment: 3.09G%
Misc. manufactured goods: 18.8%G .
3/ Excludes processed food as index is unavailble. 48
Source: Central Bureau of Statistics, Statistical Abstract and Economic Survey, various issues.
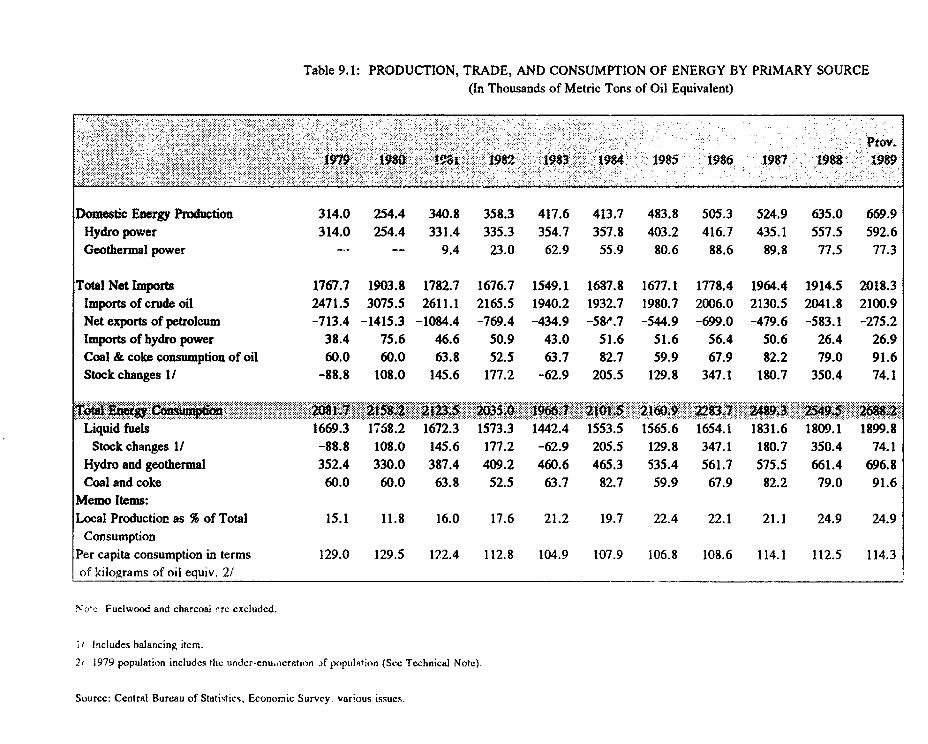
Table 9.1: PRODUCTION, TRADE, AND CONSUMPTION OF ENERGY BY PRIMARY SOURCE(In Thousands of Metric Tons of Oil Equivalent)
P~~~~~~~~~~~~~~~Pv
[~~~~~~ ........ 19.. :98 1. 19 .. 18 :9.: 1985 198 198 ' 9 ;-
Domestic Energy Prodwtion 314.0 254.4 340.8 358.3 417.6 413.7 483.8 505.3 524.9 635.0 669.9Hydro power 314.0 254.4 331.4 335.3 354.7 357.8 403.2 416.7 435.1 557.5 592.6Geothermal power - -- 9.4 23.0 62.9 55.9 80.6 88.6 89.8 77.5 77.3
Total Net Import 1767.7 1903.8 1782.7 1676.7 1549,1 1687.8 1677.1 1778.4 1964.4 1914.5 2018.3Imports of crude oil 2471.5 3075.5 2611.1 2165.5 1940.2 1932.7 1980.7 2006.0 2130.5 2041.8 2100.9Net exports of petroleum -713.4 -1415.3 -1084.4 -769.4 -434.9 -58 .7 -544.9 -699.0 -479.6 -583.1 -275.2Imports of hydro power 38.4 75.6 46.6 50.9 43.0 51.6 51.6 56.4 50.6 26.4 26.9Coal & coke consumption of oil 60.0 60.0 63.8 52.5 63.7 82.7 59.9 67.9 82.2 79.0 91.6Stock changes 1/ -88.8 108.0 145.6 177.2 -62.9 205.5 129.8 347.1 180.7 350.4 74.1
B i BBB 6 y B B . ... b ,f e.os .................. 4.s ' b §: o Y 'BBbs R i i.S >- | -B~~~~~~~~~~~~~~~~~~~~~~~~~~~~~. . . .. . . . . . .
Liquid fuels 1669.3 1758.2 1672.3 1573.3 1442.4 1553.5 1565.6 1654.1 1831.6 1809.1 1899.8Stock changes 1/ -88.8 108.0 145.6 177.2 -62.9 205.5 129.8 347.1 180.7 350.4 74.1
Hydro and geothermal 352.4 330.0 387.4 409.2 460.6 465.3 535.4 561.7 575.5 661.4 696.8Coal and coke 60.0 60.0 63.8 52.5 63.7 82.7 59.9 67.9 82.2 79.0 91.6
Memo Items:Local Production as % of Total 15.1 11.8 16.0 17.6 21.2 19.7 22.4 22.1 21.1 24.9 24.9
ConsumptionPer capita consumption in terms 129.0 129.5 122.4 112.8 104.9 107.9 106.8 108.6 114.1 112.5 114.3of kilograms of oil equiv. 2!
Note Fuclwood and charcoal rre cxcluded.
i Includes balancing itcm.2i 1979 population includes the under-enu,icration if population (Sec Technical Note).
Source: Central Bureau of Statistics, Economic Survey. various issuCs.
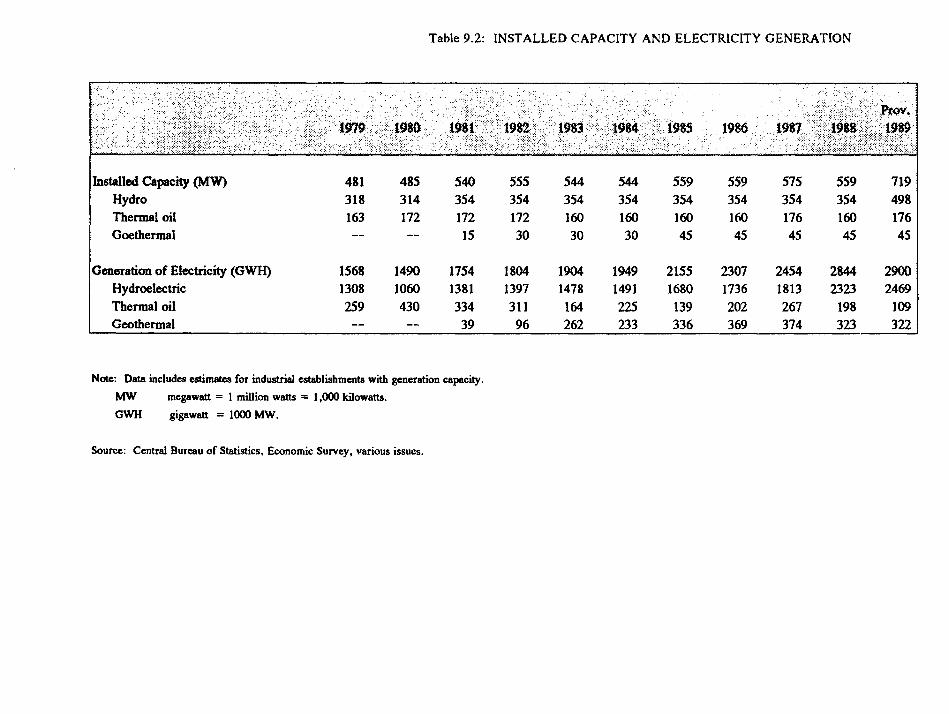
Table 9.2: INSTALLED CAPACITY AND ELECTRICITY GENERATION
.9, *. 1 1981 . 1982... 1983 : 1985 1986 1987 ........ - .- :
Installed Capacity (MW) 481 485 540 555 544 544 559 559 575 559 719
Hydro 318 314 354 354 354 354 354 354 354 354 498
Thermal oil 163 172 172 172 160 160 160 160 176 160 176
Goethermal -- -- 15 30 30 30 45 45 45 45 45
Generation of Electricity (GWH) 1568 1490 1754 1804 1904 1949 2155 2307 2454 2844 2900
Hydroelectric 1308 1060 1381 1397 1478 1491 1680 1736 1813 2323 2469
Thermal oil 259 430 334 311 164 225 139 202 267 198 109
Geothermal -- -- 39 96 262 233 336 369 374 323 322
Note: Data includes estimates for industrial establishments with generation capacity.
MW megawatt = I million watts = 1,000 kilowatts.
GWH gigawatt = 1000 MW.
Source: Central Bureau of Statistics, Economic Survey, various issues.

Table 9.3: ELECTRICITY TARIFFS BY TYPE OF CONSUMER(In Kenya Cents per Kilowatt Hour)
?4am CQumor o ;t~ D-; ; S198O 19S1 OSZ 19 S3 l94 1 995 19S6 1983 1498 1981
Small-scale consumers 51.2 53.6 53.3 53.5 71.2 81.7 88.1 91.5 101.5 114.1 118.2
Medium-scale consumers .. .. 46.1 48.0 64.4 74.9 81.8 88.3 96.9 110.9 116.6
Large-scale consumers 37.7 37.7 31.1 31.3 48.2 59.7 66.0 71.7 81.2 94.3 99.5
Off-peak 21.1 22.2 21.7 22.4 42.7 56.8 65.9 70.9 80.5 94.7 99.6
Public lighting 48.0 47.1 48.6 51.9 70.0 98.2 85.9 95.3 102.0 118.8 121.6
Note: 1986 data is for January to June only.Fiscal year ends June 30.
Source: Kenya Power and Lighting Company, Annual Reports - 1981,1985 and 1989.

Table 9.4: CRUDE OIL AND PETROLEUM PRODUCTS - DEMAND AND SUPPLY BALANCE
(In Thousands of Metric Tons)
DemadDomestic 1669.3 1768.2 1672.4 1573.3 1442.5 1553.5 1565.6 1654.1 1831.6 1809.1 1899.8
Motor spirits 302.0 300.8 298.5 269.3 256.4 257.7 267.8 295.1 321.8 325.0 376.7Jet/turbo fuel 330.1 347.9 343.5 281.8 250.1 259.4 261.0 263.4 249.5 254.6 274.3Light diesel 349.2 408.5 375.6 373.1 388.9 420.1 447.7 481.0 572.7 537.3 543.6Fuel oil 432.4 462.1 420.4 428.3 346.7 411.4 376.5 378.3 410.8 392.7 371.0Other 1/ 255.6 248.9 234.4 220.8 200.4 204.9 212.6 236.3 276.8 299.5 334.2
Exports 1036.9 1618.4 1185.8 883.1 648.8 702.4 611.9 815.8 578.8 697.3 187.6Petroleum fuels 1001.7 1581.8 1169.5 868.0 630.8 685.3 596.8 804.5 571.9 689.9 182.9Lubricating oils 33.9 35.5 15.8 14.7 17.1 16.7 14.8 11.0 6.5 6.9 4.5Lubricating greases 1.3 1.1 0.5 0.4 0.9 0.4 0.3 0.3 0.4 0.5 0.2
redhndz Tas; 1pl1y' :. g '>2706, 3 6 2 2 ) 4 20913 5.9 277 2469 2410.4 '5.4 2(87.4
Supply
Imports: 2807.8 3296.9 2746.8 2284.1 2158.6 2010.4 2067.7 2137.9 2271.1 2186.9 2169.4Crude oil 2471.5 3075.5 2611.1 2162.5 1940.2 1874.3 1980.7 2006.0 2130.5 2041.8 2100.9Petroleum fuels 288.3 166.5 85.1 101.6 195.9 100.6 51.9 105.4 92.3 106.8 55.9Lubricating oils 47.9 54.8 50.4 20.0 22.5 35.4 35.0 26.0 46.0 38.2 12.5Lubricating greases 0.1 0.1 0.2 - - 0.1 0.1 0.5 2.3 0.1 0.1
Adjustment 21 -101.6 89.7 111.4 172.3 -67.3 245.5 109.8 332.0 139.3 319.5 42.0
Memo Item:Net Imports 1770.9 1678.5 1561.0 1401.0 1509.8 1308.0 1455.8 1322.1 1692.3 1489.6 1981.8
a
I/ Includes refinery usage,liquefied petroleum gas,aviation spirit,illuminating kerosene and heavy diesel oil.2/ Adjustment for inventory changes,losscs in production and balancing item.
Source: Central Bureau of Statistics, Economic Survey, various issues.

Table 9.5: VALUE OF EXPORTS AND IMPORTS OF MINERAL FUELS(In Millions of Kenya Pounds)
.;' 1980 1981 1982 1983 1984 1985 1986 1987 1988 1989
Imports 147.9 325.1 348.0 334.5 333.5 335.8 379.1 243.4 287.1 258.2 303.4Crude petroleum 120.1 256.6 328.0 299.8 280.5 292.4 349.3 207.8 248.5 217.9 299.1Petroleum fuels 20.5 19.7 8.2 22.1 45.6 21.1 12.6 15.9 14.4 18.4 3.6Lubricating oils 5.1 0.9 11.7 5.8 7.3 12.5 13.4 9.6 15.4 12.8 0.5Lubricating greases 0.0 0.1 0.1 0.1 0.1 0.1 0.1 0.5 2.4 1.0 0.2Other 2.2 47.8 -0.0 6.7 0.1 9.6 3.7 9.6 6.4 8.1 -0.0
Exports 77.3 162.7 164.1 149.3 134.5 142.6 127.4 107.8 101.8 119.8 114.5Petroleum fuels 68.1 150.6 152.3 141.7 118.2 131.7 108.6 100.5 96.4 109.2 30.7Lubricating oils 8.3 10.0 5.5 7.1 9.7 9.5 9.1 7.0 4.9 5.4 3.7Lubricating greases 0.4 0.4 0.2 0.3 0.5 0.3 0.3 0.3 0.4 0.5 0.2Other 0.4 1.8 6.1 0.3 6.1 1.1 9.4 0.0 0.1 4.8 79.9
Source: CentralBureauofStatist.6 ics, Economic Survey,v0 ario3.6 3 ; !Source: Central Bureu of Stitics, Economic Survey, varous issues.

Table 9.6: WHOLESALE AND RETAIL PRICES OF PETROLEUM PRODUCTS
.~~~~~~~~~~ X
.~~~~~~~. ... '~~~~~~~~~~~~~~~~~~~~..S . ~ ~ ~ ~ ~ ~ .....
.'.. *~~~~~~~~~***x... ' .~.. ... ..
Wholesale (KSh/mt) 1/Liquefied petroleum gas 2060 6399 5893 6400 6400 6400 7820 11629Premium gasoline 1551 10869 9975 10868 11418 11831 13441 14156Regular gasoline 1468 10512 9734 10622 11051 11337 13551 14127Illuminating kerosene 736 4859 4012 4012 3993 4012 5033 6471Light diesel oil 892 6365 5525 5886 5886 6005 7227 8275Industrial diesel oil 471 4019 3136 3982 3982 3982 4668 6089Fuel oil 334 2408 2003 2408 2413 2408 3164 3838
Retail (KSh/liter)Premium/gasohol 2/ .. 8.6 8.0 8.6 9.0 9.3 10.5 11.0Regular gasoline .. 8.1 7.6 8.1 8.4 8.6 10.2 10.7Gas oil .. 5.9 5.3 5.6 5.6 5.7 6.8 7.7
1/ Prices include duty and iaes taxes.2/ Gasohol was introduced from 1983.
Source: Central Bureau of Sttistics, Economic Survey, vaious isues.

Table 10.1: TOURISM SECTOR - SELECTED INDICATORS
t~~~~~~~~17 190Z1 921V3'9418 9E 9718t1S
Receipts (KL millions) 62.0 82.5 90.0 118.0 122.0 151.7 197.0 248.0 292.1 349.0 432.0Receipts (US$ milliocs) 11 169.2 218.0 175.0 185.5 176.9 214.9 239.8 306.0 354.4 391.8 418.1
.,g.A. .. . , X.,.NjS .............. . ......... ,g.\ ,.......9,b ,,,,$.. #Purpose: Holiday 278.9 290.7 273.9 294.0 285.3 353.4 418.0 476.6 529.1 555.9 646.2
Business 51.6 48.9 48.u 47.9 45.0 56.5 59.5 65.7 66.1 69.5 52.9Trans:t 52.5 53.7 43.3 39.0 35.7 44.7 52.0 59.1 58.9 61.4 27.2Other 0.0 0.0 0.0 11.2 6.3 7.6 11.1 12.8 7.2 8.1 3.4
Average length of stay (days) 2/ 15.5 15.7 15.0 16.2 15.9 15.9 15.9 15.9 16.0 16.0 14.4
Hotel occupancy ('000/night) 4338.0 4717.3 4691.0 4628.5 4472.1 4684.3 4818.5 5010.0 5031.3 5134.5 5316.5Hotel occupancy rate (%) 53.9 56.7 55.0 51.4 48.6 50.9 53.4 53.5 53.1 52.9 55.2
Visitors to national parks('000) 565.8 655.7 730.1 968.0 957.9 1011.4 986.4 924.1 976.6 1063.3 1200.8
I/ Sec Statistical Appendix Table 3.2 for average exchange rate used.2V Excludes days stayed by arrivals categorized as "other".
Source: Central Bureau of Statistics, Economic Survey, various issues.
cn

Table 10.2: TRANSPORT AND COMMUNICATIONS SECTOR - SELECTED INDICATORS
(In Millions of Kenya Pounds0
Pt*v~
', 1; ,;00:j992,980 n0198102 *982 1983 1984 1985 1986 1987 19q i939
~ 46.6 ~2.$ $54. 634) 79.2 797.4 922113)
Road transport 77.7 138.5 141.5 172.3 172.2 196.1 225.6 288.1 311.7 355.2 369.6
Passenger 25.2 72.9 72.8 93.2 102.7 120.9 155.9 197.0 200.7 212.4 221.6
Freight 52.5 65.6 68.7 79.1 69.5 75.2 69.7 91.1 111.0 142.8 148.0
Railway transport 29.1 32.8 42.6 50.0 58.1 62.2 57.7 59.5 60.7 64.4 75.4
Passenger 2.2 3.1 4.2 4.4 5.1 4.5 4.8 5.7 6.3 7.0 8.1
Freight 26.9 29.7 38.4 45.6 53.0 57.7 52.9 53.8 54.4 57.4 67.3
Water transport 55.4 62.7 65.3 54.6 67.5 81.8 89.0 72.6 75.5 72.4 85.8
Air transport 40.0 41.6 39.9 48.4 69.1 73.8 86.8 102.2 131.3 155.0 192.6
Services incidental to transp. 40.8 31.2 37.5 40.3 42.5 36.4 33.8 39.0 45.6 55.2 52.8
Pipeline 11.2 18.6 18.5 20.1 19.1 21.0 23.5 26.5 26.8 27.7 30.7
Total - Transport Sector 254.2 325.4 345.3 385.7 428.5 471.3 516.4 587.9 651.6 729.9 806.9
Communications 47.6 57.5 63.5 74.9 84.0 82.9 114.6 141.3 145.8 182.3 206.1
Ai ~~~~~~~~~~~~~~~~~~~~~~~~~~~~~~~~~~~~~~~~~~~ 2..134.7 12 6.8.19.+^,*... ., ,; ....... 1. 14., , . , . o
Railway transport 26.5 30.3 40.0 44.2 51.6 60.5 55.5 55.9 55.6 60.4 74.2
Passenger 2.1 2.9 3.9 4.5 4.9 4.5 4.8 5.7 6.3 7.1 8.1
Freight 24.4 27.4 36.1 39.7 46.8 55.9 50.7 50.2 49.3 53.3 66.1
Air transport I/ .. .. .. . .. 54.0 65.0 78.9 96.9 10/.4 115.7
Passenger .. .. .. . .. 48.9 59.5 71.9 86.8 94.7 101.8
E Freight ..______________ .. . ..___ ~ 5.1 5.5 7.0 10.1 .7 14.0
1/ Domestic and intcrnational.
Source: Central Bureau of Statistics, Economic Survcy, various issues.
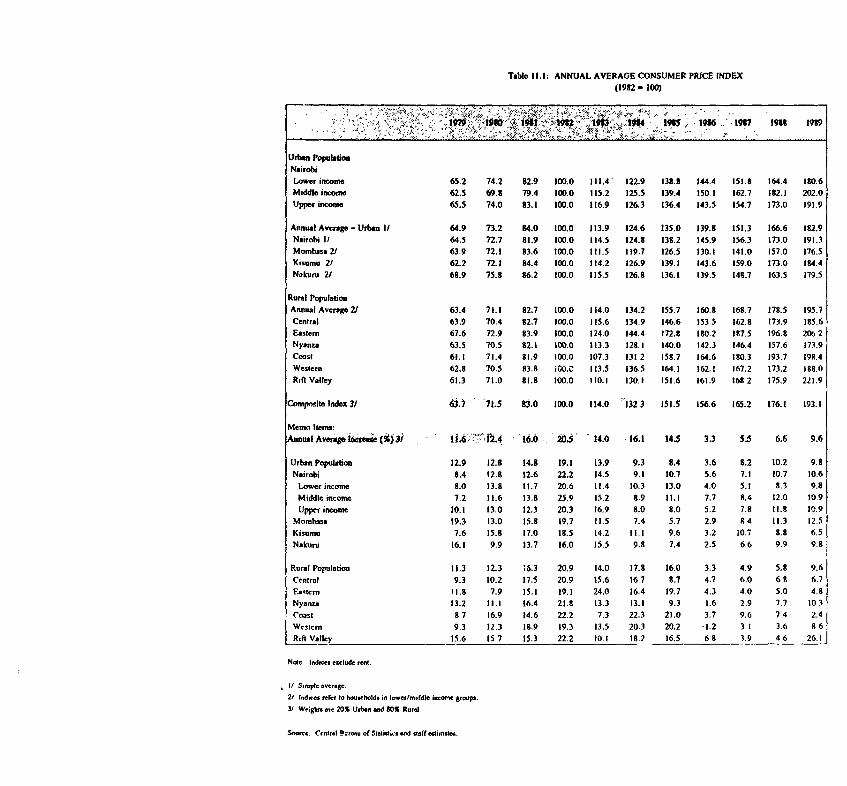
Table 11.1: ANNUAL AVERAGE CONSUMER PRICE INDEX(19t2- 100)
i979.J;*1.:5'I0>.i9Uy4~19U 19P 5~4 5985, 5956 1951 I59 I9o
Urtba PoptilatioNairobiLower incorne 65.2 74.2 82.9 100.0 111.4 122.9 138.8 144.4 151.t 164.4 180.6Middle income 62.5 69.S 79.4 100.0 115.2 125.5 139.4 150.1 162.7 12.1 202.0Upper income 65.5 74.0 83.1 100.0 116.9 126.3 136.4 143.5 154.7 173.0 191.9
Annual Avernge-Urbfan I 64.9 73.2 .4.0 100,0 113.9 124.6 135.0 139.8 151.3 166.6 12.9Nirfobi 11 64.5 72.7 81.9 100.0 114.5 124.3 138.2 145.9 156.3 173.0 191.3Mombasa 2/ 63.9 72.1 S3.6 100.0 111.5 119.7 126.5 130.1 141.0 157.0 176.5Kisumu 21 62.2 72.1 84.4 100.0 114.2 126.9 139.1 143.6 159.0 173.0 184.4Nakuru 2/ 68.9 75.8 86.2 100.0 115.5 126.8 136.1 139.5 148.7 163.5 179.5
Rural PopulationAnnual Averge 21 63.4 71.1 82.7 100.0 114.0 134.2 155.7 160.8 16S.7 178.5 195.7Central 63.9 70.4 82.7 100.0 115.6 134.9 146.6 153 S 162.8 173.9 285.6Eastern 67.6 72.9 83.9 100.0 124.0 144.4 172.8 180.2 187.5 196.8 206 2Nyanza 63.5 70.5 82.1 10D.0 113.3 128.1 140.0 142.3 146.4 157.6 173.9Coast 61.1 71.4 81.9 100.0 107.3 13112 158.7 164.6 180.3 193.7 192.4Western 62.8 70.5 83.8 i00.C 113.5 136.5 164.1 162.1 167.2 173.2 2S8.0Rft Valley 61.3 71.0 81.8 100.0 110.1 130.1 151.6 161.9 1682 175.9 221.9
Composite Index 3t 6 71.5 8i.0 100.0 114.0 1323 151.5 156.6 165.2 176.1 193.1
Memno Itenm:Annu2ilAveng1incnee(it)3i I .6<'Z"f..4 16.6 .20.5' 14.0 16.1 14.5 3.3 5.5 6.6 9.6
Urban Population 12.9 12.8 14.8 19.1 13.9 9.3 8.4 3.6 8.2 10.2 9.8Nairobi 8.4 12.8 12.6 22.2 14.5 9.1 10.7 5.6 7.1 10.7 10.6
L.ower income 8.0 13.8 11.7 20.6 11.4 10.3 13.0 4.0 5.l 8.3 9.8Middle incomne 7.2 11.6 13.8 25.9 15.2 8.9 22.2 7.7 8.4 12.0 10.9Upper income 10.1 13.0 12.3 20.3 16.9 8.0 8.0 5.2 7.8 11.8 10.9
Momba 19.3 13.0 15.8 19.7 11.5 7.4 5.7 2.9 84 11.3 12.5Kisumu 7.6 15.8 17.0 18.5 14.2 11.1 9.6 3.2 10.7 8.8 6.5Nakuru 16.1 9.9 13.7 16.0 15.5 9.8 7.4 2.5 6.6 9.9 9.8
Rural Population 11.3 12.3 i6.3 20.9 14.0 17.8 16.0 3.3 4.9 5.8 9.6Central 9.3 10.2 17.5 20.9 15.6 16.7 8.7 4.7 6.0 6 8 6.7Easlern I 1.8 7.9 15.1 19.1 24.0 16.4 19.7 4.3 4.0 5.0 4.8Nyanza 13.2 112. 16.4 21.8 13.3 13.1 9.3 1.6 2.9 7.7 1013Coast 8 7 16.9 14.6 22.2 7.3 22.3 21.0 3.7 9.6 7 4 2.4Western 9.3 12.3 18.9 19.3 13.5 20.3 20.2 -1.2 3.1 3.6 8 6
Rtli Valley 25.6 15.7 15.3 22.2 10.1 18.7 16.5 68 3.9 46 26.1
Nate Ind-, erlude rent.
If Sample averge.
2/ idieeda reer tio urhetda in lowe/middle iKIa groupA.
3/ Wesiah are 20% Urban amd 80% Rural
Sorer. Central PB-rea of Stafisti. amd staff csimae.

Table 11.2: NAIROBI CONSUMER PRICE INDICES
(1982= 100)
.~~~~~~~~~~~~~~~~~~~~~~~~~~~~~~~~~~~~~~~~~~~~~~~~~~~~~~~~~~~~~~~~~~~~~~~~~~~~~~~~~~~~~~~~~~~~~~~~~
~~4910 ~ ~ 1
.. ... . ....
64.4 1~~? ~1 I 1(J~O 1i4 5 124~~ 1312 146. ~6A 171.2,: 19'
LoweTricome 65.2 74.2 82.9 100.0 111.4 122.9 138.9 144.4 151.8 164.4 180.6
Middle icome 62.5 69.8 79.4 100.0 115.2 125.5 139.4 150.1 162.7 182.1 202.0
Upper income 65.5 74.0 83.1 100.0 116.9 126.3 136.3 143.5 154.7 173.0 191.8
Ave g~~~1 eas(%) $4 12$ 12.6~~' 22, ~45 9.0 :10.7 5.6 7.1 10.7 t0.6Lower income 8.0 13.8 11.7 20.6 11.4 10.3 13.0 4.0 5.1 8.3 9.8
Middle income 7.2 11.6 13.8 25.9 15.2 8.9 11.1 7.7 8.3 12.0 10.9
Upper income 10.1 13.0 12.3 20.3 16.9 8.0 8.0 5.3 7.8 11.8 10.9
Memo Items:December of each year
Average I11 63.1 71.0 85.9 100.0 110.0 120.7 133.0 139.1 151.2 164.6 186.2
Lower income 65.2 73.7 87.9 100.0 109.6 121.6 134.1 139.5 147.4 162.1 177.7
Middle income 60.8 67.7 84.5 100.0 110.1 122.2 136.1 144.0 158.5 166.4 197.6
Upper income 63.2 71.6 85.1 100.0 110.3 118.5 128.7 133.8 147.6 165.5 183.4
Average increase ()10.8 12.6 20.9 16.5 10.0 9.8 10.1 4.6 8.6 8.9 13.1
Lower income 9.1 13.1 19.3 13.7 9.6 10.9 10.4 4.0 5.6 10.0 9.7
Middle income 10.4 11.3 24.8 18.3 10.1 11.0 11.5 5.8 10.0 5.0 18.8
Upper income 12.8 13.3 18.9 17.5 10.3 7.5 8.6 4.0 10.3 12.1 10.8 c
t
Note: Indices include rent.
I/ Simnple average.
Source: Central Bureau of Statistics, Economic Survey, various issues.

Table 11.3: WAGE EARNINGS BY INDUSTRY AND SECTOR
ito <9i I9#0 I98t719*4 £9~ 19$6 1987 19t 1989
Agriculture and forestry 62.8 60.3 68.3 67.5 74.8 82.7 91.9 107.4 120.0 145.1 154.8 :Mining and quarrying 1.6 1.6 1.8 3.3 3.8 4.3 5.0 4.5 3.5 3.9 5.3Manufacturing 90.1 106.1 122.2 136.1 149.4 168.7 188.2 212.8 242.5 268.3 313.2Electricity and water 7.0 7.9 10.4 13.5 17.7 20.4 23.3 26.7 36.2 42.8 52.8Construction 36.0 37.5 44.5 43.7 47.5 43.5 47.5 49.6 55.6 65.7 83.0Trade,restaurantsandhotels 57.3 71.6 81.7 87.1 99.9 116.5 131.3 149.8 174.7 214.1 242.2Transport and communications 52.8 58.1 66.6 71.9 78.1 82.9 90.7 109.8 123.3 143.7 159.7Finance and business services 47.8 62.0 73.7 80.6 88.6 108.3 128.8 148.8 164.7 200.3 227.5Other services It 208.2 259.0 319.5 356.6 398.3 447.6 525.6 584.1 627.7 757.1 860.0
Private Sector 274.2 326.7 371.8 395.9 444.7 507.3 575.0 645.0 743.5 896.1 986.0Agriculture and forestry 34.0 37.0 41.3 41.6 47.5 54.4 61.6 72.0 82.6 94.7 102.3Mining and quarrying 0.7 0.6 0.6 0.8 0.9 1.2 1.6 1.3 2.3 2.4 3.6Manuf. turing 72.1 82.6 97.4 109.4 119.5 133.0 148.6 170.8 196.0 231.2 248.5Electricity and water 0.0 0.1 0.2 0.2 0.1 0.0 0.0 0.0 0.3 0.3 0.4Construction 18.7 22.5 26.5 23.3 25.1 23.4 24.1 23.8 27.5 35.4 42.1Trade,restaurantsandlhotels 53.9 67.0 75.5 79.2 91.2 107.6 121.8 139.1 159.1 197.2 222.6Transport and communications 20.9 22.5 21.4 25.4 28.3 29.2 32.8 33.9 37.7 46.0 48.6Finance and business services 36.9 47.6 55.4 60.0 66.3 77.6 89.8 96.0 107.3 132.5 151.7Other services 1/ 37.1 46.9 53.6 56.1 65.9 80.9 94.7 108.1 130.7 156.4 166.2
Public Sector 2/ 289.2 337.3 416.9 464.4 513.5 567.5 657.3 748.5 804.6 944.9 1112.5Memno Items:Av. Wage Earnings Per Employee 579.5 660.3 770.0 822.4 876.4 960.1 1049.3 1136.0 1215.1 1387.7 1544.2Public Sector 681.0 715.3 861.2 918.5 972.9 1048.1 1143.7 1235.6 1282.5 1441.7 1634.6Private Sector 500.8 611.7 688.2 732.5 786.4 877.7 958.8 1038.8 1149.7 1335.0 1453.4
Note: Wage ernings in miHions of Kenya Pounds.Aveng wge earaings per enployee in Kenya Pounds.
I/ Conmuaity,cil and penocal sev21 See Staistical Appcedix Table 5.8 for dais.
Soorce: C

Table 11.4: NOMINAL AND REAL WAGES
(Kenya Pounds per Year)
.'~ 10 :'1981, 9.82- :1983 1984 1985 1986 1987 1988 1989
MmetageNkamimalW.g - 7?945 66Q3- 770.9 822,4. 876A4 900.1 1049.3 1136.0 1215.1 1387.7 1544.2
Private sector 500.8 611.7 688.2 732.5 786.4 877.7 958.8 1038.8 1149.7 1335.0 1453.4
Public sector 681.0 715.3 861.2 918.5 972.9 1048.1 1143.7 1235.6 1282.5 1441.7 1634.6
Average Real Wage 370.3 373.7 378.1 338.6 315.4 317.2 312.5 321.9 322.2 328.2 332.5
Private sector 320.1 346.1 346.0 301.6 282.9 289.9 285.5 290.4 301.3 309.2 312.9
Public sector 435.1 404.9 433.0 387.1 350.1 345.3 340.6 354.4 343.6 346.9 352.0
Memo Items:Percent change in
Consumer prices 1/ 8.4 12.8 12.6 22.2 14.5 9.1 10.7 5.6 7.1 10.7 10.6
Real average earnings 0.9 0.9 1.2 -10.4 -6.9 0.6 -1.5 3.0 0.1 1.9 1.3
11 Composite index of Nairobi lower, middle and upper income indices calculated as an
average of the indices for all 12 months.
Source: Central Bureau of Statistics, Economic Survey, various issues.
C)

TECHNICAL NOTES
Qerview
1. The data in the Statistical Appendix is mainly in calendar year with coverage from 1979 to1989 (exceptions are Tables 2.8, 5.1 to 5.6, 7.5, 7.7, 9.3 and 9.6). Main sources of data are thefollowing two publications of Central Bureau of Statistics (CBS): Economic Survey and StatisticalAbstract, supplemented by International Monetary Fund (IMF), International Financial Statistics(IFS); World Bank, Debtor Reporting System (DRS); National Cereals and Produce Board (NCPB);Ministry of Supply and Marketing; T.-a Board of Kenya; Coffee Board of Kenya; Kenya Power andLighting Co. and staff of both CBS and Research Department of Central Bank of Kenya.
2. In compiling the series, the conventions followed are:
(a) Use of the most recent publications to obtain and/or revise all data;(b) Use of a single source (whenever possible) for data on the same subject.
3. The Government of Kenya (GOK) has detailed the methodology for compiling data for:
(i) Value added by industrial origin;(ii) Public consumption;(iii) Gross capital formation; and(iv) External accounts, in the 1977 CBS publication, Sources and Methods Used for the
National Accounts of Kenya.
4. Later, CBS reviewed the economic concepts, sources of informaticn used and mode ofpresentation of statistics in the Economic Survey and Statistical Abstract. The review has beencompleted for public finance and balance of payments data. Some of the recommendations have beenintroduced and revisions were made to the data from 1981 onwards. The details of these revisionsare documented and published in the 1987 edition of the Economic Survey.
5. Indices and constant prices are reported with 1982 as base year while values are given inKenya pounds. Selected values shown in US dollars were converted from local currency using theaverage exchange rate provided (and used) by the officials at the Central Bank of Kenya (see rates inTable 3.2). These rates may slightly differ from those in IFS due to different treatment of weekendsin the calculations.
Population and Emnplovment
Tables 1.1 and 1.2
6. Demographic analysis and internal consistency checks revealed that the 1979 population censushad an under-enumeration of population estimated at 814,000 persons who are included in the 1979total population figure reported in Table 1.1. This under-enumeration of 1979 population is notdisaggregated by sex and age, therefore the working age population (Table 1.1) as well as thedecomposition of population by sex (Table 1.2) exclude this group.

166 Statistical Appendix
7. The population projections assume a decline in both fertility and mortality over the period.The fertility rate is assumed to fall from 7.887 in 1979 to about 5.5 by the end of the century.Mortality projections are based on 1980 estimates of life expectancy of 54.1 years for males and 56.9years for females, and an infant mortality rate of 92 deaths per 1,000 live births. By 2000, the lifeexpectancy of males is projected to be 58.8 years and 61.5 for females, while the infant mortalityrate is expected to be 60 deaths per 1,000 live births. Life expectancy indicates the number of yearsa newborn infant would live if patterns of mortality prevailing (for all people) at the time of birthwere to remain the same throughout the infant's life. Infant mortality rate is the number of infantswho die before reaching one year of age, per thousand live births in a given year.
Tabk 1.3
8 Wage employees include casual employees, part-time workers, directors and partners servingon a regular basis salary contract. Self-employed persons, employees in small scale enterprises andfamily workers who do not receive regular wages or salaries are listed separately.
National Accounts
9. The accounts cover production of all enterprise activities in the monetary economy as well asproduction in the non-monetary economy if the activity corresponds to one undertaken commerciallyin the monetary economy. The non-monetary economy is one in which, even though a proportion ofinputs are purchased from the monetary economy, the output is not sold using money as a medium ofexchange. The bei,chmark data for the non-monetary economy was 1972 and since then, a grossing-up factor is used to obtain annual sectoral estimates. In editions of the Economic Survey publishedbefore 1987, the non-monetary economy was called the traditional economy. Gross DomesticProduct (GDP) by industrial origin is measured at factor cost while GDP by expenditure is calculatedat market prices.
Tables 2.1, 2.2 & 2.7
10. The aggregation of non-monetary and monetary economy is as follows:
Amriculture - Agriculture, Forestry and Fishing.
Industry - Mining and Quarrying; Manufacturing; Building and Construction; WaterCollection; Electricity and 'Water.
Services - Trade, Restaurants and Hotels; Transport, Storage and Communication; Finance andBusiness Services; Ownership of Dwellings; Domestic Services; Government Services; OtherServices; and Imputed Bank Service Charges.
Value added in tourism is captured in several sectors, for example, in Trade, Restaurants andHotels; and in Other Services.
Tables 2.3 & 2.4
1 1. The statistical discrepancy arises when the components of Gross Domestic Product areestimated independently by industrial origin and by expenditure categories.

Tabk 2.4
12. Capecity to Import is defined as the current price value of exports of goods and nonfactorservices deflated by the import price index. Terms of Trade Adjustment is capacity to import lessactual exports of goods and nonfactor services in constant prices. Gross Domestic Income is GDPplus Terms of Trade Adjustment. Gross National Income is Gross Domestic Income plus Net FactorIncome.
Tabes 2.5 & 2.6
13. The aggregation of gross fixed capital formation is as follows:
Aericulture - Agriculture and Forestry
Industry - Mining and Quarrying; Manufacturing; Electricity and Water; Construction.
Services - Trade, Restaurants and Hotels; Transport and Communication; Finance and BusinessServices; Ownership of Dwellings; Government Services; and Other Services.
Tabk 2.7
14. Deflators are constructed at the detailed subsectoral level ,n the Central Bureau of Statistics,except for Finance and Private Consumption which are implicit d-,flators.
Tabk 2.8
15. Data coverage is from 1977 to 1989. The moving average Incremental Capital-Output Ratio(ICOR) in year t is defined as follows:
3-Year Moving Average ICORl = 1/3 (ICOR,, + ICOR, + ICOR,+,)
5-Year Moving Average ICOR, = 1/5 (ICOR,2 + ICORI + ICOR, + ICOR,+, + ICORT+2
Balance of Payments
Tabks 3.1 & .2
16. Merchandise imports data for years prior to 1981 are reported only at c.i.f. values. In thesecases, an estimate of 86.2% of this value is used as the f.o.b. value.
Table 3.3
17. Horticulture includes flowers, fruits, spice. and vegetables.
Tabes 3.3 & 3.4
18. Data excludes gold and curre-ncy but includes re-exports.
Table 3.10
19. Totals for nonfactor services are derived residually.
*~ r et;41
168 Statistical Appendix
External Debt
Tabls 4.1 to 4.3
20. Data is from the World Bank, DRS which collects external debt data from member countries.Debt outstanding includes principal in arrears. Interest in arrears is included in short term debt.
Tabk 4.4
21. Net use of Fund credit does not equal purchases minus repurchases since all purchases do notconstitute a use of Fund credit.
Public Finance
22. ihe public finance data are on a fiscal year basis. Fiscal accounts presented by the IMF maydiffer from the official accounts shown here due mainly to adjustments made in their data to reflectunpresented checks.
Tabls 5.1 & 5.3
23. Data coverage is for the period 1978/79 to 1989/90 (where 1978/79 fiscal year begins on July1, 1978 and ends on June 30, 1979) and pertains to Central Government only.
Tabk 5.2
24. The statistical discrepancy line is introduced to impose consistency with total revenue data inTable 5.1.
Tables 5.4 & 5.5
25. Data coverage is for the period 1984/85 to 1989/90.
Tabk 5.6
26. Fiscal year data is from 1985/86 to 1989/90. Prior to 1985/86, data was reported in calendaryear only. Calendar year data is given here for 1979 to 1984.
Tabkl 5.7
27. The statistical discrepancy line is introduced to impose consistency with the relevant totals inthe National Accounts.
Monetard Statistics
Tabk 6.1
28. Money comprises the economy's means of payment and includes currency outside banks anddemand deposits (including call and 7 day deposits). This differs from the definition used by IMF.Quasimoney comprises time and savings depoFits. Time deposits bear interest and cannot be
withdrawn instantly without penalty or loss of interest earnings. Savings deposits earn interest andcan readily be exchanged for money.
Tabk 6.2
29. Table shows the change in year end values. Data for 1978 is obtained from the 1983Economic Survey.
Tabk 6.3
30. The statistical discrepancy line is introduced to maintain the identity: Assets = Liabilities
Tabk 6.4
31. These nominal interest rates are representative of the rates paid by financial institutions inKenya to holders of their quasi-monetary liabilities (i.e. deposit rates) and charged by theseinstitutions on loans to prime customers (i.e. lending rates). As of 4/90, interest on loans andadvances greater than 3 years is 19%.
Otber Sectors
Tabk 10.1
32. Studznts comprise the major part of visitors categorized as Other.
Prices and Wages, n.e.i.
Tabk 11.1
33. Calculations of Nairobi consumer price indices use the following income groups:
Lower - Households with monthly earnings below KSh 699.Middle - Households with monthly earnings between KSh 700 and KSh 2,499.Upper - Households with monthly earnings of KSh 2,500 and above.
Tabk 11.3
34. See Statistical Appendix Table 1.3 for the pertinent employment data.
Tabk 11.4
35. See Statistical Appendix Table 11.2 for the relevant price index.

S U D A N .
,_ 2 tX !~~~~~~~~\ArE
// \ti. /' .5^i'KENYA
j/ ,'N. N T H I
0E T H I P I AN-
7 Frr rF. - GO V s,
}~~~~~~~~~~~ ' E 'A^, r - , rAj
F Erp sc l' f 0 k-- i S
9 /g \>~~~~"' CLA -¶. :'........ "'ZF;A
2 /E '~... I -T E A 5 R N
AUEA G NF-
V?1 L L E Y . (>
Ktb~~~~~~~~~ ~~INDIAN0 44 l \ J f r J 0/R T OCEA SO" M
N. 0 o,oo~~~oo,oj copaCO
/Cb t I N, OMOBSA -T-k
*4 00' 00" s' 00 4 4 . ) ^ t -d'. 9 i
< ,'vA20t XAAR4f5A@-9w7Bl K,hi t | \,~~~~~~~~~~~~~~Dhiktb..-;
Eu! | <.T., I *AN '''EEr Km
\-' f 8 A M A"'48{ 5 h . \~~~~~~~~~~~~~O 1