Unit III: Population and Social Geography Factors influencing ...
35
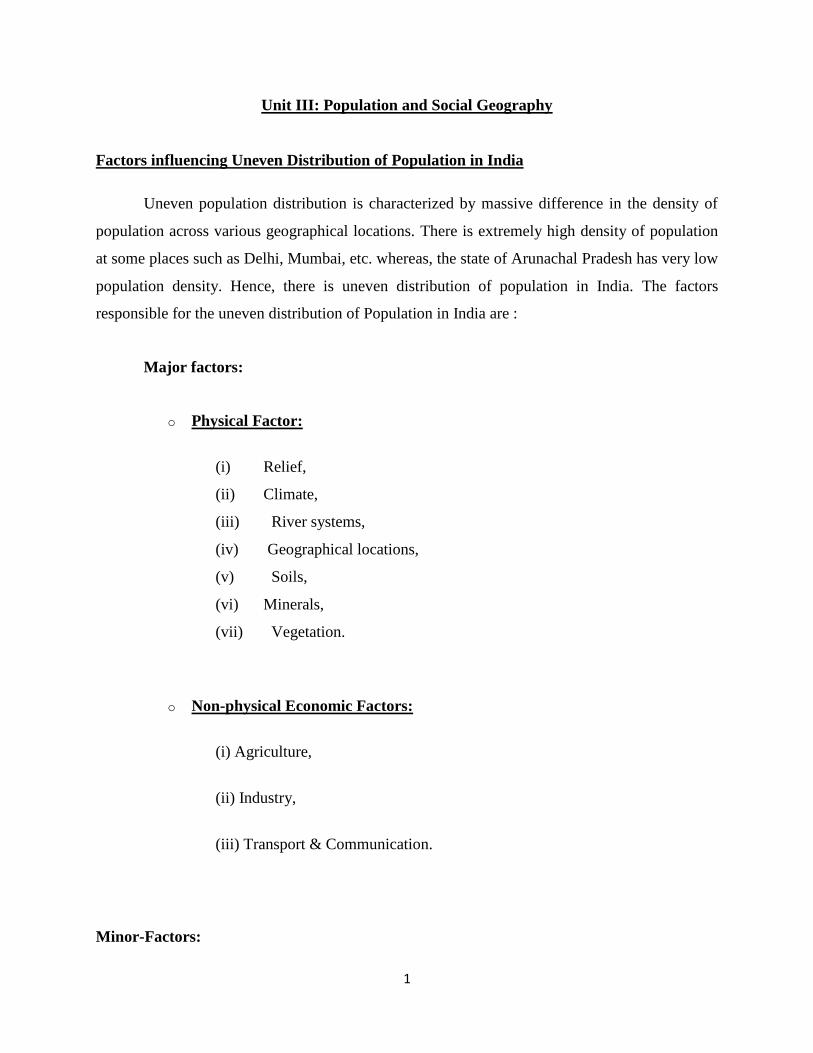
1 Unit III: Population and Social Geography Factors influencing Uneven Distribution of Population in India Uneven population distribution is characterized by massive difference in the density of population across various geographical locations. There is extremely high density of population at some places such as Delhi, Mumbai, etc. whereas, the state of Arunachal Pradesh has very low population density. Hence, there is uneven distribution of population in India. The factors responsible for the uneven distribution of Population in India are : Major factors: o Physical Factor: (i) Relief, (ii) Climate, (iii) River systems, (iv) Geographical locations, (v) Soils, (vi) Minerals, (vii) Vegetation. o Non-physical Economic Factors: (i) Agriculture, (ii) Industry, (iii) Transport & Communication. Minor-Factors:
-
Upload
khangminh22 -
Category
Documents
-
view
0 -
download
0
Transcript of Unit III: Population and Social Geography Factors influencing ...
1
Unit III: Population and Social Geography
Factors influencing Uneven Distribution of Population in India
Uneven population distribution is characterized by massive difference in the density of
population across various geographical locations. There is extremely high density of population
at some places such as Delhi, Mumbai, etc. whereas, the state of Arunachal Pradesh has very low
population density. Hence, there is uneven distribution of population in India. The factors
responsible for the uneven distribution of Population in India are :
Major factors:
o Physical Factor:
(i) Relief,
(ii) Climate,
(iii) River systems,
(iv) Geographical locations,
(v) Soils,
(vi) Minerals,
(vii) Vegetation.
o Non-physical Economic Factors:
(i) Agriculture,
(ii) Industry,
(iii) Transport & Communication.
Minor-Factors:
2
(i) Government policies,
(ii) (ii) Historical factors,
(iii) (iii) Religion factors,
(iv) (iv) Political factors.
Physical Factors :
Relief: Mountains have rugged surface and are covered with thick forest along with harsh
climate are not at all suitable for human habitation. Himalayas are sparsely populated
while, Great Northern plains providing with suitable climate, level land, fertile soil along with
knit transport system, is densely populated.
Climate: Climate of a region is existing pressure upon the human settlement. Western part of
Rajasthan is sparsely populated because of extreme climatic condition. The Range of
Temperature is very high and rainfall is low here. So it is not suitable for human habitation. Just
like the desert region, mountainous regions are also not densely populated because of too much
cold climate.
River-Systems: Rivers are providing with drinking water, water for irrigation, industrial water,
helping navigation, producing hydro-power and making land fertile by depositing silt. So the
river valley of the world is densely populated. Several populated cities such as Patna, Kanpur,
New-Delhi, Kolkata, etc are settled at river banks.
Geographical location: Geographical locations that favors development of modern
infrastructures attracts more population. Srinagar Valley, Delhi, Pune, Nasik all are well-
connected by means of roadways or railways. This central location made them populous.
Soils: Since, India is primarily an agricultural country, fertile soil with favorable climate
attracts a large number of populations. River valleys which are filled with fertile soils are densely
populated.
3
Minerals: Minerals can exercise a considerable impact upon population distribution provided
they are exploited. Because of earning facility, a large number of people flock together in and
around the mining region. Thus, the Chotonagpur plateau, the Karnataka plateau, etc. are densely
populated.
Vegetations: Human settlements respond differently to the varieties of natural vegetation—
forests, grasslands, marshes and shrubs. Sheep rearing is profitable to the people of high land
covered with grass. Whereas people of coniferous forests are engaged in collecting logs from the
forests, because these logs are used as raw materials in paper and paper-pulp, rayon, newsprint,
plywood and packing box industries. Hence, there is an employment facilities here.
Non-physical/Economic factors:
Agriculture: Most of the people of India are engaged in agriculture. Agriculture is directly or
indirectly attracting a large number of people. Areas haying fertile soils with irrigation facilities
are densely populated. Agro-based industries are also providing employment facilities to a large
number of people.
Industries: Industries are providing better economic support for the Indian masses. Big towns
like Delhi, Hyderabad, Kolkata, Bangalore, Madras, Kanpur, Ahmedabad, and Mumbai are
providing employment facilities to a large number of people as they are industrially developed
and well-connected by means of roadways and railways.
Well-developed Transport System: The regions which are well-connected by means of
roadways, railways, waterways are densely populated. Transport system has a remarkable impact
upon population movement and distribution.
Minor-Factors:
Government Policies: Well-planned Government policy can attract large number of people in a
particular region. Facilities provided by the Government can attract a huge population to a
region.
4
Historical factors: Historical factors are also responsible for the concentration population in a
region. After partition of India, huge number of people settled in West Bengal.
Religious factors: Religious places like Varanasi, Madura, Mathura, Nabadwip, Puri are densely
populated because throughout the ages they are attracting a large number of population.
Political factors: Political factors are also determining the density of population in a particular
region. After the shifting of India’s capital from Kolkata to Delhi people from different parts of
India have settled here.
Components of population change:
Birth Rate
Social scientists who study Population trend have some key terms, though. First, the fertility
rate in a country refers simply to the number of children born. This is different from
the fecundity rate, which is the number of children who could be born in a given society. Birth
rates vary by society for a number of reasons, including personal choice and social and political
factors. Factors such as poverty level, access to contraception, maternal and infant care, and
availability of nutrition all impact the birth rate in a society.
Death Rate
Scientists refer to this as the mortality rate, which is simply the number of deaths that occur in a
society. This is usually calculated by looking at the number of deaths per 1,000 individuals. Just
like birth rate, the death rate in a country depends on things such as availability of quality
medical care, disease, war, or famine.
Migration
Migration refers to movement; it's the flow or circulation of people in societies. There are two
kinds of migration: emigration and immigration.
- Emigration means to leave one's own place for another.
5
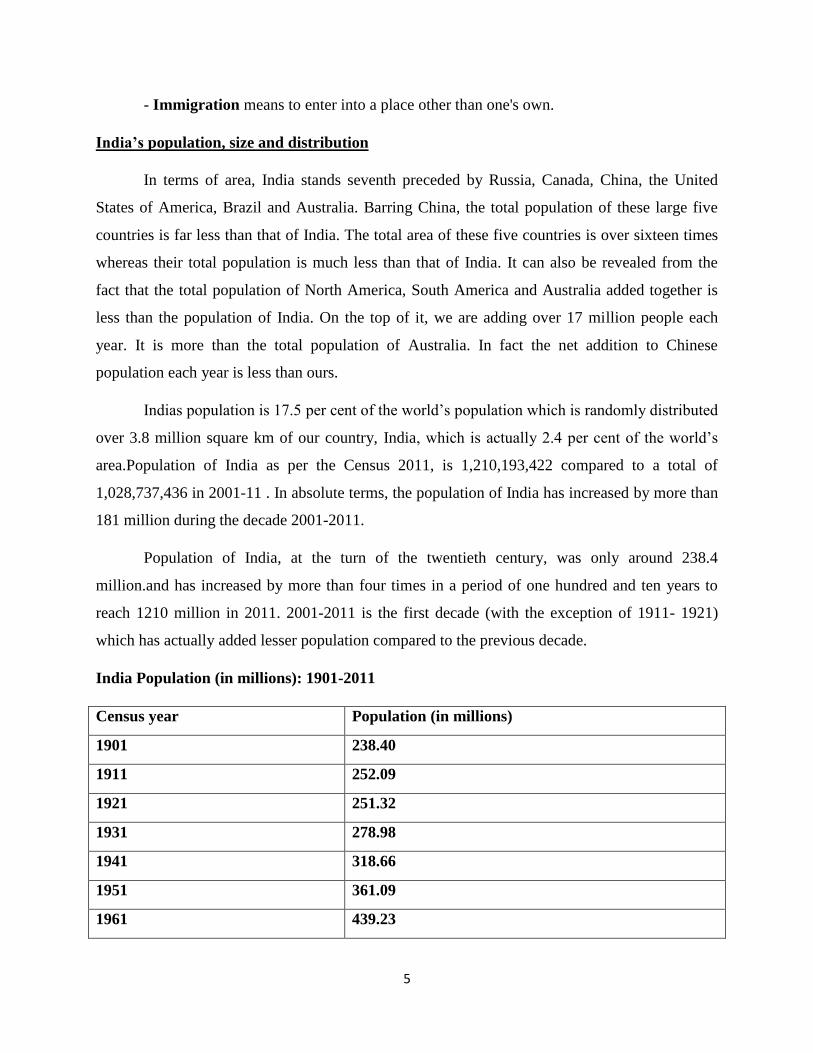
- Immigration means to enter into a place other than one's own.
India’s population, size and distribution
In terms of area, India stands seventh preceded by Russia, Canada, China, the United
States of America, Brazil and Australia. Barring China, the total population of these large five
countries is far less than that of India. The total area of these five countries is over sixteen times
whereas their total population is much less than that of India. It can also be revealed from the
fact that the total population of North America, South America and Australia added together is
less than the population of India. On the top of it, we are adding over 17 million people each
year. It is more than the total population of Australia. In fact the net addition to Chinese
population each year is less than ours.
Indias population is 17.5 per cent of the world’s population which is randomly distributed
over 3.8 million square km of our country, India, which is actually 2.4 per cent of the world’s
area.Population of India as per the Census 2011, is 1,210,193,422 compared to a total of
1,028,737,436 in 2001-11 . In absolute terms, the population of India has increased by more than
181 million during the decade 2001-2011.
Population of India, at the turn of the twentieth century, was only around 238.4
million.and has increased by more than four times in a period of one hundred and ten years to
reach 1210 million in 2011. 2001-2011 is the first decade (with the exception of 1911- 1921)
which has actually added lesser population compared to the previous decade.
India Population (in millions): 1901-2011
Census year Population (in millions)
1901 238.40
1911 252.09
1921 251.32
1931 278.98
1941 318.66
1951 361.09
1961 439.23
6
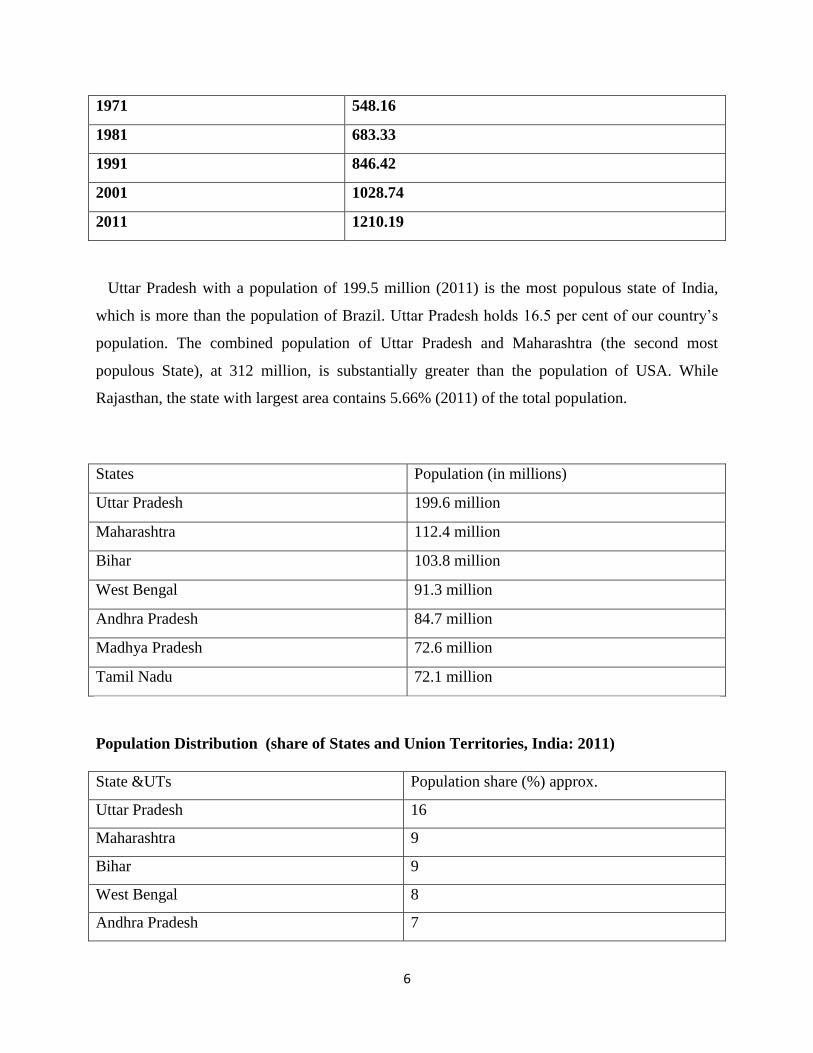
1971 548.16
1981 683.33
1991 846.42
2001 1028.74
2011 1210.19
Uttar Pradesh with a population of 199.5 million (2011) is the most populous state of India,
which is more than the population of Brazil. Uttar Pradesh holds 16.5 per cent of our country’s
population. The combined population of Uttar Pradesh and Maharashtra (the second most
populous State), at 312 million, is substantially greater than the population of USA. While
Rajasthan, the state with largest area contains 5.66% (2011) of the total population.
States Population (in millions)
Uttar Pradesh 199.6 million
Maharashtra 112.4 million
Bihar 103.8 million
West Bengal 91.3 million
Andhra Pradesh 84.7 million
Madhya Pradesh 72.6 million
Tamil Nadu 72.1 million
Population Distribution (share of States and Union Territories, India: 2011)
State &UTs Population share (%) approx.
Uttar Pradesh 16
Maharashtra 9
Bihar 9
West Bengal 8
Andhra Pradesh 7
7
Madhya Pradesh 6
Tamil Nadu 6
Rajasthan 6
Karnataka 5
Gujarat 5
Orissa 3
Kerala 3
Jharkhand 3
Assam 3
Punjab 2
Chhattisgarh 2
Haryana 2
Delhi 1
Jammu & Kashmir 1
Uttarakhand 1
Other States & UTs 2
Population Growth:
The increase in the number of people living in a country/region during a specified time
period is known as population growth. Population growth is the change in population over time
and can be quantified as the change in number of individuals in a population per unit time. The
term population growth can technically refer to any species, but almost always refer to humans.
Population growth may be expressed in terms of :
i. Absolute number
ii. Percentage increase per year
8
The growth of population in India can be divided into four phases as under:
1. Phase of Stagnant Population: 1901-21:
During this period, population increased by 1.29 crore only. If we were to break this
period in accordance with the two censuses, we find that during 1901-11, the decadal growth rate
was only 5.75 per cent, as the natural growth rate of population was low.
But in the next decade (1910-21), the growth rate of population declined to (-) 0.3 per
cent. This was due to high death rate (47.2) on account of famines and epidemics like plague,
cholera and malaria which took a heavy toll of human lives. The year 1921 is, therefore, known
as the year of Great Divide.
2. Phase of Steady Population Growth: 1921-51:
From 1921 onwards till 1951 there was a steady growth of population. During these
years, population increased by 2.8 crore in 1931, to 4 crore in 1941 and to 5 crore in 1951. But
the decadal growth rate in 1951 census was 0.9 percentage less than in the 1941 census due to
the Partition of India in 1947.
The main reason for the steady increase in population was the decline in death rate from
36.3 to 27.4 and of birth rate from 46.4 to 39.9 over the period. This resulted in an average
natural growth rate of 12.2 during this phase of 30 years.
3. Phase of Rapid Population Growth or of Population Explosion: 1951-81:
This was the period of rapid population growth when population increased by 32.5 crore
as against about 12 crore during the last 50 years from 1901 to 1951. The average annual growth
rate of population increased from 1.25 per cent to 2.2 per cent in 1981. The main reason was a
large decline in the death rate from 22.8 to 15 due to better medical facilities while the birth rate
fell slowly from 41.7 to 37.2 over the period. This led to population explosion in the country.
4. Phase of High Growth with Declining Trend: 1981-2001:
During this phase, a definite declining trend of population growth is visible. Total
population increased by 34.37 crore during 20 years. But the average annual growth rate had
9
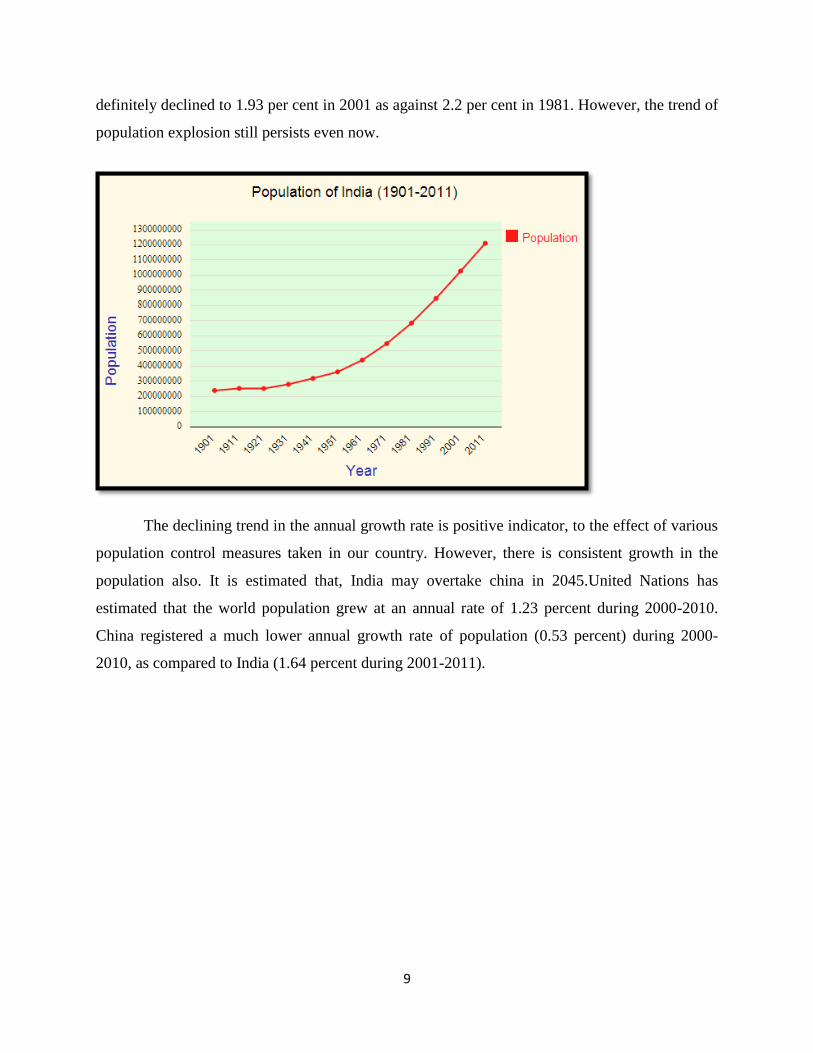
definitely declined to 1.93 per cent in 2001 as against 2.2 per cent in 1981. However, the trend of
population explosion still persists even now.
The declining trend in the annual growth rate is positive indicator, to the effect of various
population control measures taken in our country. However, there is consistent growth in the
population also. It is estimated that, India may overtake china in 2045.United Nations has
estimated that the world population grew at an annual rate of 1.23 percent during 2000-2010.
China registered a much lower annual growth rate of population (0.53 percent) during 2000-
2010, as compared to India (1.64 percent during 2001-2011).
10
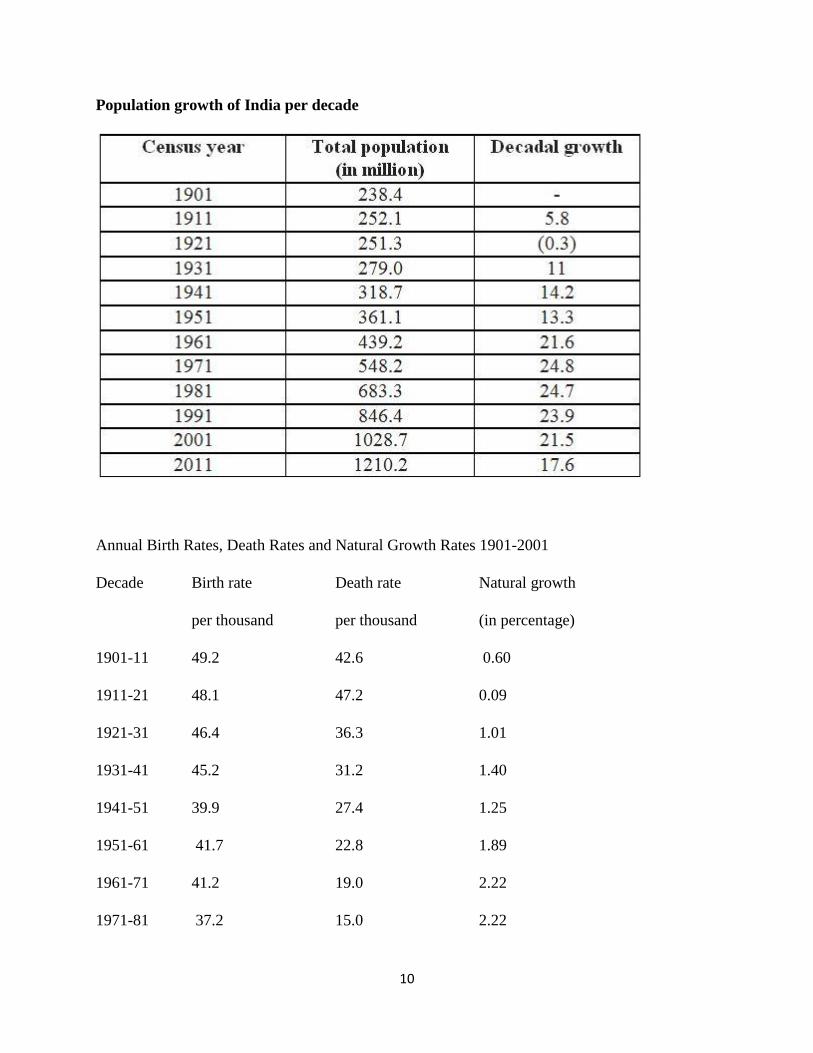
Population growth of India per decade
Annual Birth Rates, Death Rates and Natural Growth Rates 1901-2001
Decade Birth rate Death rate Natural growth
per thousand per thousand (in percentage)
1901-11 49.2 42.6 0.60
1911-21 48.1 47.2 0.09
1921-31 46.4 36.3 1.01
1931-41 45.2 31.2 1.40
1941-51 39.9 27.4 1.25
1951-61 41.7 22.8 1.89
1961-71 41.2 19.0 2.22
1971-81 37.2 15.0 2.22
11
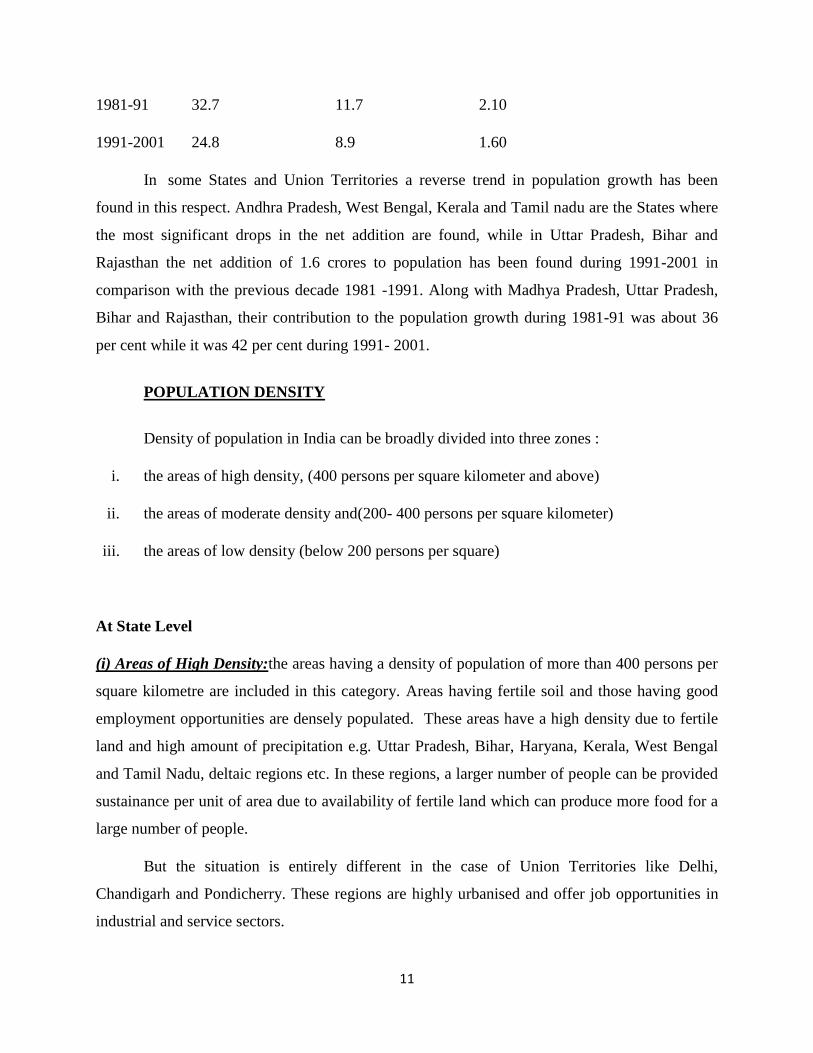
1981-91 32.7 11.7 2.10
1991-2001 24.8 8.9 1.60
In some States and Union Territories a reverse trend in population growth has been
found in this respect. Andhra Pradesh, West Bengal, Kerala and Tamil nadu are the States where
the most significant drops in the net addition are found, while in Uttar Pradesh, Bihar and
Rajasthan the net addition of 1.6 crores to population has been found during 1991-2001 in
comparison with the previous decade 1981 -1991. Along with Madhya Pradesh, Uttar Pradesh,
Bihar and Rajasthan, their contribution to the population growth during 1981-91 was about 36
per cent while it was 42 per cent during 1991- 2001.
POPULATION DENSITY
Density of population in India can be broadly divided into three zones :
i. the areas of high density, (400 persons per square kilometer and above)
ii. the areas of moderate density and(200- 400 persons per square kilometer)
iii. the areas of low density (below 200 persons per square)
At State Level
(i) Areas of High Density:the areas having a density of population of more than 400 persons per
square kilometre are included in this category. Areas having fertile soil and those having good
employment opportunities are densely populated. These areas have a high density due to fertile
land and high amount of precipitation e.g. Uttar Pradesh, Bihar, Haryana, Kerala, West Bengal
and Tamil Nadu, deltaic regions etc. In these regions, a larger number of people can be provided
sustainance per unit of area due to availability of fertile land which can produce more food for a
large number of people.
But the situation is entirely different in the case of Union Territories like Delhi,
Chandigarh and Pondicherry. These regions are highly urbanised and offer job opportunities in
industrial and service sectors.
12
(ii) Areas of Moderate Density States and Union Territories in which the density of population
ranges between 200 and 400 persons per square kilometre are called areas of moderate density of
population. They are Andhra Pradesh, Karnataka, Madhya Pradesh, Maharashtra, Gujarat, Orisa,
Rajasthan, Assam, Dadra & Nagar Haveli, Goa, Tripura. Moderate density of population is
characterised by the areas in which the agriculture is handicapped by rugged topography, lower
amount of precipitation and paucity of water for irrigation. The scope for developing primary
and secondary activities is quite large if the facilities are provided in this area. For example, at
the time of independence Chhotanagpur region was a sparsely populated area but development in
the field of mining and industries in this part of the country has been mainly responsible for
moderate density of population in this region.
(iii) Areas of Low Density All the remaining parts of India having a density of population less
than 200 persons per square kilometre may be classified under this category. The States and
Union Territories falling under this category include Arunachal Pradesh, Mizoram, Sikkim and
Andaman and Nicobar Islands. Low density population areas are characterised by rough terrain,
low rainfall or unhealthy climate. Agriculture cannot be developed in too dry or cold areas.
Difficulties exist not only in transport and communication in the hilly and mountainous areas but
also in the over all levels of economic development. That is why the density of population in all
these areas is low.
Top ten most densely populated states of India
Sl. No. States Population Density per square km
1 Bihar 1,102.4
2 West Bengal 1,029.2
3 Kerala 859.1
4 Uttar Pradesh 689
5 Haryana 573.4
6 Tamil Nadu 554.7
7 Punjab 550.1
8 Jharkhand 441.5
9 Assam 396.8
10 Goa 393.8
13
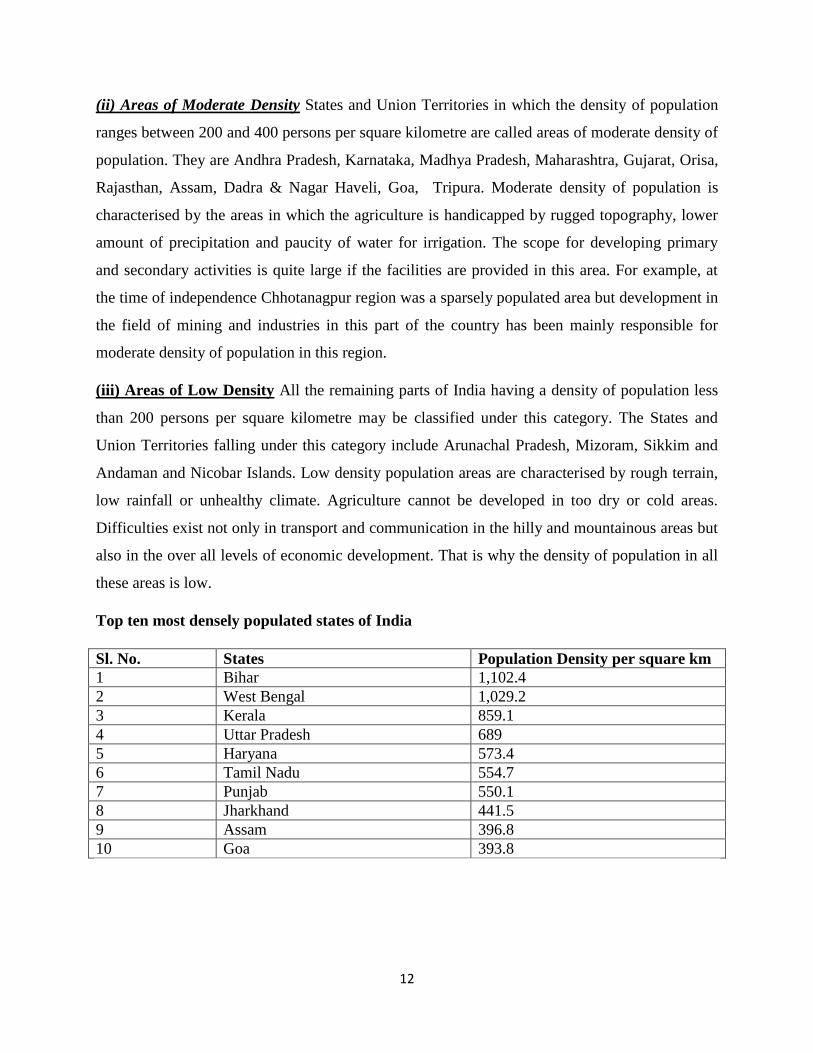
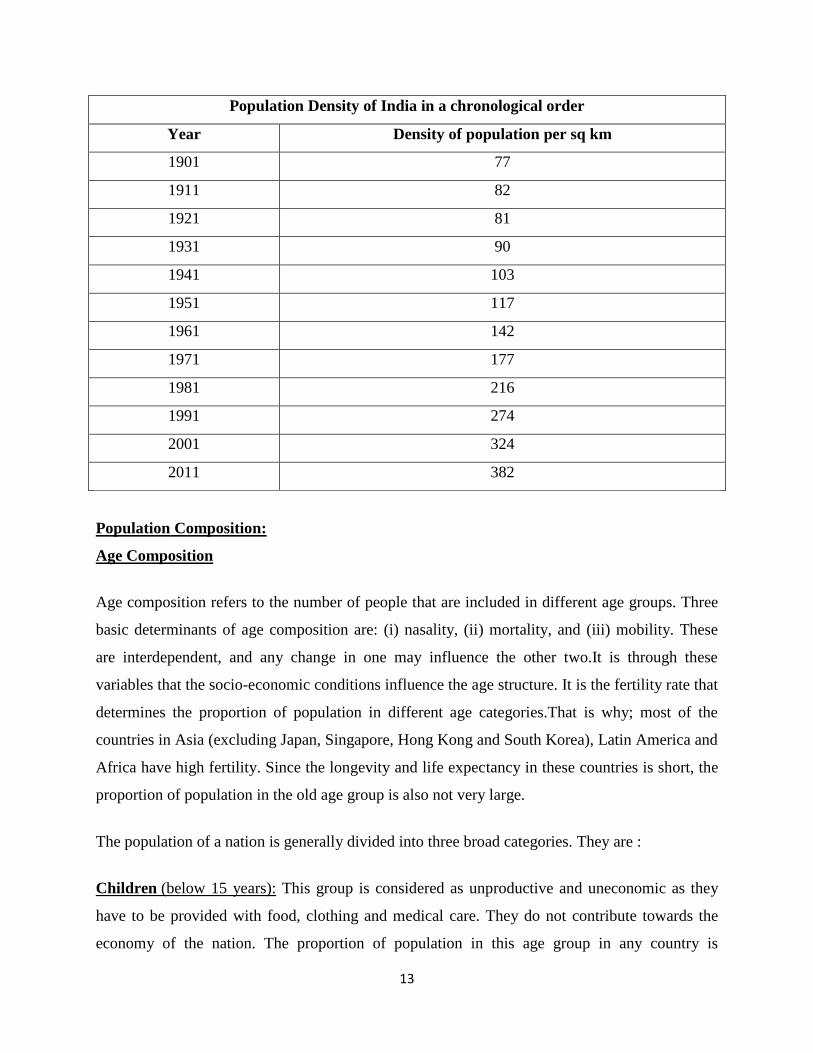
Population Density of India in a chronological order
Year Density of population per sq km
1901 77
1911 82
1921 81
1931 90
1941 103
1951 117
1961 142
1971 177
1981 216
1991 274
2001 324
2011 382
Population Composition:
Age Composition
Age composition refers to the number of people that are included in different age groups. Three
basic determinants of age composition are: (i) nasality, (ii) mortality, and (iii) mobility. These
are interdependent, and any change in one may influence the other two.It is through these
variables that the socio-economic conditions influence the age structure. It is the fertility rate that
determines the proportion of population in different age categories.That is why; most of the
countries in Asia (excluding Japan, Singapore, Hong Kong and South Korea), Latin America and
Africa have high fertility. Since the longevity and life expectancy in these countries is short, the
proportion of population in the old age group is also not very large.
The population of a nation is generally divided into three broad categories. They are :
Children (below 15 years): This group is considered as unproductive and uneconomic as they
have to be provided with food, clothing and medical care. They do not contribute towards the
economy of the nation. The proportion of population in this age group in any country is

14
determined by the stage of demographic transition it is passing through.This proportion is large if
the country is passing through the first or the second stage of demographic transition. It starts
declining as the country approaches the late stage. It is the minimum when the country is in the
final stage of demographic transition.
Working Age (15-59 years): This age group is economically productive as they are the working
population of the country and contribute towards the economic growth of the country. The adult
age group is biologically the most reproductive, economically the most productive and
demographically the most mobile (migratory).It supports the bulk of other age groups; it carries
the burden of feeding, clothing, educating the young age group and of looking after the old age
group. The developed countries have relatively high proportion of adult population.
Aged (above 59 years): This age group is a retired workforce. However, they may be
economically productive if they work voluntarily. The proportion of people in this age group, by
and large, increases as the population of a country completes its demographic evolution.
Children and aged affect the dependency ratio as they are not economically productive.
The age composition of the Indian population is as follows:
Children constitute 34.4% of the total population
Adults constitute 58.7% of the total population, and
Aged people constitute 6.9% of the total population
The number and percentage of a population found within the children, working age and
aged groups are notable determinants of the population’s social and economic structure. From
the above statistics, it is clear that the adults constitute more than half of the population of India.
This age group is economically productive and thus contributes towards the economic growth of
the country. According to other statistics, Adolescent population( between 10-19 years)
constitute one fifth of the total population which means that in coming years, India will benefit
from a young work force compared to other countries like China and Japan which in coming
years will have a ageing population.
15
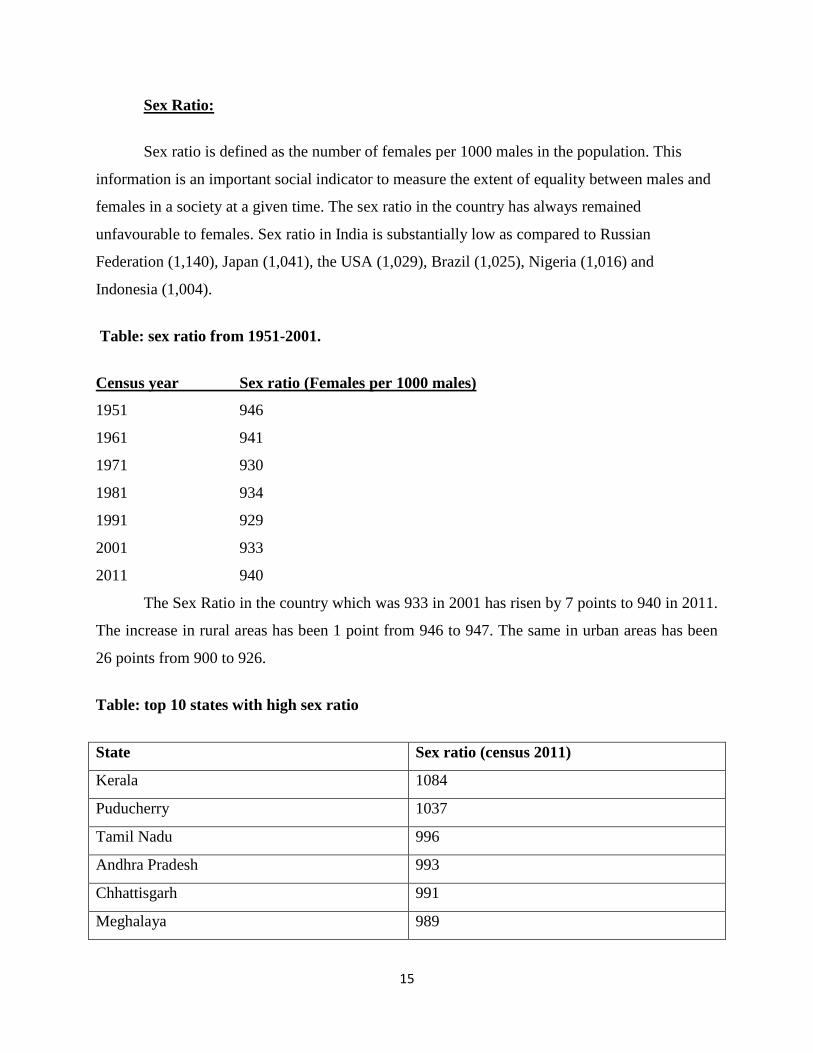
Sex Ratio:
Sex ratio is defined as the number of females per 1000 males in the population. This
information is an important social indicator to measure the extent of equality between males and
females in a society at a given time. The sex ratio in the country has always remained
unfavourable to females. Sex ratio in India is substantially low as compared to Russian
Federation (1,140), Japan (1,041), the USA (1,029), Brazil (1,025), Nigeria (1,016) and
Indonesia (1,004).
Table: sex ratio from 1951-2001.
Census year Sex ratio (Females per 1000 males)
1951 946
1961 941
1971 930
1981 934
1991 929
2001 933
2011 940
The Sex Ratio in the country which was 933 in 2001 has risen by 7 points to 940 in 2011.
The increase in rural areas has been 1 point from 946 to 947. The same in urban areas has been
26 points from 900 to 926.
Table: top 10 states with high sex ratio
State Sex ratio (census 2011)
Kerala 1084
Puducherry 1037
Tamil Nadu 996
Andhra Pradesh 993
Chhattisgarh 991
Meghalaya 989
16
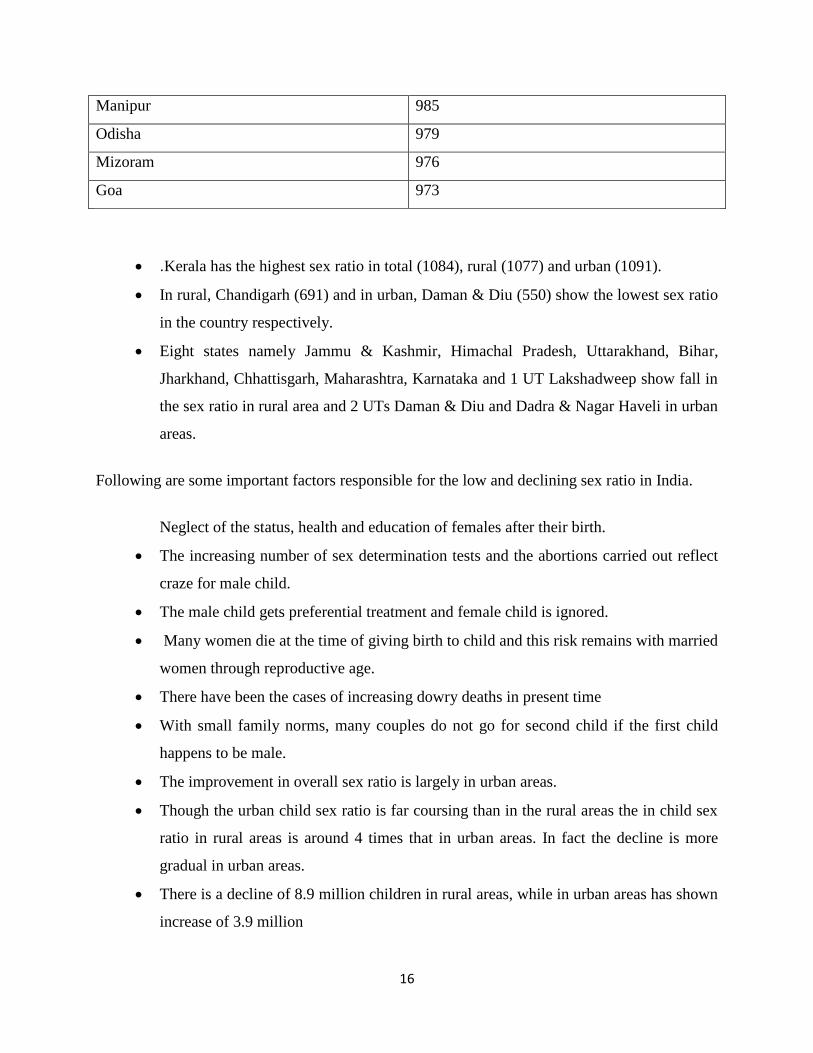
Manipur 985
Odisha 979
Mizoram 976
Goa 973
.Kerala has the highest sex ratio in total (1084), rural (1077) and urban (1091).
In rural, Chandigarh (691) and in urban, Daman & Diu (550) show the lowest sex ratio
in the country respectively.
Eight states namely Jammu & Kashmir, Himachal Pradesh, Uttarakhand, Bihar,
Jharkhand, Chhattisgarh, Maharashtra, Karnataka and 1 UT Lakshadweep show fall in
the sex ratio in rural area and 2 UTs Daman & Diu and Dadra & Nagar Haveli in urban
areas.
Following are some important factors responsible for the low and declining sex ratio in India.
Neglect of the status, health and education of females after their birth.
The increasing number of sex determination tests and the abortions carried out reflect
craze for male child.
The male child gets preferential treatment and female child is ignored.
Many women die at the time of giving birth to child and this risk remains with married
women through reproductive age.
There have been the cases of increasing dowry deaths in present time
With small family norms, many couples do not go for second child if the first child
happens to be male.
The improvement in overall sex ratio is largely in urban areas.
Though the urban child sex ratio is far coursing than in the rural areas the in child sex
ratio in rural areas is around 4 times that in urban areas. In fact the decline is more
gradual in urban areas.
There is a decline of 8.9 million children in rural areas, while in urban areas has shown
increase of 3.9 million
17
Literacy Rates
Literacy is a very important quality of a population. Obviously, only an informed and
educated citizen can make intelligent choices and undertake research and development projects.
Low levels of literacy are a serious obstacle for economic improvement. Literacy in India is a
key for socio-economic progress and the Indian literacy rate has grown to 74.04% (2011) from
12% at the end of British rule in 1947. Although this was a greater than six-fold improvement,
the level is well below the world average literacy rate of 84%. There is a wide gender disparity in
the literacy rate in India: effective literacy rates (age 7 and above) in 2011 were 82.14% for men
and 65.46% for women. The census provided a positive indication that growth in female literacy
rates (11.8%) was substantially faster than in male literacy rates (6.9%) in the 2001–2011
decadal period, which means the gender gap appears to be narrowing.
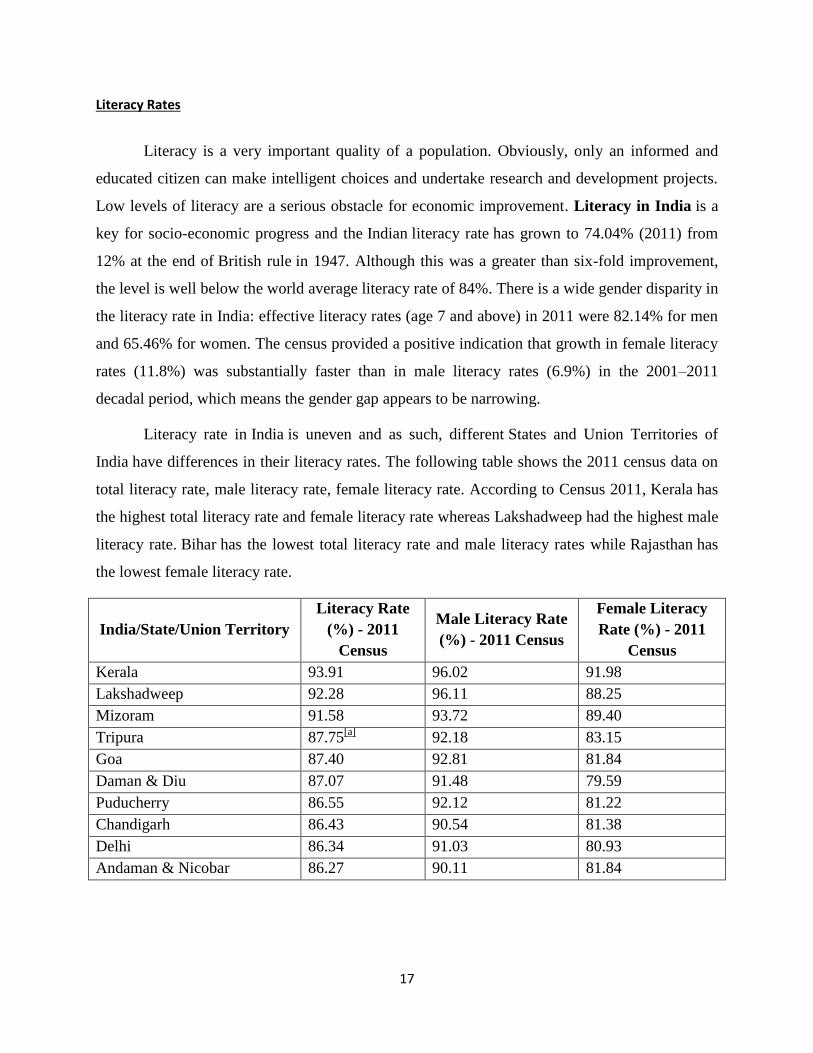
Literacy rate in India is uneven and as such, different States and Union Territories of
India have differences in their literacy rates. The following table shows the 2011 census data on
total literacy rate, male literacy rate, female literacy rate. According to Census 2011, Kerala has
the highest total literacy rate and female literacy rate whereas Lakshadweep had the highest male
literacy rate. Bihar has the lowest total literacy rate and male literacy rates while Rajasthan has
the lowest female literacy rate.
India/State/Union Territory
Literacy Rate
(%) - 2011
Census
Male Literacy Rate
(%) - 2011 Census
Female Literacy
Rate (%) - 2011
Census
Kerala 93.91 96.02 91.98
Lakshadweep 92.28 96.11 88.25
Mizoram 91.58 93.72 89.40
Tripura 87.75[a]
92.18 83.15
Goa 87.40 92.81 81.84
Daman & Diu 87.07 91.48 79.59
Puducherry 86.55 92.12 81.22
Chandigarh 86.43 90.54 81.38
Delhi 86.34 91.03 80.93
Andaman & Nicobar 86.27 90.11 81.84
18
Occupational Structure
The percentage of population that is economically active is an important index of
development. The distribution of the population according to different types of occupation is
referred to as the occupational structure. An enormous variety of occupations are found in any
country. Occupations are generally classified as primary, secondary, and tertiary.
Primary activities include agriculture, animal husbandry, forestry, fishing, mining, quarrying
etc.
Secondary activities include manufacturing industry, building and construction work etc.
Tertiary activities include transport, communications, commerce, administration and other
services.
The proportion of people working in different activities varies in developed and developing
countries. Developed nations have a high proportion of people in secondary, and tertiary
activities. Developing countries tend to have a higher proportion of their workforce engaged in
primary activities. The occupational structure of India clearly reflects a high degree of
backwardness prevailing in Indian economy. In India, about 64 per cent of the population is
engaged only in agriculture. The proportion of population dependent on secondary and
tertiary sectors is about 13 and 20 per cent respectively. There has been an occupational shift
in favour of secondary and tertiary sectors because of growing industrialisation and urbanisation
in recent times.
Some of the main features of occupational structure in India are as follows:
1. Agriculture is Main Occupation:
In India, agriculture is the main occupation. 66.7 percent of population is engaged in agriculture
as against 71 percent in 1901.This has given rise to disguised unemployment. So there is very
small chance of reducing the burden of population on agriculture.
2. Less development of industries:
19
17 percent of population depends on manufacturing industries in India. In USA 32 percent, in
England 42 percent and in Japan 39 percent people are engaged in secondary sector. It shown
that India is industrially backward.
3. Unbalanced:
Indian economy is highly unbalanced. All production activities are not equally developed. Too
much dependence on agriculture is a symptom of economic backwardness.
4. Less Income:
Per capita income and standard of living of the people in India is low. It is so because agriculture
yields less income than trade.
5. Small Villages:
Dominance of agriculture proves that most of the people in India must be living in small villages
and number of people living in towns and cities must be very small. In India 76 percent of
population lives in rural areas and 24 percent in urban areas.
6. Backward Agriculture:
66 percent of population is engaged in agriculture. In India, yet we import food grains from other
countries. It testifies that our agriculture is very backward. On the other hand, in America, 2
percent of population is engaged in agriculture which exports the surplus of food to other
countries. It shows that agriculture sector should be developed.
7. Increase in the proportion of Agriculture Labourers:
The proportion of agricultural labourers has been rising during the period of planning. It shows
the fact that the number of wage earners is increasing in agricultural sector.
8. Less development of tertiary sector:
Tertiary sector which includes services, banking, communication, transport etc. is not much
developed in India. In India, 20.5 percent of population is engaged in tertiary activities as against
66 percent in America, 56 percent in England and 49 percent in Japan.
20
Population Explosion:
The population problem of India is one of rapid population growth or population explosion. This
is due to high birth rate and low declining death rate. During 1901-1951, the population grew by
12.3 crore, while during the next 50 years from 1951 to 2001, it increased by 66.6 crore, that is
by more than 5 times.
The two main causes for this rapid growth of population have been high birth rate and a large
decline in death rate which are discussed as under:
Causes of High Birth Rate in India:
Even though the birth rate in India had declined from 41.7 in 1951-60 to 25 per thousand in
1991-2001, it is still very high. There are various social, economic, climatic and religious factors
which are responsible for the high birth rate in the country.
They are explained as under:
i. Hot Climate:
ii. Universality of Marriage
iii. Child Marriage
iv. Social Customs and Religious Superstitions
v. Joint Family System
vi. Rise in Natural Fertility Rate
vii. Low Level of Education
viii. Lack of Entertainment Facilities
ix. Low Level of Family Planning Practice
x. Poverty
Causes of Decline in Death Rate in India
There has been a rapid decline in death rate in India since 1921. It has almost approached the rate
which obtains in the developed world. The world average death rate in 1999 was 9 per thousand.
During the period 1911-20, the death rate was 48.1 per thousand whereas in 1991-2001 it was 8
per thousand.
21
i. Improvement in Medical Facilities
ii. Improvement in Standard of Living
iii. Improvement in Education and Awareness
iv. Late Marriage
Races
Classification and Distribution of Indian Races
India is a melting pot of races. It is an ethnological museum. The ancestors of the
majority of present population have migrated to India from surrounding territories across the
Himalayas. Indian population is constituted of major races of the world. We find people of
different races in India.
A.Classification of Sir Herbert Hope Risley (1915):
Sir Herbert Hope Risley tried to classify the Indian population on the basis of anthropometric
measurements. Risley distinguished seven different ‘physical types’ in the Indian population
in the following way:
1. The Dravidian
2. The Indo-Aryan
3. The Mongoloid
4. The Aryo-Dravidian
5. The Mongolo-Dravidian
6. The Scytho-Dravidian
7. The Turko-Iranian
B. Classification of A.C. Haddon (1924):
A.C. Haddon did not agree with Risley and divided India into three main geographical regions—
(a) Himalayas, (b) the Northern plains or Hindustan and (c) the Southern plateau or the Deccan
which is mostly covered by the jungles. He had dealt with each of these three regions, separately,
for the reconstruction of racial elements in them.
22
The Himalayan region:
(i) Indo-Aryan:
(ii) (ii) Mongoloid:
The Northern plains or Hindustan region:
The Indo-Afghan - The different racial elements of this region as found by Haddon are as
follows:
1. Negrito:
2. Pre-Dravidian:
3. Dravidian:
4. Southern brachycephals:
5. Western Brachycephals:
C. Classification of Eickstedt (1934):
Fuherer von Eickstedt had made the German Indian Anthropological Expedition to India during
1926-29. He classified the Indian people in 1934, both from physical and cultural perspectives.
I. Weddid or Ancient Indians:
(a) Gondid:
(b) Malid:
II. Melanid or Black Indians:
(a) South Melanid:
(b) Kolid:
III. Indid or New Indians:
(a) GracileIndid:
(b) North Indid:
IV. Palae-Mongoloid:
Eickstedt’s classification is regarded as a proper attempt to classify Indian population.
Although it was open to severe criticism, but it had a great scope. So, later it was extended with
necessary changes and additions. Efforts of B. S. Guha made it more convincing.
23
Classification of B. S. Guha: former Director of Anthropological survey of India presented
a scientific classification of Indian races in 1944 and divided the population of India into the
following races:
1. The Negrito:
These people are considered as the first comers and the true autochthones of India. They are
characterized by dark skin colour, short stature, and frizzly hair with long or short spirals. The
head is either small, medium, long or broad with bulbous forehead. The nose is flat and broad.
The lips are everted and thick. The best representatives of this type are the Kadars, the Irulas, the
Puniyans, etc. of South India.Such type of characters is also visible among the tribes living in the
Rajmahal Hills. In respect of the head form and hair form, the Indian Negrito strain resembles
more to the Melanesian Pygmies than to the Andamanese or African Pygmies.
2. The Proto-Austroloid:
The Proto-Austroloid is also known as the Pre-Dravidian race. The people are characterized by
dolichocephalic head, broad and flat nose (platyrrhine nose) which is depressed at the root. They
are further short in height, dark brown to nearly black in skin colour. The hair is wavy or curly.
Population of central India is fairly dominated by this racial element. The Santhals, the Mundas,
the Juangas, the Soaras, the Kondhs are some of the many tribes belonging to this racial type.
3. Mongoloid:
People of this racial ancestry are mainly found in North-Eastern India. This type of people is
distinguished by scanty growth of hair on face and body. The eyes are obliquely set and show the
presence of epicanthic fold. The face is flat with prominent cheekbones and hair is straight. This
group can be divided into two sub-groups, such as Palaeo-Mongoloid and the Tibeto-Mongoloid.
(a) The Palaeo-Mongoloid: This racial type is further divided into two types, one the long
headed type and the other Broad headed type.
The AngamiNagas are of the long headed type of the Palaeo-Mongoloid race. The people
inhabiting in the Himalayan foot hills from Kashmir to Assam are said to be the brood headed
type of the Palaeo-Mongoloid race.
(b) The Tibeto-Mongoloid: The people of Sikkim and Bhutan are said to belong to the Tibeto-
Mongoloid branch of Mongoloid race.
24
4. The Mediterranean:
This race is one of the dominated race in India. Mediterranean is divided into three types. They
are (a) Palaeo-Mediterranean (b) Mediterranean, (c) Oriental.
(a) The Palaeo-Mediterranean:The people are characterized by long head with bulbous
forehead, projected occiput with high vault. They also show medium stature, small and broad
nose, narrow face and pointed chin. The hair on face and body is scanty. The skin colour is
dark.This racial type is represented by the Tamil and Telugu Brahmins of the South.
(b) The Mediterranean: The features include long head with arched forehead, narrow nose,
medium to tall stature and light skin colour. Their chin is well developed, hair colour is dark, eye
colour is brownish to dark and the hair on face and body is plentiful.People of this racial type are
believed to be the builders of the Indus valley civilization.These people live in the regions like
Uttar Pradesh, Bombay, Bengal, Malabar, etc
(c) Oriental: Oriental type is very much similar to the Mediterranean type except the nose, which
is long and convex in this case. The best examples are the Punjabi Chattris, the Benia of
Rajputana, and the Pathans.
5. Western Brachycephals:
This race is of three types, namely (a) the Alpenoid, (b) the Dinaric, (c) the Armenoid.
(a) The Alpenoid: This type shows broad head with rounded occiput, medium stature, prominent
nose and rounded face. The hair on face and body is abundant and the skin colour is light. This
type is found among the Bania of Gujarat, the Kathi of Kathiawar and the Kayasthas of Bengal,
(b) The Dinaric:This type is characterized by broad head, rounded occiput and high vault. The
nose is very long and often convex. The face is long and stature in general is very tall. The skin
colour is dark; eye and hair colours are also dark.This strain is found among the people of
Bengal, Orissa and Coorg.
(c) The Armenoid:This type shows a resemblance with the Dinarics in physical characters. Only
difference is that, among the Dinarics the shape of occiput is much developed and the nose is
very prominent. The Parsis of Bombay exhibit typical Armenoid characteristics. The Bengali
Vaidyas and Kayasthas sometimes show the features of this type.
25
6. Nordic Race:
The people are characterized by long head, protruding occiput and arched forehead. The nose is
straight and high bridged. All are tall statured with strong jaw and robust body built. The eye
colour is blue or grey. The body colour is fair which is reddish white. This element is scattered in
different parts of Northern India, especially in the Punjab and Rajputana.
The Kho of chitral, the Red Kaffirs, and the Khatash are some other representatives of this type.
The Nordics came from the north, probably from Southeast Russia and Southwest Siberia,
thereafter penetrated into India through Central Asia.
Criticism of Guha’s Classification:
Guha’s classification also meets criticism at some points.
Firstly, Guha’s findings regarding the Negrito element have been opposed by almost all-leading
anthropologists.
Secondly, Guha tried to prove that all racial elements in India are of foreign origin. Keith
strongly opposed this view. Because, Keith believed in a racial evolution that has taken place in
India and so he took India an evolutionary field of different races.
Further, Guha had shown the people of India as Mongoloid and Brachycephalic. He proposed a
sweeping distribution of Brachycephals, southwards, round the both ends of the Himalayas,
which ultimately extends to the West to spread over the whole of the Deccan.
In the northeast and the east, this brachycephalic area is supposed to have spreaded from the
Nepal and Bhutan, upto Bengal and Orissa. Dr. Sarkar has strongly opposed the proposition of
Guha. In his opinion the brachycephalic population of India does not show a sweeping
distribution as has been described by Guha.
26
TRIBES
Geographical Distribution of Tribes in India
The term Scheduled Tribes first appeared in the Constitution of India. Article 366 (25)
defined scheduled tribes as "such tribes or tribal communities or parts of or groups within such
tribes or tribal communities as are deemed under Article 342 to be Scheduled Tribes for the
purposes of this constitution". The criterion followed for specification of a community, as
scheduled tribes are indications of primitive traits, distinctive culture, geographical isolation,
shyness of contact with the community at large, and backwardness. This criterion is not spelt out
in the Constitution but has become well established.
About 2/3 of the total tribal population of the country are found in the five states – Madhya
Pradesh, Orissa, Bihar, Gujarat and Maharashtra. The tribes live all over the country from
the foot-hills of Himalayas to the land tip, of Lakshadweep and from plains of Gujarat to the
hills of North-East. Madhya Pradesh registers the largest number of tribes (73) followed by
Arunachal Pradesh (62), Orissa (56), Maharashtra (52), Andhra Pradesh (43).
In India there is almost a continuous belt of high tribal concentration starting from the
Western coast – from Thane district in Maharashtra passing through Surat and Dang districts
in Gujarat to Mayurbhanj in Orissa on the Eastern coast and Bihar.
The chief concentration is in Dhulia in Maharashtra; West Nimar, Betul, Chhindwara, Seeni,
Mandla, Shandol and Sarguja in Madhya Pradesh; and Ranchi, Santhal Parganas_ and
Singhbhum district in Bihar.
Another long range of tribal belt is found in the North-East spreading over Arunachal
Pradesh, Nagaland, Meghalaya, Mizo Hills, United Mikir and North Cachar Hills of Assam
and hilly regions of Manipur and Tripura.
These belts are also linked up by a chain of pockets of tribal concentration at Taluk or sub-
divisional levels.
Tribal concentrations are also found in Bastar district of Madhya Pradesh, Korapur, Bauch-
Khandenals, and Agency tracts of Orissa and Andhra Pradesh which are linked up with the
Central belt by a chain of small pockets of tribal concentration.
27
The scheduled tribes live in exclusive pockets of the territory, upon which they have
traditional ownership rights.
Dr. B. S. Guha has divided the county into three tribal Zones:
1.North-North-Eastern Zone:
Eastern Kashmir, Eastern Punjab, Himachal Pradesh, Northern Uttar Pradesh, Nagaland, Assam
etc. constitute this zone. The Aka, the Mishmi, the Chulikata and the Naga are some of the tribes
of this zone.
2. Central Zone:
Bihar, Bengal, Southern U.P., Southern Rajasthan, Madhya Pradesh and Orissa come under this
zone. The Kondh, the Santhal, the Bhil, the Gond, the Muria and the Baiga are only a few of the
large number of tribes of this zone. The bulk of the tribal population lives in this zone. There is a
very high concentration of tribal population in central India. Over 85 per cent of the total tribal
population inhabits the eight States that constitute this zone.
3. Southern Zone:
The Southern zone is consisted of four Southern States – Andhra Pradesh, Tamil Nadu,
Karnataka and Kerala. The Toda, the Chenchu, the Kadar and the Koraga are some of the
important tribes of this zone.
C. B. Mamoria has added to this list the fourth zone consisting of Andaman and Nicober
Islands.
4. The Small Zone consisting of Andaman and Nicobar Islands:
Besides these main zones, there is another isolated zone constituting the Andaman and Nicobar
Island in the Bay of Bengal. The Jarawa, the Andamanese and the Nicobarese are the important
tribes of this zone.
B. K. Roy Burman divides the tribal population of the country into five geographical regions
taking territorial, ethnic and socio-cultural relations into account.
28
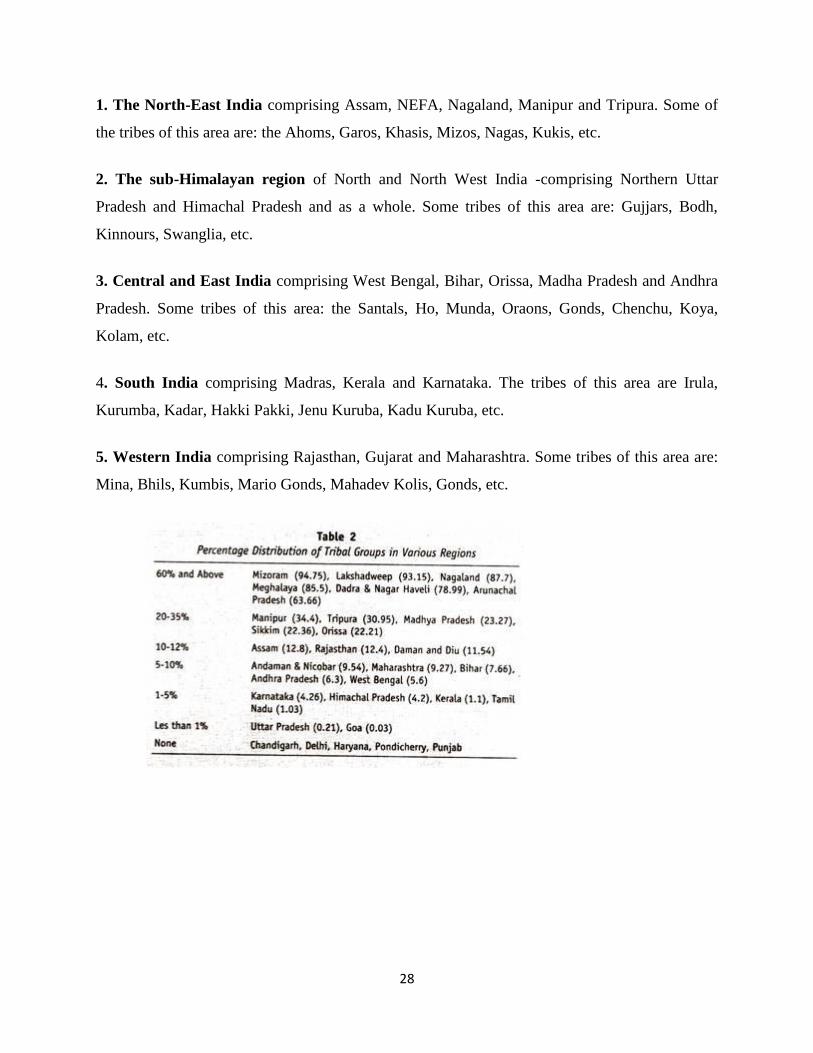
1. The North-East India comprising Assam, NEFA, Nagaland, Manipur and Tripura. Some of
the tribes of this area are: the Ahoms, Garos, Khasis, Mizos, Nagas, Kukis, etc.
2. The sub-Himalayan region of North and North West India -comprising Northern Uttar
Pradesh and Himachal Pradesh and as a whole. Some tribes of this area are: Gujjars, Bodh,
Kinnours, Swanglia, etc.
3. Central and East India comprising West Bengal, Bihar, Orissa, Madha Pradesh and Andhra
Pradesh. Some tribes of this area: the Santals, Ho, Munda, Oraons, Gonds, Chenchu, Koya,
Kolam, etc.
4. South India comprising Madras, Kerala and Karnataka. The tribes of this area are Irula,
Kurumba, Kadar, Hakki Pakki, Jenu Kuruba, Kadu Kuruba, etc.
5. Western India comprising Rajasthan, Gujarat and Maharashtra. Some tribes of this area are:
Mina, Bhils, Kumbis, Mario Gonds, Mahadev Kolis, Gonds, etc.
29
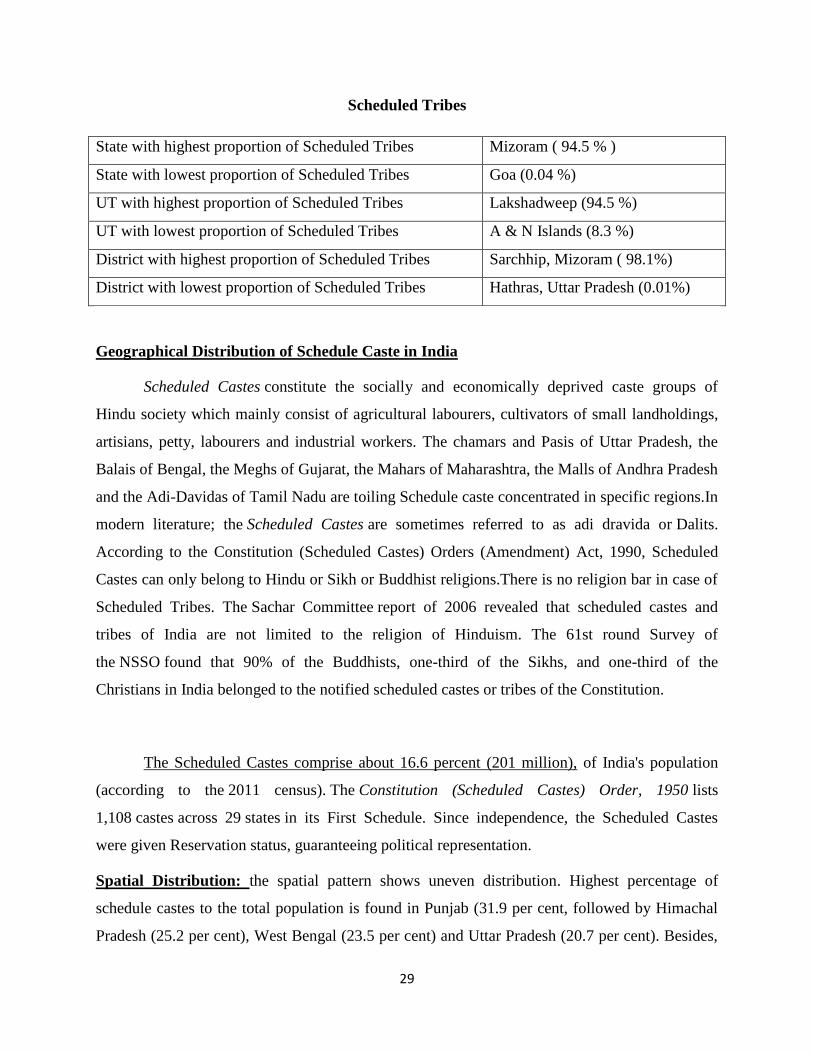
Scheduled Tribes
State with highest proportion of Scheduled Tribes Mizoram ( 94.5 % )
State with lowest proportion of Scheduled Tribes Goa (0.04 %)
UT with highest proportion of Scheduled Tribes Lakshadweep (94.5 %)
UT with lowest proportion of Scheduled Tribes A & N Islands (8.3 %)
District with highest proportion of Scheduled Tribes Sarchhip, Mizoram ( 98.1%)
District with lowest proportion of Scheduled Tribes Hathras, Uttar Pradesh (0.01%)
Geographical Distribution of Schedule Caste in India
Scheduled Castes constitute the socially and economically deprived caste groups of
Hindu society which mainly consist of agricultural labourers, cultivators of small landholdings,
artisians, petty, labourers and industrial workers. The chamars and Pasis of Uttar Pradesh, the
Balais of Bengal, the Meghs of Gujarat, the Mahars of Maharashtra, the Malls of Andhra Pradesh
and the Adi-Davidas of Tamil Nadu are toiling Schedule caste concentrated in specific regions.In
modern literature; the Scheduled Castes are sometimes referred to as adi dravida or Dalits.
According to the Constitution (Scheduled Castes) Orders (Amendment) Act, 1990, Scheduled
Castes can only belong to Hindu or Sikh or Buddhist religions.There is no religion bar in case of
Scheduled Tribes. The Sachar Committee report of 2006 revealed that scheduled castes and
tribes of India are not limited to the religion of Hinduism. The 61st round Survey of
the NSSO found that 90% of the Buddhists, one-third of the Sikhs, and one-third of the
Christians in India belonged to the notified scheduled castes or tribes of the Constitution.
The Scheduled Castes comprise about 16.6 percent (201 million), of India's population
(according to the 2011 census). The Constitution (Scheduled Castes) Order, 1950 lists
1,108 castes across 29 states in its First Schedule. Since independence, the Scheduled Castes
were given Reservation status, guaranteeing political representation.
Spatial Distribution: the spatial pattern shows uneven distribution. Highest percentage of
schedule castes to the total population is found in Punjab (31.9 per cent, followed by Himachal
Pradesh (25.2 per cent), West Bengal (23.5 per cent) and Uttar Pradesh (20.7 per cent). Besides,
30
Haryana, Tripura, Uttarakhand Odisha, Tamil Nadu, Rajasthan and UTS, Delhi, Chandigarh
have higher percentage of schedule caste population than national average (16.6 per cent). Union
territories like Andaman and Nicobar, Lakshadweep and state of Nagaland do not have schedule
caste while, Arunachal Pradesh, Goa, Manipur, Meghalaya, Mizoram, Dadra and Nagar Haveli,
Daman and Diu have less than 5 per cent of their population as schedule caste while remaining
states have moderate 5-16 per cent share.
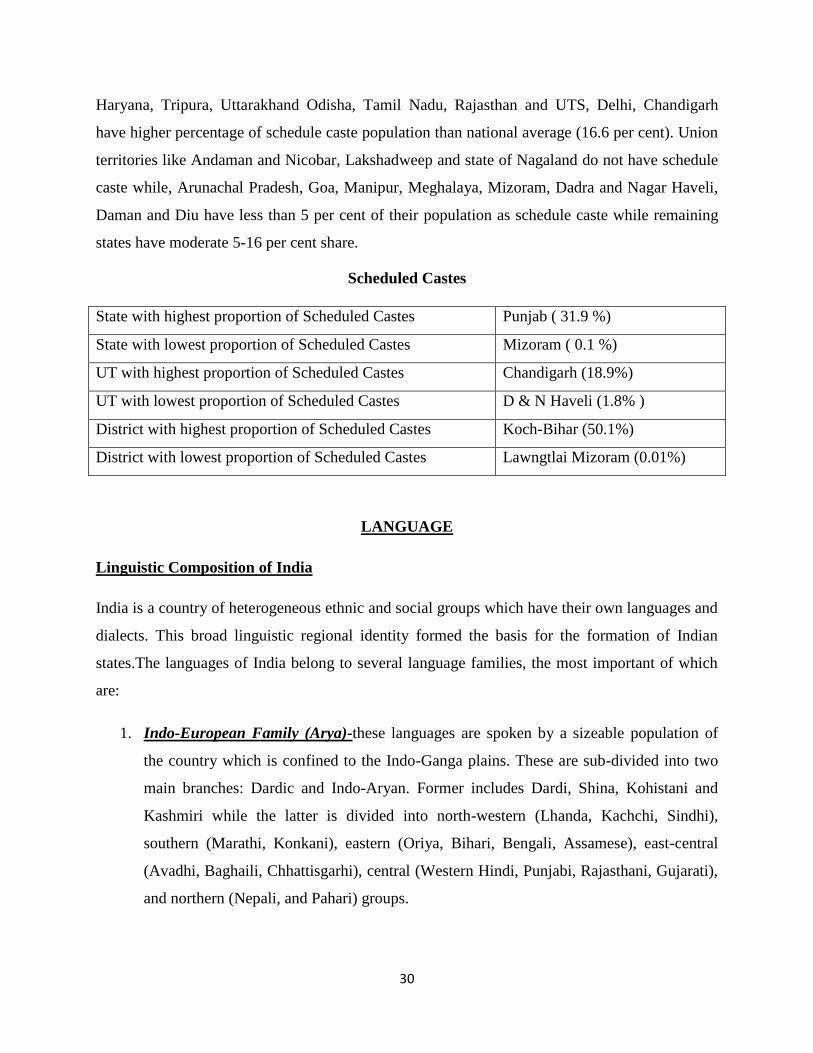
Scheduled Castes
State with highest proportion of Scheduled Castes Punjab ( 31.9 %)
State with lowest proportion of Scheduled Castes Mizoram ( 0.1 %)
UT with highest proportion of Scheduled Castes Chandigarh (18.9%)
UT with lowest proportion of Scheduled Castes D & N Haveli (1.8% )
District with highest proportion of Scheduled Castes Koch-Bihar (50.1%)
District with lowest proportion of Scheduled Castes Lawngtlai Mizoram (0.01%)
LANGUAGE
Linguistic Composition of India
India is a country of heterogeneous ethnic and social groups which have their own languages and
dialects. This broad linguistic regional identity formed the basis for the formation of Indian
states.The languages of India belong to several language families, the most important of which
are:
1. Indo-European Family (Arya)-these languages are spoken by a sizeable population of
the country which is confined to the Indo-Ganga plains. These are sub-divided into two
main branches: Dardic and Indo-Aryan. Former includes Dardi, Shina, Kohistani and
Kashmiri while the latter is divided into north-western (Lhanda, Kachchi, Sindhi),
southern (Marathi, Konkani), eastern (Oriya, Bihari, Bengali, Assamese), east-central
(Avadhi, Baghaili, Chhattisgarhi), central (Western Hindi, Punjabi, Rajasthani, Gujarati),
and northern (Nepali, and Pahari) groups.
31
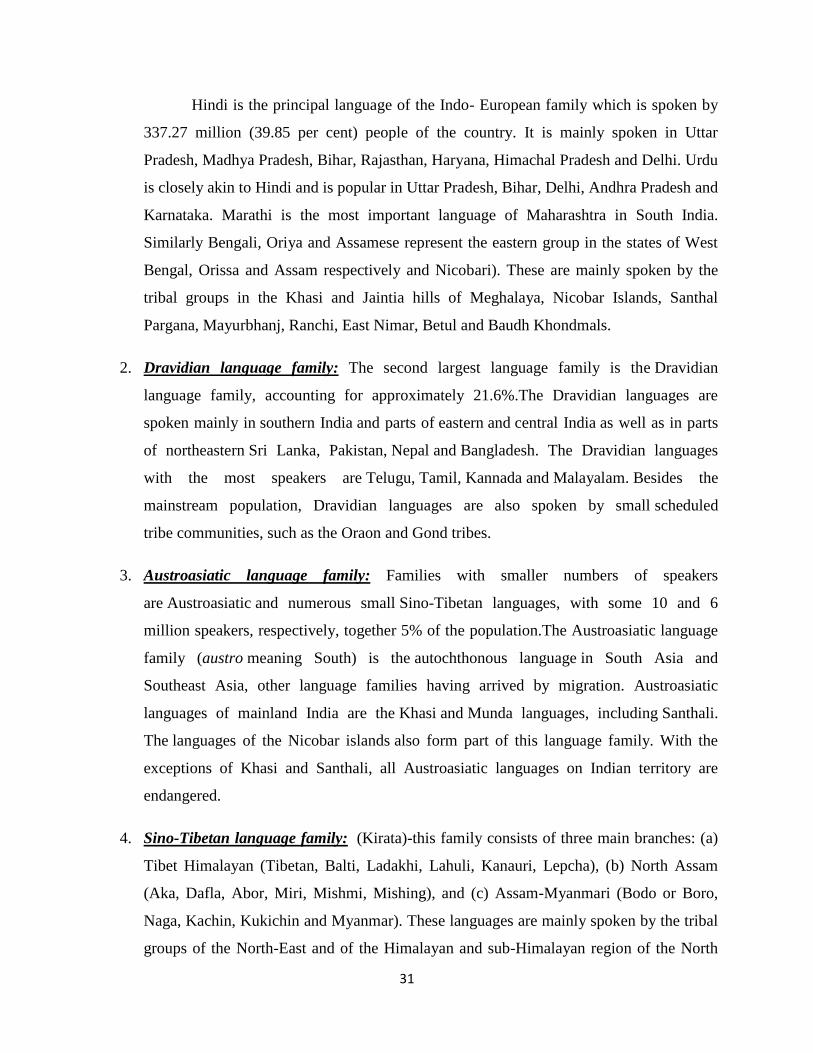
Hindi is the principal language of the Indo- European family which is spoken by
337.27 million (39.85 per cent) people of the country. It is mainly spoken in Uttar
Pradesh, Madhya Pradesh, Bihar, Rajasthan, Haryana, Himachal Pradesh and Delhi. Urdu
is closely akin to Hindi and is popular in Uttar Pradesh, Bihar, Delhi, Andhra Pradesh and
Karnataka. Marathi is the most important language of Maharashtra in South India.
Similarly Bengali, Oriya and Assamese represent the eastern group in the states of West
Bengal, Orissa and Assam respectively and Nicobari). These are mainly spoken by the
tribal groups in the Khasi and Jaintia hills of Meghalaya, Nicobar Islands, Santhal
Pargana, Mayurbhanj, Ranchi, East Nimar, Betul and Baudh Khondmals.
2. Dravidian language family: The second largest language family is the Dravidian
language family, accounting for approximately 21.6%.The Dravidian languages are
spoken mainly in southern India and parts of eastern and central India as well as in parts
of northeastern Sri Lanka, Pakistan, Nepal and Bangladesh. The Dravidian languages
with the most speakers are Telugu, Tamil, Kannada and Malayalam. Besides the
mainstream population, Dravidian languages are also spoken by small scheduled
tribe communities, such as the Oraon and Gond tribes.
3. Austroasiatic language family: Families with smaller numbers of speakers
are Austroasiatic and numerous small Sino-Tibetan languages, with some 10 and 6
million speakers, respectively, together 5% of the population.The Austroasiatic language
family (austro meaning South) is the autochthonous language in South Asia and
Southeast Asia, other language families having arrived by migration. Austroasiatic
languages of mainland India are the Khasi and Munda languages, including Santhali.
The languages of the Nicobar islands also form part of this language family. With the
exceptions of Khasi and Santhali, all Austroasiatic languages on Indian territory are
endangered.
4. Sino-Tibetan language family: (Kirata)-this family consists of three main branches: (a)
Tibet Himalayan (Tibetan, Balti, Ladakhi, Lahuli, Kanauri, Lepcha), (b) North Assam
(Aka, Dafla, Abor, Miri, Mishmi, Mishing), and (c) Assam-Myanmari (Bodo or Boro,
Naga, Kachin, Kukichin and Myanmar). These languages are mainly spoken by the tribal
groups of the North-East and of the Himalayan and sub-Himalayan region of the North
32
and North-West. The speakers of the Tibet Himalayan branch are concentrated in
Ladakh, parts of Himachal Pradesh and Sikkim. Assam-Myanmari branch spreads along
the Indo-Myanmar border. Among these, Naga dialects are spoken in Nagaland, Lushai
in Mizo hills, Garo in Garo hills and Meitei in Manipur.
On the basis of principal languages India may be divided into 12c linguistic regions.
These include Kashmiri, Punjabi, Hindi, Bengali, Assamese, Oriya, Gujrati, Marathi, Kannada,
Telugu, Tamil and Malayalam regions.
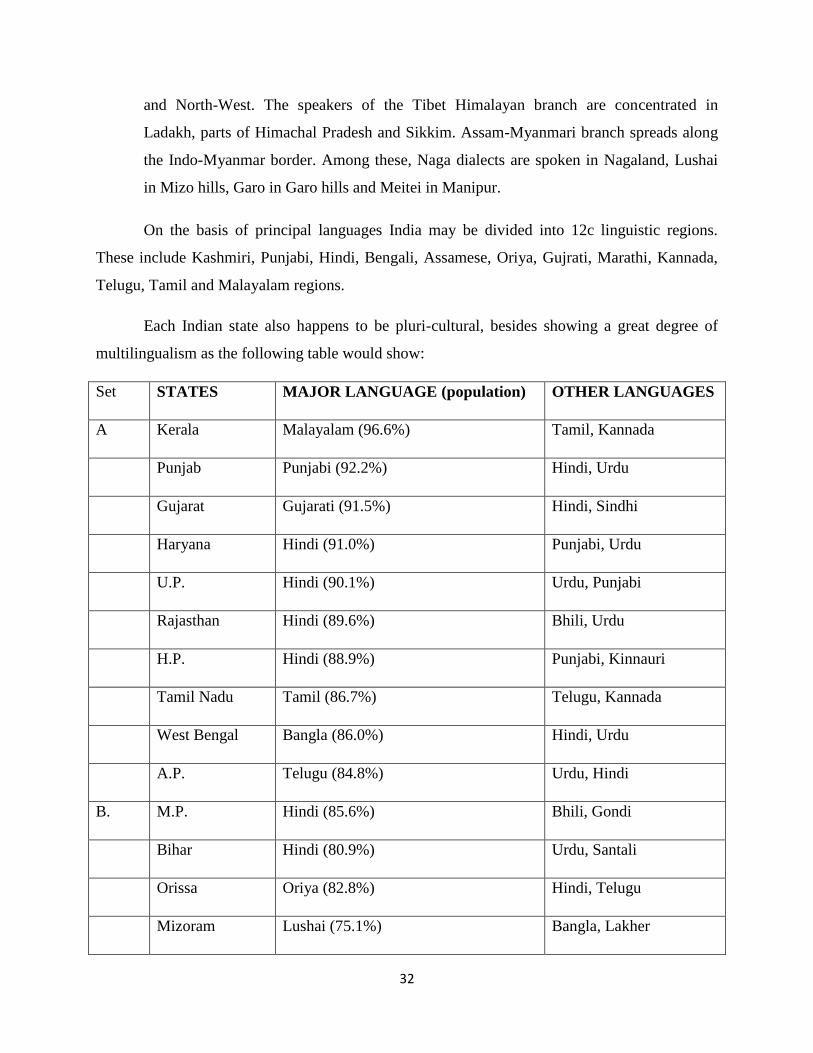
Each Indian state also happens to be pluri-cultural, besides showing a great degree of
multilingualism as the following table would show:
Set STATES MAJOR LANGUAGE (population) OTHER LANGUAGES
A Kerala Malayalam (96.6%) Tamil, Kannada
Punjab Punjabi (92.2%) Hindi, Urdu
Gujarat Gujarati (91.5%) Hindi, Sindhi
Haryana Hindi (91.0%) Punjabi, Urdu
U.P. Hindi (90.1%) Urdu, Punjabi
Rajasthan Hindi (89.6%) Bhili, Urdu
H.P. Hindi (88.9%) Punjabi, Kinnauri
Tamil Nadu Tamil (86.7%) Telugu, Kannada
West Bengal Bangla (86.0%) Hindi, Urdu
A.P. Telugu (84.8%) Urdu, Hindi
B. M.P. Hindi (85.6%) Bhili, Gondi
Bihar Hindi (80.9%) Urdu, Santali
Orissa Oriya (82.8%) Hindi, Telugu
Mizoram Lushai (75.1%) Bangla, Lakher
33
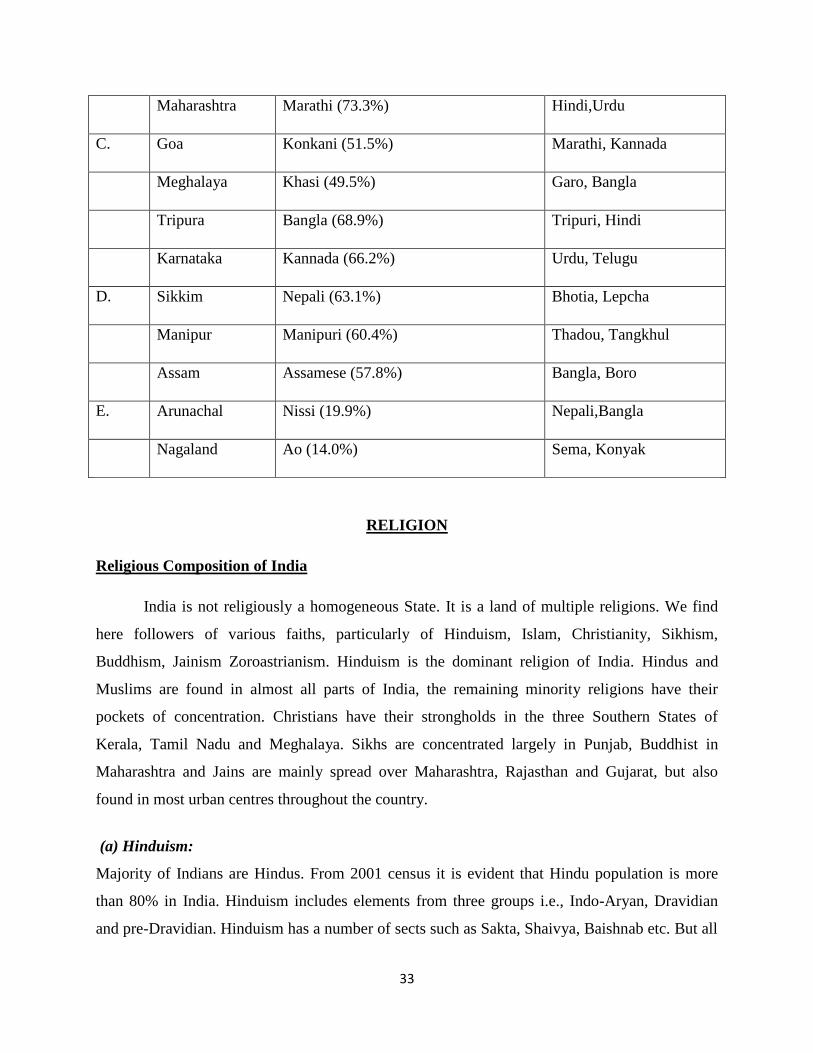
Maharashtra Marathi (73.3%) Hindi,Urdu
C. Goa Konkani (51.5%) Marathi, Kannada
Meghalaya Khasi (49.5%) Garo, Bangla
Tripura Bangla (68.9%) Tripuri, Hindi
Karnataka Kannada (66.2%) Urdu, Telugu
D. Sikkim Nepali (63.1%) Bhotia, Lepcha
Manipur Manipuri (60.4%) Thadou, Tangkhul
Assam Assamese (57.8%) Bangla, Boro
E. Arunachal Nissi (19.9%) Nepali,Bangla
Nagaland Ao (14.0%) Sema, Konyak
RELIGION
Religious Composition of India
India is not religiously a homogeneous State. It is a land of multiple religions. We find
here followers of various faiths, particularly of Hinduism, Islam, Christianity, Sikhism,
Buddhism, Jainism Zoroastrianism. Hinduism is the dominant religion of India. Hindus and
Muslims are found in almost all parts of India, the remaining minority religions have their
pockets of concentration. Christians have their strongholds in the three Southern States of
Kerala, Tamil Nadu and Meghalaya. Sikhs are concentrated largely in Punjab, Buddhist in
Maharashtra and Jains are mainly spread over Maharashtra, Rajasthan and Gujarat, but also
found in most urban centres throughout the country.
(a) Hinduism:
Majority of Indians are Hindus. From 2001 census it is evident that Hindu population is more
than 80% in India. Hinduism includes elements from three groups i.e., Indo-Aryan, Dravidian
and pre-Dravidian. Hinduism has a number of sects such as Sakta, Shaivya, Baishnab etc. But all
34
these sects have some of the common beliefs like immortality of soul, rebirth, transmigration of
soul etc.
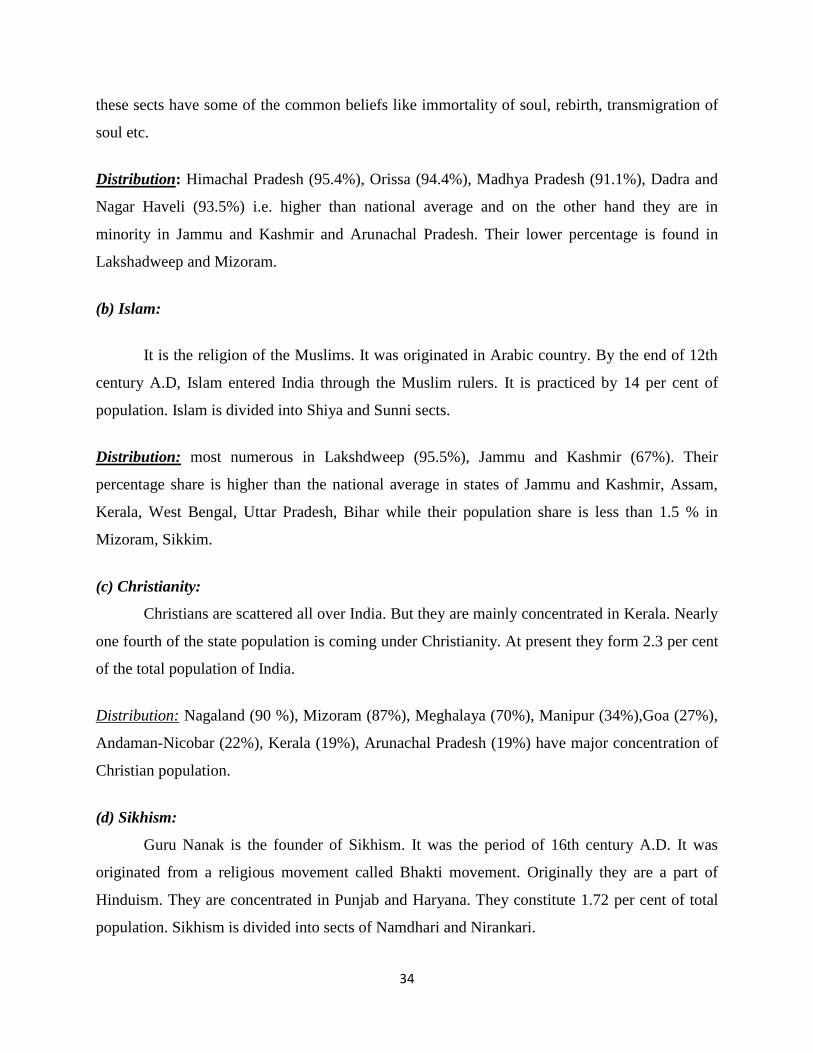
Distribution: Himachal Pradesh (95.4%), Orissa (94.4%), Madhya Pradesh (91.1%), Dadra and
Nagar Haveli (93.5%) i.e. higher than national average and on the other hand they are in
minority in Jammu and Kashmir and Arunachal Pradesh. Their lower percentage is found in
Lakshadweep and Mizoram.
(b) Islam:
It is the religion of the Muslims. It was originated in Arabic country. By the end of 12th
century A.D, Islam entered India through the Muslim rulers. It is practiced by 14 per cent of
population. Islam is divided into Shiya and Sunni sects.
Distribution: most numerous in Lakshdweep (95.5%), Jammu and Kashmir (67%). Their
percentage share is higher than the national average in states of Jammu and Kashmir, Assam,
Kerala, West Bengal, Uttar Pradesh, Bihar while their population share is less than 1.5 % in
Mizoram, Sikkim.
(c) Christianity:
Christians are scattered all over India. But they are mainly concentrated in Kerala. Nearly
one fourth of the state population is coming under Christianity. At present they form 2.3 per cent
of the total population of India.
Distribution: Nagaland (90 %), Mizoram (87%), Meghalaya (70%), Manipur (34%),Goa (27%),
Andaman-Nicobar (22%), Kerala (19%), Arunachal Pradesh (19%) have major concentration of
Christian population.
(d) Sikhism:
Guru Nanak is the founder of Sikhism. It was the period of 16th century A.D. It was
originated from a religious movement called Bhakti movement. Originally they are a part of
Hinduism. They are concentrated in Punjab and Haryana. They constitute 1.72 per cent of total
population. Sikhism is divided into sects of Namdhari and Nirankari.
35
Distribution: largest religious community of Punjab (60%) while Chandigarh (16 %), Haryana
(5.5%) and Delhi (2.5%) have major concentration
(e) Buddhism:
It was 6th century B.C when Buddhism was originated. Gautama Buddha is the
originator. Buddhism spread inside and outside India due to royal patronage. Less than 1 per cent
Buddhists lives in India. Buddhism sects are Hinayan and Mahayan.
Distribution: about 73 % of the total Buddhist live in Maharashtra (6% of state population),
Sikkim (28%), Arunachal Pradesh (13%), Mizoram (8%).
(f) Jainism:
It was also originated in 6th century B.C. Lord Mahavir was the founder of Jainism. Jains are
closer to Hindus. They believe in idol worship and they maintain caste distinction. They
constitute less than 0.4% of Indian population. Jainism sects are Digambar and Shwetambar.
Distribution: Maharashtra, Gujrat, Rajasthan, Delhi
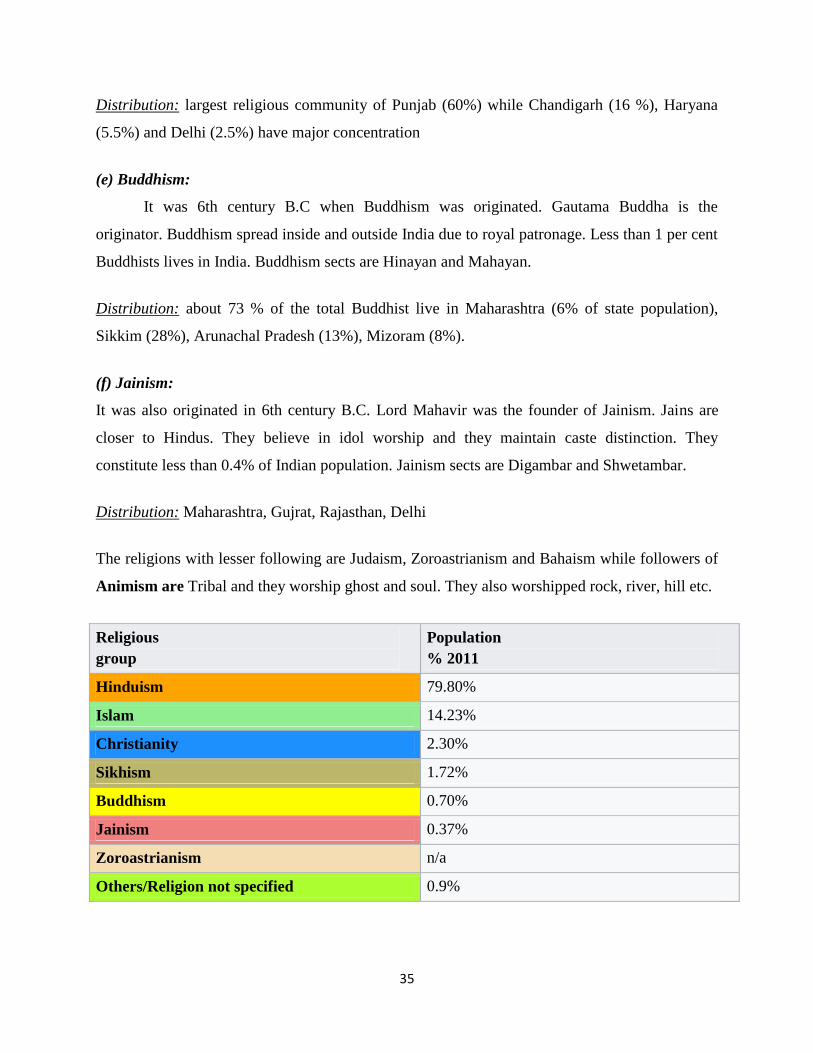
The religions with lesser following are Judaism, Zoroastrianism and Bahaism while followers of
Animism are Tribal and they worship ghost and soul. They also worshipped rock, river, hill etc.
Religious
group
Population
% 2011
Hinduism 79.80%
Islam 14.23%
Christianity 2.30%
Sikhism 1.72%
Buddhism 0.70%
Jainism 0.37%
Zoroastrianism n/a
Others/Religion not specified 0.9%