Analytical Chemistry / Instrumentation Environmental Analysis ...
Upload
khangminh22Category
view
4download
0
Program : B.Tech
Subject Name: Electronic Measurement & Instrumentation
Subject Code: EC-302
Semester: 3rd

UNIT I Accuracy and Precision, Sensitivity, Linearity, Resolution, Hysteresis, Loading Effect, Measurements of Current, Voltage, Power and Impedance: DC and AC Ammeter, DC Voltmeter- Chopper type and solid-state, AC voltmeter using Rectifier. Average, RMS, Peak responding voltmeters, Multi-meter, Power meter, Bolometer and Calorimeter Measurement is a comparison of a given unknown quantity with one of its predetermined standard values adopted as a unit. The result of any measurement is a concrete number consisting of a unit of measurement having its particular name & the number which shows how many times this particular unit is contained in the quantity being measured. The primary purpose of measurement in process industries & industrial manufacturing is to help in the economics of industrial operations by improving the quality of the product & efficiency of production and also in the maintenance of proper operation. Functional Elements of an in Instrument: All instruments contain various parts that perform prescribed functions in converting a variable quantity or condition into a corresponding indication. Thus, the operation of an instrument can be described in terms of the functional elements of instrument systems.
Primary Sensing Element: It receives energy from the measured medium & produces an output depending in
some way on the value of measured quantity.
Variable Conversion Element: It converts the output signal of the primary sensing element (which is some
physical variable such as voltage or a displacement) into a more suitable variable or condition useful to the
Fig. 1.1: Functional elements of an instrument system
PRESENTED DATA
PRIMARY
SENSING
ELEMENT
VARIABLE
CONVERSION
ELEMENT
VARIABLE
MANIPULATION
ELEMENT
DATA
PRESENTATION
ELEMENT
DATA
TRANSMISSION
ELEMENT
MEASURED
MEDIUM
OBSERVER
Downloaded from www.rgpvnotes.in
Page no: 1 Get real-time updates from RGPV

function of the instrument. (It may be noted that every instrument need not include a variable conversion
element which some requires).
Variable Manipulation Element: It manipulates the signal represented by some physical variable to perform the
intended task of an instrument. In the manipulation process; the physical nature of the variable is preserved. A
variable manipulation element does not necessarily follow a variable-conversion element; it may precede it,
appear elsewhere in the chain, or not appear at all.
Data Transmission Element: It transmits the data from one element to the other. It may be as simple as shaft and bearing assembly or as complicated as a telemetry system for transmitting signals from one place to another. Data Presentation Element: It performs the translation function, such as the simple indication of a pointer moving over a scale or recording of a pen moving over a chart. Measurement System Performance There are two categories for instrument and measurement system which are follows: (i) Static characteristics and (ii Dynamic characteristics (i) Static characteristics When the physical quantities which are either constant or vary very slowly with time in that case the measurement is in the form of statics characteristics of the instrument and provide quality measurement. (ii) Dynamic characteristics When the physical quantities which rapidly varying with time in that case the dynamic relation exists between the output and input for measurement and is called as Dynamic Characteristics. . Differential equations are used for such cases. Static Calibration Static calibration means comparing not varying quantity with time using some known standard. Calibration process is performed with either a primary standard or a secondary standard with higher accuracy than the instrument to be calibrated, or an instrument of known accuracy. Static Characteristics The main static characteristics are as follows: (i) Accuracy (ii) Sensitivity (iii) Reproducibility (iv) Drift (v) Static error (vi) Dead· Zone The qualities (i), (ii) and (iii) are desirable; while qualities (iv), (v) and (vi) are undesirable. Accuracy and Precision (i) Accuracy: It is the degree of closeness through which· an instrument reading approaches the true value of
the quantity being measured. Thus accuracy of a measurement means conformation to the truth. The accuracy can be classified in following ways: a) Point accuracy: Point accuracy is specified at only one particular point of measuring scale and does not provide accuracy on other points of the scale b) Accuracy as percentage of scale span: When an instrument has uniform scale then its accuracy is defined in terms of scale span. c) Accuracy as percentage of true value: when the accuracy is defined in terms of percentage with respect to uniform scale then it is called Accuracy as percentage of true value. (ii) Sensitivity: The sensitivity of an instrument is the ratio of the magnitude of the output signal to the
magnitude of input signal. Figure 1.2 shows the calibration curve in linear form and no linear form. Here the sensitivity of the instrument is defined by slope of calibration curve. If the plot is linear then sensitivity of the instrument remains same for the entire range and if nonlinear then it varies from point to point. Sensitivity is expressed by:
𝑆𝑒𝑛𝑠𝑖𝑡𝑖𝑣𝑖𝑡𝑦 =𝑖𝑛𝑓𝑖𝑛𝑖𝑡𝑒𝑠𝑖𝑚𝑎𝑙 𝑐ℎ𝑎𝑛𝑔𝑒 𝑖𝑛 𝑜𝑢𝑡𝑝𝑢𝑡
𝑖𝑛𝑓𝑖𝑛𝑖𝑡𝑒𝑠𝑖𝑚𝑎𝑙 𝑐ℎ𝑎𝑛𝑔𝑒 𝑖𝑛 𝐼𝑛𝑝𝑢𝑡=
∆𝑞𝑜
∆𝑞𝑖
Output, qo
Δ qo
Δ qi
Output, qo
Δ qo
Δ qi
Downloaded from www.rgpvnotes.in
Page no: 2 Get real-time updates from RGPV

Figure 1.2(i) Sensitivity for Straight line, (ii) Sensitivity for non Straight line
The Deflection factor is inversely proportional to sensitivity and expressed as:
𝐼𝑛𝑣𝑒𝑟𝑠𝑒 𝑆𝑒𝑛𝑠𝑖𝑡𝑖𝑣𝑖𝑡𝑦 𝑜𝑟 𝑑𝑒𝑓𝑙𝑒𝑐𝑡𝑖𝑜𝑛 𝑓𝑎𝑐𝑡𝑜𝑟 =1
𝑆𝑒𝑛𝑠𝑖𝑡𝑖𝑣𝑖𝑡𝑦=
∆𝑞𝑖
∆𝑞𝑜
(iii) Reproducibility: It is the degree of closeness through which a given value is repeatedly measured. Perfect reproducibility means that the instrument has no drift. No drift means that with a given input the measured values do not vary with respect to time.
(iv) Drift: Drift may be classified into three categories: a) Zero drift: If the whole calibration gradually shifts due to slippage then zero drift occurs. b) Span drift: If the output varies proportionally with respect to nominal curve and increase for upward
scale with the nominal curve than it is called span drift. c) Zero and span drift: When the combination of both zero and span drift occurs, then the instrument
shows both drift at the same time.
(i) (ii) (iii)
Figure1.3 (i) Zero drift,(ii) Span drift,(iii)Zero and span drift (v) Static Error When the instrument reading do not reach to the true value then error occurs which is termed as static error. The accuracy of an instrument is measured in terms of its error. It is never possible to measure the true or exact value of a quantity; it is nearly always possible to give a best measured value. Static error is defined as the difference between the measured value and the true value of the quantity. Then:
δA =Am - At .......(1) Where δA = error, Am =measure value of quantity,
(vi) Dead Zone If large change in the input quantity for which no output is indicated by instrument is called as dead zone. This is mainly due to backlash or hysteresis in the instrument.
Precision: It defines the reproducibility of the measurements for the same applied input signal. The term precise means clearly or sharply defined. High precision is achieved by clearly defined, finely divided, distinct scale and a knife edge pointer with mirror arrangement to remove parallax.
Nominal characteristics
Characteristics
with zero drift
Output
Input
Span drift
Nominal characteristics
Output
Input
Zero &Span
drift
Nominal characteristics
Output
Input
Downloaded from www.rgpvnotes.in
Page no: 3 Get real-time updates from RGPV

Indication of Precision Precision is composed of two characteristics: (i) Conformity (ii) Number of significant figures Precision is used in measurements to describe the reproducibility of results. High precision means accurate reading for repeated results while low precision indicates error in results. Linearity:
When the output signal is directly proportional to the input signal defines the linearity of measurement. Figure 1.4 shows the curve between actual curve and it maximum deviation with respect to the straight line.
Figure 1.4 Curve between Actual and Maximum deviation
𝑁𝑜𝑛 𝑙𝑖𝑛𝑒𝑎𝑟𝑖𝑡𝑦 =𝑀𝑎𝑥𝑖𝑚𝑢𝑚 𝑑𝑒𝑣𝑖𝑎𝑡𝑖𝑜𝑛 𝑜𝑓 𝑜𝑢𝑡𝑝𝑢𝑡 𝑓𝑟𝑜𝑚 𝑡ℎ𝑒 𝑖𝑑𝑒𝑎𝑙𝑖𝑧𝑒𝑑 𝑠𝑡𝑟𝑎𝑖𝑔ℎ𝑡 𝑙𝑖𝑛𝑒
𝐹𝑢𝑙𝑙 𝑠𝑐𝑎𝑙𝑒 𝑑𝑒𝑓𝑙𝑒𝑐𝑡𝑖𝑜𝑛× 100
Repeatability:
Repeatability is the degree of closeness through which a given input quantity is measured again and again. Resolution: When the input is gradually varied from some non-zero value and there is no change in output until a small increment. This increment is called resolution of the instrument. Threshold: When the input is gradually varied from zero value and it is found that for the minimum value no output is detected is called the threshold value. Range or Span: The minimum & maximum value of a quantity for which an instrument is designed for measurement is called its range or span.
Hysteresis When measured variable is increasing at that point if output curve is decreasing then there maximum output hysteresis is present. If the same happen in Negative side also then it is called as Maximum input hysteresis as shown in Figure 4. The hysteresis is normally defined in percentage of the full-scale of input or output reading.
Figure 1.5 Instrument characteristic with hysteresis Hysteresis occurs in instruments that contain electrical windings formed by rounding wire on an iron core, due to the magnetic field. This occurs in devices like the variable inductance displacement transducer or in LVDT.
Actual curve
Maximum deviation
Idealized straight line
Output
Input
Downloaded from www.rgpvnotes.in
Page no: 4 Get real-time updates from RGPV

Loading Effect:
When the signal is applied for measurement purpose in that case the measuring of quantity is done by various elements which require some energy for their operation. This energy is extracted from the applied input signal and due to this the signal gets distorted and the same value is not measured. This is called the loading effect. Loading Effect of a Voltmeter: The necessary requirements for any measuring instruments are:
(i) With the introduction of the instrument in the circuit, the circuit conditions should not be altered. Thus, the quantity to be measured should not get affected due to the instrument used.
(ii) The power consumed by the instruments for their operation should be as small as possible.
Ideally, the voltage measuring device must have infinite input impedance. But practically the input impedance of voltage measuring devices is very high but finite. Due to this, the devices keeps on drawing some current from the test circuit by measuring device is called Loading Effect. Higher the value of current drawn by the device, higher is the loading effect & higher is the error in the measurement.
Consider an example where a voltmeter is used to measure the voltage across a resistor in the circuit fig.1.6
With voltmeter V2, Zin = 100KΩ appears in parallel with 5KΩ & effectively becomes, R’ = 5KΩ|| 100KΩ = 4.762KΩ
V2 =4.762𝑋103
(10+4.762)𝑋103 𝑋100 = 32.253𝑉
Thus, voltmeter V2 draws more closer to true value as its Zin is high & it draws less current comparatively. Hence, higher the input impedance of the voltage measuring device, lesser is the loading effect & loading error. Problem: The expected value of the voltage across a resistor is 120V. However, the measurement gives a value of 118V. Calculate absolute error, % error, relative accuracy & % of accuracy. Solution: Given: The expected voltage drop (Yn) across a resistor = 120V On measurement, measured value (Xn) across the resistor = 118V
(i) Absolute error, e = Yn – Xn = 120V – 118V = 2V
(ii) % Error = (Yn – Xn/ Yn)X100 = [(120 – 118)/120]X100 = 1.67%
(iii) Relative accuracy, A = 1 - | (Yn – Xn)/Yn) | = 1 - | (120 – 118)/120) | = 0.9833
(iv) % of accuracy, a = 100 X A = 100 X 0.9833 = 98.33% Or
For voltmeter V1 , Zin = 10KΩ; V1 , Zin = 100KΩ
100V
Voltage to be
measured
10 KΩ
5 KΩ V1 V2
Fig. 1.6: Loading Effect of a voltmeter
From the circuit, true value of voltage
across the terminals A-B is
Vtrue =5𝑋103
[(5+10)𝑋103]𝑋100 = 33.33𝑉
With voltmeter V1, Zin = 10KΩ appears
in parallel with 5KΩ & effectively
becomes,
R’ = 5KΩ|| 10KΩ = 3.33KΩ
V1 =3.33𝑋103
(10+3.33)𝑋103 𝑋100 = 25𝑉
Thus, voltmeter V1 draws more current
& measures only 25V, though true
value to be measured is 33.33V
Downloaded from www.rgpvnotes.in
Page no: 5 Get real-time updates from RGPV
a = 100% -% of error = 100% -1.67% = 98.33%
Dynamic Characteristics: Instruments rarely respond instantaneously to changes in the measure variables. Instead they exhibit slowness or sluggishness due to mass, thermal capacitance, electric capacitance. The dynamic behavior of an instrument is determined by subjecting its primary element (sensing element) to some unknown & predetermined variations in the measured quantity. Dynamic characteristics of an instrument are: (i) Speed of Response: It is the rapidity with which an instrument responds to changes in the measured quantity. (ii) Fidelity: It is the degree to which an instrument indicates the changes in the measured variable without dynamic error (faithful reproduction). (iii) Lag: It is the retardation or delay in the response of an instrument to changes in the measured variable. (iv) Dynamic Error: It is the difference between the true value of a quantity changing with time & the value indicated by the instrument, if no static error is assumed.
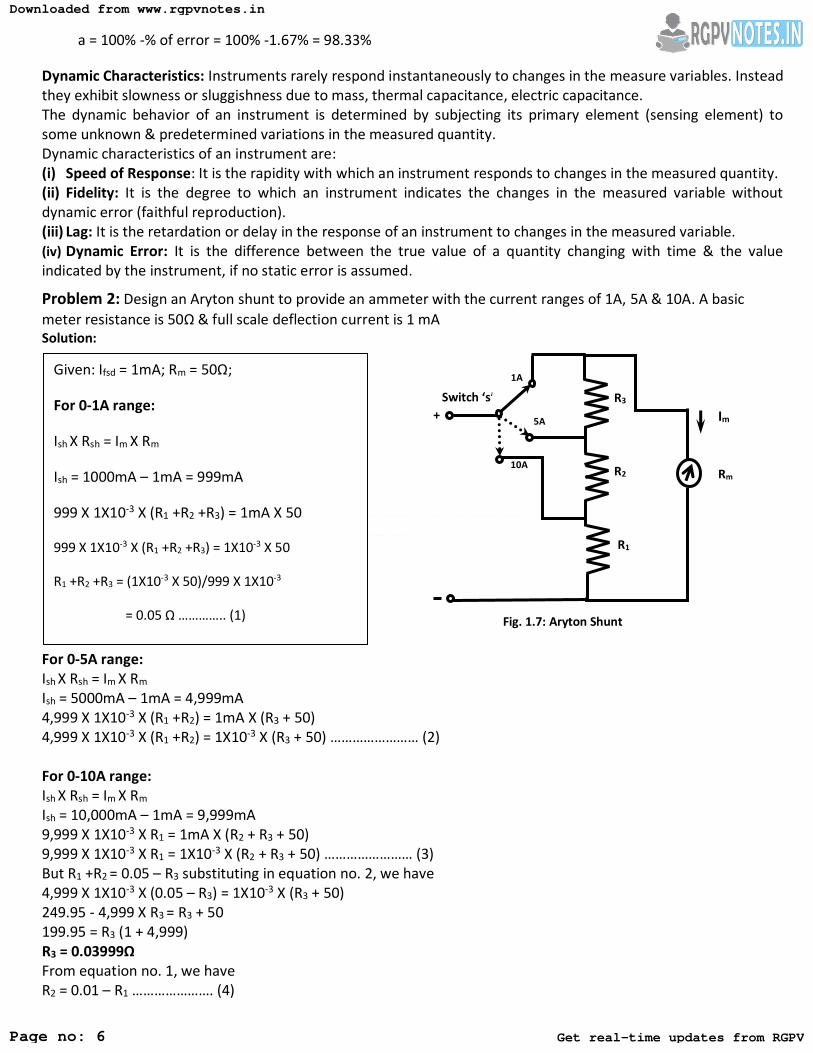
Problem 2: Design an Aryton shunt to provide an ammeter with the current ranges of 1A, 5A & 10A. A basic
meter resistance is 50Ω & full scale deflection current is 1 mA Solution:
Fig. 1.7: Aryton Shunt
For 0-5A range: Ish X Rsh = Im X Rm
Ish = 5000mA – 1mA = 4,999mA 4,999 X 1X10-3 X (R1 +R2) = 1mA X (R3 + 50) 4,999 X 1X10-3 X (R1 +R2) = 1X10⁻³ X (R3 + 50) …………………… (2) For 0-10A range: Ish X Rsh = Im X Rm
Ish = 10,000mA – 1mA = 9,999mA 9,999 X 1X10-3 X R1 = 1mA X (R2 + R3 + 50) 9,999 X 1X10-3 X R1 = 1X10⁻³ X (R2 + R3 + 50) …………………… (3) But R1 +R2 = 0.05 – R3 substituting in equation no. 2, we have 4,999 X 1X10-3 X (0.05 – R3) = 1X10⁻³ X (R3 + 50) 249.95 - 4,999 X R3 = R3 + 50 199.95 = R3 (1 + 4,999) R3 = 0.03999Ω From equation no. 1, we have R2 = 0.01 – R1 …………………. (4)
Given: Ifsd = 1mA; Rm = 50Ω;
For 0-1A range:
Ish X Rsh = Im X Rm
Ish = 1000mA – 1mA = 999mA
999 X 1X10-3 X (R1 +R2 +R3) = 1mA X 50
999 X 1X10-3 X (R1 +R2 +R3) = 1X10-3 X 50
R1 +R2 +R3 = (1X10-3 X 50)/999 X 1X10-3
= 0.05 Ω ………….. (1)
Switch ‘s”
5A
mA
10A
1A
Rm
Im +
R3
R2
R1
Downloaded from www.rgpvnotes.in
Page no: 6 Get real-time updates from RGPV

Substituting value of R2 in equation no. 3, we have 9,999 X 1X10-3 X R1 = 1X10-3 X (0.01 – R1 + 0.03999 + 50) 9,999 X 1X10-3 X R1 = 1X10-3 X (50.04999 – R1) On solving, R1 = 0.005Ω R2 = 0.01 – R1 = 0.01 – 0.005 R2 = 0.005Ω Hence, multiplier resistor R1, R2, R3 has values as 0.005Ω, 0.005Ω, 0.03999Ω respectively. Error is the deviation from the true value of the measured variable. No measurement can be made with perfect accuracy but it is important to find out what the accuracy is & how different errors have entered into the measurement. Study of errors is a first step to reduce them & to determine the accuracy of the final test result.
% Error =𝒂𝒄𝒕𝒖𝒂𝒍−𝒂𝒑𝒑𝒂𝒓𝒆𝒏𝒕 𝒗𝒂𝒍𝒖𝒆
𝒂𝒄𝒕𝒖𝒂𝒍 𝒗𝒂𝒍𝒖𝒆𝑿𝟏𝟎𝟎
Errors may come from different sources & it may be classified as: 1) Gross Errors: Largely human errors, among them misreading of instruments, incorrect adjustment & improper application of instruments & computational mistake. Some gross errors are easily detected; others may be elusive. One common gross error committed frequently by beginners in measurements, involves the improper use of an instrument. In general, indicating instruments change conditions to some extent when connected into a complete circuit so that the measured quantity is altered by the method employed. 2) Systematic Errors: Short comings of the instruments such as defective or worn parts & effects of the environment on the equipment or the user. Two types of systematic errors:
a) Instrumental errors, defined as short comings of the instrument b) Environmental errors, due to external conditions affecting the measurement.
a) Instrumental Error: These are the errors inherent in measuring instruments because of their mechanical structure. For example, in the d’arsonval movement friction in bearings of various moving components may cause incorrect readings It can be avoided by: i) Selecting a suitable instrument for the particular measurement application. ii) Applying correction factors after determining the amount of instrumental errors iii) Calibrating the instrument against a standard. b) Environmental Errors: These are due to conditions external to the measuring device, including conditions in the areas surrounding the instrument, such as the effects of changes in temperature, humidity, barometric pressure or of magnetic or electrostatic fields. To reduce these types of errors one can include air conditioning, hermetically sealing certain components in the instrument, use of magnetic shields. Systematic errors can also be sub divided into static & dynamic errors. Static errors are caused by limitations of the measuring device or the physical laws governing its behavior. A static error is introduced in a micrometer when excessive pressure is applied in torquing the shaft. Dynamic errors are caused by the instrument’s not responding fast enough to follow the changes in a measured variable. 3) Random Errors: Those due to causes that cannot be directly established because of random variations in the parameter or the system of measurement. Problem 3: A PMMC instrument with full scale deflection current = 50µA & Rm = 1700Ω is to be employed as a voltmeter with ranges of 10V, 50V & 100V. Calculate the required values of multiplier resistors for the circuits. Solution:
Given: Ifsd = 50µA; Rm = 1700Ω;
Voltage ranges: 0-10V; 0-50V; 0-100V
Required multiplier resistance will be,
For 0-10V range at V3 position:
Total circuit resistance is
V2
V3
V1
R1 R2 R3
Downloaded from www.rgpvnotes.in
Page no: 7 Get real-time updates from RGPV

Fig. 1.8: voltmeter with ranges of 10V, 50V & 100V
For 0-50V range at V2 position: Total circuit resistance is Rt =V/Ifsd = 50/50µA = 1MΩ Therefore, R2 = Rt –Rm = 1MΩ - 1700Ω R2 = 0.9983MΩ For 0-100V range at V3 position: Total circuit resistance is Rt =V/Ifsd = 100/50µA = 2MΩ Therefore, R3 = Rt –Rm = 1MΩ - 1700Ω R3 = 1.9983MΩ
Downloaded from www.rgpvnotes.in
Page no: 8 Get real-time updates from RGPV

True RMS Reading Voltmeter The measurement of complex waveform is done with the help of True RMS Voltmeter. For such type of voltmeter input is applied to the heater. The heater is heated up and transforms heat energy to the thermocouple. Coupling thermocouple converts the heat into electrical voltage which is applied to the DC amplifier. DC amplifier amplifies the DC signal and applied to PMMC instrument for indicating the voltage output. To provide accurate measurement the output is feedback to the input side where the heater is heated up and balancing thermocouple converts the DC signal to voltage. The function of feedback loop is to provide balanced condition for measuring thermocouple which is present in form of non linearity. Figure 1.9 shows the construction of true RMS voltmeter.
Figure 1.9: Diagram of True RMS reading voltmeter
Average Reading AC Voltmeters Average reading voltmeters are used for measuring AC signals in terms of calibrated RMS value on the meter scale. This measurement can be achieved by using Vacuum tube diode and a resistance which is connected in parallel with the applied AC voltage as shown in figure 1.10.
Figure 1.10: ac Voltmeter using Vacuum Tube Diode
To amplifier and meter
R AC voltage to be measured
Vacuum tube diode
Measuring
Thermocouple
ac Input
Voltage
DC
Amplifier
V2
Balancing
Thermocouple
V1
PMMC
Indicating
Instrument
Downloaded from www.rgpvnotes.in
Page no: 9 Get real-time updates from RGPV

Vacuum tube diode should have linear volt –current characteristics. This is essential to make current directly proportional to the applied input signal. The PMMC instrument is used for measurement of input signal. The average current through the meter will be given by the expression
I𝑎𝑣 =Vav
2R= 0.45 ∗ [
Vrms
𝑅]Iav
Vrms is the rms value of applied voltage. I𝑎𝑣 𝑖𝑠 𝑡ℎ𝑒 𝑎𝑣𝑒𝑟𝑎𝑔𝑒 𝑐𝑢𝑟𝑟𝑒𝑛𝑡 𝑚𝑒𝑎𝑠𝑢𝑟𝑒𝑑. Peak Reading AC Voltmeter: Peak Reading AC Voltmeter uses semiconductor diode for making measurement in term of DC signal. The half wave rectifier is used with capacitor connected in parallel form with the applied input signal. The output of rectifier is pulsating DC which is applied to the capacitor. The function of capacitor is to pass the AC signal present in rectified output and blocks the DC signal .This action provides static output which is applied to the load resistance to measure DC output with the help of PMMC instrument. The circuit arrangement is as shown in figure 1.11.
Figure 1.11: Diode Rectifier with related waveform When the positive half cycle is applied across the diode it becomes forward biased and acts as a closed switch. The current flows through the device and positive going cycle is present at the output side. In negative half cycle the diode is reversed biased and it acts as open switch.
1. Rectifier type Voltmeter Bridge rectifier consists of four diodes which are connected in the form of the bridge. The AC input voltage is applied to step down transformer which is provided to the bridge rectifier to convert AC signal to average DC signal. The resistance R is connected across the bridge. The DC
To amplifier and
Meter C
AC voltage Input
Diode R
Rectified Voltage at the
terminals of Resistance R
Volts
Time
Downloaded from www.rgpvnotes.in
Page no: 10 Get real-time updates from RGPV

signal measured across the resistance is directly proportional to the applied input signal. The bridge rectifier circuit is shown in figure 1.12 Operation: For the first positive half cycle of the input AC voltage diodes D1 and D2 becomes forward biased and current flows from positive terminal to D1 to R to D2 and reaches to negative terminal, whereas diodes D3 and D4 remains in reverse biased condition and no current flows through it.
Figure 1.12: Bridge rectifier circuit diagram
For the negative half cycle the diodes D3 and D4 are forward biased and current flows in same direction from D3 to R to D4 to negative terminal, whereas diodes D1 and D2 remains in reverse biased condition and no current flows through it. Hence with the help of bridge rectifier the positive and negative going cycles i.e. AC signal is converted into positive going cycles i.e. DC signal.
Electronic Multi meters Electronic multi meter is the measuring instrument which is used for measurement of AC, DC voltages and current. With the help of multi meter resistance can also be measured. The multi meter uses the application of differential amplifier. The differential amplifier is implemented by using FET as semiconductor device. Multi meter consists of following elements: • Balanced-bridge with DC amplifier and indicating meter • RANGE switch is used to limit the value of the applied input voltage to the desired value for measurement • Rectifier to convert an AC input voltage to a proportional DC value • to measure the resistance, internal battery and additional circuitry is provided • FUNCTION switch is used to select the various measurement functions of the instrument working of individual Components Balanced Bridge DC amplifier Figure 1.13 shows the balanced bridge DC amplifier which uses FET for various measurements.
D4
D3
D2
D1
Vo VS Vmsinωt R
Downloaded from www.rgpvnotes.in
Page no: 11 Get real-time updates from RGPV
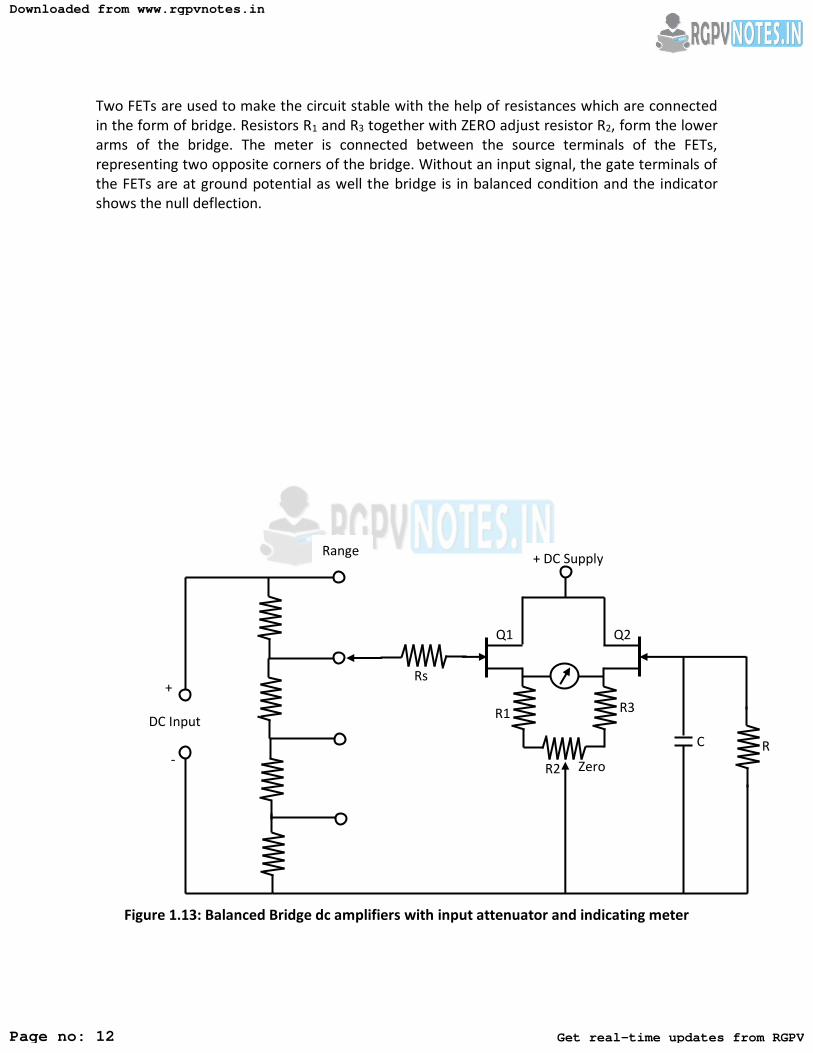
Two FETs are used to make the circuit stable with the help of resistances which are connected in the form of bridge. Resistors R1 and R3 together with ZERO adjust resistor R2, form the lower arms of the bridge. The meter is connected between the source terminals of the FETs, representing two opposite corners of the bridge. Without an input signal, the gate terminals of the FETs are at ground potential as well the bridge is in balanced condition and the indicator shows the null deflection.
Figure 1.13: Balanced Bridge dc amplifiers with input attenuator and indicating meter
C R
Zero R2
R1 R3
+ DC Supply
Q2 Q1
Rs
-
+
Range
DC Input
Downloaded from www.rgpvnotes.in
Page no: 12 Get real-time updates from RGPV

With no any input is applied to instrument and it shows deflection on indicator then with the help of ZERO adjustment using R2 potentiometer the null deflection is set. Output Indication When a positive voltage is applied to the gate of FET Q1 its drain current increases which causes the voltage at across bridge to rise. Due to rise in voltage as compared with Q2, the bridge becomes unbalance and meter indicates the reading which is directly proportional to applied input signal. Measurement of Low Power Bolometer: Bolometer is an instrument which is used for measurement of low microwave power in the range of 0.01mW to 10 mW. The microwave power in terms of heat energy is sensed by RTD which has positive temperature coefficient of resistance and converts the heat energy into electrical resistance. The resistance is converted into electrical voltage with the help of Wheatstone bridge. The RTD is inserted into one arm of the bridge where other three arms are fixed resistance. When the bridge all the resistances of each arm are equal, then the output voltage is null. When microwave power is applied on RTD its resistance changes, results in unbalancing the bridge, hence potential difference is created across the bridge. The resultant output voltage is directly proportional to applied input power. For making the bridge in balanced condition auxiliary RTD is used in parallel with the battery, which maintains the bridge into null condition when power is not applied. Figure 1.14 shows the circuit diagram of Bolometer.
RTD RTD
R 7
R 5
R 6
Battery
mA
R 1
Microwave power
R 3
R 2
G
mA
R 1
Microwave power
R 3
R 2
G
Downloaded from www.rgpvnotes.in
Page no: 13 Get real-time updates from RGPV

Figure 1.14: Bolometer for low power measurement
Calorimeter: Calorimeter is an instrument used for measurement of medium microwave power between the ranges of 10mW to 1W. Water is used for measurement of microwave power, where microwave power is transferred to the water and the difference of outlet temperature to inlet temperature is directly proportional to applied microwave power. It consists of one waveguide; glass tube inserted into waveguide, water pump, flow meter and thermometer fro measurement of temperature. Water is pumped with water pump and provided to glass tube which is placed into the waveguide which senses the temperature and provided to outlet. The flow of water is measured with the help of flow meter.
Figure 1.15: Calorimeter for medium power measurement P=4.187 V d Cp T watts P is power; V is rate of flow of calorimeter; D is specific gravity; Cp is specific heat Chopper Type Micro Voltmeter the dc input voltage is converted into an ac voltage amplifies by an ac amplifier & then converted back into a dc voltage proportional to the original input signal. To measure small voltages, a chopper type dc amplifier is used. PRINCIPLE: Referring fig 1.16, an ac amplifier which has a very small drift compared to a dc amplifier is used. The chopper may be mechanical or electronic. Photo diodes are used as non-mechanical chopper for modulation (conversion of dc to ac) & demodulation (conversion of ac to dc) Photo conductors have a low resistance, ranging from a few hundreds to a few thousand ohms, when they are illuminated by a neon or incandescent lamp. Photo conductors resistance increases sharply (several MΩ) when not illuminated. A chopper amplifier is normally used for the first stage of amplification in very sensitive instrument of a few µV ranges. In such an amplifier, the dc voltage is chopped to low frequency of 100-300Hz. It is passed through a blocking capacitor, amplified & then passed through another blocking capacitor to remove the dc drift of the amplified signal. Basic Principle: Referring fig. 1.17 & 1.18 a flashing light source, whose intensity varies from maximum to minimum almost instantaneously, causes the photo diode resistance to change
Flow meter
Water out
Outlet temperature Inlet
temperature
Pump
Waveguide
Water in
Glass tube for water flow
Microwave power input
Downloaded from www.rgpvnotes.in
Page no: 14 Get real-time updates from RGPV

from Rmin to Rmax quickly. Therefore, the output voltage is an ac, because the photo diode has a high output when its resistance is high & a low output when its resistance is low. Working: Referring the fig.1.19, an oscillator drives two neon lamps into illumination on alternating half cycles of oscillation. The oscillator frequency is limited to a few 100 cycles, because the transition time required for the photo diode to change from high resistance to a low resistance limits the chopping range. Each neon lamp illuminates one photo diode in the input circuit of the amplifier & one in the output circuit. The two photo diodes form a series shunt half wave modulator or chopper. When one photo diode or the input has maximum resistance, the other has minimum resistance. The same condition exists at the output circuit. Together they acts as a switch across the input to the amplifier, alternatively opening & closing at a rate determined by the frequency of the neon oscillator. The input signal to the amplifier is a square wave whose amplitude is proportional to the input voltage with a frequency equal to the oscillator frequency. The ac amplifier delivers an amplified square wave at its output terminals.
Photo
Diode Output (Vout)
R
DC
Supply
Time
Vout
Fig. 1.17: Electronic Modulator Fig.1.18 Output from the circuit
Flashing Light
Low level
input signal
dc amplified
signal
CHOPPER
MODULATOR
CHOPPER
DEMODULATOR
LOW PASS
FILTER
OSCILLATOR
Blocking capacitors
ac amplifier
Fig.1.16: Principle of operation (chopper type voltmeter)
Downloaded from www.rgpvnotes.in
Page no: 15 Get real-time updates from RGPV

The photo diodes (demodulator) in the output circuit operate in antisynchronously with the input chopper, recovering the dc signal by demodulating action. The dc output signal is then passed to a low pass filter to remove any residual ac component. This amplified drift free dc output is then applied to a PMMC movement for measurement. The chopper eliminates the needs of high gain dc amplifier with its inherent drift & stability problems. A commercially available instrument using a photo chopper amplifier has an impedance of 100MΩ a resolution of 0.1µV & input ranges from 3µV full scale to 1KV full scale with an accuracy of ±2% of full scale deflection. Advantages: The input impedance of a chopper amplifier of the order of 10MΩ or higher. With the use of ac amplifier, drift can be cut down by a factor of 100, thus allowing an input signal range of about 0.01mV = 10µV full scale to be handled.
Figure 1.19: Circuit Diagram of a Chopper Type Micro Voltmeter
Chopper
Demodulator
ac Amplifier
Amplified
DC output
Low
Level
DC Input
Neon
Lamp
Neon
Lamp
Photo
Conductors
C C
Chopper
Modulator Low
pass
Filter
Output
Capacitor
Neon
Oscillator
Downloaded from www.rgpvnotes.in
Page no: 16 Get real-time updates from RGPV

We hope you find these notes useful.
You can get previous year question papers at
https://qp.rgpvnotes.in .
If you have any queries or you want to submit your
study notes please write us at
Copyright © 2022 FDOKUMEN