Analytical Chemistry / Instrumentation Environmental Analysis ...
11
Analytical Chemistry / Instrumentation Environmental Analysis Analysis of SPM &TSP Paper No. :15Environmental Analysis Module :27 Analysis of SPM &TSP Principal Investigator: Dr.Nutan Kaushik, Senior Fellow The Energy and Resources Institute (TERI), New Delhi Co-Principal Investigator: Dr. Mohammad Amir, Professor of Pharm. Chemistry, JamiaHamdard University, New Delhi Paper Coordinator: Dr. NimishaJadon, Assistant Professor, School of Studies in Environmental Chemistry,Jiwaji University, Gwalior Content Writer: Dr. NimishaJadon, Assistant Professor, School of Studies in Environmental Chemistry,Jiwaji University, Gwalior Content Reviwer: Prof. Rajeev Jain, Professor of Chemistry, Jiwaji University, Gwalior
-
Upload
khangminh22 -
Category
Documents
-
view
0 -
download
0
Transcript of Analytical Chemistry / Instrumentation Environmental Analysis ...

Analytical Chemistry
/ Instrumentation
Environmental Analysis
Analysis of SPM &TSP
Paper No. :15Environmental Analysis
Module :27 Analysis of SPM &TSP
Principal Investigator: Dr.Nutan Kaushik, Senior Fellow The Energy and Resources Institute (TERI), New Delhi
Co-Principal Investigator: Dr. Mohammad Amir, Professor of Pharm. Chemistry, JamiaHamdard University, New Delhi
Paper Coordinator: Dr. NimishaJadon, Assistant Professor, School of Studies in Environmental Chemistry,Jiwaji University, Gwalior
Content Writer: Dr. NimishaJadon, Assistant Professor, School of Studies in Environmental Chemistry,Jiwaji University, Gwalior
Content Reviwer: Prof. Rajeev Jain, Professor of Chemistry, Jiwaji
University, Gwalior

Analytical Chemistry
/ Instrumentation
Environmental Analysis
Analysis of SPM &TSP
Description of Module
Subject Name Analytical Chemistry / Instrumentation
Paper Name Environmental Analysis
Module Name/Title Analysis of SPM &TSP
Module Id 27
Pre-requisites
Objectives
Keywords

Analytical Chemistry
/ Instrumentation
Environmental Analysis
Analysis of SPM &TSP
In order to develop and implement an effective air quality management plan, it is a pre-
requisite to obtain reliable information on ambient pollution levels. Sampling and
measurement of air pollutants, generally known as air quality monitoring, is an integral
component of any air pollution control programme. Purpose of monitoring is not merely to
collect data but to provide the necessary information required by scientists, policy makers and
planners. In general, air monitoring is done with the following objectives:
(i) To ascertain air quality of a particular place.
(ii) To identify specific sources of air pollution.
(m) To determine the degree of air pollution control required for existing industries.
(iv) To assess the efficiency of the air pollution control equipments.
(v) To provide information in cases of legal processes.
(VI) To analyse or assess environmental impact.
(vii) For purely research investigations.
SUSPENDED PARTICULATE MATTER (SPM)/TOTAL
SUSPENDEDPARTICULATES (TSP)
Particulate matters were released by a great variety of sources. Both stationary and mobile
sources emit particulate pollutants. Moreover, chemical and physical conversion of natural
and anthropogenic substances in the atmosphere also results in the formation of particles.
The particles vary in size from 0.01 pm to >100 pm.
The study of particulate matter can be carried out under two categories:
(i) Suspended matter and
(ii) Depositable matter
Following terms are generally applied describing atmospheric particulate matter:
(i) Smoke
(ii) Total suspended particulates (TSP
Sampling
The most common method of sampling particulate matter is by collecting it on a filter paper
by drawing a sample of contaminated air through a filter. Most of the instruments used for
monitoring either class of particulates are merely collectors and their function is to permit
measurement of collected material. The analysis of the weight or number of particles is done
separately.
Filters
The type of filters paper used depends on the purpose for which the sampling is being
conducted.
Analytical Chemistry
/ Instrumentation
Environmental Analysis
Analysis of SPM &TSP
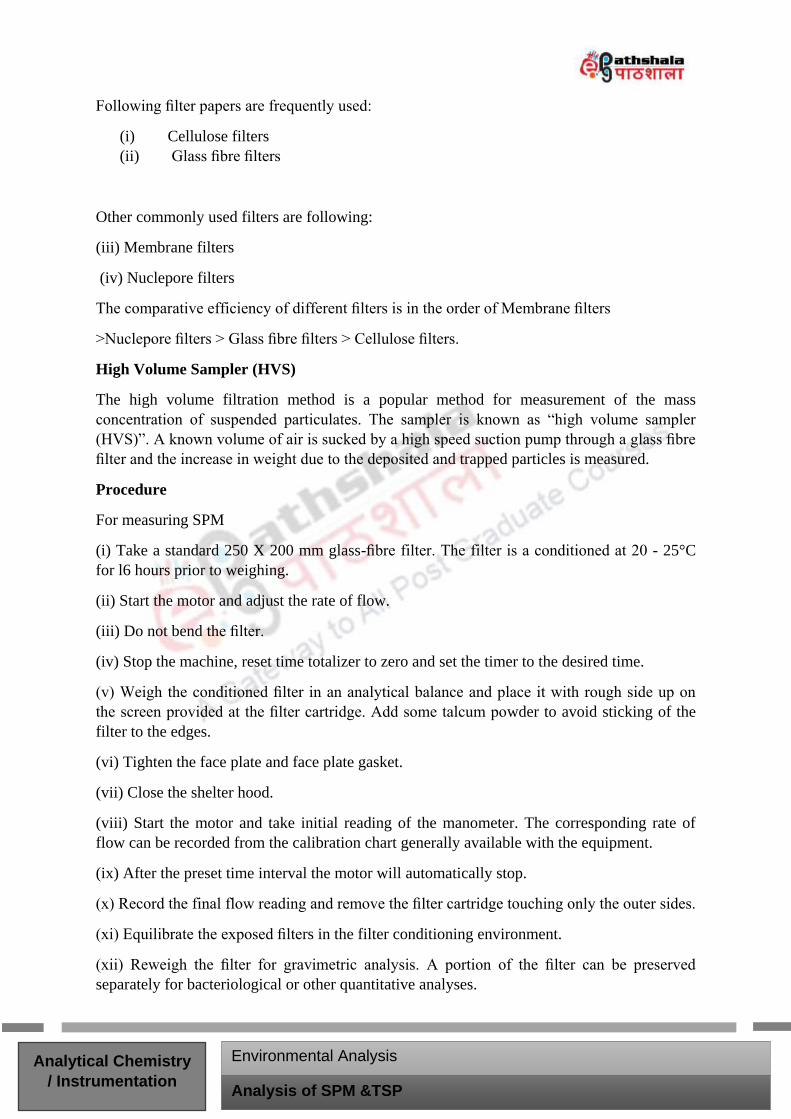
Following filter papers are frequently used:
(i) Cellulose filters
(ii) Glass fibre filters
Other commonly used filters are following:
(iii) Membrane filters
(iv) Nuclepore filters
The comparative efficiency of different filters is in the order of Membrane filters
>Nuclepore filters > Glass fibre filters > Cellulose filters.
High Volume Sampler (HVS)
The high volume filtration method is a popular method for measurement of the mass
concentration of suspended particulates. The sampler is known as “high volume sampler
(HVS)”. A known volume of air is sucked by a high speed suction pump through a glass fibre
filter and the increase in weight due to the deposited and trapped particles is measured.
Procedure
For measuring SPM
(i) Take a standard 250 X 200 mm glass-fibre filter. The filter is a conditioned at 20 - 25°C
for l6 hours prior to weighing.
(ii) Start the motor and adjust the rate of flow.
(iii) Do not bend the filter.
(iv) Stop the machine, reset time totalizer to zero and set the timer to the desired time.
(v) Weigh the conditioned filter in an analytical balance and place it with rough side up on
the screen provided at the filter cartridge. Add some talcum powder to avoid sticking of the
filter to the edges.
(vi) Tighten the face plate and face plate gasket.
(vii) Close the shelter hood.
(viii) Start the motor and take initial reading of the manometer. The corresponding rate of
flow can be recorded from the calibration chart generally available with the equipment.
(ix) After the preset time interval the motor will automatically stop.
(x) Record the final flow reading and remove the filter cartridge touching only the outer sides.
(xi) Equilibrate the exposed filters in the filter conditioning environment.
(xii) Reweigh the filter for gravimetric analysis. A portion of the filter can be preserved
separately for bacteriological or other quantitative analyses.

Analytical Chemistry
/ Instrumentation
Environmental Analysis
Analysis of SPM &TSP
High volume air sampler
Calculation
Air volume sampled in Cubic meters = V = (Qt — Q2)/2xt
Where, Q1 = Initial air flow in m3/min.
Q2 = Final airflow in m3/min.
t = Sampling time in minutes
Mass concentration of SPM = (W2 - W1)/V x 106
Where, W2 = Final mass of filter in grams
W1 = Initial mass of filter in grams
V = Air volume in cubic meters.
Cascade lmpactor
The particulate matter collected on the filters is of different size. Size of different particles
can be determined microscopically, but it is not only highly laborious but larger particles tend
to obscure the smaller ones, making counting difficult. The cascade impactors are capable of
differentiating the particles according to size on the basis of their aerodynamic impaction
properties. The best-known cascade impactor is Andersen sampler.
Principle
The design concept of the Andersen sampler has been evolved from the human respiratory
tract which is an aerodynamic classifying system for airborne particles.
The Instrument
Andersen sampler consists of seven impaction stages, backed by an efficient filter. There are
360 holes in each of the top 3 stages and 400 in each of the remaining four. Beneath each
hole there is a solid plate.
Analysis of Total Particulate Matter
Total particulate pollutants, which have been collected on the filter papers, can be determined
either by direct gravimetric determination of collected particles or by the measurement of
degree of soiling of a filter paper by the diminution of light reflectance from it. The above
methods are being discussed below:

Analytical Chemistry
/ Instrumentation
Environmental Analysis
Analysis of SPM &TSP
Gravimetric Determinations
In this technique measured volumes of air are sampled by means of high volume air sampler
using previously dried and weighed glass fibre filters.
The filter should be an 8" >< 10" sheet of fibre glass.
(i) Equilibrate glass fibre filters to constant weight in a controlled temperature and humidity
environment.
(ii) Take samples over 24 hour or 48 hour period at a flow rate of 25—50 ft3 / minute.
(iii) Equilibrate the filters again at the same humidity and temperature condition and weigh.
(iv)The difference in the two weights gives the amount of particulate matter collected. The
average sample collected is generally 50 to 250 mg.
Dust Stain Index(Smoke Stain Index)
In this method the light transmitted or reflected by particulate deposits on filters is measured.
Draw a measured volume of air through a small spot on a circle of filter paper or membrane
filter. Carry out transmittance and reflectance measurements on the stains produced by the
collected samples to evaluate the dust burden of the atmosphere.
(i) C0-efificient of Haze (COH): ACOH unit has been defined as that quantity of particulate
material which produces an optical density of 0.01 at 400 nm wavelengths and when
compared to the measurements on dustfree filter paper taken as 100%. For example, if a spot
allows 50% of the light to pass through it, it has an optical density of 0.301 and the sample
has a value 0.01/0.0l=30.l COH. Smoke concentrations are expressed in terms of the number
of COH units per 1000 linear feet of air drawn through the filter.
(ii) Reflectance Units of Dirt Shade (RUDS):
Showing simulation of human respiratory system in Andersen Sampler Stage A-10 uM and
above;
The soiling index or RUDS is the percentage reflectance obtained using a reflectometer when
10,000 linear feet of air is drawn through the filter paper. The reflectance of the clean paper is
taken as 100%.
DUST FALL SAMPLING
The amount of dust settling from the atmosphere or being washed out of the air by rain is
very important in the study of air pollution. The instruments, which are used to monitor the
deposition of particulate matter, are ‘deposit gauges’.
Deposit Gauges
The following deposit gauges are being used for sampling the dust fall in different countries:

Analytical Chemistry
/ Instrumentation
Environmental Analysis
Analysis of SPM &TSP
British Standard Deposit Gauge
It consists of a glass or a plastic collecting bowl, measuring 315 mm in diameter with a depth
of 105 mm near the circumference, which increases to 150 mm near the centre. The diameter
versus depth ratio is 1.75: 1. Dust is washed down by rain into a large collecting bottle
situated under the bowl. At the end of the collection period, which is generally one month,
the dust is washed down from the collecting bowl with a measured volume of water into the
collecting bottle.
British standard gauge has a defect. In this case the height to diameter ratio is not correct. To
ensure that the wind will not cause the dust already in the container to be blown out again
French Standard Deposit Gauge
This is very much similar to British StandardGauge. In this case the angles of the lower half
ofthe collecting bowl are comparatively steeper thanthe British Gauge, which prevents the
dust fromblowing out in strong winds. Further, an invertedtruncated conical section present at
the top alsoreduces the danger of dust being blown out.
Norwegian NILU deposit gauge
It is a cylindrical type of deposit gauge. The ratioof the diameter of the orifice to the depth is
of the order 1: 2, which reduces the possibility of loss ofsample by being blown out again. To
furtherprevent the loss of sample in high winds, enoughwater is placed in the gauge at the
start of theexposure period. To prevent the development ofalgae in the container CuSO4 or 2-
methoxyethanolat a concentration of 5% is used.
Methods for Dust Fall Collection
(i) Collect dust with the help of an open collector or any of the deposit gauges described
above placed at a suitable height in the study area. The height to diameter ratio of the
collecting vessel should be 3:1 to ensure that the wind will not blow away the dust already
present in the collecting vessel. To ensure comparability of resultsin a particular survey, all
the collecting vessels should be of the same shape and size.
(ii) Keep a little water at the bottom of the vessel. Add little CuSO4 or 2 mg of quaternary
NH4Cl to the water to prevent the growth of algae.
(iii)After a definite period, which is generally one month, bring the vessels to the laboratory
and screen out leaves, twigs, insects and other non-dust material. Wash the dust out of the
collecting vessel and filter.
The following parameters are determined:
(a) Total weight of dried insoluble material.
(b) Total weight of material dissolved in water.

Analytical Chemistry
/ Instrumentation
Environmental Analysis
Analysis of SPM &TSP
Precautions
(i) There should be no object within 3 meters of the collecting vessel or gauge. Such
obstructions if present can affect the wind flow around the gauge.
(ii) Siting of the gauge in the proximity of sources of dust should be avoided.
(iii) The collecting vessel should be at a height of at least 1.5 mm to avoid ground effects and
to reduce interference from the re-entry of the dust into the air from the ground.
(iv)In case gauges are sited near the trees or tall buildings, the angular height of such objects
from the collecting surface should be less than 30°.
A convenient means for collecting dust fall samples. In this, a perforated polished aluminium
open box is used in which a polyethylene cup, the actual measuring device is placed. The
aluminium box performs the following functions:
(i) It minimizes the loss of samples due to wind action, and
(ii) It reflects the solar heat to evaporate rainwater that may collect in the polyethylene cup.
Carry out sampling as follows:
(a) Weigh the polyethylene cup and place in the aluminium box for a definite period of time.
(b) After coming to the laboratory, evaporate the moisture, if present, and remove leaves,
twigs, insects etc.
(c) Determine the dust by weighing the residue after heating it at 110°C for l hour.
(d) Express the results as mg/cm2/month or metric tons/km2/month.
SOLUBLE AND INSOLUBLE SOLIDS
To determine water— soluble and water insoluble materials following steps are taken:
(i) Wash the inner sides of sampling cup with hot distilled water.
(ii) Filter the washing along with the insoluble material through Whatman No.42 filter paper.
(iii) Evaporate the filtrate and dry for l hour at 110°C.
(iv)Weigh the residue. It will give the amount of soluble solids.
(v) Ash the filter paper and weigh the residue.
This will give the weight of insoluble solids.

Analytical Chemistry
/ Instrumentation
Environmental Analysis
Analysis of SPM &TSP
CHEMICAL ANALYSIS OF PARTICULATE MATTER FOR METALS
Glass fibre filters of the size 10 >< 8 inches (7>< 9 inch exposed surface) are generally
employed for the collection of particulate matter with high volume air samplers. After
collection, filters are analysed for their metal contents. A number of techniques such as X-ray
fluorescence, neutron activation, emission spectrography, ring oven method, polarography,
anodic stripping voltametry, spark source mass spectrometry, and atomic absorption
spectrophotometry are available for the analysis of metallic contents of the particulate matter.
Experimental procedure for only atomic absorption analysis is being discussed below.
Sample Preparation
(i) Cut a strip of the glass fibre filter with the help of a plastic cutter. The size of the strip
depends upon the pollution load in the area being sampled. In case the sampling has been
carried out in urban areas cut a 8Xl inch strip, while for non-urban areas a 8 X 2 inch strip
and for industrial areas the size of the strip depends upon the pollution load in the area.
(ii) Ash the strip in a muffle furnace at 550°C.
(iii) Place the ashed filter in a glass thimble, which is further placed in an extraction tube-I
(iv)Attach the extraction tube to a 150 mL flask containing 8 mL of 19% HCl and 32 mL of
40% HNO3.
(v) Attach the tube with an Ahlin condenser and reflux the acid over the sample for 3 hours.
(vi)Remove the extraction tube and the condenser from the flask,
(vii) Concentrate the extracted liquid to l—2 mL on a hot plate and cool overnight.
(viii) Transfer the concentrated liquid to a graduated centrifuge tube.
(ix) Wash the flask at least thrice with 5 to l0 drops of diluted acid
(x) Dilute the sample to a known volume and centrifuge at 2000 mL-l for 30 minutes. Decant
the supernatant in a polypropylene tube, put the cap and store. This solution generally
requires further dilution before analysis.
Analysis
Aspirate the solution directly to AAS for analysis of metal contents.As, Ba, Cd, Cr, Cu, Fe,
Mn, Pb, Tl, V and Zn are generally estimated by this technique.
Precautions
Following precautions should be observed to prevent chances of contamination and to
eliminate matrix effects and interferences:
(i) Silica may cause interference with Ca, Mn, Zn and Fe and should be removed before
aspirating the liquid into AAS. For this, the acid extract is allowed to stand overnight
followed by centrifugation.

Analytical Chemistry
/ Instrumentation
Environmental Analysis
Analysis of SPM &TSP
(ii) HNO3 and HCl acid used should be of thepurest possible grade or otherwise bedistilled in
all glass apparatus to removemetal contaminants.
Prepare a calibration curve with various concentrations of standard chloride solution.
Calculate the amount of chloride ions in the solution with the help of calibration curve.
(ii) Iron (Fe3*) Perchlorate Method
Principle
In the presence of chlorine, iron perchlorate in perchloric acid produce an intense yellow
coloured complex. Optimum concentration for the acid is 8.5 M.
Reagents Required
(i) Sampling solution (0.1 M),
(ii) Iron (Fe3+ ) perchlorate in 5M perchloric acid (absorbing solution)
(iii) Standard chloride solution
Procedure
(i) Draw the air sample in 10 mL of absorbing solution.
(ii) Measure the absorbance at 350 nm using clean absorbing solution as a reference.
(iii) Prepare a calibration curve with various concentrations of Standard chloride solution.
(iv) Calculate the amount of chloride ions in the solution with the help of calibration curve.
(v) Calculate the concentration of the chloride ions as HCl in the original air sample
accordingly.
(iii) Potentiometric Method using the Chloride lon Electrode
Reagents Required
(i) Absorber solution (0.001 M NaOH)
(ii) Acetic acid-ammonium acetate buffer solution
(iii) Stock chloride solution
(iv) Standard solution A containing l.0g Cl mL
Analytical Chemistry
/ Instrumentation
Environmental Analysis
Analysis of SPM &TSP
(v) Solution B containing l0.0 g Cl mL.
Procedure
(i) Draw an air sample through 100 mL of 0.001 M NaOH.
(ii) Add 4 rnL buffer solutions; stabilize it at a 20°-25° C for l0 min in a thermostatically
controlled water bath. Mix the contents using a magnetic stirrer
(iii) Put the electrodes of pH meter in the solution and fix them 1.5 cm above the magnetic
stirrer. Keeps the magnetic stirrer running during measurement.
(iv)Prepare a calibration curve with the help of various concentrations of standard solution.
(v) Plot the curve between e.m.f. versus concentration of chloride ions per mL.
(vi)Calculate the concentration of the chloride ions in the aliquot accordingly.