Modelling the plankton groups of the deep, peri-alpine Lake ...
Upload
independentCategory
view
8download
0
Ungulate Vehicle Collisions in a Peri-Urban Environment:Consequences of Transportation Infrastructures PlannedAssuming the Absence of UngulatesInigo Zuberogoitia1*, Javier del Real2, Juan Jose Torres1, Luis Rodrıguez2, Marıa Alonso2, Jabi Zabala3
1 Estudios Medioambientales Icarus, S.L., Bilbao, Bizkaia, Spain, 2 Saitec S.A. Leioa, Bizkaia, Spain, 3 Arrigorriaga, Biscay, Spain
Abstract
Ungulate vehicle collisions (UVC) provoke serious damage, including human casualties, and a large number of measureshave been developed around the world to avoid collisions. We analyse the main factors involved in UVC in a road networkbuilt in the absence of ungulates, where mitigation structures to avoid UVC were not adequately considered. Ungulatepopulation greatly increased during the last two decades and now Roe Deer and Wild Boars are widely distributed over thestudy area, but even after this increase, the road network was not adapted to avoid UVC. A total of 235 Roe Deer (RDVC) and153 Wild Boar vehicle collisions (WBVC) were recorded between January 2008 and December 2011. We randomly selected289 sample points (87 RDVC, 60 WBVC and 142 controls) separated by at least 500 metres from the next closest point andmeasured 19 variables that could potentially influence the vehicle collisions. We detected variations in the frequency ofRDVC on a monthly basis, and WBVC was higher at weekends but no significant differences were detected on a monthlybasis. UVC were more likely to occur at locations where sinuosity of the road, velocity, surface of shrub and deciduous forestarea were greater, the presence of fences entered with positive relationship and distance to the nearest building was less.RDVC were more likely to occur at locations where timber forest area increased and distance to the nearest buildingdecreased and WBVC was related to open fields cover and also to the presence of fences. Sinuosity and velocity entered inboth cases as significant factors. Major roads, in which the traffic volume is greater and faster, caused more accidents withungulates than secondary roads. Nowadays, the high frequency of ungulate road-kills deserves a new strategy in order toadapt infrastructure and adopt mitigation measures.
Citation: Zuberogoitia I, del Real J, Torres JJ, Rodrıguez L, Alonso M, et al. (2014) Ungulate Vehicle Collisions in a Peri-Urban Environment: Consequences ofTransportation Infrastructures Planned Assuming the Absence of Ungulates. PLoS ONE 9(9): e107713. doi:10.1371/journal.pone.0107713
Editor: Maura (Gee) Geraldine Chapman, University of Sydney, Australia
Received May 20, 2014; Accepted August 14, 2014; Published September 24, 2014
Copyright: � 2014 Zuberogoitia et al. This is an open-access article distributed under the terms of the Creative Commons Attribution License, which permitsunrestricted use, distribution, and reproduction in any medium, provided the original author and source are credited.
Data Availability: The authors confirm that all data underlying the findings are fully available without restriction. All relevant data are within the paper and itsSupporting Information files.
Funding: This work has been developed as part of the Project ‘‘FORD - Aplicacion de tecnologıas de la informacion a la mejora de la seguridad eninfraestructuras de transporte: sistemas de deteccion de fauna’’, which has been financed by the Basque Government (Res. Nu: IG-2012/0000281 and IG-2013/0000703). The funders had no role in study design, data collection and analysis, decision to publish, or preparation of the manuscript. The authors declare thatthere are no competing interests or financial disclosure and that this does not alter the authors’ adherence to all PLOS ONE policies on sharing data and materials.
Competing Interests: The authors declare that there are no competing interests or financial disclosure and that this does not alter the authors’ adherence to allPLOS ONE policies on sharing data and materials.
* Email: [email protected]
Introduction
Habitats and, consequently, wildlife populations are being
increasingly fragmented due to increasing human population,
urbanized areas, the extent of transport infrastructure, habitat
transformation and agricultural intensification [1]. In this chang-
ing world, refuges free of perturbation are becoming scarce and
wildlife is forced to live in highly human populated and changing
habitats [2]. Interactions between large herbivores and transport
infrastructures are expected to increase, since the road network
and the traffic volumes are predicted to grow. Therefore, more
populations will become susceptible to decline due to road
mortality as the transportation infrastructure increases [3,4].
Although most wild ungulate species are not threatened and are
considered game species, they generate notable interest due to
their size, medium-large animals, which can provoke serious
damages, including human casualties [5–8]. Therefore, great
efforts are being made to understand the causes of ungulate vehicle
collisions (UVC) and to develop strategies to reduce them [11].
New transport infrastructures are normally planed and devel-
oped in natural environments, fragmenting habitats and wildlife
home ranges. Environmental impact studies analyse the effect of
transportation infrastructures on native wildlife populations,
mainly ungulates and large carnivores, that already occupy the
affected areas [7,9–12]. However, to our knowledge, there are no
documented analyses showing the effect of ungulate population
recovery on a transportation infrastructure network which was
developed in the absence of ungulates. In the 1980 s, there was a
limited range of wild ungulates in northern Spain, Roe Deer
(Capreolus capreolus) and Wild Boar (Sus scrofa) being restricted
to small populations on the western border of the study area [13].
Since then, the road network has increased rapidly. But, as initially
the hazards related to collision with large mammals were almost
negligible, no fences, culverts and other mitigation structures were
considered, apart from a few placed along the A8 and A68
PLOS ONE | www.plosone.org 1 September 2014 | Volume 9 | Issue 9 | e107713

highways. In fact, mitigation measures to prevent road-kills were
partly taken into account in some new roads since 2008, following
the increasing interest to deal with this problem [14]. During this
30 year period, ungulate collisions just started to become a threat
whilst the meso-carnivore road-kills were constant [15]. In fact,
this emerged as the main non-natural cause of mortality of some
endangered carnivores [16]. However, due to the small size of the
affected animals, this was not significant in terms of vehicle
damage or human injuries and authorities did not consider it as a
problem. Meanwhile, in common with other areas of the Iberian
Peninsula [17], the population and the distribution area of wild
ungulates increased rapidly, spreading throughout the country
[18]. In the first decade of this Century, road-kills, agricultural
damage and the numbers of game hunted continuously increased
[19], and now the wild ungulate populations are dense and widely
distributed. Nevertheless, the road network did not evolve in such
a way as to avoid UVC, and now the high frequency of ungulate
road-kills deserves a strategy in order to adapt infrastructure and
adopt mitigation measures.
The main goal of this paper, therefore, is to identify the main
factors involved in UVC, the road stretches where the UVC risk is
higher than others and where mitigation measures should be
adopted to reduce the problem.
Study areaThe study area covered the whole administrative area of Bizkaia
(Basque Country, northern Spain; surface = 2,384 km2; coordi-
nates from 43u11’00’’ to 43u12’70’’N and from 3u12’70’’ to
2u13’10’’W). Here, human density is amongst the highest in
Western Europe (523.6 inhabitants/km2, [20]). The territory is
hilly and characterised by the presence of extensive urban and
industrialised areas connected by 1,317.1 km of roads, of which
203.5 km are highways. Highways are fenced to keep wildlife out
of the road lanes, although fences are not equally distributed and
some stretches show unmaintained fencing with holes made by
wildlife. The A8 and A68 highways mostly have 2 m high fencing
whilst more recently built highways provide 1.5 m high fencing,
that in every case were installed during the road building. The
average traffic density is 9,837 vehicles per day and 4,704.9
millions of vehicles per km/year, of which 64.5% belong to the
highway network [21].
More than 50% of the area is dedicated to forestry, at the
expense of traditional small-scale farming. Most of the wood
produced comes from plantations of Pinus radiata and Eucalyptusglobulus, E. camaldulensis and E. nitens, while the traditional
patchwork of woodland, pasture and small-holdings has been
greatly reduced during recent decades [22].
Figure 1. Sampling point distribution. Map showing the distribution of the sample points randomly selected for the Generalized Lineal Model(GLM) analysis: 87 Roe Deer vehicle collisions (RDVC, red dots), 60 Wild Boar vehicle collisions (WBVC, blue dots) and 142 non-accident control points(white dots) on the roads and highways in the study area, Bizkaia, Northern Iberian Peninsula, between 2008 and 2011.doi:10.1371/journal.pone.0107713.g001
Ungulate Vehicle Collisions in Dense Urban Matrix
PLOS ONE | www.plosone.org 2 September 2014 | Volume 9 | Issue 9 | e107713

Materials and Methods
Ungulate vehicle collision (UVC)Data on UVC were obtained from the road accident statistics of
the ‘‘Departamento de Obras Publicas y Transportes de la
Diputacion Foral de Bizkaia’’ which is the main Road Authority in
Bizkaia. Overall 235 Roe Deer and 153 Wild Boar vehicle
collisions were recorded between January 2008 and December
2011. Each record contained information about species, place and
date. The location of each collision was identified by the kilometric
point of the road (data recorded in stretches of 100 m ). Accuracy
of the UVC location is 650 m. We used a dataset (Database S1)
from a geographical information system. The software used was
Quantum GIS 1.7.4.
Sampling point selectionIn order to avoid pseudo-replication of the sampling site factors,
we randomly selected 289 sample points separated by at least
500 m from the nearest point: 87 Roe Deer vehicle collision
(RDVC) points, 60 Wild Boar vehicle collision (WBVC) points and
142 non-accident control points in which no collision had been
detected during the study period (Fig. 1).
Landscape and traffic factorsLandscape data were obtained from a combination of digital
land-use maps, topographic maps and satellite imagery at a scale
of 1:5,000, available as free SIG data in the Basque Government
website [23]. Traffic data were obtained from the annual reports
of the ‘‘Departamento de Obras Publicas y Transportes de la
Diputacion Foral de Bizkaia’’ [24], in particular, there is a wide
network of sampling stations for traffic monitoring for which it is
possible to download the traffic volume of every road [21].
Average vehicle speed was obtained from the traffic sampling
stations, but in those few cases in which data were not available we
considered the speed limits. The presence of fences was also
checked in the field and was contrasted using the Google Street
View Programme [25].
We generated three categories of variables (habitat structure,
topographic factors and road factors, Table 1) of biological
relevance to wild ungulates [17,26]. In total, we selected 19
variables that could potentially influence the UVC (Table 1). We
created a buffer area of 500 m radius for every sampling point in
which we measured the surface covered by each of the habitat
variables, and a buffer area of 100 m radius to calculate the slope.
Statistical AnalysisThe number of potential habitat variables was reduced by
evaluating correlation and fit across spatial scales. Habitat
variables were assessed for multicollinearity (r .0.65) using
Pearson’s correlation matrix. Hence, the variables TRAFH,
FRAG, DPOP and DBFOR were excluded from the analysis,
(see Table 1).
Weekly and monthly frequencies of vehicle collisions were
analysed using the Chi Square test.
Univariate tests for differences in the environmental and road
traffic factors between collision and non-collision sites were
computed using non-parametric Mann-Whitney’s test [27]. Firstly,
we compared variables between non-collision sites and UVC sites,
Table 1. Environmental parameters, measured within 500-m radius buffers, surrounding ungulate vehicle collision (UVC) andcontrol sites in the model.
Variables/codes Description
Habitat structure
DECD Deciduous forest surface area (m2)
HOAK Holm Oak forest surface area (m2)
TIMB Exotic timber plantation surface area (m2)
SHBR Shrub cover surface area (m2)
OPEN Open grass fields and agricultural surface area (m2)
FRAG The number of vegetation patches
AFRAG The average surface of vegetation patches (m2)
DRIV Distance to the nearest river (m)
DFOR Distance to the nearest forested patch (m)
DBFOR Distance between two forested patches placed in each side of the road (m)
DBUIL Distance to the nearest building (m)
DPOP Distance to the nearest population nuclei (.5 buildings) (m)
Topographic factors
ALT Altitude of the sampling point (m a.s.l.)
SIN Road sinuosity. The relationship between the actual length of the road and the Euclidean distance between each endof the road in the 500 m radius buffer area. Larger values of sinuosity indicate more curves in the road.
SLOP Slope. The number of 20 m contour lines which cross a circle of 100 m radius around the sampling point
Road factors
VEL Average velocity of vehicles in each sampling point (km/h)
TRAF Traffic volume. Number of vehicles per day
TRAFH Traffic volume of heavy vehicles per day
FENCE Presence of fence (categorical variable)
doi:10.1371/journal.pone.0107713.t001
Ungulate Vehicle Collisions in Dense Urban Matrix
PLOS ONE | www.plosone.org 3 September 2014 | Volume 9 | Issue 9 | e107713

and secondly, we divided ungulates into Roe Deer and Wild Boar
and developed univariate analysis comparing each one with non-
collision sites and between them. Latterly, we ran a multivariate
non-parametric test for differences amongst the three groups (non-
collision, RDVC and WBVC sites) using Kruskal-Wallis test.
Categorical variables were tested using x2 function. Significance
level was set at P,0.05.
We used Monte Carlo simulations to evaluate the probability
that observed differences in velocity and traffic volume between
RDVC, WBVC and control sites could have occurred by chance.
These variables were the only significant factors shared in both
cases: RDVC and WBVC (see in results). This method has several
advantages since it allows frequency distributions to be generated
and hypothesis testing based on real field data and not theoretical
distributions (i.e. [28,29]). Firstly, we resampled an equal number
of observed data (VEL and TRAF) for the three groups using the
‘‘shuffle’’ function implemented in POPTOOLS version 3.2.5 for
Excel [30]. This procedure was repeated 1000 times in each case.
The mean value obtained in the resample of each case was used to
run the Monte Carlo simulations, using the simulation tool: Monte
Carlo Analysis function. Three data matrixes were obtained with
the mean values of every 1000 resampling, displayed in a
histogram and a mathematic function. Secondly, critical values
of significance were generated by counting the number of
randomization cases (for the control sites) that resulted in an
equal or larger/smaller value than the observed median values of
RDVC and WBVC divided by the number of randomizations
[31]. Tests were two-tailed and significance level was set at
a= 0.05.
Finally, we used generalized linear models (GLM) analysis, with
collision/non collision as a binary response variable with a logit
link function, to identify which environmental and road related
variables best predicted the likelihood of casualties for Roe Deer,
Wild Boar and for both [32]. We included the RDVC, WBVC
and control sites into 500 m radius circles (n = 289). Each case was
coded either 1 (with collision) or 0 (non-collision) and described in
terms of fifteen explanatory variables (the 19 variables in Table 1
except to the four auto-correlated factors) obtained from field
measurements or from a geographic information system. Three
different analyses were run considering both ungulates together
(UVC), or only RDVC and WBVC. We examined the ability of
each variable to predict road mortality using univariate logistic
regression. We selected only those variables for the model when
the significance of the Wald test was ,0.1. Next, we used stepwise
Table 2. Mean, standard deviation and range (brackets) of the environmental and road variables of 147 ungulate vehicle collisions(UVC) localities and 142 non-collision control sites.
Variables UVC (n = 147) Control (n = 142 U Mann-Whitney
DECD (m2) 60003670267 55130673565 6534.5
(631–356006) (14–508430)
HOAK (m2) 12723641636 10053640308 10287
(0–283668) (0–349371)
TIMBER (m2) 3255806195471 3224786230581 10205
(0–752813) (0–769761)
SHBR (m2) 50890693760 27854653512 9037 (*)
(0–544428) (0–261814)
OPEN (m2) 3296706191652 3584196231107 9809
(0–772543) (0–772542)
AFRAG (m2) 97210650139 104420658577 9524
(32189–257514) (32189–386271)
DRIV (m) 1886224 2376310 9715.5
(3–1509) (5–2500)
DFOR (m) 556124 886150 9976
(3–1293) (2–997)
DBUIL (m) 1496178 2036298 10291
(3–1419) (3–1731)
ALT (m a.s.l.) 1786147 2006154 9449.5
(10–680) (10–720)
SIN 1.1360.20 1.1460.16 9025.5 (*)
(1–2.1) (1–1.7)
SLOP 2.961.5 2.861.5 10221
(0–7) (0–6)
VEL (km/h) 73.9619.0 61.0624.6 6255 (**)
(30–120) (20–120)
TRAF (veh/day) 11682617665 9096618955 7534.5 (**)
(191–119113) (25–136190)
Significance of the Mann-Whitney test is indicated with asterisks (* P,0.05, ** P,0.01).doi:10.1371/journal.pone.0107713.t002
Ungulate Vehicle Collisions in Dense Urban Matrix
PLOS ONE | www.plosone.org 4 September 2014 | Volume 9 | Issue 9 | e107713

Ta
ble
3.
Me
an,
stan
dar
dd
evi
atio
nan
dra
ng
e(b
etw
ee
nb
rack
ets
)o
fth
ee
nvi
ron
me
nta
lan
dro
adva
riab
les
of
87
Ro
eD
ee
rve
hic
leco
llisi
on
s(R
DV
C)
and
60
Wild
Bo
arve
hic
leco
llisi
on
s(W
BV
C)
loca
litie
s.
RD
VC
(n=
87
)W
BV
C(n
=6
0)
Me
an
SD
Ra
ng
eU
Me
an
SD
Ra
ng
eU
DE
CD
(m2)
59
28
96
73
91
1(6
31
–3
56
00
6)
40
52
61
09
66
65
02
6(2
07
6–
32
50
41
)2
48
2
HO
AK
(m2)
10
47
06
38
91
8(0
–2
45
44
9)
61
02
15
99
06
45
42
8(0
–2
83
66
8)
40
35
TIM
BE
R(m
2)
34
79
95
61
95
45
2(0
–6
92
29
8)
56
68
29
30
78
61
92
49
0(0
–7
52
81
3)
39
83
SH
BR
(m2)
45
98
76
85
48
9(0
–4
62
58
3)
54
40
58
00
06
10
49
48
(0–
54
44
28
)3
59
7
OP
EN
(m2)
31
42
78
61
79
34
5(0
–7
72
54
3)
55
92
35
19
89
62
07
73
1(2
97
0–
75
63
19
)4
21
7
AF
RA
G(m
2)
97
08
86
45
13
7(3
21
89
–2
57
51
4)
57
98
97
38
86
57
01
9(3
48
47
–2
57
51
4)
37
25
DR
IV(m
)1
75
61
89
(3–
94
9)
56
54
20
66
26
7(5
–1
50
9)
40
61
DF
OR
(m)
58
61
51
(3–
12
93
)5
72
15
26
71
(3–
33
0)
42
55
DB
UIL
(m)
14
56
14
3(3
–7
18
)6
11
71
56
62
21
(3–
14
19
)4
17
4
AL
T(m
a.s.
l.)1
91
61
51
(20
–6
80
)5
94
61
60
61
42
(10
–6
40
)3
50
4*
SIN
1.1
60
.2(1
–2
.1)
56
11
1.1
60
.2(1
–1
.7)
34
14
*
SL
OP
2.9
61
.5(0
–7
)6
12
83
.06
1.6
(0–
7)
40
93
VE
L(k
m/h
)7
0.0
61
7.5
(30
–1
09
)4
19
1**
79
.66
19
.9(3
0–
12
0)
20
64
**
TR
AF
(ve
h/d
ay)
10
11
16
16
15
6(2
95
–9
87
80
)4
87
3**
13
96
06
19
56
6(1
91
–1
19
11
3)
26
22
**
Re
sult
so
fM
ann
-Wh
itn
ey’
sU
test
for
the
com
par
iso
ns
be
twe
en
RD
VC
and
WB
VC
wit
hco
ntr
ol
site
s.Si
gn
ific
ance
leve
ls:
*P
,0
.05
,**
P,
0.0
1.
do
i:10
.13
71
/jo
urn
al.p
on
e.0
10
77
13
.t0
03
Ungulate Vehicle Collisions in Dense Urban Matrix
PLOS ONE | www.plosone.org 5 September 2014 | Volume 9 | Issue 9 | e107713

forward regression procedures to build the models, leaving out
20% of the original data for cross-validation procedures in order to
evaluate the explanatory power of each model. To select the
model best supported by our data, Akaike’s Information Criterion,
corrected for small sample size (AICc) was used. We calculated
AICc differences between candidate models and selected as best
the one showing the lowest AICc value. Models within 2 units of
DAICc were considered to have substantial empirical support,
models with DAICc 4–7 were considered to have substantially less
empirical support, whereas models with more than 10 units of
DAICc were considered to have essentially no support from the
data. We also calculated the Akaike Weights (wAICc) (i.e. the
weight of evidence in favour of that model being the best in the set,
[33]) among candidate models [32].
Statistical analyses were performed with SPSS v18 (SPSS INC.,
Chicago, IL, U.S.A.).
Results
The frequency of RDVC did not vary with the days of the week
(x26 = 11.609, P = 0.07), but there were significant differences
between months, April and May followed by July and August
being the months with highest RDVC (x211 = 64.092, P,0.001).
The frequency of WBVC was higher on weekends followed by
Wednesdays (x26 = 14.769, P = 0.022), but there were no signifi-
cant differences between months (x211 = 9.588, P = 0.567) al-
though a weak peak was observed in autumn.
In a first approximation, running a descriptive analysis in order
to compare UVC with control sites, three road factors (SIN,
TRAF and VEL) and one habitat variable (SHBR) showed
statistically significant differences (Table 2). The roads with more
curves prompted fewer collisions than straight roads and the
likelihood of collisions increased with the traffic volume. The area
of shrub was the only significant habitat variable for wild
ungulates, collisions being higher in those areas dominated by
this type of vegetation.
RDVC sites were characterized by higher traffic volume and
velocity compared with control sites (Table 3). Traffic volume and
velocity also influenced WBVC, although WBVC sites were also
characterized by lower altitude and road sinuosity than control
sites (Table 3).
Figure 2. Mean velocities. Mean values of velocity (km/h) for non-collision control sites, Roe Deer vehicle collisions (RDVC) and Wild Boar vehiclecollisions (WBVC) of the resample (1000 times) after Monte Carlo simulations.doi:10.1371/journal.pone.0107713.g002
Figure 3. Mean traffic volume. Mean values of traffic volume (TRAF, vehicles/day) for non-collision control sites, Roe Deer vehicle collisions (RDVC)and Wild Boar vehicle collisions (WBVC) of the resample (1000 times) after Monte Carlo simulations.doi:10.1371/journal.pone.0107713.g003
Ungulate Vehicle Collisions in Dense Urban Matrix
PLOS ONE | www.plosone.org 6 September 2014 | Volume 9 | Issue 9 | e107713

Only velocity (Kruskal-Wallis Test, H = 41.39, P,0.001) and
traffic volume (Kruskal-Wallis Test, H = 19.39, P,0.001) showed
significant differences when comparing control, RDVC and
WBVC sites. When running Monte Carlo simulations, the analysis
confirmed significant differences between the three groups (P,
0.001), in which WBVC were detected at higher speed than
RDVC and RDVC at higher speeds than control sites (Fig. 2).
But, this was not the case for traffic volume, since no differences
were detected between the groups (P.0.05, Fig. 3). Hence, major
roads, in which the traffic volume is greater and its speed is higher,
caused more accidents with ungulates than secondary roads,
Table 4. Number of cases of control sites, ungulate vehicle collisions (UVC), Roe Deer vehicle collisions (RDVC) and Wild Boarvehicle collisions (WBVC) depending on the absence or presence of fences and the statistical value of the Chi square test.
Fence Control UVC RDVC WBVC
No 126 130 79 51
Yes 16 17 8 9
x 2 0.006 0.246 0.542
P 0.936 0.620 0.462
doi:10.1371/journal.pone.0107713.t004
Table 5. Candidate road and landscape based models predicting ungulate vehicle collisions (UVC), Roe Deer vehicle collisions(RDVC) and Wild Boar vehicle collisions (WBVC) in the study area, Bizkaia, from 2008 to 2011.
Ranking Model n k AICc DAICc AICc wi
UVC
1 SIN+VEL+SHRB+FENCE+DBUIL+DECD 223 6 303.52 0 0.269
2 SIN+VEL+SHRB+FENCE+DBUIL 223 5 303.76 0.24 0.238
3 SIN+VEL+SHRB+FENCE 223 4 304.64 1.12 0.154
4 SIN+VEL+SHRB+FENCE+DBUIL+DECD+TIMB 223 7 304.47 0.95 0.167
5 SIN+VEL+SHRB+FENCE+DBUIL+DECD+TIMB+HOAK 223 8 306.39 2.87 0.064
6 SIN+VEL+SHRB+FENCE+DBUIL+DECD+TIMB+HOAK+OPEN 223 9 306.35 2.83 0.065
7 SIN+VEL+SHRB+FENCE+DBUIL+DECD+TIMB+HOAK+OPEN+TRAF 223 10 308.05 4.53 0.028
8 All variables 223 15 318.81 15.29 0.001
RDVC
1 TIMB+DBUIL 223 2 297.16 0 0.285
2 TIMB+DBUIL+SIN+VEL 223 4 297.99 0.8 0.189
3 TIMB+DBUIL+SIN 223 3 297.69 0.5 0.220
4 TIMB+DBUIL+SIN+VEL+DECD 223 5 298.99 1.8 0.115
5 TIMB+DBUIL+SIN+VEL+DECD +SHBR 223 6 299.99 2.8 0.070
6 TIMB+DBUIL+SIN+VEL+DECD +SHBR+SLOP 223 7 300.47 3.28 0.055
7 TIMB+DBUIL+SIN+VEL+DECD +SHBR+SLOP+FENCE 223 8 301.19 4.00 0.038
8 TIMB+DBUIL+SIN+VEL+DECD +SHBR+SLOP+FENCE+DRIV 223 9 302.74 5.55 0.018
9 All variables 223 15 315.01 17.82 0.000
WBVC
1 VEL+FENCE 223 2 224.35 0 0.271
2 VEL+FENCE+SLOP 223 3 225.09 0.74 0.186
3 VEL+FENCE+SLOP+OPEN 223 4 225.40 1.05 0.159
4 VEL+FENCE+SLOP+OPEN+SHRB 223 5 225.49 1.14 0.153
5 VEL+FENCE+SLOP+OPEN+SHRB+DECD 223 6 226.78 2.43 0.080
6 VEL+FENCE+SLOP+OPEN+SHRB+DECD+HOAK+TIMBER 223 8 227.12 2.77 0.068
7 VEL+FENCE+SLOP+OPEN+SHRB+DECD+HOAK 223 7 228.10 3.75 0.041
8 VEL+FENCE+SLOP+OPEN+SHRB+DECD+HOAK+ALT 223 9 229.01 4.66 0.026
9 All variables 223 15 242.10 17.75 0.000
Models estimated and ranked by Akaike Information Criteria (AICc). K is the number of estimable parameters, DAICc shows the difference between the top model andeach candidate model, and AICc wi is the relative weighting of that model.doi:10.1371/journal.pone.0107713.t005
Ungulate Vehicle Collisions in Dense Urban Matrix
PLOS ONE | www.plosone.org 7 September 2014 | Volume 9 | Issue 9 | e107713
although those highways with a very high traffic volume showed
fewer collisions than expected.
Regarding the presence of fences, there was not the expected
negative relationship between collisions and fences, neither for
Roe Deer nor for Wild Boar (Table 4).
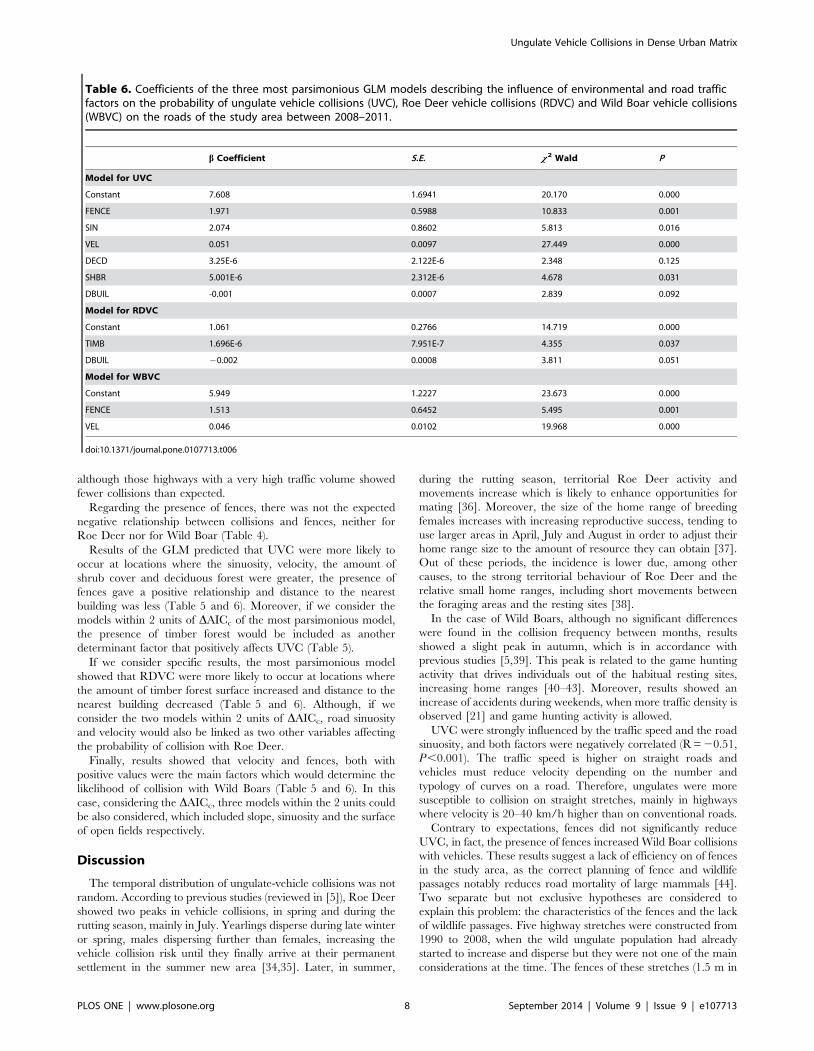
Results of the GLM predicted that UVC were more likely to
occur at locations where the sinuosity, velocity, the amount of
shrub cover and deciduous forest were greater, the presence of
fences gave a positive relationship and distance to the nearest
building was less (Table 5 and 6). Moreover, if we consider the
models within 2 units of DAICc of the most parsimonious model,
the presence of timber forest would be included as another
determinant factor that positively affects UVC (Table 5).
If we consider specific results, the most parsimonious model
showed that RDVC were more likely to occur at locations where
the amount of timber forest surface increased and distance to the
nearest building decreased (Table 5 and 6). Although, if we
consider the two models within 2 units of DAICc, road sinuosity
and velocity would also be linked as two other variables affecting
the probability of collision with Roe Deer.
Finally, results showed that velocity and fences, both with
positive values were the main factors which would determine the
likelihood of collision with Wild Boars (Table 5 and 6). In this
case, considering the DAICc, three models within the 2 units could
be also considered, which included slope, sinuosity and the surface
of open fields respectively.
Discussion
The temporal distribution of ungulate-vehicle collisions was not
random. According to previous studies (reviewed in [5]), Roe Deer
showed two peaks in vehicle collisions, in spring and during the
rutting season, mainly in July. Yearlings disperse during late winter
or spring, males dispersing further than females, increasing the
vehicle collision risk until they finally arrive at their permanent
settlement in the summer new area [34,35]. Later, in summer,
during the rutting season, territorial Roe Deer activity and
movements increase which is likely to enhance opportunities for
mating [36]. Moreover, the size of the home range of breeding
females increases with increasing reproductive success, tending to
use larger areas in April, July and August in order to adjust their
home range size to the amount of resource they can obtain [37].
Out of these periods, the incidence is lower due, among other
causes, to the strong territorial behaviour of Roe Deer and the
relative small home ranges, including short movements between
the foraging areas and the resting sites [38].
In the case of Wild Boars, although no significant differences
were found in the collision frequency between months, results
showed a slight peak in autumn, which is in accordance with
previous studies [5,39]. This peak is related to the game hunting
activity that drives individuals out of the habitual resting sites,
increasing home ranges [40–43]. Moreover, results showed an
increase of accidents during weekends, when more traffic density is
observed [21] and game hunting activity is allowed.
UVC were strongly influenced by the traffic speed and the road
sinuosity, and both factors were negatively correlated (R = 20.51,
P,0.001). The traffic speed is higher on straight roads and
vehicles must reduce velocity depending on the number and
typology of curves on a road. Therefore, ungulates were more
susceptible to collision on straight stretches, mainly in highways
where velocity is 20–40 km/h higher than on conventional roads.
Contrary to expectations, fences did not significantly reduce
UVC, in fact, the presence of fences increased Wild Boar collisions
with vehicles. These results suggest a lack of efficiency on of fences
in the study area, as the correct planning of fence and wildlife
passages notably reduces road mortality of large mammals [44].
Two separate but not exclusive hypotheses are considered to
explain this problem: the characteristics of the fences and the lack
of wildlife passages. Five highway stretches were constructed from
1990 to 2008, when the wild ungulate population had already
started to increase and disperse but they were not one of the main
considerations at the time. The fences of these stretches (1.5 m in
Table 6. Coefficients of the three most parsimonious GLM models describing the influence of environmental and road trafficfactors on the probability of ungulate vehicle collisions (UVC), Roe Deer vehicle collisions (RDVC) and Wild Boar vehicle collisions(WBVC) on the roads of the study area between 2008–2011.
b Coefficient S.E. x 2 Wald P
Model for UVC
Constant 7.608 1.6941 20.170 0.000
FENCE 1.971 0.5988 10.833 0.001
SIN 2.074 0.8602 5.813 0.016
VEL 0.051 0.0097 27.449 0.000
DECD 3.25E-6 2.122E-6 2.348 0.125
SHBR 5.001E-6 2.312E-6 4.678 0.031
DBUIL -0.001 0.0007 2.839 0.092
Model for RDVC
Constant 1.061 0.2766 14.719 0.000
TIMB 1.696E-6 7.951E-7 4.355 0.037
DBUIL 20.002 0.0008 3.811 0.051
Model for WBVC
Constant 5.949 1.2227 23.673 0.000
FENCE 1.513 0.6452 5.495 0.001
VEL 0.046 0.0102 19.968 0.000
doi:10.1371/journal.pone.0107713.t006
Ungulate Vehicle Collisions in Dense Urban Matrix
PLOS ONE | www.plosone.org 8 September 2014 | Volume 9 | Issue 9 | e107713

height at both sides of the highway) were adapted to prevent
medium sized mammals entering the road, but wildlife passages
were not taken into account or, in the latter cases, were poorly
developed. Therefore, the new stretches acted as a barrier to
medium and large mammal movements, forcing them to find
different ways to cross fences: (1) through openings in fences, (2) in
areas where the fence was inadequately buried into the ground or
(3) in some areas in which the topography of the terrain let agile
ungulates, mainly Roe Deer, jump over the fence of 1.5 m height
(Fig. 4) [45]. Moreover, deer are intelligent animals that learn
from observing others and once they penetrate the fence they can
repeatedly use the same path [45]. The problem arises once inside,
when animals cannot find the exit from the opposite side and they
display nervous behaviour and run along the road. In such
occasions poorly erected or designed fences may act as traps for
animals and cause accidents instead of avoiding them. Poorly
designed fences are believed to be the cause for Roe Deer and
Wild Boars appearing inside cities, close to the exits of highways.
This could be prevented by installing one-way exit structures,
allowing ungulates to cross fences outwards from the road.
The observed differences in the traffic velocity between Roe
Deer and Wild Boars could be related to the differential
behaviour. RDVC were mainly produced in relatively low traffic
velocity roads (on average of 70 km/h), whilst Wild Boars were
killed in 10 km/h faster roads (on average of 80 km/h Fig. 2). Roe
Deer are more nervous and unpredictable than Wild Boars (I.
Zuberogoitia, personal observations). Roe Deer appear suddenly
in the road, sometimes running or jumping, surprising drivers even
at low speed. However, Wild Boar are relatively more predictable
and quiet and drivers can easily detect them, reducing speed and
avoiding collision, except in those cases in which speed is high and
the reaction time is insufficient to avoid collision.
High traffic roads may act as movement barriers to ungulates.
We found that Roe Deer and Wild Boar collisions occur in roads
with an average of 10,000 and 14,000 vehicles per day
respectively, and the likelihood of collisions decreased as the
traffic volume increased (Fig. 3). Our results are consistent with
previous studies showing that traffic density does not affect UVC
in a linear relationship [36,40,43]. Furthermore, Madsen et al.
[36] found Roe Deer can keep home ranges close to high traffic
density roads and never cross them, suggesting that high traffic
volume may constitute home-range boundaries for the species. In
fact, high traffic density roads have been suggested to result in
movement barrier for ungulates in previous studies [8,39].
In addition to higher traffic volumes and velocity, Roe Deer
collision risks were also higher close to human settlements, and
areas with greater amount of timber harvest than control sites.
Higher RDVC near human settlements is contrary to other
neighbouring regions [7], likely due to the high human density of
the study area and the nervous and impatient behaviour of Roe
Deer when they have to pass close to inhabited buildings.
Contrasting with the natural behaviour when Roe Deer cross
roads far from inhabited areas which allows them to pay more
attention to vehicles. The observation that RDVC were closely
related to the timber plantation surface area are in agreement with
previous studies of deer in urban areas of Canada [46] and Roe
Deer in Germany [26]. Roe Deer may find appropriate resting
sites and natural corridors to move within pine and eucalyptus
forest, which most of the time are occupied by dense shrub stratus
(see [47]). However, herbaceous biomass is scarce in this type of
habitat and Roe Deer must move to open habitats or openings in
the deciduous forests to forage, thereby crossing roads and
increasing the odds of being killed [48]. With this argument,
Madsen et al. [36] suggest that dense vegetation close to roads
would increase the RDVC risk, although we did not detect any
relationship between distances to the forest edges and RDVC. We
suspect that this null effect could be due to the accuracy of our
collision data (650 m) and the changing habitats found in the
study area. Areas where forest with dense undergrowth are close to
roads could be fenced, guiding Roe Deer to areas where speed can
Figure 4. Poor fencing detected in the highways of the studyarea. Examples include: openings in fences (a), stretches inadequatelyburied into the ground (b) and damaged stretches in which agileungulates may jump over the fence (c).doi:10.1371/journal.pone.0107713.g004
Ungulate Vehicle Collisions in Dense Urban Matrix
PLOS ONE | www.plosone.org 9 September 2014 | Volume 9 | Issue 9 | e107713

be regulated to minimize collision risk, particularly in high Roe
Deer density areas.
In the case of Wild Boars, the slope and the grass field surfaces
entered into the model with velocity and sinuosity. Many roads
pass between narrow hillsides, where Wild Boars use roadsides in
order to look for adequate passages. The straight stretches between
curves, where vehicles increase velocity, were the most dangerous.
Wild Boars rest in forests and shrub areas and although they can
forage inside them, they frequently move to open areas (grass fields
and agricultural lands) at night, where they easily find herbaceous
roots and invertebrates [43,49,50]. In our case, road side shrub
cover increased the chance of collision. Road side vegetation
management can provide a short to medium-term option to
manage risks and guide animals to safe crossing areas.
Conclusions
The results of our models mostly agree with previous research
when determining the key predictor variables for ungulate
collision, except for the scarce and contradictory effect of the
fences for reducing kills due, among others, to the absence of
adequate wildlife passages. The design of the current road
infrastructure of Biscay is out-dated with regard to wildlife
conservation, and has demonstrated adverse effects for wildlife
and road users. On one hand, this road network has been
significantly affecting mammals and other vertebrates for many
years [47] and, only recently, authorities have started to seriously
consider habitat fragmentation [51,52]. On the other hand, the
alarming increase of UVC in recent years and the consequences
related to this have raised awareness regarding inadequate
planning, and emphasis on the need to make improvements to
road infrastructures so that they conform to modern conservation
and safety strategies. In order to achieve this, a large number of
costly changes need to be carried out. Wildlife passages, in
combination with fencing, are required to reduce habitat
fragmentation and road mortality. Notwithstanding, the cost of
maintaining the current situation would be much higher [53]. To
this purpose, our results provide useful information to help reduce
collisions in the short to medium term by managing vegetation to
reduce ungulate activity in the vicinity of areas of conflict, to
improve the efficiency of fences, to reduce vehicle speed in
dangerous stretches and to place passages in the areas where they
are best suited and manage surrounding vegetation.
Supporting Information
Database S1 Original data set.
(XLSX)
Acknowledgments
We would like to thank the Department of Public Works and
Transportation of the Provincial Council of Biscay for their support of
this research and the data provided. We also thank Stephen Olender for
the linguistic revision and Carlos Gonzalez de Buitrago for his contribution
with the SIG.
Author Contributions
Conceived and designed the experiments: IZ JZ. Performed the
experiments: IZ JR JT. Analyzed the data: IZ JZ. Contributed reagents/
materials/analysis tools: IZ JZ. Contributed to the writing of the
manuscript: IZ JZ JR JT MA LR.
References
1. Prugh LR, Hodges KE, Sinclair ARE, Brashares JS (2008) Effect of habitat area
and isolation on fragmented animal populations. Proc Natl Acad Sci 105:20770–20775.
2. Andersen R, Linnell JDC, Langvatn R (1996) Short-term behavioural and
physiological response of moose Alces alces to military disturbance in Norway.Biol Conserv 77: 169–176.
3. Forman R, Sperling D, Bissonette JA, Clevenger AP, Cutshall CD, et al. (2003)
Road Ecology: Science and Solutions. Washington, DC, USA. Island Press. 481 p.
4. Gordon IJ (2009) What is the future for wild, large herbivores in human-
modified agricultural landscapes. Wildl Biol 15: 1–9.
5. Colino–Rabanal VJ (2011) Contribuciones al analisis de mortalidad devertebrados en carreteras. PhD Thesis. Facultad de Ciencias Agrarias y
Ambientales. Salamanca. Universidad de Salamanca.
6. Conover MR (2002) Resolving wildlife conflicts: the science of wildlife damagemanagement. Lewis, Boca Raton, Florida, USA. CRC Press. 440 p.
7. Malo JE, Suarez F, Dıez A (2004) Can we mitigate animal-vehicle accidents
using predictive models? J Applied Ecol 41: 701–710.
8. Seiler A (2003) The toll of the automobile: wildlife and roads in Sweeden. PhD
Thesis. Uppsala. Swedish University of Agricultural Sciences.
9. Gunson KE, Mountrakis G, Quackenbush LJ (2011) Spatial wildlife-vehiclecollision models: A review of current work and its application to transportation
mitigation projects. J Environ Manage 92: 1074–1082.
10. Ascensao F, Clevenger A, Santos-Reis M, Urbano P, Jackson N (2013) Wildlife-
vehicle collision mitigation: is partial fencing the answer? An agent-based modelapproach. Ecol Model 257: 36–43.
11. Ng JW, Nielsen C, St. Clair CC (2008) Landscape and traffic factors influencing
deer-vehicle collisions in an urban environment. Human-Wildlife Conflicts 2:34–47.
12. Clevenger AP, Chruszcz B, Gunson KE (2001) Highway mitigation fencing
reduces wildlife–vehicle collisions. Wildlife Soc Bul 29: 646–653.
13. Alvarez J, Bea A, Faus JM, Castien E, Mendiola I (1985) Atlas de los vertebrados
continentales de Alava, Vizcaya y Guipuzcoa. Bilbao. Gobierno Vasco. 336 p.
14. Ministerio de Medio Ambiente y Medio Rural Marino (2008) Prescripcionestecnicas para el seguimiento y evaluacion de la efectividad de las medidas
correctoras del efecto barrera de las infraestructuras de transporte. Documentos
para la reduccion de la fragmentacion de habitats causada por infraestructuras
de transportes, numero 2. Madrid. O.A. Parques Nacionales. Ministerio deMedio Ambiente y Medio Rural y Marino. 115 p.
15. Aihartza J, Zuberogoitia I, Camacho E, Torres JJ (1999) Status of carnivores in
Biscay (N Iberian peninsula). Miscelanea Zoologica 22: 41–52.
16. Palazon S, Melero Y, Gomez A, Lopez de Luzuriaga J, Podra M, et al. (2012)
Causes and patterns of human-induced mortality in the Critically Endangered
European mink Mustela lutreola in Spain. Oryx 46: 614–616.
17. Acevedo P, Vicente J, Alzaga V, Cortazar C (2009) Wild Boar abundance and
hunting effectiveness in Atlantic Spain: environmental constraints. Galemys
21(2): 13–29.
18. Palomo LJ, Gisbert J (2002) Atlas de los mamıferos terrestres de Espana. Madrid.
Direccion General de Conservacion de la Naturaleza-SECEM-SECEMU. 564 p.
19. Monge J (2012) La caza en el Paıs Vasco. Foresta 55: 54–60.
20. Instituto Nacional de Estadistica (Spanish Statistical Office) (2014) Demografıa y
Poblacion. Available: http://www.ine.es/. Accessed 2014 May 7.
21. Emap (2011) Evolucion del trafico en las carreteras de Bizkaia. Bilbao.
Departamento de Obras Publicas y Transportes. 547 p.
22. Zuberogoitia I, Castillo I, Zabala J, Iraeta A, Azkona A (2011) Population trends
of diurnal forest raptors in Biscay. In Zuberogoitia I, Martınez JE, editors.
Ecology and Conservation of European Forest-dwelling Raptors. Bilbao.
Diputacion Foral de Bizkaia. Pp 70–80.
23. GeoEuskadi (2013) Indice de Cartografıa. Cartografıa basica. Ortofotos. Orto
2011. Available: ftp://ftp.geo.euskadi.net/cartografia/Cartografia_Basica/
Ortofotos/ORTO_2011/. Accessed 2013 Sept 30.
24. Diputacion Foral de Bizkaia (2014) Departamento de Obras Publicas y
Transportes. Evolucion del Trafico. Available: http://www.bizkaia.net/.
Accessed 2014 May 7.
25. Google Earth Street View (2013) Available: http://maps.google.es/support/
bin/answer/. Accessed 2013 Sept 30.
26. Hothorn T, Brandl R, Muller J (2012) Large-Scale Model-Based Assessment of
Deer-Vehicle Collision Risk. PLoS ONE, 7(2): e29510. doi:10.1371/journal.-
pone.0029510.
27. Zar JH (1999) Biostatistcal analysis. New Jersey: Prentice Hall. 663 p.
28. Zuberogoitia I, Gonzalez-Oreja JA, Martınez JE, Zabala J, Gomez I, et al.
(2013) Foraging movements of Eurasian Griffon Vultures (Gyps fulvus):implications for supplementary feeding management. European J Wildl Res
59: 421–429.
29. Lopez-Lopez P, Zuberogoitia I, Alcantara M, Gil JA (2013) Philopatry, natal
dispersal, first settlement and age of first breeding of Bearded Vultures Gypaetusbarbatus in central Pyrenees. Bird Study 60: 550–560.
30. Hood GM (2013) Poptools. Available: http://www.poptools.org. Accessed 2013
Sept 30.
Ungulate Vehicle Collisions in Dense Urban Matrix
PLOS ONE | www.plosone.org 10 September 2014 | Volume 9 | Issue 9 | e107713

31. Serrano D, Carrete M, Tella JL (2008) Describing dispersal under habitat
constraints: A randomization approach in lesser kestrels. Basic Appl Ecol 9: 771–778.
32. Burnham KP, Anderson DR (2002) Model selection and multi-model inference:
a practical information-theoretic approach. Berlin. Springer. 488 p.33. Wagenmakers EJ, Farrel S (2004) AIC model selection using Akaike weights.
Psychonomic Bulletin & Review 11: 192–196.34. Wahlstrom LK, Liberg O (1995) Patterns of dispersal and seasonal migration in
Roe Deer (Capreolus capreolus). J Zool 235: 455–467.
35. Coulon A, Cosson JF, Angibault JM, Cargnelutti B, Galan M, et al. (2004)Landscape connectivity influences gene flow in a Roe Deer population
inhabiting a fragmented landscape: an individual-based approach. Mol Ecol13: 2841–2850.
36. Madsen AB, Strandgaard H, Prang A (2002) Factors causing traffic killings ofRoe Deer Capreolus capreolus in Denmark. Wildl Biol 8: 55–61.
37. Saıd S, Gaillard JM, Duncan P, Guillon N, Guillon N, et al. (2005) Ecological
correlates of home-range size in spring-summer for female Roe Deer(Caprimulgus europaeus) in a deciduous woodland. J Zool Lond 267: 301–308.
38. Saıd S, Servanty S (2005) The influence of landscape structure of female RoeDeer home-range size. Landscape Ecol 20: 1003–1012.
39. Balciauskas L, Balciauskien?e L (2008) Wildlife-vehicle accidents in Lithuania,
2002–2007. Acta Biol Univ Daugavp 8: 89–94.40. Peris S, Baquedano R, Sanchez A, Pescador M (2005) Mortalidad del jabalı (Sus
scrofa) en carreteras de la provincia de Salamanca (NO de Espana): ¿influenciade su comportamiento social? Galemys 17: 13–23.
41. Dıaz ER, Marey MF, Vazquez I, Alvarez CJ (2010). Analisis espacial de lascolisiones de vehıculos con animales silvestres en la red vairia de la provincia de
Lugo (Espana). Madrid. XIV International Congrees on Project Engineering
1196–1207.42. Scillitani L, Monaco A, Toso S (2010) Do intensive drive hunts affect Wild Boar
(Sus scrofa) spatial behaviour in Italy? Some evidences and managementimplications. Eur. J Wildl Res 56: 307–318.
43. Thurfjell H (2011) Spatial Behaviour of Wild Boar. PhD Thesis. Umea. Swedish
University of Agricultural Sciences.44. Ford AT, Clevenger AP, Huijser MP, Dibb A (2011) Planning and prioritization
strategies for phased highway mitigation using wildlife-vehicle collision data.
Wildl Biol 17: 253–265.45. VerCauteren KC, Lavelle MJ, Hygnstrom S (2006) Fences and deer-damage
management: a review of design and efficacy. Wildlife Soc Bul 34: 191–200.46. Found R, Boyce MS (2011) Predicting deer-vehicle collisions in an urban area.
J Environ Manage 92: 2486–2493.
47. Rodrıguez-Refojos C, Zuberogoitia I (2011) Middle-sized carnivores in mosaiclandscapes: the case of Biscay (Sw Europe). In Rosalino LM, Gheler Costa C,
editors. Middle-sized carnivores in agricultural landscapes. New York. NovaScience Publishers. Pp. 105–126.
48. Torres RT, Carvalho JC, Panzaccho M, Linnell JDC, Fonseca C (2011)Comparative use of forest habitats by Roe Deer and moose in a human-modified
landscape in southeastern Norway during winter. Ecol Res 26: 781–789.
49. Fonseca C (2008) Winter habitat selection by Wild Boar Sus scrofa in southeastern Poland. Eur J Wildl Res 54: 361–366.
50. Colino–Rabanal VJ, Bosch J, Munoz MJ, Peris SJ (2012) Influence of newirrigated croplands on Wild Boar (Sus scrofa) road kills in NW Spain. Anim
Biodivers Conserv 35: 247–252.
51. Gurrutxaga M, Lozano PJ, del Barrio G (2010) GIS-based approach forincorporating the connectivity of ecological networks into regional planning.
J Nat Conserv 18: 318–326.52. Zuberogoitia I, Zalewska H, Zabala J, Zalewski A (2013) The impact of river
fragmentation on the population persistence of native and alien mink: anecological trap for the endangered European mink. Biodiv Conserv 22: 169–186.
53. Huijser MP, Duffield JW, Clevenger AP, Ament RJ, McGowen PT (2009) Cost-
benefit analyses of mitigation measures aimed at reducing collisions with largeungulates in the United States and Canada: a decision support tool. Ecology and
Society 14(2): 15 (online). Available: http://www.ecologyandsociety.org/voll4iss2/art15/. Accessed 2013 Dec 20.
Ungulate Vehicle Collisions in Dense Urban Matrix
PLOS ONE | www.plosone.org 11 September 2014 | Volume 9 | Issue 9 | e107713
Copyright © 2022 FDOKUMEN