
Understanding how project... - artigo - 2009
28
Understanding how project critical success factors affect organizational benefits from enterprise systems Ann Zhong Liu and Peter B. Seddon Department of Information Systems, The University of Melbourne, Melbourne, Australia Abstract Purpose – The purpose of this paper is to present and test a model that seeks to answer Robey et al.’s challenge that “ERP’s critical success factors offer few insights beyond conventional wisdom.” The model proposes that many so-called critical success factors (CSFs) affect organizational benefits from enterprise systems use (OBESU) through their impact on three outcomes of an enterprise systems (ES) implementation process, namely functional fit, overcoming organizational inertia, and delivering a working system. Design/methodology/approach – The model is tested using content analysis of 133 customer presentations at SAP’s April 2007 Sapphire USA Conference. Findings – The benefit-driver approach appears to provide at least one good answer to Robey et al.’s challenge. Research limitations/implications – It seems likely that the model is valid for most large Western organizations implementing ES. Practical implications – The model provides new insights into how and why the CSFs affect benefits from ES. Originality/value – No prior study to the best of one’s knowledge has sought to explain in such depth how ES project CSFs affect OBESU. Keywords Critical success factors, Project management, Change management, Organizational change Paper type Research paper 1. Introduction Enterprise systems (ES) are large-scale, integrated application-software packages that use the computational, data storage, and data transmission power of modern information technology (IT) to support processes, information flows, reporting, and data analytics within and between complex organizations. In this paper, the term “ES” is used to refer to all large organization-wide packaged applications including enterprise resource planning (ERP), customer relationship management (CRM), supply chain management (SCM), data warehousing, and the proprietary software platforms on which these applications are built (e.g. SAP’s NetWeaver and Oracle’s fusion). Since they impound deep knowledge of new ways of designing and executing organizational processes, these complex software packages can cause considerable assimilation difficulties for client organizations that implement them (Robey et al., 2002). The current issue and full text archive of this journal is available at www.emeraldinsight.com/1463-7154.htm The authors would like to thank Sherry Finney for sharing the analysis spreadsheets from her study. BPMJ 15,5 716 Business Process Management Journal Vol. 15 No. 5, 2009 pp. 716-743 q Emerald Group Publishing Limited 1463-7154 DOI 10.1108/14637150910987928
Transcript of Understanding how project... - artigo - 2009

Understanding how projectcritical success factors affectorganizational benefits from
enterprise systemsAnn Zhong Liu and Peter B. Seddon
Department of Information Systems, The University of Melbourne,Melbourne, Australia
Abstract
Purpose – The purpose of this paper is to present and test a model that seeks to answer Robey et al.’schallenge that “ERP’s critical success factors offer few insights beyond conventional wisdom.” Themodel proposes that many so-called critical success factors (CSFs) affect organizational benefits fromenterprise systems use (OBESU) through their impact on three outcomes of an enterprise systems (ES)implementation process, namely functional fit, overcoming organizational inertia, and delivering aworking system.
Design/methodology/approach – The model is tested using content analysis of 133 customerpresentations at SAP’s April 2007 Sapphire USA Conference.
Findings – The benefit-driver approach appears to provide at least one good answer to Robey et al.’schallenge.
Research limitations/implications – It seems likely that the model is valid for most large Westernorganizations implementing ES.
Practical implications – The model provides new insights into how and why the CSFs affectbenefits from ES.
Originality/value – No prior study to the best of one’s knowledge has sought to explain in suchdepth how ES project CSFs affect OBESU.
Keywords Critical success factors, Project management, Change management, Organizational change
Paper type Research paper
1. IntroductionEnterprise systems (ES) are large-scale, integrated application-software packages thatuse the computational, data storage, and data transmission power of moderninformation technology (IT) to support processes, information flows, reporting, anddata analytics within and between complex organizations. In this paper, the term “ES”is used to refer to all large organization-wide packaged applications includingenterprise resource planning (ERP), customer relationship management (CRM), supplychain management (SCM), data warehousing, and the proprietary software platformson which these applications are built (e.g. SAP’s NetWeaver and Oracle’s fusion). Sincethey impound deep knowledge of new ways of designing and executing organizationalprocesses, these complex software packages can cause considerable assimilationdifficulties for client organizations that implement them (Robey et al., 2002).
The current issue and full text archive of this journal is available at
www.emeraldinsight.com/1463-7154.htm
The authors would like to thank Sherry Finney for sharing the analysis spreadsheets from herstudy.
BPMJ15,5
716
Business Process ManagementJournalVol. 15 No. 5, 2009pp. 716-743q Emerald Group Publishing Limited1463-7154DOI 10.1108/14637150910987928

Worldwide investment in ES has been extensive. According to AMR Research(2005), such investment in ES was US$36 billion in 2004, and will expand to $48 billionby 2011 (AMR Research, 2007). Individual firms have also spent millions of dollarsacquiring and implementing ES, e.g. Disney Corporation reported at a presentation atSAP’s annual user conference, Sapphire 2003[1], that it spent $400 m on its two-yearSAP ES consolidation project. However, as with most large IT projects, not all ESprojects go smoothly. Widely reported disasters include the FoxMeyer Drug Company,a US$5 billion p.a. revenue pharmaceutical company went bankrupt and sued SAP andAndersen Consulting for US$500 m after its failed SAP implementation (Scott, 1999),and Hershey’s, a US$4 billion p.a. revenue confectionary maker, that spent US$112 mimplementing an SAP system, and which lost US$150 m in revenue as a result oflogistics problems in the first year after go live (Carr, 2002).
With such large expenditures on ES, and significant risks of failure, it is important formanagers to understand what makes some ES investments more successful than others.Therefore, a large number of studies has been conducted to identify so-called criticalsuccess factors (CSFs) for ES implementation projects. Finney and Corbett (2007), forinstance, identified and compared CSFs in 45 studies of factors affecting the success ofES projects conducted over the last decade. The dependent variable in all these studieswas usually ES implementation-project success, often defined as completing the projecton time, to scope, and within budget. In addition to all these CSF studies, otherresearchers have sought to identify factors that explain variance in organizationalbenefits from ES in the years after go live, Hong and Kim (2002), Davenport et al. (2002),Gattiker and Goodhue (2005), Staehr et al. (2006) and Seddon et al. (2007). However, asRobey et al. (2002) have pointed out, the CSF studies have typically made little attempt toexplain how the various CSFs affect organizational benefits from ES in the years aftertheir deployment:
In sum, studies of ERP’s CSFs offer few insights beyond conventional wisdom. Most studieslack a theoretical framework that adequately explains why the investigated project andbusiness outcomes occur. Thus, their contribution to understanding ERP implementation islimited (p. 20).
The goal of this paper is to plug the theory gap identified by Robey et al. (2002), bylinking the CSF studies to those on benefits in the years after go live. Therefore, theresearch question we pose in this study is:
RQ1. Through what mechanisms do the implementation-project CSFs identified inso many prior studies affect organizational benefits from ES?
The primary contribution of this paper is that it proposes and conducts a preliminarytest of a model that explains how the CSFs from the ES-project-success literature affectorganizational benefits from ES (with benefits being assessed from the perspective ofsenior management). To the best of our knowledge, no prior study has sought toexplain in depth the mechanisms through which ES-project CSFs identified in so manyprior studies affect organizational benefits from enterprise systems use (OBESU). Thedata for testing empirically this model came from 133 customer presentations by seniorindustry leaders at the Sapphire Conference held in Atlanta, the USA, in April 2007.As posited in the model, the empirical evidence suggests that various bundles ofCSFs (defined shortly) influence the achievement of organizational benefits primarily
How projectCSFs affect
OBES
717
through their influence on the three drivers from Seddon et al.’s (2007) organizationalbenefits from enterprise systems (OBES) model. The insights gained through thisstudy, we argue, provide:
(1) a much-needed preliminary answer to Robey et al.’s observation that the CSFstudies “offer few insights beyond conventional wisdom”;
(2) a way of organizing the 26 categories of CSFs identified by Finney and Corbett(2007) into much more workable bundles of factors than has been proposed inthe past; and
(3) two useful directions for future research.
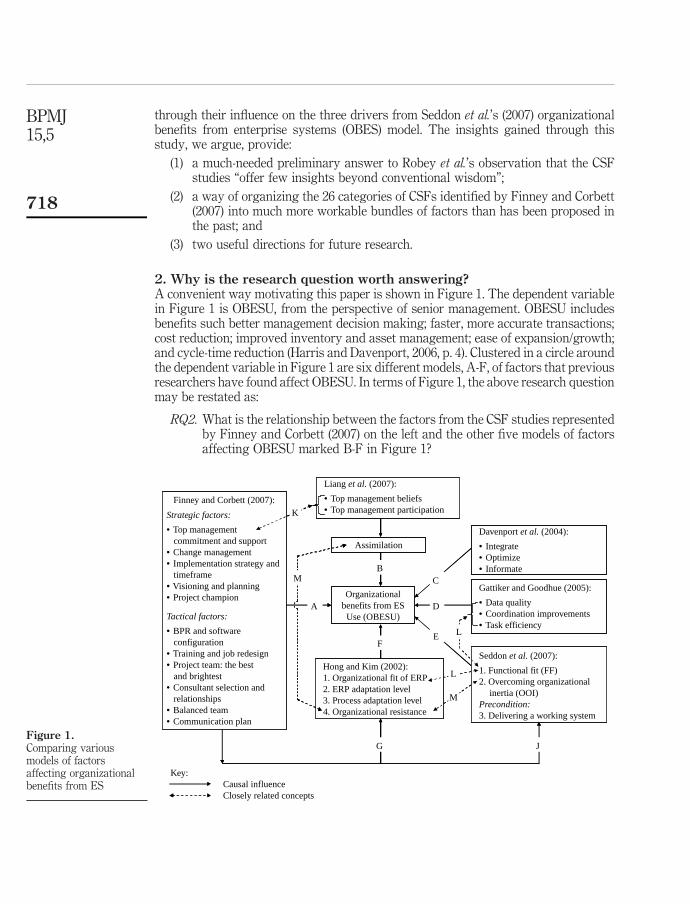
2. Why is the research question worth answering?A convenient way motivating this paper is shown in Figure 1. The dependent variablein Figure 1 is OBESU, from the perspective of senior management. OBESU includesbenefits such better management decision making; faster, more accurate transactions;cost reduction; improved inventory and asset management; ease of expansion/growth;and cycle-time reduction (Harris and Davenport, 2006, p. 4). Clustered in a circle aroundthe dependent variable in Figure 1 are six different models, A-F, of factors that previousresearchers have found affect OBESU. In terms of Figure 1, the above research questionmay be restated as:
RQ2. What is the relationship between the factors from the CSF studies representedby Finney and Corbett (2007) on the left and the other five models of factorsaffecting OBESU marked B-F in Figure 1?
Figure 1.Comparing variousmodels of factorsaffecting organizationalbenefits from ES
Organizationalbenefits from ES
Use (OBESU)
Finney and Corbett (2007):
Strategic factors:
Tactical factors:
C
Causal influenceClosely related concepts
Key:
Finney and Corbett (2007):
Strategic factors:
• Top management commitment and support• Change management• Implementation strategy and timeframe• Visioning and planning• Project champion
Tactical factors:
• BPR and software configuration• Training and job redesign• Project team: the best and brightest• Consultant selection and relationships• Balanced team• Communication plan
Gattiker and Goodhue (2005):
• Data quality• Coordination improvements• Task efficiency
Davenport et al. (2004):
• Integrate• Optimize• Informate
Hong and Kim (2002):1. Organizational fit of ERP2. ERP adaptation level3. Process adaptation level4. Organizational resistance
Liang et al. (2007):
• Top management beliefs• Top management participation
Assimilation
A
F
C
D
B
Seddon et al. (2007):
1. Functional fit (FF)2. Overcoming organizational inertia (OOI)Precondition:3. Delivering a working system
E
G J
K
L
M
M
L
BPMJ15,5
718

In Figure 1:. Model A hypothesizes that the more successfully an organization manages the
various CSFs that have been identified in many studies, the greater the OBESU.Finney and Corbett’s (2007) recent synthesis of findings from 45 different CSFstudies is convenient summary of those studies. The 11 most frequentlyidentified CSF categories they identified – classified as strategic and tacticalfactors as per their Table II (p. 335) – are shown on the left of Figure 1. However,as Robey et al. (2002) point out, what Finney and Corbett (2007) and theirpredecessors do not explain is how pursuit of their CSFs leads to better OBESU.For example, in their discussion of top-management support (TMS) – one of the26 CSF categories they discuss on Finney and Corbett (2007, pp. 335-9) say:
Top management commitment and support was one of the two most widely cited CSFs.This concept referred to the need to have committed leadership at the top managementlevel. In addition, this concept referred to the need for management to anticipate anyglitches that might be encountered (Motwani et al., 2002) and the need for seniormanagement who would be involved in the strategic planning, but who are alsotechnically orientated (Yusuf et al., 2004). Sarker and Lee (2003, p. 335) empiricallyproved that strong and committed leadership at the top management level is essentialto the success of an ERP implementation.
Notice in this quotation that although F&C claim that TMS is “essential to thesuccess of an implementation,” apart from saying that Sarker and Lee (2003)have “proved” TMS is essential to success of the implementation, they do notactually explain how and why TMS leads to greater OBESU.
. Model B hypothesizes that the greater the level of assimilation of an ERP system,the greater the benefits. Liang et al. (2007) do not make this claim explicitly, but itseems to be implied in their paper. Liang et al. (2007) report a strong association(a path coefficient of 0.476, p , 0.001) between top management participation inthe implementation project and assimilation in 77 Chinese firms that hadimplemented a Chinese ERP system called UFIDA.
. Model C follows Davenport et al. (2002) in hypothesizing that the more a firmintegrates, optimizes, and informates, the greater the OBESU. Empirically, usinga global sample from 163 large organizations, Davenport et al. report significantpath coefficients between their three variables and OBESU.
. Model D follows Gattiker and Goodhue (2005) in hypothesizing that the greaterthe coordination improvements, data quality, and task efficiency, the greater theOBESU. Empirically, using a sample from 111 US manufacturing firms, theyfound strong association between task efficiency and data quality and OBESU,and a moderate link from coordination improvements and OBESU.
. Model E follows Seddon et al. (2007) in hypothesizing that, provided the projectteam is successful in delivering a working system (DWS), the greater the successin achieving functional fit (FF) and overcoming organizational inertia (OOI) thegreater the OBESU. Empirically, using a sample of 130 presentations fromSapphire 2003 and 2005, they reported evidence of strong association between FFand OOI, on the one hand, and OBESU, on the other.
. Model F follows Hong and Kim (2002) in hypothesizing that the greater theorganizational fit of the ERP system (they consider data, process, and user fit)
How projectCSFs affect
OBES
719

and the lower the organizational resistance, the greater the OBESU. Empirically,based on a sample of 105 responses from team members in 34 implementationproject teams, they found a strong positive association between fit and OBESU,and strong negative association between resistance and OBESU.
At first glance, the six models just described offer remarkably different advice on whatan organization should do to achieve greater OBESU! Our approach to reconcilingthem began by observing that some factors are common to more than one model. Forexample, the double-headed arrows K, L, and M in Figure 1 link what we think areclosely related concepts in different models. Second, we observed that the differentmodels relate to different stages in the ES implementation-and-use cycle. For example,the CSFs are important during an implementation project, whereas the factors in Hongand Kim (2002), Gattiker and Goodhue (2005) and Seddon et al. (2007) are outcomes ofthe implementation project (that might be observable, say, in the year after go live), andthe factors in Davenport et al. (2002) describe actions a firm can take in the years aftergo live to improve OBESU. This led us to think that it might be possible to answerRobey et al.’s challenge by positing causal pathways from the various CSFs to OBESUvia the variables in the Hong and Kim (2002), Seddon et al. (2007), Gattiker andGoodhue (2005), and other similar project-outcomes models.
As an example of the sort of causal-explanation pathway we have in mind, considerthe following three-step logic:
(1) Liang et al. (2007) have built up a strong theoretical and empirical case for acausal association between TMS and assimilation.
(2) As shown by link M in Figure 1, Liang et al.’s assimilation is a similar constructto Seddon et al.’s OOI.
(3) Seddon et al. (2007) have built up a strong theoretical and empirical case for acausal association between OOI and OBESU[2].
The logical pathway (1) ! (2) ! (3) thus provides a causal explanation of how andwhy one CSF, TMS, affects OBESU.
As mentioned earlier, the goal of this paper is to plug the theory gap identified byRobey et al. (2002) by linking as many CSFs as possible (from the many CSF studies) toOBESU in the years after go live. We do that in this paper by proposing and testingcausal links (such as that just illustrated) between the top 18 CSFs from Finney andCorbett (2007) and OBESU. We believe this is a contribution to knowledge because, tothe best of our knowledge, no prior study has proposed or discussed such causalpathways. The next section presents, the model we have developed. In that model, wehave chosen to consider only pathway J&E in Figure 1 in depth because it is easier tosee links between the CSFs from Finney and Corbett (2007) and the three factors inSeddon et al.’s OBES model than between the CSFs and, say, the models with pathwaysC, D, or F in Figure 1.
3. How do project csfs affect OBES?The purpose of this section is to introduce and explain the model in Figure 2. In this model,we seek to explain how the project CSFs on the left of Figure 2 affect “OBESU” on theright. The model consists of three sets of hypotheses and propositions: H1-H3, P1a-P4,and P5. First, H1-H3 come from the project side of Seddon et al.’s (2007) model of OBES.
BPMJ15,5
720

That model hypothesizes that once the project team has been successful in deliveringa fully tested working system (DWS) that delivers significant new functionality tothe business (represented by the double-line arrow in Figure 2, which means“precondition”), a significant proportion of the variance in OBESU as perceived bysenior management is explained by variance in just two variables: FF and OOI. Thefour OBES project constructs are defined in Table I. H1-H3 linking these fourconstructs are not tested in this study because – using the same methodology as in thispaper – Seddon et al. (2007) report that in 95, 61, and 65 percent of the 130 cases theystudied there was empirical support for H1-H3, respectively. These percentages aredirectly comparable to those in the total percent column at the right of Table V in thispaper, and provide strong support for H1-H3. Treating H1-H3 as true enables us toconcentrate in this study on the propositions on the left of Figure 2 (P1a–P5).
Second, our model in Figure 2 also proposes that the top four groups of CSFs inFigure 2, Groups A, B, C, and D, explain variance in the three OBES benefit drivers. All16 CSFs in these groups – which, as discussed below, all come from Finney andCorbett (2007) – are defined in Table II. The six propositions, P1a-P1c, P2, P3, and P4,linking these groups of CSFs to the OBES benefit drivers are explained and justifiedlater in this section. Note that it would be possible to group F&C’s CSFs in manydifferent ways and posit links between those alternative groups and factors in any ofthe four other benefit-driver models in Figure 1 (B, C, D, and F). In this paper, we havechosen to group CSFs as we have, and map them to Seddon et al.’s OBES model,because this approach appears to offer the simplest mappings between the CSFs andany of the five other benefit-driver models (B-F).
Figure 2.How project CSFs affect
OBES
CSFs Benefit drivers
P2
P3
P4
P5 Precondition forachieving benefits
Benefits
A. Top management support
• Top management commitment & support• Project champion• Visioning and planning
B. Achieving functional fit
• BPR & software configuration• Selection of ERP• Balanced team
C. Changing the organization
• Change management• Training & job redesign• Communication plan• Team morale & motivation• Managing cultural change
D. Project management
• Project management• Implementation strategy & timeframe• Project team: The best and brightest• Troubleshooting/crises management• Vanilla ERP
E. Other factors
• Consultant selection & relationship• IT infrastructure
Functional fit (FF)
Delivering aworking system
(DWS)
Organizationalbenefits from
ES use (OBESU)
Overcomingorganizationalinertia (OOI)
H1
H2
H3
P1c
P1b
P1a
How projectCSFs affect
OBES
721

Third, the model also proposes that the two CSFs in Group E in Figure 2 explainvariance in Organizational benefits from ES directly (not via a benefit driver). The twoCSFs in Group E, also from F&C, are also defined in Table II. The seventh proposition,P5, is justified at the end of this section.
Theory developmentPrior research has identified many factors that affect the success of ES implementationprojects. Studies such as Bingi et al. (1999), Markus and Tanis (2000), Sumner (2000),Somers and Nelson (2001), Hong and Kim (2002), Sun et al. (2005), King and Burgess(2006) and Nelson (2007) have identified lists of CSFs intended to guide project leaderson key factors to manage during ES implementations. Other studies have focused onaspects of the ES-implementation process. Amongst many others, these include studiesof project management (Sumner, 2000; Scott and Vessey, 2000; Robey et al., 2002;Mandal and Gunasekaran, 2003; Sun et al., 2005), change management (Markus andTanis, 2000; Motwani et al., 2002; McAdam and Galloway, 2005), TMS (Bingi et al.,1999; Sumner, 2000; Aladwani, 2001; Sarker and Lee, 2003; Liang et al., 2007)
Factor Definition
OBESU, from theperspective of seniormanagement
The dependent variable in the OBES model, organizational benefitsfrom system use, from the perspective of senior management, is anoverall measure of senior management’s perception of the benefits fromthe IT-based application. Such benefits usually revolve around thesoftware enabling: (a) faster more accurate process coordination andexecution, including links with business partners up and down thesupply chain; and (b) greater accuracy of and visibility intoorganizational data, resulting in more tightly controlled organizationalprocesses, improved asset utilization, and improved decision making
1. Functional fit FF is the extent to which the functional capabilities embedded withinan ES package match the functionality that an organization needs tooperate effectively and efficiently. Saying that software has good FF isequivalent to saying that the processes supported by the ES are goodones and the software helps people in the organization get their jobsdone. Note that, FF does not consider the capacity or desire of people inthe organization to use or work with the system, which is capturedby OOI
2. Overcomingorganizational inertia
OOI is the extent to which members of the organization have beenmotivated to learn, use, and accept the new system. During initialimplementation and subsequent upgrade projects, considerablechange-management effort, training, and support are needed toovercome organizational inertia
3. Delivering a workingsystem
DWS is a binary variable that indicates the project team’s success indelivering a fully tested working system. The need for this variable isderived from underlying goal of most ES project managers, which is todeliver a full-scope, configured, reliable, fully tested working enterprisesystem with clean data and a reasonable response time, on time andwithin project resource constraints. In the OBES model, having a fullytested working system is viewed as a necessary precondition for thevalidity of H1 and H2
Source: Seddon et al. (2007)
Table I.Definitions of variablesin the on the right-handside of Figure 2
BPMJ15,5
722

F&C’s CSF categoryDefinition (from Finney and Corbett, 2007,unless stated otherwise)
Citations inF&C
Group A: top-management support1. Top management commitment and
supportTop management commitment and supportis the committed leadership at the topmanagement level and involvement in thestrategic planning of an ES implementationproject 25
2. Project champion Project champion is someone who plays apromotional, influencing role in a project.The individual should possess strongleadership skills as well as business,technical and personal managerialcompetencies 10
3. Visioning and visioning andplanning
Visioning and visioning and planningincludes defining a clear project objectiveand scope, matching business goals with ISstrategy, incorporating risk and qualitymanagement, and benchmarking internaland external best practices for ERPimplementation planning 15
Group B: achieving FF4. BPR and software configuration BPR and software configuration is how the
usage of the system matches the businessgoals and how the business will operateafter the package is in use (Ribbers andSchoo, 2002). This process involvesbusiness process reengineering and changetechniques 23
5. Selection of ERP Selection of ERP is choosing appropriatesystem or a particular software packagethat matches the business process. Selectionof a vendor is also a part of this 7
6. Balanced team Balanced team means that the project team iscross-functional consisting of people withdifferent skills, for instance business, IT, andinterdepartmental cooperation skills, and soforth. (This also involves user participation(Mandal and Gunasekaran, 2003)) 12
Group C: changing the organization7. Change management Change management is the structured
approach that enables the transition fromthe current state to a desired future state.This includes building user acceptance ofthe project, overcoming organizationalresistance to change and educating aboutthe benefits and needs for an ERP system 25
8. Training and job redesign Training includes project team training,user training, and also the need to plan fortraining facilities. Job redesign describeshow staff needs to be restructured 23
(continued )
Table II.CSF categories for ERPimplementation projects
How projectCSFs affect
OBES
723
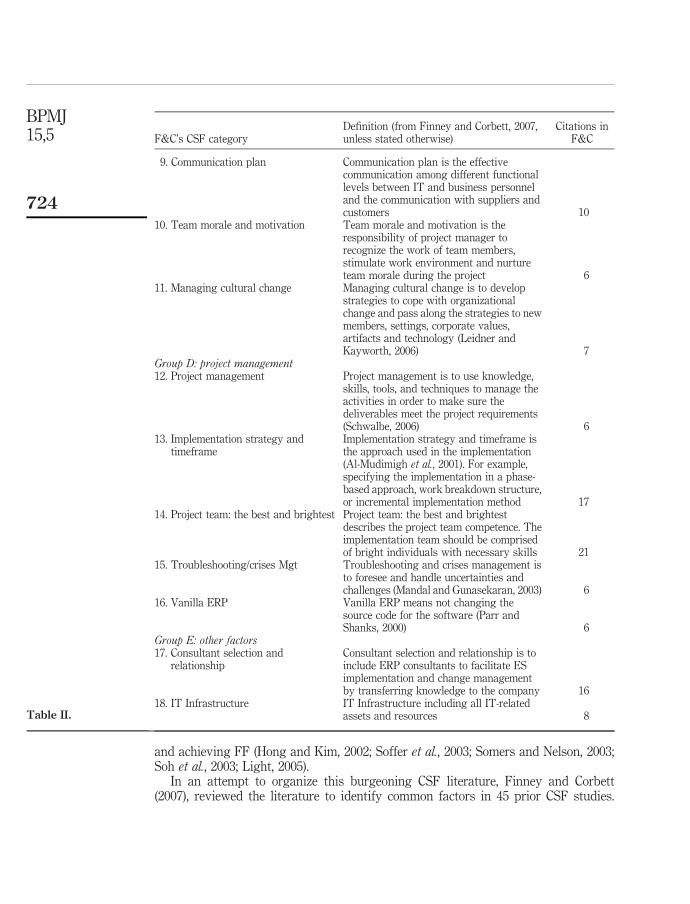
and achieving FF (Hong and Kim, 2002; Soffer et al., 2003; Somers and Nelson, 2003;Soh et al., 2003; Light, 2005).
In an attempt to organize this burgeoning CSF literature, Finney and Corbett(2007), reviewed the literature to identify common factors in 45 prior CSF studies.
F&C’s CSF categoryDefinition (from Finney and Corbett, 2007,unless stated otherwise)
Citations inF&C
9. Communication plan Communication plan is the effectivecommunication among different functionallevels between IT and business personneland the communication with suppliers andcustomers 10
10. Team morale and motivation Team morale and motivation is theresponsibility of project manager torecognize the work of team members,stimulate work environment and nurtureteam morale during the project 6
11. Managing cultural change Managing cultural change is to developstrategies to cope with organizationalchange and pass along the strategies to newmembers, settings, corporate values,artifacts and technology (Leidner andKayworth, 2006) 7
Group D: project management12. Project management Project management is to use knowledge,
skills, tools, and techniques to manage theactivities in order to make sure thedeliverables meet the project requirements(Schwalbe, 2006) 6
13. Implementation strategy andtimeframe
Implementation strategy and timeframe isthe approach used in the implementation(Al-Mudimigh et al., 2001). For example,specifying the implementation in a phase-based approach, work breakdown structure,or incremental implementation method 17
14. Project team: the best and brightest Project team: the best and brightestdescribes the project team competence. Theimplementation team should be comprisedof bright individuals with necessary skills 21
15. Troubleshooting/crises Mgt Troubleshooting and crises management isto foresee and handle uncertainties andchallenges (Mandal and Gunasekaran, 2003) 6
16. Vanilla ERP Vanilla ERP means not changing thesource code for the software (Parr andShanks, 2000) 6
Group E: other factors17. Consultant selection and
relationshipConsultant selection and relationship is toinclude ERP consultants to facilitate ESimplementation and change managementby transferring knowledge to the company 16
18. IT Infrastructure IT Infrastructure including all IT-relatedassets and resources 8Table II.
BPMJ15,5
724
They initially identified a list of 55 factors which they were then able to reduce to aranked list of 26 categories of ES implementation CSFs. In what follows, we refer tothis list of 26 CSF categories as F&C’s CSFs. In their Table III (p. 340), F&C report thenumber of studies that had identified each factor as important to project success, e.g. 25of the 45 studies identified “Top management commitment and support” as a CSF.
To keep this paper to a reasonable length, in the empirical part of this study, wedecided to restrict our attention to the top 18 CSFs from F&C’s list. These 18 CSFsaccount for 244 or 87 percent of the 279 factor citations in F&C’s Table III. Table IIpresents a brief definition (mainly from F&C, pp. 335-9) for each of the 18 factors, andreports the number of studies from F&C that identified each factor as important.Finally, to demonstrate more clearly the links between these CSFs and the factors inSeddon et al.’s OBES model, we have grouped the 18 CSFs into the five categorieslabeled Groups A-E in Figure 2 and Table II. From a structural-equation modelingperspective, the group-level constructs may be thought of as latent variables, and theCSFs in each group as indicators. Some of these classifications were harder to makethan others. For instance, the visioning, scoping and alignment-with-strategy parts ofvisioning and planning are top management activities, whereas “benchmarkinginternal and external best practices for ERP implementation” are probably not.
Group A: top-management supportAs defined in Table II, CSF Group A “top management support” includes three ofF&C’s CSFs: top management commitment and support, project championship, andvisioning and planning. The factors in Group A have been grouped as they havebecause they all seem related to a key success factor identified in many CSF studiesand in Liang et al. (2007). Top management commitment and support is the committedleadership at the top management level involving the strategic planning of an ESimplementation project. A project champion is someone who plays a promotional,influencing role in a project. This individual should possess strong leadership skills aswell as business, technical, and personal managerial competencies. The aspects ofVisioning and planning that are indicative of the presence of top-management supportare having clear project objectives and scope, having information systems strategyaligned with business goals, the existence of sound risk and quality trade-offs, andevidence of well-considered choices with respect to use of internal and external bestpractices for ERP implementation, e.g. though benchmarking. We now advance threepropositions (P1a-P1c) that explain how top-management support probably influencesall three OBES benefit drivers in Figure 2.
Impact of top-management support on FF (P1a). As defined in Table I, FF refers tothe extent that the functional capabilities embedded within an ES package matchfunctionality that an organization needs to be able to operate effectively and efficiently.FF can be achieved through software package selection, configuration, customization,and business-process reengineering to adapt new organizational process (Somers andNelson, 2003; Soh and Sia, 2004; Light, 2005; Luo and Strong, 2005; Seddon et al., 2007).Many researchers have explored difficulties in achieving FF (Soffer et al., 2003;Kraemmerand et al., 2003; Somers and Nelson, 2003; Light, 2005; Soh and Sia, 2005; Luoand Strong, 2005). According to Soh et al. (2003) and Light (2005), misfit can be causedby two reasons: the organization is unclear about their precise requirements forimplementation and there is poor comprehension between IT and business people.
How projectCSFs affect
OBES
725
Inadequate requirements and misunderstandings may lead to difficulties in theevaluation of a software package, wrong functional design, inappropriate userinterfaces, and system redesign.
Top management is not expected to understand all the detailed nuances of asoftware package, but they can define clear objectives for the implementation projectand set-up organizational structures to ensure that required functionality is clear. Forexample, as Kraemmerand et al. (2003) stress, top managers are usually the only onessufficiently equipped to act as mediators between the technological and businessdomains. In many organizations, this mediation comes in the form of steeringcommittees which consist of senior executives across different functions. Somers andNelson (2003) explain that steering committees lead to improved communicationsbetween IT and business management, which ultimately leads to better fit between theconfigured ES and corporate strategy. We, therefore, propose:
P1a. The greater the level of top-management-support factors: (1) top managementcommitment and support; (2) project champion commitment; and (3) visioningand planning, the greater the level of FF achieved in an ES implementationproject.
Impact of top-management support on OOI (P1b). As defined in Table I, OOI involveschange-management efforts in terms of motivating organizational learning, usage, andacceptance of a new ES. Since ES implementation normally involves process change,successful ES implementation is heavily dependent on adequately managing changeacross various key areas related to organizational structure, IT structure, humanresources, culture, and management systems.
The ES literature has also shown that TMS has an important role in influencing andmotivating members of the organization to adopt and use a new enterprise system. Asmentioned in the (1) ! (2) ! (3) pathway example above, Liang et al. (2007) found therole of top management important in motivating organizational ERP usage. Aladwani(2001) suggests that top management should proactively deal with user resistance byidentifying the sources of user resistance to an enterprise system in order to establishchange management strategies to overcome it. Abdinnour-Helm et al. (2003)recommend that the most effective response to resistance is to demonstrate that thechange is in people’s best interest (Abdinnour-Helm et al., 2003). People need detailedexplanation of the change process and to be provided more information about theeffects of the change on the individual level. Apart from motivation, people need to betrained to use the new system and new processes. Preconditions for effective traininginclude a strong communication network across the organization and ample resourcesfor training (Mandal and Gunasekaran, 2003). Neither of these can be provided withoutthe support and commitment of top management. In addition, the strategies set by topmanagement to deal with change resistance can also be presented in terms of norms,benchmarks, and culture which then permeate to the individual level in the form ofprocedures, regulations, and routines (Purvis et al., 2001) that motivate people tochange. In short, since top management play a key role of advocating, motivating, andsupporting in overcoming user resistance, we propose that:
P1b. The greater the level of top-management support factors: (1) top managementcommitment and support; (2) project-champion commitment, and (3) visioningand planning, the greater the likelihood of OOI in an ES implementation project.
BPMJ15,5
726

Impact of top-management support on DWS (P1c). As defined in Table I, DWS is abinary variable in OBES that indicates the project team’s success in DWS. Researchconducted by Holland and Light (1999), Scott and Vessey (2000), Umble et al. (2003),Mandal and Gunasekaran (2003), Somers and Nelson (2003) and Schwalbe (2006) hasfound that strong project management was essential to a successful implementation,which means DWS.
Among the research conducted on ERP project success factors, TMS has been foundto be a key factor throughout the implementation process (Holland and Light, 1999;Bingi et al., 1999; Sumner, 2000; Nah et al., 2001; Mandal and Gunasekaran, 2003; Umbleet al., 2003; Somers and Nelson, 2004). Top management need to champion the project,ensure it has sufficient resources, provide direction for the implementation team, andsolve problems arising from factors outside the project manager’s control. According toMandal and Gunasekaran (2003), the involvement of top management remains criticalthroughout the project, e.g. in constantly monitoring the progress of the project andproviding direction to the implementation team. We, therefore, posit that:
P1c. The greater the level of top-management-support factors: (1) top managementcommitment and support; (2) project champion commitment; and (3) visioningand planning, the greater the likelihood of DWS in an ES implementationproject.
Group B: achieving FFAs defined in Table II, CSF Group B “achieving functional fit” consists of three CSFs:business process reengineering (BPR) and software configuration, selection of ERP, andbalanced team. BPR and software configuration concerns the extent to which theconfigured system supports the business goals and how the business will operate afterthe package is in use. These CSFs all seem likely to help in achieving the FF outcome inthe OBES model. Selection of ERP involves choosing an appropriate system or softwarepackage that best matches the organization’s business processes. Balanced team refersto a cross-functional project team which consists of people with different skills, forinstance business, IT, and interdepartmental cooperation skills, user participation andso forth.
According to Luo and Strong (2005), BPR refers to redesigning the business processesto adjust to those supported by the ES. Though ERP systems can be configured to fitorganizational structures and business practices (Somers and Nelson, 2003), manycompanies find they have to change their business processes to conform to theERP-defined standard processes. All these changes via BPR and software configurationcan help an organization to improve productivity and efficiency (Hong and Kim, 2002),which are key indicators of FF. Somers and Nelson (2003) argue that selecting the rightsoftware can mean a commitment to architecture and applications that seem to best fitthe organization’s strategic goals or business processes. According to Al-Mudimigh et al.(2001), the selection of an ERP vendor is also important to achieve FF. Mostorganizations that choose ES are large companies with branches in multiple locations,which leads to the need for functionality and operational ability across all the businessunits. The chosen software should have the ability to capture the complexity of businessprocess of each business unit and be as tailorable as possible (Brehm et al., 2001).It is argued that better FF can be achieved by the understanding of user requirements(Light, 2005). Based on the discussion above we propose that:
How projectCSFs affect
OBES
727

P2. The greater the attention to functional-fit factors: (4) BPR and softwareconfiguration; (5) selection of ERP; and (6) balanced team, the greater thelevel of FF the organization is likely to achieve in an ES-implementationproject.
Group C: changing the organizationAs defined in Table II, CSF Group C “changing the organization” includes CSFs: changemanagement, training and job redesign, communication plan, team morale andmotivation, and managing cultural change. These CSFs all seem likely to help inachieving the OOI outcome in the OBES model. Change management is a structuredapproach that enables the transition from the current state to a desired future state. Thisincludes building user acceptance of the project, overcoming organizational resistance tochange and educating about the benefits and needs for an ERP system Training includesproject team training, user training, and also the need to plan for training facilities. Jobredesign describes how staff needs to be restructured. Communication plan helps tofacilitate effective communication among and between different functional levels,between IT and business personnel and with suppliers and customers. Team Morale andmotivation is the responsibility of project manager to recognize the work of teammembers, stimulate work environment and nurture team morale during the project.Managing cultural change is to develop strategies to cope with organizational changeand pass along the strategies to new members, settings, corporate values, artifacts andtechnology.
Motwani et al. (2002) argue that organizational organizational culture is important forfacilitating and motivating organizational learning, sharing information, and makingdecisions, so that cultural readiness is the precondition for promoting the changemanagement. Al-Mashari and Zairi (2000) explain that an organization’s legacy systemencapsulates existing business processes, organizational structure, and IT. Therefore,changing the system means changing ways of learning, sharing knowledge, andworking. It follows that open communication, training and team motivation are essentialto facilitate the organizational change. Training can offer a good opportunity to helppeople adjust to the change that has been introduced by the ES, and can help to buildpositive attitudes toward the system (Aladwani, 2001). Training can also help staff tounderstand the issues and become more comfortable in working and dealing withsystem changes. According to McAdam and Galloway (2005), a specific and detailedvision of the changes is necessary to help to convince and motivate people to devote timeand energy to the changes. Motwani et al. (2002) also argue that open communication canfacilitate information sharing, promote a common understanding and innovativebehavior in the organization. During the ES implementation project, sufficientcommunication with employees can help them to recognize the impact of the system andalso provide timely feedback from different perspectives about the effectiveness of thenew ES and new processes. In order to achieve effective communication, companiesoften use technology such as e-mail to exchange messages and share knowledge. Apartfrom learning and communication, the change of organizational structure will also leadto new or changed jobs and the workforce will have new responsibilities. New attitudesneed to develop to match the changes and the new organization (McAdam and Galloway,2005), and as described in P1b people need to be motivated to accept the new roles andnew ways of working. We therefore propose that:
BPMJ15,5
728

P3. The greater the level of overcoming-organizational-inertia factors: (7) changemanagement; (8) training and job redesign; (10) team morale and motivation;(11) managing cultural change; and (9) the more effective the communicationplan, the greater the likelihood of OOI in an ES implementation project.
Group D: Project managementAs defined in Table II, CSF Group D “project management” includes five CSFs: projectmanagement, implementation strategy and timeframe, project team: the best andbrightest, troubleshooting/crises management, and Vanilla ERP. These CSFs all seemlikely to help in achieving the DWS outcome in the OBES model. Project managementis to use knowledge, skills, tools and techniques to manage the activities in order tomake sure the deliverables meet the project requirements. Implementation strategyand timeframe is the approach used in the implementation (Al-Mudimigh et al., 2001).Project team: the best and brightest describes the competence of the project team.Many researchers report that the implementation team should be comprised of brightindividuals with the necessary skills. Troubleshooting and crises management is toforesee and handle uncertainties and challenges. Vanilla ERP means that the basesoftware is not modified.
A successful IT project is generally regarded as one that is finished on time, withinbudget, and meeting functionality and scope expectations (Ewusi-Mensah, 1997;Standish Group International, 1999, 2001; Jurison, 1999; Schmidt et al., 2001; Schwalbe,2006). In order to achieve success, project managers play an important role in scoping theES projects, controlling and governing the projects, and guiding team members todeliver a full-scope, configured, and reliable ES. To set a timeframe, they need to secureresources including internal and external consultants, and plan in advance according tothe available resources. To work on an implementation strategy means choosing theapproach to use in the implementation (Al-Mudimigh et al., 2001), e.g. specifying theimplementation as a phase-based approach, work breakdown structure, or incrementalimplementation method. To form the project team, members with balanced skills – ofboth business needs and ES capabilities – need to be chosen. To deal with human issues,project managers need to have problem-solving skills in order to create a harmoniousand trusting work environment. The project manager needs to use knowledge, skills,and tools and techniques to motivate and manage the team to work effectively in orderto ensure the quality of the system. Finally, the project will be simpler to manageif the source code is not modified. Since all these CSFs contribute to the delivery of aworking enterprise system, we therefore propose that:
P4. The better that the project-related factors (12) project management, (13)implementation strategy and timeframe, (14) project team: the best andbrightest, (15) troubleshooting/crises management are managed, and the more“Vanilla” the final solution, the more likely the project is to DWS in an ESimplementation project.
Group E: other factorsThe final group of CSFs in Figure 2, Group E, “other factors”, includes consultantselection and relationship and it infrastructure. consultant selection and relationshiprecognizes the importance of ES implementation partners (ERP consultants) infacilitating ES implementation and change management by transferring knowledge to
How projectCSFs affect
OBES
729

the company (Finney and Corbett, 2007). In much the same way that top-managementsupport seems likely to affect all three benefit drivers in Figure 2 (P1a-P1c), we wouldexpect consultant selection and relationship to affect all three benefit drivers. However,it clearly does not fit within Group A, top-management support. IT infrastructureincluding all IT related assets and resources, e.g. server capacity, networks, etc. thathave to be in place to have a successful project (Finney and Corbett, 2007). There is noobvious link between IT infrastructure and any of the three OBES benefit drivers,except perhaps to DWS. Our difficulties in classifying these two CSFs provides areminder that classification is difficult and that not all CSFs may be neatly related tothe OBES factors. Since we are uncertain about the pathways for these two variables,for the time being we simply propose (in P5) that they affect Organizational Benefitsfrom ES directly:
P5. The better that (17) consultant selection and relationship and (18) ITinfrastructure are managed, the more likely the project is to deliverorganizational benefits.
Summary of the modelThe model in Figure 2 of project success factors posited to affect organizationalbenefits from ES projects is a synthesis of the 18 CSFs from Finney and Corbett (2007)and the project side of Seddon et al.’s (2007) OBES model. The model proposes that thefirst four groups of CSFs explain variance in three benefit drivers, namely FF, OOI, andDWS, which, in turn, drive OBESU. The fifth group is posited to influenceOrganizational benefits directly. Obviously, since the model is concerned with verycomplex organizational phenomena, it is not suggested that the 18 CSFs explain all thevariance in FF, OOI and DWS. We do argue, however, that the model in Figure 2 is acontribution to the ES literature because it provides a causal explanation of how theCSFs that have been so widely reported in the literature help organizations achievebenefits from their ES. Hitherto, as Robey et al. (2002) have argued, there have been fewif any attempts in the literature to explain theoretically how the CSFs in the variousCSF studies relate to benefits from ES in the years after deployment. The remainder ofthis paper presents details and findings from a preliminary test of the model inFigure 2.
4. Reseach methodologyData selectionAs explained above, the data for this study came from presentations given at SAP’sSapphire USA Conference, Atlanta, in April 2007. Both the audio recordings (usually45 minutes in length) and presentation slides were available from the SAP “community”web site. A total of 147 presentations labeled by SAP as “customer presentations” weregiven by senior managers and ES project managers from large organizations from themanufacturing, banking, chemical, food, software, media, and other industries, e.g.Coca-Cola Company, Colgate, GSK, Whirlpool, NASA, John Deere, Pacific Coast, andThe Home Depot. They relate to most of SAP’s software packages, such as ERP, CRM,PLM, and SCM. After excluding 14 presentations from SAP partners who did not talkabout specific ES implementations, there were 133 presentations available for analysisin this paper. Most of these were from very large organizations. For instance, of the
BPMJ15,5
730
70 organizations that reported revenues in their presentations, 18 had 2006 revenuesabove US$10b per year.
The data for this study thus involves around 4,000 PowerPoint slides and 100 hoursof recordings from 133 presentations. Typically, the presenter was the senior projectmanager or chief information officer (CIO) who led the ES implementation. Suchpeople have rich understanding of the goals, issues, and outcomes of ES projects.The typical structure of a presentation included describing the organization, reasonsfor selecting the software, implementation project, strategies and timelines of theimplementation, team description, details of some aspect of the functionality of thesoftware, the process of using the system, benefits from the project, lessons learned,and future development.
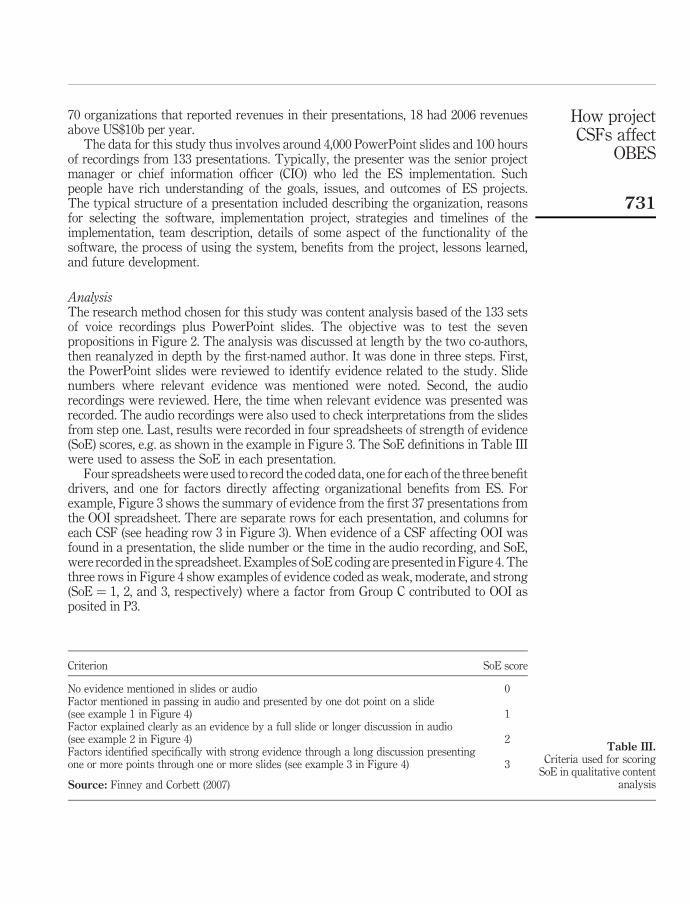
AnalysisThe research method chosen for this study was content analysis based of the 133 setsof voice recordings plus PowerPoint slides. The objective was to test the sevenpropositions in Figure 2. The analysis was discussed at length by the two co-authors,then reanalyzed in depth by the first-named author. It was done in three steps. First,the PowerPoint slides were reviewed to identify evidence related to the study. Slidenumbers where relevant evidence was mentioned were noted. Second, the audiorecordings were reviewed. Here, the time when relevant evidence was presented wasrecorded. The audio recordings were also used to check interpretations from the slidesfrom step one. Last, results were recorded in four spreadsheets of strength of evidence(SoE) scores, e.g. as shown in the example in Figure 3. The SoE definitions in Table IIIwere used to assess the SoE in each presentation.
Four spreadsheets were used to record the coded data, one for each of the three benefitdrivers, and one for factors directly affecting organizational benefits from ES. Forexample, Figure 3 shows the summary of evidence from the first 37 presentations fromthe OOI spreadsheet. There are separate rows for each presentation, and columns foreach CSF (see heading row 3 in Figure 3). When evidence of a CSF affecting OOI wasfound in a presentation, the slide number or the time in the audio recording, and SoE,were recorded in the spreadsheet. Examples of SoE coding are presented in Figure 4. Thethree rows in Figure 4 show examples of evidence coded as weak, moderate, and strong(SoE ¼ 1, 2, and 3, respectively) where a factor from Group C contributed to OOI asposited in P3.
Criterion SoE score
No evidence mentioned in slides or audio 0Factor mentioned in passing in audio and presented by one dot point on a slide(see example 1 in Figure 4) 1Factor explained clearly as an evidence by a full slide or longer discussion in audio(see example 2 in Figure 4) 2Factors identified specifically with strong evidence through a long discussion presentingone or more points through one or more slides (see example 3 in Figure 4) 3
Source: Finney and Corbett (2007)
Table III.Criteria used for scoring
SoE in qualitative contentanalysis
How projectCSFs affect
OBES
731

Figure 3.The upper quarter of theOOI analysis spreadsheet(cases 1-37) N
ote:
Evi
denc
e is
rec
orde
d ei
ther
by
the
slid
e nu
mbe
r in
the
Pow
er P
oint
pre
sent
atio
n, e
.g.“
s14”
for
“sl
ide1
4” in
case
8, o
r by
the
num
ber
of m
inut
es in
toth
e re
cord
ed p
rese
ntat
ion,
e.g
. 42-
43 m
inut
es in
to th
e re
cord
ing
inca
se 6
BPMJ15,5
732

SO
EE
xam
ple
Ex
pla
nat
ion
ofS
oEco
din
g
1
Slid
e 23
, cas
e 22
slid
e23
,ca
se22
Inth
issl
ide,
the
CIO
from
Tes
sen
der
loK
erle
y,
Inc.
ag
lob
alw
ebse
rvic
esco
mp
any
,sh
ows
trai
nin
gas
imp
orta
nt
inp
rep
arin
gfo
rg
o-li
ve.
Sin
ceth
isp
oin
tw
asn
otd
iscu
ssed
ind
etai
lin
the
spok
enp
rese
nta
tion
,th
est
ren
gth
ofth
isev
iden
ceth
attr
ain
ing
isan
imp
orta
nt
mec
han
ism
for
OO
Iw
asju
dg
edto
be
lim
ited
,i.e
.1.
Th
isd
ecis
ion
isre
cord
edin
row
29,
colu
mn
Tof
the
spre
adsh
eet
inF
igu
re3
by
the
stri
ng
“s23
,”in
dic
atin
gth
atth
eev
iden
cew
ason
slid
e23
ofth
eP
ower
Poi
nt
pre
sen
tati
on
2
Slid
e 72
, cas
e 14
slid
e72
,ca
se14
Ind
iscu
ssin
gth
issl
ide,
the
spea
ker
from
Joh
ns
Hop
kin
sU
niv
ersi
tysp
ent
one
min
ute
exp
lain
ing
how
thei
r“W
ork
For
ceT
ran
siti
on”
and
“Tra
inin
g”
team
sd
ealt
wit
hch
ang
em
anag
emen
tan
du
ser
trai
nin
gin
thei
rsu
pp
lych
ain
imp
lem
enta
tion
pro
ject
.T
he
stre
ng
thof
this
evid
ence
that
chan
ge
man
agem
ent
and
trai
nin
gh
elp
toov
erco
me
org
aniz
atio
nal
iner
tia
was
jud
ged
tob
em
oder
ate,
i.e.2
.Th
isd
ecis
ion
was
reco
rded
inro
w21
,col
um
nT
ofth
esp
read
shee
tin
Fig
ure
3,b
yth
est
rin
g“s
72,”
ind
icat
ing
that
the
evid
ence
was
onsl
ide
72of
the
Pow
erP
oin
tp
rese
nta
tion
3
Slid
e 14
, cas
e 9
slid
e14
,ca
se9
Ind
iscu
ssin
gth
issl
ide,
the
sen
ior
pro
ject
man
ager
ofB
urd
aDig
ital
,ale
adin
gG
erm
anp
ub
lish
ing
com
pan
y,
spen
t5
min
ute
sta
lkin
gab
out
the
imp
orta
nce
ofch
ang
em
anag
emen
tin
thei
rp
roje
ct.S
he
talk
edab
out
thei
rh
olis
tic
chan
ge
man
agem
ent
inIT
syst
ems,
pro
cess
es,
and
org
aniz
atio
nal
stru
ctu
res
tod
evel
opa
solu
tion
that
del
iver
sp
roce
ssex
cell
ence
and
allo
ws
bu
sin
ess
mod
elin
nov
atio
n.T
wo
typ
esof
chan
ge
man
agem
ent
wer
eid
enti
fied
ask
eysu
cces
sp
roje
ctfa
ctor
s:on
ew
asm
anag
ing
the
chan
ge
inth
eb
usi
nes
s,an
dth
eot
her
was
man
agin
gth
ech
ang
ein
IT.
Th
est
ren
gth
ofth
isev
iden
ceth
atch
ang
em
anag
emen
tis
imp
orta
nt
for
OO
Iw
asju
dg
edto
be
stro
ng
,i.e
.3.
Th
isd
ecis
ion
was
reco
rded
inro
w16
,col
um
nR
ofth
esp
read
shee
tin
Fig
ure
3b
yth
est
rin
g“s
14,”
ind
icat
ing
that
the
evid
ence
was
onsl
ide
14of
the
Pow
erP
oin
tp
rese
nta
tion
Figure 4.Examples of SoE
judgments for evidencesupporting P3
How projectCSFs affect
OBES
733
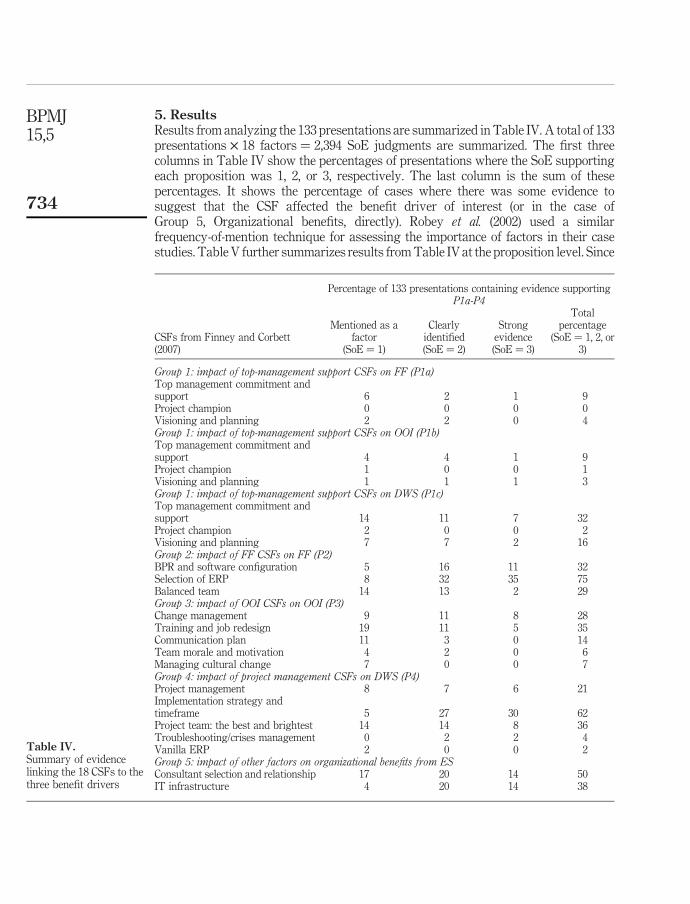
5. ResultsResults from analyzing the 133 presentations are summarized in Table IV. A total of 133presentations £ 18 factors ¼ 2,394 SoE judgments are summarized. The first threecolumns in Table IV show the percentages of presentations where the SoE supportingeach proposition was 1, 2, or 3, respectively. The last column is the sum of thesepercentages. It shows the percentage of cases where there was some evidence tosuggest that the CSF affected the benefit driver of interest (or in the case ofGroup 5, Organizational benefits, directly). Robey et al. (2002) used a similarfrequency-of-mention technique for assessing the importance of factors in their casestudies. Table V further summarizes results from Table IV at the proposition level. Since
Percentage of 133 presentations containing evidence supportingP1a-P4
CSFs from Finney and Corbett(2007)
Mentioned as afactor
(SoE ¼ 1)
Clearlyidentified(SoE ¼ 2)
Strongevidence(SoE ¼ 3)
Totalpercentage
(SoE ¼ 1, 2, or3)
Group 1: impact of top-management support CSFs on FF (P1a)Top management commitment andsupport 6 2 1 9Project champion 0 0 0 0Visioning and planning 2 2 0 4Group 1: impact of top-management support CSFs on OOI (P1b)Top management commitment andsupport 4 4 1 9Project champion 1 0 0 1Visioning and planning 1 1 1 3Group 1: impact of top-management support CSFs on DWS (P1c)Top management commitment andsupport 14 11 7 32Project champion 2 0 0 2Visioning and planning 7 7 2 16Group 2: impact of FF CSFs on FF (P2)BPR and software configuration 5 16 11 32Selection of ERP 8 32 35 75Balanced team 14 13 2 29Group 3: impact of OOI CSFs on OOI (P3)Change management 9 11 8 28Training and job redesign 19 11 5 35Communication plan 11 3 0 14Team morale and motivation 4 2 0 6Managing cultural change 7 0 0 7Group 4: impact of project management CSFs on DWS (P4)Project management 8 7 6 21Implementation strategy andtimeframe 5 27 30 62Project team: the best and brightest 14 14 8 36Troubleshooting/crises management 0 2 2 4Vanilla ERP 2 0 0 2Group 5: impact of other factors on organizational benefits from ESConsultant selection and relationship 17 20 14 50IT infrastructure 4 20 14 38
Table IV.Summary of evidencelinking the 18 CSFs to thethree benefit drivers
BPMJ15,5
734
some presentations mentioned more than one CSF from the same group, to avoid doublecounting, the group-level SoE scores are not just the sum of the CSF scores in that group.
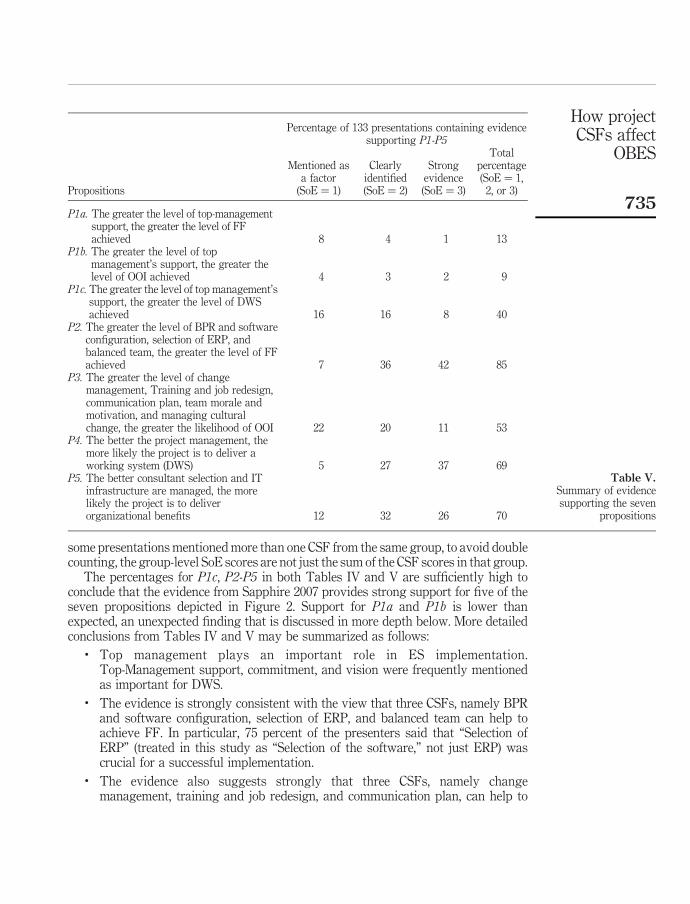
The percentages for P1c, P2-P5 in both Tables IV and V are sufficiently high toconclude that the evidence from Sapphire 2007 provides strong support for five of theseven propositions depicted in Figure 2. Support for P1a and P1b is lower thanexpected, an unexpected finding that is discussed in more depth below. More detailedconclusions from Tables IV and V may be summarized as follows:
. Top management plays an important role in ES implementation.Top-Management support, commitment, and vision were frequently mentionedas important for DWS.
. The evidence is strongly consistent with the view that three CSFs, namely BPRand software configuration, selection of ERP, and balanced team can help toachieve FF. In particular, 75 percent of the presenters said that “Selection ofERP” (treated in this study as “Selection of the software,” not just ERP) wascrucial for a successful implementation.
. The evidence also suggests strongly that three CSFs, namely changemanagement, training and job redesign, and communication plan, can help to
Percentage of 133 presentations containing evidencesupporting P1-P5
Propositions
Mentioned asa factor
(SoE ¼ 1)
Clearlyidentified(SoE ¼ 2)
Strongevidence(SoE ¼ 3)
Totalpercentage(SoE ¼ 1,
2, or 3)
P1a. The greater the level of top-managementsupport, the greater the level of FFachieved 8 4 1 13
P1b. The greater the level of topmanagement’s support, the greater thelevel of OOI achieved 4 3 2 9
P1c. The greater the level of top management’ssupport, the greater the level of DWSachieved 16 16 8 40
P2. The greater the level of BPR and softwareconfiguration, selection of ERP, andbalanced team, the greater the level of FFachieved 7 36 42 85
P3. The greater the level of changemanagement, Training and job redesign,communication plan, team morale andmotivation, and managing culturalchange, the greater the likelihood of OOI 22 20 11 53
P4. The better the project management, themore likely the project is to deliver aworking system (DWS) 5 27 37 69
P5. The better consultant selection and ITinfrastructure are managed, the morelikely the project is to deliverorganizational benefits 12 32 26 70
Table V.Summary of evidencesupporting the seven
propositions
How projectCSFs affect
OBES
735

achieve OOI. Based on the presentations, change management and training isvery important and a significant part of ERP implementations. The importanceof having a communication plan, team motivation, and managing culturalchange were also quite frequently mentioned.
. Three CSFs related to project management methodologies, skills and practices,namely, project management, implementation strategy and timeframe, andproject team: the best and brightest, appear to be very necessary for ESimplementation. In the 133 presentations, implementation strategies werefrequently mentioned and identified as preconditions of successfulimplementations. Strong project management and having a balanced teamwere also important for ES project success.
. The two “other” factors were also important drivers of organizational benefitsfrom ES. Consultant selection and relationship was mentioned in 50 percent ofpresentations as contributing to organizational benefits. IT infrastructure wasmentioned in 38 percent of the presentations as contributing to benefits.
6. DiscussionSeddon et al.’s (2007) OBES model was selected from models B-F in Figure 1 as asource of possible pathways for connecting the CSFs from Finney and Corbett (2007) toOBESU because, from a relatedness-of-concepts perspective, there appeared to be somereasonably clear mappings from many of F&C’s CSFs to factors in the OBES model.Empirically, Tables IV and V show that this intuition was well founded. They showthat support for P1c, P2-P5 was strong. However, surprisingly, support for P1a andP1b was weak. Since P1c-P5 encompass 87 percent of the CSFs identified by Finneyand Corbett, it therefore appears that ES researchers finally have a way of answeringRobey et al.’s (2002) challenge that the CSF studies “lack a theoretical framework thatadequately explains why the investigated project and business outcomes occur.”
Without further work, we are unable to explain why support for P1a and P1b solow. Why, for instance, was there so little evidence reported of TMS leading to betteroutcomes in terms of OOI when logic (see pathway (1) ! (2) ! (3)) says it should bevery important? One explanation is that TMS may be an important enabler ofthe factors in Groups 2-4 in Table II, which, in turn, as shown in Tables IV and V, affectthe three benefit drivers. For example, TMS might enable resources to be devoted tochange management, which in turn, would help the organization overcomeorganizational inertia. This is an interesting area to explore in future research.
6.1 Internal validityThere are both positive and negative sides to using Sapphire presentations as data fortesting the model in Figure 2. On the negative side:
. all these customer presentations were likely to have been invited by SAP becausethey had favorable outcomes;
. the speakers would have felt some pressure from SAP, and their role aspresenters of useful knowledge, to focus on the good outcomes of theirimplementations and to gloss over the problems their organizations hadexperienced as they implemented their systems; and
BPMJ15,5
736
. the presenters would have had a tendency to present themselves and their firmsin a good light[3].
This might mean that conclusions based on content analysis of the presentationsreveal little of value about the factors that really drive benefits from ES. On the positiveside:
. as is apparent from the examples in Figure 4, the Sapphire presentations are richin interesting information;
. they provide detailed first-hand accounts from senior managers of theirexperiences in a wide range of major corporations[4];
. the presenters knew they were talking to knowledgeable peers, which wouldhave tended to keep them from “stretching the truth” too far; and
. some of the comments in the presentations are quite frank about difficulties theirorganizations experienced.
After weighing up the pros and cons above, we have concluded that the evidence fromthe Sapphire Conference is useful for researching in the area of benefits from ES andbenefit drivers. The strongest grounds for this conclusion is that when Yang andSeddon (2003) analyzed 60 presentations from Sapphire 2003, their lists of benefits andCSFs were very similar to those reported by prior authors – Deloitte Consulting (1998)and Davenport et al. (2002) for benefits, and factors from the 45 studies summarized inFinney and Corbett (2007) for CSFs – yet those studies used a range of differentresearch methods. Since results from content analysis of those Sapphire presentationsproduced results so similar to those from prior researchers, it seems reasonable toconclude that the results from the analysis reported in this paper may also be trusted.
A second question one might ask in assessing internal validity is whether the modelin Figure 2 is a valid representation of cause and effect for the phenomena described inthe 130 presentations. Here, our conclusion is that as with any study, there could beother factors not explored in this study that are important drivers of organizationalbenefits from ES projects, and there may be relationships between the factors.However, because it was possible to explore causality at the individual-case level (seethe quotations and discussion of SoE judgments in Figure 4 for the basis for this claim),we believe that the relationships described by the model in Figure 2 are both importantand causal.
6.2 GeneralizabilityThe normal technique used by survey researchers for making inferences about theapplicability of their results beyond their sample is to estimate p-values based on thevariability of data within their sample. p-values of less than, say, 0.05, are said to be“significant”; the implication being that the chance of non-zero association betweenvariables in the population is low. The weakness with p-value logic is that it only testsassociation, not causality. Justification for causality claims based on p-value logictherefore has to come from the theory, not the data, as it does in this study.
In this study, since:. most of the organizations studied were very large and from a wide range of
industries; and
How projectCSFs affect
OBES
737

. causal arguments supporting the model in Figure 2 do not appear to beSAP-specific, nor peculiar to the organizations studied
the results reported here are likely to be applicable to other large organizations usingeither SAP or non-SAP enterprise-system software in western-style organizationsaround the world.
However, because the needs and resources of small organizations are so different,we are not so confident that the results above are applicable to small western-basedorganizations, nor to large or small organizations in countries such as China withhighly collectivistic decision process (Hofstede, 2001). Nonetheless, we would expectthe results and final model to be at least partially applicable in all organizations usingpackaged enterprise application software.
7. ConclusionThe purpose of the study was to try to answer Robey et al.’s (2002) challenge byoffering a theoretical explanation of how the CSFs reported in so many prior studiesaffect organizational benefits from ES in the years after go live. The approach adoptedwas to explore the possibility that the CSFs might affect benefits through their impacton the three key benefit drivers proposed by Seddon et al. (2007) in the project side oftheir OBES model. Building on this idea, this study treated the 26 CSF categoriesidentified in Finney and Corbett (2007) as a useful current summary and synthesis ofthe CSF literature, then proposed a model explaining how 16 of the most-frequentlycited 18 of those factors affected OBESU through the OBES benefit drivers. Our modelis shown in Figure 2. The four variables on the right are defined in Table I. Each of theCSFs and their groupings is defined in Table II. Detailed explanations of how thegroups of CSFs contribute to benefits are presented in Section 3.
As a preliminary test of the model in Figure 2, we content analyzed 133 customerpresentations at the Sapphire Conference held in Atlanta, Georgia, the USA, in April2007. As shown in Tables IV and V, the results provide considerable support for themodel. In particular, there was strong support for Propositions P1c, P2-P5. Support forP1a and P1b was much less strong. The contributions of this study are:
. the model of the mechanisms through which the project CSFs affectorganizational benefits from ES projects (Figure 2); and
. the empirical results reported in Tables IV and V which provide support for thatmodel.
Together, these two contributions are sufficient to provide:
(1) a much-needed preliminary answer to Robey et al.’s observation that the CSFstudies “offer few insights beyond conventional wisdom”;
(2) a way of organizing the 26 groups of CSFs identified by Finney and Corbett(2007) into much more workable bundles of factors than has been proposed inthe past; and
(3) two useful directions for future research, namely:. exploring causal pathways through models other than those in OBES; and. using different methods than those used in this study to assess the validity
of the model in Figure 2.
BPMJ15,5
738

Yet other areas for future study include:. explaining why there was so little evidence reported of TMS leading to better
outcomes in terms of FF and OOI when logic says it should be very important;. asking how the other eight CSFs from Finney and Corbett (2007) affect
organizational benefits from ES; and. asking more grounded-style questions about whether CSFs such as TMS affect
benefits via any other paths than through the OBES variables (FF, OOI, andDWS), e.g. through Liang et al.’s (2007) assimilation construct or throughinter-relationships between the various CSFs themselves.
Notes
1. The Sapphire Conferences are a series of annual conferences organized by SAP, the world’slargest vendor of ES, in various continents around the world. Sapphire Conferences providea vehicle for SAP to inform their customers of new product developments and for theircustomers to try out new software and exchange information about implementationexperiences and what they are doing with SAP software. At a typical three-day US SapphireConference, there are over 10,000 attendees, many paying some thousands of dollars each toattend.
2. Furthermore, though this was not what they hypothesized, Hong and Kim (2002) also foundstrong negative association between resistance and OBESU (r ¼ 0.48, p , 0.01).
3. Self-reporting bias is an issue in all single-informant studies, e.g. surveys, but is likely to bestronger at a Sapphire Conference than, say, in an anonymous survey, because respondentsand their firms are “on display” in a highly visible setting.
4. It is unlikely, for instance, that comparable high-quality information would have beenavailable from a survey-based study even if the same 140 þ senior managers had taken thetime to complete the survey form. (The term “140 þ ” is used because 13 of the sessionsinvolved presentations from more than one organization).
References
Abdinnour-Helm, S., Lengnick-Hall, M.L. and Lengnick-Hall, C.A. (2003), “Pre-implementationattitudes and organizational readiness for implementing an enterprise resource planningsystem”, European Journal of Operational Research, Vol. 146, pp. 258-73.
Aladwani, A.M. (2001), “Change management strategies for successful ERP implementation”,Business Process Management Journal, Vol. 7 No. 3, pp. 266-75.
Al-Mashari, M. and Zairi, M. (2000), “Supply-chain re-engineering using enterprise resourceplanning (ERP) systems: an analysis of a SAP R/3 implementation case”, InternationalJournal of Physical Distribution & Logistics Management, Vol. 30 Nos 3/4, pp. 296-313.
Al-Mudimigh, A., Zairi, M. and Al-Mashari, M. (2001), “ERP software implementation:an integrative framework”, European Journal of Operational Research, Vol. 10, p. 216.
AMR Research (2005), “AMR research reports Oracle-Peoplesoft merger could result in a$5.5 billion applications business”, available at: www.amrresearch.com/Content/View.asp?pmillid¼17938&docid¼12226 (accessed August 2007).
AMR Research (2007), “AMR research releases enterprise applications market sizing reportsWednesday”, available at: www.amrresearch.com/Content/View.asp?pmillid¼20564(accessed February 2008).
How projectCSFs affect
OBES
739
Bingi, P., Sharma, M.K. and Godla, J.K. (1999), “Critical issues affecting an ERP implementation”,Information Systems Management, Vol. 16 No. 3, pp. 7-8.
Brehm, L., Heinzl, A. and Markus, M.L. (2001), “Tailoring ERP systems: a spectrum of choicesand their implications”, Proceedings of the 34th Hawaii International Conference onSystems Sciences, Maui.
Carr, D.F. (2002), “Hershey’s sweet victory”, Baseline, pp. 68-73, available at: www.baselinemag.com/artical2/0,3959,760615,00.asp (accessed August 2007).
Davenport, T.H., Harris, J.G. and Cantrell, S. (2002), The Return of Enterprise Systems:The Director’s Cut, Accenture, Cambridge, MA.
Deloitte Consulting (1998), ERP’s Second Wave – Maximizing the Value of ERP-enabledProcesses, Deloitte Consulting, New York, NY.
Ewusi-Mensah, K. (1997), “Critical issues in abandoned information systems developmentprojects”, Communications of the ACM, Vol. 40 No. 9, pp. 74-80.
Finney, S. and Corbett, M. (2007), “ERP implementation: a compilation and analysis of criticalsuccess factors”, Business Process Management Journal, Vol. 13 No. 3, pp. 329-47.
Gattiker, T.F. and Goodhue, D.L. (2005), “What happens after ERP implementation?Understanding the impact of inter-dependence and differentiation on plant-leveloutcomes”, MIS Quarterly, Vol. 29 No. 3, pp. 559-85.
Harris, J.G. and Davenport, T.H. (2006), New Growth from Enterprise Systems: Achieving HighPerformance through Distinctive Capabilities, Accenture Institute for High PerformingBusiness, Addison-Wesley, Boston, MA.
Hofstede, G. (2001), Culture’s Consequences: Comparing Values, Behaviors, Institutions, andOrganizations across Nations, 2nd ed., Sage, London.
Holland, C.P. and Light, B. (1999), “A critical success factors model for ERP implementation”,IEEE Software, Vol. 16 No. 3, pp. 30-6.
Hong, K.K. and Kim, Y.G. (2002), “The critical success factors for ERP implementation:an organizational fit perspective”, Information & Management, Vol. 40 No. 1, pp. 25-40.
Jurison, J. (1999), “Software project management: the manager’s view”, Communications of theAIS, Vol. 2 No. 17, available at: http://cais.isworld.org./articles/2-17/
King, S.F. and Burgess, T.F. (2006), “Beyond critical success factors: a dynamic model ofenterprise system innovation”, International Journal of Information Management, Vol. 26No. 1, pp. 59-69.
Kraemmerand, P., Møller, C. and Boer, H. (2003), “ERP implementation: an integrated process ofradical change and continuous learning”, Production Planning & Control, Vol. 14 No. 4,pp. 338-48.
Leidner, D.E. and Kayworth, T. (2006), “Review: a review of culture in information systemsresearch: toward a theory of information technology culture conflict”, MIS Quarterly,Vol. 30 No. 2, pp. 357-99.
Liang, H., Saraf, N., Hu, Q. and Xue, Y. (2007), “Assimilation of enterprise systems: the effect ofinstitutional pressures and the mediating role of top management”, MIS Quarterly, Vol. 31No. 1, pp. 59-87.
Light, B. (2005), “Going beyond ‘misfit’ as a reason for ERP package customization”, Computersin Industry, Vol. 56 No. 6, pp. 606-19.
Luo, W. and Strong, D.M. (2005), “A framework for evaluating ERP implementation choices”,IEEE Transactions on Engineering Management, Vol. 51 No. 3, pp. 322-33.
BPMJ15,5
740

McAdam, R. and Galloway, A. (2005), “Enterprise resource planning and organisationalinnovation: a management perspective”, Industrial Management & Data Systems, Vol. 105No. 3, pp. 280-90.
Mandal, P. and Gunasekaran, A. (2003), “Issues in implementing ERP: a case study”, EuropeanJournal of Operational Research, Vol. 146 No. 2, pp. 274-83.
Markus, M.L. and Tanis, C. (2000), “The enterprise system experience – from adoption tosuccess”, in Zmud, R.W. (Ed.), Framing the Domains of IT Research: Glimpsing the Futurethrough the Past, Pinnaflex Educational Resources, Cincinnati, OH, pp. 173-207.
Motwani, J., Mirchandani, D., Madan, M. and Gunasekaran, A. (2002), “Successfulimplementation of ERP projects: evidence from two case studies”, International Journalof Production Economics, Vol. 75 Nos 1/2, pp. 83-96.
Nah, F.F., Lau, J.L. and Kuang, J. (2001), “Critical factors for successful implementation ofenterprise systems”, Business Process Management Journal, Vol. 7 No. 3, pp. 285-96.
Nelson, R.R. (2007), “IT project management: infamous failures, classic mistakes, and bestpractices”, MIS Quarterly Executive, Vol. 6 No. 2, pp. 67-78.
Parr, A. and Shanks, G. (2000), “A model of ERP project implementation”, Journal of InformationTechnology, Vol. 15 No. 4, pp. 289-303.
Purvis, R., Sambamurthy, V. and Zmud, R.V. (2001), “The assimilation of knowledge platforms inorganizations: an empirical investigation”, Organization Science, Vol. 12 No. 2, pp. 117-35.
Ribbers, P.M.A. and Schoo, K.-C. (2002), “Program management and complexity of ERPimplementations”, Engineering Management Journal, Vol. 14, p. 45.
Robey, D., Ross, J.W. and Boudreau, M.-C. (2002), “Learning to implement enterprise systems:an exploratory study of the dialectics of change”, Journal of MIS, Vol. 19 No. 1, pp. 17-46.
Sarker, S. and Lee, A.S. (2003), “Using a case study to test the role of three key social enablers inERP implementation”, Information & Management, Vol. 40 No. 8, pp. 813-29.
Schmidt, R., Lyytinen, K., Keil, M. and Cule, P. (2001), “Identifying software project risks:an international Delphi study”, Journal of Management Information Systems, Vol. 17 No. 4,pp. 5-36.
Schwalbe, K. (2006), Information Technology Project Management, 4th ed., Course Technology,Boston, MA.
Scott, J.E. (1999), “The Foxmeyer Drugs bankruptcy: was it a failure of ERP?”, Proceedings of theAmericas Conference on Information Systems.
Scott, J.E. and Vessey, I. (2000), “Managing risks in enterprise systems implementations”,Communications of the ACM, Vol. 45 No. 4, pp. 74-81.
Seddon, P.B., Calvert, C. and Yang, S. (2007), “Key factors affecting organizational benefits fromenterprise systems”, working paper, Department of Information Systems, The Universityof Melbourne, Melbourne.
Soffer, P., Golany, B. and Dori, D. (2003), “ERP modeling: a comprehensive approach”,Information Systems, Vol. 28 No. 6, pp. 673-90.
Soh, C. and Sia, S.K. (2004), “An institutional perspective on sources of ERPpackage-organisation misalignments”, Journal of Strategic Information Systems, Vol. 13No. 4, pp. 375-97.
Soh, C. and Sia, S.K. (2005), “The challenges of implementing ‘vanilla’ versions of enterprisesystems”, MISQ Executive, Vol. 4 No. 3, pp. 373-84.
How projectCSFs affect
OBES
741

Soh, C., Sia, S.K., Boh, W.F. and Tang, M. (2003), “Misalignments in ERP implementation:a dialectic perspective”, International Journal of Human-computer Interaction, Vol. 16No. 1, pp. 81-100.
Somers, T.M. and Nelson, K.G. (2001), “The impact of critical success factors across the stages ofenterprise resource planning implementations”, Proceedings of the 34th HawaiiInternational Conference on System Sciences, Maui.
Somers, T.M. and Nelson, K.G. (2003), “The impact of strategy and integration mechanisms onenterprise system value: empirical evidence from manufacturing firms”, European Journalof Operational Research, Vol. 146 No. 2, pp. 315-38.
Somers, T.M. and Nelson, K.G. (2004), “A taxonomy of players and activities across the ERPproject life cycle”, Information & Management, Vol. 41 No. 3, pp. 257-78.
Staehr, L., Shanks, G. and Seddon, P.B. (2006), “Understanding the business consequences ofERP use”, Proceedings of the 14th European Conference on Information Systems,Goteborg.
Standish Group International (1999), Chaos: A Recipe for Success, The Standish GroupInternational, Boston, MA, available at: http://standishgroup.com/sample_research/PDFpages/chaos1999.pdf (accessed June 2006).
Standish Group International (2001), Extreme Chaos, The Standish Group International, Boston,MA, available at: www.standishgroup.com/sample_research/PDFpages/extreme_chaos.pdf (accessed June 2006).
Sumner, M. (2000), “Risk factors in enterprise-wide/ERP projects”, Journal of InformationTechnology, Vol. 15 No. 4, pp. 317-27.
Sun, A.Y.T., Yazdania, A. and Overend, J.D. (2005), “Achievement assessment for enterpriseresource planning (ERP) system implementations based on critical success factors (CSFs)”,International Journal of Production Economics, Vol. 98 No. 2, pp. 189-203.
Umble, E.J., Haft, R.R. and Umble, M.M. (2003), “Enterprise resource planning: implementationprocedures and critical success factors”, European Journal of Operational Research,Vol. 146 No. 2, pp. 241-57.
Yang, S. and Seddon, P.B. (2003), “Benefits and key project success factors from enterprisesystems implementations: lessons from Sapphire 2003”, paper presented at theAustraliasian Conference on Information Systems, Hobart.
Yusuf, Y., Gunasekaran, A. and Abthorpe, M.S. (2004), “Enterprise information systems projectimplementation: a case study of ERP in Rolls-Royce”, International Journal of ProductionEconomics, Vol. 87, pp. 251-66.
Further reading
Abdinnour-Helm, S., Lengnick-Hall, M.L. and Lengnick-Hall, C.A. (2003), “Pre-implementationattitudes and organizational readiness for implementing an enterprise resource planningsystem”, European Journal of Operational Research, Vol. 146, pp. 258-73.
Al-Mashari, M., Al-Mudimigh, A. and Zairi, M. (2003), “Enterprise resource planning: a taxonomyof critical factors”, European Journal of Operational Research, Vol. 146 No. 2, pp. 352-64.
Brown, C.V. and Vessey, I. (2001), “NIBCO’S ‘BIG BANG’”, Communications of the AIS, Vol. 5.
Dalal, N.P., Kamath, M., Kolarik, W.J. and Sivaraman, E. (2004), “Toward an integratedframework for modeling enterprise processes”, Communications of the ACM, Vol. 47 No. 3,pp. 83-7.
BPMJ15,5
742

Jacobs, F.R. and Bendoly, E. (2003), “Enterprise resource planning: developments and directionsfor operations management research”, European Journal of Operational Research, Vol. 146No. 2, pp. 233-40.
Mabert, V.A., Soni, A. and Venkataramanan, M.A. (2003), “Enterprise resource planning:managing the implementation process”, European Journal of Operational Research,Vol. 146 No. 2, pp. 302-14.
Palaniswamy, R. and Frank, T. (2000), “Enhancing manufacturing performance with ERPsystems”, Information Systems Management, Vol. 17 No. 3, pp. 1-13.
Sharif, A.M., Irani, Z. and Love, P.E.D. (2005), “Integrating ERP using EAI: a model for post hocevaluation”, European Journal of Information Systems, Vol. 14 No. 2, pp. 162-74.
Soh, C., Kien, S.S. and Tay-Yap, J. (2000), “Enterprise resource planning: cultural fits and misfits:is ERP a universal solution?”, Communications of the ACM, Vol. 43 No. 4, pp. 47-51.
Willis, T.H. and Willis-Brown, A.H. (2002), “Extending the value of ERP”, IndustrialManagement & Data Systems, Vol. 102 No. 1, pp. 35-8.
Yin, R.K. (2003), Case Study Research: Design and Methods, 3rd ed., Sage, London.
Corresponding authorPeter B. Seddon can be contacted at: [email protected]
How projectCSFs affect
OBES
743
To purchase reprints of this article please e-mail: [email protected] visit our web site for further details: www.emeraldinsight.com/reprints