
Understanding hospital electricity use: an end-use(r) perspective
330
Understanding hospital electricity use: an end-use(r) perspective Paula Morgenstern UCL Energy Institute The Bartlett School of Environment, Energy and Resources University College London A Thesis Submitted for the Degree of Doctor of Philosophy University College London University of London 2016
-
Upload
khangminh22 -
Category
Documents
-
view
0 -
download
0
Transcript of Understanding hospital electricity use: an end-use(r) perspective
Understanding hospital electricity use:an end-use(r) perspective
Paula Morgenstern
UCL Energy Institute
The Bartlett School of Environment, Energy and ResourcesUniversity College London
A Thesis Submitted for the Degree of
Doctor of Philosophy
University College London
University of London
2016


Abstract
Increasing energy costs and climate change legislation have prompted efforts to re-
duce energy consumption in hospitals. In addition to technological conservation
strategies focusing on building and systems, staff-centred initiatives such as energy
awareness campaigns are increasingly considered by NHS trusts. But hospitals are
complex buildings with unique energy requirements and it is unclear to what extent
these are influenced by clinical staff. This case study investigation, employing both
technical and social methods of inquiry, hence aims to improve the understanding of
hospital electricity use from an end-use perspective and to determine the relevance
of behaviour and other simple operational changes as strategies to save energy in
different hospital areas.
The study findings highlight the importance of a robust understanding of oper-
ational characteristics and contextual variables in devising tailored organisational
carbon management strategies. A three-tiered process is proposed to identify spaces
where simple operational changes could reduce energy demand: it is recommended
to, firstly, undertake an engineering analysis of the energy end-uses in the spaces in
question, identifying significant loads at a local level. Floor area weighted operating
hours and shares of installed loads under (clinical) staff control may then be helpful
metrics to approximate the extent to which these loads are influenced by the actions
of occupants. Finally, socio-technical constraints on departmental workings should
be considered taking into account at least aspects around the shared use of spaces
between teams, the available local knowledge on the control of building services and
equipment, the morale within the organisation as well as the suitability of the work-
ing means.
The need to move away from top-down imposed models of change is recognised,
instead taking a user-perspective to understand what may constitute a reasonably
achievable transformation in the ways things are done. This does also mean that
standards and requirements are not beyond questioning, even in sensitive environ-
ments such as hospitals. Instead, collaborative efforts between energy managers
and interested clinicians as well as health administrators and equipment technicians
could help to demystify clinical processes and achieve a sound understanding of op-
portunities to reduce the energy use of the health service.
i
Student Declaration
I, Paula Morgenstern confirm that the work presented in this thesis is my own.
Where information has been derived from other sources, I confirm that this has
been indicated in the thesis.
ii

Acknowledgements
I would like to thank my supervisors Professor Paul Ruyssevelt and Dr Rokia Raslan
for their invaluable guidance and feedback, without which this thesis would not have
been possible. In addition, Dr Lai Fong Chiu has been a great mentor who has al-
ways had an open ear and some encouraging words.
My sincere thanks also go to a number of other colleagues at the UCL Energy
Institute, prominently Professor Robert Lowe for his input as supervisor during the
first year of this PhD and to Dr Gesche Huebener during interim periods.
A large part of this research was undertaken within NHS organisations and I am
immensely grateful to the participating trusts, Barts Health NHS Trust and King’s
College Hospital NHS Foundation Trust and in particular to Fiona Daly and Cathal
Griffin for providing access to the case study sites. Mike Gentry, Bex McIntosh and
Lee Comerford at Global Action Plan have further been great company for my first
steps into the hospital environment. I would also in particular like to acknowledge
the valuable contribution of all hospital staff, whose generosity in offering their time
despite busy work schedules will not be forgotten.
The research was made possible by EPSRC support to the Centre for Doctoral
Training in Energy Demand (LoLo), grants EP/L01517X/1 and EP/H009612/1. I
would also like to extend my thanks to all members of LoLo, both at UCL and at
Loughborough University. Having an insight into the ways and workings of both
institutions has provided me with a richer view on the academic world, as well as
with many enjoyable moments. Thanks also to Jess, Jana and Marlene for many
insightful discussions on medical topics.
Finally, I would like to thank my partner Jasper and my family. Their encourage-
ment, support and patience have been invaluable over the last years.
iii
Contents
List of Figures vii
List of Tables ix
Glossary xi
1 Introduction 1
1.1 Rationale for the study . . . . . . . . . . . . . . . . . . . . . . . . . . 1
1.2 Research question, aims and objectives . . . . . . . . . . . . . . . . . 9
1.3 Thesis structure and chapter layout . . . . . . . . . . . . . . . . . . . 11
2 Literature review: Occupant influence on non-domestic energy use 15
2.1 Disciplinary views on people in the context of building energy use . 17
2.2 Individualist studies of occupant influence on non-domestic building
energy use . . . . . . . . . . . . . . . . . . . . . . . . . . . . . . . . . 22
2.3 Saving energy at work as social practice . . . . . . . . . . . . . . . . 41
2.4 Summary of evidence from the literature . . . . . . . . . . . . . . . . 49
3 Study Methodology 57
3.1 Research aim and objectives . . . . . . . . . . . . . . . . . . . . . . . 58
3.2 Commitment to pragmatism . . . . . . . . . . . . . . . . . . . . . . . 59
3.3 Research design: Multiple case studies . . . . . . . . . . . . . . . . . 61
3.4 Research methods: A mixed-methods approach . . . . . . . . . . . . 65
3.5 Data analysis . . . . . . . . . . . . . . . . . . . . . . . . . . . . . . . 81
3.6 Summary of the study methodology . . . . . . . . . . . . . . . . . . 86
4 Analysis context: Arrangements of different hospital departments 89
4.1 Overview of analysed departments . . . . . . . . . . . . . . . . . . . 90
4.2 Diagnosis: X-ray Imaging . . . . . . . . . . . . . . . . . . . . . . . . 91
iv
4.3 Diagnosis: Clinical pathology laboratories . . . . . . . . . . . . . . . 96
4.4 Treatment: Surgery in operating theatres . . . . . . . . . . . . . . . 101
4.5 Treatment: Day Units . . . . . . . . . . . . . . . . . . . . . . . . . . 107
4.6 Care: Inpatient accommodation on wards . . . . . . . . . . . . . . . 112
4.7 Summary of logistical and spatial arrangements . . . . . . . . . . . . 117
5 Quantitative findings: Influence of clinical staff on hospital electri-
city use 121
5.1 Drivers of centralised and local electricity requirements . . . . . . . . 122
5.2 Clinical staff influence on central electricity requirements . . . . . . . 124
5.3 Clinical staff influence on local electricity requirements . . . . . . . . 127
5.4 Theoretical electricity savings potentials . . . . . . . . . . . . . . . . 138
5.5 Summary of quantitative findings . . . . . . . . . . . . . . . . . . . . 142
6 Qualitative findings: Socio-technical constraints on end-use energy
savings 145
6.1 Embodied habits around energy saving . . . . . . . . . . . . . . . . . 146
6.2 Knowledge constraints on end-use energy savings in hospitals . . . . 151
6.3 Meanings associated with hospital energy usage . . . . . . . . . . . . 161
6.4 Technological constraints affecting energy end-use . . . . . . . . . . . 169
6.5 Summary of qualitative findings . . . . . . . . . . . . . . . . . . . . . 180
7 Discussion: End-use energy savings in real-world settings 183
7.1 Assessing the relevance of simple operational changes to save energy 184
7.2 Strategic suggestions for end-use energy savings in the hospital context190
7.3 The black-boxing of (clinical) processes . . . . . . . . . . . . . . . . 194
7.4 A real-world energy savings potential . . . . . . . . . . . . . . . . . . 199
7.5 Summary of the discussion . . . . . . . . . . . . . . . . . . . . . . . . 202
8 Conclusion and implications 205
8.1 Key findings in relation to the research question . . . . . . . . . . . 206
8.2 Limitations of the study . . . . . . . . . . . . . . . . . . . . . . . . . 209
8.3 Implications of this thesis for different stakeholders . . . . . . . . . . 215
8.4 Future work . . . . . . . . . . . . . . . . . . . . . . . . . . . . . . . . 221
8.5 Outputs associated with this research . . . . . . . . . . . . . . . . . 223
Bibliography 227
Appendices 252
v
A Hospital energy use 253
A.1 Evidence on hospital energy performance: Measured consumption
levels as well as best-practice targets at building level . . . . . . . . 253
A.2 Evidence on the relevance of different energy end-uses in hospitals . 256
A.3 A graphic overview of UK guidance documents on energy efficiency
in hospitals . . . . . . . . . . . . . . . . . . . . . . . . . . . . . . . . 258
B Supporting evidence from the literature 259
B.1 Empirical social practices studies of non-domestic building energy use 259
B.2 Strategies to ensure quality in case study research . . . . . . . . . . 261
C Data collection instruments 265
C.1 Lighting and appliance audit . . . . . . . . . . . . . . . . . . . . . . 265
C.2 Interview guide . . . . . . . . . . . . . . . . . . . . . . . . . . . . . . 267
C.3 Informed consent form . . . . . . . . . . . . . . . . . . . . . . . . . . 272
D Data analysis process 277
D.1 List of lighting and equipment items . . . . . . . . . . . . . . . . . . 278
D.2 Cross-tabulation of interview information as model input . . . . . . 302
D.3 Example of an interview transcript . . . . . . . . . . . . . . . . . . . 309
D.4 Excerpt from the analytical research notes . . . . . . . . . . . . . . . 310
E Quantitative findings 311
E.1 Details for departmental savings potentials . . . . . . . . . . . . . . . 311
vi

List of Figures
1.1 Historical development of energy use in English general acute hospit-
als (Graph created by author on the basis of publicly available ERIC data) . . . . . 3
1.2 Relevance of different energy end-uses in hospitals . . . . . . . . . . 7
1.3 Overview of thesis structure . . . . . . . . . . . . . . . . . . . . . . . 14
2.1 Structural overview of the literature review chapter . . . . . . . . . . 16
2.2 Methodologies to quantify occupant influence on building energy use 37
2.3 Evaluatory challenges for energy behaviour change interventions . . 39
2.4 Conceptual framework of conceivable operational changes . . . . . . 51
3.1 Embedded multiple case study research design . . . . . . . . . . . . 62
3.2 Equipment typology for audit and bottom-up model . . . . . . . . . 71
3.3 Process for determining equipment in use durations . . . . . . . . . . 72
4.1 Weekend electricity consumption profile of RLH Inpatient X-ray . . 92
4.2 Weekday electricity consumption profile of NUH X-ray facilities . . . 93
4.3 Set-up and use of space of X-ray facilities . . . . . . . . . . . . . . . 94
4.4 Comparative electricity consumption profiles for laboratories . . . . 97
4.5 Workflow and spatial arrangements of laboratories . . . . . . . . . . 99
4.6 Weekday theatre electricity consumption profiles . . . . . . . . . . . 103
4.7 Weekday electricity consumption profile of RLH Day Theatres . . . 104
4.8 Room layout for a typical operating theatre suite . . . . . . . . . . . 105
4.9 RLH Day Unit weekday electricity consumption profile . . . . . . . . 109
4.10 KCH day unit weekday electricity consumption profile . . . . . . . . 110
4.11 Electricity consumption profile of KCH general surgical ward . . . . 114
4.12 Electricity consumption profile of NUH general surgical ward . . . . 115
4.13 Overview of use of space in all investigated departments . . . . . . . 119
5.1 Measured electricity consumptions in relation to benchmarks . . . . 128
vii
5.2 Overview of local departmental electricity consumption . . . . . . . 135
5.3 Installed load (modelled) under clinical staff control . . . . . . . . . 136
5.4 Theoretical energy savings potentials in different departments . . . . 140
5.5 Influence of operating hours on theoretical savings potentials . . . . 141
5.6 Influence of clinical staff control on theoretical savings potentials . . 142
6.1 Interviewee attitudes towards being green depending on qualification 158
6.2 Cross case comparison of reported thermal comfort levels . . . . . . 170
6.3 Temperature profile of the NUH Ward treatment room . . . . . . . . 173
6.4 Perceived lighting control subject to lighting control infrastructure . 177
7.1 Sankey diagram illustrating proposed assessment framework . . . . . 185
7.2 A real-world energy savings potential . . . . . . . . . . . . . . . . . . 201
A.1 Measured hospital energy performance and best-practice targets . . 253
A.2 Studies specifying energy end-uses in hospitals . . . . . . . . . . . . 257
A.3 Mind map of available NHS guidance documents on sustainability . 258
C.1 Example of data entry during audits . . . . . . . . . . . . . . . . . . 266
C.2 Scales shown to interviewees . . . . . . . . . . . . . . . . . . . . . . . 269
C.3 Informed consent: a) Interview Information Sheet . . . . . . . . . . . 275
C.4 Informed consent: b) Interview Consent Form . . . . . . . . . . . . . 276
D.1 Example of interview transcript . . . . . . . . . . . . . . . . . . . . . 309
D.2 Excerpt from research notes kept during qualitative analysis . . . . . 310
viii
List of Tables
1.1 Overview of hospital energy performance figures and targets . . . . . 6
2.1 List of generic low energy workplace behaviours . . . . . . . . . . . . 18
2.2 Social science perspectives on energy consumption . . . . . . . . . . 19
2.3 Energy behaviour change initiatives in organisations . . . . . . . . . 25
2.4 Social practice theory elements for empirical analysis . . . . . . . . . 44
2.5 Empirical social practice based studies of energy demand in buildings 46
2.6 Reported energy savings from clinical staff engagement in hospitals . 53
3.1 Brief overview of major paradigms . . . . . . . . . . . . . . . . . . . 60
3.2 Key characteristics of case study hospitals . . . . . . . . . . . . . . . 64
3.3 Overview of study data collection methods . . . . . . . . . . . . . . . 66
3.4 Case study departments and employed data collection methods . . . 68
3.5 Specifications of measurement equipment . . . . . . . . . . . . . . . 69
3.6 Lighting power consumption audit codes . . . . . . . . . . . . . . . . 73
3.7 Equipment power consumption audit codes . . . . . . . . . . . . . . 74
3.8 Formal characteristics of interviewees . . . . . . . . . . . . . . . . . . 77
3.9 Topic guide for semi-structured interviews . . . . . . . . . . . . . . . 79
4.1 Overview of core characteristics of investigated departments . . . . . 90
4.2 Inventory of major automated analysers in pathology laboratories . . 100
4.3 Mealtimes at investigated wards . . . . . . . . . . . . . . . . . . . . 114
4.4 Comparison of spatial characteristics of investigated wards . . . . . . 117
5.1 Locally versus centrally provided main building services . . . . . . . 122
5.2 Measured power characteristics for all case departments . . . . . . . 128
5.3 Definition of variables for model validity criteria . . . . . . . . . . . 130
5.4 Validity of departmental electricity use bottom-up models . . . . . . 132
ix
6.1 Levels of knowledge required for low energy operations . . . . . . . . 152
6.2 NHS job roles and likely knowledge on controlling building services . 155
6.3 Cross case comparison of primary ventilation and space cooling strategies172
6.4 Lighting levels in theatres . . . . . . . . . . . . . . . . . . . . . . . . 176
7.1 Cross tabulation of department types with high energy saving potentials189
7.2 Possible strategies to promote staff engagement with energy issues . 191
8.2 Impact of and mitigation strategies for major study limitations . . . 211
C.1 Site visit codes describing building systems and controls . . . . . . . 266
D.1 List of lighting and equipment items . . . . . . . . . . . . . . . . . . 301
D.2 Example from the RLH Day Clinic for the cross-tabulation of inter-
view information as basis for quantitative modelling . . . . . . . . . 308
E.1 Details for departmental savings potentials . . . . . . . . . . . . . . 314
x

Glossary
This glossary clarifies some of the vocabulary used in this thesis. There is ambiguity
about many terms used within built environment research; it is hence not suggested
that the following definitions are exclusive. Rather, the glossary serves to state how
certain terms are understood within this thesis.
Building occupants
Administrative staff Administrative staff provide essential support to doctors,
scientists, nurses and other health care professionals in a
wide range of functions such as health records staff, clerks or
receptionists. Their activities will be essentially computer-
based and rely heavily on typing and word processing skills.
Building operators This refers to the estates team of a hospital. The team
will include amongst others plumbers, electricians, engin-
eers and estates managers. Importantly, the estates team is
concerned with the cost-effective running of hospital estates
and energy issues are therefore part of their job responsibil-
ities.
Building users In hospitals, building users will include at least clin-
ical staff, administrative staff, domestic staff as well
as other non-clinical support staff and patients (see
http://www.nhscareers.nhs.uk/explore-by-career/ for a
comprehensive overview of job roles within the NHS, many
of them based in hospital buildings). For building users,
energy issues will be secondary to their core activities.
xi
Clinical staff A broad category encompassing all medical staff working on
the hospital premises. This also includes scientists in labor-
atories as well as dentists, if applicable. Clinical support
workers for example in theatres are also included in this
category as their activity remit can extend beyond simple
support tasks such as cleaning to clinical activities, such as
the handling and checking of medical equipment.
Domestic staff Domestic staff within hospitals commonly work within one
of three key areas: catering, cleaning or laundry services.
Non-clinical
support staff
This groups includes all other professionals responsible for
the non-clinical running of a hospital. This includes for ex-
ample security or health and safety officers.
Locums Locums are health care staff in any job role, who are em-
ployed through agencies to temporarily fulfil the duties of
others to cover staff shortages within the NHS.
Buildings and systems
Nightingale Construction type for hospitals typical in the UK in the
late 19th and early 20th century. Wards were designed as
open-plan dormitories for 24 to 30 patients in north/south
pavilions, with separate sanitary towers to one side and court
yards between them. Day light and fresh air were important
concerns, high ceilings and large windows were consequently
common (see also Lomas et al., 2012).
xii
Nucleus During the mid 1970s, it was aimed to build standardised
low cost hospitals offering a ‘nucleus’ of services, with the
option to expand the hospital when capital was available
by adding additional blocks. The standard element was a
cruciform block plan of about 1000 m2 connected to other
blocks through a central corridor (the hospital street). ‘More
than 130 standard Nucleus schemes have been built in the
UK’ (Francis et al., 1999, p.37), accounting for roughly 10%
of the stock.
Split unit Split systems are decentralised (duct-less) systems able to
provide heating and cooling to single or few adjacent spaces
(mini-split or multi-split systems). They are composed of
an outdoor and up to five indoor units. The outdoor unit
holds the compressor, while the indoor unit contains the
expansion valve and a blower to deliver chilled air into the
space. Modern day split units often also provide heating
through electric resistance heating.
Evaluation
Ex-ante Ex-ante evaluations (appraisals) attempt to forecast inten-
ded energy savings of future projects before an investment
decision is made.
Ex-post Ex-post evaluations are conducted either on or after comple-
tion of an intervention to determine whether the intended
objectives could be achieved.
Simple behavi-
oural changes
Changes in the way a building is used by the occupants that
are easy to implement and require no extensive infrastruc-
tural rearrangements.
xiii

Real-world savings
potential
An ex-ante potential based on the extent to which a techno-
logy may deliver energy savings in-situ or the understanding
of building users as to what constitutes a reasonably achiev-
able change in the ways things are done. As opposed to a
theoretical savings potential, the real-world savings poten-
tial recognises the constraints applicable in real-world socio-
technical systems.
Theoretical
energy savings
potential
A calculated potential representing some form of ideal inter-
vention and disregarding all practical considerations which
may affect implementation. The theoretical potential is
context-dependent, but unconstrained except through infra-
structural arrangements.
xiv

1 Introduction
This chapter briefly sets the scene and presents relevant background information
against which this study positions itself. The main research question is defined and
aims and objectives are laid out. The research methodology and the main structure
of the thesis are briefly outlined to provide the reader with guidance for subsequent
reading.
1.1 Rationale for the study . . . . . . . . . . . . . . . . . . . . . . . . . . 1
1.2 Research question, aims and objectives . . . . . . . . . . . . . . . . . 9
1.3 Thesis structure and chapter layout . . . . . . . . . . . . . . . . . . . 11
1.1 Rationale for the study
1.1.1 Research context: Reducing carbon emissions in health care
In the UK, hospitals are operated by the tax-funded National Health Service (NHS).
The carbon footprint of the NHS and associated authorities amounts to about 32
million tonnes of CO2 equivalent per year and accounts for 40% of all public sector
emissions in England (NHS SDU, 2014). In line with the UK Climate Change Act
2008, the NHS commits to reducing its total emissions by 28% by 2020 against the
2013 level and in the long term by 80% until 20501 (ibid).
1 In 2015, the interim target of a 10% reduction from 2007 was exceeded by the health serviceand reductions of 11% could be achieved despite an 18% increase in health care system activity(NHS SDU, 2016).
1 Introduction
Energy use in buildings accounts for 15% of NHS carbon emissions, while 72%
are from the procurement of pharmaceuticals, medical devices and gases and the
remaining 13% from travel as well as the transport of patients and goods (NHS
SDU, 2014). Emissions from NHS buildings therefore generate 4 to 5 Mt of carbon
equivalent (NHS SDU, 2014; Godoy-Shimizu et al., 2011), compared to 77 Mt from
UK residential buildings (DECC 2014). Reducing building energy use is neverthe-
less important for the NHS in view of rising energy costs2, the need to ensure a
secure and resilient energy supply in health critical environments (ibid) as well as
increasing energy demands across the world (Sumner, 2010).
It is also increasingly recognised that health and climate change are linked. The
2015 Lancet commission on health and climate change finds that tackling climate
change could be ‘the biggest global health opportunity of the 21st century’ (Watts
et al., 2015), while the NHS Sustainable Development Unit (SDU) proclaims with
view to climate change that ‘(o)ur business is health and we have a moral duty to
act on health threats and to manage future demand on the health service’ (NHS
SDU, 2015, p.1).
Strategies to reduce the carbon footprint of the health service are numerous: while
general practitioners may best contribute through preventing the need for resource
intensive treatments, acute hospitals were recognised to have significant potential
to reduce building energy consumption by cutting unnecessary energy services and
increasing energy efficiency (NHS SDU, 2014).
Acute hospitals are complex buildings with unique energy requirements that ex-
ceed those of many other non-domestic building types (Ziebik and Hoinka, 2013):
They are occupied 24/7 by a large number of people, many of whom are vulner-
able. Medical requirements necessitate strict control of the thermal environment
and of indoor air parameters, especially in operating theatres and treatment rooms.
Specialist medical equipment, sterilization, laundries and food preparation further
increase electricity use (EnCO2de, 2006; EPA, 2012).
2 The NHS’ annual energy expenditure now exceeds £630 million (NHS SDU, 2013). Rising energyprices, growth in technology and increased service delivery have all contributed to this triplingin energy costs from £232 million in 2000 within little more than a decade.
2
1 Introduction
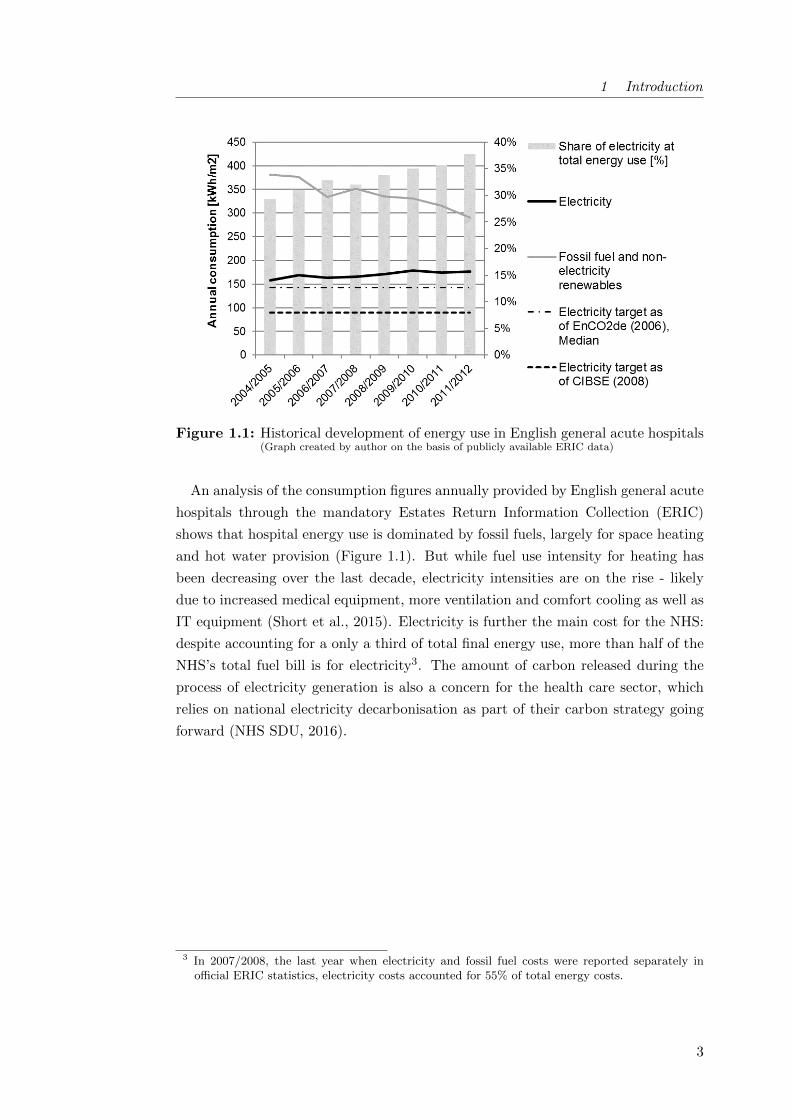
Figure 1.1: Historical development of energy use in English general acute hospitals(Graph created by author on the basis of publicly available ERIC data)
An analysis of the consumption figures annually provided by English general acute
hospitals through the mandatory Estates Return Information Collection (ERIC)
shows that hospital energy use is dominated by fossil fuels, largely for space heating
and hot water provision (Figure 1.1). But while fuel use intensity for heating has
been decreasing over the last decade, electricity intensities are on the rise - likely
due to increased medical equipment, more ventilation and comfort cooling as well as
IT equipment (Short et al., 2015). Electricity is further the main cost for the NHS:
despite accounting for a only a third of total final energy use, more than half of the
NHS’s total fuel bill is for electricity3. The amount of carbon released during the
process of electricity generation is also a concern for the health care sector, which
relies on national electricity decarbonisation as part of their carbon strategy going
forward (NHS SDU, 2016).
3 In 2007/2008, the last year when electricity and fossil fuel costs were reported separately inofficial ERIC statistics, electricity costs accounted for 55% of total energy costs.
3
1 Introduction
1.1.2 State of knowledge: Energy demand in hospital buildings
Academic research regarding the energy use of existing hospital buildings is sparse,
even within the comparatively under-researched field of non-domestic buildings while
much knowlegde on health care engineering resides outside academia. Operational
and facilities management in hospitals has been studied in order to reduce opera-
tional costs (Diez and Lennerts, 2010; Jones, 2001; McGuire, 1987). Other studies
have focused on the monitoring of air quality issues and indoor temperatures in their
crucial role for patient well-being and staff performance; overall (Li et al., 2015) or
in certain hospital building types (e.g. Short et al., 2012; Lomas and Ji, 2009) or
parts (e.g. Balaras et al., 2007). Further, the drivers of hospital energy use have
been debated and are briefly summarized subsequently.
It is well established that floor area and built form4 drive hospital energy use
(Fifield, 2012; Witt, 2013). Regression analysis carried out for the certification
scheme Energy Star in the US and Canada also suggested that number of beds,
worker density, number of MRI machines (EPA, 2014b) or the presence of laundry
facilities (EPA, 2014a) may be predictors of hospital energy use, but some ambiguity
remains here due to methodological criticism (Scofield, 2014). Burpee et al. (2014)
further argue that the energy use of MRI machines has long been overrated and does
on the whole not account for more than 1% of total hospital energy use.
Within hospitals (as in other building types), it was found that seasonal vari-
ations in outdoor temperature decisively influence heating and cooling demands.
But doubts remain as to how clinical activity relates to total hospital energy use:
• Takakusagi and Yoshino (2011) and Moghimi et al. (2013) identify differences
in daily electricity consumption between weekday and holidays in large hospit-
als in China and Malaysia respectively, suggesting clinical activity is influential.
In a study of two US hospitals, Rabanimotlagh et al. (2016) further identify
the number of radiological imaging series performed to be a driver of electricity
use. In a large UK consultancy project, Bacon (2015) also argues that clinical
activity decisively determines space use and therefore the design of health care
facilities with important (albeit more indirect) implications for energy use.
4 Nightingale designs tended to be more energy efficient as opposed to nucleus, tower or courtyardbuildings from a top-down perspective, while differences in service delivery and service qualitywere not analysed (Witt, 2013).
4
1 Introduction
• Rabanimotlagh et al. (2016) do however find no significant influence of the
number of inpatients, outpatients or patients seen in the emergency depart-
ment on monthly electricity or gas usage. Their study hence concludes that
the analysis of daily measures of energy consumption tied to daily measures
of activity are needed to clarify the relation, while the outcome may alternat-
ively indicate ‘that nothing is ever turned off in hospitals (p.14)’ regardless of
service demand.
Whole building energy performance figures are also increasingly becoming avail-
able as best practice guidance for the sector and/or as basis for mandatory disclosure
schemes such as the British display energy certificates (DECs). In the UK, there
are at least three recent systems of benchmarking that cover NHS properties as a
whole (Table 1.1, middle) alongside with a national energy target for NHS Trusts
(HM Government, 2006). Internationally, published consumption figures and en-
ergy performance targets for hospitals (see Appendix A.1 for details) are on the
whole not dissimilar while in particular Germany specifies more ambitious stand-
ards (Table 1.1, bottom: based on actual consumption data reported in a survey
among 248 hospitals of various sizes). All of the values, however, highlight the en-
ergy intensity of hospitals compared to other non-domestic building types such as
offices or schools (Godoy-Shimizu et al., 2011).
Little evidence is currently available on hospital energy use at a sub-building level.
Some studies have focused on energy intensive areas such as operating theatres (Bal-
aras et al., 2007; Beier, 2009) and an engineering doctorate at an architecture faculty
in Germany has analysed interrelations between hospital design and energy demand
of different space types (Holeck, 2007). Sub-building level electricity data is also
becoming available through research on energy intensive equipment (Jensen and
Petersen, 2011; Rohde and Martinez, 2015), primarily imaging and radiotherapy
(Esmaeili et al., 2015; Twomey et al., 2012). An increasing number of studies is
now also aiming to measure hospital electricity use at a sub-building or depart-
mental level with view of providing input data for building simulation (Hagemeier,
2014; Christiansen et al., 2015; Pagliarini et al., 2012). But on the whole, energy
data with granularities exceeding entire buildings remains sparse, likely due to access
constraints and a prevalent lack of sub-metering. This lack of detailed understanding
limits the identification of energy conservation opportunities as well as the exchange
of best-practice experiences across heterogeneous hospital facilities.
5

1 Introduction
Table 1.1: UK energy target and performance benchmarks in the UK and Germany(see Appendix A.1 for further performance figures, conversion of government targets fromGJ/100m3 based on a ceiling height of 2.7m)
Publication Comment Category Current/TypicalkWh/(m2 · yr)
Target/Best practicekWh/(m2 · yr)
Electric Thermal Electric Thermal
HM Government(2006)
Few other countriesspecify national energytargets for health care.
Existing facilities Total energy: 413-488
New build &major refurb
Total energy: 263-413
BRECSU 1996Re-published unchangedin CIBSE (2012)
Acute Hospital 108 510 74 422
EnCO2de (2006)Primary UK guide onenergy efficiency inhealth care facilities
General AcuteHospital
143 373 122 317
CIBSE (2008)Used as basis for UKDisplay EnergyCertificates (DEC)
Hospital (Clinical& Research)
90 420
Laboratory oroperating theatre
160 160
Schettler-Kohler(2009)
Benchmarks for German‘Energieausweis’(mandatory displaycertificate followingEnEV2007, EnEv2009)
Hospital with upto 250 beds
120 205 84 145
Hospital with 251to 1000 beds
115 250 80 175
Hospital with morethan 1000 beds
115 285 80 200
At the time of this literature review, only ten studies globally reported energy
audit results for hospitals that specified the magnitude of different end-uses. They
confirm that space heating and hot water are dominant, as suggested earlier in Fig-
ure 1.1. For electricity, about two thirds of a hospital’s electricity consumption occur
locally through lighting, plug loads such as IT or medical equipment or food prepar-
ation (‘All process’ in Figure 1.2). The remaining third (more in tropical climates) is
accounted for by the provision of building services, in particular cooling, ventilation,
compressed gases and elevators. Scope, employed methodology and quality of the
reporting however vary widely between the studies; presenting some challenges for
a systematic meta-analysis (see Appendix A.2 for details).
This finding nevertheless suggests that a substantial share of a hospital’s electricity
demand occurs in a decentralised fashion across the hospital, while high-level audits
can not provide insights on how such demand is distributed across a hospital, neither
spatially nor in time. Black et al. (2013) conclude similarly that ‘common, small
[medical] devices consume large amounts of energy in aggregate and should not be
ignored when trying to address hospital energy use (p.1)’.
6

1 Introduction
Figure 1.2: Evidence from the literature on the relevance of different energy end-uses in hospitals (n = 10, see Appendix A.2 for details on the includedstudies)
1.1.3 Reducing hospital energy demand
The 2010 European Energy Performance of Buildings Directive explicitly encourages
reductions in building energy demand. To help health care organizations manage the
energy use of their buildings, the UK Department of Health publishes and regularly
updates the guidance document EnCO2de (2006, latest version from 2015). In addi-
tion, many other non-government bodies offer advice for hospital energy managers,
in the UK notably through the Carbon Trust’s Carbon Management Programme
and previously the Building Research Energy Conservation Support Unit (see Ap-
pendix A.3 for a graphic overview of UK guidance documents). A plethora of both
historic and current Carbon Management Plans of individual trusts are also avail-
able as exemplars, if not as best-practice examples. In other countries, comparable
guidance documents exist such as Tippkoter and Schuwer (2003) in Germany, Benke
et al. (2009) in Austria or Singer et al. (2009) in the US. BREEAM health care fur-
ther offers assessment of and certification for sustainable health care buildings and
ratings of ‘excellent’ or ‘very good’ are sought in the UK since 2008 for new health
care buildings and major refurbishments respectively.
7
1 Introduction
Strategies to reduce the energy use of existing hospital buildings are various. Tra-
ditionally, they have focused on technical measures such as the retrofitting of fabric
insulation and updates to lighting installations as well as to pumps, motors, lifts
and space conditioning equipment. Salix Finance, a government arm’s length or-
ganization providing much of the funding for energy saving projects to NHS Trusts
in England, Scotland and Wales, list combined heat and power, heat recovery and
LED lighting as most commissioned technologies within the NHS between 2012 and
2014 (Salix Finance, 2014).
Now, it is increasingly discussed whether energy savings in non-domestic buildings
may also be achieved through changes in user behaviour (Banks et al., 2012; Jeffries
and Rowlands-Rees, 2013). Behaviour change campaigns aimed at raising employee
awareness of sustainability and mostly encouraging simple energy efficient actions,
such as switching off lights and IT equipment out of hours, have been trialled in
offices and other workplaces, with some success (see literature review 2.2.1.1 for
more details). The NHS has consequently expressed an interest in this option in
the short term as it is thought that it could be more cost-effective than many tech-
nological conservation options (Pencheon et al., 2009; Morgenstern et al., 2015a).
In EnCO2de 2015, behaviour change also features much more prominently than in
previous versions of the guide (Short et al., 2015).
But knowledge on the applicability as well as the limitations of behaviour change
campaigns and other staff-centred energy conservation initiatives in hospitals is
sparse (see literature review 2.2.1.2): A thorough review of the relevant literature
revealed few academic publications on the topic, and many open questions remain
in the practical literature (for example around the nature of relevant energy beha-
viours, stakeholder motivations and lasting impacts specific to the hospital context).
A recent survey study by this author however indicated that the majority of energy
managers in English general acute hospitals were interested in trialling ‘behaviour
change’ among health care staff as tool for carbon reduction (Morgenstern et al.,
2015a), justifying a further exploration of the topic.
8
1 Introduction
1.2 Research question, aims and objectives
In addition to technological conservation strategies focusing on buildings and build-
ing services, staff-centred initiatives such as energy awareness campaigns are in-
creasingly considered by NHS Trusts to reduce their carbon emissions (Morgenstern
et al., 2015a; NHS SDU, 2010). But hospitals have complex energy requirements
and it is unclear to what extent these are influenced by clinical staff in different
building types and clinical processes. It can further be expected that the nature
and function of health care will pose particular challenges to attempts at reducing
the end-use of energy. This research therefore aims to improve the understanding
of hospital electricity use from an end-use perspective and to identify the scope for
local electricity conservation by answering the following research question:
To what extent can clinical staff influence electricity use in dif-
ferent hospital buildings and departmental processes and what
is their potential role in its reduction?
More specifically, the research will address the following objectives:
(i) Establish the theoretical maximum electricity savings potential from simple
changes in the way different hospital departments are being used by occupants,
principally clinical staff;
(ii) Unpick the governing constraints on energy demand reduction in the complex
socio-technical systems that hospital departments constitute;
(iii) Suggest a process to evaluate the relevance of behaviour and other simple
operational changes as tools for carbon mitigation in hospitals; and finally
(iv) Contribute to the concept of a socio-technical energy conservation potential
while discussing scope and limitations of socio-technical methods for research
in the built environment.
The scope of the study is necessarily limited (see also 8.2.1). It focuses on elec-
tricity usage as major cost to hospitals while space heating, usually by fossil fuel,
is the largest component of site carbon emissions in hospitals. The study further
addresses local electricity use only (for lighting, small power equipment and localised
heating, cooling or ventilation solutions) while excluding electricity used for cooling
or central ventilation systems, pumping and medical gas services, which as central
services are only with difficulty attributable to separate spaces within a building.
Finally, it is focused on clinical staff as opposed to other users of hospital buildings
because they represent the least transient occupant group.
9
1 Introduction
1.2.1 Stakeholders of the research
This research has a number of stakeholders who will benefit from the different types
of contributions (analytical, methodological and empirical) which can be expected
to emerge from this research project:
• Energy managers and facilities professionals: NHS energy managers and
energy managers in other organisations will be able to use the developed frame-
work to gauge to what extent behaviour and simple operational changes may
represent a worthwhile energy conservation tool across their building stock.
The framework will allow them to focus on building and department types
where staff engagement is a valuable resource, while disregarding those where
other energy conservation measures would be more promising.
• Architects and designers: The research presents a wealth of details on hos-
pital operations and clinical processes understood from an energy perspective.
Such evidence will be valuable to architects and designers interested in further
low carbon hospital design and may assist them in exploring how different
physical and logistical arrangements can enable low carbon health care.
• NHS Management and the Department of Health: Robust evidence on
the energy savings potentials of operations-focused measures to reduce energy
demand in hospital can support (or not) the integration of such measures in
energy policy frameworks, for example by the NHS Sustainable Development
Unit. The study is further expected to gather evidence and methodological
insight for the energy benchmarking of hospitals.
• The built environment research community: Academics working within
the field of the built environment, which traditionally is dominated by engin-
eering and the physical sciences, may benefit from reflections on the scope and
limitations of socio-technical methods for research in this area.
10
1 Introduction
1.2.2 Methodological overview
This exploratory thesis adopts a multiple case study approach to address the research
question outlined above. A mixed-method study design is considered most appro-
priate due to its effectiveness in handling both quantitative and qualitative inquiries
and its flexibility in integrating their various research instruments. Data collection
and analysis are understood within an inductive-pragmatic research paradigm (Mor-
gan, 2007) with a view to identifying transferable factors which enable or constrain
specific energy saving strategies and may be applicable to hospitals as well as to the
wider non-domestic context. The research design and the application of the mixed-
method approach are outlined in chapter 3, where an overview of the analysed cases
as well as a brief description of each of the research instruments employed (electricity
monitoring, lighting and appliance audit and semi-structured interviews) is given.
1.3 Thesis structure and chapter layout
The research is structured into three parts: review, analysis and synthesis (Fig-
ure 1.3), the chapters are therein organised as following:
Part I: Review
Introduction (this chapter)
An introduction to the study discusses the state of knowledge on hospital energy use.
Little academic research is available in the area and the practical literature focuses
largely on the energy use of entire buildings or systems. There is now some interest
in involving building users in attempts to reduce hospital energy use, but many
open questions remain. Among them, the introduction defines the main research
question and aims and objectives are laid out. The research methodology and the
main structure of the thesis are briefly outlined.
Literature review
This chapter reviews the literature which investigates how and to what extent oc-
cupants influence non-domestic building energy use. The review firstly compares
the understanding of various academic disciplines of people and their actions in the
context of building energy use. Secondly, it reviews studies investigating behaviour
change initiatives in non-domestic buildings in general and hospital in particular
from an individualist viewpoint. And finally, it reaches out beyond the notion of
human-building interaction as ‘energy behaviour’, discussing empirical studies from
a socio-technical and social practices perspective.
11
1 Introduction
Part II: Analysis
Study methodology
This chapter defines the main areas of investigation of this research and lays out
epistemological considerations resulting from nature and domain of the research
subject. Various possible research designs are explored and a rationale for the se-
lected multiple case mixed-method study design is presented. Following this, details
are provided on the data collection protocol and the analysis strategy.
Analysis context: Logistical and spatial arrangements of hospital
departments
This chapter presents the context in which clinical activity takes places in different
hospital departments and provides insight into the socio-technical systems framing
all energy saving attempts. Five department types with different energy intensities
and operating hours are analysed in this study across three case study hospitals.
They represent different stages (diagnosis, treatment and care) along the patient
pathway within an acute hospital. This chapter aims to provide the reader with
some contextual understanding and give credibility to the subsequent analysis.
Quantitative findings: Influence of clinical staff on hospital electricity
use
This first findings chapter addresses the first research objective i. Based primarily on
the collected quantitative data, it investigates the theoretical extent of clinical staff
influence on departmental electricity use and estimates the theoretical maximum
savings potential from simple changes in clinical operation for each department,
identifying transferable drivers.
Qualitative findings: Constraints on a theoretical energy savings
potential
This second findings chapter addresses the second research objective ii. It ana-
lyses the interview data (in the context of other available evidence from audits and
monitoring) to determine how the theoretical electricity saving potentials determ-
ined earlier were constrained in the complex socio-technical systems that hospital
departments constitute. The presentation of findings is guided by Gram-Hanssen’s
(2013a) empirical analysis framework for social practices.
12

1 Introduction
Part III: Synthesis
Discussion
The discussion chapter brings together findings from the quantitative and the qual-
itative findings chapters and jointly discusses their implications, thereby addressing
the research objectives iii and iv : The relevance of simple behaviour change as a
tool for carbon mitigation across different hospital departments and buildings is
evaluated by highlighting important factors which govern both theoretical and ac-
tual (real-world) energy savings potentials. Other strategies potentially effective in
reducing the energy end-use of hospitals are also presented. The discussion chapter
further contributes to the concept of a socio-technical conservation potential while
discussing scope and limitations of socio-technical methods for research in the built
environment.
Conclusion
The conclusion chapter briefly summarizes the key findings in relation to the research
question. It further discusses the implications of this thesis for different stakeholders,
taking into account the limitations of study design and methodology. Needs for
future work, both in academia and in practice, are highlighted.
13

1 Introduction
Figure 1.3: Overview of thesis structure
14

2 Occupant influence on
non-domestic energy use
This chapter reviews the literature which investigates how and to what extent occu-
pants influence non-domestic building energy use. It draws primarily on academic
sources, but government publications and other items from the grey literature1 are
also included where appropriate due to the close link of the non-domestic building
sector with occupying organisations and their research outputs. The review (see
Figure 2.1 for structure) firstly compares disciplinary understandings of people and
their actions in the context of building energy use. Secondly, it reviews studies
investigating behaviour change initiatives in non-domestic buildings in general and
hospitals in particular from an individualist viewpoint. And finally, it reaches out
beyond the notion of energy behaviours and discusses energy saving at work from
socio-technical and social practices perspectives.
2.1 Disciplinary views on people in the context of building energy use . 17
2.2 Individualist studies of occupant influence on non-domestic building
energy use . . . . . . . . . . . . . . . . . . . . . . . . . . . . . . . . . 22
2.2.1 Empirical studies on energy behaviour change initiatives in
organisations . . . . . . . . . . . . . . . . . . . . . . . . . . . 23
2.2.1.1 Behaviour change campaigns in organisations generally 24
2.2.1.2 Staff-centred energy conservation initiatives in hos-
pitals . . . . . . . . . . . . . . . . . . . . . . . . . . 27
2.2.2 Challenges for the evaluation of behavioural energy efficiency
interventions . . . . . . . . . . . . . . . . . . . . . . . . . . . 33
2.2.2.1 Ex-ante: Assessing energy savings potentials . . . . 34
1 The term ‘grey literature’ lacks a firm definition. It is generally understood to describe researchoutputs produced by non-academic organisations where the outputs have no commercial aimsand are not under the control of commercial publishers (Bryman, 2007).

2 Literature review: Occupant influence on non-domestic energy use
2.2.2.2 Ex-post: Assessing energy savings achieved in actual
interventions . . . . . . . . . . . . . . . . . . . . . . 39
2.2.3 Section summary and implications for this study . . . . . . . 40
2.3 Saving energy at work as social practice . . . . . . . . . . . . . . . . 41
2.3.1 Empirical socio-technical research on energy demand in buildings 41
2.3.2 Social practice based studies on building energy use . . . . . 43
2.3.2.1 Introduction to social practice theory . . . . . . . . 43
2.3.2.2 Empirical social practices studies of building energy
use . . . . . . . . . . . . . . . . . . . . . . . . . . . 46
2.3.3 Section summary and implications for this study . . . . . . . 49
2.4 Summary of evidence from the literature . . . . . . . . . . . . . . . . 49
2.4.1 Conceptual Framework . . . . . . . . . . . . . . . . . . . . . 50
2.4.2 Gaps in knowledge: Occupant influence on hospital energy use 52
Figure 2.1: Structural overview of the literature review chapter
16

2 Literature review: Occupant influence on non-domestic energy use
2.1 Disciplinary views on people in the context of
building energy use
Over the last years, behaviour change has been discussed as a strategy to reduce
building energy use alongside technological options and design practices in both the
domestic and increasingly also the non-domestic context (Lucon et al., 2014). Dis-
cussed behaviours of individuals (as opposed to group behaviours or organisational
behaviours) which relate to building energy use broadly fall into two categories:
• Single non-recurrent changes, mainly investment in energy efficient technolo-
gies or on-site renewables: relevant for domestic owner-occupiers (Bruce, 2008)
or facilities, technical and board-level staff in organisations (Banks et al., 2012)
• On-going repeated activities: Low energy household (Lopes et al., 2012; Abra-
hamse et al., 2005) or workplace behaviours (Cox et al., 2012), relevant for all
householders as well as organisational core staff but in particular also support
staff such as security personnel or cleaners
This study focuses exclusively on the second category within the organisational con-
text.
Low energy workplace behaviours are commonly understood to include simple
actions like the after-hour switch-off of lighting and equipment (see Table 2.1 for
a comprehensive list), but may extend to more complex behaviours such as the
bottom-up development of low carbon strategies. Accordingly, behaviour change
initiatives may aspire to the starting or stopping of a behaviour as well as the re-
placement of one behaviour with another.
17

2 Literature review: Occupant influence on non-domestic energy use
Table 2.1: List of generic (process independent) low energy workplace behaviours(Cox et al., 2012; Staats et al., 2000; Schahn, 2007; Jiang et al., 2013)
Heating, Cooling & Ventilation
Closing doors between areas with differenttemperatures
Increased reporting of problems such assimultaneous heating and cooling
Equal setting of radiator valves for allradiators in one room
Reduced window opening while heating orcooling systems are in operation
Keeping radiators and grates aboveradiators unobstructed
Reduced use of portable fans/airconditioners
Reduced use of portable heaters Increase in (some) cooling set points
Reduction in (some) heating set points Wearing clothes appropriate for the season
Lighting & Equipment Hot water
Switching off unnecessary lightsUsing only as much hot water as neededfor hand or dish-washing and showering
Turning off unused equipment Reporting of dripping tabs
Reporting of problems such asunresponsive occupant light sensors
Choice of low temperature programs fordish washers and washing machines
Closing doors of utility and storage roomsto avoid triggering light sensors bypassers-by
Within academia, however, the conceptualisation of occupant influence on build-
ing energy use as energy behaviour is contested depending on disciplinary views and
resulting assumptions on the nature of people and their actions and interactions with
their environment (Sorrell, 2015, see also the 2014 special issue of the journal ‘Ar-
chitectural Engineering and Design Management’ analysing the impact of building
occupants on energy consumption). Lately a number of policy- and implementation-
focused reviews have attempted to systematize theoretical stances on interpreting
human actions within the context of the built environment to allow a more diverse
range of ideas to be taken into account in policy making (Lopes et al., 2012; Chatter-
ton, 2011; Cox et al., 2012). Although necessarily simplistic especially with regard
to more complex theories, such overviews seem valuable in advancing the knowledge
of energy conservation options through occupant influence at an applied and policy
level.
Table 2.2 provides a high level overview of different social science perspectives on
energy consumption. Importantly, they all represent theories, i.e. abstracted ways
of understanding a phenomenon, while none fully reflects reality:
18

2 Literature review: Occupant influence on non-domestic energy use
Table 2.2: Social science perspectives on energy consumption(Table by Behar (2015), based on information curated by Chatterton (2011)
Philosophical position Discipline Understanding of energy
Individualist EconomicsEnergy is a tradeable commodity and consumers willadapt their usage in response to price signals.
PsychologyEnergy usage is subject to stimulus-responsemechanisms and affected by awareness levels andattitudes.
Socially orientated SociologyEnergy is largely invisible and its usage is often aby-product of other goals and daily practices.
EducationEnergy use is a skill that is learned through specificexperiences.
After all, social theories are vocabularies necessarily underdetermined
by empirical ‘facts’. As vocabularies they never reach the bedrock of a
real social world, but offer contingent systems of interpretation which
enable us to make certain empirical statements (and exclude other forms
of empirical statements).
(Reckwitz, 2002, p.257)
Depending on the question asked, each of the perspectives presented in Table 2.2
may consequently allow for useful conclusions and ultimately contribute to sustain-
ability and reductions in energy demand.
Individualist and socially orientated perspectives can be distinguished:
• Individualist understandings, typical for economic and psychological theories,
focus on individual occupants as centre of energy conservation initiatives.
• Socially orientated theories, common in sociology, science and technology stud-
ies and also in education sciences, reflect that energy demand also results from
social constructions and the systems providing energy services.
In energy policy as well as in built environment research, individualist perspect-
ives have long been dominant for a number of reasons potentially including a closer
alignment with assumptions and worldviews typical in engineering and the physical
sciences as well as neoliberal policy stances seeking ‘to encourage more sustainable
choices among sovereign consumers’ (Hargreaves, 2011, p.80).
19
2 Literature review: Occupant influence on non-domestic energy use
Individualist approaches do have some decisive strengths: They often result in
tangible pathways to action (Stern, 2000) and lend themselves to attempts at quan-
tification as basis for energy policy (Sorrell, 2015). Practical principles of inter-
vention often appear fairly accessible to stakeholders outside of the social science
community as well as to decision makers who (at least within the current political
and economic system) often operate within positivist mindframes (see section 3.2
for a brief overview of major belief systems). Individualist understandings of en-
ergy consumption finally also facilitate reflections on the savings potential of ‘people
interventions’ aimed at reducing building energy use en par with technological inter-
ventions, therefore offering the option of an integrated assessment of different carbon
mitigation strategies (see also section 2.2.2.1).
A number of aspects which have increasingly been identified as crucial in un-
derstanding occupant influence on building energy use are, however, overlooked by
individualist approaches (Shove, 2010). Most importantly, they pose the danger of
devolving the responsibility for change to the end-user where fundamental structural
changes would (also) be necessary (Shove, 1998). Chances for fundamental trans-
itions to a more sustainable society may therewith be foregone, an issue particularly
pressing given the urgency to act on climate change (Moezzi and Janda, 2014). Here
socially orientated approaches increasingly offer alternative insights and pathways
to change (Whittle et al., 2015).
The strength of socially orientated approaches is their ability to appreciate com-
plexity and embrace a whole variety of social and material factors (Cohn, 2014).
They recognise issues of power and politics as central features of all proposed meth-
ods to affect change and understand that current arrangements partly result from
vested interests and decisions which have previously been taken. In doing so, socially
orientated theories allow for a more fundamental (re-)assessment of social issues and
at best introduce additional degrees of freedom rather than simple mechanistic ideas
for and pathways to change.
But:
By being aligned with a language of systems, complexity, interactions
and irreducibilities, such an approach must inevitably be modest, since
it can only ever offer a partial interpretation. (Cohn, 2014, p.160)
20
2 Literature review: Occupant influence on non-domestic energy use
Socially orientated approaches therefore often result somewhat intangible at a prac-
tical level and remain conceptual rather than resulting in specific recommendations
for action (Whitmarsh et al., 2011). This can be problematic for the practical imple-
mentation of energy conservation interventions in buildings as well as in the energy
policy context. Also, devised practical interventions for change may not differ all
that much from those developed on the basis of other approaches (Blue et al., 2014).
In their paper on discouraging smoking as unhealthy practice, the authors acknow-
ledge that: ‘It is important to notice that there is nothing especially new about
the methods of intervention that might follow’ Blue et al. (2014, p.10) from socially
orientated analysis approaches, while others are recognised as ineffective ( such as
prescribed exercise and advice to individual smokers).
It should consequently seem that individualist approaches conceptualising occu-
pant influence on building energy use as energy behaviours can be helpful in attempts
to quantify energy saving potentials. Such potentials may support the prioritisation
of efforts with view to developing carbon reduction strategies. In its first part aim-
ing to quantify savings potentials (Chapter 5), this thesis will therefore refer to the
concepts of ‘energy behaviours’ and ‘behaviour change’.
Socially orientated approaches have, in contrast, proved particularly useful in
identifying additional levers of change and in pointing out intervention strategies
unlikely to be effective (Reckwitz, 2002, also quote above by Blue et al.). They will
hence be applied in this work to identify real-world constraints on the calculated
saving potentials and develop complementary pathways to change (Chapter 6). In
doing so, this study aims to combine the strengths of both approaches and bring to-
gether engineering and social sciences as frequently called for in the literature (Lopes
et al., 2012; Summerfield and Lowe, 2012).
This chapter will now proceed to discussing relevant studies of occupant influence
on non-domestic building energy use, firstly from an environmental psychology per-
spective (section 2.2) and secondly taking a socio-technical or ‘social practices’ view
on saving energy in work places (section 2.3).
21
2 Literature review: Occupant influence on non-domestic energy use
2.2 Individualist studies of occupant influence on
non-domestic building energy use
The influence of occupants on building energy consumption was first shown in the
domestic context. In the late 1970s, a study by Princeton University found that the
energy consumption of a number of nominally identical town houses varied hugely
depending on occupant behaviour (Socolow, 1978). Since then, other studies have
confirmed the role of occupants using different methodologies (e.g. Yu et al., 2011)
and larger sample sizes (e.g. Steemers and Yun, 2009). Subsequently, numerous in-
terventions encouraging households to reduce their energy and resource use more
generally) have been trialled (Darby, 2006; Osbaldiston and Schott, 2012; Abra-
hamse et al., 2005).
In contrast, there is less research on the impact of occupants on energy use in
non-domestic buildings. Increasingly, post-occupancy evaluations have helped un-
derstanding how well occupant needs are met in commercial buildings (e.g. Baird,
2010), and implications for sustainable building management have been identified
(Bordass et al., 2001). However, relatively few studies in the academic literature
explicitly investigate staff energy behaviours in organisations, and less so in health
care. In 2013, Abrahamse and Steg (2013) published a comprehensive meta-analysis
of social influence approaches in resource conservation (including employee energy
behaviours). The majority of the 29 studies included in their analysis however fo-
cused on recycling or referred to social situations in neighbourhoods and communities
as opposed to in the workplace.
22
2 Literature review: Occupant influence on non-domestic energy use
In non-domestic buildings, different occupant groups have differing influences on
building energy consumption depending on their respective job roles. For building
operators and facilities staff, energy issues are part of their job. Aune et al. (2008)
stress the importance of this occupant group in energy management. Building op-
erators are however vastly outnumbered by building users, i.e the core staff of the
organisations inhabiting a building. The occupation of the latter depends on the
organisational focus and will in the majority of cases have nothing to do with en-
ergy issues (Pellegrini-Masini and Leishman, 2011). In hospitals, building users will
include at least clinical staff (doctors, nurses, scientists in laboratories), adminis-
trative staff (health records staff, clerks, receptionists), non-clinical support staff
(including cleaners, porters2, security staff) as well as patients (see also the gloss-
ary for definitions of these terms).
Apart from these (semi-)permanent building users, many non-domestic buildings
are also occupied temporarily by other occupant groups such as students in univer-
sity buildings or visitors in hospitals. In continuation, this review will focus on the
influence of organisational core staff on non-domestic energy use due to the small
influence of transient populations on building energy consumption (Gul and Patidar,
2015). It further specialises on clinical staff within hospitals, as energy behaviours
of administrative staff can reasonably be expected to be very similar to the office
context, which has previously been researched more widely (Cox et al., 2012; Lit-
tleford et al., 2013). Researching the role of domestic staff on building energy use
meanwhile represents an important area of further investigation (see also limitations
of this study, section 8.2.1).
2.2.1 Empirical studies on energy behaviour change initiatives in
organisations
A number of theoretical frameworks have been developed within social and envir-
onmental psychology to analyse employee energy behaviours in organisations (for
example Cox et al., 2012; Lo et al., 2012; Littleford et al., 2013; Tudor et al., 2008).
Three main groups of variables are thought to be influential:
• Contextual factors such as the nature of the setting and physical control
over environment or equipment;
2 Porters are those health care professionals responsible for moving frail and often very ill patientsbetween different departments and wards. They also transport equipment that may requireexpert handling around the building.
23
2 Literature review: Occupant influence on non-domestic energy use
• Individual level factors such as knowledge, value orientations or self-efficacy;
and
• Organisational level factors such as social norms and organisational cul-
ture.
All of these factors may present levers - as well as constraints - to encourage energy
efficient behaviours in the workplace. An application of these frameworks to the
development of behaviour change initiatives in hospitals can be found in Short et al.
(2015). This brief review will therefore focus on reporting experiences from actual
interventions, both in organisations generally (section 2.2.1.1) and in hospitals in
particular (section 2.2.1.2).
2.2.1.1 Behaviour change campaigns in organisations generally
Social and environmental psychology literature reports intervention studies target-
ing employee energy use using various different approaches such as the provision
of information, goal setting and giving feedback or rewards (see Table 2.3). Some
studies report measured savings, but evaluation methodologies and reporting vary
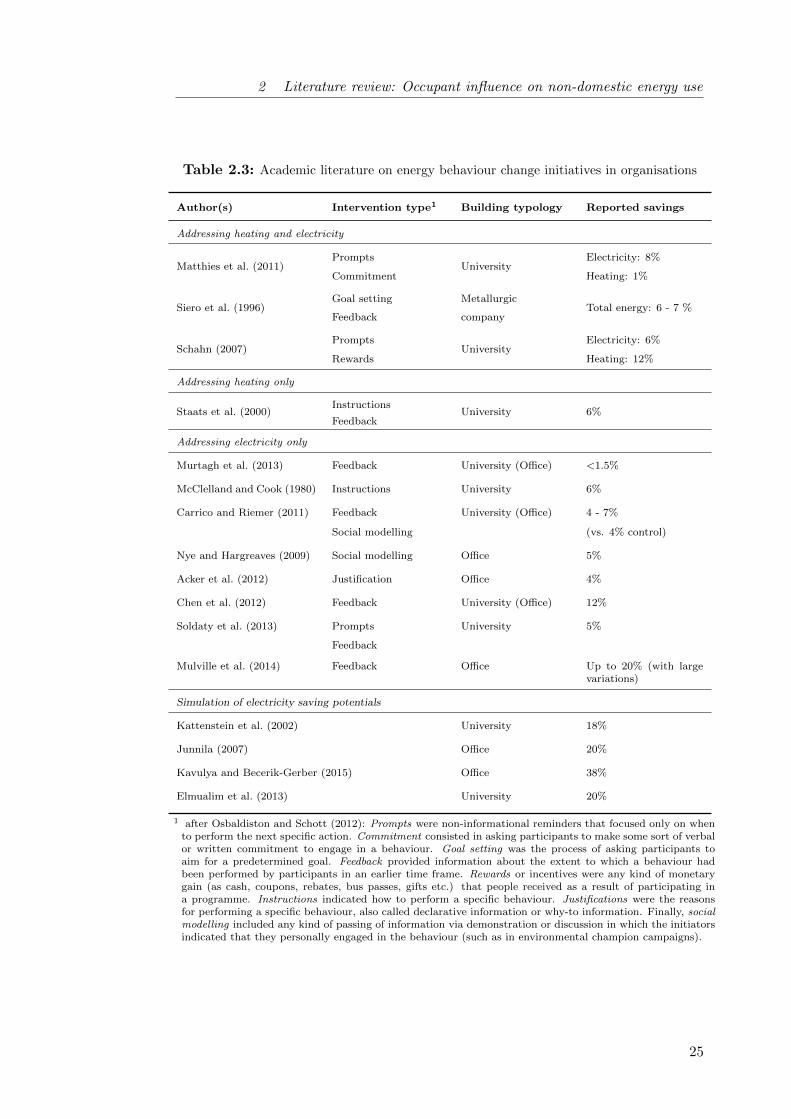
hugely, complicating the comparison of campaign effect sizes. On the whole, studies
in peer-reviewed journals or at academic conferences report measured energy savings
in organisations between 1 and 12 % for heating and of almost none up to 20% for
electricity, while simulations more consistently claim a potential of around 20% of
total electricity use. The interest has so far primarily been in university and office
buildings, with a more pronounced interest in electricity as opposed to heating use.
In terms of intervention approaches, the provision of feedback as well as social mod-
elling techniques based on energy or environmental champions are most researched.
24
2 Literature review: Occupant influence on non-domestic energy use
Table 2.3: Academic literature on energy behaviour change initiatives in organisations
Author(s) Intervention type1 Building typology Reported savings
Addressing heating and electricity
Matthies et al. (2011)Prompts
UniversityElectricity: 8%
Commitment Heating: 1%
Siero et al. (1996)Goal setting Metallurgic
Total energy: 6 - 7 %Feedback company
Schahn (2007)Prompts
UniversityElectricity: 6%
Rewards Heating: 12%
Addressing heating only
Staats et al. (2000)Instructions
University 6%Feedback
Addressing electricity only
Murtagh et al. (2013) Feedback University (Office) <1.5%
McClelland and Cook (1980) Instructions University 6%
Carrico and Riemer (2011) Feedback University (Office) 4 - 7%
Social modelling (vs. 4% control)
Nye and Hargreaves (2009) Social modelling Office 5%
Acker et al. (2012) Justification Office 4%
Chen et al. (2012) Feedback University (Office) 12%
Soldaty et al. (2013) Prompts University 5%
Feedback
Mulville et al. (2014) Feedback Office Up to 20% (with largevariations)
Simulation of electricity saving potentials
Kattenstein et al. (2002) University 18%
Junnila (2007) Office 20%
Kavulya and Becerik-Gerber (2015) Office 38%
Elmualim et al. (2013) University 20%
1 after Osbaldiston and Schott (2012): Prompts were non-informational reminders that focused only on whento perform the next specific action. Commitment consisted in asking participants to make some sort of verbalor written commitment to engage in a behaviour. Goal setting was the process of asking participants toaim for a predetermined goal. Feedback provided information about the extent to which a behaviour hadbeen performed by participants in an earlier time frame. Rewards or incentives were any kind of monetarygain (as cash, coupons, rebates, bus passes, gifts etc.) that people received as a result of participating ina programme. Instructions indicated how to perform a specific behaviour. Justifications were the reasonsfor performing a specific behaviour, also called declarative information or why-to information. Finally, socialmodelling included any kind of passing of information via demonstration or discussion in which the initiatorsindicated that they personally engaged in the behaviour (such as in environmental champion campaigns).
25

2 Literature review: Occupant influence on non-domestic energy use
Out of the studies listed in Table 2.3, the research project ‘change’ by Matthies
and colleagues seems noteworthy (Matthies et al., 2011; Kattenstein et al., 2002): An
interdisciplinary team of environmental psychologists and energy engineers achieved
an 8% reduction in the lighting and small power consumption of a German univer-
sity through an intervention package encompassing information in various formats,
prompts through stickers and a commitment sheet linked to a lottery. To allow for a
better evaluation of the effectiveness of the intervention, the achieved savings were
compared to the theoretical maximum electricity savings potential. This theoret-
ical potential was determined through TRNSYS building simulation of optimized
energy-relevant staff behaviours, suggesting that 14% of electricity use could the-
oretically be avoided by switching-off unused computers and power sockets and a
further 4% by switching-off lights when sufficient daylight was available or rooms
were empty3. Providing such theoretical savings potentials also helped to link the
energy behaviours targeted through the initiative to their actual environmental im-
pact, a common call in the psychological literature (Stern et al., 1997; Gatersleben
et al., 2002).
Studies directly linking organisational energy use to specific employee behaviours
have increasingly been emerging but currently remain restricted to individual work-
station behaviours in offices (Murtagh et al., 2013; Coleman et al., 2013; Mulville
et al., 2014; Bradley et al., 2016). Murtagh (2013) and her interdisciplinary team
of psychologists, engineers and computer scientists used individual level feedback on
measured workstation electricity consumption in university offices through an on-
line application to encourage employees to switch-off their workstations when away
from their desks. Pre-intervention, a theoretical savings potential of 32% based on
the measured use of a workstation compared to a 40h per week base case scenario
was estimated. Measured savings were found to vary widely and were subject to
participants joining and leaving the offices or changing desks during the study as
well as to seasonality effects during the summer months. Mulville et al. (2014) exper-
ienced similar challenges of desk use instability in their study providing comparative
feedback at desk-level to employees in a commercial office. Before the intervention,
baseline electricity use is extensively analysed and savings potentials are estimated
by comparing high, mean and low consumption patterns.
3 Building simulation further suggested that 9% of heat may be saved through improved ventilationpractices and the reduction of indoor temperatures by one degree.
26

2 Literature review: Occupant influence on non-domestic energy use
2.2.1.2 Staff-centred energy conservation initiatives in hospitals
Attempts to promote healthy lifestyles through behaviour change campaigns have a
long tradition to address issues such as obesity, smoking, heavy drinking or sexual
risk taking and many successful intervention examples originate within the field of
public health (NICE 2007). While generally aimed at communities or the wider
population, some public health campaigns have also specifically targeted clinicians
and aimed to encourage them to to maintain high levels of hand-hygiene for infection
control purposes (Fuller et al., 2014) or to keep updating their prescribing routines
based on the latest emerging scientific evidence (Brennan and Mattick, 2013; Michie
et al., 2005). In these cases, campaign goals were presumably aligned with the clini-
cians’ aims to achieve optimal patient outcomes, but limited knowledge and/or a
lack of attention paid sometimes kept health care staff from taking the required ac-
tion. This suggests that for non-core activities such as energy saving similar, if not
more, challenges will apply.
A review of the peer-reviewed academic literature has revealed a lack of research
studies that focus on staff-centred energy conservation initiatives in hospitals. How-
ever, a handful of case studies in the grey literature report energy awareness cam-
paigns or comparable measures in hospitals. While some report on cost or fuel
savings achieved as detailed below, the quoted estimates will need to be interpreted
with some caution as methods for their estimation are often unclear and results may
be influenced by stakeholder interests.
Historical accounts of staff-centred energy conservation in English hos-
pitals In England, behavioural energy efficiency in hospitals has been discussed at
least two times: in the late 1980s and then again now following a period of reduced
interest in behavioural energy efficiency during the 1990s/early 2000s. During the
first period, the (then) Department of the Environment published a guide for energy
and estate managers on good housekeeping in (BRECSU 1992b) based on experi-
ences acquired in different health authorities during the 1980s.
27

2 Literature review: Occupant influence on non-domestic energy use
In 1987, the Somerset Health Authority trialled a good housekeeping programme,
which in combination with some capital investment in energy cost reduction pro-
jects achieved 25% savings on fuel bills within three years (BRECSU 1992a). Little
detailed energy data was available and the sole effect of the staff-centred initiatives
could not be separated out, but the report attributes roughly a fifth of the savings
(5% of the fuel bill) to the housekeeping measures. Clinical and administrative staff
were appointed as ‘energy monitors’ to watch the day-to-day use of equipment and
identify opportunities for savings, while they and their departmental managers re-
ceived training on energy issues and appreciation sessions. In addition, humorous
posters were put up to reduce waste and competitions for energy posters and energy
saving ideas were held among staff and patients, especially children. Every em-
ployee received an energy handbook and new staff were given a special introduction
with respect to efficient energy behaviours. The campaign further recognised the
importance of senior management commitment and monthly review meetings with
high-ranking managers were organised.
An interesting approach to motivating staff is reported from the Pinderfields Hos-
pital Trust (BRECSU 1995). Apart from a poster campaign throughout their hos-
pitals and energy handbooks for staff to take home, the trust also implemented
departmental accountability in six pilot areas; pre-allocating energy budgets to de-
partments and measuring actual energy use. The project documentation, however,
does not indicate whether departments could use saved money for other purposes or
how well this intervention performed generally.
Promoting energy awareness in English hospitals today In 2007, the NHS
Carbon Management Plan was piloted in partnership with the Carbon Trust in 30
hospitals throughout England and Wales. Most pilots included some behavioural
elements (Carbon Trust, 2008; Heape, 2013). The 2015 version of EnCO2de also
gives high prominence to organisational carbon management and good housekeep-
ing, stressing that ‘there is a potential danger that the energy management team
could spend too much time focusing on technical detail’ (Short et al., 2015, p.31).
28
2 Literature review: Occupant influence on non-domestic energy use
Specifically, the Carbon Trust claims that reductions in total energy costs of up
to 10% could be possible at no or very low cost in hospitals (Carbon Trust, 2010).
The aforementioned 1992 NHS guide also published a 10% savings potential from
good housekeeping measures (BRECSU 1992a), while other official publications since
then by the NHS Estates (NHS Estates, 2004a) or the NHS Sustainable Development
Unit (SDU) (Pencheon et al., 2009) had stressed the significance of staff education
and participation, but not presented tangible energy saving potentials. For their
Marginal Abatement Cost decision support tool, however, the SDU assumes more
conservative energy awareness campaign effect sizes of 3% reductions for electricity
and heating respectively (SDU 2010).
In terms of practical advice on staff engagement, the NHS SDU website provides
a staff awareness pack (developed in collaboration with the Leeds Teaching Hospit-
als NHS Trust) to help hospitals run a half-hourly session on sustainability within
their existing induction or staff professional development programmes. The advice
collection ‘5 to Survive for Nursing Professionals’4 put together in association with
the Royal College of Nursing includes information on low carbon procurement, com-
muting and business travel. It further encourages the promotion of healthy meals
in collaboration with colleagues from the catering department as well as the devel-
opment of better models of care, but notably excludes any building related actions.
The NHS SDU also publishes successful sustainability or energy efficiency projects
as best-practice examples on their website, such as that of Operation TLC at the
Barts Health NHS Trust (Barts Health NHS Trust, 2013).
4 ‘5 to survive...’ advice is also available for other groups of health care professionals includingGPs and Estates and Facilities Personnel.
29

2 Literature review: Occupant influence on non-domestic energy use
Operation TLC, an award-winning multi-partner behaviour change programme5
used an Energy Champion approach to promote three low impact, but high frequency
energy behaviours (turning off unused equipment, switching off lights and closing
doors). The campaign team states that cost savings equivalent to 7% of the trust’s
fuel bill have been achieved alongside improvement in patient experience through
fewer sleep disruptions and less privacy intrusions. This author was involved with
the evaluation of the campaign in one of the participating hospitals during the first
year of this PhD (scoping study). Findings highlighted that although the hospital’s
sub-metering levels were comparatively high, difficulties in measuring and attribut-
ing changes in energy use to the behavioural campaign were considerable due to the
complexity of the underlying consumption profile from building services and appli-
ance use as well as due to the varying engagement of occupants with the awareness
campaign across the hospital (Morgenstern et al., 2014).
A recent survey study, also carried out by this author as part of the PhD scoping
activities, nevertheless suggests that facilities and energy managers in a majority of
NHS Trusts in England are implementing or planning to implement some form of
staff-centred energy conservation initiative (Morgenstern et al., 2015a). Information-
based initiatives to raise energy awareness among trust staff or patients proved most
popular on the behavioural side and accounted for 13% of all energy efficiency meas-
ures carried out by NHS trusts in 2012/2013 according to the 70 survey responses.
The survey, however, also showed that while cost-effectiveness is a central decision-
making criterion for energy managers, it remains somehow unclear to them how
much energy and therewith money can really be saved through energy awareness
campaigns and other staff engagement initiatives in hospitals, partly due to the
heterogeneity of their estates. It is concluded that to overcome this challenge the
influence of clinical staff on building energy use needs to be explicitly linked to the
respective buildings, processes and their interfaces with the occupants.
5 Operation TLC was implemented by Barts Health together with the behaviour change charityGlobal Action Plan and the energy service providers GE and Skanska. In 2013, it was awardedthe widely respected HSJ award for ‘Improving environmental and social sustainability’ and hassince been the role model for further behaviour change programmes carried out in the healthcare sector (promoted for example in Short et al., 2015).
30

2 Literature review: Occupant influence on non-domestic energy use
The survey study further identifies challenges to lasting staff engagement with sus-
tainability issues in busy hospital environments. The authors conclude that ‘it also
seems promising to directly involve interested clinical staff in campaigns as experts
on health care processes, the use of respective facilities and local pressures. A wider
network of actors may be conceivable to complement top-down efforts by the en-
ergy management team, potentially including academic experts helping programme
evaluations. At the same time, the conflicting demands on the time of both clinical
and technical staff within a high pressure environment such as the NHS need to be
appreciated. The resources required for staff-centred campaigns can only be made
available if a trust’s senior management remains strongly committed to sustainabil-
ity in times of rising pressures on NHS budgets’ (Morgenstern et al., 2015a, p.17).
Similar challenges rooted in the centralised and hierarchical structures of the NHS
with high levels of central focus and control had previously been identified by Tudor
et al. (2008) based on their study of waste management in the NHS Cornwall.
Staff-centred energy conservation initiatives in hospitals worldwide In-
ternationally, a number of behaviour change programmes in hospitals have also been
reported on by practitioners6. In Canada, the University Health Network (UHN)
in Toronto are running an extensive environmental champion programme (coincid-
entally also called Operation TLC) encouraging clinical staff to widely engage with
energy saving and sustainability issues (Cowan, 2011, 2013). In a personal com-
munication, the programme designer reports that actual energy savings from the
programme are difficult to determine due to evaluatory challenges. She estimates
(on the basis of surveys, visual audits and engineering calculations) that energy sav-
ings of about 10-20% may have been achieved over the 7 years programme duration
through behaviour change. Voluntary participation in the programme is supposedly
rising and energy is claimed to have become more salient across the hospitals, with
senior management now asking for energy impacts on investment projects and other
(health care) organizations inquiring about the programme. Indeed, other Canadian
hospitals also report attempts to motivate employees, for example to help with the
reporting of losses and leaks (Marshall and Rashid, 2013).
6 A Chinese journal also reports on an energy awareness campaign promoting the adjustment oflamp placements as well as power saving modes for IT equipment on nurses bases. The abstractclaims electricity cost savings of 38%, but the article is unfortunately only available in Chineseso details could not be verified by the author (Su, 2011).
31

2 Literature review: Occupant influence on non-domestic energy use
In Austria, the partly EU-funded recommissioning project ‘Re-Co’ - aiming to im-
prove operational energy efficiency of non-domestic buildings through auditing and
the implementation of low-cost measures (www.re-co.eu) - also included four hospit-
als. Energy coaches, comparable to energy champions, participated in workshops to
identify behavioural savings opportunities. Apart from common energy behaviours
such as light switching and switching off monitors during breaks, they included the
combining of little used refrigerators as hospital specific energy behaviour (Benke,
2012). Specific energy savings from the behaviour change campaign are not reported,
but the implementing team estimates the user-sided savings potential to lie between
10 and 15%.
Few other studies investigated hospital specific energy behaviours or analysed how
generic energy behaviours play out across different hospital buildings and depart-
ment types. Jensen and Petersen (2011) have looked at reducing stand-by energy use
of medical as well as laboratory equipment. They conclude that for some depart-
ments, stand-by electricity consumption from non-transportable equipment ‘most
often accounts for more than 50% of annual power consumption’ (p.1516). At the
same time, it is very difficult to obtain information from clinical staff or equip-
ment manufacturers as to whether the equipment or parts of it can be switched off,
whether recalibration is necessary after switch-on and how long it takes or whether
the equipment is affected by frequent switching. Based on monitoring as well as some
estimates, Pierce et al. (2014) and his team of anaesthetic practitioners assessed the
daily electricity use required to provide a day’s general anaesthesia in operating de-
partments. They conclude that the pumps of the anaesthetic gas scavenging system
removing gases hazardous to health from theatre departments should be switched-off
after hours and then properly activated as part of the pre-anaesthetic check.
32
2 Literature review: Occupant influence on non-domestic energy use
2.2.2 Challenges for the evaluation of behavioural energy efficiency
interventions
Robust evaluations are considered a prerequisite for improvement and learning (Pre-
iser and Vischer, 2005). They can offer evidence on impacts of policies, programmes
or interventions, illustrating not only what changes were produced but also why and
how these changes came about (Hills and Junge, 2010). Rigorous design based on a
suitable theoretical framework is however a precondition for evaluations to deliver
sound results. Plenty of literature and guidelines exists on programme evaluation in
general (see Hills and Junge, 2010, for an excellent discussion of the topic) as well as
on the evaluation of technical energy efficiency programmes (e.g. Vine and Sathaye,
1999). But less guidance is available for behavioural change programmes in build-
ings, neither on ex-ante (section 2.2.2.1) nor on ex-post (section 2.2.2.2) evaluations.
There has been a continued call for better evaluation from both academia and
practitioners (e.g. Banks et al., 2012). Importantly - and in contrast to technical
measures where energy and cost savings are the main focus - behavioural energy
efficiency interventions may co-generate a number of non-energy-benefits in partic-
ular regarding patient experience (Gray, 2011), employee satisfaction and morale
(Knight and Haslam, 2010) as well as organisational image (Pellegrini-Masini and
Leishman, 2011). These ‘knock-on benefits’ and potential ‘knock-on costs’ need to
be taken into account to allow for comprehensive cost-benefit analyses of behavioural
interventions (Skumatz et al., 2000; Banks et al., 2012).
33

2 Literature review: Occupant influence on non-domestic energy use
2.2.2.1 Ex-ante: Assessing the energy savings potential of operational
changes
Ex-ante evaluations, or appraisals, attempt to forecast intended energy savings of
future projects before an investment decision is made (Hills and Junge, 2010). Their
relevance in the context of organisational energy management has variously been
argued: Azar and Menassa (2014) stress the need for a framework to quantify such
saving potentials from improved operations of the commercial building stock. They
claim that a comprehensive framework will support the integration of operations-
focused measures in energy policies and justify the costs of their further exploration.
Energy managers are also known to often need justification as to why their organ-
isations should invest in (behavioural) energy efficiency, making savings potentials
helpful (CIBSE, 2012). Moreover, the psychological literature calls to more compre-
hensively assess the potential environmental impact of pro-environmental and energy
behaviours (Stern et al., 1997; Gatersleben et al., 2002; Matthies et al., 2011, see
also section 2.2.1.1). Terminology and methodologies to determine energy savings
potentials, however, are yet to be standardized.
Terminology: What is an energy savings potential? Energy benchmarking
methodologies for buildings make reference to two types of performance standards:
an absolute standard based on what a building does and a relative standard where
the assessed building is compared to a notional building identical in shape and form
with the same servicing systems (e.g. Bordass et al., 2014). So are the UK Display
Energy Certificates (DEC), now mandatory for all public buildings, based on abso-
lute standards while compliance with Part L of the Building Regulations is granted
in the UK based on relative benchmarks. Potentials as understood in this study
are also relative, i.e dependent on the context of the investigated building and its
configuration.
Moezzi and Janda (2014) name three kinds of (relative) potentials which could
be tapped to reduce building energy use: a technical, a behavioural and a social
potential.
• For the authors (based on ideas by Rosenfeld et al., 1993), a technical poten-
tial denotes a best-case energy efficiency scenario based on engineering and
economic calculations unconcerned with the probability of a successful imple-
mentation of the proposed measures.
34

2 Literature review: Occupant influence on non-domestic energy use
• Similarly, a behavioural potential describes a savings potential from simple
changes in energy behaviours, i.e. ‘without assuming dramatic or onerous
changes in behaviours’ (Moezzi and Janda, 2014, p.5), disregarding any ana-
lysis of how compelling supposed benefits are to occupants or other consider-
ations on ways to achieve this behavioural potential. Incidentally, the concept
of a behaviour potential has helped to establish a policy-friendly counterpoint
to a conventional focus on technological efficiency alone. In the tradition of
socially orientated schools of thought (see also section 2.1), Moezzi and Janda
(2014) are, however, highly critical of such simplistic notions of the role of
human actors in achieving reductions in energy use.
• They hence move on to propose a social potential describing the gap between
current arrangements and ‘a world where social organization is optimized for
energy performance’ (Moezzi and Janda, 2014, p.6). As work in progress, the
notion of the social potential currently remains somehow vague in the text
despite a number of examples. Following further developments, the concepts
may however become an extremely useful tool to highlight (and potentially
even quantify?) additional pathways for change.
Other scholars are less critical of behavioural potentials and stress their import-
ance in bringing the influence of occupants on building energy use to the attention of
implementers and climate policy (Lucon et al., 2014). In the domestic context, the
term ‘behavioural wedge’ was used to describe ‘the reasonably achievable potential
for near-term reductions by altered adoption and use of available technologies’ (Di-
etz et al., 2009, p.18452). In this definition it does remain somehow debatable what
may be understood as ‘reasonably achievable’, likely pointing out a major weakness
of the concept of (behavioural) potentials in generally. Ucci et al. (2012) develop a
questionnaire tool to assess how well organisations are doing in managing energy-use
behaviours of occupants in existing non-domestic buildings. In a very applied art-
icle, they do not specifically define their term ‘behaviour change potential for energy
saving’, but the developed questionnaire items comprise specific switch-off actions
but no fundamental transformations.
35
2 Literature review: Occupant influence on non-domestic energy use
This work will subsequently use the term of a theoretical savings potential to de-
scribe a calculated potential representing some form of ideal intervention and disreg-
arding all practical considerations which may affect implementation. The theoretical
potential is context-dependent but unconstrained except through infrastructural ar-
rangements. As opposed to technical, behavioural or social potentials, the term
theoretical savings potential may refer to operational changes achievable through
either technical, behavioural or organisational/structural measures. This termin-
ology is preferred due to its emphasis on the theoretical nature of the estimated
potential, stressing the value of the concept in prioritisation and strategy develop-
ment rather than focusing on specific pathways to change.
Methods and methodologies to quantify occupant influence on building
energy use Methods to quantify the energy use of existing non-domestic buildings
in general can be divided into measurement-based and calculation-based approaches
(the latter include steady-state or dynamic simulations) (Agami Reddy, 2011; Wang
et al., 2012). Surveying and energy audits are common measurement-based tools
to obtain information on organisational processes at a building or systems level, to
identify energy conservation opportunities and estimate savings potentials (Russen
et al., 2010; Field et al., 1997; Hirst, 1982). Depending on their level of detail, en-
ergy audits can include the analysis of fuel bills, walk-throughs, the study of installed
equipment and operating data as well as on-site measurements.
Energy audits (Masoso and Grobler, 2010) as well as a number of other measurement-
based methods have been used to assess factors related to occupant energy beha-
viours:
• Window opening behaviours, lighting switching as well the use of shading
have been monitored using time-lapse digital photography (see for example
Hagemeier (2014) for an example in the hospital context).
• Temperatures and light levels were recorded using distributed data loggers (for
example Mahdavi et al., 2008; Schakib-Ekbatan et al., 2015).
• Electricity consumption of equipment was monitored at plug level (for example
Murtagh et al., 2013).
• Some studies (for example Tetlow et al., 2012) recorded observations of light
switching over a certain period of time.
• The location of occupants within a building, especially relevant for HVAC op-
erations, was monitored using a range of techniques (see Spataru and Gauthier,
2014, for a detailed review).
36

2 Literature review: Occupant influence on non-domestic energy use
Figure 2.2: Graphical overview of methods and methodologies to quantify occu-pant influence on building energy use discussed in this section
An increasing interest in advancing the understanding of occupant influence on
building energy use has also emerged from a building simulation perspective. This
is for example reflected in the formation of the IEA-EBC Annex 66 for the definition
and simulation of occupant behaviour in buildings in 2013. It is hoped that a better
understanding of occupant energy behaviours may help to reduce the performance
gap prevalent in the understanding of the energy performance of non-domestic build-
ings (CIBSE, 2006). Predicting building energy consumption based on statistical or
engineering estimates and attributing remaining differences from measured energy
consumption to occupant behaviour is generally common, but may - in overlooking
structural and modelling uncertainty - not stand up to scrutiny while as a top-down
method offering little insight into what is actually going on on the ground.
37

2 Literature review: Occupant influence on non-domestic energy use
Beyond methods, a number of methodologies have further informed the analysis
of occupant influence on building energy use in this study (Figure 2.2). Life cycle as-
sessments (LCAs) are used to obtain detailed information on environmental aspects
and potential impacts, including the energy consumption associated with a product,
process, or service (EPA 2015). In health care, LCAs are common to investigate the
environmental impact of drug and consumable use (for example Overcash, 2012).
LCA has also been applied to the delivery of imaging in hospitals, measuring in
detail the electricity use of imaging equipment during different scans and estimat-
ing the energy use for lighting and building services (Esmaeili et al., 2015; Twomey
et al., 2012). Such detailed bottom-up studies seem invaluable in understanding to
what extent hospital energy use is influenced by the decisions of clinical and other
staff in different health care processes.
The explicit link of estimated potentials to specific energy behaviours is also a
strength of McKenzie-Mohr (2000)’s community-based social marketing (CBSM).
CBSM recommends to begin thinking about any pro-environmental behaviour change
initiative by creating a list of all related behaviours, regardless of whether a beha-
viour seems highly insignificant in terms of impact or virtually inconceivable in terms
of uptake. Based on this initial list, an informed decision can be made as to which
behaviours to promote in order to maximise greenhouse gas emission reductions.
CBSM advises to determine the potential impact of any behaviour change based
on information from the literature or through expert consultation if no reliable in-
formation are available otherwise. Based on the CBSM methodology, Bruce (2008)
from the municipality of Townsville in Australia created a list of 241 behaviours
related to residential energy demand, classifying potential impact and likelihood of
each behaviour. No comparable inventory of energy behaviours was found in the
non-domestic context, despite calls to base behaviour change initiatives on detailed
assessment of the potential impact of energy behaviours (Banks et al., 2012; Short
et al., 2015).
38

2 Literature review: Occupant influence on non-domestic energy use
Figure 2.3: Challenges for the evaluation of energy behaviour change interventions(Schahn, 2007; Matthies et al., 2011; Lakeridou et al., 2012; Zibarrasand Ballinger, 2011; Cox et al., 2012)
2.2.2.2 Ex-post: Assessing energy savings achieved in actual
interventions
Ex-post evaluations are conducted either on or after completion of an intervention
to determine whether the intended objectives could be achieved (Hills and Junge,
2010). For energy awareness campaigns or other behavioural initiatives in organ-
isations, ex-post evaluation has so far mostly been attempted through what theory
describes as a quasi-experimental approach using interrupted time-series (Shadish
et al., 2001). This approach is known to be problematic for gradual rather than ab-
rupt interventions and those where effects might be delayed. Especially in complex
non-domestic buildings with limited available meter data, links between measured
changes in energy consumption and actual occupant activities can be hard to estab-
lish (Morgenstern et al., 2014). This can limit the understanding of the extent to
which behaviour change programmes are actually effective in motivating employees
to reduce workplace energy use. Figure 2.3 summarizes additional challenges for
energy interventions commonly encountered in practice.
39
2 Literature review: Occupant influence on non-domestic energy use
The methods used to determine actual energy reductions from interventions are
on the whole not dissimilar from those applicable to determine savings potentials
(see section 2.2.2.1). Many evaluatory attempts have relied on meter data and
self-reported data from pre-and post intervention questionnaires with occasional in-
cidents of behavioural monitoring, observing for example light switching in jointly
used rooms (Tetlow et al., 2012) or window positions from the outside of buildings
(Matthies et al., 2011). The use of such additional datasets seems highly commen-
ded to increase the understanding of intervention pathways.
Additional research could be especially beneficial in establishing suitable indicat-
ors to specify the energy impact of behavioural energy efficiency intervention taking
into account the resources (financial, personnel) realistically available to evaluation.
On the other hand, non-experimental alternatives such as theory based evaluations
linked to the intervention logic might be more promising in the first place (Petersen,
1998; Morgenstern et al., 2014). The reporting of achieved campaign effect sizes
within the context of theoretical achievable potentials to allow for a comparison
across contexts and buildings also seems crucial (Matthies et al., 2011).
2.2.3 Section summary and implications for this study
This section on individualist studies of employee energy behaviours presented a
number of staff-centred energy conservation initiatives in non-domestic buildings in
general and in hospitals in particular. Such studies claim some success in reducing
organisational energy use, while evaluation poses a major challenge, especially in
complex buildings like hospitals. Apart from reductions in energy consumption and
costs, the importance of intangible benefits relevant directly for the employees as
opposed to the organisation (such as comfort or increased reliability of equipment)
has been stressed. It further seems that the culture of an organisation and how much
priority is given to sustainability by its senior management is crucial in motivating
an efficient end-use of energy. For hospitals in particular, the lack of studies invest-
igating energy behaviours specific to the context was highlighted.
40
2 Literature review: Occupant influence on non-domestic energy use
It was further established that an assessment of energy savings potentials is im-
portant within individualist frameworks to allow for investment decisions between
different carbon mitigation strategies. The literature was reviewed for available
methods and methodologies to estimate such potentials, which guided the research
design of this study: given that little secondary data was available in the hospital
context, affecting also the viability of simulation-based approaches, a measurement-
based methodology was applied in this study (chapter 3). This chapter will now
proceed to discussing relevant studies taking a socio-technical or ‘social practices’
view on saving energy in work places.
2.3 Saving energy at work as social practice
In contrast to traditions of thought focusing on individuals and their choices, so-
cially orientated perspectives common in sociology, education sciences and science
and technology studies, reflect that energy demand occurs as a result of social or-
ganisation and the structures established to provide energy services. While indi-
vidualist perspectives have long been dominant in the built environment, sustainab-
ility research agendas increasingly recognise the need to include more complex and
system-orientated notions of human interaction with buildings and infrastructure
(Summerfield and Lowe, 2012). This section presents a selection of important em-
pirical socio-technical studies on energy demand in buildings (section 2.3.1) before
proceeding to introducing social practice theory and a number of empirical studies
undertaken within this framework (section 2.3.2).
2.3.1 Empirical socio-technical research on energy demand in
buildings
Empirical research is crucial for evidence-based policy as well as for the test and
refinement of theories (Summerfield and Lowe, 2012). Currently there are still few
data-driven socio-technical studies available in built environment research, while
new insights are constantly emerging - especially in dwellings (Chiu et al., 2014). It
therefore seems important to briefly review applied socio-technical studies in other
areas in order to gain insight into value and implementation of such approaches. This
section hence introduces a number of important empirical studies of socio-technical
systems generally.
41

2 Literature review: Occupant influence on non-domestic energy use
The concept of socio-technical systems was initially operationalized for the empir-
ical analysis of real-world situations by Trist and Bamforth (1951) in their seminal
study on social and psychological consequences of different coal mining methods.
Based on data gathered in repeated discussions with expert groups and long in-
terviews with miners as well as managers, Trist illustrates how scale and spatio-
temporal structure of the three shift cycle for longwall coal-getting negatively im-
pacts on worker morale and productivity. Suggestions for changes in social organ-
isation7 which had previously been overlooked emerged from this analysis approach.
More recently, Schatzki’s account of the Shaker8 medical herb business again poin-
ted towards the relation between activity and site (Schatzki, 2002). In a historic case
study used to illustrate the author’s theory of what defines social life, Schatzki draws
out how the activities of collecting, chopping and drying medical herbs are inter-
twined with both the physical arrangements of the Shaker villages as well as the
social order of the Shaker society including their religious convictions and a strong
sense of community. Amongst others, the case study exemplifies Schatzki’s concept
of spatial prefiguration according to which a site prefigures the path of an activity
taken which in turn shapes the site. This concept of prefiguration seems crucial also
in the analysis of energy consumption in buildings.
From a different perspective, the PROBE studies undertaken primarily in office
buildings9 (Bordass et al., 2001) and other examples of commercial post-occupancy
evaluation (POE) (Baird, 2010; Preiser and Vischer, 2005) have contributed hugely
to a socio-technical understanding of building energy use and occupant satisfaction.
The focus of such studies is however often to understand and benchmark the phys-
ical and energy performance of buildings. Data from occupants is mostly collected
through standardized survey instruments, somehow limiting the scope to reflect on
contextual variables (Chiu et al., 2014). More recently, Gul and Patidar (2015) in-
clude semi-structured interviews with facilities personnel as well as some ordinary
building occupants in their POE of a multi-purpose university building. This helps
them to uncover potential changes to timer settings of automated HVAC systems,
suggesting that especially in complex buildings with a mixed use of space such flex-
ibility is invaluable.
7 such as developing a formal small-group organization on the filling shift or an acceptable solutionfor authorities on the cutting shift
8 The Shaker were a religious community in the 19th century in the US. They were characterisedby a communal lifestyle, pacifism, the celibate and a model of equality of the sexes as well astheir simple living, architecture, and furniture.
9 PROBE included the analysis of a small medical centre containing doctors’ and dentists’ surgeries.
42

2 Literature review: Occupant influence on non-domestic energy use
2.3.2 Social practice based studies on building energy use
A number of theories and frameworks have been proposed to facilitate the socio-
technical analysis of increasingly complex and multidisciplinary research questions.
The multi-level perspective (MLP) investigates change by including three different
socio-technical scales and has been influential in investigating societal transitions
(Geels and Schot, 2007). Further, ‘energy cultures’ aims to help identify opportun-
ities for behaviour change by taking a culture-based approach to behaviour which
also draws from lifestyles and systems thinking (Stephenson et al., 2010). In the
(UK) built environment research community, social practice theory has increasingly
gained academic and policy attention (Chatterton, 2011), partly due to its poten-
tial to integrate technical data on building and energy performance with qualitative
explorations of social or cultural components of everyday life (Foulds et al., 2013).
2.3.2.1 Introduction to social practice theory
A theory of social practice was originally developed in the late 1970s by the Brit-
ish sociologist Anthony Giddens. Over the last two decades, Elizabeth Shove from
Lancaster University has further developed social practice theory (SPT) in relation
to sustainability and energy consumption. Fundamentally, SPT aims to ‘transcend
the dualism of structure and agency (Shove et al., 2012, p.3)’ by proposing social
practices as elements ‘shaping society and human doings over space and time’. To
understand the influence of occupants on building energy use, research may hence
focus neither on the individual occupant nor on the cultural and material arrange-
ments of organisations and buildings alone, but on collective indoor climate and
equipment practices.
According to Shove et al. (2012), practices are routinised activities that occur
repeatedly in a very similar form in different places and moments. They represent
broad cultural entities that shape an individual’s perceptions, interpretations and
actions within the world (Hargreaves, 2011). Cohn (2014) points out that ‘everyday
practices are always locally situated and composite’ while they have no absolute
delimitation. Similar to the definition of a system in engineering, the boundaries
of what is understood to constitute a certain social practice will depend on the re-
search question as ‘it is perhaps impossible and even undesirable to try and identify
when exactly an action starts and when it ends, or the extent to which one action
is distinct from another’ (Cohn, 2014, p.160). Used skilfully, social practices can
therefore represent a useful analytical framework to disentangle a range of different
questions associated with a move towards a more sustainable built environment.
43
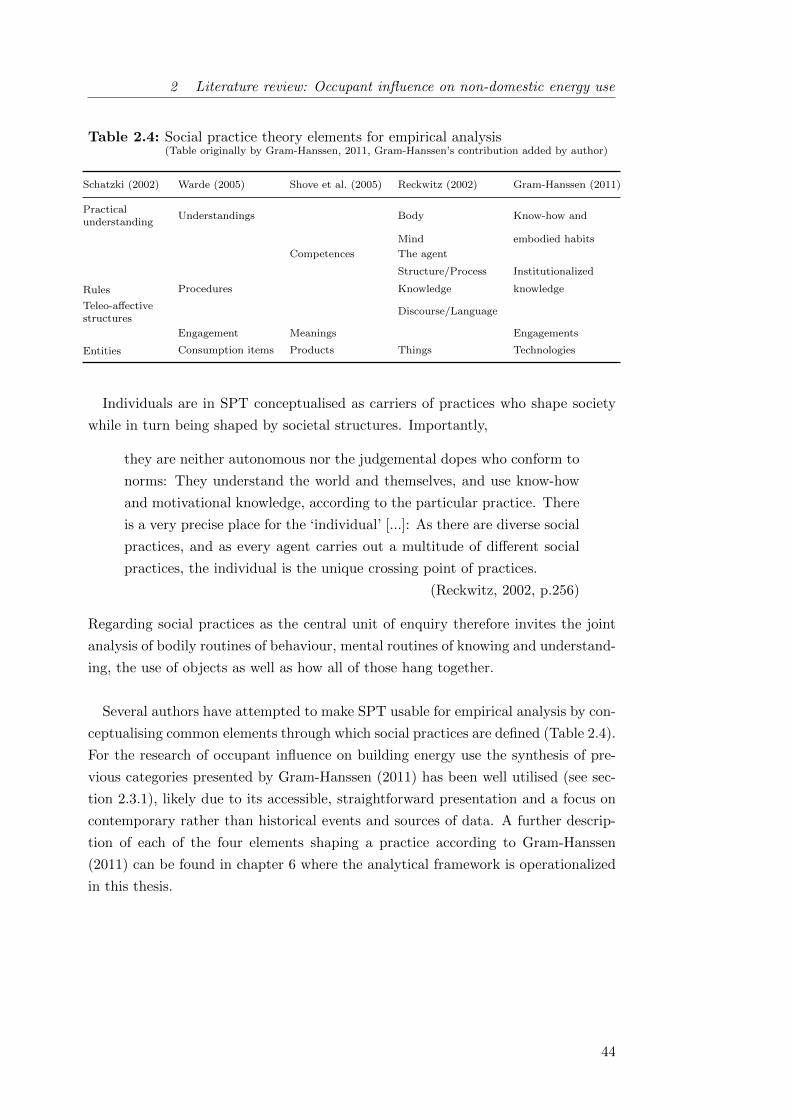
2 Literature review: Occupant influence on non-domestic energy use
Table 2.4: Social practice theory elements for empirical analysis(Table originally by Gram-Hanssen, 2011, Gram-Hanssen’s contribution added by author)
Schatzki (2002) Warde (2005) Shove et al. (2005) Reckwitz (2002) Gram-Hanssen (2011)
Practicalunderstanding
Understandings Body Know-how and
Mind embodied habits
Competences The agent
Structure/Process Institutionalized
Rules Procedures Knowledge knowledge
Teleo-affectivestructures
Discourse/Language
Engagement Meanings Engagements
Entities Consumption items Products Things Technologies
Individuals are in SPT conceptualised as carriers of practices who shape society
while in turn being shaped by societal structures. Importantly,
they are neither autonomous nor the judgemental dopes who conform to
norms: They understand the world and themselves, and use know-how
and motivational knowledge, according to the particular practice. There
is a very precise place for the ‘individual’ [...]: As there are diverse social
practices, and as every agent carries out a multitude of different social
practices, the individual is the unique crossing point of practices.
(Reckwitz, 2002, p.256)
Regarding social practices as the central unit of enquiry therefore invites the joint
analysis of bodily routines of behaviour, mental routines of knowing and understand-
ing, the use of objects as well as how all of those hang together.
Several authors have attempted to make SPT usable for empirical analysis by con-
ceptualising common elements through which social practices are defined (Table 2.4).
For the research of occupant influence on building energy use the synthesis of pre-
vious categories presented by Gram-Hanssen (2011) has been well utilised (see sec-
tion 2.3.1), likely due to its accessible, straightforward presentation and a focus on
contemporary rather than historical events and sources of data. A further descrip-
tion of each of the four elements shaping a practice according to Gram-Hanssen
(2011) can be found in chapter 6 where the analytical framework is operationalized
in this thesis.
44

2 Literature review: Occupant influence on non-domestic energy use
Social practice theory has been criticised for its strong focus on routines and
elements holding practices together, implying that a practices lens may be somehow
limited in understanding how change can happen (Warde, 2005; Gram-Hanssen,
2011). A number of directions for further development have been proposed, below a
list of those voiced in particular by researchers utilising SPT for empirical analysis:
• Instead of focusing on single practices, more attention should be paid to con-
nections, alliances and conflicts between practices (Hargreaves, 2011). This
in line with Gram-Hanssen’s proposition that different practices might share
elements, implying that changes in one practice may help to induce changes in
another (Gram-Hanssen, 2011).
• Hargreaves also suggests further inquiry into how practitioners are being re-
cruited into a practice and how this affects their (social) identities. Placing
a higher focus on practitioners appears to starkly contrast understandings of
SPT which strictly focus on the practice as suggested for example by Shove,
but may offer additional insights relevant to change-making by taking account
of social and power relations.
• Palm and Darby (2014) propose to explore how practice theory connects to
different aspects of learning and how feedback processes, for example through
post-occupancy evaluation (POE), may bring about change. The importance
of POE in closing feedback loops for building design and operation is increas-
ingly recognised (Leaman et al., 2010) and synergies with practice based in-
vestigations could mutually increase insights.
As it stands, SPT continues to evolve and can be expected to make further contri-
butions to our understanding of human action in the built environment.
45
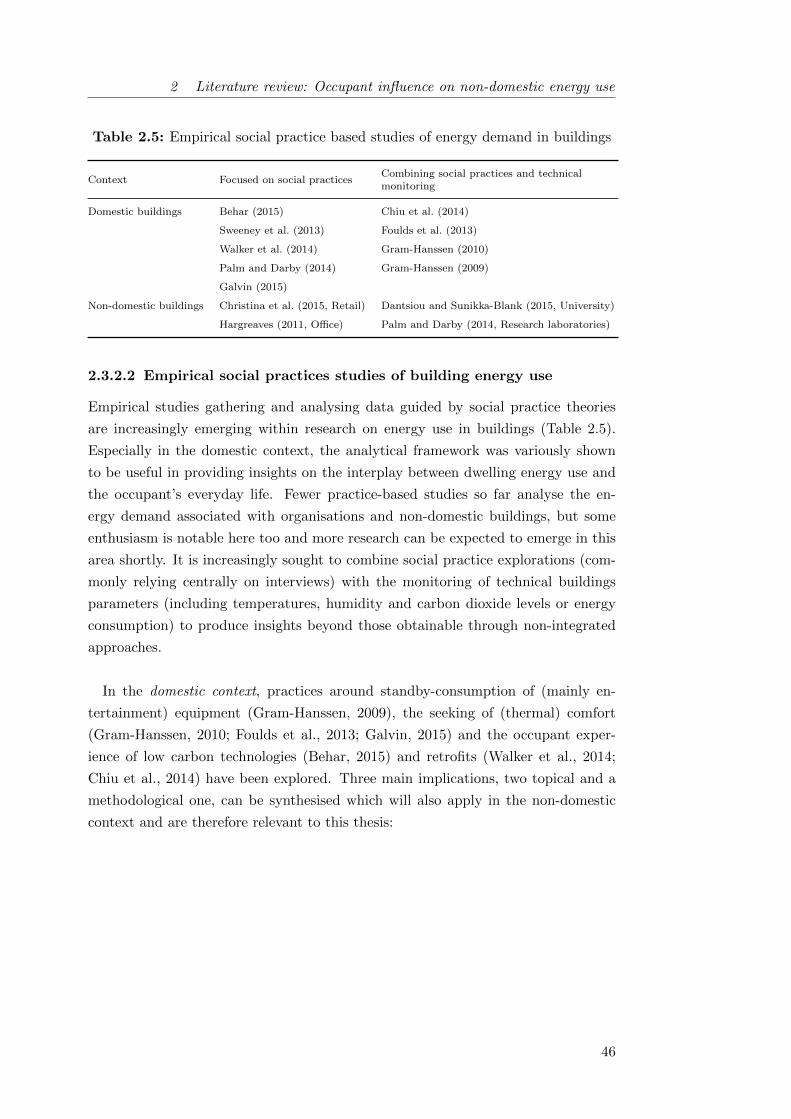
2 Literature review: Occupant influence on non-domestic energy use
Table 2.5: Empirical social practice based studies of energy demand in buildings
Context Focused on social practicesCombining social practices and technicalmonitoring
Domestic buildings Behar (2015) Chiu et al. (2014)
Sweeney et al. (2013) Foulds et al. (2013)
Walker et al. (2014) Gram-Hanssen (2010)
Palm and Darby (2014) Gram-Hanssen (2009)
Galvin (2015)
Non-domestic buildings Christina et al. (2015, Retail) Dantsiou and Sunikka-Blank (2015, University)
Hargreaves (2011, Office) Palm and Darby (2014, Research laboratories)
2.3.2.2 Empirical social practices studies of building energy use
Empirical studies gathering and analysing data guided by social practice theories
are increasingly emerging within research on energy use in buildings (Table 2.5).
Especially in the domestic context, the analytical framework was variously shown
to be useful in providing insights on the interplay between dwelling energy use and
the occupant’s everyday life. Fewer practice-based studies so far analyse the en-
ergy demand associated with organisations and non-domestic buildings, but some
enthusiasm is notable here too and more research can be expected to emerge in this
area shortly. It is increasingly sought to combine social practice explorations (com-
monly relying centrally on interviews) with the monitoring of technical buildings
parameters (including temperatures, humidity and carbon dioxide levels or energy
consumption) to produce insights beyond those obtainable through non-integrated
approaches.
In the domestic context, practices around standby-consumption of (mainly en-
tertainment) equipment (Gram-Hanssen, 2009), the seeking of (thermal) comfort
(Gram-Hanssen, 2010; Foulds et al., 2013; Galvin, 2015) and the occupant exper-
ience of low carbon technologies (Behar, 2015) and retrofits (Walker et al., 2014;
Chiu et al., 2014) have been explored. Three main implications, two topical and a
methodological one, can be synthesised which will also apply in the non-domestic
context and are therefore relevant to this thesis:
46

2 Literature review: Occupant influence on non-domestic energy use
• Temporal organisation of daily life: Attention needs to be paid to the
temporal organisation of daily life, appreciating expectations of ‘convenience’
and ‘speed’ associated with routines as well as when may be a reasonable
moment to instigate change. Hand-overs were found to traditionally clash with
busy periods in residents’ lives (while trying to make themselves at home in new
dwellings or post-retrofit), suggesting repeated inductions at a later time may
be more promising in making low-carbon technologies work in practice (Behar,
2015). Practices associated with low energy demand were found more likely to
be taken up if they proved convenient with respect to achieving practice goals
or saved time, such as showering versus bathing in the attempt to achieve
cleanliness (Walker et al., 2014).
• Complementing material changes with knowledge and engagement:
Evidence is increasingly emerging that established practices will not neces-
sarily change or be replaced with changes in technology and the material en-
vironment. Pre-retrofit heating, cooling and ventilation practices often per-
sisted, albeit with differing intensities, following retrofits (Chiu et al., 2014)
or relocations to a new home (Behar, 2015). This contradicts earlier findings
where changes of habits were found to often occur together with technolo-
gical rearrangements (Gram-Hanssen, 2009). In contrast, all studies agree that
changes in knowledge and motivation, potentially complementary to techno-
logical rearrangements, were also crucial. So while technological rearrange-
ments may seem like a straightforward and hence potentially attractive route
to change, their role may not be overestimated and it would appear important
to also focus on aspects of knowledge and especially engagements.
• Post-rationalisation of habits: Several studies have found that people,
if pressed during interviews, would explain their habits to make them seem
rational (Gram-Hanssen, 2010) or by repeating what deemed ‘experts’ had
been saying (Foulds et al., 2013). Mismatches between stated practices and
monitoring were occasionally identified, casting doubt on the robustness of
findings. Hitchings (2012) argues that people can be helped to talk about
habitual and seemingly mundane everyday practices by undertaking serial in-
terviews to build rapport or by carefully tabling alternative ways of behaving
to explore own routines among a range of others without feeling ridiculed or
stigmatized. The work by Foulds et al. (2013) suggests that subtly probing
householders in the context of findings from technical monitoring may also
help to ascertain how a household actually uses the dwelling, but potentially
only if a good relationship between occupants and researchers has previously
been established.
47

2 Literature review: Occupant influence on non-domestic energy use
Most studies within non-domestic buildings were undertaken within the context
of behaviour change interventions of some form, identifying what had worked and
what not and providing suggestions on or even assisting with the implementation of
improvements. It seemed overall that researching energy practices in a work context
adds additional complexity as opposed to studies looking at dwellings. The time
and effort required to carry out such studies is one likely reason why they have so
far primarily been restricted to PhD projects which tend to operate on longer time
frames than many other research projects within current funding arrangements (see
Appendix B.1 for a summary of relevant studies).
One study of particular importance to this work conducts a social practices based
case study investigation in four 24-hour research laboratories (Palm and Darby,
2014). Out of the above settings, continuously operating research laboratories can
be expected to match the context and the challenges of hospitals most closely. The
study uncovers issues with ‘the meaning of a 24-hour building (p.80)’ resulting from a
lack of critical engagement with questions like ‘How much provision for 24-hour work
is really needed, and how can it be provided most effectively (p.89)?’ or ’What does
scientific activity mean in the 21st century (p.89)?’. Based on secondary data from
an energy audit, Palm and Darby further highlight that notions of energy wastage,
for example from night-time lighting, do not correspond to the actual make-up of
the laboratories’ base-loads. They hence stress that building energy management
requires the understanding of factors that are both physical and social.
It is notable that all of the above studies in non-domestic buildings stress aspects
of organisational culture and rules while this element (which Gram-Hanssen, 2011,
describes as ‘Institutionalised knowledge’) featured somehow less prominently in the
domestic context. This resonates with notions within psychology pointing towards
social norms as additional lever to reduce workplace as opposed to household energy
use. In contrast, there appears to be less certainty about the role of technology as
agent to change energy practices in the workplace. The findings do however suggest
that infrastructure or installations of poor quality may hinder low carbon practices
(as well as employee well-being and productivity), in line with findings from Walker
et al. (2014) and Chiu et al. (2014) in the domestic context.
48
2 Literature review: Occupant influence on non-domestic energy use
2.3.3 Section summary and implications for this study
Socially orientated schools of thought reflect that energy demand occurs as a result
of social organisation and the structures established to provide energy services. The
empirical analysis of such arrangements requires socio-technical approaches in order
to appreciate the relevance of both physical and social factors. One theory aiming
to describe the interactions between these factors is social practices theory. Within
built environment research, Gram-Hanssen (2011)’s framework for the analysis of
social practices has proven helpful and will therefore also be applied in this study.
Empirical socio-technical studies highlight that service requirements and the res-
ulting energy demands are complex and intertwined, in particular in non-domestic
buildings. Awareness campaigns, energy competitions and other simplistic attempts
at changing energy-related practices, be it of householders or of employees, are un-
derstood to have limited success because engagements, routines and knowledge issues
are not considered. It is recommended that increased attention is also directed to-
wards the definition of services themselves, questioning operating hours, temperature
preferences and space requirements. It is finally pointed out that while technology
can be helpful in reducing energy demand, this is not deterministic and faulty or
poorly defined technology can impact on occupant comfort and satisfaction while
adversely affecting carbon emissions.
2.4 Summary of evidence from the literature
This literature review suggests that staff-centred energy conservation initiatives in
hospitals may achieve energy and cost savings while potentially also benefiting pa-
tient outcomes. The academic work investigating occupant influences on hospital
energy use is however very limited and further research focusing on energy consump-
tions and cultural elements relevant in health care seems beneficial. The opinions
on the viability of behaviour and other simple operational changes are further di-
vided, with many scholars reflecting critically on the scope of such initiatives in the
sensitive hospital context as well as on practical and ethical issues associated with
attempts to place responsibility for organisational energy use on the shoulders of
individual employees.
49

2 Literature review: Occupant influence on non-domestic energy use
Energy managers within the NHS and other organisations encountered over the
course of this study10 did, however, argue a number of practical reasons why they
may decide to pursue behaviour and other simple operational change initiatives as
part of carbon mitigation strategies:
• The budget available to energy efficiency measures may be limited due to
an organisation’s financial status, its priorities and the availability of funding
mechanisms for larger capital projects.
• The time frame within which energy demand reductions can be achieved may
be short because the organisation is due to relocate or undergo other forms of
restructuring.
• In tenanted spaces, the control of physical parameters may be outside of an
organisation’s control.
Pragmatically, a further exploration of staff engagement and other strategies of
simple operational changes hence seemed justified in hospitals, while taking account
of socially orientated and socio-technical concerns. A framework is presented which
will support the conceptualisation of potential changes in clinical routines through-
out the remainder of this study (section 2.4.1), aiming to broaden the remit of
staff-centred energy conservation initiatives in organisations. At an applied level, a
number of open questions are summarized in section 2.4.2.
2.4.1 Conceptual Framework
World-views and the resulting assumptions of people, their actions and the degree to
which those actions are structured and prescribed by the context vary between aca-
demic disciplines. While individualist understandings, typical for (micro-)economic
and psychological theories, focus on individual occupants as centre of energy conser-
vation initiatives in buildings, socially orientated theories, common in sociology or
science and technology studies, reflect that energy demand also results from social
constructions and the systems providing energy services. Social practices theory
(focusing on collective practices which shape an individual’s perceptions, interpret-
ations and actions within the world) has been proposed as an analytical framework
aiming to bridge the gap between structure and agency (Shove et al., 2012) and has
been well utilised for the research of occupant influence on building energy demand.
10 mainly during the survey study published in Morgenstern et al. (2015a) as well as in networkinginteractions
50

2 Literature review: Occupant influence on non-domestic energy use
Figure 2.4: Conceptual framework of conceivable energy-related operationalchanges in organisations
Importantly, all theories represent abstracted ways of understanding while none
fully reflect reality. Different theories can therefore offer different insights on the
interplay of occupants and non-domestic buildings, i.e. the service infrastructure
they provide. In response, pragmatic approaches combining models and methods
in service to increasingly complex and multi-dimensional research questions are in-
creasingly emerging (Morgan, 2007, see also section 3.2). The use of multiple-model
approaches to compare and contrast findings generated through different lenses has
also been advocated at a practical and policy level (Chatterton, 2011).
51
2 Literature review: Occupant influence on non-domestic energy use
Accordingly, it was found useful to distinguish three levels of operational change
conceivable in hospital departments (Figure 2.4). Each level of change may achieve
some reductions in building energy use. The three levels differ in complexity and
how strongly they focus on the behaviour of individuals as opposed to changes in
social and physical arrangements and can be expected to apply equally in other non-
domestic building types. More complex changes may often be associated with longer
implementation time-scales owing the need for (infra-)structural changes. Simple
changes may, in contrast, not deliver the required reductions in carbon emissions
while potentially overlooking synergies with improvement attempts in other areas
(such as public health). By bringing together the different levels of change (albeit
inevitably very simplified) in one conceptual framework, it is hoped to illustrate a
wider range of options to those researching and especially those designing practical
interventions to reduce non-domestic building energy use.
2.4.2 Gaps in knowledge: Occupant influence on hospital energy
use
In the past, a number of staff-centred energy conservation initiatives have been car-
ried out in hospitals, generally claiming to achieve reductions in total energy use
between 5% and 20% (Table 2.6). These reported reduction estimates are (although
associated with some uncertainty) roughly in line with relative effect sizes repor-
ted in the academic literature for offices and university buildings, while exceeding
them in absolute terms due to the energy intensity of hospital buildings. A recent
survey study by this author further suggested that facilities and energy managers
in a majority of NHS Trusts in England are currently implementing or planning to
implement some form of staff-centred energy conservation initiative (Morgenstern
et al., 2015a), justifying further explorations in this area.
Many open questions remain within the psychological11 and sociological12 arena.
This literature review, however, also highlights several themes which would benefit
from technical insight, the primary skill set of this thesis’ author:
11 For example: What is the best way to engage busy hospital staff with sustainability issues andkeep them engaged in the long term?; Can a transfer of energy behaviours between home andworkplace be a motivator?; What about staff who are disinterested or cynical about climatechange?
12 For example: How can attempts at energy demand reduction in hospitals (be made to) overlapwith the sustainable provision of health (care) to ageing populations?; How can technologybe employed to instigate changes in current energy practices in workplaces?; How can socialpractices theories be further developed and improved for the empirical analysis of organisationalbuilding energy use?
52

2 Literature review: Occupant influence on non-domestic energy use
Table 2.6: Reported energy savings from clinical staff engagement in hospitalsPlease note the limited comparability of the reported savings due to differences in interventiontype, programme duration as well as available detail on evaluation methodologies.
Type Source Reported energy savings
Case reports Somerset Health Authority, UK (BRECSU 1992a) 5% of total fuel bill
Operation TLC, UK (Barts Health NHS Trust, 2013) 7% of electricity
Operation TLC, Canada (Cowan, 2013) 10-20% of energy
Re-Co project, Austria (Benke, 2012) Potential: 10-15% of total fuel bill
Guidelines NHS SDU MAC curves (SDU 2010) 3% for electricity, 3% for heating
Carbon Trust (2010, based on NHS CarbonManagement programme)
10% total energy
• Theoretical energy savings potentials: Theoretical energy savings poten-
tials are calculated potentials representing energy savings achievable through
an ideal intervention while disregarding practical considerations and constraints
which may affect implementation. Studies within social and environmental
psychology argue that the estimation of such potentials is crucial for two reas-
ons:
– Firstly, estimating savings potentials allows for the selection of environ-
mentally significant behaviours and practices to be targeted in change
initiatives, thereby ensuring that impacts on energy costs and carbon
emissions may be substantial and justify the undertaking of an initiative
(Stern et al., 1997; Gatersleben et al., 2002; Matthies et al., 2011).
– Secondly, knowledge on theoretically achievable savings helps evaluation
by allowing insights on how much of this potential could actually be
tapped by an intervention (Matthies et al., 2011). For comparisons of
initiatives across different buildings and organisations, a metric taking
account of the achieved savings in the context of projected savings seems
a more meaningful indicator of success than reporting achieved savings
only.
53

2 Literature review: Occupant influence on non-domestic energy use
• Understanding hospital energy use: The careful selection of targeted be-
haviours and/or practices on the basis of theoretical energy savings potentials
is hence crucial for achieving operational reductions in hospital energy use (be
it through behaviour change campaigns or re-arrangements at a physical, social
or organisational level). Background to this study (section 1.1) and literature
review, however, suggest that the understanding of hospital energy use at a
sub-building level is currently fairly limited. The gap between clinicians us-
ing building and (medical) equipment and building operators looms large and
little is known about how area characteristics impact on energy use. Further
research explicitly linking energy use to the respective hospital departments
and their activities therefore seems recommended.
• Evaluation in complex buildings: Due to the complexity of building ser-
vices and appliance use in hospitals, it is very difficult to measure and attribute
changes in energy use to behavioural initiatives even in hospitals with above-
average sub-metering. Nevertheless, this is commonly attempted especially in
consultancy where pressures to present actual savings are high. Further re-
search would be beneficial to establish whether it is at all realistic to place
individual energy behaviours reliably within the context of total hospital en-
ergy use, and if so how this may be achieved (see also Morgenstern et al.,
2014).
• Engagement in clinical areas: Survey findings and much anecdotal evid-
ence related by hospital engineers and other practitioners in health suggest
large differences in achievable energy savings from operational measures across
heterogeneous hospital estates13. Apart from applied intervention means and
the type of promoted changes, this appears to be due to a number of factors
including process, building characteristics and staffing pressures. The relev-
ance of each of these factors and their interplay, however, have so far not been
comprehensively analysed and would merit further investigation.
13 This theme of heterogeneity was repeatedly encountered in numerous conversations and contextsthroughout this study. The evidence remains anecdotal, but the recurrence of the theme seemedto highlight its importance. To give but two examples, the author took part in evaluatoryaudits of ‘Operation TLC’ at Barts Health and NUS’s Green Impact Programme at UniversityHospital Bristol. Both initiatives observed higher engagement with their campaigns outside ofward areas. This impression was substantiated through the analysis of metered electricity dataat Barts’ Royal London Hospital (RLH) where higher energy savings were achieved in day-clinicsand administrative areas, while many wards could achieve no savings at all.
54
2 Literature review: Occupant influence on non-domestic energy use
On the whole, it appears evident that many staff engagement initiatives in hos-
pitals are currently not sufficiently linked to this particular type of building and
its function. It is in this vein that this study seeks to make its contribution by
providing detailed insight into the energy use of different hospital building parts
and processes while appreciating the working realities of clinical staff. The research
question, aim and objective as well as the study methodology are laid out in the
following chapter 3.
55


3 Study Methodology
This chapter defines the main areas of investigation of this research and lays out epi-
stemological considerations resulting from domain, nature and scope of the research
subject. Various possible research designs are explored and a rationale for the se-
lected multiple case mixed-method study design is presented. Following this,
details are provided on data collection methods and analysis approach. The study
has been approved by the UCL Research Ethics Committee (Project ID: 5434/001),
details on the ethics process can be found in Appendix C.3.
3.1 Research aim and objectives . . . . . . . . . . . . . . . . . . . . . . . 58
3.2 Commitment to pragmatism . . . . . . . . . . . . . . . . . . . . . . . 59
3.3 Research design: Multiple case studies . . . . . . . . . . . . . . . . . 61
3.3.1 Rationale for a case study design . . . . . . . . . . . . . . . . 61
3.3.2 The case studies . . . . . . . . . . . . . . . . . . . . . . . . . 63
3.4 Research methods: A mixed-methods approach . . . . . . . . . . . . 65
3.4.1 Rationale for using mixed-methods . . . . . . . . . . . . . . . 65
3.4.2 Quantitative data collection methods . . . . . . . . . . . . . . 67
3.4.2.1 Departmental electricity data . . . . . . . . . . . . . 68
3.4.2.2 Lighting and appliances audit . . . . . . . . . . . . 69
3.4.2.3 Additional quantitative data collection methods . . 74
3.4.3 Qualitative data collection methods . . . . . . . . . . . . . . 76
3.4.3.1 Semi-structured interviews with clinical staff . . . . 76
3.4.3.2 Other qualitative data collection methods . . . . . . 80
3.5 Data analysis . . . . . . . . . . . . . . . . . . . . . . . . . . . . . . . 81
3.5.1 Quantitative strand: Representing departmental electricity use 81
3.5.1.1 Top-down analysis of electricity use . . . . . . . . . 81
3.5.1.2 Bottom-up representations based on audit data . . . 82
3.5.1.3 Assessing theoretical savings potentials . . . . . . . 82
3.5.2 Qualitative strand: Contextualising potential changes . . . . 85
3.6 Summary of the study methodology . . . . . . . . . . . . . . . . . . 86
3 Study Methodology
3.1 Research aim and objectives
Literature review and survey study (see chapter 2 and Morgenstern et al., 2015a)
suggested that staff-centred energy conservation initiatives could be part of carbon
reduction strategies in hospitals in the future. Current assumptions of their poten-
tial, however, seemed rather optimistic and more importantly rather undifferentiated
with respect to operational characteristics. Going forward, it seems advisable to as-
sess behavioural energy conservation initiatives more closely related to the physical
context of the respective hospital building and its service infrastructure as well as
the health care processes relevant in different departments. To address this gap in
knowledge, this PhD thesis proposes the following research question (as outlined
earlier in section 1.2):
To what extent can clinical staff influence electricity use in different hos-
pital buildings and departmental processes and what is their potential
role in its reduction?
More specifically, the research addresses the following objectives through the ana-
lysis of multiple case studies:
(i) Establish the theoretical maximum electricity savings potential from simple
changes in the way different hospital departments are being used by occupants,
principally clinical staff;
(ii) Unpick the governing constraints on energy demand reduction in the complex
socio-technical systems that hospital departments constitute;
(iii) Suggest a process to evaluate the relevance of behaviour and other simple
operational changes as tools for carbon mitigation in hospitals; and finally
(iv) Contribute to the concept of a socio-technical energy conservation potential
while discussing scope and limitations of socio-technical methods for research
in the built environment.
The hypothesis of the study is that the theoretical extent of staff influence on
local electricity use (not taking into account constraints) will depend on infrastruc-
tural arrangements (such as control interfaces for building services) and the nature
of departmental processes (defining electricity requirements and operating hours).
Two basic indicators are initially proposed to capture these concepts:
1. Local control: The extent to which electricity demands can be influenced locally
by clinical staff as opposed to being defined elsewhere (for example centrally
through facilities management) or through other actors (for example auto-
mated sensors or other stakeholders).
58
3 Study Methodology
2. Time not in use: The extent of after-hours or hours with reduced service
requirements allowing for a lower electricity demand.
It is thought that more local control and more time not in use will theoretically in-
crease clinical staff influence on local electricity use. Constraints on the theoretical
influence are then assessed using an empirical social practices framework (Gram-
Hanssen, 2013a).
The thesis adopts a multiple case study approach due to the exploratory nature
of the research question outlined above. A mixed-method study design is further
considered most appropriate due to its effectiveness in handling both quantitative
and qualitative inquiries and its flexibility in integrating their various research in-
struments. The research design and the application of the mixed-method approach
are outlined subsequently and a description of each of the research instruments
employed (electricity monitoring, lighting and appliance audit and semi-structured
interviews) is given.
3.2 Commitment to pragmatism
Research within the field of the built environment has traditionally been dominated
by engineering and the natural sciences (Schweber and Leiringer, 2012). During
the last years, however, energy conservation has become an important focus and
the research agenda has expanded to include the role of building occupants and
their interaction with the buildings. Epistemological, ontological, methodological
and ethical debates traditionally championed by the social sciences have therefore
become important within built environment research.
This study considers itself within a pragmatic research tradition (see Table 3.1
for a simplified overview of major paradigms, i.e. basic belief systems). According
to C.S. Peirce, one of the early scholars influential in developing pragmatic ideas,
pragmatism holds that the meaning of any statement lies in its impact on experi-
ence. Empirical research into the practical bearings of ideas is therefore crucial in
the creation of knowledge. According to Tashakkori and Teddlie (1998, p.22), prag-
matism consequently values the posed research questions higher than specific beliefs
or methodologies.
59

3 Study Methodology
Pragmatic beliefs were shown to be useful in empirical real-world research, espe-
cially when both social and technical phenomena are investigated within the same
study (Robson, 2011). There are however challenges associated with pragmatic
approaches, which can build on less foundations than more established research tra-
ditions and may lack well-defined protocols. Pragmatic research further requires the
mastering of a much wider range of theoretical positions and data collection and
analysis approaches, which may present a threat to research quality. Actions to
ensure the quality of both the gathered evidence and its interpretation must hence
be carefully considered across all steps of the research process.
Table 3.1: Brief overview of major paradigms1
Element Positivism Interpretivism Pragmatism
OntologyWhat exists?
Social phenomena and theirmeanings have an existencethat is independent of socialactors.
Social phenomena andtheir meanings arecontinually beingaccomplished by socialactors.
Social phenomena have anindependent existence buttheir meanings arecontinually beingaccomplished by socialactors.
EpistemologyWhat constitutesvalid knowledge?
Clear distinction betweenscientific (confirmable bysenses) and normativestatements (truth not reallyestablishable, thereforeconsidered irrelevant).
There is a differencebetween people and theobjects of the naturalsciences. Social actionshave subjective meaningswhich are relevant.
Depending on the researchquestion, both objectiveand subjective views maywork in practice and aretherefore relevant.
MethodologyHow can the realbe examined?
Primarily quantitativeapproaches
Primarily qualitativeapproaches
Mixed-methodologies
At a methodological level, Morgan (2007) has pointed out three characteristics
placing the pragmatic approach between qualitative and quantitative approaches:
• Relationship to research process: Pragmatism sees no problem with as-
serting both that there is a single ‘real world’ and that all individuals have
their own unique interpretations of that world. In this study, this dualism is
reflected in particular with respect to the buildings and the control interfaces
they provide for occupants and how those are contrasted by the individuals’
perceptions on their control over building services.
1 There is little agreement between authors especially from different disciplinary backgrounds onterminology and the precise principles encompassed in different paradigms. The informationpresented here has largely been adapted from Bryman (2007), Bryman (2012) and Creswell(2009) while other sources may offer different interpretations.
60

3 Study Methodology
• Inference from data: Morgan (2007) advocates the transferability of re-
search results based on the investigation of the factors that affect whether the
knowledge gained in one context can be transferred to other settings. Here,
such pragmatic focus was the basis of the research question aiming to identify
factors across different hospital buildings and processes.
• Connection of theory and data: Instead of being purely inductive or de-
ductive, the pragmatic approach acknowledges the movement back and forth
between both modes of reasoning when converting observations into theory
and assessing those theories through action. In this study, such abductive lo-
gic is employed both through the mixed-methods research design and in the
actual research process carried out in a real-world setting.
3.3 Research design: Multiple case studies
3.3.1 Rationale for a case study design
Yin (2003) suggests that the choice of an appropriate research design needs to be
guided by the type of research question posed, the extent of control an investigator
has over actual behavioural events, and the degree of focus on contemporary as
opposed to historical events. This study is concerned with exploring the interplay
between hospital staff and their department’s energy use, asking ‘how’ influential
staff are with respect to departmental energy use and ‘why (not)’ they may be able
to enact energy savings. It is focused on contemporary events over which the invest-
igator has no control. As typical for building-performance studies, it is sought ‘to
expose and reveal contexts rather than controlling for them’ (Leaman et al., 2010,
p.571).
A case study design consequently seems appropriate over archival analysis, sur-
veys or experimental designs. This decision is further favoured by the novelty of
the research subject, making the investigation exploratory in nature as opposed to
theory testing (Creswell, 2009) while the currently available evidence is considered
too thin for more quantitative survey-based approaches. Finally, case studies designs
enable the researcher to deal with large amounts of data emerging through different
methods, as required to master the complexity of research questions in real-world
situations (Leaman et al., 2010).
61
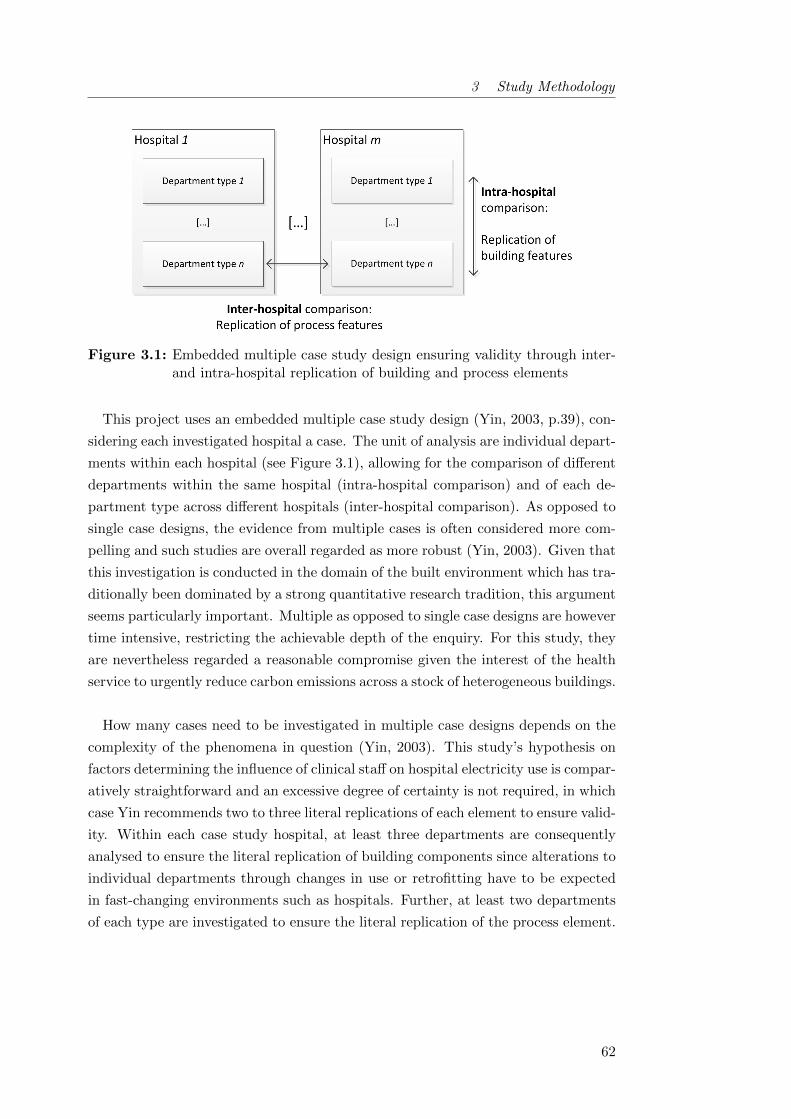
3 Study Methodology
Figure 3.1: Embedded multiple case study design ensuring validity through inter-and intra-hospital replication of building and process elements
This project uses an embedded multiple case study design (Yin, 2003, p.39), con-
sidering each investigated hospital a case. The unit of analysis are individual depart-
ments within each hospital (see Figure 3.1), allowing for the comparison of different
departments within the same hospital (intra-hospital comparison) and of each de-
partment type across different hospitals (inter-hospital comparison). As opposed to
single case designs, the evidence from multiple cases is often considered more com-
pelling and such studies are overall regarded as more robust (Yin, 2003). Given that
this investigation is conducted in the domain of the built environment which has tra-
ditionally been dominated by a strong quantitative research tradition, this argument
seems particularly important. Multiple as opposed to single case designs are however
time intensive, restricting the achievable depth of the enquiry. For this study, they
are nevertheless regarded a reasonable compromise given the interest of the health
service to urgently reduce carbon emissions across a stock of heterogeneous buildings.
How many cases need to be investigated in multiple case designs depends on the
complexity of the phenomena in question (Yin, 2003). This study’s hypothesis on
factors determining the influence of clinical staff on hospital electricity use is compar-
atively straightforward and an excessive degree of certainty is not required, in which
case Yin recommends two to three literal replications of each element to ensure valid-
ity. Within each case study hospital, at least three departments are consequently
analysed to ensure the literal replication of building components since alterations to
individual departments through changes in use or retrofitting have to be expected
in fast-changing environments such as hospitals. Further, at least two departments
of each type are investigated to ensure the literal replication of the process element.
62
3 Study Methodology
On this basis and with view to the huge variety of processes with very different
characteristics ongoing in hospitals, it is settled for three case study hospitals and five
different department types overall. While limiting the possible depth of the investig-
ation into each department type, this strategy allowed some overview of the spaces
prevalent in hospitals - crucial if any considerations for hospitals as a whole were
to be attempted. A wide strategy further offered the additional benefit of provid-
ing evidence for the development of composite hospital energy benchmarks based on
the technical analysis of the electricity data (published in Morgenstern et al., 2016a).
Case study research has in the past been criticised for a lack of analytical rigour
(Gray, 2004). A number of strategies are hence applied in this study to ensure
quality, as conceptualised through the four elements external, measurement and
internal validity as well as reliability (Bryman, 2012, p.47). They are described in
more detail in Appendix B.2.
3.3.2 The case studies
The study focuses on general acute hospitals as they occupy 60% of the total floor
area within the NHS according to ERIC data. Subject to access constraints and the
collaboration interest shown by NHS trusts, three case study hospitals (Table 3.2)
are selected using a purposeful maximum variation sampling strategy (Patton, 1990,
p.172) in line with the exploratory aim of the study. The sampling criteria relevant
for maximizing sample diversity were identified from literature review and scoping
activities to be:
• Hospital age and resulting built form: expected to yield a variety in the
implementation of building services and building service interfaces with occu-
pants such as – Centralised or localised space heating; – Manual or automatic
light switches; – Operable, locked or no windows; and
• Hospital size: expected to influence extent and realisation of service delivery
as well as staffs’ relation to their workplace.
The unit of analysis for this study is an individual department. Five depart-
ment types prevalent in general acute hospitals (Gray et al., 1997) were selected for
analysis reflecting variety across two aspects crucial to the research question:
• High (operating theatres, laboratories, imaging) versus low (wards, day clinics)
electrical intensities; and
• Continuous (Wards, Some operating theatres, Laboratories) versus intermit-
tent operation (Day clinics, Some imaging departments, Day theatres).
63

3 Study Methodology
Table 3.2: Key characteristics of case study hospitals(Data from ERIC 2013/2014 if not stated otherwise)
HospitalThe Royal
London Hospital(RLH)
NewhamUniversity
Hospital (NUH) 1
King’s CollegeHospital (KCH)
NHS Trust Barts Health NHS TrustKing’s CollegeHospital NHS
Foundation Trust
Gross internal site floor area(GIA) 247 686 m2 44 401 m2 142 610 m2
Number of available beds 708 344 884
Bed utilisation (%) 95% 81% 97%
Dominant age range (% of GIA)2005 to present
(67%)1975 - 1984 (49%) pre 1948 (45%)
Dominant built form Deep Plan Nucleus Nightingale
Electricity consumptionintensity [kWh/(m2· yr)] 170 220 204 2
Heat consumption intensity[kWh/(m2· yr)] 188 220 312
Overall patient satisfaction(Stars out of 5) 3 3.5 (n = 217) 2 (n = 157) 4 (n = 108)
1 Since 2012 officially as Newham General Hospital part of Barts Health.2 Based on average from 2011 - 2013, intensity in 2014 ERIC data was 407 kWh/(m2· yr) which was
suspected to be a data entry error as there was no evidence suggesting a sudden doubling in electricityload on the ground
3 Source: NHS Choices, Reviews and Ratings. Accessed 22/07/2015. Overall score is based on theaverage of all ratings awarded in the past two years to each hospital for the question ‘How likely are youto recommend this service to friends and family if they needed similar care or treatment?’.
These selected pathways further represented different stages along the patient path-
way within an acute hospital:
• from the diagnosis of an illness (through imaging or the analysis of blood or
other body fluid samples in a hospital’s pathology laboratory);
• via its treatment (exemplified here through surgery in an operating theatre
and the day treatment for specific conditions such as cancer or kidney mal-
functions);
• to the inpatient care on wards.
64
3 Study Methodology
Given the abundance of possible clinical pathways, this approach excludes many
relevant hospital department types while the selection nevertheless allows for some
understanding of hospitals from a health care perspective. Other hospital depart-
ments with relevant energy intensities such as sterile services or those where access
constraints impeded data collection, for example in accident and emergency services,
are also excluded from the study in accordance with the resources available to the
project. At least two departments of each type were investigated to increase external
validity (see section 4.1 for an overview of investigated departments).
3.4 Research methods: A mixed-methods approach
3.4.1 Rationale for using mixed-methods
In case study research, especially for the investigation of organisations in the field
of business and management research, the combined use of different methods is
well established (Bryman, 2007, p.642) and is recommended when ‘the use of either
quantitative or qualitative approaches by themselves is inadequate to address com-
plexity’ (Creswell, 2009, p.203). Mixed-method approaches can further strengthen
the validity of resulting theories through the opportunity to observe data conver-
gence or divergence in the various strands of data (Tashakkori and Teddlie, 1998).
In line with this tradition and the theoretical commitment to pragmatism as out-
lined in section 3.2, this study uses a mixed-methods approach. Due to the socio-
technical nature of the research question, an interdisciplinary strategy gathering
both social and physical data is chosen to obtain a rich picture of hospital electricity
use. Table 3.3 lists the applied data collection techniques; they are further illustrated
in the following sections 3.4.2 and 3.4.3 detailing each method. While the social data
were mainly qualitative, the technical data were dominated by quantitative elements
but also included some qualitative elements.
65
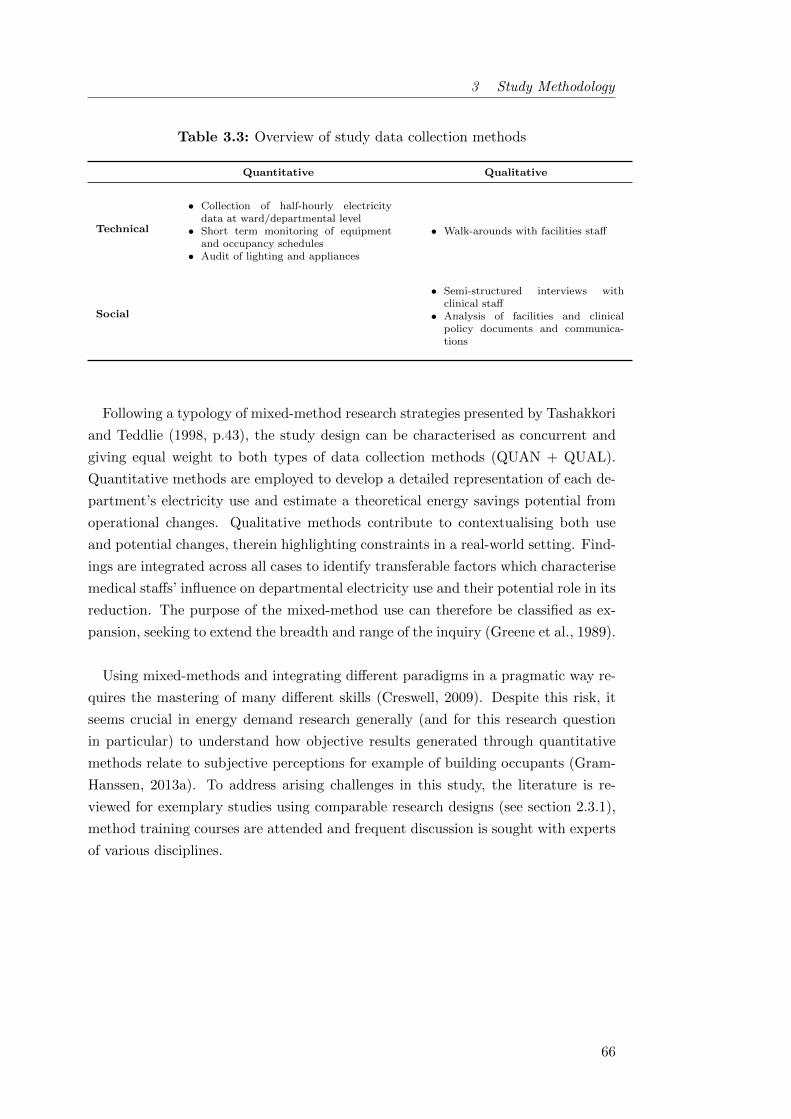
3 Study Methodology
Table 3.3: Overview of study data collection methods
Quantitative Qualitative
Technical
• Collection of half-hourly electricitydata at ward/departmental level
• Short term monitoring of equipmentand occupancy schedules
• Audit of lighting and appliances
• Walk-arounds with facilities staff
Social
• Semi-structured interviews withclinical staff
• Analysis of facilities and clinicalpolicy documents and communica-tions
Following a typology of mixed-method research strategies presented by Tashakkori
and Teddlie (1998, p.43), the study design can be characterised as concurrent and
giving equal weight to both types of data collection methods (QUAN + QUAL).
Quantitative methods are employed to develop a detailed representation of each de-
partment’s electricity use and estimate a theoretical energy savings potential from
operational changes. Qualitative methods contribute to contextualising both use
and potential changes, therein highlighting constraints in a real-world setting. Find-
ings are integrated across all cases to identify transferable factors which characterise
medical staffs’ influence on departmental electricity use and their potential role in its
reduction. The purpose of the mixed-method use can therefore be classified as ex-
pansion, seeking to extend the breadth and range of the inquiry (Greene et al., 1989).
Using mixed-methods and integrating different paradigms in a pragmatic way re-
quires the mastering of many different skills (Creswell, 2009). Despite this risk, it
seems crucial in energy demand research generally (and for this research question
in particular) to understand how objective results generated through quantitative
methods relate to subjective perceptions for example of building occupants (Gram-
Hanssen, 2013a). To address arising challenges in this study, the literature is re-
viewed for exemplary studies using comparable research designs (see section 2.3.1),
method training courses are attended and frequent discussion is sought with experts
of various disciplines.
66

3 Study Methodology
3.4.2 Quantitative data collection methods
The study employs quantitative data collection methods to analyse local electricity
use in different hospital buildings and departments and to establish the respective
extent to which it is influenced by clinical staff. Local electricity use, primarily from
lighting and appliance use, occurs in addition to centrally provided energy services
such as ventilation and space conditioning where the energy is consumed by cent-
ral plant and can only with difficulty be attributed locally. Following a review of
available methodologies (section 2.2.2.1), the understanding of local electricity use
is primarily built from two components used to complement and validate each other
as suggested by Field et al. (1997) and Mortimer et al. (2000): a departmental level
electricity use profile (top-down) and a bottom-up end-use model based on a detailed
audit of lighting and appliances use.
Within the bottom-up model, the electricity use W of each item i is estimated as
suggested by CIBSE TM54 (2013) for small power equipment. For lights, parasitic
consumption for controls and emergency lighting is taken into account based on de-
partmental floor area (BSI 2007). Item electricity use Wi is calculated as the product
of the item’s average power consumption during operation Pi and the duration of
its use ti, both of which are investigated. Additionally, average item power draw
outside of operation Ni (often referred to as stand-by although terminologies are not
clear) has to be accounted for in some items.
Wi = Pi · ti + Ni · (8760 [h/yr] − ti) (3.1)
Such an approach focuses on average electricity usage and disregards peak power
consumption which (although of interest for load shifting strategies and for power
system stability in hospital areas such as imaging) seems less relevant to an initial
understanding of clinical staff impact on energy use. More complex estimation pro-
cedures, e.g. for lighting or cooling energy use, are likewise disregarded because the
study’s main challenge is understood to be from the collection of and uncertainties
in data inputs. A simple formulation of item electricity use in hence prefered.
67

3 Study Methodology
Table 3.4: Case study departments and employed data collection methods
Departmenttype
Hospital Description
Ele
ctri
city
data
from
sub
-met
ers
Mea
sure
men
tsat
main
inco
mer
Mea
sure
men
tsat
circ
uit
level
Lig
hti
ng
an
dap
plian
ces
au
dit
Short
-ter
mm
on
itori
ng
Mea
sure
men
tof
envir
on
men
tal
vari
ab
les
Inte
rvie
ww
ith
clin
ical
staff
Operatingtheatres
NUHOne emergency and onenon-emergency theatre suite
O O O
RLH2 emergency theatre suites and 3non-emergency theatres suites
O O O
Daytheatres
RLH 6 day theatres suites, Recovery, 2Offices
O O O
Laboratory NUHEntire pathology departmentincluding main lab, specimenreception, offices
O O O
KCH Main laboratory and two offices O O O O
Imaging RLH3 X-ray rooms, primarily forbedbound inpatients
O O O O O
NUH
3 X-ray rooms serving all patientpopulations including emergencies,also a mammography and afluroscopy room
O O O
Day Clinic RLHRenal dialysis: Day clinic with up to30 chronic dialysis units
O O O
KCHChemotherapy Day Unit for 15patients
O O O O
Ward NUH General Surgical Ward, 25 beds O O O O O
KCH General Surgical Ward, 28 beds O O O
3.4.2.1 Departmental electricity data
At least half-hourly electricity data was collected of each department’s main incomer,
comprised of power (including fan coil units if present) and lighting loads but ex-
cluding central services, i.e. ventilation and cooling. For some of the departments
at the RLH and in NUH, automatic meter readings were available on the trust’s
energy management system (Table 3.4). For the others, electrical measurements
were carried out at the distribution boards serving the respective departments using
various types of equipment (Table 3.5).
68
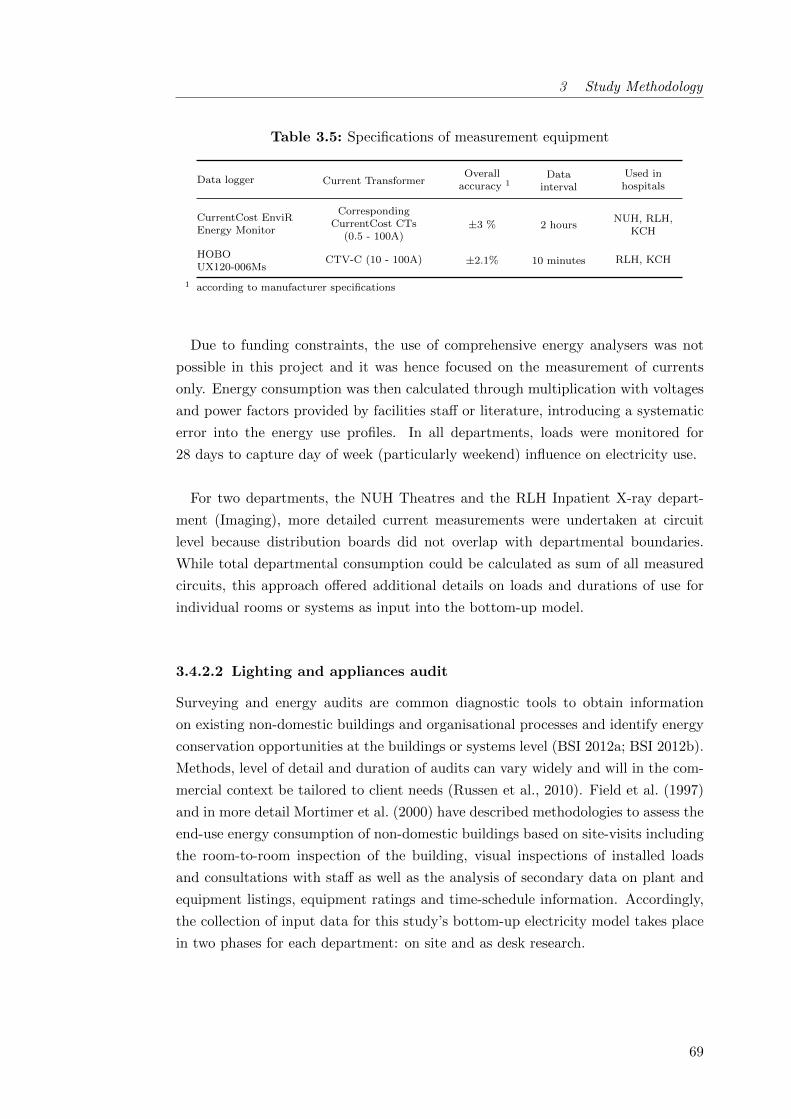
3 Study Methodology
Table 3.5: Specifications of measurement equipment
Data logger Current TransformerOverall
accuracy 1Data
interval
Used inhospitals
CurrentCost EnviREnergy Monitor
CorrespondingCurrentCost CTs
(0.5 - 100A)±3 % 2 hours
NUH, RLH,KCH
HOBOUX120-006Ms
CTV-C (10 - 100A) ±2.1% 10 minutes RLH, KCH
1 according to manufacturer specifications
Due to funding constraints, the use of comprehensive energy analysers was not
possible in this project and it was hence focused on the measurement of currents
only. Energy consumption was then calculated through multiplication with voltages
and power factors provided by facilities staff or literature, introducing a systematic
error into the energy use profiles. In all departments, loads were monitored for
28 days to capture day of week (particularly weekend) influence on electricity use.
For two departments, the NUH Theatres and the RLH Inpatient X-ray depart-
ment (Imaging), more detailed current measurements were undertaken at circuit
level because distribution boards did not overlap with departmental boundaries.
While total departmental consumption could be calculated as sum of all measured
circuits, this approach offered additional details on loads and durations of use for
individual rooms or systems as input into the bottom-up model.
3.4.2.2 Lighting and appliances audit
Surveying and energy audits are common diagnostic tools to obtain information
on existing non-domestic buildings and organisational processes and identify energy
conservation opportunities at the buildings or systems level (BSI 2012a; BSI 2012b).
Methods, level of detail and duration of audits can vary widely and will in the com-
mercial context be tailored to client needs (Russen et al., 2010). Field et al. (1997)
and in more detail Mortimer et al. (2000) have described methodologies to assess the
end-use energy consumption of non-domestic buildings based on site-visits including
the room-to-room inspection of the building, visual inspections of installed loads
and consultations with staff as well as the analysis of secondary data on plant and
equipment listings, equipment ratings and time-schedule information. Accordingly,
the collection of input data for this study’s bottom-up electricity model takes place
in two phases for each department: on site and as desk research.
69

3 Study Methodology
On site: Each department is visited at least two times for the audit, ideally within
the course of two weeks. Firstly, the authorisation for the fieldwork is obtained from
the departmental manager and a guided walk-through is undertaken with them to
understand departmental processes and boundaries and identifying potential inter-
view partners (see section 3.4.3.1). A second visit for the actual field data collection
is then scheduled at their convenience. During the second visit, a room-by-room in-
spection of the area covered by the metered electricity data is carried out recording
information on:
• type of use and reported duration of use of each room;
• lighting installations (identified based on lamp type and size, type of control
gear and if in doubt light colour and strike time) and lighting controls;
• HVAC installations and controls;
• windows and their operability;
• equipment items (including name plate ratings if available), their use schedules
as well as the extent to which they could be switched off by clinical staff (see
Figure 3.2 for a typology of equipment types including some common examples
encountered in each group);
• spot-measurement of appliance wattage where possible; and
• the operational state of all items during the researcher’s visit
Please refer to Appendices for an overview of used codes and a filled example of a
data entry sheet (C.1) as well as a list of all encountered equipment (D.1).
70

3 Study Methodology
Figure 3.2: Equipment typology to code equipment during audits(see also section 3.5.1.3, II for details on sector labels)
While information on the inventory is primarily observed or extracted from doc-
umentation, much of the duration of use information is reported by staff. In the
literature, paper-based self-administered surveys are often used to extract such in-
formation but are found impractical in the dynamic hospital context where staff are
rarely based in one space only. In addition, some of the more intense clinical areas
such as labs and theatres are subject to strict health and safety regulations and
introducing additional paper does not seem appropriate. A researcher-led approach
asking a limited number of questions face to face to extract durations of room and
equipment use is therefore preferred. In addition, duration of use information is also
extracted from the in-depth interviews (section 3.4.3.1). Corresponding statements
are validated against each other and followed up if inconsistent. Durations of use
have to be inferred from a general understanding of the departmental processes for
rooms where no occupants are encountered (see Figure 3.3 for a flow chart of the
process). Occasionally, lighting or equipment power consumptions are reported in
conversation with technical staff.
71
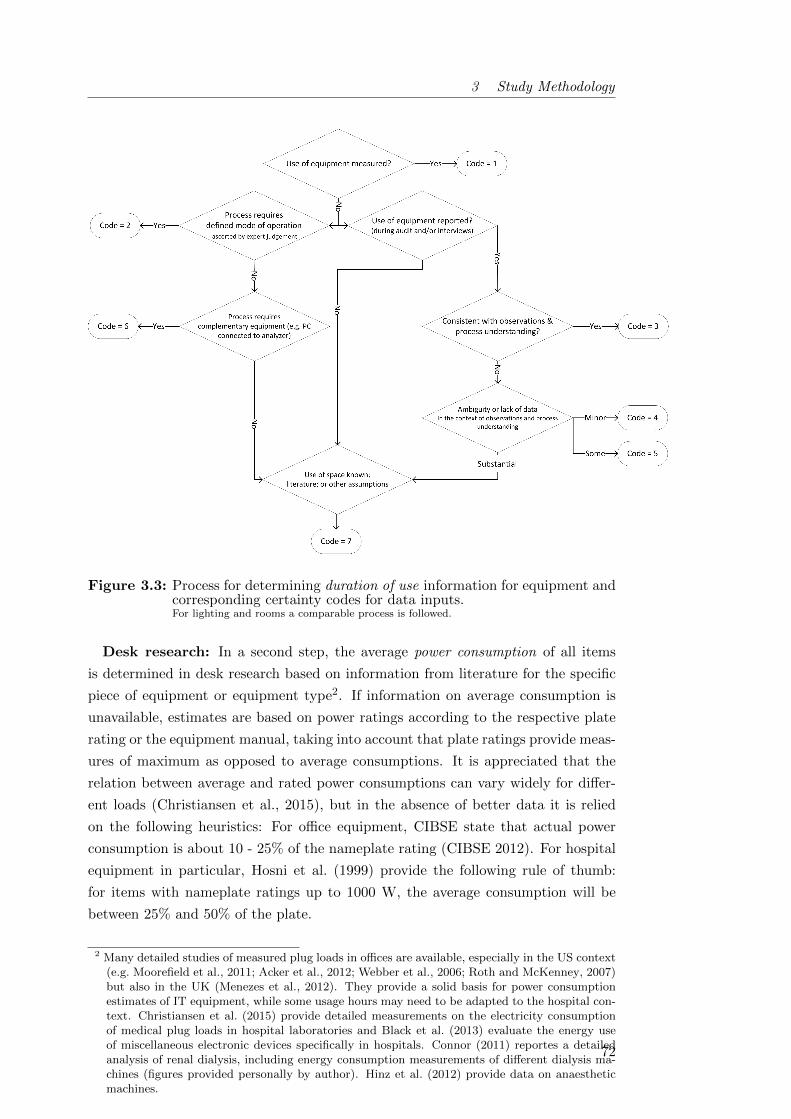
3 Study Methodology
Figure 3.3: Process for determining duration of use information for equipment andcorresponding certainty codes for data inputs.For lighting and rooms a comparable process is followed.
Desk research: In a second step, the average power consumption of all items
is determined in desk research based on information from literature for the specific
piece of equipment or equipment type2. If information on average consumption is
unavailable, estimates are based on power ratings according to the respective plate
rating or the equipment manual, taking into account that plate ratings provide meas-
ures of maximum as opposed to average consumptions. It is appreciated that the
relation between average and rated power consumptions can vary widely for differ-
ent loads (Christiansen et al., 2015), but in the absence of better data it is relied
on the following heuristics: For office equipment, CIBSE state that actual power
consumption is about 10 - 25% of the nameplate rating (CIBSE 2012). For hospital
equipment in particular, Hosni et al. (1999) provide the following rule of thumb:
for items with nameplate ratings up to 1000 W, the average consumption will be
between 25% and 50% of the plate.
2 Many detailed studies of measured plug loads in offices are available, especially in the US context(e.g. Moorefield et al., 2011; Acker et al., 2012; Webber et al., 2006; Roth and McKenney, 2007)but also in the UK (Menezes et al., 2012). They provide a solid basis for power consumptionestimates of IT equipment, while some usage hours may need to be adapted to the hospital con-text. Christiansen et al. (2015) provide detailed measurements on the electricity consumptionof medical plug loads in hospital laboratories and Black et al. (2013) evaluate the energy useof miscellaneous electronic devices specifically in hospitals. Connor (2011) reportes a detailedanalysis of renal dialysis, including energy consumption measurements of different dialysis ma-chines (figures provided personally by author). Hinz et al. (2012) provide data on anaestheticmachines.
72
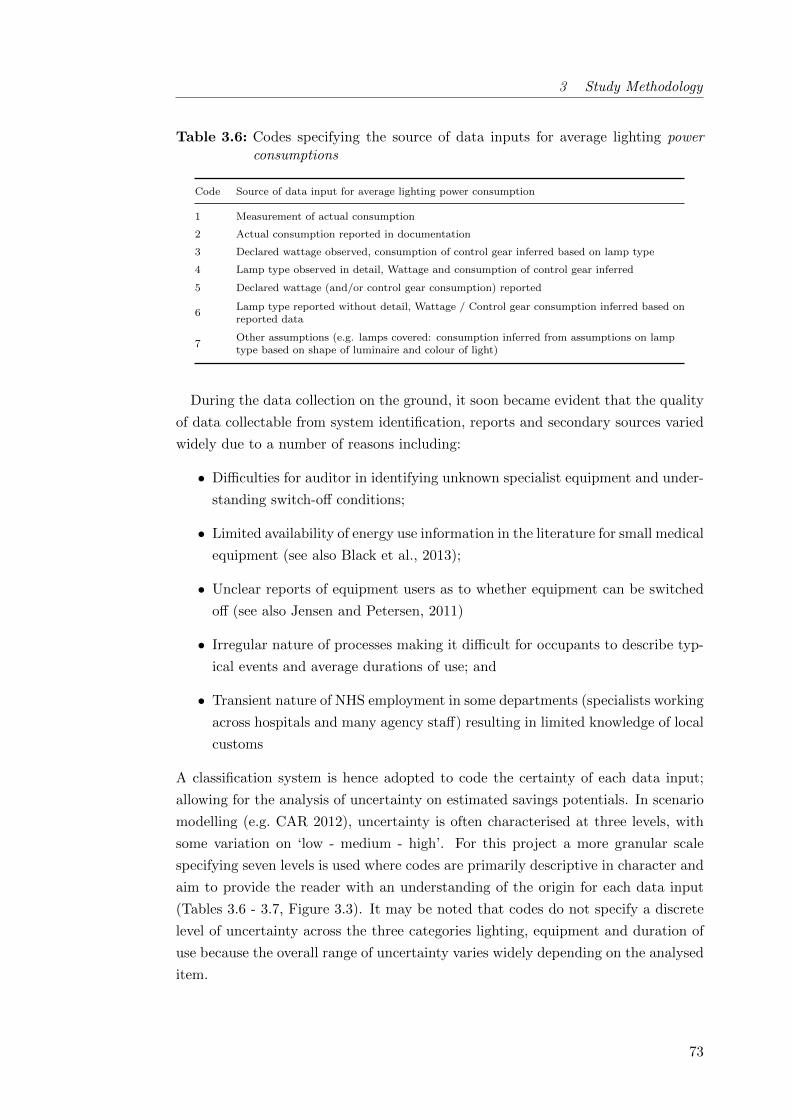
3 Study Methodology
Table 3.6: Codes specifying the source of data inputs for average lighting powerconsumptions
Code Source of data input for average lighting power consumption
1 Measurement of actual consumption
2 Actual consumption reported in documentation
3 Declared wattage observed, consumption of control gear inferred based on lamp type
4 Lamp type observed in detail, Wattage and consumption of control gear inferred
5 Declared wattage (and/or control gear consumption) reported
6Lamp type reported without detail, Wattage / Control gear consumption inferred based onreported data
7Other assumptions (e.g. lamps covered: consumption inferred from assumptions on lamptype based on shape of luminaire and colour of light)
During the data collection on the ground, it soon became evident that the quality
of data collectable from system identification, reports and secondary sources varied
widely due to a number of reasons including:
• Difficulties for auditor in identifying unknown specialist equipment and under-
standing switch-off conditions;
• Limited availability of energy use information in the literature for small medical
equipment (see also Black et al., 2013);
• Unclear reports of equipment users as to whether equipment can be switched
off (see also Jensen and Petersen, 2011)
• Irregular nature of processes making it difficult for occupants to describe typ-
ical events and average durations of use; and
• Transient nature of NHS employment in some departments (specialists working
across hospitals and many agency staff) resulting in limited knowledge of local
customs
A classification system is hence adopted to code the certainty of each data input;
allowing for the analysis of uncertainty on estimated savings potentials. In scenario
modelling (e.g. CAR 2012), uncertainty is often characterised at three levels, with
some variation on ‘low - medium - high’. For this project a more granular scale
specifying seven levels is used where codes are primarily descriptive in character and
aim to provide the reader with an understanding of the origin for each data input
(Tables 3.6 - 3.7, Figure 3.3). It may be noted that codes do not specify a discrete
level of uncertainty across the three categories lighting, equipment and duration of
use because the overall range of uncertainty varies widely depending on the analysed
item.
73
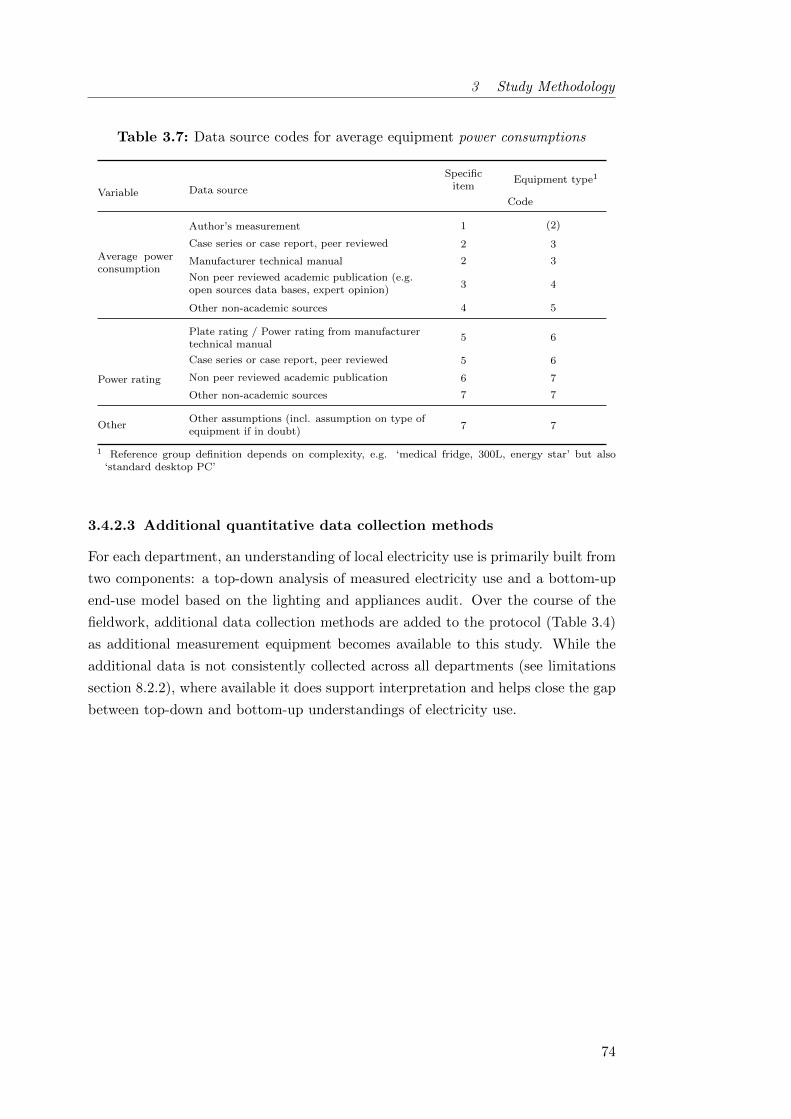
3 Study Methodology
Table 3.7: Data source codes for average equipment power consumptions
Variable Data source
Specificitem
Equipment type1
Code
Average powerconsumption
Author’s measurement 1 (2)
Case series or case report, peer reviewed 2 3
Manufacturer technical manual 2 3
Non peer reviewed academic publication (e.g.open sources data bases, expert opinion)
3 4
Other non-academic sources 4 5
Power rating
Plate rating / Power rating from manufacturertechnical manual
5 6
Case series or case report, peer reviewed 5 6
Non peer reviewed academic publication 6 7
Other non-academic sources 7 7
OtherOther assumptions (incl. assumption on type ofequipment if in doubt)
7 7
1 Reference group definition depends on complexity, e.g. ‘medical fridge, 300L, energy star’ but also‘standard desktop PC’
3.4.2.3 Additional quantitative data collection methods
For each department, an understanding of local electricity use is primarily built from
two components: a top-down analysis of measured electricity use and a bottom-up
end-use model based on the lighting and appliances audit. Over the course of the
fieldwork, additional data collection methods are added to the protocol (Table 3.4)
as additional measurement equipment becomes available to this study. While the
additional data is not consistently collected across all departments (see limitations
section 8.2.2), where available it does support interpretation and helps close the gap
between top-down and bottom-up understandings of electricity use.
74

3 Study Methodology
Short-term equipment monitoring: The most accurate method to obtain in-
formation on equipment electricity use is to monitor items individually. Doing so
will both provide detailed information on power consumption and on usage hours
(Murtagh et al., 2013), which ultimately is especially relevant for large consumers
(Robison and Reichmuth, 1992). In this study, Current Cost individual appliance
monitors with the EnviR data loggers are used to log the profile of selected pieces
of equipment such as radiology monitors in imaging departments, ward kitchens
serving patients with warm meals and general IT equipment. Sensitive medical or
laboratory equipment could not be monitored with the individual appliance loggers
due to concerns about safety and disruptions. This is a known problem in the hos-
pital context (Black et al., 2013; Hagemeier, 2014; Christiansen et al., 2015) and
presents one of the difficulties for built environment research in this building type.
Measurement of environmental variables: In some departments (Table 3.4)
lighting levels as well as ambient temperatures are recorded every 10 minutes over
a period of two to four weeks using HOBO U12-012 data loggers (accuracy for tem-
peratures ± 0.35 ◦C and 80% for light intensities at 550 nm). Especially for spaces
without natural light (frequent in most visited departments), the analysis of local
lighting levels allows statements as to whether lights were on or off at each point in
time. Temperature data is of interest in departments where thermal discomfort is
reported and cooling fans or fan heaters are consequently common.
75

3 Study Methodology
3.4.3 Qualitative data collection methods
The focus of the qualitative investigation is on understanding hospital electricity use
from an end-user perspective in order to identify constraints on the optimally effi-
cient local use of electricity. Constraints are understood broadly and conceptualised
through the elements of knowledge, embodied habits, meanings and technologies as
introduced by Gram-Hanssen (2013a) in an empirical operationalization of social
practices theory for the understanding of energy demand. This framework has been
well utilised for the investigation of energy demand in the built environment (see
section 2.3.2.2), likely due to its accessible, straightforward presentation and a fo-
cus on contemporary rather than historical events and sources of data. It further
allows for the integration of both social and technical data and has therefore been
chosen as analytical framework for this study. The main method for the collection
of qualitative data are semi-structured interviews with clinical staff, complemented
by information from facilities management and the analysis of trust policy docu-
ments. In accordance with the Data Protection Act 1998, this study is registered
with UCL Data Protection (Z6364106/2013/05/59) and has been approved by the
UCL Research Ethics Committee (Project ID: 5434/001).
3.4.3.1 Semi-structured interviews with clinical staff
This study carries out 22 semi-structured interviews across all case departments as
well as 2 pilot interviews outside of the case hospitals (Table 3.8). The interviews
last between 30 and 70 minutes and take place in the respective departments to
ensure routines and local control elements can easily be recalled by participants.
In the RLH theatres, the interviews could not be carried out in full due to access
constraints and time pressures on staff. Instead, 10 conversation fragments are re-
corded during a site visit by speaking to staff in quiet moments while the theatres
are operational. Jointly the fragments cover the interview guide approximately twice.
76
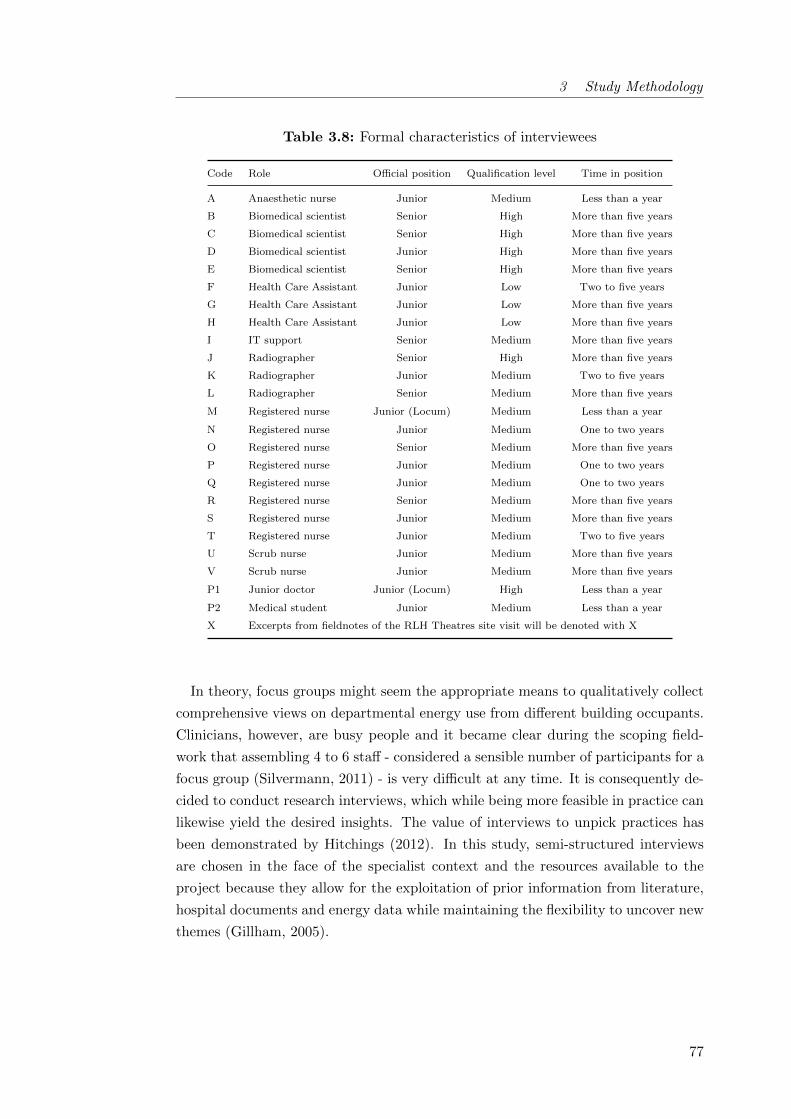
3 Study Methodology
Table 3.8: Formal characteristics of interviewees
Code Role Official position Qualification level Time in position
A Anaesthetic nurse Junior Medium Less than a year
B Biomedical scientist Senior High More than five years
C Biomedical scientist Senior High More than five years
D Biomedical scientist Junior High More than five years
E Biomedical scientist Senior High More than five years
F Health Care Assistant Junior Low Two to five years
G Health Care Assistant Junior Low More than five years
H Health Care Assistant Junior Low More than five years
I IT support Senior Medium More than five years
J Radiographer Senior High More than five years
K Radiographer Junior Medium Two to five years
L Radiographer Senior Medium More than five years
M Registered nurse Junior (Locum) Medium Less than a year
N Registered nurse Junior Medium One to two years
O Registered nurse Senior Medium More than five years
P Registered nurse Junior Medium One to two years
Q Registered nurse Junior Medium One to two years
R Registered nurse Senior Medium More than five years
S Registered nurse Junior Medium More than five years
T Registered nurse Junior Medium Two to five years
U Scrub nurse Junior Medium More than five years
V Scrub nurse Junior Medium More than five years
P1 Junior doctor Junior (Locum) High Less than a year
P2 Medical student Junior Medium Less than a year
X Excerpts from fieldnotes of the RLH Theatres site visit will be denoted with X
In theory, focus groups might seem the appropriate means to qualitatively collect
comprehensive views on departmental energy use from different building occupants.
Clinicians, however, are busy people and it became clear during the scoping field-
work that assembling 4 to 6 staff - considered a sensible number of participants for a
focus group (Silvermann, 2011) - is very difficult at any time. It is consequently de-
cided to conduct research interviews, which while being more feasible in practice can
likewise yield the desired insights. The value of interviews to unpick practices has
been demonstrated by Hitchings (2012). In this study, semi-structured interviews
are chosen in the face of the specialist context and the resources available to the
project because they allow for the exploitation of prior information from literature,
hospital documents and energy data while maintaining the flexibility to uncover new
themes (Gillham, 2005).
77
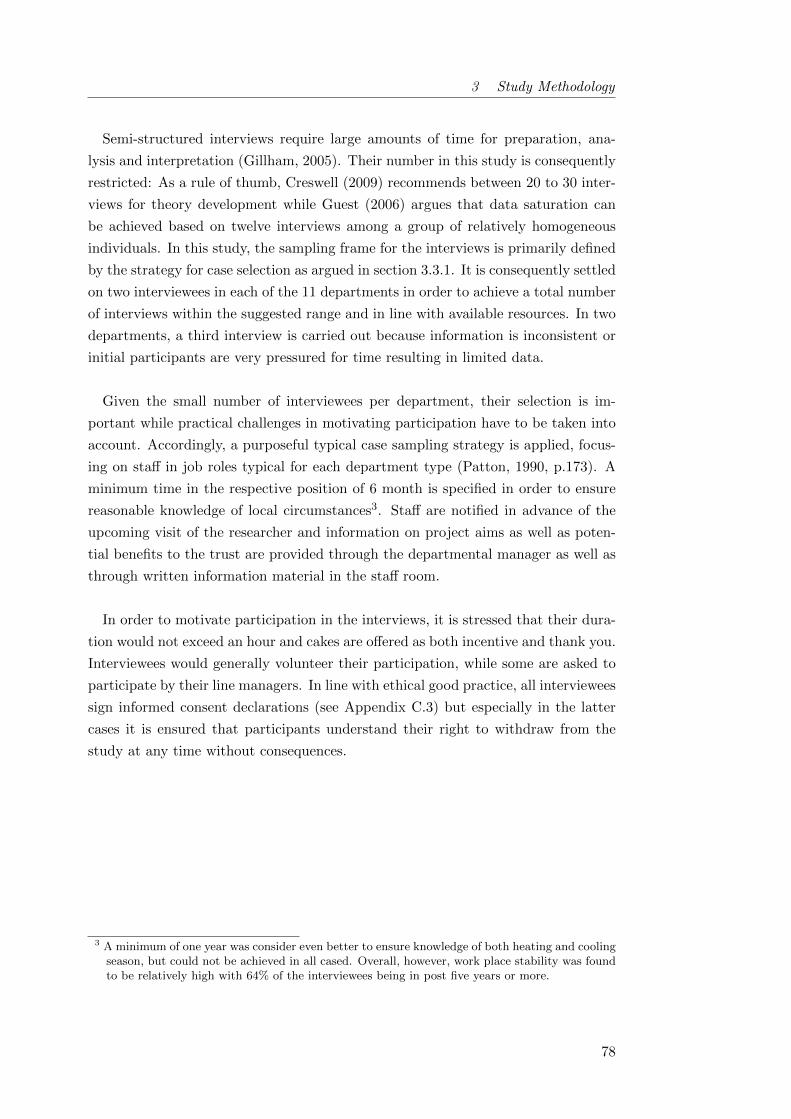
3 Study Methodology
Semi-structured interviews require large amounts of time for preparation, ana-
lysis and interpretation (Gillham, 2005). Their number in this study is consequently
restricted: As a rule of thumb, Creswell (2009) recommends between 20 to 30 inter-
views for theory development while Guest (2006) argues that data saturation can
be achieved based on twelve interviews among a group of relatively homogeneous
individuals. In this study, the sampling frame for the interviews is primarily defined
by the strategy for case selection as argued in section 3.3.1. It is consequently settled
on two interviewees in each of the 11 departments in order to achieve a total number
of interviews within the suggested range and in line with available resources. In two
departments, a third interview is carried out because information is inconsistent or
initial participants are very pressured for time resulting in limited data.
Given the small number of interviewees per department, their selection is im-
portant while practical challenges in motivating participation have to be taken into
account. Accordingly, a purposeful typical case sampling strategy is applied, focus-
ing on staff in job roles typical for each department type (Patton, 1990, p.173). A
minimum time in the respective position of 6 month is specified in order to ensure
reasonable knowledge of local circumstances3. Staff are notified in advance of the
upcoming visit of the researcher and information on project aims as well as poten-
tial benefits to the trust are provided through the departmental manager as well as
through written information material in the staff room.
In order to motivate participation in the interviews, it is stressed that their dura-
tion would not exceed an hour and cakes are offered as both incentive and thank you.
Interviewees would generally volunteer their participation, while some are asked to
participate by their line managers. In line with ethical good practice, all interviewees
sign informed consent declarations (see Appendix C.3) but especially in the latter
cases it is ensured that participants understand their right to withdraw from the
study at any time without consequences.
3 A minimum of one year was consider even better to ensure knowledge of both heating and coolingseason, but could not be achieved in all cased. Overall, however, work place stability was foundto be relatively high with 64% of the interviewees being in post five years or more.
78
3 Study Methodology
Table 3.9: Question topics for semi-structured interviews with clinical staff
# Topic Sub-Topic Purpose of topic
1Personal
experience in thedepartment
• Daily routine• Workplace satisfac-
tion
• Putting the interviewee at ease and build-ing an atmosphere of confidence
• Exploring the relationship of the inter-viewee with their workplace
2 Area description
• Processes• Operating hours• Cleaning and Main-
tenance
• Clarifying previous understanding of de-partmental function and boundaries
• Investigating processes and operatinghours for comparison with the electricityuse profile
3 Lighting • Lighting levels• Lighting controls
• Exploring satisfaction with lighting levelsand control options
4 Medical equipment
• Types of prevalentequipment
• Equipment powerdown
• Classify medical equipment used in thedepartment
• Explore switch-off of medical equipment
5 IT equipment • Shared use of com-puters
• Investigate issues around the diffusion ofresponsibility for IT and meeting roomequipment
6Heating and
cooling
• Thermal comfortlevels
• Coping strategies
• Explore whether supplementary heatingand cooling is used in the department andif applicable how windows are operated
7Electricity use
profile• Discuss abnormalities visible in the top-
down electricity consumption profile
8 Ecological values • Own values• Social norms
• Exploring views on saving energy at homeand in the workplace
• Comparison with others
9 Saving energy • Ideas on how tosave energy
• Sharing knowledge on energetic bestpractice
• Identifying constraints on potential sav-ings options in practice
In semi-structured interviews, the development of the interview guide is crucial
as questions hope to be motivating for the interviewees and productive for the re-
searcher (Gillham, 2005, p.72). Based on the review of the literature as presented in
the sections 2.2.1.1, 2.2.1.2 and 2.3.1, nine main topics are identified which are asso-
ciated with departmental routines from an energy perspective and local constraints
on electricity conservation (Table 3.9). The questions themselves (see Appendix C.2)
are developed and improved in three stages:
79
3 Study Methodology
1. Draft
2. Consultation with supervisors and an experienced qualitative researcher: re-
view of initial question order to improve the dynamic of the interviews, re-
wording of questions to increase understanding by people without technical
background, introduction of scales for perceived control and thermal comfort
to allow for some quantitative analysis of interviews
3. Piloting with two clinical staff external to the selected case hospitals: clarific-
ation to questions on heating versus temperature control and on arrangements
helping or hindering efficient resource use
During the interviews, the same questions are asked to all interviewees using
prompts to ensure approximately equivalent coverage of topics. All interviews are
tape recorded and transcribed (Silvermann, 2011) (see Appendix D.3 for exemplary
excerpt from an interview transcript).
At KCH, the third case study hospital, lines of enquiry which had so far not
resulted productive with respect to the research question are removed from the
interview guide (Section 7, Questions on maintenance in sections 2, 3 and 6; marked
with (*) in Appendix C.2) to tighten the investigation and not take up too much
of the participant’s time given its shortage within the hospital context. By this
time, it was generally felt that although the additional interviews added variation
on infrastructure and processes, few new themes were emerging suggesting some
level of data saturation.
3.4.3.2 Other qualitative data collection methods
In addition to the interviews, policy documents on departmental procedures are col-
lected where available to substantiate the interpretation of audits and interviews.
This includes health and safety documents, nursing policies as well as communic-
ations to patients. At the level of the whole hospital, communications on sustain-
ability and actions of the IT department are collated. Fieldnotes are maintained
following walk-arounds and encounters with technical staff while installing monitor-
ing equipment.
80

3 Study Methodology
3.5 Data analysis
3.5.1 Quantitative strand: Representing departmental electricity
use
Based on measured electricity consumption data and the detailed lighting and ap-
pliances audits, the quantitative strand of this work aims to create models of local
electricity use for each department as basis for the ex-ante estimation of electricity
savings through behaviour and simple operational changes. In this, the top-down
analysis based on measured electricity use enables departmental performance to
be understood within the wider context of department type and hospital building
(Hong et al., 2013), as well as the identification of abnormalities such as high base
or after hours loads. The bottom-up model allows for a more detailed performance
diagnosis identifying end-uses (Burman et al., 2014) and is also used as basis for
the quantification of potential operational changes. To allow for the comparison of
results between departments of a type in the face of infrastructural differences in
set-up, it is focused on spaces and activities characteristic for each department type
(see section 4.7). Details for each department type are described in chapter 4.
3.5.1.1 Top-down analysis of electricity use
Patterns of electricity usage in daily and weekly profiles, weekday and weekend day
consumptions, base loads and peak loads are examined in order to provide character-
istics of the hospital departments’ energy use. Missing data points are replaced with
the average energy consumption of the respective time period during all comparable
weekdays. Base loads are defined as the mean of the minimum power readings as
recorded in each 24 hour period, and peak loads as the mean of the maximum read-
ings as recorded in each 24 hour period.
Data from interval energy use and floor areas from floor plans (verified by spot
measurements on-site) allows for predictions of annual consumption intensities to
be made. They are scaled up to a year based on mean daily weekday and daily
weekend day consumptions during the measurement period, assuming bank holidays
are as weekend days. This approach disregards seasonal differences in electricity
consumption (mainly from fan coil units and some lighting use) and further assumes
the measurement period is representative for the year which may underestimate
variation in clinical activity for some department types (imaging for instance tends
to see more patients during winter).
81
3 Study Methodology
3.5.1.2 Bottom-up representations based on audit data
All audit and secondary data on average power consumptions and durations of use
is tabulated using individual tables for room, lighting and equipment information
- similar to the examples provided by Mortimer et al. (2000). Where available,
measured lighting intensities patterns are analysed for weekdays and weekend days
to estimate average durations of lighting use. In the tables, the certainty of each
data input is specified for both power and duration of use dimensions. The tables
are then used to estimate the electricity use for six end-use categories potentially
relevant locally in hospitals (Carbon Trust, 2010): lighting, medical equipment, IT
equipment, catering, local heating or cooling and other, primarily pumps for anaes-
thetic gas scavenging or ultraclean ventilation in theatres.
Results are presented in the format suggest by CIBSE 2006 and compared with
measured consumption data at departmental level. A modest amount of energy-
balancing (Mortimer et al., 2000) or reconciliation (Field et al., 1997) through
changes in the most uncertain data inputs is considered appropriate if all items
remain consistent with the available evidence. Disagreements are understood to re-
quire further investigation as to the source of the discrepancy, both at the desk and
on the ground; iteratively improving the model representation of the department.
3.5.1.3 Assessing theoretical savings potentials
In a further step, potential changes in energy behaviours and clinical operations are
conceptualised from the conducted interviews and audits, the analysis of the electri-
city use profiles, the input of clinical and technical experts and from literature (for
example Pierce et al., 2014; Twomey et al., 2012; Maughan and Ansell, 2014; Batty
et al., 1988). A systemic process guided by the importance of each end-use is used
to question what operational changes seem conceivable for each of them (see Ap-
pendix E.1 for proposed changes in each case study department). A broad approach
is taken including different levels of changes according to the framework presented
in section 2.4.1:
82

3 Study Methodology
I) Promoting simple energy behaviours: To quantify the theoretical sav-
ings potential from promoting simple energy behaviours (Level I in Figure 2.4), a
statistical approach based on measured electricity use is used given the difficulties
associated with estimating current switching frequencies (Morgenstern et al., 2015b).
This approach based on typical (median) and best practice values (lower quartiles)
of the collected data is similar to Mulville et al. (2014), as well as to methodolo-
gies common in building performance benchmarking (Hong et al., 2013; Liddiard
and Wright, 2008). Departmental savings potentials S (absolute or as here in %)
are computed as sum of the difference between median (kWh 50) and lower quartile
(kWh 25) energy use for all metered days (if applicable week or weekend days only)
during each of the n daily measurement periods t:
S =
∑nt (kWh 50 − kWh 25)t∑n
t kWht50
(3.2)
A general disadvantage of statistical approaches is that they provide no insight into
where differences in operational energy use stem from and how these savings can be
tapped (Burman et al., 2014). In this study, this problem can partly be overcome by
interpreting projected savings within the context of the electricity model and other
available evidence. The approach however remains limited to departments where
no clear drivers of energy use (such as number or type of treatments) are effective.
Data from a reasonable number of days is further required, which in this study was
problematic for weekend days in some departments. It is also assumed that within
the 28 days of available data, seasonal difference from daylight hours are negligible
while electricity use from local heating or cooling, if applicable, has to be investig-
ated separately.
83

3 Study Methodology
II) Modifying standard procedures: Further savings may be achievable by
modifying standard procedures in such a way that redundant energy use is elimin-
ated (Level II in section 2.4.1). To estimate the theoretical energy savings potentials
S from such changes, they are translated into the terms of the bottom-up electricity
model based on the assumption that - as new procedures - their current frequen-
cies are negligible. In many instances, staff influence on item electricity use Wi is
considered to be mainly through decreasing durations of use tavoided, while reduc-
tions in power use Pavoided depend on the type of equipment. For equipment with
large power variations in use, such as dialysis machines, calculations are based on
ready mode Ri rather than average power consumption Pi to exclude the influence
of power peaks (see Figure 3.2 for equipment types).
S =
∑Pavoided · tavoided∑
Wiwith Pavoided =
Pi if equipment type is A
Pi − Ni if equipment type is B
Ri if equipment type is C
Ri − Ni if equipment type is D
(3.3)
The data input classifications in the model quickly provide an overview of how
certain each of the savings estimates are. For savings estimates based on the most
uncertain inputs, codes are translated into uncertainty ranges based on expert judge-
ment (Eisenhower et al., 2012). Scenario analysis can then be used to identify a
realistic range for the technical potential of suggested changes. Generally, a conser-
vative approach is chosen preferring to underestimate the savings potential given the
shortage of funds within NHS facilities management and the urgent need to select
strategies that deliver (Morgenstern et al., 2015a).
III) Complex operational changes: The modelling of structural changes in clinical
operation based on a comprehensive review of processes and the negotiation of ac-
ceptable operational states with lower energy services delivery remains out of scope
in this study. Some instances are however qualitatively discussed in the discussion
chapter 7.3.3.
84
3 Study Methodology
3.5.2 Qualitative strand: Contextualising potential changes
As opposed to the quantitative data which is firstly analysed case by case and
only then across cases, the qualitative data was primarily analysed across cases
using a variable-oriented strategy (Miles and Huberman, 1994) to identify context
of and constraints on potential operational changes. All interview transcripts as
well as policy documents and other communications were inserted into NVivo 10, a
computer-assisted qualitative data analysis software (CAQDAS) package. There is
no agreement on the merits of CAQDAS and while some authors fear its use may
result in the fragmentation and loss of context of qualitative data, others stress the
improved efficiency and transparency of the analysis process (Bryman, 2012, p.592).
Given the overall volume of the data collected during this project through both
quantitative and qualitative methods, analysis speed seemed crucial and the use of
CAQDAS in general and NVivo in particular was therefore considered appropriate.
The analysis of the qualitative data followed a thematic analysis process as out-
lined by Creswell (2009, p.185), in which it is iterated between coding the interview
transcripts and documents, identifying themes and interrelations between them and
then interpreting their meaning. Codes were developed as a combination of predeter-
mined and emerging codes, the former being guided by Gram-Hanssen’s (2013a) em-
pirical analysis framework for social practices as well as the interview guide. Gradu-
ally, the codes were refined and conceptually similar codes were grouped together.
Following Bryman (2012, p.580), themes were then based on topical repetitions in
the data, theory-related material, categories indigenous to the hospital context and
aspects interviewees seemed to omit in their answers (missing data). Subsequently,
analytic research notes were developed exploring each theme in greater depth (see
Appendix D.4 for an example). Cross-tabulations of evidence on physical arrange-
ments and occupants’ experience were further used to explore how the identified
constraints mapped onto the factors believed to determine theoretical saving poten-
tials (Appendix D.2).
85
3 Study Methodology
3.6 Summary of the study methodology
This study sets out to investigate the extent to which medical staff influence elec-
tricity end-use in different hospital buildings and departmental processes. On this
basis, the relevance of simple behaviour change as a tool for carbon mitigation in
hospitals will be evaluated, while taking account of the challenges and constraints
effective in health care. Background to the study and literature review have high-
lighted the lack of research on hospital energy use in general and on the viability
and relevance of staff-centred energy conservation initiatives there in particular.
This study consequently adopts an exploratory approach with a view to developing
theory applicable to hospitals, and potentially the wider non-domestic sector.
A case study research design is considered appropriate due to the complex, socio-
technical nature of the research question. Case studies have previously proven be-
neficial in dealing with large amounts of data, obtainable through a number of
different research methods (Flyvbjerg, 2006). Research in the built environment
has however a strong quantitative tradition, emphasising technical dimensions and
large-scale survey research. A multiple case study approach is hence preferred over
single case analysis which, although restricting the achievable depth of the enquiry
given the available resources, promises evidence more compelling to the field. Case
study analysis has further been criticised for a lack of analytical rigour. This study
consequently puts a number of mechanisms in place to ensure quality, including a
replication of factors believed to be crucial in the research design, a detailed field-
work protocol and the extensive collaboration with both technical and social science
experts.
This study considers itself within a pragmatic research tradition. A concurrent
mixed-methods approach using both quantitative and qualitative methods is applied
in service to the research question. The quantitative methods are employed to de-
velop detailed representations of the electricity use in different hospital departments
and to estimate energy savings potentials from operational changes. For this, two
main approaches are used which complement and validate each other: a top-down
analysis of measured departmental electricity consumption data and a bottom-up
end-use model based on a detailed audit of lighting and appliances use. The focus
of the qualitative investigation, which primarily relies on semi-structured interviews
with clinical staff in all departments, is on understanding hospital electricity use
from an end-user perspective in order to identify constraints on the optimally effi-
cient local use of electricity.
86
3 Study Methodology
The study has a number of contextual and methodological limitations, the implica-
tions of which for the present and future studies are discussed in detail in section 8.2.
Importantly, it focuses on reductions in local electricity end-use as opposed to im-
provements at a fabric or systems level. While this may somehow limit the scope for
energy savings, it represents a novel strategy which may contribute to an increased
understanding of the interplay between building energy use, service delivery and
occupant needs. The research study was further crucially constrained by the lack
of available data on hospital energy use and the difficulties associated with primary
data collection in complex as well as inaccessible environments. In the face of these
challenges, the study represents a significant advance on the available evidence, and
will support larger scale and more structured data collection efforts in the future.
The next chapter 4 presents an energy perspective on the (clinical) activities tak-
ing place in different hospital departments to provide the reader with some insight
into the socio-technical systems governing all energy saving attempts in hospitals.
87

4 Logistical & spatial arrangements
of hospital departments
This chapter uses energy and process data collected by the author to present the
context in which clinical activity takes places in different hospital departments. Few
studies are currently available detailing clinical processes in hospitals from an energy
perspective (section 1.1.2). There is further a growing awareness that a detailed
understanding of contextual factors is paramount to identify feasible opportunities
for change (section 2.3). This chapter therefore aims to provide the reader with
some insight into the socio-technical systems governing all end-use energy saving
attempts in hospitals.
4.1 Overview of analysed departments . . . . . . . . . . . . . . . . . . . 90
4.2 Diagnosis: X-ray Imaging . . . . . . . . . . . . . . . . . . . . . . . . 91
4.2.1 Logistical arrangements . . . . . . . . . . . . . . . . . . . . . 91
4.2.2 Spatial arrangements . . . . . . . . . . . . . . . . . . . . . . . 93
4.3 Diagnosis: Clinical pathology laboratories . . . . . . . . . . . . . . . 96
4.3.1 Logistical arrangements . . . . . . . . . . . . . . . . . . . . . 97
4.3.2 Spatial arrangements . . . . . . . . . . . . . . . . . . . . . . . 98
4.4 Treatment: Surgery in operating theatres . . . . . . . . . . . . . . . 101
4.4.1 Logistical arrangements . . . . . . . . . . . . . . . . . . . . . 102
4.4.2 Spatial arrangements . . . . . . . . . . . . . . . . . . . . . . . 104
4.5 Treatment: Day Units . . . . . . . . . . . . . . . . . . . . . . . . . . 107
4.5.1 Logistical arrangements . . . . . . . . . . . . . . . . . . . . . 108
4.5.2 Spatial arrangements . . . . . . . . . . . . . . . . . . . . . . . 110
4.6 Care: Inpatient accommodation on wards . . . . . . . . . . . . . . . 112
4.6.1 Logistical arrangements . . . . . . . . . . . . . . . . . . . . . 113
4.6.2 Spatial arrangements . . . . . . . . . . . . . . . . . . . . . . . 115
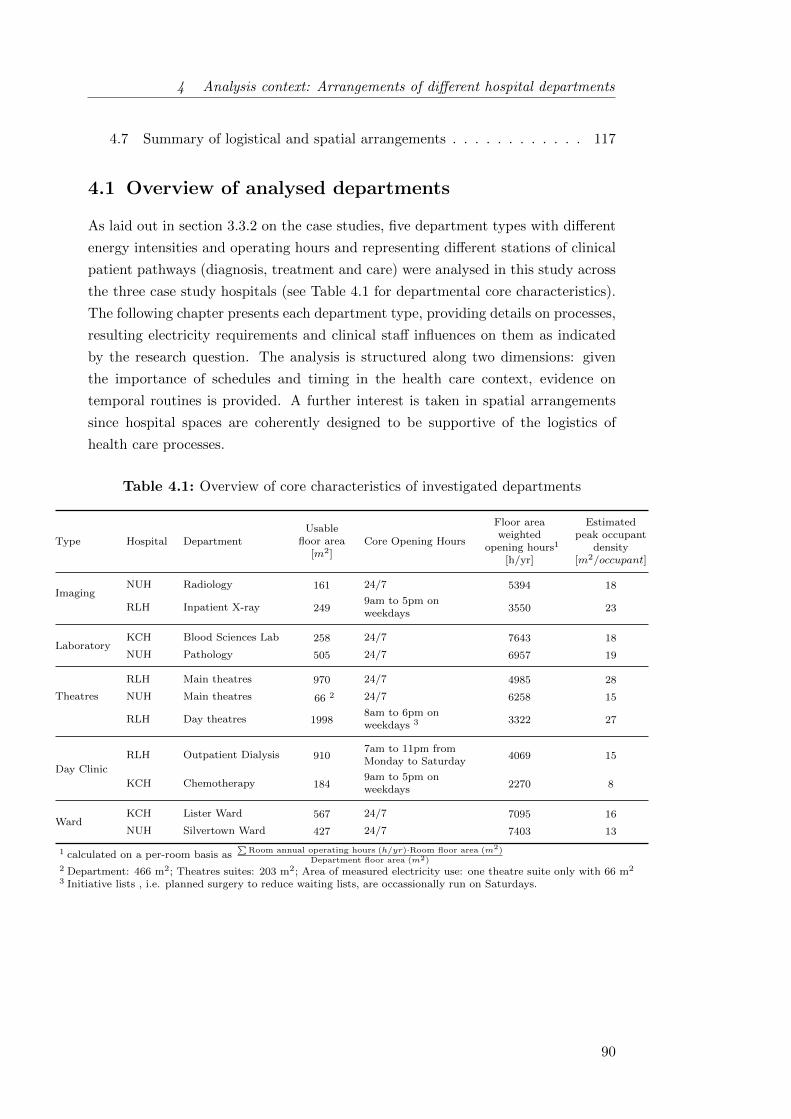
4 Analysis context: Arrangements of different hospital departments
4.7 Summary of logistical and spatial arrangements . . . . . . . . . . . . 117
4.1 Overview of analysed departments
As laid out in section 3.3.2 on the case studies, five department types with different
energy intensities and operating hours and representing different stations of clinical
patient pathways (diagnosis, treatment and care) were analysed in this study across
the three case study hospitals (see Table 4.1 for departmental core characteristics).
The following chapter presents each department type, providing details on processes,
resulting electricity requirements and clinical staff influences on them as indicated
by the research question. The analysis is structured along two dimensions: given
the importance of schedules and timing in the health care context, evidence on
temporal routines is provided. A further interest is taken in spatial arrangements
since hospital spaces are coherently designed to be supportive of the logistics of
health care processes.
Table 4.1: Overview of core characteristics of investigated departments
Type Hospital DepartmentUsable
floor area[m2]
Core Opening Hours
Floor areaweighted
opening hours1
[h/yr]
Estimatedpeak occupant
density[m2/occupant]
ImagingNUH Radiology 161 24/7 5394 18
RLH Inpatient X-ray 2499am to 5pm onweekdays 3550 23
LaboratoryKCH Blood Sciences Lab 258 24/7 7643 18
NUH Pathology 505 24/7 6957 19
Theatres
RLH Main theatres 970 24/7 4985 28
NUH Main theatres 66 2 24/7 6258 15
RLH Day theatres 19988am to 6pm onweekdays 3 3322 27
Day Clinic
RLH Outpatient Dialysis 9107am to 11pm fromMonday to Saturday
4069 15
KCH Chemotherapy 1849am to 5pm onweekdays 2270 8
WardKCH Lister Ward 567 24/7 7095 16
NUH Silvertown Ward 427 24/7 7403 13
1 calculated on a per-room basis as∑
Room annual operating hours (h/yr)·Room floor area (m2)
Department floor area (m2)2 Department: 466 m2; Theatres suites: 203 m2; Area of measured electricity use: one theatre suite only with 66 m2
3 Initiative lists , i.e. planned surgery to reduce waiting lists, are occassionally run on Saturdays.
90
4 Analysis context: Arrangements of different hospital departments
4.2 Diagnosis: X-ray Imaging
For patients to be adequately treated in a hospital, their illness needs to be cor-
rectly identified. Modern medicine provides varied and sophisticated means to do
so, ranging from verbal consultations and physical examinations over the analysis
of blood or urine samples (see section 4.3 on laboratories) to the use of highly spe-
cialised imaging equipment such as CT or MRI scanners. A frequently used tool for
the diagnosis of fractures and other issues related to bone abnormalities as well as
pathologies of lungs or bowels is the X-ray, in clinical terms also referred to as plain
X-ray because no contrast solution is given.
Physically, plain X-ray uses radiation of a wavelength between 0.01 to 10−9 metres
which transcends skin and muscle tissue but is absorbed by bones and other dense
materials to provide a simple black and white image of the area of interest. The
required X-ray beam is generated within the tube of the X-ray generator, in which
the interaction of a cathode-anode pair emits both the desired radiation as well
as a substantial amount of waste heat. An additional cooling system is therefore
required, making X-ray equipment comparatively energy-intensive (Twomey et al.,
2012). Although the images do not show as much detail as those obtained using
other modalities, plain X-ray is in wide spread use due to its comparatively low
investment and running costs as well as its speed. The focus of current clinical
developments in X-ray is to reduce the required doses of radiation as it is harmful
to surrounding tissue, a prospect beneficial also from an energy perspective.
4.2.1 Logistical arrangements
In this study, the X-ray facilities at NUH and at the RLH were investigated. In
acute hospitals, all types of patients are frequently investigated using X-ray: inpa-
tients, outpatients, GP patients referred for diagnosis as well as patients in theatres
and in the Accidents & Emergencies department (A&E). Depending on the size of
a hospital, separate facilities can be available for the different patient groups or all
may be seen within the same area. At the RLH, one of the biggest hospitals in Lon-
don, more than 400 patients are investigated daily using X-ray technology and five
separate parts of the building are dedicated to this purpose. At NUH, in contrast,
all X-ray patients excluding those undergoing surgery (about 200 a day) are seen
within the main radiology department adjacent to A&E. Despite these differences
in set-up, the actual practice of taking an X-ray compared well across both hospitals.
91
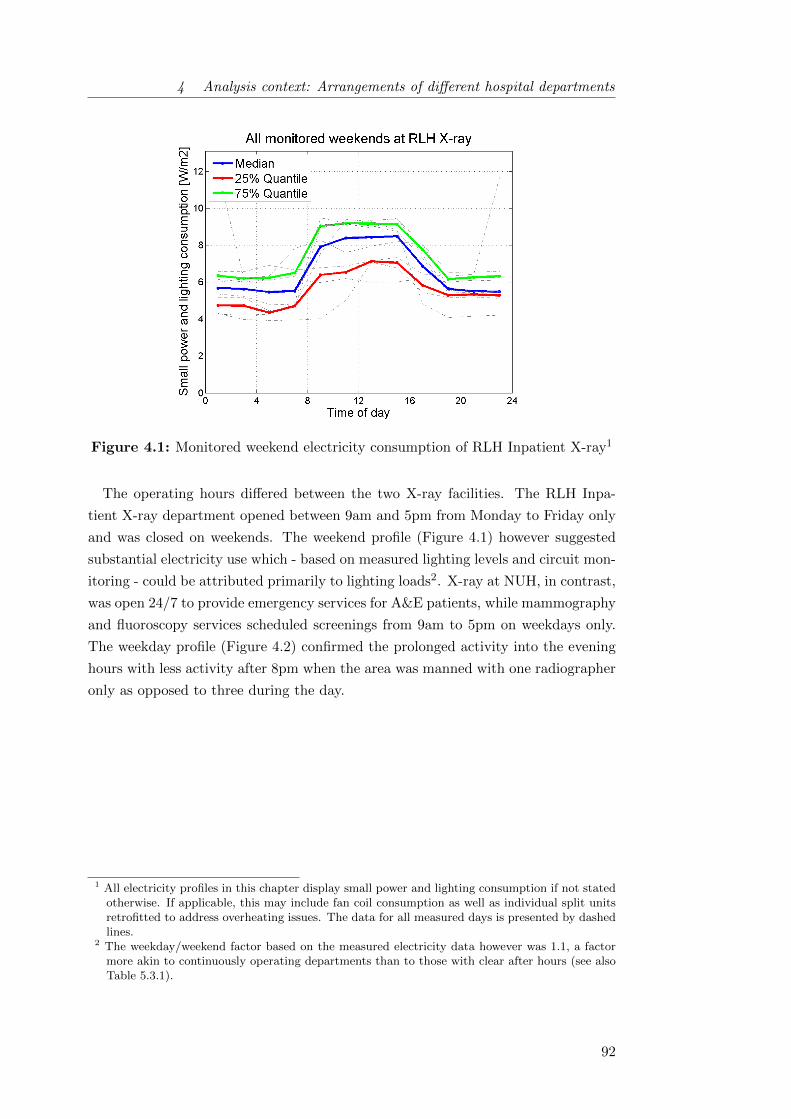
4 Analysis context: Arrangements of different hospital departments
Figure 4.1: Monitored weekend electricity consumption of RLH Inpatient X-ray1
The operating hours differed between the two X-ray facilities. The RLH Inpa-
tient X-ray department opened between 9am and 5pm from Monday to Friday only
and was closed on weekends. The weekend profile (Figure 4.1) however suggested
substantial electricity use which - based on measured lighting levels and circuit mon-
itoring - could be attributed primarily to lighting loads2. X-ray at NUH, in contrast,
was open 24/7 to provide emergency services for A&E patients, while mammography
and fluoroscopy services scheduled screenings from 9am to 5pm on weekdays only.
The weekday profile (Figure 4.2) confirmed the prolonged activity into the evening
hours with less activity after 8pm when the area was manned with one radiographer
only as opposed to three during the day.
1 All electricity profiles in this chapter display small power and lighting consumption if not statedotherwise. If applicable, this may include fan coil consumption as well as individual split unitsretrofitted to address overheating issues. The data for all measured days is presented by dashedlines.
2 The weekday/weekend factor based on the measured electricity data however was 1.1, a factormore akin to continuously operating departments than to those with clear after hours (see alsoTable 5.3.1).
92
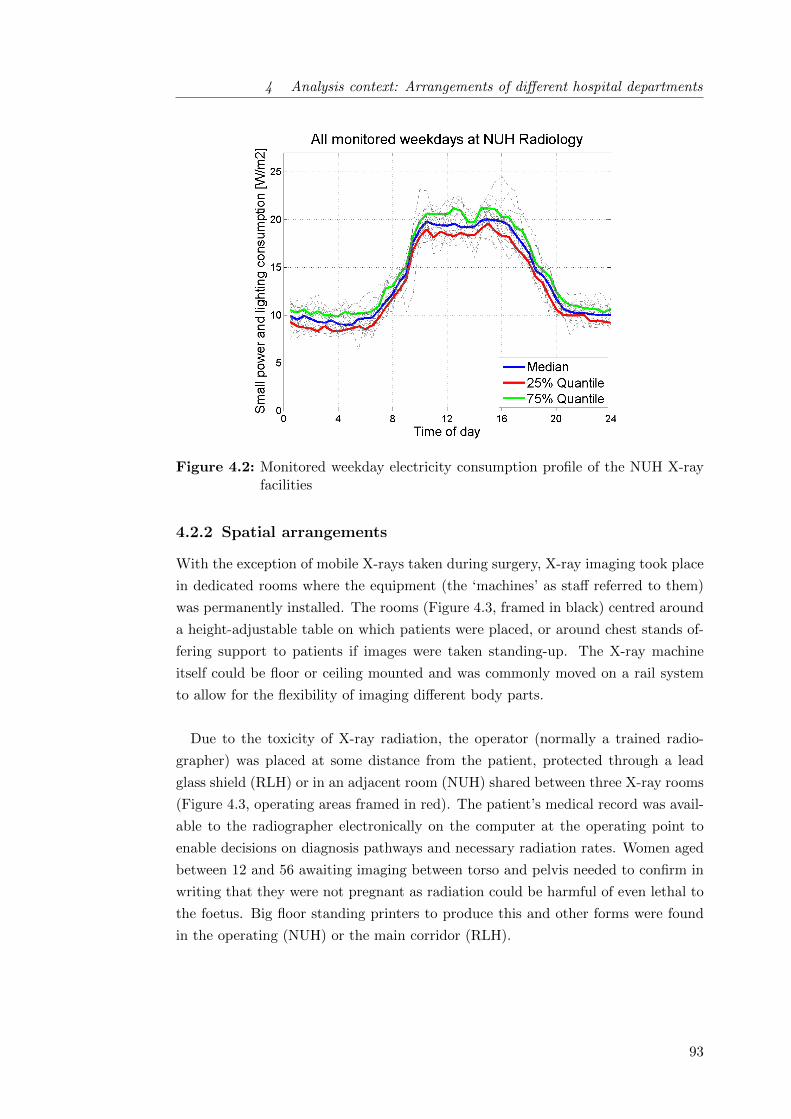
4 Analysis context: Arrangements of different hospital departments
Figure 4.2: Monitored weekday electricity consumption profile of the NUH X-rayfacilities
4.2.2 Spatial arrangements
With the exception of mobile X-rays taken during surgery, X-ray imaging took place
in dedicated rooms where the equipment (the ‘machines’ as staff referred to them)
was permanently installed. The rooms (Figure 4.3, framed in black) centred around
a height-adjustable table on which patients were placed, or around chest stands of-
fering support to patients if images were taken standing-up. The X-ray machine
itself could be floor or ceiling mounted and was commonly moved on a rail system
to allow for the flexibility of imaging different body parts.
Due to the toxicity of X-ray radiation, the operator (normally a trained radio-
grapher) was placed at some distance from the patient, protected through a lead
glass shield (RLH) or in an adjacent room (NUH) shared between three X-ray rooms
(Figure 4.3, operating areas framed in red). The patient’s medical record was avail-
able to the radiographer electronically on the computer at the operating point to
enable decisions on diagnosis pathways and necessary radiation rates. Women aged
between 12 and 56 awaiting imaging between torso and pelvis needed to confirm in
writing that they were not pregnant as radiation could be harmful of even lethal to
the foetus. Big floor standing printers to produce this and other forms were found
in the operating (NUH) or the main corridor (RLH).
93
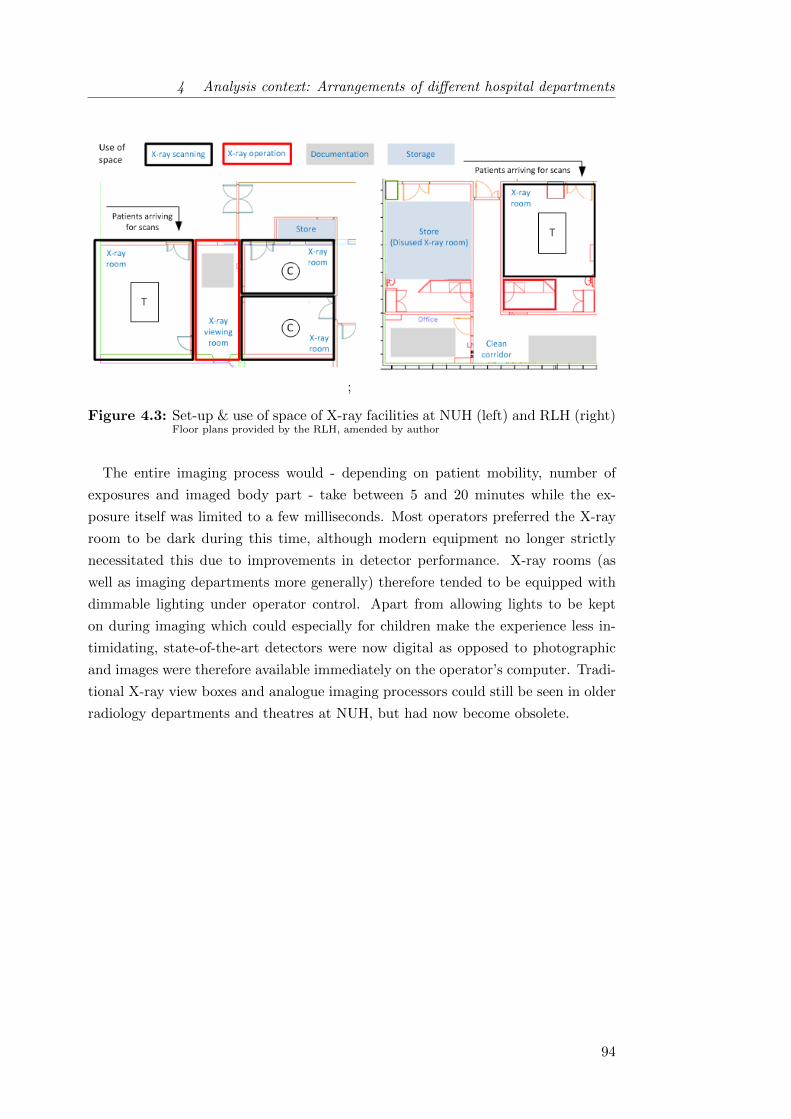
4 Analysis context: Arrangements of different hospital departments
;
Figure 4.3: Set-up & use of space of X-ray facilities at NUH (left) and RLH (right)Floor plans provided by the RLH, amended by author
The entire imaging process would - depending on patient mobility, number of
exposures and imaged body part - take between 5 and 20 minutes while the ex-
posure itself was limited to a few milliseconds. Most operators preferred the X-ray
room to be dark during this time, although modern equipment no longer strictly
necessitated this due to improvements in detector performance. X-ray rooms (as
well as imaging departments more generally) therefore tended to be equipped with
dimmable lighting under operator control. Apart from allowing lights to be kept
on during imaging which could especially for children make the experience less in-
timidating, state-of-the-art detectors were now digital as opposed to photographic
and images were therefore available immediately on the operator’s computer. Tradi-
tional X-ray view boxes and analogue imaging processors could still be seen in older
radiology departments and theatres at NUH, but had now become obsolete.
94

4 Analysis context: Arrangements of different hospital departments
The emergence of computers and digital technology had also substantially changed
the role of radiologists, those professionals responsible for reading and interpreting
the images taken by the radiographers (‘reporting’). They now worked at ‘report-
ing stations’ composed of computers equipped with two or more specialist, high-
resolution monitors which allow the detailed inspection of images for diagnosis.
Commonly, two or more of such stations were placed together in so called reporting
rooms. In their character comparable to offices, the reporting rooms would also have
dimmable lights and were used intermittently by the radiologists3.
Every radiology department would further have an officer in charge of the elec-
tronic images stored in systems such as the picture archiving and communications
system (PACS) or the radiology information system (RIS). In smaller hospitals such
as NUH, this officer may also be in charge of departmental IT issues more generally,
while in bigger hospitals such as the RLH specialisation tended to be higher while
IT support was accessible centrally.
The local electricity use of X-ray departments was composed of two components:
energy-intensive X-ray machinery on three phase supply and single phased lighting
and ancillary appliances. In this study, a detailed analysis was only undertaken for
the single phase components4 because they proved more relevant to the research
question while the electricity use of large scale imaging equipment is increasingly
being discussed elsewhere in the literature (e.g. Esmaeili et al., 2015; Harsem, 2011;
Hagemeier, 2014).
3 Radiologists, like other physicians, must have earned an MD degree and passed a licensing ex-amination, as well as having completed a practical residency in radiology. Less commonly, thereporting may be carried out by ‘reporting radiographers’. Very occasionally, ordinary radio-graphers might also access reporting stations to alter images (for example to correct mistakes indeclaring whether an image was left or right).
4 Additionally, the consumption of two of the three RLH X-ray machines was monitored over 2weeks to get an understanding of how equipment consumption related to overall departmentalconsumption. The results showed that with 22 kWh/(m2 · yr) the X-ray equipment itself ac-counted for 26% of total local electricity use while 61 kWh/(m2 · yr) were for small power andlighting, highlighting the relevance of the latter. The measurements at the RLH and also otherwork for instance by Jensen and Petersen (2011) further illustrated that beam generation ac-counted only for 5 - 15% of the time during which X-ray equipment was in use. Cutting residualelectricity use, mostly from pre and post processing and to move bed and machine arm, couldtherefore also contribute to energy conservation. The potential will depend on the degree of ma-chine/room utilization, equipment type and respective manufacturer recommendations as well asdepartmental policies specifying whether equipment was powered down outside operating hoursor left in idle mode (Twomey et al., 2012). At NUH, all X-ray equipment currently remainedin ready mode for emergency purposes 24 hours per day on 365 days per year. In contrast, theX-ray equipment at ‘RLH Inpatient X-ray’ was switched off completely (including generators)outside of the core hours because emergency X-rays were taken elsewhere.
95

4 Analysis context: Arrangements of different hospital departments
The comparison of small power and lighting consumption profiles suggested that
the NUH X-ray department was more energy intensive than its RLH counterpart.
This was primarily due to
• older lighting technology (T8 and T12 versus T5 compact fluorescents);
• some remaining analogue image processing technology while RLH was purely
digital; and
• supplementary local cooling solutions such as split units and fans at NUH,
where RLH heat loads were met exclusively by the central chillers through
ceiling mounted chilled beams.
Lights, single-phase medical and IT equipment could mostly be switched off by
clinical staff in the X-ray departments. This was with the exception of resuscitation
equipment which was constantly being charged, and split units and network printers
(remained in stand-by) at NUH. Treatment room lights were dimmable and therefore
offered additional degrees of control in comparison with other department types.
4.3 Diagnosis: Clinical pathology laboratories
The field of pathology has a major role in diagnosing diseases, helping choose optimal
treatments and monitoring their effectiveness by analysing patient tissue, blood and
other body fluid samples. Currently, 60 - 70% of diagnoses are based upon a num-
ber of pathology specialities, of which the four major disciplines are listed below
(NHS Estates, 2005; Commission for Healthcare Audit and Inspection, 2007). Smal-
ler disciplines such as cytology, immunology, virology and infection control may in
larger trusts be located in additional departments or in smaller trusts constitute
sub-specialities of the listed:
• Haematology: checks on the status of a patient’s blood and blood-forming
tissues, identifies abnormalities of blood coagulation such as haemostasis and
thrombosis, often also in charge of blood transfusions and the operation of a
trust’s blood bank;
• Clinical biochemistry: examines the level of electrolytes, enzymes, hor-
mones and other chemicals in specimens of body fluids and tissues, mostly
blood serum or plasma;
• Microbiology: isolates disease-causing micro-organisms such as bacteria, vir-
uses, fungi and parasites using a range of specialist culture and non-culture
technologies and platforms and seeks suitable antibiotics (for the treatment of
bacterial infections), anti-fungals and anti-viral medications;
• Histopathology: detects abnormalities in tissue samples from surgical oper-
ations and biopsies.
96
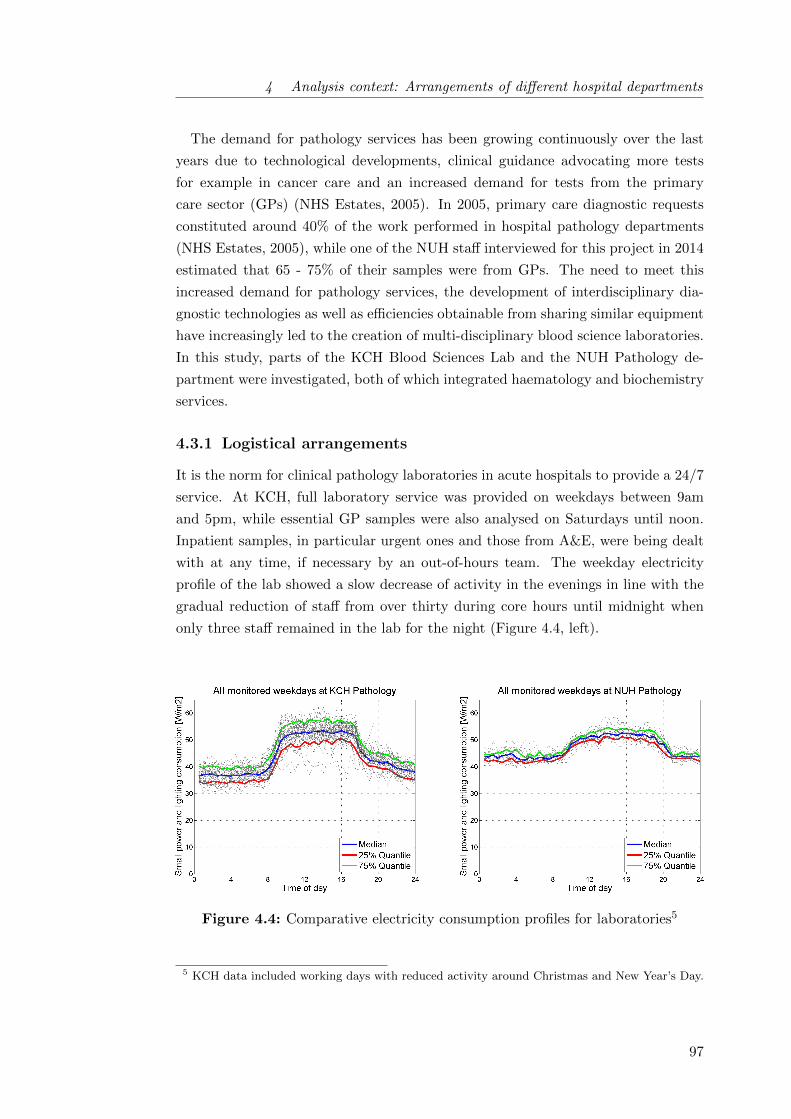
4 Analysis context: Arrangements of different hospital departments
The demand for pathology services has been growing continuously over the last
years due to technological developments, clinical guidance advocating more tests
for example in cancer care and an increased demand for tests from the primary
care sector (GPs) (NHS Estates, 2005). In 2005, primary care diagnostic requests
constituted around 40% of the work performed in hospital pathology departments
(NHS Estates, 2005), while one of the NUH staff interviewed for this project in 2014
estimated that 65 - 75% of their samples were from GPs. The need to meet this
increased demand for pathology services, the development of interdisciplinary dia-
gnostic technologies as well as efficiencies obtainable from sharing similar equipment
have increasingly led to the creation of multi-disciplinary blood science laboratories.
In this study, parts of the KCH Blood Sciences Lab and the NUH Pathology de-
partment were investigated, both of which integrated haematology and biochemistry
services.
4.3.1 Logistical arrangements
It is the norm for clinical pathology laboratories in acute hospitals to provide a 24/7
service. At KCH, full laboratory service was provided on weekdays between 9am
and 5pm, while essential GP samples were also analysed on Saturdays until noon.
Inpatient samples, in particular urgent ones and those from A&E, were being dealt
with at any time, if necessary by an out-of-hours team. The weekday electricity
profile of the lab showed a slow decrease of activity in the evenings in line with the
gradual reduction of staff from over thirty during core hours until midnight when
only three staff remained in the lab for the night (Figure 4.4, left).
Figure 4.4: Comparative electricity consumption profiles for laboratories5
5 KCH data included working days with reduced activity around Christmas and New Year’s Day.
97

4 Analysis context: Arrangements of different hospital departments
At NUH, the laboratory was smaller and samples for microbiological or specialist
tests could not be analysed locally but were sent to the bigger pathology department
at the RLH. The NUH department nevertheless operated around the clock to meet
demands for tests required in emergency care while full service was provided between
9am and 5pm on weekdays like at KCH (Figure 4.4, right). Between 8pm and 8am
and on weekends (except Saturdays from 11:30am to 4:30pm when there were two
extra staff) the laboratory was staffed by two people, one in the haematology team
and one in biochemistry. On average, laboratories represented the department type
with the longest average operating hours (see also Table 4.1).
4.3.2 Spatial arrangements
Both investigated laboratories were classified at containment level 2, implying that
the access to the laboratory was restricted to authorised persons and specified disin-
fection procedures must be used. Containment level 2 spaces are recommended to be
maintained at an air pressure negative to atmosphere, but it is appreciated that this
may be difficult in practice due to constant footfall in and out of the rooms6. The
general work-flow in the two investigated labs was found to be quite similar despite
the difference in size (Figure 4.5, highlighting also required electrical equipment).
Both external (GP) and internal samples were received by specimen reception, cata-
logued, batched and then distributed to the responsible parts of the laboratory. In
NUH, specimen reception resulted to be a major bottleneck in the operation of the
pathology department due to staffing pressures there.
Depending on the required tests, batches of samples then had to be prepared by
centrifugation. Generally, all biochemistry samples were centrifuged and about half
of the haematology specimen (coagulation tests and transfusion samples were spun
but not full blood counts which were the most numerous haematology tests). Non-
tempered centrifuges were assumed to draw no power when not in use.
6 Regulations on the Control of Substances Hazardous to Health (COSHH) specify ventilation re-quirements for laboratory and other hospital spaces. COSHH requires that laboratories from andabove containment level 3 are maintained at negative air pressures through specialist ventilationarrangements, while at lower containment level this is a recommendation only.
98

4 Analysis context: Arrangements of different hospital departments
Figure 4.5: Workflow and spatial arrangements of laboratories
99
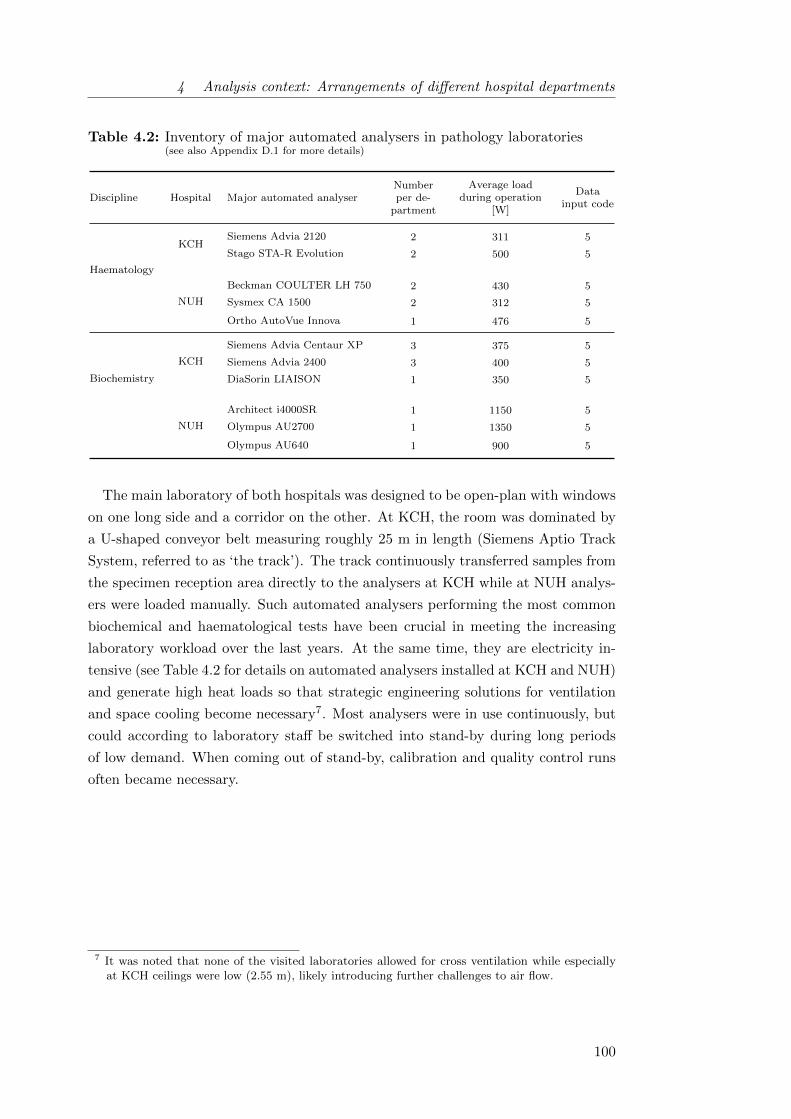
4 Analysis context: Arrangements of different hospital departments
Table 4.2: Inventory of major automated analysers in pathology laboratories(see also Appendix D.1 for more details)
Discipline Hospital Major automated analyserNumberper de-
partment
Average loadduring operation
[W]
Datainput code
Haematology
KCHSiemens Advia 2120 2 311 5
Stago STA-R Evolution 2 500 5
NUH
Beckman COULTER LH 750 2 430 5
Sysmex CA 1500 2 312 5
Ortho AutoVue Innova 1 476 5
Biochemistry
KCH
Siemens Advia Centaur XP 3 375 5
Siemens Advia 2400 3 400 5
DiaSorin LIAISON 1 350 5
NUH
Architect i4000SR 1 1150 5
Olympus AU2700 1 1350 5
Olympus AU640 1 900 5
The main laboratory of both hospitals was designed to be open-plan with windows
on one long side and a corridor on the other. At KCH, the room was dominated by
a U-shaped conveyor belt measuring roughly 25 m in length (Siemens Aptio Track
System, referred to as ‘the track’). The track continuously transferred samples from
the specimen reception area directly to the analysers at KCH while at NUH analys-
ers were loaded manually. Such automated analysers performing the most common
biochemical and haematological tests have been crucial in meeting the increasing
laboratory workload over the last years. At the same time, they are electricity in-
tensive (see Table 4.2 for details on automated analysers installed at KCH and NUH)
and generate high heat loads so that strategic engineering solutions for ventilation
and space cooling become necessary7. Most analysers were in use continuously, but
could according to laboratory staff be switched into stand-by during long periods
of low demand. When coming out of stand-by, calibration and quality control runs
often became necessary.
7 It was noted that none of the visited laboratories allowed for cross ventilation while especiallyat KCH ceilings were low (2.55 m), likely introducing further challenges to air flow.
100

4 Analysis context: Arrangements of different hospital departments
Both pathology departments included various store rooms (including cold rooms
at NUH which at KCH were outside the analysed boundaries) where specimen were
stored under refrigeration (2 - 6% of total floor area). Up to a quarter of the depart-
mental floor area was taken up by office spaces for both process and administration.
The latter were operating during core hours only allowing for some office equipment
to be switched off. At NUH, the blood bank consisting of two blood fridges and two
big plasma freezers was also part of the main pathology department while it was
located outside of the analysis boundaries at KCH.
On the whole, laboratories were found to be energy intensive departments with
high load densities. While active loads seemed comparable between the two investig-
ated labs, base loads were higher at NUH. This was surprising given the continuously
operating track system at KCH but will likely be a result of higher loads from ana-
lysers and cold storage. There may nevertheless be some potential for base load
reductions in the NUH Pathology department, a supposition also repeatedly voiced
by different members of the hospitals facilities management team who claimed that
‘laboratory staff would just leave everything on’.
4.4 Treatment: Surgery in operating theatres
For many medical conditions surgery can be necessary to alleviate them and every
acute hospital will therefore be equipped with a number of theatre suites (consti-
tuted by theatres, anaesthetic rooms, scrub, preparation and (dirty) utility rooms)
as well as recovery facilities where patients are supervised immediately after surgery.
Additionally, most theatre departments include some administrative areas and facil-
ities for staff changing and resting. Larger hospitals often have dedicated day theatre
departments for ambulant procedures as well special paediatric theatre departments
for surgery on children in addition to the main theatres. In this study, the main
theatre departments at RLH and NUH were investigated. To get some sense for the
differences between full and ambulatory surgery, the study also included an analysis
of the RLH day theatres.
101
4 Analysis context: Arrangements of different hospital departments
4.4.1 Logistical arrangements
Surgeries can be differentiated into two categories: elective (planned) and emergency.
Planned surgery follows patient lists (commonly simply referred to as lists) compiled
by the theatre manager balancing patient needs and the availability of staff and fa-
cilities. In addition, emergency surgeries characterised by a need for swift action
to avoid patient death or permanent disability are carried out at any time during
day or night. During 2012/13, about a quarter of surgical hospital admissions were
emergencies in the UK (Royal College of Surgeons, 2014). This was also reflected
at NUH, where operational data from the Trust’s accounting system was available
to this project and showed that 30% of surgeries were emergency surgeries during
September 2014 and 22% during October 2014 respectively. Infrastructural provi-
sions matched this need with one in five theatres being dedicated emergency theatres
with round the clock disposition in both analysed hospitals.
In theory, there were two four-hour blocks of elective surgery daily (9am to 1pm
and 2pm to 6pm at NUH; 8:30am to 12:30pm and 1:30pm to 5:30pm at RLH), both
of which were preceded by equipment preparations and team meetings and followed
by cleaning activities (30 minutes each). In practice, many cases took longer than
scheduled due to unforeseen complications and staff were accustomed to staggering
their lunches and working overtime. The electricity consumption profile for both
main theatre departments (Figure 4.6) in fact suggested continued activity into the
evening in more than just the emergency theatre on a regular basis. On weekends,
both departments would run some elective cases to keep patient lists manageable,
but less staff were working and the focus would be on emergency surgery. Adminis-
trative areas such as theatre reception and record offices tended to be staffed from
9am to 5pm or from 8am to 6pm on weekdays only.
102

4 Analysis context: Arrangements of different hospital departments
Figure 4.6: Weekday electricity consumption profiles for main theatres8
Day surgery was performed from Monday to Friday (with occasional cases on
Saturdays) and according to lists only. Cases tended to be less invasive than full
surgery, with shorter recovery times and ideally no ward stay before nor after the
intervention. At the RLH, there was a short stay ward adjacent to the day theatres
for patients coping poorly with the effects of the surgery, but most patients would
go straight to the discharge lounge and return home after as little as 20 minutes
there. In contrast to the main theatres where patients were bedbound, day theatre
patients were moved about using trolleys which proved more flexible and easier to
push for staff. The official operating hours of the RLH Day theatres corresponded
to those of planned surgery within the main theatres and while day theatre staff
were faced with similar challenges from unstable patients and overrunning lists, the
departmental electricity profile confirmed that they were able to go home at 6pm
more often (Figure 4.7).
8 The difference in measurement areas for the departments (one theatre suite at NUH, five suitesat RLH) influenced load diversity: Measured peak loads were hence much higher in NUH.
103

4 Analysis context: Arrangements of different hospital departments
4.4.2 Spatial arrangements
Operating theatres follow a consistent layout supportive to the logistics of surgery
(see Figure 4.8 for a typical operating theatre suite): patients in beds or trolleys
enter the theatre suite through the anaesthetic room where they are put to sleep
by anaesthetist and anaesthetic nurse/operating department practitioner (ODP).
Meanwhile, the surgeon and his team (generally up to two assistants to the surgeon,
two to three scrub nurses and a support worker) enter the theatre through the scrub
room where they wash and disinfect themselves in order to become sterile. The sur-
gical instruments are prepared and disinfected in the preparation room, sometimes
also referred to as laying up room. After surgery, the patient is taken into recovery
for post anaesthetic care through the main theatre doors while the next patient may
be prepared in the anaesthetics room.
All visited theatres at RLH and NUH corresponded well to the recommended lay-
out, with slight deviations in access arrangements for preparation rooms and the
provision of dirty utilities. The most notable difference was the size of the provided
facilities with NUH being much more spatially constrained: The average operating
theatres at Newham had only 37.6 m2 as opposed to 57.5 m2 (RLH Main Theatres)
and 56.4 m2 (RLH Day theatres) while a standard size of 55 m2 is recommended for
all inpatient operating theatres (NHS Estates, 2004c). All other NUH rooms were
also found to be much smaller than at RLH while both interviewed NUH theatre
staff pointed out that the lack of space at times complicated patient care.
Figure 4.7: Weekday electricity consumption profile of RLH Day Theatres
104

4 Analysis context: Arrangements of different hospital departments
Figure 4.8: Room layout for a typical operating theatre suite with individual scrubroom according to design guide lines(Schematic from NHS Estates (2004c, p.26), directions of movement added by author)
Theatres were on the whole found to be rather electricity intensive areas (see
Figure 4.6 for loads). They had high base loads which compared well across the
two investigated main theatres. The use of medical equipment during surgery and
requirements for facilities such as ultra clean ventilation (UCV) canopies (see sec-
tion 5.2 for further details on UCV) are believed to be decisively defined by the
surgical speciality9 (NHS Estates, 2004c).
9 To give but one example, orthopaedic surgeries may only be carried out in theatres equippedwith UCV canopies because any infection risks rejection of implanted components. Orthopaedicsurgeries tend to be rather long with average case times of two hours while requiring frequentimaging (typically using mobile X-ray) to ensure correct implant positioning. On the otherhand, minimal invasive surgeries using for example endoscopic ‘keyhole’ techniques are becomingincreasingly popular in surgical specialities such as urology (focuses on diseases of the male andfemale urinary tract system and the male reproductive organs) and otolaryngology (deals withdisorders and conditions of the ear, nose, and throat region and related areas of the head andneck). Minimal invasive surgery is much quicker and up to 30 patients can be seen daily, oftenas day-case procedures in rooms more akin to regular treatment rooms than to fully equippedoperating theatres.
105
4 Analysis context: Arrangements of different hospital departments
In this study, operational data from the Trust’s accounting system was available for
the NUH Theatres providing details on actual theatre use by list speciality. It could
be shown that periods of high local electricity use (with loads exceeding 60 W m−2
in Figure 4.6, right) reliably corresponded to trauma or fracture lists while gen-
eral or ear, nose and throat surgery seemed to be less electricity intensive10. Day
theatres, where many patients are operated using local anaesthesia only, were also
less electricity intensive overall due to less specialist ventilation arrangements and
fewer medical appliances.
Other electrical equipment typically in use in theatre departments included cold
storage, warming cabinets, the anaesthetic machines in theatres and anaesthetic
rooms, the IT equipment for the documentation of procedures and the surgical task
lighting, controllable both locally by the surgeon and through the theatre panel.
The theatre panels also allowed for dimming other theatre lights as well for defining
temperature and humidity set-points, controlling blinds if applicable and operating
the UCV canopy while also featuring several warning lights for high medical gas
concentrations or fire.
Controlling the atmospheric concentrations of anaesthetic gases is crucial in theatre
departments to meet requirements on the control of substances hazardous to health
(COSHH). To this purpose, all visited theatres operated anaesthetic gas scaven-
ging systems (AGSS) serving both theatres and anaesthetic rooms11. Statements
of all stakeholder groups (clinical staff, technical staff and consultants) as well as
monitoring data confirmed the continuous running of AGSS in both case hospitals.
Theoretically, however, AGS pumps may be switched off out-of-hours by clinical
staff in both hospitals through a switch in the theatre panel.
10 Trauma and fracture lists generally ran at NUH on Tuesday mornings and Wednesday orThursday afternoons. In some hospitals, ear, nose and throat surgery is carried out mostlyin day theatres, confirming the reduced need for specialist ventilation and a resulting lowerelectricity use.
11 Literature indicates power ratings for AGS pumps between 500 W and 2.2 kW (Pierce et al.,2014), with pumps generally serving one or more theatres and adjacent anaesthetic rooms. Forthis study, the anaesthetic scavenging pumps serving two NUH theatre suites were monitoredover the course of four weeks. The average total load resulted 63.2 ± 1.8 W, drawn consistentlyat any time over the course of 24 hours. This seems little compared to the nominal load of1.8 kW per blower, but may be a result of a theatre retrofit reducing the area scavenged from.At RLH, AGSS electricity use estimates are based on manufacturer specifications.
106

4 Analysis context: Arrangements of different hospital departments
4.5 Treatment: Day Units
Outpatients departments (OPD) are visited by a larger number of people than any
other part of a hospital and could be considered the hospital’s ‘shop-windows’ (NHS
Estates, 2004b). Appearance and running of both the building and the service are
therefore particularly important there as initial impressions might remain. High
patient throughputs, however, can put pressure on the spaces. In general, OPDs
have three major functions:
1. specialist consultation and examination;
2. treatments not requiring acute day or inpatient ward stays;
3. screening of patients, pre-operative assessments and follow-ups for treatments
elsewhere in the hospital.
This study focused on the second type of outpatient departments, also knowns as
‘day units’, because the energy demand of OPDs undertaking primarily assessments
and consultations was expected to be less specialist and more akin to settings already
comparatively well researched in the context of smaller health care premises and of-
fices (e.g. Murray et al., 2008).
Two examples of treatment-focused OPDs were investigated12: the outpatient hae-
modialysis unit at RLH and the outpatient chemotherapy unit at KCH. Haemo-
dialysis is one possible treatment for patients whose kidneys are in a state of renal
failure. It involves diverting blood into an external machine, where it is filtered to re-
move waste products such as creatinine and urea before being returned to the body.
Established renal patients on maintenance haemodialysis attend the unit three times
per week with each session lasting around four hours (Department of Health, 2013).
Chemotherapy is the repeated use of cytotoxic drugs to destroy cancer cells during
4 to 8 treatment cycles over the course of 3 to 6 months (Cancer Research UK, 2015).
Depending on the drug and the type of cancer, there are many ways to administer
the anti-cancer drugs including as injection into a vein, or orally as capsule or tablet.
In day units, intravenous infusions over anything from 30 minutes to several hours
are used while the drugs are injected into the patients veins by infusion pumps at
carefully controlled rates. For cancer that has spread to the brain or spinal cord, the
chemotherapy is inserted directly into the patient’s cerebrospinal fluid via a lumbar
puncture. This procedure takes about 20 minutes and needs to take place is a sep-
arate, permanently designated area for intrathecal chemotherapy.
12 Due to practical challenges (service provision, access constraints) it was not possible to workwith two departments of the exact same nature within the case study hospitals.
107

4 Analysis context: Arrangements of different hospital departments
4.5.1 Logistical arrangements
As opposed to laboratories, theatres and most imaging departments which feature at
least some 24/7 spaces, day units are characterised by defined operating and clear
after-hours. The RLH Haemodialysis day unit operated between 7am and 11pm
from Monday to Saturday (closed on Sundays), while the KCH Chemotherapy day
unit had a more confined rhythm and opened Monday to Friday from 9am to 5pm
only. The closed day(s) electricity profiles for both units confirmed the absence
of activity with median electricity use levels corresponding to the base load, while
some instances of energy use exceeding base load consumption levels were noted in
particular at KCH.
The electricity profile of the RLH outpatient haemodialysis unit during the week
(Figure 4.9) showed distinct peaks at 6am, 12 noon and 5pm which were attributed
to the heat disinfection of the approximately 30 haemodialysis machines13. The
unit offered three dialysis shifts daily including a twilight shift from 5pm to 10pm
on about half of the machines in order to meet the increasing demand for the ser-
vice as well as accommodating renal patients who are still actively working. This is
typical for renal units in urban centres where patient preference and local transport
links for both patients and staff make such provision feasible (Department of Health,
2013).
Clinical staff worked 11.5 hour shifts, from either 7am to 6:30pm or from 11:30am
to 11pm. During this time, dialysis machines were in constant use cycling between
heat disinfection, preparation (also referred to as priming or lining), treatment and
chemical disinfection. A number of different dialysis machine brands were found to
be in use at the RLH (different models primarily by the manufacturers Gambro and
Fresenius) of which newer types were reported by clinical staff and renal technicians
to automatically power down after the last disinfection cycle while older machines
had to be switched off manually. In the mornings, all machines were set to come on
automatically and perform their first heat disinfection around 6:30am to be ready
for preparation by health care assistants from 7am.
13 According to Connor et al. (2011, and other unpublished data by the same author), dialysismachines use 0.6 - 1 kWh during 30 minutes of heat disinfection while the electricity use duringthe actual treatment was about half of that (1.5 - 2 kWh per four hours). This is in linewith measurements by Jensen and Petersen (2011) (1.8 kW during heat disinfection, 0.6 kWduring treatment) and taking into account some diversity in machine use as well as the expectedelectricity use for lighting and IT equipment explains the observed profile well. Understandingsuch characteristics of hospital departments can be important from an energy managementperspective when making sense of the increasingly available smart and sub-meter data.
108
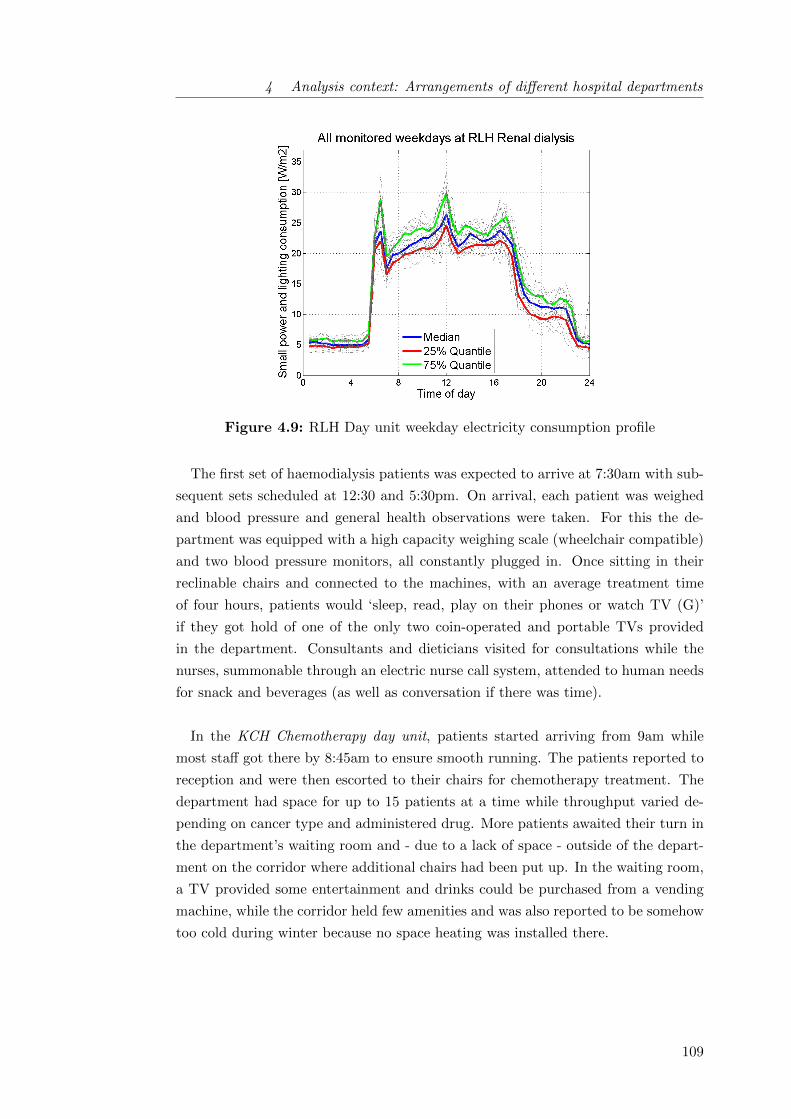
4 Analysis context: Arrangements of different hospital departments
Figure 4.9: RLH Day unit weekday electricity consumption profile
The first set of haemodialysis patients was expected to arrive at 7:30am with sub-
sequent sets scheduled at 12:30 and 5:30pm. On arrival, each patient was weighed
and blood pressure and general health observations were taken. For this the de-
partment was equipped with a high capacity weighing scale (wheelchair compatible)
and two blood pressure monitors, all constantly plugged in. Once sitting in their
reclinable chairs and connected to the machines, with an average treatment time
of four hours, patients would ‘sleep, read, play on their phones or watch TV (G)’
if they got hold of one of the only two coin-operated and portable TVs provided
in the department. Consultants and dieticians visited for consultations while the
nurses, summonable through an electric nurse call system, attended to human needs
for snack and beverages (as well as conversation if there was time).
In the KCH Chemotherapy day unit, patients started arriving from 9am while
most staff got there by 8:45am to ensure smooth running. The patients reported to
reception and were then escorted to their chairs for chemotherapy treatment. The
department had space for up to 15 patients at a time while throughput varied de-
pending on cancer type and administered drug. More patients awaited their turn in
the department’s waiting room and - due to a lack of space - outside of the depart-
ment on the corridor where additional chairs had been put up. In the waiting room,
a TV provided some entertainment and drinks could be purchased from a vending
machine, while the corridor held few amenities and was also reported to be somehow
too cold during winter because no space heating was installed there.
109

4 Analysis context: Arrangements of different hospital departments
Figure 4.10: KCH day unit weekday electricity consumption profile(includes lighting, small power and comprehensive split units for space conditioning.)
In both day units, the cleaning was reported to take place partly in the morn-
ings (dusting, changing bin liners) but mainly in the evenings after the department
closed. At KCH, this resulted in above base-line electricity use on weekdays past
5pm and up until 8pm due to continued lighting and split unit use (Figure 4.10).
This corresponded to interviewed staff’s notion that domestic staff were coming in as
they were leaving, meaning lights were mostly left on for them. At RLH, Carillion,
the sub-contractor in charge of cleaning, confirmed that domestic staff would start
in renal at 6am but do the mopping from 10pm to avoid accidents on slippery floors.
Due to the longer operating hours, cleaner influence on electricity seemed overall
less pronounced here than at KCH.
4.5.2 Spatial arrangements
Although function and operating hours varied for the two investigated outpatient
departments, the spatial configuration was found to be comparable. The main treat-
ment took place in open plan bays in which views and natural daylight were import-
ant design considerations to ensure patient comfort and well-being. Curtains could
be used as non-fixed partitions to flexibly separate spaces to ensure patient privacy
as well as staff-to-patient and staff-to-staff confidentiality. Apart from the respect-
ive medical equipment (haemodialysis machines or chemotherapy infusion pumps),
all patients had reading lights enabling them to control the lighting levels in their
immediate environment.
110
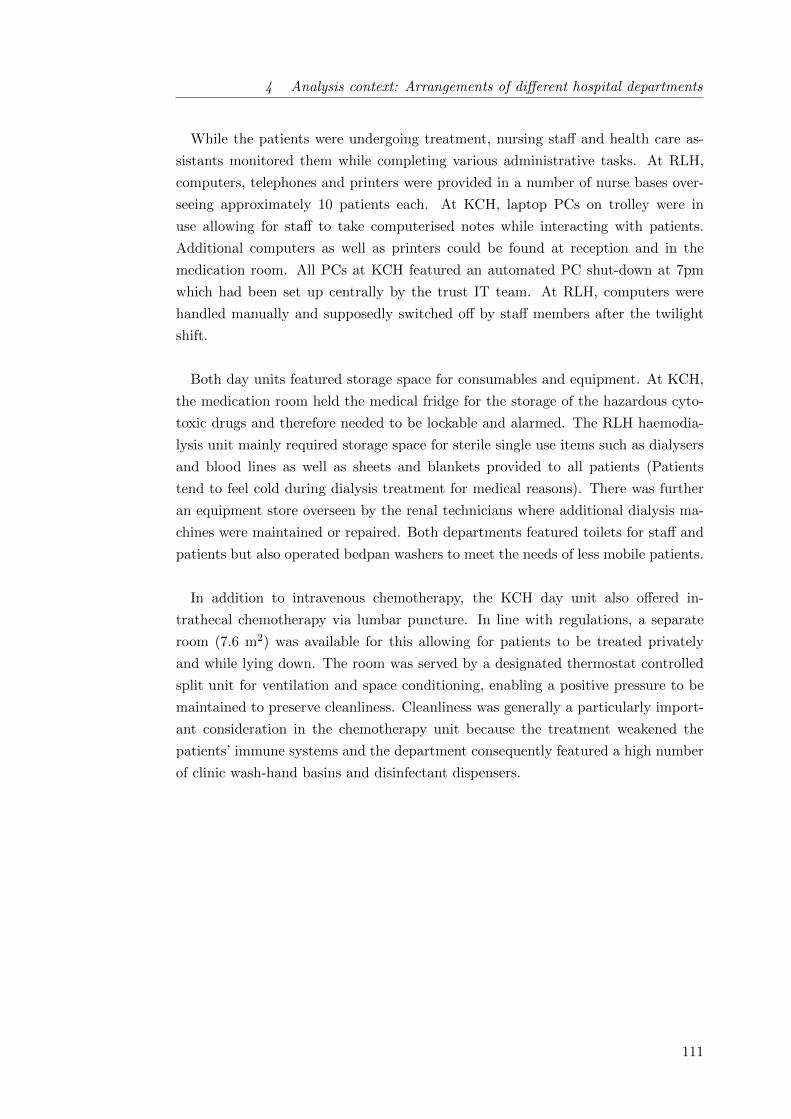
4 Analysis context: Arrangements of different hospital departments
While the patients were undergoing treatment, nursing staff and health care as-
sistants monitored them while completing various administrative tasks. At RLH,
computers, telephones and printers were provided in a number of nurse bases over-
seeing approximately 10 patients each. At KCH, laptop PCs on trolley were in
use allowing for staff to take computerised notes while interacting with patients.
Additional computers as well as printers could be found at reception and in the
medication room. All PCs at KCH featured an automated PC shut-down at 7pm
which had been set up centrally by the trust IT team. At RLH, computers were
handled manually and supposedly switched off by staff members after the twilight
shift.
Both day units featured storage space for consumables and equipment. At KCH,
the medication room held the medical fridge for the storage of the hazardous cyto-
toxic drugs and therefore needed to be lockable and alarmed. The RLH haemodia-
lysis unit mainly required storage space for sterile single use items such as dialysers
and blood lines as well as sheets and blankets provided to all patients (Patients
tend to feel cold during dialysis treatment for medical reasons). There was further
an equipment store overseen by the renal technicians where additional dialysis ma-
chines were maintained or repaired. Both departments featured toilets for staff and
patients but also operated bedpan washers to meet the needs of less mobile patients.
In addition to intravenous chemotherapy, the KCH day unit also offered in-
trathecal chemotherapy via lumbar puncture. In line with regulations, a separate
room (7.6 m2) was available for this allowing for patients to be treated privately
and while lying down. The room was served by a designated thermostat controlled
split unit for ventilation and space conditioning, enabling a positive pressure to be
maintained to preserve cleanliness. Cleanliness was generally a particularly import-
ant consideration in the chemotherapy unit because the treatment weakened the
patients’ immune systems and the department consequently featured a high number
of clinic wash-hand basins and disinfectant dispensers.
111
4 Analysis context: Arrangements of different hospital departments
Apart from specialist energy requirements for machines (RLH) and ventilation
(KCH), the investigated treatment units required further engineering services: Hae-
modialysis creates considerable amounts of waste requiring strategic disposal as well
as complex water services including water treatment. Chemotherapy also relies on
specialist waste disposal arrangements due to the toxicity of the involved drugs. As
for standard electricity uses, ceiling lights were controlled manually at KCH, while
staff had full control over temperatures through room thermostats. In contrast,
space heating and cooling were controlled centrally at RLH; corridor, store and util-
ity room lights were sensor controlled and only the ceiling lights in the treatment
bays could be influenced by clinical staff through conventional light switches.
4.6 Care: Inpatient accommodation on wards
Historically, inpatient accommodation has been at the core of acute hospitals. Des-
pite current trends aimed at shifting care into community settings, inpatient accom-
modation - in particular for complex cases or where major surgery requiring general
anaesthesia is required - still accounts for a significant proportion of space in general
acute hospitals (Department of Health, 2013). Wards, internationally sometimes
referred to as ‘inpatient units’, are composed of patient bedrooms and the spaces
that support them including utility rooms, nurse or touchdown bases, storage spaces
and potentially food reheating facilities.
Some difference in electricity intensity can be expected between general wards,
intermediate care or so-called step-down units and intensive care wards such as stroke
or critical care units. In the latter, respiratory care services need to be available
around the clock and monitoring is higher, with one trained critical care nurse in
charge of only one or two patients as opposed to typically eight patients on general
wards (RCN 2012). In this study, two general surgical wards were investigated at
NUH and KCH, which - as opposed to more specialist wards associated with specific
treatment centres - assume care for most post-surgical patients.
112
4 Analysis context: Arrangements of different hospital departments
4.6.1 Logistical arrangements
Wards are characterised by their continued occupation regardless of time of day,
week or year providing continuous medical observation and care for patients before,
during and after treatment. From an energy perspective week and weekend days
were found to differ little on the investigated wards; the average electricity use on
weekdays was 1.03 and 1.05 times that of weekend days at NUH and KCH respect-
ively. Clinically, there were some difference in that less planned patient admissions
and discharges took place over the weekend and fewer doctors as well as nurses were
around. On both wards, the fieldwork for this study also took place during a week-
end because staff nurses thought this more convenient.
The rhythm of ward activity was determined by the admitted patients who were
often acutely ill and in need of observation. Each ward nevertheless had routines in
place which were found to be both very comparable between the investigated wards
and in line with available guidance (e.g. Department of Health, 2013). Clinical
staff worked 13 hour shifts, starting at 7:30am to allow for a one hour overlap with
the night shift to compare notes on patient status (‘handover’). Patients needing
medication were woken by the night staff from 6am while others might sleep until
breakfast, at around 8am. Mornings were generally perceived by ward staff to be the
busiest time due to many imminent tasks including washing, dressing and feeding
incapacitated patients as well as preparing medications. Daily, all patients were also
seen by their doctors during the mornings while visitors were welcome between 2pm
and 8pm in the afternoons. In the evenings, patients were expected to sleep from
11pm the latest and this was promoted by a reduction in bay lighting to night levels
(see Figure 4.11 for the KCH profile as one example).
113

4 Analysis context: Arrangements of different hospital departments
Figure 4.11: Electricity consumption profile of KCH general surgical ward(includes lighting, small power and comprehensive split units for space conditioning.)
Table 4.3: Mealtimes at investigated wards
Mealtimes NUH KCH
Breakfast 8am to 9am 7.45am to 8.45amLunch 12 to 1pm 12 to 1pmSupper 5pm to 6pm 6pm to 7pmSnacks & Hot drinks 10am, 3pm, 6:30pm & 7:30pm Served all day on request
Meals were served three times a day (Table 4.3) by domestic staff who also helped
patients to choose their daily meals taking into account medical diet restrictions.
The energy use profiles of the investigated departments differed somehow due to dif-
fering means to re-heat patient meals locally after they had been prepared in central
catering facilities. NUH used a regeneration kitchen, an equipment item previously
identified to be comparatively energy intensive for a ward14. The NUH ward’s elec-
tricity use profile (Figure 4.12) correspondingly showed a pronounced peak at lunch
and dinner time, while at KCH less energy intensive commercial microwaves were
used for food reheating and peaks hence less pronounced. After lunch, the NUH
ward observed a period of quiet time dimming lights and switching off TVs to allow
patients to get some rest which also resulted in lower electricity use.
14 Building Research Energy Conservation Support Unit (BRECSU) (1996) for instance estimatean annual electricity use of 328 kWh/bed (equivalent to 8 - 10 kWh/(m2 · yr)) while wards havesmall electricity requirements overall.
114
4 Analysis context: Arrangements of different hospital departments
Figure 4.12: Electricity consumption profile of NUH general surgical ward
The central kitchen preparing and distributing patient meals across the hospital
was only one of the central facilities maintaining logistical interactions with the
wards. There were also frequent dealings with the central pharmacy department to
stock up on medications and consumables such as syringes and needles as well as
with laundry services and central stores to obtain clean supplies of linen and others.
Bearing in mind the presence or visits of junior doctors, consultants and occupational
or physiotherapists, wards seemed to have maintained their role as hub of hospital
activity, further justifying their inclusion in this investigation despite comparatively
low overall electricity intensities.
4.6.2 Spatial arrangements
There are a number of important considerations for the design of ward spaces (De-
partment of Health, 2013):
1. Daylight: It has been established that daylight has beneficial effects on pa-
tient recovery, so all patient spaces should receive natural daylight. At the
same time, the efficient use of daylight (i.e. minimising the use of artificial
lighting) seemed a promising energy savings strategy on wards.
2. Observation: The distance between patient rooms and staff workstations
should be minimal to enable the observation of critically ill patients. Views into
busy internal spaces such as circulation areas can further provide a distraction
for patients in addition to views of the outside world.
115
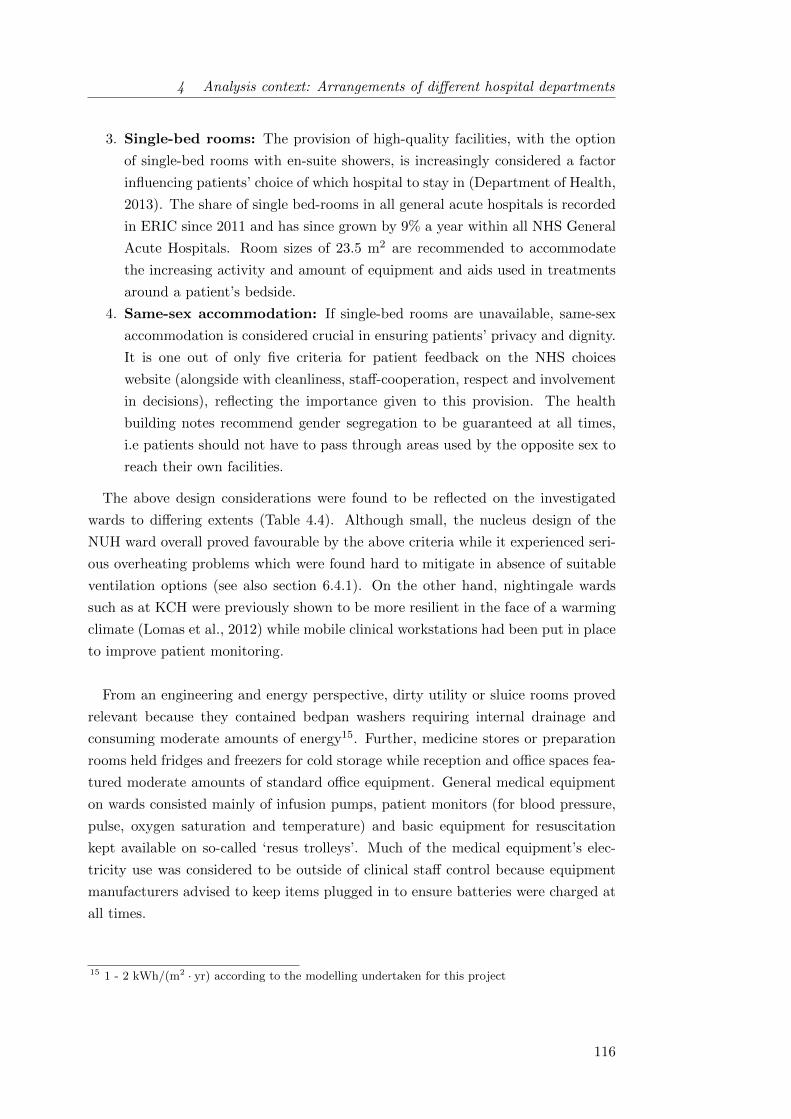
4 Analysis context: Arrangements of different hospital departments
3. Single-bed rooms: The provision of high-quality facilities, with the option
of single-bed rooms with en-suite showers, is increasingly considered a factor
influencing patients’ choice of which hospital to stay in (Department of Health,
2013). The share of single bed-rooms in all general acute hospitals is recorded
in ERIC since 2011 and has since grown by 9% a year within all NHS General
Acute Hospitals. Room sizes of 23.5 m2 are recommended to accommodate
the increasing activity and amount of equipment and aids used in treatments
around a patient’s bedside.
4. Same-sex accommodation: If single-bed rooms are unavailable, same-sex
accommodation is considered crucial in ensuring patients’ privacy and dignity.
It is one out of only five criteria for patient feedback on the NHS choices
website (alongside with cleanliness, staff-cooperation, respect and involvement
in decisions), reflecting the importance given to this provision. The health
building notes recommend gender segregation to be guaranteed at all times,
i.e patients should not have to pass through areas used by the opposite sex to
reach their own facilities.
The above design considerations were found to be reflected on the investigated
wards to differing extents (Table 4.4). Although small, the nucleus design of the
NUH ward overall proved favourable by the above criteria while it experienced seri-
ous overheating problems which were found hard to mitigate in absence of suitable
ventilation options (see also section 6.4.1). On the other hand, nightingale wards
such as at KCH were previously shown to be more resilient in the face of a warming
climate (Lomas et al., 2012) while mobile clinical workstations had been put in place
to improve patient monitoring.
From an engineering and energy perspective, dirty utility or sluice rooms proved
relevant because they contained bedpan washers requiring internal drainage and
consuming moderate amounts of energy15. Further, medicine stores or preparation
rooms held fridges and freezers for cold storage while reception and office spaces fea-
tured moderate amounts of standard office equipment. General medical equipment
on wards consisted mainly of infusion pumps, patient monitors (for blood pressure,
pulse, oxygen saturation and temperature) and basic equipment for resuscitation
kept available on so-called ‘resus trolleys’. Much of the medical equipment’s elec-
tricity use was considered to be outside of clinical staff control because equipment
manufacturers advised to keep items plugged in to ensure batteries were charged at
all times.
15 1 - 2 kWh/(m2 · yr) according to the modelling undertaken for this project
116
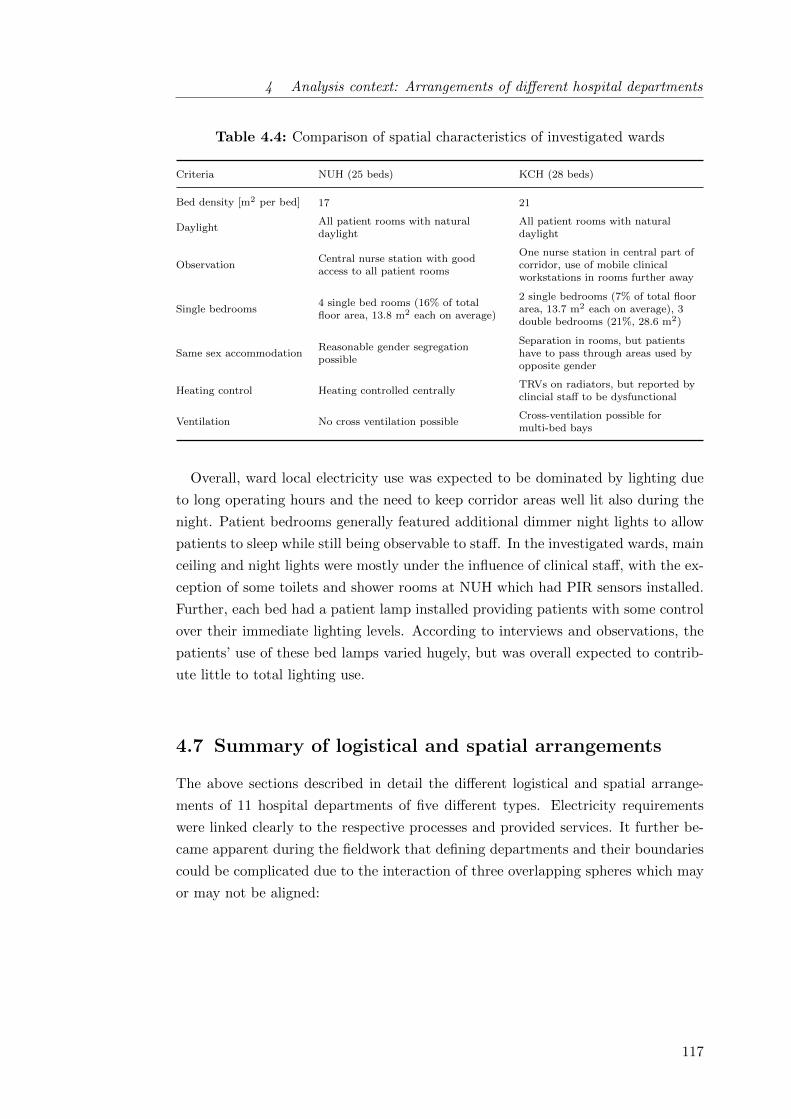
4 Analysis context: Arrangements of different hospital departments
Table 4.4: Comparison of spatial characteristics of investigated wards
Criteria NUH (25 beds) KCH (28 beds)
Bed density [m2 per bed] 17 21
DaylightAll patient rooms with naturaldaylight
All patient rooms with naturaldaylight
ObservationCentral nurse station with goodaccess to all patient rooms
One nurse station in central part ofcorridor, use of mobile clinicalworkstations in rooms further away
Single bedrooms4 single bed rooms (16% of totalfloor area, 13.8 m2 each on average)
2 single bedrooms (7% of total floorarea, 13.7 m2 each on average), 3double bedrooms (21%, 28.6 m2)
Same sex accommodationReasonable gender segregationpossible
Separation in rooms, but patientshave to pass through areas used byopposite gender
Heating control Heating controlled centrallyTRVs on radiators, but reported byclincial staff to be dysfunctional
Ventilation No cross ventilation possibleCross-ventilation possible formulti-bed bays
Overall, ward local electricity use was expected to be dominated by lighting due
to long operating hours and the need to keep corridor areas well lit also during the
night. Patient bedrooms generally featured additional dimmer night lights to allow
patients to sleep while still being observable to staff. In the investigated wards, main
ceiling and night lights were mostly under the influence of clinical staff, with the ex-
ception of some toilets and shower rooms at NUH which had PIR sensors installed.
Further, each bed had a patient lamp installed providing patients with some control
over their immediate lighting levels. According to interviews and observations, the
patients’ use of these bed lamps varied hugely, but was overall expected to contrib-
ute little to total lighting use.
4.7 Summary of logistical and spatial arrangements
The above sections described in detail the different logistical and spatial arrange-
ments of 11 hospital departments of five different types. Electricity requirements
were linked clearly to the respective processes and provided services. It further be-
came apparent during the fieldwork that defining departments and their boundaries
could be complicated due to the interaction of three overlapping spheres which may
or may not be aligned:
117

4 Analysis context: Arrangements of different hospital departments
• The functional sphere: Primarily, departments were organisational units
dividing the larger hospital into parts with specific responsibilities. They were
defined by the structures of each NHS trust, but remained essentially virtual
units open to re-organisation as seen for example at NUH after the hospital
became part of the Barts Health NHS Trust.
• The physical sphere: Departments were also defined by their physical
boundaries, i.e. the spaces they occupied. Such boundaries were found to
be more pronounced in nucleus (NUH) and nightingale (KCH) designs where
individual departments tended to occupy entire wings of the building, while
the deep plan design of the RLH resulted in several departments overlapping
in each building part. The electricity use and how well it could be measured
also related to the physical sphere in so far that distribution boards did not
always align with the organisational definition of departments, in particular at
the RLH.
• The social sphere: Finally, the reality of hospitals as a workplace for clinical
staff proved to not necessarily be bound to departments, neither as organisa-
tional nor as spatial units. While staff for example on wards tended to be
quite firmly associated with their domain, those trained in certain imaging
modalities or surgical specialities might work in different departments across
the hospital or even across different hospitals depending on the rota.
To overcome the challenge of a fuzzy definition of departments, further analysis was
guided by spatial arrangements focusing on core as opposed to support spaces while
issues resulting in particular from the third of the above points (‘the social sphere’)
are discussed in more detail in chapter 6.
As for core activity spaces, large variations were found between different depart-
ment types. Within each department type, however, there was reasonable agreement
across different hospitals since hospital spaces are coherently designed to be support-
ive of the logistics of health care processes. This suggested that, despite potential
delimitation difficulties, departments rather than whole buildings posed a sensible
unit for the analysis of hospitals (and potentially other heterogeneous and complex
building types). Such choice of unit of analysis allowed for obtaining scalable but
meaningful results and the identification of transferable factors for building opera-
tion and energy conservation.
118
4 Analysis context: Arrangements of different hospital departments
Figure 4.13: Overview of use of space in all investigated departments16
Notable in most investigated departments, in particular those operating 24/7, was
the heterogeneous use of space (Figure 4.13). All continuously operating department
types such as theatres, laboratories and emergency imaging also contained spaces
with more standard hours (e.g. between 9am and 5pm on weekdays only) resulting
in floor area weighted opening hours well below 8760 h/yr (see also Table 4.1). This
suggested that even those department types might include spaces and equipment
items with some switch-off potential, as further discussed in the next chapter 5.
16 This diagram type will be used extensively in the following chapter(s) to represent findings ofthe case study investigation. In all of them, two information items are presented for each casestudy department (x-axis), on the primary and secondary y-axes respectively depending on theleading narrative:
• Stacked columns: The contribution of different categories towards a total of 100% ispresented for each department. In this figure (4.13), the primary axis shows how spaces withdifferent annual operating hours build up the total floor space of each department.
• Absolute value: Here (Figure 4.13), the secondary y-axis shows the mean value for theentire department, allowing a comparison between departments on the whole.
119

5 Influence of clinical staff
on hospital electricity use
This first findings chapter addresses the research objective i. It investigates the
theoretical extent of clinical staff influence on departmental electricity use and es-
timates the theoretical maximum savings potential from simple changes in clinical
operation for each department, identifying transferable drivers. The findings result
primarily from quantitative analysis: As laid out in section 3.4.2, the understanding
of local electricity use for each department was built from the top-down analysis of
measured electricity use as well as a bottom-up end-use model based on a detailed
audit of lighting and appliances use. For central energy requirements, it is drawn
on literature and qualitative data as few quantitative data were collected as part of
this study.
5.1 Drivers of centralised and local electricity requirements . . . . . . . . 122
5.2 Clinical staff influence on central electricity requirements . . . . . . . 124
5.3 Clinical staff influence on local electricity requirements . . . . . . . . 127
5.3.1 Top-down analysis of departmental electricity use . . . . . . . 127
5.3.2 Validity of departmental bottom-up representations . . . . . 130
5.3.3 Local electricity use in different department types . . . . . . 134
5.3.4 Means of clinical staff control over local electricity use . . . . 134
5.4 Theoretical electricity savings potentials . . . . . . . . . . . . . . . . 138
5.5 Summary of quantitative findings . . . . . . . . . . . . . . . . . . . . 142
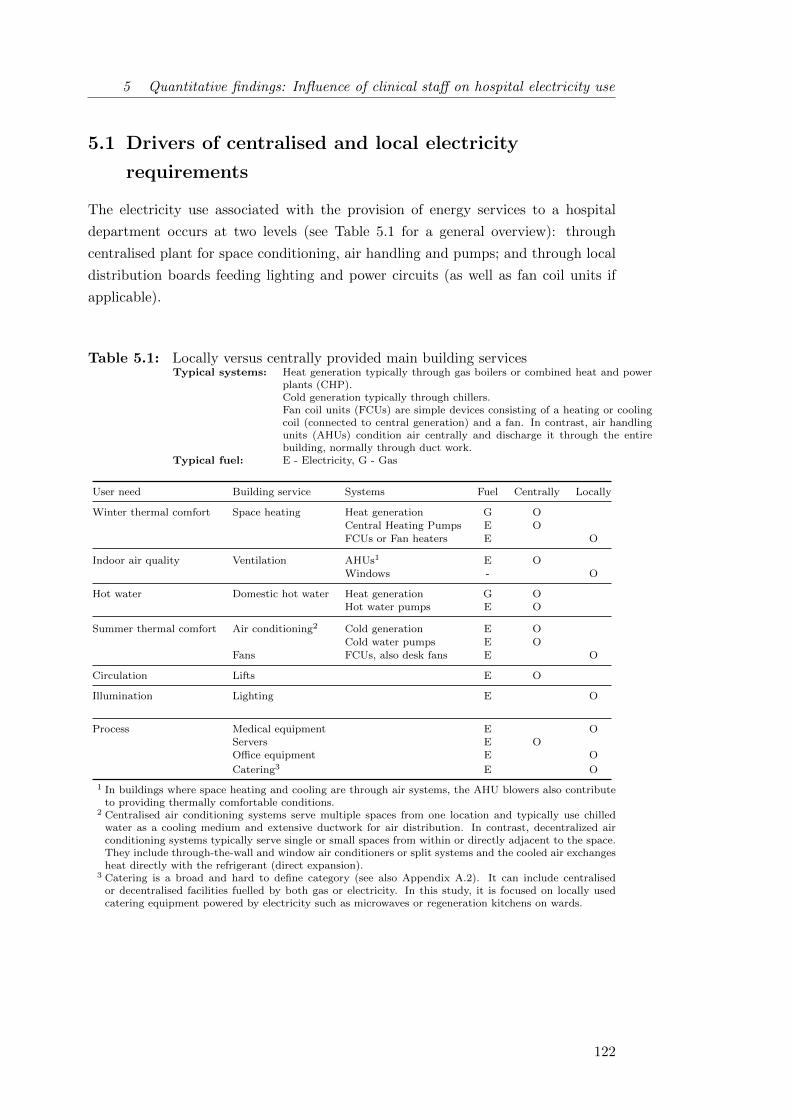
5 Quantitative findings: Influence of clinical staff on hospital electricity use
5.1 Drivers of centralised and local electricity
requirements
The electricity use associated with the provision of energy services to a hospital
department occurs at two levels (see Table 5.1 for a general overview): through
centralised plant for space conditioning, air handling and pumps; and through local
distribution boards feeding lighting and power circuits (as well as fan coil units if
applicable).
Table 5.1: Locally versus centrally provided main building servicesTypical systems: Heat generation typically through gas boilers or combined heat and power
plants (CHP).Cold generation typically through chillers.Fan coil units (FCUs) are simple devices consisting of a heating or coolingcoil (connected to central generation) and a fan. In contrast, air handlingunits (AHUs) condition air centrally and discharge it through the entirebuilding, normally through duct work.
Typical fuel: E - Electricity, G - Gas
User need Building service Systems Fuel Centrally Locally
Winter thermal comfort Space heating Heat generation G OCentral Heating Pumps E OFCUs or Fan heaters E O
Indoor air quality Ventilation AHUs1 E OWindows - O
Hot water Domestic hot water Heat generation G OHot water pumps E O
Summer thermal comfort Air conditioning2 Cold generation E OCold water pumps E O
Fans FCUs, also desk fans E O
Circulation Lifts E O
Illumination Lighting E O
Process Medical equipment E OServers E OOffice equipment E O
Catering3 E O
1 In buildings where space heating and cooling are through air systems, the AHU blowers also contributeto providing thermally comfortable conditions.
2 Centralised air conditioning systems serve multiple spaces from one location and typically use chilledwater as a cooling medium and extensive ductwork for air distribution. In contrast, decentralized airconditioning systems typically serve single or small spaces from within or directly adjacent to the space.They include through-the-wall and window air conditioners or split systems and the cooled air exchangesheat directly with the refrigerant (direct expansion).
3 Catering is a broad and hard to define category (see also Appendix A.2). It can include centralisedor decentralised facilities fuelled by both gas or electricity. In this study, it is focused on locally usedcatering equipment powered by electricity such as microwaves or regeneration kitchens on wards.
122
5 Quantitative findings: Influence of clinical staff on hospital electricity use
As discussed in section 1.1, space heating, usually by fossil fuel, is the largest
component of energy usage in hospitals. It is however very dependent on the build-
ing envelope and the system efficiency, which is largely dictated by hospital age
plus any retrofit improvements. Electricity use for ventilation and cooling will very
much depend on system design and space usage - in particular whether mechanical
ventilation and air conditioning is used, which in turn relates partially to built form
(narrow or deep plan). The need for vertical transportation is also primarily defined
by the building design. The influence of clinical staff on central heat and electricity
requirements is therefore expected to be somehow limited, while facilities manage-
ment as well as strategic retrofit improvements seem crucial in achieving reductions
in the energy used for centrally supplied building services.
In contrast, electrical energy use for lighting is thought to be much more inde-
pendent of building design and system age. Window design will be important in
areas with daylight and replacement cycles influence installed lighting technologies.
But lighting requirements are additionally also influenced by lighting controls as well
as their utilisation and other operational practices. Small power use may be largely
independent of building age and form and therefore more consistent across hospitals,
depending instead on department type, operational hours and intensity of use, such
as bed density on wards.
The influence of clinical staff on local electricity requirements was therefore ex-
pected to be somehow more pronounced, and local rather than central electricity
requirements were consequently the focus of this study. The following sections nev-
ertheless provide a discussion of both categories for the investigated case study hos-
pitals to provide some understanding of the complete picture, but the analysis of
central requirements and clinical staff influence on them is kept brief. It will draw
mainly on literature and qualitative data as few quantitative data on central energy
requirements were collected as part of this study.
123

5 Quantitative findings: Influence of clinical staff on hospital electricity use
5.2 Clinical staff influence on central electricity
requirements
Space heating and domestic hot water In all investigated case hospitals (sec-
tion 3.3.2), space heating and domestic hot water was provided by gas fired boilers
only (RLH, NUH) or in combination with a combined heat and power plant (KCH).
This study focused on electricity use as large cost to NHS trusts. Although sig-
nificant in terms of carbon emissions (see also Table 3.2), space heating therefore
remained largely outside of the scope of this study.
Air conditioning In contrast, air conditioning was (at least partly) provided by
central electric chillers in all case hospitals. At KCH, practical challenges during
the retrofit of the oldest among the three case study hospitals had also resulted in
the use of split units1 for cooling in some spaces. According to statements by the
facilities managers, the chillers constituted large - if not the largest - single loads
in the investigated hospitals. Clinical staff control over central air conditioning was
absent or severely restricted2 in most investigated departments, with the exception
of operating theatres. For air conditioning, as well as for heating, temperature set-
points tended to be defined centrally by the building operators through the building
management system. These findings were in line with reports from consultants and
health engineers for other hospitals, suggesting limited occupant temperature con-
trol to be a characteristic feature of this building type.
1 See glossary.2 In the NUH laboratory, a room thermostat had initially been provided to control the air condi-
tioning in the main lab. Following disputes over operation and temperature settings resulting insystem problems, the thermostat was enclosed in a sealed plastic box by the estates departmentso that staff could no longer interact with it directly. Temperatures were now set centrally ascommon for the majority of other departments to begin with.
124

5 Quantitative findings: Influence of clinical staff on hospital electricity use
In theatres3, space conditioning requirements are known to be particularly strict
(EnCO2de, 2006). The Carbon Trust recommends operating theatre temperatures
between 17 and 19 ◦C while other hospital spaces may range between 19 and 24 ◦C
(Carbon Trust, 2011). No temperatures could be measured in this study due to
concerns about introducing data logging equipment in health critical environments.
The qualitative data however also illustrated the narrow band of acceptable tem-
peratures: when too cold, patients risked hypothermia and supplementary warming
equipment had to be used extensively; when too warm, the concentration of the
surgical team might be affected or, more dramatically, sweating could become prob-
lematic over open cases. According to theatre staff at RLH, theatre temperatures
between 18 to 21 ◦C were considered acceptable and it was stressed that higher
temperatures also increased infection risks. During the interviews, staff consistently
reported frequent interactions with the theatre panel in order to adjust temperat-
ures, while the effectiveness was sometimes questioned:
There is a control in the wall, but I don’t think it works properly to make
the temperature go down. (F)
Theatre staff at both RLH and NUH frequently called the estates team with heat-
ing or cooling (control) issues. In comparison, they did appear more content with
the speed of response than staff in other departments, potentially indicating a prior-
itization process within the facilities team. In all other department types, the estates
team was also the first port of call to adjust temperature set-points - either directly
or through calling the helpdesk. Influence on energy requirements from space con-
ditioning therefore lay with technical, but only very indirectly with clinical staff as
the following discussion of the related issue of ventilation affirms.
Ventilation All investigated departments contained a number of mechanically
ventilated spaces, while the RLH was fully mechanically ventilated. Windows could
not be opened there at all - a situation two out of the eight RLH interviewees stated
to dislike. At NUH and KCH, mechanical ventilation was concentrated in core
rooms and those with specialist ventilation requirements (e.g. laboratory or treat-
ment rooms using solvents or hazardous materials, sanitary facilities, etc.). Windows
in peripheral rooms could mostly be opened subject to safety restrictions in patient-
accessible areas (see Health Technical Memorandum 55 - ’Windows’).
3 It may be noted that this was the case only for the actual theatres but not for the rest of thedepartments.
125
5 Quantitative findings: Influence of clinical staff on hospital electricity use
This study found clinical staff to have no influence on energy requirements for
mechanical ventilation in the investigated hospitals generally. Air handling units
(AHUs) were controlled by the building management systems (BMS) operated by
the hospital’s estates department. Technical staff reported that the AHUs were set
to run continuously in 24 hour areas or on time schedules otherwise. In areas with
windows, some influence of clinical staff on energy requirements for heating or cool-
ing influence could be suspected. Reduced window opening while heating or cooling
systems are in operation has previously been pointed out in employee awareness
campaigns (see also Table 2.1 in section 2.1) while indoor air quality and smell is-
sues need to be considered.
In contrast to other department types, a share of ventilation electricity use may
be under end-user control in theatres4: all of the visited full and some of the day
theatres visited featured ultra-clean ventilation (UCV) canopies above the operating
zone inclosing patient, equipment and immediate surgery team. Ultra-clean ventil-
ation canopies discharge large volumes of clean air filtered through a high-efficiency
particulate air (HEPA) filter at vertical air velocities of 0.3 m s−1 to reduce airborne
bacteria in the operating zone and reduce post-operative sepsis following certain
orthopaedic procedures. At NUH, UCV canopy operation was controlled through
a manual switch in the theatre panel while at the RLH, PIR sensors supposedly
switched airflow and canopy lights from operational (100%) into stand-by mode
(50%) 15 to 20 minutes after the last activity was detected in theatres.
Energy requirements for ultra-clean ventilation are twofold: increased loads on
central air handling units and local electricity requirements for fans. While the elec-
tricity use for UCV fans could be measured locally (NUH) or estimated based on
manufacturer specifications (RLH), the increased load on air handling units from
ultra-clean ventilation is difficult to determine without full dynamic simulation. To
get at least some understanding of theatre ventilation requirements, the electricity
consumptions of the air handling units serving parts of the NUH theatre department
(two theatre suites) as well as some utility spaces in the theatre department and an
adjacent ward were measured as part of this study.
4 Theatres further feature specialist extract ventilation from theatre suites and anaesthetic roomsthrough anaesthetic gas scavening systems (AGS). In all investigated theatres, the scavengingpumps were controllable locally through on-off switches in the theatre panels (section 4.4.2).
126

5 Quantitative findings: Influence of clinical staff on hospital electricity use
The AHUs were found to be operating continuously irrespective of demand. As-
suming ventilation requirements were equal across theatre and ward spaces, AHU
electricity use amounted to 146 kWh/(m2 · yr) as opposed to 397 kWh/(m2 · yr) for
all local power and lighting. This number underestimates the energy required for
the ventilation of theatres as air change rates there are with 25 AC/h much higher
than on wards (5 AC/h, Department of Health, 2013a). Beier (2009) have previously
measured much higher electricity usage for theatre ventilation (364 kWh/(m2 · yr)
on average), with extremes of up to 1275 kWh/(m2 · yr) for continuously operating
AHUs. One promising strategy for reducing ventilation energy use in hospitals hence
consists in implementing demand driven operation of AHUs through good-practice
facilities management (CIBSE, 2015), similarly as suggested for other non-domestic
building types (e.g. Gul and Patidar, 2015).
Other hospital departments potentially featuring user-controlled specialist vent-
ilation were laboratories and imaging departments. Keeping fume cupboards in
laboratories closed is frequently discussed in the literature as one example of end-
user influence on building electricity use (Dodd and Padley, 1992; Hart et al., 2011;
Jensen and Petersen, 2011). However, none of the investigated laboratory spaces
had fume cupboards which are more common in chemical and microbiological labor-
atories. Further, local exhaust ventilation was traditionally required to remove haz-
ardous vapours from X-ray film processing units but has become obsolete in the age
of digital imaging (DoH, HTM 03-01).
5.3 Clinical staff influence on local electricity
requirements
Establishing the extent of local electricity use in different hospital buildings and
departments was one of the objectives of this study. As laid out in section 3.4.2,
the understanding of local electricity use was built from the top-down analysis of
measured departmental electricity usage in combination with a bottom-up end-use
model based on a detailed audit of lighting and appliances use.
5.3.1 Top-down analysis of departmental electricity use
Some initial characteristics of departmental electricity consumption (Table 5.2) could
be derived from the top-down analysis of the departmental electricity use profiles
(see chapter 4 for selected plots). This sections restricts itself to summarizing a
number of key points:
127
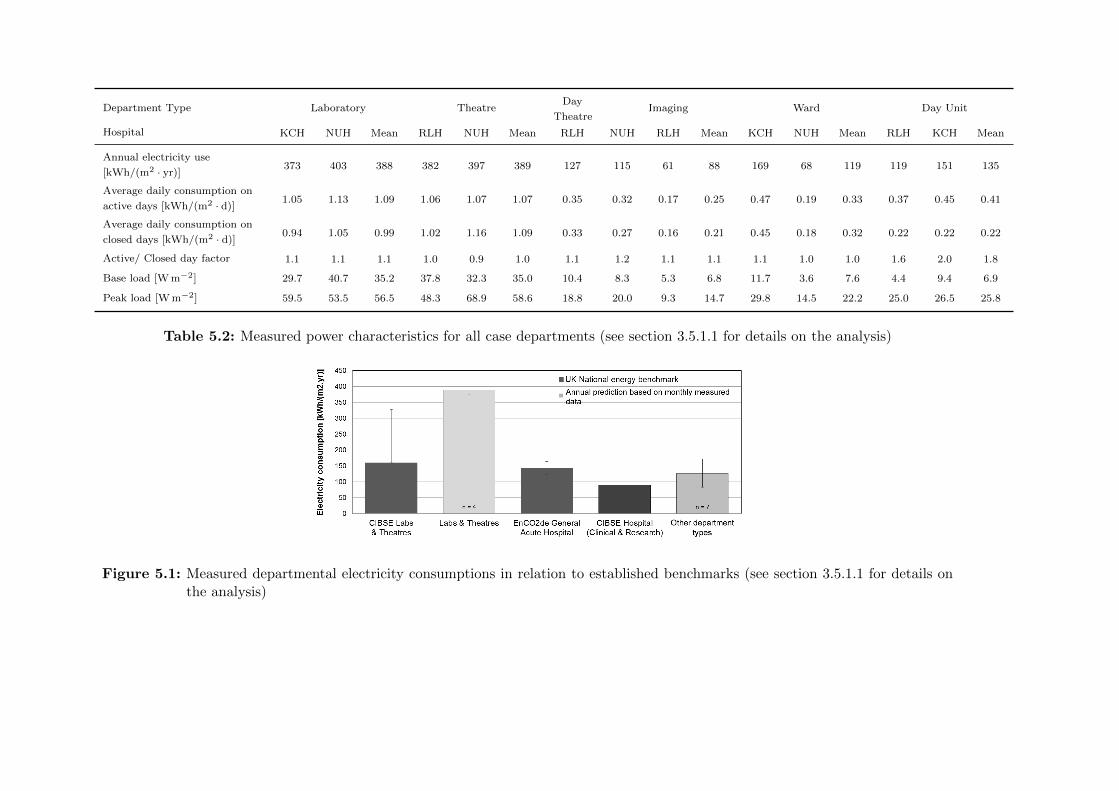
Department Type Laboratory TheatreDay
TheatreImaging Ward Day Unit
Hospital KCH NUH Mean RLH NUH Mean RLH NUH RLH Mean KCH NUH Mean RLH KCH Mean
Annual electricity use
[kWh/(m2 · yr)]373 403 388 382 397 389 127 115 61 88 169 68 119 119 151 135
Average daily consumption on
active days [kWh/(m2 · d)]1.05 1.13 1.09 1.06 1.07 1.07 0.35 0.32 0.17 0.25 0.47 0.19 0.33 0.37 0.45 0.41
Average daily consumption on
closed days [kWh/(m2 · d)]0.94 1.05 0.99 1.02 1.16 1.09 0.33 0.27 0.16 0.21 0.45 0.18 0.32 0.22 0.22 0.22
Active/ Closed day factor 1.1 1.1 1.1 1.0 0.9 1.0 1.1 1.2 1.1 1.1 1.1 1.0 1.0 1.6 2.0 1.8
Base load [W m−2] 29.7 40.7 35.2 37.8 32.3 35.0 10.4 8.3 5.3 6.8 11.7 3.6 7.6 4.4 9.4 6.9
Peak load [W m−2] 59.5 53.5 56.5 48.3 68.9 58.6 18.8 20.0 9.3 14.7 29.8 14.5 22.2 25.0 26.5 25.8
Table 5.2: Measured power characteristics for all case departments (see section 3.5.1.1 for details on the analysis)
Figure 5.1: Measured departmental electricity consumptions in relation to established benchmarks (see section 3.5.1.1 for details onthe analysis)

5 Quantitative findings: Influence of clinical staff on hospital electricity use
• Measured electricity consumption varied widely across different hospital de-
partments (see also Figure 5.2), whereby intensive departments such as theatres
and laboratory departments used on average roughly three times more electri-
city than wards, outpatient departments and imaging departments (excluding
imaging equipment). In this the former group vastly exceeded the CIBSE
TM 46 (2008) electricity benchmark5, while the latter was better aligned with
general hospital electricity benchmarks (Figure 5.1).
• Theatres and laboratories were further characterised by rather continuous op-
eration and high base loads. For some major equipment items, it remained
unclear to users whether they could be switched off due to concerns about
calibration needs and availability in case of emergency. Often, they therefore
remained on continuously (see also section 6.1.1). Jensen and Petersen (2011)
have made similar observations in a Danish hospital laboratory: while the re-
search team concluded that many base load items could likely be switched off
at night, lab staff were often uncertain about recalibration times and whether
the equipment was affected by frequent on/off operations. For the theatres and
laboratories in this study, some energy savings may hence result from similar
clarifications.
• In departments with defined after hours (Outpatient departments, RLH Ima-
ging, RLH Day theatres) differences between in use and not in use periods
were more pronounced. Electricity saving potentials could be suspected out
of hours at the RLH were closed day factors and average daily consumptions
on closed days were measured only little below those of active days. It was
further noted that night time loads tended to exceed base loads in particular
on weekends suggesting differences in actors and routines contributed to poor
energy efficiency. This observation will be followed up further in section 6.1.
A more detailed discussion of the measured electricity usage of the case study depart-
ments (amid a number of other departments monitored by collaboration partners)
can be found in the paper Morgenstern et al. (2016a).
5 Please note that the measured values excluded electricity use by centralised plant while thebenchmarks include all electricity use. Difference for operating theatres and laboratories weretherefore even more pronounced suggesting benchmarking values for hospitals as well as bench-marking methodologies for complex non-domestic buildings might benefit from a revision.
129
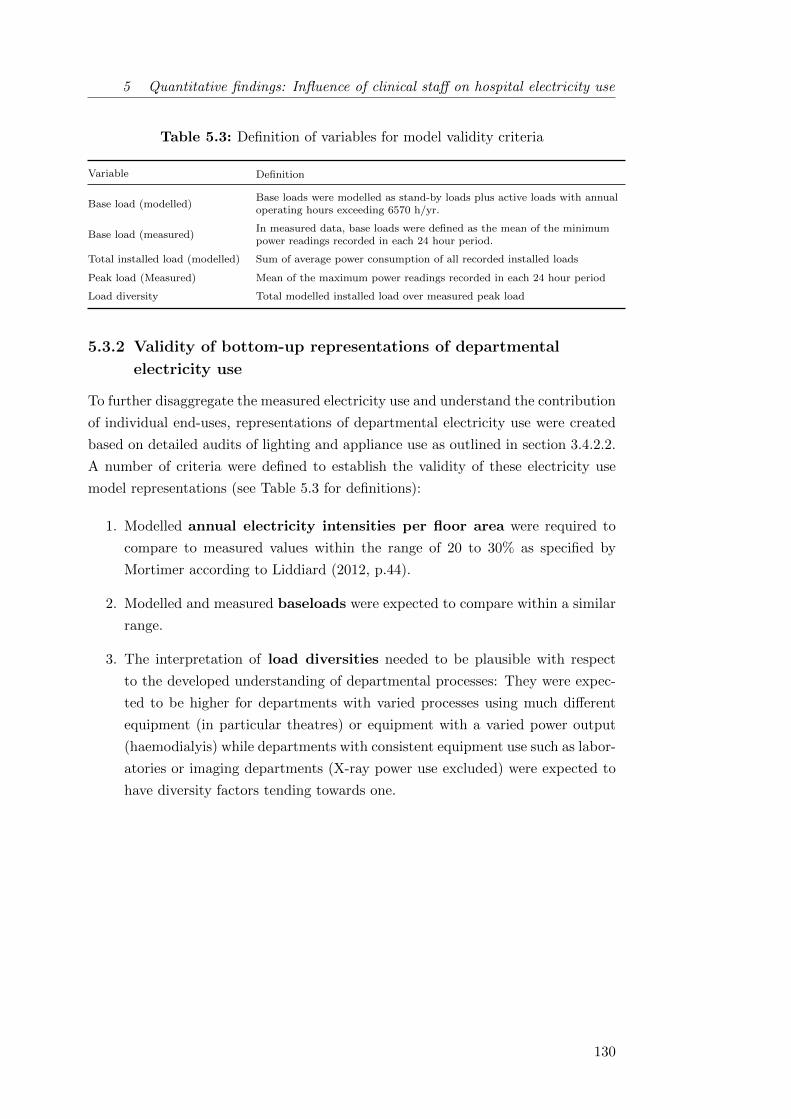
5 Quantitative findings: Influence of clinical staff on hospital electricity use
Table 5.3: Definition of variables for model validity criteria
Variable Definition
Base load (modelled)Base loads were modelled as stand-by loads plus active loads with annualoperating hours exceeding 6570 h/yr.
Base load (measured)In measured data, base loads were defined as the mean of the minimumpower readings recorded in each 24 hour period.
Total installed load (modelled) Sum of average power consumption of all recorded installed loads
Peak load (Measured) Mean of the maximum power readings recorded in each 24 hour period
Load diversity Total modelled installed load over measured peak load
5.3.2 Validity of bottom-up representations of departmental
electricity use
To further disaggregate the measured electricity use and understand the contribution
of individual end-uses, representations of departmental electricity use were created
based on detailed audits of lighting and appliance use as outlined in section 3.4.2.2.
A number of criteria were defined to establish the validity of these electricity use
model representations (see Table 5.3 for definitions):
1. Modelled annual electricity intensities per floor area were required to
compare to measured values within the range of 20 to 30% as specified by
Mortimer according to Liddiard (2012, p.44).
2. Modelled and measured baseloads were expected to compare within a similar
range.
3. The interpretation of load diversities needed to be plausible with respect
to the developed understanding of departmental processes: They were expec-
ted to be higher for departments with varied processes using much different
equipment (in particular theatres) or equipment with a varied power output
(haemodialyis) while departments with consistent equipment use such as labor-
atories or imaging departments (X-ray power use excluded) were expected to
have diversity factors tending towards one.
130
5 Quantitative findings: Influence of clinical staff on hospital electricity use
In addition, lighting intensities were modelled based on the established lighting in-
stallations and compared to lux level measurements in some departments (see also
section 6.4.2 for results and Table 3.4 for data collection per department). Detailed
model results were further interpreted in comparison to departments of the same
type and in the context of available literature (see chapter 4 on the analysis con-
text). Table 5.4 provides an overview of the above listed characteristics for each
department as well as a list of major uncertainties, which may be from either mod-
els or measurements.
Generally, the models complied well with the measured data according to the cri-
teria listed above - with the exception of the KCH ward where some important base
load components appeared to remain unaccounted for in the model (highlighted in
grey in Table 5.4). This suggested that some savings potential from reducing base
loads may be overlooked for this department while operating hours for other equip-
ment are likely overestimated given the reasonable match of the annual energy use.
The load diversity of the KCH ward, at 1.4, also seemed rather low, providing
further evidence that the model representation of this department should be used
with caution only. A limited understanding of heating and cooling energy use by
the installed split system was suspected to be the main reason for the modelling
uncertainty. The load diversity of the NUH laboratory was also above expectations
(1.7). This issue may however be explained by the fact that the laboratory model
covered the whole of the pathology department showing a much higher diversity of
use than the investigated area at KCH (see also Figure 4.13).
On the whole, the electricity models seemed to provide reasonable representa-
tions of departmental electricity usage. In combination with a robust methodology
and some contextual understanding, some confidence could hence be had in end-use
splits and saving potential estimates from operational changes on the basis of these
models. The next section will present a comparative analysis of electricity end-uses
in different department types.
131

5 Quantitative findings: Influence of clinical staff on hospital electricity use
Table 5.4: Validity of bottom-up representations of departmental electricity useIt is considered acceptable if the ratio of modelled over measured energy intensities and base
loads falls in the range of 100 ± 20 - 30% (following Liddiard, 2012, p.44) and interpretations
of load diversity are plausible. Divergent cases are marked in grey. Major uncertainties are
mostly from modelling (normal font), those related to measurement challenges are highlighted
in italics.
DepartmentModelled over measured
Load diversity
Key uncertainties
Annually
[kWh/(m2 · yr)]
Base load
[W/m2](based on audit uncertainty codes)
NUH Imaging 101% 106% 1.9
• Uncertainties around which areas &
services were included in the measured
data 1
• Duration of use and power consumption
of split units
• Actual power consumption of analogue
imaging processors
RLH Imaging 118% 71% 2.4• Duration of use of reporting rooms
which are shared with other departments
KCH
Laboratory99% 110% 1.0
• Power consumption of track system
• (Stand-by) Consumption of automated
anaylsers
• Duration of use and power consumption
of split units
NUH
Laboratory88% 81% 1.7
• Power consumption of cold room
• (Stand-by) Consumption of automated
anaylsers
• Duration of use of IT equipment in
specimen reception
RLH Main
Theatres103% 92% 1.7
• Actual operating hours at each theatre
• Durations of use for medical equipment
items generally
• Actual loads from intensive medical
equipment and those items hard to
identify
NUH Main
Theatres103% 96% 1.4
• Actual loads of theatre panels and hard
to identify medical equipment
132

5 Quantitative findings: Influence of clinical staff on hospital electricity use
Table 5.4: (continued)
DepartmentModelled over measured
Load diversity
Biggest uncertainties
Annually
[kWh/(m2 · yr)]
Base load
[W/m2](based on codes & sensitivity analysis)
RLH Day
Theatres122% 84% 1.5
• Actual loads from intensive medical
equipment and those items hard to
identify
• Durations of use for medical equipment
items generally
RLH
Outpatients117% 72% 1.3
• Issues with metering suspected but could
not be clarified despite collaboration
with facilities management
KCH
Outpatients99% 75% 1.9
• Duration of use and power consumption
of split units
KCH General
Ward98% 61% 1.4
• Duration of use and power consumption
of split units
• Operating hours for lighting in rooms
where day light is available
• Major unaccounted base load
contribution and exaggerated installed
load
NUH General
Ward110% 94% 2.0
• Operating hours for lighting in rooms
where day light is available
• Bedpan washer power consumption and
duration of use
1 The whole of the NUH Radiology department (1320 m2, also including MRI, CT and nuclear medicine)
was covered by 6 sub-meters, out of which one supposedly covered the X-ray area. The department
had, however, been refurbished repeatedly over the last decades resulting in changes to circuit and
distribution board layouts. According to the responsible electrician, some loads within the X-ray area
now ran through other distribution boards while the X-ray board included lighting loads in other areas.
The exact determination of which circuits were served by which board resulted impossible due to a lack of
documentation and the continuous operation of the department preventing experimental determinations
of attributions through powering down boards sequentially out of hours. The measured figures and
profiles at NUH Imaging hence need to be understood as indicative only.
133
5 Quantitative findings: Influence of clinical staff on hospital electricity use
5.3.3 Local electricity use in different department types
Both annual electrical consumptions and the significance of different end-uses var-
ied widely across different hospital department types (Figure 5.2). Energy intensive
department types i.e. operating theatre departments and laboratories used most of
their electricity for ultraclean ventilation (UCV) and medical equipment or auto-
mated analysers (also coded as medical equipment). Lower intensity department
types were dominated by lighting energy consumption. The RLH haemodialysis de-
partment was an exception here due to the extensive use of the dialysis machines.
Notable was also the more pronounced electricity use for local heating and cooling
at KCH as a result of split unit provision, prompting questions around the overall ef-
ficiencies of air conditioning provided through different technologies. Such questions
remained largely outside the scope of this study. KCH technical personnel, however,
pointed out that the central chillers could feed more spaces than they were cur-
rently being used for. This suggested challenges for the consistent implementation
of energy efficient infrastructure strategies in budget constrained and fast changing
environments such as hospitals.
Overall, the findings were in fair agreement with the limited available evidence
on end-uses for hospitals as a whole. Figure 1.2 showed that lighting loads were
dominant over equipment loads in entire hospitals. This suggested that non-energy
intensive department types played a major role within the make-up of a building’s
total energy performance, an interpretation that was substantiated by the fact that
wards accounted for a significant proportion of space in general acute hospitals
(Department of Health, 2013).
5.3.4 Means of clinical staff control over local electricity use
It was hypothesised in this study that control interfaces for building services as
well as nature and type of departmental appliances were one factor6 influencing the
extent of clinical staff’s influence on electricity use (section 3.1). This section will
undertake an analysis of these control aspects, investigating in particular whether
building services and appliances could theoretically be switched off by clinical staff.
As laid out in section 2.2.2.1, the theoretical viability of switch-off is understood to
be determined only by material configurations, ignoring all constraints effective in
real-world situations. These constraints are in detail discussed in chapter 6.
6 The other one was departmental operating hours, i.e. the amount of time building and equipmentwere not in use. Findings for the latter are summarized in section 4.7.
134

5 Quantitative findings: Influence of clinical staff on hospital electricity use
Figure 5.2: Overview of local departmental electricity consumption for allinvestigated departmentsAbsolute values (Left axis): Annual prediction for energy intensity extrapolated
based on measured data (White line)Stacked column (Right axis): Relevance of respective end-uses for each type
(Absolute use represents 100% for each department.)UCV - Ultra-clean ventilation; AGS - Anaesthetic gasscavenging (see section 4.4.2)
See also Figure 4.13 for a description of the diagram type.
To allow for the comparison of the concept of control means across departments
with different operating hours, an analysis was undertaken in the power dimension
focusing on staff control over installed loads. All items within the bottom-up mod-
els were coded by the author according to the extent their electricity consumption
was under clinical staff control following the equipment typology introduced in sec-
tion 3.4.2.2. This included a differentiation according to whether equipment had to
remain in stand-by or could be switched off completely (see also Figure 3.2). A list
of equipment items encountered during the audits for this project can be found in
Table D.1 in the appendix. For lighting, manual switches were understood as means
of clinical staff control, while PIR sensors or lights under the control of patients were
not.
135
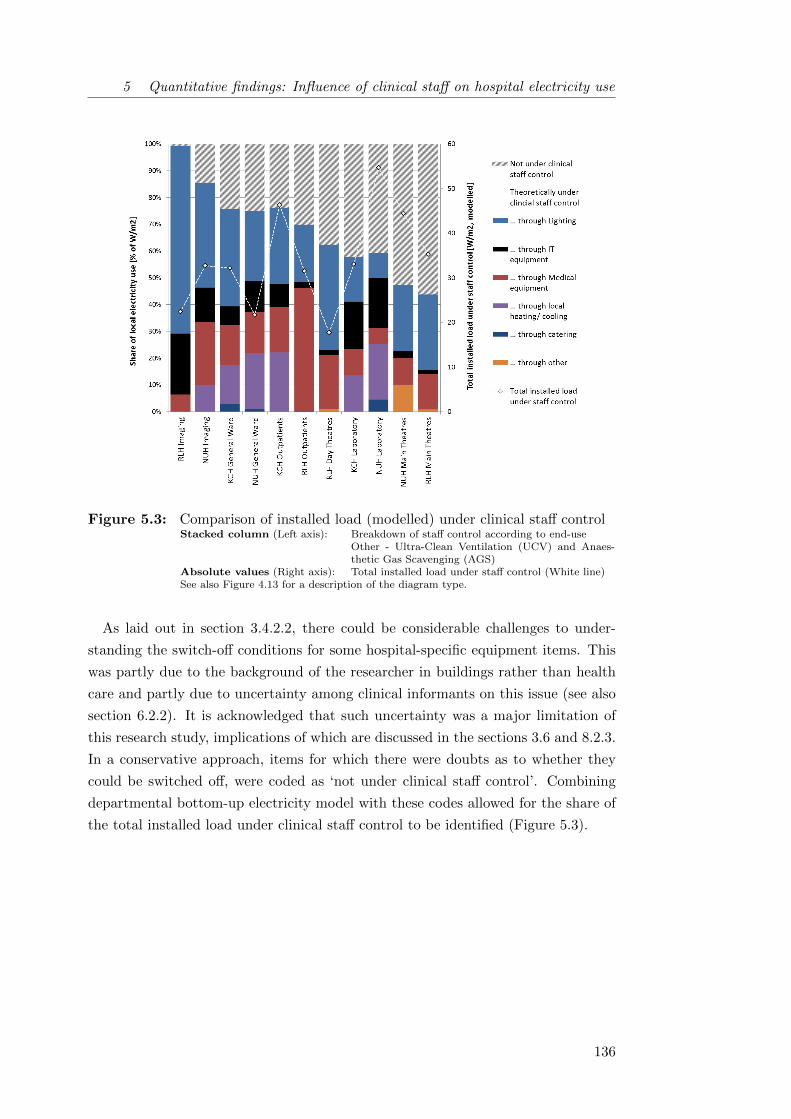
5 Quantitative findings: Influence of clinical staff on hospital electricity use
Figure 5.3: Comparison of installed load (modelled) under clinical staff controlStacked column (Left axis): Breakdown of staff control according to end-use
Other - Ultra-Clean Ventilation (UCV) and Anaes-thetic Gas Scavenging (AGS)
Absolute values (Right axis): Total installed load under staff control (White line)See also Figure 4.13 for a description of the diagram type.
As laid out in section 3.4.2.2, there could be considerable challenges to under-
standing the switch-off conditions for some hospital-specific equipment items. This
was partly due to the background of the researcher in buildings rather than health
care and partly due to uncertainty among clinical informants on this issue (see also
section 6.2.2). It is acknowledged that such uncertainty was a major limitation of
this research study, implications of which are discussed in the sections 3.6 and 8.2.3.
In a conservative approach, items for which there were doubts as to whether they
could be switched off, were coded as ‘not under clinical staff control’. Combining
departmental bottom-up electricity model with these codes allowed for the share of
the total installed load under clinical staff control to be identified (Figure 5.3).
136
5 Quantitative findings: Influence of clinical staff on hospital electricity use
Generally, energy intensive department types such as theatres and laboratories
exhibited lower relative shares of clinical staff control over electricity use than other
department types. Absolute loads under staff control may however be higher due
to the higher energy intensities of these departments. In the laboratories, the low
relative shares of clinical staff control were largely due to high cooling loads and
automated analysers supposedly needing to remain in stand-by due to calibration
issues. In the theatres, high loads were from equipment which manufacturers recom-
mended to maintain in stand-by. At the RLH, the electricity intensive UCV canopies
were automated through PIR sensors, further reducing clinical staff control. Among
the less electricity intensive department types, imaging departments exhibited the
greatest relative extent of clinical staff control. In day clinics and wards where staff
consistently controlled around three quarters of the installed loads, patients featured
as important actors accountable for some electricity use in particular from patient
lamps and entertainment equipment.
The above analysis tentatively suggested that the largest theoretical extent of
clinical staff control over installed loads in hospitals was found in low energy in-
tensive departments with limited residence of the patient population. Apart from
diagnosis-focused departments such as imaging, this will likely also apply to outpa-
tient departments focused on consultations. At the same time, absolute loads and
therefore also absolute loads under staff control may be comparatively small in these
departments, reducing the ultimate scope for savings.
It was also observed that control shares were higher in departments where the
energy-intensity of an end-use coincided with the available means of control. Fig-
ure 5.2 had shown the importance of lighting loads in most non-energy intensive de-
partment types. At the same time, much clinical influence was found to be through
manual light switches (with the exception of haemodialysis and laboratories). A
similar concurrence can be observed at the KCH day unit, where the installed split-
units for air conditioning contributed significantly to the department’s energy use.
They were fully controllable through clinical staff boosting the extent of clinical staff
influence on installed loads.
137
5 Quantitative findings: Influence of clinical staff on hospital electricity use
This finding suggested that addressing lighting use might be a crucial component
of potential staff-centred energy conservation initiatives, also in hospitals. Bordass
et al. (2007) however highlight that the presence of light switches alone will not
result in energy efficiency; control design and usability are vitally important. In
the light of the practical constraints in hospitals (chapter 6), automated lighting
controls based on PIR sensors and/or timers may further represent an avenue worth
exploring.
5.4 Theoretical electricity savings potentials of simple
changes in clinical operation
This research further aimed at conceptualising potential operational changes in the
way hospital departments are being used by occupants (principally clinical staff)
and establishing the theoretical maximum electricity savings potential from simple
operational changes for different departments types. Details on proposed simple
changes for each case study department are shown in the appendix (Table E.1).
Conceptually, the proposed simple changes included both suggestions for more en-
ergy efficient standard procedures and the promotion of simple energy behaviours,
i.e. an increased compliance of staff with existing procedures. Within the concep-
tual framework set out earlier (Figure 2.4), they corresponded to the levels I and
II. More complex changes to service and service delivery, level III of the framework,
were excluded in the quantitative analyse due to practical challenges for estimating
their more complex impacts in energy terms.
In the investigated departments, simple changes in clinical operation included ele-
ments such as improved light switching or reducing equipment stand-by but also
the introduction of quiet time on wards, a period in which lights and equipment are
powered down after lunch to allow patients to rest better. Importantly, this may also
include matching the operational state of spaces and equipment to staff availability
and patient numbers, by for example switching off all but one X-ray room if only
one radiographer was present during nights at NUH Radiology or switching off one
of the three RLH X-ray rooms at 4pm rather than 5pm to match declining patient
throughput. Most proposal for change were in line with low energy workplace beha-
viours suggested in the literature for other building types (see Table 2.1). Hospital
specific energy behaviours were limited to operating theatres as very specialist areas,
requiring the (manual) switch-off of specialist ventilation systems and anaesthetic
gas scavenging pumps.
138

5 Quantitative findings: Influence of clinical staff on hospital electricity use
As laid out in section 2.2.2.1, there is no consensus in the literature on what is
to be understood as theoretical potential in the context of energy conservation in-
terventions involving humans. For the purpose of this thesis, the theoretical savings
potential was equated with the difference between current local electricity use and
the optimal efficient operation of the respective hospital department, based on an
assessment as detailed in section 3.5.1.3.
The theoretical electricity savings potentials of simple changes in clinical opera-
tion across the 11 investigated hospital departments ranged between 2 and 25% of
local electricity use (Figure 5.4), with a median value of 12%7. Importantly, these
values represent a theoretical savings potential and could therefore not be directly
compared to literature values for achieved savings from behaviour change campaigns
as presented in section 2.2.1.2. The median did, however, exceed most reports of
actual savings in line with expectations based in the nature of the different metrics
(see Table 2.6 for an overview or section 2.2.1.2 for more details on savings reported
in the literature).
As for potentials, Kattenstein et al. (2002) and Junnila (2007) reported theoret-
ical savings potentials for university and office buildings based on simulation. At
20%, both estimates were higher than the median estimated in this study, suggesting
savings potentials from simple operational changes may on the whole be lower in
hospitals than in other building types. Benke (2012) further estimated a savings
potential of 10-15% of the total fuel bill based on experiences in hospitals. In com-
parison with the the findings of this study, this suggests that electricity and heating
fuel savings might have comparable orders of magnitude.
7 If the potentials were assumed to be a normal distributed sample, which given the non-representative sampling strategy and the small sample size did not apply, then 95% of thepopulation could be expected to achieve theoretical savings potentials between 8% and 15%.
139

5 Quantitative findings: Influence of clinical staff on hospital electricity use
Figure 5.4: Definition and theoretical savings potential of changes in departmentaloperation
On average, 57% of the estimated savings potentials were from promoting simple
energy behaviours, with up to 85% in the RLH day unit and on the NUH ward (Fig-
ure 5.4)8. This finding highlighted that while setting standard procedures affecting
energy use well mattered, motivating occupants to comply with them remained cru-
cial. The following chapter 6 will discuss challenges associated with such attempts.
In less energy intensive departments, savings were available from changes in lighting
use and where applicable, addressing local heating and cooling use appeared to be
important.
8 There may be some bias in this analysis due to the differing methodologies applied to estimate thesavings potentials from different types of changes. Savings from promoting standard procedureswere based on a top down estimate (level I, see 3.5.1.3) while the effects of procedural modifica-tions were estimated based on a bottom-up approach (level II). To mitigate potential differencesfrom these complementary approaches, level II savings were implemented conservatively aftera comparison of level I potentials according to both methodologies for three trial departmentshad shown that the audit based estimates resulted higher than those from top-down analysis.
140
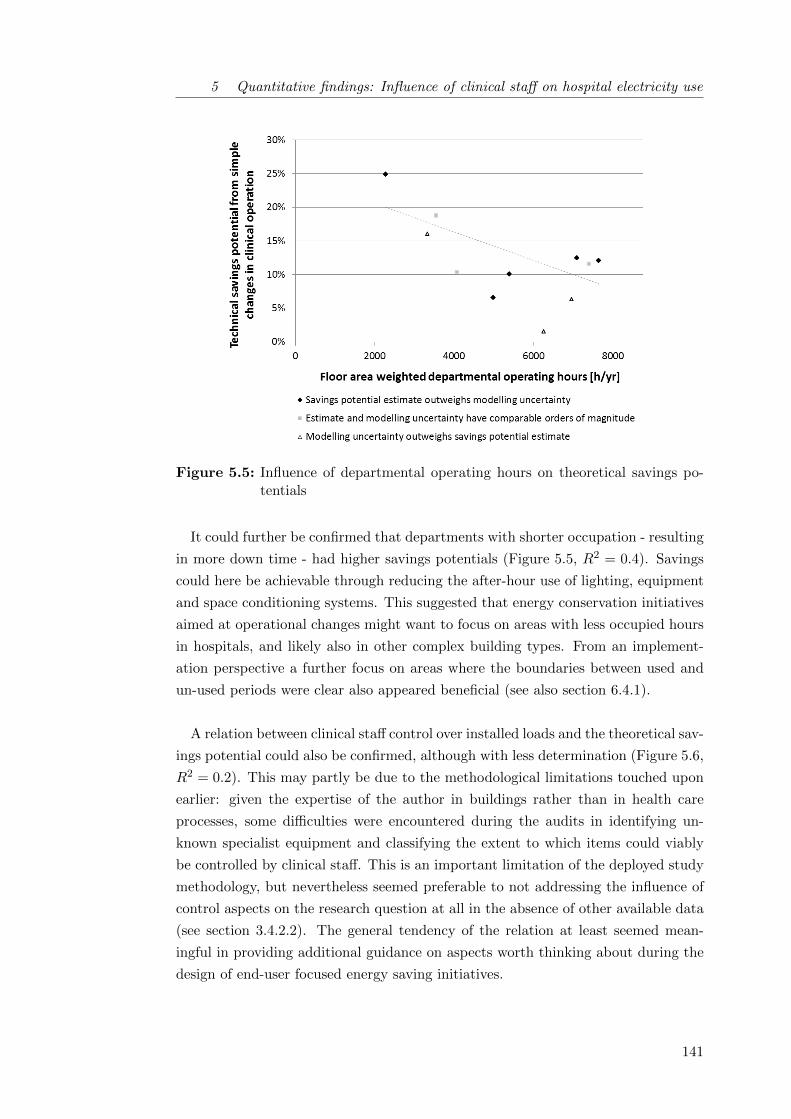
5 Quantitative findings: Influence of clinical staff on hospital electricity use
Figure 5.5: Influence of departmental operating hours on theoretical savings po-tentials
It could further be confirmed that departments with shorter occupation - resulting
in more down time - had higher savings potentials (Figure 5.5, R2 = 0.4). Savings
could here be achievable through reducing the after-hour use of lighting, equipment
and space conditioning systems. This suggested that energy conservation initiatives
aimed at operational changes might want to focus on areas with less occupied hours
in hospitals, and likely also in other complex building types. From an implement-
ation perspective a further focus on areas where the boundaries between used and
un-used periods were clear also appeared beneficial (see also section 6.4.1).
A relation between clinical staff control over installed loads and the theoretical sav-
ings potential could also be confirmed, although with less determination (Figure 5.6,
R2 = 0.2). This may partly be due to the methodological limitations touched upon
earlier: given the expertise of the author in buildings rather than in health care
processes, some difficulties were encountered during the audits in identifying un-
known specialist equipment and classifying the extent to which items could viably
be controlled by clinical staff. This is an important limitation of the deployed study
methodology, but nevertheless seemed preferable to not addressing the influence of
control aspects on the research question at all in the absence of other available data
(see section 3.4.2.2). The general tendency of the relation at least seemed mean-
ingful in providing additional guidance on aspects worth thinking about during the
design of end-user focused energy saving initiatives.
141

5 Quantitative findings: Influence of clinical staff on hospital electricity use
Figure 5.6: Influence of clinical staff control on theoretical savings potentials
5.5 Summary of quantitative findings
This first findings chapter investigated the departmental electricity use of different
hospital departments and the extent to which it can theoretically be influenced by
clinical staff. Departmental electricity use profiles were found to vary widely between
department types: Out of those investigated in this study, theatres and laboratories
may in line with previous research be classified as energy intensive departments with
high base loads, while other department types showed lower consumption intensit-
ies and a higher relevance of lighting loads. The latter category appeared to be in
reasonable agreement with current UK energy benchmarks while findings suggested
that a revision of electricity benchmarks for energy intensive hospital areas may be
worth considering given the increase in technology use over the last decade.
142
5 Quantitative findings: Influence of clinical staff on hospital electricity use
The influence of clinical staff on hospital electricity use was found to likewise
vary between departments, but to overall be relatively small. Few hospital specific
energy behaviours were identified and pathways of influence were mainly through
reducing the after-hour use of lighting, equipment and space conditioning systems
(see Appendix E.1 for details). In theory, the median electricity savings from simple
changes in the way the eleven case study departments were used by their occupants
amounted to 12%. Simple changes in clinical operation are hence likely insufficient
to realize substantial carbon savings in hospitals and more complex changes taking
into account central energy use as well as the nature of health care service delivery
will have to be considered.
At a conceptual level, it could be shown that the theoretical savings potentials
from simple operational changes were driven by at least two factors: Firstly, higher
potentials were seen for departments with lower operating hours resulting in more
down time for space and equipment. And secondly, savings potentials seemed higher
for departments where substantial loads, for example from heating or cooling, were
under clinical staff control as opposed to being either automated, centrally con-
trolled or determined by equipment parameters. Floor area weighted opening hours
and share of installed load under clinical staff control proved to be useful metrics
allowing for a building and process independent assessment of organisational energy
use. It is believed that such metrics may be helpful to facilities managers across the
non-domestic building stock in easily identifying buildings or building parts where
conservation initiatives focused on promoting simple energy behaviours or modifying
operational standard procedures may be promising in reducing local electricity use.
It should be noted, however, that the concept of a theoretical savings potential is
limited as it does not account for organisational, social or individual constraints on
clinical operations and staff energy behaviours. So while technical saving potentials
can be useful in prioritising and planning for energy conservation campaigns and
in energy policy, they may not be confused with actual campaign effect sizes. The
next chapter 6 will proceed to discuss some of the named constraints and reach out
beyond the theoretical energy savings potential.
143

6 Socio-technical constraints on
end-use energy savings
This second findings chapter analyses the semi-structured interviews with clinical
staff in the context of information from the literature, the monitoring of environ-
mental variables and further contextual evidence obtained during the site visits for
audits and monitoring. In response to research objective ii, the findings aim to
determine how the theoretical electricity saving potentials (chapter 5) in partic-
ular and attempts to achieve end-use energy savings in general are constrained in
the complex socio-technical systems that real-world hospital departments constitute.
The presentation of these (primarily) qualitative findings is guided by Gram-
Hanssen’s (2013a) empirical analysis framework for social practices, which has be-
come widely used in built environment research (see section 2.3.2). Gram-Hanssen
suggests that social practices can be operationalized for analysis through the four
elements embodied habits, knowledge, meanings and technologies which mutually
shape each other and the practice in question. A section is dedicated to each ele-
ment in this chapter (6.1 - 6.4), briefly introducing each of them before themes from
the empirical data are analysed and then related back to the theoretical concepts in
section summaries.
6.1 Embodied habits around energy saving . . . . . . . . . . . . . . . . . 146
6.1.1 Temporal routines: Intermediate and after-hour switching . . 146
6.1.2 Saving energy at home . . . . . . . . . . . . . . . . . . . . . . 149
6.1.3 Section summary: Energy saving in hospitals as proto-practice 151
6.2 Knowledge constraints on end-use energy savings in hospitals . . . . 151
6.2.1 Identifying the best-practice agenda . . . . . . . . . . . . . . 152
6.2.2 Shared knowledge on building services control . . . . . . . . . 154
6.2.3 Individual action in an organisational setting . . . . . . . . . 159

6 Qualitative findings: Socio-technical constraints on end-use energy savings
6.2.4 Section summary: Levels of knowledge constraints . . . . . . 160
6.3 Meanings associated with hospital energy usage . . . . . . . . . . . . 161
6.3.1 Accommodating potentials needs of others . . . . . . . . . . . 162
6.3.2 The place for energy saving in the clinical day-to-day . . . . 164
6.3.3 Section summary: A hierarchy of meanings . . . . . . . . . . 168
6.4 Technological constraints affecting energy end-use . . . . . . . . . . . 169
6.4.1 Operational challenges to resource efficiency . . . . . . . . . . 170
6.4.2 Energy intensive prefigurations in health care . . . . . . . . . 174
6.4.3 Technological helpers in saving energy . . . . . . . . . . . . . 176
6.4.4 Section summary: Implications of technological constraints . 180
6.5 Summary of qualitative findings . . . . . . . . . . . . . . . . . . . . . 180
6.1 Embodied habits around energy saving
Embodied habits can be understood as often unconsciously performed routinised
practices (Gram-Hanssen, 2013b). They encompass a practical and bodily under-
standing of actions by those engaged in them and are generally firmly rooted in
every day activities. Previously, related concepts have been discussed using a var-
ied terminology including habitus, practical understanding or know-how (see also
section 2.3.2.1). Importantly, having the skills to carry out an action may in some
situations not be the same as having the knowledge to evaluate the performance,
with the latter being linked more explicitly to cognition and discussed in section 6.2.
This section investigates a number of habitual actions which jointly may or may
not contribute to a practice of saving energy being carried (out) by clinical staff in
different hospital departments.
6.1.1 Temporal routines: Intermediate and after-hour switching
It was illustrated in chapter 5 that energy could potentially be saved locally in
hospital departments through a number of simple operational changes which con-
ceptually can be divided into the following categories:
• Changing the operational state of items from ‘on’ to ‘not in use’ when their
service is not required. Importantly, this may include matching the operational
state of spaces and equipment to staff availability and patient numbers.;
• Eliminating equipment ‘not in use’ energy consumption (stand-by) where pos-
sible; and
146

6 Qualitative findings: Socio-technical constraints on end-use energy savings
• Reducing the service delivery of items with a range of operational states to
the lowest acceptable level (such as increasing thermostat set-points for split
air-conditioning units or dimming corridor lights).
From an implementation perspective, the necessary actions could be further be differ-
entiated according to when they needed to take place: during or after departmental
operation. After-hours switch-off was shown to be more relevant for departments
with defined operating hours, while all department types including those running
24 hour services featured spaces and functions relevant only during core hours (sec-
tion 4.7). In contrast, intermediate switching to adapt levels of service delivery as
well as to switch-off items not required could in theory apply in all department types.
The analysis of instances of switching by clinical staff reported in the interviews
revealed an imbalance between the processes of switching-on and switching-off. For
other building types, the low likelihood of intermediate switching despite the absence
of a service demand is well documented in the literature, in particular for lighting
(e.g. Lindelof and Morel, 2006).
In this study, switching-on mostly followed routines such as the starting up of a
department in the morning, but instances of switching-on driven by service demand
were also reported in the interviews. They included the switching-on of the split air
conditioning units in the KCH Day Unit once it was getting warm because many
patients were around or switching on the computers to do documentation once the
first cohort of patients had been put onto the haemodialysis machines in the RLH
Day Unit.
In contrast, switching-off seemed to be driven purely by routines: mainly at clos-
ing time, but occasionally also during lunch breaks or associated with a prescribed
‘quiet time’1 on NUH ward. All of the very few examples of demand-driven switch-
offs reported during the interviews could be linked to clinical outcomes such as the
adjusting of lighting levels in X-ray rooms or for endoscopic procedures in operating
theatres. If sufficient day light was available on wards, reducing lighting levels was
reportedly considered there, but had to be contrasted with safety considerations for
patients who may be elderly, disorientated or had bad eyesight.
1 See also section 6.4.1 for a further explanation of the quiet time.
147
6 Qualitative findings: Socio-technical constraints on end-use energy savings
In many areas, lights stayed on throughout from ‘when we are in in the morning,
that’s it until the end of the day (G)’ while intermediate light switching was often
considered impractical due to the intermittent use of rooms. People would often
walk in and out of rooms, carrying out tasks which might not take longer than a few
minutes. This narrative was supported by the data from occupancy sensors which
for example suggested that the occupation of the sister’s office on the NUH ward was
for periods of 6 min on average. For many equipment items, intermediate switching
reportedly was out of the question due to continued demand or the need to be ready
if demand was to occur - in combination with long start-up times of equipment (see
also section 6.4.1).
For after-hour switching, differences were noted between individual spaces such
as permanent offices and communal spaces for instance corridors, utility rooms but
also shared offices used in a hot-desking fashion. While staff permanently in an office
or an individual treatment room (n=5) consistently expressed robust knowledge on
switch-off procedures for their space, there was more uncertainty about what was
happening to lights and computers in shared and communal areas:
I think often they are sort of left on, I think it is random whether workers
working in the area will switch it off. [...] I don’t think anybody is keeping
track of the lights and computers. (L)
Interviewees across all case hospitals, especially in departments with clear after-
hours, had developed a personal perspective with regards to what was happening
in their department at night. These narratives may or may not reflect actual oper-
ations. In that sense, it proved a central limitation to this project that interviews
remained restricted to day-time clinical staff and excluded night staff and cleaners
(section 8.2.1).
Switching-on and switching-off in mornings and evenings were further found to be
routinised parts of daily tasks with lights being switched on by the first person in
and off by the last person out of departments with clear operating hours. If it was
believed that the space was or would soon be occupied by others colleagues including
cleaners or colleagues from other teams, lights as well as air conditioning were often
left on (section 6.3.1). Such practice was for example observable in the electricity
profile of the KCH day unit where lights and split units remained on for the cleaners
after the department’s official closing time at 5pm (see Figure 4.10).
148

6 Qualitative findings: Socio-technical constraints on end-use energy savings
The switching-on of equipment represented a particularly firm part of daily routines
where extensive checks and quality controls on machinery formed part of the clinical
protocol such as for automated analysers, anaesthetic machines or X-ray machinery.
Switching-off was often associated with tidying and cleaning:
We try to kind of close here bang on five o’clock to shut the door.
That involves turning and tidying, turning the machines off, making
sure everything is switched off correctly, making sure all our patients are
sorted out for the day which sometimes can take a bit more time than
you expect. (K)
This suggested that saving energy through adjusting the operational states of light-
ing and appliances may currently be part of a set of other activities which clinical
staff perform, rather than an integrated practice in its own right.
6.1.2 Saving energy at home
13 out of the 22 interviewees unpromptedly touched on the question how the practice
of saving energy at work differed from doing so at home: To all of them it was clear
that energy was not to be wasted at home. Different reasons were provided for this
which apart from financial motives included that their up-bringing had emphasized
the importance of not leaving things on unnecessarily or that not being wasteful was
an important value to be passed on to their own children.
The extent to which interviewees aimed to be green at home varied2. When asked
what they did at home to be green, some interviewees referred only to the electricity
related actions which had been discussed extensively throughout the interview for
the work place (lights, IT equipment). Others included actions to save heat (includ-
ing retrofitting their homes if owner-occupiers), measures to reduce waste and water
consumption, sustainable transport options or conscious purchasing of goods includ-
ing food. Saving electricity at home did however appear relevant to all interviewees.
There is some debate within the academic community as to whether habits at
home influence those at work. In an office study, Littleford et al. (2014) for example
found little to no evidence to support the existence of spillover effects in the way
energy services were being used across settings. Potentially the relationship is a
negative one at best, as one of the interviewees in this project put it:
2 The variation may potentially also be related to their job roles and qualification levels, see alsosection 6.2.2 and Figure 6.1.
149

6 Qualitative findings: Socio-technical constraints on end-use energy savings
If you haven’t got the habit of saving up from at home, then obviously
you will not have that at work. (I)
So while possibly a prerequisite, saving energy at home must not necessarily result
in a similar practice at work3.
Some interviewees did however point out that switching things off at home had
become a more universal habit for them in a sense that ‘for me, it’s in me (N)’.
Similarly, practices at home were referred to as guidance exemplifying best practice:
Because it is not your home, does it mean you have to waste it? I mean,
I do try to think - it’s not my home, but I do try to think what would I
do there. (T)
Such notions may of course only apply to energy end-uses which are consistent across
settings, while many hospital processes were extremely context dependent. Lighting
use was however identified in the technical analysis to be both comparatively elec-
tricity intensive and under user control in many hospital departments, while closely
matching a service also required in domestic settings. And while additional con-
straints from procedural know-how or social and organisational factors may apply
in the work place, the embodiment of light switching in the home context could
potentially be an important prerequisite for enacting such practice at work as well4.
3 Home habits of patients and their attitudes towards spaces which were not their homes alsoproved relevant on wards and in day units. Night lighting use on wards may for instance bedefined by a patient’s fear of the dark and a consequent habit from home to sleep with thelights on.
While in hospitals, patients would often feel poorly and concentrate primarily on gettingbetter. In contrast to clinical staff, however, who will have somehow durable relationships to thehospital departments as their workplaces, patients may further feel little or no concern aboutthe space and its resource use. One interviewee observed with regards to patients’ consumableuse:
And people take lots of blankets and sheets and sometimes for the wrong reason. Youknow, like they will have one for this arm, one for this arm, one for their back, oneto put their feet (laughs) Unnecessary really. In my head, I do think - Would they dothat at home? (T)
The influence of patients on hospital electricity use remains outside of the scope of this study,but the above argument as well as repeated reports by clinical staff that patient practices seemedto be linked to age (with older patients tending to be more modest) point towards potential areasfor further research.
4 In the terminology of formal logics, light switching could potentially be thought of as a necessarybut not a sufficient condition for light switching at work.
150

6 Qualitative findings: Socio-technical constraints on end-use energy savings
6.1.3 Section summary: Energy saving in hospitals as
proto-practice
Embodied habits associated with low end-use energy demands in hospitals were
found to primarily relate to instances of switching lighting and equipment off after-
hours. Instances of demand driven switching were biased toward switching-on and
intermediate switching was often considered out of the question due to a perceived
need to have everything ready if demand was to occur in combination with long
start-up times of equipment. Both of these constraints will be further analysed in
the following sections.
It was further recognised that adjusting the operational states of lighting and ap-
pliances may currently be part of a set of other activities which clinical staff perform.
This suggested that energy saving in hospitals may not currently be an integrated
practice in its own right. Such finding stood in contrast to the domestic context:
while encompassing a cluster of different activities and carried out by people to dif-
fering degrees, energy saving at home seemed to be more established as a coherent
unit of practice. In contrast, energy saving at work could potentially be concep-
tualised as what Shove et al. (2012) refer to as a ’proto-practice’, with respective
implications for possible strategies to encourage the establishment of such a practice
(section 7.2.1).
6.2 Knowledge constraints on end-use energy savings in
hospitals
This practice theory element refers to the level of general knowledge individuals hold
with respect to electricity consuming technologies and their use (Gram-Hanssen,
2013b). This includes the available language (Schatzki, 2002) through which it can
be thought and spoken about energy saving; as well as the pathways through which
knowledge is established and disseminated ’including what rules [people] have been
taught to follow by different types of intermediaries such as caretakers, energy ad-
visors, craftsmen or sales persons’ (Gram-Hanssen, 2013b, p.104). Goldkuhl and
Braf (2002) further differentiate between individual knowledge and institutionalised
(shared) knowledge, which has transcended individual subjects as a result of common
working practices and plays a crucial role in enabling organised and coordinated ac-
tion in an organisation. Importantly, practice theory discourages any interpretation
which linearly links knowledge and practices while aligning itself with a language of
systems, complexity and interactions (Cohn, 2014).
151

6 Qualitative findings: Socio-technical constraints on end-use energy savings
The following sections firstly analyse the level of knowledge held in different hos-
pitals departments with respect to how low energy end-use is enabled (section 6.2.1).
It is then uncovered how the knowledge on the control of most building services is
shared among clinical staff (section 6.2.2). Finally, constraints on end-use energy
savings are highlighted which result from the limited knowledge individual members
of staff hold on who else may use shared spaces in many hospital departments (sec-
tion 6.2.3). Conceptually, knowledge on end-use energy savings in hospitals is hence
analysed at three levels (Table 6.1) for each of which Bernstein (1996) has identified
viability conditions.
Table 6.1: Levels of knowledge required for low energy operations(Levels and conditions by Bernstein (1996))
Levels Conditions Application to hospitals Section
Political DiscourseWhat is required to locally use aslittle operational energy as possible?
Identifying the best-practice agenda
Social Communitas How would we act?Shared knowledge on buildingservices control
Individual Confidence Who needs to take action?Individual action in an organisationalsetting
6.2.1 Identifying the best-practice agenda
The first step towards energy conservation in any given context constitutes in stra-
tegically identifying what would need to be done in order to be energy efficient
(CIBSE, 2012). The interviews suggested that in the complex environment of some
hospital departments this could prove quite difficult. Far from being relevant to
everyone, this question was found to primarily be of importance for senior staff and
those with health and safety responsibilities. On one occasion, a junior staff mem-
ber with a personal interest in sustainability also commented on this challenge while
stressing that their department nurtured a culture of openness allowing them to get
involved with improving departmental runnings beyond their pay grade.
Generally, it seemed that especially in complex departments such as laboratories
and theatres individuals found it hard to understand the interactions within and
between processes and systems. In the absence of established knowledge, myths were
generated for example on how the scavenging of anaesthetic gases was implemented
on the building side or on centralised heating schedules as illustrated in the following
quote:
152

6 Qualitative findings: Socio-technical constraints on end-use energy savings
In this theatre it [the heating] seems to work, but there seems to be...
like at night-time it seems to automatically re-set itself to a very cold
temperature. [...] I presume they automatically reduce temperatures
because it seems to get cold sometimes. (X)
According to the facilities department no such night-time temperature set-back was
operational in this particular theatre due to uncertainty about operating hours5.
Certain knowledge about operations was particularly hard to obtain for clinical staff
where processes were partly defined and/or controlled outside of the department6.
Such challenges were even bigger if it was attempted to holistically understand a
department’s environmental impact and life-cycle emissions were also considered, as
this quote by a senior laboratory staff with strong interest in sustainability indicated:
Of course, heat, light, electricity - if we could recycle all our waste, we
might be using more electricity so it’s a difficult balance. We might really
be using more energy because our plastic boxes need to be incinerated,
and then they need to be made again. (B)
Challenges in setting best-practice agenda arose in particular from hospital spe-
cific functions and building services. For lighting, environmental impact and con-
trol means were perceived as quite straightforward in comparison. Although issues
around obstructed, hidden or unlabelled light switches were occasionally reported, it
was generally clear to staff in all departments that switching lights off was associated
with saving energy and lighting controls were often the way to effect this:
It’s like any room you go into, they are not hidden so to say - light
switches are placed basically in the same kind of areas everywhere, so
you could go into a strange house and switch the lights on. (E)
5 It is generally recommended for hospitals that heating systems should be controlled to a set-back temperature of 12 to 15 ◦C out of hours (Department of Health Estates and FacilitiesDivision, 2007). For theatres in contrast, the system should ensure that temperatures do notfall below 15 ◦C to avoid lengthy temperature recovery periods. Full manual override permittingplant restoration to full operational status at short notice is recommended. The presented case,however, illustrated that facilities staff preferred to avoid conflict by not implementing night-time temperature set-backs in specialist areas. More collaboration between facilities and clinicalstaff to provide the former with insights on actual occupancy schedules may be beneficial here(section 7.3).
6 In the quoted case, the impression also was that efforts applied in further investigation werelimited because comfort levels were not seriously infringed on.
153
6 Qualitative findings: Socio-technical constraints on end-use energy savings
In all departments, staff did also display some awareness as to whether their de-
partment was a major energy user within the context of the entire hospital. Such
judgements could be related to department size or the energy intensity of the depart-
mental activity. For example in the KCH Day Unit which with 178 m2 indeed was
one of the smallest departments in the study, both interviewed staff suggested that
little energy was wasted there in absolute terms because they had ‘less lights, less
computers, less places to walk (M)’ and more energy could hence be saved elsewhere.
An interviewee from a ward also explained:
My job and energy use are negatively correlated. [...] Nursing and electri-
city, I don’t think they have anything to do. If you are in ICU [Intensive
Care Unit] they rely solely on electricity for the machines. If you are in
CCU [Critical Care Unit], they rely on the machines. If you are in the
birthing centre, they rely on the machines, incubators and all that. But
here [on a general ward] - if nobody needs a machine, sometimes we go
a whole week and nobody needs a machine that uses electricity. (R)
In contrast, all interviewed theatre and in particular laboratory staff (energy in-
tensive department types) expressed concerns about energy costs. Setting the best-
practice agenda consequently seemed to be of particular concern in energy intensive
department types, which coincidently also tended to be more specialist and complex.
6.2.2 Shared knowledge on building services control
In a second step, local energy conservation requires the relevant occupants of a space
to know both what constitutes the best-practice agenda and how it can be enacted.
Hospitals were found to be a very hierarchical environment with strong division of
labour where roles were clearly prescribed and every team member contributed spe-
cialist knowledge. It became clear in this study that labour division also extended
to control over building services and - potentially somehow less surprisingly - equip-
ment. As a result, not all members of staff possessed knowledge on how to adapt
building services or influence the operational state of equipment items as illustrated
by this junior doctor’s statement on heating control:
I... don’t know how to [control the heating]. But I am sure the nurse,
the head nurse can. But I don’t know where the panel is. [...] But the
doctors can say to the nurses ‘Can we change the temperature?’ It’s
mainly that. (P1)
154
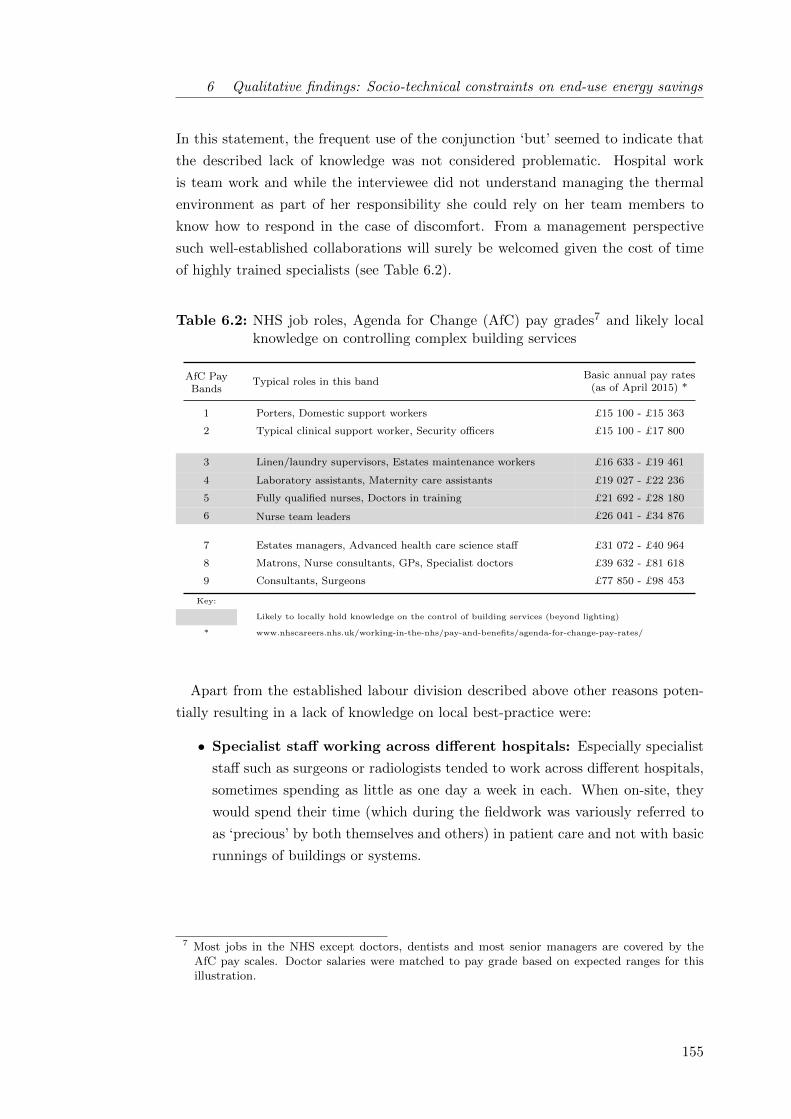
6 Qualitative findings: Socio-technical constraints on end-use energy savings
In this statement, the frequent use of the conjunction ‘but’ seemed to indicate that
the described lack of knowledge was not considered problematic. Hospital work
is team work and while the interviewee did not understand managing the thermal
environment as part of her responsibility she could rely on her team members to
know how to respond in the case of discomfort. From a management perspective
such well-established collaborations will surely be welcomed given the cost of time
of highly trained specialists (see Table 6.2).
Table 6.2: NHS job roles, Agenda for Change (AfC) pay grades7 and likely localknowledge on controlling complex building services
AfC PayBands
Typical roles in this bandBasic annual pay rates
(as of April 2015) *
1 Porters, Domestic support workers £15 100 - £15 363
2 Typical clinical support worker, Security officers £15 100 - £17 800
3 Linen/laundry supervisors, Estates maintenance workers £16 633 - £19 461
4 Laboratory assistants, Maternity care assistants £19 027 - £22 236
5 Fully qualified nurses, Doctors in training £21 692 - £28 180
6 Nurse team leaders £26 041 - £34 876
7 Estates managers, Advanced health care science staff £31 072 - £40 964
8 Matrons, Nurse consultants, GPs, Specialist doctors £39 632 - £81 618
9 Consultants, Surgeons £77 850 - £98 453
Key:
Likely to locally hold knowledge on the control of building services (beyond lighting)
* www.nhscareers.nhs.uk/working-in-the-nhs/pay-and-benefits/agenda-for-change-pay-rates/
Apart from the established labour division described above other reasons poten-
tially resulting in a lack of knowledge on local best-practice were:
• Specialist staff working across different hospitals: Especially specialist
staff such as surgeons or radiologists tended to work across different hospitals,
sometimes spending as little as one day a week in each. When on-site, they
would spend their time (which during the fieldwork was variously referred to
as ‘precious’ by both themselves and others) in patient care and not with basic
runnings of buildings or systems.
7 Most jobs in the NHS except doctors, dentists and most senior managers are covered by theAfC pay scales. Doctor salaries were matched to pay grade based on expected ranges for thisillustration.
155

6 Qualitative findings: Socio-technical constraints on end-use energy savings
• Increasing number of temporary staff: Due to staff shortages, especially
in less centrally located or prestigious hospitals such as NUH, agency staff were
frequently employed to temporarily fulfil the duties of absent others (Locum).
Depending on local arrangements, time in post and personal abilities, locum
staff may have a lower status and less rights than permanent staff in for ex-
ample accessing computer systems, accompanying patients or being entitled
to discounted canteen food. One interviewed nurse employed as agency staff
observed:
And there is only one toilet. It’s only a disabled toilet. And there is
no toilet for the staff, there is no toilet for woman. Just one toilet -
and this place is contagious, but everyone is using this toilet... But
I don’t know, I am just agency, but that is what I see (M).
Despite making a valid point which her colleagues affirmed, the interviewee
seemed less sure throughout the conversation of her right to voice an opinion
due to her role as temporary staff. Such perceptions may have an important
influence on knowledge of local best-practice, ownership of space and when
aiming to establish a culture of change.
• Limited agency in support staff: Two out of the three interviewed health
care assistants (HCA) agreed that as a support worker ‘the most important
is we got told what to do, so we do that, we follow that. Because it is what
the management told us. (F)’ Own initiative and independent knowledge were
consequently limited, while the third HCA showed higher levels of agency and
reported to commonly help the nurses out with tasks above her pay grade.
• Uncertainty on equipment switch-off options: Clinical staff were in some
cases found to be unsure about the operating characteristics of specialist med-
ical or laboratory equipment, making it hard for them to decide whether or
not equipment could be switched-off or into stand-by. To give but one ex-
ample, RLH radiology staff tended to work across different imaging depart-
ments including inpatient- , outpatient- and paediatric-X-ray. While in inpa-
tient X-ray, the manufacturer (Siemens) specified that the X-ray generators
may be switched off after-hours, the instruction manual in paediatrics (GE
Medical) recommended keeping them on throughout. For staff working across
departments, this proved somehow confusing ‘with all these different things...
With different companies, different equipment, there are different rules and
regulations. (L)’. Such uncertainties pointed towards the role of equipment
manufacturers and equipment technicians for low carbon clinical operations
(section 7.2.2).
156

6 Qualitative findings: Socio-technical constraints on end-use energy savings
• Contradictory instructions: Similarly, uncertainty could extend to proced-
ures for IT equipment. The green group of a hospital affiliated with but not
directly participating in this study discussed sending an e-mail reminder to
clinical staff asking them to shut down computers after work. They received
the following response from the trust’s IT department working on a business-
critical software migration: ‘We sent a message out to all trust staff last week
that [...] they should leave their PCs on for us. A message asking users to
turn them off would obviously directly contradict the first one and would leave
users confused, leave us unable to complete the merge, and make the trust
look like it didn’t know what it was doing.’ Apart from the confusion poten-
tial for end-users, this example also highlighted differences in priorities and
little coordination between departments.
• Little conversations about energy best practice: All interviewees con-
sistently reported that energy efficiency and sustainability were ‘not really’ is-
sues discussed among colleagues, neither did they tend to be included in local
staff inductions. The peer-to-peer diffusion of best practice procedures asso-
ciated with energy and sustainability hence proved unlikely, unless someone
in the team was actively pursuing the topic out of a personal interest. In the
latter cases, e-mails and reminders during staff meetings for specific actions
such as switching off the ultraclean ventilation canopy in theatres or recycling
certain items were found to be most common.
On the whole, the available knowledge on the control of both building services
(especially heating/cooling and specialist building services such as gas scavenging or
ultra clean ventilation in theatres) and equipment seemed to be concentrated in the
hand of intermediate level professionals, primarily nurses (see Table 6.2).
157

6 Qualitative findings: Socio-technical constraints on end-use energy savings
Nurses commonly hold medium level qualifications8. There has been some evid-
ence for the general public that education was associated with pro-environmental
attitudes (DEFRA 2008). More recent studies have however criticised the knowledge
deficit interpretation for climate change action and shown mediating influences of the
type of environmental-friendly actions (Lynn and Longhi, 2011) and political values
(Whitmarsh, 2011). The interview data in this study did suggest that staff with high
levels of qualification were more likely to take informed and decisive action to be
green at home and generally champion green attitudes (see Figure 6.1). There was
hence a potential disconnect between those in the know on how to control building
and appliances and those interested in reducing energy use in favour of environment
and planet. It may however be noted that this is a small study and qualification
levels are only one factor among many which may potentially be associated with the
uptake of environmentally-friendly practices.
Figure 6.1: Influence of qualification levels on: left) interviewee attitudes towardsbeing green at home9 ; and right) championing green issues more gen-erally10
8 Currently, nursing degree courses in any of the four branches of nursing (adult, mental health,learning disabilities and children’s nursing) are three years full-time and are offered by univer-sities across the country. They comprise 50% theory and 50% of supervised nursing practicetaking place in both hospital and community settings and eventually lead to the registrationwith the Nursing and Midwifery Council (NMC) as registered nurses. Specialisations for em-ployment in critical care or theatre departments as well as master degrees in nursing studies arealso available.
9 Numerical ratings assigned based on whether interviewees unpromptedly referred to actions onelectricity, heat (including retrofitting), waste (including water and recycling), transport andconscious purchasing (including diet) when asked what they did to be green at home
10 Categories attributed by the researcher based on the enthusiasms for sustainability expressedduring the interviews. It is acknowledged that rating will be subject to interpretive bias.
158

6 Qualitative findings: Socio-technical constraints on end-use energy savings
6.2.3 Individual action in an organisational setting
A third knowledge constraint on energy saving in clinical workplaces seemed to result
from difficulties for the individual in identifying situations in which it was specifically
upon them to act. The interviews suggested that there was a strong social compon-
ent to working in hospitals and friendly relations with colleagues were often stated as
the most important reason for work place satisfaction. The team was also considered
a strong power in solving problems and ensuring the smooth running of departments.
Aside from rigid hierarchical structures, hospitals proved to be rather dynamic
with respect to teams. As one senior staff put it:
People off sick, annual leave, vacancies, locums we have to get in - you
write a rota and then you re-write it on the day. (B)
In consequence, all employees were familiar to regularly working with different col-
leagues and based on a professional conduct this generally seemed to work well.
It did, however, seem that the perception of teams was restricted to direct col-
leagues based on time spent together. At NUH for example, some employees in the
pathology lab and the radiology department only worked night shifts. Only to a
very limited extent were they considered part of the team by their colleagues from
the day shift. Similarly, the interviewees did not understand domestic staff such
as cleaners or hostesses re-heating patient meals on wards as a part of their team.
Such exclusion was reinforced because the latter tended to be employed through
sub-contractors or agencies rather than the respective trust directly.
As a result of this narrow conceptualisation of teams, all departments were reg-
ularly frequented by ‘outsiders’ who intervened in the departmental runnings. In
some departments at the RLH this was aggravated by the spatial arrangements re-
quiring the shared use of office spaces, lockers or staff rooms with other departments
with differing operating hours. Uncertainty could hence arise for staff as to whether
energy services were still needed by someone or not. The implications of this uncer-
tainty in combination with meanings relevant in hospitals are further discussed in
section 6.3.1.
159

6 Qualitative findings: Socio-technical constraints on end-use energy savings
One way of clarifying who should be in charge of switching-off and the imple-
mentation of energy best practice more generally which was brought up in the in-
terviews was the attribution of formal responsibilities, for example by integrating
energy efficiency with health and safety roles. In hospitals, hierarchies and fixed
job roles are generally well established (see also Tudor et al., 2008), suggesting such
strategies might fit the organisational culture. In their work within the retail sector,
Christina et al. (2015) have pointed out the importance of aligning organisational
energy strategies with the prevailing organisational culture.
In this study, the interviewees’ opinions on integrating energy issues into formal
responsibilities were divided: Support staff but also those rather new to more re-
sponsible roles and hence feeling mentally occupied with their clinical responsibilities
tended to like the idea, while others thought that flexibility in combination with good
team work would be a strategy more adaptive to different situations. It also seemed
that some individuals were already taking responsibility for sustainable operations
according to their interests, a motivation which could be hampered by structuring
existing working routines even more.
6.2.4 Section summary: Levels of knowledge constraints
This section presented a number of constraints on end-use energy savings from limits
in knowledge at the managerial, team and individual level. It was shown for energy
intensive department types such as operating theatres and laboratories that system
complexities, multiple stakeholders and conflicting priorities complicated decisions
on sustainability strategies. Bernstein (1996) identified ‘discourse’ as necessary con-
dition to establish knowledge in such circumstances. This study however highlighted
that conversations about energy issues were rare within clinical teams, but perhaps
more importantly also between clinical staff and those in charge of facilities and en-
ergy management. This seemed to result in a lack of joined-up knowledge on how to
locally define (energy) best practice, an important challenge in hospitals and likely
other complex building types that will be further discussed in section 7.3.
160

6 Qualitative findings: Socio-technical constraints on end-use energy savings
This study further found that the control of HVAC systems and specialist building
services constituted inter-subjective knowledge and tended to be shared between in-
termediate level professionals, primarily nurses. This may partly be due to the well
established labour division in the hierarchical environment which hospitals consti-
tute, while staff moving between hospitals as specialists or locums and contradictory
instructions from equipment manufacturers and IT specialists appeared to further
contribute to a lack of knowledge on local best-practice among individuals in other
job roles. In line with Bernstein’s proposition, the team, i.e. communitas, did
consequently seem to represent a powerful player in the investigated hospital de-
partments, as well as a significant resource for resilience in the face of obstacles.
Finally, challenges for low energy use in shared spaces may arise from uncertainty
around whether space and equipment may still be needed by someone. Bernstein
advocates confidence as one condition which allows individuals to know appropriate
courses of action. Confidence building may hence be promising for some support
staff which currently seemed to have limited agency. In line with previous research
for example by Tudor et al. (2008), this study further highlighted the role of hier-
archies and fixed job roles in hospitals. The attribution of formal responsibilities,
for example through integrating energy efficiency with health and safety roles, may
hence represent an additional strategy well suited to the organisational culture typ-
ical in health care settings.
6.3 Meanings associated with hospital energy usage
Meanings and engagements are considered a further element holding practices to-
gether. There is however limited agreement among practice theorists on how to char-
acterize meanings, emotions and motivations (Shove et al., 2012). Gram-Hanssen
(2010) states that practitioners can be understood to connect with practices through
individual and collective engagements while meanings accumulate through these ac-
tions. Other scholars, especially those more firmly rooted in sociology where the
concept of meanings goes back as far as Max Weber, debate the extent to which
engagements are at all individual. All interpretations and subsequent meanings are
considered a result of collective processes.
161

6 Qualitative findings: Socio-technical constraints on end-use energy savings
This and other debates highlight that SPT is a theory in development rather than
a finalized tool. The focus of this study meanwhile is on empirical data collection
and analysis in a novel context rather than on theory development. The following
section will orientate itself towards an interpretation of meanings following Gram-
Hanssen, which grants individuals a limited amount of personnel motivations and
engagements. For this study, this seemed appropriate for two main reasons: firstly,
hospitals were found to be strictly hierarchical environments strongly shaped by job
roles. This resulted in some differences between clinical staff which are thought to
influence engagements. And secondly, there is an increasing amount of literature
available on motivations for energy saving at the workplace, in particular within
business research and social/environmental psychology (section 2.2.1) while social
practice based studies are still few (section 2.3.2.2). At least reflecting on the col-
lected data against the background of this literature therefore seemed beneficial.
A comparison of evidence from offices or manufacturing with accounts on the
realities of working life collected in this study indicated that, from an employee
perspective, hospitals were little different to other work places in many aspects.
This finding contrasted the perception of many people encountered over the course of
this research project, especially building professionals, and therefore seemed relevant
in itself (see section 7.3). Two central meanings in the context of energy end-use
which were particular to hospitals are further discussed below: the strong impetus
to accommodate potential needs of others (section 6.3.1) and the place of saving
energy in busy hospital environments (section 6.3.2).
6.3.1 Accommodating potentials needs of others
In the hospital context, a number of engagements of clinical staff were identified,
amongst which caring for others featured prominently. This included both a commit-
ment to excellent patient care as well as more general social considerations aiming
to accommodate the needs and wants of their colleagues, their families and also
strangers such as the researcher of this project. Naturally, the degree to which
interviewees appeared to be driven by motives of care varied between them and de-
pending on their position and personality other engagements such as cost concerns,
an impetus for compliance or a desire to learn were also important to them. All
interviewed staff, however, expressed a concern for the well-being of others at some
point, likely a characteristic somehow typical for the health care sector.
162

6 Qualitative findings: Socio-technical constraints on end-use energy savings
From an energy perspective, the kind concern for the well-being of others however
often resulted in increased energy demand because it made ‘on’ the default mode
of operation for equipment and lights. The interviews clearly highlighted the social
motive behind the ‘defaulting to on’: it was considered important to leave a room
or an equipment item ready for use in case colleagues or patients might need it, as
illustrated by the following quote on keeping lights and equipment on during the
day theatre lunch break:
Because maybe surgeons come in there, because we don’t know who
might come in there while we are having lunch. (F)
Palm and Darby (2014) have previously uncovered a very similar notion among
researchers in university laboratories, where lab machines were generally ‘left on
around the clock largely because someone might want to use them (p.86, italics in
the original)’. In the office context, it used to be custom to boil full kettles in case
colleagues were also in need of cup of tea.
At the same time, hospitals seemed to be fundamentally risk-averse environments.
Building systems were sized with generous safety margins (Bacon, 2014) and often
held additional plant equipment (such as back-up gas boilers11), laboratories fea-
tured redundant analysers (B) and additional tests were prescribed in diagnosis to
be on the safe side (P1). The fact that room lights were kept on in case someone
may walk in (L) hence appeared to fit in well with the wider organisational culture.
The above quote also re-emphasized the important role of hierarchy in hospitals as
previously discussed and also reported by Tudor et al. (2008). Certain professions, in
particular surgeons, were regarded by their colleagues with much respect and it was
attempted to shelter them from nuisance. In particular temperatures in operating
theatres proved a contentious issue in this context (see also section 5.2): temperat-
ures were often predetermined at 18 ◦C or below to ensure the surgeon would not
sweat and concentrate well, while people at the periphery might well feel cold. It
seemed to generally remain unquestioned whether the actual thermal comfort prefer-
ences of the surgeon or the nature of the clinical case required such low temperatures.
11 For instance, the RLH is equipped with six 3.5MW gas-fired combi boilers. During the technicalsite visit on a fairly cold day during March 2013, only one of the boilers was in use while accordingto the technician even on peak days no more than four out of the six boilers are ever in use.
163

6 Qualitative findings: Socio-technical constraints on end-use energy savings
Similarly, the interviews indicated that patient needs for environmental conditions
such as temperature or lighting levels were often estimated based on experience and
potentially personal preference rather than through interaction with the respective
patient. In nursing, it certainly is crucial to emphatically accommodate the needs
of others, especially those excluded from exercising control over their environment
themselves due to vulnerability (Nightingale, 1860). These observations nevertheless
suggested that there may be some scope to question default operational states with
a view to reducing energy use to determine to what extent they meet actual needs
as opposed to pre-empting ideas of clinical needs and comfort.
6.3.2 The place for energy saving in the clinical day-to-day
Not surprisingly, hospitals were found to be rather demanding workplaces. All in-
terviewed staff reported to be very busy and the perceived lack of time seemed to
spread fairly equally across different roles, despite differences in responsibilities. In
line with official NHS communications (e.g NHS England, 2013), the interviewed staff
expressed strong commitments to achieve excellent patient care. In this endeavour
however they found themselves subject to many competing priorities, including:
• Responsibility for human life: Undoubtedly, responsibilities for clinical
staff especially in senior positions are rather high compared to other professions
as they are often required to take decisions affecting human life and death.
Depending on staff experience and patient need this can be quite taxing as the
following quote illustrates:
I think that A&E is very... stressful - not stressful, but you have to
be alert all the time and you are constantly thinking about what you
are going do with your patients, how are you not missing important
things, how are you not missing life threatening stuff. That... like
so much of my energy is focused on that. I have found that when
I am in A&E, I am very focused and people think that I am quite
serious, but it is just that I am trying to concentrate on not missing
anything or that kind of stuff. (P1)
164
6 Qualitative findings: Socio-technical constraints on end-use energy savings
• Budget constraints within the NHS: Pressures to continue delivering
value for money in the face of rising demands are high within the NHS (NHS
England, 2013). On the ground, this resulted in some awareness of cost issues
in all trusts but in particular at NUH where the funding situation had long
been complicated and culminated in the trust being put into special measures12
in March 2015.
• Staffing pressures: Partly a consequence of tight budgets, but also a result
of planning issues and recruiting difficulties as well as staff illness, all visited
departments suffered from more or less prolonged periods of under-staffing.
The workload of present staff consequently often doubled resulting at least in
overtime and no breaks but potentially more dramatically also in a lack of
time for patient care as one interviewee pointed out:
There seemed to be a lot of shortages somehow and it’s been looked
into and hopefully the issues will be resolved eventually because we
can’t work under such conditions. It comprises patients and safety
because right now there is so much work, you begin to lose your
concentration and there may be a detrimental impact on service
quality. (D)
• Security concerns: Hospitals are public spaces with largely uncontrolled
access, meaning that security can be a concern. Interviewees related occur-
rences of equipment and drug theft as well as the use of sanitary facilities for
substance abuse suggesting that a permanent state of alertness was indicated.
At the same time, patients or visitors in need for directions may constantly
approach any member of staff, especially at the difficult to navigate RLH.
• Personal well-being: Finally, staff also expressed concerns about their per-
sonal well-being, which from an organisational perspective will additionally be
important in the light of productivity. As far as building services were con-
cerned, this related in particular to thermal comfort preferences but also for
example to the need for cold temperatures or very bright light to stay awake
during night shifts as well as personal health issues such as hot flushes dur-
ing the menopause influencing fan use, or poor levels of eyesight as well as
spending extended periods in dim X-ray rooms marking lighting preferences.
12 When there are concerns about the quality of care that NHS hospitals are delivering, they can beput into special measures under the authority of three Department of Health funded bodies (CareQuality Commission, Monitor and the NHS Trust Development Authority). Special measuressupposedly provide the hospitals with support to improve while giving the public the ability tohold them accountable.
165
6 Qualitative findings: Socio-technical constraints on end-use energy savings
Among these great many priorities, the profile of sustainability and energy effi-
ciency proved comparatively low for the interviewed staff. It was, however, notable
that issues of waste disposal and recycling were valued more highly, while especially
switching-off lights held little importance to most. It was in consequence occasion-
ally forgotten when it would have admittedly been appropriate to turn the lights
off. Forgetting was in these situations understood as part of ‘being human’ (A),
indicating that energy use was of little priority to staff in the face of the above
engagements. In several departments, reminders were used to address forgetfulness,
but most interviewees did not appear convinced of their sustained effectiveness be-
cause ‘it lasts for a few weeks and then it goes back to normal.’ (L)
A lack of leadership on sustainability, at times combined with a more general lack
of leadership following staffing changes and under-staffing, was suspected to be a
further reason for the low priority of energy efficiency in hospitals. Three out of the
eleven investigated departments did not have on-site managers in charge of the de-
partments at the time of the fieldwork while many managerial tasks had temporarily
been taken over by other team members. Non-core activities had low priority as a
consequence. Similar findings have previously been reported generally (Zibarras and
Ballinger, 2011) and also for the NHS: Tudor et al. (2008) have undertaken a study
of the waste management in the NHS Cornwall. Managers there likewise tended to
prioritise health care related targets and showed a certain reluctance to spend money
on non-core activities including sustainability, resulting in low motivation among all
staff towards them.
All interviewed staff did show an awareness of the importance of budgeting for
the NHS and saving energy was appreciated as a tool to cut overall costs. Benefits
as well as difficulties were often interpreted in the light of immediate outcomes for
oneself and each department:
If the bills go up, then they will cut on the staff, so effects do come to
us. (R)
Saving energy therefore constituted an indirect tool for each employee to improve
their work environment. The relevance of such financial motive however relied on a
strong and trustful relationship between employer and employee forming the basis
for engagement. One interviewee described how the absence of a positive employer-
employee relationship impacted on work ethic and the consequent willingness to
make an effort, be it for energy efficiency or service delivery more generally:
166
6 Qualitative findings: Socio-technical constraints on end-use energy savings
It’s more to do with people’s... what do you call it... see, with their
enthusiasm to work in an environment where you feel like ‘I could go the
extra mile’. But under the circumstances, it’s not just lighting, it impacts
on other things. [...] I don’t want to say problem because problem is too
strong a word to use... But people don’t have the morale. (D)
In this sense, operational energy efficiency could potentially be understood as addi-
tional indicator of a successful organisation, while in return contributing to making
an organisation successful by delivering value for money.
To many interviewed staff, saving energy at the workplace further related to a
notion of being prepared for the future; similar to the concerns about eventual staff
reduction expressed in the above quote. Resourcefulness was seen as morally right
by a majority of interviewees while any waste had to be avoided on principle. It
is likely that cultural and socio-economic backgrounds will have contributed to this
understanding as one staff member originally from India pointed out:
And I know this sounds crazy but a lot of people come from poor coun-
tries and that is what they do automatically - not waste things. (U)
According to NHS workforce statistics, 80% of all Hospital and Community Health
Service staff were British in 2014 while the rest came from 212 other countries, most
prominently India, Ireland and the Philippines (Health and Social Care Information
Centre, 2014). It may be expected that diversity will be somehow higher for the
case study hospitals due to their London location. Cultural differences may hence
play a role with respect to what resources mean to individual members of hospital
staff13. Avoiding waste, especially with respect to consumables and through recyc-
ling while potentially less so for electricity, was in any case a common theme across
the interviews and seemed to reflect - possibly an extension of the notion of ‘caring’
to include future generations - a motive relevant to most clinical staff.
13 The facilities management at both RLH and NUH also commented on differing temperaturepreferences between cultures: according to them people from warmer countries tended to prefer(and demand) higher levels of space heating.
167

6 Qualitative findings: Socio-technical constraints on end-use energy savings
6.3.3 Section summary: A hierarchy of meanings
This section investigated a number of issues which collectively held meaning for clin-
ical staff in hospitals. It was found that all interviewed staff expressed strong com-
mitments to achieving excellent patient care. Similarly, it was collectively considered
important to leave a room or an equipment item ready for use in case colleagues or
patients might need it. Such kind concern for others often increased energy demand
because it made ‘on’ the default mode of operation for equipment and lights. In a
number of instances, the analysis questioned whether such pre-emptive approaches
actually contributed to the well-being of those considered. This suggested that there
may be scope for questioning default operational states with view to reducing hos-
pital energy use, an issue further discussed in section 7.3.
On the other hand, it was found that saving energy in their workplace held little
meaning for most clinical staff in the face of many competing priorities. A lack of
leadership on sustainability, at times combined with a more general lack of leader-
ship following staffing changes and under-staffing, further contributed to a low profile
of energy efficiency in most hospital departments. Many staff nevertheless under-
stood saving energy as tool to cut overall costs while appreciating the importance
of budgeting for the NHS. The average rating across all interviewees with respect
to the question ‘At your workplace, how important is saving energy for you?’ was
4.314 (n = 23) on a 5 point scale with 5 being ‘Very important’. Despite compet-
ing priorities, it hence seemed that (at least intellectually) saving energy had some
relevance for clinical staff in hospitals as work places.
14 It is expected that there were methodological limitations associated with this question (includingsome social desirability bias) while interviewees sometimes found it hard to interpret the ques-tion on a numerical scale. Accordingly, some interviewees introduced qualifiers differentiatingbetween the trust perspective and a personal perspective or between a theoretical importanceand where the trust was currently in terms of practical implementations. If such comments aswell as the unprompted provision of a rationale were considered a sign of reflection on the ques-tion while ratings by interviewees very immediately providing only a high score were excludeddue to suspected bias, the average rating dropped to 3.8 (n = 17).
168

6 Qualitative findings: Socio-technical constraints on end-use energy savings
6.4 Technological constraints affecting energy end-use
As opposed to behavioural approaches focusing on the action of individuals, practice
theory - in the tradition of sociology and science and technology studies - places a
strong focus on the role of technologies and the material environment in shaping hu-
man action. With respect to energy saving practices, technologies may refer to the
physical environment surrounding us including the buildings themselves, electrical
devices but also other physical objects and infrastructures. In a wider sense, pro-
cedural items such as schedules may also be understood to form part of the material
environment (following Latour, 1999).
Technology and infrastructure have been recognised to constrain and enable hu-
man activity at two levels: in the present and by channeling forthcoming activity
in what Schatzki (2002, p.44) refers to as ‘prefiguration’. Likewise, current material
arrangements been have shaped by past activities in a loop-like process. In the con-
text of this research project, the current design of hospital buildings as well as the
definition of clinical processes consequently needed to be understood as the outcome
of past decisions in which sustainability and efficient resource use may have been a
lesser concern than today given rising energy costs, threats from air pollution and a
changing climate.
The following sections investigate how energy efficient local operations in different
hospital departments may be constrained and enabled by technologies and mater-
ial arrangements, building on interview data as well as evidence from monitoring
and an analysis of the physical arrangements as described in chapter 4. Technolo-
gical constraints on energy efficient hospital operation are discussed in the present
(section 6.4.1), and as a result of prefiguration (section 6.4.2). Finally, possible
contributions of technology and material helpers in achieving low end-use energy
demand are also discussed (section 6.4.3).
169

6 Qualitative findings: Socio-technical constraints on end-use energy savings
Figure 6.2: Cross case comparison of reported thermal comfort levels
6.4.1 Operational challenges to resource efficiency
Technology and the material environment can pose major challenges to the optimal
running of departments, affecting both patient care and energy use. During the inter-
views, ‘insufficient working means’ were identified to be a central problem for clinical
staff and accounted for 71% (n = 29) of all coding references related to technological
challenges during operation (n = 41). Insufficient working means included lack of
space (especially in NUH and KCH Outpatients) and affected building services and
equipment corresponding to all electrical end-uses, while space cooling and heating
proved most problematic (38% (n = 11) and 24% (n = 7) of coding references under
the code ‘insufficient working means’ respectively). Frequently, staff had to develop
workarounds to achieve viable solutions in the face of such obstacles which at times
proved sub-optimal from an energy perspective but, perhaps more importantly, also
resulted in a waste of ‘personal energy (X)’ while likely being associated with higher
operational costs.
Space cooling was found to be especially problematic at NUH where two thirds
of the mentions (n = 8) of insufficient cooling means came from, and to a lesser
extent at KCH (n = 3), while the theme was not mentioned at the RLH. This was
also reflected in the reported thermal comfort levels across the different hospitals
(Figure 6.2) indicating serious overheating issues in NUH during the summer while
overheating has previously been identified as an important challenge for hospitals in
a changing climate (e.g. Lomas and Ji, 2009; Short et al., 2012).
170

6 Qualitative findings: Socio-technical constraints on end-use energy savings
From a clinician perspective, thermal discomfort affected both patient safety and
work place satisfaction (see also section 5.2). If the implemented ventilation and
space cooling strategies proved insufficient in achieving acceptable summer temper-
atures, supplementary space cooling equipment including portable air conditioning
units and fans were brought in:
So every summer we end up using portable units because the air condi-
tioning is not up to the standard it should be. (E)
This was extensively observed in NUH, in particular in the laboratory and on the
ward, but also in the radiology department and resulted in 4 - 8% of local electricity
use being employed for local space conditioning in addition to the energy require-
ments of central plant (not estimated in this study). In contrast, no heaters or fans
were observed at RLH and only individual devices in air-conditioned spaces at KCH.
A detailed analysis of building physical parameters contributing to this problem
was beyond the scope of this study, while previous research is available which in-
vestigates overheating in hospitals from a technical perspective (e.g. Lomas et al.,
2012; Lomas and Ji, 2009). It was, however, felt that the between-case differences
in ventilation and space cooling strategies (Table 6.3) implied challenges for mixed
mode strategies in existing hospitals which tended to evolve situational and often
with little strategic planning. NUH for example was originally built as mixed mode
building where the building core and spaces with specialist loads were mechanically
ventilated and space conditioned through the air handling units while the periphery
was naturally ventilated and heated through a wet radiator system. With increasing
heat loads from equipment and dense occupation as well as restrictions to window
opening, mechanical ventilation arrangements were seen to expand to the building
periphery while service delivery proved unsatisfactory.
171
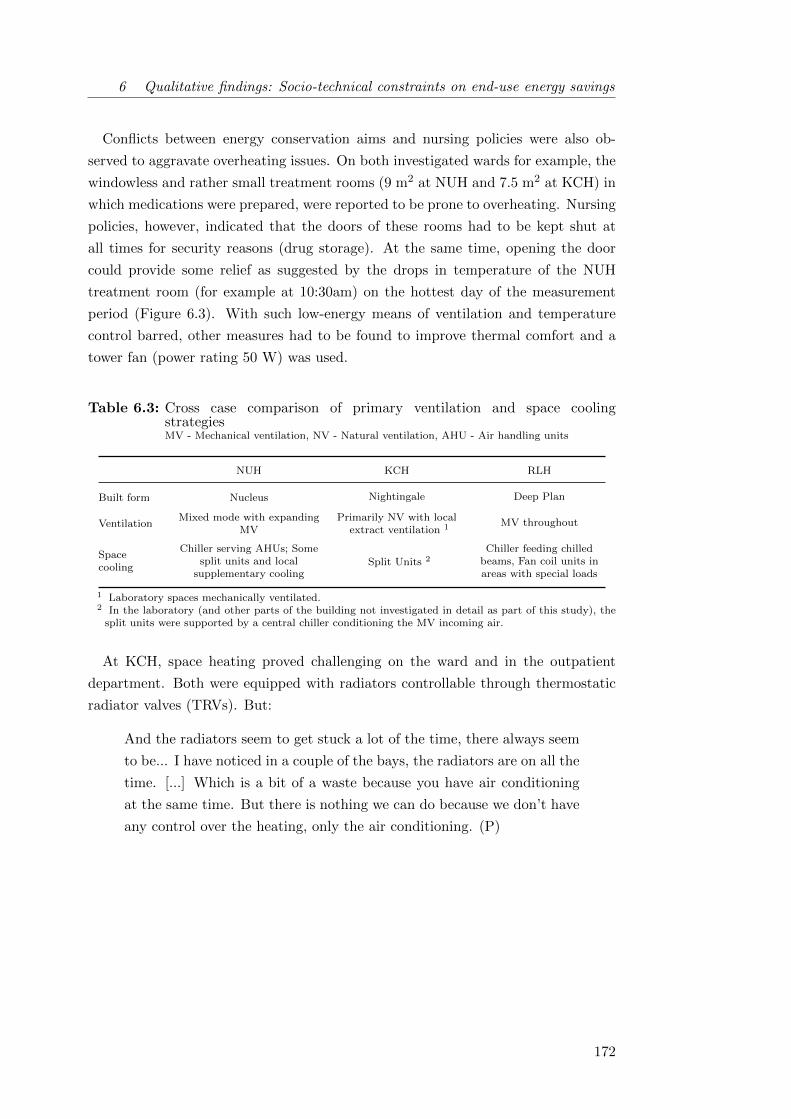
6 Qualitative findings: Socio-technical constraints on end-use energy savings
Conflicts between energy conservation aims and nursing policies were also ob-
served to aggravate overheating issues. On both investigated wards for example, the
windowless and rather small treatment rooms (9 m2 at NUH and 7.5 m2 at KCH) in
which medications were prepared, were reported to be prone to overheating. Nursing
policies, however, indicated that the doors of these rooms had to be kept shut at
all times for security reasons (drug storage). At the same time, opening the door
could provide some relief as suggested by the drops in temperature of the NUH
treatment room (for example at 10:30am) on the hottest day of the measurement
period (Figure 6.3). With such low-energy means of ventilation and temperature
control barred, other measures had to be found to improve thermal comfort and a
tower fan (power rating 50 W) was used.
Table 6.3: Cross case comparison of primary ventilation and space coolingstrategiesMV - Mechanical ventilation, NV - Natural ventilation, AHU - Air handling units
NUH KCH RLH
Built form Nucleus Nightingale Deep Plan
VentilationMixed mode with expanding
MVPrimarily NV with local
extract ventilation 1 MV throughout
Spacecooling
Chiller serving AHUs; Somesplit units and local
supplementary coolingSplit Units 2
Chiller feeding chilledbeams, Fan coil units inareas with special loads
1 Laboratory spaces mechanically ventilated.2 In the laboratory (and other parts of the building not investigated in detail as part of this study), the
split units were supported by a central chiller conditioning the MV incoming air.
At KCH, space heating proved challenging on the ward and in the outpatient
department. Both were equipped with radiators controllable through thermostatic
radiator valves (TRVs). But:
And the radiators seem to get stuck a lot of the time, there always seem
to be... I have noticed in a couple of the bays, the radiators are on all the
time. [...] Which is a bit of a waste because you have air conditioning
at the same time. But there is nothing we can do because we don’t have
any control over the heating, only the air conditioning. (P)
172
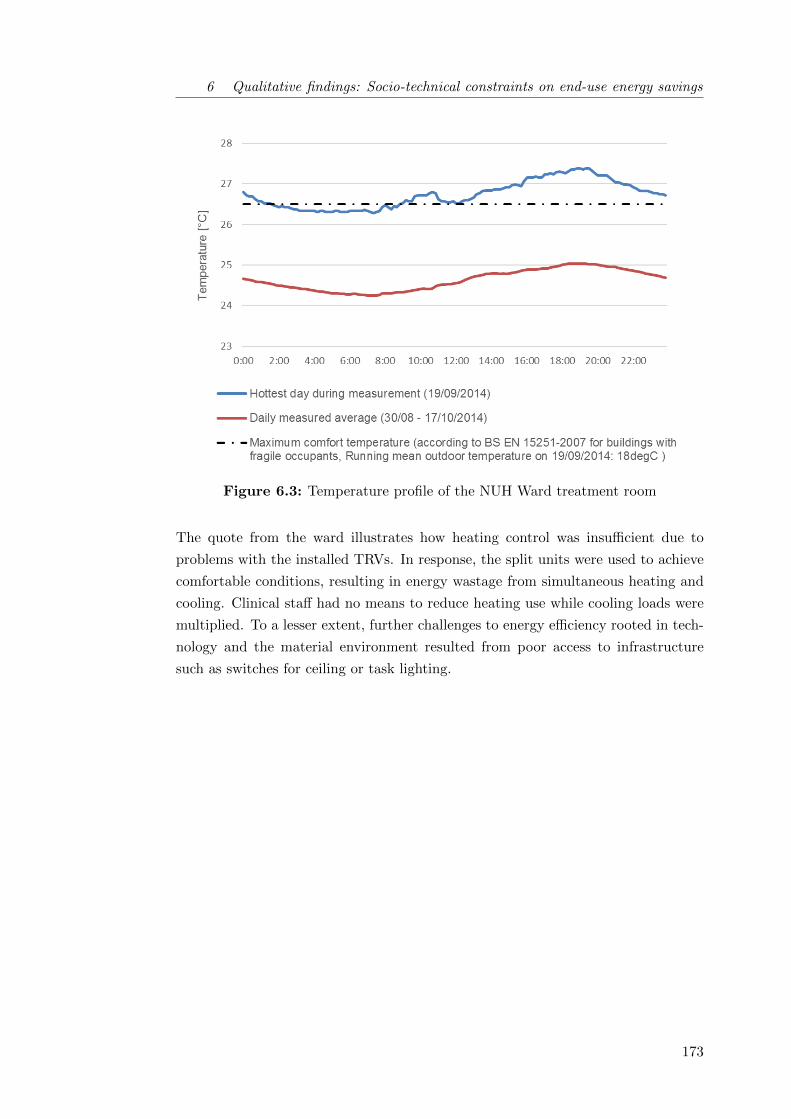
6 Qualitative findings: Socio-technical constraints on end-use energy savings
Figure 6.3: Temperature profile of the NUH Ward treatment room
The quote from the ward illustrates how heating control was insufficient due to
problems with the installed TRVs. In response, the split units were used to achieve
comfortable conditions, resulting in energy wastage from simultaneous heating and
cooling. Clinical staff had no means to reduce heating use while cooling loads were
multiplied. To a lesser extent, further challenges to energy efficiency rooted in tech-
nology and the material environment resulted from poor access to infrastructure
such as switches for ceiling or task lighting.
173
6 Qualitative findings: Socio-technical constraints on end-use energy savings
6.4.2 Energy intensive prefigurations in health care
Literature, interviews and the analysis of departmental set-ups provided evidence
for prefigurations of hospital services, spaces and protocols affecting energy demand
at two levels: firstly at a very fundamental level with respect to how a good as im-
portant as health could be provided to a population and secondly, how this service
(however it may be defined) was delivered as efficiently as possible. The former
question was ethically and politically complex and touched on big questions around
prevention, care in the community, palliative care as well as on issues around the
privatization of the NHS. More imminently, promoting all channels of health care
delivery including pharmacies, the NHS 111 helpline and GPs to reduce the use
of A&E for non-life-threatening injuries seemed important also from an energy per-
spective. Although certainly extremely crucial for resource use and carbon emissions
within the health care sector, these questions remained large outside of the scope of
this thesis.
In terms of the efficient delivery of a health service as currently defined, issues
resulted from the over-specification of space and equipment in hospitals. When
asked what they disliked about their buildings, almost two thirds (n = 8/14) of
the interviewed staff at NUH and KCH commented on a lack of space resulting in
overcrowding and overheating. In contrast, interviewees at the RLH talked about a
much higher variety of individual dislikes including slow lifts, heavy doors, bad food
in the canteen, the location of the hospitals with few interesting shops around and
a lack of fresh air due to windows not being operable. Three staff, however, also
mentioned poor signage throughout the building in combination with the following:
The thing I don’t like now is the distances we have to cover. [...] It
makes you tired at the end of the day. (L)
174
6 Qualitative findings: Socio-technical constraints on end-use energy savings
Objectively, the RLH offered much more space than the older hospitals, an average
theatre suite (104 m2) for example was 1.5 times as big as in NUH (69 m2). 24% of
the building’s total usable floor area was however comprised of corridors, lobbies and
stairs compared to 3 - 5% on average in shops, offices or factory spaces (no details
available for hospitals) (Liddiard, 2014). Investigating an outpatient department,
Bacon (2014) argued that sizing hospitals with view to actual occupancy could sub-
stantially reduce energy use (see also Bacon, 2015, for a more general and somehow
clearer presentation of the argument). It would seem that the large conditioned
circulation spaces at the RLH contributed unfavourably to the hospital’s absolute
energy use, while floor area normalized demand as specified in benchmarks charac-
terized the building as more efficient. This raised some methodological questions
around the measurement of and accountability for energy use, further discussed in
section 7.2.2.
Similarly, basic lux level estimates based on audited lighting installations in the
theatre departments appeared high at the RLH while spot validations with light-
ing level measurements suggested they somehow overestimated actual lighting levels
(Table 6.4)15. Especially in corridors, not atypically, the over-specification of light-
ing installations with respect to the relevant norm BS EN 12464-1 far exceeded the
uncertainty of the estimate, suggesting energy savings from reducing lighting loads
may be feasible in circulation areas across the hospital. At the same time, clinical
staff voiced satisfaction with the quality of lighting in their normal work areas in all
three hospitals. The RLH actually scored with 5.7 (n = 10) slightly lower on a 7
point scale (1 - Unsatisfactory, 7 - Satisfactory, see also Appendix C.2) than NUH
(6.1, n = 7) and KCH (6.0, n = 6). Uniquely, one RLH staff criticised glare on com-
puters screens indicating that potentially lighting installations across administrative
spaces could also be reviewed there.
Equipment levels in hospitals have been growing constantly over the last decade,
counteracting improvements in equipment efficiencies. A longitudinal analysis of
ERIC data revealed that the share of inpatient occupied beds with a patient power
service (comprised of television, radio and telephone) grew from 10.5% in 2001 to
60.5% in 200816 across all English general acute hospitals. Similarly, more electricity
intensive medical equipment was in use (Black et al., 2013).
15 It is appreciated that this is an indicative comparison only and measured lux levels will amongstothers be influenced by maintained illuminance requirements.
16 After 2008 the figure was no longer reported in ERIC, likely because this was now consideredstandard.
175
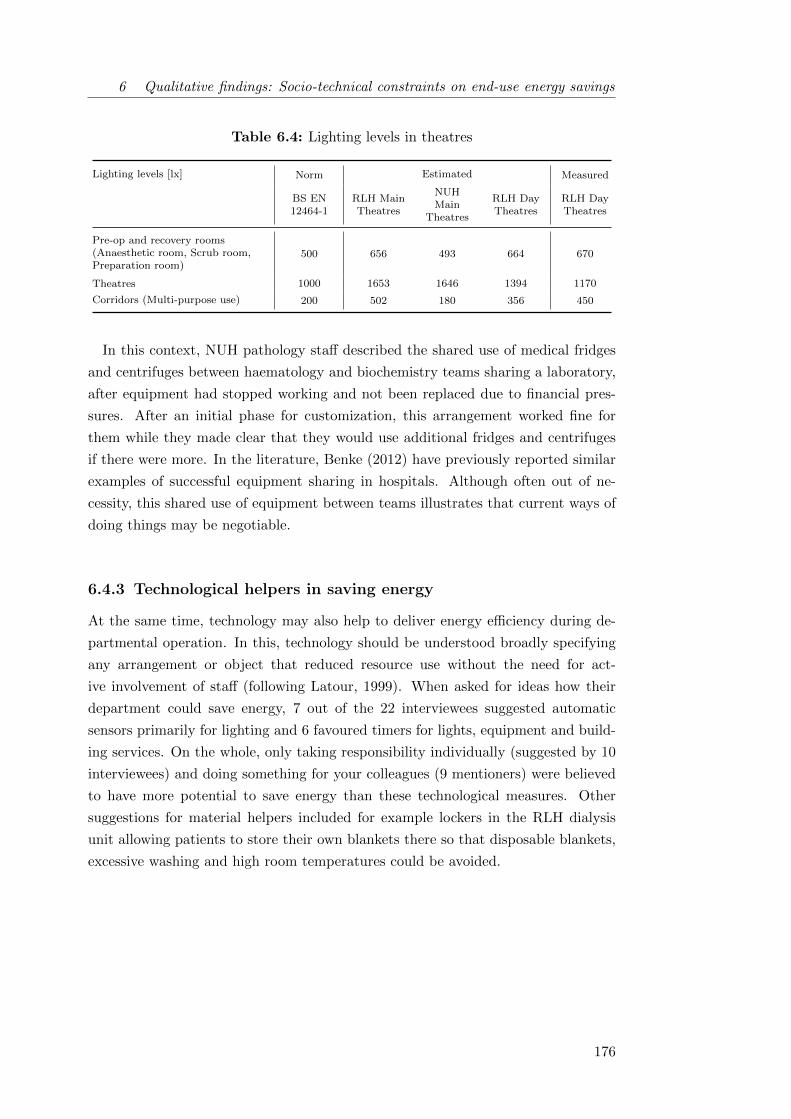
6 Qualitative findings: Socio-technical constraints on end-use energy savings
Table 6.4: Lighting levels in theatres
Lighting levels [lx] Norm Estimated Measured
BS EN12464-1
RLH MainTheatres
NUHMain
Theatres
RLH DayTheatres
RLH DayTheatres
Pre-op and recovery rooms(Anaesthetic room, Scrub room,Preparation room)
500 656 493 664 670
Theatres 1000 1653 1646 1394 1170
Corridors (Multi-purpose use) 200 502 180 356 450
In this context, NUH pathology staff described the shared use of medical fridges
and centrifuges between haematology and biochemistry teams sharing a laboratory,
after equipment had stopped working and not been replaced due to financial pres-
sures. After an initial phase for customization, this arrangement worked fine for
them while they made clear that they would use additional fridges and centrifuges
if there were more. In the literature, Benke (2012) have previously reported similar
examples of successful equipment sharing in hospitals. Although often out of ne-
cessity, this shared use of equipment between teams illustrates that current ways of
doing things may be negotiable.
6.4.3 Technological helpers in saving energy
At the same time, technology may also help to deliver energy efficiency during de-
partmental operation. In this, technology should be understood broadly specifying
any arrangement or object that reduced resource use without the need for act-
ive involvement of staff (following Latour, 1999). When asked for ideas how their
department could save energy, 7 out of the 22 interviewees suggested automatic
sensors primarily for lighting and 6 favoured timers for lights, equipment and build-
ing services. On the whole, only taking responsibility individually (suggested by 10
interviewees) and doing something for your colleagues (9 mentioners) were believed
to have more potential to save energy than these technological measures. Other
suggestions for material helpers included for example lockers in the RLH dialysis
unit allowing patients to store their own blankets there so that disposable blankets,
excessive washing and high room temperatures could be avoided.
176
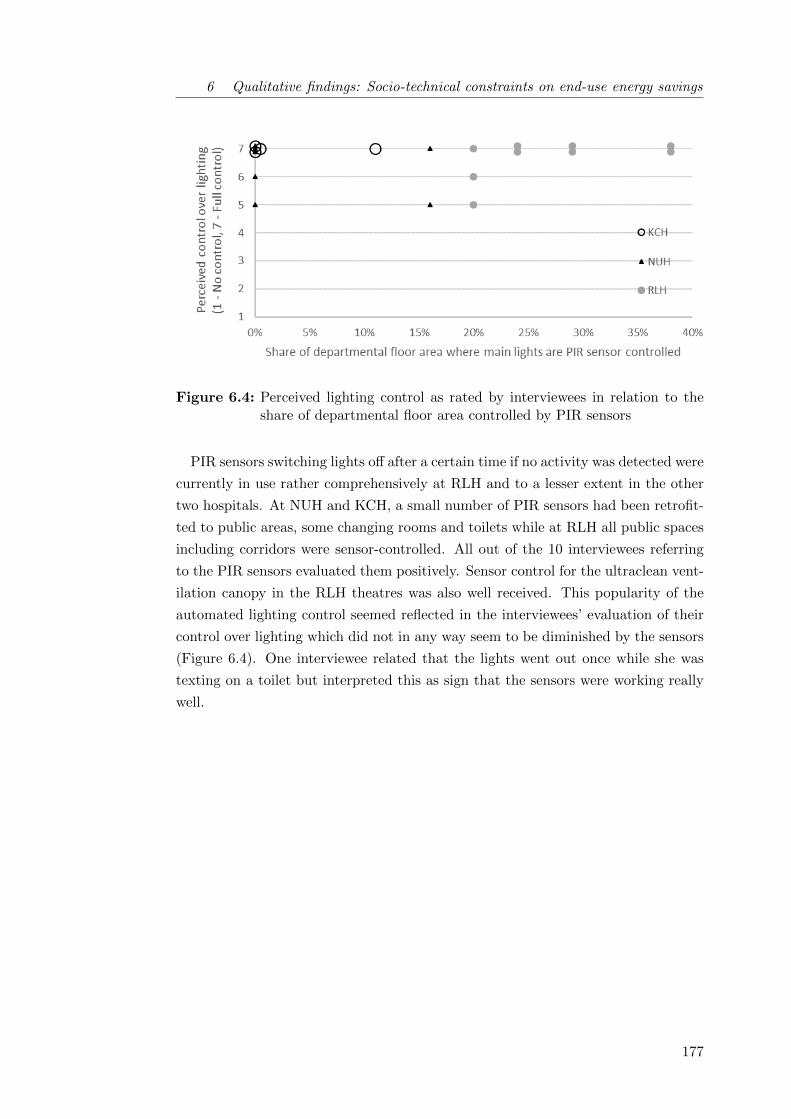
6 Qualitative findings: Socio-technical constraints on end-use energy savings
Figure 6.4: Perceived lighting control as rated by interviewees in relation to theshare of departmental floor area controlled by PIR sensors
PIR sensors switching lights off after a certain time if no activity was detected were
currently in use rather comprehensively at RLH and to a lesser extent in the other
two hospitals. At NUH and KCH, a small number of PIR sensors had been retrofit-
ted to public areas, some changing rooms and toilets while at RLH all public spaces
including corridors were sensor-controlled. All out of the 10 interviewees referring
to the PIR sensors evaluated them positively. Sensor control for the ultraclean vent-
ilation canopy in the RLH theatres was also well received. This popularity of the
automated lighting control seemed reflected in the interviewees’ evaluation of their
control over lighting which did not in any way seem to be diminished by the sensors
(Figure 6.4). One interviewee related that the lights went out once while she was
texting on a toilet but interpreted this as sign that the sensors were working really
well.
177
6 Qualitative findings: Socio-technical constraints on end-use energy savings
The time between registered activity and switch-off did however seemed to be a
crucial criterion in evaluating energy saving potentials from PIR sensors. It it re-
lated by the RLH facilities team that it was initially tendered to purchase sensors
for the new building which would switch the lights off 2 minutes after they had been
triggered. During the value engineering process cheaper sensors were chosen waiting
20 minutes to go off, resulting in many lights being on almost continuously given
hospital activity levels. One interviewee also observed that lights always seemed
to be on in toilets, wondering whether the sensor might pick up on activity in the
corridor through an open door - a known issue with many PIR sensors (BSI 2007).
In combination, these challenges may seriously hamper the savings potential from
PIR sensors and careful consideration during installation seems crucial.
Other technological helpers already in place across the case study hospitals in-
cluded the sleep mode for PCs switching off monitors and sending PCs into energy
saving mode after 30 minutes of inactivity. This feature was widely enabled in
all hospitals and seemed to be perceived by occupants as so normal that it was
rarely worth mentioning. All hospitals also featured an automated PC power down
administered by the central IT departments which automatically switched off all
workstations in non-clinical areas and some selected ones in clinical areas at 7 pm
and re-started them at 7 am. Employees were further encouraged to communicate
their actual working hours so that the power down software could be customized to
maximise energy savings. The initiative appeared to be well received by staff across
all hospitals, while few employees were aware of its existence and no-one was sure
about details such as timings of the switch off.
In a wider sense, the ‘quiet time’ held on the NUH Ward (as well as on other wards
within the Barts Health NHS Trust) could also be understood as technological helper
as it introduced a schedule to be observed by both staff and patients. Between 12am
and 2pm, lights were dimmed on the ward and TVs and other entertainment devices
were switched off to allow for patients to get some rest. Additionally, this quiet
time allowed staff to enjoy better defined lunch breaks. Staff reported that it was
important for the quiet time to be institutionalised so that it could be argued to
patients since on wards and in other care focused department types such as day
units, control over lighting and equipment was shared between staff and patients.
178
6 Qualitative findings: Socio-technical constraints on end-use energy savings
Protocols were generally found to be crucial agents in achieving energy efficiency
in situations were flexibility was required and full automation for example through
timers was not adequate. Frequently it would seem that major saving potentials in
particular in 24 hour areas with treatment functions resulted from matching room
use to staff availability or activity levels, by for example switching off all but one
X-ray room if only one radiographer was present during nights at NUH Radiology or
switching off one of the three RLH X-ray rooms at 4pm rather than 5pm to match
declining patient throughput (see also section 5.4). Desirable procedures were found
to be more readily implemented if they offered non-energy benefits such as reducing
stress at closing time at RLH X-ray or medical advantages such as more help at
hand if night-time surgeries were concentrated in adjacent theatres in NUH.
Such protocols and ways of doing things were however often found to be in conflict
with the notion of incessant availability in health care (see also section 7.3). But an
anaesthetic nurse working amongst others in emergency theatres clarified:
One thing we tend to forget is that even in a dying emergency, you are
being prompted. Let’s say a head injury arrives at the A&E, and since
this place is well developed, let’s say in the UK we are well advanced,
even before the patient comes here, we have a pre-information. Where
I used to work, sometimes they would bring patients who have been
involved in head injury, and the air ambulance normally brings them in,
but before the air ambulance even lands on the hospital premises, we
already have the pre-information. So by the time they land and transfer
the patient, even if he goes straight into theatres, we should get ourselves
sorted out. (A)
179
6 Qualitative findings: Socio-technical constraints on end-use energy savings
6.4.4 Section summary: Implications of technological constraints
This section uncovered a number of challenges for low carbon hospital operations
from technology and the material environment. Insufficient working means, in par-
ticular heating and cooling systems, were identified to pose major challenges to
resource efficient operations of hospitals. Problems with temperature control as well
as simultaneous heating and cooling resulted in the waste of energy, but likely also af-
fected clinical outcomes, staff morale and operational costs. Science and technology
studies have long stressed the importance of artefact functionality in organisational
ability (e.g. Goldkuhl and Braf, 2002). The findings of this study support the in-
terpretation that in particular constraints from material problems need to urgently
be addressed as well as taken into account in any attempt to affect organisational
change. Protocols shaping the way things were done further had a huge role as flex-
ible helpers to energy efficiency, while technological helpers could achieve savings in
well defined and more rigid processes.
The presented analysis indicated a prefiguration of hospital services, spaces and
protocols which affect energy demand at two levels: firstly with respect to how
health is provided to a population and secondly, with respect to the resource use
that was considered necessary and/or appropriate in this process. The former, very
fundamental consideration remained largely outside the scope of this study. As for
the latter, it was found that hospitals tended to be a risk-averse environment (see
also section 6.3.1) in which there was a tendency to over-size systems and spaces
in new designs. In existing hospitals, however, overcrowding and overheating was a
problem, suggesting there was a fine balance to strike here. Section 7.3 will further
address some of the resulting challenges, while this chapter highlighted the value of
Schatzki’s concept of prefiguration in uncovering the linkage between crisis response
strategies in the past and their implications for the future.
6.5 Summary of qualitative findings
This second findings chapter analysed how attempts to achieve end-use energy sav-
ings were constrained in the complex socio-technical systems that real-world hospital
departments constitute. The presentation of the (primarily) qualitative findings is
guided by Gram-Hanssen’s (2013a) empirical analysis framework for social practices
according to which the four elements embodied habits, knowledge, meanings and
technologies mutually shape each other and the practice in question.
180

6 Qualitative findings: Socio-technical constraints on end-use energy savings
In the presented analysis, energy saving at work was initially conceptualised as a
practice. But during the analysis it was found that adjusting the operational states
of lighting and appliances tended to be part of a set of other activities which clinical
staff performed, making energy saving in hospitals more akin to a ‘proto-practice’
(Shove et al., 2012, p.25) rather than a fully integrated practice in its own right.
Proto-practices are characterised by no or only weak links between the different ele-
ments which mutually constitute a practice. Albeit hard to predict and difficult to
enact, this finding implies that the making or strengthening of links between the
analysed practice elements could be one possible strategy to reduce energy and re-
source use in hospitals.
The chapter further highlighted a lack of joined-up knowledge on how to locally
define (energy) best practice, especially in complex and energy intensive department
types such as laboratories and operating theatres. Neither local clinical staff nor fa-
cilities or energy personnel seemed to have full insight into departmental operations,
which tended to be defined through both local and central processes. In contrast, the
local knowledge on how to control specific building services seemed well established
in most departments: it generally formed part of the institutionalised knowledge
and was shared between intermediate level professionals, primarily nurses. In com-
bination with strong core-teams, this arrangement seemed to work well for most
building users, including those excluded from directly exercising control over their
environment due to vulnerability or a focus on other responsibilities.
An efficient use of energy services was also limited by uncertainties as to whether
spaces and equipments may still be needed by other building users after hours. Such
uncertainties proved particularly relevant in health care where social considerations
aimed at accommodating potential needs of others proved to have much meaning.
This often resulted in increased energy use because ‘on’ was maintained as the de-
fault mode of operation for equipment and lights in case a colleague or a patient
might require these services. At the same time, saving energy was found to hold
little meaning for most clinical staff in the face of many competing priorities and a
lack of leadership on sustainability issues. Saving energy was, if at all, considered
a tool to avoid cuts in the departmental budget or proclaimed as the morally right
thing to do to preserve resources for future generations. While clinical staff intellec-
tually ascribed some importance to saving energy at work and thought much about
recycling, it was in particular considered ‘normal’ and ‘human’ to engage little with
lighting use, especially in shared spaces. These findings again emphasized that en-
ergy saving as such did hardly constitute a relevant practice in hospital departments.
181
6 Qualitative findings: Socio-technical constraints on end-use energy savings
The chapter finally uncovered significant challenges to satisfactory as well as re-
source efficient hospital operations from insufficient working means, in particular
under-performing or malfunctioning heating and cooling systems in older hospitals.
The new hospital investigated in this study achieved better thermal comfort levels,
while there was some evidence for the over-sizing of spaces, in particular corridor
spaces, and systems (including boiler and lighting installations) which negatively
impacted on absolute energy use. Importantly, floor area normalised energy use,
a metric typically used in energy performance benchmarking, appeared lower due
to the larger dimensions, highlighting the need for additional energy performance
metrics based on service delivery instead of floor area - a proposal further discussed
in section 7.2.2.
More generally, the next chapter 7 will now proceed to discuss further strategies
to achieve end-use energy savings in hospitals given the estimated savings potentials
from simple operational changes (chapter 5) as well as the recognised constraints
and enabling factors (this chapter 6).
182
7 Achieving end-use energy
savings in real-world settings
The discussion chapter brings together findings from the quantitative and the qual-
itative findings chapters and jointly discusses their implications, thereby addressing
the research objectives iii (7.1 - 7.2) and iv (7.3 - 7.4). The first section 7.1 pro-
poses an assessment framework by which the relevance of simple operational changes
to save energy can be gauged in different buildings and building parts. Some sug-
gestions to reduce the end-use of energy in hospitals based on the empirical study
findings are also made (section 7.2). The next section (7.3) investigates how clinical
processes are conceptualised from a facilities management perspective, highlighting
some limitations and room for improvement with a view to reducing hospital re-
source consumption. Section (7.4) finally suggests developments to the concept of
an energy savings potential as metric for decision support in organisational carbon
management processes.
7.1 Assessing the relevance of simple operational changes to save energy 184
7.1.1 Proposed assessment framework . . . . . . . . . . . . . . . . 184
7.1.2 Exemplary assessment for hospital buildings . . . . . . . . . . 187
7.2 Strategic suggestions for end-use energy savings in the hospital context190
7.2.1 Socio-technical suggestions for staff engagement in hospitals . 190
7.2.2 Beyond behaviour and simple operational change . . . . . . . 192
7.3 The black-boxing of (clinical) processes . . . . . . . . . . . . . . . . 194
7.3.1 The phenomenon of process black-boxing . . . . . . . . . . . 195
7.3.2 The implications of process black-boxing . . . . . . . . . . . . 196
7.3.3 Suggestions for looking inside process black boxes . . . . . . 197
7.4 A real-world energy savings potential . . . . . . . . . . . . . . . . . . 199
7.5 Summary of the discussion . . . . . . . . . . . . . . . . . . . . . . . . 202

7 Discussion: End-use energy savings in real-world settings
7.1 Assessing the relevance of simple operational
changes to save energy
Various staff-centred energy conservation initiatives have previously been trialled
in hospitals in the UK and worldwide, with varying success (section 2.2.1.2). The
available evidence was however largely limited to hospitals as a whole and little
information is available on scope and viability of interventions across different de-
partments despite their very different occupational and procedural characteristics
(section 2.4.2). Guidance documents on energy management however stress the
need to break buildings down, for example into areas with different uses, operating
hours and tenancy arrangements (CIBSE, 2012). This study consequently investig-
ated the influence of clinical staff on electricity use across five hospital department
types with differing operating hours, energy intensities and roles within clinical pa-
tient pathways (see chapter 4 for a description of the department types).
7.1.1 Proposed assessment framework
One objective of this study was to suggest a process by which the relevance of
behaviour and other simple operational changes as tools for carbon mitigation in
organisations can be assessed. Given its small scale, the study does not attempt to
provide a blanket recommendation for the use (or not) of behaviour change initiatives
to achieve energy savings in different hospital departments and buildings. Rather,
it highlights the importance of a robust understanding of contextual variables in
devising tailored organisational carbon management strategies. It is proposed that
a three-tiered process may be appropriate in identifying parts of a building or es-
tate where simple operational changes may be a viable tool for carbon mitigation
(Figure 7.1):
1. In a first step, it is recommended to undertake an engineering analysis of the
energy end-uses in the buildings and spaces in question, identifying significant
loads at a local level. CIBSE TM22 (CIBSE, 2006) or other bottom-up energy
assessment and audit methodologies provide guidance for this process.
2. Secondly, areas where energy services are provided but may not be required
for service delivery (redundant energy services) and the extent to which such
loads are influenced by the actions of occupants need to be determined. As
discussed in the quantitative findings chapter 5, floor area weighted opening
hours and staff control over energy-intensive end-uses may be helpful metrics
to allow for a first order assessment.
184
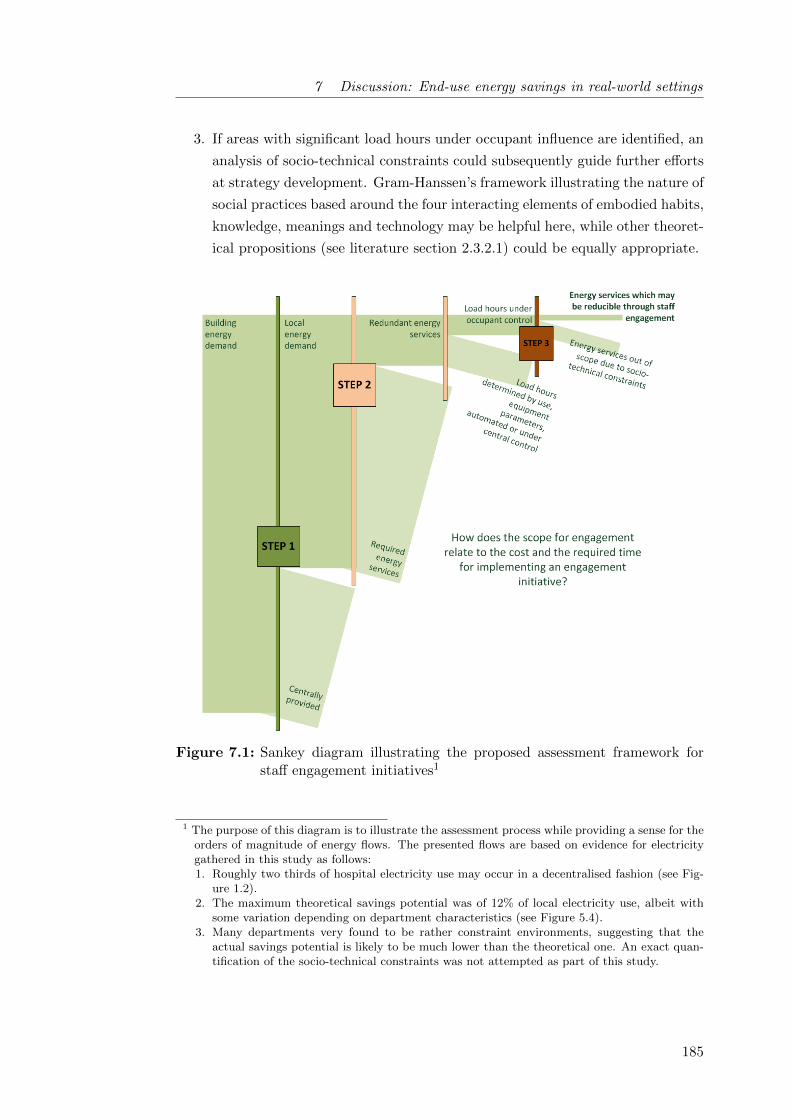
7 Discussion: End-use energy savings in real-world settings
3. If areas with significant load hours under occupant influence are identified, an
analysis of socio-technical constraints could subsequently guide further efforts
at strategy development. Gram-Hanssen’s framework illustrating the nature of
social practices based around the four interacting elements of embodied habits,
knowledge, meanings and technology may be helpful here, while other theoret-
ical propositions (see literature section 2.3.2.1) could be equally appropriate.
Figure 7.1: Sankey diagram illustrating the proposed assessment framework forstaff engagement initiatives1
1 The purpose of this diagram is to illustrate the assessment process while providing a sense for theorders of magnitude of energy flows. The presented flows are based on evidence for electricitygathered in this study as follows:1. Roughly two thirds of hospital electricity use may occur in a decentralised fashion (see Fig-
ure 1.2).2. The maximum theoretical savings potential was of 12% of local electricity use, albeit with
some variation depending on department characteristics (see Figure 5.4).3. Many departments very found to be rather constraint environments, suggesting that the
actual savings potential is likely to be much lower than the theoretical one. An exact quan-tification of the socio-technical constraints was not attempted as part of this study.
185
7 Discussion: End-use energy savings in real-world settings
Appropriate indicators for the assessment of socio-technical constraints are some-
how harder to pin down than those relating to technical drivers of energy use only.
The qualitative findings (chapter 6) of this study highlight a number of potential
factors defining the viability of changes in local practices in hospitals, none of which
have (as yet) been quantitatively assessed against their respective impact on savings
potentials. Quantifying the impact of some of these diverse influences on building
performance may hence represent a worthwhile area of future research (see sec-
tion 8.4.2).
For the time being, four factors are selected for subsequent discussion due to their
perceived importance in hospitals and their potential applicability in other non-
domestic building types2: the local knowledge on building services and equipment,
the shared use of space, the morale within the organisation and the suitability of
working means.
1. Importantly, the need for local knowledge on operational characteristics of
building services and equipment was identified to be a crucial pre-requisite
for energy efficient runnings. This included certainty about whether process
equipment could be switched off or into stand-by as well as an understanding of
how building services such as heating or specialist ventilation were controlled.
Out of the the presented factors, local knowledge is the least disputed - with
both individualist and socially orientated scholars agreeing on its importance
(see literature review chapter 2.1).
2 It is proposed that none of the identified factors stands in isolation and while the immediateimpact of for example insufficient working means on energy use may be drastic, a resilient socio-technical system may be able to compensate for such a challenge. To illustrate this hypothesisfor an empirical case: Excess energy use will be substantial if radiator valves are stuck and airconditioning needs to be used to combat overheating. But if staff are enthusiastic about theirwork, feel responsible for their space and further know who to call about this technical problem,chances are that it might get sorted reasonably fast.
186
7 Discussion: End-use energy savings in real-world settings
2. In the hospital context, a number of engagements of clinical staff were identi-
fied, amongst which caring for others featured prominently. From an energy
perspective, the kind concern for the well-being of others however often res-
ulted in increased energy demand because it made ‘on’ the default mode of
operation for equipment and lights. This was in particular the case in depart-
ments where the spatial arrangements required the shared use of office spaces,
locker or staff rooms with other departments with differing operating hours.
Uncertainty could arise there for staff as to whether energy services were still
needed by someone or not. The shared use of space with strangers could re-
duce staff engagement with energy services, comparable to energy behaviours
reported as typical for transient spaces (Cox et al., 2012).
3. A comparison of evidence from offices or manufacturing with accounts on the
realities of working life collected in this study indicated that, from an employee
perspective, hospitals were little different to other work places in many aspects
(see section 6.3). Saving energy was perceived an indirect tool for employees to
improve their work environment through reducing the organisation’s bills. The
relevance of such financial motive however relied on a strong and trustful re-
lationship between employer and employee forming the basis for engagement.
Inspiring places to work may moreover not only boost people’s morale to
engage with energy issues but to take responsibility for service quality and
delivery more generally, a factor applicable in all workplaces (Lo et al., 2012;
Pellegrini-Masini and Leishman, 2011).
4. And finally, insufficient working means (in particular heating and cooling
systems) were identified to pose major challenges to resource efficient hospital
operations in this study. Problems with temperature control as well as sim-
ultaneous heating and cooling resulted in the waste of energy, but likely also
affected organisational outcomes, staff morale and operation costs. Science
and technology studies have long stressed the importance of artefact function-
ality in organisational ability (e.g. Goldkuhl and Braf, 2002), highlighting the
relevance of this aspect across building types.
7.1.2 Exemplary assessment for hospital buildings
The proposed assessment framework can be applied to the hospital departments
analysed in this study, exemplifying its use while juxtaposing the findings of the
different data collection methods employed.
187

7 Discussion: End-use energy savings in real-world settings
STEP 1: Based on a review of the literature on hospital energy use, chapter 1.1.2
identified that about two thirds of a hospital’s electricity consumption typically are
from lighting or plug loads (such as IT or medical equipment and food preparation)
and therefore occur in a decentralised fashion across the estate. Local as opposed to
central energy demands can be difficult to address due to their fragmented nature
and the multitude of actors involved in bringing them about, making staff engage-
ment one possible carbon mitigation strategy worth exploring further.
STEP 2: Chapter 5 differentiated local electricity demands to show that lighting
loads are typically dominant in low-intensity hospital departments such as wards or
day clinics. High-intensity department types such as operating theatres and laborat-
ories were dominated by specialist equipment loads (including theatre ventilation).
For change initiatives, such energy intensive departments may offer large poten-
tials for absolute savings due to the energy intensity of the departmental processes.
A subsequent analysis of the theoretical savings potential achievable through
simple operational changes across different departments based on the identified met-
rics (chapter 5) suggested two departmental archetypes potentially holding relevant
end-use energy savings from simple operational changes in hospitals. Firstly, de-
partments with defined after-hours had substantial not-in-use periods. And
secondly, outpatient departments (ODPs) focused on consultations or dia-
gnosis seemed to exhibit high levels of clinical staff influence over installed electrical
loads. Notably, they were often also defined by clear after-hours.
STEP 3: According to the qualitative findings (chapter 6), fewer constraints
and therefore potentially higher savings potentials for initiatives aiming to engage
clinical staff with energy issues were believed to prevail in:
A) Departments with many individual spaces: due to less need for social
considerations and clearer attributions of switch-off responsibilities;
B) Simple departments with well established switch-off protocols: where
energy and sustainability best-practice agendas could easily be established and
were conveyed to relevant staff through the provision of appropriate and com-
prehensive training sessions;
C) Inspiring places to work: where most employees were enthusiastic and pre-
pared to go the extra mile while encouraged by the management to contribute
ideas for improvements; and finally
188

7 Discussion: End-use energy savings in real-world settings
Table 7.1: Simplified cross tabulation of departmental archetypes with relevantenergy savings potentials according to different findings (quan + qual)Green cells represent circumstances where the quantitative and the qualitative conditionswould likely occur in the same department, while for red cells the respective conditionsexclude each other.
Department types with relevant energysavings potentials according toqualitative (right) and quantitativefindings (below)
A)
Many
ind
ivid
ual
space
s
B)
Sim
ple
dep
art
men
ts
C)
Insp
irin
gw
ork
pla
ces
D)
Fun
ctio
nal
&E
ffici
ent
1) Energy intensive O O
2) Defined operating hours O
3) OPDs with limited patient residence O O
D) Functional workplaces: where both infrastructure and service definition were
in excellent working order and optimised for low energy use, allowing employees
to focus on their core activities.
A cross-tabulation of the departmental archetypes identified through quantitative
and qualitative analysis respectively shows limited deterministic overlap between the
categories (Table 7.1). Solely, arrangements tended to be more complex in energy in-
tensive departments, complicating the identification of best practice procedures. At
the same time, the cost of energy was more present to clinical and managerial staff
there, potentially supporting the rollout of an energy efficient standard for working
means. Due to the high patient throughput and in order to meet privacy and dig-
nity standards, outpatient departments often held separate and clearly signposted
facilities and responsibility conflicts resulting from the shared use of space were less
common. Finally, department types with defined after-hours tended to have more
established switch-off protocols, while the clear after-hours reduced social consider-
ations according to which lights and equipment were left on in case someone might
need them.
The limited overlap between departmental archetypes identified through quantit-
ative and qualitative analysis suggested that both are important in order to identify
relevant savings potentials. At a methodological level, the breadth and the range of
the inquiry was therewith successfully expanded by the mixed-method deployment
(see section 3.4.1).
189
7 Discussion: End-use energy savings in real-world settings
Overall, the proposed assessment framework qualitatively outlined a process to
select spaces within complex buildings where behaviour or other simple operational
changes may represent viable tools for organisational carbon management. Field
tests are recommended to establish whether the proposed framework is useful to
practitioners in thinking about staff engagement initiatives in organisations.
7.2 Strategic suggestions for end-use energy savings in
the hospital context
In addition to proposing a procedural assessment framework, a number of sugges-
tions to improve operational energy efficiency in existing hospital buildings can be
derived from the presented empirical analysis of departmental energy use (chapter 5)
and constraints on end-use energy savings (chapter 6). The suggestions are briefly
outlined below and aim to improve on (7.2.1) or go beyond (7.2.2) simple staff en-
gagement strategies.
7.2.1 Socio-technical suggestions for staff engagement in hospitals
As pointed out in section 2.4, energy managers may resort to staff-centred energy
conservation initiatives and other attempts at simple operational changes for a num-
ber of reasons, namely a lack of funding, time or control over infrastructural compon-
ents. Despite debate about using socio-technical analysis in favour of individualist
attempts at changing behaviours (section 2.1), it will hence seem to this author that
there is value in taking account of a wider number of constraints and enabling factors
also in the design of staff engagement campaigns.
Table 7.2 suggests a number of potential strategies corresponding primarily to
the first level of the proposed conceptual framework (Figure 2.4), which will be dis-
cussed in more detail subsequently. Importantly, none of the proposed strategies has
been tested within the remit of this study; they are hence to be understood as an
invitation to think more broadly about staff-centred energy conservation initiatives
in hospitals rather than as prescriptive recipes for success.
190

7 Discussion: End-use energy savings in real-world settings
Table 7.2: Possible strategies to promote staff engagement with energy issues
Sphere Improved staff engagement strategies in existing hospital buildings
HabitsPromoting lighting and equipment switch-off as part of a routine: ‘Time togo home’
KnowledgeFocusing engagement campaigns on intermediate level professionals takinginto account their routines and motivations as well as tailoringcommunication means and messages to them
MeaningsInvestment in job satisfaction through accountable local leadership,appropriate staffing levels as well as a culture of openness to ideas andfeedback
Technology‘Quick fixes’ for overheating issues where possible such as loadre-distribution (Christiansen et al., 2015) and safety features for windowsto make them operable
This study has highlighted that the switch-off of lights and equipment across all
departments tended to be driven by routines, not by demands. Those switch-off ac-
tions that appeared habitual in character were found to be firm part of a temporal
routine, in particular at closing time. In order to promote equipment and lighting
switch-off, it consequently seemed important to acknowledge their place within a
wider cluster of activities which people carried out to end their shifts. This may
include activities such as cleaning or the hand-over of information which potentially
are more closely associated with clinical outcomes and therefore of higher priority
to staff. Promoting these combinations of activities, potentially with the positively
connoted message ‘Time to go home’ after a long and busy working day, may be
more promising than focusing on switch-off actions alone3.
3 Clinical staff were in some cases also found to be unsure about the operating characteristics ofspecialist medical equipment, making it impossible for them to decide whether or not equipmentcould be switched-off or into stand-by. In line with suggestions by others (Jensen and Petersen,2011; Rohde and Martinez, 2015), it therefore appeared important to clarify options for theswitch off of medical equipment.
191

7 Discussion: End-use energy savings in real-world settings
It also seemed important to tailor engagement campaigns to reach out to the ap-
propriate individuals, in particular in strictly hierarchical environments with strong
labour division like hospitals. This study found that the knowledge on and the re-
sponsibility for controlling building services (potentially beyond lighting but often
even including lighting) was concentrated in the hands of nurses and comparable
intermediate level professionals such as operating department practitioners (ODPs)
in theatres. Engagement campaigns in clinical areas of hospitals might hence want
to concentrate on them by taking into account their routines and motivations as well
as tailoring communication means4. This will also include ensuring good morale so
people feel prepared to go the extra mile.
Finally, challenges that remain on the systems-side may not be overlooked when
attempting to improve operational energy efficiency, in particular with respect to
overheating issues. Ultimately, well-being and comfort needs of patients and staff
take priority over energy issues as energy demand is essentially a by-product of ser-
vice provision and not vice versa. Often, technological challenges will be substantial
and require more fundamental investment and re-thinking, but at times easy and
low-cost ‘quick fixes’ may be available to ensure that the comfort needs of all occu-
pants are being met while eliminating energy inefficient work arounds.
7.2.2 Beyond behaviour and simple operational change
Findings chapter 5 has shown that the theoretical influence of clinical staff on hos-
pital electricity use was limited in most hospital departments, while chapter 6 hinted
at the wide range of other stakeholders and processes involved in the resource effi-
cient operation of a hospital. This section briefly outlines a number of avenues other
than simple behaviour change which appeared beneficial throughout the case study
investigation.
4 Nurses did for example spend limited time at a computer (as opposed to people in offices)and their day to day was determined by much moving around and face-to-face interaction withpatients, colleagues and visitors. Engagement approaches meeting them directly in their depart-ment and inviting their input on the functionality of working means while discussing switch-offprocedures consequently seemed most promising, despite the required investment of time.
192

7 Discussion: End-use energy savings in real-world settings
In line with current practice in many hospitals, this study found it recommendable
to make use of appropriately configured technological helpers (such as PIR sensors or
timer settings for IT equipment) wherever possible as they proved popular with both
clinical and technical staff (section 6.4.3). In particular for centrally controlled timer
settings, manual override functionality appeared appropriate to customise techno-
logical helpers and enable them to flexibly meet the local demand. Timer settings
could for example be implemented for anaesthetic gas scavenging systems in theatres
based on planned operation (section 4.4.2) if effective options for override allowed
staff to take the pumps in operation whenever necessary. In hospitals with powerful
HVAC systems such as the new-built RLH, night-time temperature set-backs could
also be implemented throughout as and when manual override functions allowed staff
to adjust the temperatures locally in case of unplanned space utilisation, including
for emergency surgery (section 6.2.1).
It also seemed that not only the use but also the purchasing of medical equipment
deserved more attention. In tendering for any hospital equipment, clinical require-
ments are of course central. Cost savings from equipment sleep modes or quick
re-calibrations allowing for complete switch-off after-hours would however seem a
persuasive argument for including energy efficiency criteria in procurement specific-
ations. Jensen and Petersen (2011) report that currently few tenders for energy
intensive imaging equipment included energy use as criteria in Denmark. In the
UK, the late NHS Purchasing and Supply agency published an assessment tool for
energy efficiency requirements of electric medical devices (Centre for Evidence-based
Purchasing, 2009), but its use (or lack of) remains in the hand of individual hospitals.
Against this background, it was felt that the hierarchical environment prevalent
in hospitals subordinating other professions to doctors may be complicating it for
equipment technicians to take a stand in procurement questions. Further research
into the power dynamics of such relationships to clarify this notion is recommended
(see also section 8.4). Collaborations with equipment manufacturers and vendors
may also be a route to innovate towards a new product generation with lower elec-
tricity use (Rohde and Martinez, 2015).
193

7 Discussion: End-use energy savings in real-world settings
Findings in this study have further suggested that the specification of energy
benchmarks per floor space may benefit the over-sizing of new health care facilit-
ies5. Based on past experiences with overcrowded hospitals, a generous allocation
of space is certainly desirable especially with respect to the future flexibility of a
building. There may however be a danger of overshooting, with associated negative
implications for energy and resource consumption, including construction materials.
Specifying additional energy targets on the basis of service delivery may con-
sequently be one way forward, despite obvious complications with how service de-
livery should be specified. There is, however, a wealth of thinking available which
has gone into clinical accountability and costing of treatments. It will seem to this
author that increased collaboration between facilities managers and interested clini-
cians as well as administrators may be a way forward here to provide additional
metrics for the energy performance benchmarking of hospitals.
The following section 7.3 now proceeds to reflect on some of these issues more
abstractly, in order to contribute to the generation of theory.
7.3 The black-boxing of (clinical) processes
Chiu et al. (2014) analyse the process of domestic retrofit from a socio-technical
perspective. They reveal the existence of a dynamic and iterative adaptive process
between technology, project teams and occupants, where retrofits have previously
often been regarded as ‘black boxes’ (following Latour, 1999). This section uncovers
parallels to such black boxes in the conceptualisation of clinical processes in hospit-
als from a facilities management perspective.
5 Somehow similarly, English (2014) suggests that air-changes-per-hour (ACH) are an unhelpfulmetric to specify required dilution ventilation rates in hospitals: Using ACH benefits the over-sizing of ventilation systems by not taking into account that contaminants naturally dilute inlarger volumes.
194
7 Discussion: End-use energy savings in real-world settings
7.3.1 The phenomenon of process black-boxing
Over the course of this research project, the author variously came across the no-
tion that local operational energy savings were unlikely within hospitals due to the
importance of the processes ongoing there, a suggestion repeatedly voiced by prac-
titioners and academic experts in the buildings field. Reductions in hospital carbon
emissions were considered feasible primarily through central changes to buildings
and systems or supply-side initiatives such as combined heat and power plants or
renewables (see chapter 1.1.3). During data collection on the ground, the only non-
clinical interviewee, an IT expert responsible for the computer-based archiving of
radiologic diagnosis results, also stressed the difficulties for energy saving attempts
in clinical areas:
It is difficult. Because it is a clinical area. Because services are run and
patients are in and out the trust at particular times. You know, it will
be difficult. But I think it is achievable in areas that are not... in non-
clinical areas, especially the offices having a note to switch off after for
example 8 o’clock. (I)
The technical analysis in this study (see chapter 5) confirmed a higher energy sav-
ings potential from behaviour and simple operational changes in areas with defined
operating hours. It did however seem notable that if clinical staff argued that more
energy could be ‘saved elsewhere’, they did so on size and process grounds as part
of the clinical work flow (see section 6.2.1). Non-clinical staff and building experts
in contrast seemed to take an outside look and considered the clinical process sac-
rosanct, similar to the black box proposed by Latour. health care was conceptualised
as non-stop and emergency driven while the impression on the ground taking a clini-
cian perspective was quite different.
On the ground, established protocols were in place to manage in particular emer-
gency situations and staff’s designated roles and responsibilities helped to structure
complex and potentially life-saving activities into manageable and almost routinised
tasks. As one staff working amongst other in emergency theatres put it:
There can be no panic. Because if there is panic, there will be mistakes.
(X)
195

7 Discussion: End-use energy savings in real-world settings
Powell et al. (2014) concluded similarly from an interview study in an accident and
emergency department where new nurses and doctors tended to find the environment
stressful at first but then got used to it. health care became a job like many others
- leaving little room for the argument that considering changes in clinical processes
needed to remain out of bounds in attempts to develop strategies for reducing the
resource consumption of hospitals.
Similar notions of ‘process black-boxing’ have also been identified in other con-
texts, albeit for different reasons:
• An expert discussion group between about 20 academics and practitioners
experienced in consulting energy intensive industries concluded that the energy
managers of manufacturing companies were often responsible for the building
sided energy use only but had no control of or even insight in the production
processes (ECEEE, Informal session 04/06/2015).
• Various energy managers of universities (UCL, Cambridge University, King’s
College London) have also commented towards this author that they held no
authority over energy-intensive research laboratories, including extensive plant
growth facilities accountable for large shares of the fuel bill6.
7.3.2 The implications of process black-boxing
The interest in ensuring the quality of the respective process varies across the three
contexts discussed above (ensuring human health, protecting commercial interests or
guaranteeing sensitive research designs), but the outcome from an energy perspect-
ive seems comparable: the limited insight in and understanding of organisational
processes leaves little scope for holistically identifying opportunities to reduce the
associated energy use.
6 Often, the operation of HVAC systems in complex non-domestic buildings is also contractedout and no longer within the responsibility of building or energy managers (for example Palmand Darby, 2014, for hospitals common through public-private partnerships). It is believed thatsuch increasing fragmentation of building management tasks complicates the holistic analysisand optimisation of building operations. Opportunities for energy demand reductions may hencebe left out of consideration.
196
7 Discussion: End-use energy savings in real-world settings
In hospitals, the disconnect between the clinical reality and its conceptualisation
by non-clinicians (including facility managers and those developing carbon mitiga-
tion programmes for hospitals) pointed towards the important question of who, if
anyone, did hold knowledge on reducing departmental electricity use. The dichotomy
between clinical and energy knowledge was also evident in the conception of this re-
search project, which for the generation of ideas on potential operational changes
sought input from the interviewees as local experts, while interviewees interested in
sustainability were found to frequently hope for input from the researcher. A risk
of overlooking potential savings options seemed to result from this lack of joined-up
knowledge on energy conservation pathways specific to the hospital setting.
Such detailed analysis will arguably take more time at the ‘energy planning stage
(BS EN ISO 50001: 2011)’ and during implementation, while time is at a premium in
hospitals and many other contexts. In many cases, however there seems to be scope
for and mutual benefit from more collaborative attempts between core staff (i.e.
clinical staff in hospitals, production engineers in the manufacturing industries or
scientists in university laboratories) and those focused on cutting the organisation’s
carbon emissions to explore and establish acceptable operational states associated
with lower levels of service delivery. Notably, such attempts move the extent of op-
erational changes more towards the third level depicted in the conceptual framework
presented in section 2.4.1.
7.3.3 Suggestions for looking inside process black boxes
Comprehensive operational changes require fundamental questions around how ser-
vices in general as well as building services requirements are understood and defined.
The following paragraphs place the findings of this study against the literature to
highlight some scope for questioning established notions.
Service understanding: In their practice based study of four UK research labor-
atories, Palm and Darby (2014) question the notion of 24-hour buildings. They argue
that ‘while the concept of a 24-hour building might sound flexible and empowering
(p.82)’ and even represented an asset attracting academics to the university, the
actual need for and use of the building between 11pm and 7am was minimal.
197

7 Discussion: End-use energy savings in real-world settings
Similarly, this study found that even hospitals - where the need for some 24-hour
provision to deal with emergencies is not subject to project deadlines, cultural inter-
pretations of work ethics or personal ambitions - did not correspond to the notion
of a 24-hour building. Parts of departments did of course operate on a 24 hour
basis but this requirement would hardly extend to entire departments yet alone
the entire building (chapter 4.7). Many hospitals nevertheless seemed to operate
as continuously on, both from an employee and potentially more importantly also
from a facilities management perspective. A higher resolution in the spatial under-
standing of operating characteristics may be an important step forward here (see
section 8.3.1.1 on study implications for facilities professionals).
Specifying requirements for building services: This study further high-
lighted some of the difficulties associated with specifying the required levels of build-
ing service delivery in the sensitive context of hospitals (see for example section 6.3.1
on temperatures in operating theatres). Mathew et al. (2004) also address the tricky
topic of health and safety in specialist buildings in their study on required ventilation
rates in laboratories. They conclude that even in the health-critical context of labs
‘(t)he definition of what constitutes a requirement is often open to interpretation,
and should not necessarily be taken at face value’ (Mathew et al., 2004, p.3-237).
English (2014) seconds this call for ventilation rates in US hospitals more generally:
Based on an informal and non-peer reviewed web survey, he finds that ‘some con-
sulting engineers say they feel “handcuffed” by the ventilation standard (“We could
achieve so much energy efficiency, if only we could change the ventilation rates”),
while others believe the ventilation rates are akin to a moral imperative (“If the code
says 6 ACH, anything less endangers patients”)’ (p.1).
The above quotes go a long way to illustrate that the stakes in all questions as-
sessing actual service requirements in hospitals are high. It will nevertheless seem
to this author, that given the urgency to reduce carbon emissions in all sectors of
society, careful analysis and constructive debate should not remain out of bounds.
Consequently three strategies allowing facilities and energy managers to look
into the black box of clinical requirements are proposed, based on an evaluation of
the literature as well as the experience of this author acquired over the course of the
project. It is thought that likely all of them will be needed, while the knowledge
gap between the facilities and the clinical understanding may progressively decrease
from 1 to 3:
198

7 Discussion: End-use energy savings in real-world settings
1. Seeking out process information in clinical reports: Clinical reports on
hospital operations could be regarded as tools to establish dialogue as they -
although likely too complex in many aspects from a lay perspective - highlight
priorities and workflows from a clinical perspective. Bacon (2015) argues that
’It is through such clinically led studies that the estates professional is able to
find the clues to the evidence base that is required to enter into an informed
dialogue with the clinical leadership teams’ (p.46).
2. Collaboration with interested clinicians: Health professionals increas-
ingly recognise air quality issues and climate change as threat to human health
(Watts et al., 2015). Numerous organisations in the UK, such as the Oxford
based Centre for Sustainable Health Care or the medicine student-led organ-
isation Healthy Planet UK as well as many personally interested clinicians (for
example Pierce et al., 2014, and many others met during the fieldwork) are
actively engaged in moving the sustainability agenda forward from the clin-
ical side. van Amstel et al. (2015) further give recommendations to encourage
participatory design practice in health care projects.
3. Novel methodologies for the assessment of service requirements:
Novel methodologies including modelling and simulations are needed to assess
actual process requirements in detail. Mathew et al. (2004) for example pro-
pose computational fluid dynamics (CFD) simulations of different spill scen-
arios to determine safe ventilation rates in laboratories. System-dynamics
based participatory and group modelling exercises also seem particularly re-
warding in this sensitive context to capture demands and concerns of all in-
volved stakeholders.
Albeit time consuming and potentially difficult, it seems that the proposed methods
may contribute to opening the black box of clinical processes in different hospital
departments and can therefore help to identify more fundamental end-use energy
demand reduction strategies. Similarly, the next section (7.4) suggest developments
to the concept of an energy savings potential as metric for decision support.
7.4 A real-world energy savings potential
Section 2.2.2.1 highlights the importance of ex-ante evaluations, i.e. attempts to
forecast intended energy savings of future projects before an investment decision is
made. Savings potentials are a commonly used metric is this context.
199
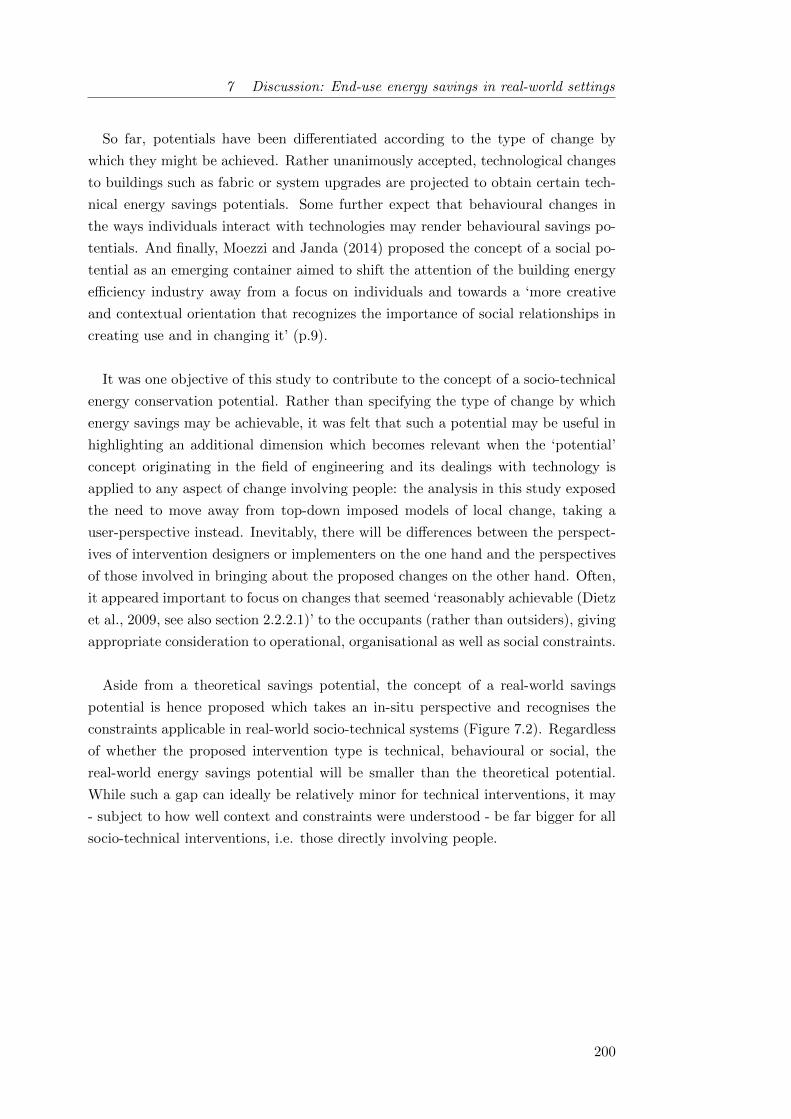
7 Discussion: End-use energy savings in real-world settings
So far, potentials have been differentiated according to the type of change by
which they might be achieved. Rather unanimously accepted, technological changes
to buildings such as fabric or system upgrades are projected to obtain certain tech-
nical energy savings potentials. Some further expect that behavioural changes in
the ways individuals interact with technologies may render behavioural savings po-
tentials. And finally, Moezzi and Janda (2014) proposed the concept of a social po-
tential as an emerging container aimed to shift the attention of the building energy
efficiency industry away from a focus on individuals and towards a ‘more creative
and contextual orientation that recognizes the importance of social relationships in
creating use and in changing it’ (p.9).
It was one objective of this study to contribute to the concept of a socio-technical
energy conservation potential. Rather than specifying the type of change by which
energy savings may be achievable, it was felt that such a potential may be useful in
highlighting an additional dimension which becomes relevant when the ‘potential’
concept originating in the field of engineering and its dealings with technology is
applied to any aspect of change involving people: the analysis in this study exposed
the need to move away from top-down imposed models of local change, taking a
user-perspective instead. Inevitably, there will be differences between the perspect-
ives of intervention designers or implementers on the one hand and the perspectives
of those involved in bringing about the proposed changes on the other hand. Often,
it appeared important to focus on changes that seemed ‘reasonably achievable (Dietz
et al., 2009, see also section 2.2.2.1)’ to the occupants (rather than outsiders), giving
appropriate consideration to operational, organisational as well as social constraints.
Aside from a theoretical savings potential, the concept of a real-world savings
potential is hence proposed which takes an in-situ perspective and recognises the
constraints applicable in real-world socio-technical systems (Figure 7.2). Regardless
of whether the proposed intervention type is technical, behavioural or social, the
real-world energy savings potential will be smaller than the theoretical potential.
While such a gap can ideally be relatively minor for technical interventions, it may
- subject to how well context and constraints were understood - be far bigger for all
socio-technical interventions, i.e. those directly involving people.
200
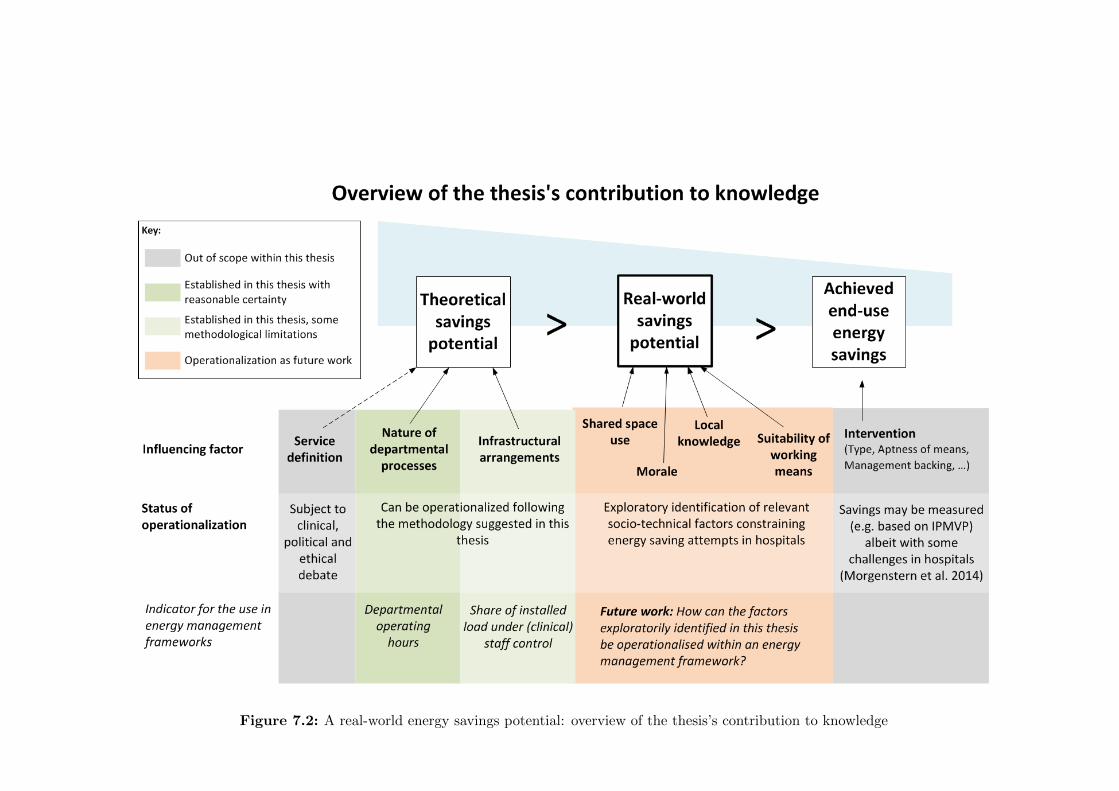
Figure 7.2: A real-world energy savings potential: overview of the thesis’s contribution to knowledge
7 Discussion: End-use energy savings in real-world settings
It is however increasingly recognised that even for primarily technological solu-
tions, their implementation is crucial and people and their actions have an important
role therein (e.g. Lowe et al., 2007). Assessing real-world energy savings potentials
rather than theoretical potentials hence emphasizes the need to involve people as act-
ive participants in all transition processes in order to close this gap. For technical
potentials, this will include focusing on how technologies work in practice rather
than in tests and laboratory situations. For behavioural and social potentials, more
attention needs to be on taking an end-user perspective in order to understand the
complexity of reasons for the status quo and resulting consequences for change.
7.5 Summary of the discussion
This discussion chapter set out to evaluate the relevance of staff engagement and
simple behaviour change as tools for carbon mitigation strategy in different hospital
buildings and departments. A process is proposed by which buildings or building
parts can be identified in which energy savings may be achievable through simple
operational changes. The process combines an engineering analysis of local energy
demands with an investigation into contextual factors which may constrain (or en-
able) changes in organisational practices. Such mixed use of both quantitative and
qualitative as well as technical and social research methods enables an understand-
ing of opportunities for change which could hardly be achieved using one type of
methods alone.
It is further argued that in hospitals, which may be understood as one example of a
complex socio-technical work environment, it is paramount to take a user-perspective
when aiming to understand what constitutes a reasonably achievable change in the
ways things are done. In return, this also means that standards and requirements
are not beyond questioning. Instead, collaborative efforts between energy managers
and interested clinicians as well as health administrators could help to demystify
clinical processes and achieve a sound understanding of opportunities to reduce the
energy use of the health service. There may also be an important role for equipment
manufacturers and vendors to innovate towards new generation of specialist medical
equipment with lower electricity use.
202

7 Discussion: End-use energy savings in real-world settings
Methodologically, this same realisation may find reflection in the definition of sav-
ings potentials as tools to support strategic planning and decision making. When
the engineering concept of a savings potential is applied to any aspect of change
involving people, there will necessarily be a difference between the top-down per-
spectives of the intervention designers/implementers and the perspectives of those
involved in bringing about the proposed changes. Aside from a theoretical savings
potential, the concept of a real-world savings potential is hence proposed which
takes an in-situ perspective and recognises the constraints applicable in real-world
socio-technical systems. Assessing real-world energy savings potentials rather than
theoretical potentials emphasizes the need to involve people as active participants
in all transition processes in order to close this gap.
203

8 Conclusion and implications
The conclusion chapter briefly summarizes the key findings in relation to the research
question. It further discusses the implications of the thesis findings for different
stakeholders, taking into account the limitations of study design and methodology.
Needs for future work, both academic and in practice, are highlighted.
8.1 Key findings in relation to the research question . . . . . . . . . . . 206
8.2 Limitations of the study . . . . . . . . . . . . . . . . . . . . . . . . . 209
8.2.1 Delimitations of the study . . . . . . . . . . . . . . . . . . . . 209
8.2.2 Research design . . . . . . . . . . . . . . . . . . . . . . . . . . 212
8.2.3 Data collection . . . . . . . . . . . . . . . . . . . . . . . . . . 213
8.2.4 Data analysis . . . . . . . . . . . . . . . . . . . . . . . . . . . 215
8.3 Implications of this thesis for different stakeholders . . . . . . . . . . 215
8.3.1 Practitioners . . . . . . . . . . . . . . . . . . . . . . . . . . . 216
8.3.1.1 Energy managers and facilities professionals . . . . 216
8.3.1.2 Architects and Designers . . . . . . . . . . . . . . . 217
8.3.1.3 NHS Management . . . . . . . . . . . . . . . . . . . 217
8.3.1.4 Clinicians . . . . . . . . . . . . . . . . . . . . . . . . 218
8.3.2 Research communities . . . . . . . . . . . . . . . . . . . . . . 219
8.3.3 Department of Health . . . . . . . . . . . . . . . . . . . . . . 220
8.4 Future work . . . . . . . . . . . . . . . . . . . . . . . . . . . . . . . . 221
8.4.1 Complex buildings . . . . . . . . . . . . . . . . . . . . . . . . 222
8.4.2 Quantifying diverse influences on building performance . . . . 222
8.4.3 Social and power dynamics within work places . . . . . . . . 223
8.5 Outputs associated with this research . . . . . . . . . . . . . . . . . 223

8 Conclusion and implications
8.1 Key findings in relation to the research question
This multiple case mixed-method study exemplifies an unusual research approach
which may contribute to an increased understanding of the interplay between build-
ing energy use, service delivery and occupant needs in non-domestic buildings. Im-
mediate value also stems from its contribution to the evidence base on hospital
electricity use at a sub-building level and its procedural proposal for the strategic
development of carbon mitigation interventions taking account of both technical as
well as organisational and social characteristics of distinct units (spaces, depart-
ments) within the wider context of an organisation. The following sections will
briefly lay out how the respective study objectives presented in section 1.2 were
addressed.
i) Establish the theoretical maximum electricity savings potential from
simple changes in the way different hospital departments are being used
by occupants, principally clinical staff. The influence of clinical staff on hos-
pital electricity use was found to vary between departments, while hospital specific
energy behaviours were limited to operating theatres as specialist areas which may
require the manual switch-off of specialist ventilation systems and anaesthetic gas
scavenging pumps. In other department types, clinical staff mainly impacted on
departmental electricity use through reducing the after-hour use of lighting, equip-
ment and space conditioning systems, similar to actions which have been described
for other building types. Additional pathways of influence included the review of
protocols to achieve a better match between the provision of building services and
actual clinical needs. As opposed to somehow rigid technological helpers such as
automation and sensors, protocols fit the dynamic context of hospitals in less defined
situations which may require some improvisation.
The theoretical electricity savings potentials from simple operational changes
were relatively small across the 11 investigated hospital departments. They ranged
between 2 and 25% of local electricity use with a median value of 12%, which cor-
roborated previous evidence from hospitals and suggested the savings potentials in
hospitals are lower than in other non-domestic building types. It should further be
noted that the concept of a theoretical savings potential is limited as it does not
account for organisational, social or individual constraints on clinical operations and
staff energy behaviours.
206
8 Conclusion and implications
ii) Unpick the governing constraints on energy demand reduction in the
complex socio-technical systems that hospital departments constitute.
The study highlighted a lack of joined-up knowledge on the optimal use of energy
services, especially in complex and energy intensive department types such as labor-
atories and operating theatres. Neither local clinical staff nor facilities or energy
personnel seemed to have full insight into departmental operations, which tended to
be defined through both local and central processes and systems. There was further
uncertainty for important pieces of medical equipment as to whether or not they
could be switched-off or into stand-by, a question that could potentially be clarified
through closer collaboration with equipment technicians and vendors. Challenges
for efficient energy use in shared spaces could further arise from uncertainties as
to whether spaces and equipment may still be needed by other building users after
hours. At the same time, saving energy was found to hold little meaning for most
clinical staff in the face of many competing priorities and a lack of leadership on
sustainability issues. A general lack of leadership, typically a consequence of under-
staffing or staffing changes, could further impair employee morale and reduce initiat-
ive where applicable. Last but not least, significant challenges to satisfactory as well
as resource efficient hospital operations arose from insufficient working means, in
particular under-performing or malfunctioning heating and cooling systems in older
hospitals as well as old IT infrastructure.
iii) Suggest a process to evaluate the relevance of behaviour and other
simple operational changes as tools for carbon mitigation in hospitals.
Given its small scale, the study does not attempt to provide a blanket recommenda-
tion for the use (or not) of behaviour change initiatives to achieve energy savings in
different hospital departments and buildings. Rather, it highlights the importance
of a robust understanding of contextual variables and operational constraints in de-
vising tailored organisational carbon management strategies.
207
8 Conclusion and implications
It is proposed that a three-tiered process may be appropriate in identifying parts
of a building or estate where simple operational changes could be a viable tool for
carbon mitigation: it is recommended to, firstly, undertake an engineering analysis
of the energy end-uses in the spaces in question, identifying significant loads at a
local level. Floor area weighted operating hours and shares of installed loads un-
der (clinical) staff control may then be helpful metrics to approximate the extent to
which these loads are influenced by the actions of occupants. Finally, socio-technical
constraints on departmental workings should be analysed taking into account at least
aspects around the shared use of spaces between teams, the available local knowledge
on the control of building services and equipment, the morale within the organisa-
tion as well as the suitability of the working means.
Generally, the need to move away from top-down imposed models of change is
recognised, instead taking a user-perspective when aiming to understand what may
constitute a reasonably achievable transformation in the ways things are done. This
does also mean that standards and requirements are not beyond questioning, even
in sensitive environments such as hospitals. Instead, collaborative efforts between
energy managers and interested clinicians as well as health administrators and equip-
ment technicians could help to demystify clinical processes and achieve a sound un-
derstanding of opportunities to reduce the energy use of the health service.
iv) Contribute to the concept of a socio-technical energy conservation po-
tential while discussing scope and limitations of socio-technical methods
for research in the built environment. The concept of a real-world energy
savings potential is proposed as decision support tool, representing a metric which
takes an in-situ perspective and recognises the constraints applicable in real-world
socio-technical systems. Assessing real-world energy savings potentials rather than
theoretical potentials emphasizes the need to involve people as active participants in
all transition processes in order to obtain meaningful ex-ante expectations of effect
sizes. For technical potentials, this will include focusing on how technologies work in
practice rather than in tests and laboratory situations. For behavioural and social
potentials, more attention needs to be on taking an end-user perspective in order to
understand the complexity of reasons for the status-quo and resulting consequences
for change.
208

8 Conclusion and implications
The study has highlighted the value of small scale case study investigations in ad-
dressing the complexity arising from the interaction between buildings, organisations
and their functions as well as their people. Quantitative conclusions for example on
departmental electricity intensities are limited by the study’s small scale (see limita-
tions section 8.2.2), while the study represents a substantial advance on the available
evidence in a context where primary data collection efforts are hindered by complex-
ity and access issues. The theoretical development of the assessment framework for
the viability of simple operational changes as well as the real-world energy savings
potential were crucially dependent on the use of both quantitative and qualitative,
of both technical and social research methods and further scope is expected for such
approaches in the built environment.
8.2 Limitations of the study
The present study has a number of contextual and methodological limitations high-
lighting the need for further research on reducing hospital electricity use. Table 8.2
provides an overview of the major study limitations and how they were dealt with.
They are further briefly outlined below for each aspect of the study. Despite these
limitations, this study offers some valuable insights into an area where comparatively
little research was done so far and has significantly advanced the available evidence.
8.2.1 Delimitations of the study
The scope of the study is necessarily limited. Firstly, it focuses exclusively on elec-
tricity as major cost to hospitals while energy use is often associated with both
electricity and heat or cold use: internal gains from laboratory equipment decis-
ively increase cooling loads, and electric fan heaters (‘convective warmers’) are used
to maintain patient body temperatures during surgery. Further research is hence
needed to clarify how for example central changes in room temperatures would im-
pact on warmer use in theatres as well as on the use of desk fans in other departments.
Secondly, the study does not include electricity use for cooling or central vent-
ilation systems, pumping and medical gas services, which as central services are
only with difficulty attributable to separate spaces within a building. It is believed
that this challenge contributes hugely to the performance gap in non-domestic build-
ings, with design simulations frequently misrepresenting the energy use of centralised
plant feeding a multitude of different activity spaces. Further research clarifying the
energy use for varying levels of service delivery across complex buildings is therefore
recommended.
209

Table 8.2: Impact of and mitigation strategies for major study limitations
Aspect of study Definition of limitation Impact on findings Mitigation
Delimitations Focus on local electricity use Carbon emissions from fossil fuels not addressed Review of the literature on hospital energy use
Interactions between electric loads and cooling loads
not investigatedRecommendation for future research provided
Focus on clinical staff
Influence of other staff groups overlooked, in
particular cleaning and security staff who work
after-hours
Future research recommended (in hospitals, but also
the wider non-domestic context)
Research design Small, UK based sample Quantitative results are indicative onlyCollaboration with others working on hospital energy
use (see Morgenstern et al., 2016a)
Future research recommended for benchmark
development
Defining departmental functions and
boundariesChallenge for inter-hospital comparisons Activity based approach
Analysis of spatial arrangements because hospital
spaces are coherently designed to be supportive to
the logistics of health care processes
Current levels of energy management
and staff engagement assumed to be
comparable across all departments
and typical for the stock
Savings potentials may be underestimated in the
wider population because participating trusts might
be more engaged with sustainability issues already
(self-selection bias)
Multiple case design: Selection of trusts and case
study hospitals with different characteristics
Qualitative findings used to contextualise levels of
engagement.
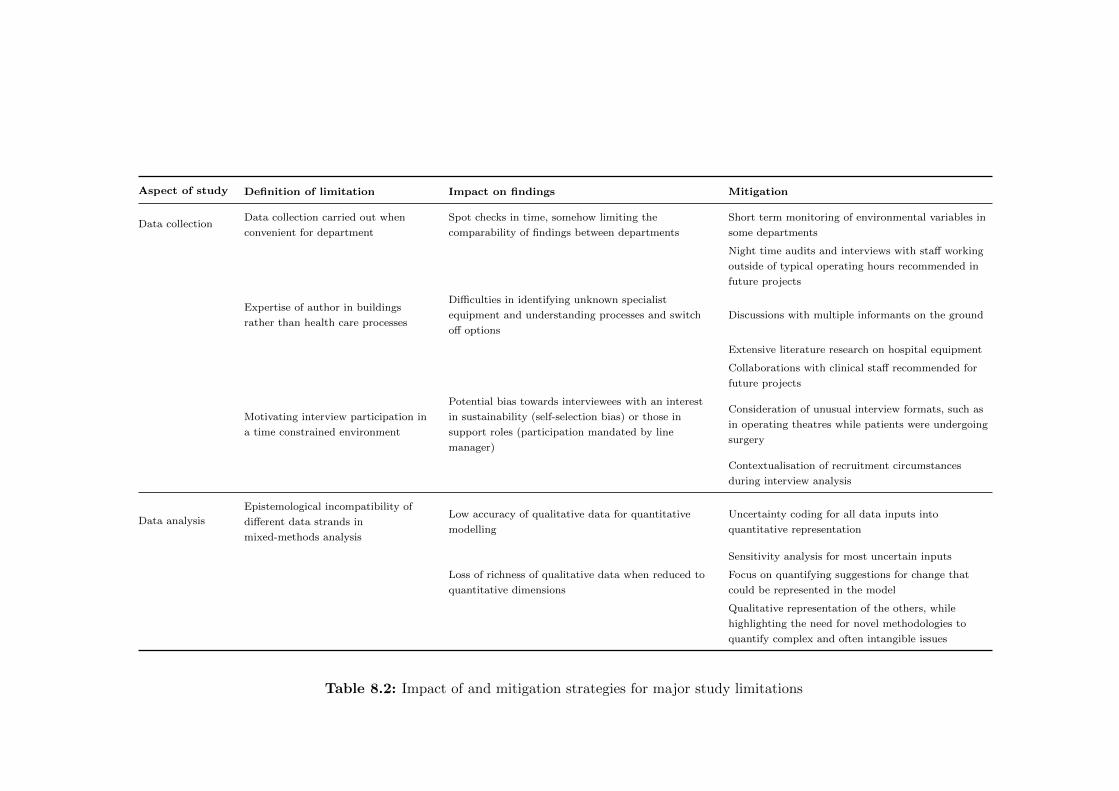
Aspect of study Definition of limitation Impact on findings Mitigation
Data collectionData collection carried out when
convenient for department
Spot checks in time, somehow limiting the
comparability of findings between departments
Short term monitoring of environmental variables in
some departments
Night time audits and interviews with staff working
outside of typical operating hours recommended in
future projects
Expertise of author in buildings
rather than health care processes
Difficulties in identifying unknown specialist
equipment and understanding processes and switch
off options
Discussions with multiple informants on the ground
Extensive literature research on hospital equipment
Collaborations with clinical staff recommended for
future projects
Motivating interview participation in
a time constrained environment
Potential bias towards interviewees with an interest
in sustainability (self-selection bias) or those in
support roles (participation mandated by line
manager)
Consideration of unusual interview formats, such as
in operating theatres while patients were undergoing
surgery
Contextualisation of recruitment circumstances
during interview analysis
Data analysis
Epistemological incompatibility of
different data strands in
mixed-methods analysis
Low accuracy of qualitative data for quantitative
modelling
Uncertainty coding for all data inputs into
quantitative representation
Sensitivity analysis for most uncertain inputs
Loss of richness of qualitative data when reduced to
quantitative dimensions
Focus on quantifying suggestions for change that
could be represented in the model
Qualitative representation of the others, while
highlighting the need for novel methodologies to
quantify complex and often intangible issues
Table 8.2: Impact of and mitigation strategies for major study limitations
8 Conclusion and implications
Thirdly, it is focused on clinical staff as opposed to other occupants of hospital
buildings such as domestic staff in charge of cleaning and maintenance or security
staff. While in departments occupied around the clock, clinical staff contributing
to this study were able to provide sound insight into the local use of the hospital
building, this proved challenging in the 12-hour areas. There, clinical staff would
commonly be succeeded by cleaners or others during after-hours; including the ac-
tions and views of this occupant group would therefore be crucial in order to obtain
a comprehensive picture of local hospital electricity use. It will seem that this is
a worthy area of further research, while limited evidence appears to currently be
available.
8.2.2 Research design
This was a small, UK based study with very limited sample sizes for hospital build-
ings and departments of each type. Especially quantitative results indicating mean
departmental consumption intensities may hence be understood as indicative only.
The three case study hospitals represented only a small selection of ages, built forms
and infrastructural arrangements given the large variety between hospitals within
the NHS.
Further issues complicating departmental comparison arose from structural dif-
ferences between departments. While core functions might be clearly defined for
each department type, additional service and infrastructural arrangements may vary
widely. In addition, the electrical layout determining which circuits and areas are
served by set distribution boards and can therefore be monitored will often not cor-
respond to the spaces constituting a clinical function or department. Especially in
older buildings, spaces may have undergone various changes of use resulting in distri-
bution boards with undocumented service provision or serving several departments.
212

8 Conclusion and implications
Similarly, differences in the current level of energy management as well as in
current levels of staff engagement with energy issues across different hospitals and
departments were disregarded in the technical analysis of savings potentials. The
subsequent qualitative analysis did, however, partly address this limitation through
an extensive analysis of contextual factors. Other limitations in the research design
were met by the replication of factors thought influential across the multiple case
study design (infrastructural and process elements). A protocol explicitly outlining
fieldwork procedures was put in place to ensure reliability and discussions with
experts from various disciplines were sought to ensure methodological soundness in
the face of the mixed use of approaches in this study.
8.2.3 Data collection
Research, especially in the real-world context, is an iterative process (Robson, 2011).
The data collection methods employed in this study hence evolved over time, res-
ulting in differences in available evidence across departments. The fieldwork for this
PhD thesis was undertaken between January 2013 and June 2015, providing a snap-
shot of activity and energy use for each department. Meanwhile, the data collection
spanned summer and winter periods, with consequences for energy use especially
from local heating and cooling. Additionally, both energy audits and interviews
were arranged when convenient for the respective department in an attempt to min-
imize disruption and increase research participation. Consequently, data collection
took place at different times during weekdays or weekends, mornings or afternoons,
somehow restricting the replicability of audit results. The opportunistic auditing
further resulted especially limiting for the understanding of after-hour energy usage
which in the future should be assessed through night time audits (Morgenstern et al.,
2014) and interviews with support staff frequenting hospital areas outside opening
hours.
As to challenges for electricity use measurement practicalities, the use of
different equipment with varying accuracies influenced result comparability. More
fundamentally, however, there was a systematic error from measuring currents only
instead of all power characteristics while the use of comprehensive energy analys-
ers was not possible due to funding constraints. Similarly, it was not possible to
monitor departments for a full year to fully understand the implications of seasonal
variations in weather and clinical activity.
213

8 Conclusion and implications
The reliability of the lighting and appliance audits was limited by their char-
acter as spot-checks in time, while repeated audits would also contribute to under-
standing changes within environments as dynamic as hospitals. There were further
some difficulties in identifying processes and equipment items given that the expert-
ise of this author was in buildings rather than in health-care processes. For future
projects in health care, it is recommended to form interdisciplinary teams includ-
ing both interested clinicians and technical personnel to fully embrace the variety
of available options for reducing hospital electricity use during operation. Such a
course of action would further allow for expanding the scope of initiatives to include
demand flexibility with view to reducing peak power, an increasingly important con-
cern for grid stability given high renewable penetration.
A major challenge for the interviews was for interviewees to make time for par-
ticipation. Them speaking to the researcher often resulted in an absence which had
to be covered for by other members of their team. On three occasions, staff had to
be interviewed in the presence of others because no separate facilities were available
to carry out the interview in private. Staff were explicitly asked whether they felt
comfortable carrying out the interview under these circumstances or whether they
preferred to rearrange which they did not wish to do. It is appreciated that this may
not be ideal neither from an ethical nor from an analytical perspective but could -
given the constraints on NHS staff and facilities - not be avoided. Such practical
challenges also biased the sampling for interviewees, potentially favouring those in-
terested in sustainability (self-selection bias) or those in support roles asked by their
line managers to participate. It can further be expected that interviewees were to
a certain extent affected by social desirability bias although it was aimed to avoid
framing the research as a mere energy conservation project.
214

8 Conclusion and implications
8.2.4 Data analysis
Challenges during the data analysis stage resulted primarily from the integration
of the many different types of data, an issue common in case study research (Yin,
2003). The mixed-method approach yielding both quantitative as well as qualit-
ative data strands based on different epistemological assumptions added additional
complications. ‘Spatio-temporal issues’ (Love and Cooper, 2015, p.987) arose from
utilizing interview data on durations of space and equipment use within the quant-
itative context of the bottom-up electricity models following the concurrent mixed
analysis of both data sets. Using quantitized qualitative data inputs (Tashakkori
and Teddlie, 1998) was here the result of practical challenges in collecting actual
quantitative data, therefore somewhat limiting model validity while nevertheless al-
lowing for some process understanding.
Conversely, the qualitative data was rich in ideas occupants expressed for potential
changes at their workplace (which may or may not contribute to energy savings).
In order to estimate potential energy savings from them, they had to be broken
down to the two dimensions of average power consumptions and durations of use.
While this approach worked reasonably well for some ideas, others could only poorly
be represented in such terms. It was nevertheless felt that even providing a rough
estimate of potential impacts from different operational strategies would help the
discussion on carbon mitigation in the hospital context, similarly as suggested by
Gatersleben et al. (2002) in the consumer context.
8.3 Implications of this thesis for different stakeholders
Despite the limitations outlined above, this study represents a significant advance
on the available evidence in a complex and ‘hard to research’ environment. It has
shed light on a number of avenues worthwhile exploring to holistically address the
energy use of hospitals and has contributed to an increased understanding of the
interplay between building energy use, service delivery and occupant needs. Some
implications of the research findings for the different stakeholder groups presented
in section 1.2.1 are outlined subsequently.
215

8 Conclusion and implications
8.3.1 Practitioners
8.3.1.1 Energy managers and facilities professionals
• This study stresses the need to understand differing characteristics of processes
and occupation as well as contextual variables in heterogeneous mixed-use
buildings in order to develop effective strategies to reduce the end-use of en-
ergy. Previous guidance documents on energy management have also emphas-
ized this need to break buildings down, for example into areas with different
uses, operating hours and tenancy arrangements (CIBSE, 2012). Such detailed
understanding will allow for targeted energy management, in particular with
respect to HVAC set points and timings.
• Processes in hospitals, but also other building types, were sometimes ‘black-
boxed’ and treated as beyond questioning in attempts to reduce building energy
use. Such approaches overlook the connections between function and form of
a building as well as between different energy services, most prominently the
influence of electrical loads on cooling demands. Albeit time consuming and
potentially difficult, it seems that opening the black boxes of clinical processes
in different hospital departments can contribute to identifying end-use energy
demand reduction strategies which go beyond simple operational changes. Sec-
tion 7.3.3 proposes a number of strategies which may be helpful in the process,
out of which strategic collaborations between facilities personnel and interested
clinicians seems of most importance in hospitals.
• If staff engagement is considered as a carbon mitigation strategy in a hospital
(be it due to a lack of funding or time for other measures), a three-tiered pro-
cess may be appropriate to identify parts of a building or estate where simple
operational changes could be a viable tool. It is recommended to undertake
an engineering analysis of the energy end-uses in the buildings and spaces in
question, identifying significant loads at a local level and the extent to which
they are influenced by the actions of occupants. Floor area weighted operating
hours and shares of installed loads under clinical staff control may be helpful
metrics to allow for a first order assessment of the latter. In addition, socio-
technical constraints on departmental workings should be analysed aiming to
understand what may constitute a reasonably achievable transformation in the
ways things are done from an occupant perspective.
216
8 Conclusion and implications
8.3.1.2 Architects and Designers
• The research has presented a wealth of details on hospital operations and
clinical processes understood from an energy perspective. The evidence ex-
emplifies the links between spatial and logistical arrangements in relation to
patient flows and may assist architects and designers interested in low carbon
hospital design in exploring how different configurations can enable low carbon
health care. A better understanding of clinical processes (and expectations for
their future development) will be required to address the difficult issue of siz-
ing hospital buildings, while it seems that a happy middle ground is yet to be
found between spaciousness, adaptability and resource efficiency.
• This case study investigation has further highlighted that overheating can be
a serious concern in many hospitals, both in summer and in winter. In sum-
mer, this seemed to be largely due to reactive rather than proactive cooling
strategies which had evolved in a piecemeal fashion in response to growing
heat loads from equipment and overcrowding. In winter, malfunctioning radi-
ator systems and a lack of localised temperature control could be problematic,
albeit in fewer cases. This study therefore follows previous studies (e.g Lomas
et al., 2012; Short et al., 2012) in pointing out the urgent need to incorpor-
ate comprehensive and forward thinking ventilation and cooling strategies into
new designs and retrofits to ensure comfort levels can be maintained without
extensive work-arounds which often result sub-optimal from an energy per-
spective.
8.3.1.3 NHS Management
• The resource use of hospitals is defined by a large number of stakeholders. An
essential problem for holistic energy demand reduction consequently seemed
to arise from the fragmentation of the task. Opportunities, in particular for
structural re-arrangements, could easily be overlooked if they fell between the
spheres of responsibility of different stakeholder groups. The role of the en-
ergy manager, potentially once created to fill this very gap, was in many trusts
seen bogged down with compliance and reporting responsibilities, leaving little
capacity for the creation of context dependent and innovative carbon manage-
ment strategies. To raise the profile of energy managers within NHS Trusts and
make more resources available for their work, it could potentially be effective
to emphasize the benefits of their activities for comfort and indoor air quality,
maybe even renaming them as ‘indoor environment specialists’ or similar.
217
8 Conclusion and implications
• Time pressure was a central concern for all NHS staff involved in this study.
At the same time, a lack of leadership on sustainability issues was widespread.
Given that one of the key recommendations of this study is for an increased
collaboration between facilities, clinical and administrative staff - which inev-
itably will require further resources - it seems important that senior manage-
ment within NHS Trusts and beyond develop a clear stand on the importance
of sustainability for health, the aspect at the very core of the organisation’s
existence. Energy policy may be able to support such endeavours by support-
ing sector carbon targets as well as action-orientated benchmarks, while NHS
funding remains a crucial matter of a wider political debate.
8.3.1.4 Clinicians
• Clinical staff were in some cases found to be unsure about the operating char-
acteristics of specialist medical equipment, making it hard for them to decide
whether or not the equipment could be switched-off or into stand-by. Equip-
ment technicians could be an important port of call here to clarify options for
the switch-off of medical equipment.
• A good working relationship between clinical staff and the hospital’s facilit-
ies management (FM) team was further recognised as mutually beneficial in
this study. The FM teams of large hospitals are in charge of a huge num-
ber of different spaces and areas, with differing operating hours, temperature
requirements and special needs. As technical experts, their knowledge on clin-
ical processes is necessarily limited. A close working relationship between the
clinical management of each department and the FM team may therefore help
to ensure that the departmental needs and requirements are met, while avoid-
ing a somehow wasteful blanket provision of services ‘just in case’. Clarifying
actual operating hours may for example contribute to maximising the energy
savings from a customized IT power down or enable heating and cooling energy
savings by allowing for night-time temperature set-backs.
218
8 Conclusion and implications
• More fundamentally, an increased clinician input into the detailed specifica-
tion of building services required to ensure optimal patient outcomes could be
beneficial. This may range from the required colour rendering properties of
lighting installations to help diagnosis over the need for ventilation to reduce
infection rates to future scenarios of health care provision and how hospital
building may best support these. Naturally, such collaborations take time, a
commodity traditionally sparse within health care organisations. Mutual be-
nefits at the local level as well as the input of professional organisation such
as medical associations and long-term planning more generally may be helpful
here.
8.3.2 Research communities
• This study highlights the value of small scale case study investigations in a
field that has traditionally been dominated by survey work and quantitative
methods. Especially when aiming to address the complexity arising from the
interaction between buildings, systems, organisations and their functions as
well as occupants the explorative and open-ended nature of case studies was
shown to have much value.
• It was further found that a healthy scepticism is appropriate in the analysis
and interpretation of automatic meter readings. It is paramount to know
what areas and services are located downstream of a meter in order to make
sense of the generated data, an issue previously also highlighted by Janda et al.
(2015). Especially in environments evolving adaptively and with little strategic
planning, such as hospitals, this can be difficult. Such findings highlight that
some caution may also be appropriate in the increasing use of smart meter data
in energy research, given the limited value of the data without an appropriate
contextualisation of what it represents.
• The pragmatic approach taken in this study has highlighted the potential con-
tributions of several different disciplines to the real-world problem of reducing
energy use in hospitals. Within the academic discourse, however, such ap-
preciation of each others contributions does not always seem to be found. It
will appear to this author that more value-neutral debates about the strength
and limitations of different approaches would be beneficial, respecting that
each can bring interesting aspects to a complex and multi-faceted problem but
none holds the holy grail.
219
8 Conclusion and implications
• The study further suggests that more attention should be paid to the link
between occupant comfort/well-being/productivity and building energy per-
formance. Energy use is not an end in itself but a means to an end, with
associated consequences for pathways to change. This also points towards the
rhetorical value of cost-effectiveness as central argument for explorations of
energy demand.
• Finally, primary data is and will remain important as input in and for the val-
idation of energy models, on which policy decisions are increasingly based. The
collection of primary data is however resource intensive and time consuming,
while these efforts do not always seem to be appropriately recognised. Research
communities and funders may have a role in ensuring that the necessary means
for primary data collection are made available. The further development of
open-source data repositories and intellectual property licenses also seems im-
portant in this context, so that data can be shared and the efforts going into
primary data collection can be credited as required.
8.3.3 Department of Health
• This study has exposed the variability between different hospital departments
and clinical processes from an estates perspective. Like for the resource-
efficient energy management of hospitals (section 8.3.1.1), an understanding
of the differing characteristics of processes and contextual variables is also
required from a policy perspective. Department of Health policies and recom-
mendations, for example on but not restricted to staff awareness campaigns,
do currently hardly differentiate between different spaces in hospitals. Going
forward it is recommended that a more granular and process focussed strategy
is adopted to make the most of efficiency opportunities within the estate as
recommended by the 2016 Carter review.
• The Department of Health further has a role in advancing the energy bench-
marking of hospital buildings. Findings in this study have suggested that the
specification of energy benchmarks per floor space may benefit the over-sizing
of new (health care) facilities. Additionally specifying energy usage on the
basis of service delivery may consequently be one way forward, despite ob-
vious complications with how service delivery should be specified. There is,
however, a wealth of thinking available which has gone into clinical accountab-
ility and the costing of treatments. The Department of Health may have a role
in providing a framework within which to bring facilities managers, clinicians
and health administrators together to improve the available metrics for the
energy performance benchmarking of hospitals.
220
8 Conclusion and implications
• Specifying energy use per treatment (as attempted for example by the NHS
Sustainable Development Unit through their Sustainable Care Pathways) will
also be crucial in exploring the carbon impact of future healthcare pathways.
A more continuous operation of imaging and laboratory facilities (as implied
by the conservative government under their seven-day NHS plan to extend the
weekend access to diagnostics) would for example increase the current metric of
energy use per floor area while energy use per treatment would likely decrease,
especially in laboratories due to their high base loads. The present study does
at the same time highlight the need for government to specify more clearly
what, above and beyond higher consultant cover on weekends, is meant by
a seven-day service as the space-use data (see Figure 4.13) clearly indicate
that services are already being provided around the clock in many hospital
departments.
• Further challenges for the energy benchmarking of complex buildings (includ-
ing hospitals) are associated with the definition of the standards against which
to compare the actual performance of a building. If statistical rather than sim-
ulated standards are to be used, this author proposes that composite energy
benchmarks taking into account differing energy intensities at a departmental
level may be beneficial in hospitals (Morgenstern et al., 2016a). Such an ap-
proach may increase the meaningfulness of energy benchmarks by tailoring
them to the service configuration of a respective hospital, accommodating the
large heterogeneity between buildings of this category.
• It finally seemed that not only the use, but also the purchasing of medical
equipment deserved more attention. EnCO2de (2015), Part B provides sug-
gestions on the inclusion of energy and environmental criteria in tender docu-
ments. More impact may however be achievable given the collaborative pur-
chasing power of the NHS from more stringent requirements while collabora-
tions with equipment manufacturers and vendors may help to drive innovation
towards new product generations with lower carbon impact.
8.4 Future work
The implications of this study for research communities (section 8.3.2) have already
highlighted the need for future work, in particular to advance socio-technical meth-
odologies and put them on equal grounds with other, more established approaches.
A range of other areas considered worthy of further investigation are listed below.
221

8 Conclusion and implications
8.4.1 Complex buildings
Energy research needs to extend its focus beyond dwellings to capture the carbon
emissions from non-domestic buildings. Within the non-domestic sector, a shift of
focus away from office and educational buildings is required to investigate the energy
use in industry, retail and health care buildings and address the significant process
loads in these building types. At the moment, there is much uncertainty about such
process loads while they are often arranged outside of the responsibilities of energy
managers. A better understanding and an integration of responsibilities may lead
to the identification of new pathways to holistically reduce energy use.
Further research is also recommended to clarify how the energy use of central
plant results from and is attributable to the delivery of energy services across com-
plex buildings, where different areas can have varying occupational characteristics
and differing service requirements. This challenge is increasingly addressed with
regards to the after-hour use of HVAC systems in multi-tenanted office buildings,
but little research is currently available for more complex mixed-use buildings. Field
studies applying heat and cold metering at a sub-building level as well as the meter-
ing of fan coil units may help to minimise the performance gap in non-domestic
buildings and provide input into energy simulations of centralised plant feeding a
multitude of different activity spaces.
It was further pointed out that all non-domestic buildings are occupied by multiple
groups of people. This study focused on clinical staff as core occupants of hospitals,
but it proved a major limitation to the project that other staff groups had not been
included in the analysis. Future research is therefore recommended to investigate
the influence of cleaners and other domestic staff on building energy use. Given
their likelihood to occupy buildings after-hours, their impact may be substantial
while they will be subject to their own particular set of constraints.
8.4.2 Quantifying diverse influences on building performance
This case study investigation developed a qualitative understanding of a wide range
of factors influencing the energy end-use in hospitals, including aspects of knowledge
and motivation in building occupants and spatial and technological constraints. The
impact of different factors on the energy savings potential of carbon management
strategies has however not been quantitatively assessed as part of this study. Fur-
ther research aiming to assess the relative importance of different factors against
each other in energy terms therefore seems one possible next step.
222

8 Conclusion and implications
In a similar vein, the development of novel methodologies to assess the level of
space and building services requirements (such as ventilation rates), which are ac-
tually needed to ensure health and safety in hospitals, is recommended. This may
also include a more fundamental assessment of how service is defined in hospitals
themselves and in the wider health care sector. Participatory and group modelling
exercises may be rewarding in this sensitive context to capture demands and con-
cerns of all involved stakeholders.
8.4.3 Social and power dynamics within work places
It was felt that the hierarchical environment prevalent in hospitals, which seemed
to subordinate all other professions to doctors, complicated it for non-clinical staff
including equipment technicians as well as energy managers to input in decision
making processes. Further research clarifying this notion is recommended and may
offer insights into barriers to collaboration across the NHS workforce, given that col-
laboration was concluded to be an important factor in reducing hospital emissions.
This study further produced an interesting anomaly: Much literature indicates
that more control over building services at the workplace reduces sick building syn-
drome and lets occupants be more comfortable (e.g. Bordass et al., 2007). In most
departments of this study, occupants had no control over the heating system. But
while teams would establish ‘running gags’ on temperatures being too high or too
low, they generally seemed to adapt to this situation reasonably well and the blame
was placed outside of the team. Other departments, in contrast, had some means
to control the temperature, and in those departments tension about temperature
issues and thermostat settings could arise within the team. It may consequently be
valuable to explore how HVAC control related to comfort in dynamic environments
where spaces are always shared and the team is an important asset to the work-flow.
8.5 Outputs associated with this research
This research was made possible by support from the EPSRC Centre for Doctoral
Training in Energy Demand, grant numbers EP/L01517X/1 and EP/H009612/1.
The following section lists the main outputs associated with the research. Outputs
marked with an asterisks (*) cover material included directly in this thesis, while
other outputs address associated topics.
223
8 Conclusion and implications
Journal papers
Morgenstern, P., Li, M., Raslan, R., Ruyssevelt, P., & Wright, A. (2016). Bench-
marking acute hospitals: Composite electricity targets based on departmental con-
sumption intensities?. Energy & Buildings. doi:10.1016/j.enbuild.2016.02.052
– This paper presents departmental electricity intensities measured by this PhD
project as well as by collaboration partners and discusses implications for the
energy benchmarking of complex buildings.
– The data set underlying the publication has been published as:
Morgenstern, P., Li, M., Raslan, R., Ruyssevelt, P., & Wright, A. (2016b).
Small power and lighting load time series for 27 departments across 8 UK
hospitals. Data in Brief. doi:10.1016/j.dib.2016.03.076
Morgenstern, P., Raslan, R., & Huebner, G. (2015). Applicability, potential and
limitations of staff-centred energy conservation initiatives in English hospitals. En-
ergy Efficiency. doi:10.1007/s12053-015-9346-2
– This paper reviews the literature on staff-centred energy conservation initiat-
ives in hospitals and presents a survey study among NHS energy managers
which was undertaken as scoping exercise for this PhD. The findings of the
survey study are not directly included in this PhD thesis, but rather used
to explore the context and define the research question. A brief summary of
highlights has been included in the literature review in section 2.2.1.2.
Peer reviewed conference papers
* Morgenstern, P., Raslan, R., & Ruyssevelt, P. (2015). Assessing savings potentials
from changes in energy behaviours of hospital staff: benefits and challenges of
energy audits. In: eceee2015 Summer Study on energy efficiency. Belambra Les
Criques, Toulon/Hyeres, France.
– This paper details the methodology of energy audits applied in this PhD study
and illustrates their use for the assessment of energy savings potentials from
simple operational changes.
* Morgenstern, P., Raslan, R., & Ruyssevelt, P. (2016). Reducing hospital electri-
city use: an end-use perspective. In: 9th International Conference on Improving
Energy Efficiency in Commercial Buildings and Smart Communities (IEECB&SC16).
Light+Building trade fair, Frankfurt, Germany.
– This paper presents the quantitative findings on end-use splits across different
hospital departments as described in section 5.3.3 of this thesis and discusses
implications, in particular for lighting energy use.
224

8 Conclusion and implications
Other international conference papers and posters
Morgenstern, P., Raslan, R. M., & Ruyssevelt, P. (2014). Measuring changes in
energy behaviours in complex non-domestic buildings. Paper. In: BEHAVE Energy
Conference 2014. Said Business School, Oxford University, UK.
– This paper reflects the experience of the author during a scoping study, in
which she assisted with the implementation and evaluation of a behaviour
change campaign in a UK acute hospital.
* Morgenstern, P., Raslan, R. M., & Lowe, R. (2013). Evaluating energy efficiency
behaviour change interventions in hospitals. Poster. In: 10th Biennial Confer-
ence on Environmental Psychology. Otto von Guericke Universitaet, Magdeburg,
Germany.
– This poster reviews the literature on methodologies and challenges associ-
ated with the evaluation of behaviour change interventions, as presented in
section 2.2.2.2 of the literature review.
Other publications
Morgenstern, P. (2016). Energy saving in health care: why, who, how?. In: Hospital
health care Europe 2016. European Hospitals and health care Federation. London,
UK.
– This is an overview article highlighting the need to save energy in hospitals in
a medical publication targetting health care professionals throughout Europe.
Key presentations
* Morgenstern, P. (2015). Understanding hospital electricity use: an end-use(r)
perspective. In: MSc Facility and Carbon Management, University College London,
London, UK.
Morgenstern, P. (2014). Practical challenges for energy audits in specialist build-
ings. In: CBxchange. London, UK.
Morgenstern, P. (2014). ’Helping patients’ and/or/vs. ’Helping the planet’: Pro-
environmental behaviours and professional identities. In: British Environmental
Psychology Symposium. Sheffield, UK.
Morgenstern, P. & Stancliffe, R. (2014). Grassroots action for a sustainable health
care system: the Sustainable Specialities network and the NUS Green Impact
scheme as case studies. In: Healthy Planet Conference. London, UK.
225

8 Conclusion and implications
* Morgenstern, P. (2013). How to measure the impact of energy efficiency behaviour
change interventions in hospitals? In: IHEEM Health Care Estates Conference.
Manchester, UK.
* Morgenstern, P. (2013). How to evaluate energy efficiency behaviour change
interventions in hospitals? In: YoungOR Conference. Exeter, UK.
226
Bibliography
Abrahamse, W. and Steg, L. (2013). Social influence approaches to encourage
resource conservation: A meta-analysis. Global Environmental Change,
23(6):1773 – 1785.
Abrahamse, W., Steg, L., Vlek, C., and Rothengatter, T. (2005). A review of
intervention studies aimed at household energy conservation. Journal of
Environmental Psychology, 25(3):273–291.
Acker, B., Duarte, C., and Van Den Wymelenberg, K. (2012). Office Plug Load
Profiles. Technical Report 20100312-01 Integrated Design Lab, University of
Idaho, Moscow, US.
Agami Reddy, T. (2011). Applied Data Analysis and Modeling for Energy
Engineers and Scientists. Springer, New York.
Aune, M., Berker, T., and Bye, R. (2008). The missing link which was already
there: Building operators and energy management in non-residential buildings.
Facilities, 27(1):44–55.
Azar, E. and Menassa, C. C. (2014). A comprehensive framework to quantify
energy savings potential from improved operations of commercial building
stocks. Energy Policy, 67:459–472.
Bacon, M. (2014). Occupancy analytics: a new basis for low-energy-low-carbon
hospital design and operation in the uk. Architectural Engineering and Design
Management, 10(1-2):146–163.
Bacon, M. (2015). How can acute space be better used? Health Estate Journal,
09:45–49.
Baird, G. (2010). Sustainable buildings in practice : what the users think.
Routledge, London.

8 Bibliography
Balaras, C. A., Dascalaki, E., and Gaglia, A. (2007). HVAC and indoor thermal
conditions in hospital operating rooms. Energy and Buildings, 39(4):454–470.
Banks, N., Redgrove, Z., Gunn, M., Mullen, J., Ryle, J., Fawcett, T., Ristic, L.,
and Bird, S. (2012). What are the factors influencing energy behaviours and
decision-making in the non-domestic sector? A rapid evidence assessment,
Centre for Sustainable Energy and Environmental Change Institute, University
of Oxford. [online] Available from: https://www.gov.uk/government/uploads/
system/uploads/attachment_data/file/65601/
6925-what-are-the-factors-influencing-energy-behaviours.pdf
Accessed: Mar 2016.
Barts Health NHS Trust (2013). Changing Energy Behaviours in the NHS:
Operation TLC. [online] Available from:
http://www.sduhealth.org.uk/news-events/news/214/
Barts-Health-NHS-Trust-saves-100000-with-a-bit-of-TLC, Accessed: Oct
2013.
Batty, W. J., Conway, M. A., Newborough, M., and Probert, S. D. (1988). Effects
of operative behaviours and management planning on energy consumptions in
kitchens. Applied Energy, 31(3):205–220.
Behar, C. (2015). A sociotechnical perspective on ventilation practices, design,
everyday life and change. Thesis (Ph.D), UCL Energy Institute, University of
London.
Beier, C. (2009). [in German] Analyse des Energieverbrauchs und exemplarische
Best-practice-Losungen fur relevante Verbrauchssektoren in Krankenhausern.
Report, Fraunhofer-Institut fur Umwelt-, Sicherheits- und Energietechnik
UMSICHT, Oberhausen.
Benke, G. (2012). [in German] Steigerung der Energieeffizienz in
Dienstleistungsgebauden. Krankenhaus Special, 12:50 – 52.
Benke, G., Leutgob, K., Varga, M., Kolpek, M., and Greisberger, H. (2009). [in
German] Das energieeffiziente Krankenhaus. Realistische Ansatzpunkte und
Massnahmenidentifikation. Report, Bundesministerium fur Verkehr, Innovation
und Technologie, Wien.
Bernstein, B. (1996). Pedagig, symbolic control and identity: theory, research,
critique. Taylor and Francis, London.
228

8 Bibliography
Black, D. R., Lanzisera, S. M., Lai, J., Brown, R. E., and Singer, B. C. (2013).
Evaluation of miscellaneous and electronic device energy use in hospitals. World
Review of Science, Technology and Sustainable Development, 10(1-3):113–128.
Blue, S., Shove, E., Carmona, C., and Kelly, M. P. (2014). Theories of practice and
public health: understanding (un)healthy practices. Critical Public Health, pages
1–15.
Bordass, B., Cohen, R., Spevack, R., Burman, E., Hong, S.-M., Ruyssevelt, P., and
Field, J. (2014). Tailored energy benchmarks for offices and schools, and their
wider potential. In CIBSE ASHRAE Technical Symposium, Dublin, Ireland.
Bordass, B., Leaman, A., and Ruyssevelt, P. (2001). Assessing building
performance in use 5: conclusions and implications. Building Research &
Information, 29(2):144–157. PhD Lit I.
Bordass, B., Leaman, A. J., and Bunn, R. (2007). Controls for End Users: A
Guide for Good Design and Implementation. Report, British Controls Industry
Association (BCIA), London.
Bradley, P., Fudge, S., and Leach, M. (2016). Motivating energy conservation in
organisations: smart metering and the emergence and diffusion of social norms.
Technology Analysis & Strategic Management, 28(4):435–461.
Brennan, N. and Mattick, K. (2013). A systematic review of educational
interventions to change behaviour of prescribers in hospital settings, with a
particular emphasis on new prescribers. British Journal of Clinical
Pharmacology, 75(2):359–372.
Bruce, G. (2008). Townsville Residential Energy Demand Program (TRED
Program). Identification and Assessment of Homeowner Behaviours Related to
Reducing Residential Energy Demand, Townsville City Council Integrated
Sustainability Services, Townsville.
Bryman, A. (2007). Business research methods. Oxford University Press, Oxford,
UK.
Bryman, A. (2012). Social research methods. Oxford University Press, Oxford, UK,
4th edition.
Building Research Energy Conservation Support Unit (BRECSU) (1992a). Energy
efficiency in hospitals by good housekeeping. Health Estate J, 48(8):4–6.
229
8 Bibliography
Building Research Energy Conservation Support Unit (BRECSU) (1992b). Good
Housekeeping in the NHS. A Guide for energy and estate managers. Good
Practice Guide.
Building Research Energy Conservation Support Unit (BRECSU) (1995). Energy
savings in NHS hospitals. Good Practise Case Study, 202:1 – 6.
Building Research Energy Conservation Support Unit (BRECSU) (1996). Energy
consumption in hospitals. Energy Consumption Guide, 72.
Burman, E., Hong, S.-M., Paterson, G., Kimpian, J., and Mumovic, D. (2014). A
comparative study of benchmarking approaches for non-domestic buildings: Part
2 - bottom-up approach. International Journal of Sustainable Built
Environment, 3(2):247–261.
Burpee, H., Loveland, J., Helmers, A., and Hatten, M. (2014). Targeting 100! a
roadmap for meeting the 2030 challenge in healthcare across the united states.
In 2014 ACEEE Summer Study on Energy Efficiency in Buildings. Asilomar
Conference Center, Pacific Grove, CA.
Cancer Research UK (2015). Chemotherapy. [online] Available from:
http://www.cancerresearchuk.org/about-cancer/cancers-in-general/
treatment/chemotherapy/. Accessed: Aug 2015.
CAR (2012). How much energy could be saved by making small changes to
everyday household behaviours? Report to the Department of Energy and
Climate Change, Cambridge Architectural Research (CAR). [online] Available
from: https://www.gov.uk/government/uploads/system/uploads/
attachment_data/file/128720/
6923-how-much-energy-could-be-saved-by-making-small-cha.pdf
Accessed Aug 2014.
Carbon Trust (2008). Introducing NHS Carbon Management. Technical report,
Carbon Trust, London, UK.
Carbon Trust (2010). Hospitals. Healthy budgets through energy efficiency.
Technical report, Carbon Trust, London, UK.
Carbon Trust (2011). Heating, ventilation and air conditioning. Saving energy
without compromising comfort. Carbon Trust Guides. Volume 46, London, UK.
Carrico, A. R. and Riemer, M. (2011). Motivating energy conservation in the
workplace: An evaluation of the use of group-level feedback and peer education.
Journal of Environmental Psychology, 31(1):1–13.
230

8 Bibliography
Centre for Evidence-based Purchasing (2009). Energy efficiency assessment for
electrical medical devices. Protocol CEP08037, NHS Purchasing and Supply
Agency, London, UK.
Centre for the Analysis and Dissemination of Demonstrated Energy Technologies
(CADDET) (1997). Saving energy with Energy Efficiency in Hospitals. Report,
International Energy Agency, Paris, France.
Chatterton, T. (2011). An Introduction to Thinking About ’Energy Behaviour’: a
multi-model approach. Report, Department of Energy and Climate Change
(DECC), London, UK.
Chen, H.-M., Lin, C.-W., Hsieh, S.-H., Chao, H.-F., Chen, C.-S., Shiu, R.-S., Ye,
S.-R., and Deng, Y.-C. (2012). Persuasive feedback model for inducing energy
conservation behaviors of building users based on interaction with a virtual
object. Energy and Buildings, 45:106–115.
Chiu, L. F., Lowe, R., Raslan, R., Altamirano-Medina, H., and Wingfield, J.
(2014). A socio-technical approach to post-occupancy evaluation: interactive
adaptability in domestic retrofit. Building Research & Information, pages 1–17.
Christiansen, N., Kaltschmitt, M., Dzukowski, F., and Isensee, F. (2015).
Electricity consumption of medical plug loads in hospital laboratories:
Identification, evaluation, prediction and verification. Energy and Buildings,
107:392–406.
Christina, S., Waterson, P., Dainty, A., and Daniels, K. (2015). A socio-technical
approach to improving retail energy efficiency behaviours. Appl Ergon,
47:324–35.
CIBSE (2006). TM 22: Energy assessment and reporting methodology. Chartered
Institute of Building Services Engineers (CIBSE), London, UK.
CIBSE (2008). TM 46: Energy benchmarks. Chartered Institute of Building
Services Engineers (CIBSE), London, UK.
CIBSE (2012). Energy efficiency in buildings. CIBSE Guide F. Chartered Institute
of Building Service Engineers (CIBSE), London, UK, 3rd edition.
CIBSE (2013). TM 54: Evaluating Operational Energy Performance of Buildings
at the Design Stage. Chartered Institute of Building Services Engineers
(CIBSE), London, UK.
CIBSE (2015). Environmental design. CIBSE Guide A. Chartered Institution of
Building Services Engineers, London, UK, eight edition.
231

8 Bibliography
Cohn, S. (2014). From health behaviours to health practices: an introduction.
Sociol Health Illn, 36(2):157–62.
Coleman, M. J., Irvine, K. N., Lemon, M., and Shao, L. (2013). Promoting
behaviour change through personalized energy feedback in offices. Building
Research & Information, 41(6):637–651.
Commission for Healthcare Audit and Inspection (2007). Getting results. Pathology
services in acute and specialist trusts. Technical report, London: Commission for
Healthcare Audit and Inspection. [online] Available from:
http://www.bipsolutions.com/docstore/pdf/16479.pdf Accessed: Mar
2014.
Connor, A., Lillywhite, R., and Cooke, M. W. (2011). The carbon footprints of
home and in-center maintenance hemodialysis in the United Kingdom. Hemodial
Int, 15(1):39–51.
Cowan, K. (2011). Energy Champion Guidebook. Report, University Health
Network (UHN), Toronto, Canada.
Cowan, K. (2013). Turn off the lights or 1000 little steps. In Proceedings of the
2013 Behavior Energy and Climate Conference, Sacramento, California.
Cox, A., Higgins, T., Gloster, R., Foley, B., and Darnton, A. (2012). The Impact of
Workplace Initiatives on Low Carbon Behaviours. Technical report, Scottish
Government Social Research, Crown: London.
Creswell, J. W. (2009). Research design: Qualitative, Quantitative and Mixed
Method Approaches. SAGE, Thousand Oaks, California, 3rd edition.
Dantsiou, D. and Sunikka-Blank, M. (2015). Why does energy use feedback not
work in workplaces? Insights from social practice theory. In ECEEE 2015
Summer study on energy efficiency. Belambra Les Criques, Toulon/Hyeres,
France.
Darby, S. (2006). The effectiveness of feedback on energy consumption. A review
for Defra of the literature on metering, billing and direct displays,
Environmental Change Institute, University of Oxford, Oxford, UK.
Department for Environment, Food and Rural Affairs (DEFRA) (2008). A
Framework for pro-environmental behaviours. [online] Available from:
https://www.gov.uk/government/uploads/system/uploads/attachment_
data/file/69277/pb13574-behaviours-report-080110.pdf. Accessed: Mar
2016.
232

8 Bibliography
Department of Energy and Climate Change (DECC) (2014). 2013 UK Greenhouse
Gas Emissions, Provisional Figures and 2012 UK Greenhouse Gas Emissions,
Final Figures by Fuel Type and End-User. [online] Available from:
https://www.gov.uk/government/uploads/system/uploads/attachment_
data/file/295968/20140327_2013_UK_Greenhouse_Gas_Emissions_
Provisional_Figures.pdf. Accessed: Oct 2015.
Department of Health (2013). Health Building Note 04-01: Adult in-patient
facilities. London: Crown.
Department of Health (2013). Health Building Note 07-02: Main renal unit.
London: Crown.
Department of Health (2013a). Health Technical Memorandum 03-01: Heating and
ventilation systems. Specialised ventilation for healthcare premises. London: The
Stationay Office.
Department of Health (2013b). Health Technical Memorandum 07-07: Sustainable
health and social care buildings: Planning, design, construction and
refurbishment. London: Crown.
Department of Health Estates and Facilities Division (2007). HBN 10-02 Surgery:
Day Surgery Facilities. London: The Stationary Office (TSO).
Dietz, T., Gardner, G. T., Gilligan, J., Stern, P. C., and Vandenbergh, M. P.
(2009). Household actions can provide a behavioral wedge to rapidly reduce us
carbon emissions. Proc Natl Acad Sci U S A, 106(44):18452–6.
Diez, K. and Lennerts, K. (2010). [in German] Benchmarking im Krankenhaus -
Schwerpunkte Energie und Instandhaltung. In Facility Management Messe und
Kongress, Frankfurt (Main), Germany.
Dodd, D. J. and Padley, P. J. (1992). Energy-efficient use of fume cupboards.
Applied Energy, 41(3):167–176.
Eisenhower, B., O’Neill, Z., Fonoberov, V. A., and Mezi, I. (2012). Uncertainty
and sensitivity decomposition of building energy models. Journal of Building
Performance Simulation, 5(3):171–184.
Elmualim, A., Darby, H., Clements-Croome, D., Yearly, T., and Davies, G. (2013).
Intelligent and sustainable buildings: Influence of occupants’ behaviour on
energy and carbon emission reduction. In 10th International Conference on
Healthy Buildings 2012, volume 1, pages 227–232, Brisbane, Australia.
233
8 Bibliography
EnCO2de (2006). EnCO2de- Making energy work in healthcare: environment and
sustainability. Department of Health and Carbon Trust and Building Research
Establishment and NHS Scotland Property and Environment Forum and Welsh
Health Estates and Northern Ireland Health Estates, London, UK.
English, T. R. (2014). Engineers’ Perspectives on Hospital Ventilation. [online]
Available from: http://hpac.com/iaq-ventilation/
engineers-perspectives-hospital-ventilation?page=1. Accessed: Oct
2015.
EPA (2012). Energy Use Benchmarking. Data trends, United States
Environmental Protection Agency (EPA). [online] Available from:
https://www.energystar.gov/sites/default/files/buildings/tools/
DataTrends_Energy_20121002.pdf Accessed: Mar 2014.
EPA (2014a). ENERGY STAR Score for Hospitals in Canada. Technical reference,
Environmental Protection Agency (EPA). [online] Available from:
http://www.energystar.gov/sites/default/files/buildings/tools/
Hospital_Canada_0.pdf Accessed: Apr 2015.
EPA (2014b). ENERGY STAR Score for Hospitals in the United State. Technical
reference, Environmental Protection Agency (EPA). [online] Available from:
http:
//www.energystar.gov/sites/default/files/tools/Hospital_US_0.pdf
Accessed: Apr 2015.
Esmaeili, A., Twomey, J. M., Overcash, M. R., Soltani, S. A., McGuire, C., and
Ali, K. (2015). Scope for energy improvement for hospital imaging services in
the usa. J Health Serv Res Policy, 20(2):67–73.
Field, J., Soper, J., Jones, P., Bordass, W., and Grigg, P. (1997). Energy
performance of occupied non-domestic buildings: Assessment by analysing
end-use energy consumptions. Building Services Engineering Research and
Technology, 18(1):39–46.
Fifield, L. (2012). Monitoring and Modelling UK Hospital Building Type Energy
Consumption. Thesis (MPhil), Loughborough University.
Flyvbjerg, B. (2006). Five misunderstandings about case-study research.
Qualitative Inquiry, 12(2):219–245.
Foulds, C., Powell, J., and Seyfang, G. (2013). Investigating the performance of
everyday domestic practices using building monitoring. Building Research &
Information, 41(6):622–636.
234
8 Bibliography
Francis, S., Glanville, R., Noble, A., and Scher, P. (1999). 50 years of ideas in
health care buildings. Report, The Nuffield Trust, London.
Fuller, C., Besser, S., Savage, J., McAteer, J., Stone, S., and Michie, S. (2014).
Application of a theoretical framework for behavior change to hospital workers’
real-time explanations for noncompliance with hand hygiene guidelines. Am J
Infect Control, 42(2):106–10.
Galvin, R. (2015). The Rebound Effect in Home Heating. A guide for policymakers
and practitioners. Routledge, London.
Gatersleben, B., Steg, L., and Vlek, C. (2002). Measurement and Determinants of
Environmentally Significant Consumer Behavior. Environment and Behavior,
34(3):335–362.
Geels, F. W. and Schot, J. (2007). Typology of sociotechnical transition pathways.
Research Policy, 36(3):399–417.
Gillham, B. (2005). Research Iterviewing. The range of techniques. Open
University Press, Maidenhead, UK.
Godoy-Shimizu, D., Armitage, P., Steemers, K., and Chenvidyakarn, T. (2011).
Using display energy certificates to quantify schools’ energy consumption.
Building Research & Information, 39(6):535–552.
Goldkuhl, G. and Braf, E. (2002). Organisational ability: Constituents and
congruencies. In Coakes, E., Willis, D., and Clarke, S., editors, Knowledge
Management in the Socio Technical World, Computer Supported Cooperative
Work, book section 4, pages 30–42. Springer London.
Gram-Hanssen, K. (2009). Standby consumption in households analyzed with a
practice theory approach. Journal of Industrial Ecology, 14(1):150–165.
Gram-Hanssen, K. (2010). Residential heat comfort practices: understanding
users. Building Research & Information, 38(2):175–186.
Gram-Hanssen, K. (2011). Understanding change and continuity in residential
energy consumption. Journal of Consumer Culture, 11(1):61 – 78.
Gram-Hanssen, K. (2013a). New needs for better understanding of household’s
energy consumption - behaviour, lifestyle or practices? Architectural Engineering
and Design Management, 10(1-2):91–107.
235
8 Bibliography
Gram-Hanssen, K. (2013b). New needs for better understanding of household’s
energy consumption - behaviour, lifestyle or practices? Architectural Engineering
and Design Management, 10(1-2):91–107.
Gray, A., Hoile, R., Ingram, G., and Sherry, K. (1997). The report of the national
enquiry into perioperative deaths. Report, National Confidential Enquiry into
Perioperative Deaths (NCEPOD).
Gray, D. E. (2004). Doing research in the real world. Sage, London.
Gray, S. M. (2011). Online course on sustainable healthcare. [online] Available
from: http://www.healthknowledge.org.uk/interactive-learning/
sustainable-healthcare. Accessed: Mar 2016.
Greene, J. C., Caracelli, V. J., and Graham, W. F. (1989). Toward a conceptual
framework for mixed-method evaluation designs. Educational Evaluation and
Policy Analysis, 11(3):255–274.
Guest, G. (2006). How many interviews are enough?: An experiment with data
saturation and variability. Field Methods, 18(1):59–82.
Gul, M. S. and Patidar, S. (2015). Understanding the energy consumption and
occupancy of a multi-purpose academic building. Energy and Buildings,
87:155–165.
Hagemeier, A. (2014). [in German] Erfassung des energierelevanten
Nutzerverhaltens in Krankenhausern in Hinblick auf Beleuchtung, Gerate und
Fensteroffnung. In Fifth German-Austrian IBPSA Conference RWTH Aachen
University, pages 519 – 527.
Hargreaves, T. (2011). Practice-ing behaviour change: Applying social practice
theory to pro-environmental behaviour change. Journal of Consumer Culture,
11(1):79–99.
Harsem, T. T. (2011). Stricter specification of the energy performanc eof
healthcare equipment can reduce hospital energy consumption. In 4th European
Conference on Healthcare Engineering (ECHE). Paris, France.
Hart, S., Steven, H., and Crozier-Cole, T. (2011). Rapid Improvement & Ideas
Sharing. Presentation by the Carbon Trust, UK.
236

8 Bibliography
Health and Social Care Information Centre (2014). NHS Hospital and Community
Health Service (HCHS) monthly workforce statistics - Provisional Statistics.
Nationality by main staff group, headcount. [online] Available from: www.hscic.
gov.uk/catalogue/PUB16369/nhs-work-stat-oct-2014-nlty.xls. Accessed:
Aug 2015.
Heape, S. (2013). Personal communication.
Hills, D. and Junge, K. (2010). Guidance for transport impact evaluations.
Choosing an evaluation approach to achieve better attribution, The Tavistock
Institute, London.
Hinz, J., Rieske, N., Schwien, B., Popov, A. F., Mohite, P. N., Radke, O., Bartsch,
A., Quintel, M., and Zuchner, K. (2012). Cost analysis of two anaesthetic
machines: ”primus(r)” and ”zeus(r)”. BMC Res Notes, 5:3.
Hirst, E. (1982). Analysis of hospital energy audits. Energy Policy, 10(3):225–232.
Hitchings, R. (2012). People can talk about their practices. Area, 44(1):61–67.
HM Government (2006). Climate Change. The UK Programme 2006. [online]
Available from: https://www.gov.uk/government/uploads/system/uploads/
attachment_data/file/272269/6764.pdf. Accessed: Oct 2014.
Holeck, S. (2007). [in German] Energieoptimierung in Krankenhausern. Qualitat
und Quantitat des Energiebedarfs von Krankenhausern unter besonderer
Berucksichtigung des Einflusses des architektonischen und baukonstruktiven
Entwurfes. Thesis (Ph.D), Bauhaus-Universitat Weimar.
Hong, S.-M., Paterson, G., Burman, E., Steadman, P., and Mumovic, D. (2013). A
comparative study of benchmarking approaches for non-domestic buildings: Part
1 - top-down approach. International Journal of Sustainable Built Environment,
2(2):119–130.
Hosni, M. H., Jones, B. W., and Xu, H. (1999). Experimental results for heat gain
and radiant/convective split from equipment in buildings. ASHRAE
Transactions, 105(2):527–539.
Janda, K., Patrick, J., and Layberry, R. (2015). A wicked approach to retail sector
energy management. In ECEEE 2015 Summer study on energy efficiency.
Belambra Les Criques, Toulon/Hyeres, France.
Jeffries, I. and Rowlands-Rees, T. (2013). Energy efficiency trends annual report
2012/2013. essential insight for consumers and suppliers of non-domestic
energy-efficiency. Report, Bloomberg New Energy Finance. Accessed: Nov 2014.
237
8 Bibliography
Jensen, A. and Petersen, P. (2011). Energy efficiency in hospitals and laboratories.
In ECEEE 2011 Summer Study. Belambra Les Criques, Toulon/Hyeres, France.
Jiang, P., Chen, Y., Xu, B., Dong, W., and Kennedy, E. (2013). Building low
carbon communities in china: The role of individual’s behaviour change and
engagement. Energy Policy, 60:611–620.
Jones, C. S. (2001). Towards benchmarking in British acute hospitals. Health
Services Management Research, 14(2):125–138.
Junnila, S. (2007). The potential effect of end-users on energy conservation in
office buildings. Facilities, 25(7):329–339.
Kattenstein, T., Unger, H., and Wagner, H. (2002). Handlungskonzepte zur
Optimierung des Energiebedarfs und der Energieversorgung der Ruhr-Universitat
Bochum. Abschlussbericht zum Vorhaben: IV A4-20600298 Optimierung der
bestehenden wirtschaftlichen Energieversorgung der Ruhr-Universitat Bochum
(in German), Lehrstuhl fur Energiesysteme und Energiewirtschaft,
Ruhr-Universitat.
Kavulya, G. and Becerik-Gerber, B. (2015). Understanding the influence of
occupant behavior on energy consumption patterns in commercial buildings. In
Congress on Computing in Civil Engineering, Proceedings, pages 569–576.
Knight, C. and Haslam, S. A. (2010). The relative merits of lean, enriched, and
empowered offices: an experimental examination of the impact of workspace
management strategies on well-being and productivity. J Exp Psychol Appl,
16(2):158–72.
Lakeridou, M., Ucci, M., Marmot, A., and Ridley, I. (2012). The potential of
increasing cooling set-points in air-conditioned offices in the UK. Applied
Energy, 94:338–348.
Latour, B. (1999). Pandora’s Hope: Essays on the Reality of Science Studies.
Harvard University Press, Massachusetts, US.
Leaman, A., Stevenson, F., and Bordass, B. (2010). Building evaluation: practice
and principles. Building Research & Information, 38(5):564–577.
Li, Y., Tang, J., Noakes, C., and Hodgson, M. J. (2015). Engineering control of
respiratory infection and low-energy design of healthcare facilities. Science and
Technology for the Built Environment, 21(1):25–34.
Liddiard, R. (2014). Room-scale profiles of space use and electricity consumption
in non-domestic buildings. Building Research & Information, 42(1):72–94.
238
8 Bibliography
Liddiard, R. G. (2012). Characterising Space Use and Electricity Consumption in
Non-domestic Buildings. Thesis (Ph.D), Institute of Energy and Sustainable
Development, De Montfort University, Leicester.
Liddiard, R. G. and Wright, A. (2008). A review of non-domestic energy
benchmarks and benchmarking methodologies. In IEECB Focus 2008 Improving
Energy Efficiency in Commercial Buildings Conference, pages 1 – 11, Frankfurt
am Main, Germany.
Lindelof, D. and Morel, N. (2006). A field investigation of the intermediate light
switching by users. Energy and Buildings, 38(7):790–801.
Littleford, C., Ryley, T., and Firth, S. (2013). Organisational settings and
individual energy use: How context affects behaviour in shared offices. In 10th
Biennial Conference on Environmental Psychology. Magdeburg, Germany.
Littleford, C., Ryley, T. J., and Firth, S. K. (2014). Context, control and the
spillover of energy use behaviours between office and home settings. Journal of
Environmental Psychology, 40:157–166.
Lo, S. H., Peters, G.-J. Y., and Kok, G. (2012). A review of determinants of and
interventions for proenvironmental behaviors in organizations. Journal of
Applied Social Psychology, 42(12):2933–2967.
Lomas, K., Giridharan, R., Short, C., and Fair, A. (2012). Resilience of
’Nightingale’ hospital wards in a changing climate. Building Services
Engineering Research and Technology, 33(1):81–103.
Lomas, K. J. and Ji, Y. (2009). Resilience of naturally ventilated buildings to
climate change: Advanced natural ventilation and hospital wards. Energy and
Buildings, 41(6):629–653.
Lopes, M. A. R., Antunes, C. H., and Martins, N. (2012). Energy behaviours as
promoters of energy efficiency: A 21st century review. Renewable and
Sustainable Energy Reviews, 16(6):4095–4104.
Lord Carter of Coles (2016). Operational productivity and performance in english
nhs acute hospitals: Unwarranted variations. Technical report, An independent
report for the Department of Health. [online]. Last Accessed July 2016.
Love, J. and Cooper, A. C. (2015). From social and technical to socio-technical:
Designing integrated research on domestic energy use. Indoor and Built
Environment, 24(7):986–998.
239

8 Bibliography
Lowe, R., Wingfield, J., Bell, M., and Bell, J. (2007). Evidence for heat losses via
party wall cavities in masonry construction. Building Services Engineering
Research and Technology, 28(2):161–181.
Lucon, O., Urge Vorsatz, D., Ahmed, A. Z., Akbari, H., Bertoldi, P., Cabeza,
L. F., Eyre, N., Gadgil, A., Harvey, L. D. D., Jiang, Y., E.Liphoto, Mirasgedis,
S., Murakami, S., Parikh, J., Pyke, C., and Vilarino, M. V. (2014). Buildings. In
Edenhofer, O., Pichs-Madruga, R., Sokona, Y., Farahani, E., Kadner, S.,
Seyboth, K., Adler, A., Baum, I., S.Brunner, Eickemeier, P., Kriemann, B.,
Savolainen, J., Schlomer, S., Stechow, C. v., Zwickel, T., and Minx, J., editors,
Climate Change 2014: Mitigation of Climate Change. Contribution of Working
Group III to the Fifth Assessment Report of the Intergovernmental Panel on
Climate Change. Cambridge University Press, Cambridge, United Kingdom and
New York, NY, USA.
Lynn, P. and Longhi, S. (2011). Environmental attitudes and behaviour: Who
cares about climate change? In McFall, S. L. and Garrington, C., editors,
Understanding society: Early findings from the first wave of the UK’s household
longitudinal survey. Colchester: Institute for Social and Economic Research,
University of Essex.
Mahdavi, A., Mohammadi, A., Kabir, E., and Lambeva, L. (2008). Shading and
lighting operation in office buildings in austria: A study of user control behavior.
Building Simulation, 1(2):111–117.
Marshall, B. and Rashid, F. (2013). The Ottawa Hospital Energy Management
Program. Energy Engineering, 110(3):65–80.
Masoso, O. T. and Grobler, L. J. (2010). The dark side of occupants’ behaviour on
building energy use. Energy and Buildings, 42(2):173–177.
Mathew, P., Sartor, D., Geet, O. V., and Reilly, S. (2004). Rating energy efficiency
and sustainability in laboratories: Results and lessons from the labs21 program.
In Proceedings of the 2004 ACEEE Summer Study in Buildings, Asilomar
Conference Center: Pacific Grove, CA.
Matthies, E., Kastner, I., Klesse, A., and Wagner, H.-J. (2011). High reduction
potentials for energy user behavior in public buildings: how much can
psychology-based interventions achieve? Journal of Environmental Studies and
Sciences, 1(3):241–255.
240

8 Bibliography
Maughan, D. and Ansell, J. (2014). Protecting resources, promoting value: a
doctor’s guide to cutting waste in clinical care. Report, Academy of Medical
Royal Colleges, London.
McClelland, L. and Cook, S. W. (1980). Energy-Conservation in University
Buildings - Encouraging and Evaluating Reductions in Occupants Electricity
Use. Evaluation Review, 4(1):119–133.
McGuire, A. (1987). The measurement of hospital efficiency. Social Science &
Medicine, 24(9):719–724.
McKenzie-Mohr, D. (2000). Promoting sustainable behavior: An introduction to
community-based social marketing. Journal of Social Issues, 56(3):543–554.
Menezes, A. C., Cripps, A., Buswell, R. A., and Bouchlaghem, D. (2012).
Benchmarking small power energy consumption in office buildings in the united
kingdom: A review of data published in cibse guide f. Building Services
Engineering Research and Technology, 34(1):73–86.
Michie, S., Johnston, M., Abraham, C., Lawton, R., Parker, D., and Walker, A.
(2005). Making psychological theory useful for implementing evidence based
practice: A consensus approach. Quality and Safety in Health Care, 14(1):26–33.
Miles, M. and Huberman, A. (1994). Qualitative Data Analysis: An Expanded
Sourcebook. SAGE Publications, London.
Moezzi, M. and Janda, K. B. (2014). From ”if only” to ”social potential” in schemes
to reduce building energy use. Energy Research & Social Science, 1:30 – 40.
Moghimi, S., Azizpour, F., Mat, S., Lim, C. H., Salleh, E., and Sopian, K. (2013).
Building energy index and end-use energy analysis in large-scale hospitals - case
study in malaysia. Energy Efficiency, 7(2):243–256.
Moorefield, L., Frazer, B., and Bendt, P. (2011). Office Plug Load Field Monitoring
Report. Pier energy?related environmental research program. cec?500?2011?010.,
California Energy Commission, Portland, OR.
Morgan, D. L. (2007). Paradigms lost and pragmatism regained: Methodological
implications of combining qualitative and quantitative methods. Journal of
Mixed Methods Research, 1(1):48–76.
Morgenstern, P., Li, M., Raslan, R., Ruyssevelt, P., and Wright, A. (2016a).
Benchmarking acute hospitals: Composite electricity targets based on
departmental consumption intensities? Energy and Buildings, 118:277 – 290.
241

8 Bibliography
Morgenstern, P., Li, M., Raslan, R., Ruyssevelt, P., and Wright, A. (2016b). Small
power and lighting load time series data for 27 departments across 8 UK
hospitals. Data in Brief, pages –.
Morgenstern, P., Raslan, R., and Huebner, G. (2015a). Applicability, potential and
limitations of staff-centred energy conservation initiatives in english hospitals.
Energy Efficiency, pages 1–22.
Morgenstern, P., Raslan, R., and Ruyssevelt, P. (2014). Measuring changes in
energy behaviours in complex non-domestic buildings. In Proceedings of the
BEHAVE Energy Conference 2014. Said Business School, Oxford University.
Morgenstern, P., Raslan, R., and Ruyssevelt, P. (2015b). Assessing savings
potentials from changes in energy behaviours of hospital staff: benefits and
challenges of energy audits. In ECEEE 2015 Summer study on energy efficiency.
Belambra Les Criques, Toulon/Hyeres, France.
Mortimer, N., Ashley, A., and Rix, J. H. R. (2000). Detailed energy surveys of
non-domestic buildings. Environment and Planning B: Planning and Design,
27:25 – 32.
Mulville, M., Jones, K., and Huebner, G. (2014). The potential for energy
reduction in UK commercial offices through effective management and behaviour
change. Architectural Engineering and Design Management, 10(1-2):79–90.
Murray, J., Pahl, O., and Burek, S. (2008). Evaluating the scope for
energy-efficiency improvements in the public sector: Benchmarking NHS
Scotland’s smaller health buildings. Energy Policy, 36(3):1236–1242.
Murtagh, N., Nati, M., Headley, W. R., Gatersleben, B., Gluhak, A., AliImran, M.,
and Uzzell, D. (2013). Individual energy use and feedback in an office setting: A
field trial. Energy Policy, 62(0):717–728.
National Institute for Health and Care Excellence (NICE) (2007). Behaviour
change: the principles for effective interventions. NICE, London. [online]
Available from: https://www.nice.org.uk/guidance/ph6 Accessed: Mar 2016.
NHS England (2013). Putting Patients First. The NHS England business plan for
2013/14 - 2015/16. London: NHS England. [online] Available from: http:
//www.england.nhs.uk/wp-content/uploads/2013/04/ppf-1314-1516.pdf
Accessed: Dec 2013.
NHS Estates (2004a). Carbon/energy management in healthcare. Best practice
advice for the NHS in England on meeting the mandatory carbon/energy targets.
TSO (The Stationery Office), Leeds, UK.
242

8 Bibliography
NHS Estates (2004b). HBN 12: Out-patients department. London: The Stationary
Office (TSO).
NHS Estates (2004c). HBN 26 Facilities for surgical procedures Volume 1. London:
The Stationary Office (TSO).
NHS Estates (2005). HBN 15 - ’Facilities for pathology services’. London: The
Stationary Office (TSO).
NHS SDU (2010). Save Money by Saving Carbon. Decision Making in the NHS
using Marginal Abatement Cost Curves, NHS Sustainable Development Unit.
NHS SDU (2013). Carbon footprint update for NHS in England 2012. [online]
available from: http://www.sduhealth.org.uk/policy-strategy/reporting/
nhs-carbon-footprint.aspx accessed: Mar 2014, NHS Sustainable
Development Unit, Cambridge.
NHS SDU (2014). Sustainable, Resilient, Healthy People & Places. A Sustainable
Development Strategy for the NHS, Public Health and Social Care system.
[online] availabble from http:
//www.sduhealth.org.uk/policy-strategy/engagement-resources.aspx
accessed: Mar 2016, NHS Sustainable Development Unit.
NHS SDU (2015). 5 to Survive for Estates & Facilities Management Professionals.
[online] available from: http://www.sduhealth.org.uk/documents/
publications/5_to_survive_estates.pdf accessed: Sept 2015, NHS
Sustainable Development Unit.
NHS SDU (2016). Sustainable Development in Health and Care Report. Health
Check 2016. [online] available from
http://www.sduhealth.org.uk/policy-strategy/reporting/
sustainable-development-in-health-and-care-report-2016.aspx
accessed: Jan 2016, Cambridge: The NHS Sustainable Development Unit.
Nightingale, F. (1860). Notes on Nursing What It Is, and What It Is Not.
Harrison, London.
Nye, M. and Hargreaves, T. (2009). Exploring the social dynamics of
proenvironmental behavior change. Journal of Industrial Ecology, 14(1):137–149.
Osbaldiston, R. and Schott, J. P. (2012). Environmental sustainability and
behavioral science: Meta-analysis of proenvironmental behavior experiments.
Environment and Behavior, 44(2):257–299.
243
8 Bibliography
Overcash, M. (2012). A comparison of reusable and disposable perioperative
textiles: sustainability state-of-the-art 2012. Anesth Analg, 114(5):1055–66.
Pagliarini, G., Corradi, C., and Rainieri, S. (2012). Hospital chcp system
optimization assisted by TRNSYS building energy simulation tool. Applied
Thermal Engineering, 44:150–158.
Palm, J. and Darby, S. J. (2014). The meanings of practices for energy
consumption - a comparison of homes and workplaces. Science and Technology
Studies, 27(2):72–92.
Patton, M. (1990). Qualitative evaluation and research methods. SAGE, Newbury
Park, California, 2nd edition.
Pellegrini-Masini, G. and Leishman, C. (2011). The role of corporate reputation
and employees’ values in the uptake of energy efficiency in office buildings.
Energy Policy, 39(9):5409–5419.
Pencheon, D., Cointet, S., Brown, J., Howley, J., Tennison, I., Greensmith, H., and
Wright, S. (2009). Saving Carbon, Improving Health. NHS Carbon Reduction
Strategy for England, NHS Sustainable Development Unit.
Petersen, A. C. (1998). W.K. Kellogg Foundation Evaluation Handbook. W.K.
Kellogg Foundation, Battle Creek, MI.
Pierce, T., Morris, G., and Parker, B. (2014). Reducing theatre energy
consumption. Health Estate J, 68(3):58 – 62.
Powell, M., Glendinning, S., Castan Broto, V., Dewberry, E., and Walsh, C.
(2014). Shaped by shock: Staff on the emergency department ‘shop floor’.
Anthropology in Action, 21(2):14–22.
Preiser, W. F. and Vischer, J. C. (2005). Assessing Building Performance. Elsevier
Butterworth-Heinemann, Amsterdam.
Rabanimotlagh, A., Overcash, M., and Twomey, J. (2016). [Draft] End-Use
Demand Analysis of Hospital Energy Consumption. Energy Efficiency, 0.
Currently under review with the journal.
Reckwitz, A. (2002). Toward a theory of social practices: A development in
culturalist theorizing. European Journal of Social Theory, 5(2):243–263.
Robison, D. and Reichmuth, H. (1992). The Use of Shoert-Term Measurements to
Decompose Commercial Billing Data Into Primary End Uses. In ACEE Summer
Study on Energy Efficiency in Buildings, volume 3. Washington, DC.
244
8 Bibliography
Robson, C. (2011). Real world research. A resources for Users of Social Research
Methods in Applied Settings. John Wiley & Sons Ltd, Chichester, UK, 3rd
edition.
Rohde, T. and Martinez, R. (2015). Equipment and energy usage in a large
teaching hospital in norway. J Healthc Eng, 6(3):419–33.
Rosenfeld, A., Atkinson, C., Koomey, J., Meier, A., Mowris, R. J., and Price, L.
(1993). Conserved energy supply curves for u.s. buildings. Contemporary
Economic Policy, 11:45 – 68.
Roth, K. W. and McKenney, K. (2007). Energy Consumption by Consumer
Electronics in U.S. Residences. Consumer Electronics Association (CEA),
Arlington, Virginia.
Royal College of Nursing (RCN) (2012). Mandatory Nurse Staffing Levels. Royal
college of nursing, Policy & International Department, London.
Royal College of Surgeons (2014). Emergency Surgery Policy Briefing. London,
[online] Available from http://www.rcseng.ac.uk/policy/documents/RCS%
20Emergency%20surgery%20policy%20briefing.pdf Accessed: Apr 2015.
Russen, L., Neale, S., and Rees, S. (2010). Commercial Energy Assessor’s
Handbook. RICS, London.
Saidur, R., Hasanuzzaman, M., Yogeswaran, S., Mohammed, H. A., and Hossain,
M. S. (2010). An end-use energy analysis in a Malaysian public hospital. Energy,
35(12):4780–4785.
Salix Finance (2014). Salix working within the NHS. Briefing, Salix, London.
[online] Available from: http:
//www.salixfinance.co.uk/system/public_files/nhs_briefing_final.pdf
Accessed: Oct 2015.
Santamouris, M., Dascalaki, E., Balaras, C., Argiriou, A., and Gaglia, A. (1994).
Energy performance and energy conservation in health care buildings in hellas.
Energy Conversion and Management, 35(4):293–305.
Schahn, J. (2007). Projekt Energiemanagment am Psycholgischen Institut der
Universiat Heidelberg: Ein erfolgreicher Fehlschlag. Umweltpsychologie,
11(2):138–163.
245

8 Bibliography
Schakib-Ekbatan, K., Caciki, F. Z., Schweiker, M., and Wagner, A. (2015). Does
the occupant behavior match the energy concept of the building? - Analysis of a
German naturally ventilated office building. Building and Environment, 84:142 –
150.
Schatzki, T. R. (2002). The site of the social. Pennsylvania State University Press,
University Park.
Schettler-Kohler, H.-P. (2009). [in German] Benchmarks fur die Energieeffizienz
von Nichtwohngebauden. Vergleichswerte fur Energieausweise,
Bundesministerium fuer Verkehr, Bau und Stadtentwicklung (BMVBS), Berlin.
[online] Available from http://www.bbsr.bund.de/BBSR/DE/
Veroeffentlichungen/BBSROnline/2009/ON092009.html?nn=395966 Accessed:
Jan 2015.
Schweber, L. and Leiringer, R. (2012). Beyond the technical: a snapshot of energy
and buildings research. Building Research & Information, 40(4):481–492.
Scofield, J. H. (2014). Energy star building benchmarking scores: Good idea, bad
science. In 2014 ACEEE Summer Study on Energy Efficiency in Buildings.
Asilomar Conference Center, Pacific Grove, CA.
Shadish, W. R., Cook, T., and Campbell, D. (2001). Experimental and
quasi-experimental designs for generalized causal inference. Houghton Mifflin,
New York.
Short, C. A., Guthrie, P., Soulti, E., and Macmillan, S. (2015). Health Technical
Memorandum 07-02: EnCO2de 2015 - making energy work in healthcare.
Environment and sustainability, Department of Health, London. [online]
Available from https://www.gov.uk/government/uploads/system/uploads/
attachment_data/file/416635/HTM_07-02_Part_A_FINAL.pdf Accessed Oct
2015.
Short, C. A., Lomas, K. J., Giridharan, R., and Fair, A. J. (2012). Building
resilience to overheating into 1960’s UK hospital buildings within the constraint
of the national carbon reduction target: Adaptive strategies. Building and
Environment, 55:73–95.
Shove, E. (1998). Gaps, barriers and conceptual chasms: theories of technology
transfer and energy in buildings. Energy Policy, 26(15):1105–1112.
Shove, E. (2010). Beyond the abc: climate change policy and theories of social
change. Environment and Planning A, 42(6):1273–1285.
246
8 Bibliography
Shove, E., I., and Pantzar, M. (2005). Consumers, producers and practices:
Understanding the invention and reinvention of nordic walking. Journal of
Consumer Culture, 5(1):43–64.
Shove, E., Pantzar, M., and Watson, M. (2012). The dynamics of social practice :
everyday life and how it changes. Sage, London.
Siero, F. W., Bakker, A. B., Dekker, G. B., and Van Den Burg, M. T. C. (1996).
Changing organizational energy consumption behaviour through comparative
feedback. Journal of Environmental Psychology, 16(3):235–246.
Silvermann, D. (2011). Interpreting qualitative data: methods for analysing talk,
text and interaction. Sage, London.
Singer, B. C., Mathew, P., Greenberg, S., Tschudi, W., and Sartor, D. (2009).
Hospital Energy Benchmarking Guidance - Version 1.0. LBNL - 2738E,
Lawrence Berkeley National Laboratory, Berkeley CA.
Skumatz, L., Dickerson, C. A., and Coates, B. (2000). Non-energy benefits in the
residential and non-residential sectors - innovative measurements and results for
participant benefits. In ACEEE Summer Study on Energy Efficiency in
Buildings, Washington, DC.
Socolow, R. H. (1978). Saving energy in the home : Princeton’s experiments at
Twin Rivers. Ballinger Pub. Co., Cambridge, Mass.
Soldaty, H., Plesser, S., and Fisch, N. (2013). The Best Energy Project -
Information and Communication Technologies for the Improvement of Energy
Efficient Building Operation and User Involvement. In Proceedings of the 7th
International Conference on Energy Efficiency in Commercial Buildings,
Frankfurt, Germany.
Sorrell, S. (2015). Reducing energy demand: A review of issues, challenges and
approaches. Renewable and Sustainable Energy Reviews, 47:74–82.
Spataru, C. and Gauthier, S. (2014). How to monitor people ‘smartly’ to help
reducing energy consumption in buildings? Architectural Engineering and
Design Management, 10(1-2):60–78.
Staats, H., van Leeuwen, E., and Wit, A. (2000). A longitudinal study of
informational interventions to save energy in an office building. Journal of
Applied Behavior Analysis, 33(1):101–104.
Steemers, K. and Yun, G. Y. (2009). Household energy consumption: a study of
the role of occupants. Building Research & Information, 37(5-6):625–637.
247
8 Bibliography
Stephenson, J., Barton, B., Carrington, G., Gnoth, D., Lawson, R., and Thorsnes,
P. (2010). Energy cultures: A framework for understanding energy behaviours.
Energy Policy, 38(10):6120–6129.
Stern, P. C. (2000). Toward a coherent theory of environmentally significant
behaviour. Journal of Social Issues, 56(3):407–424.
Stern, P. C., Dietz, T., Ruttan, V. W., Socolow, R. H., and Sweeney, J. L., editors
(1997). Environmentally significant consumption. National Academy Press,
Washigton, D.C.
Su, C.-C. (2011). [in chinese] measures to reduce lighting-related energy use and
costs at hospital nursing stations. Chinese journal of nursing, 58(3 Suppl):39–46.
Summerfield, A. J. and Lowe, R. (2012). Challenges and future directions for
energy and buildings research. Building Research & Information, 40(4):391–400.
Sumner, Steven A., M. (2010). Running on empty: Health care energy use in a
developing country. Journal of health care for the poor and underserved,
21(4):1278–81.
Sweeney, J. C., Kresling, J., Webb, D., Soutar, G. N., and Mazzarol, T. (2013).
Energy saving behaviours: Development of a practice-based model. Energy
Policy, 61:371–381.
Takakusagi, A. and Yoshino, D. (2011). [in chinese] research on energy and water
consumption at large-scale hospital. Chinese Journal, 17(35):233–238.
Tashakkori, A. and Teddlie, C. (1998). Mixed methodology. Combining Qualitative
and Quantitative Approaches., volume 46 of Applied Social Research Methods
Series. Sage, Thousand Oaks, California.
Tetlow, R., Beaman, C., Elmualim, A., and Couling, K. (2012). The impact of
occupant behaviour on the variation between the design and in-use energy
consumption of non-domestic buildings: An experimental approach. In TSBE
EngD Conference 3rd July 2012. Reading, UK.
The British Standard Institute (BSI) (2011). Energy management systems -
Requirements with guidance for use. BS EN ISO 50001:2011, pages 1–34.
The British Standards Institution (BSI) (2007). Energy performance of buildings -
Energy requirements for lighting. BS EN 15193:2007, pages 1 –79.
The British Standards Institution (BSI) (2012a). Energy audits. Part 1: General
requirements. BS EN 16247-1:2012, pages 1 –20.
248
8 Bibliography
The British Standards Institution (BSI) (2012b). Energy audits. Part 2: Buildings.
BS EN 16247-2:2012, pages 1 –48.
Tippkoter, R. and Schuwer, D. (2003). Leitfaden Energieeffizienz fur
Krankenhauser. Report, Energie Agentur NRW.
Trist, E. L. and Bamforth, K. W. (1951). Some social and psychological
consequences of the longxwall method of coal-getting: An examination of the
psychological situation and defences of a work group in relation to the social
structure and technological content of the work system. Human Relations,
4(1):3–38.
Tudor, T. L., Barr, S. W., and Gilg, A. W. (2008). A Novel Conceptual
Framework for Examining Environmental Behavior in Large Organizations: A
Case Study of the Cornwall National Health Service (NHS) in the United
Kingdom. Environment and Behavior, 40(3):426–450.
Twomey, J., Overcash, M., and Soltani, S. (2012). Life cycle for engineering the
healthcare service delivery of imaging. In Leveraging Technology for a
Sustainable World: Proceedings of the 19th CIRP Conference on Life Cycle
Engineering. Springer Science & Business Media.
Ucci, M., Domenech, T., Ball, A., Whitley, T., Wright, C., Mason, D., Corrin, K.,
Milligan, A., Rogers, A., Fitzsimons, D., Gaggero, C., and Westaway, A. (2012).
Behaviour change potential for energy saving in non-domestic buildings:
Development and pilot-testing of a benchmarking tool. Building Services
Engineering Research and Technology, 35(1):36–52.
Unites States Environmental Protection Agency (EPA) (2015). Life Cycle
Assessment (LCA). [online] Available from:
http://www.epa.gov/nrmrl/std/lca/lca.html. Accessed: Sept 2015.
van Amstel, F. M. C., Zerjav, V., Hartmann, T., van der Voort, M. C., and
Dewulf, G. P. M. R. (2015). Expanding the representation of user activities.
Building Research & Information, 43(2):144–159.
Vine, E. and Sathaye, J. (1999). Guidelines for the monitoring, evaluation,
reporting, verification, and certification of energy-efficiency projects for climate
change mitigation. Technical report, Lawrence Berkeley National Laboratory,
Berkeley, CA.
Walker, S. L., Lowery, D., and Theobald, K. (2014). Low-carbon retrofits in social
housing: Interaction with occupant behaviour. Energy Research & Social
Science, 2:102–114.
249

8 Bibliography
Wang, S., Yan, C., and Xiao, F. (2012). Quantitative energy performance
assessment methods for existing buildings. Energy and Buildings, 55:873–888.
Warde, A. (2005). Consumption and theories of practice. Journal of Consumer
Culture, 5(2):131–153.
Watts, N., Adger, W. N., Agnolucci, P., Blackstock, J., Byass, P., Cai, W.,
Chaytor, S., Colbourn, T., Collins, M., Cooper, A., Cox, P. M., Depledge, J.,
Drummond, P., Ekins, P., Galaz, V., Grace, D., Graham, H., Grubb, M., Haines,
A., Hamilton, I., Hunter, A., Jiang, X., Li, M., Kelman, I., Liang, L., Lott, M.,
Lowe, R., Luo, Y., Mace, G., Maslin, M., Nilsson, M., Oreszczyn, T., Pye, S.,
Quinn, T., Svensdotter, M., Venevsky, S., Warner, K., Xu, B., Yang, J., Yin, Y.,
Yu, C., Zhang, Q., Gong, P., Montgomery, H., and Costello, A. (2015). Health
and climate change: policy responses to protect public health. The Lancet,
386(10006):1861–1914.
Webber, C. A., Roberson, J. A., McWhinney, M. C., Brown, R. E., Pinckard,
M. J., and Busch, J. F. (2006). After-hours power status of office equipment in
the usa. Energy, 31(14):2823–2838.
Whitmarsh, L. (2011). Scepticism and uncertainty about climate change:
Dimensions, determinants and change over time. Global Environmental Change,
21(2):690–700.
Whitmarsh, L., O’Neill, S., and Lorenzoni, I. (2011). Climate change or social
change? Debate within, amongst, and beyond disciplines. Environment and
Planning A, 43(2):258–261.
Whittle, R., Ellis, R., Marshall, I., Alcock, P., Hutchison, D., and Mauthe, A.
(2015). From responsibility to accountability: Working creatively with
distributed agency in office energy metering and management. Energy Research
& Social Science, 10:240–249.
Witt, H. (2013). Statistical Analysis of the Energy Demand of the Hospital
Building Stock in England. Thesis (MRes), Loughborough University.
Yin, R. (2003). Case study research: design and methods. Sage, London, 3rd
edition.
Yu, Z., Fung, B. C. M., Haghighat, F., Yoshino, H., and Morofsky, E. (2011). A
systematic procedure to study the influence of occupant behavior on building
energy consumption. Energy and Buildings, 43(6):1409–1417.
250
8 Bibliography
Zibarras, L. and Ballinger, C. (2011). Promoting environmental behaviour in the
workplace: A survey of UK organisations. In Bartlett, D., editor, Going green:
The psychology of sustainability at the workplace. London Metropolitan
University, London.
Ziebik, A. and Hoinka, K. (2013). Energy Systems of Complex Buildings. Springer,
London.
251
Appendices
A Hospital energy use 253
A.1 Evidence on hospital energy performance: Measured consumption
levels as well as best-practice targets at building level . . . . . . . . 253
A.2 Evidence on the relevance of different energy end-uses in hospitals . 256
A.3 A graphic overview of UK guidance documents on energy efficiency
in hospitals . . . . . . . . . . . . . . . . . . . . . . . . . . . . . . . . 258
B Supporting evidence from the literature 259
B.1 Empirical social practices studies of non-domestic building energy use 259
B.2 Strategies to ensure quality in case study research . . . . . . . . . . 261
C Data collection instruments 265
C.1 Lighting and appliance audit . . . . . . . . . . . . . . . . . . . . . . 265
C.2 Interview guide . . . . . . . . . . . . . . . . . . . . . . . . . . . . . . 267
C.3 Informed consent form . . . . . . . . . . . . . . . . . . . . . . . . . . 272
D Data analysis process 277
D.1 List of lighting and equipment items . . . . . . . . . . . . . . . . . . 278
D.2 Cross-tabulation of interview information as model input . . . . . . 302
D.3 Example of an interview transcript . . . . . . . . . . . . . . . . . . . 309
D.4 Excerpt from the analytical research notes . . . . . . . . . . . . . . . 310
E Quantitative findings 311
E.1 Details for departmental savings potentials . . . . . . . . . . . . . . . 311
A Hospital energy use
This appendix provides additional detail on the available evidence on hospital energy
demand, in particular:
A.1 Evidence on hospital energy performance: Measured consumption levels as well
as best-practice targets at building level
A.2 Evidence on the relevance of different energy end-uses in hospitals
A.3 A graphic overview of UK guidance documents on energy efficiency in hospitals
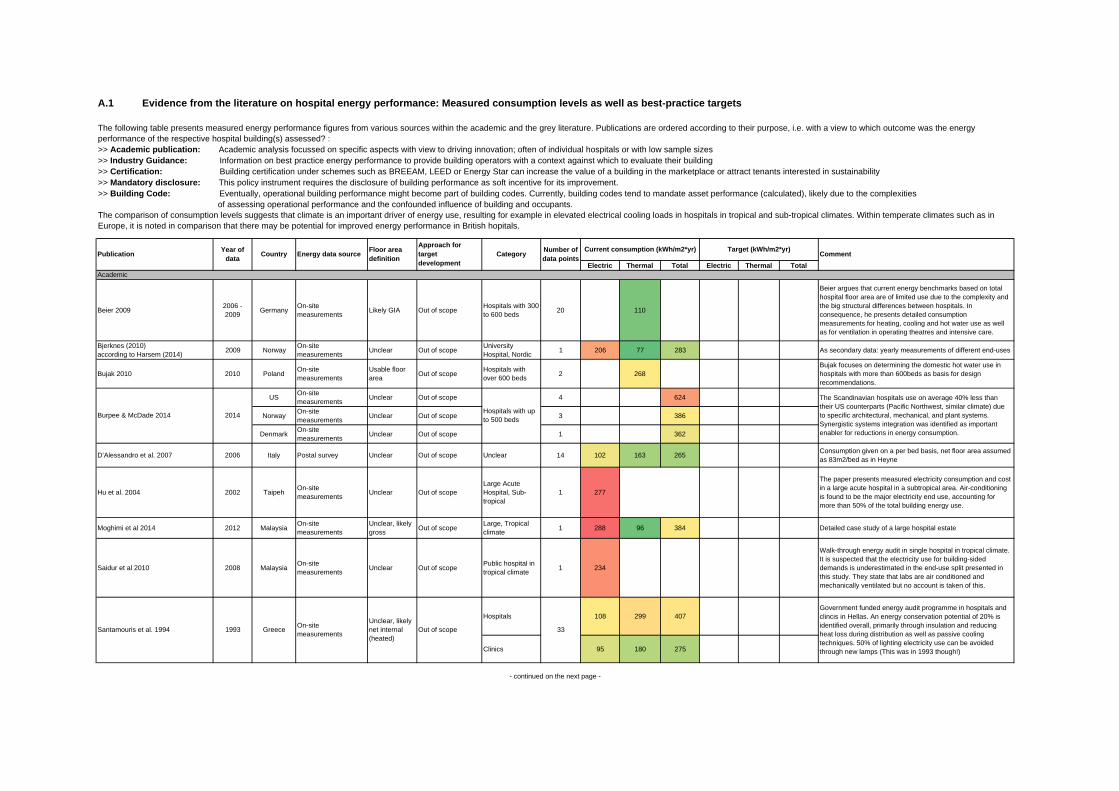
Electric Thermal Total Electric Thermal Total
Beier 2009 2006 - 2009 Germany On-site
measurements Likely GIA Out of scope Hospitals with 300 to 600 beds 20 110
Beier argues that current energy benchmarks based on total hospital floor area are of limited use due to the complexity and the big structural differences between hospitals. In consequence, he presents detailed consumption measurements for heating, cooling and hot water use as well as for ventilation in operating theatres and intensive care.
Bjerknes (2010) according to Harsem (2014) 2009 Norway On-site
measurements Unclear Out of scope University Hospital, Nordic 1 206 77 283 As secondary data: yearly measurements of different end-uses
Bujak 2010 2010 Poland On-site measurements
Usable floor area Out of scope Hospitals with
over 600 beds 2 268Bujak focuses on determining the domestic hot water use in hospitals with more than 600beds as basis for design recommendations.
US On-site measurements Unclear Out of scope 4 624
Norway On-site measurements Unclear Out of scope 3 386
Denmark On-site measurements Unclear Out of scope 1 362
D’Alessandro et al. 2007 2006 Italy Postal survey Unclear Out of scope Unclear 14 102 163 265 Consumption given on a per bed basis, net floor area assumed as 83m2/bed as in Heyne
Hu et al. 2004 2002 Taipeh On-site measurements Unclear Out of scope
Large Acute Hospital, Sub-tropical
1 277
The paper presents measured electricity consumption and cost in a large acute hospital in a subtropical area. Air-conditioning is found to be the major electricity end use, accounting for more than 50% of the total building energy use.
Moghimi et al 2014 2012 Malaysia On-site measurements
Unclear, likely gross Out of scope Large, Tropical
climate 1 288 96 384 Detailed case study of a large hospital estate
Saidur et al 2010 2008 Malaysia On-site measurements Unclear Out of scope Public hospital in
tropical climate 1 234
Walk-through energy audit in single hospital in tropical climate. It is suspected that the electricity use for building-sided demands is underestimated in the end-use split presented in this study. They state that labs are air conditioned and mechanically ventilated but no account is taken of this.
Hospitals 108 299 407
Clinics 95 180 275
Academic
- continued on the next page -
A.1 Evidence from the literature on hospital energy performance: Measured consumption levels as well as best-practice targets
The following table presents measured energy performance figures from various sources within the academic and the grey literature. Publications are ordered according to their purpose, i.e. with a view to which outcome was the energy performance of the respective hospital building(s) assessed? :>> Academic publication: Academic analysis focussed on specific aspects with view to driving innovation; often of individual hospitals or with low sample sizes>> Industry Guidance: Information on best practice energy performance to provide building operators with a context against which to evaluate their building>> Certification: Building certification under schemes such as BREEAM, LEED or Energy Star can increase the value of a building in the marketplace or attract tenants interested in sustainability>> Mandatory disclosure: This policy instrument requires the disclosure of building performance as soft incentive for its improvement.>> Building Code: Eventually, operational building performance might become part of building codes. Currently, building codes tend to mandate asset performance (calculated), likely due to the complexities of assessing operational performance and the confounded influence of building and occupants. The comparison of consumption levels suggests that climate is an important driver of energy use, resulting for example in elevated electrical cooling loads in hospitals in tropical and sub-tropical climates. Within temperate climates such as in Europe, it is noted in comparison that there may be potential for improved energy performance in British hopitals.
Current consumption (kWh/m2*yr) Target (kWh/m2*yr)Publication Year of
data Country Energy data source Floor area definition
Approach for target development
Number of data pointsCategory
Government funded energy audit programme in hospitals and clincis in Hellas. An energy conservation potential of 20% is identified overall, primarily through insulation and reducing heat loss during distribution as well as passive cooling techniques. 50% of lighting electricity use can be avoided through new lamps (This was in 1993 though!)
33Santamouris et al. 1994 1993 Greece On-site measurements
Unclear, likely net internal (heated)
Out of scope
Comment
The Scandinavian hospitals use on average 40% less than their US counterparts (Pacific Northwest, similar climate) due to specific architectural, mechanical, and plant systems. Synergistic systems integration was identified as important enabler for reductions in energy consumption.
Hospitals with up to 500 beds2014Burpee & McDade 2014

Electric Thermal Total Electric Thermal Total
BRECSU (Published unchanged in 2012 in CIBSE Guide F) Pre 1996 UK Unclear Unclear 1st quartile Acute Hospital Unclear, but
many 108 510 618 74 422 496 Assumed ceiling height 2.9m
EnCO2de 2006 UK Mandatory reporting GIA 1st quartile General Acute Hospital Many 143 373 516 122 317 439 Assumed ceiling height 2.7m
2007 GIA Out of scope Nieder-österreich Unclear 108 203 311
2006 GIA Out of scope Vorarlberg Unclear 58 104 162
ECObench 2010 India Online platform Unclear Out of scope Multi-Speciality Hospitals 129 307
US Aid have run a hospital benchmarking programme in India. They differentiated between small and large multi-speciality hospitals as well as public and private clinics, but there seem to be some issues with the numbers in the presentation I have.
IEA - CADDET: 'Saving energy with Energy Efficiency in Hospitals' Pre 1997 Worldwide Unclear Gross floor
area Out of scope Different countries 145 350 495 High-level world wide comparison, Large variation in electricity consumption noted, Averages presented here
Hospital with up to 250 beds 102 53 289 343 32 170 203
Hospital with 251 to 450 beds 76 67 243 309 45 172 217
Hospital with 451 to 650 beds 46 77 314 390 48 204 251
Hospitals with 651 - 1000 beds 27 78 308 386 36 230 266
More than 1000 beds 31 164 446 610 47 270 317
Herbst (after Tippköter & Schüwer) 1996 Germany On-site measurements GIA Out of scope Hospitals with 100
- 350 beds Unclear 60 225 285
Heyne (after Tippköter & Schüwer) 1998 Germany On-site measurements
Net internal floor area Out of scope Hospital (no
further details) Unclear 95 298 393 Consumption given on a per bed basis, net floor area given as 83m2/bed
Climate Zone 4B 334
Climate Zone 8 441
Energy Star 2003 US Large scale survey GIA Regression 191 620 Actual performance data from Portfolio Manager
Targeting 100! (Burpee et al. 2014 ACEEE) 2014 US Large scale survey GIA
Pass-Definition: 60% reduction by 2030
191 784 315
Targeting 100! is a US based programme to identify low cost design principles specific to acute hospitals. It is concluded from a simulation based analysis of two hospital schemes that an efficient handling of solar gains and HVAC issues generally is more important than hospital specific issues.
Energy Star 2009 Canada Large scale survey GIA Regression 150 653 Actual performance data from Portfolio Manager
CIBSE TM46 as basis for DECs ? UK ? Usable floor area ? Hospital (Clinical
and Research) Unclear 90 420 510 90 420 510
Hospital with up to 250 beds 111 120 205 325 84 145 229
251 to 1000 beds 104 115 250 365 80 175 255
More than 1000 beds 33 115 285 400 80 200 280
Mandatory sector targetsGovernment targets for the NHS 2006 UK 413 - 488 Converted from GJ/100m3; Assumed ceiling height 2.7m
Benchmarks for "Energieausweis" as prescribed by EnEV2007 and EnEv2009
Mandatory reporting
Hospitals (General Medical and Surgical)
Certification
Mandatory Disclosure
Industry Guidance
In 2009, the authors assume an average actual use of 200kWh/m2*yr for heat and 110kWh/m2*yr for the rest for the whole of Austria (apparently based on this data)
'Das energieeffiziente Krankenhaus' (Benke et al 2009) Austria
VDI 3807 Consumption given on a per bed basis, net floor area given as 83m2/bed
Pass definition: Mean of the 1st Quartile
Various Unclear
Pass definition: 50% reduction based on modelled data
Proto-typical model
Pass-Definition: 30%
Design guidance for new large acute hospitals. Developes energy performance targets based on simulation. The simulation is calibrated using data collected through various means, including a large scale survey and on-site measurements.
Based on multivariate regression
Based on multivariate regression
2007 Germany Large Scale Survey Net floor area
1999 Germany On-site measurements GIA
Industry Guidance based on simulation
ASHRAE 2010 - New built hospitals (Large Acute)
2000 - 2004 US
Publication Year of data Country Energy data source Floor area
definition
Approach for target development
Category Number of data points
Current consumption (kWh/m2*yr) Target (kWh/m2*yr)Comment
A Hospital energy use
A.2 Evidence on the relevance of different energy
end-uses in hospitals
A number of single case as well as programme based audits aiming to identify energy
conservation opportunities in hospitals are reported in the academic and practical
literature. Scope, employed methodologies and quality of the reporting vary widely;
presenting some challenges for systematic meta-analysis. Frequently, there are dif-
ferences between the reported end-uses and what is encompassed within each term
(CIBSE, 2006; Field et al., 1997, see example).
This study was interested in identifying electricity used locally as opposed to
demands for heat (often from fossil fuel) or electricity used centrally for the provision
of building services, i.e. ventilation, cooling and pumps (e.g. for hot water). End-
uses categories were therefore defined rather broad:
• Space heating and hot water: Contains all energy use for space heating
(incl. air heating) as well as the provision of both domestic hot water and hot
water used in processes such as sterilisation. In the majority of hospitals, heat
demand is met by fossil fuels rather than electricity.
• Fans, Pumps & Motors: Building-sided electricity use for ventilation fans,
compressors and pumps moving domestic hot water as well as space condition-
ing fluids. If specified, electricity use of lifts was also included in this category.
• Cooling: Electricity use for cold generation, typically through electric chillers.
• Catering: May includes kitchen appliances as well as equipment for com-
mercial food preparation (This category was found to often be poorly defined
in the primary sources, major uncertainty hence remains to what is actually
included. It was often also unclear which fuel was used in food preparation,
all was attributed to electricity in this study.)
• Lighting: All ceiling as well as task lighting.
• Small power: This category includes all plug loads, i.e. IT equipment, med-
ical equipment, supplementary heating and cooling through fans or electric
radiators. Some medical equipment, in particular major imaging and laborat-
ory equipment, operates on three phase supply. For the sake of this analysis,
those are presumably also included as small power, while the analysed primary
sources (depending on focus) hardly differentiated which medical equipment
items were included in this category.
256
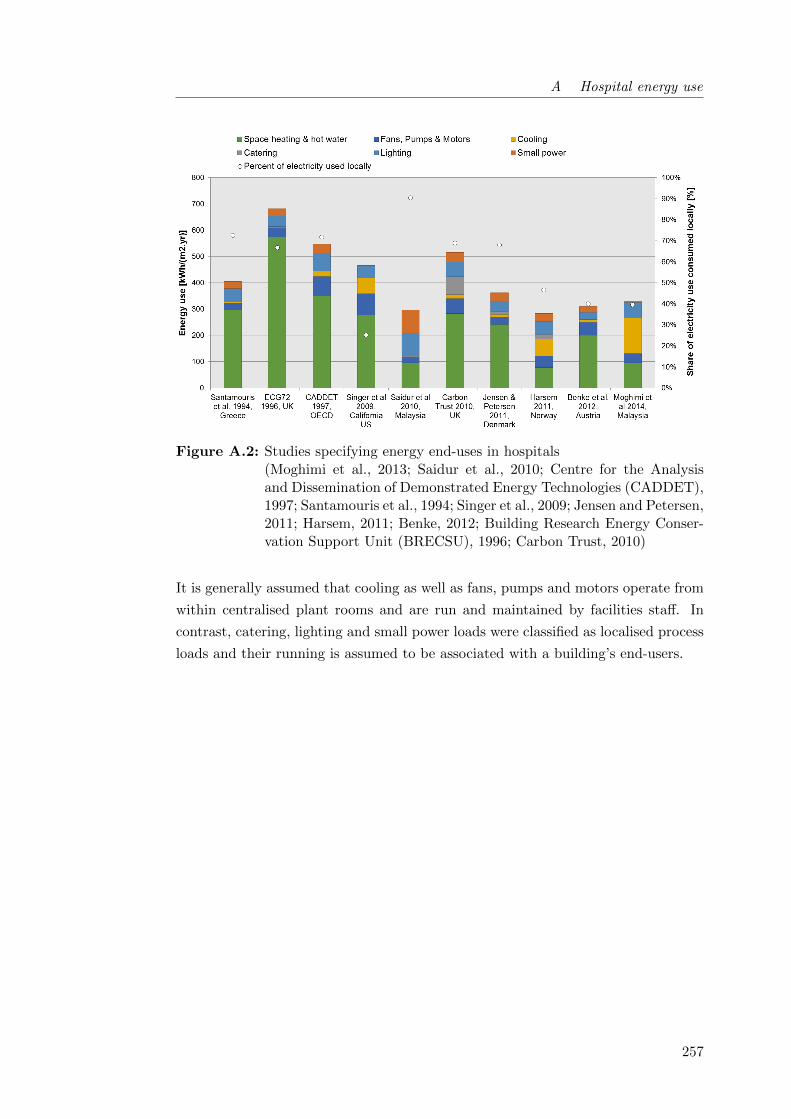
A Hospital energy use
Figure A.2: Studies specifying energy end-uses in hospitals(Moghimi et al., 2013; Saidur et al., 2010; Centre for the Analysisand Dissemination of Demonstrated Energy Technologies (CADDET),1997; Santamouris et al., 1994; Singer et al., 2009; Jensen and Petersen,2011; Harsem, 2011; Benke, 2012; Building Research Energy Conser-vation Support Unit (BRECSU), 1996; Carbon Trust, 2010)
It is generally assumed that cooling as well as fans, pumps and motors operate from
within centralised plant rooms and are run and maintained by facilities staff. In
contrast, catering, lighting and small power loads were classified as localised process
loads and their running is assumed to be associated with a building’s end-users.
257
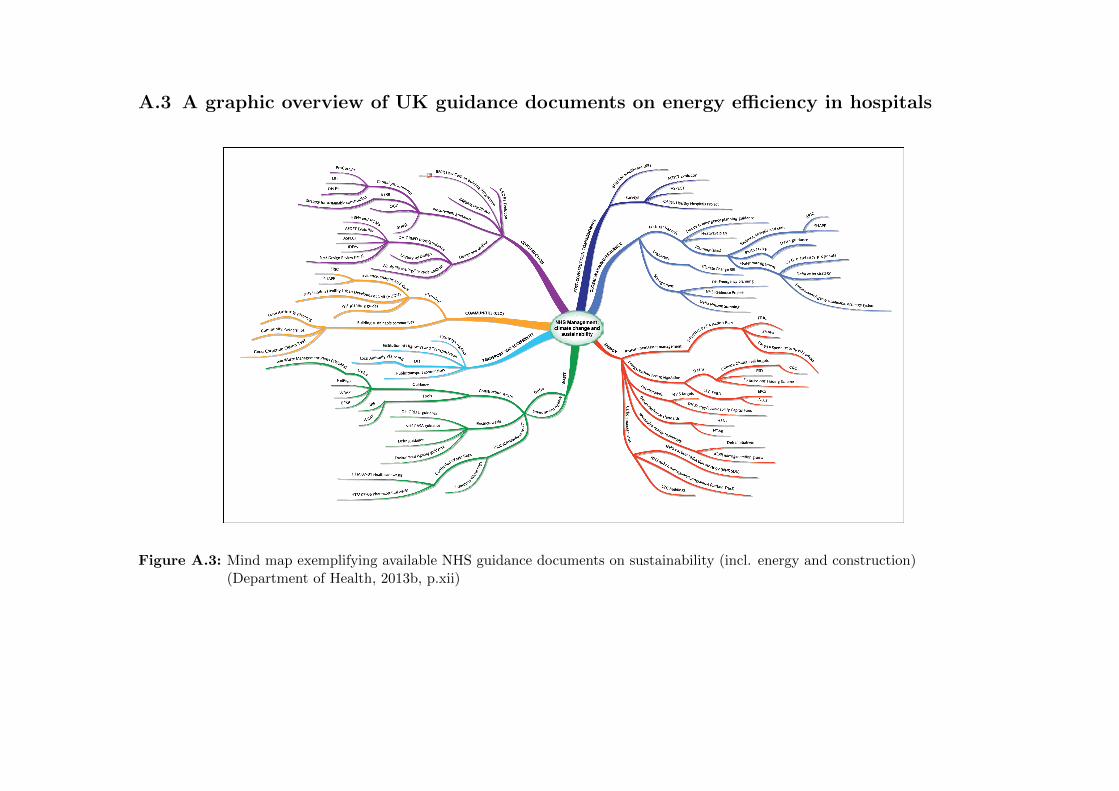
A.3 A graphic overview of UK guidance documents on energy efficiency in hospitals
Figure A.3: Mind map exemplifying available NHS guidance documents on sustainability (incl. energy and construction)(Department of Health, 2013b, p.xii)

B Supporting evidence based on
a review of the literature
This appendix provides additional detail on the available evidence literature, in
particular:
B.1 Details on a number of empirical social practices studies of non-domestic build-
ing energy use
B.2 Strategies to ensure quality in case study research and how they were applied
in this study
B.1 Empirical social practices studies of non-domestic
building energy use
Most studies within non-domestic buildings were undertaken within the context
of behaviour change interventions of some form, identifying what had worked and
what not and providing suggestions on or even assisting with the implementation of
improvements. It seemed overall that researching energy practices in a work context
adds additional complexity as opposed to studies looking at dwellings. The time
and effort required to carry out such studies is one likely reason why they have so
far primarily been restricted to PhD projects which tend to operate on longer time
frames than many other research projects within current funding arrangements. The
following paragraphs each briefly describe one relevant study.

B Supporting evidence from the literature
Based on her EngD project at Loughborough University, Christina presents a
longitudinal case analysis of a UK retailer’s organisational behavioural strategy for
energy demand reduction (Christina et al., 2015). The extensive work (131 inter-
views in total) is based on a systems approach and stands out due to the compre-
hensive involvement of staff at all organisational levels over the course of two years.
Based on initial findings on challenges associated with an energy champion system
previously in place in the shops, the project proposed a behavioural intervention
which incorporates energy management firmly into departmental job roles instead
of relying on voluntary engagement and lays out specific energy tasks rather than
abstract energy performance goals for all staff. While energy management remains
a secondary goal to the organisation and its employees, it is now seen to be aligned
with the primary organisational goals and included in the processes and practices
used to manage those primary goals. Managers further feel more comfortable talking
about how to get specific tasks completed rather than controlling energy budgets,
while other staff approve of no longer being held accountable for systemic problems
outside their control. The study stresses that this intervention ‘fits into the culture
of the stores (Christina et al., 2015, p.332)’, indicating the importance of contextual
factors.
During his PhD at the University of East Anglia, Hargreaves investigated an
environmental champion campaign in the head offices of a UK construction company
based on an ethnographic case. In Hargreaves (2011), he offers a re-interpretation
of his data through a social practices lens. Data was collected through nine months
of participant observation including the attendance of all environmental champions
meetings and events, as well as through 38 semi-structured interviews with all cham-
pions, management and technical staff and several employees whom the initiative
was seeking to influence. Hargreaves concludes that the ability of a well-informed
team ‘to challenge, let alone replace, existing and taken-for-granted practices (Har-
greaves, 2011, p.93)’ was rather limited as well as initially socially awkward. Much
discussion hence centred on how ‘stuff’ associated with working practices might be
replaced with more pro-environmental alternatives. Over time and as it were ‘from
the inside out (p.94)’, the initiatives did however give rise to a new identity of an ‘en-
vironmental employee’ in making low carbon routines part of the organisation’s un-
written set of rules. This suggested that social modelling campaigns may be related
in particular to the ‘institutionalised knowledge’ element of the practices framework.
260
B Supporting evidence from the literature
A third PhD project, by Dantsiou at Cambridge University, explores the effects
of energy feedback in university offices on comfort seeking practices (Dantsiou and
Sunikka-Blank, 2015). An environmental consultancy had organised a behavioural
intervention displaying the sub-metered electricity consumption of different office
spaces in real-time and encouraged the employees to compete for energy savings.
Dantsiou collates semi-structured interviews with, and comfort diaries of the work-
place users, while quantitatively measuring temperature and humidity in seven of-
fices. Similarly to Hargreaves (2011), Dantsiou and Sunikka-Blank (2015) are scep-
tical about the potential of the feedback intervention in changing energy use and
comfort practices. They conclude that in the absence of financial incentives to save
energy (typical for work as opposed to home environments) and in the face of techno-
logical challenges resulting in limited cooling control, seeking comfort was a priority
for employees. In shared offices, thermal comfort preferences are however found to
be collectively shaped in order to avoid conflicts with colleagues. Social dynamics
proved important, suggesting that collective pro-environmental attitudes based on
a green organisational identity may be more effective in reducing energy use than
energy competitions.
B.2 Strategies to ensure quality in case study research
Case study research has in the past often been criticised for a lack of analytical
rigour (Gray, 2004). A number of strategies are hence applied in this study to
ensure quality, as conceptualised through the four elements external, measurement
and internal validity as well as reliability (Bryman, 2012, p.47):
• External validity during the research design phase: External valid-
ity (i.e. the relevance of findings beyond the specific research context) can
in multiple case study designs be shown through the replication of findings
across different cases. In this study, it is hypothesised on the basis of literat-
ure review and scoping activities that the extent of clinical staff’s influence on
electricity use will depend on infrastructural arrangements, in particular con-
trol interfaces for building services, and the nature of departmental processes
defining electricity requirements and operating hours. Each of these factors is
replicated in the study design as basis for a potential replication of findings:
infrastructural features across different departments within the same hospital
and process elements within the same department type across different hospit-
als (see Figure 3.1).
261

B Supporting evidence from the literature
• Reliability during data collection: Reliability refers to the consistency
with which a concept is measured. To ensure reliability during data collection,
a protocol outlining fieldwork procedures is put in place. It encompasses the
following elements:
– Obtain authorisation for fieldwork through facilities management of each
hospital
– Acquire hospital wide policy documents, information on IT procedures,
etc.
– Collect electricity consumption data for departments of interest (see sec-
tion 3.4.2.1)
– Establish contact with departmental manager to obtain authorisation for
fieldwork
– Guided walk through to understand departmental process and boundaries
– Inform the team about upcoming visit of the researcher (through clinical
lead, bulletin)
– Data collection using quantitative and qualitative data as detailed in sec-
tion 3.4
– Data analysis as detailed in section 3.5
Research, especially in the real-world context, is an iterative process (Gray,
2004) and despite the initial pilot testing of data collection instruments some
improvements to the protocol could be incorporated during the fieldwork phase.
Such changes included for instance the additional measurement of lighting
levels to obtain more detailed duration of use information for lighting in some
departments, or the tightening of the interview guide for the third hospital
by removing lines of enquiry which had not proved productive. With any
iteration, great care is taken not to introduce bias into the collected data.
• Measurement or construct validity during data collection and ana-
lysis: Construct validity refers to the degree to which a measure of a concept
really does reflect the concept. Mono-method bias has been described as a
major threat to measurement validity (Tashakkori and Teddlie, 1998, p.40);
avoided in this study through the triangulation of various sources of evidence
describing for example the duration of use of building services and appliances.
Details on the mixed methods approach are described in section 3.4. The con-
cepts of a theoretical and an actual energy savings potential is developed based
on established methods in the field and discussed with experts from various
disciplines to ensure methodological soundness.
262

B Supporting evidence from the literature
• Internal validity during data analysis: Internal validity relating mainly to
the correct attribution of causality was in this study primarily ensured through
pattern matching across different departments. Potential rival explanations
for observed differences in savings potentials across different departments were
also addressed through contextualising them within building and department
type.
263


C Data collection instruments
This appendix provides additional detail on the data collection instruments employed
throughout this study:
C.1 Tools used and records kept during the lighting and appliance audits on the
ground
C.2 Interview guide for semi-structured interviews with clinical staff (including scales
used as prompt)
C.3 Study information sheet and informed consent form utilized during interviewing
C.1 Lighting and appliance audit
Figure C.1 shows a completed example of how data was recorded during the room to
room inspection of hospital departments. Floor plans obtained from the hospital fa-
cility department were used to reflect the spatial distribution of lighting installations
and record building services and control infrastructures for each room (Table C.1).
Equipment items and their reported durations of use were noted as seperate lists in
the fieldwork book.
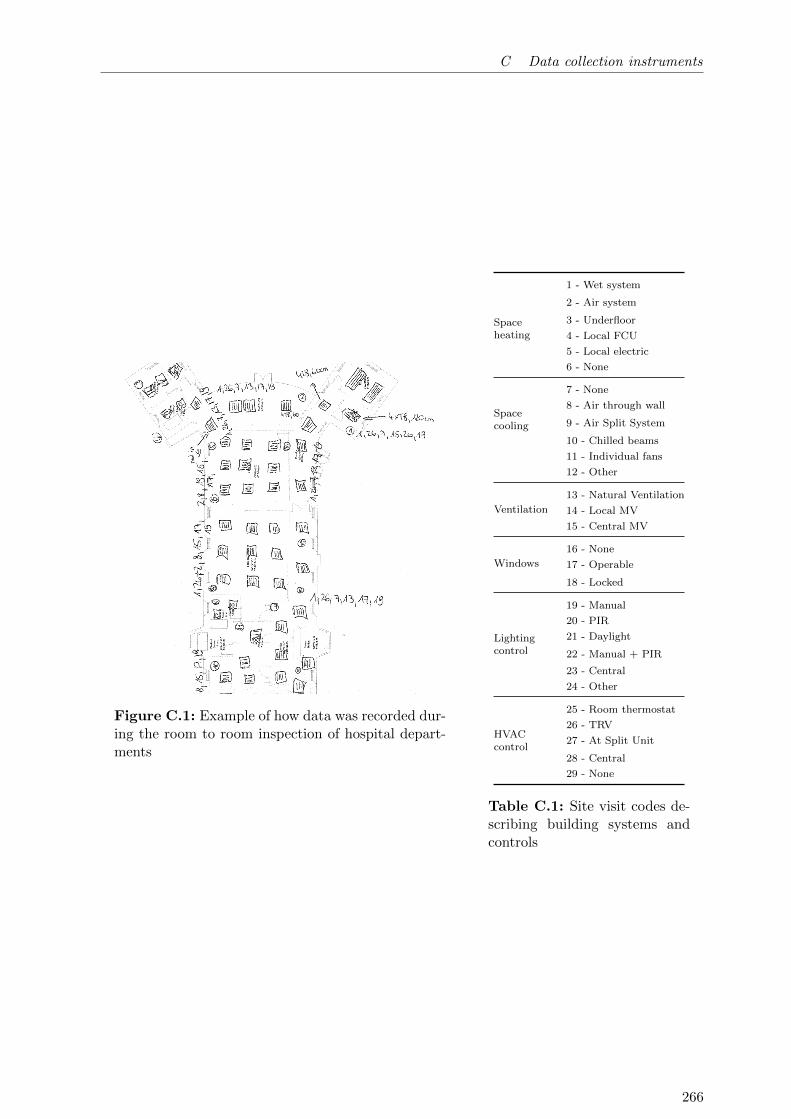
C Data collection instruments
Figure C.1: Example of how data was recorded dur-ing the room to room inspection of hospital depart-ments
Spaceheating
1 - Wet system
2 - Air system
3 - Underfloor
4 - Local FCU
5 - Local electric
6 - None
Spacecooling
7 - None
8 - Air through wall
9 - Air Split System
10 - Chilled beams
11 - Individual fans
12 - Other
Ventilation
13 - Natural Ventilation
14 - Local MV
15 - Central MV
Windows
16 - None
17 - Operable
18 - Locked
Lightingcontrol
19 - Manual
20 - PIR
21 - Daylight
22 - Manual + PIR
23 - Central
24 - Other
HVACcontrol
25 - Room thermostat
26 - TRV
27 - At Split Unit
28 - Central
29 - None
Table C.1: Site visit codes de-scribing building systems andcontrols
266
C Data collection instruments
C.2 Interview guide
Please find below the interview guide as utilised for the semi-structured interviews
with clinical staff. During the second phase of the fieldwork, namely the investigation
at KCH, questions which had so far not resulted productive with respect to the
research question were removed from the interview guide in order to not take up too
much of the participant’s time given its shortage in hospitals. Such questions are
marked here with (*). The scales used as visual prompts to elicit numerical ratings
are shown in Figure C.2.
Briefing
• ‘The aim of my research is to get a better idea of what energy is used for in
different hospital areas and why.’
• Confirm information on interviewee (Position)
• Let them sign the informed consent form (see Figure C.4).
Personal experience in the department/on the ward
• How long have you been working in this department?
– Have you worked here in winter/summer?
• Could you please describe to me how a typical day looks here for you?
– What do you spend most of your time doing?
– How long do you spend directly in contact with your patients?
– How much administrative work do you have to do?
• Could you tell me a bit about your experience of working here?
– (*) What do you like/dislike about the department / work environment?
– Are there any particular aspects of the building you like or dislike? Maybe
you can tell me a bit more about them.
Area description
• Overall, how could the function of the department best be described?
– Clarify whether the previous understanding was correct
– Establish what the interviewee regards as their normal work area
• What are the operating hours of this department?
267
C Data collection instruments
– During the week? On a weekend?
– Are there any days when the area is used less than usual?
– Are there any days when areas that are normally not used are used for
something?
– Are there any times during the day, when there is more activity in the
department / it tends to be quieter?
• (Do you know) When is the area being cleaned?
– Is that every day?
Lighting
• Let’s talk a little bit about the lighting in your normal work area. I brought
a scale in order to help us do that. [Show scale C.2a] Which number on this
scale describes best how you feel about the lighting in your normal work area?
Do you think it is 1 - ’Unsatisfactory?’? Or 7 - ’Satisfactory’? Or somewhere
in between?
– Can you briefly explain to me why you chose this rating?
∗ Too little / too much artificial light?
∗ Too dark / bright in some areas? Glare from lights?
• Thank you for that. I have brought a second scale here. [Show scale C.2b]
This one asks: How much control do you personally have over the lighting in
your normal work area? And by control I mean, can you influence the state of
the lights? Do you have 1 - ’No control’ or up to 7 - ’Full control’?
– Again, why did you choose this rating?
– How are the lights controlled? / I understand that the main ceiling lights
in this area are controlled <so-and-so>. Is that correct?
∗ Is that the case for all rooms in this department?
– If manual light switches:
∗ How often do you operate the switches of the main lights?
∗ If never or very seldom, why not?
∗ When you begin/end work/your shift is the light normally on / off?
– If occupancy sensors:
∗ How well do you feel the automatic sensors control the lights?
268
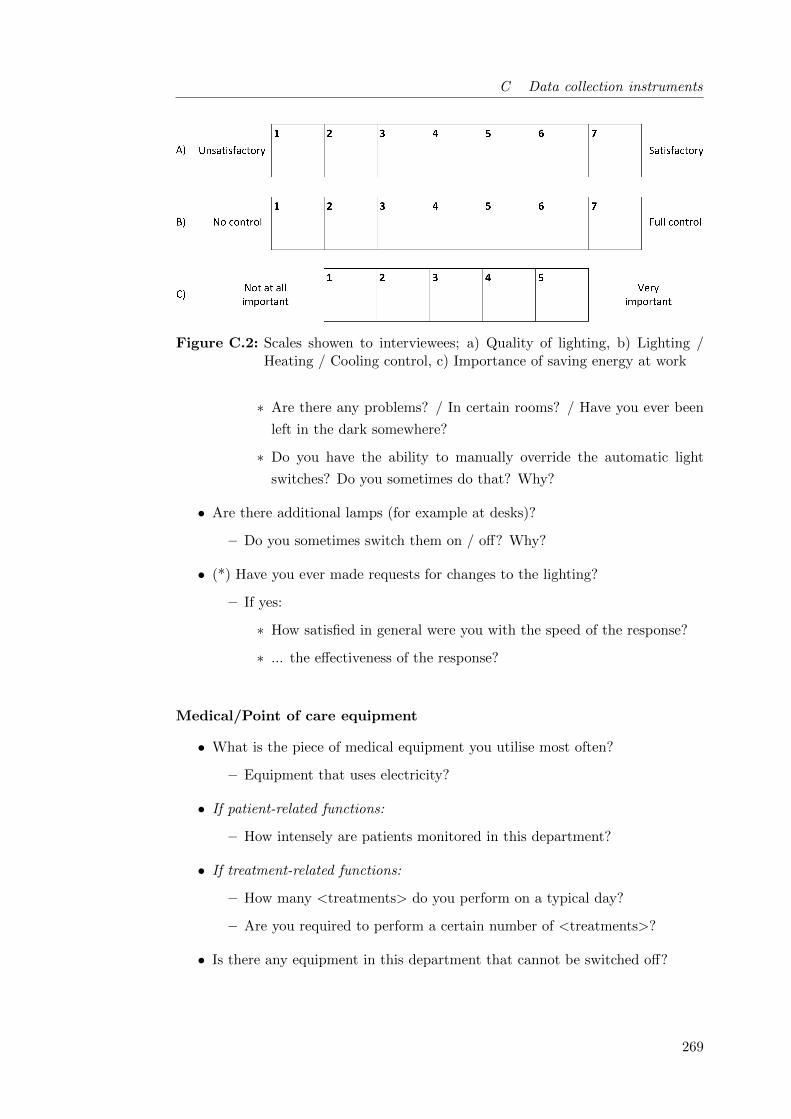
C Data collection instruments
Figure C.2: Scales showen to interviewees; a) Quality of lighting, b) Lighting /Heating / Cooling control, c) Importance of saving energy at work
∗ Are there any problems? / In certain rooms? / Have you ever been
left in the dark somewhere?
∗ Do you have the ability to manually override the automatic light
switches? Do you sometimes do that? Why?
• Are there additional lamps (for example at desks)?
– Do you sometimes switch them on / off? Why?
• (*) Have you ever made requests for changes to the lighting?
– If yes:
∗ How satisfied in general were you with the speed of the response?
∗ ... the effectiveness of the response?
Medical/Point of care equipment
• What is the piece of medical equipment you utilise most often?
– Equipment that uses electricity?
• If patient-related functions:
– How intensely are patients monitored in this department?
• If treatment-related functions:
– How many <treatments> do you perform on a typical day?
– Are you required to perform a certain number of <treatments>?
• Is there any equipment in this department that cannot be switched off?
269

C Data collection instruments
– Why not? (Policy, Calibration, ...)
• Is someone responsible for switching off all other equipment when it is not in
use? At the end of the day?
IT equipment
• You mentioned that you spend <so and so long> doing administrative work.
/ Do you spend much of your time doing administrative work?
• Do you have your own computer? / Between how many staff do you share a
computer?
• Do you usually power down the computer after you finish using it?
– If not, why not?
– What happens at the end of the day?
– Are / Could the computers be powered-down automatically?
• If the department has other IT equipment:
– Explore the use of printers, fax, etc.
– Investigate whether the equipment has sleep mode / is being switched off
– Is someone responsible for powering down equipment?
Supplementary heating/cooling
• How well do you feel is the heating working in this department generally?
• During winter, do you ever feel ’Too cold’ or ’Much too cold’ here?
– If yes:
∗ What do you do to get warmer?
∗ Are any supplementary heaters used in the department?
∗ If not, why not? (Policy?)
– Do you sometimes feel ’Too warm’ or ’Much too warm’ in winter?
– Could it be cooler? / Would it bother (you or) the patients if it were
cooler?
– Is it too hot now?
• In summer, do you ever feel ’Too warm’ or ’Much too warm’?
– If too warm/much too warm:
270
C Data collection instruments
∗ How do you cool it down?
∗ Explore use of fans, opening windows, portable air conditioning.
• How much control do you personally have over the heating?
– 1 - ’No control’, 7 - ’Full control’ [Show scale C.2b]
– !!! Check & if necessary prompt if answers refer to temperature control
rather than heating control
• How much control do you personally have over the air conditioning?
– 1 - ’No control’, 7 - ’Full control’ [Show scale C.2b]
• (*) Have you ever made requests for changes to the heating (and/or air-
conditioning/cooling)?
– If yes:
∗ How satisfied in general were you with the speed of the response?
∗ ... the effectiveness of the response?
(*) Abnormalities in the electricity use profile
This section will only be asked if particularities were found in the profile and was
omitted entirely during the second phase of the investigation.
• This is the profile of how electricity is being used in this department. The use
has been averaged across all days / weekdays / weekend days during the last
month.
– I was just wondering, whether you had any idea what could be going on...
– I also noticed that...
Ecological values (also compared to others)
• What are your views in general about being green and saving energy?
– What do you do to be green?
– How do you save energy?
– Explore actions at home
• At your workplace, how important is saving energy for you, on a scale of 1 to
5, with 1 being ’Not at all important’ and 5 being ’Very important?’ [Show
scale C.2c)]
– Can you briefly explain to me why you chose this rating?
271
C Data collection instruments
• Do you think your colleagues and other people around here would say the
same?
– Are they more/less keen on sustainability?
– Is being green something that comes up much in conversation? Why
(not)?
Ideas on how to save energy
The questions in and the structure of this section are fairly open and the interviewer
needs to respond flexibly to informant and prior information.
• What do you think, could the department reduce its power use? How?
– Explore ideas for change, what could be done differently
– What are trade-offs, reasons for current ways of doing things
– What would need to happen for you to take these actions?
• Explore issues of constrains and enablement, prefiguration
– Does the set-up of the department help you not to waste energy?
– Does anything in the physical arrangements of this department keep you
from saving energy / being green?
Close
• Explain when we might next be in touch and leave contact details for them.
• Thank them for their time and help.
C.3 Informed consent form
Obtaining written informed consent from research participants is good practice and
ensures that the rights of participants are respected throughout the research process.
This project has been approved by the UCL Research Ethics Committee (Project ID:
5434/001). In accordance with the Data Protection Act 1998, this study is further
registered with UCL Data Protection (Z6364106/2013/05/59). Please see below for
the project information sheet (Figure C.3) and the consent form (Figure C.4) used
in this study. The filled consent forms from all research participants are kept in a
locked drawer. The following final report on the project was submitted to the UCL
Research Ethics Committee:
272

C Data collection instruments
Final project report to ethics committee
For my PhD project entitled ‘Understanding hospital electricity use: an end-use(r)
perspective’ I have carried out 22 interviews with NHS clinical staff in 10 depart-
ments of 3 London hospitals. In addition, I have carried out a number of more
informal conversations in the main theatres of one of those hospitals where staff
found it difficult to make time for the formal interviewing process. All interviewees
were given information about the project as well as a hand-out including my contact
details and provided written informed consent prior to the interview.
No major ethical issues arose during the interviews. In one case, a staff nurse vo-
lunteered to be interviewed but withdrew after being informed in more detail about
the procedure and the purpose of the project. On three occasions, staff had to be
interviewed in the presence of others because no separate facilities were available
to carry out the interview in private. Staff were explicitly asked whether they felt
comfortable carrying out the interview under these circumstances or whether they
preferred to rearrange which they did not wish to do. It is appreciated that this may
not be ideal neither from an ethical nor from an analytical perspective but could -
given the constraints on NHS staff and facilities - not be avoided.
As for the informal conversations in the theatre department, the presence of the
researcher was authorized by the head of the department. All members of staff
were informed by him about the upcoming visit of the researcher and the purpose
of the project. In addition, handouts were displayed on the information board of
the theatre one week before the visit. Theatre staff were free to speak or not to
speak to the researcher who always identified herself and explained the purpose of
the project before asking any questions. Their statements remain anonymous and
are more isolated, this will be considered during analysis.
Overall, a major challenge for most employees was to find time to participate in
the interviews. Often their speaking to the researcher resulted in an absence which
had to be covered for by other members of their team. It was hence considered
appropriate to not only thank the interviewee for their participation through a piece
of cake but to also bring some sweets for the rest of the team. These little gestures
of acknowledgement were generally well received.
273
C Data collection instruments
The data collection phase of the project has now been completed. In a next step,
the collected data will be analysed and interview data will be viewed in the context
of other strands of data collected through facility audits, technical measurements
and document analysis.
274

C Data collection instruments
Figure C.3: Informed consent: a) Interview Information Sheet
275

C Data collection instruments
Figure C.4: Informed consent: b) Interview Consent Form
276
D Data analysis process
This appendix gives an insight in the analysis process, by exemplifying the type
of records kept in the process. D.1 is at the core of the bottom-up representation
of electricity use in quantitative analysis, while D.2 - D.4 are associated with the
qualitative analysis process:
D.1 List of all lighting and equipment item encountered in the case study depart-
ments
D.2 Example of the cross-tabulation of interview information as basis for quantit-
ative modelling
D.3 Example of an interview transcript
D.4 Excerpt from the analytical research notes kept during qualitative data analysis
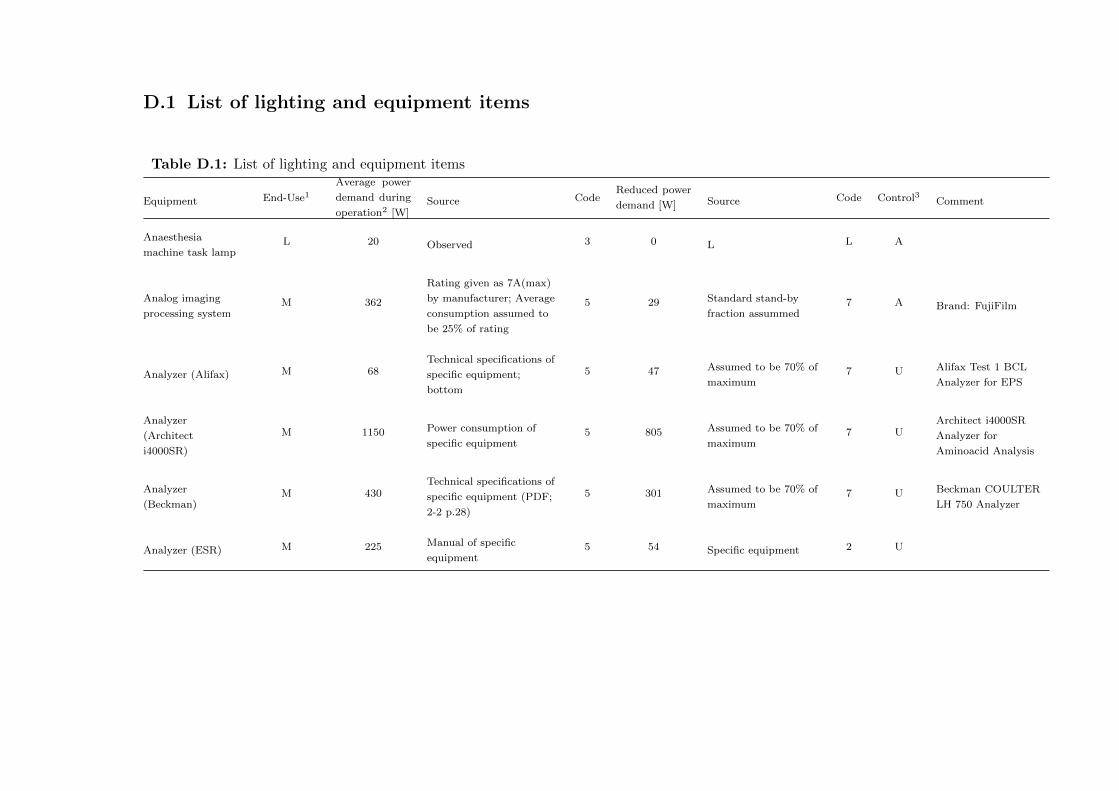
D.1 List of lighting and equipment items
Table D.1: List of lighting and equipment items
Equipment End-Use1
Average power
demand during
operation2 [W]Source Code
Reduced power
demand [W] Source Code Control3 Comment
Anaesthesia
machine task lampL 20 Observed 3 0 L L A
Analog imaging
processing systemM 362
Rating given as 7A(max)
by manufacturer; Average
consumption assumed to
be 25% of rating
5 29 Standard stand-by
fraction assummed7 A Brand: FujiFilm
Analyzer (Alifax) M 68Technical specifications of
specific equipment;
bottom
5 47 Assumed to be 70% of
maximum7 U Alifax Test 1 BCL
Analyzer for EPS
Analyzer
(Architect
i4000SR)
M 1150 Power consumption of
specific equipment5 805 Assumed to be 70% of
maximum7 U
Architect i4000SR
Analyzer for
Aminoacid Analysis
Analyzer
(Beckman)M 430
Technical specifications of
specific equipment (PDF;
2-2 p.28)
5 301 Assumed to be 70% of
maximum7 U Beckman COULTER
LH 750 Analyzer
Analyzer (ESR) M 225 Manual of specific
equipment5 54 Specific equipment 2 U

Table D.1: List of lighting and equipment items (continued)
Equipment End-Use
Average power
demand during
operation [W]Source Code
Reduced power
demand [W] Source Code Control Comment
Analyzer
(LIAISON by
DiaSorin)
M 350 Power in use given as
1.5kW (kWh?)(Interval?)4 28 % of active 6 U
Analyzer
(Olympus
AU2700)
M 1350 Equipment specs; external 6 945 Assumed to be 70% of
maximum7 U
Analyzer
(Olympus AU640)M 900 Equipment specs; external 5 630 Assumed to be 70% of
maximum7 U
Analyzer (Ortho
AutoVue Innova)M 476 Technical specification of
specific equipment5 333 Assumed to be 70% of
maximum7 U
Ortho AutoVue Innova
analyzer for blood
groups
Analyzer (Siemens
Advia 2120
Haematology)
M 311 Maximum according to
manufacturer5 25 % of active 7 U
Analyzer (Siemens
Advia 2400)M 400 Power in use given
(Interval?)5 64 % of active 7 U
Analyzer (Siemens
Advia Centaur
XP)
M 375 Power in use given as
1.5kW (kWh?)(Interval?)5 30 % of active 7 U
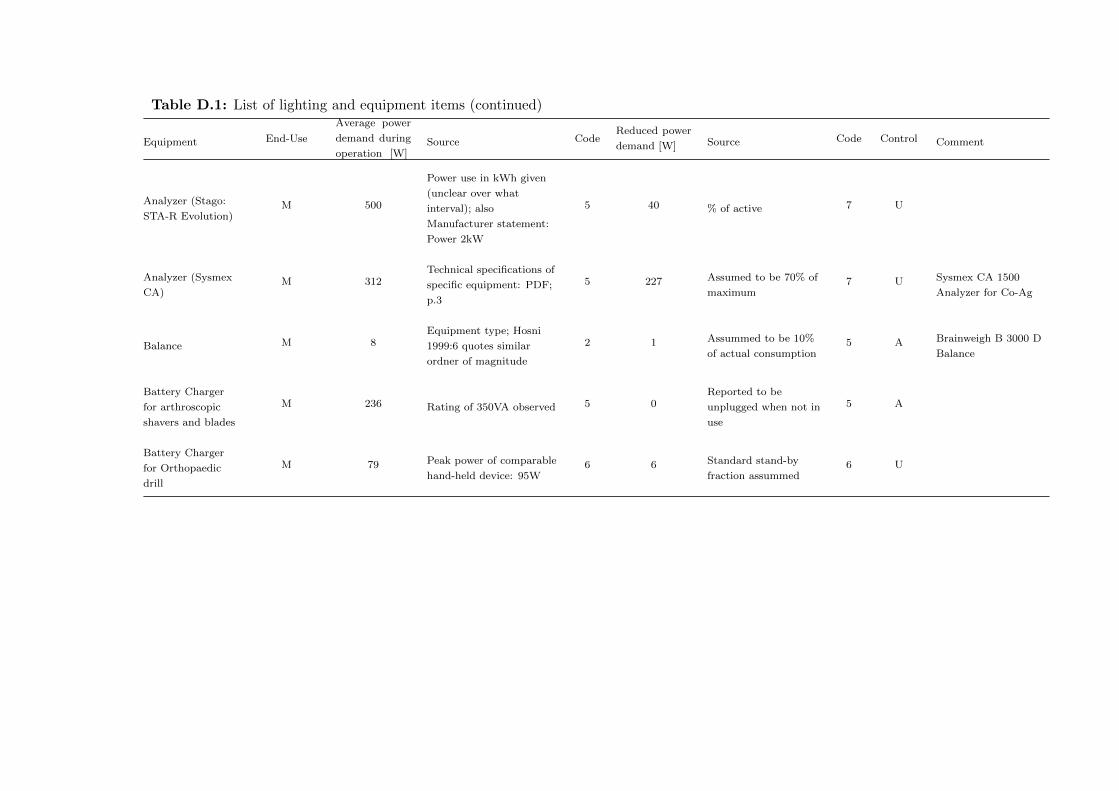
Table D.1: List of lighting and equipment items (continued)
Equipment End-Use
Average power
demand during
operation [W]Source Code
Reduced power
demand [W] Source Code Control Comment
Analyzer (Stago:
STA-R Evolution)M 500
Power use in kWh given
(unclear over what
interval); also
Manufacturer statement:
Power 2kW
5 40 % of active 7 U
Analyzer (Sysmex
CA)M 312
Technical specifications of
specific equipment: PDF;
p.3
5 227 Assumed to be 70% of
maximum7 U Sysmex CA 1500
Analyzer for Co-Ag
Balance M 8Equipment type; Hosni
1999:6 quotes similar
ordner of magnitude
2 1 Assummed to be 10%
of actual consumption5 A Brainweigh B 3000 D
Balance
Battery Charger
for arthroscopic
shavers and blades
M 236 Rating of 350VA observed 5 0Reported to be
unplugged when not in
use
5 A
Battery Charger
for Orthopaedic
drill
M 79 Peak power of comparable
hand-held device: 95W6 6 Standard stand-by
fraction assummed6 U

Table D.1: List of lighting and equipment items (continued)
Equipment End-Use
Average power
demand during
operation [W]Source Code
Reduced power
demand [W] Source Code Control Comment
Bedpan washer M 1800
No details for specific
equipment; General
numbers: 0.16kWh/cycle;
0.3kWh/cycle - Capacity
of washer: 4 bedpans; 29
patients on ward –> 7
cycles per day assummed;
Cycle time 10min
4 0Power estimate based
on energy use; no
stand-by assummed
7 A
Bedside
entertainment unitIT 30 HOSPICOM unit 5 2 Standard stand-by
fraction assummed7 No
Under patient control;
use will depend on
patient
Blood Gas
AnalyzerM 40
3.4kWh/week according to
Christiansen et al. (2015):
Assumed to be on 12
hours a day
3 3 % of active 7 U
Centrifuge;
tempererd
(Eppendorf 5702)
M 140
70% of specified maximum
power requirement (Hosni
1999 for lab equipment <
1000W)
3 14
10% of active
consumption
assummed during
stand-by
5 A
Centrifuge;
tempererd
(eppendorf 5804)
M 450 Specific equipment;
Average consumption5 0 No stand-by 7 A
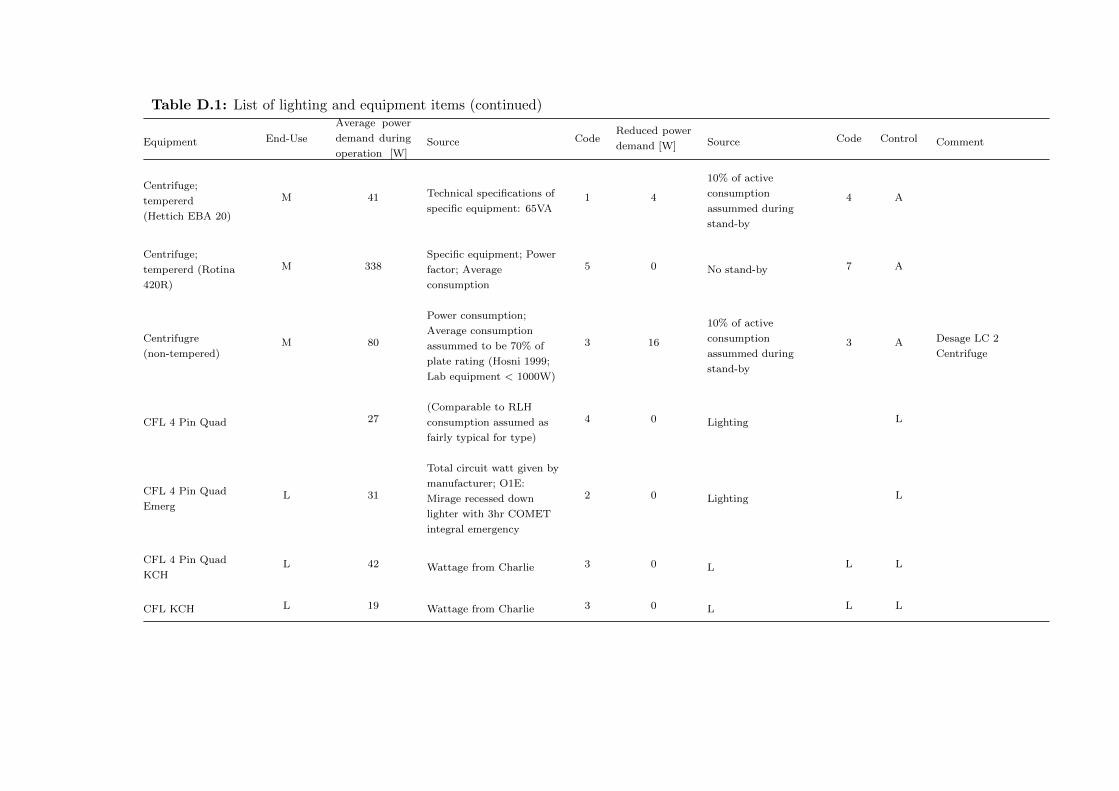
Table D.1: List of lighting and equipment items (continued)
Equipment End-Use
Average power
demand during
operation [W]Source Code
Reduced power
demand [W] Source Code Control Comment
Centrifuge;
tempererd
(Hettich EBA 20)
M 41 Technical specifications of
specific equipment: 65VA1 4
10% of active
consumption
assummed during
stand-by
4 A
Centrifuge;
tempererd (Rotina
420R)
M 338Specific equipment; Power
factor; Average
consumption
5 0 No stand-by 7 A
Centrifugre
(non-tempered)M 80
Power consumption;
Average consumption
assummed to be 70% of
plate rating (Hosni 1999;
Lab equipment < 1000W)
3 16
10% of active
consumption
assummed during
stand-by
3 A Desage LC 2
Centrifuge
CFL 4 Pin Quad 27(Comparable to RLH
consumption assumed as
fairly typical for type)
4 0 Lighting L
CFL 4 Pin Quad
EmergL 31
Total circuit watt given by
manufacturer; O1E:
Mirage recessed down
lighter with 3hr COMET
integral emergency
2 0 Lighting L
CFL 4 Pin Quad
KCHL 42 Wattage from Charlie 3 0 L L L
CFL KCH L 19 Wattage from Charlie 3 0 L L L
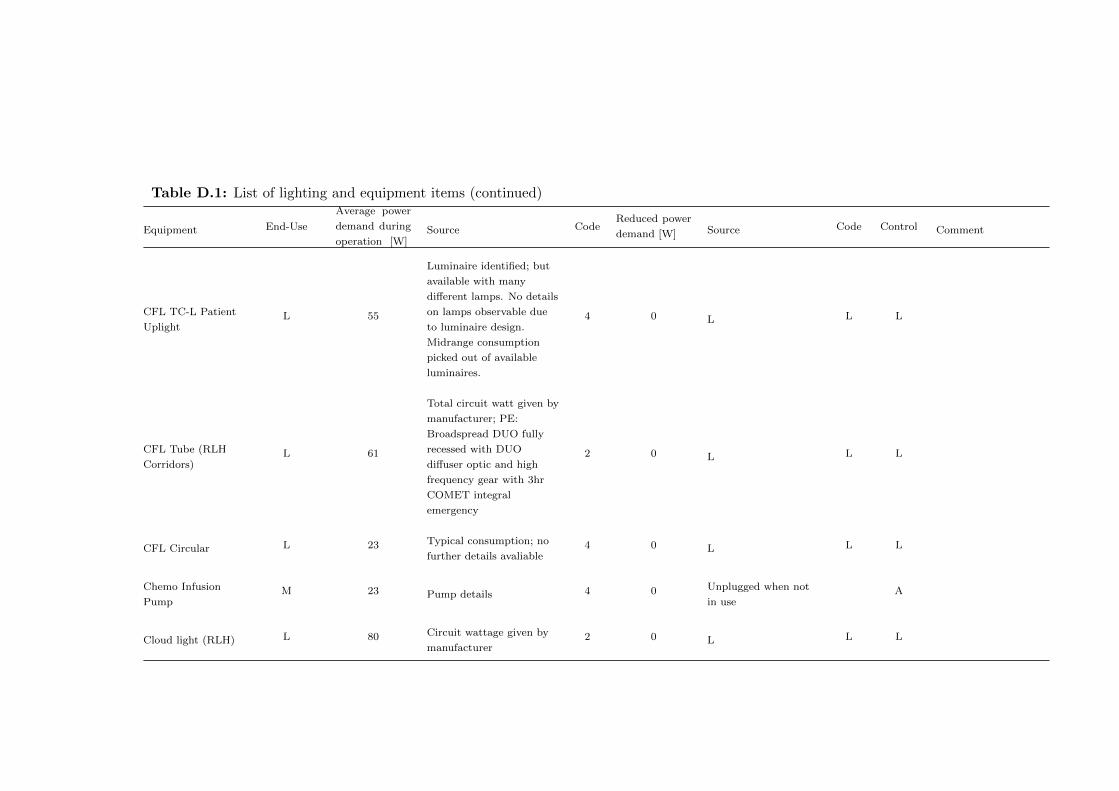
Table D.1: List of lighting and equipment items (continued)
Equipment End-Use
Average power
demand during
operation [W]Source Code
Reduced power
demand [W] Source Code Control Comment
CFL TC-L Patient
UplightL 55
Luminaire identified; but
available with many
different lamps. No details
on lamps observable due
to luminaire design.
Midrange consumption
picked out of available
luminaires.
4 0 L L L
CFL Tube (RLH
Corridors)L 61
Total circuit watt given by
manufacturer; PE:
Broadspread DUO fully
recessed with DUO
diffuser optic and high
frequency gear with 3hr
COMET integral
emergency
2 0 L L L
CFL Circular L 23 Typical consumption; no
further details avaliable4 0 L L L
Chemo Infusion
PumpM 23 Pump details 4 0 Unplugged when not
in useA
Cloud light (RLH) L 80 Circuit wattage given by
manufacturer2 0 L L L

Table D.1: List of lighting and equipment items (continued)
Equipment End-Use
Average power
demand during
operation [W]Source Code
Reduced power
demand [W] Source Code Control Comment
Cold room M 228Double of the electricity
consumption benchmark
for cold storage
7 228 Always on 7 No
Commercial
microwaveC 373 Specific equipment 5 2
Menezes et al 2014;
p.80 Stand-by mode
(Stand-by of
commercial microwave
assummed to be
similar to normal
microwave)
3 A
Convective warmer
(Bair Hugger)M 380 Measured by Tom Pierce 2 0
Reported to be
unplugged when not in
use
5 A
Cooling fan LHC 500 Rating of 1000W observed 5 0 No stand-by 2 A
Daikin Split Unit LHC 750
Reported for the Daikin
Units at KCH (Norton);
Slightly above
measurement
5 150 Measured at KCH Day
Care1 B Potentially
overestimating use
Datex Ohmeda
Aespire View
Anaesthetic
machine
M 110
No details available;
machines seems to be
between Drager Fabius
Trio and Drager Primus in
size
5 9 % of active 7 A
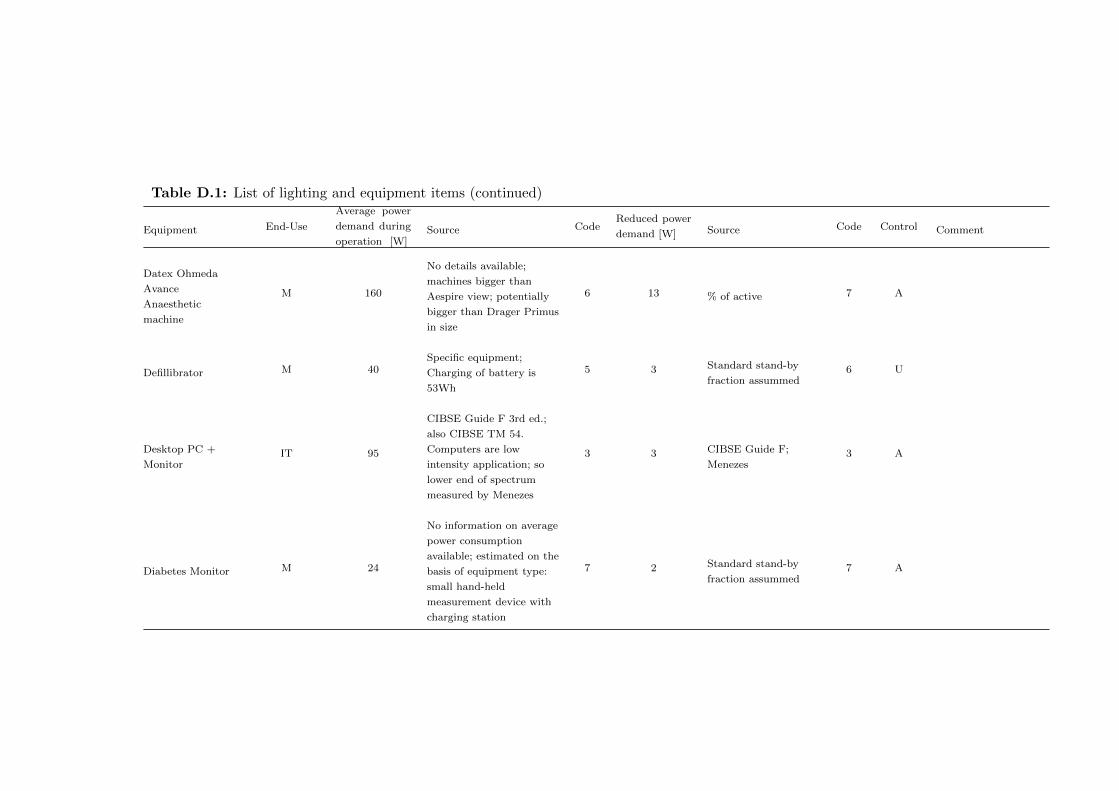
Table D.1: List of lighting and equipment items (continued)
Equipment End-Use
Average power
demand during
operation [W]Source Code
Reduced power
demand [W] Source Code Control Comment
Datex Ohmeda
Avance
Anaesthetic
machine
M 160
No details available;
machines bigger than
Aespire view; potentially
bigger than Drager Primus
in size
6 13 % of active 7 A
Defillibrator M 40Specific equipment;
Charging of battery is
53Wh
5 3 Standard stand-by
fraction assummed6 U
Desktop PC +
MonitorIT 95
CIBSE Guide F 3rd ed.;
also CIBSE TM 54.
Computers are low
intensity application; so
lower end of spectrum
measured by Menezes
3 3 CIBSE Guide F;
Menezes3 A
Diabetes Monitor M 24
No information on average
power consumption
available; estimated on the
basis of equipment type:
small hand-held
measurement device with
charging station
7 2 Standard stand-by
fraction assummed7 A

Table D.1: List of lighting and equipment items (continued)
Equipment End-Use
Average power
demand during
operation [W]Source Code
Reduced power
demand [W] Source Code Control Comment
Dialysis machine M 525
Based on Measurements
were taken at Maidstone
renal unit (East Kent
Hospitals University NHS
Foundation Trust)
between 03/06/2010 to
15/06/2010. By Fraser
Campbell; Renal
technician
3 42
Are normally switched
off entirely according
to technician to avoid
water problem; about
8% are left in stand-by
3 C
Dinamap Patient
MonitorM 9 12W rated according to
manufacturer5 1
% of active;
manufacturer advice is
to always keep plugged
in to safe battery
7 A
Dish washer;
commercialC 425
Total connected load
1.7kW; Average power use
of 50% assumed
5 34 Standard stand-by
fraction assummed6 No Domestic staff
Draeger Fabious
Trio Anaesthetic
machine
M 93Manufacturer
specifications + 30W for a
monitor
4 7 % of active 5 A
Draeger Primus
Anaesthetic
machine
M 130 Hinz et al. (2012) 2 10 % of active 5 A
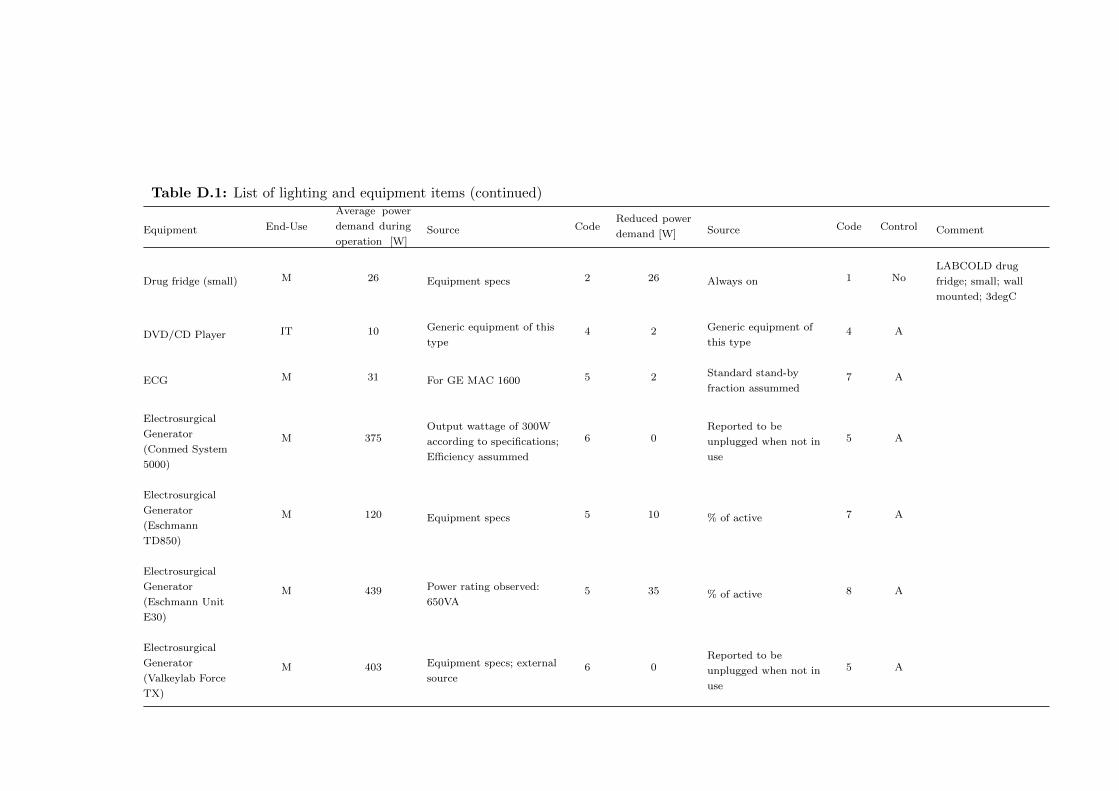
Table D.1: List of lighting and equipment items (continued)
Equipment End-Use
Average power
demand during
operation [W]Source Code
Reduced power
demand [W] Source Code Control Comment
Drug fridge (small) M 26 Equipment specs 2 26 Always on 1 NoLABCOLD drug
fridge; small; wall
mounted; 3degC
DVD/CD Player IT 10 Generic equipment of this
type4 2 Generic equipment of
this type4 A
ECG M 31 For GE MAC 1600 5 2 Standard stand-by
fraction assummed7 A
Electrosurgical
Generator
(Conmed System
5000)
M 375Output wattage of 300W
according to specifications;
Efficiency assummed
6 0Reported to be
unplugged when not in
use
5 A
Electrosurgical
Generator
(Eschmann
TD850)
M 120 Equipment specs 5 10 % of active 7 A
Electrosurgical
Generator
(Eschmann Unit
E30)
M 439 Power rating observed:
650VA5 35 % of active 8 A
Electrosurgical
Generator
(Valkeylab Force
TX)
M 403 Equipment specs; external
source6 0
Reported to be
unplugged when not in
use
5 A
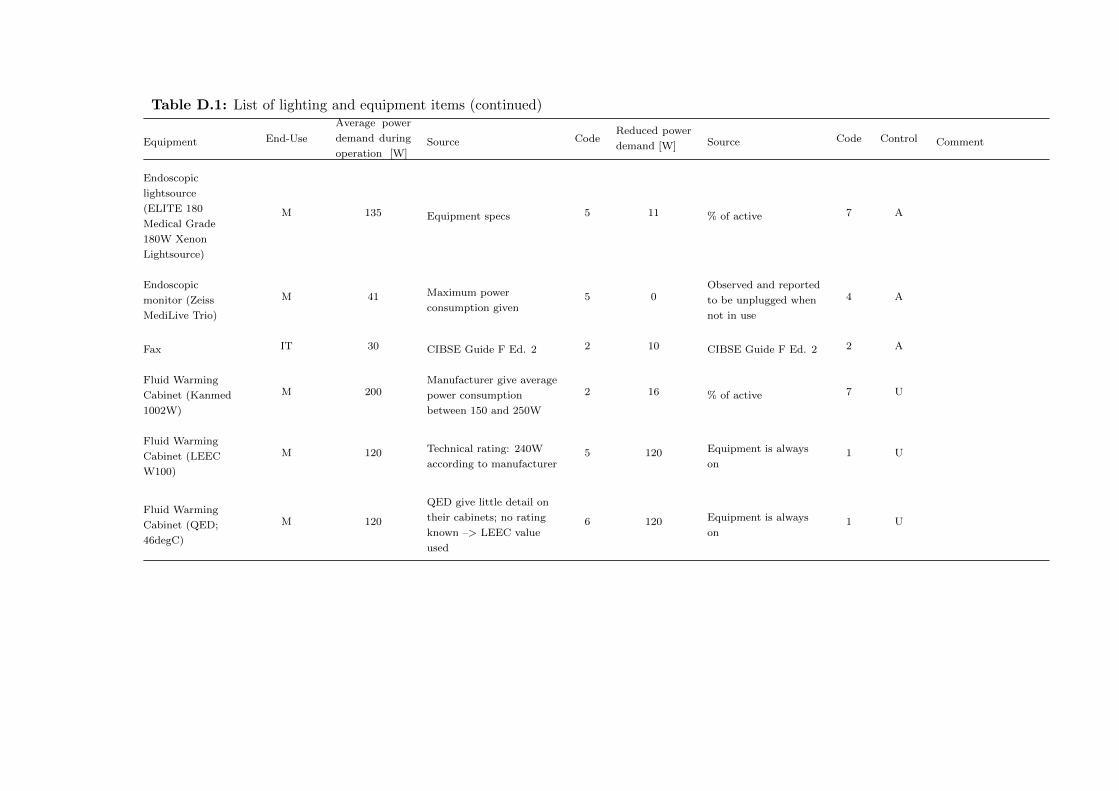
Table D.1: List of lighting and equipment items (continued)
Equipment End-Use
Average power
demand during
operation [W]Source Code
Reduced power
demand [W] Source Code Control Comment
Endoscopic
lightsource
(ELITE 180
Medical Grade
180W Xenon
Lightsource)
M 135 Equipment specs 5 11 % of active 7 A
Endoscopic
monitor (Zeiss
MediLive Trio)
M 41 Maximum power
consumption given5 0
Observed and reported
to be unplugged when
not in use
4 A
Fax IT 30 CIBSE Guide F Ed. 2 2 10 CIBSE Guide F Ed. 2 2 A
Fluid Warming
Cabinet (Kanmed
1002W)
M 200Manufacturer give average
power consumption
between 150 and 250W
2 16 % of active 7 U
Fluid Warming
Cabinet (LEEC
W100)
M 120 Technical rating: 240W
according to manufacturer5 120 Equipment is always
on1 U
Fluid Warming
Cabinet (QED;
46degC)
M 120
QED give little detail on
their cabinets; no rating
known –> LEEC value
used
6 120 Equipment is always
on1 U

Table D.1: List of lighting and equipment items (continued)
Equipment End-Use
Average power
demand during
operation [W]Source Code
Reduced power
demand [W] Source Code Control Comment
Fluid Warming
Cabinet
(unspecified)
M 120
QED give little detail on
their cabinets; no rating
known –> LEEC value
used
6 120 Equipment is always
on1 U
Fridge C 53Menezes et al 2014; p.80
Average consumption in
use
3 53 Always on 3 No
Gyrus Ent
Equipment for
nasal surgery
M 357 Observed 2.3A 5 0Observed and reported
to be unplugged when
not in use
4 A
Hi-Fi System IT 20 Audio Minisystem 4 9 Audio Minisystem 4 A
Honeywell electric
heaterLHC 2010 Measured 1 0 1 A
Hot beverage
systemC 233
No idea - Ultrakart for
50cups of water; heats
them 40K in 2hours
7 23To keep the volume
warm: 2K are
constantly lost
6 No

Table D.1: List of lighting and equipment items (continued)
Equipment End-Use
Average power
demand during
operation [W]Source Code
Reduced power
demand [W] Source Code Control Comment
Hot water provider C 575 Manufacturer specs 5 0
Zip Hydroboil give
weekly consumption
figures based on a
40h/working week of 8
- 10 kWh/week. Based
on this standby
consumption we have
10kWh/week which
given the longer
working week seems
reasonable.
5 No
Incubator
(Helmer)M 455
Power factor; Correction
for part load through
linear assumptions on
temperature; Average:
70% of specified maximum
power requirement (Hosni
1999 for lab equipment <
1000W)
5 0 No stand-by 2 U
Helmer Incubator with
Helmer Agitator inside
chamber; see Photo;
22.3degC; Range
according to Manual:
20 to 35degC
Incubator (Ortho
Vue)M 210
Technical specifications of
specific equipment; pdf
p.8; Hosni 1999 <1000W
3 21 % of active 7 U Ortho Bio Vue System
IV pump M 7 Manufacturer power rating
for Voluminat Aguila5 7 Always on 7 U
Recommended by
manufacturer to
always remain plugged
in
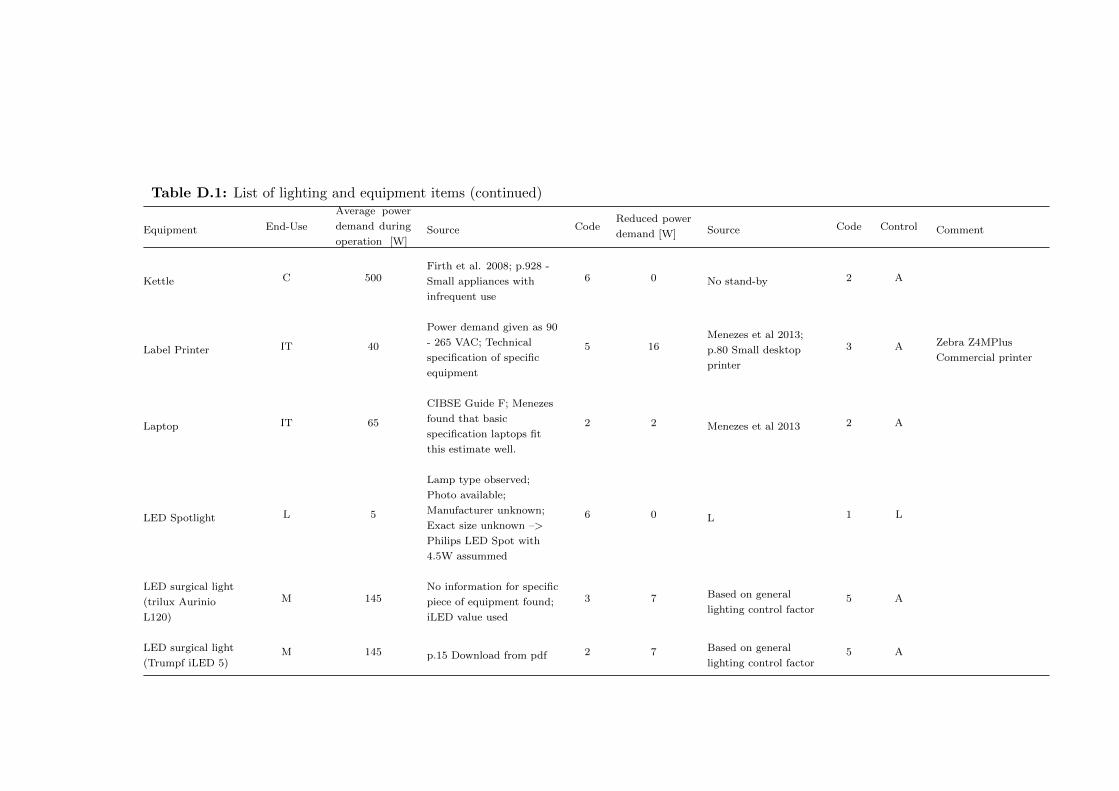
Table D.1: List of lighting and equipment items (continued)
Equipment End-Use
Average power
demand during
operation [W]Source Code
Reduced power
demand [W] Source Code Control Comment
Kettle C 500Firth et al. 2008; p.928 -
Small appliances with
infrequent use
6 0 No stand-by 2 A
Label Printer IT 40
Power demand given as 90
- 265 VAC; Technical
specification of specific
equipment
5 16Menezes et al 2013;
p.80 Small desktop
printer
3 A Zebra Z4MPlus
Commercial printer
Laptop IT 65
CIBSE Guide F; Menezes
found that basic
specification laptops fit
this estimate well.
2 2 Menezes et al 2013 2 A
LED Spotlight L 5
Lamp type observed;
Photo available;
Manufacturer unknown;
Exact size unknown –>
Philips LED Spot with
4.5W assummed
6 0 L 1 L
LED surgical light
(trilux Aurinio
L120)
M 145No information for specific
piece of equipment found;
iLED value used
3 7 Based on general
lighting control factor5 A
LED surgical light
(Trumpf iLED 5)M 145 p.15 Download from pdf 2 7 Based on general
lighting control factor5 A
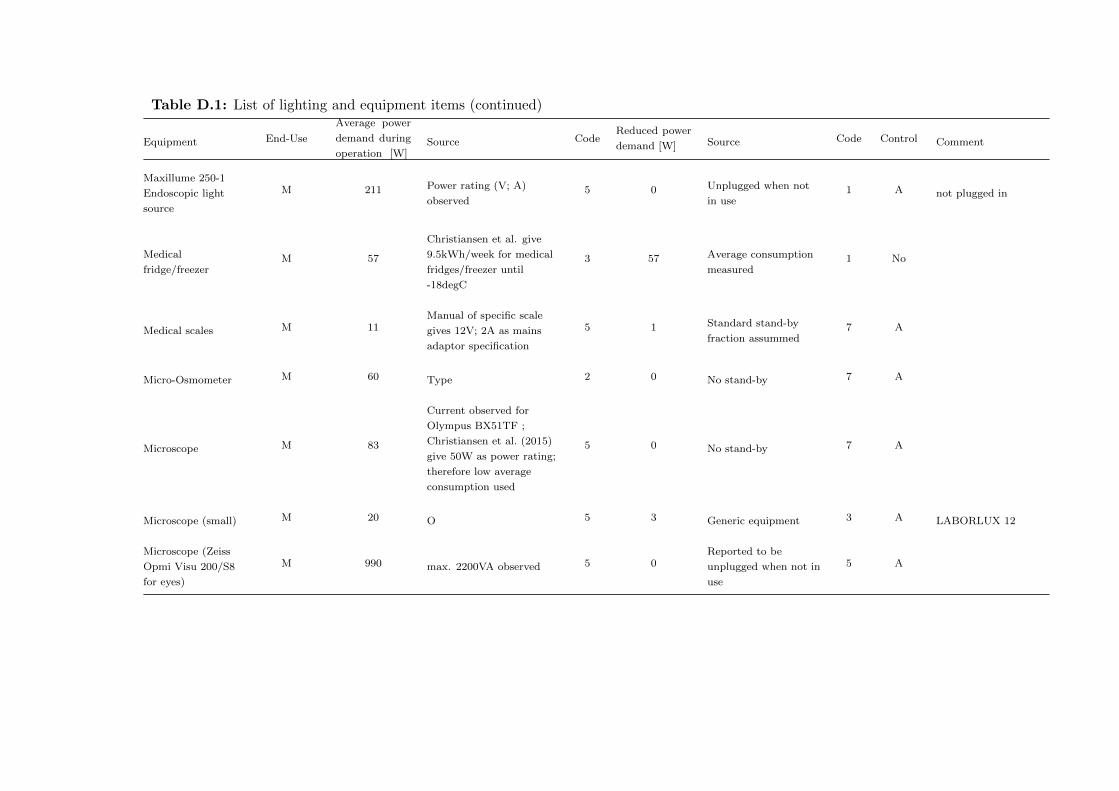
Table D.1: List of lighting and equipment items (continued)
Equipment End-Use
Average power
demand during
operation [W]Source Code
Reduced power
demand [W] Source Code Control Comment
Maxillume 250-1
Endoscopic light
source
M 211 Power rating (V; A)
observed5 0 Unplugged when not
in use1 A not plugged in
Medical
fridge/freezerM 57
Christiansen et al. give
9.5kWh/week for medical
fridges/freezer until
-18degC
3 57 Average consumption
measured1 No
Medical scales M 11Manual of specific scale
gives 12V; 2A as mains
adaptor specification
5 1 Standard stand-by
fraction assummed7 A
Micro-Osmometer M 60 Type 2 0 No stand-by 7 A
Microscope M 83
Current observed for
Olympus BX51TF ;
Christiansen et al. (2015)
give 50W as power rating;
therefore low average
consumption used
5 0 No stand-by 7 A
Microscope (small) M 20 O 5 3 Generic equipment 3 A LABORLUX 12
Microscope (Zeiss
Opmi Visu 200/S8
for eyes)
M 990 max. 2200VA observed 5 0Reported to be
unplugged when not in
use
5 A

Table D.1: List of lighting and equipment items (continued)
Equipment End-Use
Average power
demand during
operation [W]Source Code
Reduced power
demand [W] Source Code Control Comment
Microscope for
cataract/retina
surgery (Zeiss
lumera 700)
M 540 Maximum rated
consumption; p.145 0
Reported to be
unplugged when not in
use
5 A
Microwave C 120Menezes et al 2014; p.80
Average consumption in
use
3 2 Menezes et al 2014;
p.80 Stand-by mode3 A
Mitsubischi Split
UnitLHC 600 O - Rated input for
specific unit2 120
Assumed to be a bit
smaller than the
Daikin Unit
7 B
Mobile Imaging
(Siemens Arcadis
Varic)
M 2300 During X-ray generation 4 184% of active
(understood as
exposure)
7 B Generator reportedly
on
Monitor (Flat
screen)IT 30
CIBSE Guide F 3rd ed.;
Computers are low
intensity application; so
lower end of spectrum
measuren by Menezes
3 1
Menezes et al 2014
Monitored value;
CIBSE guide F 3rd
edition
3 A
Nerve monitor
(Neurosign 100)M 39 Power rating (V; A)
observed5 0
Observed and reported
to be unplugged when
not in use
4 A
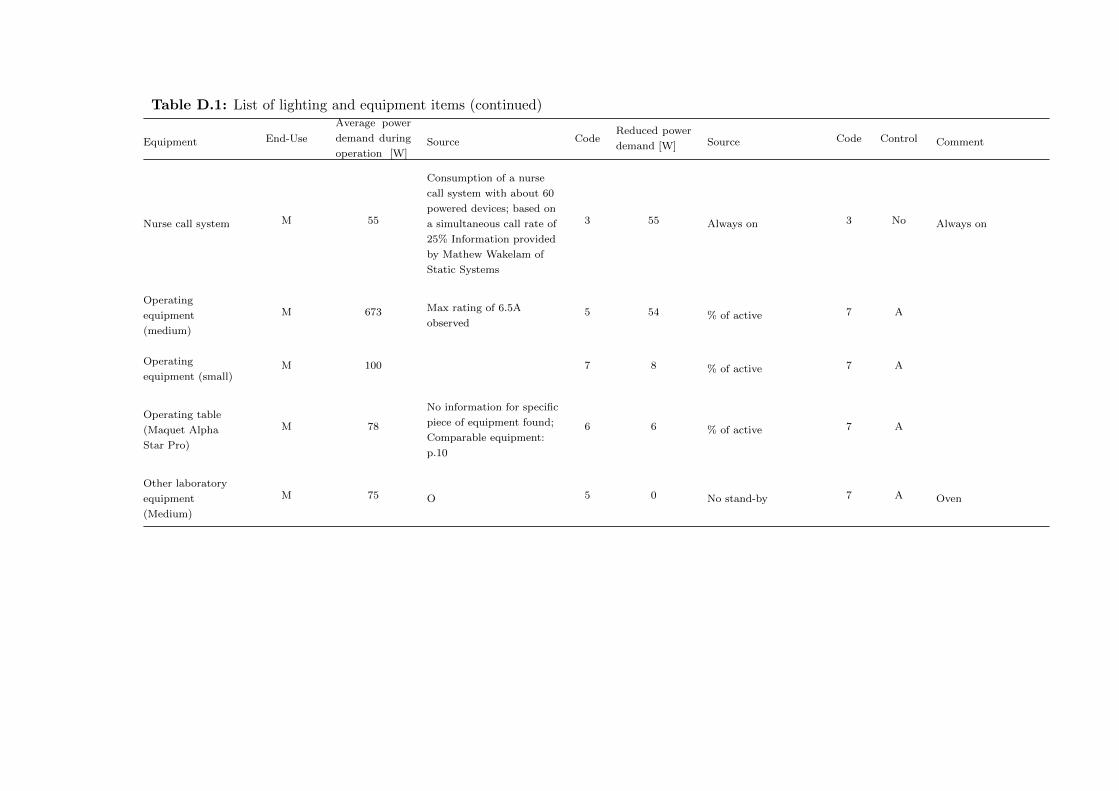
Table D.1: List of lighting and equipment items (continued)
Equipment End-Use
Average power
demand during
operation [W]Source Code
Reduced power
demand [W] Source Code Control Comment
Nurse call system M 55
Consumption of a nurse
call system with about 60
powered devices; based on
a simultaneous call rate of
25% Information provided
by Mathew Wakelam of
Static Systems
3 55 Always on 3 No Always on
Operating
equipment
(medium)
M 673 Max rating of 6.5A
observed5 54 % of active 7 A
Operating
equipment (small)M 100 7 8 % of active 7 A
Operating table
(Maquet Alpha
Star Pro)
M 78
No information for specific
piece of equipment found;
Comparable equipment:
p.10
6 6 % of active 7 A
Other laboratory
equipment
(Medium)
M 75 O 5 0 No stand-by 7 A Oven

Table D.1: List of lighting and equipment items (continued)
Equipment End-Use
Average power
demand during
operation [W]Source Code
Reduced power
demand [W] Source Code Control Comment
Other laboratory
equipment (small)M 10 Assummed; small
equipment5 2 Assumed to be 20% of
maximum5 A
SARSTEDT Multi
Sealer MS 250 to seal
blood bags;
Electrophorese
maschine (Transmed
Sahara iii)
PACS Reporting
StationM 179
Average power
consumption measured at
RLH X-ray
1-2 61 Measured at RLH 1 A
Patient lamp
(CFL)L 18 Wattage observed 3 0 L L L
Patient lamp
(Halogen; KCH)L 53 Wattage from Charlie 3 0 L 1 L
Patient lamp
(Incandescent)L 60 Wattage observed; Inc; so
no control gear3 0 L L No
Patient lamp
(LED)L 5 Equivalent to the 60W
observed4 0 L 1 L
Patient lamp
(Metal halide)L 30
on Strumpf medical
system Pod; patient
controlled; Wattage
observed as ’20 - 60W
lamp’ specified on the
tripod
5 0 L L L

Table D.1: List of lighting and equipment items (continued)
Equipment End-Use
Average power
demand during
operation [W]Source Code
Reduced power
demand [W] Source Code Control Comment
Patient Monitor M 612W rated according to
manufacturer of Dinamap
Patient Monitor
5 0 Standard stand-by
fraction assummed7 No
Manufacturer advice is
to always keep plugged
in to safe battery
Photocoagulator M 270 Power rating (V; A)
observed5 0
Observed and reported
to be unplugged when
not in use
4 A
Photocopier IT 230
Menezes et al 2014; p.80
Large network printer
photocopier - Average
consumption in use
3 35
Menezes et al 2014;
p.80 Large network
printer photocopier -
Stand-By
2 A
Platform for
cataract removalM 338 Maxiumum power rating
observed5 0
Reported to be
unplugged when not in
use
5 A
Portable AC unit LHC 569Max current according to
plate is 11A; Observed at
NUH Ward
5 0 Observed unplugged
when not in use1 A
Printer (Medium) IT 49 Menezes; Average
consumption3 16 Menezes et al 2013 3 A
Quantum 2
Controller for
anatomical
procedures
M 414Rating observed: 4A for
220 - 240V or 400W
output power
6 0Reported to be
unplugged when not in
use
5 A
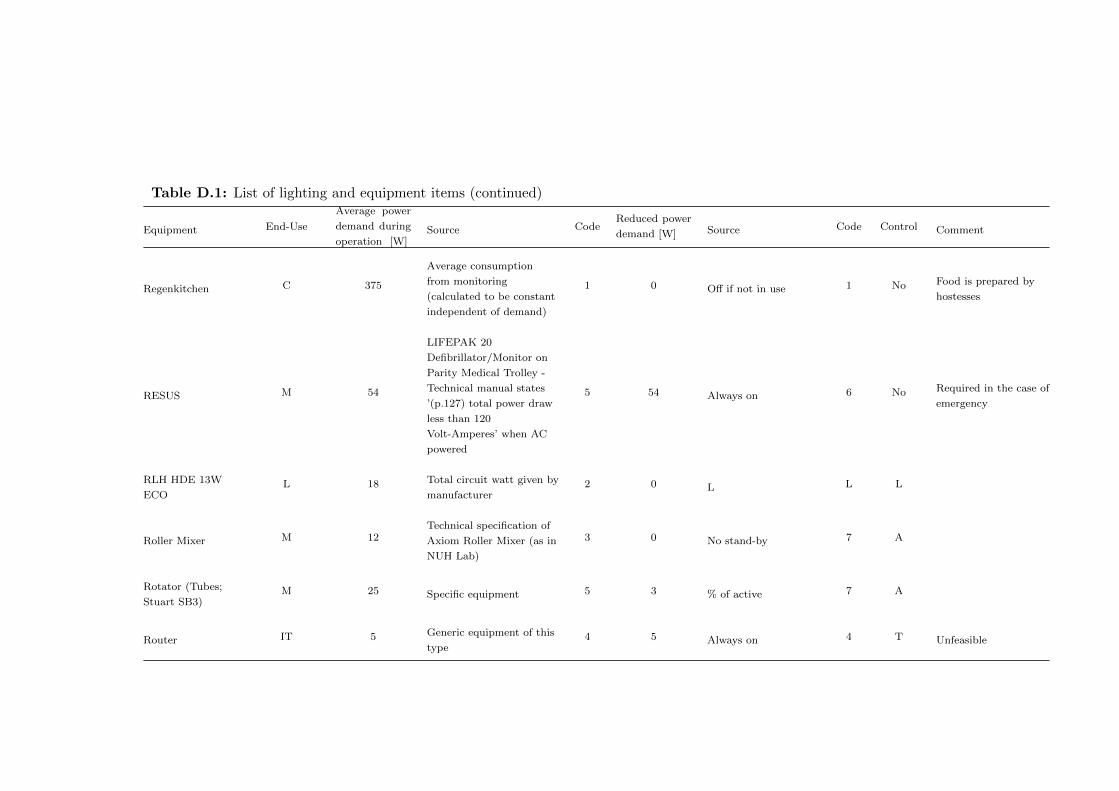
Table D.1: List of lighting and equipment items (continued)
Equipment End-Use
Average power
demand during
operation [W]Source Code
Reduced power
demand [W] Source Code Control Comment
Regenkitchen C 375
Average consumption
from monitoring
(calculated to be constant
independent of demand)
1 0 Off if not in use 1 No Food is prepared by
hostesses
RESUS M 54
LIFEPAK 20
Defibrillator/Monitor on
Parity Medical Trolley -
Technical manual states
’(p.127) total power draw
less than 120
Volt-Amperes’ when AC
powered
5 54 Always on 6 No Required in the case of
emergency
RLH HDE 13W
ECOL 18 Total circuit watt given by
manufacturer2 0 L L L
Roller Mixer M 12Technical specification of
Axiom Roller Mixer (as in
NUH Lab)
3 0 No stand-by 7 A
Rotator (Tubes;
Stuart SB3)M 25 Specific equipment 5 3 % of active 7 A
Router IT 5 Generic equipment of this
type4 5 Always on 4 T Unfeasible
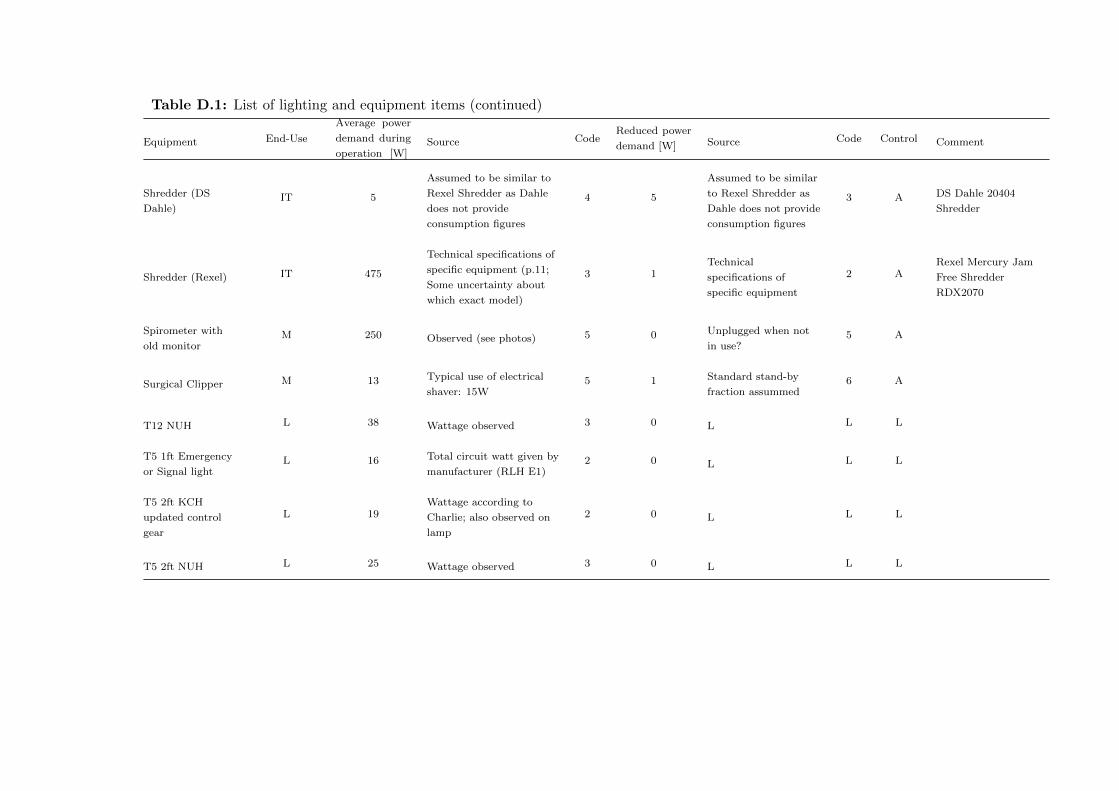
Table D.1: List of lighting and equipment items (continued)
Equipment End-Use
Average power
demand during
operation [W]Source Code
Reduced power
demand [W] Source Code Control Comment
Shredder (DS
Dahle)IT 5
Assumed to be similar to
Rexel Shredder as Dahle
does not provide
consumption figures
4 5
Assumed to be similar
to Rexel Shredder as
Dahle does not provide
consumption figures
3 A DS Dahle 20404
Shredder
Shredder (Rexel) IT 475
Technical specifications of
specific equipment (p.11;
Some uncertainty about
which exact model)
3 1Technical
specifications of
specific equipment
2 ARexel Mercury Jam
Free Shredder
RDX2070
Spirometer with
old monitorM 250 Observed (see photos) 5 0 Unplugged when not
in use?5 A
Surgical Clipper M 13 Typical use of electrical
shaver: 15W5 1 Standard stand-by
fraction assummed6 A
T12 NUH L 38 Wattage observed 3 0 L L L
T5 1ft Emergency
or Signal lightL 16 Total circuit watt given by
manufacturer (RLH E1)2 0 L L L
T5 2ft KCH
updated control
gear
L 19Wattage according to
Charlie; also observed on
lamp
2 0 L L L
T5 2ft NUH L 25 Wattage observed 3 0 L L L
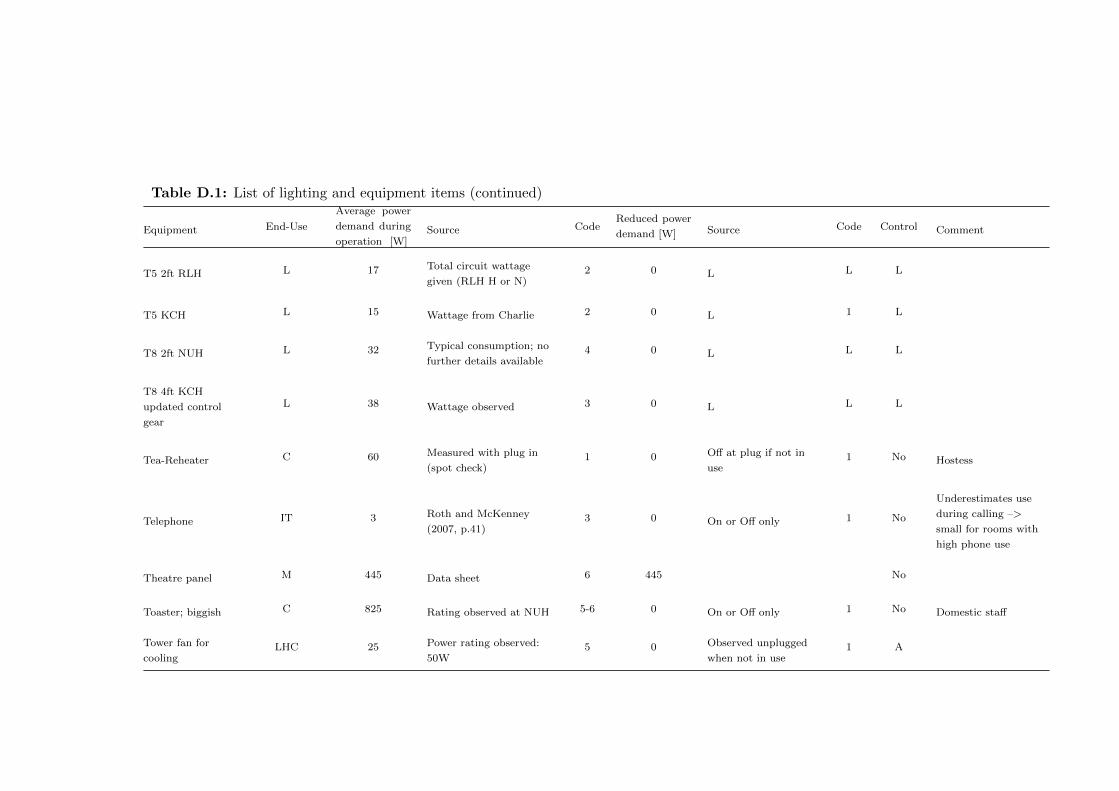
Table D.1: List of lighting and equipment items (continued)
Equipment End-Use
Average power
demand during
operation [W]Source Code
Reduced power
demand [W] Source Code Control Comment
T5 2ft RLH L 17 Total circuit wattage
given (RLH H or N)2 0 L L L
T5 KCH L 15 Wattage from Charlie 2 0 L 1 L
T8 2ft NUH L 32 Typical consumption; no
further details available4 0 L L L
T8 4ft KCH
updated control
gear
L 38 Wattage observed 3 0 L L L
Tea-Reheater C 60 Measured with plug in
(spot check)1 0 Off at plug if not in
use1 No Hostess
Telephone IT 3 Roth and McKenney
(2007, p.41)3 0 On or Off only 1 No
Underestimates use
during calling –>
small for rooms with
high phone use
Theatre panel M 445 Data sheet 6 445 No
Toaster; biggish C 825 Rating observed at NUH 5-6 0 On or Off only 1 No Domestic staff
Tower fan for
coolingLHC 25 Power rating observed:
50W5 0 Observed unplugged
when not in use1 A

Table D.1: List of lighting and equipment items (continued)
Equipment End-Use
Average power
demand during
operation [W]Source Code
Reduced power
demand [W] Source Code Control Comment
TV IT 130 Firth et al. 2008; p.928 for
normal TV3 2 Firth et al. 2008;
p.9283 A
UCV Canopy
(Exflow 32)UCV Canopy 4100
Operational (Mean) Power
Consumption According
to Technical Summary
2 2050
According to the
manual; Stand-by
mode is 50% of
operational mode
2 B
UCV Canopy
(MAT)UCV Canopy 2708 Measured in NUH Theatre
41 1781 Measured in NUH
Theatre 41 B
Ultrafeezer M 1024 Measured by Christiansen
et al. (2015)3 1024 No
Uninterruptible
Power SupplyM 16 Estimate 6 16 Is ready 6 No PowerVar
UV sterilizer C 25 Rating of 50W observed 5 25 Always on 5 No Required on for health
& safety reasons
Vending machine C 583 14 kWh/day according to
overview4 583 Always on 7 U
Wall mounted
electric heaterLHC 2070
Measured: 2070 W on
stage II; 1050 W on Stage
I
1 0 1 ADe Longhi wall
mounted electric
heater
Water cooler C 311 Power factor; FLA as
given 1.5A5 7 OASIS Water cooler;
Cold only6 No

Table D.1: List of lighting and equipment items (continued)
Equipment End-Use
Average power
demand during
operation [W]Source Code
Reduced power
demand [W] Source Code Control Comment
Water cooler unit;
Cold onlyC 7 Labelling scheme 3 7 Always on 1 No Always on
Water purification
systemM 300
Comparable water
purification system; p.5.
Power consumption
< 0.4kW
6 210 Assumed to be 70% of
maximum7 No Millipore Progard
TL1C12
1 End-use: C - Catering; IT - IT equipment; L - Lighting; LHC - Local heating/cooling; M - Medical equipment
2 For equipment of type C and D: In ’Ready mode’
3 Default Control Code: A - Clinical staff can switch from on/ready to off
B - Clinical staff can switch from on/ready to stand-by
No - No switching by clinical staff possible
U - Unclear
Table D.1: List of lighting and equipment items

D.2 Example from the RLH Day Clinic for the cross-tabulation of interview information
as basis for quantitative modelling
Table D.2: Cross-tabulation of information for RLH Outpatients
ElementFieldwork preparation with
Renal technicianInterview I: Staff nurse
Interview II: Health Care
AssistantInterview III: Nursing support
MorningWe start 7:30. We start from 7 to
6:30.
We come in at seven. The patients...
Sometimes patients get here before us,
the reason being the transportation.
It’s when they are picked up. Yeah, so
once we have lined the machines 07:30,
they are meant to come in. Some
people do come in before time.
Colleague: I usually turn up here at
half past six.
7am
Evening
And so if you are late with your bay,
these patients don’t get to go on at 5
and staff don’t finish 11 o’clock which
obviously puts them in more of a
situation because they have to get
their way home and people don’t live
locally.
I mostly work twilight. It starts at
11:30, so there is kind of like an
overlap till 11pm.
6:30 (She never does twilight) It is
just this bay and this bay which do
twilight and only on Monday,
Wednesday and Friday.
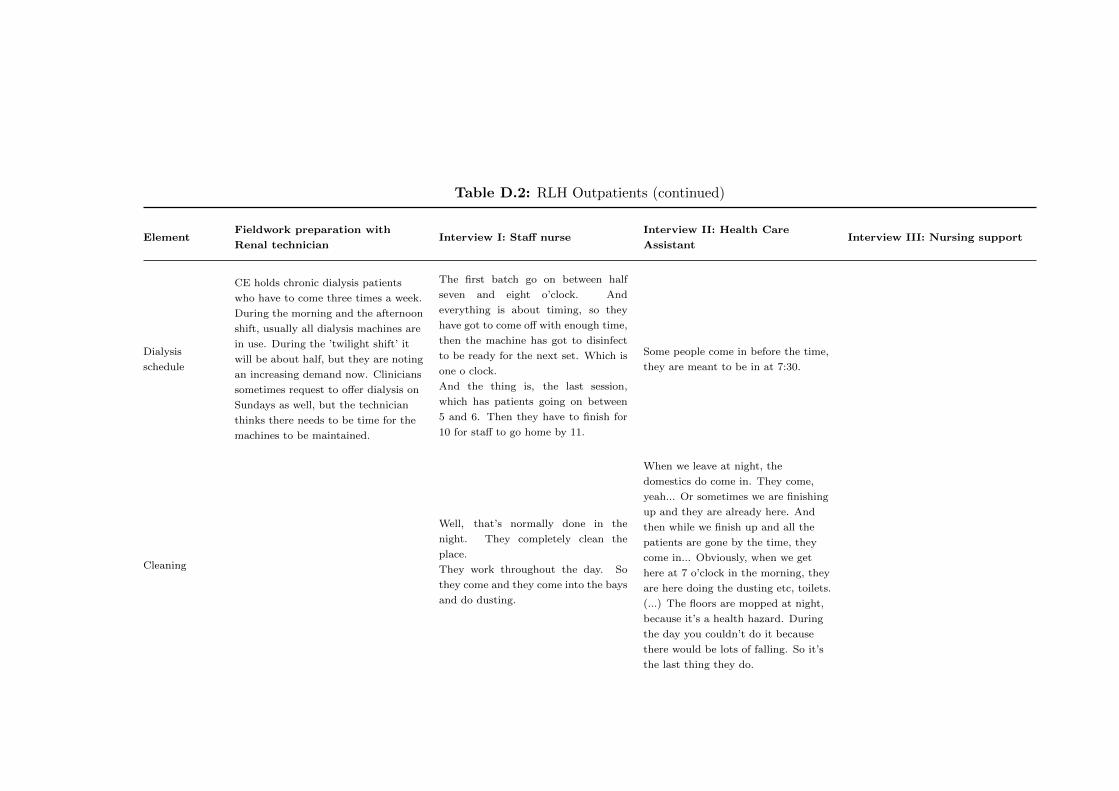
Table D.2: RLH Outpatients (continued)
ElementFieldwork preparation with
Renal technicianInterview I: Staff nurse
Interview II: Health Care
AssistantInterview III: Nursing support
Dialysis
schedule
CE holds chronic dialysis patients
who have to come three times a week.
During the morning and the afternoon
shift, usually all dialysis machines are
in use. During the ’twilight shift’ it
will be about half, but they are noting
an increasing demand now. Clinicians
sometimes request to offer dialysis on
Sundays as well, but the technician
thinks there needs to be time for the
machines to be maintained.
The first batch go on between half
seven and eight o’clock. And
everything is about timing, so they
have got to come off with enough time,
then the machine has got to disinfect
to be ready for the next set. Which is
one o clock.
And the thing is, the last session,
which has patients going on between
5 and 6. Then they have to finish for
10 for staff to go home by 11.
Some people come in before the time,
they are meant to be in at 7:30.
Cleaning
Well, that’s normally done in the
night. They completely clean the
place.
They work throughout the day. So
they come and they come into the bays
and do dusting.
When we leave at night, the
domestics do come in. They come,
yeah... Or sometimes we are finishing
up and they are already here. And
then while we finish up and all the
patients are gone by the time, they
come in... Obviously, when we get
here at 7 o’clock in the morning, they
are here doing the dusting etc, toilets.
(...) The floors are mopped at night,
because it’s a health hazard. During
the day you couldn’t do it because
there would be lots of falling. So it’s
the last thing they do.

Table D.2: RLH Outpatients (continued)
ElementFieldwork preparation with
Renal technicianInterview I: Staff nurse
Interview II: Health Care
AssistantInterview III: Nursing support
Nurse base
CFLs
And here (in the nursebase), we have
lights here, we control that behind the
computer. That’s fine.
No control. On when in use.
Nurse base
LEDs
And you have these as well (the LED
type lamps on the ’counter’)...I don’ t
really notice them. (laughs) I don’t
really think about these ones.
Sometimes. Not really. As it is up
now. (They were not in use during
the interview)
Corridor lights
We don’t really need any corridor
lights. What about the ones which are
on at the moment? Oh yeah, yeah... I
think they are on, but I never notice
them really. But if they were on or
off, it wouldn’t make a bit difference
really. We don’t really need it as such.
What, these ones? I don’t know...
(laughs) (I keep insisting and she sees
herself forced to give some answer)
Who would be switching on the lights
in the corridors? Mmh... Is that just
the first person in? Yeah, that could
be. The first person in, yeah.
Because they do automatically go off,
because they are sensored and as soon
as somebody comes through. And
then if nobody is there around, they
will go off.
Bay lights
Cloud lightsControlled by staff
You can turn it off on the main switch
which is there (point to a switch on
the wall opposite the nurse base) and
then everybody got their individual
light.

Table D.2: RLH Outpatients (continued)
ElementFieldwork preparation with
Renal technicianInterview I: Staff nurse
Interview II: Health Care
AssistantInterview III: Nursing support
Patient bed
lights
... but if you have that one (cloud
light) you don’t need to touch the
lamps. But at the bottom (the
patient beds at the periphery of the
building, further away from the nurse
station), they don’t have it so you
have to put the lamps on.

Table D.2: RLH Outpatients (continued)
ElementFieldwork preparation with
Renal technicianInterview I: Staff nurse
Interview II: Health Care
AssistantInterview III: Nursing support
Uplights at
patient beds
For example, there is another light,
but it is behind the machine and it is
behind the bed. I have to go behind
to switch it on. And if you switch it
on, and obviously patients will want
to turn it back off when you finish, so
you got to behind the machine,
behind the bed, or behind the
handbags and coats. It’s not... easy
accessible. It would be nice maybe if
there was some form of remote control
or so maybe. And do you use these
uplights a lot? Yes, because at the
back that is the only light, that and
the lamp. So generally in the back of
the bay, these lights will be on all the
time? Unless the patient don’t want
it on. So you switch it off. And then
the little lamp, patients can also
switch them on and off themselves?
Yeah, yeah. So for that reason I
would say six.

Table D.2: RLH Outpatients (continued)
ElementFieldwork preparation with
Renal technicianInterview I: Staff nurse
Interview II: Health Care
AssistantInterview III: Nursing support
Toilet lights
See, the good thing is - if you walk
into like a place, sorry , I said seven,
we don’t have full control over some
of the lights - I will give it a five -
because if you walk into the toilets, it
is like immediately, it senses your
presence and will immediately come
on.
Nurse base
PCs
Technician says there is no automatic
PC power down in the department.
Monitors go into sleep mode and PCs
into standby.
No, they will be off in the mornings.
(...) Because they normally go off in
the evenings... They have a power
thing that switches off. Is that like an
automatic power down? Yeah.
I don’t think we actually switch it off.
We just log-off. Most of us just log-off.
Mornings: And... for the first
person... because when we come in
immediately, we don’t go straight to
the computer. It’s hands on - we go
straight to the machine. But once, we
are ready we will switch them on.
Maybe at about eight, I don’t know
maybe between eight and nine.
Actually, it’s mostly about nine
because we are not gonna be...
Sometimes we are putting patients on.
About 8:30... Evenings - automatic
shutdown? Yes, they do. They do.
On: That is not priority first thing. -
If somebody needs to check
something. Probably half eight, nine
o’clock. Once all the patients are on -
unless somebody needs to check
something. Off: Probably about 6
o’clock, half six.
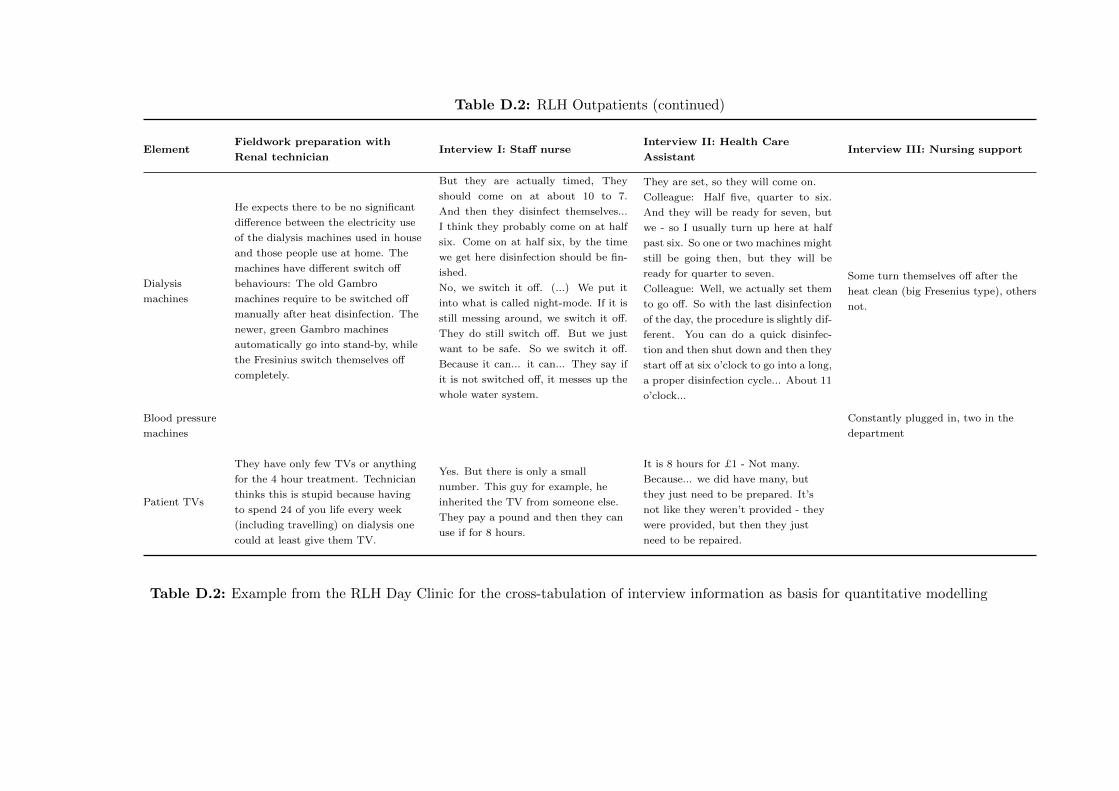
Table D.2: RLH Outpatients (continued)
ElementFieldwork preparation with
Renal technicianInterview I: Staff nurse
Interview II: Health Care
AssistantInterview III: Nursing support
Dialysis
machines
He expects there to be no significant
difference between the electricity use
of the dialysis machines used in house
and those people use at home. The
machines have different switch off
behaviours: The old Gambro
machines require to be switched off
manually after heat disinfection. The
newer, green Gambro machines
automatically go into stand-by, while
the Fresinius switch themselves off
completely.
But they are actually timed, They
should come on at about 10 to 7.
And then they disinfect themselves...
I think they probably come on at half
six. Come on at half six, by the time
we get here disinfection should be fin-
ished.
No, we switch it off. (...) We put it
into what is called night-mode. If it is
still messing around, we switch it off.
They do still switch off. But we just
want to be safe. So we switch it off.
Because it can... it can... They say if
it is not switched off, it messes up the
whole water system.
They are set, so they will come on.
Colleague: Half five, quarter to six.
And they will be ready for seven, but
we - so I usually turn up here at half
past six. So one or two machines might
still be going then, but they will be
ready for quarter to seven.
Colleague: Well, we actually set them
to go off. So with the last disinfection
of the day, the procedure is slightly dif-
ferent. You can do a quick disinfec-
tion and then shut down and then they
start off at six o’clock to go into a long,
a proper disinfection cycle... About 11
o’clock...
Some turn themselves off after the
heat clean (big Fresenius type), others
not.
Blood pressure
machines
Constantly plugged in, two in the
department
Patient TVs
They have only few TVs or anything
for the 4 hour treatment. Technician
thinks this is stupid because having
to spend 24 of you life every week
(including travelling) on dialysis one
could at least give them TV.
Yes. But there is only a small
number. This guy for example, he
inherited the TV from someone else.
They pay a pound and then they can
use if for 8 hours.
It is 8 hours for £1 - Not many.
Because... we did have many, but
they just need to be prepared. It’s
not like they weren’t provided - they
were provided, but then they just
need to be repaired.
Table D.2: Example from the RLH Day Clinic for the cross-tabulation of interview information as basis for quantitative modelling

D Data analysis process
D.3 Example of an interview transcript
Figure D.1: Example of interview transcript
309
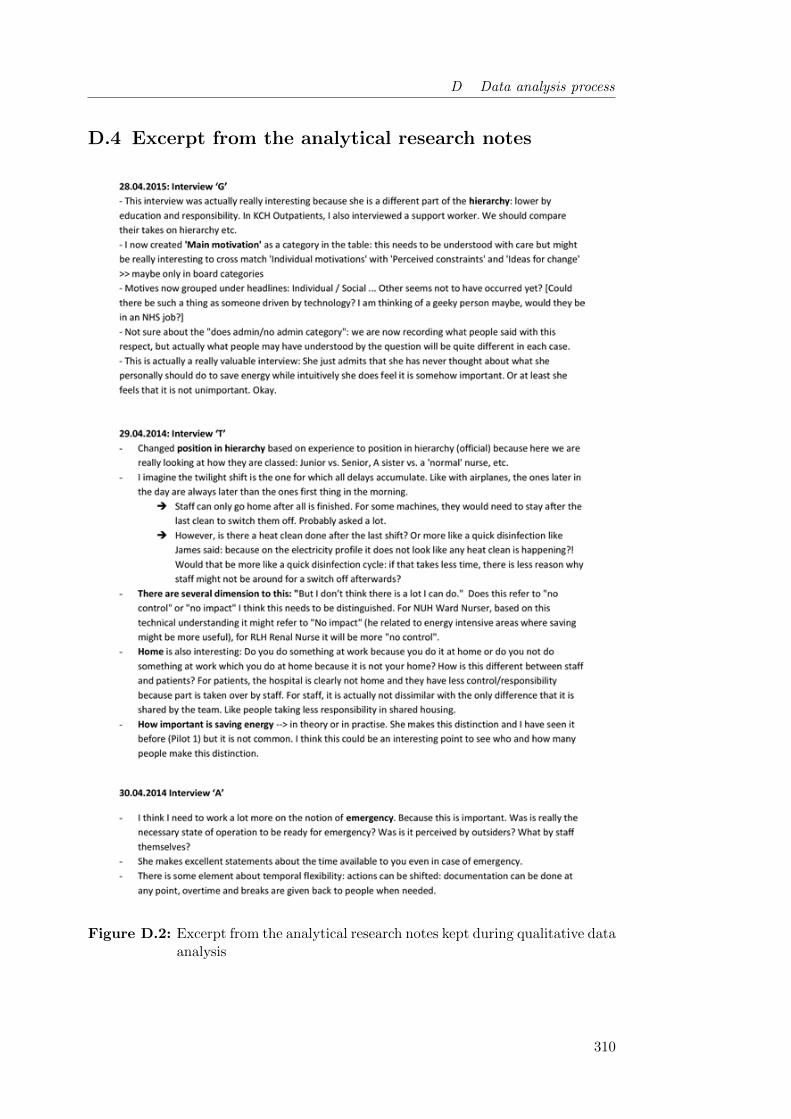
D Data analysis process
D.4 Excerpt from the analytical research notes
Figure D.2: Excerpt from the analytical research notes kept during qualitative dataanalysis
310
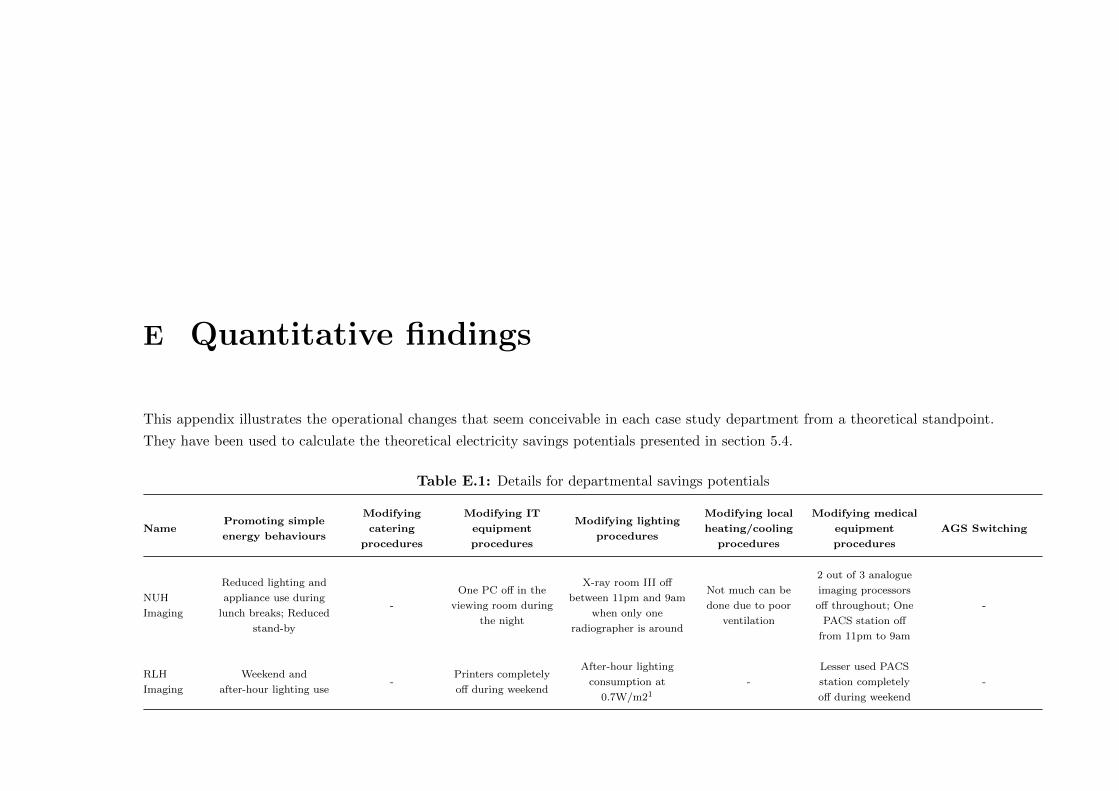
E Quantitative findings
This appendix illustrates the operational changes that seem conceivable in each case study department from a theoretical standpoint.
They have been used to calculate the theoretical electricity savings potentials presented in section 5.4.
Table E.1: Details for departmental savings potentials
NamePromoting simple
energy behaviours
Modifying
catering
procedures
Modifying IT
equipment
procedures
Modifying lighting
procedures
Modifying local
heating/cooling
procedures
Modifying medical
equipment
procedures
AGS Switching
NUH
Imaging
Reduced lighting and
appliance use during
lunch breaks; Reduced
stand-by
-
One PC off in the
viewing room during
the night
X-ray room III off
between 11pm and 9am
when only one
radiographer is around
Not much can be
done due to poor
ventilation
2 out of 3 analogue
imaging processors
off throughout; One
PACS station off
from 11pm to 9am
-
RLH
Imaging
Weekend and
after-hour lighting use-
Printers completely
off during weekend
After-hour lighting
consumption at
0.7W/m21
-
Lesser used PACS
station completely
off during weekend
-
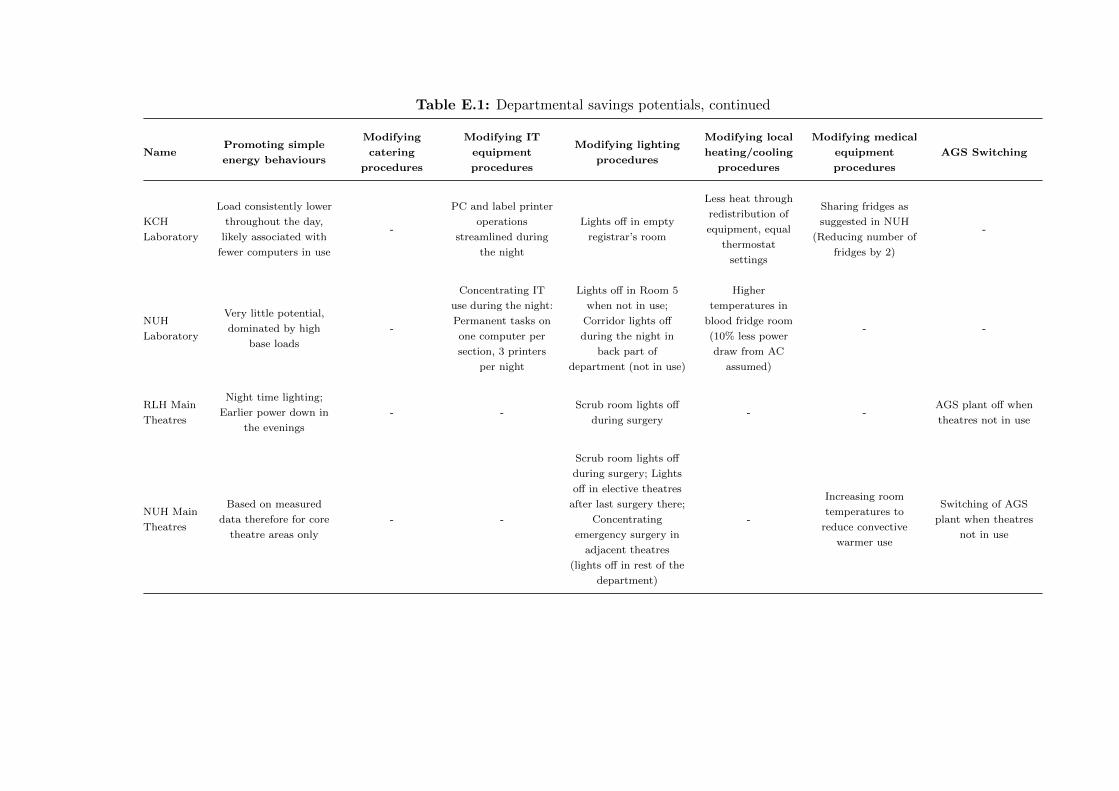
Table E.1: Departmental savings potentials, continued
NamePromoting simple
energy behaviours
Modifying
catering
procedures
Modifying IT
equipment
procedures
Modifying lighting
procedures
Modifying local
heating/cooling
procedures
Modifying medical
equipment
procedures
AGS Switching
KCH
Laboratory
Load consistently lower
throughout the day,
likely associated with
fewer computers in use
-
PC and label printer
operations
streamlined during
the night
Lights off in empty
registrar’s room
Less heat through
redistribution of
equipment, equal
thermostat
settings
Sharing fridges as
suggested in NUH
(Reducing number of
fridges by 2)
-
NUH
Laboratory
Very little potential,
dominated by high
base loads
-
Concentrating IT
use during the night:
Permanent tasks on
one computer per
section, 3 printers
per night
Lights off in Room 5
when not in use;
Corridor lights off
during the night in
back part of
department (not in use)
Higher
temperatures in
blood fridge room
(10% less power
draw from AC
assumed)
- -
RLH Main
Theatres
Night time lighting;
Earlier power down in
the evenings
- -Scrub room lights off
during surgery- -
AGS plant off when
theatres not in use
NUH Main
Theatres
Based on measured
data therefore for core
theatre areas only
- -
Scrub room lights off
during surgery; Lights
off in elective theatres
after last surgery there;
Concentrating
emergency surgery in
adjacent theatres
(lights off in rest of the
department)
-
Increasing room
temperatures to
reduce convective
warmer use
Switching of AGS
plant when theatres
not in use

Table E.1: Departmental savings potentials, continued
NamePromoting simple
energy behaviours
Modifying
catering
procedures
Modifying IT
equipment
procedures
Modifying lighting
procedures
Modifying local
heating/cooling
procedures
Modifying medical
equipment
procedures
AGS Switching
RLH Day
Theatres
Night time lighting in
particular over the
weekend
- -
Lights off during lunch
breaks; Scrub room
lights off during
surgery; Looking
department overnight:
Corridor lights may be
switched off
-
Increasing room
temperatures to
reduce convective
warmer use
Switching of AGS
plant after-hours
RLH Out-
patients
Weekend night time
lighting; Lights off in
self dialysis areas
during non-active
twilight; Consistent
switch off of dialysis
machines
Microwave
completely off
after-hours
Printers off after
hours
Asking patients
whether they want
their light on (instead
of default on)
-
Unplugging IV
pumps when not in
use (after-hours)
-
KCH Out-
patients
Less lighting use on
weekends, Space
conditioning from 8am
and not earlier,
Unplugging IV pumps
during the night
New vending
machine is 10%
more efficient
Switching off
printers after hours-
Reducing split unit
use by 20%
through less space
conditioning
outside opening
hours
- -

Table E.1: Departmental savings potentials, continued
NamePromoting simple
energy behaviours
Modifying
catering
procedures
Modifying IT
equipment
procedures
Modifying lighting
procedures
Modifying local
heating/cooling
procedures
Modifying medical
equipment
procedures
AGS Switching
KCH
General
Ward
Lights in peripheral
rooms switched off
during day time; Half
of corridor lights
switched off during
night
Staff microwaves
completely off
Monitors in corridor
providing patient
information off
during the night; 2
out of 8 computers
off completely
overnight; Printer in
office and reception
completely off
overnight
Reception light off
after-hours,
Introducing quiet time
(2 hr/day switch off of
bay lights)
(Savings through
improvements in
heating control
conceivable, but
currently not
feasible)
- -
NUH
General
Ward
Increased quiet time;
Earlier sleeping at
night
Staff microwaves
completely off
2 out of 6 computers
off overnight
Better use of day light:
switching lights of in
bays for one additional
hour per day
(Needed due to
overheating issues)- -
1 Minimum measured consumption, also in CIBSE TM 54 Standard (CIBSE, 2013)
Table E.1: Details for departmental savings potentials