The direct and indirect use of fossil fuels and electricity in USA agriculture, 1910–1990
11
ELSEVIER Agriculture, Ecosystems and Environment 55 (1995) 111-121 Agriculture Ecosystems & Environment The direct and indirect use of fossil fuels and electricity in USA agriculture, 1910-1990 Cutler J. Cleveland 1 Centerfor Energy and Environmental Studies and Department of Geography, Boston University, 675 Commonwealth Avenue, Boston MA 02215, USA Accepted 1 May 1995 Abstract Industrial agriculture relies on large quantities of fossil fuels and electricity. The increase in energy prices in the 1980s prompted substantial investigation into the response of farmers to new energy conditions, and into the prospects for future food production in the face of scarcer and more expensive energy inputs. Previous attempts to model these relationships were hampered by a lack of consistent and reliable historical data on total energy use in USA agriculture. This analysis develops and applies a new methodology to calculate the direct and indirect use of fossil fuels and electricity on USA farms from 1910 to 1990. The data on energy use is used to construct indices of energy productivity over the same period. The results show a substantial overall increase in energy use from 1910 through the 1970s, and a shift from gasoline to diesel fuel and electricity. The use of all fuels declined in the 1980s. The measures of energy productivity show a substantial decline in through the 1970s, a trend consistent with the substitution of fossil fuels for animate power and with the low price of fossil fuels relative to other inputs. Energy productivity rose in the 1980s due to a diminution in the rate of energy use, a reduction in the number of harvested hectares, and larger farms. The results show a clear response of farmers to higher energy prices that resulted in technical and managerial changes that improved energy productivity. 1. Introduction The energy-intensiveness of industrial agriculture is well-documented, and much of the increase in agricul- tural productivity in the 20th century was driven by large subsidies of fossil fuels (Odum, 1971; Pimentel et al., 1973; Steinhart and Steinhart, 1974; Leach, 1976; Lockeretz, 1977; Pimentel and Pimentel, 1979; Fluck, 1979; Torgerson and Cooper, 1980; Fluck and Baird, 1980; Bayliss-Smith, 1984; Stanhill, 1984; Gever et al., 1986; Hall et al., 1986; Pimentel et al., 1990; Smil, 1991). The increase in energy prices in the 1980s 1Tel: (617) 353-3083, Fax: (617) 353-5986, E-mail: cut- [email protected]. Elsevier Science B.V. SSDIO167-8809(95)OO615-X prompted substantial investigation into the response of farmers to new energy conditions, and into the pros- pects for future food production in the face of scarcer and more expensive energy inputs (Doering, 1980; Dvoskin et al., 1978; OECD, 1982; Gowdy et al., 1987; Stout and Nehring, 1988; Tewari, 1990; Panesar and Fluck, 1993; Kendall and Pimentel, 1994). Previous attempts to model these relationships were hampered by a lack of consistent and reliable historical data on total energy use in USA agriculture. In the most frequently cited time series on energy use, Steinhart and Steinhart (1974) pieced together data from nine different sources to generate nine observations on farm energy use in the USA from 1940 to 1970. The dynamic models of productivity and resource degradation in
-
Upload
independent -
Category
Documents
-
view
5 -
download
0
Transcript of The direct and indirect use of fossil fuels and electricity in USA agriculture, 1910–1990
E L S E V I E R Agriculture, Ecosystems and Environment 55 (1995) 111-121
Agriculture E c o s y s t e m s & Environment
The direct and indirect use of fossil fuels and electricity in USA agriculture, 1910-1990
Cutler J. Cleveland 1 Center for Energy and Environmental Studies and Department of Geography, Boston University, 675 Commonwealth Avenue, Boston MA
02215, USA
Accepted 1 May 1995
Abstract
Industrial agriculture relies on large quantities of fossil fuels and electricity. The increase in energy prices in the 1980s prompted substantial investigation into the response of farmers to new energy conditions, and into the prospects for future food production in the face of scarcer and more expensive energy inputs. Previous attempts to model these relationships were hampered by a lack of consistent and reliable historical data on total energy use in USA agriculture. This analysis develops and applies a new methodology to calculate the direct and indirect use of fossil fuels and electricity on USA farms from 1910 to 1990. The data on energy use is used to construct indices of energy productivity over the same period. The results show a substantial overall increase in energy use from 1910 through the 1970s, and a shift from gasoline to diesel fuel and electricity. The use of all fuels declined in the 1980s. The measures of energy productivity show a substantial decline in through the 1970s, a trend consistent with the substitution of fossil fuels for animate powe r and with the low price of fossil fuels relative to other inputs. Energy productivity rose in the 1980s due to a diminution in the rate of energy use, a reduction in the number of harvested hectares, and larger farms. The results show a clear response of farmers to higher energy prices that resulted in technical and managerial changes that improved energy productivity.
1. Introduction
The energy-intensiveness of industrial agriculture is well-documented, and much of the increase in agricul- tural productivity in the 20th century was driven by large subsidies of fossil fuels (Odum, 1971; Pimentel et al., 1973; Steinhart and Steinhart, 1974; Leach, 1976; Lockeretz, 1977; Pimentel and Pimentel, 1979; Fluck, 1979; Torgerson and Cooper, 1980; Fluck and Baird, 1980; Bayliss-Smith, 1984; Stanhill, 1984; Gever et al., 1986; Hall et al., 1986; Pimentel et al., 1990; Smil, 1991). The increase in energy prices in the 1980s
1Tel: (617) 353-3083, Fax: (617) 353-5986, E-mail: cut- [email protected].
Elsevier Science B.V. SSDIO167-8809(95)OO615-X
prompted substantial investigation into the response of farmers to new energy conditions, and into the pros- pects for future food production in the face of scarcer and more expensive energy inputs (Doering, 1980; Dvoskin et al., 1978; OECD, 1982; Gowdy et al., 1987; Stout and Nehring, 1988; Tewari, 1990; Panesar and Fluck, 1993; Kendall and Pimentel, 1994).
Previous attempts to model these relationships were hampered by a lack of consistent and reliable historical data on total energy use in USA agriculture. In the most frequently cited time series on energy use, Steinhart and Steinhart (1974) pieced together data from nine different sources to generate nine observations on farm energy use in the USA from 1940 to 1970. The dynamic models of productivity and resource degradation in
112 C.J. Cleveland~Agriculture, Ecosystems and Environment 55 (1995) 111-121
USA agriculture developed by Gever et al. (1986) were based on the Steinhart and Steinhart data, plus three additional observations from three sources. Econ- omists have calculated indices of energy use based on energy price and cost data in translog cost functions (Capalbo et al., 1985), but such approaches do not discriminate among fuel types and they do not calculate the quantity of energy use in physical units.
The purpose of this analysis is twofold. First, a new methodology is developed and applied to calculate the direct and indirect use of fossil fuels and electricity on USA farms from 1910 to 1990. Second, the data on energy use was used to construct indices of energy productivity over the same period. An analysis of the principal factors that influence the quantity and pro- ductivity of energy use in USA agriculture is then dis- cussed, with particular reference to the impacts of the energy price shocks.
2. Calculating the direct use of fossil fuels and electricity
The majority of work on energy use in agriculture has focused on the comparison of the energy cost of producing different crops and animal products at a point in time (e.g. Leach, 1976; Pimentel and Pimentel, 1979); the comparison of different methods of agri- cultural production, such as traditional vs. industrial agriculture (e.g. Bayliss-Smith, 1984; Smil, 1991);or the comparison of agricultural energy use in different nations at a point in time (e.g. OECD, 1982). Most time series of energy use are for the production of specific crops, such as Pimentel's long-running analy- sis of the energy cost of corn production in the USA (Pimentel et al., 1973; Pimentel et al., 1990).
Steinhart and Steinhart (1974) produced the first time series of aggregate energy use in agriculture, but as the authors themselves noted, the quality of their data was limited severely by the paucity of data and their methodology. The USA Department of Agricul- ture produced a census of energy use in agriculture in 1974 and 1978, providing a rich database for comparing energy use among different agricultural products and different farm operations in those years. Stout and Nehring (1988) extended that series to the years 1981, 1984, and 1985 using data on fuel prices and energy expenditures. Capalbo et al. (1985) developed an
index of fuel use in agriculture from 1948 to 1983 using a translog cost function. This method used the price, output share, and production cost share of energy to generate an index of energy use. This approach does not calculate the actual quantity of fuels actually used. Panesar and Fluck (1993) use the data from Capalbo et al. (1985) in their analysis of energy productivity in agriculture.
2.1. A model of direct energy use
The Economic Research Service of the USA Depart- ment of Agriculture (USDA) annually publishes data from 1910 to the present on the dollar value of two categories of energy use on USA farms: total fossil fuel use and electricity use. Expenditures on fossil fuel use are not disaggregated by fuel type. The following pro- cedure was used to estimate disaggregated fossil fuel use in physical units (MJ).
The total reported dollar expenditure on fossil fuels (TEe) is defined by
n
t ee = ~ P~i (1)
where Pi is the nominal price of fuel type i (cents per M J), xi is the quantity of fuel type i purchased and used on farms ( M J), and n is the number of fossil fuels used. It was assumed that n=4 : gasoline, distillate fuels (mostly diesel fuel), liquefied petroleum gas (LPG), and natural gas. This breakdown was based on other historical empirical analyses of direct fuel use on farms by Schurr and Netschert (1960), the 1964 Census of Agriculture, and Stout and Nehring (1988). Stout and Nehring (1988) summarize the fuel use data reported in the energy use surveys in the 1974 and 1978 census of energy use in agriculture (Torgerson and Cooper, 1980). The prices paid by farmers for each of these fuels are reported annually in the USDA's Agricultural Statistics.
The information on farm fuel prices was used to re- write equation (1) as:
TEe =plxl +pzx2 +pax3 +p4x4 (2)
where the p and the x are the prices and quantities, respectively, of gasoline, diesel fuel, LPG, and natural gas. The fuel share (z) for the ith fuel type is defined as"
C.J. Cleveland/Agriculture, Ecosystems and Environment 55 (1995) 111-121 113
n
Zi = xi / y'~xi (3) i
Data on fuel shares are from Schurr and Netschert (1960), the 1964 Census of Agriculture, and Stout and Nehring (1988), and the Nat ional Financial Summary published by the National Economic Research Service. These data covered the period from 1955 to 1990. It was assumed that fuel shares in the 1910 to 1954 period were the same as for 1955.
Equations (2) and (3) were combined to solve for the quantity of each fuel:
xl = ( ( z I T E ) / (
- P 4 - P l Z l +P4Zl --P2Z2 +P4Z2 --P3Z3 q-P4Z3) ) (4)
x2 = ( ( z2TE) / (
--P4 --PlZl q-P4Zl --P2Z2 "¥P4Z2 --P3Z3 "I-p4z3) ) (5)
X3 = ((z3TE) / (6)
- P 4 -P lZ l q-PaZl -P2Z2 +PaZ2 -P3Z3 q'-P4Z3) )
X4 = ( ( - - 1 -[- Z 1 + Z2 + z3TE) / (
- P 4 -P lZ l q-P4Zl --P2Z2 +P4Z2 -P3Z3 q-PaZ3) ) (7)
where x~, x2, x3, and x4 are the quantities of gasoline, diesel fuel, natural gas, respectively (MJ). Eqs. ( 4 ) - (7) were solved with the annual data from 1910 to 1990 with on total expenditures for fuels, fuel prices, and fuel shares to calculate the quantities of the four fossil fuels used on farms.
The calculation of electricity use was straightfor- ward. The total dollar expenditure on electricity (TEE) reported by the Economic Research Service was defined as
TE E = pEXE ( 8 )
where PE is the price of electricity paid by farmers (cents per MJ) and XE is the quantity of electricity used on farms ( M J). The price paid by farmers for electricity is reported annually in the USDA's Agricul tural Sta- tistics. Eq. (8) is solved for x using annual data from 1910 to 1990 on total expenditures for electricity and the price of electricity.
3. The indirect use of fossil fuels and electricity
Indirect energy use in agriculture is the energy used off the farm to manufacture inputs such as fertilizer and farm machinery. Most energy analyses rely on con- verting physical units of inputs (tonnes of fertilizer, tonnes of steel in tractors) to energy units using the energy cost of producing a unit of each input (MJ/ tonne of fertilizer or steel) (Leach, 1976; Doering, 1980; Lockeretz, 1980). One important advantage of using physical inputs to calculate indirect energy use is that detailed technical or engineering information can be used to assess specific commodities or processes, such as the production of fertilizers or tractors.
There are three shortcomings to this approach. First, the energy cost of producing inputs changes over time, but there is no consistent database that collects techni- cal and engineering information in physical units for the wide range of inputs used on farms. The lack of data that track theses changes forces some analysts to assume constant energy costs over long periods of time. For example, Pimentel et al. (1973), Pimentel et al. (1990) used a constant energy cost for the production of steel, fertilizers and chemicals in their analysis of corn production from 1700 through 1989. But the energy cost of producing many agricultural inputs has declined over time. For example, the quantity of direct fuel used in the Haber Bosch process to produce a MT of ammonia declined from nearly 900 GJ M T - ~ in 1900 to less than 40 MJ MT -~ today (Smil et al., 1983; Heath et al., 1985). The direct plus indirect energy used per unit output in the USA chemical industry, where all agricultural chemicals are produced, declined 20% from 1972 to 1985 (Office of Technology Assessment, 1990). The energy cost of many other materials pur- chased directly and indirectly by farmers have exhib- ited similar declines, such as the 70% decline in the energy cost of aluminum production from 1880 to 1980 (Ross, 1991; Atkins et al., 1991).
Dovring and McDowell (1980) speculate that the reduction in direct fuel use in manufacturing fertilizer could have been offset by the increase in indirect energy use embodied in new equipment and factories, although they offer no empirical evidence. It is highly unlikely that indirect energy costs could have increased more than direct fuel declined in the manufacture of fertil- izers. Heath et al. (1985) show that significant energy savings in the fertilizer industry came through
114 C.J. Cleveland/Agriculture, Ecosystems and Environment 55 (1995) 111-121
improved housekeeping and maintenance, not by more intensive use of capital. Moreover, much the new equipment and capital installed was itself manufactured with less energy-direct and indirect-due to the econ- omy-wide decrease in energy intensiveness over the past two decades. For example, the direct and indirect energy cost of producing farm machinery declined 24% from 1972 to 1985 (Office of Technology Assessment, 1990).
A second shortcoming of using physical units to calculate indirect energy use relates to agricultural serv- ices. Farmers buy insurance, financial services, irriga- tion services, services to repair and maintain buildings and equipment, veterinarian services, and other serv- ices. These expenditures represent a large and growing fraction of total costs, and hence total energy use. These inputs are impossible to represent in physical terms, and therefore are ignored in most energy cost calcula- tions.
A third shortcoming of using physical units is the lack of a standard methodology for calculating the energy embodied in the wide range of materials that farmers use. For example, Fluck and Baird (1980) cited more than 20 studies that generated various esti- mates of the energy required to produce a tonne of fertilizer. Similar ranges exist for other materials such as machinery. The result is that analyses of individual crop or livestock products often use estimates of energy cost sources that employ different methodologies and span long periods of time.
3.1. A model o f indirect energy use
Indirect energy use on farms has two components: energy used off the farm to manufacture inputs such as farm machinery, chemicals, fertilizers, and agricultural services, and the fuel used to generate the electricity purchased by farmers. The total indirect energy input to agriculture (I0 is defined as
It = ~-~ Ck., x ek,,+ [ (EtX rh) - E t ] (9) k
where Ck., is the dollar cost of the kth input, ek., is the energy intensity of the kth input (MJ $-~), Et is the quantity of electricity purchased by farmers as defined in Eq. (8), (MJ $-1) , and Et is the thermal efficiency of power plants in the USA (MJ of fuel input/MJ of electricity generated).
The dollar cost of inputs from 1910 to 1984 were taken from an historical analysis of farm production costs by the USDA Economic Research Service (Lucier et al., 1985). From 1985 forward these data were obtained from the annual National Financial
Summary published by the Economic Research Service which reports the total production costs paid by farm- ers. Included in the calculation of It are fertilizer, lime, pesticides and other chemicals, agricultural services, communication, irrigation, capital depreciation, oper- ation and maintenance of farm machinery and struc- tures, and miscellaneous expenses.
The basis of the energy intensities are the reports of the Energy Research Group at the University of Illinois (Herendeen and Bullard, 1974; Hannon et al., 1985). These sources used a consistent methodology to cal- culate sector-specific energy intensities for all of the major categories of farm production expenses for the years 1963, 1967, 1972, and 1977. For the intervening years a linear interpolation was used to estimate energy intensities. For the years prior to 1963 and subsequent to 1977, the energy intensities were extrapolated using the annual change in the ratio of USA energy use to Gross National Product (GNP).
The treatment of the energy cost of capital and labour merit additional elaboration. Whether or not to attribute an energy cost to human labour, an if so what method to apply, has been debated since energy analysis was first applied to agriculture in the 1970s (Black, 1971; Odum, 1971; Pimentel et al., 1973; Leach, 1976; Sles- ser, 1978; Fluck and Baird, 1980; Stanhill, 1984; Hall et al., 1986). Fluck and Baird (1980) reviewed seven different approaches, ranging from the muscular energy expended by labour (Makhijani, 1975), to the food energy consumed by labour (Pimentel et al., 1973), to the energy embodied in the goods and services pur- chased with the income of labour (Odum and Odum, 1976; Costanza, 1980). The lack of a generally accepted accounting procedure led many analysts to omit the energy cost of labour (e.g. Leach, 1976). Stanhill (1984) noted two situations where such a measure is essential: the analysis of traditional agricul- ture in which labour is the dominant input, and the measurement of the substitution of energy and other inputs for labour during agricultural development. This analysis deals with neither of those cases, so no energy measure of labour is included. Like Leach (1976) and
C.J. Cleveland~Agriculture, Ecosystems and Environment 55 (1995) 111-121 115
Stanhill (1984), however, I acknowledge the impor- tance of such a measure in certain instances.
The measurement of the energy cost of capital can be equally vexing (Doering, 1980; Foster et al., 1980). A common approach is to assess the energy required to produce a tonne of steel or other material used in a capital good such as a tractor, the energy required to operate it and maintain it over its lifetime, and then to allocate that energy over the expected lifetime of the tractor (Leach, 1976; Doering, 1980). One advantage of this approach is that it provides a detailed assessment at a point in time in the energy required to produce a specific capital good. One problem with this approach is that the energy cost of materials change with time, and hence the energy cost of tractors and other capital made from those materials changes as well. Generally, time series data on such changes are not available, forcing analysts to use energy costs based on one year's data in long time series (Steinhart and Steinhart, 1974; Leach, 1976; Pimentel et al., 1990). Another problem with using physical inputs to measure capital is that some forms of capital use usually are included (e.g. tractors), while other forms of capital (buildings) fre- quently are excluded.
Following Panesar and Fluck (1993) the capital input to agriculture was measured by the dollar value of capital depreciation on farms as reported by the Economic Research Service. Capital depreciation admittedly is a rough proxy for the amount of capital consumed each year, but it does provide a consistent measure of all types of capital use over time. Such consistency is important in analyses that seek to meas- ure changes in energy use over time. Unlike Panesar and Fluck (1993), the energy intensity of capital was not assumed constant for the reasons cited above. Mul- tiplying the capital depreciation of each major input in a year by the energy intensity of that input gives a measure of the energy consumed in capital.
4. Measuring the productivity of energy use
A common application of information on energy use in agriculture is to compare it to the quantity of food output it produces in a given year (Pimentel et al., 1973; Steinhart and Steinhart, 1974; Leach, 1976; Stanhill, 1984; Gever et al., 1986; Hall et al., 1986; Panesar and Fluck, 1993; Bonny, 1993; Cleveland, 1995). Panesar
and Fluck (1993) reviewed some important issues sur- rounding the measurement of energy productivity. Energy productivity in agriculture at time t (PI,) was defined as:
(index of output) Pit= (10)
(index of energy input)
where the numerator is an index of the output of the entire farm sector using two different indices of output. The first is the USA Department of Agriculture's index (1977= 100) of total agricultural output which includes the production of crops, fruits, and vegetables, and animal products. The output index is a Laspeyres index that weights the physical units of individual foods produced with their unit prices in a base period. The second measure of output is Gross Farm Product, the value added in the farm sector, reported in constant dollars and indexed to 1977 = 100 (Bureau of the Cen- sus, 1976; Economic Report to the President, 1995). The denominator ofEq. (10) is an index ( 1977 = 100) of the direct and indirect energy use as calculated in Eqs. (4 ) - (9 ) .
5. Results
5.1. Changes in energy use
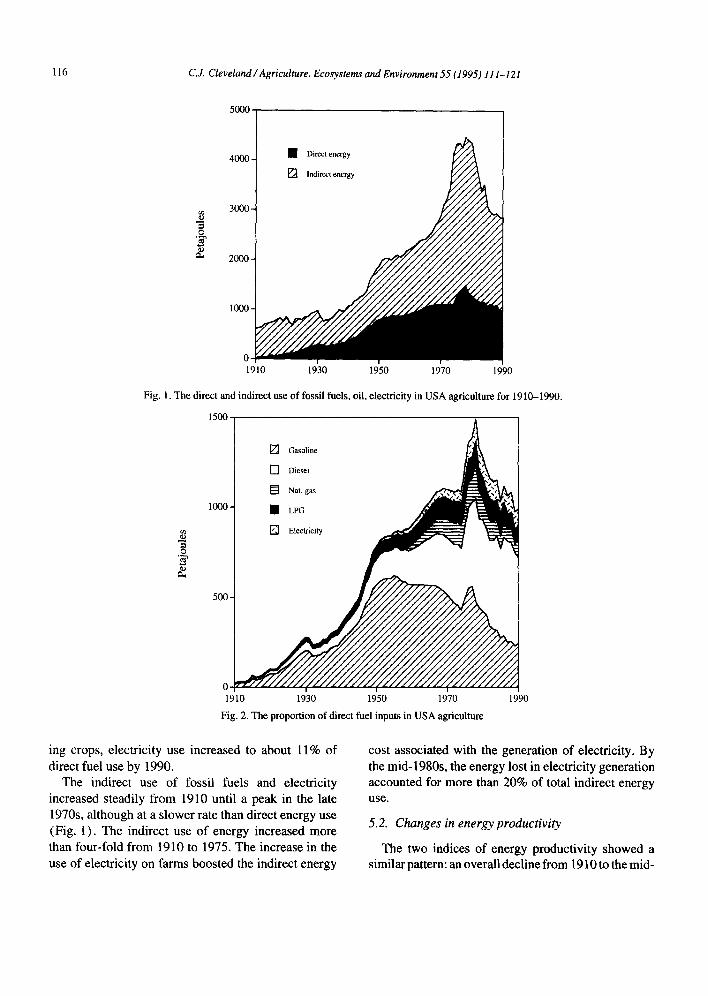
The direct and indirect use of fossil fuels and elec- tricity increased more than six-fold from 1910 to 1978, reaching a peak of 4.4 EJ, equivalent to about 5% of national energy use in 1978 (Fig. 1 ). Total energy use declined 33% from 1978 to 1990.
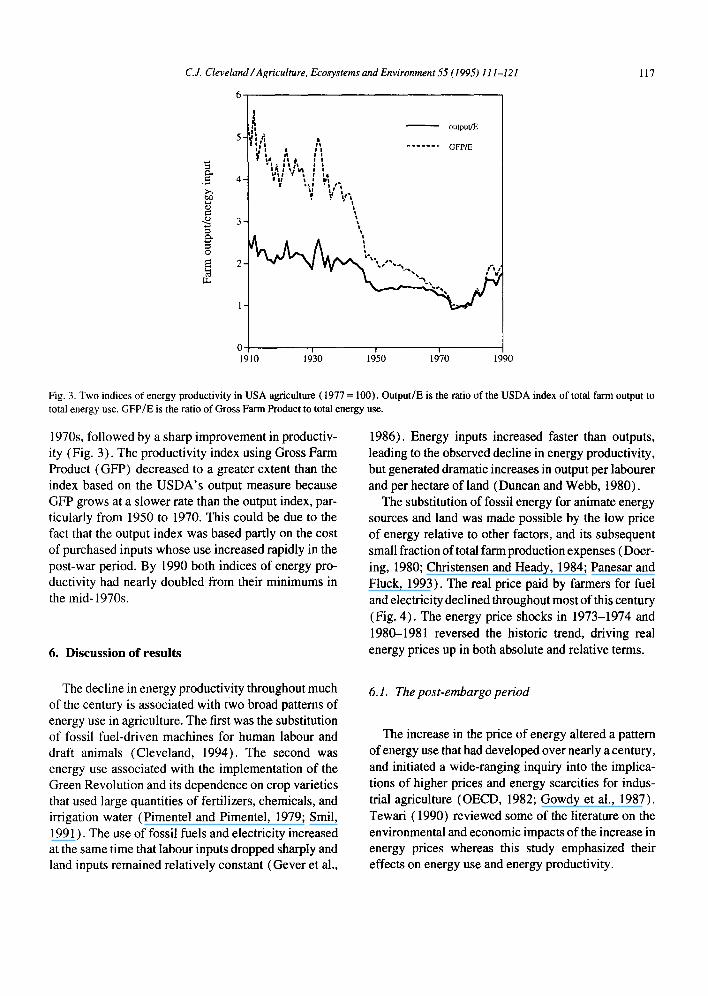
The composition of direct fuel and electricity use showed two important trends (Fig. 2). The first was a shift from gasoline to diesel as the principal fuel for farm machinery and vehicles. The diesel engine is a more desirable prime mover because diesel fuel has more MJ per liter and delivers more mechanical energy per MJ compared to gasoline (Bloome et al., 1977). Diesel tractors were introduced in 1931 (Dieffenbach and Gray, 1960), but it was not until the 1950s that the rapid shift to diesel fuel began and continued through the 1990s when the diesel share of direct fuel use was twice that of gasoline. The second significant pattern was the overall increase in the importance of electricity. Used principally for pumping irrigation water and dry-
116 C.J. Cleveland~Agriculture, Ecosystems and Environment 55 (1995) 111-121
5000
4000.
3000.
@
~" 2000-
1000-
0 o
1910 1930 1950 1970 1990
Fig. 1. The direct and indirect use of fossil fuels, oil, electricity in USA agriculture for 1910-1990.
1500
1000-
500-
0 I
1910
Fig. 2. The proportion of direct fuel inputs in USA agriculture
[ ] Gasoline
O e,o, I k \
1930 1950 1970 1990
ing crops, electricity use increased to about 11% of direct fuel use by 1990.
The indirect use of fossil fuels and electricity increased steadily from 1910 until a peak in the late 1970s, although at a slower rate than direct energy use (Fig. 1). The indirect use of energy increased more than four-fold from 1910 to 1975. The increase in the use of electricity on farms boosted the indirect energy
cost associated with the generation of electricity. By the mid-1980s, the energy lost in electricity generation accounted for more than 20% of total indirect energy use .
5.2. Changes in energy productivity
The two indices of energy productivity showed a similar pattern: an overall decline from 1910 to the mid-
C.J. Cleveland/Agriculture, Ecosystems and Environment 55 (1995) 111-121 117
6-
5-
.~ 4-
"~ 3.
0
1-
I output/E ! | •
Ill I ~ i I ill i . . . . . . . GFP/E I n I i
#1 I I ; i I I
i l l # v i | 14 I l# I i ~1
I i ~1 I I I% t l I ~ I .
\ I \
I t
0 1910 19130 19150 19170 1990
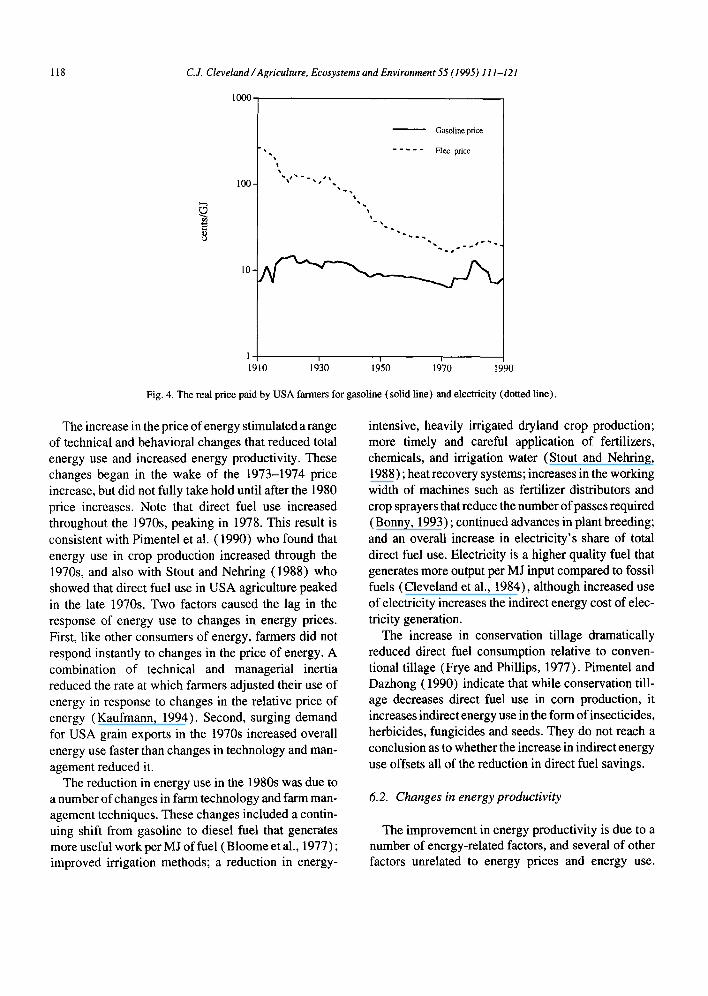
Fig. 3. Two indices of energy productivity in USA agriculture (1977 = 100). Output/E is the ratio of the USDA index of total farm output to total energy use. GFP /E is the ratio of Gross Farm Product to total energy use.
1970s, followed by a sharp improvement in productiv- ity (Fig. 3). The productivity index using Gross Farm Product (GFP) decreased to a greater extent than the index based on the USDA's output measure because GFP grows at a slower rate than the output index, par- ticularly from 1950 to 1970. This could be due to the fact that the output index was based partly on the cost of purchased inputs whose use increased rapidly in the post-war period. By 1990 both indices of energy pro- ductivity had nearly doubled from their minimums in the mid- 1970s.
6. D i scuss ion o f results
1986). Energy inputs increased faster than outputs, leading to the observed decline in energy productivity, but generated dramatic increases in output per labourer and per hectare of land (Duncan and Webb, 1980).
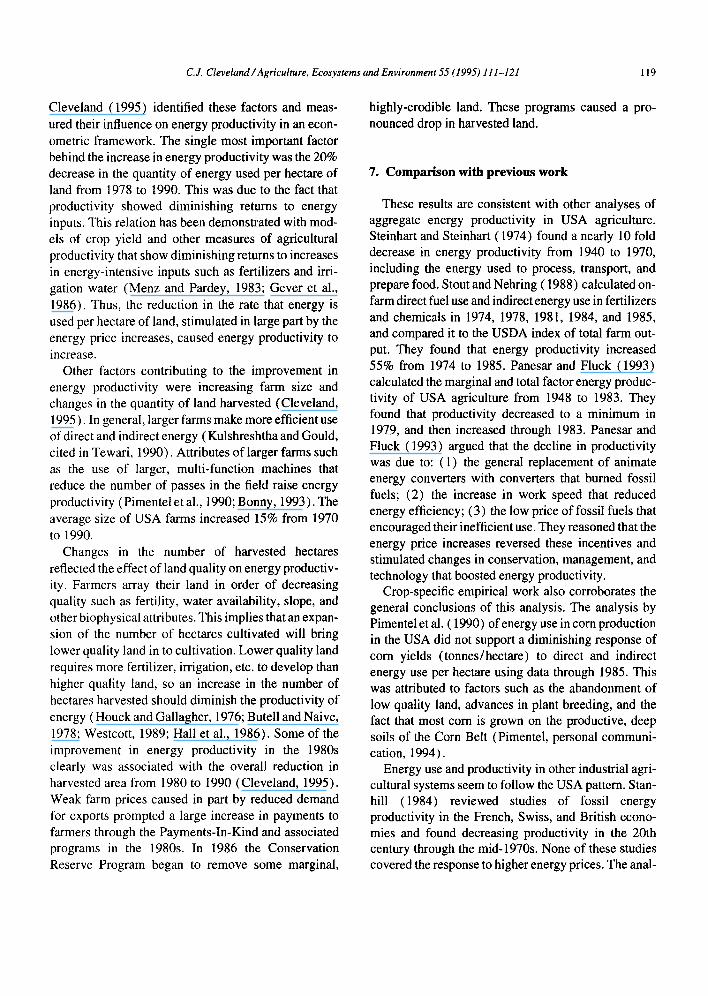
The substitution of fossil energy for animate energy sources and land was made possible by the low price of energy relative to other factors, and its subsequent small fraction of total farm production expenses (Doer- ing, 1980; Christensen and Heady, 1984; Panesar and Fluck, 1993). The real price paid by farmers for fuel and electricity declined throughout most of this century (Fig. 4). The energy price shocks in 1973-1974 and 1980-1981 reversed the historic trend, driving real energy prices up in both absolute and relative terms.
The decline in energy productivity throughout much of the century is associated with two broad patterns of energy use in agriculture. The first was the substitution of fossil fuel-driven machines for human labour and draft animals (Cleveland, 1994). The second was energy use associated with the implementation of the Green Revolution and its dependence on crop varieties that used large quantities of fertilizers, chemicals, and irrigation water (Pimentel and Pimentel, 1979; Smil, 1991 ). The use of fossil fuels and electricity increased at the same time that labour inputs dropped sharply and land inputs remained relatively constant (Gever et al.,
6.1. The post-embargo period
The increase in the price of energy altered a pattern of energy use that had developed over nearly a century, and initiated a wide-ranging inquiry into the implica- tions of higher prices and energy scarcities for indus- trial agriculture (OECD, 1982; Gowdy et al., 1987). Tewari (1990) reviewed some of the literature on the environmental and economic impacts of the increase in energy prices whereas this study emphasized their effects on energy use and energy productivity.
118 C.J. Cleveland/Agriculture, Ecosystems and Environment 55 (1995) 111-121
1000.
©
100-
10-
Gasoline price
' • ~ - . . . . Elec. price
\
i
1 1910 19130 1950 1~70 1990
Fig. 4. The real price paid by USA farmers for gasoline (solid line) and electricity (dotted line).
The increase in the price of energy stimulated a range of technical and behavioral changes that reduced total energy use and increased energy productivity. These changes began in the wake of the 1973-1974 price increase, but did not fully take hold until after the 1980 price increases. Note that direct fuel use increased throughout the 1970s, peaking in 1978. This result is consistent with Pimentel et al. (1990) who found that energy use in crop production increased through the 1970s, and also with Stout and Nehring (1988) who showed that direct fuel use in USA agriculture peaked in the late 1970s. Two factors caused the lag in the response of energy use to changes in energy prices. First, like other consumers of energy, farmers did not respond instantly to changes in the price of energy. A combination of technical and managerial inertia reduced the rate at which farmers adjusted their use of energy in response to changes in the relative price of energy (Kaufmann, 1994). Second, surging demand for USA grain exports in the 1970s increased overall energy use faster than changes in technology and man- agement reduced it.
The reduction in energy use in the 1980s was due to a number of changes in farm technology and farm man- agement techniques. These changes included a contin- uing shift from gasoline to diesel fuel that generates more useful work per MJ of fuel (Bloome et al., 1977 ) ; improved irrigation methods; a reduction in energy-
intensive, heavily irrigated dryland crop production; more timely and careful application of fertilizers, chemicals, and irrigation water (Stout and Nehring, 1988); heat recovery systems; increases in the working width of machines such as fertilizer distributors and crop sprayers that reduce the number of passes required (Bonny, 1993) ; continued advances in plant breeding; and an overall increase in electricity's share of total direct fuel use. Electricity is a higher quality fuel that generates more output per MJ input compared to fossil fuels (Cleveland et al., 1984), although increased use of electricity increases the indirect energy cost of elec- tricity generation.
The increase in conservation tillage dramatically reduced direct fuel consumption relative to conven- tional tillage (Frye and Phillips, 1977). Pimentel and Dazhong (1990) indicate that while conservation till- age decreases direct fuel use in corn production, it increases indirect energy use in the form of insecticides, herbicides, fungicides and seeds. They do not reach a conclusion as to whether the increase in indirect energy use offsets all of the reduction in direct fuel savings.
6.2. Changes in energy productivity
The improvement in energy productivity is due to a number of energy-related factors, and several of other factors unrelated to energy prices and energy use.
C.J. Cleveland/Agriculture, Ecosystems and Environment 55 (1995) 111-121 119
Cleveland (1995) identified these factors and meas- ured their influence on energy productivity in an econ- ometric framework. The single most important factor behind the increase in energy productivity was the 20% decrease in the quantity of energy used per hectare of land from 1978 to 1990. This was due to the fact that productivity showed diminishing returns to energy inputs. This relation has been demonstrated with mod- els of crop yield and other measures of agricultural productivity that show diminishing returns to increases in energy-intensive inputs such as fertilizers and irri- gation water (Menz and Pardey, 1983; Gever et al., 1986). Thus, the reduction in the rate that energy is used per hectare of land, stimulated in large part by the energy price increases, caused energy productivity to increase.
Other factors contributing to the improvement in energy productivity were increasing farm size and changes in the quantity of land harvested (Cleveland, 1995). In general, larger farms make more efficient use of direct and indirect energy (Kulshreshtha and Gould, cited in Tewari, 1990). Attributes of larger farms such as the use of larger, multi-function machines that reduce the number of passes in the field raise energy productivity (Pimentel et al., 1990; Bonny, 1993). The average size of USA farms increased 15% from 1970 to 1990.
Changes in the number of harvested hectares reflected the effect of land quality on energy productiv- ity. Farmers array their land in order of decreasing quality such as fertility, water availability, slope, and other biophysical attributes. This implies that an expan- sion of the number of hectares cultivated will bring lower quality land in to cultivation. Lower quality land requires more fertilizer, irrigation, etc. to develop than higher quality land, so an increase in the number of hectares harvested should diminish the productivity of energy (Houck and Gallagher, 1976; Butell and Naive, 1978; Westcott, 1989; Hall et al., 1986). Some of the improvement in energy productivity in the 1980s clearly was associated with the overall reduction in harvested area from 1980 to 1990 (Cleveland, 1995). Weak farm prices caused in part by reduced demand for exports prompted a large increase in payments to farmers through the Payments-In-Kind and associated programs in the 1980s. In 1986 the Conservation Reserve Program began to remove some marginal,
highly-erodible land. These programs caused a pro- nounced drop in harvested land.
7. Comparison with previous work
These results are consistent with other analyses of aggregate energy productivity in USA agriculture. Steinhart and Steinhart (1974) found a nearly 10 fold decrease in energy productivity from 1940 to 1970, including the energy used to process, transport, and prepare food. Stout and Nehring (1988) calculated on- farm direct fuel use and indirect energy use in fertilizers and chemicals in 1974, 1978, 1981, 1984, and 1985, and compared it to the USDA index of total farm out- put. They found that energy productivity increased 55% from 1974 to 1985. Panesar and Fluck (1993) calculated the marginal and total factor energy produc- tivity of USA agriculture from 1948 to 1983. They found that productivity decreased to a minimum in 1979, and then increased through 1983. Panesar and Fluck (1993) argued that the decline in productivity was due to: (1) the general replacement of animate energy converters with converters that burned fossil fuels; (2) the increase in work speed that reduced energy efficiency; (3) the low price of fossil fuels that encouraged their inefficient use. They reasoned that the energy price increases reversed these incentives and stimulated changes in conservation, management, and technology that boosted energy productivity.
Crop-specific empirical work also corroborates the general conclusions of this analysis. The analysis by Pimentel et al. (1990) of energy use in corn production in the USA did not support a diminishing response of corn yields (tonnes/hectare) to direct and indirect energy use per hectare using data through 1985. This was attributed to factors such as the abandonment of low quality land, advances in plant breeding, and the fact that most corn is grown on the productive, deep soils of the Corn Belt (Pimentel, personal communi- cation, 1994).
Energy use and productivity in other industrial agri- cultural systems seem to follow the USA pattern. Stan- hill (1984) reviewed studies of fossil energy productivity in the French, Swiss, and British econo- mies and found decreasing productivity in the 20th century through the mid-1970s. None of these studies covered the response to higher energy prices. The anal-
120 C.J. Cleveland / Agriculture, Ecosystems and Environment 55 (1995) 111-121
ysis by Bonny (1993) of energy use in French agri- culture spanned 1958-1989, and found a similar pattern of energy productivity: a generally decreasing trend through the late 1970s, followed by a significant improvement through the 1990s. Bonny attributed the improvement to changes in technology and farm man- agement that were stimulated by the energy price shocks.
8. Conclusions
The energy basis of industrial food production has a rich tradition, but quantitative analysis of changes in energy use in agriculture has been limited by the lack of consistent data. This analysis used a new method- ology for calculating the direct and indirect use of fossil fuels in agriculture. The procedure was used to quantify energy use in USA agriculture from 1910 to 1990. The results showed a substantial overall increase in energy use from 1910 through the 1970s, and a shift from gasoline to diesel fuel and electricity. The use of all fuels declined in the 1980s.
Two measures of energy productivity are calculated that compare total farm output to total energy use on farms. Both measures showed a substantial decline in energy productivity through the 1970s, a trend consis- tent with the substitution of fossil fuels for animate power and with the low price of fossil fuels relative to other inputs. Energy productivity rose in the 1980s due to a diminution in the rate of energy use, a reduction in the number of harvested acres, and larger farms. The results showed a clear response of farmers to higher energy prices that resulted in technical and managerial changes that improved energy productivity.
References
Atkins, P.R., Willoughby, D. and Hittner, H.J., 1991. Some energy and environmental impacts of aluminum usage. In: J.W. Tester, D.O. Wood and N.A. Ferrari (Editors), Energy and the Environ- ment in the 21st Century. MIT Press, Cambridge, MA, pp. 383- 387.
Bayliss-Smith, T.P., 1984. Energy flows and agrarian change in Kar- nataka: the Green revolution at micro-scale. In: T.P. Bayliss- Smith (Editor), Understanding Green Revolutions. Cambridge University Press, Cambridge, MA, pp. 153-172.
Black, J.N., 1971. Energy relations in crop production - - a prelimi- nary survey. Ann. Appl. Biol., 67: 272-278.
Bloome, P.D., Grevis-James, l.W., Jones, L.K. and Batchelder, D.G, 1977. Farm machinery ideas that save energy. In: U.S. Depart- ment of Agriculture (Editor), Agricultural Yearbook. Govern- ment Printing Office, Washington, D.C.
Bonny, S., 1993. Is agriculture using more energy? a French case study. Agric. Systems, 43: 51-66.
Bureau of the Census, 1976./ Historical statistics of the United States. Government Printing Office, Washington, D.C.
Butell, R. and Naive, J.J., 1978. Factors Affecting Corn Yields. Feed Situation. U.S. Department of Agriculture.
Capalbo, S.M., Vo, T. and Wade, J., 1985. An econometric database for measuring agricultural productivity and characterizing the structure of U.S. agriculture. Resources for the Future, Washing- ton, D.C.
Christensen, D.A. and Heady, E.O., 1984. Impacts of energy price increases on the well-being of farmers and consumers. Energy Systems and Policy, 8: 293-312.
Cleveland, C.J., Costanza, R., Hall, C.A.S. and Kaufmann, R., 1984. Energy and the U.S. economy: a biophysical perspective. Sci- ence, 255: 890-897.
Cleveland, Cutler J., 1994. Re-Allocating Work Between Human and Natural Capital. In: A.M. Jansson, M. Hammer, C. Folke and R. Costanza (Editors), Investing in Natural Capital: An Ecolog- ical Economic Perspective. Island Press, Covelo, CA, pp. 179- 199.
Cleveland, C.J., 1995. Resource degradation, technical change, and the productivity of energy use in U.S. agriculture. Ecol. Econ., 13: 185-201.
Costanza, R., 1980. Embodied energy and economic evaluation. Science, 210: 1219-1224.
Doering, O.C., 1980. Accounting for energy in farm machinery and buildings. In: D. Pimentel (Editor), Handbook of Energy Utili- zation in Agriculture. CRC Press, Boca Raton, FL, pp. 9-23.
Dieffenbach, E.M. and Gray, R.B., 1960. The development of the tractor. Agricultural Yearbook 1960, pp. 24-45.
Dovring, F. and McDowell, D.R., 1980. Energy use for fertilizers. Illinois Agricultural Economics Staff Paper 80 E-102, Depart- ment of Agricultural Economies, University of Illinois, Urbana, IL.
Duncan, M. and Webb, K., 1980. Energy and American Agriculture. Federal Reserve Bank of Kansas City, Kansas City, 41 pp.
Dvoskin, D., Heady, E.O. and English, B.C., 1978. Energy use in U.S. agriculture: An evaluation of national and regional impacts from alternative energy policies. Center for Energy and Rural Development, University of Iowa, Ames, IA.
Economic Report to the President, 1995. Government Printing Office, Washington, D.C.
Fluck, R.C., 1979. Energy productivity: a measure of energy utili- zation in agricultural systems. Agric. Systems, 4: 29-37.
Fluck, R.C. and Baird, C.D., 1980. Agricultural Energetics. Avi Publishing, Westport.
Foster, P., Flemming, J. and Wichelns, D., 1980. Energy accounting: the case of farm machinery in Maryland. Southern J. Agric. Econ., 12: 189-192.
Frye, W.W. and Phillips, S.H., 1977. How to grow crops with less energy. In: U.S. Department of Agriculture (Editor), Agricul- tural Yearbook. Government Printing Office, Washington, D.C.

C.J. Cleveland/Agriculture, Ecosystems and Environment 55 (1995) 111-121 121
Gever, J., Kaufmann, R., Skole, D. and Vorosmarty, C., 1986. Beyond Oil: The Threat to Food and Fuel in the Coming Decades. Ballinger, Cambridge, 304 pp.
Gowdy, J.M., Miller, J.L. and Kberbachi, H., 1987. Energy use in U.S. agriculture: early adjustment to the 1973-1974 price shock. Southern J. Agric. Econ., 42: 33-41.
Hall, C.A.S., Cleveland, C.J. and Kaufmann, R., 1986. Energy and Resource Quality: The Ecology of the Economic Process. Wiley, New York.
Hannon, B.M., Casler, S.D. and Blazeck, T., 1985. Energy Intensities for the U.S. Economy --1977. Energy Research Group, Univer- sity of Illinois, Urbana, IL, 48 pp.
Heath, R., Mulckhuyse, J. and Venkataraman, S., 1985. The potential for energy efficiency in the fertilizer industry. World Bank Tech- nical Paper Number 35, Washington, D.C.
Herendeen, R.A. and Bullard, C.W., 1974. Energy Costs of Goods and Services. CAC Document 140. Energy Research Group, University of Illinois, Urbana, 39 pp.
Houck, J.P. and Gallagher, P.W., 1976. The price responsiveness of U.S. corn yields. Am. J. Agric. Econ., 58: 731-734.
Kaufmann, R.K., 1994. The relation between marginal product and price in U.S. energy markets. Energy Econ., 16: 145-158.
Kendall, H.W. and Pimentel, D., 1994. Constraints on the expansion of the global food supply. Ambio, 23: 198-205.
Leach, G., 1976. Energy and Food Production. IPC Science and Technology Press, Guildford, UK.
Lockeretz, W. (Editor), 1977. Agriculture and Energy. Academic Press, New York.
Lockeretz, W., 1980. Energy inputs for nitrogen, phosphorous, and potash fertilizers. In: D. Pimentel (Editor), Handbook of Energy Utilization in Agriculture. CRC Press, Boca Raton, FL, pp. 23- 33.
Lucier, G., Chesley, A. and Abeam, M., 1985. Farm Income Data: An Historical Perspective. Economic Research Service, U.S. Department of Agriculture.
Makhijani, A., 1975. Energy and Agriculture in the Third Word. Ballinger, Cambridge.
Menz, K.M. and Pardey, P., 1983. Technology and U.S. corn yields: plateaus and price responsiveness. Am. J. Agfic. Econ., 65: 558- 562.
OECD, 1982. The Energy Problem and the Agro-Food Sector. Organization of Economic Cooperation and Development, Pads.
Office of Technology Assessment, 1990. Energy Use and the U.S. Economy. Government Printing Office, Washington, D.C., 78
PP. Odum, H.T., 1971. Environment, Power and Society. Wiley, New
York, 289 pp.
Odum, H.T. and Odutn, E.C., 1976. Energy Basis for Man and Nature. McGraw-Hill, New York, 297 pp.
Panesar, B.S. and Fluck, R.C., 1993. Energy productivity of a pro- duction system: analysis and measurement. Agric. Systems, 43: 415-437.
Pimentel, D., Hurd, L.E., BeUotti, A.C., Forester, M.J., Oka, N., Sholes, O.D. and Whitman, R.J., 1973. Food production and the energy crisis. Science, 182: 443--449.
Pimentel, D. and Pimentel, M., 1979. Food, Energy and Society. Edward Arnold, London, 165 pp.
Pimentel, D. and Dazhong, W., 1990. Technological changes in energy use in U.S. agricultural production. In: C.R. Carroll, J.H. Vandermeer and P. Rosset (Editors), Agroecology. McGraw- Hill, New York, pp. 147-164.
Ross, M., 1991. Modeling the energy intensity and carbon dioxide emissions in U.S. manufacturing. In: J.W. Tester, D.O. Wood and N.A. Ferrad (Editors), Energy and the Environment in the 21st Century. MIT Press, Cambridge, MA, pp. 297-310.
Pimentel, D., Dazhong, W. and Giampietro, M., 1990. Technological changes in energy use in U.S. agricultural production. In: S.R. Gleissman (Editor), Agroecology. Springer, New York, pp. 305-321.
Schurr, S. and Netschert, B., 1960. Energy and the American Econ- omy, 1850-1975. Johns Hopkins University Press, Baltimore, MD.
Slesser, M., 1978. Energy in the Economy. St. Martin's Press, New York.
Smil, V., 1991, General Energetics: Energy in the Biosphere and Civilization. Wiley, New York, 369 pp.
Smil, V., Nachman, P. and Long, T.V., 1983. Energy Analysis and Agriculture: An Application to U.S. Corn Production. Westview Press, Boulder, CO, 191 pp.
Stanhill, G. (Editor), 1984. Energy and Agriculture. Springer, Ber- lin.
Steinhart, J.S. and Steinhart, C.E., 1974. Energy use in the U.S. food system. Science, 184: 307-316.
Stout, B.A. and Nehring, R.F., 1988. Agricultural energy: 1988 and the future. Phi Kappa Phi J., 68: 32-36.
Tewad, D.D., 1990. Energy price impacts modelling in the agricul- ture sector. Energy Econ., 12: 147-158.
Torgerson, D. and Cooper, H., 1980. Energy and U.S. Agriculture: 1974 and 1978. United States Department of Agriculture.
Westcott, P.C., 1989. An analysis of factors influencing corn yields. U.S. Department of Agriculture, Feed Situation and Outlook Report FdS-310, pp. 16-22.


![Der Gebirgsbote 1910 [Jg. 63] - Biblioteka Cyfrowa](https://static.fdokumen.com/doc/165x107/63249a4e3a06c6d45f06a28d/der-gebirgsbote-1910-jg-63-biblioteka-cyfrowa.jpg)