Electricity and Climate Change
260
-
Upload
khangminh22 -
Category
Documents
-
view
0 -
download
0
Transcript of Electricity and Climate Change

Electricity & climate change
SEEKING FOR THE TRIPLE NEXUS OF ELECTRIFICATION,
CLIMATE CHANGE MITIGATION,
AND CLIMATE CHANGE ADAPTATION
DISSERTATION
to obtain
the degree of doctor at the University of Twente,
on the authority of the rector magnificus,
Prof. dr. T.T.M. Palstra,
on account of the decision of the graduation committee,
to be publicly defended
on Thursday, the 21st of November 2019 at 12:45 hrs
by
Kamia Handayani
born on the 27th of May 1978
In Garut, Indonesia

This dissertation has been approved by
Prof. dr. T. Filatova
Dr. Y. Krozer

Graduation committee:
Chair and secretary
Prof. dr. T.A.J. Toonen University of Twente
Promotor
Prof. dr. T. Filatova University of Twente
Co-Supervisor
Dr. Y. Krozer University of Twente
Members:
Prof. dr. J.S. Clancy University of Twente
Dr. M.J. Arentsen University of Twente
Prof. dr. P. Herder Delft University of Technology
Prof. dr. K. Blok Delft University of Technology
Prof. dr. K. Lindgren Chalmers University of Technology

Colophon
Copyright ©2019, Kamia Handayani, University of Twente, BMS-CSTM
All rights reserved. No parts of this dissertation may be reproduced,
stored in a retrieval system, or transmitted in any form or by any means
without prior written permission of the author.
Cover design: Edi Trihartono Nuryatno
Published by: Ipskamp printing, Enschede, the Netherlands
ISBN: 978-90-365-4890-8
DOI: 10.3990/1.9789036548908
URL: https://doi.org/10.3990/1.9789036548908
This work was funded by The Indonesian Endowment Fund for Education
(LPDP) under Grant No. PRJ-2570/LPDP/2015, and supported by PT
PLN (Persero).

i
Acknowledgments
All praise is due to Allah, Lord of the universe.
It was January 2016 when I started my PhD journey. Here I am now, writing
the last part of my dissertation book. This book exists due to hard work
and the tremendous support received from many people and organizations.
I would like to take this opportunity to express my gratitude to those who
have significantly contributed to this achievement.
I am deeply grateful to my husband and my two daughters for
accompanying me during the course of my PhD, for their full understanding,
and for always being my fanatical supporters. I owe everything to my
parents. Their prayers and their selfless, unwavering support throughout
my life have made me who I am today. I am always thankful to my mother-
in-law for giving her blessing to us living far from home these past four
years. I thank my late sister, Teh Yuniar, for her kindness – my prayers
are always with you. I appreciate my little sister, Ina, for taking care of our
parents while I am away from home.
My deepest appreciation goes to my supervisors, Prof. Tatiana Filatova
and Prof. Yoram Krozer, who consistently provided constructive feedback
and support at critical points of my research development. Tatiana, you
are indeed a great mentor. Coming from the industry, I have greatly
benefited from your valuable insights concerning the academic world. Your
expertise and wisdom helped to shape my research talent, and your careful
attention to detail and your well-structured thoughts helped to vastly
improve my academic writing skill. Thank you for giving me challenges
when I needed them, and for supporting me when I was in doubt. Your
commitment as a supervisor is remarkable. I remember you called me from
Sydney late at night to provide me with mental support, and you responded
to one of my emails while admitted to a hospital. You are an exceptionally
kind and warm person. Your feedback was always encouraging and made
me felt appreciated. I am also indebted to you for your great reference

ii
letters, which have led to several travel grants and admissions to high-
quality research schools.
My intellectual debt is to Yoram. Yoram, you are the first person to
introduce me to academia. Our master thesis project roused my interest
in undertaking PhD research. Your critical yet constructive views have
improved my capabilities. I remember those first weeks when you
challenged me to explore “technological change” in energy modeling. One
and a half years later, my work was published in Energy Policy. I always
appreciated your swift responses to my queries and your timely feedback.
For me, you are not just a supervisor, but also a generous friend. Thank
you for the treats during our lunch meetings. My family and I were also
grateful to you for inviting us to stay at your place during a vacation in
Amsterdam.
My sincere gratitude goes to the rest of my graduation committee from
the University of Twente: Prof. Joy S. Clancy and Dr. Maarten J. Arentsen.
I feel honored to have you both as part of my PhD graduation committee.
Thank you very much for your professional feedback during my qualifier
presentation and for reading and assessing my dissertation book. I extend
my sincere gratitude to the external committee members: Prof. Paulien
Herder, Prof. Kristian Lindgren, and Prof. Kornelis Blok. It is a great honor
to have you all in my committee. Thank you for taking the time to read
and evaluate my book.
This book would not have been possible without the support from a number
of organizations. I would like to express my gratitude to LPDP for their
financial support and to PLN for supporting me during my study leave.
Throughout the data collection process, I received persistent support from
Indonesia’s three electric utilities: PLN, IP and PJB. I am thankful to SEI
and to IBM for providing free access to the LEAP software and the CPLEX
software, respectively. Several research schools made contributions at
different points in my PhD journey: the CERES research school during the
construction of my research proposal, the Research on Sustainable

iii
Development summer school, organized by the University of Basel, during
the development of Chapter 3, and the ETH-EAERE winter school during
the preparation of Chapter 5. I would also like to thank the Energy
Academy Indonesia (Ecadin) for the opportunity to share my research with
the Indonesian energy community. Finally, I am grateful for the opportunity
to share a panel with resourceful people in COP24, organized by the
Indonesian pavilion, TYK Consulting and Action Research, and Ecadin.
This book has had support from many individuals. Taylor Bennington and
Emily Gosh from SEI provided answers to my queries on the LEAP
software. Faris Al Rasyid helped me during the analysis of Chapter 4. Pinto
Anugrah has run the WEAP simulation used in Chapter 5. I am also thankful
to Aji P. Perdana for his assistance in using ArcGIS software to retrieve
the CIMP5 SST data. I appreciate the help from Dr. Musa Marbun, Anindita
Nugraha, Marwah, Wuri Prasetyo, Andrey Kennedy, Muhammad Maulana
Saputra, Arief Sugiyanto, Fitria Leli, Amna Apriliani, Ricky Aldrian, Pak
Ajrun, Mbak Mekkadinah, Pak Purnomo, Pak Wisnu, Pak Hijrah, Pak Ismail,
Pak Romadhony, Pak Alan, Tania, Pak Haris, Bu Esti, Ofa, Pak Kristofa,
Mbak Indah, Dian, Pak Wayan, Pak Lingga, and Eko for their support in the
data collection process. Finally, I appreciate the generous support from all
resourceful people and respondents of the three utilities who contributed
with their knowledge, experience, and time during my fieldwork and
afterward.
I am blessed to have been surrounded by wonderful people throughout this
path. The Department of Government and Technology for Sustainability
(CSTM) has been my second home since 2016. I would like to thank Prof.
Hans Bressers for accepting me at CSTM in the first place. I extend my
gratitude to Prof. Michiel Heldeweg and all senior staff members for the
good times we shared in the office as well as in our outbound gathering. I
am thankful to Barbera, who was always there to help me with general
affairs throughout my PhD trajectory. I am also grateful to Annemiek, who
helped me a lot with the administrative procedures at the beginning of my
PhD research project. I enjoyed the company of Karen - who serves as

iv
my first paranymph - this past three years. We have shared memorable
times during countless lunches, dinners, sports, and our girl talks. Thank
you for being a great friend! I also thank Dwi, my second paranymph, for
the wonderful times we shared at the office, Basel summer school, COP24,
and within the Indonesian community in Enschede. It is my pleasure to
acknowledge my PhD colleagues at CSTM for the good times we shared:
Heksi, Amro, Brayton, Juliane, Franziska, Juli, Kristina, Kenia, and
Alessandro. I also enjoyed the times spent with my previous PhD
colleagues: Dr. Monica, Dr. Helmi, Dr. Cesar, Dr. Shaheen, Dr. Houda, Dr.
Imke, Dr. Koen, Dr. Ewert, Dr. Maia, Dr. Leila, Dr. Fariba, and Dr. Narges.
Enschede felt like home, thanks to the company of its Indonesian
community. In particular, I would like to thank Fajar and family, Akbar and
family, and Aji and family for taking care of my daughters while my husband
and I were away for the hajj pilgrimage. I also thank other Indonesian
friends who have been very kind to me and my family: Lulu, Pak Dhadhang
and family, Muthia and family, Pak Kunaifi and family, Mbak Dwi and family,
and other Indonesian PhD colleagues. I extend my gratitude to Yosia, Mbak
Zaki, Mbak Dewi, Mbak Elly, Bu Ells, Ceu Enung, Ancalas NL (Inna, Arief,
Ayu, Mira), Mbak Marni, PPIE board members of 2017, the IMEA family, the
Annissa family, and many others. Thank you very much for being my family
in NL.
This book ends my journey as a PhD researcher, but it is certainly not the
end of my work on energy and climate change.
Enschede, October 2019
Kamia Handayani

v
Contents
1 General Introduction .................................................................................... 1
1.1. Background .............................................................................................3
1.2. Case study: The Indonesian power sector ................................5
1.3. Analysis of climate change mitigation and adaptation in
the power sector: State of the art ...............................................9
1.4. Research gaps .................................................................................... 16
1.5. Main goal, research questions, and approach........................ 19
1.6. Structure of the dissertation ....................................................... 24
2 Trade-offs between electrification and climate change
mitigation: An Analysis of the Java-Bali power system in
Indonesia ........................................................................................................ 27
2.1. Introduction ......................................................................................... 30
2.2. Paris Agreement and decarbonization of the power
sector ..................................................................................................... 32
2.3. Methodology and data ..................................................................... 35
2.4. Balancing the Paris climate target and the Java-Bali
capacity expansion: LEAP results .............................................. 49
2.5. Discussions .......................................................................................... 56
2.6. Conclusions ......................................................................................... 58
3 From fossil fuels to renewables: An analysis of long-term
scenarios considering technological learning ................................... 61
3.1. Introduction ......................................................................................... 64
3.2. Technological learning ..................................................................... 66
3.3. Methodology and data ..................................................................... 68
3.4. Results ................................................................................................... 79
3.5. Discussions .......................................................................................... 88
3.6. Conclusions ......................................................................................... 89
vi
4 The vulnerability of the power sector to climate variability and
change: Evidence from Indonesia ......................................................... 91
4.1. Introduction ......................................................................................... 94
4.2. Methodology ........................................................................................ 97
4.3. Results: Weather and climate effects and adaptive
responses of the power sector ................................................. 100
4.4. Discussions ........................................................................................ 119
4.5. Conclusions ....................................................................................... 121
5 Climate change mitigation and adaptation nexus: Analysis of a
low-carbon electrification scenario incorporating climate
change impacts ......................................................................................... 123
5.1. Introduction ....................................................................................... 126
5.2. Modeling climate change impacts on the power sector .. 128
5.3. Methodology and data ................................................................... 132
5.4. Climate change mitigation-adaptation synergies: LEAP
Results ................................................................................................. 141
5.5. Discussion .......................................................................................... 148
5.6. Conclusions ....................................................................................... 150
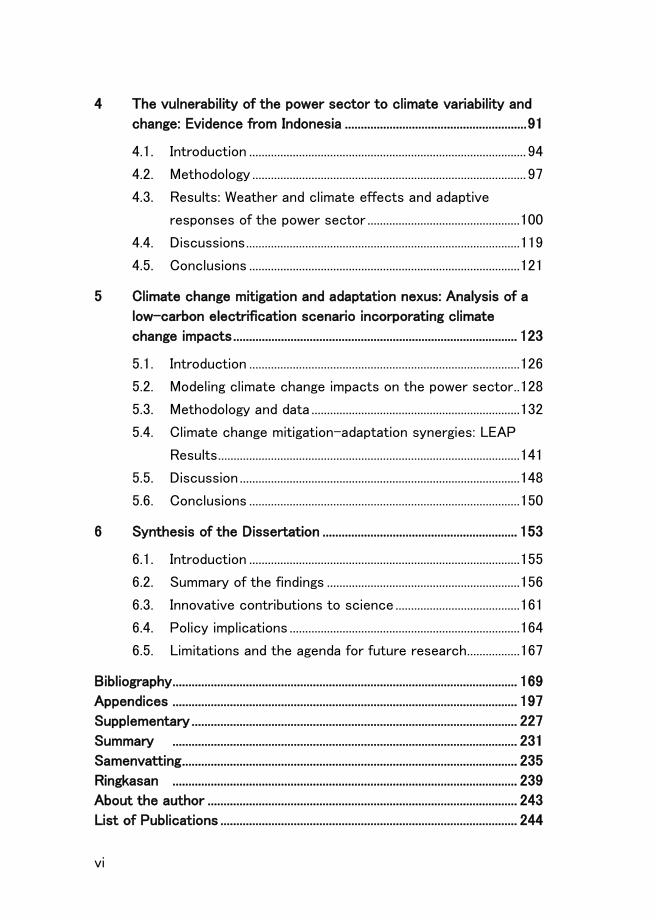
6 Synthesis of the Dissertation ............................................................. 153
6.1. Introduction ....................................................................................... 155
6.2. Summary of the findings .............................................................. 156
6.3. Innovative contributions to science ........................................ 161
6.4. Policy implications .......................................................................... 164
6.5. Limitations and the agenda for future research ................. 167
Bibliography ............................................................................................................ 169
Appendices ............................................................................................................ 197
Supplementary ...................................................................................................... 227
Summary ............................................................................................................ 231
Samenvatting ......................................................................................................... 235
Ringkasan ............................................................................................................ 239
About the author ................................................................................................. 243
List of Publications ............................................................................................. 244

vii
List of Abbreviations
BAU Business As Usual
BMKG Badan Meteorologi, Klimatologi dan Geofisika (the Agency for
Meteorology, Climatology, and Geophysics)
CFPP Coal-fired Power Plant
CST Coal Steam Turbine
IEA International Energy Agency
ENS Energy Not Supplied
ETL Endogenous Technological Learning
GHG Greenhouse Gas
GWh Gigawatt-hour
HEPP Hydroelectric Power Plant
IEO Indonesia Energy Outlook
INDC Intended Nationally Determined Contribution
IP PT Indonesia Power
IPCC Intergovernmental Panel on Climate Change
IPP Independent Power Producer
IRENA International Renewable Energy Agency
kWh Kilowatt-hour
LEAP Long-range Energy Alternatives Planning system
NDC Nationally Determined Contribution
NEP National Energy Policy
NGCC Natural Gas Combined Cycle
viii
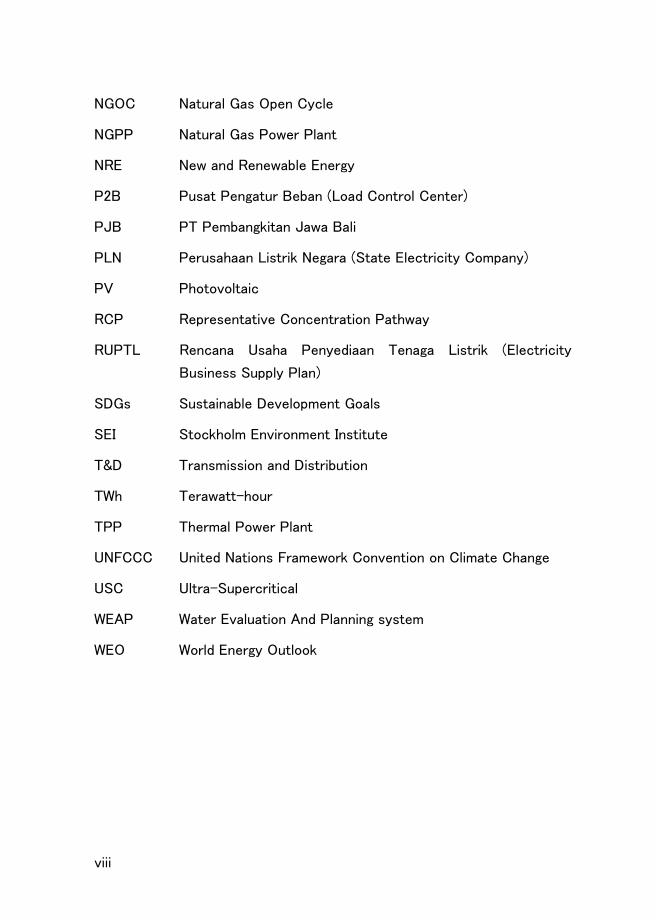
NGOC Natural Gas Open Cycle
NGPP Natural Gas Power Plant
NRE New and Renewable Energy
P2B Pusat Pengatur Beban (Load Control Center)
PJB PT Pembangkitan Jawa Bali
PLN Perusahaan Listrik Negara (State Electricity Company)
PV Photovoltaic
RCP Representative Concentration Pathway
RUPTL Rencana Usaha Penyediaan Tenaga Listrik (Electricity
Business Supply Plan)
SDGs Sustainable Development Goals
SEI Stockholm Environment Institute
T&D Transmission and Distribution
TWh Terawatt-hour
TPP Thermal Power Plant
UNFCCC United Nations Framework Convention on Climate Change
USC Ultra-Supercritical
WEAP Water Evaluation And Planning system
WEO World Energy Outlook


CHAPTER 1 GENERAL INTRODUCTION
3
1.1. Background
Electricity is a basic need in the modern world. Economic development
and social well-being are possible because of electricity (Ferguson et al.,
2000; Fouquet, 2011). Accordingly, the speed of electricity growth is the
fastest among other sources of total energy demand (IEA, 2018a). In 2016,
the world’s electricity consumption doubled that of 1990. However, nearly
1 billion people worldwide today are still without access to electricity (IEA,
2018b). Looking ahead, the International Energy Agency (IEA) estimates a
90% increase in global electricity consumption in 2040 due to
electrification. Therefore, the power sector is expected to expand further
to satisfy future demand for electricity.
While the increase in electricity demand in advanced economies is
expected to be relatively modest, developing economies will share an
extensive account of the future demand increase, which will be driven by
rapid economic and population growth (IEA, 2018a). For the global South,
growth in electricity demand is a crucial prerequisite for the development
and satisfaction of the United Nations (UN) Sustainable Development
Goals (SDGs). For example, Indonesia, a developing economy with 262
million inhabitants, records an annual economic growth of 5.3% between
2012-2016 (BPS, 2018). In the same period, Indonesia experienced a yearly
growth of 6.7% in electricity demand (PLN, 2018). Thus, the country is
projected to be the world’s fourth-largest economy during the 2030s,
owing to an increase in the working-age population, which will reach 68%
of the total population by 2030 (OECD, 2018). Consequently, the demand
for electricity will continue to grow, making the power sector’s
infrastructure increasingly vital for enabling socio-economic development
and progress on SDGs.
Nonetheless, this paramount role of the power sector in driving the
country’s development comes at a cost. Electricity generation in
Indonesia contributes to 43% of the energy sector emissions and 16% to
national greenhouse gas emission (GHG) (Rizaldi Boer et al., 2018), owing

CHAPTER 1 GENERAL INTRODUCTION
4
to the power sector’s reliance on fossil fuels, especially coal. Under the
Paris Agreement, the country is embarking on a low-carbon pathway and
aims to reduce 29% of its carbon emissions by 2030 (Government of The
Republic of Indonesia, 2015a). This goal aligns with Indonesia’s ambitious
target of increasing the share of new1 and renewable energy in the national
energy mix up to 23% in 2025 and 31% in 2050 (Government of The Republic
of Indonesia, 2014). Furthermore, while the power sector infrastructure is
increasingly crucial for meeting socio-economic and climate change
mitigation goals, at the same time, it is threatened by the adverse impacts
of climate change. A United Nations Framework Convention on Climate
Change (UNFCCC) report confirms that the global South is to bare the
most of the latter (UNFCCC, 2007a).
Extreme weather events and gradual changes in climate variables have
implications for the reliability, cost, and environmental impacts of the
energy supply worldwide (Schaeffer et al., 2012; Cronin et al., 2018).
Climate change impacts are expected throughout the entire power sector
value chain, including production, transmission, distribution, and
consumption. On the supply side, effects of climate change include
changes in water availability and the seasonality of hydropower, alterations
in wind speed frequency and distribution, reductions in solar cell efficiency,
generation cycle efficiency, and the cooling water availability of thermal
power plants, and failures and reductions in the capacity of transmission
and distribution lines. On the demand side, climate change alters the
balance of heating and demand patterns (Schaeffer et al., 2012; Cronin et
al., 2018; Audinet et al., 2014).
Moreover, electricity infrastructures are vulnerable to extreme weather
events, which are one of the world’s leading causes of power outages. A
1New energy refers to energy sources that can be produced using new
technology, either originating from renewable energy or non-renewable energy,
among others, including nuclear, hydrogen, coal bed methane, liquefied coal, and
gasified coal (Government of The Republic of Indonesia, 2014)
CHAPTER 1 GENERAL INTRODUCTION
5
World Bank report on resilient infrastructure highlights that natural shocks
caused 44% of power outages in the US between 2000 and 2017 and 37%
of outages in Europe between 2010 and 2017. Such events cost billions of
dollars per year for electric utilities, consumers, and governments.
Therefore, natural hazards and climate change are pressing problems that
in the coming decades, would involve substantial investments (Nicolas et
al., 2019).
Thus, the grand challenge for the power sector worldwide and Indonesia,
in particular, is to develop in a resilient way under the nexus of three
objectives: satisfying fast-rising electricity demand, meeting the Paris
Agreement and coping with the impact of climate change. One practical
challenge is the substantial investment required to develop clean, reliable,
and climate-resilient power systems. Even without climate change
considerations, the power sector is already capital-intensive
(Bhattacharyya, 2011; Nicolas et al., 2019) and with additional objectives
of climate change mitigation and adaptation, much higher investments are
expected.
To date, the scientific community has accumulated knowledge to address
this societal problem, which is reviewed in Section 1.3. However, first, an
overview of the case study is presented in Section 1.2. and then Chapter
1.4 discusses the research gaps in the current literature. Thereafter,
Chapter 1.5 highlights the core research goal of the dissertation, together
with the guiding research questions for attaining this goal and an overview
of the mixed methods used in the dissertation. Finally, this chapter ends
with an outline of the structure of the entire doctoral dissertation.
1.2. Case study: The Indonesian power sector
Indonesia is one of the world’s fast-developing economies. The
Government of Indonesia is promoting an average of 5% economic growth
per annum to reduce the poverty rate below 4% by 2025 (Government of
The Republic of Indonesia, 2016). Meanwhile, to date, more than 14 million
Indonesians do not have electricity access (IEA, 2018b). Moreover, the

CHAPTER 1 GENERAL INTRODUCTION
6
electricity consumption per capita of Indonesia is relatively low, i.e., 870
kilowatt-hours (kWh) in 2016, which is much lower compared to 3,110 kWh
of the world's average per capita consumption in the same year (IEA,
2018c). These statistics imply that the demand for electricity in Indonesia
will continue to grow in the next decade.
The structure of Indonesia’s power sector is vertically integrated: the
state-owned electricity company (PLN) monopolizes the retail electricity
sale and is the sole purchaser of electricity produced by independent
power producers (IPPs). The PLN solely owns and operates the
transmission and distribution (T&D) networks, while the power generation
assets are divided between PLN, its subsidiaries, and IPPs.
As an archipelagic nation that has more than 16,000 islands (BIG, 2017a),
Indonesia’s electricity infrastructures are spread into eight major
electricity grids and more than 600 isolated grids distributed throughout
the archipelago (PWC, 2017). Thus, it is pertinent to note that while the
physical infrastructure spreads throughout the Indonesian archipelago,
most of the power generation capacity (65%) is situated in the Java and
Bali islands (Table 1.1). These islands are the most populated islands,
inhabited by over 148 million people, which comprises 57% of the national
population (BPS, 2018).
Table 1.1: Capacities of power generation, transmission, and distribution: the
total Indonesia and Java-Bali system (KESDM, 2017; PLN, 2017a)
Assets Indonesia Java-Bali
Percentage of the Java-Bali capacity
Generation capacity (MW) 59,656 38,690 65%
Transmission network: Transmission lines (kmc) Substation transformer (MVA)
44,064 98,899
22,553 78,697
51% 80%
Distribution network: Distribution lines (kmc) Substation transformer (MVA)
887,681 50,100
466,686 32,822
53% 65%
Note: MW=megawatt; kmc=kilometer circuit; MVA= megavolt ampere

CHAPTER 1 GENERAL INTRODUCTION
7
The Indonesian power sector, including the Java-Bali interconnected
power system, is highly dependent on fossil fuels. As a locally extracted
and relatively cheap resource, coal became the primary energy source in
the country. In 2015, fossil fuels constituted 90% and 91% of the national
and Java-Bali power generation mixes, respectively (Fig. 1.1). Therefore,
the Java-Bali power system is illustrative of the national electricity mix.
Furthermore, since Java and Bali are the most populated and developed
islands in Indonesia, electricity consumption on these islands has
continued to increase, having an annual average growth of 5.9% between
2012 and 2016 (PLN, 2018). Furthermore, in 2018, the Java-Bali power
system served 74% of national electricity consumption (PLN, 2019).
Consequently, Java-Bali contributed the highest share to the national
balance of power sector’s GHG emissions, compared to the outer islands.
Fig. 1.1: The national and Java-Bali power generation mixes in 2015 (PLN,
2016a). This data includes both PLN and IPP productions.
Indonesia owns abundant energy resources, including oil, coal, natural gas,
hydro, geothermal, solar, biomass, and wind resources (Table 1.2 and Table
1.3). In 2015, the cumulative reserves of the three fossil fuel resources
constituted 93 billion tons of oil equivalent/toe. Nonetheless, fossil fuel
resources are depleting, and unless new reserves are discovered,
Indonesian oil is expected to be exhausted in 12 years, natural gas in 33
years, and coal in 82 years (DEN, 2016a).

CHAPTER 1 GENERAL INTRODUCTION
8
Table 1.2: Primary energy resources in Indonesia
Primary
energy
Reserve
Total Indonesia Java, Madura, and Bali
Coal 126.6 billion tons (88.6 billion toe)a
19.8 million tonsa
Natural gas 151.3 TCF (3.9 billion toe)a 10.6 TCFb
Oil 3.6 billion barrels (0.5 billion toe)a 1.2 billion barrelsc
aMEMR (2016), bKESDM (2018a), and cKESDM (2018b)
Meanwhile, the potential for renewable energy is enormous (Table 1.3);
however, this potential is hardly utilized. In 2015, nearly 9 GW, or less than
1% of renewable energy potential, was employed (EBTKE, 2016).
Table 1.3: Renewable energy potential and current practices in Indonesia
Renewable Potential in
Gigawatt (GW) Renewable deployment by 2015, total Indonesia
Sources
Total Indonesia
Java- Bali islands
Installed capacity (GW)
Renewable utilization (%)
Hydro 75 4.2 5.4 7.2% (DEN, 2016b; ESDM, 2019)
Hydro P/S 4.3 3.9 0 0.0% (ESDM, 2019; PLN, 2017b)
Mini hydro 19.4 2.9 0.4 2.1% (DEN, 2016b; ESDM, 2019)
Geothermal 17.5a 6.8a 1.9 11% (DEN, 2016b; ESDM, 2019)
Biomass 30 7.4 1.8 6.0% (DEN, 2016b; ESDM, 2019)
Solar 5,374b 2,747b 0.06 0.0% (ESDM, 2019; Kunaifi and Reinders, 2016)
Wind 60.6 24.1 0.0004 0.2% (DEN, 2016b; ESDM, 2019)
Note: Hydro P/S = hydro pumped storage, aexcluding speculative and hypothetical potential, bin Gigawatt peak

CHAPTER 1 GENERAL INTRODUCTION
9
Similar to many other countries, the Indonesian energy sector is required
to contribute to the nationally determined contribution (NDC) under the
Paris Agreement. This sector is required to cut 11% of national GHG
emissions from business as usual (BAU) by 2030. Meanwhile, the power
sector in Indonesia is already affected by severe weather events and
changes in climate variables. For example, heavy rainfall in March and April
of 2010 resulted in excessive water entering reservoirs of the Citarum
cascade hydropower on Java island, which caused flooding downstream.
In contrast, in 2011, the water level in these reservoirs fell drastically
below the normal level, reducing their electricity production (Syariman and
Heru, 2011). Likewise, severe weather events adversely affected
electricity distribution networks, often causing widespread power cuts
(PLN Yogyakarta, 2015).
Considering its vital role for meeting the electrification and Paris
Agreement goals, as well as the fact that it is already affected by climate
variability, the Indonesian power sector is a vivid example when studying
the triple nexus of electrification, climate change mitigation, and climate
change adaptation. As such, this doctoral dissertation focuses on the most
extensive power system in Indonesia, i.e., the Java-Bali power system,
since it is representative of demand growth, energy mix, and CO2 emissions
and given the author’s access to high-quality data for this system.
1.3. Analysis of climate change mitigation and adaptation in the
power sector: State of the art
1.3.1. Modeling low-carbon pathways in a power system expansion
Making assessments about the future of power systems is not an easy
task considering the uncertainty about the future of the power sector,
economic situation, and technological progress, among other things. In this
context, scenario analysis offers flexibility for the actors to explore a
variety of pathways to expand the power system over time, and to evaluate
the benefits and consequences of each path.
CHAPTER 1 GENERAL INTRODUCTION
10
Energy system models are often utilized to aid in the detailed
quantification of scenarios (Hall and Buckley, 2016). They developed during
the 1970s and have been used worldwide (Kemfert and Truong, 2009).
Varied in purpose (Connolly et al., 2010), each model has a unique
paradigm, technique, and solution (Hall and Buckley, 2016). Moreover,
energy models can be classified based on the level of aggregation and the
theoretical approach being used. This classification divides energy system
models into two types: top-down and bottom-up models. While top-down
models focus on aggregate linkages between energy, economy, and
environment from the context of the national, regional, or global economy
as a whole, bottom-up models look at the issues from the perspective of
a specific sector, such as electricity generation or transport (Kemfert and
Truong, 2009). As such, top-down models focus on market processes
rather than technological details, addressing policy concerns related to
public finances, economic competitiveness, and employment (van Vuuren
et al., 2009). Meanwhile, bottom-up models include a more detailed
quantitative description of the technological structure utilized in a sector
(Kemfert and Truong, 2009; van Vuuren et al., 2009), thereby modeling the
detailed technological complexity of the energy system (Pfenninger et al.,
2014).
To assess the trade-offs between electrification and climate change
mitigation goals in the power sector, one needs a tool that enables
performing a technological, economic, and environmental analysis of the
power system expansion. Furthermore, since climate change mitigation in
the power sector relies heavily on a variety of energy technologies, it is
essential that this tool represents technologies in detail and can
incorporate a competition between current and future energy
technologies.
Bottom-up energy models, such as the Long-range Energy Alternatives
Planning system (LEAP), offer the capability to analyze both a power
system expansion and climate policy scenarios, taking into account
detailed characteristics of electric power technologies. LEAP, which was

CHAPTER 1 GENERAL INTRODUCTION
11
developed by the Stockholm Environment Institute (SEI), has been used in
190 countries, becoming the de facto standard tool in developing countries
(Heaps, 2017). Its success is accelerated by its free access for developing
countries and by the fact that it accommodates various characteristics
essential for an energy sector analysis in developing countries, such as
electrification and flexible data requirements (Urban et al., 2007).
Numerous studies have applied LEAP when assessing the decarbonization
of the power system. For example, McPherson and Karney (2014) explored
scenarios for climate change mitigation within Panama’s power sector.
The study indicates that there is an opportunity for Panama to reduce
both greenhouse gas emissions and system generation costs on the
condition that there is sufficient private investment. Perwez et al. (2015)
included an analysis of a green future scenario for Pakistan’s power
sector, concluding that a green scenario is more economically efficient in
the long run compared to fossil-fuel based scenarios. Samsudin et al.
(2016) analyzed the paths of the Malaysian sustainable power sector,
showing that sustainable scenarios assure sufficient electricity supply
while keeping emissions below the target limit. Ouedraogo (2017) employed
LEAP to examine reference and sustainable scenarios for Africa. The
study implies that the modification of existing oil and coal plants, as well
as the promotion of local renewable resources, allow for fuel diversification
in the power sector, which will increase energy security while reducing
CO2 emissions. Similarly, Bhuvanesh et al. (2018) evaluated greenhouse
gas mitigation scenarios for Tamil Nadu State, India, and suggested that
the adoption of renewable energy sources in the power sector will increase
Tamil Nadu’s energy independence and also reduce CO2 emissions.
Worldwide scholars have also applied LEAP to examine the achievement
of NDCs in the power sector at a national level, including Mexico’s
(Grande-Acosta and Islas-Samperio, 2017), Thailand’s (Kusumadewi et al.,
2017) and Botswana’s (Baek et al., 2019) power sectors. Together, these
studies indicate that each country’s NDC is achievable through the
increased deployment of renewable energy, and in the case of Mexico, also

CHAPTER 1 GENERAL INTRODUCTION
12
through energy-efficient measures. Meanwhile, Kumar and Madlener
(2018) go beyond the current NDC by exploring a plausible pathway for
the German power sector to achieve 1.5 ºC, the Paris Agreement goal.
The study reveals that GHG emission comes down to almost zero in 2040,
thereby ensuring the achievement of the temperature limit of 1.5 ºC.
However, in doing so, this will entail high GHG mitigation costs: 194.2 €/t
of CO2e.
A variety of other modeling tools are used in the literature to analyze the
power sector pathways towards meeting the Paris Agreement goal. Dalla
Longa and van der Zwaan (2017) adopted the TIAM-ECN model to examine
the role of low carbon technologies in achieving Kenya’s target under the
Paris Agreement. Bogdanov et al. (2018) used the LUT Energy System
Transition modeling tool to explore the technical feasibility of the
Northeast Asia power system for deep decarbonization mandated by the
Paris Agreement. Moreover, Haiges et al. (2019) applied TIMES to assess
the Malaysian power sector pathways, considering the country’s NDC as
well as 2050’s deep decarbonization. Fortes et al. (2019) employed
TIMES_PT to analyze the extension of end-use sector electrification as a
cost-effective strategy for deep decarbonization in Portugal. Meanwhile,
Gómez-Calvet and Martínez-Duart (2019) proposed a mathematical model
based on linear programming to optimize the balance between variable
renewable energy sources to be extensively added in the Spanish power
sector as a response to the EU’s NDC.
Nevertheless, there is still no assessment of the implications of
Indonesia’s NDC for the power sector, let alone an assessment of the role
of technological change in attaining the NDC targets. Furthermore, the link
between the Paris Accord’s mitigation objectives with the sector’s
adaptation to climate change has not yet been investigated. Such analyses
are critical, as they could provide insights into formulating a policy
framework for the power sector to curb CO2 emissions.
CHAPTER 1 GENERAL INTRODUCTION
13
1.3.2. Endogenous technological learning in energy system models
The academic literature agrees that technological changes play a critical
role in the historical energy transition, as well as in future scenarios of
energy transition (Nakicenovic et al., 2000; Berglund and Söderholm, 2006;
IPCC, 2007; Wilson and Grubler, 2011). Even more, technological change
is viewed as a critical component of long-term climate change mitigation
strategy (Pizer and Popp, 2008). Accordingly, the IPCC Fifth Assessment
Report (AR5) highlights the inability of existing technologies to gain a
significant reduction needed to meet the IPCC’s mitigation scenarios
(Pachauri et al., 2014). Thereby, it underlines the importance of institutions
and economic incentives to encourage technological change that would
lead to reductions in climate change mitigation costs. However,
incorporating technological change in energy modeling remains a challenge
(Grübler et al., 1999; Frei et al., 2003; Berglund and Söderholm, 2006).
Most energy models treat technological change as exogenous (Grübler et
al., 1999; Berglund and Söderholm, 2006; Ma and Nakamori, 2009),
integrating this change through numerous assumptions about the costs
and performance of future technology. For example, in optimization
models, the adoption of low-carbon yet uneconomical technologies can be
triggered by creating environmental or capacity constraints, among others
(Ma and Nakamori, 2009).
Nonetheless, in reality, technological change is tightly embedded in the
developmental trajectory of technology and requires considerable
developmental efforts (Berglund and Söderholm, 2006). Accordingly, there
is an increasing number of studies that adopt endogenous technological
change in energy system models. Technological learning or a learning
effect is the most common approach to specifying and incorporating
endogenous technological change (Kahouli-Brahmi, 2008). For example,
Pratama et al. (2017) applied a multi-objective optimization method that
considers technological learning to minimize both the costs of power
generation and its corresponding CO2 emissions for multiple regions in
CHAPTER 1 GENERAL INTRODUCTION
14
Indonesia. The study reveals that the incorporation of the learning rate of
renewables results in a considerable deployment of renewables to replace
coal-based power generation. Meanwhile, Heuberger et al. (2017)
integrated endogenous technological learning (ETL) into the ESO-XEL
model to simulate the UK’s power capacity expansion for the period of
2015-2050 and compared the results between with and without
technological learning. The study finds that the consideration of
technological learning influences the competitiveness of technology and
results in earlier optimal investment. Similarly, Daggash and Mac Dowell
(2019) used ESO-XEL, which embodies technological learning to evaluate
the UK’s power system expansion up to 2100 to address deep
decarbonization mandated by the Paris Agreement. The study indicates
that the deployment of CCS technology -including bioenergy with carbon
capture and storage and direct air capture and storage- is required from
2030 onward to comply with the Paris Agreement goal by the end of the
century. Finally, Liu et al. (2018) incorporated technological learning into
the TIMES model to evaluate low-carbon technology diffusion in the
decarbonization of the Tianjin power sector in China. The study implies
that the learning rate is a critical factor in optimization simulation, as it
affects the choice of technologies and total system costs.
Despite the increasing recognition of the critical role played by
technological learning, there have been no studies incorporating ETL into
LEAP, precluding an evaluation of the effects of induced cost reduction
on the entire power system.
1.3.3. Adverse impacts of climate change on the power sector
The climate is changing. Even if global GHG emissions are stabilized at
1.5ºC above the pre-industrial level, we will still see changes in climate
and their impacts, including higher air and seawater temperatures,
increased frequency and intensity of heavy precipitation and droughts,
sea-level rise, ecosystem damages, and land and forest degradations
(IPCC, 2018).
CHAPTER 1 GENERAL INTRODUCTION
15
Climate change already affects the entire global economy, including the
energy sector. In 2005 alone, extreme climate events accounted for a 13%
variation in energy productivity in developing countries (World Bank, 2010).
Moreover, future climate change is expected to increase the vulnerability
of the power sector, which has attracted the attention of both researchers
and practitioners. Financial institutions now include an assessment of
climate change impacts on their loan portfolios (Connell et al., 2018;
International Finance Corporation, 2012). Moreover, international
guidelines for such an assessment are emerging. For example, the World
Bank produced a guideline for climate-resilient hydropower, which involved
a broad stakeholder engagement during the preparation process (World
Bank, 2017). Similarly, the International Standard Organization issued a
new international standard, i.e., ISO 14090, to assist companies in
assessing climate change impacts and developing effective adaptation
plans (Naden, 2019).
To support this societal need of assessing infrastructure resilience,
researchers often use simulation models that integrate the projected
effects of climate change on future power systems. Naturally, such
modeling links to climate change scenarios and their expected impacts
resulting from global climate change models. However, climate change may
affect various elements of the electricity supply chain and electricity
sources differently. Previous studies on this topic have established that
climate change reduces the reliability of thermoelectric power plants
mainly due to increasing air and cooling water temperatures, and
decreasing streamflow (Förster and Lilliestam, 2010; van Vliet et al., 2012;
Zheng et al., 2016; Tobin et al., 2018).
Meanwhile, impacts on hydropower are uneven between regions. For
example, Shafiei et al. (2015) indicate that Iceland would benefit from an
increase in hydropower production under future climates while Spalding-
Fecher et al. (2017) imply that the Southern African power pool would
adversely be affected under a drying climate. Similarly, impacts on
electricity demand vary between regions, indicating a net decrease in

CHAPTER 1 GENERAL INTRODUCTION
16
demand in colder regions while contrarily, implying a net increase in
demand in warmer regions.
Furthermore, several studies indicate limited adverse impacts of gradual
changes in climate variables on wind and solar energy production (Tobin
et al., 2018; Jerez et al., 2015). Additionally, few studies estimate an
increase in wind power generation in some parts of Brazil (Pereira de
Lucena et al., 2010) and Croatia (Pašičko et al., 2012). Nevertheless, off-
shore wind power plants may need to invest in adaptation measures
against sea-level rise (Lise and van der Laan, 2015).
Studies presented so far broadly indicate the adverse impacts of climate
change on electricity supply and demand, calling for the power sector to
improve its resilience to climate change. Furthermore, although climate
change is a global phenomenon, its geography is uneven, showing diverse
impacts across the globe. Hence, assessments of these impacts at local
levels are needed to facilitate appropriate local adaptation actions.
1.4. Research gaps
While the literature on the subject is extensive, several research gaps
remain. Building upon previous studies, this doctoral dissertation aims to
address gaps in the literature on the analysis of climate change mitigation
and adaptation in the expanding power sector. In particular:
(i). A bottom-up assessment regarding the trade-offs between
electrification and the Paris climate target of the Indonesian power
sector is still missing.
Previous studies have analyzed the decarbonization of the
Indonesian power system (Marpaung et al. (2007); Dasuki et al.;
(2001); Purwanto et al. (2015); Stich and Hamacher (2016); Kumar
(2016)). Nonetheless, a thorough search of the relevant literature
yielded only one related article, i.e., Siagian et al. (2017), which
specifically addressed Indonesia’s intended nationally determined
contribution. However, this study was carried out based on a draft

CHAPTER 1 GENERAL INTRODUCTION
17
policy document before the COP21 in Paris. Meanwhile, a study that
examines the implications of the energy sector’s target in the final
NDC submitted under the Paris Agreement is still missing.
Moreover, the previous research by Siagian et al. employs the Asia-
Pacific Integrated Model/Computable General Equilibrium
(AIM/CGE) model for their analysis and mentions the model’s
limitations in producing technology-rich outcomes, which can be
provided by bottom-up-type engineering models. Therefore, a
bottom-up analysis using a technology-detailed dataset of the
Indonesian power sector in achieving Indonesia’s NDC will add to
the existing literature on modeling low-carbon energy systems.
(ii). ETL is not represented in the LEAP modeling literature.
Heuberger et al. (2017) listed state-of-the-art energy and
electricity system models, incorporating ETL, which includes
MESSAGE-MACRO, MARKAL-TIMES, NEMS, POLES, ERIS,
GALLM, and ESO-XEL. The LEAP modeling literature, however, has
not included ETL thus far.
Since LEAP is claimed to be the de facto standard for developing
countries undertaking assessments of low-emission development
strategies (Heaps, 2017), it is essential to incorporate ETL into
LEAP. Such an effort enables the consideration of cost reductions
of low-carbon technologies over time for robust analysis of low-
carbon energy transition. ETL often indicates declining costs of
relatively new technologies –such as wind or solar– in comparison
to more established fossil fuel-based ones. Neglecting this
significant change in market forces when developing policy decisions
for the rapidly expanding energy sector in developing countries may
lead to unnecessary technological lock-ins.

CHAPTER 1 GENERAL INTRODUCTION
18
(iii). Empirical evidence regarding the impacts of weather and climate on
the power sector is scarce.
As discussed in Section 1.3.3 above, previous research has provided
projections regarding climate change impacts on the power sector,
mostly by employing simulation models. Nevertheless, there have
been few empirical investigations about the historical effects of
weather and climate on the power sector. Such an investigation on
the entire value chain of the power sector will add to the
understanding of the risks posed by severe weather events and
gradual climate change on electricity supply and demand.
Moreover, existing literature on climate change impacts on the
power sector focuses mainly on electricity infrastructure in
developed countries, making potential impacts on the power sector
in developing countries unexplored (Audinet et al., 2014).
Accordingly, the IPCC AR5 acknowledges the scarcity of
publications regarding climate change impacts, adaptation, and
vulnerability in developing countries (Field C.B. et al., 2014).
Finally, since electric utilities are responsible for ensuring the
security and reliability of electricity supply, the impacts of climate
variability and change directly affect the utilities’ business activities
(Audinet et al., 2014). As such, this calls for investigations on direct
damage costs suffered by utilities, as well as their responses to
disruptive weather and climate, which could be further used to
estimate the costs of climate change and the benefits of adaptation.
(iv). Integrated analysis of climate change mitigation and adaptation of
the power sector remains a challenge.
The IPCC AR5 identifies several challenges in managing trade-offs
and synergies between mitigation and adaptation. These include
suitable tools for an integrative assessment, stable governance
structures, as well as an adequate capacity to design and deploy
integrated responses (Pachauri et al. 2014). The report also

CHAPTER 1 GENERAL INTRODUCTION
19
highlights climate change impacts and the adaptation responses of
the energy system as a research gap, urging their integration into
the assessment of the climate stabilization path (Clarke et al., 2014).
Section 1.3.1 and 1.3.3 have presented studies that are concerned
with climate change mitigation in the power sector and the impacts
of climate change on the power sector, respectively. Nevertheless,
these studies do not explicitly link climate mitigation efforts of the
power sector with the projected impacts of climate change to the
sector, let alone asses their multiple effects on the future power
sector.
A separate analysis of climate change mitigation, impacts, and
adaptations not only jeopardizes the power sector’s security and
reliability, but it also underestimates the investment needed for
expanding the power sector, which is inevitable, especially for the
global South. Furthermore, climate change impacts could influence
the effectiveness of mitigation options, among other things.
Therefore, it is crucial to consider both climate change mitigation as
well as adverse impacts and adaptations when analyzing a power
system expansion. This requires a clear set of modeling scenarios
that consider technological changes when assessing climate change
mitigation targets, in addition to the consideration of future climatic
regimes when examining climate change adaptation goals.
1.5. Main goal, research questions, and approach
1.5.1. The main goal and research questions
The main goal of this doctoral research is to assess the triple nexus of
electrification, climate change mitigation, and the climate change
adaptation objectives of the power sector. To understand how the power
sector may balance these triple objectives, this dissertation addresses the
following four core research questions (RQ):

CHAPTER 1 GENERAL INTRODUCTION
20
RQ1: How could the power sector align electrification and the Paris
Agreement goals?
RQ2: How could technological change affect the deployment of low-carbon
technologies?
RQ3: How do severe weather and gradual changes in climate variables
affect the power system? What are the current adaptation practices?
RQ4: How can one integrate climate change impacts into power system
expansion modeling? How might this affect electrification and climate
change mitigation goals?
1.5.2. Research approach
I address these research questions by employing a set of methodological
steps, as depicted in Fig. 1.2. Modeling is pursued with LEAP and WEAP
(Water Evaluation and Planning system) software tools, while extensive
data collection is conducted through interviews and focus group
discussions (FGDs) with stakeholders from different elements of the
power sector supply chain. Thereafter, I gradually advance the current
modeling practice by sequentially taking into consideration endogenous
technological learning as well as climate change impacts and adaptations
(the blue arrows of Fig. 1.2).
The LEAP simulation model:
I use LEAP to assist in answering RQ1, RQ2, and RQ4. LEAP is a tool to
evaluate the entire energy system. The essential features of LEAP for
addressing the primary goal of this dissertation includes its support for
alternative scenario projections, its least-cost optimization modeling of
power system expansion, and the calculation of CO2 emissions.
LEAP consists of three modules: I. Demand, II. Transformation and III.
Resources modules (the black boxes of Fig. 1.2). The power system
simulation, called the electricity generation module in LEAP, belongs to
the transformation module. The electricity generation module simulates
electricity supply to satisfy the given demand, based on various input
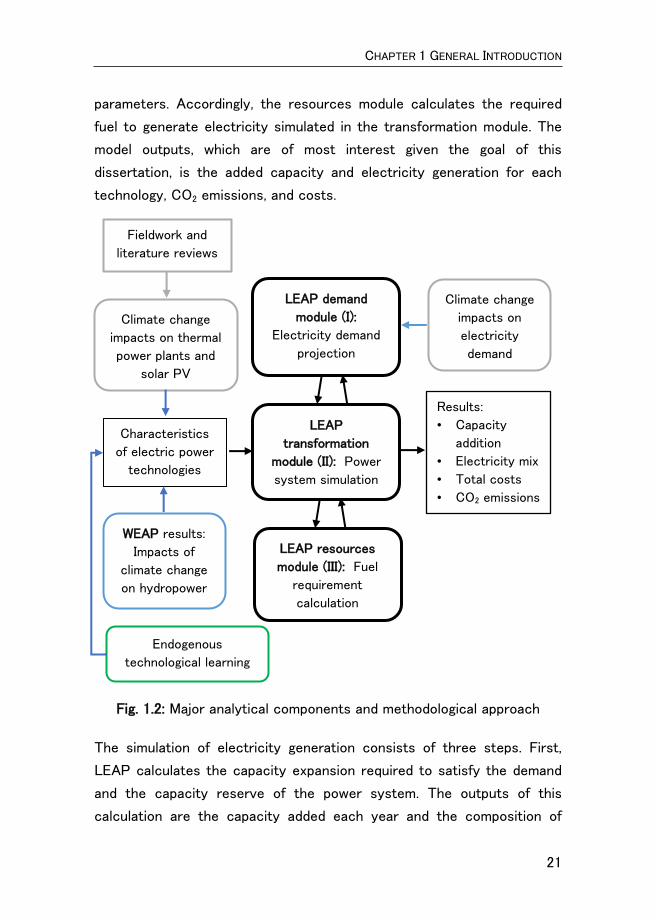
CHAPTER 1 GENERAL INTRODUCTION
21
parameters. Accordingly, the resources module calculates the required
fuel to generate electricity simulated in the transformation module. The
model outputs, which are of most interest given the goal of this
dissertation, is the added capacity and electricity generation for each
technology, CO2 emissions, and costs.
Fig. 1.2: Major analytical components and methodological approach
The simulation of electricity generation consists of three steps. First,
LEAP calculates the capacity expansion required to satisfy the demand
and the capacity reserve of the power system. The outputs of this
calculation are the capacity added each year and the composition of
Climate change
impacts on
electricity
demand
Characteristics
of electric power
technologies
LEAP demand
module (I):
Electricity demand
projection
Results:
• Capacity
addition
• Electricity mix
• Total costs
• CO2 emissions
LEAP
transformation
module (II): Power
system simulation
LEAP resources
module (III): Fuel
requirement
calculation
WEAP results:
Impacts of
climate change
on hydropower
Endogenous
technological learning
change
Climate change
impacts on thermal
power plants and
solar PV
Fieldwork and
literature reviews
CHAPTER 1 GENERAL INTRODUCTION
22
technology (capacity mix). Second, LEAP dispatches electricity from each
process in accordance with the annual demand and the load curve. The
output of the second step is the annual electricity production from each
process. Three, the resource module calculates the primary energy
required to generate electricity based on the fuel efficiency of each
technology. Additionally, LEAP calculates the power system’s total costs
based on the costs’ input data. Moreover, LEAP includes a technology
and environmental database that allows the calculation of CO2 emissions
from the electricity production based on the IPCC Tier 1 emission factor.
In LEAP, the optimal solution is defined as the power system with the
lowest total net present value of the total costs over the entire period of
calculation (from the base year to the end year). Thus, the optimization
setting works through integration with the Open Source Energy Modelling
System (OSeMOSYS). LEAP automatically writes the data files required
by OSeMOSYS, making use of the same data that were input into LEAP.
The results of the optimization are also read back into LEAP so that all
relevant results can be viewed in LEAP. In turn, OSeMOSYS depends on
a solver software tool for developing decision optimization models. Due to
the complexity of the simulations performed in this doctoral research, a
more powerful solver, namely the CPLEX optimizer, which is a software
toolkit developed by IBM, was used instead of the LEAP built-in GNU
Linear Programming Kit.
The WEAP simulation model:
This dissertation employs WEAP for evaluating the impacts of climate
change on water availability for hydropower; thus, it supports addressing
RQ4. WEAP is a software tool that was also developed by SEI and as such,
WEAP and LEAP are sister tools that share many of the same design
features and approaches. Furthermore, WEAP has a built-in link with
LEAP, allowing the integration of WEAP outputs into the system-wide
LEAP model. WEAP can simulate water demand, flows, and storage, as well
as pollution generation, treatment, and discharge (Sieber, 2019). The
CHAPTER 1 GENERAL INTRODUCTION
23
essential features of WEAP employed for the goal of this dissertation are
its capability to simulate the water demand and supply of a river basin,
taking into account climate variables and competing uses of water.
A WEAP application is initialized by defining the scope of the study, such
as the timeframe, spatial boundary, and system components. The present
situation regarding water demand and supply is entered into the “Current
Accounts” tab. As such, alternative sets of scenarios are developed based
on various assumptions; for example, future climates. These scenarios can
be evaluated with regard to water sufficiency, cost, and environmental
impacts.
WEAP simulation results indicate water availability for hydropower under
future climates, and further determines the availability2 of the hydropower.
This data becomes the input for the power system expansion model,
allowing for an assessment of the impacts of climate-induced hydropower
availability on the power system as a whole.
Fieldwork for data collection:
To address RQ3, I carried out fieldwork from February to March 2018,
collecting data regarding climate change impacts on the Indonesian power
sector and the sector’s adaptation responses. The fieldwork involved in-
depth semi-structured interviews and FGDs with representatives of three
electric utility companies, covering three head offices, ten power
generation plants, the Java-Bali grid operator (load control center), two
transmission offices, and two distribution offices. Thus, I interviewed
stakeholders that were representative of the various stages of the
electricity supply to acquire primary data on the current adverse impacts
and adaptation practices in these power sector facilities.
2Availability in LEAP is defined as the ratio of the energy produced for a given period
to what would have been produced if the process ran at full capacity for a given
period (expressed as a percentage)

CHAPTER 1 GENERAL INTRODUCTION
24
The power plants being chosen are those major ones in the Java-Bali
power system, which account for 35% of the Java-Bali power generation
capacity. Meanwhile, the T&D offices where I conducted interviews and
FGDs are responsible for 65% and 44% of Java-Bali T&D assets,
respectively. The interviews and FGDs are supplemented with secondary
data, consisting of utilities’ internal reports and published energy sector
information that was used to validate and triangulate the results derived
from the interviews and FGDs. The secondary data for T&D networks
include all T&D assets of the Java-Bali power system. Hence, this
dissertation covers the entire Java-Bali T&D networks.
A set of questionnaires, which were structured differently for each target
group, were used as guidance for conducting interviews and FGDs. The
questionnaires were developed based on the results of a literature review
on climate change impacts and adaptations in the energy sector.
1.6. Structure of the dissertation
This doctoral dissertation consists of six chapters. Apart from the General
Introduction and the Synthesis chapters, there are four research chapters,
each dealing with one specific research question (Fig. 1.3). While Chapter
2 and Chapter 3 give attention to climate change mitigation of the power
sector, Chapter 4 focuses on climate change impacts and adaptations.
Finally, Chapter 5 brings the two parts together within an integrated
analysis framework. The remaining parts of this dissertation proceed as
follows:
Chapter 2 analyzes the trade-offs between satisfying the Java-Bali
electrification goal with achieving the power sector’s emission reduction
target under the Paris Agreement. Before discussing the method and
analysis results of the electrification and climate change mitigation nexus,
the chapter elaborates on various energy models and presents the
validation of the Indonesian LEAP model.
CHAPTER 1 GENERAL INTRODUCTION
25
Chapter 3 explores various scenarios of the Java-Bali power system
expansion to achieve the targets of renewable energy share in 2025 and
2050. This chapter elaborates on how endogenous technological learning
could be integrated into the LEAP cost function and shows its effect on
the deployment of renewable energy, and subsequently, on CO2 emissions
and costs.
Chapter 4 reports the empirical evidence concerning the effects of
weather and climate on the entire elements of the power sector. The
chapter also provides estimates of direct losses suffered by electric power
utilities as well as adaptation measures taken by the utilities to deal with
weather- and climate-related disruptions.
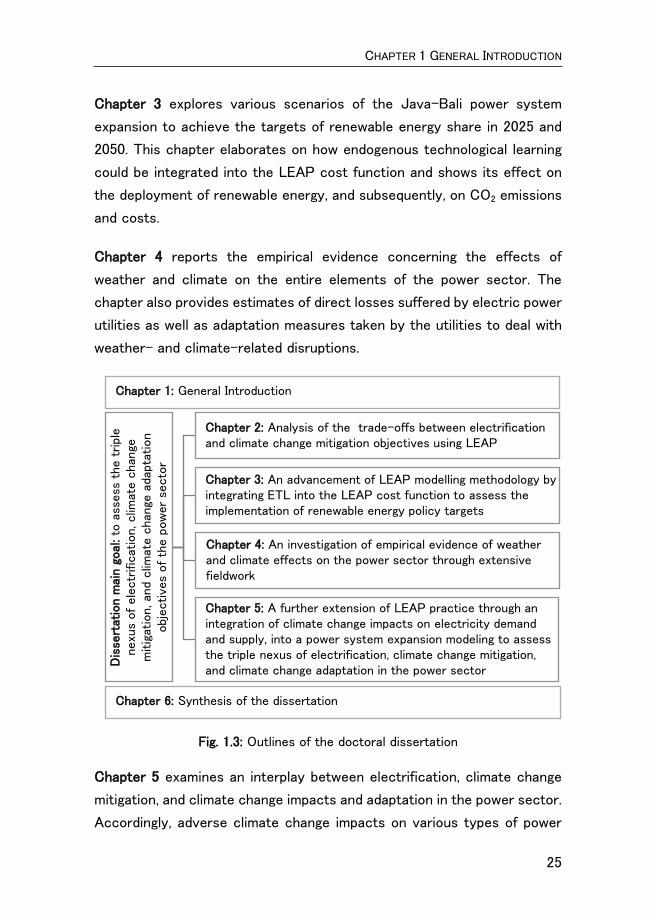
Fig. 1.3: Outlines of the doctoral dissertation
Chapter 5 examines an interplay between electrification, climate change
mitigation, and climate change impacts and adaptation in the power sector.
Accordingly, adverse climate change impacts on various types of power
Dis
sert
atio
n m
ain g
oal
: to
ass
ess
the
trip
le
nexu
s of
ele
ctr
ific
atio
n, c
limat
e c
han
ge
mitig
atio
n, a
nd
clim
ate c
han
ge a
dapt
atio
n obj
ect
ives
of th
e p
ow
er s
ecto
r
Chapter 2: Analysis of the trade-offs between electrification and climate change mitigation objectives using LEAP
Chapter 3: An advancement of LEAP modelling methodology by integrating ETL into the LEAP cost function to assess the implementation of renewable energy policy targets
Chapter 4: An investigation of empirical evidence of weather and climate effects on the power sector through extensive fieldwork
Chapter 5: A further extension of LEAP practice through an integration of climate change impacts on electricity demand and supply, into a power system expansion modeling to assess the triple nexus of electrification, climate change mitigation, and climate change adaptation in the power sector
Chapter 1: General Introduction
Chapter 6: Synthesis of the dissertation

CHAPTER 1 GENERAL INTRODUCTION
26
generation and on electricity demand are incorporated into the simulations
of the power system expansion, using LEAP. Hence, the chapter indicates
the triple nexus of electrification, climate change mitigation, and climate
change adaptation in expanding the Java-Bali power system.
Chapter 6 provides the synthesis of the findings of this dissertation and
discusses its innovative contributions as well as its policy implications.
The chapter ends with outlining limitations and perspectives for future
research.


CHAPTER 2 TRADE-OFFS BETWEEN ELECTRIFICATION AND CLIMATE CHANGE MITIGATION
29
Abstract
The power sector in many developing countries face challenges of fast-
rising electricity demand in urban areas and the urgency of improved
electricity access in rural areas. These development needs are challenged
by the vital goal of climate change mitigation. This chapter investigates
plausible trade-offs between electrification and CO2 mitigation in a
developing country context, taking Indonesia as an example. By employing
LEAP, this chapter incorporates Indonesia’s NDC pledge into the modeling
of capacity expansion of the Java-Bali power system in Indonesia. Firstly,
the LEAP model is validated using historical data of Indonesia’s power
system. Secondly, four scenarios of the Java-Bali power system
expansion from the base year 2015 through to 2030 are developed and
analyzed. Results indicate that the shift to natural gas (NGS scenario)
decreases future CO2 emissions by 65 million tons, helping to achieve the
CO2 mitigation target committed to. Likewise, an escalation of renewable
energy development (REN scenario) cuts the same amount of the
projected CO2 emissions and, thus, assures meeting the target. The cost
optimization simulation (OPT scenario) attains the targeted emission
reduction, but at 18% and 12%, lower additional costs compared to NGS
and REN, respectively. The cost-effectiveness of CO2 mitigation scenarios
ranges from 36.5 to 44.7 US$/tCO2e.
This chapter is based on a journal article:
Handayani, K., Krozer, Y., & Filatova, T. (2017). Trade-offs between
electrification and climate change mitigation: An analysis of the Java-
Bali power system in Indonesia. Applied Energy, 208.
CHAPTER 2 TRADE-OFFS BETWEEN ELECTRIFICATION AND CLIMATE CHANGE MITIGATION
30
2.1. Introduction
Electricity is vital to society today. Global electricity demand in the period
of 2002-2012 increased by 3.6% annually, exceeding the annual population
growth for the same period (IEA, 2015a). However, nearly 1 billion people
worldwide today do not have access to electricity (IEA, 2018b), making the
provision of universal access to electricity a vital development objective.
Yet, fossil fuel-based electricity production causes GHG emissions
measured in CO2 equivalents (CO2e). Since 2000, GHG emissions have
increased 2.4% a year, reaching 49 GtCO2e in 2010 (IEA, 2015b), out of
which 25% came from electricity and heat production (IPCC, 2014).
The Paris Agreement requires all parties to communicate their Intended
Nationally Determined Contributions (INDC), later converted into
Nationally Determined Contributions (NDC). Around 99% of the
communicated INDCs cover the energy sector (UNFCCC, 2016).
Accordingly, they need to incorporate their Paris target into national
energy planning. Developing countries, in particular, need to align the Paris
Agreement target with their vital national goals of nationwide
electrification. This research chapter addresses the question of if and how
Indonesia may satisfy the growing electricity demand while still meeting
climate mitigation targets. Aligned with the 2015 Paris Agreement,
Indonesia aims to reduce its GHGs by up to 29% against business as usual,
by 2030. Over and above this, an additional 12% reduction is intended with
international cooperation3. In the meantime, more than 14 million
Indonesians still do not have access to electricity (IEA, 2018b).
This chapter considers both objectives of electrification and climate
change mitigation in the simulation of capacity expansion of the most
extensive power system in Indonesia, namely the Java-Bali
interconnected power system. This chapter analyzes various scenarios of
3The Indonesian voluntary pledge is written in its first NDC document submitted to
the United Nations Framework Convention on Climate Change (UNFCCC) in 2016.
CHAPTER 2 TRADE-OFFS BETWEEN ELECTRIFICATION AND CLIMATE CHANGE MITIGATION
31
future power generation in the Java-Bali power system between 2016 to
2030, employing LEAP and a unique dataset from PLN. LEAP is selected
over other software tools to suit the modeling needs of this dissertation,
through a systematic screening process. Despite the fact that LEAP is
actively used –in 85 UNFCCC country reports (Khan et al., 2011) and in
more than 70 peer-reviewed journal papers (Connolly et al., 2010)–,
publications explicitly discussing the LEAP model validation are limited.
First, I set up the Indonesian LEAP model and run it from the base year
2005 through to 2015. Then, model results are validated against the
historical data of the national capacity addition, electricity production, and
CO2 emissions throughout 2006 through to 2015. Secondly, I develop
scenarios for future power generation in the Java-Bali power system and
analyze the changes in resource utilization and technology deployment
that respond to the Paris pledge with 10 power generation alternatives,
namely: ultra-supercritical (USC) coal, natural gas combined cycle
(NGCC), natural gas open cycle (NGOC), large and small hydroelectric
power plant (HEPP), hydro pumped storage (hydro P/S), geothermal, solar
photovoltaic (PV), wind power, and biomass.
The chapter adds a number of innovative contributions to the body of the
energy modeling literature. Firstly, to the best of the author’s knowledge,
this chapter is the first to analyze scenarios of power system expansion,
which take into account the energy sector’s actual CO2 mitigation targets
associated with the Indonesian pledge to the Paris Agreement. This
chapter assesses the consequences of the climate mitigation policy on
the Indonesian power sector using a validated model and zoom into the
level of individual technologies (a bottom-up approach), rather than
employing a macro-economic approach. Secondly, this chapter uses a
unique dataset from PLN that represents the historical technical
performances of every individual power plant in the Java-Bali power
system of 64 plants. Such a dataset enables more accurate settings for
some of the crucial LEAP input parameters, including each plant’s net

CHAPTER 2 TRADE-OFFS BETWEEN ELECTRIFICATION AND CLIMATE CHANGE MITIGATION
32
capacity and capacity factor4. Thirdly, this chapter is transparent on the
LEAP validation procedure by using ten years of Indonesian electricity
supply and demand data. As such, the study lays out an easy-to-replicate
method for assessing power sector pathways with regard to the Paris
Agreement in other developing countries.
The remainder of this chapter is organized as follows: Section 2.2 is the
literature review on the decarbonization of the power sector; Section 2.3
presents the methodology and data, including validation of the LEAP model
and scenarios development of the Java-Bali power system expansion;
Section 2.4 provides the results of LEAP simulations; Section 2.5
discusses the main findings; Section 2.6 concludes the chapter.
2.2. Paris Agreement and decarbonization of the power sector
A number of studies discuss decarbonization of the power sector in
developing countries and the implications of their commitments to the
Paris Agreement. Grande-Acosta and Islas-Samperio (2017) present an
alternative scenario for the Mexican power sector by assessing various
mitigation options both on the demand and supply sides. Their study
concluded that the alternative scenario assures Mexican compliance with
the Paris Agreement. However, the scenario entails an additional
investment of 2 billion US$/year over the analysis period. Likewise, Dalla
Longa and van der Zwaan (2017) analyzed the role of low carbon
technologies in achieving Kenya’s CO2 mitigation target under the Paris
Agreement. One conclusion of this study is that the deployment of these
technologies raises the energy system costs in 2050 ranging from 0.5% to
2% of the country’s GDP. Kim and Park (2017) investigated the impact of
South Korea’s INDC on the power system and electricity market in Korea.
The study revealed that the implementation of INDC causes an increase
in the electricity price by as much as 8.6 won/kWh. Another study of the
4Capacity factor is defined as the ratio of an actual electricity generation over a given
period of time to the maximum possible electricity generation over the same period
of time (U.S. NRC, 2017)
CHAPTER 2 TRADE-OFFS BETWEEN ELECTRIFICATION AND CLIMATE CHANGE MITIGATION
33
South Korean power sector (Lee and Huh, 2017) assessed the impact of
national policies triggered by the Paris Agreement –i.e., renewable portfolio
standard and feed-in-tariff– on the diffusion of renewable electricity. The
study confirmed that the policies indeed influence renewable electricity
diffusion. Meanwhile, in response to the Paris Agreement, China needs to
radically decarbonize its power sector, which will create unintended
consequences, such as the disturbance in stability and integrity due to
intermittent renewable energy generation (Guo et al., 2017). Thus, Guo et
al. (2017) present an analysis of the decarbonization of the Chinese power
sector, taking into consideration these temporal variations. This study
found that the inclusion of temporal variations resulted in a significant
difference in terms of installed capacity and load factors when compared
to the standard model. Wan et al. (2016) assess the impacts of Paris
climate targets on water consumption of the power sector in major
emitting economies, which include Brazil, China, India, US, EU, and Russia.
The study discovered that the fulfillment of long-term climate targets
would increase water consumption of power sector, when compared to the
business as usual pathways, particularly in the case of China and India.
Studies on the decarbonization of the Indonesian power sector are
available in the literature. Marpaung et al. (2005) used a decomposition
model to examine two factors (i.e., the technological substitution effect
and the demand side effect) that affect CO2 emissions by considering an
influence of external costs on the development of the Indonesian power
sector for the period of 2006 to 2025. This study concluded that increasing
external cost at a high level allowed for technological substitution, which
led to CO2 emissions reduction by up to 82.5%. Meanwhile, at the low to
medium external costs, CO2 emission reduction was mainly due to the
demand-side effect. Shrestha et al. (2009) used an input-output
decomposition approach to analyze factors that affect economy-wide
change in CO2, SO2, and NOx emissions in the case when the Indonesian
power sector employs integrated resource planning (IRP) approach, rather
than traditional supply-based electricity planning (TEP). The IRP approach

CHAPTER 2 TRADE-OFFS BETWEEN ELECTRIFICATION AND CLIMATE CHANGE MITIGATION
34
resulted in CO2, SO2, and NOx emission reductions of 431, 1.6, and 1.3
million tons, respectively, during 2006-2025, as compared to that under
the TEP approach. Rachmatullah et al. (2007) used the scenario-planning
method to devise a long-term electricity supply plan (1998-2013) of the
Java-Bali power system, which included analysis of CO2 emissions. This
study showed that 15% of CO2 emission could be reduced at an abatement
cost of around US$2.8–4.0 per ton. Wijaya and Limmeechokchai (2010)
introduced low carbon society actions into the long-term Indonesian
power system expansion planning (2007-2025), using the LEAP model.
This study concluded that the low carbon society actions reduced external
cost by 2 billion US$ as compared to the conventional electricity
expansion planning. Purwanto et al. (2015) developed a multi-objective
optimization model of long-term electricity generation planning (2011-
2050) to assess the economic, environmental, and energy resources
adequacy. This study revealed that the power system scenario with high
orientation on environmental protection became the most sustainable
scenario, yet lacked in terms of Reserve to Production Ratio (R/P) and
cost-related indicators. Kumar (2016) investigated the effects of different
renewable energy policy scenarios on CO2 emissions reduction, employing
LEAP. The results showed that the utilization of the Indonesian renewable
energy potentials reduced up to 81% of CO2 emissions when compared to
the baseline scenario. All of these studies analyzed the long-term power
system expansions and their associated CO2 emissions. However, they did
not set specific targets on CO2 mitigation as a constraint in the simulations
of future power generation.
A few studies set a specific target for CO2 emission in the Indonesian
power sector, and simulated patterns of power supply to meet the targets
set. Marpaung et al., 2007 developed a general equilibrium model, i.e., Asia-
Pacific Integrated Model (AIM)/Enduse for Indonesia, and analyzed the
effects of introducing CO2 emission targets on the technology mix of the
Indonesian power sector during 2013-2035. The study concluded that the
deployment of carbon capture and storage (CCS), biomass, and wind
CHAPTER 2 TRADE-OFFS BETWEEN ELECTRIFICATION AND CLIMATE CHANGE MITIGATION
35
power technologies contributed significantly to achieving the targets. Das
and Ahlgren (2010) analyzed the CO2 reduction targets scenario for the
long-term Indonesian power system expansion planning (2004-2030) using
MARKAL. The results showed that constraints on CO2 emission invoked
changes in technology mixes. Similarly, Stich and Hamacher (2016) applied
different levels of CO2 emission reduction targets to the optimized power
supply in Indonesia. Their results demonstrated that the CO2 emission
constraints boosted geothermal power expansion to replace the coal-fired
power generation. Finally, Siagian et al. (2017) used AIM to simulate energy
sector development over the period 2005-2030 under CO2 constraints
stipulated in a draft policy document. Their study indicated carbon prices
of US$16 and US$63 (2005)/tCO2 under 17.5% and 32.7% CO2 reduction
scenarios, respectively.
Neither of these studies is associated with the prevailing Indonesian policy
as stipulated in the Nationally Determined Contribution (NDC) as
submitted to UNFCCC after the Paris Agreement came into force.
Furthermore, an analysis using a bottom-up model that allows
considerations of technological complexity in the power sector is still
missing. This chapter fills this gap by incorporating the actual energy
sector’s mitigation targets - i.e., 11% CO2 reduction on its own effort and
14% CO2 with international support - into power capacity expansion using
a technology-rich energy system model. Hence, the outcomes of this
chapter can be used as a reference when formulating the legal framework
for curbing CO2 emissions in the power sector.
2.3. Methodology and data
2.3.1. Review of available models and selection of an appropriate model
Rigorous models for analyzing long-term planning are necessary to support
any optimal allocation of investments. While numerous energy system
models are developed and used worldwide (Evans and Hunt, 2009), not all
are suitable for performing a technological, economic, and environmental
analysis of the national power sector. Consequently, this calls for the

CHAPTER 2 TRADE-OFFS BETWEEN ELECTRIFICATION AND CLIMATE CHANGE MITIGATION
36
careful selection of a model. Urban et al. (2007) provided a comparison of
12 models in terms of their suitability for applications in developing
countries. The study argued that the characteristics of an energy system
in developing countries differed from those of developed countries. They
found that the energy-related characteristics of developing countries,
such as supply shortages, urbanization, and low electrification rate, were
neglected in many models. Bhattacharyya (2010) provided an assessment
of 12 energy system models suitable for analyzing energy, environment,
and climate change policies in developing countries. This study suggested
that the accounting-type models were more relevant for developing
countries because of their ability to capture rural-urban differences,
traditional and modern energy technologies as well as non-monetary
transactions. Connolly et al. (2010) reviewed energy system models to
identify ones suitable to analyze the integration of 100% renewable energy
into various energy systems. The paper presented a brief summary of 37
models, most of them included the power sector in their analysis. However,
they varied significantly in their purpose. Based on these three review
papers, this chapter filters and identifies energy system models that are
open access and suitable for analyzing the technical, economic, and
environmental parameters of a long-term power system expansion in a
developing country. The detailed inventory of models and screening
criteria are presented in Appendix 2.A (Table 2A.1).
This screening produced a shortlist of 30 models as being potentially
suitable for the analysis in this chapter (Appendix 2.A, Table 2A.2). The
screening results in the LEAP model being chosen for several reasons.
Firstly, it can accommodate the technological complexity of the power
system. Secondly, LEAP is freely accessible to students, as well as non-
profit and academic institutions in developing countries. This increases
the chances of reproducing and further developing this analysis beyond
the efforts in the current study, as and when new data and policy
considerations become available. In addition, LEAP is very user-friendly
and provides open-access online support for its users. Finally, LEAP is
CHAPTER 2 TRADE-OFFS BETWEEN ELECTRIFICATION AND CLIMATE CHANGE MITIGATION
37
considered as a popular energy model, as it has been used in 190 countries
and hosts more than 42,000 members in its online platform (Heaps, 2017).
It makes results comparable across countries, which is especially relevant
when major international agreements such as the Paris accord are
considered.
Indeed, LEAP has been used in many studies analyzing CO2 mitigation in
the power sector worldwide. The LEAP model is employed to explore
various scenarios of the energy system development in Taiwan (Yophy et
al., 2011), China (Tao et al., 2011), Iran (Amirnekooei et al., 2012), Panama
(McPherson and Karney, 2014), Maharashtra, India (Kale and Pohekar,
2014), Pakistan (Perwez et al., 2015), and Africa (Ouedraogo, 2017). LEAP
has also been actively applied to study the energy and CO2 impacts of a
power system expansion with a special focus on a particular energy source
such as landfill gas in Korea (Shin et al., 2005), nuclear in Korea and Japan
(Kim et al., 2011; Takase and Suzuki, 2011) and renewable in Southeast
Asia (Kumar, 2016). None of these studies combined the accounting and
optimization settings in LEAP for the analysis. Yet, the features provide
for different types of analysis, which is essential for a choice of a robust
policy. On the one hand, the accounting method in LEAP can be used to
represent future power systems based on various policy scenarios,
enabling the comparison of energy, environmental and economic impacts
of various energy policies. This method provides answers for a “what if”
type of analysis. On the other hand, the optimization method in LEAP
optimizes investment decisions and, thus, provides a picture of what could
be the optimal pathway of the power system development. This chapter
employs both accounting and optimization methods from LEAP to analyse
scenarios of CO2 mitigation in the Java-Bali power system.
CHAPTER 2 TRADE-OFFS BETWEEN ELECTRIFICATION AND CLIMATE CHANGE MITIGATION
38
2.3.2. Validation of the Indonesian LEAP model
2.3.2.1. Model setup
I started by setting up a LEAP model of the Indonesian power system from
the base year of 2005. After which, I simulated the expansion of PLN’s
power generation capacity from 2006 to 2015. According to the PLN
statistics, coal steam turbine (CST), NGCC, NGOC, diesel generator,
hydropower, geothermal, and solar power were the leading technologies
employed during this time. CST and NGCC expanded significantly during
this period, i.e., 72% and 18% of the total capacity addition respectively,
leaving the remaining 10% of the capacity addition shared between the
rest. Thus, the Indonesian LEAP model endogenously simulates CST and
NGCC for capacity expansion, while the other technologies are
exogenously added.
Table 2.1 lists the type of model outputs, as well as the employed input
data and the data used for validation of the Indonesian LEAP model. The
input data for electricity demand is the actual values of the national
electricity consumption from 2005 to 2015. The power system
characteristics such as transmission losses and a load shape as well as
technological characteristics are also based on the actual values.
Meanwhile, the data used for validation of the model results consists of
historical electricity generation, past capacity expansion of each
technology, and actual fuel consumptions. Appendix 2.B presents detailed
information regarding parameters for the Indonesian LEAP model
validation.
As mentioned in Section 2.3.1, LEAP has two different settings for
simulating electricity generation: accounting settings and optimization
settings. Table 2.2 explains the two alternative settings with regard to the
capacity addition and electricity dispatch. I compared the simulation
results from both of these settings with the actual data of the year 2005-
2015 to validate the model performance.

CHAPTER 2 TRADE-OFFS BETWEEN ELECTRIFICATION AND CLIMATE CHANGE MITIGATION
39
Table 2.1: Input-output parameters in the Indonesian LEAP model and data
used for validation
Input parameter Model outputs Data used for validation
- Electricity demand (2005-2015)a
- Transmission & distribution losses (2005-2015)a
- Reserve margin* (2005-2015)b
- Load shapec
- Power generation capacitiesa
- Fuel efficiencyd
- Investment cost of each technologye
- Operation cost of each technologya
- Electricity generation (2005-2015)
- Capacity added (2006-2015)
- Technology mix of the capacity added
- Fuel requirement
- CO2 emissions
- Historical electricity generation (2005-2015)a
- Historical capacity addition (2006-2015)a
- Actual technology mix of the capacity addeda
- Fuel consumptiona
- CO2 emissionsf
*Reserve margin is the percentage of reserve capacity relative to the capacity needed to meet the normal peak demand. Source: aPLN Statistics 2005-2015; bCalculated based on peak load and capacity data in PLN Statistics 2005-2015; cDrawn based on hourly load data of 2015 (P2B, 2016a); dCalculated based on actual electricity production and fuel consumption in 2005 (PLN, 2006); ePLN (2005b); fCalculated using IPCC Tier 1 emission factor.
Table 2.2: Two alternative simulation settings in LEAP
Accounting Setting Optimization Setting
Step 1: Capacity addition
LEAP controls when to add new supply capacity based on annual electricity demand.
LEAP controls the type of new supply capacity to be added and when it will be added based on annual demand and cost optimization.
Step 2: Electricity dispatch from each type of power supply
LEAP controls the dispatch of electricity from each process based on a user-defined merit order.
Driven by cost optimization, LEAP controls the dispatch of electricity from each process.
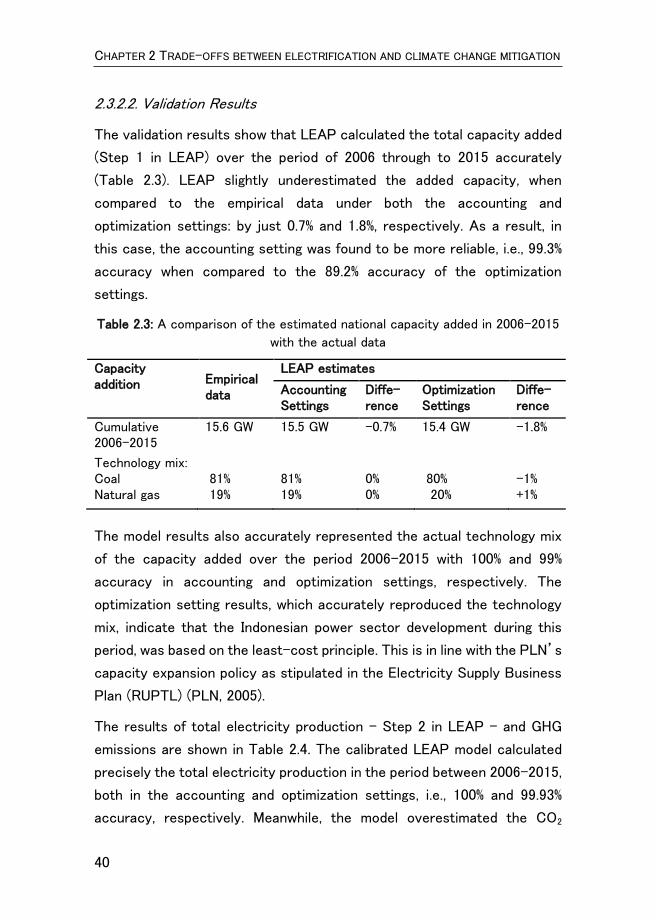
CHAPTER 2 TRADE-OFFS BETWEEN ELECTRIFICATION AND CLIMATE CHANGE MITIGATION
40
2.3.2.2. Validation Results
The validation results show that LEAP calculated the total capacity added
(Step 1 in LEAP) over the period of 2006 through to 2015 accurately
(Table 2.3). LEAP slightly underestimated the added capacity, when
compared to the empirical data under both the accounting and
optimization settings: by just 0.7% and 1.8%, respectively. As a result, in
this case, the accounting setting was found to be more reliable, i.e., 99.3%
accuracy when compared to the 89.2% accuracy of the optimization
settings.
Table 2.3: A comparison of the estimated national capacity added in 2006-2015
with the actual data
Capacity addition Empirical
data
LEAP estimates
Accounting Settings
Diffe-rence
Optimization Settings
Diffe-rence
Cumulative 2006-2015
15.6 GW 15.5 GW -0.7% 15.4 GW -1.8%
Technology mix: Coal 81% 81% 0% 80% -1% Natural gas 19% 19% 0% 20% +1%
The model results also accurately represented the actual technology mix
of the capacity added over the period 2006-2015 with 100% and 99%
accuracy in accounting and optimization settings, respectively. The
optimization setting results, which accurately reproduced the technology
mix, indicate that the Indonesian power sector development during this
period, was based on the least-cost principle. This is in line with the PLN’s
capacity expansion policy as stipulated in the Electricity Supply Business
Plan (RUPTL) (PLN, 2005).
The results of total electricity production – Step 2 in LEAP – and GHG
emissions are shown in Table 2.4. The calibrated LEAP model calculated
precisely the total electricity production in the period between 2006-2015,
both in the accounting and optimization settings, i.e., 100% and 99.93%
accuracy, respectively. Meanwhile, the model overestimated the CO2

CHAPTER 2 TRADE-OFFS BETWEEN ELECTRIFICATION AND CLIMATE CHANGE MITIGATION
41
emissions by 2.6% and 2.5% in the accounting and optimization settings,
respectively.
Table 2.4: A comparison of the estimated national electricity production and
GHG emissions with the actual data
Electricity production and GHG emissions (2006-2015)
Empirical data
LEAP estimate Accounting Setting
Diffe-rence
Optimization Setting
Diffe-rence
Cumulative electricity production
1,398 terawatt-hour/TWh
1,398 TWh 0% 1,397 TWh -0.07%
Cummulative GHG emissions
1030 MtCO2e
1057 MtCO2e
+2.62% 1056 MtCO2e +2.53%
Based on these results, I concluded that LEAP calculations were accurate.
However, as is the case with any other energy model, the simulations in
LEAP depend on input data and assumptions. Hence, it may generate
uncertainty in outcomes when long-run future perspectives are taken.
2.3.3. Future scenarios development
The validation phase (Section 2.3.2) indicated that the LEAP model
estimates of the capacity added, technology mix, cumulative electricity
production, and CO2 emissions were reliable. I moved to scenario analysis
of possible future developments of the Java-Bali power system. I
developed four scenarios of capacity expansion for the Java-Bali power
system. The scenarios were developed based on the changes in LEAP
assumptions on the choice of power generation technologies and types of
energy sources. All scenarios aimed to reduce CO2 emissions in line with
the Indonesian pledge to the Paris Agreement.
The first scenario (reference) represents the continuity of the present
trend that sets the benchmark. The second and third ones –namely:
natural gas scenario and renewable energy scenario, respectively– follow
The National Energy Policy 2014 (NEP) (Government of The Republic of

CHAPTER 2 TRADE-OFFS BETWEEN ELECTRIFICATION AND CLIMATE CHANGE MITIGATION
42
Indonesia, 2014). NEP aimed to increase the use of natural gas and new5
and renewable energy (NRE) to attain a minimum of 22% and 23% shares,
respectively, in the national energy mix by 2025. The NRE target in NEP
includes nuclear. Nonetheless, NEP emphasizes that nuclear is the least
preferable option. These three scenarios use the accounting settings in
LEAP, which enable the analysis of different paths of the future of power
supply, based on different policy assumptions considering the realistic
constraints Indonesia currently faces. Meanwhile, the fourth scenario
(optimization scenario) uses the optimization setting of LEAP to find the
least-cost solution for the capacity expansion and electricity dispatch. As
such, this scenario does not account for the realistic policy constraints
per se but instead serves as a normative benchmark from the cost
minimization perspective.
The objective of all scenarios is to meet the growing electricity demand
of the future while fulfilling the Indonesian commitment under the Paris
Agreement. According to the Indonesian First NDC document, Indonesia
is committed to reducing 29% of GHG emissions by 2030 (unconditional
target/CM1), compared to the business as usual scenario (Government of
The Republic of Indonesia, 2016). A more ambitious target is set at 41%
reduction (conditional target/CM2), subject to the availability of financial
support from developed countries. Given 29% and 41% targets, 11% and
14%, respectively, should be reduced by the energy sector alone. These
targets are lower when compared to those of the forestry sector, which
are 17% (own effort) and 23% (with international support). This is expected
as the forestry sector6 contributed 51% of total emissions over the period
of 2000-2012, while the energy sector contributed 32% over the same
period (Government of The Republic of Indonesia, 2015b). With no
mitigation policy, the energy sector alone is expected to produce up to
1,669 million tCO2e emissions in 2030 (Government of The Republic of
5 The term “new energy” is defined as energy that is stemmed from new technologies
such as nuclear and hydrogen (Government of The Republic of Indonesia, 2014) 6 Including land use change
CHAPTER 2 TRADE-OFFS BETWEEN ELECTRIFICATION AND CLIMATE CHANGE MITIGATION
43
Indonesia, 2015b). These emissions consist of emissions from power,
transportation, and other energy sub-sectors. The emission reduction
targets for the energy sector are 314 million tons (CM1) and 398 million
tons (CM2) or equivalent to 19% and 24% of the energy sector’s baseline
emission in 2030, respectively, under CM1 and CM2. Yet, the NDC
document does not specify the CO2 emission baseline for the power sector
alone. Hence, for all practical purposes, I assume that the power sector
contributes proportionally to the national energy sector target.
Accordingly, I assume that the Java-Bali power system should reduce its
emissions at least at the same pace as agreed upon at the national level.
Thus, 19% and 24% by 2030 are the targets for setting up the scenarios.
To quantify possible pathways of reaching these competing targets, I
specify four scenarios of the Java-Bali power system expansion for the
period 2016-2030 as follows:
(i). Reference scenario (REF): In the year 2015, coal-fired power plants
(CFPPs) were the dominant technology in the Java-Bali power system.
The net capacity of the coal power plants was 17.3 MW or 55% of the
total capacity in the Java-Bali power system (P2B, 2016a). The natural
gas power plant constituted 34% of the total capacity, while the
renewable capacity share was only 11%, which consisted of geothermal
(8%) and hydro (3%). Biomass, wind power, and solar PV technologies
were not present in the 2015 capacity mix. The REF scenario assumes
that the power system expands with the 2015 technology mix, which
persists until the end of the modeling horizon. This pathway does not
incorporate any CO2 mitigation policies and continues the historical
capacity expansion policy based merely on cost-optimization (PLN,
2016b). The abundance of coal resources in Indonesia and the low cost
of coal technology leads to the lock-in with the coal technology along
the REF pathway.
(ii). Natural gas scenario (NGS): This scenario assumes an increasing rate
of the natural gas power plant’s development. This is in line with the

CHAPTER 2 TRADE-OFFS BETWEEN ELECTRIFICATION AND CLIMATE CHANGE MITIGATION
44
NEP 2014, which aims to increase the share of natural gas in the
national energy mix. The substitution of coal by ‘cleaner’ natural gas
is expected to reduce GHG emissions, due to the lower emission factor
of natural gas when compared to that of coal. I ran this scenario in two
versions. The NGS1 scenario aimed to achieve the 19% CO2 reduction
target compared to the REF scenario, relying entirely on own efforts
without any support from international partners. The NGS2 scenario
assumes international partners provide support to Indonesia, and this
curbs the CO2 emissions by 24% compared to the REF scenario.
(iii). Renewable energy scenario (REN): This scenario assumes an increase
in the development of renewable energy, which includes geothermal,
hydro, biomass, wind, and solar PV. In this scenario, the power system
expansion maximizes the utilization of the renewable energy potential
of the Java-Bali islands to achieve the Paris target. This scenario is
in line with the NEP 2014, which aims to increase the use of new and
renewable energy in the national energy mix. The REN1 scenario aims
for the 19% CO2 reduction target and REN2 scenario for the 24% CO2
reduction target.
(iv). Optimization scenario (OPT): This scenario uses LEAP’s optimization
settings to obtain the least-cost solution for the Java-Bali power
capacity expansion while satisfying both the increasing demand and
CO2 reduction targets. The least-cost solution in LEAP is defined as
the power system with the lowest total net present value of costs of
the system over the entire time horizon. In the OPT scenario, all
technologies that are included in the REF, NGS, and REN scenarios
are considered for capacity expansion. The OPT1 and OPT2 scenarios
assume 19% and 24% CO2 reduction targets, correspondingly.
2.3.4. Input data
The data source and methodology to calculate the parameters of the
Java-Bali power system are provided in Table 2.5. Rather than relying on
the generic LEAP default values, I use national and regional data. Thus,

CHAPTER 2 TRADE-OFFS BETWEEN ELECTRIFICATION AND CLIMATE CHANGE MITIGATION
45
most of the input parameters were collected from governmental reports
and PLN. Since PLN is the sole owner and operator of Indonesia’s T&D
networks, it also records and manages electricity dispatch from IPPs.
Table 2.5: Summary of model input parameter
Input Data Value Source
Annual demand growth 2016-2030
6.8% - 7.5% Refers to the RUPTL estimates (PLN, 2017b)
T&D losses 7.9% – 8.5% Refers to the draft RUKN estimates (KESDM, 2015)
System load shape Appendix 2.C Based on hourly demand data in 2014 (P2B, 2016b)
Reserve margin 35% Refers to the RUKN criteria (KESDM, 2015)
Capacities of existing power plants
Appendix 2.C (P2B, 2016a)
Merit order* in the accounting setting:
- Baseload power plants - Intermediate/peak
load power plants
Coal, geothermal Natural gas, hydro
Maintained according to the P2B dispatch order (P2B, 2016a)
Environmental parameter
Per technology The IPCC Tier 1 default emission factors, embedded in the LEAP technology database (Heaps, 2017)
Discount rate 12% The discount rate used by PLN (JICA, 2010)
*In the accounting setting of LEAP, merit order is the order in which a power plant will be dispatched. **P2B = the Java-Bali load control center
The demand projection for the year 2016 to 2025 is calculated based on
the estimated demand growth in RUPTL (PLN, 2017b). Meanwhile, the
demand projection for the remaining years (2026 to 2030) was calculated,
assuming that demand for electricity continues to grow at the same rate
as the estimated growth in the year 2026, i.e., 7%. It is assumed that
transmission losses will gradually decrease from 8.6% in the year 2015 to
7.9% in the year 2030 (KESDM, 2015). The energy load shape is drawn in
the LEAP model based on the historical hourly load data collected from
P2B, as shown in Appendix 2.C, Figure 2C.1 (P2B, 2016b). The planning

CHAPTER 2 TRADE-OFFS BETWEEN ELECTRIFICATION AND CLIMATE CHANGE MITIGATION
46
reserve margin was set at 35% following the criteria in the draft National
Electricity General Plan (RUKN) 2015-2034 (KESDM, 2015).
The calculation of electricity generation in LEAP depends on the input of
the projected electricity demand in the demand module (Chapter 1, Fig.
1.2). Thereafter, the electricity generation module in LEAP assigns
technologies to satisfy the electricity demand. One limitation in LEAP is
that the model does not provide for the expansion of T&D networks.
Hence, I assume that there are no constraints in the T&D networks,
meaning that the electricity supply can be transmitted at any time to any
T&D substation.
The type of existing power generation technologies in the Java-Bali power
system includes CST, NGCC, NGOC, diesel generator, HEPP, and
geothermal. For capacity expansion, I consider adding unexploited
renewable potentials, namely, biomass, wind turbine, and solar PV.
The existing coal power plants in Java-Bali use conventional technologies,
which have relatively lower efficiencies compared to the supercritical (SC)
and USC technologies. According to RUPTL, to improve efficiency and
reduce CO2 emissions, the future coal power plant’s development in the
Java-Bali power system would only consider SC and USC technologies
(PLN, 2016b). Thus, this dissertation only considers USC coal technology
for the new coal capacity addition. To date, there are no nuclear power
plants in Indonesia. In the future, the development of large-scale nuclear
energy supply is possible, as indicated in NEP. However, it is considered
as the last option after maximizing the use of renewable energy sources.
Therefore, this chapter assumes no nuclear deployment during the time
horizon of the simulations (2016-2030).
Technology data of the existing power plants in the Java-Bali system were
collected from PLN. These data include the power-generating capacity of
each technology, planned retirement, heat rate, historical production, and
capacity factor. The accuracy of the existing power plant data is essential
to ensure reliable base year data, which was used as a reference for
CHAPTER 2 TRADE-OFFS BETWEEN ELECTRIFICATION AND CLIMATE CHANGE MITIGATION
47
developing power expansion scenarios. The capacities of existing power
plants in the Java-Bali power system are presented in Appendix 2.C, Table
2C.1.
Meanwhile, technology data for future capacity expansion were retrieved
from various studies, as shown in Table 2.6. The cost characteristic of
power generation technologies refers to the cost assumptions of the world
energy outlook (WEO) model (OECD/IEA, 2017). Costs data that was not
presented in the WEO model 2016 were taken from the Indonesian Energy
Outlook (IEO) 2016, which relied on data from the International Energy
Agency (IEA) database of the WEO 2015. These parameters were assumed
to be constant throughout the entire simulation.
Fuel costs of coal and natural gas were taken from the PLN Statistics
2015 (PLN, 2016c), while biomass fuel cost was sourced from ASEAN
Energy Centre (ACE) study (ACE, 2016). The calculation of the
resources/fuel requirements in LEAP depends on the outputs of the
electricity generation module. LEAP allocates resources needed for the
electricity generation in accordance with the fuel efficiency of each
technology.
It is essential to take into consideration the availability of the energy
resources for the Indonesian LEAP model, particularly concerning
renewable energy, as it can only be utilized locally. Hence, the simulation
of renewable energy expansion takes into account the potential of
renewable energy in the Java-Bali islands. For practical reasons, I assume
that the publicly available data for the Indonesian renewable energy
potential (Chapter 1, Table 1.2) can be exploited over the time horizon of
this study. Furthermore, I assume that Indonesian natural gas reserves
could be utilized for power generation without any constraint.

CHAPTER 2 TRADE-OFFS BETWEEN ELECTRIFICATION AND CLIMATE CHANGE MITIGATION
48
Table 2.6: Characteristics of technologies in the Java-Bali LEAP model
Technology Lifetime (years)a
Efficiency (%)b
Maximum Availability (%)*c
Capacity credit (%)**d
Capital cost (2015 US$/kW)b
Fixed OM cost (2015 US$/kW)b
Variable OM
Cost (2015 US$/MWh)c
Fuel coste (2015 US$)
USC coal 30 44 80 100 1867 64 3.8 51.8 US$/ton
NGCC 25 57 80 100 817 24 3.8 7.6 US$/MMBTU
NGOC 25 38 80 100 439 21 3.8 7.6 US$/MMBTU
Hydro 35 100 41 51 2200 56 3.8 -
Mini hydro 35 100 46 58 3350 67 3.8 -
Hydro P/S 35 95c 20 25 1050c 54c 3.8 -
Geothermal 20 10 80 100 2675 53 0.7 -
Solar PV 20 100 17 22 1953 20 0.4 -
Wind power 20 100 28 35 1756 44 0.8 -
Biomass 20h 35 80 100 2228 78 6.5 11.67 US$/toni
Note: kW= kilowatt; MWh = megawatt-hours; OM = operation and maintenance; MMBTU = million British thermal units. *Maximum availability in LEAP is defined as the ratio of the maximum energy produced to what would have been produced if the process ran at full capacity for a given period (expressed as a percentage) (Heaps, 2017). **Capacity credit in LEAP is defined as the fraction of the rated capacity considered firm for calculating the reserve margin, which is calculated based on the ratio of availability of the intermittent plant to the availability of a standard thermal plant (Heaps, 2017). aIEA and OECD/IEA (2015); bOECD/IEA (2017)w; cDEN (2016); dcalculated based on the ratio of availability of the intermittent plant to the availability of a standard thermal plant (Heaps, 2017); ePLN (2016c); fRothwell and Rust (1997); gIEA and NEA (2015); hIRENA (2012); iACE (2016).
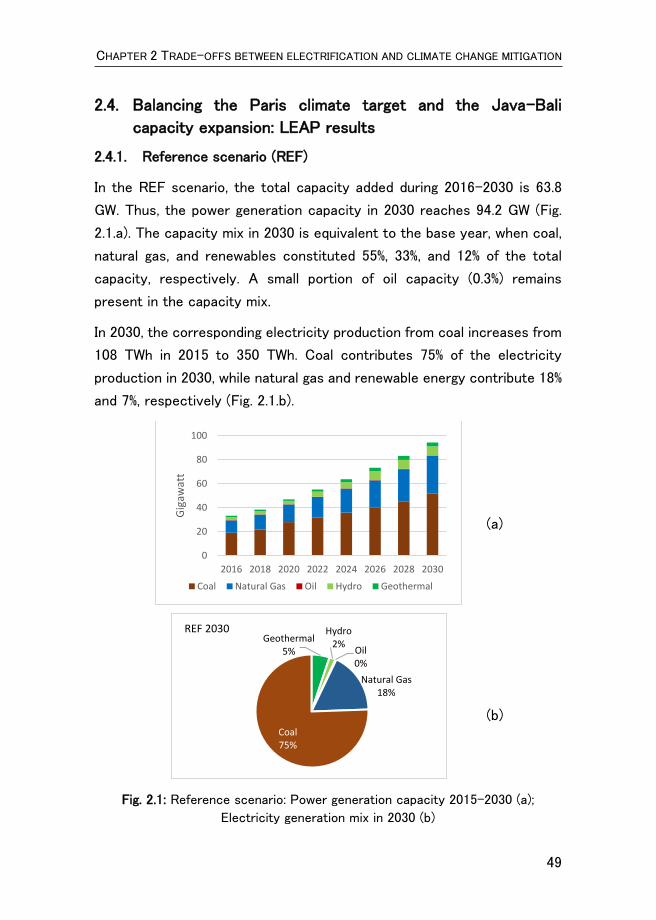
CHAPTER 2 TRADE-OFFS BETWEEN ELECTRIFICATION AND CLIMATE CHANGE MITIGATION
49
2.4. Balancing the Paris climate target and the Java-Bali
capacity expansion: LEAP results
2.4.1. Reference scenario (REF)
In the REF scenario, the total capacity added during 2016-2030 is 63.8
GW. Thus, the power generation capacity in 2030 reaches 94.2 GW (Fig.
2.1.a). The capacity mix in 2030 is equivalent to the base year, when coal,
natural gas, and renewables constituted 55%, 33%, and 12% of the total
capacity, respectively. A small portion of oil capacity (0.3%) remains
present in the capacity mix.
In 2030, the corresponding electricity production from coal increases from
108 TWh in 2015 to 350 TWh. Coal contributes 75% of the electricity
production in 2030, while natural gas and renewable energy contribute 18%
and 7%, respectively (Fig. 2.1.b).
(a)
(b)
Fig. 2.1: Reference scenario: Power generation capacity 2015-2030 (a);
Electricity generation mix in 2030 (b)
0
20
40
60
80
100
2016 2018 2020 2022 2024 2026 2028 2030
Gig
awat
t
Coal Natural Gas Oil Hydro Geothermal
Geothermal5%
Hydro2%
Oil0%
Natural Gas18%
Coal75%
REF 2030

CHAPTER 2 TRADE-OFFS BETWEEN ELECTRIFICATION AND CLIMATE CHANGE MITIGATION
50
The resulting CO2 emissions in 2030 are 339 million tCO2e or nearly
threefold of the emissions in the base year. These are the baseline for the
CO2 reduction in the mitigation scenarios (NGS, REN, and OPT). Table 2.7
shows the CO2 emissions baseline and reduction targets.
Table 2.7: Emission reduction targets against REF scenario
CO2 emissions level in 2030
(REF), million tCO2e
CO2 reduction target
in 2030 (%)
CO2 emission reduction
in 2030, million tCO2e
339 19% 64.4
339 24% 81.4
2.4.2. Natural gas scenario (NGS)
The results of the LEAP simulations for the NGS scenario indicate that
switching from coal to natural gas alone can already deliver both 19% and
24% CO2 reduction targets. This switching requires around 0.36 billion toe
of natural gas, which is equivalent to 9% of the Indonesian natural gas
reserve.
NGS1 scenario aiming at the 19% CO2 reduction:
In NGS1, the natural gas capacity in 2030 expands up to 56.5 GW, a fivefold
increase in the capacity over 2015. It is a 25% increase in the gas share in
the capacity mix as compared to REF (Fig. 2.2.a). Consequently, the coal
capacity share decreases from 52% in REF down to 31% in NGS1.
Compared to REF, the corresponding electricity production from natural
gas increases significantly. In NGS1, natural gas constitutes 50% of the
electricity generation in 2030, nearly threefold compared to its share in
REF. Accordingly, coal power generation decreases from 75% in REF to
42% in NGS1.
NGS2 scenario aiming at the 24% CO2 reduction:
In order to reduce the CO2 emissions by 24% against REF, further
expansion of natural gas capacity is required. The simulation results
indicate that it takes an additional 6.2 GW of natural gas capacity when

CHAPTER 2 TRADE-OFFS BETWEEN ELECTRIFICATION AND CLIMATE CHANGE MITIGATION
51
compared to NGS1. Consequently, the share of natural gas power
generation in 2030 rises to 59%, which is 9% higher than NGS1 (Fig. 2.2.b).
Meanwhile, the coal capacity share declines to 24%, leading to a reduced
percentage of the coal power generation to 33% as compared to 75% in
REF.
(a)
(b)
Fig. 2.2: Natural gas scenario: Power generation capacity (NGS1, 19% target) (a);
Electricity generation mix in 2030 (NGS2, 24% target) (b)
2.4.3. Renewable energy scenario (REN)
In REN, the capacity of renewable energy increases significantly in order
to attain both 19% and 24% CO2 reduction targets. Accordingly, the
corresponding electricity production from renewable energy also grows in
both REN1 and REN2 scenarios (Fig. 2.3). The deployment of renewable
energy in REN refers to RUPTL, which stipulates the plan to maximize the
0
20
40
60
80
100
2016 2018 2020 2022 2024 2026 2028 2030
Gig
awat
t
Coal Natural Gas Oil Hydro Geothermal
Geothermal5%
Hydro3%
Oil0%
Natural Gas59%
Coal33%
2030: 465 TWh

CHAPTER 2 TRADE-OFFS BETWEEN ELECTRIFICATION AND CLIMATE CHANGE MITIGATION
52
utilization of hydro and geothermal potentials and to add up to 5 GW and
2.5 GW of solar PV and wind power capacities, respectively by 2025 (PLN,
2017b). By 2030, the solar PV capacity adds up to 8 GW and 14 GW,
respectively, in REN1 and REN2. Furthermore, the capacity of wind power
reaches 4 GW and 6 GW by 2030 in REN1 and REN2, respectively.
Meanwhile, no specific target is set for biomass, although the RUPTL
mentions the plan to add 0.1 GW of municipal waste power plants. I assume
that 4 GW and 5 GW of biomass capacities are added in REN1 and REN2,
respectively, out of the total 7.4 GW biomass potentials of the Java-Bali
islands.
(a)
(b)
Fig. 2.3: Renewable energy scenario: Electricity generation mix in 2030 (REN1,
19% target) (a); Power generation capacity (REN2, 24% target) (b)
Solar3%
Wind2% Biomass
6%
Geothermal10%
Hydro3%
Oil0%
Natural Gas19%
Coal57%
2030: 465 TWh
0
20
40
60
80
100
120
2016 2018 2020 2022 2024 2026 2028 2030
Gig
awat
t
Coal Natural Gas Oil Hydro Geothermal Biomass Wind Solar

CHAPTER 2 TRADE-OFFS BETWEEN ELECTRIFICATION AND CLIMATE CHANGE MITIGATION
53
REN1 scenario aiming at the 19% CO2 reduction:
The renewable capacity in REN1 adds up to 33 GW or threefold of the
renewable capacity addition present in REF. Renewables now account for
31% of the total power generation capacity in 2030, split between hydro
(9.8%), geothermal (6.3%), wind power (3.8%), biomass (3.8%), and solar PV
(7.6%). Consequently, the share of renewable electricity generation
increases by up to 24% of the total power generation in 2030, which is
three times higher than that in REF.
REN2 scenario aiming at the 24% CO2 reduction:
To accomplish the 24% CO2 reduction target, 9 GW of renewables are
added on top of their capacity in REN1. In 2030 the renewables capacity
reaches 42 GW constituting 38% of the total power generation capacity.
The capacity is shared between hydro 10.3 GW, geothermal 6.7 GW, wind
6 GW, biomass 5 GW, and solar PV 14 GW. Meanwhile, the share of
renewable electricity generation adds up to 28% as compared to 7% in REF.
2.4.4. Optimization scenario (OPT)
Based on the simulation results of the OPT scenario, the least-cost option
for meeting the Paris target is to expand both renewable energy and
natural gas capacities, resulting in a significant decrease in coal capacity
compared to REF (Fig. 2.4).
OPT1 scenario aiming at the 19% CO2 reduction:
In OPT1, by 2030, the renewables capacity accounts for 20 GW (Fig. 2.4.a).
This is a significant increase from 10.8 GW in REF, and consists of hydro
(8.4 GW), geothermal (6.6 GW), biomass (4 GW), wind (0.5 GW), and solar
PV (0.5 GW). The natural gas capacity increased by 4% from 31.3 GW in
REF to 32.5 GW in OPT1. Meanwhile, the coal capacity decreases
significantly (25%) from 51.8 GW in REF down to 38.8 GW in OPT1.
Thus, the OPT1 cost-efficient electricity generation mix in 2030 consists
of coal (56%), natural gas (23%), and renewables (21%). Despite its
decreased capacity compared to REF, the production share of coal

CHAPTER 2 TRADE-OFFS BETWEEN ELECTRIFICATION AND CLIMATE CHANGE MITIGATION
54
remains the highest due to its dominance in the base year (65% of the total
production) and the cheap price of coal resources. This indicates a high
chance of lock-in with the coal technology infrastructure, if no other
criteria, other than cost minimization, are at play.
(a)
(b)
Fig. 2.4: Optimization scenario: Power generation capacity (OPT1, 19% target)
(a); Electricity generation mix 2030 (OPT2, 24% target) (b)
OPT2 scenario aiming at the 24% CO2 reduction:
The results of the OPT2 scenario show that the 5% supplementary CO2
reduction can be attained through partial substitution of coal by natural
gas. These produce an electricity generation mix comprising of coal (46%),
renewables (21%), and natural gas (33%), in the year 2030 (Fig. 2.4.b).
0
20
40
60
80
100
2016 2018 2020 2022 2024 2026 2028 2030
Gig
awat
t
Coal Natural Gas Oil Hydro Geothermal Biomass Wind Solar
Solar0%
Wind1%
Biomass6%
Geothermal10%
Hydro4%Oil
0%
Natural Gas33%
Coal46%
2030: 465 TWh
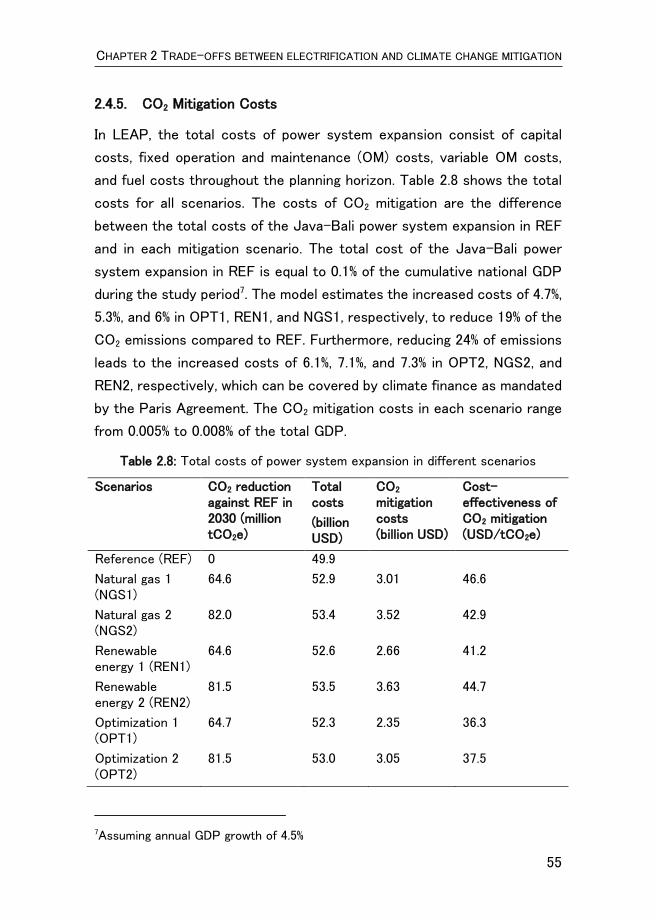
CHAPTER 2 TRADE-OFFS BETWEEN ELECTRIFICATION AND CLIMATE CHANGE MITIGATION
55
2.4.5. CO2 Mitigation Costs
In LEAP, the total costs of power system expansion consist of capital
costs, fixed operation and maintenance (OM) costs, variable OM costs,
and fuel costs throughout the planning horizon. Table 2.8 shows the total
costs for all scenarios. The costs of CO2 mitigation are the difference
between the total costs of the Java-Bali power system expansion in REF
and in each mitigation scenario. The total cost of the Java-Bali power
system expansion in REF is equal to 0.1% of the cumulative national GDP
during the study period7. The model estimates the increased costs of 4.7%,
5.3%, and 6% in OPT1, REN1, and NGS1, respectively, to reduce 19% of the
CO2 emissions compared to REF. Furthermore, reducing 24% of emissions
leads to the increased costs of 6.1%, 7.1%, and 7.3% in OPT2, NGS2, and
REN2, respectively, which can be covered by climate finance as mandated
by the Paris Agreement. The CO2 mitigation costs in each scenario range
from 0.005% to 0.008% of the total GDP.
Table 2.8: Total costs of power system expansion in different scenarios
Scenarios CO2 reduction against REF in 2030 (million tCO2e)
Total costs
(billion USD)
CO2 mitigation costs (billion USD)
Cost-effectiveness of CO2 mitigation (USD/tCO2e)
Reference (REF) 0 49.9
Natural gas 1 (NGS1)
64.6 52.9 3.01 46.6
Natural gas 2 (NGS2)
82.0 53.4 3.52 42.9
Renewable energy 1 (REN1)
64.6 52.6 2.66 41.2
Renewable energy 2 (REN2)
81.5 53.5 3.63 44.7
Optimization 1 (OPT1)
64.7 52.3 2.35 36.3
Optimization 2 (OPT2)
81.5 53.0 3.05 37.5
7Assuming annual GDP growth of 4.5%

CHAPTER 2 TRADE-OFFS BETWEEN ELECTRIFICATION AND CLIMATE CHANGE MITIGATION
56
The NGS scenarios impose the highest total costs among the three sets
of mitigation scenarios, while the OPT scenarios offer the lowest. Hence,
the most cost-effective CO2 mitigation scenario is OPT, followed by REN.
The optimization method in OPT ensures the lowest total costs of the
power system expansion in meeting the mitigation target. The OPT
scenario covers all technologies employed in REF with the addition of
biomass, wind, and solar PV technologies. However, the optimal mix can
be sensitive to the input assumptions, such as the relative performance
of different technologies or future costs. I keep it aside as a subject for
Chapter 3.
Table 2.8 also shows the cost-effectiveness of the CO2 mitigation
scenarios. For the 19% CO2 reduction target, the abatement costs are 36.3,
41.2, and 46.6 US$/tCO2e in OPT1, REN1, and NGS1, respectively.
Meanwhile, for the 24% CO2 reduction target, the abatement costs are
37.5, 42.9, and 44.7 US$/tCO2e in OPT2, NGS2, and REN2, respectively.
2.5. Discussions
The analysis results obtained can be summarized as follows:
1). In the reference case where the power capacity expansion of the Java
Bali power system continues as per the present pattern (REF
scenario), the fossil-fueled power plants remain dominant until the end
of the study period. As a result, the CO2 emissions in 2030 are nearly
triple those witnessed in 2015.
2). In the context of the Java-Bali power system, the power sector target
associated with the Paris pledge – 19% or 24% reduction – is achievable
under the proposed capacity expansion scenarios. The NGS scenario
results in a substantial addition of natural gas capacity, i.e., 47 GW and
54 GW under the NGS1 and NGS2 scenarios, respectively. This
indicates that the single substitution of coal by natural gas can reduce
emissions by 19% and 24% from REF. REN scenarios lead to the
addition of the renewable capacity of 29 GW and 38 GW under the

CHAPTER 2 TRADE-OFFS BETWEEN ELECTRIFICATION AND CLIMATE CHANGE MITIGATION
57
REN1 and REN2 scenarios, respectively. The OPT scenarios that
focus on the cost-minimization result in expansions of both renewable
energy and natural gas capacities.
3). Total costs of the Java-Bali power system expansion under the REF
scenario are equal to 0.1% of the Indonesian GDP during the analysis
period. Any of the CO2 mitigation efforts aligned with the Java-Bali
capacity expansion increases the costs from 5% to 7% of the REF cost.
The cost-effectiveness of CO2 mitigation scenarios ranges between
36.3 and 46.6 US$/t CO2e.
Overall, these findings indicate that, in the contexts of the Java-Bali
power system, the Paris target can be met solely by fuel switching from
coal to natural gas. Though gas is a cleaner fuel, this strategy would not
use the Indonesian potential of its renewable energy. The national
electrification goal can also be achieved without breaking the Paris
Agreement by escalating the development of renewable energy. However,
the most cost-effective measure is by increasing renewable energy
development in combination with an expansion of natural gas power
generation capacity. As far as costs are concerned, results of this chapter
are aligned with other studies regarding the implication of the Paris
Agreement on the power sector in developing countries, for example, the
case of Botswana (Baek et al., 2019) and Kenya (Dalla Longa and van der
Zwaan, 2017).
Providing reliable and affordable electrical energy for the entire population
is a vital development goal of the Indonesian Government. Therefore, the
electricity tariff is determined by the government, and subsidies are
allocated for low-income households to ensure electrical energy is
affordable for all people. In 2017 alone, the electricity subsidy accounts
for 3% of the Government’s revenue (Gumelar, 2017; Direktorat Jenderal
Anggaran, 2017). Thus, it is paramount to maintain low electricity
production costs. As such, the Indonesian power sector development
follows the ‘least costs’ principle, with electricity supply options are

CHAPTER 2 TRADE-OFFS BETWEEN ELECTRIFICATION AND CLIMATE CHANGE MITIGATION
58
chosen based on the lowest cost (PLN, 2016b). Any additional cost, such
as the cost incurred due to the compliance with the Paris Agreement, will
increase the electricity production costs, which eventually can increase
the price paid by the consumer and the size of the government subsidy.
2.6. Conclusions
Assuring electricity access for the entire population is still a vital national
development goal for many developing countries, including Indonesia.
Likewise, climate change mitigation and adaptation are also central policies
due to the country’s vulnerability to climate change impacts. This chapter
analyzed plausible trade-offs between electrification and climate change
mitigation goals in the Java-Bali islands. The focus was on alternatives
that could allow Indonesia to satisfy the future electricity demand, while
also meeting its Paris climate targets. LEAP was chosen for performing
the analysis after a systematic review of different models (Appendix 2.A).
At first, the model was carefully validated using the actual data of the
Indonesian power system in the period 2005-2015. Then, four sets of
scenarios of the power system expansion for the period 2016-2030 were
developed and analyzed.
Results demonstrate that any effort to comply with the Paris climate
target will impact the electricity generation costs. Currently, there is no
regulation in place in Indonesia to limit CO2 emissions from the power
sector. Development of such a policy needs to consider the cost
implications for the power generation companies, as these costs,
eventually, are bound to pass onto the consumers or have to be covered
by the government’s subsidy.
This chapter has incorporated Indonesia’s NDC targets into power
capacity expansion. However, there is a number of important
methodological issues that should be incorporated in any future work. In
particular, these types of assessments would benefit greatly by taking into
consideration climate change impacts on the future power system, and
possible adaptation strategies in the power sector. It is also vital to

CHAPTER 2 TRADE-OFFS BETWEEN ELECTRIFICATION AND CLIMATE CHANGE MITIGATION
59
account for the evolution of energy technology - as most technologies in
time become more cost-effective (Rubin et al., 2015) - and analyzes their
impact on the robustness of the power system expansion scenarios within
the CO2 mitigation constraints.

60


CHAPTER 3 FROM FOSSIL FUELS TO RENEWABLES
63
Abstract
This chapter analyzes a diffusion of renewable energy in a power system
considering technological learning. The chapter explores long-term
scenarios for capacity expansion of the Java-Bali power system in
Indonesia, considering the country’s renewable energy targets, by applying
the LEAP model with an integration of technological learning. Results
reveal that, at the medium and high pace of technological learning, the
total costs of electricity production to achieve the long-term renewable
energy target are 4% to 10% lower than the scenario without considering
technological learning. With respect to technology, solar PV and wind
become competitive with other types of renewables and nuclear.
Moreover, the fulfillment of the renewable energy targets decreases CO2
emissions by 25% compared to the reference scenario. Implications of
these findings indicate that energy policies should focus on the early
deployment of renewables, upgrading the grid capacity to accommodate
variable renewable energy, and enabling faster local learning.
This chapter is published as a journal article:
Handayani, K., Krozer, Y. and Filatova, T. (2019). From fossil fuels to
renewables: An analysis of long-term scenarios considering
technological learning. Energy Policy, 127.

CHAPTER 3 FROM FOSSIL FUELS TO RENEWABLES
64
3.1. Introduction
Renewable energy is a critical component for combating climate change.
In fact, most of NDCs submitted by countries under the Paris Agreement
include renewable energy as their measure to address climate change
(IRENA, 2017). The implementation of NDCs will add at least 1.3 terawatts
to the global renewable installed capacity. This ambitious target would
need a considerable investment cost—1,700 billion USD by 2030, according
to the International Renewable Energy Agency (IRENA) estimate.
The high upfront expense for the installation of renewable technologies is
one of the factors that hinder the deployment of renewable energy.
However, the capital costs of energy technologies are known to decline
over time due to cost-reducing technological changes, usually referred to
as learning (IEA, 2000; Lafond et al., 2017; McDonald and Schrattenholzer,
2001; Rubin et al., 2015; Watanabe, 1995). The concept of the learning
effect has been widely used and analyzed empirically in many applications
(Grübler et al., 1999). The earliest example is Wright (1936), who reported
that unit labor costs in airframe manufacturing declined with accumulative
experience measured by cumulative output.
Cost savings brought up by technological learning are especially attractive
for developing countries, which are still facing rapid growths of electricity
demand while also pledging their NDCs. This case applies to Indonesia, the
fourth most populous country in the world. Electricity demand in the
country is projected to grow at an average of 8.3% per year in the next
decade (PLN, 2017b). Meanwhile, it pledges to reduce 29% of its
greenhouse gas emissions against its business-as-usual scenario by 2030
(Government of The Republic of Indonesia, 2016). While, in 2015, renewable
CHAPTER 3 FROM FOSSIL FUELS TO RENEWABLES
65
energy only accounted for 4% of the national energy mix8 (DEN, 2016c),
the most recent national energy policy (NEP) requires it to increase by
23% in 2025 and 31% in 2050 (Government of The Republic of Indonesia,
2014). In the context of the power sector, renewable energy currently
accounts for 10% of the national electricity generation mix9 (PLN, 2016a).
RUPTL 2016-2025 estimates an increase in unit costs of electricity
production by 22% to realize the NEP target in the power sector by 2025.
Such a raise, if it occurs, will cause a burden on the power sector and, in
turn, the national economy. Yet, these projections neglect the learning
process of electric power technologies. As discussed above, technological
learning may reduce the unit costs of electricity production, making
investments in renewable energy technologies more economically
attractive.
Given the essential role of technological learning, it is necessary to
consider it when projecting a long-term electricity supply. Accordingly,
this chapter integrates technological learning into the LEAP model to
explore a number of electricity expansion scenarios. LEAP has been
actively used for assessing renewable energy expansion in many countries,
such as Pakistan (Ishaque, 2017), Bulgaria (Nikolaev and Konidari, 2017),
Ghana (Awopone et al., 2017), Thailand (Wongsapai et al., 2016), Iran
(Eshraghi and Maleki, 2016), Indonesia (Kumar, 2016), India (Kumar and
Madlener, 2016), Malaysia (Samsudin, 2016), Brazil (De Andrade Guerra et
al., 2015), Korea (Park et al., 2013), and Lebanon (Dagher and Ruble, 2011).
Despite its extensive use, little attention has been paid to incorporating
technological learning in the LEAP model, which likely results in
underestimating the future deployment of renewable energy.
Focusing on the Java-Bali power system, this chapter develops scenarios
for the system’s capacity expansion from 2016 through to 2050.
8Energy mix is a set of various primary energy sources used to meet energy needs in
a region (ton oil equivalent and % contributions) 9Electricity generation mix is a set of primary energy sources that constitute the total
electrical energy production in a region (Megawatt hour and % contributions).

CHAPTER 3 FROM FOSSIL FUELS TO RENEWABLES
66
Moreover, this chapter applies a learning model for each power generation
technology into the LEAP cost function. The simulation results are
analyzed in terms of energy, costs, and CO2 emissions.
The innovative contribution of this chapter is twofold. First,
methodologically, it moves beyond the current practice of LEAP usage by
incorporating a learning model with respect to energy technologies into
the LEAP cost function. Although there are some energy system models
that have included technology cost learning, such as MESSAGE-MACRO,
MARKAL-TIMES, NEMS, POLES, ERIS, GALLM, and EXO-XEL (Heuberger
et al., 2017), to the best of our knowledge, this dissertation is the first to
include technological learning endogenously in LEAP. Secondly, this
chapter adds an understanding regarding the role of technological learning
in driving the transition from fossil-fuel-based power generation to a
lower-carbon power system in the context of developing countries.
The remainder of this chapter is organized as follows: Section 3.2 presents
the literature review; Section 3.3 explains the methodology, scenarios, and
the model input parameters for the future Java-Bali power system;
Section 3.4 discusses the results of model simulations; Section 3.5
presents the main findings of this chapter; Section 3.6 concludes the
discussions.
3.2. Technological learning
The development of technology is not an autonomous, independent
process. Instead, it evolves from many interactions within social systems
as well as from experience in using the technology itself (Barreto, 2001).
The process of technological change requires considerable time from
innovation to widespread diffusions, such as what has occurred in the past
concerning the global technology transitions from traditional biomass to
coal-based technology and from coal-based technology to electricity and
petroleum-based technologies (Wilson and Grubler, 2011).
CHAPTER 3 FROM FOSSIL FUELS TO RENEWABLES
67
The development and introduction of new technologies involve a learning
process that results in the improvement of the production process and
product, which, in turn, often makes the costs lower (GEA, 2012). The
learning process starts from the first practical use of a new technology
until its maturation stage (Sagar and van der Zwaan, 2006). Learning is a
crucial element of the early adoption of technologies, and it indicates the
experiences gained through the practical use of technology and
contributes to cost reduction over time (Sagar and van der Zwaan, 2006).
Since learning is a self-enforcing process, more accumulated experiences
in technology lead to lower cost, and more increase in technology
competitiveness leads to even more accumulated experience (Gillingham
et al., 2008). As such, it is not always the case that new technology is
used because it becomes cheap, but also technology becomes cheap
because of its increased use and learning process (Berglund and
Söderholm, 2006). In addition to cost reduction, learning can also lead to
greater proficiency in technology operation as well as institutional
transformation necessary to allow the widespread use of new technologies
(Sagar and van der Zwaan, 2006).
The concept of the learning effect has been widely used since its first
appearance in the economic literature, and it was empirically verified
(Berglund and Söderholm, 2006). The learning process triggering cost
reduction is expressed as a function of the accumulation of knowledge and
experience related to R&D expenditures, the production, and the use of
technology (Kahouli-Brahmi, 2008). Quantification of these learning
patterns is presented in the literature using the so-called one-factor and
multi-factor learning curves (Kahouli-Brahmi, 2008; Rubin et al., 2015). The
former is the most widely used method for endogenously forecasting
changes in technology costs. Its experience performance is indicated by
the cumulative installed capacity or cumulative production.
The term “learning rate” is used to express the experience gained from
using technology and the corresponding technological progress in its
production. It denotes the percentage by which a unit cost declines with
CHAPTER 3 FROM FOSSIL FUELS TO RENEWABLES
68
every doubling of the cumulative production. In other words, it is a fraction
by which the unit price of energy service (such as electricity) declines
with every doubling of its installed capacity (Sagar and van der Zwaan,
2006). The corresponding change in price compared to its previous price
with each doubling of capacity is referred to as the “progress ratio”
(Berglund and Söderholm, 2006). A progress ratio of 75% indicates that the
costs of technology have declined to 75% of its previous level after a
doubling of its cumulative capacity. In this case, the corresponding learning
rate is 25%.
The multi-factor approach includes factors beyond the cumulative
installed capacity or production that contribute to technology cost
reduction, such as R&D spending, knowledge spill-overs, and economies
of scale (Rubin et al., 2015). However, due to data requirements and
theoretical limitations, this approach is less prevalent in the literature
compared to the one-factor model (Farmer and Lafond, 2016; Rubin et al.,
2015).
3.3. Methodology and data
3.3.1. The LEAP model
A summary of LEAP methodology has been discussed in Section 1.6. The
following sections elaborate on the LEAP framework for calculating
electricity demand, capacity expansion, total costs, and GHG emissions
3.3.1.1. Electricity demand projection
In this chapter, the demand for electricity is calculated based on the
demand growth projection stipulated in RUPTL 2016-2025 and IEO 2014.
Hence, the electricity demand in a specific year is the sum of electricity
demanded in the previous year and its anticipated growth:
𝐸𝐷𝑡 = (𝐸𝐷𝑡−1 ∗ 𝐸𝐷𝐺𝑡)) + 𝐸𝐷𝑡−1, Eq. 3.1
where 𝐸𝐷𝑡 is the electricity demand in year 𝑡, and 𝐸𝐷𝐺𝑡 is the percentage
of growth in the electricity demand in year 𝑡.
CHAPTER 3 FROM FOSSIL FUELS TO RENEWABLES
69
Total electricity demand in the power system for a specific year (𝑇𝐸𝐷𝑡) is
calculated as the sum of electricity demanded and electricity losses (𝐸𝐿𝑡)
during the electricity transfer through the T&D networks in that year:
𝑇𝐸𝐷𝑡 = 𝐸𝐷𝑡 + 𝐸𝐿𝑡 and Eq. 3.2
𝐸𝐿𝑡 = 𝐸𝐷𝑡 ∗ 𝑇𝐿𝑡 , Eq. 3.3
where 𝑇𝐿𝑡 is the percentage of T&D losses in year 𝑡.
3.3.1.2. Capacity expansion in LEAP
The capacity of a set of technologies can be added both exogenously and
endogenously in LEAP. I specify exogenously the previously existing
capacities as well as committed additional capacities, such as the power
plants that are currently under construction. Furthermore, the capacity of
hydro-pumped storage is also added exogenously following the RUPTL
assumptions (PLN, 2016b)
For the endogenous capacity addition, LEAP calculates the amount of
capacity to be added using the Eqs. 3.4, 3.5, and 3.6 below (Awopone et
al., 2017; Heaps, 2017). In the reference scenario, which uses the
accounting setting, I specify the types of the power plant to add, but LEAP
decides when they will be added based on the system’s requirement. In
the renewable energy scenarios, which make use of LEAP’s optimization
capability, LEAP decides what types of technology should be added and
when it will be added based on the least-cost principle and the set
constraints. In these scenarios, I set the minimum capacity of natural gas
power plants to be added each year as intermediate and peak plants, as
well as for balancing the variability of intermittent renewable energies.
𝐶𝐸𝑛 = 𝐷𝑝(𝑃𝑅𝑀 − 𝑅𝑀), Eq. 3.4
𝐷𝑝 =𝐸𝐷
𝐿𝐹 ∗ 8760 , and Eq. 3.5
𝑅𝑀 = 𝐶𝑝−𝐷𝑝
𝐷𝑝 , Eq. 3.6
where 𝐶𝐸𝑛 is the endogenous capacity addition, 𝐷𝑝 is the peak electricity
demand, 𝑃𝑅𝑀 is planning reserve margin, 𝑅𝑀 is the reserve margin before

CHAPTER 3 FROM FOSSIL FUELS TO RENEWABLES
70
addition, 𝐸𝐷 is electricity demand, 𝐿𝐹 is the load factor (calculated as the
ratio of the average load and the peak load), and 𝐶𝑝 is the capacity before
addition.
3.3.1.3. Total costs calculation
The total cost of the power system is the total net present value of the
system costs over the entire period of calculation:
𝑇𝐶 = ∑ ∑1
(1+𝑑)𝑡 (𝐾𝑐 ∗ 𝐶𝑎𝑡 + 𝑓𝑜𝑐𝑡 ∗ 𝐶𝑎𝑡 + 𝑉𝑜𝑐𝑡 ∗ 𝑃𝑡 + 𝐹𝑐𝑡)𝑝𝑁𝑡𝑡 , Eq. 3.7
where 𝑇𝐶 is the total cost, 𝑁𝑡 denotes the entire years from 2016 through
to 2050, 𝑝 is the process (technology), 𝑑 is the discount rate, 𝐾𝑐 is the
initial capital cost, 𝐶𝑎𝑡 is the capacity in year 𝑡, 𝑓𝑜𝑐𝑡 is the fixed operation
and maintenance costs in year 𝑡, 𝑉𝑜𝑐𝑡 is the variable operation and
maintenance costs in year 𝑡, 𝑃𝑡 is the output power in year 𝑡, and 𝐹𝑐𝑡 is
the fuel cost in year 𝑡.
3.3.1.4. CO2 emissions calculation
CO2 emissions from electricity production are calculated as follows (Feng
and Zhang, 2012):
𝐶𝐸 = ∑ ∑ 𝐸𝐹𝑓,𝑝 ∗ 1
𝐸𝑝 ∗ 𝑃𝑝𝑓𝑝 , Eq. 3.8
where 𝐶𝐸 is the CO2 emissions, 𝐸𝐹𝑓,𝑝 is the CO2 emission factor from one
unit of primary fuel type 𝑓 consumed for producing electricity through
technology 𝑝, 𝐸𝑝 is the efficiency of technology 𝑝, and 𝑃𝑝 is the output
power from technology 𝑝.
3.3.2. Integration of the learning model
LEAP does not provide a built-in expression for capturing technological
learning. Thus, I integrate the one-factor learning model into LEAP by
adding expression in LEAP, representing the learning curve of electric
power technologies. I build the syntaxes in LEAP that enable the
calculation of changes in capital costs for each technology type along with
changes in cumulative capacity and in learning rate value of the technology
for each learning phase.
CHAPTER 3 FROM FOSSIL FUELS TO RENEWABLES
71
The capital cost of electric power technology in a specific year is
calculated using the following formulas (Kim et al., 2012):
𝐾𝑡 = 𝐾𝑐 (𝐶𝑡
𝐶0)
𝛽 and Eq. 3.9
LR = 1 − 2𝛽 , Eq. 3.10
where 𝐾𝑡 denotes the capital cost in year t, 𝐶𝑡 is the cumulative capacity
until year t, 𝐶0 is the capacity in the base year, and 𝛽 is the positive
learning parameter (learning index), which characterizes the inclination of
the learning curve, and LR is the learning rate.
The shapes of learning curves for different energy technologies depend on
two factors: initial learning rates and the speed of their change. To initialize
the learning curve model, I retrieve the learning rate values for electric
power technologies from Rubin et al. (2015) and Heuberger et al. (2017),
(see Appendix 3.A). Further, with respect to the speed of learning, I
assume four learning phases throughout the time horizon of this study
where the learning rate of each electric power technology decreases with
every phase, as shown in Table 3.1. This assumption refers to the WEO
model 2016, which assumes reductions in the capital costs of renewable
energy over time. WEO distinguishes the capital costs in four-time steps:
2015, 2020, 2030, and 2040 (OECD/IEA, 2017). The learning curve of solar
PV, as the results of its substantial deployment along the time horizon of
this study, is depicted in Appendix 3.B (Fig. 3B.1).

CHAPTER 3 FROM FOSSIL FUELS TO RENEWABLES
72
Table 3.1: Assumptions of learning rates of electric power technologies 2016-2050.
Technology REN-Low LR scenarioa: Low value of the initial learning rate
REN-Medium LR scenariob: Medium value of the initial learning rate
REN-High LR scenarioc: High value of the initial learning rate
2016-2020
2021-2030
2031-2040
2040-2050
2016-2020
2021-2030
2031-2040
2040-2050
2016-2020
2021-2030
2031-2040
2040-2050
Solar PV 10.0% 7.1% 4.0% 1.6% 23.0% 16.3% 9.1% 3.7% 47.0% 33.4% 18.7% 7.7%
Wind Turbine -11.0% -7.8% -4.4% -1.8% 12.0% 8.5% 4.8% 2.0% 32.0% 22.7% 12.7% 5.2%
Biomass 0.0% 0.0% 0.0% 0.0% 11.0% 7.8% 4.4% 1.8% 24.0% 17.0% 9.5% 3.9%
USC Coal 5.6% 4.0% 2.2% 0.9% 8.3% 5.9% 3.3% 1.4% 12.0% 8.5% 4.8% 2.0%
NGOC 10.0% 7.1% 4.0% 1.6% 15.0% 10.7% 6.0% 2.4% 22.0% 15.6% 8.7% 3.6%
NGCC -11.0% -7.8% -4.4% -1.8% 14.0% 9.9% 5.6% 2.3% 34.0% 24.1% 13.5% 5.5%
Hydro 1.4% 1.0% 0.6% 0.2% 1.4% 1.0% 0.6% 0.2% 1.4% 1.0% 0.6% 0.2%
Nuclear -6.0% -4.3% -2.4% -1.0% -1.0% -0.7% -0.4% -0.2% 6.0% 4.3% 2.4% 1.0%
Note: The learning rates for the first phase (2016-2020) is based on Rubin et al. (2015). For the other phases, I estimate learning rates based on data from OECD/IEA (2017) aThe initial learning rates (LR), i.e., the LR values in the first phase refer to the lowest values in Rubin et al. (2015) and assumption on the low LR value for nuclear in Heuberger et al. (Heuberger et al., 2017) bThe initial learning rates (LR), i.e., the LR values in the first phase refer to the mean values in Rubin et al. (2015) and assumption on the medium LR value for nuclear in Heuberger et al. (Heuberger et al., 2017) cThe initial learning rates (LR), i.e., the LR values in the first phase refer to the highest values in Rubin et al. (2015)

CHAPTER 3 FROM FOSSIL FUELS TO RENEWABLES
73
3.3.3. Future Scenarios
I design five scenarios for the future development of the Java–Bali power
system. The first one is the reference scenario, which assumes the
continuation of the present technology mix in the Java-Bali power system.
The other four are scenarios for meeting the NEP’s NRE targets.
The NEP 2014 proposes ambitious NRE targets for increasing the role of
renewable energy. The NRE targets relate to two stages. In Stage 1, by
2025, the share of NRE should be at least 23% of the national energy mix,
which refers to the total domestic energy use coming from various
sources. In Stage 2, by 2050, the share of NRE should be at least 31% of
the national energy mix. NEP also mentions that the economic aspects of
renewables are taken into consideration in achieving its targets
(Government of The Republic of Indonesia, 2014). Furthermore, NEP also
considers nuclear as alternative energy to meet its NRE targets, although
it is the last option after maximizing the use of renewable energy sources.
This chapter assumes that 23% and 31% of NRE targets are applied to the
power sector’s energy mix. Accordingly, this chapter analyzes four
scenarios for maximizing the use of renewable energy —as mandated by
NEP— in the context of the Java-Bali power system and assess their
impacts on costs and CO2 emissions. The LEAP optimization method is
employed to analyze the least-cost options of meeting the NRE targets
with and without technological learning. The assumptions for each scenario
are as follows:
a. Reference scenario (REF): The reference scenario assumes a
continuity of fossil-fuel-based power generation in the Java-Bali
power system. Hence, the technology mix in the future is expected to
be equivalent to the present situation. The main characteristics of this
scenario are as follows:
- Deployment of technology is limited to conventional technologies
that have been deployed up to 2015, mainly CFPPs

CHAPTER 3 FROM FOSSIL FUELS TO RENEWABLES
74
- Renewable capacity expansion only limited to geothermal and
hydro, as they are the only renewable technologies that existed in
the base year
- No limitation on the domestic fossil fuels uses
- Geothermal and hydro expansions are dependent on their
availability (potentials) in the Java and Bali islands
- No specific target is set for renewable energy deployment
- No technological learning is considered
b. Renewable energy scenario (REN): In the renewable energy scenario,
the NRE targets are taken into consideration when projecting the
power system expansion. Besides hydro and geothermal that already
operate in Indonesia, three types of renewable energy are added over
the time horizon of this study: solar, wind, and biomass. Moreover, in
line with NEP, nuclear is considered a new technology to be added
after maximizing renewable energy uses. This scenario includes the
following characteristics:
- The capacity expansion aims at achieving the NRE targets. Thus,
the NRE targets are set as constraints in the model
- The types of technology that are considered for future capacity
expansion include USC coal, NGCC, NGOC, HEPP, geothermal,
wind power, biomass, solar PV, and nuclear
- The renewables’ capacity expansions are dependent on their
availability (potentials) in the Java and Bali islands
- LEAP will choose the types of technology to be employed based
on costs and the set objectives
- No technological learning is considered
In addition, I suggest three variations of the REN scenario, which vary in
the initialization of technological learning for electric power technologies.
I consider the learning rate of not only renewable energy technologies but
also of non-renewables. Following the setup of ETL in Section 3.3.2, I
assume the technological learning for all energy technologies occurs in

CHAPTER 3 FROM FOSSIL FUELS TO RENEWABLES
75
four phases. LEAP is run with ETL, assuming three different initial values
for the learning rate: low (REN-low LR in Table 3.1), medium (REN-medium
LR in Table 3.1), and high (REN-high LR in Table 3.1).
(i). Renewable energy scenario with low learning rate (REN-low LR): the
initial learning rate values refer to the minimum learning rate values (REN-
low LR in Table 3.1).
(ii). Renewable energy scenario with medium learning rate (REN-medium
LR): the initial learning rate values refer to the mean learning rate values
(REN-medium LR in Table 3.1).
(iii). Renewable energy scenario with high learning rate (REN-high LR): the
initial learning rate values refer to the maximum learning rate values (REN-
high LR in Table 3.1).
3.3.4. Data
Most of the model input data were collected from PLN and governmental
reports, rather than relying on default data provided by LEAP. Therefore,
this dissertation represents the actual characteristics of the Indonesian
power system, making policy projections more reliable. Table 3.2 presents
the model input parameters and their sources. The Java-Bali electricity
demand projection for 2016 through to 2025 is based on RUPTL with an
annual average of 7.3% (PLN, 2017b). Meanwhile, the demand growth
projections for 2026 onwards refer to IEO 2014 with an annual average of
5.6% from 2026 through to 2040 and 4.3% from 2041 through to 2050 (DEN,
2014). The transmission and distribution losses data come from RUKN
2015-2034, which estimates a reduction from 8.5% in 2015 to 7.9% in 2030
onwards. The planning reserve margin is set at 35%, in accordance with
the RUKN criteria (KESDM, 2015).
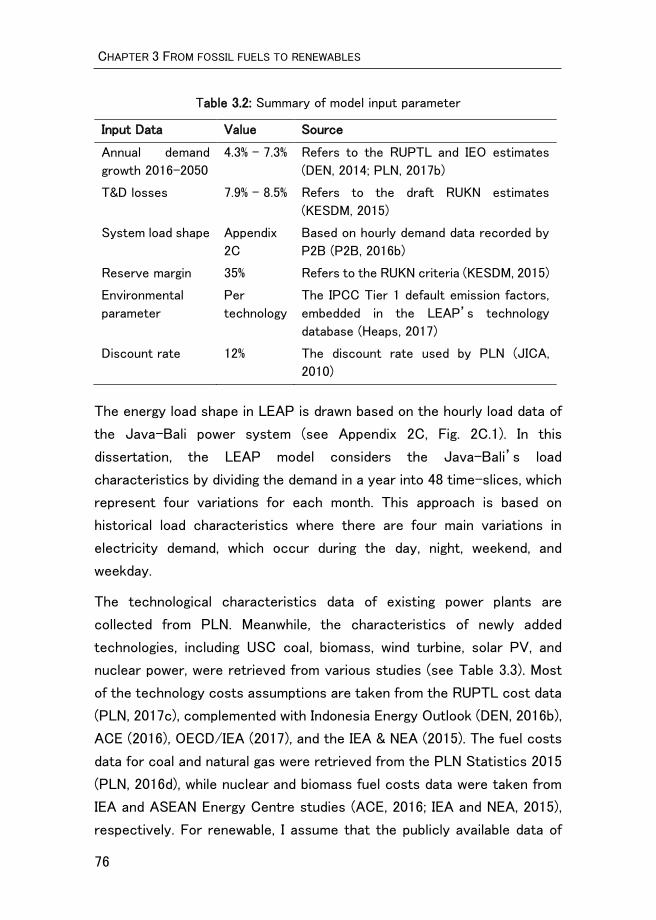
CHAPTER 3 FROM FOSSIL FUELS TO RENEWABLES
76
Table 3.2: Summary of model input parameter
Input Data Value Source
Annual demand
growth 2016-2050
4.3% - 7.3% Refers to the RUPTL and IEO estimates
(DEN, 2014; PLN, 2017b)
T&D losses 7.9% – 8.5% Refers to the draft RUKN estimates
(KESDM, 2015)
System load shape Appendix
2C
Based on hourly demand data recorded by
P2B (P2B, 2016b)
Reserve margin 35% Refers to the RUKN criteria (KESDM, 2015)
Environmental
parameter
Per
technology
The IPCC Tier 1 default emission factors,
embedded in the LEAP’s technology
database (Heaps, 2017)
Discount rate 12% The discount rate used by PLN (JICA,
2010)
The energy load shape in LEAP is drawn based on the hourly load data of
the Java-Bali power system (see Appendix 2C, Fig. 2C.1). In this
dissertation, the LEAP model considers the Java-Bali’s load
characteristics by dividing the demand in a year into 48 time-slices, which
represent four variations for each month. This approach is based on
historical load characteristics where there are four main variations in
electricity demand, which occur during the day, night, weekend, and
weekday.
The technological characteristics data of existing power plants are
collected from PLN. Meanwhile, the characteristics of newly added
technologies, including USC coal, biomass, wind turbine, solar PV, and
nuclear power, were retrieved from various studies (see Table 3.3). Most
of the technology costs assumptions are taken from the RUPTL cost data
(PLN, 2017c), complemented with Indonesia Energy Outlook (DEN, 2016b),
ACE (2016), OECD/IEA (2017), and the IEA & NEA (2015). The fuel costs
data for coal and natural gas were retrieved from the PLN Statistics 2015
(PLN, 2016d), while nuclear and biomass fuel costs data were taken from
IEA and ASEAN Energy Centre studies (ACE, 2016; IEA and NEA, 2015),
respectively. For renewable, I assume that the publicly available data of

CHAPTER 3 FROM FOSSIL FUELS TO RENEWABLES
77
the Indonesian renewable energy potential (Chapter 1, Table 1.2) can be
exploited over the time horizon of this study without any constraints.
Furthermore, since NEP lists nuclear as the least preferred option for
meeting the NRE targets, I assume that nuclear will be deployed for the
first time in 2035 when all renewable energy potentials have mainly been
exploited. Coal, nuclear, and biomass power plants are expected to cover
the baseload, while natural gas and hydropower plants are expected to
cover the peak load. With regard to the supply characteristics of
intermittent renewable power plants (wind and solar), I specify
exogenously capacity addition for hydro-pumped storages as well as set
a minimum amount of natural gas power plant to be added each year to
balance the intermittent renewable energies.
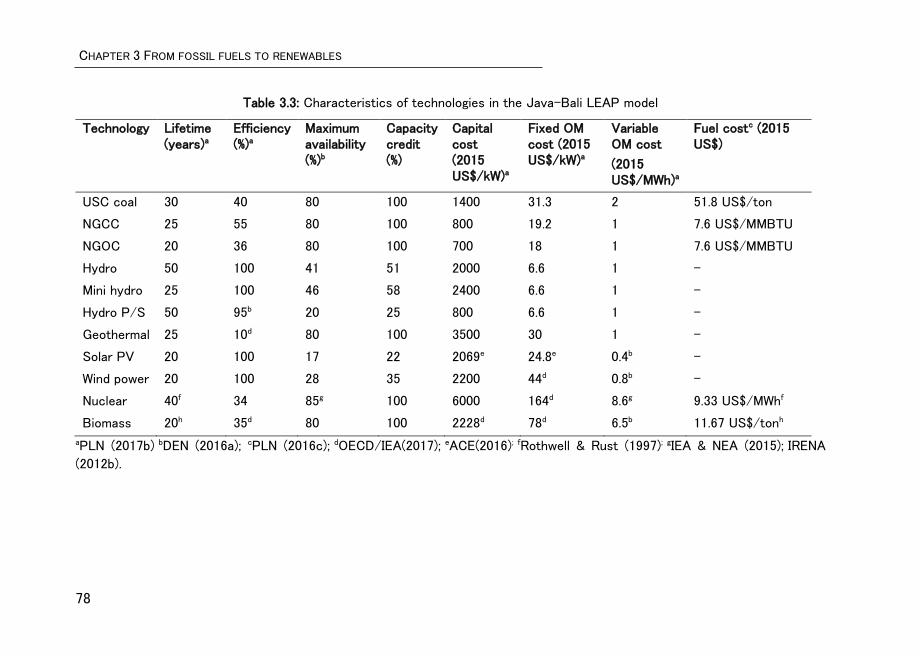
CHAPTER 3 FROM FOSSIL FUELS TO RENEWABLES
78
Table 3.3: Characteristics of technologies in the Java-Bali LEAP model
Technology Lifetime (years)a
Efficiency (%)a
Maximum availability (%)b
Capacity credit (%)
Capital cost (2015 US$/kW)a
Fixed OM cost (2015 US$/kW)a
Variable OM cost
(2015 US$/MWh)a
Fuel costc (2015 US$)
USC coal 30 40 80 100 1400 31.3 2 51.8 US$/ton
NGCC 25 55 80 100 800 19.2 1 7.6 US$/MMBTU
NGOC 20 36 80 100 700 18 1 7.6 US$/MMBTU
Hydro 50 100 41 51 2000 6.6 1 -
Mini hydro 25 100 46 58 2400 6.6 1 -
Hydro P/S 50 95b 20 25 800 6.6 1 -
Geothermal 25 10d 80 100 3500 30 1 -
Solar PV 20 100 17 22 2069e 24.8e 0.4b -
Wind power 20 100 28 35 2200 44d 0.8b -
Nuclear 40f 34 85g 100 6000 164d 8.6g 9.33 US$/MWhf
Biomass 20h 35d 80 100 2228d 78d 6.5b 11.67 US$/tonh aPLN (2017b) bDEN (2016a); cPLN (2016c); dOECD/IEA(2017); eACE(2016); fRothwell & Rust (1997); gIEA & NEA (2015); IRENA
(2012b).

CHAPTER 3 FROM FOSSIL FUELS TO RENEWABLES
79
3.4. Results
The LEAP model calculation of the demand growth (Eq. 3.1) results in 305
TWh of electricity demand in 2025, doubling values recorded in 2015.
Furthermore, in 2050, it increases up to 1,068 TWh—over threefold of
those in 2025. The total electricity supply calculated by the LEAP model
is higher than the projected electricity demand, as the electricity
generation module also needs to compensate electricity losses in the T&D
networks (Eq. 3.2). The following sections discuss the results of five
scenarios for the Java-Bali power system’s expansion to satisfy the
projected future demand.
3.4.1. Reference scenario (REF)
In the REF scenario, with the business as usual technology composition,
the coal capacity is added expansively over the time horizon of the
simulation, followed by natural gas (see Fig. 3.1). Consequently, the
electricity generation mix in the Java-Bali power system is dominated by
coal. In total, fossil fuels (coal and natural gas) account for 92% and 94%
of electricity supply in 2025 and 2050, respectively. Interestingly,
renewable energy share reduces from 8% in 2025 to 6% in 2050 despite the
full utilization of geothermal and hydro potentials of the Java-Bali islands.
Therefore, the electricity generation mix in REF (Fig. 3.2) is far from what
is expected by NEP. These results indicate that it is not possible to
increase renewable energy share if the sector is to rely on geothermal and
hydro alone without exploiting other types of renewable energy.

CHAPTER 3 FROM FOSSIL FUELS TO RENEWABLES
80
Fig. 3.1: Installed capacity, REF scenario
Fig. 3.2: Electricity generation mix, REF scenario.
3.4.2. Renewable energy scenario (REN)
The total power generation capacity of the Java-Bali power system
reaches 69.6 Gigawatt (GW) at the end of NEP’s Stage 1 (2025) under the
REN scenario without technological learning (Fig. 3.3). In this scenario, the
renewable capacity expands up to 15.2 GW—a nearly twofold increase
compared to REF. Accordingly, there is a 22% decrease in coal capacity.
During the NEP Stage 2 period in the REN scenario, the system’s capacity
expands further, reaching 244.4 GW in 2050. Interestingly, nuclear capacity
is added significantly during this time. It is first installed in 2035 and adds
0
50
100
150
200
250
2015 2020 2025 2030 2035 2040 2045 2050
Cap
acit
y (G
igaw
att)
Coal Natural Gas Oil Hydro Geothermal Solar
0
200
400
600
800
1,000
1,200
2015 2020 2025 2030 2035 2040 2045 2050
Elec
tric
ity
gen
era
tio
n (
TWh
)
Coal Natural Gas Oil Hydro Geothermal
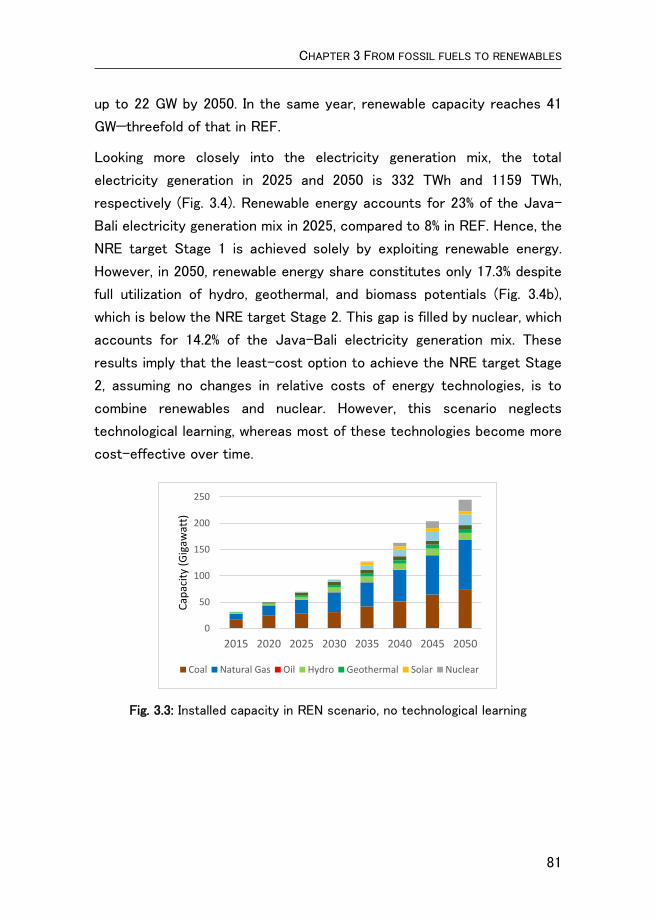
CHAPTER 3 FROM FOSSIL FUELS TO RENEWABLES
81
up to 22 GW by 2050. In the same year, renewable capacity reaches 41
GW—threefold of that in REF.
Looking more closely into the electricity generation mix, the total
electricity generation in 2025 and 2050 is 332 TWh and 1159 TWh,
respectively (Fig. 3.4). Renewable energy accounts for 23% of the Java-
Bali electricity generation mix in 2025, compared to 8% in REF. Hence, the
NRE target Stage 1 is achieved solely by exploiting renewable energy.
However, in 2050, renewable energy share constitutes only 17.3% despite
full utilization of hydro, geothermal, and biomass potentials (Fig. 3.4b),
which is below the NRE target Stage 2. This gap is filled by nuclear, which
accounts for 14.2% of the Java-Bali electricity generation mix. These
results imply that the least-cost option to achieve the NRE target Stage
2, assuming no changes in relative costs of energy technologies, is to
combine renewables and nuclear. However, this scenario neglects
technological learning, whereas most of these technologies become more
cost-effective over time.
Fig. 3.3: Installed capacity in REN scenario, no technological learning
0
50
100
150
200
250
2015 2020 2025 2030 2035 2040 2045 2050
Cap
acit
y (G
igaw
att)
Coal Natural Gas Oil Hydro Geothermal Solar Nuclear

CHAPTER 3 FROM FOSSIL FUELS TO RENEWABLES
82
(a) (b)
Fig. 3.4: Electricity generation mix in REN scenario, no technological learning
The following sections discuss the results of the alternative REN
scenarios, which take into account the learning curves of both renewable
and non-renewable technologies. In these scenarios, the capital costs of
electric power technologies change along with their increased capacity
depending on their learning rates.
3.4.2.1. Renewable energy scenario with low learning rate values (REN-low
LR)
REN-low LR scenario assumes the minimum value of the learning rate of
each technology in Phase I, which evolves throughout the other phases.
The results indicate that there is a significant change in the 2025’s
electricity generation mix when compared to REN (Figs. 3.5a vs. 3.4a).
Solar now accounts for 6% of the electricity generation mix, partially
replacing biomass and geothermal, in contrast to 1% in REN. It implies that
in the early phase of technological learning, even in its minimum learning
rate value, solar becomes competitive with other renewables.
Furthermore, the natural gas share slightly increases as compared to REN,
compensating a slight reduction in coal.
0% 1%
11%
7%
4%
21%56%
2025: 332 TWh
14% 1%
4%
5%
5%
3%24%
44%
2050: 1159 TWh

CHAPTER 3 FROM FOSSIL FUELS TO RENEWABLES
83
These changes are seen substantially by 2050. The share of nuclear and
wind power present in REN is replaced by solar (compare Figs. 3.5b and
3.4b). The solar share is now 18%, which also slightly replaces the coal
share. Hence, this result suggests that when the minimum learning rate
values for all technologies are considered, solar becomes more
economically attractive compared to other technologies. Remarkably, even
under the most modest assumptions regarding technological progress,
solar proliferates from less than 1% to become the third most used energy
source after coal and natural gas. A reasonable explanation could be that,
in this scenario, the initial learning rate of solar PV (10%) is the highest,
compared to those of nuclear (-6%), wind power (-11%), and coal (5.6%).
This also explains why nuclear and wind power hardly appear in the 2050’s
electricity generation mix.
(a) (b)
Fig. 3.5: Electricity generation mix in REN-low LR scenario, technological
learning occurs at the minimum pace
3.4.2.2. Renewable energy scenario with medium learning rate values
(REN-medium LR)
When the medium learning rate value for each technology is applied, a
significant change is also seen in the 2025’s electricity generation mix
(Fig. 3.6a) as compared to REN. Renewable energy is now shared between
0%
6%
1%
7% 5%
4%
23%
54%
2025: 332 TWh
1%
18%0%
5%
4%
3%
26%
43%
2050: 1159 TWh
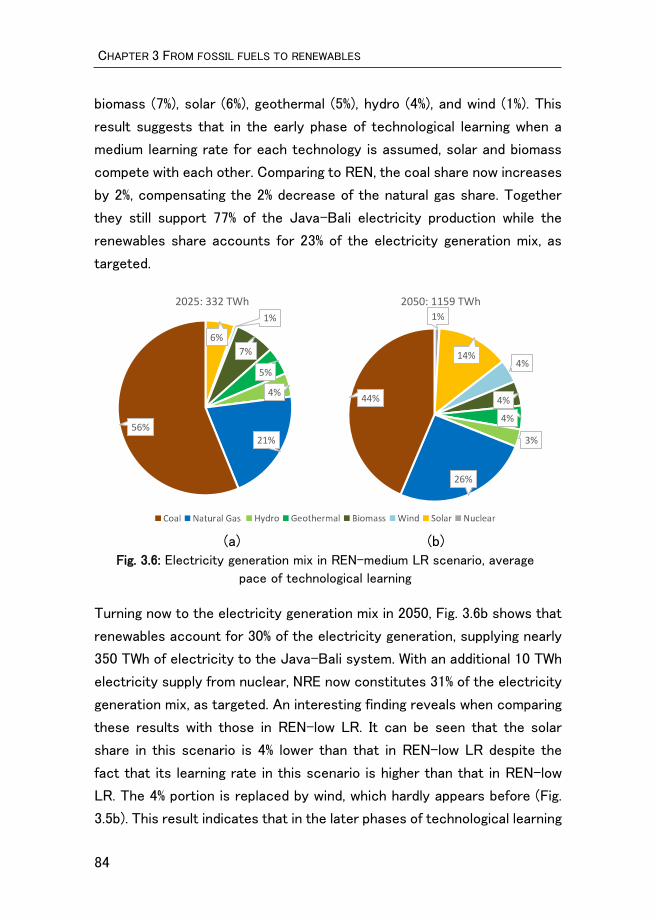
CHAPTER 3 FROM FOSSIL FUELS TO RENEWABLES
84
biomass (7%), solar (6%), geothermal (5%), hydro (4%), and wind (1%). This
result suggests that in the early phase of technological learning when a
medium learning rate for each technology is assumed, solar and biomass
compete with each other. Comparing to REN, the coal share now increases
by 2%, compensating the 2% decrease of the natural gas share. Together
they still support 77% of the Java-Bali electricity production while the
renewables share accounts for 23% of the electricity generation mix, as
targeted.
(a) (b) Fig. 3.6: Electricity generation mix in REN-medium LR scenario, average
pace of technological learning
Turning now to the electricity generation mix in 2050, Fig. 3.6b shows that
renewables account for 30% of the electricity generation, supplying nearly
350 TWh of electricity to the Java-Bali system. With an additional 10 TWh
electricity supply from nuclear, NRE now constitutes 31% of the electricity
generation mix, as targeted. An interesting finding reveals when comparing
these results with those in REN-low LR. It can be seen that the solar
share in this scenario is 4% lower than that in REN-low LR despite the
fact that its learning rate in this scenario is higher than that in REN-low
LR. The 4% portion is replaced by wind, which hardly appears before (Fig.
3.5b). This result indicates that in the later phases of technological learning
6%
1%
7%
5%
4%
21%56%
2025: 332 TWh1%
14%4%
4%
4%
3%
26%
44%
2050: 1159 TWh

CHAPTER 3 FROM FOSSIL FUELS TO RENEWABLES
85
when the learning rate values of each technology diminish, the wind power
is more competitive than it is in the earlier phases.
3.4.2.3. Renewable energy scenario with high learning rate values (REN-
high LR)
In the scenario with the high learning rate value for each technology, it
can be seen that the 2025 electricity generation mix is comparable with
those in the REN-low LR and REN-medium LR scenarios (Figs. 3.5a vs.
3.6a and 3.7a). This finding suggests that, regardless of the initial learning
rate values, solar is competitive against other renewables when it is
deployed in the early phases.
(a) (b)
Fig. 3.7: Electricity generation mix in REN-high LR scenario, the high pace of
technological learning
Results for 2050 under the intensive technological learning show that
hydro, geothermal, and biomass expand up to 28.1 GW, reaching their
maximum plausible capacities. Meanwhile, wind capacity adds up to 20.5
GW, almost reaching its maximum potential of 24 GW. In total, these
renewables account for a 16% share of the electricity generation mix (Fig.
3.7b). After these renewables reach their maximum plausible capacities,
solar and nuclear are the only options for meeting the NRE targets.
6%
1%
7%
5%4%
19%58%
2025: 332 TWh
1%
14%4%
5%
4%
3%
26%
43%
2050: 1159 TWh
CHAPTER 3 FROM FOSSIL FUELS TO RENEWABLES
86
Together with 14% of solar and 1% of nuclear shares, NRE constitutes 31%
of the Java-Bali electricity generation mix, satisfying the NRE target Stage
2. This is comparable with REN-medium LR, indicating that, at the medium
and high initial learning rate values, all types of renewable compete with
each other to achieve the NRE target Stage 2.
Comparing results from the three technological learning scenarios, several
significant findings emerge. Firstly, the integration of ETL in LEAP reveals
comparable results for the early phase of technological learning (2016-
2025). In this phase, hydro, geothermal, biomass, and solar PV compete
with each other to meet the NRE target Stage 1. Meanwhile, in the later
phases, when the learning rate value of all technologies decreases, the
results are slightly different between the REN-low LR scenario and the
two other technological learning scenarios. While, in the former scenario,
the wind power share is negligible, in the latter scenarios, the wind power
is competitive with other renewables. Secondly, as far as technological
learning scenarios are concerned, they meet the NRE targets mostly
through renewables, barely depending on nuclear.
3.4.3. Costs
Given the pressure from the competing socio-economic priorities,
including poverty eradication and other SDGs, any effort in achieving the
NRE targets relies on making NRE technologies economically feasible.
Hence, assessing the costs of meeting these targets is essential. Here, I
compare the results of simulations from the five scenarios with respect to
their total costs (Fig. 3.8). The total costs to achieve the NRE target by
2050 are 103.1 USD in REN in the absence of technology learning, which
is nearly 16% higher when compared to 88.9 USD in REF.
The technological learning has an impact on the total costs, which vary
non-linearly with the change in the learning pace. Results show that the
total costs of REN-medium LR and REN-high LR become 4% and 10%
lower, respectively, when compared to REN (Fig. 3.8). Meanwhile, the total
costs of REN-low LR are 2% higher than REN, which is due to the

CHAPTER 3 FROM FOSSIL FUELS TO RENEWABLES
87
assumptions of negative learning rates of NGCC, wind, and nuclear in this
scenario (see Table 3.1). Interestingly, when the high learning rates are
applied (REN-high LR), the total costs become lower than REN even by
2025. This indicates that if progress in energy technologies and their
adoption intensifies, the cost reduction starts earlier, and the total costs
of the expanding power sector increase at a slower rate already before
2025, making it attractive to invest in renewable energy.
Fig. 3.8: Total costs of electricity production under reference and four
renewable energy scenarios
3.4.4. CO2 emissions
Aligned with the Paris Agreement on mitigation of climate change, the
Government of Indonesia has announced its targets to reduce greenhouse
gas emissions by 29% in 2030 against the business-as-usual scenario.
Eleven-percent of the 29% target is allocated to the energy sector. Results
indicate how much the NRE targets will contribute to the achievement of
the Indonesian CO2 reduction target (Fig. 3.9). As expected, all renewable
scenarios, regardless of technological learning, result in lower emissions
compared to REF. In 2030, CO2 emissions from REN reaches 239 million-
ton CO2e, as compared to 318 million-ton CO2e in REF. This is equal to
25% of CO2 reduction, 6% higher than what is targeted for the power sector.
0
10
20
30
40
50
60
70
80
90
100
110
2020 2025 2030 2035 2040 2045 2050
Bill
ion
US$
REN-medium LR
REN-high LR
REN-low LR
REN
Reference
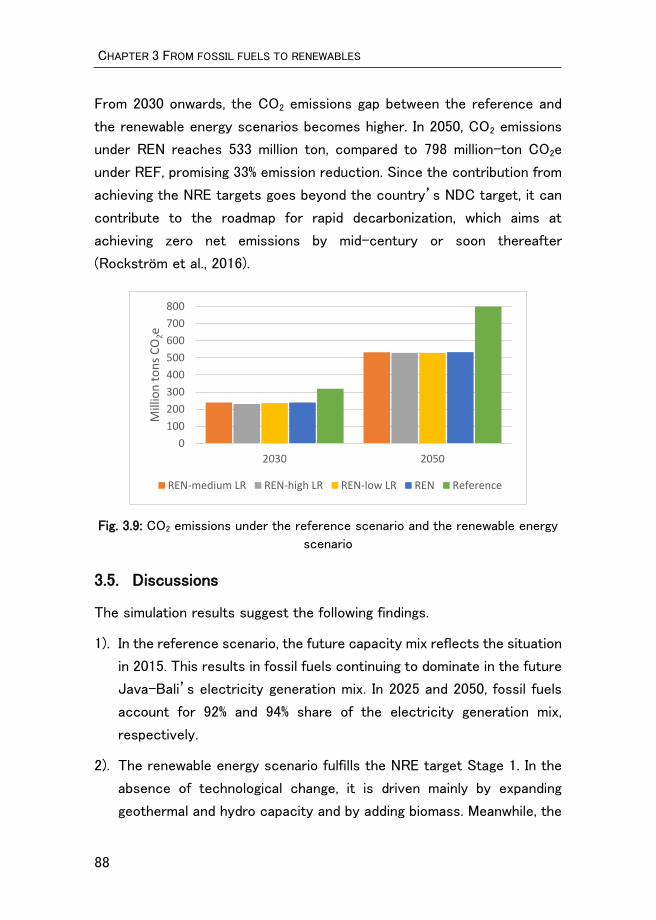
CHAPTER 3 FROM FOSSIL FUELS TO RENEWABLES
88
From 2030 onwards, the CO2 emissions gap between the reference and
the renewable energy scenarios becomes higher. In 2050, CO2 emissions
under REN reaches 533 million ton, compared to 798 million-ton CO2e
under REF, promising 33% emission reduction. Since the contribution from
achieving the NRE targets goes beyond the country’s NDC target, it can
contribute to the roadmap for rapid decarbonization, which aims at
achieving zero net emissions by mid-century or soon thereafter
(Rockström et al., 2016).
Fig. 3.9: CO2 emissions under the reference scenario and the renewable energy
scenario
3.5. Discussions
The simulation results suggest the following findings.
1). In the reference scenario, the future capacity mix reflects the situation
in 2015. This results in fossil fuels continuing to dominate in the future
Java-Bali’s electricity generation mix. In 2025 and 2050, fossil fuels
account for 92% and 94% share of the electricity generation mix,
respectively.
2). The renewable energy scenario fulfills the NRE target Stage 1. In the
absence of technological change, it is driven mainly by expanding
geothermal and hydro capacity and by adding biomass. Meanwhile, the
0
100
200
300
400
500
600
700
800
2030 2050
Mill
ion
to
ns
CO
2e
REN-medium LR REN-high LR REN-low LR REN Reference

CHAPTER 3 FROM FOSSIL FUELS TO RENEWABLES
89
NRE Stage 2 target is achieved by expanding renewables (17%) and
deploying nuclear (14%).
3). The inclusion of technological learning rates significantly alters the
electricity generation mix. Regardless of technological learning pace,
solar PV is competitive against other renewables and nuclear.
Meanwhile, in the long-run, wind power is competitive in the scenarios
with medium and high learning rate values.
4). Without considering technological learning, the fulfillment of the NRE
targets increases the total costs of electricity production by 15%. The
incremental costs become 4% and 10% lower, respectively, when the
medium and high paces of technological learning are considered, but
the effect changes non-linearly with the learning rate.
The fulfillment of NRE targets provides co-benefits in terms of reducing
CO2 emissions. By 2030, CO2 emissions decrease by 25% as compared to
the reference scenario, thereby assuring the achievement of the power
sector’s CO2 emission reduction target.
3.6. Conclusions
The aim of this chapter is to analyze the long-term capacity expansion in
the Java-Bali power system in Indonesia, considering the national NRE
targets. To the best of our knowledge, this dissertation is the first to
assess the impacts of this national policy quantitatively considering
technological learning. On the methodological side, this chapter makes an
innovative contribution to the literature by accounting for ETL in the
analysis of future electricity supply using LEAP. This chapter employs a
unique detailed dataset to simulate five scenarios for capacity expansion
of the Java-Bali system. The reference scenario assumes a business-as-
usual electricity generation mix and no technological change. Renewable
energy scenarios assess power system expansion under the national
energy policy in Indonesia, using new and renewable energy targets as
constraints. Furthermore, I differentiate between the standard renewable
CHAPTER 3 FROM FOSSIL FUELS TO RENEWABLES
90
energy scenario with fixed technological costs and three renewable energy
scenarios that include technological learning of electric power
technologies.
Overall, the results of this chapter indicate that the incorporation of ETL
into the LEAP simulation for the capacity expansion of the Java-Bali
power system enables accelerating the renewable energy penetration in
Java-Bali islands.
This chapter provides a framework to explore the cost-reducing effect of
technological learning in the power sector using LEAP. Furthermore, it also
indicates the least-cost option for the Java-Bali power system to meet
the NRE targets. Looking further ahead, more detailed researches are
needed to cover transmission capacity and spatial analysis of each power
plant including data on the supply characteristics of intermittent energy
sources, such as wind speeds and solar radiation in each region.


CHAPTER 4 THE VULNERABILITY OF THE POWER SECTOR TO CLIMATE CHANGE
93
Abstract
The power sector is a key target for reducing CO2 emissions. However,
little attention has been paid to the sector’s vulnerability to climate
change. This chapter investigates the impacts of severe weather events
and changes in climate variables on the power sector in developing
countries, focusing on Indonesia as a country with growing electricity
infrastructure, yet being vulnerable to natural hazards. This chapter
obtains empirical evidence concerning weather and climate impacts
through interviews and focus group discussions with electric utilities along
the electricity supply chain. These data are supplemented with reviews of
utilities’ internal reports and published energy sector information. Results
indicate that severe weather events often cause disruptions in electricity
supply—in the worst cases, even power outages. Weather-related power
outages mainly occur due to failures in distribution networks. Furthermore,
while severe weather events infrequently cause shutdowns of power
plants, their impact magnitude is significant if it does occur. Meanwhile,
transmission networks are susceptible to lightning strikes, which are the
leading cause of the networks’ weather-related failures. This chapter also
presents estimates of financial losses suffered by utilities due to weather-
related electricity supply disruptions and highlights their adaptation
responses to those disruptions. The findings of this chapter imply that
energy policies should consider climate change adaptation in the sectoral
development plans.
This chapter is published as a journal article:
Handayani, K., Filatova, T., & Krozer, Y. (2019). The Vulnerability of the
Power Sector to Climate Variability and Change: Evidence from
Indonesia. Energies, 12 (19), 3640.

CHAPTER 4 THE VULNERABILITY OF THE POWER SECTOR TO CLIMATE CHANGE
94
4.1. Introduction
Climate change has already greatly affected economies around the world
(World Bank, 2010). Further warming of the earth by 1.5ºC above the pre-
industrial level would entail $54 trillion costs in damage to the global
economy by the year 2100, as warned by the IPCC in its special report on
1.5ºC global warming (Hoegh-Guldberg et al. 2018). More frequent and
intense extreme weather events, rising temperatures, and shifting
precipitation patterns are expected to impact businesses. These have
brought attention to financial institutions and credit rating agencies, which
now take into account climate change risks into their assessment criteria
(Connell et al., 2018; Mufson, 2019). Accordingly, the new international
standard, i.e., ISO 14090, has emerged to assist companies in assessing
climate change impacts and developing action plans for effective
adaptation (Naden, 2019).
The power sector is not immune to climate change impacts; it is affected
through acute, disruptive, extreme weather events, and gradual long-term
changes in climate parameters (Sieber, 2013). Extreme weather events
cause damage in electricity supply infrastructures, leading to disruptions
in electricity supply. Meanwhile, long-term changes in climate parameters,
although not disruptive, can affect the quality and quantity of electricity
supply and demand. For example, an increase in surface air temperature
reduces the power output of gas turbine power plants (de Lucena et al.,
2010; Bartos and Chester, 2015; Henry and Pratson, 2016) and changes in
precipitation alter the reliability of hydropower (Syariman and Heru, 2011;
Popescu et al., 2014).
The societal need to assure climate-resilient development has triggered
scientific attention to assessing the vulnerability of the power sector to
climate change. Audinet et al. (2014) discuss climate risks for the power
sector and reveal the management approaches to deal with these risks
taken by 12 electric utility companies operating in Canada, Taiwan, India,
Australia, South Africa, and the UK. Similar studies were conducted for

CHAPTER 4 THE VULNERABILITY OF THE POWER SECTOR TO CLIMATE CHANGE
95
Asia and the Pacific (Peter et al., 2012), the European region (Tobin et al.,
2018), some areas of United States (Li et al., 2014; Vine, 2012), and Norway
(Seljom et al., 2011). Other studies focus only either on the supply or
demand side: for thermal power plants (van Vliet et al., 2012; Sieber, 2013;
Cook et al., 2015), hydroelectric power plants (Popescu, Brandimarte and
Peviani, 2014; de Lucena et al., 2009; Syariman and Heru, 2011), biofuel
(de Lucena et al., 2009), solar power (Jerez et al., 2015), wind power
(Pereira de Lucena et al., 2010), T&D networks (Panteli and Mancarella,
2015; Ward, 2013), and for the electricity demand (Véliz et al., 2017;
Kaufmann et al., 2013).
In general, scholars agree that thermal power plants are affected by rising
air ambient and water temperatures. Similarly, renewable energy, such as
wind, solar, and hydropower, are also affected by climate variability and
change, raising a concern on climate change mitigation and adaptation
nexus. Alterations in wind speed may influence the optimal match between
the wind energy source and the wind turbines power curve (Schaeffer et
al., 2012). Furthermore, increasing air temperature reduces the efficiency
of solar power. Moreover, extreme weather events and change in climate
variables also affect the hydropower operation with uneven impacts
between regions (de Lucena et al., 2009; Popescu et al., 2014; Syariman
and Heru, 2011). Similarly, impacts on electricity demand vary between
regions, indicating a net decrease in demand in colder regions while, on
the contrary, implying a net increase in demand in warmer regions (Seljom
et al., 2011; Véliz et al., 2017)
Most of these studies use simulation models to assess the projected
climate change impacts on future electricity demand and supply. However,
assessments of such effects based on empirical evidence are scarce.
Moreover, current literature focuses on assessing one segment of the
electricity supply chain: the power generation. Meanwhile, there is little
information regarding climate change impacts on other segments of the
power sector, which include transmission and distribution networks
(Cronin et al., 2018). This chapter contributes to covering this gap in the

CHAPTER 4 THE VULNERABILITY OF THE POWER SECTOR TO CLIMATE CHANGE
96
literature on the relationship between energy and climate change by
addressing the two research questions: How do severe weather events
and gradual changes in climate variables affect the entire segments of the
power sector? What are the current adaptation practices taken by electric
utility companies?
The chapter focuses on the power sector in developing countries. It is
characterized by supply shortages, aging equipment, poor performances of
energy utilities, capital flow barriers, yet rapid expansions of the grid, and
slow technology diffusion (Bhattacharyya, 2010; Nicolas et al., 2019).
These factors reduce the reliability of the power sector and increase its
vulnerability to natural shocks (Nicolas et al., 2019). As such, it is already
vulnerable to present-day weather and climate, let alone future climate
(Audinet et al., 2014).
Moreover, developing countries have a low adaptive capacity—socially,
technologically, and financially (UNFCCC, 2007b). Hence, climate change
impacts might undermine the vital role of the power sector in allowing
socio-economic development that is so crucial for enabling any progress
along UN SDGs in these countries. At the same time, the IPCC’s fifth
assessment report highlights the scarcity of literature on climate change
vulnerability, impacts, and adaptation in developing countries (Clarke et al.,
2014). By taking Indonesia as a case study, this chapter investigates the
historical effects of severe weather events and gradual changes in climate
variables on the power sector and estimates the losses suffered by
electric utility companies due to weather and climate-related electricity
disruptions. Furthermore, this chapter identifies adaptation measures
already taken by electric utilities to deal with those disruptions. The
investigation relies on extensive fieldwork in Indonesia, which comprised
of interviews, focus group discussions (FGD), and reviews of utilities’
internal reports and published energy sector information.
This chapter makes several original contributions to the literature. Firstly,
it is among the first attempts to thoroughly examine the historical impacts

CHAPTER 4 THE VULNERABILITY OF THE POWER SECTOR TO CLIMATE CHANGE
97
of severe weather events and changes in climate variables on different
segments along the power sector supply chain. Hence, this chapter
provides new data that add to our understanding concerning weather and
climate impacts on the production, transmission, and distribution of
electricity, focusing on the direct damage costs suffered by electric
utilities. Secondly, this chapter identifies measures taken by electric
utilities to adapt to severe weather events and gradual climate change;
therefore, it offers some important insights into firms’ capacity to adapt
to the changing climate. Finally, this chapter focuses on the power sector
in a developing country, thereby adding to the scarce literature on climate
change impacts, adaptation, and vulnerability of the sector in developing
countries.
The remaining part of the chapter proceeds as follows: Section 4.2
presents the methodology; Section 4.3 elaborates the effects of weather
and climate on the Indonesian power sector and discusses responses and
adaptations measures taken by the electric utilities; Section 4.4 highlights
the major findings; Section 4.5 draws the conclusions.
4.2. Methodology
To understand the actual effects of severe weather events and changes
in climate variables on the Indonesian power sector, an extensive fieldwork
was carried out in February-March 2018. An overview of Indonesia’s
vulnerability to climate change is provided in Appendix 4.A. The fieldwork
focuses on the Java-Bali power system, covering the entire key segments
of the power system: power generation, transmission, and distribution.
While the power generation segment produces the electrical energy, the
transmission networks, which consist of substations and transmission
lines, transfer the high voltage electricity over long distances before
reaching end users. Finally, the distribution networks facilitate the
electricity delivery from the grid to the end user’s meter at reduced,
usable voltage levels.

CHAPTER 4 THE VULNERABILITY OF THE POWER SECTOR TO CLIMATE CHANGE
98
The sources of the Indonesian electricity supply are primarily coal, natural
gas, and hydropower. Hence, the investigated power generation plants
comprised of major power plants of these types (Table 4.1). In total, the
fieldwork covered power plants that constitute 35% of the total power
generation capacity in the Java-Bali electricity grid.10 Any disruptions that
occur in these power plants, including weather and climate-related
outages can cause power shortage throughout the whole Java-Bali power
system. For the T&D segments, this chapter includes the entire T&D
networks throughout the Java-Bali islands (Fig. 4.1).
Table 4.1: Indonesian power plants where primary data collection has taken place
Power plant Utility Installed Capacity (MW)
Location Primary energy source
Data collection
Saguling IP 797 West Java Hydro FGD
Cirata PJB 1,008 West Java Hydro FGD
Priok IP 1,900 Jakarta Natural gas Interview
Muara Karang PJB 909 Jakarta Natural gas Interview
Tambak Lorok IP 1,350 Central Java Natural gas Interview
Pesanggaran IP 325 Bali Natural gas FGD
Suralaya IP 3,400 Banten Coal Interview
Tanjung Jati B PLN 2,640 Central Java Coal Interview
PJB Paiton PJB 800 East Java Coal Interview
Paiton #9 PLN 660 East Java Coal Interview
Note: IP = PT Indonesia Power, PJB = PT Pembangkitan Jawa Bali
The fieldwork consisted of in-depth semi-structured interviews (n = 28)
and five FGDs. The interviews involved key informants, holding various
position levels (e.g., high and middle management levels, supervisory level,
staff, and operators) of three electric utilities, who work across multiple
business units (e.g., head office, load control center, transmission office,
distribution office, and power plant). Meanwhile, the FGD was carried out
at three power plants, one transmission office, and one distribution office.
10Source: own calculation based on KESDM (2017) and PLN (2017)
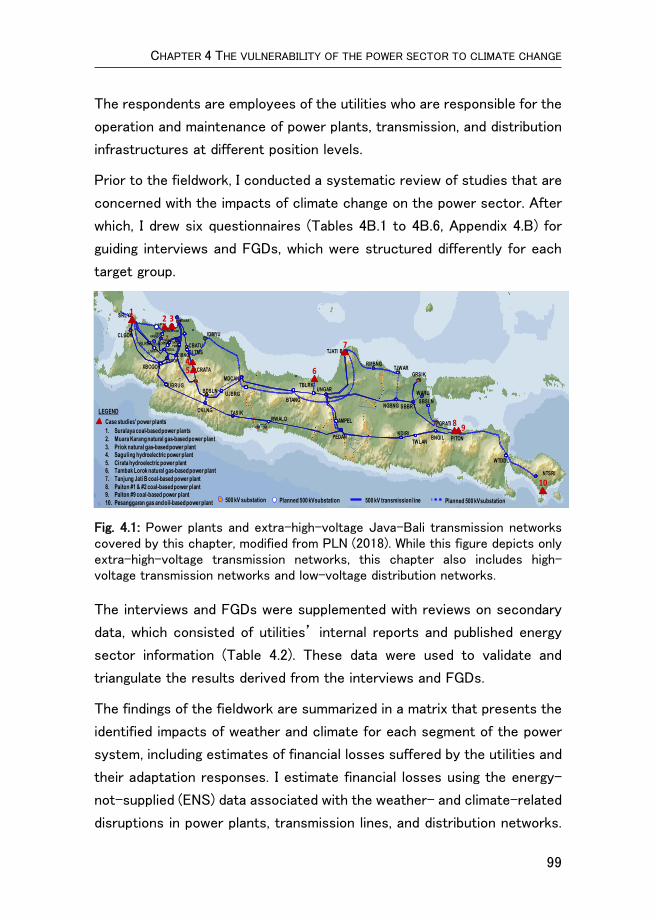
CHAPTER 4 THE VULNERABILITY OF THE POWER SECTOR TO CLIMATE CHANGE
99
The respondents are employees of the utilities who are responsible for the
operation and maintenance of power plants, transmission, and distribution
infrastructures at different position levels.
Prior to the fieldwork, I conducted a systematic review of studies that are
concerned with the impacts of climate change on the power sector. After
which, I drew six questionnaires (Tables 4B.1 to 4B.6, Appendix 4.B) for
guiding interviews and FGDs, which were structured differently for each
target group.
Fig. 4.1: Power plants and extra-high-voltage Java-Bali transmission networks covered by this chapter, modified from PLN (2018). While this figure depicts only extra-high-voltage transmission networks, this chapter also includes high-voltage transmission networks and low-voltage distribution networks.
The interviews and FGDs were supplemented with reviews on secondary
data, which consisted of utilities’ internal reports and published energy
sector information (Table 4.2). These data were used to validate and
triangulate the results derived from the interviews and FGDs.
The findings of the fieldwork are summarized in a matrix that presents the
identified impacts of weather and climate for each segment of the power
system, including estimates of financial losses suffered by the utilities and
their adaptation responses. I estimate financial losses using the energy-
not-supplied (ENS) data associated with the weather- and climate-related
disruptions in power plants, transmission lines, and distribution networks.
RENCANA KELISTRIKAN SISTEM 500 kV JAWA-BALI
*) COD Pembangkit Berdasarkan RUPTL 2017-20263
CRATA
CBATUBKASI
CIBNG
CWANG
GNDUL
UJBRG
MDCAN
BDSLN
RWALO
PEDAN
UNGAR
TASIK
KDIRI
AMPEL
GRSIK
SBBRT
DEPOK
PITON
SBSLNNGBNG
BTANG
KMBNG
BNGIL
NTSRI
SRLYAMTWAR
IDMYU
CKLNG
MKRNGDKSBI
PRIOK
CLGON
TJATI B
GRATI
WARU
TMBUN
~ 2 3
5
7
7
9
4
BLRJA
DLTMSLGKNG
8
TJWAR
CKUPA
LNTAR
UBRUG TBLRK
RMBNG
CWGBR
XBOGOR
1
6
TWLAN
~
WTDDL
10
LEGEND
Case studies’ power plants
1. Suralaya coal-based power plants
2. Muara Karangnatural gas-based power plant
3. Priok natural gas-based power plant4. Saguling hydroelectric power plant
5. Cirata hydroelectric power plant6. Tambak Lorok natural gas-based power plant
7. Tanjung Jati B coal-based power plant
8. Paiton #1 & #2 coal-based power plant9. Paiton #9 coal-based power plant
10. Pesanggaran gas and oil-based power plant 500 kV substation 500 kV transmission linePlanned 500 kV substation Planned 500 kV substation

CHAPTER 4 THE VULNERABILITY OF THE POWER SECTOR TO CLIMATE CHANGE
100
The ENS data is multiplied by the average electricity tariff for a disruption
event in the corresponding year. Meanwhile, there is only limited data
available regarding the cost incurred by the utilities to repair the physical
damages of their assets caused by severe weather events. Therefore, the
chapter reports these costs per case, data permitting. There is hardly any
data available regarding the probabilities of adverse events, which prohibits
me from reporting the expected annual damages. Likewise, the data
regarding costs associated with adaptation actions taken by the utilities
is hardly available, due to proprietary data protection or lack of proper
documentation.
Table 4.2: Sources of secondary data
Data Sources Year Covered
Disruptions in power plants
- P2B internal reports - Media covers - Suralaya CFPP’s
internal report
2011-2017 2007, 2008, 2011, 2013 2011-2017
Disruptions in transmission lines
- P2B internal reports - Media cover
2011-2017 2013
Disruption in distribution networks
- PLN internal reports - Media cover
2014-2015 2013
Precipitation, water inflow, and water spill
Cirata and Saguling HEPPs internal reports
Cirata: 1988-2017 Saguling: 1986-2017
The Java-Bali peak load P2B internal report 2014
Air temperature BMKG database center 2014
Average electricity tariff PLN statistics 2011-2017
Note: BMKG = the Agency for Meteorology, Climatology, and Geophysics
4.3. Results: Weather and climate effects and adaptive
responses of the power sector
The fieldwork reveals that weather and climate affect all segments of the
power system: generation, transmission, and distribution. Disruptive
severe weather events cause most of the identified effects. These include
heavy wind, heat waves, lightning, and heavy precipitation, which can lead

CHAPTER 4 THE VULNERABILITY OF THE POWER SECTOR TO CLIMATE CHANGE
101
to floods and landslides. The effects of gradual long-term changes in
climate variables revealed during the fieldwork include rising ambient air
and seawater temperatures, changes in precipitation patterns, and sea-
level rise. Tables 4.3 to 4.5 summarize findings regarding weather and
climate impacts on power generation, transmission, and distribution
segments of the power sector, respectively, including financial losses
suffered by the utilities and their adaptation responses. The following
sections elaborate findings of the fieldwork.
4.3.1. Impacts of severe weather events
4.3.1.1. Disruptions due to heavy precipitation
Flood and landslide affect electricity supply infrastructure
Heavy precipitation increases the chances of flooding in low-lying delta
areas, making coastal thermal power plants and their associated T&D
substations are vulnerable to flooding. According to the interviews and
reviews on various documents, flooding generally results in acute
situations. A notable example is a severe flood that occurred on the
Northern coast of Jakarta in January 2013 that forced a 909-megawatt
natural-gas-based power plant to shut down for 12 days.
Moreover, at least 546 units of an inundated distribution substation were
turned off. These instances led to an estimated loss of 15.3 million USD
suffered by electric utilities due to the disruptions of electricity production
that month and physical damages of the power plant, transmission, and
distribution equipment. The societal loss could be much more significant,
considering the vital function of the power plant and its associated T&D
networks as the backbone of the electricity supply to the capital city.
Assessing these indirect effects are out of the scope of this fieldwork and
require modeling efforts.
Besides the severe flood in 2013, PLN documentation also reveals flooding
events for the years 2014 and 2015. There were 354 and 19 floods
recorded, respectively, which affected the Java-Bali distribution networks.
During the flooding, PLN deliberately turned off the inundated distribution

CHAPTER 4 THE VULNERABILITY OF THE POWER SECTOR TO CLIMATE CHANGE
102
substations and lines for safety reasons. The ENS due to these events
reached 6.3 gigawatt-hours (GWh), with an estimated loss of nearly 0.5
million USD suffered by the utility over the two years.
Heavy precipitation often causes failures in distribution networks
Respondents of distribution offices and results of a review on PLN internal
reports indicate heavy precipitation as the second primary cause of
weather-related outages in distribution networks. By the end of 2015, the
length of distribution lines throughout the Java-Bali islands was a 22,553-
kilometer circuit (PLN, 2017a). These lines pass through many trees, which
include community, agricultural, and forest trees. Since the majority of
these lines consist of bare overhead conductors, they are sensitive to
contact with tree branches or other objects. During heavy precipitation,
wet tree branches along the distribution line become heavier and often
touch the bare conductors causing short circuits and triggering the
protection system to turned off the power. Moreover, if heavy precipitation
is accompanied by severe lightning, PLN deliberately cuts off the power
supply to avoid the channeling of lightning current to houses through the
distribution lines’ conductors.
Between 2014 and 2015, heavy precipitation caused 1,048 events of power
outages in the Java-Bali distribution network. These events result in an
8.3 gigawatt-hour ENS that is equal to an estimated loss of more than 0.5
million USD over the two years. The FGD confirms that the utility is well
aware of the risks posed by heavy precipitations. Therefore, preventive
measures have been taken to minimize the risks (Table 4.5).

CHAPTER 4 THE VULNERABILITY OF THE POWER SECTOR TO CLIMATE CHANGE
103
Table 4.3: Impacts of severe weather events on power generation and the utilities’ adaptation responses. Source: own fieldwork.
Weather- and climate-related event
Identified impacts Estimated utilities’ financial losses (USD)
Adaptation responses
Heavy precipitation Soaked dry coal reduced burning efficiency
Wet coals clogged the coal feeders reduced power output
Suralaya CFPP, 2011-2017: 21.5 million.
Construction of sheds to protect the coal storage area from rainwater
Increased river flow more waste in the sea impeded power plants’ water uptake
Muara Karang, Priok, and Tambak Lorok NGCC power plants, 2011-2017: 15 million
Additional work hours for waste cleaning and transportation
Days of heavy rainfall high water inflow to the hydropower reservoir reservoir’s water spills flooding downstream
N/A Adjust hydropower operation pattern to maintain a normal reservoir’s water level
Flooded electricity infrastructure Muara Karang NGCC power plant, 2013: 6.2 million
Construction of flood control systems
Mobilization of portable water pumps for draining the water
Elevation of some areas of power plants
Heavy wind and high sea waves
Interruptions in coal shipping to CFPPs reduced power outputs/shutdowns
Suralaya power plant, 2011-2017: 1.2 million
Additional coal shipping fleets
Changes in the type of fleets (to a stronger and larger vessel)
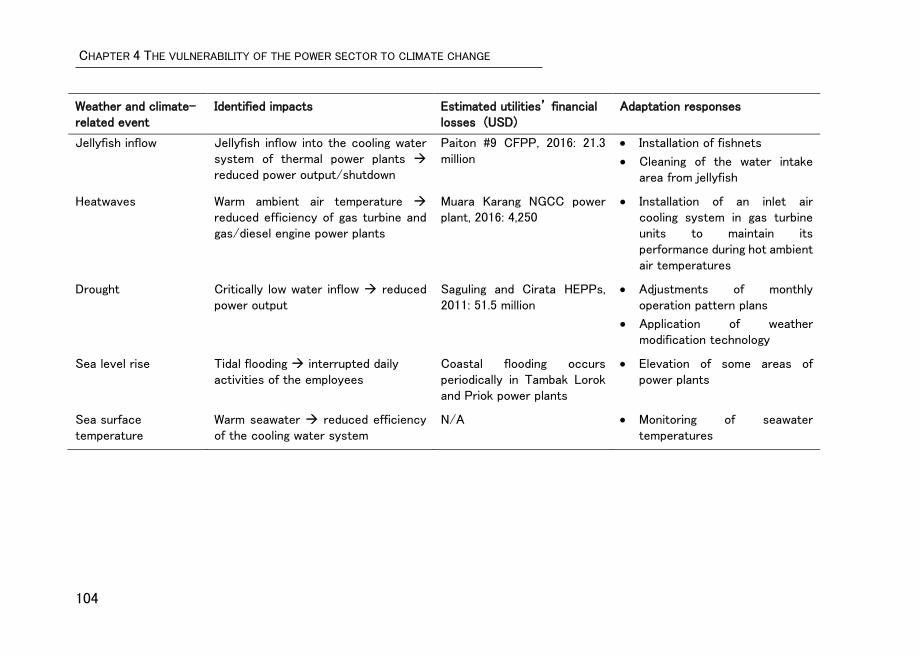
CHAPTER 4 THE VULNERABILITY OF THE POWER SECTOR TO CLIMATE CHANGE
104
Weather and climate-related event
Identified impacts Estimated utilities’ financial losses (USD)
Adaptation responses
Jellyfish inflow Jellyfish inflow into the cooling water system of thermal power plants reduced power output/shutdown
Paiton #9 CFPP, 2016: 21.3 million
Installation of fishnets
Cleaning of the water intake area from jellyfish
Heatwaves Warm ambient air temperature reduced efficiency of gas turbine and gas/diesel engine power plants
Muara Karang NGCC power plant, 2016: 4,250
Installation of an inlet air cooling system in gas turbine units to maintain its performance during hot ambient air temperatures
Drought Critically low water inflow reduced power output
Saguling and Cirata HEPPs, 2011: 51.5 million
Adjustments of monthly operation pattern plans
Application of weather modification technology
Sea level rise Tidal flooding interrupted daily activities of the employees
Coastal flooding occurs periodically in Tambak Lorok and Priok power plants
Elevation of some areas of power plants
Sea surface temperature
Warm seawater reduced efficiency of the cooling water system
N/A Monitoring of seawater temperatures

CHAPTER 4 THE VULNERABILITY OF THE POWER SECTOR TO CLIMATE CHANGE
105
Table 4.4: Impacts of severe weather events on transmission networks and the utility’s adaptation responses. Source: own
fieldwork.
Weather and climate-related events
Identified impacts Estimated utility’s financial losses (USD)
Adaptation responses
Lightning Lightning strikes overvoltage and flashover power failures and transmission equipment damages
2011-2017: 524,091 Installation of the lightning monitoring system
Improvement of the lightning protection system
Heavy wind Power failures due to objects being blown onto the conductors or heavy wind detaching the conductors from the isolator
2011-2017: 22,139 Repair the damaged equipment.
Flood Inundated substations were deliberately turned off for safety reasons
Flood in Jakarta, 2013: 9.1 million
Elevated the flood-prone substations

CHAPTER 4 THE VULNERABILITY OF THE POWER SECTOR TO CLIMATE CHANGE
106
Table 4.5: Impacts of severe weather events on distribution networks and utility’s adaptation responses. Source: own fieldwork
Weather and climate-related event
Identified impacts Estimated utility’s financial losses (USD)
Adaptation responses
Heavy wind
Uplifted objects damage bare conductors power failures
2014-2015: 13.1 million
Conduct routine inspections Alert the 24-hour technical service teams Apply segmentation of protection systems to
avoid widespread power outages
Heavy precipitation
Wet and heavy branches touched the bare conductors power failures
2014-2015: 575,152
Check and maintain distribution networks (e.g., clear distribution lines from tree branches) before the wet season come
Alert the 24-hour technical service teams
Flood Inundated substations were deliberately turned off for safety reasons.
2014-2015: 455,605
Identify and elevate flood-prone substations Replace old underground conductors that were
flooded Establish a computer application to monitor the
area affected by flood-induced power outages Establish a disaster recovery center and a special
service team for post-flood recovery.
Landslide Heavy precipitation and heavy winds triggered landslides damaged distribution networks
2014-2015: 9,234 Identify landslide-prone poles Improve poles’ foundation

CHAPTER 4 THE VULNERABILITY OF THE POWER SECTOR TO CLIMATE CHANGE
107
Heavy precipitation reduces coal quality
CFPPs generally store coals in open areas (coal yards). As heavy rainfall
soaks the dry coal, the plants’ burning efficiency reduces. Moreover,
rainwaters generate excessive coal runoff, which in severe cases,
inundates the coal yards. Respondents highlight that, subsequently, the
coals turn into sticky sludge, causing clogging in the coal feeder, which
prevents a continuous, reliable coal supply to the power plants’ burning
chambers and reduces power output. For example, the document reviews
reveal that the Suralaya CFPP has experienced 544 occurrences of a
power output reduction due to a clogged coal feeder during 2011-2017.
Consequently, the total ENS over the seven years for this power plant
alone reached 277.6 GWh, resulting in estimated losses of 21.5 million USD.
The power plant reacted by building a shed in its coal yard, which currently
accommodates around 10% of the coal storage area.
Heavy precipitation brings waste to power plants’ water intake area
Heavy precipitation increases river flows, which in turn bring more waste
into the sea. An increased volume of waste in the sea creates problems
for coastal power plants. The respondents of coal- and gas-based power
plants stress that small-size waste escapes water intake filters and enters
the cooling water system, causing clogging in the water-circulating pump,
and plugging in the condenser. Interviews and utilities’ documentations
point to the fact that waste has forced some units of natural gas-based
plants to shut down temporarily in severe cases.
The fieldwork finds that increased waste driven by heavy rainfall affected
three natural-gas-based power plants of the case studies: Muara Karang,
Tambak Lorok, and Priok. A high-quantity of waste on water intake areas
have caused reductions in their power outputs. In total, the ENS due to
interruptions in these three power plants nearly reached 190 GWh, causing
an estimated loss of 15 million USD during 2011-2017. Furthermore, the
Muara Karang power plant recorded eight events of waste-related forced
shutdowns over the considered seven-year period.

CHAPTER 4 THE VULNERABILITY OF THE POWER SECTOR TO CLIMATE CHANGE
108
The massive amount of waste requires a significant number of workforce.
For instance, at the Muara Karang power plant alone, the waste cleaning
in its two water intake areas involves at least 80 personnel who work in
shifts for 24 hours in two water intake facilities. The collected waste is
transported outside the plant twice a week. However, during the peak
amount of waste, daily transportation is needed, as respondents reported.
4.3.1.2. Disruptions due to heavy wind
Heavy wind damages electricity supply infrastructure
Heavy wind is by far the main threat for the Java-Bali distribution
networks (Table 4.4). For example, during 2014-2015, it was responsible
for 95% of the weather-related power outages. The interviews with
representatives of distribution offices indicate that heavy wind can knock
down trees and billboards and throw them and other objects onto the bare
conductors of the distribution networks, thereby causing power outages.
Multiple occurrences of heavy wind over the two years resulted in 275
GWh of ENS, leading to an estimated loss of 13.1 million USD for PLN over
the two years.
Meanwhile, in the transmission networks, there were only 12 heavy-wind-
related power outages recorded from 2011 through to 2017, owing to their
stronger tower structure and higher conductors as compared to
distribution networks. These events resulted in 0.28 GWh of ENS, which
equals to 22,139 USD of financial losses over the seven years (Table 4.3).
Respondents identify three reasons for the heavy-wind-related outages
in T&D networks: (i) heavy wind blew tree branches or other objects onto
the conductors; (ii) heavy wind caused the conductors to swing and hit
the pole/tower’s body; (iii) Heavy wind detached the conductors from the
insulators.
Respondents of the distribution offices state some proactive measures
they have taken responding to heavy-wind-related disruptions. They
regularly monitor weather forecasts; in case a heavy wind is approaching,
they alert its 24-hours technical service teams and ensures sufficient

CHAPTER 4 THE VULNERABILITY OF THE POWER SECTOR TO CLIMATE CHANGE
109
people and materials available to overcome any damage that may occur
when the heavy wind comes. Beside corrective measures, they also
include preventive measures by conducting inspections on its distribution
networks. The inspection includes cutting tree branches that could
potentially harm the distribution network when heavy wind occurs. The
control also checks and maintains pole stands to ensure that they are
supported by an adequate foundation. In case a power outage occurs due
to severe weather, they prevent widespread power outages by applying
the segmentation of the distribution’s protection system. Meanwhile, the
response of transmission offices to heavy-wind-related disruptions so far
has been on the investigation of the cause of power transmission failures
and repairing the damaged equipment without any ex-ante adaptation
actions.
Heavy winds also cause damages to power plants’ facilities. For example,
in 2007, a heavy wind slammed two coal ships, causing them to crash into
the coal loading facility of the Tanjung Jati B CFPP. Consequently, the
coal unloading facility did not function for two weeks, which resulted in a
critical stock of fuel coal in the power plant, forcing the plant to shut down
for some time. Furthermore, in March 2017, a heavy wind lifted the roof of
the coal yard’s shed of Paiton #9 CFPP and crooked some of the shed’s
pipes. Respondents state that nothing has been done in terms of improving
the resiliency of infrastructure against the severe weather.
Heavy wind disrupts the fuel-coal stock
The interviews with representatives of head office and coal fired-power
plants reveal that heavy wind and high waves in the Java Sea affect coal
transportation to the Java island. The CFPPs sited in Java rely on sea-
shipped coals from coalmines of other islands. During heavy winds, coal
loading and unloading activities are prohibited, which causes a longer
waiting time for coal deliveries. Moreover, high waves in the Java Sea,
which often occur during the wet season, prevent coal barges from
cruising. These circumstances jeopardize the stock of coal at CFPPs,

CHAPTER 4 THE VULNERABILITY OF THE POWER SECTOR TO CLIMATE CHANGE
110
which often lead to reductions in the plants’ power outputs. For instance,
in 2007, Tanjung Jati B CFPP experienced critical fuel-coal stocks twice
–in March and December– due to severe weather in the Java Sea. The
media reported forced shutdowns of the CFPP for days due to the
disruptions in coal supply (Damayanty, 2008; ‘Tanjung Jati’, 2007).
Consequently, the costly oil-fueled power plants were operated to
substitute such capacity loss in the Java-Bali grid, causing an additional
cost of 1.6 million USD per day during those critical days in March and
December 2007 (Detikfinance, 2007).
Recent data from the fieldwork show that severe weather events in the
Java Sea continue posing threats to the security of coal supply for CFPPs.
In December 2017, the average coal stock of Tanjung Jati B was only
enough for 13 days of operation, which was halved of the planned stock of
25 days. By the end of January 2018, the stock was only enough for three
days of operation, leaving the plant vulnerable to a forced shutdown.
Similarly, the average coal stock of PJB Paiton power plant in January
2017 reached a critical point, i.e., less than three days. In Suralaya CFPP,
the disturbances in coal stock between 2011 and 2017 resulted in an
estimated loss of 1.2 million USD in total.
As per the interviews, to avoid critical fuel-coal stocks during severe
weather events, CFPPs responded by revising their contracts to add the
number of coal shipments and to use stronger and larger vessels.
4.3.1.3. Heatwave effects on electricity supply and demand
Heatwave reduces generation capacity of natural-gas-based power plants
The heatwave is particularly a concern for natural-gas-based power
plants. Interviews with representatives of these power plants indicate that
warm air temperatures affect the gas turbines and gas engines of the
power plants. The operation of this type of power plant requires ambient
air for compressor intake, which is then pumped into the burning chamber.
The higher the air ambient temperature, the lower the air density and,
hence, the burning efficiency, which subsequently reduces power outputs.
CHAPTER 4 THE VULNERABILITY OF THE POWER SECTOR TO CLIMATE CHANGE
111
Utilities recorded disruptions in several natural-gas-based power plants
attributable to heatwaves. On March 17, 2015, two units of gas turbines in
the Muara Karang power plant reduced their power outputs by 14% and
17% each due to the hot temperature outside, which was measured at
35ºC. Similarly, on May 3, 2016, two other units of the same power plant
experienced a reduction in power output by 3% of their capacity due to
high ambient air temperature. The latter caused an estimated loss of 4,250
USD suffered by the power plant on that particular month alone. Another
case that is worth mentioning is a disruption that occurred in the
Pesanggaran power plant. During the fieldwork visit on March 1, 2018, the
ambient air temperature was 33ºC. At this temperature, the engine could
not deliver the optimum power output. The screen in the control room
shows "automatic derating" notification with an explanation of the cause:
a high ambient air temperature. The information means that the engine
automatically reduces its output due to high air temperature.
The FGD and interviews reveal that reductions in power outputs due to
warm-ambient air temperature have not been a substantial issue for the
Java-Bali electricity grid as a whole. However, for the Bali subsystem, it
was a significant problem in 2010 due to its limited power generation
capacity then, while the power transfer from the Java subsystem was
constrained by a technical barrier in the transmission networks. Hence, it
was essential to optimize power output from local plants in Bali. Therefore,
the Pesanggaran power plant in Bali adapted by installing an inlet air
cooling system in its gas turbine units to maintain the machine
performance during hot temperatures.
Heatwave increases electricity use
Respondents confirm an increase in electricity demand during hot
temperature days. An IP internal report reveals that in the Bali subsystem
alone, the difference in peak demand between hot and cold days/nights
can reach 100 MW—around 12% of the peak demand in 2017. Hence, a
surge in electricity demand due to warmer temperature directly affects

CHAPTER 4 THE VULNERABILITY OF THE POWER SECTOR TO CLIMATE CHANGE
112
the power system, as the system should be able to accommodate any
surge in electricity demand. In the long-term, an increased mean
temperature will require a more substantial investment in power
generation, transmission, and distribution networks to cope with the
increased energy use (MWh) and higher peak demand (MW).
4.3.1.4. Disruptions due to lightning strikes
Respondents from the transmission offices point to lightning strikes as the
leading cause of weather-related disruptions in high-voltage transmission
lines. According to the interviews, a lightning strike can induce an
overvoltage on transmission lines and cause a flashover, which results in
power failures, and damages power transmission equipment. Therefore,
transmission lines generally equipped with shield wire and insulation to
protect them from a lightning strike (Table 4.3). However, lightning strikes
that occur too frequently can reduce the lifetime of the protective
equipment, causing an increase in transmission’s failure and its
maintenance costs. The fieldwork reveals 107 events of lightning strike-
related power outages in transmission networks throughout the Java-Bali
power system during 2011-2017. The total ENS during the same period
was 67 gigawatt-hour, which is equal to 0.52 million USD over the six
years.
Being aware of the risks posed by lightning, PLN established a lightning
monitoring system, which derives the data regarding the occurrence of
lightning strikes in the transmission network areas. The monitoring system
produces a lightning density map and data regarding the exposure of
lightning to the transmission network. The transmission offices compare
these data with the disruption events in the transmission networks to
conclude whether a disruption occurred due to lightning or something else.
In case lightning strikes are found responsible for any disruptions in a
specific transmission line or substation, PLN improves the lightning
protection facilities at this location. Such improvements include the
installation of transmission line arresters and the improvement of
CHAPTER 4 THE VULNERABILITY OF THE POWER SECTOR TO CLIMATE CHANGE
113
grounding systems and earth wire conductor materials. PLN also uses
lightning data as a consideration for the planning of the transmission
network’s development.
4.3.1.5. Disruptions due to jellyfish inflows
This chapter adds the ‘jellyfish outbreak’ into the extreme category
because, in this context, it is associated with a drastic seawater
temperature change (Rafiq, 2016). Jellyfish inflow on thermal power plants
is an extreme event that occasionally occurs on the Northern coast of
Java. According to interviews, jellyfish often slip off screening facilities for
the inlet water, causing a problem in the cooling water system of CFPPs.
A severe jellyfish inflow can cause a reduction in power generation
capacity or even force the power plant to shut down. For example, in April
2016, the jellyfish inflow to Paiton #9 CFPP forced the plant to shut down
for 20 days, causing an estimated loss of 21.7 million USD due to ENS
alone. According to BMKG, the jellyfish outbreak was triggered by an
extremely cold temperature in the Australian sea, forcing jellyfish to
migrate to the North Java Sea (Rafiq, 2016).
The first emergency response to the jellyfish inflow at that time was
cleaning and spraying the traveling screen, flushing the inlet of water
intake, and installing fishnet on the water intake canal. However, these
responses were not enough to block the jellyfish inflow, and in the end,
the plant was forced to shut down. After the plant was shut down, manual
cleaning of the water intake canal was carried out, involving 90 personnel,
including divers. The damaged equipment was also repaired. The shutdown
of Paiton #9 CFPP caused a power supply shortage in the Java subsystem.
Consequently, the Java subsystem had to import the expensive oil-based
electricity from the Bali subsystem.
Jellyfish inflow also occurred in the water intake facility of Tanjung Jati B
CFPP. The jellyfish inflow blocked the water uptake of the cooling water
system, which eventually caused reductions in power output. From 2011-
2017, there were 11 occurrences of jellyfish inflow that affected the

CHAPTER 4 THE VULNERABILITY OF THE POWER SECTOR TO CLIMATE CHANGE
114
Tanjung Jati B electricity productions. The problem was generally solved
within 0.5 to a few hours. The estimated losses suffered by Tanjung Jati
B due to the jellyfish-induced reductions in the plant’s energy production
reaches 0.3 million USD over the seven years. Apart from the jellyfish
migration from the Australian sea, the jellyfish outbreak can be attributed
to among others, a warmer sea temperature (Purcell, 2005; Aljbour et al.,
2019). So far, the power plant has taken ex-post measures such as
installing fishnets and cleaning the water intake facility from the jellyfish.
4.3.2. Impacts of gradual changes in climate variables
4.3.2.1. Changes in precipitation pattern affect hydroelectric power plants
The FGDs with representatives of two hydropower plants conclude that
changes in precipitation patterns affect the hydropower operation already
today, raising concerns about future climate conditions. My analysis based
on the power plants’ data confirms the strong correlation between
precipitation, water inflow to the reservoir, and electricity production of
hydropower (Figure 4C.1 and 4C.2 Appendix 4.C). The primary climate-
induced challenge for hydropower is, therefore, to manage the situation
during extreme wet and dry seasons. For example, reductions in generated
capacity due to long-lasting drought were observed in 1997, 2003, 2006,
and 2011. In 2011 alone, both Saguling and Cirata HEPPs only utilized 87%
and 75% of their design capacities, respectively, resulted in 51.5 million of
ENS-related financial losses. Furthermore, in September 2011, they were
only able to operate half of their capacity and only to serve the peak
demand (Musim Kering, 2011).
Table 4.64.6 compares the energy generated in extremely dry years with
their design capacities and estimates the ENS due to the lack of water.
In contrast, days with heavy rainfalls result in high water levels of the
reservoirs. This situation gives a positive impact enabling the HEPPs to
produce electricity at their maximum capacity. However, excessive water
inflow can lead to water spills, which should be avoided as much as
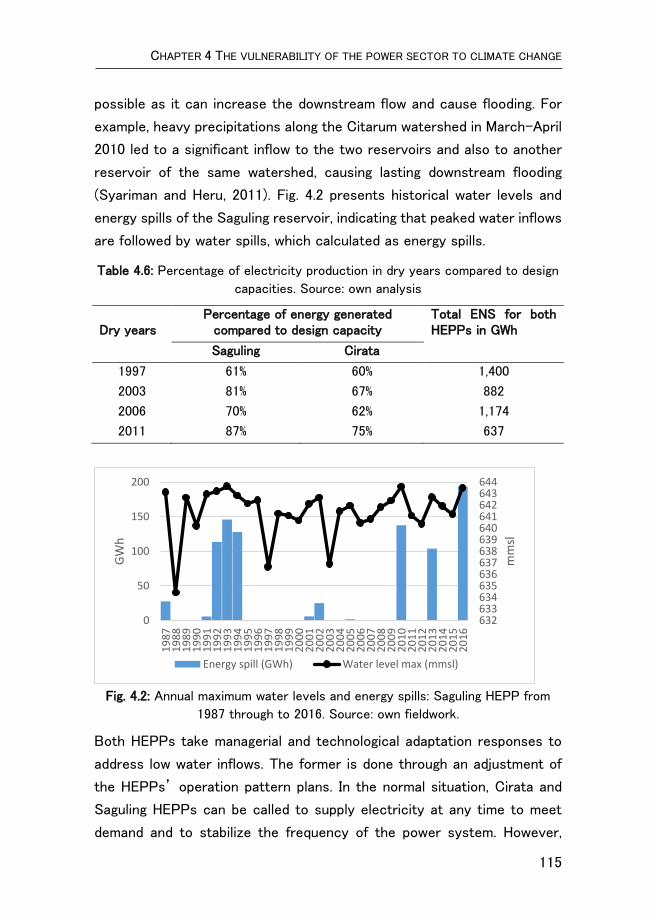
CHAPTER 4 THE VULNERABILITY OF THE POWER SECTOR TO CLIMATE CHANGE
115
possible as it can increase the downstream flow and cause flooding. For
example, heavy precipitations along the Citarum watershed in March-April
2010 led to a significant inflow to the two reservoirs and also to another
reservoir of the same watershed, causing lasting downstream flooding
(Syariman and Heru, 2011). Fig. 4.2 presents historical water levels and
energy spills of the Saguling reservoir, indicating that peaked water inflows
are followed by water spills, which calculated as energy spills.
Table 4.6: Percentage of electricity production in dry years compared to design
capacities. Source: own analysis
Dry years
Percentage of energy generated compared to design capacity
Total ENS for both HEPPs in GWh
Saguling Cirata
1997 61% 60% 1,400
2003 81% 67% 882
2006 70% 62% 1,174
2011 87% 75% 637
Fig. 4.2: Annual maximum water levels and energy spills: Saguling HEPP from
1987 through to 2016. Source: own fieldwork.
Both HEPPs take managerial and technological adaptation responses to
address low water inflows. The former is done through an adjustment of
the HEPPs’ operation pattern plans. In the normal situation, Cirata and
Saguling HEPPs can be called to supply electricity at any time to meet
demand and to stabilize the frequency of the power system. However,
632633634635636637638639640641642643644
0
50
100
150
200
19
87
19
88
19
89
19
90
19
91
19
92
19
93
19
94
19
95
19
96
19
97
19
98
19
99
20
00
20
01
20
02
20
03
20
04
20
05
20
06
20
07
20
08
20
09
20
10
20
11
20
12
20
13
20
14
20
15
20
16
mm
sl
GW
h
Energy spill (GWh) Water level max (mmsl)

CHAPTER 4 THE VULNERABILITY OF THE POWER SECTOR TO CLIMATE CHANGE
116
during low water levels in reservoirs, they are only operated to serve the
increasing energy demand at peak hours (Musim Kering, 2011). The
technological response is through an application of weather modification
technology that creates artificial rain, which was done in 2011 when
extreme drought occurred. Meanwhile, when there is excessive water
enter the reservoirs, the HEPPs should maintain the standard reservoir’s
water level by maximizing water use for producing electricity. However, in
severe cases, water spill could not be avoided.
4.3.2.2. Warmer ambient air temperature increases electricity use
The mean annual temperature in Indonesia has increased by 0.04℃ per
decade between 1985 and 2015 (GERICS, 2015). As discussed in Section
4.3.1.3, the interviews indicate a rise in electricity demand during warmer
temperatures. To validate this, this section analyzes the hourly load data,
and the peak electricity demand data collected from P2B, relating these
data to the average temperature data from 23 weather stations retrieved
from the BMKG database center. As a result, a strong relationship
between an increase in electricity use and air temperature rise is found
(Fig. 4.3). Therefore, an increase in the mean temperature is expected to
boost the average electricity consumption.
Fig. 4.3: Peak electricity demand in the Java-Bali grid as a function of maximum
daily temperature: weekdays 2014. Source: own fieldwork.
y = 521.55x + 5788.3R² = 0.6078
20,000
20,500
21,000
21,500
22,000
22,500
23,000
23,500
24,000
26 28 30 32 34 36
Pea
k El
ectr
icit
y D
eman
d (
MW
)
Average Maximum daily Temperature (ºC)Temperature Linear (Temperature)
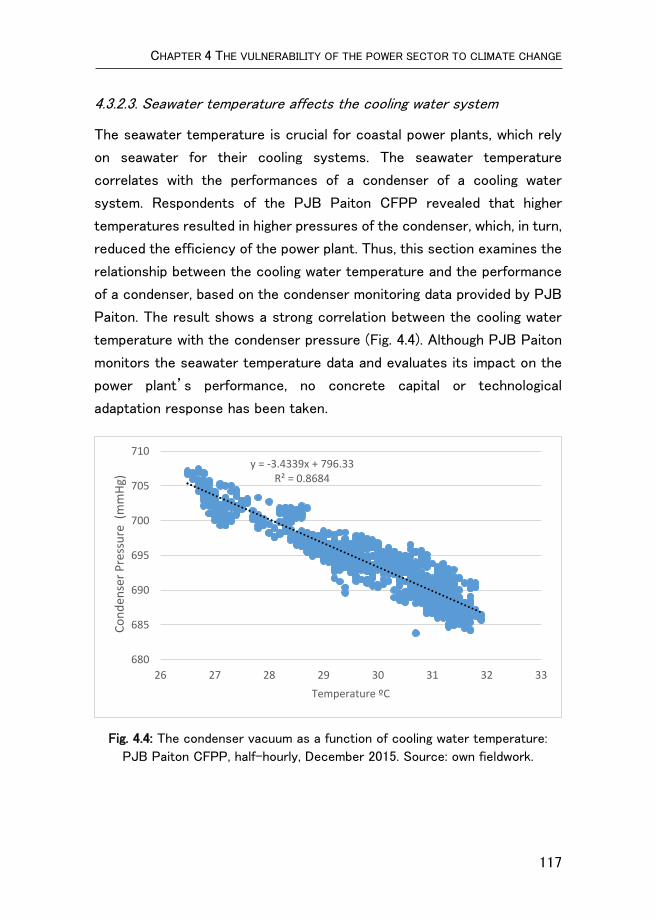
CHAPTER 4 THE VULNERABILITY OF THE POWER SECTOR TO CLIMATE CHANGE
117
4.3.2.3. Seawater temperature affects the cooling water system
The seawater temperature is crucial for coastal power plants, which rely
on seawater for their cooling systems. The seawater temperature
correlates with the performances of a condenser of a cooling water
system. Respondents of the PJB Paiton CFPP revealed that higher
temperatures resulted in higher pressures of the condenser, which, in turn,
reduced the efficiency of the power plant. Thus, this section examines the
relationship between the cooling water temperature and the performance
of a condenser, based on the condenser monitoring data provided by PJB
Paiton. The result shows a strong correlation between the cooling water
temperature with the condenser pressure (Fig. 4.4). Although PJB Paiton
monitors the seawater temperature data and evaluates its impact on the
power plant’s performance, no concrete capital or technological
adaptation response has been taken.
Fig. 4.4: The condenser vacuum as a function of cooling water temperature:
PJB Paiton CFPP, half-hourly, December 2015. Source: own fieldwork.
y = -3.4339x + 796.33R² = 0.8684
680
685
690
695
700
705
710
26 27 28 29 30 31 32 33
Co
nd
ense
r P
ress
ure
(m
mH
g)
Temperature ºC

CHAPTER 4 THE VULNERABILITY OF THE POWER SECTOR TO CLIMATE CHANGE
118
4.3.2.4. Sea-level rise contributes to tidal flooding
Indonesia has recorded 2 to 10 mm of annual sea-level rise from 1993 to
2012 (USAID, 2017). Sea-level rise threatens coastal power plants and
their associated T&D substations. Tidal flooding often occurs in coastal
power plants, especially during high tide and heavy precipitation. For
example, Priok and Tambak Lorok gas-based power plants are often hit by
tidal flooding. Priok, which is located on the Northern coast of Jakarta, lies
in the altitude of 0-2 m above sea level. It is a flood-prone area where
nine rivers and two flood canals meet. The lower parts of the power plant
have often inundated, disturbing some activities such as employees’
mobility between buildings. The water inundation level is considered
dangerous when it reaches 35 cm, which has occurred in 2007 and 2008.
Respondents point out that tidal flooding has never caused production
failure so far because the powerhouse is located on the higher altitude of
the power plant area. However, in 2007, one of the Priok power plant’s
transformers was flooded (Fig. 4.5a). Hence, it was deliberately
disconnected from the grid during the flooding for safety reasons. During
the 2007 and 2008 flooding, the Priok power plant mobilized a portable
water pump for draining the water. After the floods, some areas of the
plants were also elevated.
Tambak Lorok power plant is located on the Northern Coast of Semarang,
Central Java at the elevation of 0.75-1.5 m above sea level (IP Semarang,
2017). The sea-level rise in combination with land subsidence makes the
plant vulnerable to tidal flooding and future changes in these due to climate
change. The flooding occurs periodically; in fact, when the field visit was
conducted in February 2018, the front gate of the plant was flooded (Fig.
4.5b). As an adaptation to this situation, the Tambak Lorok power plant
constructed a flood control system, which included a polder, water sump
pumps, a wall, and upgraded its drainage system to improve its resilience
against seawater surge. Moreover, an additional polder is currently under
construction to manage water inflow from the front side of the plant.

CHAPTER 4 THE VULNERABILITY OF THE POWER SECTOR TO CLIMATE CHANGE
119
(a)
(b)
Fig. 4.5: Tidal flooding affects coastal power plants: Priok in 2007 (a) and
Tambak Lorok in 2018 (b). Source: own fieldwork
4.4. Discussions
The findings of this chapter reveal the adverse impacts of weather and
climate to the power sector, including past losses both in energy-not-
supplied and in USD, and indicate the adaptation measures already taken
by the actors in the Indonesian power sector.

CHAPTER 4 THE VULNERABILITY OF THE POWER SECTOR TO CLIMATE CHANGE
120
Impacts: Severe weather events and gradual changes in climate variables
affect all segments of the power sector, namely generation, transmission,
and distribution. My findings suggest that, in terms of the frequency of
failures, the distribution network segment is the most vulnerable to severe
weather events. Meanwhile, weather-related disruptions occur less
frequently in the power generation segment. Nevertheless, whenever it
does happen, the magnitude is significant, knocking out power plants for
days and causing tens of millions of USD in the direct damage alone.
Severe weather mainly affects the fuel-coal quality and the coal stock of
coal-fired power plants, and the reliability of the cooling water system in
both coal- and gas-based power plants. These effects raise concerns
regarding climate-resilience of fossil-fuel-based electricity production,
which to date outprices green electricity options in Indonesia and forms
the core of its future electrification plans. Changes in precipitation
patterns also affect hydropower operation, undermining its role in serving
electricity demand during peak hours. Concerning the transmission
network, the primary cause of weather-related disruptions is the lightning
strike. Yet, the weather-related damage in this segment is minor when
compared to those in the distribution and generation segments.
Adaptation: To some extent, actors throughout Indonesia’s electricity
supply chain already implement adaptation actions in response to severe
weather events, combining managerial and technological interventions. The
technological responses include investments in flood control systems in
power plants, a lightning monitoring system for the transmission networks,
and an application of weather modification technology to create artificial
rain to increase water inflow to hydropower reservoirs. Managerial
responses include altering coal shipment contracts, increasing routine
distribution network checks, and altering hydropower operation patterns.
However, these adaptation responses are limited to ex-post reactions to
weather- and climate-related disruptions encountered by utilities.
Furthermore, the responses are fragmented rather than a part of a national
strategy and focus only on assets already adversely affected. Meanwhile,
CHAPTER 4 THE VULNERABILITY OF THE POWER SECTOR TO CLIMATE CHANGE
121
a long-term strategic plan that ex-ante anticipates future climate change-
related risks and systematic adaptation responses have not been
considered.
4.5. Conclusions
This chapter aims to systematically investigate the effects of severe
weather events and changes in climate variables on the electricity supply
chain, taking Indonesia as an example of a developing country where
natural hazards already undermine the resilience of the power sector
today. Relying on extensive fieldwork carried out in 2018, this chapter
reveals which, and how severe weather events and changes in climate
variables adversely affect the Indonesian power sector.
The estimation of weather-related damage to the power sector in this
chapter is limited to the direct losses suffered by electric utilities, primarily
including energy-not-supplied. It also includes direct economic losses
from damaged assets and equipment when data permits. This chapter,
however, does not account for complete economic losses due to weather-
and climate-related widespread power cuts. Hence, business interruptions
and other cross-sectoral impacts of hazards are out of the scope of this
chapter.
This chapter contributes to the literature by providing empirical insights
into the actual effects of severe weather events and changes in climate
variables on the entire electricity supply chain in a developing country,
both in physical and monetary terms where data permitted. Moreover, it
provides unique information on the variety of the actual adaptation
responses of actors throughout different segments of the electricity
supply chain to severe weather events. Future research might integrate
the observed and projected climate change impacts into simulations of the
electricity system expansion for realizing a climate-resilient electricity
system and estimating costs and benefits of adaptation of the power
sector to climate change.

122


CHAPTER 5 SEEKING FOR CLIMATE CHANGE MITIGATION AND ADAPTATION NEXUS
125
Abstract
The power sector is in the spotlight for reducing carbon emissions.
However, little attention has been paid concerning the impacts of climate
change on the sector. This chapter analyzes the interplay between
electrification, climate change mitigation and climate change impacts and
adaptation in the power sector. Taking Indonesia as an example, this
chapter integrates both climate change mitigation goals and the impacts
of climate change into simulations of an Indonesian power system
expansion using LEAP. First, this chapter quantifies the impacts of climate
change on electricity demand and supply based on historical climate-
related impacts and climate change projections. Thereafter, the quantified
effects, together with renewable energy targets, then integrated into the
LEAP modeling architecture. Results show a substantial alteration in
technology composition driven by the joint climate mitigation–adaptation
scenario compared to the reference scenario. Furthermore, there is an
increase in installed capacity and electricity generation relative to the
reference scenario to balance the climate-induced rise in electricity
demand and to compensate for the reductions of the power-generating
capacity under new climate conditions. Consequently, the total costs of
electricity production increase significantly.
This chapter is based on:
Handayani, K., Filatova, T, Krozer, & Y., Anugrah, P. (2019). Seeking
for climate change mitigation and adaptation nexus: Analysis of a
long-term power system expansion. Applied Energy. (Under review).

CHAPTER 5 SEEKING FOR CLIMATE CHANGE MITIGATION AND ADAPTATION NEXUS
126
5.1. Introduction
The energy sector is a significant contributor to global warming.
Accordingly, most of the NDCs submitted by the UNFCCC parties include
reducing emissions from this sector as their strategies to meet their
pledge under the Paris Agreement (UNFCCC, 2016). However, the energy
sector is also vulnerable to the impacts of climate change. Extreme
weather events and gradual changes in climate variables have implications
for the reliability, cost, and environmental effects of the energy supply
(Schaeffer et al., 2012; Cronin et al., 2018). Therefore, it is a great
challenge for the energy sector to meet their climate mitigation goals while
at the same time, cope with climate change impacts. For developing
countries, this challenge coincides with their vital electrification objective
as they face rapid growth in electricity demand.
Significant research has addressed the decarbonization of the power
sector in response to the Paris Agreement. Grande-Acosta and Islas-
Samperio (2017) provide an alternative scenario to decarbonize the
Mexican power sector by assessing 36 mitigation options using LEAP.
Handayani et al. (2017) also employ LEAP to analyze scenarios for the
Indonesian power system to meet both electrification and Paris climate
goals. Dalla Longa and van der Zwaan (2017) adopt TIAM-ECN model to
investigate the role of low carbon technologies in achieving Kenya’s Paris
climate target. A study for the Malaysian power sector was conducted by
Haiges et al. (2017), which utilizes TIMES model to assess the long-term
power generation options considering climate change mitigation. Lee and
Huh (2017) propose a diffusion model to evaluate the impact of South
Korean renewable energy policies triggered by the Paris Agreement, on
the diffusion of renewable electricity. Overall, these studies indicate that
the Paris Agreement is achievable but entails various consequences such
as increasing costs and alterations in technology and energy mixes.
While mitigation efforts are vital, it is evident that adverse impacts of
climate change affect various sectors of social-economic systems already

CHAPTER 5 SEEKING FOR CLIMATE CHANGE MITIGATION AND ADAPTATION NEXUS
127
today, and these impacts may facilitate or hinder mitigation efforts of the
power sector (Cronin et al., 2018). The previously-mentioned studies pay
little attention to adverse climate change impacts, and yet they are
expected throughout the entire elements of the power system. On the
supply side, climate change impacts include changes in water availability
and seasonality of hydropower, alteration in wind speed frequency and
distribution, reduction in solar cell efficiency, a decline in generation cycle
efficiency and cooling water availability of thermal power plants, as well as
failure and reduction in the capacity of transmission and distribution lines.
On the demand side, climate change alters the balance of heating and
demand patterns (Schaeffer et al., 2012; Cronin et al., 2018; Audinet et al.,
2014). Neglecting these impacts can undermine efforts to decarbonize the
energy sector (Cronin et al., 2018).
Furthermore, the IPCC AR5 has recognized climate change impacts and
adaptation responses of the energy system as a research gap and urge
their integration into the assessment of climate stabilization path (Clarke
et al., 2014). This is crucial as climate change impacts could influence,
among others, the effectiveness of mitigation options. AR5 also highlights
the scarcity of publications regarding climate change impacts, adaptation,
and vulnerability from developing countries (Field et al., 2014).
This chapter aims to address this gap in the literature by conducting a
holistic analysis of a low-carbon pathway of the power sector, accounting
for the adverse climate change impacts. It integrates both climate change
mitigation goals and climate change impacts into modeling simulations of
the Java-Bali power system expansion in Indonesia. Indonesia, an
emerging developing economy with fast-rising electricity demand, embarks
on a low-carbon energy system by setting out a target to increase the
share of renewable energy by 23% in 2030 and 31% in 2050. This target is
in line with the country’s NDC to reduce 29% of CO2 emissions from the
business as usual scenario.

CHAPTER 5 SEEKING FOR CLIMATE CHANGE MITIGATION AND ADAPTATION NEXUS
128
LEAP is used for conducting simulations of the long-term expansion of
the Java-Bali power system. Prior to commencing the simulations, the
impacts of climate change on the electricity demand and supply were
quantified based on fieldwork in Indonesia, revealing the past
consequences of climate-related events (Chapter 4) and on the secondary
data of global climate change projections. The quantified effects, together
with the renewable energy targets, are then converted into constraints
within the LEAP optimization modeling architecture.
This chapter offers several contributions to the current literature and
practice. Firstly, to the best of our knowledge, this chapter is the first to
jointly consider climate change mitigation goals and climate change
impacts on various elements of the power sector into simulations of power
system expansion using LEAP. This chapter is novel in the sense that it
explicitly links the sectoral efforts to pursue the low-carbon pathway with
its adaptation to the adverse climate change impacts and fills an important
gap in the literature on the climate-resilient energy sector. Secondly, this
chapter adds to the scarce literature on climate change impacts,
adaptation, and vulnerability of developing countries and may serve as a
reference for policies facilitating a low-carbon and climate-resilient power
sector.
The remaining part of this chapter proceeds as follows. Section 5.2 lays
out the existing literature on modeling a power system expansion under
climate change and outlines knowledge gaps. Section 5.3 describes the
employed methodology, and Section 5.4 presents the results of the LEAP
modeling for each scenario. Section 5.5 discusses the significance of the
findings of the modeling work. Finally, Section 5.6 provides conclusions and
limitations of this chapter as well as recommendations for future work.
5.2. Modeling climate change impacts on the power sector
The recognition of the power sector vulnerabilities to the effects of the
changing climate is growing, as does the need to quantify these impacts,
usually with the help of models. Tobin et al. (2018) investigate the impacts

CHAPTER 5 SEEKING FOR CLIMATE CHANGE MITIGATION AND ADAPTATION NEXUS
129
of climate change on four electricity supply technologies (wind, solar PV,
hydro and thermal power supply) in 28 EU countries based on EURO-
CORDEX regional climate model projections. Other studies focus mainly
on the impacts on thermoelectric power plants. Cook et al. (2015) develop
a methodology for predicting thermal power plants' risks of violating
thermal pollution limits due to climate-induced drought and heatwave in
the Upper Mississippi River Basin and Texas. Furthermore, van Vliet et al.
(2012) analyze the impact of changes in temperature and water availability
under climate change on thermoelectric power plants in the U.S. and
Europe using a physically-based hydrological and water temperature
modeling framework in combination with an electricity production model.
Likewise, Zheng et al. (2016) investigate the vulnerability of the Chinese
thermoelectric power plants to water scarcity problems by performing a
high-resolution evaluation and projection of spatial vulnerability.
Collectively, these studies agree that the adverse effects of changes in
climate variables such as temperature and precipitation reduce the power
generation capacity of thermoelectric power plants.
Meanwhile, adverse impacts of gradual changes in climate variables on
wind and solar PV are found to be limited (Tobin et al., 2018; Jerez et al.,
2015; Pereira de Lucena et al., 2010). Moreover, Lucena et al. (2010) and
Pašičko et al. (2012) estimate an increase in wind power production under
the future climate in some parts of Brazil and Croatia, respectively.
Nonetheless, off-shore wind power plants may need to invest in adaptation
measures against sea-level rise (Lise and van der Laan, 2015).
Results with respect to climate change impacts on hydropower are mixed.
Anugrah et al. (2015) evaluate Bayang micro hydropower system in
Indonesia using WEAP-LEAP models and find that climate change will
reduce power production. Obahoundje et al. (2017) also employ WEAP to
explore the combined effect of land use and land cover change and climate
change on water availability for all demand sectors, including hydropower.
The study shows contradictory results regarding the power generation
between two climate change scenarios. Zhang et al. (2017) evaluate the
CHAPTER 5 SEEKING FOR CLIMATE CHANGE MITIGATION AND ADAPTATION NEXUS
130
vulnerability of hydropower of the Yangtze river basin to climate change
using WEAP and also find large fluctuations in the power generating
capacity. Namely, the supply increases under the high-temperature
scenario and decreases under the low-temperature scenario, thereby
increasing the vulnerability and uncertainties of hydropower supply
systems.
Compared to other energy sources, climate change impacts on
hydropower have been extensively incorporated into simulations of long-
term power system expansion. Such popularity is due to the hydropower
dominance in some countries, its long asset lifetime, and its apparent
dependence on climate (Cronin et al., 2018). The integration of climate
change impacts into simulations of a power system expansion allows
analyzing their associated impacts on the power system as a whole. To
mention a few studies: Lucena et al. (2010) for the Brazilian power sector,
Teotónio et al. (2017) for the Portuguese power system, Arango-Aramburo
et al. (2019) for the Colombian power sector, and Spalding-Fecher (2017)
for the Southern African Power Pool. Overall, these studies indicate a
decline in hydropower generation under climate change, although the
declining percentage is marginal is some countries while significant in
others. Consequently, extra capacity from other energy sources is
required to compensate for the lack of reliability of hydropower.
On the demand side, previous studies often indicate an increase in
electricity consumption under future climate change, such as in USA
(Baxter and Calandri, 1992; Sailor and Pavlova, 2003; Mansur et al., 2008),
the Southeast Mediterranean region (Cartalis et al., 2001) and Brazil (de
Lucena et al., 2010). A net increase in demand is also indicated in Austria
and German (Totschnig et al., 2017). In contrast, the total EU’s energy
demand is expected to decrease (Dowling, 2013). Similarly, a study for
Norway (Seljom et al., 2011) also suggests a net decrease in energy
demand.

CHAPTER 5 SEEKING FOR CLIMATE CHANGE MITIGATION AND ADAPTATION NEXUS
131
Several studies integrate climate change multiple impacts on energy
demand and various types of energy supply into the simulation of long-
term power system expansion, thereby allowing to trace their combined
effects on the system. Lucena et al. (2010) incorporate climate change
impacts on electricity demand, hydropower, and natural gas turbines into
the long-term expansion of the Brazilian power sector using MAED-
MESSAGE models. Seljom et al. (2011) employ MARKAL to include climate
change impacts to hydro and wind power as well as energy demand into
the analysis of future Norwegian energy system. Meanwhile, Dowling (2013)
analyzes the long-term European energy system considering climate
change impacts on energy demand and various types of power supply,
including thermoelectric, wind, solar PV, and hydroelectric by utilizing
POLES. A similar study for Europe was conducted by Mima and Criqui
(2015) with a smaller scope, covering only energy demand, thermal power
plants, and hydropower. Totschnig et al. (2017) employ HiREPS to
integrate impacts of climate change and fuel price shocks on energy
demand and various types of energy supply into simulations of the future
Austrian and German power sectors. Finally, Li et al. (2014) incorporate
effects of projected changes in temperature, precipitation, and extreme
events on electricity demand and various power supply types into the
power system expansion for several U.S. regions using a robust electric
power Generation Expansion Planning (GEP) optimization model. All these
studies agree that thermal power plants' reliability will decrease under
climate change. Meanwhile, climate change impacts on solar PV and wind
are estimated to be minor (Seljom et al., 2011; Dowling, 2013). Results for
Norway reveal lower system costs due to the net decrease in demand.
Furthermore, the country benefits from an increase in hydropower
production. Meanwhile, Brazil suffers from reduced hydropower reliability,
needing extra installed capacity, consequently requiring extra investment
costs.
Nevertheless, to the best our knowledge, research explicitly linking the
impacts of climate change with the sector’s climate mitigation goals is
CHAPTER 5 SEEKING FOR CLIMATE CHANGE MITIGATION AND ADAPTATION NEXUS
132
still lacking. Hence, the interferences of climate change impacts on the
power sector’s mitigation efforts for achieving national long-term climate
mitigation goals, remain unexplored. An integrated assessment of climate
change mitigation and adaptation for the power sector is especially vital
for developing countries, which already face adverse climate change
impacts and electrification needs on top of climate change mitigation goals.
Therefore, this chapter addresses this important gap by pursuing a
comprehensive assessment of the nexus between electrification, climate
change mitigation, and climate change adaptation in developing countries,
taking Indonesia as an example.
5.3. Methodology and data
This chapter simulates the future development of Indonesia’s power
sector, considering both climate change mitigation (low-carbon
electrification) and adaptation, focusing on the country’s primary power
system. Fig. 5.1 depicts the conceptual framework of this chapter.
To account for climate change mitigation, this chapter sets a long-term
scenario for the Java-Bali power system expansion taking into account
the country’s low-carbon development policy (Fig. 5.1, left flow).
Subsequently, LEAP is used to analyze the low-carbon pathway. For the
adaptation11 part, I take a 3-step approach (Fig. 5.1, right flow). Firstly, I
collect data on the current impacts of severe weather events and gradual
changes in climate variables on different power plants, transmission and
distribution networks by conducting semi-structured interviews and focus
group discussions between February-March 2018 (as reported in Chapter
4). Secondly, I perform a literature review on climate change scenarios to
identify the likely trends in temperature, precipitation, and sea surface
11Here, adaptation id defined as the variations in the power system configuration (e.g.,
installed, capacity, technology composition) due to the climate change-induced
reduction in power supply reliability and changes in the electricity demand

CHAPTER 5 SEEKING FOR CLIMATE CHANGE MITIGATION AND ADAPTATION NEXUS
133
temperature for the Indonesian archipelago. Finally, I identify the variables
and functions in the LEAP model architecture to parameterize the
projected impacts of climate change on the Java-Bali power system.
This chapter considers the impacts of climate change on both demand and
supply sides. On the demand side, this chapter estimates how changing
temperatures might affect electricity needs in Java-Bali. Meanwhile, on
the supply side, it quantifies climate change impacts on power generation,
focusing on four power plant types: CFPP, NGPP, HEPP, and solar
photovoltaic (solar PV). The first three are chosen because they
constitute most of Indonesia’s power generation capacity, i.e., 50%, 28%,
and 9%, respectively (KESDM, 2018c). This chapter also includes solar PV
because, as indicated in Chapter 2, it plays a significant role in Indonesia’s
transition to the low carbon energy system.
This chapter focuses on analyzing the impacts of gradual changes in
climate variables, including surface air temperature, precipitation, and sea
surface temperature on the power system. Although extreme weather
events often cause power failure, especially in distribution networks (see
Chapter 4), they are not included in this chapter. This will be an essential
topic for future research. WEAP is employed to analyze the impacts of
changes in precipitation and temperature on the water availability for
hydroelectric power plants. Meanwhile, this chapter relies on findings from
Chapter 4 and on the current literature to parameterize expected climate
change impacts on thermal power plants (TPPs) and solar PV.
Finally, I simulate the Java-Bali power system expansion taking into
account the national low-carbon policy targets and climate change
impacts on the power system. These simulations quantify electricity mix
and corresponding costs of a climate-resilient power system that assures
a nexus of electrification, climate change mitigation, and adaptation goals.
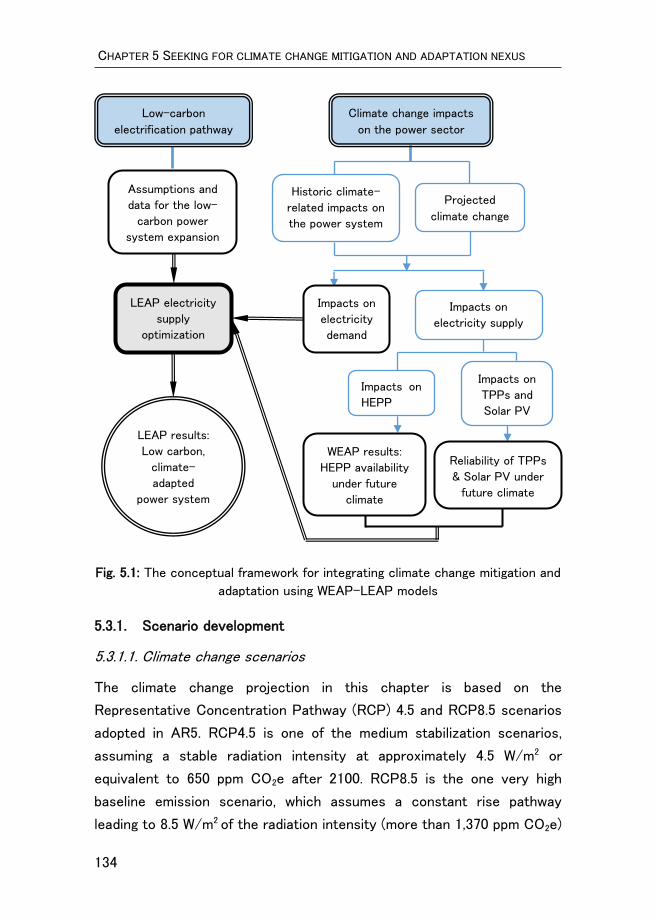
CHAPTER 5 SEEKING FOR CLIMATE CHANGE MITIGATION AND ADAPTATION NEXUS
134
Fig. 5.1: The conceptual framework for integrating climate change mitigation and
adaptation using WEAP-LEAP models
5.3.1. Scenario development
5.3.1.1. Climate change scenarios
The climate change projection in this chapter is based on the
Representative Concentration Pathway (RCP) 4.5 and RCP8.5 scenarios
adopted in AR5. RCP4.5 is one of the medium stabilization scenarios,
assuming a stable radiation intensity at approximately 4.5 W/m2 or
equivalent to 650 ppm CO2e after 2100. RCP8.5 is the one very high
baseline emission scenario, which assumes a constant rise pathway
leading to 8.5 W/m2 of the radiation intensity (more than 1,370 ppm CO2e)
Impacts on
electricity supply
Assumptions and
data for the low-
carbon power
system expansion
Low-carbon
electrification pathway
Climate change impacts
on the power sector
Impacts on
HEPP
WEAP results:
HEPP availability
under future
climate
Impacts on
TPPs and
Solar PV
Reliability of TPPs
& Solar PV under
future climate
Historic climate-
related impacts on
the power system
Projected
climate change
LEAP electricity
supply
optimization
LEAP results:
Low carbon,
climate-
adapted
power system
Impacts on
electricity
demand

CHAPTER 5 SEEKING FOR CLIMATE CHANGE MITIGATION AND ADAPTATION NEXUS
135
in 2100 (Zhang et al., 2017). Accordingly, this chapter uses climate change
projections for Indonesia under these scenarios. The projection of
temperature and precipitation (Table 5A.1 of Appendix 5.A) are based on
the ensemble values of 35 CIMP models available at the World Bank
Climate Knowledge Portal’s website (The World Bank Group, 2019), which
were derived from Harris et al. (2014). These data are available for two
periods within the study’s time horizon: 2020-2039 and 2040-2059.
Meanwhile, the projected sea surface temperature (SST) data comes from
a global climate model’s output of the Institut Pierre Simon Laplace, which
was retrieved from the International Pacific Research Center’s website12
(International Pacific Research Center, 2018). Based on these data, this
chapter quantifies the effects of the changes in these climate variables
on the electricity demand and on the key technical characteristics of
various power plants.
5.3.1.2. Power system expansion scenarios
I develop three scenarios of the Java-Bali power system’s expansion for
the period of 2018-2050:
1. Reference scenario (REF): the power system’s expansion scenario
without climate change considerations. Hence, the objective of this
scenario is to satisfy solely the growing future demand for electricity
in the Java-Bali islands at the lowest cost.
2. Climate change mitigation scenario (CCM): the power system’s
expansion assumes a shift to a low-carbon pathway following the NRE
targets stipulated in NEP, which is to increase the share of renewables
in the national energy mix up to 23% by 2025 and 31% by 2050. In
addition to these mitigation targets, this scenario accounts for
12The Asia-Pacific Data Research Center is a part of the International Pacific
Research Center at the University of Hawaiʻi at Mānoa, funded in part by the National
Oceanic and Atmospheric Administration (NOAA).

CHAPTER 5 SEEKING FOR CLIMATE CHANGE MITIGATION AND ADAPTATION NEXUS
136
electrification but neglects the sector’s adaptation to the changing
climate.
3. Climate change mitigation and adaptation scenarios (CCMA): the
power system’s expansion assumes a shift to a low-carbon pathway
and integrates the effects of projected climate change on the
electricity supply and demand. Following the climate change scenarios
discussed in Section 5.3.1.1, this chapter differentiates between two
CCMA scenarios:
a. CCMA RCP4.5: climate change impacts on power plants are
quantified based on the IPCC RCP4.5 scenario
b. CCMA RCP8.5: climate change impacts on power plants are
quantified based on the IPCC RCP8.5 scenario
Chapter 2 and Chapter 3 have explained the setup of the Java-Bali LEAP
model in detail. In addition to the methodological advances with the CCMA
scenario, this chapter updates the previous ones by including the most
recent historical data of energy demand and supply. Accordingly, the LEAP
base year is updated from 2015 to 2017. Furthermore, this chapter updates
the electricity demand projection by the most recent RUPTL 2018-2027
(PLN, 2018), which indicates a lower growth in electricity demand
compared to the previous projection. Likewise, the capital cost of electric
power technologies is now assumed to decrease every five years following
the percentage of technology cost reduction in the World Energy Outlook
(OECD/IEA, 2017).
5.3.2. Integrating adverse climate change impacts into LEAP
5.3.2.1. Demand-side
Projecting impact of higher temperatures on the electricity demand
By relying on the relationship between air temperature and electricity
demand analyzed in Chapter 4 (Fig. 4.3, Chapter 4), I carry out a first-
order estimate of the effects of projected higher temperatures on the
annual peak demand.

CHAPTER 5 SEEKING FOR CLIMATE CHANGE MITIGATION AND ADAPTATION NEXUS
137
Results show that the annual demand for electricity increases by 1.2% and
1.4% by 2020s under the CCMA RCP4.5 and CCMA RCP8.5 scenarios,
respectively, relative to REF. Furthermore, by the 2040s the electricity
demand increases by 2% and 2.8%, respectively.
5.3.2.2. Supply-side
As a bottom-up energy model, LEAP allows setting detailed
characteristics of energy technologies through its input data. Hence, it is
possible to alter the technical features of a power plant, integrating the
effects of the changing climate. This chapter quantifies these effects
based on the results of Chapter 4 and transforms them into changes in
the technical characteristics of power plants. The altered technical
features include the capacity factor and the efficiency of power plants,
which are expected to influence the technology mix and installed capacity,
as well as reflect the costs of the power system adapting to the changing
climate.
Projecting impacts of temperature and precipitation changes to HEPPs
This chapter employs WEAP to simulate future hydrology in the Citarum
river basin (Fig. 5B.1 of Appendix 5.B) based on projected changes in air
temperatures and precipitations. The Citarum river provides water for the
two largest HEPPs in Indonesia, i.e., Saguling and Cirata; each has the
installed capacity of 1,008 MW and 797 MW, respectively. As discussed in
Chapter 1, WEAP has a built-in link with LEAP, where the hydropower
availability modeled by WEAP becomes an input for LEAP. Hence, the use
of both software tools enables dynamic analyses of climate change
implications on hydropower production (Spalding-fecher, 2018). Table 5B.1
of Appendix 5.B lists WEAP input data for the HEPPs simulations.
Results show that under the CCMA RCP4.5 scenario, the average annual
capacity factor of both Saguling and Cirata HEPPs varies across years
when compared to REF (Fig. 5B.2 of Appendix 5.B). From 2022 to 2039,
both Saguling and Cirata produce slightly less electricity (<1%) compared
to REF. In contrast, their electricity production overshoots that of REF
CHAPTER 5 SEEKING FOR CLIMATE CHANGE MITIGATION AND ADAPTATION NEXUS
138
from 2040 onward. However, the aggregate HEPP production over the
study period is higher than that in REF. Meanwhile, no significant difference
found in the annual average capacity factor across the years between REF
and the RCP8.5 scenario. Nonetheless, the aggregate HEPP production in
RCP8.5 is slightly lower compared to REF. These results are extrapolated
to the rest of HEPPs when simulating the Java-Bali power system
expansion using the LEAP-WEAP combination.
Sea surface temperature and efficiency of coal-fired power plants
A cooling water system is an essential part of coal-fired power plants.
CFPPs in the Java-Bali power system rely on seawater for their cooling
systems, thereby will likely be impacted by higher seawater temperatures
expected in a climate-changed world. The CFPPs employ once-through
cooling systems, which take water from the sea and circulate it through
pipes in a condenser to absorb heat from the steam. The warmer water is
then discharged back to the sea. A higher cooling water temperature
results in a higher condenser pressure, which reduces the energy
efficiency of a condenser (Haldkar et al., 2013). In Chapter 4, I drew the
correlation between seawater temperature and condenser pressure of the
Paiton PJB CFPP, which is a typical CFPP using a once-through cooling
system (Fig. 4.4, Chapter 4). Here, this relationship is combined with the
data of the primary energy consumption of the power plant. According to
the power plant’s performance report, every 1ºC increase in cooling water
temperature above 25ºC, the power plant efficiency drops by 0.32%.
This chapter adopts this relationship to estimate the alteration of CFPP’s
efficiency following the changes in the sea surface temperature
anticipated with climate change. Results show that the reductions of the
efficiency of the Java-Bali CFPPs range from 0.1% to 0.4% under the
RCP4.5 scenario and from 0.03% to 0.3% in the RCP8.5 scenario. These
drops of efficiency are expected to increase fuel consumption, leading to
a rise in fuel costs and CO2 emissions.
CHAPTER 5 SEEKING FOR CLIMATE CHANGE MITIGATION AND ADAPTATION NEXUS
139
Precipitation and capacity factors of coal-fired power plants
The fieldwork reveals that heavy precipitation dampens coals in CFPPs’
open storage areas, thereby reducing the CFPPs’ burning efficiency. This
instance often occurs during the wet season when rainfall is intense and
frequent. Suralaya CFPP, the largest CFPP in Indonesia, provides the
operation disruption data from 2011 to 2017, which includes past
disruptions due to wet coals. Based on this data, the average annual
reduction of the CFPP’s capacity factor is calculated, following the
decrease in its energy generation attributable to wet coals.
Furthermore, this chapter combines the historical data of the CFPP
disruptions and local precipitation, with projected precipitation under
climate change scenarios to estimate reductions in the CFPP’s capacity
factor under future climate. Results indicate that the CFPP’s capacity
factor will reduce by 0.29% and 0.30%, respectively, by 2020 and 2040.
These estimates are adopted in LEAP simulations for the rest of Java-
Bali CFPPs.
Ambient air temperature and power output of natural gas power plants
There exist two types of technologies in NGPPs of the Java-Bali power
system: NGOC, which produces electricity solely from a gas combustion
turbine, and NGCC, which produces electricity from the gas combustion
turbine and generates extra electricity by routing the waste heat from the
gas turbine to the nearby steam turbine. High ambient air temperatures
affect gas turbines of NGPPs. The operation of the gas turbines requires
ambient air for the compressor intake and routed into the burning chamber.
The higher the ambient air temperature, the lower the air density and,
hence, the burning efficiency, which in turn reduces power outputs of the
gas turbines (Henry and Pratson, 2016). According to the field data from
the Muara Karang NGOC, every 1ºC increase in ambient air temperature
above 16ºC, the power output of the NGOC drops by 0.6%. Accordingly,
the power output of the Muara Karang NGOC correlates with air ambient
temperature following Eq. 5.1. This data is comparable with findings

CHAPTER 5 SEEKING FOR CLIMATE CHANGE MITIGATION AND ADAPTATION NEXUS
140
reported in the literature, which indicate that with each one-degree
temperature increase above 30ºC, the power output of gas turbines drops
by 0.50%–1.02% (Drbal et al., 1996; Kehlhofer et al., 2009; Asian
Development Bank, 2012).
Furthermore, the literature indicates that the overall net reduction of the
power output of an NGCC is within the range of 0.3% - 0.6%. Here, I assume
that every 1ºC increase in ambient air temperature, the power outputs of
NGCCs drop by 0.45%, which is the middle value of the range. Accordingly,
the power output of NGCCs correlates with air ambient temperature
following Eq. 5.2.
Thus, this chapter estimates the monthly energy output of NGOC and
NGCC under climate change scenarios based on projections of average
monthly temperature, using Eq. 5.1 and Eq. 5.2, respectively. Accordingly,
the annual capacity factor under climate change scenarios is calculated
using Eq. 5.3. Results show that reductions in the capacity factor of the
Java-Bali NGPPs in 2040 range from 0.8% to 4.3%.
𝑃(𝑇) = 𝑃 ∗ (−0.006𝑇 + 1.0933) Eq. 5.1
𝑃(𝑇) = 𝑃 ∗ (−0.0043𝑇 + 1.0662) Eq. 5.2
𝐶𝐹𝑇𝑚 = 𝐸𝑇𝑚
𝑃𝑙𝑎𝑛𝑡 𝑐𝑎𝑝𝑎𝑐𝑖𝑡𝑦 (𝑀𝑊) ∗ 8760 ℎ𝑜𝑢𝑟𝑠 Eq. 5.3
where 𝐸𝑇𝑚 is the annual energy output in MWh, 𝑇𝑚 is the average monthly
temperature, 𝑃(𝑇) is the power output at temperature 𝑇 in MW, and 𝐶𝐹𝑇𝑚
is the capacity factor.
Air temperatures and efficiency of Solar PV
A rise in air temperature may negatively impact the performance of solar
PVs. It manifests as a decrease in the solar PV efficiency determined by
the so-called temperature coefficient, which is a correction factor of
efficiency as a function of temperature (Simioni and Schaeffer, 2019). This
chapter adopts the estimate by Pašičko et al. (2012), where every 1ºC

CHAPTER 5 SEEKING FOR CLIMATE CHANGE MITIGATION AND ADAPTATION NEXUS
141
increase in air temperature decreases PV efficiency by 0.5% relative to
the referent value at 25ºC. This value is consistent with the average
temperature coefficient specified in Dubey et al. (2013). Based on this
assumption, this chapter estimates the reduction in the efficiency of the
Java-Bali solar PV following the climate-driven rise in temperature13.
Results indicate that the reduced efficiency under future air temperature
leads to a reduction in the solar PV capacity factor by 0.5% to 0.6% during
the 2020s and by 0.8% to 1.1% during the 2040s.
5.4. Climate change mitigation-adaptation synergies: LEAP
Results
The following sections discuss the output of the climate change
mitigation-adaptation integrated framework using WEAP and LEAP models
applied to the case of the Java-Bali power system. First, the capacity
added and electricity mix for each scenario are presented, followed by
discussions on their associated costs and CO2 emissions.
5.4.1. Installed capacity and electricity mix
5.4.1.1. Reference scenario
In the reference scenario, which assumes the least-cost electrification
without considering climate change mitigation and adaptation, the capacity
of fossil fuel technologies increases rapidly. The coal and natural gas
capacity reach 115 GW and 53 GW by 2050, respectively, hence increase
sixfold and fivefold compared to 2017. As a result, the capacity mix over
the study period locks into the fossil fuels’ regime (Fig 5.2a). Therefore,
in 2050, coal maintains its domination (Fig. 5.2b), comprising 72.4% of the
Java-Bali electricity mix, followed by natural gas (20.7%), hydro (3.8%), and
geothermal (3%).
13This study assumes that other parameters (e.g., wind speed, solar radiation) remain
unchanged

CHAPTER 5 SEEKING FOR CLIMATE CHANGE MITIGATION AND ADAPTATION NEXUS
142
(a)
(b)
Fig. 5.2: Capacity mix over the study period (a) and electricity
mix in 2050 (b) in the reference scenario
5.4.1.2. Climate change mitigation scenario
Results show that the implementation of NEP’s NRE policy (climate
change mitigation targets assumed in the CCM scenario) dramatically
alters the Java-Bali capacity mix. In 2050, the coal capacity in CCM
reduces by 41% compared to REF. The reduction in the coal capacity is
compensated by the increased capacity of natural gas (23%), hydro (7%),
and geothermal (27%) as well as by the penetration of solar (117.7 GW),
biomass (7.4 GW), and wind (1.6 GW). With this capacity mix, all of the
hydro, geothermal, and biomass potentials in Java-Bali islands (Table 5B.1
of Appendix 5.B) are utilized, leaving wind and solar as the only renewable
energy source still potentially available.
0
40
80
120
160
200
2020 2025 2030 2035 2040 2045 2050
Gig
awat
t
YearCoal Natural Gas Hydro Geothermal Biomass Wind Solar
3.0% 3.8%
20.7%
72.4%
2050: 982 TWh

CHAPTER 5 SEEKING FOR CLIMATE CHANGE MITIGATION AND ADAPTATION NEXUS
143
Accordingly, the Java-Bali electricity mix mimics the change in its
capacity mix. While fossil fuels serve most of the demand for electricity in
the base year, they gradually reduce their share in the Java-Bali electricity
mix. Complying with the NRE target, by 2025, renewables compose 23% of
the electricity mix, shared between geothermal (9.6%), hydro (5.6%),
biomass (6.5%), wind (1%), and solar (0.3%) (Fig. 5.3).
Furthermore, by 2050, the renewable share increases up to 31% as
targeted by NEP. Interestingly, the electricity production from solar
encompasses 17.4% of the total electricity mix, the highest among other
renewable owing to the relatively faster reduction in its investment costs.
Meanwhile, although nuclear is available as an option for meeting the NRE
targets, it is not competitive against solar and other renewables due to its
low technology-learning rate.
Fig. 5.3: The Java-Bali electricity mix in 2017, 2025, and 2050; climate change
mitigation scenario (CCM)
5.4.1.3. Climate change mitigation and adaptation scenarios
When impacts of global climate change are integrated on top of the climate
change mitigation and electrification assumptions, the results depict the
optimal choice of shifting the Java-Bali power system to a low-carbon
pathway while also responding to the effect of new climate conditions. The
results show that extra capacities are required to serve the climate-
induced electricity demand surge and to cope with the decreased power-
generating capacity (Fig. 5.4). Under CCMA RCP4.5, the extra capacity of
5%
4%
24%
67%
2017: 182 TWh 1%
6%
10%6%
21%56%
2025: 282 TWh
17.4% 0.4%
5.3%
3.9%
4.0%21.6%
47.4%
2050: 982 TWh

CHAPTER 5 SEEKING FOR CLIMATE CHANGE MITIGATION AND ADAPTATION NEXUS
144
solar PV, coal, wind, and biomass are 7.5%, 5.4%, 19.9%, and 0.7%,
respectively higher from that in CCM. In contrast, the natural gas capacity
reduces by 2.2% compared to CCM. Naturally, the capacity of solar PV,
coal, wind, and biomass increase to balance the growth in demand and to
compensate for the declined power-generating capacities.
(a)
(b)
Fig. 5.4: Extra capacity in CCMA RCP4.5 (a) and CCMA RCP8.5
(b). CCM is taken as a benchmark
Under CCMA RCP8.5, the extra installed capacity is even higher, which
indicates that the higher temperature scenario intensifies impacts on the
electricity demand and power supply (e.g., coal, natural gas, solar PV). The
extra capacity is now shared almost evenly between solar, coal, and wind
(Fig. 5.4b). The increased penetration of wind power indicates the trade-
off between climate change mitigation and adaptation. Firstly, wind
resource potential is still available to facilitate the power system meeting
the NRE targets while the addition of the coal capacity is constrained by
NRE targets. Secondly, the simulation excludes the impacts of climate
4.0
-1.6
- - 0.1 0.5
8.7
Coal Natural Gas Hydro Geothermal Biomass Wind Solar
Extra capacity (GW) in CCMA RCP4.5 relative to CCM
5.0
-2.4
- - 0.1
4.9 5.8
Coal Natural Gas Hydro Geothermal Biomass Wind Solar
Extra capacity (GW) in CCMA RCP8.5 relative to CCM

CHAPTER 5 SEEKING FOR CLIMATE CHANGE MITIGATION AND ADAPTATION NEXUS
145
change on wind power. Thus, under the higher temperature scenario
(CCMA RCP8.5), wind power replaces a portion of solar PV’s extra
capacity, making the extra capacity of solar PV lower than that in CCMA
RCP4.5. However, the role of solar PV is still significant in anticipating the
climate-induced surge demand, adding extra capacity above CCM by 5%.
Furthermore, the extra installed capacity to anticipate climate change
adds 299 TWh and 388 TWh of electrical energy, respectively, in CCMA
RCP4.5 and CCMA RCP8.5, over the period of 2020-2050. In CCMA
RCP4.5, the additional electrical energy mainly comes from coal and solar
PV (Fig. 5.5a). Meanwhile, although solar adds extra capacity in CCMA
RCP8.5 (Fig. 5.4b), its electricity generation is 6% lower than that in CCM
likely due to a reduction in its efficiency, which is compensated by a
significant increase in wind power production (Fig. 5.5b).
(a)
(b)
Fig. 5.5: Extra electricity production in CCMA RCP4.5 (a) and CCMA RCP8.5 (b). CCM is taken as a benchmark
356.4
-126.2 -0.6
-5.3
5.2 4.8
65.2
Coal Natural Gas Hydro Geothermal Biomass Wind Solar
Extra energy production (TWh): CCMA RCP4.5 relative to CCM
418.8
-132.8
-3.1 -5.3
7.4
172.5
-69.3 Coal Natural Gas Hydro Geothermal Biomass Wind Solar
Extra energy production (TWh): CCMA RCP8.5 relative to CCM

CHAPTER 5 SEEKING FOR CLIMATE CHANGE MITIGATION AND ADAPTATION NEXUS
146
5.4.2. O2 emissions and total costs
5.4.2.1. CO2 emissions
Indonesia’s NDC outlines the country’s target of reducing 29% of its
emission from business as usual (BAU) by 2030, where the energy sector
is targeted to contribute 11% of the national CO2 reduction target or 19%
reduction from its emission baseline. The simulation results reveal that
under the reference scenario, the Java-Bali power system emits 215
million tons of CO2 in 2030 (Fig. 5.6). This value is lower than that was
calculated in Chapter 3, mainly because of the lower electricity demand
growth assumed in the present chapter - following the latest RUPTL -
compared to Chapter 3. Meanwhile, under the CCM scenario, the CO2
emissions decrease to 188 million tons, which is 13% lower than that in
REF. Therefore, under the updated assumption, additional efforts beyond
implementing NEP’s NRE targets are required to achieve the NDC target
by 2030. By 2050, however, the CO2 emissions drop further, being 34%
lower than that in REF. Therefore, when the NRE target in 2050 is fulfilled,
Indonesia can reduce its emission further, moving beyond its current NDC.
Fig. 5.6: CO2 emissions under reference, mitigation, and adaption scenarios.
CCM is taken as a benchmark
0
20
40
60
80
100
120
140
160
180
200
2020 2025 2030 2035 2040 2045 2050
Mill
ion
to
n C
O2
e
CCM
CCMA RCP4.5
CCMA RCP8.5
REF

CHAPTER 5 SEEKING FOR CLIMATE CHANGE MITIGATION AND ADAPTATION NEXUS
147
The CO2 emissions increase in both CCMA scenarios, i.e., 20 and 25 million
ton CO2, respectively, in RCP4.5 and RCP8.5 (Fig. 5.6) compared to CCM.
The additional CO2 emissions are attributed to the increased electricity
production from coal to compensate for the climate-induced surged
electricity demand. Moreover, CFPPs efficiencies drop under future
climate, needing additional fuel coal consumption per unit energy
produced. However, even with this increase, the CO2 emissions still
decrease by 30% compared to REF in 2050.
5.4.2.2. Total costs
Total costs are calculated based on the net present value of the total
costs over the entire study period, which includes capital costs, operation,
and maintenance costs, and fuel costs. Under REF, the total costs of
electricity production over the simulation period 2018-2050 reach 70.4
billion USD, which is equal to 0.1% of the cumulative national GDP during
the study period14. This is lower than estimated in previous work (Chapter
3), partly owing to the lower electricity demand growth assumption in the
present research following the update in the latest RUPTL (PLN, 2018)
and due to the assumption of technology cost reduction, which is now
included in all scenarios.
Meanwhile, under the CCM scenario, the total costs of expanding the
Java-Bali power system over the period of 2018-2050 reach 75.1 billion
USD. Hence, shifting from the current regime to the low-carbon pathway
adds 4.7 billion USD extra or 6.8% higher costs compared to the no
mitigation-adaptation scenario (REF) (Fig. 5.7). Furthermore, when climate
change impacts are considered, the costs grow by 10.7% and 11.4% in
CCMA RCP4.5 and CCMA RCP8.5, respectively, relative to REF. This
implies that shifting to a low-carbon power system while coping with
climate change impacts increase the sector costs relative to the no
mitigation-adaptation scenario. Thus, the climate change mitigation-
adaptation costs for the Java-Bali power system are 2.7 and 3.2 billion
14Assuming annual GDP growth of 4.5%

CHAPTER 5 SEEKING FOR CLIMATE CHANGE MITIGATION AND ADAPTATION NEXUS
148
USD, respectively higher than the costs when only climate change
mitigation is considered (compare CCMA RCP4.5 and CCMA RCP8.5 with
CCM in Fig. 5.7). These costs are high: they constitute more than half of
the budget allocated by the Indonesian Government for climate change
mitigation and adaptation for all sectors in 2017. These additional costs
are due to the extra installed capacity and energy production of coal, solar
PV, and wind power required to cope with the adverse impacts of future
climate.
Fig. 5.7: Total production costs under reference, mitigation, and adaption
scenarios. CCM is taken as a benchmark.
5.5. Discussion
The integration of climate change mitigation and adaptation objectives into
the simulations of the Java-Bali power system expansion reveals the
following findings. First, the Java-Bali technology composition is
significantly altered, driven by the constraints set in LEAP, i.e., the
minimum amount of renewable energy share and the adverse climate
change impacts. Second, the Java-Bali installed capacity increases to
balance the climate-induced increase in electricity demand and to
compensate for a loss of reliability of the Java-Bali power generation due
to new climate conditions. Finally, while CO2 emissions drop due to the
-6,000
-4,000
-2,000
0
2,000
4,000
2020 2025 2030 2035 2040 2045 2050Co
st o
f p
rod
uct
ion
(2
01
7 m
illio
n U
SD)
Year
CCM
CCMA RCP4.5
CCMA RCP8.5
REF
CHAPTER 5 SEEKING FOR CLIMATE CHANGE MITIGATION AND ADAPTATION NEXUS
149
mitigation efforts, the total costs of the electricity production increase by
11.4% in 2050 attributed to the mitigation and adaptation measures.
The NEP’s NRE targets force the power system to shift to a low-carbon
pathway, resulting in a 34% CO2 emission reductions by 2050. The main
driver of this transition is solar PV owing to its vast remaining exploitable
potential, whereas the exploitable potential of other renewables such as
hydro and geothermal is limited. Likewise, solar PV also plays a significant
role in compensating for the reduction in capacity and energy generation
under adverse climate change impacts, especially under CCMA RCP4.5.
However, under the higher temperature changed scenario (CCMA RCP8.5),
solar PV reduces its reliability, which is compensated by wind power.
Meanwhile, coal plays a significant role in satisfying the climate-induced
increase in electricity demand and compensating for the declined power-
generating capacity in both CCMA scenarios, resulting in an increase of
CO2 emissions compared to CCM. These findings clearly show the
interplay between climate change mitigation-adaptation objectives and
suggest that climate change impacts might hinder climate change
mitigation efforts of the power system, which agrees with the hypothesis
in the literature (Fisher-Vanden et al., 2013; Turner et al., 2017; Cronin et
al., 2018).
Given that climate change impacts are unavoidable due to the past emitted
CO2 and the delayed mitigation actions, these findings suggest several
courses of action for policymakers. First, a key policy priority should be to
recognize the power sector’s vulnerability to climate change, prepare for
its adaptation action plans, and further integrate the plans into the national
adaptation strategies. Secondly, there is a defined need for ensuring a
sufficient budget allocation for the power sector’s adaptation to climate
change. Since the power sector adaptation to climate change hinders the
CO2 mitigation efforts, a nexus between mitigation and adaptation energy
policy should be exploited in national budget allocation. Finally, more
considerable efforts are needed for conducting detailed investigations of
climate change impacts on individual power plants, including a full analysis

CHAPTER 5 SEEKING FOR CLIMATE CHANGE MITIGATION AND ADAPTATION NEXUS
150
of the cost and benefit of their adaptation. The latter may include local
investments in preventing reductions in capacity factor and efficiency at
individual vulnerable power plants.
5.6. Conclusions
The main goal of this chapter is to integrate both climate change mitigation
and adaptation objectives into the long-term capacity expansion of a
power system. This chapter takes Indonesia as an example of a developing
country struggling to meet its electrification needs, focusing further on its
primary power system, i.e., Java-Bali. Four scenarios for the Java-Bali
power system expansion from 2018 through to 2050 are analyzed, including
a reference scenario, a climate change mitigation scenario, and two
scenarios that integrate climate change mitigation and adaptation. For
climate change mitigation, this chapter considers the renewable energy
target of the Indonesian government that aims to increase the share of
new and renewable energy by 23% in 2025 and 31% in 2050.
Meanwhile, this chapter quantifies climate change impacts on power supply
and demand by employing various methods. The WEAP model is used when
quantifying climate change impact on hydropower availability, and combine
empirical data from the fieldwork with findings from the literature when
assessing climate change impacts on thermal power plants and on the
electricity demand. The estimated impacts include the changes in HEPP’s
capacity factor, a reduction in CFPP’s efficiency and capacity factor, a
reduction in NGPP’s capacity factor, a reduction in solar PV capacity
factor, and an increase in electricity demand. Furthermore, this study
integrates these quantified impacts into the Java-Bali power system
expansion using LEAP. The simulation results are discussed in terms of
installed capacity, electricity mix, costs, and CO2 emissions.
This chapter provides an insight into economically optimal options for the
electricity generation in the Java-Bali power system under a set of climate
change mitigation-adaptation regimes. It includes impacts on the demand
as well as on the supply sides. Although this chapter does not cover

CHAPTER 5 SEEKING FOR CLIMATE CHANGE MITIGATION AND ADAPTATION NEXUS
151
climate change impacts for all types of power plants, results indicate
significant deviations from the reference scenario in terms of installed
capacity, electricity generation, and the total costs of electricity
production, attributable to climate change mitigation and adaptation.
Furthermore, even though this chapter excludes the impacts of extreme
weather events, the costs of power system adaptation to gradual changes
in climate variables such as temperature and precipitation are comparable
with the costs of climate change mitigation.
The methodological approach of this chapter could be replicated in other
cases that aim at analyzing the interplay between climate change
mitigation and adaptation in the power sector. This chapter, however, has
several limitations, mainly regarding the assessment of climate change
impacts on power generation. Firstly, the projection of climate change
impacts on the Indonesian power sector is preliminary, driven by the
estimates found in the literature rather than a case-specific downscaled
climate change scenario. Yet, this secondary data provides the basis for
an initial evaluation regarding climate change impacts on the power sector.
Furthermore, this chapter generalizes the effects of climate change on
CFPPs and HEPPs based on the fieldwork data from several power plants.
Future work may focus on collecting detailed data on individual power
plants to assess site-specific costs of climate change and possible
adaptation solutions.
Secondly, the modeling approach in this chapter does not include impacts
of extreme weather events, whereas they may intensify under future
climate change and lead to physical infrastructure damage, energy losses,
and indirect effects such as business interruption. This would be a fruitful
area for further work. Thirdly, due to data limitations and the scope of
LEAP, climate change impacts on transmission and distribution are
excluded from this assessment. Further research may explore the
quantification of climate change impact on the entire segments of the
power sector: generation, transmission, and distribution. Finally, the
analysis in this chapter relies on global climate change projection for which

CHAPTER 5 SEEKING FOR CLIMATE CHANGE MITIGATION AND ADAPTATION NEXUS
152
there is a great deal of uncertainty. Therefore, the modeling of climate
change impacts on electricity supply and demand inherits the uncertainty
of the chosen climate change scenarios.
Despite its limitations, this chapter provides a methodological framework
for an integrated analysis of climate change mitigation and adaptation in
the power sector, which allows an assessment of the nexus between
climate change mitigation and adaptation that crucial for developing
optimal mitigation and adaptation strategy. This framework can be
extended to account for other climate change impacts such as extreme
weather events, impacts of gradual changes in climate variables on
transmission and distribution networks, and impacts on other types of
electric power technology such as wind power, geothermal, nuclear, and
storage technologies.


CHAPTER 6 SYNTHESIS OF THE DISSERTATION
155
6.1. Introduction
The global power sector faces a triple challenge: to satisfy fast-rising
electricity demands, to meet the sector’s CO2 reduction targets, and to
cope with the adverse impacts of climate change. These challenges require
the power sector’s transformation to low-carbon and climate-resilient
systems. Moreover, financial institutions and credit rating agencies have
included climate change risks into their assessment criteria, calling for the
enhancement of the electric industry’s resilience to climate change
(International Finance Corporation, 2012; Connell et al., 2018; Mufson,
2019). Accordingly, international standards are emerging to assist electric
utilities in examining climate change impacts and developing adaptation
strategies. For example, the World Bank produced a guideline for climate-
resilient hydropower (World Bank, 2017), while the International
Organization for Standardization recently established ISO 14090:
Adaptation to climate change — principles, requirements, and guidelines
(Naden, 2019)
A practical barrier to the low-carbon and climate-resilient transformation
is the fact that expanding the power system, even without climate change
consideration, involves enormous investment costs (Bhattacharyya, 2011;
Nicolas et al., 2019). Furthermore, while technological change is required
to facilitate this transformation (Nakicenovic et al., 2000; Berglund and
Söderholm, 2006; IPCC, 2007; Wilson and Grubler, 2011), it needs to be
supported by institutions and economic incentives (Pachauri et al., 2014).
Meanwhile, the scientific challenge concerning this societal problem lies in
developing a method for an integrated analysis of electrification, climate
change mitigation, and climate change adaptation in the power sector.
Likewise, modeling technological change to support low-carbon transition
remains a challenge for energy modelers (Grübler et al., 1999; Frei et al.,
2003; Berglund and Söderholm, 2006).
Thus, the goal of this doctoral research was to contribute to addressing
the above scientific challenges by assessing the triple nexus of
CHAPTER 6 SYNTHESIS OF THE DISSERTATION
156
electrification, climate change mitigation, and climate change adaptation in
the power sector. I have addressed four core research questions based
on the Java-Bali power system in Indonesia by employing energy and
water sectors simulation modeling using LEAP and WEAP, respectively,
and by conducting extensive fieldwork. The fieldwork involved in-depth,
semi-structured interviews and focus group discussions with
representatives of electric utilities within the Java-Bali power system.
Furthermore, I have conducted this doctoral research project in four
stages, as discussed in greater detail in Chapter 2 through Chapter 5.
This chapter proceeds as follows: Section 6.2 summarizes the findings
from each study, followed by the highlights of the innovative contributions
of this dissertation (Section 6.3). Section 6.4 provides the policy
implications of this doctoral research, while Section 6.5 reflects on the
limitations of this dissertation and highlights the agenda for future
research that aims at modeling power system expansion under the climate
change regime.
6.2. Summary of the findings
RQ1: How could the power sector align electrification and the Paris
Agreement goals?
To address RQ1, I conducted modeling simulations of the Java-Bali power
system expansion, as reported in Chapter 2. To decide on a suitable model
for performing simulations, a systematic screening of 48 energy models
was performed. The screening resulted in the LEAP energy model being
chosen for a number of reasons. Firstly, it can accommodate the detailed
characteristics of electric power technologies. Secondly, its free access
for developing countries increases the chances of reproducing the
outcomes of this work and further development of methods beyond the
scope of this dissertation. Lastly, its extensive use makes results
comparable across countries.

CHAPTER 6 SYNTHESIS OF THE DISSERTATION
157
Furthermore, I carried out a validation of the Indonesian LEAP model to
test the accuracy of the LEAP analysis, comparing the LEAP simulation
results for power system expansion from 2006 through to 2015 with the
historical data. The results of this validation check conclude that LEAP
predicted the expansion of the Java-Bali system from 2006 through to
2015 with an accuracy of 88.2%-100%. Relying on these results, I
proceeded further by conducting simulations of the Java-Bali power
system expansion from 2016 through 2030.
Three scenarios of the Java-Bali power system’s responses to the Paris
Agreement were simulated. These scenarios defined the power sector’s
CO2 emission reduction target stipulated in Indonesia’s NDC document as
a constraint in the simulation. Hence, the future power generation needs
to comply with the Paris Agreement while satisfying the national
electrification objective.
The results revealed that in the context of the Java-Bali power system,
electrification and Paris climate goals could be achieved solely through: (i)
fuel switching from coal to natural gas or (ii) escalating renewable energy
deployment. However, the economically optimal strategy was achieved due
to the combination of an increase in natural gas power generation and in
renewable capacities. This strategy led to a reduction of 65 million tons of
CO2, thereby meeting the NDC target at 18% and 12% lower costs than
merely switching to natural gas or renewable energy, respectively.
The chapter concluded that the Paris Agreement could enforce the power
system’s transition from a fossil-fuel-based power generation to a low-
carbon power system in Java-Bali, thereby lowering CO2 emissions.
However, this transition imposes higher total costs of the power system
expansion compared to BAU, which should be considered in the national
budget plan, as the Indonesian power sector is still highly subsidized.

CHAPTER 6 SYNTHESIS OF THE DISSERTATION
158
RQ2: How could technological change affect the deployment of renewable
energy?
To answer this research question, I incorporated the one-factor learning
model into the LEAP cost function, which allowed a quantification of the
endogenous technology cost reduction as a function of the accumulation
of installed capacity of electric power technologies. With this modification,
I have simulated the Java-Bali power system expansion from 2016 through
2050, taking into account the NRE targets.
Chapter 3 has elaborated the methodological framework to explore the
cost-reducing effect of technological learning using LEAP and then,
thereafter, discussed the findings. The learning rate of various electric
power technologies, including fossil fuels and renewables, were taken into
account in the simulations. Based on the WEO model assumption of capital
costs reduction of electric power technologies (OECD/IEA, 2017), the
chapter has parameterized four phases of technological learning in LEAP.
The high speed of learning occurred during the initial phase, while its pace
reduced gradually throughout the other three phases.
The study has shown that in the absence of technological learning, nuclear
power is more cost-effective at meeting the NRE targets than solar PV
and wind power. However, empirical data has proven that the costs of
renewables decrease over time, while the costs of nuclear tend to increase
(Rubin et al., 2015). Accordingly, when ETL was included in the LEAP
simulations, renewables became competitive against nuclear. By 2050,
solar PV will lead other renewables in assuring the achievement of NRE
targets. As a result, the costs for achieving the NRE targets are 4% and
10% lower under the scenario of the medium and high pace of technological
learning, respectively, compared to no technological learning scenarios.
Furthermore, the achievement of NRE provides a co-benefit in terms of
reducing emissions, assuring the fulfillment of the power sector’s NDC
target.
CHAPTER 6 SYNTHESIS OF THE DISSERTATION
159
Overall, the chapter has concluded that endogenous technological learning
accelerated the penetration of renewable energy in the Java-Bali power
system and lowered the costs of achieving the NRE targets.
RQ3: How do severe weather and gradual changes in climate variables
affect the power system? What are current adaptation practices?
Chapter 4 moved the focus of this dissertation to climate change
adaptation. The research question of this chapter sought empirical
evidence that could explain how and to what extent weather and climate
have implications for the power sector. Data were collected through
extensive fieldwork that was carried out in Indonesia between February
and March of 2018. First, I designed questionnaires that were structured
differently for each target group. After which, I conducted semi-structured
interviews and focus group discussions involving the representatives of
three electric utility companies. The latter was comprised of three head
offices, ten power generation plants, a load control center (grid operator),
two transmission offices, and two distribution offices, thus covered the
entire chain of the electricity supply. The ten power plants are the major
ones in the Java-Bali power system, accounting for 35% of the Java-Bali
power generation capacity. Moreover, this chapter covered the entire
Java-Bali T&D networks.
The results of this investigation revealed that severe weather and gradual
changes in climate variables have implications for power generation,
transmission, and the distribution of electricity. However, in terms of
frequency of disruption event, distribution networks are affected most by
severe weather events. Weather-related power cuts commonly occur due
to failures in distribution networks. Meanwhile, the Java-Bali power
generations recorded several forced outages due to extreme weather- and
climate-related events, such as flood and jellyfish inflow into the cooling
water system. For transmission networks, lightning strikes have become
the leading cause of their failures.
CHAPTER 6 SYNTHESIS OF THE DISSERTATION
160
Furthermore, Chapter 4 provided empirical evidence regarding the
correlation between climate variables, such as air temperature,
precipitation, and sea surface temperature, with the performances of the
power plants. The evidence suggests that higher temperatures reduce the
reliability of thermal power plants. Meanwhile, changes in precipitation
patterns affect the operations of hydroelectric power plants, which in turn
affect the operational pattern of the Java-Bali power system as a whole.
Another interesting finding was that weather- and climate-related
disruptions caused financial losses for utility companies due to damaged
equipment and energy-not-supplied. Subsequently, utilities have taken
ex-post adaptation responses, which include managerial and technological
interventions.
To summarize, these findings suggested that the Java-Bali power system
is vulnerable to severe weather and gradual changes in climate variables.
Therefore, future climate change is expected to increase the vulnerability
of the power system, demanding that the system improve its resilience to
climate change.
RQ4: How can one integrate climate change impacts into the power
system expansion modeling? How might this affect electrification and
climate change mitigation goals?
To answer this set of research questions, Chapter 5 brought together
climate change mitigation and climate change adaptation within an
integrated framework. Within this framework, the chapter has incorporated
the anticipated climate change impacts into simulations of a low-carbon
power system expansion from 2018 through 2050. Climate change impacts
were quantified based on the empirical data from the fieldwork and then
supplemented by the secondary data from the literature; for example, the
global climate change projections downscaled for Indonesia. Furthermore,
the WEAP software tool was used to simulate water availability for
hydropower under the future climate. Meanwhile, quantifications of climate

CHAPTER 6 SYNTHESIS OF THE DISSERTATION
161
change impacts on coal and natural gas were based on empirical evidence
from case study power plants and findings from the literature.
Thus, the research has shown that future climate change could have
implications on electricity supply and demand. On the supply side, climate
change reduced power-generating capacity while on the demand side, it
increased the demand for electricity. Given these constraints as well as
the requirement to achieve the NRE and CO2 mitigation targets, the results
of modeling simulations showed an alteration in technology composition
compared to the electrification-only scenario.
Furthermore, extra capacities were required to compensate for the climate
change-induced reduction in power-generating capacity and the increased
demand in the above 2℃ warmer world. Consequently, the total costs of
power system expansion increased by 11.4% compared to no mitigation-
adaptation scenario. Moreover, in the mitigation-adaptation scenario, CO2
emissions in 2050 increased by 4% compared to the scenario that only
considered the mitigation and electrification objectives.
The simulation results indicated that future climate changes would
increase electricity demand and reduce the reliability of the power
generation. These changes will cause an increase in CO2 emissions and
costs, indicating that climate change impacts on the power system might
hinder the electrification and climate change mitigation goals if no climate
change adaptation policy is developed for the sector.
6.3. Innovative contributions to science
This doctoral dissertation has provided insights into the interplay between
electrification, climate change mitigation, and climate change impacts and
adaptations. Accordingly, this dissertation makes several innovative
scientific contributions to the literature on climate change mitigation-
adaptation in the energy sector.
Electrification and Paris climate goals: Firstly, to the best of the author’s
knowledge, the study discussed in Chapter 2 was the first to assess the
CHAPTER 6 SYNTHESIS OF THE DISSERTATION
162
trade-offs between electrification and the Paris climate goals in the
context of the Indonesian power sector using a technology-rich energy
system model. Furthermore, the modeling simulations in this dissertation
employed a high-quality dataset of the 67 power generation units in the
Java-Bali power system, which included technical parameters crucial for
LEAP input data. Hence, it enabled more accurate results for the
Indonesian context than relying on the default values provided by the
LEAP technology database. As reported in Chapter 2, the research results
showed an agreement with other studies, assessing the implications of the
Paris Agreement on the power sector (Grande-Acosta and Islas-
Samperio, 2017; Baek et al., 2019; Kumar and Madlener, 2018) and in
particular, those concerning an increase in the investment costs of the
power system expansion, as well as in the penetration of renewable energy
technologies.
Power system expansion and endogenous technological learning:
Secondly, Chapter 3 demonstrated how ETL could influence renewable
energy deployment in Java-Bali. Although LEAP has been used worldwide,
to the best of the author’s knowledge, this chapter was the first to
integrate ETL into LEAP and applied it to simulations of a power system
expansion. Therefore, this chapter adds to the understanding regarding the
role of technological learning in driving the transition from a fossil-fuel-
based power generation to a lower-carbon power system in the context
of developing countries. Similar results regarding the role of ETL in energy
transition are indicated in other studies, although with different contexts,
such as Heuberger et al., which incorporate ETL into the ESO-XEL model
for analyzing the UK’s power system and Liu et al., which integrate ETL
into TIMES for assessing the Tianjin power sector in China.
Empirical evidence of the impacts of weather and climate on the power
sector: Thirdly, Chapter 4 has been one of the first attempts to thoroughly
examine the historical impacts of weather and climate on the power
sector. Hence, this chapter provides new data that adds to our
understanding concerning weather and climate impacts on the sector,

CHAPTER 6 SYNTHESIS OF THE DISSERTATION
163
including direct damage costs suffered by utilities and their adaptation
responses. Moreover, given the absence of vulnerability analysis of the
Indonesian power sector to climate change, this chapter offers valuable
insights into this important subject. Compared with few empirical studies
on this subject (Audinet et al., 2014; Syariman and Heru, 2011), new
findings have emerged, such as extreme weather events that caused
jellyfish inflow and waste increase, which adversely affected the cooling
water system of thermal power plants.
Integrated analysis of the power sector expansion under climate change
mitigation and adaptation: Fourthly, Chapter 5 has explicitly linked the
power system’s climate change mitigation efforts with the interferences
brought by climate change impacts to the power sector. Thus, this chapter
contributes to filling the gap in the literature on the integrated analysis of
climate change impact and adaptation in the energy sector, as highlighted
by the IPCC AR5 (Clarke et al., 2014).
Assessment of climate change mitigation and adaptation of the energy
sector on the global South: Finally, this dissertation takes Indonesia as a
case study. In doing so, it adds to the scarce literature in developing
countries regarding (i) the implications of the Paris Agreement on the
power sector, and (ii) climate change impacts, adaptation, and vulnerability.
In addition, this dissertation creates two methodological innovations by
advancing the LEAP model application:
Firstly, Chapter 3 extended the current practice of LEAP by incorporating
the ETL of electric power technologies into the LEAP cost function. The
modeling approach was reported in detail, thereby allowing its replication
and application to other cases. Secondly, Chapter 5 advanced the LEAP
model practice by incorporating climate-driven changes in technological
characteristics (i.e., efficiency and capacity factor) of various power
generation types. Thus, providing LEAP modeling framework for an
integrated analysis of climate change mitigation and adaptation.

CHAPTER 6 SYNTHESIS OF THE DISSERTATION
164
6.4. Policy implications
This doctoral research focused on one critical contemporary societal
problem: electrification and climate change. The findings of this
dissertation can be used to develop targeted interventions aimed at
balancing electrification goals with climate change mitigation and
adaptation goals. This is particularly important for the global South, where
electrification is a precondition for the development and achievement of
most social and economic UN SDGs. Accordingly, this dissertation
suggests several courses of action for the Indonesian power sector:
Early deployment of renewable energy: Indonesia’s NDC mitigation target
is aligned with the national policy to increase the share of renewable
energy in the national energy mix. The results in Chapter 3 have shown
that the costs of renewables decrease following the increase in their
installed capacity, with technological learning occurring at the highest
speed during the initial phase of technology deployment. These findings
suggest that the deployment of currently unexploited renewable energy
should start as early as possible to gain the benefits of technological
learning and to avoid further technological lock-ins of the newly installed
infrastructure into fossil-fuel-based electricity production. Furthermore,
this will help to avoid excessive investments in coal-fired power plants,
which could result in stranded coal power plant assets in the future.
Enabling faster local learning: Developing countries like Indonesia generally
receive technology transfers from industrialized countries, allowing
Indonesia to take advantage of global technological learning that has
already taken place. Additionally, local learning processes also play a
significant role in reducing the costs of renewables. Therefore, the
conditions that facilitate faster local learning should be made available.
Such a condition includes a stable regulatory framework, an adequate
skilled workforce, and the establishment of a sustainable business model
(Huenteler et al., 2016). Infrastructure improvements that enable remote
areas to become more accessible would also create a faster diffusion of

CHAPTER 6 SYNTHESIS OF THE DISSERTATION
165
renewable energy technologies. Most importantly, it is critical that there
should be interactions between all involved parties, including users,
suppliers, competitors, universities, and regulators for the learning and
innovation process to occur (Lundvall, 2016).
Improvements in the grid capacity: Integration of vast renewable energy
capacities presents new challenges to any power system operations and
planning. Variable energy resources, such as wind and solar, have
intermittent characteristics that will likely change the way electricity is
dispatched and transmitted by the grid operator. Therefore, the
acceleration of renewable energy deployment should go hand-in-hand with
the improvement of grid capacity, which includes technical and human
capital capacities. Furthermore, other disruptive technologies, such as the
internet of energy, energy storage, and electric vehicles, require the global
utility sector to transform into a smarter grid.
Moving toward a low-carbon and climate-resilient power sector: Chapter
4 has shown that severe weather and changes in climate variables have
caused widespread power outages, resulting in tremendous financial losses
for utilities and have affected the economy as a whole. Given the vital role
of the sector in meeting the electrification and climate change mitigation
goals, it is crucial for the country to improve the sector’s resilience to
climate change.
The first step toward a low-carbon and climate-resilient power sector
would be to acknowledge the vulnerability of the sector to climate change
and to integrate the sector’s climate change adaptation plans into the
national action plans for climate change adaptation. The critical question
here is to determine whether it is enough to scale up the existing
adaptation responses or if a transformational action is required to assure
a climate-resilient development path. Synergies between climate
mitigation goals –the massive introduction of renewables into the existing
fossil fuel dominated energy mix– and climate adaptation efforts should be
explored to increase the climate resilience of the sector.

CHAPTER 6 SYNTHESIS OF THE DISSERTATION
166
Moreover, this dissertation has shown that the sector’s adaptation to
climate change has been reactive following weather and climate-related
damages and losses. Ex-post adaptation focused on the extent and
probability of past adverse events faces limitations in the climate-changed
world. The expected increase in severity and probability of hazard events
in a future climate calls for ex-ante strategies, especially when an
expansion of the power system is considered. The future sector’s
resilience is co-developed today, requesting the integration of climate
change projections, assessment of physical and economic impacts, and
possible incremental or transformational adaptation responses (Kates et
al., 2012) into the sector’s long-term development plan.
Finally, given the adverse impact of climate change on the power sector,
it is crucial for electric power utilities to include climate change adaptation
into their long-term business strategies and capacity building. Increasing
awareness of the power sector’s stakeholders regarding climate change
consequences for the sustainability of their business operations is an
essential milestone.
Ensuring budget allocations for climate change mitigation and adaptation:
In the context of Indonesia, achieving a 100% electrification ratio is a vital
national development goal that affects human capital and other essential
social and economic objectives. Therefore, electricity should be not only
reliable but also affordable so that every citizen, including the poor, can
enjoy electricity. To date, the government controls the electricity tariff
and allocates subsidy for low-income households through the state
electricity company. This subsidy is used to cover the difference between
costs and the subsidized tariff for low-income households.
As discussed in Chapter 2 and Chapter 5, achieving the power sector’s
target under the Paris Agreement would add to the costs of electrification.
Given that climate change is already affecting the power sector today due
to past-emitted CO2 and delayed mitigation actions, adaptation to climate
change is unavoidable. Therefore, it is critical for the power sector to

CHAPTER 6 SYNTHESIS OF THE DISSERTATION
167
increase its resilience to climate change; for example, by taking ex-ante
adaptation measures, such as investing in technology that is less
vulnerable to climate change and upgrading electricity infrastructure. This
would entail supplementary costs in addition to mitigation costs. Naturally,
these additional costs could affect the electricity price and the size of the
government subsidy. However, if climate change impacts and adaptations
are considered at the early stages of electricity system expansion, it
affects the choice of technology in the projected energy mix. This
indicates that anticipatory climate change adaptation can bring co-
benefits.
6.5. Limitations and the agenda for future research
While this dissertation makes a number of innovative contributions, it also
opens doors for further research. Firstly, due to the scope of LEAP and
data limitations, the power system expansion neglected constraints in the
T&D networks, assuming that electricity can be transmitted at any time
to any load station. Moreover, since the simulations in this doctoral
research were carried out with an annual time-step over a long-term time
horizon, hourly demand variations could not be accommodated due to
computational feasibility. In this dissertation, the Java-Bali’s load
characteristics were divided into 48 time-slices, which represent four
variations for each month (weekday, weekend, day, and night). Hence, the
variations in demand were represented by a segmented load duration
curve, making the temporal dynamic, such as continuous (hourly)
variations in demand and intermittency and variability in supply, were
ignored. Further modeling works will have to cover transmission capacity
and spatial analysis of each power plant and substation, as well as include
data on temporal characteristics of electricity demand and intermittency
of renewable energy supply.
Secondly, with respect to ETL, this dissertation has taken into account
the one-factor learning model, which relates technology costs with its
cumulative capacity or production. An interesting extension could be to

CHAPTER 6 SYNTHESIS OF THE DISSERTATION
168
consider other factors, such as cumulative expenditure for research and
development in the ETL simulations.
Thirdly, the quantifications of climate change impacts on the power system
in this dissertation were preliminary, relying on the empirical data from
several power plants and findings found in the literature. Further research
may proceed with a systematic data collection to enable detailed
estimations based on individual power plants, thereby enabling evaluating
the site-specific impacts of climate change. Comparison of the empirical
facts across power plants based on the same technology and across
countries will allow for generalizations and estimation of probabilities and
damage curves caused by the changing climate.
Finally, the integrated mitigation-adaptation modeling approach in this
dissertation omitted the impacts of extreme weather events due to
existing tools having a limited ability to capture extreme events (Cronin et
al., 2018). While my fieldwork delivered data on both extreme events and
gradual changes in climate variables, only the latter –i.e., increased air and
seawater temperatures and changes in precipitation– were considered in
the modeling part. Nonetheless, extreme events are expected to intensify
under future climate change and will lead to physical infrastructure
damages, energy losses, and indirect effects, such as business
interruptions. Therefore, an important direction of future research would
be to explore how extreme weather events would hinder long-term
electrification and the climate change mitigation goals of the power sector
due to damages and their social costs throughout the electricity value
chain.

BIBLIOGRAPHY
169
Bibliography
ACE, 2016. Levelised cost of electricity of selected renewable
technologies in the ASEAN member states. ASEAN Center for
Energy, Jakarta.
AIM Project Team, 2016. Asia-Pacific Integrated Model [WWW Document].
URL http://www-iam.nies.go.jp/aim/about_us/index.html
Akmal, M., Thorpe, S., Dickson, A., Burg, G., Klijn, N., Australia, C. of, 2004.
Australian Energy: National and State Projections to 2019-20,
ABARE eReport 04.11. the Australian Government, Department of
Industry, Tourism and Resources, Canberra.
Aljbour, S.M., Zimmer, M., Al-Horani, F.A., Kunzmann, A., 2019. Metabolic
and oxidative stress responses of the jellyfish Cassiopea sp.to
changes in seawater temperature. J. Sea Res.
https://doi.org/10.1016/j.seares.2018.12.002
Amirnekooei, K., Ardehali, M.M., Sadri, A., 2012. Integrated resource
planning for Iran: Development of reference energy system, forecast,
and long-term energy-environment plan. Energy 46, 374–385.
https://doi.org/10.1016/j.energy.2012.08.013
Anugrah, P., Setiawan, A.A., Budiarto, R., Sihana, 2015. Evaluating Micro
Hydro Power Generation System under Climate Change Scenario in
Bayang Catchment, Kabupaten Pesisir Selatan, West Sumatra.
Energy Procedia 65, 257–263.
https://doi.org/https://doi.org/10.1016/j.egypro.2015.01.043
Arango-Aramburo, S., Ríos-Ocampo, J.P., Álvarez-Espinosa, A.C., Kober,
T., Turner, S.W.D., Daenzer, K., Hejazi, M.I., Romero-Otalora, G.D., van
der Zwaan, B., 2019. Climate impacts on hydropower in Colombia: A
multi-model assessment of power sector adaptation pathways.
Energy Policy 128, 179–188.
https://doi.org/10.1016/j.enpol.2018.12.057
Asian Development Bank, 2012. Adaptation to Climate Change - The Case
of a Combined Cycle Power Plant.
Audinet, P., Amado, J.-C., Rabb, B., 2014. Climate Risk Management
Approaches in the Electricity Sector: Lessons from Early Adapters

BIBLIOGRAPHY
170
17–64. https://doi.org/10.1007/978-1-4614-9221-4_2
Awopone, A.K., Zobaa, A.F., Banuenumah, W., 2017. Techno-economic and
environmental analysis of power generation expansion plan of Ghana.
Energy Policy 104, 13–22.
https://doi.org/https://doi.org/10.1016/j.enpol.2017.01.034
Baek, Y.J., Jung, T.Y., Kang, S.J., 2019. Low carbon scenarios and policies
for the power sector in Botswana. Clim. Policy 19, 219–230.
https://doi.org/10.1080/14693062.2018.1490243
BAPPENAS, 2014. Rencana Aksi Nasional Adaptasi Perubahan Iklim
(RAN-API) [WWW Document]. URL http://sekretariat-
ranapi.org/storage/app/media/RAN-API.pdf (accessed 2.3.19).
Barreto, T.L.G., 2001. Technological Learning in Energy Optimisation
Models and Deployment of Emerging Technologies. SWISS FEDERAL
INSTITUTE OF TECHNOLOGY ZURICH, Zurich.
Bartos, M.D., Chester, M. V., 2015. Impacts of climate change on electric
power supply in the Western United States. Nat. Clim. Chang. 5, 748–
752. https://doi.org/10.1038/nclimate2648
Baxter, L.W., Calandri, K., 1992. Global warming and electricity demand: A
study of California. Energy Policy 20, 233–244.
https://doi.org/10.1016/0301-4215(92)90081-C
Benders, R., 1996. Interactive simulation of electricity demand and
production. University of Groningen.
Berglund, C., Söderholm, P., 2006. Modeling technical change in energy
system analysis: analyzing the introduction of learning-by-doing in
bottom-up energy models. Energy Policy 34, 1344–1356.
https://doi.org/http://dx.doi.org/10.1016/j.enpol.2004.09.002
Bhattacharyya, S.C., 2011. Energy Economics. Springer-Verlag London
Limited. https://doi.org/10.1007/978-0-85729-268-1
Bhattacharyya, S.C., 2010. A review of energy system models. Int. J.
Energy Sect. Manag. 4, 494–518.
https://doi.org/10.1108/17506221011092742
Bhuvanesh, A., Jaya Christa, S.T., Kannan, S., Karuppasamy Pandiyan, M.,
2018. Aiming towards pollution free future by high penetration of

BIBLIOGRAPHY
171
renewable energy sources in electricity generation expansion
planning. Futures. https://doi.org/10.1016/j.futures.2018.07.002
BIG, 2017a. Jumlah Pulau Indonesia Sebanyak 16.056 Pulau Masih Bisa
Bertambah Lagi.
BIG, 2017b. Ina-Geoportal [WWW Document]. URL
http://tanahair.indonesia.go.id/portal-web (accessed 12.6.18).
Blarke, M.B., 2008. The missing link in sustainable energy: Techno-
economic consequences of large-scale heat pumps in distributed
generation in favour of a domestic integration strategy for sustainable
energy. Inst. Samf. og Planlægning. Aalborg Universitet.
Bogdanov, D., Farfan, J., Sadovskaia, K., Fasihi, M., Child, M., Breyer, C.,
2018. Arising role of photovoltaic and wind energy in the power sector
and beyond: Changing the Northeast Asian power landscape. Jpn. J.
Appl. Phys. 57, 08RJ01. https://doi.org/10.7567/JJAP.57.08RJ01
BPS, 2018. Statistical Yearbook of Indonesia 2018 [WWW Document]. URL
https://www.bps.go.id/publication/2018/07/03/5a963c1ea9b0fed64
97d0845/statistik-indonesia-2018.html (accessed 5.30.19).
Cartalis, C., Synodinou, A., Proedrou, M., Tsangrassoulis, A., Santamouris,
M., 2001. Modifications in energy demand in urban areas as a result
of climate changes: an assessment for the southeast Mediterranean
region. Energy Convers. Manag. 42, 1647–1656.
https://doi.org/http://dx.doi.org/10.1016/S0196-8904(00)00156-4
CEEESA, 2017. Energy and Power Evaluation Program (ENPEP-
BALANCE) [WWW Document]. URL
http://ceeesa.es.anl.gov/projects/Enpepwin.html
Clarke, L., Sokka, L., Jiang, K., Akimoto, K., Babiker, M., Blanford, G., Fisher-
Vanden, K., Hourcade, J., Krey, V., Kriegler, E., Löschel, A., McCollum,
D., Paltsev, S., Rose, S., Shukla, P.R., Tavoni, M., C van der Zwaan,
B.C., van Vuuren, D., Sokona, Y., Farahani, E., Kadner, S., Seyboth, K.,
Adler, A., Baum, I., Brunner, S., Eickemeier, P., Kriemann, B.,
Savolainen, J., Schlömer, S., von Stechow, C., Zwickel, T., Minx, J.,
2014. Assessing Transformation Pathways Coordinating Lead
Authors: Chapter Science Assistant. Clim. Chang. 2014 Mitig. Clim.
Chang. Contrib. Work. Gr. III to Fifth Assess. Rep. Intergov. Panel

BIBLIOGRAPHY
172
Clim. Chang. 98.
Connell, R., Firth, J., Baglee, A., Haworth, A., Steeves, J., Fouvet, C.,
Hamaker-Taylor, R., 2018. Navigating a New Climate. Assessing credit
risk and opportunity in a changing climate: Outputs of a working group
of 16 banks piloting the TCFD Recommendations. Part 2: Physical
risks and opportunities.
Connolly, D., Lund, H., Mathiesen, B. V, Leahy, M., 2010. A review of
computer tools for analysing the integration of renewable energy into
various energy systems. Appl. Energy 87, 1059–1082.
https://doi.org/10.1016/j.apenergy.2009.09.026
Cook, M.A., King, C.W., Davidson, F.T., Webber, M.E., 2015. Assessing the
impacts of droughts and heat waves at thermoelectric power plants
in the United States using integrated regression, thermodynamic, and
climate models. Energy Reports 1, 193–203.
https://doi.org/http://dx.doi.org/10.1016/j.egyr.2015.10.002
Cronin, J., Anandarajah, G., Dessens, O., 2018. Climate change impacts on
the energy system: a review of trends and gaps. Clim. Change 151,
79–93. https://doi.org/10.1007/s10584-018-2265-4
Daggash, H.A., Mac Dowell, N., 2019. The implications of delivering the
UK’s Paris Agreement commitments on the power sector. Int. J.
Greenh. Gas Control 85, 174–181.
https://doi.org/10.1016/j.ijggc.2019.04.007
Dagher, L., Ruble, I., 2011. Modeling Lebanon’s electricity sector:
Alternative scenarios and their implications. Energy 36, 4315–4326.
https://doi.org/https://doi.org/10.1016/j.energy.2011.04.010
Dalla Longa, F., van der Zwaan, B., 2017. Do Kenya’s climate change
mitigation ambitions necessitate large-scale renewable energy
deployment and dedicated low-carbon energy policy? Renew. Energy
113, 1559–1568. https://doi.org/10.1016/J.RENENE.2017.06.026
Damayanty, D., 2008. Membenahi Perusahaan Listrik Negara [WWW
Document]. KOMPAS.com. URL
https://sains.kompas.com/read/2008/01/10/19315174/membenahi.
perusahaan.listrik.negara (accessed 5.24.18).
Das, A., Ahlgren, E.O., 2010. Implications of using clean technologies to

BIBLIOGRAPHY
173
power selected ASEAN countries. Energy Policy 38, 1851–1871.
https://doi.org/10.1016/j.enpol.2009.11.062
Dasuki, A.S., Djamin, M., Lubis, A.Y., 2001. The strategy of photovoltaic
technology development in Indonesia. Renew. Energy 22, 321–326.
https://doi.org/http://dx.doi.org/10.1016/S0960-1481(00)00022-7
De Andrade Guerra, J.B.S.O., Dutra, L., Schwinden, N.B.C., Andrade, S.F.
De, 2015. Future scenarios and trends in energy generation in Brazil:
Supply and demand and mitigation forecasts. J. Clean. Prod. 103,
197–210. https://doi.org/10.1016/j.jclepro.2014.09.082
De Kruijk, H., 1994. The EU Energy and Environmental Model Efom-env
Specified in Gams: Model Description and User’s Guide. Netherlands
Energy Research Foundation ECN.
de Lucena, A.F.P., Schaeffer, R., Szklo, A.S., 2010. Least-cost adaptation
options for global climate change impacts on the Brazilian electric
power system. Glob. Environ. Chang. 20, 342–350.
https://doi.org/http://dx.doi.org/10.1016/j.gloenvcha.2010.01.004
de Lucena, A.F.P., Szklo, A.S., Schaeffer, R., de Souza, R.R., Borba,
B.S.M.C., da Costa, I.V.L., Júnior, A.O.P., da Cunha, S.H.F., 2009. The
vulnerability of renewable energy to climate change in Brazil. Energy
Policy 37, 879–889.
https://doi.org/http://dx.doi.org/10.1016/j.enpol.2008.10.029
De Vries, B., van Vuuren, D., Den Elzen, M., Janssen, M., 2002. Targets
IMage Energy Regional (TIMER) Model, Technical Documentation.
DEN, 2016a. Sosialisasi Rencana Umum Energi Nasional dalam rangka
Penyusunan Rencana Umum Energi Daerah.
DEN, 2016b. Indonesia Energy Outlook 2016. National Energy Council.
DEN, 2016c. Tayangan Siaran Pers Rencana Umum Energi Nasional.
DEN, 2014. Outlook Energi Indonesia 2014.
Detikfinance, 2007. Pasokan Batubara Seret, PLN Tambah Pemakaian
BBM [WWW Document]. detik.com. URL
https://finance.detik.com/berita-ekonomi-bisnis/d-
752626/pasokan-batubara-seret-pln-tambah-pemakaian-bbm
(accessed 5.24.18).
BIBLIOGRAPHY
174
Direktorat Jenderal Anggaran, 2017. Informasi APBN 2017.
DOE, 2003. Model Documentation Report: System for the Analysis of
Global Energy Markets (SAGE), Data Implementation Guide.
Doorman, G., Kjǿlle, G., Uhlen, K., Huse, E.S., Flatabǿ, N., 2004. Vulnerability
of the Nordic power system, Report to the Nordic Council of
Ministers, SINTEF Energy Research.
Dowling, P., 2013. The impact of climate change on the European energy
system. Energy Policy 60, 406–417.
https://doi.org/10.1016/j.enpol.2013.05.093
Drbal, L., Westra, K., Boston, P., 1996. Power Plant Engineering. Springer,
Boston, MA. https://doi.org/https://doi.org/10.1007/978-1-4613-
0427-2
Dubey, S., Sarvaiya, J.N., Seshadri, B., 2013. Temperature Dependent
Photovoltaic (PV) Efficiency and Its Effect on PV Production in the
World – A Review. Energy Procedia 33, 311–321.
https://doi.org/10.1016/J.EGYPRO.2013.05.072
Duić, N., da Graça Carvalho, M., 2004. Increasing renewable energy sources
in island energy supply: case study Porto Santo. Renew. Sustain.
Energy Rev. 8, 383–399.
https://doi.org/https://doi.org/10.1016/j.rser.2003.11.004
Dutch Sustainability Unit, 2016. Climate Change Profile: INDONESIA
[WWW Document]. URL
http://api.commissiemer.nl/docs/os/i71/i7196/climate_change_profi
le_indonesia_2016_reduced_size.pdf (accessed 11.19.18).
EBTKE, 2016. Isu strategis/permasalahan sub sektor EBTKE.
EIA, 2009. The National Energy Modeling System: an Overview 2009, Office
of Integrated Analysis and Forecasting, US Department of Energy,
Washington, DC.
EMD International A/S, 2017. energyPRO [WWW Document]. URL
http://www.emd.dk/energypro/
Enerdata, 2012. POLES: Prospective Outlook on Long-term Energy
Systems, Complementary documentation for the EnerFuture
Forecasts.

BIBLIOGRAPHY
175
ESDM, 2019. Statistik Ketenagalistrikan 2018. Directorate General of
Electricity, Ministry of Energy and Mineral Resources, Jakarta,
Indonesia.
Eshraghi, H., Maleki, A., 2016. Reshaping energy policy for sustainable
development: Curbing Iran’s carbon emission monster via renewable
energies. Energy Sources, Part B Econ. Planning, Policy 11, 830–840.
https://doi.org/10.1080/15567249.2013.810313
Evans, J., Hunt, L.C., 2009. International Handbook on the Economics of
Energy. Edward Elgar Publishing, Inc., Northampton, USA.
Farmer, J.D., Lafond, F., 2016. How predictable is technological progress?
Res. Policy 45, 647–665.
https://doi.org/10.1016/j.respol.2015.11.001
Feng, Y.Y., Zhang, L.X., 2012. Scenario analysis of urban energy saving and
carbon abatement policies: A case study of Beijing city, China.
Procedia Environ. Sci. 13, 632–644.
https://doi.org/https://doi.org/10.1016/j.proenv.2012.01.055
Ferguson, R., Wilkinson, W., Hill, R., 2000. Electricity use and economic
development. Energy Policy 28, 923–934.
https://doi.org/10.1016/S0301-4215(00)00081-1
Field C.B., V.R. Barros, K.J. Mach, M.D. Mastrandrea, M. van Aalst, W.N.
Adger, D.J. Arent, J. Barnett, R.B., T.E. Bilir, J. Birkmann, J. Carmin,
D.D. Chadee, A.J. Challinor, M. Chatterjee, W. Cramer, D.J. Davidson,
Y.O.E., J.-P. Gattuso, Y. Hijioka, O. Hoegh-Guldberg, H.Q. Huang, G.E.
Insarov, R.N. Jones, R.S. Kovats, P.R.-L., J.N. Larsen, I.J. Losada, J.A.
Marengo, R.F. McLean, L.O. Mearns, R. Mechler, J.F. Morton, I. Niang,
T. Oki, J.M.O., M. Opondo, E.S. Poloczanska, H.-O. Pörtner, M.H.
Redsteer, A. Reisinger, A. Revi, D.N. Schmidt, M.R.S., W. Solecki, D.A.
Stone, J.M.R. Stone, K.M. Strzepek, A.G. Suarez, P. Tschakert, R.
Valentini, S. Vicuña, A.V., K.E. Vincent, R.Warren, L.L.White,
T.J.Wilbanks, P.P.Wong, and G.W.Y., 2014. 2014: Technical summary.
Clim. Chang. 2014 Impacts, Adapt. Vulnerability. Part A Glob. Sect.
Asp. Contrib. Work. Gr. II to Fifth Assess. Rep. Intergov. Panel Clim.
Chang. 35–94.
Fisher-Vanden, K., Sue Wing, I., Lanzi, E., Popp, D., 2013. Modeling climate
change feedbacks and adaptation responses: recent approaches and

BIBLIOGRAPHY
176
shortcomings. Clim. Change 117, 481–495.
https://doi.org/10.1007/s10584-012-0644-9
Foell, W., Amann, M., Carmichael, G., Hettelingh, J.-P., Hordijk, L., Dianwu,
Z., 1995. RAINS-Asia: An Assessment Model for Air Pollution in Asia:
Final Report Submitted to the Bank by the Project Team. World Bank.
Förster, H., Lilliestam, J., 2010. Modeling thermoelectric power generation
in view of climate change. Reg. Environ. Chang. 10, 327–338.
https://doi.org/10.1007/s10113-009-0104-x
Fortes, P., Simoes, S.G., Gouveia, J.P., Seixas, J., 2019. Electricity, the
silver bullet for the deep decarbonisation of the energy system?
Cost-effectiveness analysis for Portugal. Appl. Energy 237, 292–303.
https://doi.org/10.1016/J.APENERGY.2018.12.067
Fouquet, R., 2011. A brief history of energy, in: Evans, J., Hunt, L.C. (Eds.),
International Handbook on the Economics of Energy. Edward Elgar
Publishing Limited, Cheltenham, UK, pp. 1–19.
Frei, C.W., Haldi, P.-A., Sarlos, G., 2003. Dynamic formulation of a top-
down and bottom-up merging energy policy model. Energy Policy 31,
1017–1031. https://doi.org/http://dx.doi.org/10.1016/S0301-
4215(02)00170-2
GEA, 2012. Policies for the Energy Technology Innovation System (ETIS),
in: Global Energy Assessment - Toward a Sustainable Future.
Cambridge University Press, Cambridge UK and New York, NY, USA
and the International Institute for Applied Systems Analysis,
Laxenburg, Austria.
GERICS, 2015. Indonesia Climate-Fact-Sheet [WWW Document]. URL
https://www.climate-service-center.de/index.php.en#Region-Asia-
Indonesia (accessed 11.19.18).
Gillingham, K., Newell, R.G., Pizer, W.A., 2008. Modeling endogenous
technological change for climate policy analysis. Energy Econ. 30,
2734–2753.
https://doi.org/http://dx.doi.org/10.1016/j.eneco.2008.03.001
Gómez-Calvet, R., Martínez-Duart, J.M., 2019. On the Assessment of the
2030 Power Sector Transition in Spain. Energies 12, 1369.
https://doi.org/10.3390/en12071369

BIBLIOGRAPHY
177
Government of The Republic of Indonesia, 2016. First Nationally
Determined Contribution Republic of Indonesia [WWW Document].
URL
http://www4.unfccc.int/ndcregistry/PublishedDocuments/Indonesia
First/First NDC Indonesia_submitted to UNFCCC Set_November
2016.pdf (accessed 1.12.17).
Government of The Republic of Indonesia, 2015a. Intended Nationally
Detemined Contribution Republic of Indonesia.
Government of The Republic of Indonesia, 2015b. Indonesia First Biennial
Update Report (BUR) Under the United Nations Framework
Convention on Climate Change. Ministry of Environment and
ForestryRepublic of Indonesia, Jakarta.
Government of The Republic of Indonesia, 2014. Government Regulation
of Republic of Indonesia No. 79 Year 2014 regarding National Energy
Policy.
Grande-Acosta, G., Islas-Samperio, J., 2017. Towards a low-carbon
electric power system in Mexico. Energy Sustain. Dev. 37, 99–109.
https://doi.org/10.1016/J.ESD.2017.02.001
Grübler, A., Nakićenović, N., Victor, D.G., 1999. Dynamics of energy
technologies and global change. Energy Policy 27, 247–280.
https://doi.org/http://dx.doi.org/10.1016/S0301-4215(98)00067-6
Gumelar, G., 2017. Pemerintah Tambah Alokasi Subsidi Listrik 15 Persen
di APBNP. CNN Indones. 2017.
Guo, Z., Cheng, R., Xu, Z., Liu, P., Wang, Z., Li, Z., Jones, I., Sun, Y., 2017.
A multi-region load dispatch model for the long-term optimum
planning of China’s electricity sector. Appl. Energy 185, 556–572.
https://doi.org/10.1016/j.apenergy.2016.10.132
Hadley, S.W., 2008. The Oak Ridge Competitive Electricity Dispatch
(ORCED) Model, ORNL/TM-2007/230, Oak Ridge National
Laboratory, June.
Haiges, R., Wang, Y.D., Ghoshray, A., Roskilly, A.P., 2019. Unconventional
fuel pathways for decarbonizing the electrical power generation in
Malaysia by 2050. Energy Procedia 158, 4238–4245.
https://doi.org/10.1016/J.EGYPRO.2019.01.803
BIBLIOGRAPHY
178
Haiges, R., Wang, Y.D., Ghoshray, A., Roskilly, A.P., 2017. Optimization of
Malaysia’s power generation mix to meet the electricity demand by
2050. Energy Procedia 142, 2844–2851.
https://doi.org/10.1016/J.EGYPRO.2017.12.431
Haldkar, V., Kumar Sharma, A., Ranjan, R.K., Bajpai, V.K., 2013. An energy
analysis of condenser. Int. J. Therm. Technol. 3, 120–125.
Hall, L.M.H., Buckley, A.R., 2016. A review of energy systems models in the
UK: Prevalent usage and categorisation. Appl. Energy 169, 607–628.
https://doi.org/10.1016/j.apenergy.2016.02.044
Handayani, K., Krozer, Y., Filatova, T., 2017. Trade-offs between
electrification and climate change mitigation: An analysis of the Java-
Bali power system in Indonesia. Appl. Energy 208.
https://doi.org/10.1016/j.apenergy.2017.09.048
Harris, I., Jones, P.D., Osborn, T.J., Lister, D.H., 2014. Updated high-
resolution grids of monthly climatic observations - the CRU TS3.10
Dataset. Int. J. Climatol. 34, 623–642.
https://doi.org/10.1002/joc.3711
Heaps, C.G., 2017. Long-range Energy Alternatives Planning (LEAP)
system. [Software version 2017.0.5] [WWW Document]. URL
http://www.energycommunity.org
Henry, C.L., Pratson, L.F., 2016. Effects of environmental temperature
change on the efficiency of coal- and natural gas-fired power plants.
Environ. Sci. Technol. 50, 9764–9772.
https://doi.org/10.1021/acs.est.6b01503
Heuberger, C.F., Rubin, E.S., Staffell, I., Shah, N., Mac Dowell, N., 2017.
Power capacity expansion planning considering endogenous
technology cost learning. Appl. Energy 204, 831–845.
https://doi.org/10.1016/j.apenergy.2017.07.075
Hoegh-Guldberg, O., Jacob, D., Taylor, M., Bindi, M., Brown, S., Camilloni,
I., Diedhiou, A., Djalante, R., Ebi, K.L., Engelbrecht, F., Guiot, J., Hijioka,
Y., Mehrotra, S., Payne, A., Seneviratne, S.I., Thomas, A., Warren, R.,
Zhou, G., 2018. Impacts of 1.5oC Global Warming on Natural and
Human Systems. In: Global Warming of 1.5°C. An IPCC Special
Report on the impacts of global warming of 1.5°C above pre-

BIBLIOGRAPHY
179
industrial levels and related global greenhouse gas emission
pathways, in the context of .
Huenteler, J., Niebuhr, C., Schmidt, T.S., 2016. The effect of local and
global learning on the cost of renewable energy in developing
countries. J. Clean. Prod. 128, 6–21.
https://doi.org/10.1016/j.jclepro.2014.06.056
IAEA, 2006. Wien Automatic System Planning (WASP) Package: A
Computer Code for Power Generating System Expansion Planning
Version WASP-IV with User Interface User’s Manual, Vienna,
Austria: IAEA.
Ibnu Kasiro, Isdiana, D. Pangluar, CL Nugroho, Attan Muchtar, Hari Martadi,
R.S., 1995. Bendungan Besar di Indonesia. Pusat Penelitian dan
Pengembangan Pengairan, Dept. PU, Dirjen Pengairan.
IEA, 2018a. 2018 World Energy Outlook: Executive Summary.
IEA, 2018b. World Energy Outlook 2018: Electricity [WWW Document]. URL
https://www.iea.org/sdg/electricity/ (accessed 7.17.19).
IEA, 2018c. World Energy Balances 2018 [WWW Document]. URL
https://webstore.iea.org/world-energy-balances-2018 (accessed
2.20.19).
IEA, 2015a. Tracking Clean Energy Progress 2015. France.
IEA, 2015b. WORLD ENERGY OUTLOOK 2015 FACTSHEET.
IEA, 2000. Experience Curves for Energy Technology Policy [WWW
Document]. https://doi.org/10.1787/9789264182165-en
IEA, NEA, 2015. Projected Costs of Generating Electricity 2015 Edition.
International Energy Agency Nuclear Energy Agency, Paris.
IEA, OECD/IEA, 2015. Southeast Asia Energy Outlook 2015. France.
International Finance Corporation, 2012. Performance Standard 1
Assessment and Management of Environmental and Social Risks and
Impacts. IFC Perform. Stand. Environ. Soc. Sustain. 5–15.
International Pacific Research Center, 2018. CIMP5 dataset [WWW
Document]. URL
http://apdrc.soest.hawaii.edu/las/v6/dataset?catitem=3228

BIBLIOGRAPHY
180
(accessed 5.13.19).
IP Semarang, 2017. Addendum ANDAL and RKL-RPL Development and
Operational PLTU/PLTGU/PLTG Unit Updates from 1,350 MW
become 2,150 MW PT . INDONESIA POWER UP Semarang.
IPCC, 2018. Summary for Policymakers. In: Global Warming of 1.5°C. An
IPCC Special Report on the impacts of global warming of 1.5°C
above pre-industrial levels and related global greenhouse gas
emission pathways, in the context of strengthening the global
response to.
IPCC, 2014. IPCC. (2014). Climate Change 2014: Mitigation of Climate
Change. Contribution of Working Group III to the Fifth Assessment
Report of the Intergovernmental Panel on Climate Change
[Edenhofer, O., R. Pichs-Madruga, Y. Sokona, E. Farahani, S. Kadner,
K. Seyb. Cambridge University Press, Cambridge, United Kingdom and
New York, NY, USA.
IPCC, 2007. Climate Change 2007: Mitigation. Contribution of Working
Group III to the Fourth Assessment Report of the Intergovernmental
Panel on Climate Change, Cambridge University Press. Cambridge
University Press, Cambridge, United Kingdom and New York, NY,
USA.
IPCC, 2000. Special report on emissions scenarios: a special report of
working group III of the Intergovernmental Panel on Climate Change,
Cambridge University Press: Cambridge, UK.
IRENA, 2017. Untapped Potential for Climate Change Action: Renewable
Energy in Nationally Determined Contributions. International
Renewable Energy Agency, Abu Dhabi.
IRENA, 2012a. Renewable energy technologies: Cost analysis series,
Biomass for Power Generation. Abu Dhabi.
IRENA, 2012b. Renewable energy technologis: Cost analysis series,
Biomass for Power Generation. Abu Dhabi.
Ishaque, H., 2017. Is it wise to compromise renewable energy future for
the sake of expediency? An analysis of Pakistan’s long-term
electricity generation pathways. Energy Strateg. Rev. 17, 6–18.
https://doi.org/https://doi.org/10.1016/j.esr.2017.05.002
BIBLIOGRAPHY
181
Jerez, S., Tobin, I., Vautard, R., Montávez, J.P., López-Romero, J.M., Thais,
F., Bartok, B., Christensen, O.B., Colette, A., Déqué, M., Nikulin, G.,
Kotlarski, S., van Meijgaard, E., Teichmann, C., Wild, M., 2015. The
impact of climate change on photovoltaic power generation in Europe.
Nat. Commun. 6, 10014. https://doi.org/10.1038/ncomms10014
JICA, 2010. Preparatory Survey for Indramayu Coal-fired Power Plant
Project in Indonesia.
Kahouli-Brahmi, S., 2008. Technological learning in energy-environment-
economy modelling: A survey. Energy Policy 36, 138–162.
Kale, R. V., Pohekar, S.D., 2014. Electricity demand and supply scenarios
for Maharashtra (India) for 2030: An application of long range energy
alternatives planning. Energy Policy 72, 1–13.
https://doi.org/10.1016/j.enpol.2014.05.007
Kates, R.W., Travis, W.R., Wilbanks, T.J., 2012. Transformational adaptation
when incremental adaptations to climate change are insufficient.
Proc. Natl. Acad. Sci. 109, 7156–7161.
https://doi.org/10.1073/PNAS.1115521109
Kaufmann, R.K., Gopal, S., Tang, X., Raciti, S.M., Lyons, P.E., Geron, N.,
Craig, F., 2013. Revisiting the weather effect on energy consumption:
Implications for the impact of climate change. Energy Policy 62,
1377–1384.
https://doi.org/http://dx.doi.org/10.1016/j.enpol.2013.07.056
Kehlhofer, R., Rukes, B., Hannemann, F., Stirnimann, F., 2009. Combined-
Cycle Gas & Steam Turbine Power Plants. PennWell Corp.
Kemfert, C., Truong, T., 2009. Energy-economy-environment modelling: a
survey, in: Evans, J., Hunt, L.C. (Eds.), International Handbook on the
Economics of Energy. Edward Elgar Publishing limited, UK, pp. 367–
382.
KESDM, 2018a. Peta Cadangan Gas [WWW Document]. URL
http://statistik.migas.esdm.go.id/index.php?r=petaCadanganGasBum
i/index
KESDM, 2018b. Peta Cadangan Minyak [WWW Document]. URL
http://statistik.migas.esdm.go.id/index.php?r=petaCadanganMinyakB
umi/index (accessed 7.8.19).

BIBLIOGRAPHY
182
KESDM, 2018c. Statistik Ketenagalistrikan 2017.
KESDM, 2017. Statistik Ketenagalistikan 2016 [WWW Document]. URL
https://www.esdm.go.id/assets/media/content/content-statistik-
ketenagalistrikan-tahun-2016-1.pdf (accessed 7.26.18).
KESDM, 2015. Draft Rencana Umum Ketenagalistrikan Nasional 2015-
2034.
Khan, S.I., Islam, A., Khan, A.H., 2011. Energy Forecasting of Bangladesh in
Gas Sector Using LEAP Software. Glob. J. Res. Eng. 11, 6.
Kim, C., Park, H., 2017. An investigation into the impact of limiting carbon
emissions on the Korean power system and the electricity market. J.
Electr. Eng. Technol. 12, 1038–1045.
https://doi.org/10.5370/JEET.2017.12.3.1038
Kim, H., Shin, E., Chung, W., 2011. Energy demand and supply, energy
policies, and energy security in the Republic of Korea. Energy Policy
39, 6882–6897.
https://doi.org/http://dx.doi.org/10.1016/j.enpol.2011.07.056
Kim, S., Koo, J., Lee, C.J., Yoon, E.S., 2012. Optimization of Korean energy
planning for sustainability considering uncertainties in learning rates
and external factors. Energy 44, 126–134.
https://doi.org/10.1016/j.energy.2012.02.062
Klemeš, J., Bulatov, I., Koppejan, J., 2009. Novel energy saving technologies
evaluation tool. Comput. Chem. Eng. 33, 751–758.
https://doi.org/https://doi.org/10.1016/j.compchemeng.2008.07.005
KLHK, 2011. Peta DAS Prioritas Citarum. KLHK, Bogor.
Kumar, S., 2016. Assessment of renewables for energy security and carbon
mitigation in Southeast Asia: The case of Indonesia and Thailand.
Appl. Energy 163, 63–70.
https://doi.org/10.1016/j.apenergy.2015.11.019
Kumar, S., Madlener, R., 2018. Energy systems and COP21 Paris climate
agreement targets in Germany: An integrated modeling approach, in:
2018 7th International Energy and Sustainability Conference, IESC
2018. IEEE, pp. 1–6. https://doi.org/10.1109/IESC.2018.8440004
Kumar, S., Madlener, R., 2016. CO2 emission reduction potential

BIBLIOGRAPHY
183
assessment using renewable energy in India. Energy 97, 273–282.
https://doi.org/https://doi.org/10.1016/j.energy.2015.12.131
Kunaifi, K., Reinders, A., 2016. Opportunities for Photovoltaic Solar Energy
Systems in Indonesia. WREC-15.
Kusumadewi, T.V., Winyuchakrit, P., Misila, P., Limmeechokchai, B., 2017.
GHG Mitigation in Power Sector: Analyzes of Renewable Energy
Potential for Thailand’s NDC Roadmap in 2030, in: Energy Procedia.
Elsevier, pp. 69–74. https://doi.org/10.1016/j.egypro.2017.10.054
Lafond, F., Gotway Bailey, A., David Bakker, J., Rebois, D., Zadourian, R.,
McSharry, P., Doyne Farmer, J., 2017. How well do experience curves
predict technological progress? A method for making distributional
forecasts. https://doi.org/10.1016/j.techfore.2017.11.001
Lambert, T., Gilman, P., Lilienthal, P., 2006. Micropower System Modeling
with Homer, in: Integration of Alternative Sources of Energy. John
Wiley & Sons, Inc., pp. 379–418.
https://doi.org/10.1002/0471755621.ch15
Lee, C.-Y., Huh, S.-Y., 2017. Forecasting the diffusion of renewable
electricity considering the impact of policy and oil prices: The case
of South Korea. Appl. Energy 197, 29–39.
https://doi.org/http://dx.doi.org/10.1016/j.apenergy.2017.03.124
Lehmann, H., 2003. Energy-rich Japan, Institute for Sustainable Solutions
and Innovations.
Li, S., Coit, D.W., Selcuklu, S., Felder, F. a, 2014. Electric Power Generation
Expansion Planning: Robust Optimization Considering Climate
Change. Proc. 2014 Ind. Syst. Eng. Res. Conf. 1–10.
https://doi.org/10.1021/acschembio.5b00762
Lise, W., van der Laan, J., 2015. Investment needs for climate change
adaptation measures of electricity power plants in the EU. Energy
Sustain. Dev. 28, 10–20. https://doi.org/10.1016/J.ESD.2015.06.003
Liu, X., Du, H., Brown, M.A., Zuo, J., Zhang, N., Rong, Q., Mao, G., 2018.
Low-carbon technology diffusion in the decarbonization of the power
sector: Policy implications. Energy Policy 116, 344–356.
https://doi.org/10.1016/j.enpol.2018.02.001

BIBLIOGRAPHY
184
Loulou, R., Labriet, M., 2008. ETSAP-TIAM: the TIMES integrated
assessment model Part I: Model structure. Comput. Manag. Sci. 5, 7–
40. https://doi.org/10.1007/s10287-007-0046-z
Lund, H., 2013. EnergyPLAN Advanced Energy Systems Analysis
Computer Model Documentation Version 11.0. 2013, Aalborg
University: Aalborg, Denmark.
Lundvall, B.-Å., 2016. The Learning Economy and the Economics of Hope,
Research Series 31,.
https://doi.org/http://dx.doi.org/10.1016/B978-0-7506-7009-
8.50019-7
Ma, T., Nakamori, Y., 2009. Modeling technological change in energy
systems – From optimization to agent-based modeling. Energy 34,
873–879.
https://doi.org/http://dx.doi.org/10.1016/j.energy.2009.03.005
MacDonald, M., Fischer, S., 2007. Using BCHP Screener (BCHPsc) for
Facility Energy Assessments.
Mansur, E.T., Mendelsohn, R., Morrison, W., 2008. Climate change
adaptation: A study of fuel choice and consumption in the US energy
sector. J. Environ. Econ. Manage. 55, 175–193.
https://doi.org/10.1016/J.JEEM.2007.10.001
Mantzos, L., Capros, P., 1998. The PRIMES Version 2 Energy System
Model: Design and Features, E3M-Lab/lnstitute of Communication
and Computer Systems, National Technical University of Athens.
Marpaung, C.O.P., Soebagio, A., Shrestha, R.M., 2007. The role of carbon
capture and storage and renewable energy for CO 2 mitigation in the
Indonesian power sector, in: 8th International Power Engineering
Conference, IPEC 2007. pp. 779–783.
Marpaung, C.O.P., Soebagio, A., Shrestha, R.M., 2005. Internalizing external
cost in electricity development in Indonesia: A factor decomposition
analysis, in: 2005 IEEE/PES Transmission and Distribution
Conference and Exhibition: Asia and Pacific.
https://doi.org/10.1109/TDC.2005.1546869
Martinsen, D., Krey, V., Markewitz, P., Vögele, S., 2006. A time step energy
process model for Germany-model structure and results. Energy

BIBLIOGRAPHY
185
Stud. Rev. 14. https://doi.org/DOI:
https://doi.org/10.15173/esr.v14i1.480
McDonald, A., Schrattenholzer, L., 2001. Learning rates for energy
technologies. Energy Policy 29, 255–261.
https://doi.org/http://dx.doi.org/10.1016/S0301-4215(00)00122-1
McPherson, M., Karney, B., 2014. Long-term scenario alternatives and
their implications: LEAP model application of Panama׳s electricity
sector. Energy Policy 68, 146–157.
https://doi.org/http://dx.doi.org/10.1016/j.enpol.2014.01.028
Meibom, P., 2005. Design of the Wilmar Planning tool. Wilmar Seminar,
Brussels.
MEMR, 2016. Handbook of Energy and Economic Statistics of Indonesia
2016. MEMR of Indonesia, Jakarta.
Mima, S., Criqui, P., 2015. The Costs of Climate Change for the European
Energy System, an Assessment with the POLES Model. Environ.
Model. Assess. 20, 303–319. https://doi.org/10.1007/s10666-015-
9449-3
Mufson, S., 2019. Moody’s Analytics says climate change could cost $69
trillion by 2100. Washington Post.
Musim Kering, 2011. Musim Kering , PLTA Saguling Cirata Hanya
Beroperasi Malam Hari [WWW Document]. detik.com. URL
https://finance.detik.com/energi/d-1726926/musim-kering-plta-
saguling-cirata-hanya-beroperasi-malam-hari (accessed 6.11.18).
Naden, C., 2019. Managing the impact of climate change: First International
Standard for adaptation published [WWW Document]. URL
https://www.iso.org/news/ref2405.html (accessed 7.25.19).
Nebojsa Nakicenovic, Joseph Alcamo, Gerald Davis, Bert de Vries, Joergen
Fenhann, Stuart Gaffin, Kermeth Gregory, Amulf Griibler, Tae Yong
Jung, Tom Kram, Emilio Lebre La Rovere, Laurie Michaelis, Shunsuke
Mori, Tsuneyuki Morita, William Pepper, Hugh Pitc, Z.D., 2000. Special
Report on Emissions Scenarios. Cambridge University Press,
Cambridge UK.
Ng, W.S., 2015. Electric Power Resource Planning: EGEAS Software
BIBLIOGRAPHY
186
Overview. Electric Power Research Institute, Inc, EPRI Program 178b
Webcast.
Nicolas, C., Rentschler, J., Potter van Loon, A., Oguah, S., Schweikert, A.,
Deinert, M., Koks, E., Arderne, C., Cubas, D., Li, J., Ichikawa, E., 2019.
Stronger Power : Improving Power Sector Resilience to Natural
Hazards. Sector note for LIFELINES: The Resilient Infrastructure
Opportunity. Washington, DC.
Nikolaev, A., Konidari, P., 2017. Development and assessment of renewable
energy policy scenarios by 2030 for Bulgaria. Renew. Energy 111,
792–802.
https://doi.org/https://doi.org/10.1016/j.renene.2017.05.007
North, M., Conzelmann, G., Koritarov, V., Macal, C., Thimmapuram, P.,
Veselka, T., 2002. E-laboratories: agent-based modeling of electricity
markets, in: 2002 American Power Conference. pp. 15–17.
Obahoundje, S., Ofosu, E., Akpoti, K., Kabo-bah, A., 2017. Land Use and
Land Cover Changes under Climate Uncertainty: Modelling the
Impacts on Hydropower Production in Western Africa. Hydrology 4,
2. https://doi.org/10.3390/hydrology4010002
OECD/IEA, 2017. World Energy Outlook - World Energy Model [WWW
Document]. URL http://www.worldenergyoutlook.org/weomodel/
OECD, 2018. Indonesia OECD Economic Surveys, OECD Economic
Surveys. https://doi.org/10.1787/9789264026940-pl
Ouedraogo, N.S., 2017. Modeling sustainable long-term electricity supply-
demand in Africa. Appl. Energy 190, 1047–1067.
https://doi.org/http://dx.doi.org/10.1016/j.apenergy.2016.12.162
P2B, 2016a. Evaluasi Operasi Sistem Jawa Bali 2015. PLN P2B, Jakarta.
P2B, 2016b. Beban Sistem Jawa Bali 2014.
Pachauri, R. K. , Allen, M. R. , Barros, V. R. , Broome, J. , Cramer, W. ,
Christ, R. , Church, J. A. , Clarke, L. , Dahe, Q. , Dasgupta, P. , Dubash,
N. K. , Edenhofer, O. , Elgizouli, I. , Field, C. B. , Forster, P. ,
Friedlingstein, P. , Fuglestvedt, J, J.P., 2014. Climate Change 2014:
Mitigation of Climate Change. Contribution of Working Group III to the
Fifth Assessment Report of the Intergovernmental Panel on Climate

BIBLIOGRAPHY
187
Change [Edenhofer, O., R. Pichs-Madruga, Y. Sokona, E. Farahani, S.
Kadner, K. Seyboth, A. Adler,. Cambridge University Press,
Cambridge, United Kingdom and New York, NY, USA.
Panteli, M., Mancarella, P., 2015. Influence of extreme weather and climate
change on the resilience of power systems: Impacts and possible
mitigation strategies. Electr. Power Syst. Res. 127, 259–270.
https://doi.org/10.1016/j.epsr.2015.06.012
Park, N.-B., Yun, S.-J., Jeon, E.-C., 2013. An analysis of long-term
scenarios for the transition to renewable energy in the Korean
electricity sector. Energy Policy 52, 288–296.
https://doi.org/https://doi.org/10.1016/j.enpol.2012.09.021
Pašičko, R., Branković, Č., Šimić, Z., 2012. Assessment of climate change
impacts on energy generation from renewable sources in Croatia.
Renew. Energy 46, 224–231.
https://doi.org/10.1016/J.RENENE.2012.03.029
Pereira de Lucena, A.F., Szklo, A.S., Schaeffer, R., Dutra, R.M., 2010. The
vulnerability of wind power to climate change in Brazil. Renew. Energy
35, 904–912. https://doi.org/10.1016/J.RENENE.2009.10.022
Perwez, U., Sohail, A., Hassan, S.F., Zia, U., 2015. The long-term forecast
of Pakistan’s electricity supply and demand: An application of long
range energy alternatives planning. Energy 93, 2423–2435.
https://doi.org/10.1016/j.energy.2015.10.103
Peter, C., Johnston, Gomez, J.F., Laplante, B., 2012. Climate Risk and
Adaptation in the Electric Power Sector. Asian Development Bank,
Manila.
Pfenninger, S., Hawkes, A., Keirstead, J., 2014. Energy systems modeling
for twenty-first century energy challenges. Renew. Sustain. Energy
Rev. 33, 74–86.
https://doi.org/http://dx.doi.org/10.1016/j.rser.2014.02.003
Pizer, W.A., Popp, D., 2008. Endogenizing technological change: Matching
empirical evidence to modeling needs. Energy Econ. 30, 2754–2770.
https://doi.org/http://dx.doi.org/10.1016/j.eneco.2008.02.006
PLN, 2019. Statistik PLN 2018 [WWW Document]. URL
https://www.pln.co.id/statics/uploads/2019/07/Buku-Statistik-

BIBLIOGRAPHY
188
2018-vs-Indo-Final.pdf
PLN, 2018. Electricity Supply Bussiness Plan (RUPTL) 2018-2027 [WWW
Document]. URL http://www.pln.co.id/stakeholder/ruptl (accessed
6.18.18).
PLN, 2017a. Statistik PLN 2016 [WWW Document]. URL
https://www.pln.co.id/stakeholder/laporan-statistik (accessed
4.18.18).
PLN, 2017b. Electricity Supply Business Plan 2017-2026 (RUPTL).
PLN, 2017c. RUPTL cost assumptions.
PLN, 2016a. PLN Management Report.
PLN, 2016b. Electricity Supply Business Plan (RUPTL) 2016-2025 . PT
PLN (Persero), Jakarta, Indonesia.
PLN, 2016c. PLN Statistics 2015. Corporate Secretary PT PLN (Persero),
Jakarta.
PLN, 2016d. PLN Statistics 2015. Corporate Secretary PT PLN (Persero),
Jakarta.
PLN, 2006. PLN Statistics 2005. Corporate Secretary PT PLN (Persero).
PLN, 2005. Electricity Supply Business Plan (RUPTL) 2006-2015.
PLN Yogyakarta, 2015. Kenapa Listrik Sering Padam Saat Hujan.
PLTA Cirata, 2018. Fieldwork data.
PLTA Saguling, 2018. Fieldwork data.
Popescu, I., Brandimarte, L., Peviani, M., 2014. Effects of climate change
over energy production in La Plata Basin. Int. J. River Basin Manag.
12, 319–327. https://doi.org/10.1080/15715124.2014.917317
Pratama, Y.W., Purwanto, W.W., Tezuka, T., McLellan, B.C., Hartono, D.,
Hidayatno, A., Daud, Y., 2017. Multi-objective optimization of a
multiregional electricity system in an archipelagic state: The role of
renewable energy in energy system sustainability. Renew. Sustain.
Energy Rev. 77, 423–439. https://doi.org/10.1016/j.rser.2017.04.021
Purwanto, W.W., Pratama, Y.W., Nugroho, Y.S., Warjito, Hertono, G.F.,
Hartono, D., Deendarlianto, Tezuka, T., 2015. Multi-objective

BIBLIOGRAPHY
189
optimization model for sustainable Indonesian electricity system:
Analysis of economic, environment, and adequacy of energy sources.
Renew. Energy 81, 308–318.
https://doi.org/10.1016/j.renene.2015.03.046
PWC, 2017. Power in Indonesia: Investment and Taxation Guide November
2017 5th Edition [WWW Document]. URL
https://www.pwc.com/id/en/energy-utilities-
mining/assets/power/power-guide-2017.pdf (accessed 11.19.19).
Rachmatullah, C., Aye, L., Fuller, R.J., 2007. Scenario planning for the
electricity generation in Indonesia. Energy Policy 35, 2352–2359.
https://doi.org/http://dx.doi.org/10.1016/j.enpol.2006.08.015
Rafiq, M., 2016. BMKG sebut Perubahan Iklim Dingin Sebabkan Migrasi
Ubur-ubur ke Laut Utara Jawa [WWW Document]. detik.com. URL
https://news.detik.com/berita-jawa-timur/3201707/bmkg-sebut-
perubahan-iklim-dingin-sebabkan-migrasi-ubur-ubur-ke-laut-
utara-jawa/komentar (accessed 6.13.18).
Rajendra K. Pachauri, Myles R. Allen, Vicente R. Barros, John Broome,
Wolfgang Cramer, Renate Christ, John A. Church, Leon Clarke, Qin
Dahe, Purnamita Dasgupta, Navroz K. Dubash, Ottmar Edenhofer,
Ismail Elgizouli, Christopher B. Field, Piers Forster, Pie, J.-P. van Y.,
2014. Climate Change 2014: Synthesis Report. Contribution of
Working Groups I, II and III to the Fifth Assessment Report of the
Intergovernmental Panel on Climate Change [Core Writing Team, R.K.
Pachauri and L.A. Meyer (eds.)]. Geneva, Switzerland.
Ravn, H.F., 2001. The Balmorel Model: Theoretical Background. Denmark.
Risø, D.T.U., 2008. Danish Greenhouse Gas Reduction Scenarios for 2020
and 2050.
Rizaldi Boer, Retno Gumilang Dewi, Muhammad Ardiansyah, Ucok W.
Siagian, Agus Gunawan, Akma Yeni Masri, Alan Rosehan, Ardina
Purbo, Arif Darmawan, Arif Wijaya, B., Arunarwati Margono, Budiharto,
Delon Martinus, Endah Tri Kurniawaty, Endang Pratiwi, F.N., Franky
Zamzani, Gamma Nur Merrillia Sularso, Gatot Setiawan, Gito
Immanuel, Guntur Sutiyono, H., Wibowo, Haruni Krisnawati, Heri
Purnomo, Iwan Hendrawan, I Wayan Susi Darmawan, J., Purwanto,
Kurnia Utama, Lia Kartikasari, Liliek Sofitri, Novia Widyaningtyas, R.B.,

BIBLIOGRAPHY
190
Ratnasari, Rias Parinderati, Rien Rakhmana, Rully Dhora Sirait, Rusi
Asmani, Saiful Lathif, S.A., Solicin Manuri, Teddy Rusolono, Vina
Precilia, Wawan Gunawan, Wisnu Murti, and Y.S., 2018. Indonesia
Second Biennial Update Report under the United Nations Framework
Convention on Climate Change. Directorate General of Climate
Change, Ministry of Environment and Forestry.
Rockström, J., Schellnhuber, H., Hoskins, B., Ramanathan, V., Brasseur, G.,
Gaffney, O., Nobre, C., Meinshausen, M., Lucht, W., 2016. Earth ’ s
Future The world ’ s biggest gamble Earth ’ s Future. Earth’s Futur.
4, 465–470. https://doi.org/10.1002/2016EF000392.Received
Rosen, J., Rentz, P.D. rer. nat. O., 2007. The future role of renewable
energy sources in European electricity supply. A model-based
analysis for the EU-15. French-German Inst. Environ. Res.
Universität Karlsruhe (TH), Karlsruhe.
Rothwell, G., Rust, J., 1997. On the Optimal Lifetime of Nuclear Power
Plants. J. Bus. Econ. Stat. 15, 195–208.
https://doi.org/10.2307/1392305
Rubin, E.S., Azevedo, I.M.L., Jaramillo, P., Yeh, S., 2015. A review of learning
rates for electricity supply technologies. Energy Policy 86, 198–218.
https://doi.org/http://dx.doi.org/10.1016/j.enpol.2015.06.011
Sagar, A.D., van der Zwaan, B., 2006. Technological innovation in the
energy sector: R&D, deployment, and learning-by-doing. Energy
Policy 34, 2601–2608.
Sailor, D.J., Pavlova, A.A., 2003. Air conditioning market saturation and
long-term response of residential cooling energy demand to climate
change. Energy 28, 941–951.
https://doi.org/http://dx.doi.org/10.1016/S0360-5442(03)00033-1
Samsudin, M.S.N., Rahman, M.M., Abdul, M.A., 2016. Sustainable Power
Generation Pathways in Malaysia : Development of Long-range
Scenarios Akademia Baru Sustainable Power Generation Pathways
in Malaysia : Development of Long-range Scenarios. J. Adv. Res. Appl.
Mech. 24, 22–38.
Samsudin, M.S.N.B.M.M.S.N.B., 2016. Sustainable power generation
pathways in Malaysia: Development of long-range scenarios.

BIBLIOGRAPHY
191
Schaeffer, R., Szklo, A.S., Pereira de Lucena, A.F., Moreira Cesar Borba,
B.S., Pupo Nogueira, L.P., Fleming, F.P., Troccoli, A., Harrison, M.,
Boulahya, M.S., 2012. Energy sector vulnerability to climate change:
A review. Energy 38, 1–12.
https://doi.org/http://dx.doi.org/10.1016/j.energy.2011.11.056
Seljom, P., Rosenberg, E., Fidje, A., Haugen, J.E., Meir, M., Rekstad, J.,
Jarlset, T., 2011. Modelling the effects of climate change on the
energy system—A case study of Norway. Energy Policy 39, 7310–
7321. https://doi.org/10.1016/J.ENPOL.2011.08.054
Shafiei, E., Davidsdottir, B., Leaver, J., Stefansson, H., Asgeirsson, E.I.,
2015. Economic impact of adaptation to climate change in Iceland’s
energy supply sector, in: International Conference on the European
Energy Market, EEM. https://doi.org/10.1109/EEM.2015.7216623
Sheffield, J., Goteti, G., Wood, E.F., 2006. Development of a 50-Year High-
Resolution Global Dataset of Meteorological Forcings for Land
Surface Modeling. J. Clim. 19, 3088–3111.
https://doi.org/10.1175/JCLI3790.1
Shin, H.-C., Park, J.-W., Kim, H.-S., Shin, E.-S., 2005. Environmental and
economic assessment of landfill gas electricity generation in Korea
using LEAP model. Energy Policy 33, 1261–1270.
https://doi.org/http://dx.doi.org/10.1016/j.enpol.2003.12.002
Shrestha, R.M., Anandarajah, G., Liyanage, M.H., 2009. Factors affecting
CO2 emission from the power sector of selected countries in Asia
and the Pacific. Energy Policy 37, 2375–2384.
https://doi.org/10.1016/j.enpol.2009.01.032
Siagian, U.W.R., Yuwono, B.B., Fujimori, S., Masui, T., 2017. Low-carbon
energy development in Indonesia in alignment with Intended
Nationally Determined Contribution (INDC) by 2030. Energies 10.
https://doi.org/10.3390/en10010052
Sieber, J., 2019. Water Evaluation And Planning (WEAP) System, Software
version: 2019.0, Stockholm Environment Institute, Somerville, MA,
USA [WWW Document]. URL https://www.weap21.org (accessed
2.21.19).
Sieber, J., 2013. Impacts of, and adaptation options to, extreme weather

BIBLIOGRAPHY
192
events and climate change concerning thermal power plants. Clim.
Change 121, 55–66. https://doi.org/10.1007/s10584-013-0915-0
Simioni, T., Schaeffer, R., 2019. Georeferenced operating-efficiency solar
potential maps with local weather conditions – An application to
Brazil. Sol. Energy 184, 345–355.
https://doi.org/10.1016/J.SOLENER.2019.04.006
Solar Energy Laboratory University of Wisconsin-Madison, 2013. TRNSYS
17 [WWW Document]. URL
http://sel.me.wisc.edu/trnsys/features/features.html
Spalding-fecher, D.R., 2018. Impact of climate change and irrigation
development on hydropower supply in the Zambezi River Basin , and
implications for power sector development in the Southern African
Power Pool.
Spalding-Fecher, R., Joyce, B., Winkler, H., 2017. Climate change and
hydropower in the Southern African Power Pool and Zambezi River
Basin: System-wide impacts and policy implications. Energy Policy
103, 84–97. https://doi.org/10.1016/J.ENPOL.2016.12.009
Stich, J., Hamacher, T., 2016. The cost-effectiveness of power generation
from geothermal potentials in Indonesia and the Philippines, in: IEEE
PES Innovative Smart Grid Technologies Conference Europe. pp.
177–182. https://doi.org/10.1109/ISGT-Asia.2016.7796382
Syariman, P., Heru, A., 2011. Extreme Weather Impacts on Citarum
Cascade Reservoir Operation Pattern 2011. J. Tek. Hidraul. 2 No.1,
57–68.
Takase, K., Suzuki, T., 2011. The Japanese energy sector: Current
situation, and future paths. Energy Policy 39, 6731–6744.
https://doi.org/http://dx.doi.org/10.1016/j.enpol.2010.01.036
Tanjung Jati, 2007. Tanjung Jati B Dimatikan [WWW Document].
merdeka.com. URL https://www.merdeka.com/uang/pasokan-
batubara-terganggu-pltu-tanjung-jati-b-dimatikan-5brucri.html
(accessed 6.13.18).
Tao, Z., Zhao, L., Changxin, Z., 2011. Research on the prospects of low-
carbon economic development in China based on LEAP model.
Energy Procedia 5, 695–699.

BIBLIOGRAPHY
193
https://doi.org/http://dx.doi.org/10.1016/j.egypro.2011.03.123
Teotónio, C., Fortes, P., Roebeling, P., Rodriguez, M., Robaina-Alves, M.,
2017. Assessing the impacts of climate change on hydropower
generation and the power sector in Portugal: A partial equilibrium
approach. Renew. Sustain. Energy Rev. 74, 788–799.
https://doi.org/https://doi.org/10.1016/j.rser.2017.03.002
The JGCRI GCAM Team, 2016. Overview of the Global Change
Assessment Model (GCAM) . Joint Global Change Research Institute
, Joint GCAM Community Modeling Meeting and GTSP Technical
Workshop, Maryland, USA.
The World Bank Group, 2019. Climate Change Knowledge Portal. Country:
Indonesia [WWW Document]. URL
https://climateknowledgeportal.worldbank.org/country/indonesia
(accessed 4.18.19).
Tobin, I., Greuell, W., Jerez, S., Ludwig, F., Vautard, R., Van Vliet, M.T.H.,
Breón, F.M., 2018. Vulnerabilities and resilience of European power
generation to 1.5 °c, 2 °c and 3 °c warming. Environ. Res. Lett.
13. https://doi.org/10.1088/1748-9326/aab211
Tot, M., 2012. IAEA’s Tool for Energy Supply System Assessment
MESSAGE Modelling Framework. IRENA-ECREEE Workshop on
Energy Planning, , Abidjan, Cote D’Ivoire.
Totschnig, G., Hirner, R., Müller, A., Kranzl, L., Hummel, M., Nachtnebel,
H.P., Stanzel, P., Schicker, I., Formayer, H., 2017. Climate change
impact and resilience in the electricity sector: The example of Austria
and Germany. Energy Policy 103, 238–248.
https://doi.org/10.1016/j.enpol.2017.01.019
Turner, S.W.D., Hejazi, M., Kim, S.H., Clarke, L., Edmonds, J., 2017. Climate
impacts on hydropower and consequences for global electricity
supply investment needs. Energy 141.
https://doi.org/10.1016/j.energy.2017.11.089
U.S. NRC, 2017. Glossary [WWW Document]. URL
https://www.nrc.gov/reading-rm/basic-ref/glossary/capacity-
factor-net.html
Ulleberg, O., Morkved, A., 2008. Renewable Energy and Hydrogen System

BIBLIOGRAPHY
194
Concepts for Remote Communities in the West Nordic Region: The
Nolsoy Case Study. Institute for Energy Technology.
UNFCCC, 2016. Aggregate effect of the intended nationally determined
contributions: an update synthesis report by the secretariat.
UNFCCC, 2007a. Climate Change: Impacts, Vulnerabilities and Adaptation
in Developing Countries [WWW Document]. URL
http://unfccc.int/resource/docs/publications/impacts.pdf
(accessed 11.30.18).
UNFCCC, 2007b. Climate Change: Impacts, Vulnerabilities and Adaptation
in Developing Countries [WWW Document]. United Nations Framew.
Conv. Clim. Chang. URL
http://unfccc.int/resource/docs/publications/impacts.pdf
Urban, F., Benders, R.M.J., Moll, H.C., 2007. Modelling energy systems for
developing countries. Energy Policy 35, 3473–3482.
https://doi.org/http://dx.doi.org/10.1016/j.enpol.2006.12.025
USAID, 2017. Climate Risk Profile Indonesia [WWW Document]. URL
https://www.climatelinks.org/resources/climate-risk-profile-
indonesia (accessed 11.23.18).
van Vliet, M.T.H., Yearsley, J.R., Ludwig, F., Vogele, S., Lettenmaier, D.P.,
Kabat, P., 2012. Vulnerability of US and European electricity supply
to climate change. Nat. Clim. Chang. 2, 676–681.
van Vuuren, D.P., Hoogwijk, M., Barker, T., Riahi, K., Boeters, S., Chateau,
J., Scrieciu, S., van Vliet, J., Masui, T., Blok, K., Blomen, E., Kram, T.,
2009. Comparison of top-down and bottom-up estimates of sectoral
and regional greenhouse gas emission reduction potentials. Energy
Policy 37, 5125–5139.
https://doi.org/http://dx.doi.org/10.1016/j.enpol.2009.07.024
Véliz, K.D., Kaufmann, R.K., Cleveland, C.J., Stoner, A.M.K., 2017. The
effect of climate change on electricity expenditures in
Massachusetts. Energy Policy 106, 1–11.
https://doi.org/http://dx.doi.org/10.1016/j.enpol.2017.03.016
Veselka, T., 2014. GTMax Overview Capabilities and Features.
Vine, E., 2012. Adaptation of California’s electricity sector to climate

BIBLIOGRAPHY
195
change. Clim. Change 111, 75–99.
Wan, L., Wang, C., Cai, W., 2016. Impacts on water consumption of power
sector in major emitting economies under INDC and longer term
mitigation scenarios: An input-output based hybrid approach. Appl.
Energy 184, 26–39.
https://doi.org/http://dx.doi.org/10.1016/j.apenergy.2016.10.013
Ward, D.M., 2013. The effect of weather on grid systems and the reliability
of electricity supply. Clim. Change 121, 103–113.
https://doi.org/10.1007/s10584-013-0916-z
Watanabe, C., 1995. Identification of the role of renewable energy: A view
from Japan’s challenge: The New Sunshine Program. Renew. Energy
6, 237–274. https://doi.org/http://dx.doi.org/10.1016/0960-
1481(95)00032-F
Wijaya, M.E., Limmeechokchai, B., 2010. The hidden costs of fossil power
generation in Indonesia: A reduction approach through low carbon
society. Songklanakarin J. Sci. Technol. Vol 32 81–89.
Wilson, C., Grubler, A., 2011. Lessons from the history of technological
change for clean energy scenarios and policies. Nat. Resour. Forum
35, 165–184. https://doi.org/10.1111/j.1477-8947.2011.01386.x
Wing, I.S., Daenzer, K., Fisher-Vanden, K., Calvin, K., 2011. Phoenix Model
Documentation, Joint Global Change Research Institute, Pacific
Northwest National Laboratory.
Wongsapai, W., Ritkrerkkrai, C., Pongthanaisawan, J., 2016. Integrated
Model for Energy and CO2 Emissions Analysis from Thailand’s Long-
term Low Carbon Energy Efficiency and Renewable Energy Plan.
Energy Procedia 100, 492–495.
https://doi.org/https://doi.org/10.1016/j.egypro.2016.10.208
World Bank, 2017. Hydropower Sector Climate Resilience Guidelines. World
Bank.
World Bank, 2011. Vulnerability, risk reduction and adaptation to Climate
change: Indonesia [WWW Document]. URL
http://sdwebx.worldbank.org/climateportalb/doc/GFDRRCountryPr
ofiles/wb_gfdrr_climate_change_country_profile_for_IDN.pdf (accessed
11.20.18).

BIBLIOGRAPHY
196
World Bank, 2010. World development report 2010. Development and
climate change [WWW Document]. URL
https://siteresources.worldbank.org/INTWDR2010/Resources/5287
678-1226014527953/WDR10-Full-Text.pdf (accessed 6.25.19).
Wright, T.P., 1936. Factors Affecting the Cost of Airplanes. J. Aeronaut.
Sci. 3, 122–128. https://doi.org/10.2514/8.155
Yophy, H., Jeffrey, B.Y., Chieh-Yu, P., 2011. The long-term forecast of
Taiwan’s energy supply and demand: LEAP model application. Energy
Policy 39, 6790–6803. https://doi.org/10.1016/j.enpol.2010.10.023
Zhang, Y., Gu, A., Lu, H., Wang, W., 2017. Hydropower generation
vulnerability in the Yangtze River in China under climate change
scenarios: Analysis based on the WEAP model. Sustain. 9.
https://doi.org/10.3390/su9112085
Zheng, X., Wang, C., Cai, W., Kummu, M., Varis, O., 2016. The vulnerability
of thermoelectric power generation to water scarcity in China:
Current status and future scenarios for power planning and climate
change. Appl. Energy 171, 444–455.
https://doi.org/http://dx.doi.org/10.1016/j.apenergy.2016.03.040


APPENDICES
199
Appendix 2.A: Systematic screening of energy models
Table 2A.1: Inventory of energy system models
Suitability Criteria
No. Model Able to simulate
capacity expansion of a large power system
Wide options of power generation
technologies
Calculate costs
Simulation period of min
10 years
Calculate CO2
emissions
1 AEOLIUS (Connolly et al., 2010; Rosen and Rentz, 2007)
No Yes Yes No Yes
2 BALMOREL (Connolly et al., 2010; Ravn, 2001)
Yes Yes Yes Yes Yes
3 BHCP Screening Tool (Connolly et al., 2010; MacDonald and Fischer, 2007)
No No Yes No Yes
4 Compare Options for Sustainable
Energy/COMPOSE (Connolly et al., 2010; Blarke, 2008)
No Yes Yes Yes Yes
5 E4cast (Connolly et al., 2010; Akmal et al., 2004)
Yes Yes Yes Yes Yes
6 Electricity Market Complex Adaptive Systems/EMCAS (North et al., 2002)
No Yes Yes Yes No
7 Early Market Introduction of New Energy Technologies/EMINEN (Connolly et al., 2010; Klemeš et al., 2009)
Yes Yes Yes No Yes

APPENDICES
200
No Model Able to simulate
capacity expansion of a large power system
Wide options of power generation
technologies
Calculate costs
Simulation period of min
10 years
Calculate CO2
emissions
8 EFI’s Multi-Area Powermarket Simulator/EMPS (Connolly et al., 2010; Doorman et al., 2004)
Yes Yes Yes Yes Yes
9 EnergyPLAN (Lund, 2013)l Yes Yes Yes No Yes
10 EnergyPRO (Connolly et al., 2010; EMD International A/S, 2017)
No Yes Yes Yes Yes
11 Energy and Power Evaluation Program/ENPEP-BALANCE (Connolly et al., 2010; CEEESA, 2017)
Yes Yes Yes Yes Yes
12 Generation and Transmission Maximisation Tool/GTMax (Connolly et al., 2010; Veselka, 2014)
No Yes Yes Yes No
13 H2RES (Connolly et al., 2010; Duić and da Graça Carvalho, 2004)
No Yes Yes Yes Yes
14 HOMER (Connolly et al., 2010; Lambert et al., 2006)
No Yes Yes No Yes
15 Hydrogen Energy Models/HYDROGEMS (Connolly et al., 2010; Ulleberg and Morkved, 2008)
No Yes Yes No Not clear*
16 IKARUS (Connolly et al., 2010; Martinsen et al., 2006)
Yes Yes Yes Yes Yes

APPENDICES
201
No Model Able to simulate
capacity expansion of a large power system
Wide options of power generation
technologies
Calculate costs
Simulation period of min
10 years
Calculate CO2
emissions
17 International Network for Sustainable Energy/INFORSE (Connolly et al., 2010)
Yes Yes Yes Yes Yes
19 Long-range Energy Alternative Planning System/LEAP (Heaps, 2017)
Yes Yes Yes Yes Yes
20 MARKet ALlocation model (MARKAL)/The Integrated MARKAL-EFOM System/TIMES (Loulou and Labriet, 2008)
Yes Yes Yes Yes Yes
21 Model for Energy Supply Strategy Alternatives and their General Environmental impact/MESSAGE (Connolly et al., 2010; Tot, 2012)
Yes Yes Yes Yes Yes
22 Mini Climate Assessment Model (MiniCAM )/Global Change Assessment Model/GCAM (The JGCRI GCAM Team, 2016)
Yes Yes Yes Yes Yes
23 National Energy Modelling System/NEMS (EIA, 2009)
Yes Yes Yes Yes Yes
24 Oak Ridge Competitive Electricity Dispatch/ORCED (Hadley, 2008)
Yes Yes Yes Yes Yes

APPENDICES
202
No Model Able to simulate
capacity expansion of a large power system
Wide options of power generation
technologies
Calculate costs
Simulation period of min
10 years
Calculate CO2
emissions
25 Programme-package for Emission Reduction Strategies in Energy Use and Supply-Certificate Trading/PERSEUS (Rosen and Rentz, 2007)
Yes Yes Yes Yes Yes
26 PRIMES (Mantzos and Capros, 1998) Yes Yes Yes Yes Yes
27 ProdRisk (Connolly et al., 2010) No No Yes Yes Not clear*
28 RAMSES (Connolly et al., 2010) Yes Yes Yes Yes Yes
29 Renewable Energy Technology Screening Model/RETScreen (Connolly et al., 2010)
No Yes Yes Yes Yes
30 Simulation of Renewable Energy Networks/SimREN (Lehmann, 2003)
Yes Yes Yes Yes Not clear*
31 SIVAEL (Connolly et al., 2010) No No Yes No Yes
32 Sustainable Technology Research and Energy Analysis Model/ STREAM (Risø, 2008)
Yes Yes Yes Yes Yes
33 TRNSYS16 (Solar Energy Laboratory University of Wisconsin-Madison, 2013)
No No Not clear*
Yes Not clear*

APPENDICES
203
No Model Able to simulate
capacity expansion of a large power system
Wide options of power generation
technologies
Calculate costs
Simulation period of min
10 years
Calculate CO2
emissions
34 UniSyD3.0 (Connolly et al., 2010) Yes Yes Yes Yes Yes
35 Wien Automatic System Planning Package/WASP (IAEA, 2006)
Yes Yes Yes Yes Yes
36 WILMAR Planning Tool (Meibom, 2005) No Yes Yes No Yes
37 Regional Energy Scenario Generator/RESGEN (Foell et al., 1995)
Yes Yes Yes Yes No
38 Energy Flow Optimisation Model/EFOM (De Kruijk, 1994)
Yes Yes Yes Yes No
39 Prospective outlook on long-term energy systems/POLES (Enerdata, 2012)
Yes Yes Yes Yes Yes
40 World Energy Model/WEM (OECD/IEA, 2017)
Yes Yes Yes Yes Yes
41 System for the analysis of global energy markets/SAGE (DOE, 2003)
Yes Yes Yes Yes Yes
42 Electricity Generation Expansion Analysis System/EGEAS (Ng, 2015)
Yes Yes Yes Yes Yes
43 Asia-Pacific Integrated Model/AIM (AIM Project Team, 2016)
Yes Yes Yes Yes Yes
44 Atmospheric Stabilization Framework/ASF (IPCC, 2000)
Yes Yes Yes Yes Yes

APPENDICES
204
No Model Able to simulate
capacity expansion of a large power system
Wide options of power generation
technologies
Calculate costs
Simulation period of min
10 years
Calculate CO2
emissions
45 TARGETS-IMAGE Energy Regional Model/IMAGE-TIMER (De Vries et al., 2002)
Yes Yes Yes Yes Yes
46 Multiregional Approach for Resource and Industry Allocation/MARIA (IPCC, 2000)
Yes Yes Yes Yes Yes
47 PowerPlan (Benders, 1996) Yes Yes Yes Yes Yes
48 Second Generation Model (SGM)/Phoenix (Wing et al., 2011)
Yes Yes Yes Yes Yes
*Unclear due to insufficient information

APPENDICES
205
Table 2A.2: Accessibility of the suitable models
No Tools Accessibility Link to free download
1. Balmorel Free* http://www.balmorel.com/index.php/downloadmodel
2. E4cast Commercial
3. EMPS Commercial
4. ENPEP-BALANCE Free Email to [email protected]
5. H2RES Internal use only
6. IKARUS Commercial
7. INFORSE Free to INFORSE members and cooperating European networks
8. LEAP Free** https://www.energycommunity.org/default.asp?action=download
9. MARKAL/TIMES Commercial
10. Mesap PLanet Commercial
11. MESSAGE Free***
12. MiniCAM/ GCAM Free* http://www.globalchange.umd.edu/gcam/download/
13. NEMS The model is free, but users must purchase the simulator
https://www.eia.gov/bookshelf/models2001/NationalEnergy.html
14. ORCED Used to be free to download
15. PERSEUS Commercial
16. PRIMES Commercial
17. SimREN Commercial
18. STREAM Free http://streammodel.org/downloads.html

APPENDICES
206
No Tools Accessibility Link to free download
19. UniSyD3.0 Contact: Prof. Jonathan Leaver: [email protected]
20. WASP Free IAEA member states
21. POLES Commercial
22. WEM Internal use
23. SAGE Model source codes are available* http://www.globaloilwatch.com/reports/mdr-system-analysis-global-energy-markets-eia-082003.pdf
24. EGEAS Commercial
25. AIM Free* http://www-iam.nies.go.jp/aim/data_tools/index.html
26. ASF Internal use
27. IMAGE/TIMER Contact: [email protected]
28. MARIA Internal use
29. PowerPlan Commercial
30 SGM/Phoenix Model source codes are available* http://www.globalchange.umd.edu/data/models/phx_documentation_august_2011.pdf
*The program is written in GAMS modeling language, which is a commercial software. **Free for students and non-profit institutions in
developing countries. ***Free for academic purposes and the International Atomic Energy Agency (IAEA) member states.
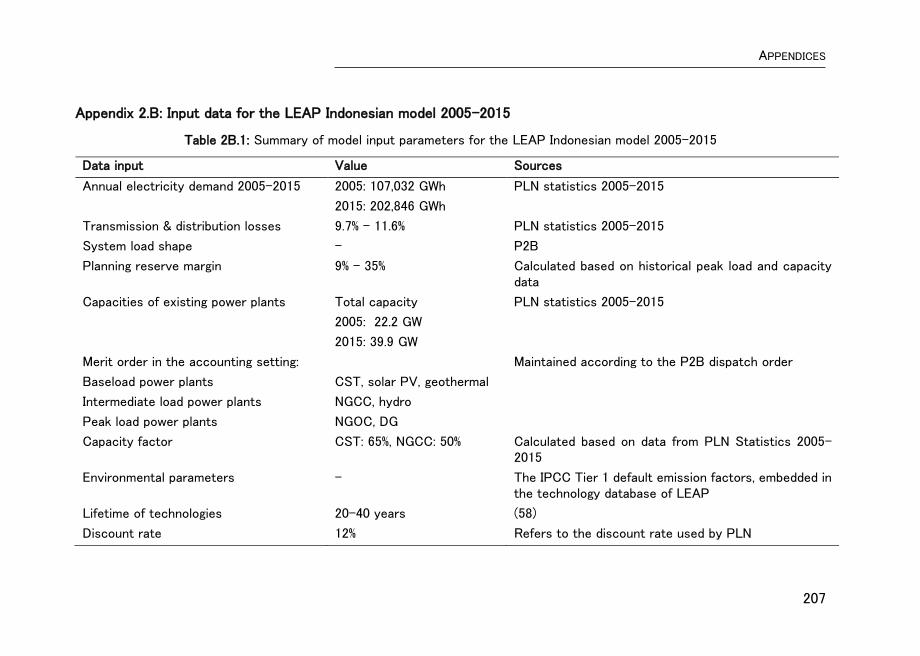
APPENDICES
207
Appendix 2.B: Input data for the LEAP Indonesian model 2005-2015
Table 2B.1: Summary of model input parameters for the LEAP Indonesian model 2005-2015
Data input Value Sources
Annual electricity demand 2005-2015 2005: 107,032 GWh
2015: 202,846 GWh
PLN statistics 2005-2015
Transmission & distribution losses 9.7% - 11.6% PLN statistics 2005-2015
System load shape - P2B
Planning reserve margin 9% - 35% Calculated based on historical peak load and capacity data
Capacities of existing power plants Total capacity
2005: 22.2 GW
2015: 39.9 GW
PLN statistics 2005-2015
Merit order in the accounting setting:
Baseload power plants
Intermediate load power plants
Peak load power plants
CST, solar PV, geothermal
NGCC, hydro
NGOC, DG
Maintained according to the P2B dispatch order
Capacity factor CST: 65%, NGCC: 50% Calculated based on data from PLN Statistics 2005-2015
Environmental parameters - The IPCC Tier 1 default emission factors, embedded in the technology database of LEAP
Lifetime of technologies 20-40 years (58)
Discount rate 12% Refers to the discount rate used by PLN

APPENDICES
208
Table 2B.2: Cost data for the capacity addition 2006-2015
Technologies
Investment Costa (2005 US$/kW)
Variable OM Costsb (2005 US$/MWh)
Fuel Costs Costs (2005 US$)b
Unit
CST 850 2.2 25.7 Per metric ton of coal
NGCC 550 5.2 2.65 Per MMBTU of natural gas
Sources: aRUPTL 2006-2015 (PLN, 2005); bPLN Statistics 2005 (PLN, 2006)

APPENDICES
209
Appendix 2.C: Input data for Java-Bali power system expansion 2016-
2030
Fig. 2C.1: Load shape of the Java Bali power system (P2B, 2016a)
Table 2C.1: Power generation capacity of the Java-Bali Power System (P2B,
2016a)
Power plants Net Capacity (MW)
Coal steam turbine 17,339
Natural gas combines cycle 8,971
Hydro 2,477
Geothermal 1,092
Natural gas open cycle 1066
Diesel generator 260
Natural gas engine 200
Total 31,405
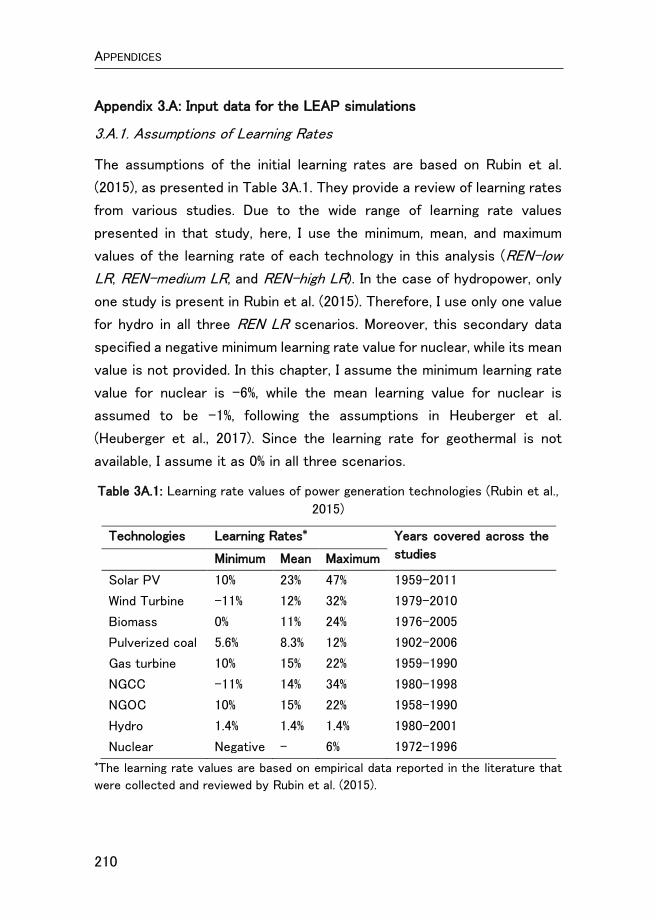
APPENDICES
210
Appendix 3.A: Input data for the LEAP simulations
3.A.1. Assumptions of Learning Rates
The assumptions of the initial learning rates are based on Rubin et al.
(2015), as presented in Table 3A.1. They provide a review of learning rates
from various studies. Due to the wide range of learning rate values
presented in that study, here, I use the minimum, mean, and maximum
values of the learning rate of each technology in this analysis (REN-low
LR, REN-medium LR, and REN-high LR). In the case of hydropower, only
one study is present in Rubin et al. (2015). Therefore, I use only one value
for hydro in all three REN LR scenarios. Moreover, this secondary data
specified a negative minimum learning rate value for nuclear, while its mean
value is not provided. In this chapter, I assume the minimum learning rate
value for nuclear is -6%, while the mean learning value for nuclear is
assumed to be -1%, following the assumptions in Heuberger et al.
(Heuberger et al., 2017). Since the learning rate for geothermal is not
available, I assume it as 0% in all three scenarios.
Table 3A.1: Learning rate values of power generation technologies (Rubin et al.,
2015)
Technologies Learning Rates* Years covered across the
studies
Minimum Mean Maximum
Solar PV 10% 23% 47% 1959-2011
Wind Turbine -11% 12% 32% 1979-2010
Biomass 0% 11% 24% 1976-2005
Pulverized coal 5.6% 8.3% 12% 1902-2006
Gas turbine 10% 15% 22% 1959-1990
NGCC -11% 14% 34% 1980-1998
NGOC 10% 15% 22% 1958-1990
Hydro 1.4% 1.4% 1.4% 1980-2001
Nuclear Negative - 6% 1972-1996 *The learning rate values are based on empirical data reported in the literature that
were collected and reviewed by Rubin et al. (2015).

APPENDICES
211
Appendix 3.B: Learning curves of solar PV
The optimization simulations in LEAP result in a massive deployment of
solar PV in all three technological learning scenarios. Hence, the capital
cost of solar PV reduced over time, as depicted in Fig. 3C.1 (for the REN-
medium LR scenario). Fig. 3B.1 (a) shows a continues reduction in the
capital cost of solar PV along with the increase in its cumulative capacity.
As Fig. 3B.1 (b) illustrates, in Phases I and II, the cost reduction occurs
faster. Meanwhile, in the later phases, the costs reduce slower partly
because of the reduction in the learning rate value as well as the
cumulative capacity already being high. In Phase II, the cumulative capacity
reaches nearly 20 GW; thus, in Phase III, it requires another 20 GW of
additional capacity to gain a 9% cost reduction, as assumed for the REN-
Medium LR scenario (see Table 3A.1). Furthermore, in Phase IV, it requires
another nearly 40 GW additional capacity to gain 4% of cost reduction.

APPENDICES
212
(a)
(b)
Fig. 2C.1: Learning curves of solar PV assuming the medium value of the initial
learning rate: (a) depicts a continuous cost reduction based on Eq. (9), while (b)
depicts a linear approximation of the cost reduction in (a) that divides into four
phases.
0
500
1000
1500
2000
2500
0 20,000 40,000 60,000 80,000 100,000 120,000
Cap
ital
co
st (
20
15
US$
/kW
)
Cummulative capacity (Megawatt)
0
500
1000
1500
2000
2500
0 20,000 40,000 60,000 80,000 100,000 120,000
Cap
ital
co
st (
20
15
US$
/KW
)
Cummulative capacity (Megawatt)
Phase I
Phase II
Phase III Phase IV

APPENDICES
213
Appendix 4.A: Indonesia’s vulnerability to climate change
Being a vast archipelagic country with 81,000 km of coastline and 42
million inhabitants living in low-lying areas, Indonesia is highly vulnerable
to the adverse impacts of climate change (USAID, 2017). As many as 2,000
small islands are projected to sink by mid-century. Furthermore, by 2100,
an estimate of 5.9 million people every year will be affected by coastal
flooding. Other impacts of climate change include extended dry seasons,
an increased frequency of extreme climate occurrences, and degraded
biodiversity (BAPPENAS, 2014). A World Bank analysis ranks Indonesia
12th among 35 countries with high mortality risks due to multiple hazards,
including climate-related hazards such as floods, landslides, and droughts
(Dutch Sustainability Unit, 2016). Accordingly, an estimated 40% of
Indonesians are at risk of various hazards, including earthquakes, tsunamis,
volcanic eruptions, floods, landslides, droughts, and forest fires (World
Bank, 2011). Table 4A.1 summarizes the trends and projections of the
Indonesian climate.

APPENDICES
214
Table 4A.1 Historical trends and future projections of the Indonesian climate.
Source: (GERICS, 2015; USAID, 2017)
Climate parameters
Historical trends Future projections
Temperature Mean annual temperature increased 0.04°C per decade between 1985 to 2015
Mean annual temperature increase of 1.1 to 3.2°C by 2085
Heatwaves The frequency of hot days and nights increased +88 days and +95 nights, respectively, since 1960.
- Increase in the duration of heat waves ranging from 23 to 1340 days by 2085
- The decrease in the duration of cold spell ranging from -10 to -1 day
Rainfall Average annual rainfall increased by 12% from 1985 to 2015
- Although projections for rainfall differ, they point to increased rainfall during the wet season
- A slight increase in the duration of dry spells (+2 days).
- Increase in frequency and intensity of heavy rainfall events by 3-31% and 2-13%, respectively
Sea level Sea level rise of 2-10 mm per year from 1993 to 2012
Sea level rise of 150-450 mm by 2056
Tropical glacier
Decreased of tropical Papua glaciers cover by 78% from 1936 to 2006
The disappearance of Papua glaciers

APPENDICES
215
Appendix 4.B: Questionnaires and secondary data
Table 4B.1: List of questions for head office representatives
No Questions Expected supporting documents
1. Based on your experience, how do weather and climate affect the power generation, transmission, and distribution networks?
2. Has flood ever occurred and affected the electricity infrastructure? How often? What was the cause? Did the infrastructure shut down? How much was the financial loss?
Documentation of the flood
3. What has been done to deal with the floods? How much do these actions cost?
4. Were there any interruptions on electricity supply attributable to extreme weather? What and when? How much were the financial losses?
How did the operation interruption affect the rest of the economy (in the region/island/country – choose the relevant)?
Documentation of operation interruptions due to extreme weather.
5. Are there any policies and programs addressing climate change impact and adaptation? Is there any budget allocated?
Copy of policies and programs
$$ of investments planned
Table 4B.2: List of questions concerning transmission networks
No Questions Expected supporting documents
1. Has flood ever occurred in substations, and transmission networks? How often? What were the causes? Did they cause power cuts? How much were the financial losses?
Documentation of the flood SOP of dealing with floods
2. What has been done to deal with the floods? How much do they cost?
3. Was there any operation interruption due to extreme weather? What and when? How often? How much was the financial loss?
Documentation of operation interruptions due to extreme weather
4. Are there any policies and programs addressing climate change impact and adaptation? Is there any budget allocated?
Copy of policies and programs
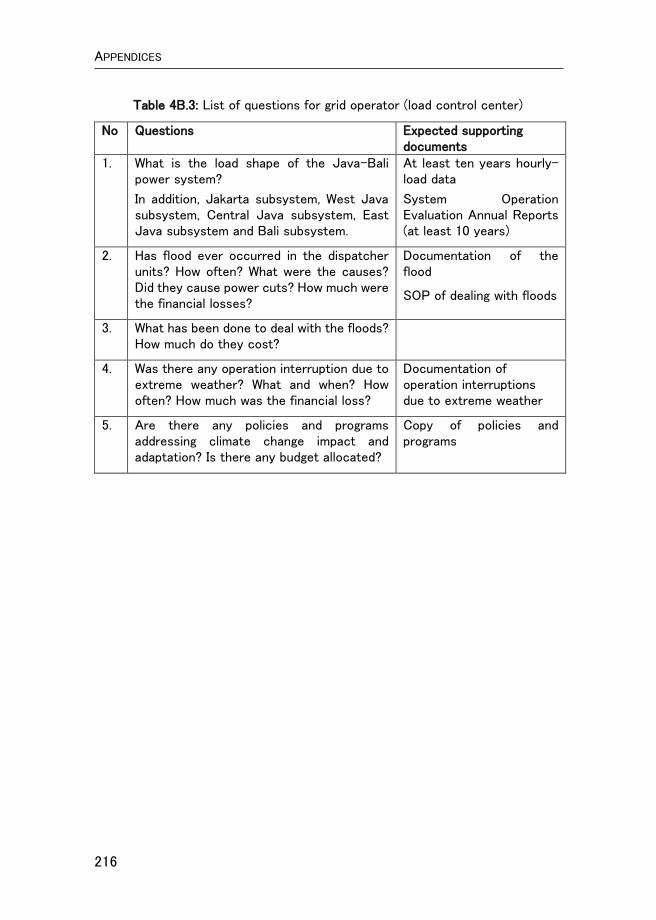
APPENDICES
216
Table 4B.3: List of questions for grid operator (load control center)
No Questions Expected supporting documents
1. What is the load shape of the Java-Bali power system?
In addition, Jakarta subsystem, West Java subsystem, Central Java subsystem, East Java subsystem and Bali subsystem.
At least ten years hourly-load data
System Operation Evaluation Annual Reports (at least 10 years)
2. Has flood ever occurred in the dispatcher units? How often? What were the causes? Did they cause power cuts? How much were the financial losses?
Documentation of the flood
SOP of dealing with floods
3. What has been done to deal with the floods? How much do they cost?
4. Was there any operation interruption due to extreme weather? What and when? How often? How much was the financial loss?
Documentation of operation interruptions due to extreme weather
5. Are there any policies and programs addressing climate change impact and adaptation? Is there any budget allocated?
Copy of policies and programs
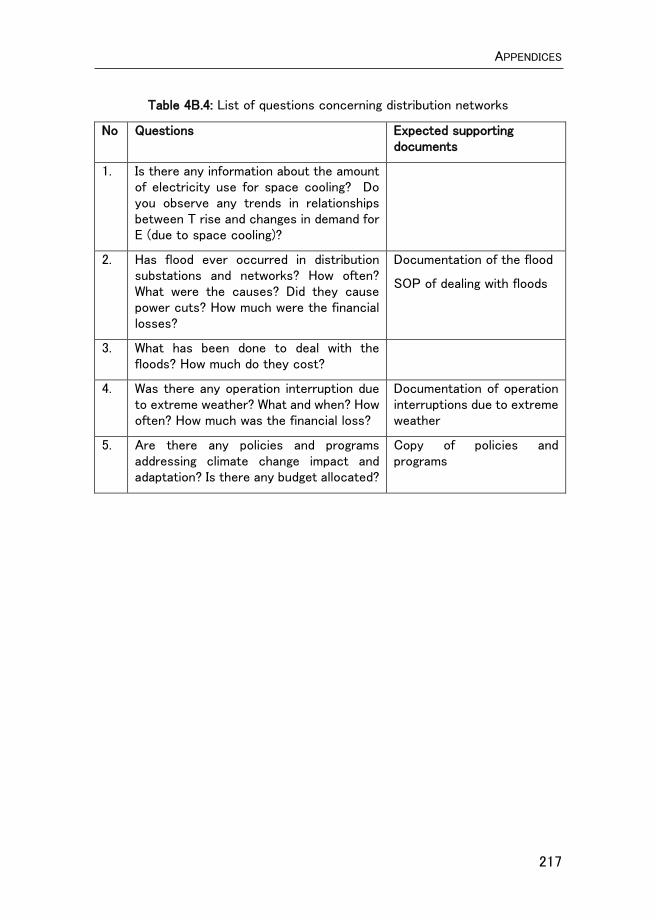
APPENDICES
217
Table 4B.4: List of questions concerning distribution networks
No Questions Expected supporting documents
1. Is there any information about the amount of electricity use for space cooling? Do you observe any trends in relationships between T rise and changes in demand for E (due to space cooling)?
2. Has flood ever occurred in distribution substations and networks? How often? What were the causes? Did they cause power cuts? How much were the financial losses?
Documentation of the flood
SOP of dealing with floods
3. What has been done to deal with the floods? How much do they cost?
4. Was there any operation interruption due to extreme weather? What and when? How often? How much was the financial loss?
Documentation of operation interruptions due to extreme weather
5. Are there any policies and programs addressing climate change impact and adaptation? Is there any budget allocated?
Copy of policies and programs

APPENDICES
218
Table 4B.5: List of questions concerning hydropower plants
No Questions Expected supporting documents
1. What is the trend of precipitation and water level? Has the water level changed from the first year of operation?
Monitoring data of precipitation, water inflow, the water level
2. How does the trend affect electricity production?
Monitoring data on electricity production
3. Was there any operation interruption due to low water level/drought or excessive water? How often? How much were the financial losses?
Water level and electricity production data
4. Have there been any actions done to increase the water level? What are they? How much do they cost?
5. Has flood ever occurred in the power plants? How often? What was the cause? Did the plant shut down? How much was the financial loss?
Documentation of the flood
SOP of dealing with floods
6. What has been done to deal with the floods? How much do they cost?
7. Was there any operation interruption due to extreme weather? What and when? How often? How much were the financial losses?
Documentation of operation interruptions due to extreme weather
8. Are there any company’s policies and programs addressing climate change impact and adaptation? Is there any budget allocated?
Copy of policies and programs

APPENDICES
219
Table 4B.6: List of questions concerning thermal power plants (coal- and gas-
based power plants)
No Questions Expected supporting documents
1. What is the trend of cooling water temperature?
Monitoring data on cooling water temperature in last (5, 10, 15 years if possible)
2. Is there any correlation between cooling water temperature and power plant efficiency? What and how?
Monitoring data on cooling water temperature and power plant’s efficiency
3. Has the sea level changed from the first year of operation?
Sea level data
4. What has been done to maintain the cooling water temperature at the desired level? How much does it cost?
To what extent (in %?) were you able to recover the power output to the pre-warming levels?
5. Has flood ever occurred and affected the power plants? How often? What was the cause? Did the plant shut down? How much was the financial loss?
Documentation of the flood
6. What has been done to deal with the floods? How much do these actions cost?
7. Was there any operation interruption due to extreme weather? What and when? How much were the financial losses?
Documentation of operation interruptions due to extreme weather.
8. Are there any policies and programs addressing climate change impact and adaptation? Is there any budget allocated?
Copy of policies and programs
$$ of investments planned

APPENDICES
220
Appendix 4.C: Historical data of hydroelectric power plants
(a)
(b)
Fig. 4C.1: Historical data on electricity production and water inflow Saguling HEPP
(a) and Cirata HEPP (b). Source: own fieldwork.
0
20
40
60
80
100
120
140
160
180
0
500
1,000
1,500
2,000
2,500
3,000
3,500
4,000
4,500
5,000
m3
/s
GW
h
Electricity production (GWh) Water inflow (m3/s)
0
50
100
150
200
250
300
0
500
1,000
1,500
2,000
2,500
3,000
m3/s
GW
h
Electricity production (GWh) Water inflow (m3/s)

APPENDICES
221
(a)
(b)
Fig. 4C.2: Correlation between precipitation, water inflow, and electricity
production: Cirata HEPP 2013-2017. (a) Monthly water inflow as a function of
precipitation15; (b) Monthly electricity production as a function of water inflow.
Source: own analysis.
15Precipitation data from seven weather stations
y = -2E-08x3 + 8E-05x2 + 0.0025x + 99.71R² = 0.619
0
50
100
150
200
250
300
350
400
450
0 500 1000 1500 2000 2500 3000
Wat
er in
flo
w (
m3
/s)
Precipitation (mm)
Precipitation vs water inflow to the reservoir
y = 5E-06x3 - 0.0027x2 + 0.8294x + 30.718R² = 0.7447
0
50
100
150
200
250
300
50 150 250 350 450
Elec
tric
ity
pro
du
ctio
n (
GW
h)
Water inflow (m3/s)
Eater inflow vs production

APPENDICES
222
Appendix 5.A: Projection of temperature and precipitation changes
Table 5A.1: Historical and projected changes in temperature
Month Temperature (ºC)
1986-2005 Projected changed
2020-2039 2040-2059
RCP4.5 RCP8.5 RCP4.5 RCP8.5
January 25.88 0.69 0.76 1.03 1.37
February 25.94 0.73 0.82 1.09 1.45
March 26.22 0.72 0.81 1.06 1.40
April 26.43 0.75 0.83 1.05 1.42
May 26.41 0.71 0.82 1.07 1.43
June 26.05 0.72 0.81 1.07 1.45
July 25.73 0.73 0.84 1.06 1.42
August 25.74 0.71 0.82 1.07 1.41
September 25.92 0.77 0.82 1.10 1.43
October 26.20 0.77 0.83 1.09 1.43
November 26.21 0.74 0.84 1.09 1.41
December 25.95 0.69 0.79 1.02 1.39
Table 5A.2: Historical and projected changes in temperature
Month Precipitation (mm)
1986-2005 Projected changed
2020-2039 2040-2059
RCP 4.5 RCP 8.5 RCP 4.5 RCP 8.5
January 336.73 18.08 9.42 29.90 20.87
February 266.76 -3.62 4.48 0.52 14.48
March 343.74 0.83 15.38 15.36 15.56
April 327.12 -5.28 4.32 10.43 13.86
May 240.61 -6.10 -1.65 -0.06 1.48
June 115.71 -3.43 -7.23 -0.25 -3.47
July 109.90 -8.02 -7.95 -10.32 -17.47
August 101.13 -1.69 -0.22 -6.22 -3.98
September 137.69 -4.24 -2.18 -2.16 -6.87
October 287.00 -8.80 -9.24 -7.22 -10.95
November 398.00 1.99 8.53 13.27 4.36
December 340.32 -1.83 -8.89 15.28 -5.09

APPENDICES
223
Appendix 5.B: Assumptions for projecting climate change impacts
on the electricity supply
Fig. 5B.1: Schematic view of water demand and supply of the Citarum WEAP
model. Source: own simulations

APPENDICES
224
Table 5B.1: Input data for the Citarum WEAP model
Input Data Value Sources
Catchment
Map Fig. 5B.2 KLHK (KLHK, 2011), BIG (BIG, 2017b)
Area Saguling: 222,000 ha
Cirata: 416,000 ha
Own calculation based on geospatial analysis
Precipitation (mm) Monthly, 1948-2010
Monthly, 1986-2017
Sheffield et al. (Sheffield et al., 2006)
PLTA Cirata (PLTA Cirata, 2018) and PLTA Saguling (PLTA Saguling, 2018)
Temperature (°C) Mean monthly air temp, 1948-2010
Sheffield et al. (Sheffield et al., 2006)
Wind speed (m/s) Monthly, 1948-2010 Sheffield et al. (Sheffield et al., 2006)
Total Storage Capacity
Cirata
Saguling
2,165 million m3
875 million m3
PLTA Cirata (PLTA Cirata, 2018)
PLTA Saguling (PLTA Saguling, 2018)
Max Turbine Flow
Cirata
Saguling
1,080 m3/s
219.2 m3/s
PLTA Cirata (PLTA Cirata, 2018)
PLTA Saguling (PLTA Saguling, 2018)
Tailwater Elevation
Cirata
Saguling
84 m
252 m
Kasiro et al. (Ibnu Kasiro, Isdiana, D. Pangluar, CL Nugroho, Attan Muchtar, Hari Martadi, 1995)
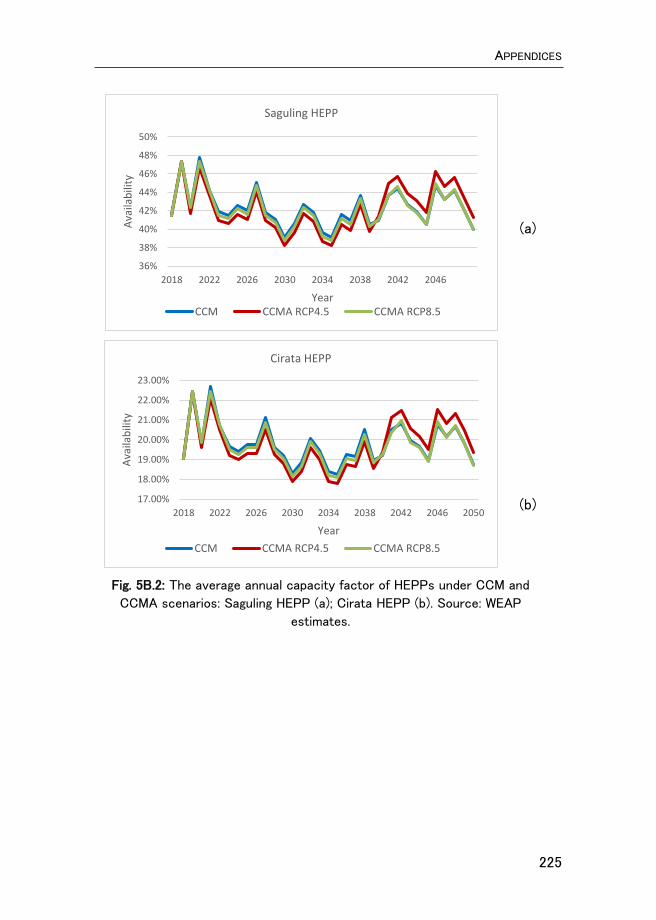
APPENDICES
225
(a)
(b)
Fig. 5B.2: The average annual capacity factor of HEPPs under CCM and
CCMA scenarios: Saguling HEPP (a); Cirata HEPP (b). Source: WEAP
estimates.
36%
38%
40%
42%
44%
46%
48%
50%
2018 2022 2026 2030 2034 2038 2042 2046
Ava
ilab
ility
Year
Saguling HEPP
CCM CCMA RCP4.5 CCMA RCP8.5
17.00%
18.00%
19.00%
20.00%
21.00%
22.00%
23.00%
2018 2022 2026 2030 2034 2038 2042 2046 2050
Ava
ilab
ility
Year
Cirata HEPP
CCM CCMA RCP4.5 CCMA RCP8.5

226

SUPPLEMENTARY
227
Supplementary
List of Figures
Fig. 1.1: The national and Java-Bali power generation mixes in 2015 (PLN, 2016a). .................................................................................................................................... 7
Fig. 2.1: Reference scenario: Power generation capacity 2015-2030 (a); Electricity generation mix in 2030 (b) ..................................................................... 49
Fig. 2.2: Natural gas scenario: Power generation capacity (NGS1, 19% target) (a); Electricity generation mix in 2030 (NGS2, 24% target) (b) ...... 51
Fig. 2.3: Renewable energy scenario: Electricity generation mix in 2030 (REN1, 19% target) (a); Power generation capacity (REN2, 24% target) (b) ................................................................................................................................................ 52
Fig. 2.4: Optimization scenario: Power generation capacity (OPT1, 19% target) (a); Electricity generation mix 2030 (OPT2, 24% target) (b) ........... 54
Fig. 3.1: Installed capacity, REF scenario. ............................................................. 80
Fig. 3.2: Electricity generation mix, REF scenario. ............................................ 80
Fig. 3.3: Installed capacity in REN scenario, no technological learning. ... 81
Fig. 3.4: Electricity generation mix in REN scenario, no technological learning. ............................................................................................................................... 82
Fig. 3.5: Electricity generation mix in REN-low LR scenario, technological learning occurs at the minimum pace. .................................................................... 83
Fig. 3.6: Electricity generation mix in REN-medium LR scenario, average pace of technological learning. ................................................................................... 84
Fig. 3.7: Electricity generation mix in REN-high LR scenario, the high pace of technological learning. .............................................................................................. 85
Fig. 3.8: Total costs of electricity production under reference and four renewable energy scenarios. ...................................................................................... 87
Fig. 3.9: CO2 emissions under the reference scenario and the renewable energy scenario. ............................................................................................................... 88
Fig. 4.1: Power plants and extra-high-voltage Java-Bali transmission networks covered by this chapter, modified from PLN (2018). While this figure depicts only extra-high-voltage transmission networks, this chapter also includes high-voltage transmission networks and low-voltage distribution networks ..................................................................................................... 99

SUPPLEMENTARY
228
Fig. 4.2: Annual maximum water levels and energy spills: Saguling HEPP from 1987 through to 2016. Source: own fieldwork. ...................................... 115
Fig. 4.3: Peak electricity demand in the Java-Bali grid as a function of maximum daily temperature: weekdays 2014. Source: own fieldwork. ... 116
Fig. 4.4: The condenser vacuum as a function of cooling water temperature: PJB Paiton CFPP, half-hourly, December 2015. Source: own fieldwork. .......................................................................................................................... 117
Fig. 4.5: Tidal flooding affects coastal power plants. Source: own fieldwork. ............................................................................................................................................. 119
Fig. 5.1: The conceptual framework for integrating climate change mitigation and adaptation using WEAP-LEAP models .................................. 134
Fig. 5.2: Capacity mix over the study period (a) and electricity mix in 2050 (b) in the reference scenario ................................................................................... 142
Fig. 5.3: The Java-Bali electricity mix in 2017, 2025, and 2050; climate change mitigation scenario (CCM) ........................................................................ 143
Fig. 5.4: Extra capacity in CCMA RCP4.5 (a) and CCMA RCP8.5 (b). CCM is taken as a benchmark............................................................................................ 144
Fig. 5.5: Extra electricity production in CCMA RCP4.5 (a) and CCMA RCP8.5 (b). CCM is taken as a benchmark ....................................................... 145
Fig. 5.6: CO2 emissions under reference, mitigation, and adaption scenarios. CCM is taken as a benchmark .......................................................... 146
Fig. 5.7: Total production costs under reference, mitigation, and adaption scenarios. CCM is taken as a benchmark. ......................................................... 148
Fig. 2C.1: Learning curves of solar PV assuming the medium value of the initial learning rate: (a) depicts a continuous cost reduction based on Eq. (9), while (b) depicts a linear approximation of the cost reduction in (a) that divides into four phases. .................................................................................. 212
Fig. 4C.1: Historical data on electricity production and water inflow. Source: own fieldwork. ............................................................................................... 220
Fig. 4C.2: Correlation between precipitation, water inflow, and electricity production: Cirata HEPP. Source: own analysis. ............................................. 221
Fig. 5B.1: Schematic view of water demand and supply of the Citarum WEAP model. Source: own simulations ............................................................... 223
Fig. 5B.2: The average annual capacity factor of HEPPs under CCM and CCMA scenarios: Saguling HEPP (a); Cirata HEPP (b). Source: WEAP estimates. ........................................................................................................................ 225
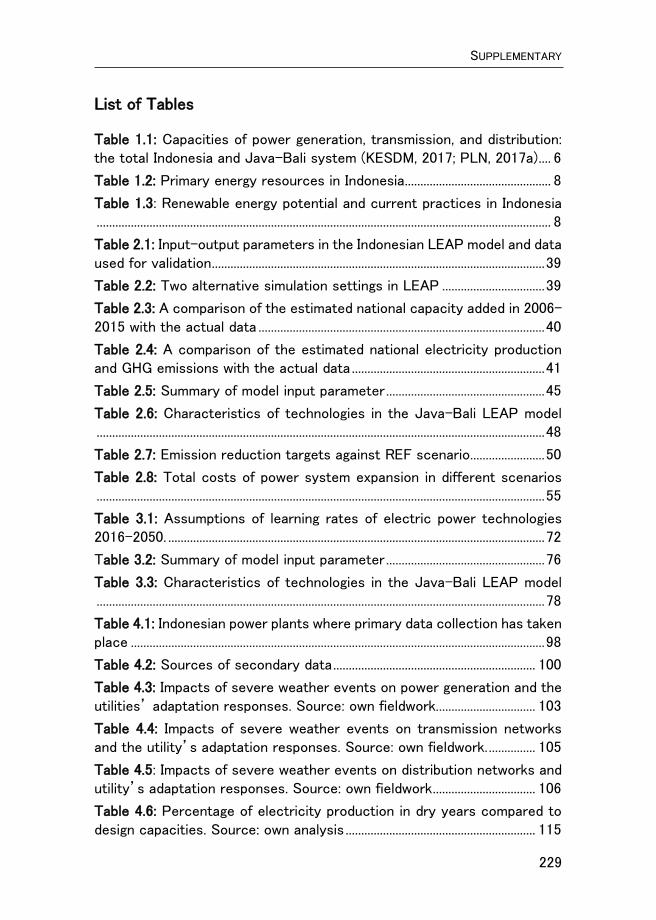
SUPPLEMENTARY
229
List of Tables
Table 1.1: Capacities of power generation, transmission, and distribution: the total Indonesia and Java-Bali system (KESDM, 2017; PLN, 2017a) .... 6
Table 1.2: Primary energy resources in Indonesia ............................................... 8
Table 1.3: Renewable energy potential and current practices in Indonesia .................................................................................................................................................. 8
Table 2.1: Input-output parameters in the Indonesian LEAP model and data used for validation ........................................................................................................... 39
Table 2.2: Two alternative simulation settings in LEAP ................................. 39
Table 2.3: A comparison of the estimated national capacity added in 2006-2015 with the actual data ............................................................................................ 40
Table 2.4: A comparison of the estimated national electricity production and GHG emissions with the actual data .............................................................. 41
Table 2.5: Summary of model input parameter ................................................... 45
Table 2.6: Characteristics of technologies in the Java-Bali LEAP model ................................................................................................................................................ 48
Table 2.7: Emission reduction targets against REF scenario ........................ 50
Table 2.8: Total costs of power system expansion in different scenarios ................................................................................................................................................ 55
Table 3.1: Assumptions of learning rates of electric power technologies 2016-2050. ......................................................................................................................... 72
Table 3.2: Summary of model input parameter ................................................... 76
Table 3.3: Characteristics of technologies in the Java-Bali LEAP model ................................................................................................................................................ 78
Table 4.1: Indonesian power plants where primary data collection has taken place ..................................................................................................................................... 98
Table 4.2: Sources of secondary data ................................................................. 100
Table 4.3: Impacts of severe weather events on power generation and the utilities’ adaptation responses. Source: own fieldwork. ............................... 103
Table 4.4: Impacts of severe weather events on transmission networks and the utility’s adaptation responses. Source: own fieldwork. ............... 105
Table 4.5: Impacts of severe weather events on distribution networks and utility’s adaptation responses. Source: own fieldwork ................................. 106
Table 4.6: Percentage of electricity production in dry years compared to design capacities. Source: own analysis ............................................................. 115

SUPPLEMENTARY
230
Table 2A.1: Inventory of energy system models ............................................. 199
Table 2A.2: Accessibility of the suitable models ............................................ 205
Table 2B.1: Summary of model input parameters for the LEAP Indonesian model 2005-2015 .......................................................................................................... 207
Table 2B.2: Cost data for the capacity addition 2006-2015 ...................... 208
Table 2C.1: Power generation capacity of the Java-Bali Power System (P2B, 2016a) ................................................................................................................... 209
Table 3A.1: Learning rate values of power generation technologies (Rubin et al., 2015) ..................................................................................................................... 210
Table 4A.1 Historical trends and future projections of the Indonesian climate. Source: (GERICS, 2015; USAID, 2017) ............................................... 214
Table 4B.1: List of questions for head office representatives .................. 215
Table 4B.2: List of questions concerning transmission networks ............ 215
Table 4B.3: List of questions for grid operator (load control center) .... 216
Table 4B.4: List of questions concerning distribution networks .............. 217
Table 4B.5: List of questions concerning hydropower plants .................... 218
Table 4B.6: List of questions concerning thermal power plants (coal- and gas-based power plants) ........................................................................................... 219
Table 5A.1: Historical and projected changes in temperature .................. 222
Table 5A.2: Historical and projected changes in temperature .................. 222
Table 5B.1: Input data for the Citarum WEAP model .................................... 224

SUMMARY
231
Summary
Electricity is the backbone of the modern world. Yet, an electricity
connection is beyond the reach of nearly one billion people worldwide.
While the global power sector is expanding to meet the increasing
electricity demand, global warming calls for its transformation to a low-
carbon sector. Under the Paris Agreement, countries have committed to
curbing carbon emissions, with the power sector being one of the primary
targets for emissions reduction actions. At the same time, climate change
is affecting the global economy, including the power sector, and hence the
power sector needs to be greener and climate-resilient.
The goal of this dissertation is to address the above societal problem by
assessing the triple nexus of electrification, climate change mitigation, and
climate change adaptation in the power sector of developing countries,
taking Indonesia as an example. This goal is pursued by employing a set of
methodological steps, including modeling with the LEAP and WEAP
software tools and extensive data collection through interviews and FGDs
with stakeholders from different stages of the power sector supply chain.
This dissertation gradually advances the current modeling practice by
sequentially taking into consideration endogenous technological learning
as well as climate change impacts and adaptation.
Chapter 2 investigates plausible trade-offs between electrification and
climate change mitigation in Indonesia’s primary power system – i.e.,
Java-Bali. Accordingly, Indonesia’s NDC pledge is included in the
simulation of the power system expansion. Results indicate that the
national electrification and the Paris Agreement goals can be achieved
through switching from coal to natural gas and renewable energy. The CO2
mitigation scenario requires 5% – 7% of additional costs compared to the
reference (electrification only) scenario. Meanwhile, the cost-
effectiveness of CO2 mitigation scenarios ranges from 36.3 and 46.6
US$/tCO2e.

SUMMARY
232
Chapter 3 extends the LEAP modeling practice by incorporating
technological learning to assess the diffusion of renewable energy in the
Java-Bali power system in Indonesia. The chapter indicates that
endogenous technological learning accelerates the penetration of
renewable energy and lowers the costs of achieving Indonesia’s renewable
energy targets. Furthermore, at the medium and high pace of technological
learning, the total costs of electricity production to achieve the long-term
renewable energy target are 4–10% lower than the scenario without
considering technological learning.
Chapter 4 moves the discussions to the climate change adaptation
challenge. This chapter presents the empirical evidence of the impacts of
severe weather events and gradual changes in climate variables on all
segments of Java-Bali’s electricity supply chains: generation,
transmission, and distribution. Weather- and climate-related disruptions
cause financial losses for the electric utilities due to damaged equipment
and energy-not-supplied. Accordingly, utilities take autonomous
adaptation measures, which include behavioral, managerial, and
technological responses.
Finally, Chapter 5 brings together the triple objectives of electrification,
climate change mitigation, and climate change adaptation within the LEAP
modeling framework. The results show that the joint objectives alter the
future technology mix when compared to the electrification-only scenario.
Moreover, there is an increase in the installed capacity and electricity
generation to balance the climate-induced rise in electricity demand and
to compensate for the reduction in power-generating capacity under
adverse impacts of the future climate. As a result, the total costs of power
capacity expansion increase significantly.
This dissertation provides a number of innovative contributions to science.
Firstly, to the best of our knowledge, it is the first to assess the
implications of the Indonesian NDC for the power sector, using a bottom-
up energy system model. Hence, it adds to the literature on balancing the

SUMMARY
233
electrification and climate change mitigation goals. Secondly, it is the first
to integrate endogenous technological learning into the LEAP model,
thereby advancing the LEAP methodology and adding understanding
regarding the role of technological learning in driving the transition from
fossil-fuel-based power generation to a lower-carbon power system.
Thirdly, it presents historical evidence of the vulnerability of the
Indonesian power sector to climate variability and change, which is likely
to be shared among other developing countries. Hence, it adds to the
scarce literature on climate change impacts, adaptation, and vulnerability
in developing countries. Finally, it explicitly connects the objective of the
power sector’s climate change mitigation goal with the interferences
caused by the impact of climate change on the sector. This dissertation,
therefore, contributes to filling the gap in the literature on integrated
analysis of climate change mitigation and adaptation in the energy sector
highlighted by IPCC AR5.
On the practical side, this dissertation offers several policy implications.
First, the deployment of the currently unexploited renewable energy
should be started as early as possible to gain benefits of technological
learning and avoid further technological lock-ins of fossil-fuel-based
technologies. Accordingly, the conditions that facilitate faster local-
learning should be made available to reduce the costs of renewable energy
technologies even more quickly. Second, it is essential that the
acceleration of renewable energy deployment go hand-in-hand with the
improvement of the grid capacity, which includes technical and human
capital capacities. Third, the power sector’s vulnerability to climate
change should be acknowledged at the national level, and its adaptation
plans should be integrated into the national action plans for climate change
adaptation. Likewise, it is crucial for electric utilities to include climate
change adaptation into their long-term business strategies and capacity
building. Finally, the power sector needs to ensure budget allocations for
climate change mitigation and adaptation to realize a future low-carbon,
climate-resilient power sector.

234
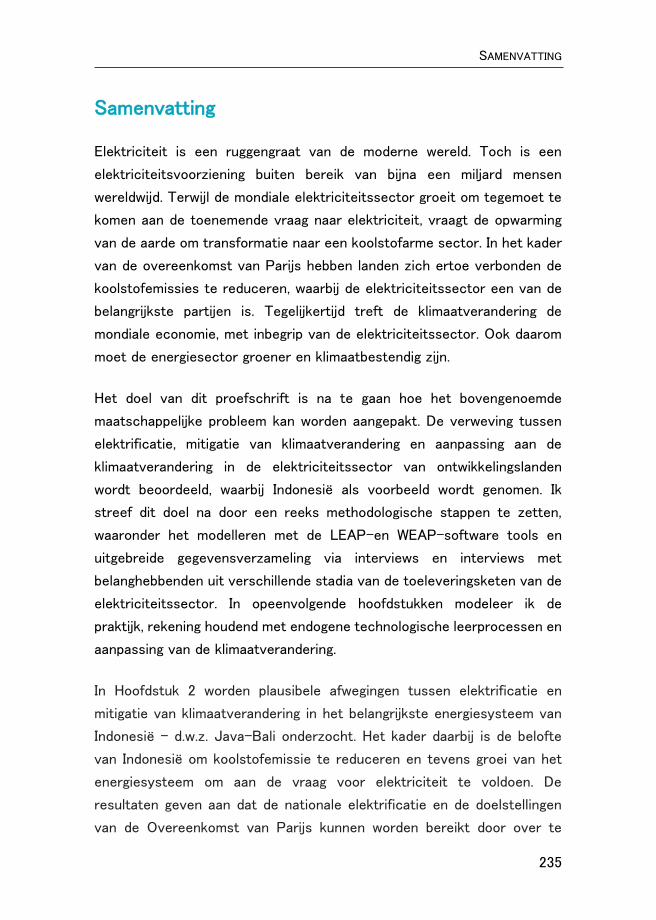
SAMENVATTING
235
Samenvatting
Elektriciteit is een ruggengraat van de moderne wereld. Toch is een
elektriciteitsvoorziening buiten bereik van bijna een miljard mensen
wereldwijd. Terwijl de mondiale elektriciteitssector groeit om tegemoet te
komen aan de toenemende vraag naar elektriciteit, vraagt de opwarming
van de aarde om transformatie naar een koolstofarme sector. In het kader
van de overeenkomst van Parijs hebben landen zich ertoe verbonden de
koolstofemissies te reduceren, waarbij de elektriciteitssector een van de
belangrijkste partijen is. Tegelijkertijd treft de klimaatverandering de
mondiale economie, met inbegrip van de elektriciteitssector. Ook daarom
moet de energiesector groener en klimaatbestendig zijn.
Het doel van dit proefschrift is na te gaan hoe het bovengenoemde
maatschappelijke probleem kan worden aangepakt. De verweving tussen
elektrificatie, mitigatie van klimaatverandering en aanpassing aan de
klimaatverandering in de elektriciteitssector van ontwikkelingslanden
wordt beoordeeld, waarbij Indonesië als voorbeeld wordt genomen. Ik
streef dit doel na door een reeks methodologische stappen te zetten,
waaronder het modelleren met de LEAP-en WEAP-software tools en
uitgebreide gegevensverzameling via interviews en interviews met
belanghebbenden uit verschillende stadia van de toeleveringsketen van de
elektriciteitssector. In opeenvolgende hoofdstukken modeleer ik de
praktijk, rekening houdend met endogene technologische leerprocessen en
aanpassing van de klimaatverandering.
In Hoofdstuk 2 worden plausibele afwegingen tussen elektrificatie en
mitigatie van klimaatverandering in het belangrijkste energiesysteem van
Indonesië - d.w.z. Java-Bali onderzocht. Het kader daarbij is de belofte
van Indonesië om koolstofemissie te reduceren en tevens groei van het
energiesysteem om aan de vraag voor elektriciteit te voldoen. De
resultaten geven aan dat de nationale elektrificatie en de doelstellingen
van de Overeenkomst van Parijs kunnen worden bereikt door over te

SAMENVATTING
236
schakelen van steenkool naar aardgas en hernieuwbare energie. Het CO2-
beperkingsscenario vereist 5% - 7% extra kosten in vergelijking met het
referentiescenario (alleen elektrificatie). Ondertussen varieert de
kosteneffectiviteit van CO2-beperkende scenario's van USD 36,3 and 46,6
per tCO2e.
In Hoofdstuk 3 breid ik de LEAP-modellering uit door technologisch
leerproces op te nemen. Vooral diffusie van hernieuwbare energie in het
Java-Bali energiesysteem in Indonesië wordt beoordeeld. Het hoofdstuk
geeft aan dat endogeen technologisch leerproces de verspreiding van
hernieuwbare energie versnelt en de kosten van het behalen van de
beoogde duurzame energie in Indonesië versnelt. Bovendien zijn de totale
kosten van elektriciteitsproductie om het langetermijndoel voor
hernieuwbare energie te halen bij het gemiddelde en hoge tempo van
technologisch leren 4% tot 10% lager dan het scenario zonder rekening te
houden met technologisch leerproces.
In Hoofdstuk 4 worden de discussies naar de aanpassing aan de
klimaatverandering verschoven. Onderbouwd worden de effecten van
drastische weersveranderingen en geleidelijke klimaatsveranderingen op
alle segmenten van de stroomvoorzieningsketens van Java-Bali:
opwekking, transmissie en distributie. Storingen verbonden met de weer-
en klimaatsveranderingen veroorzaken financiële verliezen bij de
elektriciteitsbedrijven als gevolg van beschadigde apparatuur en niet-
geleverde energie. Dienovereenkomstig nemen nutsbedrijven
aanpassingsmaatregelen in het gedrag, bestuur en technologie.
Ten slotte worden in hoofdstuk 5 de drievoudige doelstellingen van
elektrificatie, beperking van de klimaatverandering en aanpassing aan de
klimaatverandering gemodelleerd met behulp van LEAP. De resultaten
laten zien dat bij klimaatdoelstellingen de toekomstige technologiemix
veranderd in vergelijking met het scenario met alleen elektrificatie.
Bovendien is er een toename van de geïnstalleerde capaciteit en

SAMENVATTING
237
elektriciteitsopwekking om de door het klimaat veroorzaakte stijging van
de vraag naar elektriciteit te dekken en de vermindering van de
elektriciteitsproductiecapaciteit te compenseren. Als gevolg hiervan
nemen de totale kosten van de hogere capaciteit aanzienlijk toe.
Dit proefschrift levert een aantal innovatieve bijdragen aan de wetenschap.
Ten eerste, voor zover wij weten, is het de eerste keer dat de gevolgen
van de Indonesische Nationale klimaatdoelstellingen voor de energiesector
zijn beoordeeld met behulp van een bottom-up model voor het
Indonesische energiesysteem. Daarom draagt het onderzoek bij aan de
literatuur over het balanceren van de doelstellingen voor elektrificatie en
de beperking van de klimaatverandering. Ten tweede is het de eerste keer
dat technologische leerproces endogeen in het LEAP-model is
geïntegreerd. Daardoor wordt de LEAP-methodiek verbeterd en begrip
wordt vergroot over de rol van het technologisch leerproces bij de
overgang van energieopwekking op basis van fossiele brandstoffen naar
een koolstofarm energiesysteem. Ten derde presenteert het historisch
bewijs van de kwetsbaarheid van de Indonesische elektriciteitssector voor
klimaatvariabiliteit en verandering, die waarschijnlijk ook bij andere
ontwikkelingslanden veel voorkomt. Daarom draagt het bij aan de schaarse
literatuur over de gevolgen van klimaatverandering, aanpassing en
kwetsbaarheid in ontwikkelingslanden. Ten slotte worden de doelstellingen
van de energiesector om de klimaatverandering te verminderen met
interventies van de elektriciteitssector en gevolgen van
klimaatsveranderingen voor de sector. Dit proefschrift draagt daarom bij
aan het opvullen van de leemte in de literatuur over geïntegreerde analyse
van de koolstofemissiereductie en aanpassing aan klimaatverandering in
de energiesector.
Het proefschrift toont diverse implicaties voor de beleidspraktijk. Ten
eerste moet de inzet van de momenteel onbenutte hernieuwbare energie
zo snel mogelijk worden gestart om de voordelen van technologisch leren
te behalen en verdere technologische “lock-ins” van de nieuw te

SAMENVATTING
238
installeren infrastructuur voor de op fossiele brandstoffen gebaseerde
elektriciteitsproductie te voorkomen. Dienovereenkomstig moeten de
voorwaarden worden geschapen om een sneller leerproces door te maken
waarmee de kosten van technologieën voor hernieuwbare energie nog
sneller worden beperkt. Ten tweede is het van essentieel belang dat de
versnelling in de inzet van hernieuwbare energie gepaard gaat met de
verbetering van de netcapaciteit, waaronder technische en menselijke
capaciteiten. Ten derde moet de kwetsbaarheid van de energiesector voor
klimaatverandering op nationaal niveau worden erkend en moeten de
aanpassingsplannen van de sector worden geïntegreerd in de nationale
actieplannen voor aanpassing aan de klimaatverandering. Evenzo is het
van cruciaal belang voor elektriciteitsbedrijven om aanpassing aan de
klimaatverandering op te nemen in hun langetermijnstrategieën en opbouw
van hun capaciteit. Ten slotte moet de energiesector zorgen dat er
voldoende begroting beschikbaar is voor de klimaatmitigatie en aanpassing
van de klimaatverandering waarmee ze een toekomstige koolstofarme en
klimaatbestendige energiesector kan realiseren.

RINGKASAN
239
Ringkasan
Tenaga listrik merupakan tulang punggung kehidupan modern. Namun,
masih terdapat hampir satu milyar populasi bumi belum memiliki
sambungan listrik. Oleh karena itu, sektor ketenagalistrikan di seluruh
dunia, khususnya di negara-negara berkembang berekspansi dalam rangka
memenuhi permintaan listrik yang meningkat. Di sisi lain, isu pemanasan
global menyerukan sektor ketenagalistrikan untuk bertransformasi menuju
sektor yang rendah karbon. Di bawah kerangka Perjanjian Paris, negara-
negara bersepakat untuk membatasi emisi karbon, dan pada umumnya
mengikutsertakan upaya penguranagn emisi di sektor ketenagalistrikan.
Sementara itu, dampak perubahan iklim telah dirasakan oleh ekonomi global
saat ini, termasuk sektor ketenagalistrikan. Oleh karena itu, di masa yang
akan datang, sektor ketenagalistrikan tidak hanya dituntut untuk lebih
bersih, tetapi juga lebih tahan terhadap dampak perubahan iklim.
Tujuan dari disertasi ini adalah untuk memberikan kontribusi solusi
terhadap permasalahan di atas dengan melakukan kajian mengenai
keterkaitan tiga tujuan penting sektor ketenagalistrikan, yaitu: elektrifikasi,
mitigasi perubahan iklim, dan adaptasi terhadap dampak perubahan iklim.
Pencapaian tujuan ini diupayakan dengan menggunakan serangkaian
metodologi, termasuk pemodelan dengan perangkat lunak LEAP dan WEAP
dan melakukan pengumpulan data melalui wawancara serta diskusi
kelompok secara terarah dengan para pemangku kepentingan dari berbagai
elemen rantai pasokan penyediakan tenaga listrik. Disertasi ini secara
bertahap memperbaharui LEAP dengan secara bertahap memasukan
pertimbangan “endogenous technological learning” dan adaptasi sistem
ketenagalistrikan terhadap perubahan iklim.
Bab 2 menyajikan evaluasi beberapa skenario trade-off antara elektrifikasi
dan mitigasi perubahan iklim di sistem ketenagalistrikan Jawa-Bali. Dalam
hal ini, target penurunan emisi sektor energi Indonesia yang tercantum
dalam dokumen Nationally Determined Contribution (NDC) dijadikan
pertimbangan dalam simulasi pengembangan sistem ketenagalistikan

RINGKASAN
240
Jawa-Bali. Hasil simulasi menunjukkan bahwa target elektrifikasi dan NDC
dapat dicapai melalui peralihan energi primer pembangkit listrik dari
batubara ke gas alam dan energi terbarukan. Skenario mitigasi CO2
tersebut membutuhkan biaya tambahan 5% - 7% dibandingkan dengan
skenario dasar yang hanya mempertimbangkan target elektrifikasi.
Sementara itu, efektifitas biaya mitigasi CO2 berkisar antara USD 36,3 and
46,6/tCO2e.
Pada Bab 3, metode kalkulasi biaya pada perangkat lunak LEAP
dimodifikasi dengan memasukkan formula “endogenous technological
learning” dalam rangka mengkaji penetrasi energi terbarukan dalam sistem
ketenagalistrikan Jawa-Bali. Bab ini menyimpulkan bahwa “endogenous
technological learning” mempercepat penetrasi energi terbarukan dalam
sistem ketenagalistrikan Jawa-Bali dan mampu menurunkan biaya
pencapaian target energi terbarukan Indonesia. Lebih jauh lagi, pada
skenario “technological learning” dengan kecepatan sedang dan tinggi,
total biaya produksi listrik untuk mencapai target energi terbarukan jangka
panjang menjadi 4% - 10% lebih rendah dibandingkan skenario tanpa
mempertimbangkan “technological learning”.
Pada Bab 4, pembahasan disertasi ini dialihkan ke topik adaptasi perubahan
iklim. Bab ini membahas dampak kejadian cuaca buruk dan perubahan
variabel iklim pada proses bisnis penyediaan tenaga listrik di sistem Jawa-
Bali yang meliputi: pembangkitan, transmisi, dan distribusi. Berdasarkan
hasil wawancara dengan pemangku kepentingin penyediaan tenaga listrik
dan hasil kajian terhadap laporan gangguan pembangkit, transmisi, dan
distribusi, dapat disimpulkan bahwa gangguan terkait cuaca dan iklim telah
menyebabkan kerugian finansial untuk perusahaan-perusahaan penyedia
tenaga listrik akibat peralatan yang rusak dan energi listrik yang tidak
tersalurkan. Perusahaan-perusahaan penyedia tenaga listrik telah
mengambil langkah-langkah adaptasi terhadap kejadian cuaca buruk
dengan melakukan upaya-upaya teknis dan manajerial.

RINGKASAN
241
Bab 5 menyatukan tiga tujuan penting yaitu: elektrifikasi, mitigasi
perubahan iklim, dan adaptasi terhadap dampak perubahan iklim dalam
kerangka pemodelan LEAP. Hasil penelitian menunjukkan bahwa ketika
ketiga tujuan tersebut dipertimbangkan dalam simulasi pengembangan
sistem ketenagalistrikan Jawa-Bali, maka bauran teknologi di masa depan
mengalami perubahan jika dibandingkan dengan skenario dasar yang hanya
mempertimbangkan elektrifikasi. Selain itu, diperlukan pula penambahan
kapasitas terpasang pembangkit dan produksi listrik untuk memenuhi
kenaikan permintaan listrik yang disebabkan oleh kenaikan suhu akibat
perubahan iklim serta untuk mengkompensasi penurunan keandalan
pembangkit listrik akibat dampak perubahan iklim. Hal-hal tersebut
menyebabkan total biaya ekspansi sistem ketenagalistrikan meningkat
secara signifikan.
Disertasi ini memberikan beberapa kontribusi inovatif bagi ilmu
pengetahuan. Pertama, sejauh pengetahuan kami, disertasi ini adalah yang
pertama melakukan kajian implikasi target penurunan emisi sektor
ketenagalistrikan Indonesia di bawah Perjanjian Paris dengan menggunakan
model bottom-up. Oleh karena itu, disertasi ini menambah literatur terkait
energi dan perubahan iklim. Kedua, disertasi ini merupakan kajian pertama
yang mengintegrasikan “endogenous technological learning” ke dalam
model LEAP, sehingga ada pembaharuan metodologi LEAP dan menambah
pemahaman tentang peran “technological learning” dalam mendorong
transisi dari energi listrik berbasis bahan bakar fosil ke energi rendah
karbon. Ketiga, disertasi ini menyajikan bukti historis kerentanan sektor
tenaga listrik Indonesia terhadap variabilitas dan perubahan iklim, yang juga
mewakili kerentanan negara-negara berkembang lainnya. Oleh karena itu,
disertasi ini menambah literatur yang masih terbatas mengenai dampak
perubahan iklim, adaptasi, dan kerentanan di negara-negara berkembang.
Keempat, disertasi ini secara eksplisit menggabungkan tujuan mitigasi dan
adaptati perubahan iklim di sektor ketenagalistrikan sehingga berkontribusi
untuk mengisi kesenjangan literatur tentang analisis terpadu mitigasi dan
RINGKASAN
242
adaptasi perubahan iklim di sektor energi sebagaimana ditekankan dalam
Laporan Kajian IPCC ke-5.
Disertasi ini juga menawarkan beberapa rekomendasi kebijakan yang dapat
diterapkan. Pertama, pemanfaatan energi terbarukan yang saat ini belum
dieksploitasi harus dimulai sedini mungkin untuk mendapatkan manfaat
“technological learning” dan menghindari ketergantungan pada teknologi
berbasis bahan bakar fosil. Selain itu, kondisi yang dapat memfasilitasi
“local learning” perlu diupayakan agar penurunan biaya teknologi energi
terbarukan dapat terjadi lebih cepat. Kedua, percepatan pemanfaatan
energi terbarukan harus berjalan seiring dengan penguatan kapasitas
sistem ketenagalistrikan, yang mencakup kapasitas teknis dan sumber
daya manusia. Ketiga, kerentanan sektor energi terhadap perubahan iklim
perlu diarusutamakan di tingkat nasional, dan rencana adaptasinya harus
diintegrasikan ke dalam rencana aksi nasional adaptasi perubahan iklim.
Demikian juga, sangat penting bagi perusahaan penyedia tenaga listrik
untuk memasukkan adaptasi perubahan iklim ke dalam strategi bisnis
jangka panjang dan program penguatan kapasitas. Terakhir, sektor
ketenagalistrikan perlu mengalokasikan anggaran untuk mitigasi dan
adaptasi perubahan iklim dalam rangka mewujudkan infrastruktur
ketenagalistrikan yang rendah karbon dan tahan terhadap dampak
perubahan iklim.
243
About the Author
Kamia Handayani was born in Garut, Indonesia. She
holds a Master of Science (Cum Laude) in Energy
& Environmental Management from the
University of Twente, the Netherlands, and a
Bachelor of Environmental Engineering from
Bandung Institute of Technology, Indonesia.
After working for a decade at PT PLN
(Persero), the state-owned electric power
company in Indonesia, she took a study
leave in 2016 to pursue a doctoral degree at
the Department of Governance and
Technology for Sustainability, University of
Twente, the Netherlands.
Kamia represented the University of Twente at the UN Climate Change
Conference COP23 in Bonn (2017). She also shared a panel with
resourceful people in COP24 in Katowice (2018), which included the Dutch
climate envoy and various young experts. She has presented her works at
numerous international conferences and regularly writes articles for The
Jakarta Post.
During her previous service in PLN, Kamia contributed to the development
of a system for evaluating the environmental management performances
of PLN business units all over Indonesia. She also involved in the
development of climate change mitigation strategies of the company.
Kamia’s expertise includes carbon credit for clean energy projects and
environmental & social safeguards for electricity infrastructure projects,
among others. She is a member of numerous energy and environmental
communities, including the International Association for Energy Economics
(IAEE), European Association of Environmental and Resources Economists
(EAERE), Southeast Asian Women, 4TU Centre for Resilience Engineering
(4TU RE), Energy Academy Indonesia (Ecadin), and Yayasan Pembangunan
Berkelanjutan-LEAD Indonesia. She is a volunteer at ‘Indonesia
Mengglobal’ and ‘I Care Indonesia’ and the coordinator of Komunitas
Hijau PLN (PLN Green Community).
244
List of Publications
Journal articles
1. Handayani, K., Filatova, T, Krozer, Y., & Anugrah, P. (2019). Seeking for climate change mitigation and adaptation nexus: Analysis of a long-term power system expansion. Applied Energy. (Under review).
2. Handayani, K., Filatova, T., & Krozer, Y. (2019). The Vulnerability of the Power Sector to Climate Variability and Change: Evidence from Indonesia. Energies, 12(19), 3640.
3. Gonella, F., Almeida, C. M. V. B., Fiorentino, G., Handayani, K., Spanò, F., Testoni, R., & Zucaro, A. (2019). Is technology optimism justified? A discussion towards a comprehensive narrative. Journal of cleaner production, 223, 456-465.
4. Handayani, K., Krozer, Y., & Filatova, T. (2019). From fossil fuels to renewables: An analysis of long-term scenarios considering technological learning. Energy Policy, 127, 134-146.
5. Handayani, K., Krozer, Y., & Filatova, T. (2017). Trade-offs between electrification and climate change mitigation: An analysis of the Java-Bali power system in Indonesia. Applied energy, 208, 1020-1037.
Conference proceedings
1. Handayani, K., Filatova, T., Krozer, Y., & Anugrah, P. (2019). Toward a low-carbon and climate-resilient power system: A case of the Indonesian power sector. Paper presented at 42nd IAEE International Conference, Montreal, Canada.
2. Handayani, K., Krozer, Y., & Filatova, T. (2017). Assessment of renewable energy expansion in the Java-Bali islands, Indonesia. In S. Ulgiati, L. Vanoli, M. T. Brown, M. Casazza, & H. Schnitzer (Eds.), 10th Biennial International Workshop Advances in Energy Studies: Energy futures, environment and well-being (pp. 271). TU Graz.
3. Handayani, K., Krozer, Y. (2014). Cost-effectiveness of emission reduction for the Indonesian coal-fired power plants. The 20th Conference of Electric Power Supply Industry, International Convention Center Jeju, South Korea.

245
Selected talks and presentations
1. Linking climate change mitigation and adaptation: An integrated power system expansion modeling. EMP-E conference 2019: Modelling the implementation of A Clean Planet For All Strategy. 8-9 October 2019, Brussels, Belgium.
2. Exploring young-led climate partnership towards COP25:‘What we have brought from COP24 Katowice 2018’, 27 February 2019, The Indonesian embassy, The Hague, the Netherlands.
3. Young Professionalism in climate resilience, UN Climate Change Conference (COP24), 14 December 2018, Katowice, Poland.
4. Panel Discussion: How to create societal support for alternative energies. 31 August 2018, University of Twente, the Netherlands.
5. Simulasi Pencapaian Target Penurunan Emisi Gas Rumah Kaca Sektor Ketenagalistrikan, Webinar Energy Academy Indonesia, 29 October 2017.
6. Opportunities for Climate Change Mitigations: A Case Study of the Indonesian Power Sector. International Symposium on Sustainability Science, “Understanding Climate Change Phenomena for Human Well Being”, 8-10 September 2014, Bandung, Indonesia.
7. Renewable Energy for Electrification in Flores Island, Indonesia. ICREP Conference: “Improving energy Access through Climate Finance: Picking the Winners”, 26-28 March 2013, Enschede, the Netherlands.
Media articles
1. Kamia Handayani (2018). Invest in ‘Technology Cost Learning’. The Jakarta Post, 08 November. http://www.thejakartapost.com/academia/2018/11/08/invest-in-technology-cost-learning.html
2. Kamia Handayani (2017). Securing electricity supply: Climate change does matter. The Jakarta Post, 26 October. http://www.thejakartapost.com/academia/2017/10/26/securing-electricity-supply-climate-change-does-matter.html
3. Kamia Handayani (2016). Trading off electrification and climate change. The Jakarta Post, 28 October. http://www.thejakartapost.com/academia/2016/10/28/trading-off-electrification-and-climate-change.html