Climate Change
11
© 2018 Discovery Publication. All Rights Reserved. www.discoveryjournals.org OPEN ACCESS ARTICLE Page642 RESEARCH Flooding as precursor of climate variability: causes and damages of 2010 flood event in District Swat, Pakistan Muhammad Suleman Bacha 1☼ , Mohammad Nafees 1 , Muhammad 2 Pakistan is extremely vulnerable to climate induced hazards such as floods, droughts, storms, heat waves and extreme weather events. Flooding is the most devastating natural hazard of Pakistan. Since the inception, the country has faced with multiple flood events costing thousands of lives and billions of losses in infrastructure. The situation has gotten worse since the past decades as the events of floods have increased in the country particularly the enormous floods of 2010 which shook the economy and till now we have not been recovered yet. This paper utilizes primary and secondary sources in gathering the data regarding damages of floods incurred by the inhabitants of district Swat. A total of 86 respondents were interviewed using semi structured household questionnaire. The survey results showed that flooding is the main perceived climate change vulnerability in the area. Damages include human, livelihood and household losses. Most of the respondents believe the incidents of floods have increased since the past two decades. The study area is most vulnerable to the negative impacts of climate change. Climate variability and increasing extreme weathers events are resulting in livelihood insecurities among the local communities. Poor households with low resource base and adaptation capabilities are most vulnerable to the natural disasters. This research recommends that government should prioritize the effected livelihoods of the study area by extending their support to the affected communities. Intensive research is needed to investigate to a full extent the climate change vulnerabilities particularly extreme weather events in the area. Local communities should be equipped with climate change knowledge and extension of climate technologies to offset the vulnerabilities with effective climate adaptation plans. INTRODUCTION Flooding is the most frequently occurring and most devastating natural hazard in Pakistan. Of all population who are affected by natural hazards, 90% are subjected to flooding (Tariq & van de Giesen, 2012). Due to excessive rainfall in the months of July to September 2010, Pakistan experienced unprecedented flooding in the whole country that affected about 20 million people and brought a death toll of 1800 people. The flooding event was recorded as one of the worst since 1929. Moreover, the flash floods caused great damages to the infrastructure affecting entire villages, urban centers, homes, crops and agriculture lands. The direct damages by the floods were calculated to US$ 6.5 billion while the indirect costs were calculated to be US$ 3.6 billion. The main sectors that were affected during the flooding were agriculture; livestock and fisheries costed US$ 5.0 billion (Asian Development Bank, 2010; Tariq & van de Giesen, 2012). It is anticipated that more incidents of similar nature will occur the coming decades. Moreover, variability in the monsoon pattern will increase chances of droughts in the future, thus affecting the food availability in Pakistan (IUCN, 2009). Pakistan is vulnerable to climate change induced hazards including floods, droughts, water shortages, shifts in weather patterns, loss of biodiversity and melting of glaciers (Government of Pakistan, 2010). There have been 67 reported flooding events in Pakistan occurring since 1900 with a clustering of 52 events of various severity in the last 30–40 years. Around eight of these events that occurred between 1950 to 2010 were also accompanied with huge losses of life and property (Webster et al., 2011; Atta-ur-Rahman & Khan, 2011). According to available official statistics, about 8000 people lost their lives and economical losses amounted to approximately $10 billion between independence of the country in 1947 and the 2010 flooding (Baig, 2008). Likewise, the events of droughts recorded during 2000-2002 and fourteen cyclones recoded during 1971-2001 caused hoax and momentous damages (Asian Development Bank, 2010). The change in the rainfall patterns and increase in precipitation during monsoon seasons is a clear indication of changing climate in the country. The future scenarios conducted for Pakistan points towards increase in the rainfall events over the north-west region instead of north-west. Due to the reason Indus and Kabul Rivers will be more vulnerable to flooding events in the future (Asian Development Bank, 2010). The 2010 flooding was triggered by many events. Due to low rainfall and severe drought in 2009, the vegetation cover was sparser in 2010. The region is mountainous with steep valleys and ridges. Moreover, severe deforestation in the region may have accelerated the runoff after heavy rainfall through the steep valleys during the months RESEARCH 4(16), October- December, 2018 Climate Change ISSN 2394–8558 EISSN 2394–8566 1 Department of Environmental Sciences, University of Peshawar, Pakistan; 2 Department of Urban and Regional Planning, University of Peshawar, Pakistan; ☼ Corresponding Author: Department of Environmental Sciences, University of Peshawar, Pakistan; Email: [email protected]
-
Upload
khangminh22 -
Category
Documents
-
view
3 -
download
0
Transcript of Climate Change

© 2018 Discovery Publication. All Rights Reserved. www.discoveryjournals.org OPEN ACCESS
ARTICLE
Pag
e64
2
RESEARCH
Flooding as precursor of climate variability: causes
and damages of 2010 flood event in District Swat,
Pakistan
Muhammad Suleman Bacha1☼, Mohammad Nafees1, Muhammad2
Pakistan is extremely vulnerable to climate induced hazards such as floods, droughts, storms, heat waves and extreme weather events. Flooding is the most devastating natural hazard of Pakistan. Since the inception, the country has faced with multiple flood events costing thousands of lives and billions of losses in infrastructure. The situation has gotten worse since the past decades as the events of floods have increased in the country particularly the enormous floods of 2010 which shook the economy and till now we have not been recovered yet. This paper utilizes primary and secondary sources in gathering the data regarding damages of floods incurred by the inhabitants of district Swat. A total of 86 respondents were interviewed using semi structured household questionnaire. The survey results showed that flooding is the main perceived climate change vulnerability in the area. Damages include human, livelihood and household losses. Most of the respondents believe the incidents of floods have increased since the past two decades. The study area is most vulnerable to the negative impacts of climate change. Climate variability and increasing extreme weathers events are resulting in livelihood insecurities among the local communities. Poor households with low resource base and adaptation capabilities are most vulnerable to the natural disasters. This research recommends that government should prioritize the effected livelihoods of the study area by extending their support to the affected communities. Intensive research is needed to investigate to a full extent the climate change vulnerabilities particularly extreme weather events in the area. Local communities should be equipped with climate change knowledge and extension of climate technologies to offset the vulnerabilities with effective climate adaptation plans.
INTRODUCTION
Flooding is the most frequently occurring and most devastating natural
hazard in Pakistan. Of all population who are affected by natural
hazards, 90% are subjected to flooding (Tariq & van de Giesen, 2012).
Due to excessive rainfall in the months of July to September 2010,
Pakistan experienced unprecedented flooding in the whole country that
affected about 20 million people and brought a death toll of 1800
people. The flooding event was recorded as one of the worst since 1929.
Moreover, the flash floods caused great damages to the infrastructure
affecting entire villages, urban centers, homes, crops and agriculture
lands. The direct damages by the floods were calculated to US$ 6.5
billion while the indirect costs were calculated to be US$ 3.6 billion.
The main sectors that were affected during the flooding were
agriculture; livestock and fisheries costed US$ 5.0 billion (Asian
Development Bank, 2010; Tariq & van de Giesen, 2012). It is
anticipated that more incidents of similar nature will occur the coming
decades. Moreover, variability in the monsoon pattern will increase
chances of droughts in the future, thus affecting the food availability in
Pakistan (IUCN, 2009).
Pakistan is vulnerable to climate change induced hazards including
floods, droughts, water shortages, shifts in weather patterns, loss of
biodiversity and melting of glaciers (Government of Pakistan, 2010).
There have been 67 reported flooding events in Pakistan occurring since
1900 with a clustering of 52 events of various severity in the last 30–40
years. Around eight of these events that occurred between 1950 to 2010
were also accompanied with huge losses of life and property (Webster et
al., 2011; Atta-ur-Rahman & Khan, 2011). According to available
official statistics, about 8000 people lost their lives and economical
losses amounted to approximately $10 billion between independence of
the country in 1947 and the 2010 flooding (Baig, 2008). Likewise, the
events of droughts recorded during 2000-2002 and fourteen cyclones
recoded during 1971-2001 caused hoax and momentous damages (Asian
Development Bank, 2010).
The change in the rainfall patterns and increase in precipitation
during monsoon seasons is a clear indication of changing climate in the
country. The future scenarios conducted for Pakistan points towards
increase in the rainfall events over the north-west region instead of
north-west. Due to the reason Indus and Kabul Rivers will be more
vulnerable to flooding events in the future (Asian Development Bank,
2010). The 2010 flooding was triggered by many events. Due to low
rainfall and severe drought in 2009, the vegetation cover was sparser in
2010. The region is mountainous with steep valleys and ridges.
Moreover, severe deforestation in the region may have accelerated the
runoff after heavy rainfall through the steep valleys during the months
RESEARCH 4(16), October- December, 2018 Climate
Change ISSN
2394–8558 EISSN
2394–8566
1Department of Environmental Sciences, University of Peshawar, Pakistan; 2Department of Urban and Regional Planning, University of Peshawar, Pakistan; ☼Corresponding Author: Department of Environmental Sciences, University of Peshawar, Pakistan; Email: [email protected]

© 2018 Discovery Publication. All Rights Reserved. www.discoveryjournals.org OPEN ACCESS
ARTICLE RESEARCH
Pag
e64
3
of July and August (Webster et al., 2011).
This research is based on the case study of two administrative units
of district Swat, Pakistan. The area is selected because the impacts of
climate change are more evident in the mountainous areas compared to
the plain areas. The study area fits to this description as the climate of
the area is already changing and might get worse in the future. The study
area was one of the most affected areas due to devastating floods of the
recent history.
Study Area
Swat is the administrative district of Khyber Pakhtunkhwa,
Pakistanlocated at 34°46′58″N and 72°21′43″E. Swat borders Chitral in
the North, Dir in the West and Gilgit-Baltistan in the North-east. Swat
covers an area of 5337 Km2 with a population of 1.26 million (GOP,
1999; Bangash, 2012). The district is enclosed by the sky-high
mountains with Gilgit Baltistan and Chitral in the North, Dir in the
West, and Mardan in the South, while Indus separates it from Hazara in
the east (Sabir, 2003; PPAF, 2013). Topographically, Swat is a
mountainous region, located among the foothills of the Hindukush
mountain range. This range runs in the general direction of North and
South and has a varied elevation within the Swat area, beginning from
600 meters above sea level in the South and rising rapidly up towards
the North. Some of the peaks has elevations starting from 4500 to
around 6,000 meters above sea level (Bazinni, 2013; PPAF, 2013). The
Swat region, containing the meandering Swat River, is also home to lush
green valleys, snow-covered glaciers, forests, meadows and plains
(PPAF, 2013). The lofty Hindu Raj mountains surrounds the area and
drained by a single watershed of Swat River originating in the high
mountains to the north having an altitude more than 6000 m (Ahmad et
al., 2015). The Swat district has a population of 1.25 million according
to the 1998 census, with a growth rate of 3.9% and migration of 3.2%
(GOP, 1999).
The study area lies in the temperate zone where various factors
including altitude, latitude, Indian ocean monsoon and western cyclonic
currents control the climate. The summer in lower Swat valley is short
and moderate while it is cool and refreshing in the upper northern part.
The hottest month is June with mean maximum and minimum
temperature of 33°C and 16°C, respectively. The coldest month is
January with mean maximum and minimum temperature of 11°C and -
2°C, respectively. The winter season is long and extends from
November to March; rain and snowfall occurs during this season. The
average annual precipitation in district Swat ranges from 1000mm to
1200mm. (Dahri et al., 2011; PPAF, 2013, Bazinni, 2013). The
population of Swat is dependent on Agriculture, Horticulture, Livestock,
Fisheries, Tourism and Forest resources of the area (Khan and Khan,
2009; Sabir, 2003). Apart from dependency on the natural resources, the
people also finds their jobs in several industries and have employment in
multiple public and private sector organizations (Sabir, 2003).
Moreover, some of the households are dependent on local and foreign
remittances (Khan and Khan).
RESULTS
The Swat River
Swat River serves as the only drainage basin of district Swat. The River
is originated in the upper part of the district, in the form of rushing
streams of glacial lakes and permanent ice caps. The river flow is mostly
determined by snow milt and monsoon rainfall in the months of March
to June and July to August respectively. In the valleys of Mahodand and
Gabral, these streams merge forming Ushu Gol and Gabral River. After
flowing southwards, the two rivers after covering 34 to 40 km, give rise
to the Swat River at Kalam (Ahmad et al., 2015). The length of River
Swat is about 250 km from Kalam to its confluence with Kabul River
near Charsadda. Many tributaries (seasonal and perennial) join River
Swat along the way as it flows. Around 50 species of freshwater species
have been recorded in River Swat (Hasan et al., 2013; Yousafzai et al.,
2013; Ahmad et al., 2015).
River Swat can be divided into two types of ecology i.e. “The
monsoon-excluded spating river ecology” and “the monsoon-prevailing
sluggish river ecology”. The first system is constrained to upper part of
the district also known as Swat Kohistan characterized by the torrent
cold water. Being a main habitat of Trout fish due to this cold-water
ecosystem, it is also termed as Trout ecology. In the lower part of this
river non-trout ecology exists, represented by cold but relatively slow
water movement (Ahmad et al., 2015). Having a major role in the local
economy, SwatRiver is an attraction to thousands of visitors across the
country. The river is also a source of water for irrigation and domestic
purposes. Due to multitude of problems including pollution, unplanned
urbanization, deforestation, illegal fishing, encroachments, the River is
facing serious threats to its riverine ecosystem and water quality
(PDMA, 2015). The situation needs immediate attention from the
government and policy makers. Moreover, the above problems are
exacerbated by the floods season. The year 2010 saw a major flood in
the Swat River responsible for huge losses to the ecosystem,
infrastructure and human settlements (Yousafzai et al., 2013). Figure 2
shows theflood inundation map of district Swat.
Causes of Flooding in River Swat
A variety of factors were responsible for triggering the events that lead
to devastating floods of 2010 in the study area. In the pre-flood time,
heavy snowfall was recorded at Kalam, Dir and Malam Jaba met
observatories in the months of January and February of 2010, which
subsequently contributed in the floods through heavy melting in June
and July. Moreover, the months of June and July are among the hottest
months in the region, which acted as a driving force behind the melting
of snow (Atta-ur-Rahman & Khan, 2013). Monsoon is responsible for
most of the rainfalls in the months of July to September in Pakistan.
Originating from Bay of Bengal, it moves north-west before reaching
Pakistan while in 2010; the course of monsoon rainfall was somehow
different from the usual flow process and moved towards North West to
central part of India. At the same high-speed cyclone, Phet entered
Pakistan from south and joined with the usual monsoon track. The
moisture laden winds from both the monsoons and Phet were
responsible for heavy and prolonged rainfall over the north and north
western mountains of Pakistan (Atta-ur-Rahman & Khan, 2013). The
region experienced a huge anomaly of rainfall, that lasted four days
starting from July 27 to July 30, 2010 and all the meteorological stations
recorded rainfall above normal (Figure 3). According to the water
discharge statistics of WAPDA, the river discharge in 2010 showed
highest among recorded data. The maximum recorded discharge of Swat
River at Amandara gauging station was 5663 Cumecs in 2010 floods
and 175,546 Cusecs at Khawazakhela gauging station on July 29, 2010
(PDMA, 2015) while the discharge at Munda headworks reached 8495
Cumecs on July 29, 2010 which uprooted it due to the heavy influx of
water (Atta-ur-Rahman & Khan,2013; Asian Development Bank, 2010).
The water discharge data gathered from Khwazakhela gauge station
for the months of July and August through the years 2005 to 2013 is
shown in figures 4a and b. The average monthly discharge for both the
months reached its historical highest reading in 2010 with 26891 cusecs

© 2018 Discovery Publication. All Rights Reserved. www.discoveryjournals.org OPEN ACCESS
ARTICLE RESEARCH
Pag
e64
4
Figure 1 Map of the Study Area

© 2018 Discovery Publication. All Rights Reserved. www.discoveryjournals.org OPEN ACCESS
ARTICLE RESEARCH
Pag
e64
5
Source: UNOCHA Figure 2 Flood Affected Union Councils of District Swat (as of 05 August 2010)

© 2018 Discovery Publication. All Rights Reserved. www.discoveryjournals.org OPEN ACCESS
ARTICLE RESEARCH
Pag
e64
6
Source: Atta-ur-Rahman & Khan, 2013 Figure 3 The Four-Day Wet Spell for Selected Met Observatories that Caused Floods in Khyber Pakhtunkhwa
Figure 4a Average Monthly Discharge for July (2005-2013) at Khawazakhela Gauging Station, District Swat
22218
18034
10958
1352612572
26891
7874
1340811693
0
5000
10000
15000
20000
25000
30000
2005 2006 2007 2008 2009 2010 2011 2012 2013
Dis
char
ge (
ft3
/Se
c)
July

© 2018 Discovery Publication. All Rights Reserved. www.discoveryjournals.org OPEN ACCESS
ARTICLE RESEARCH
Pag
e64
7
Figure 4b Average Monthly Discharge for August (2005-2012) at Khawazakhela Gauging Station, District Swat Table 1 Socio-economic attributes of the surveyed respondents
Variable Bahrain (Percent) Fatehpur (Percent)
Family Size (Persons) 11 10
Age
21-30 5.1 15.2
31-40 61.5 54.3
41-50 and above 33.3 30.4
Education
Primary/Middle 23.1 34.8
Matric/O-Level 17.9 28.3
FSc/A-Level and above 5.2 4.3
No Formal Education 53.8 32.6
Income (PKR)
10001-15000 (Very-Low income) 2.6 37.0
15001-20000 (Low income) 41.0 32.6
20001-30000 (Moderate income) 48.7 19.6
30001-40000 (High income) 7.7 10.9
Livelihood Source
Farming/Agriculture 6.5 29.2
Fisheries 10.2 5.3
Hotel business 23.2 5.5
Restaurant 24.9 7.3
Transportation 11.2 16.4
Teaching 6.8 18.2
Tourist Guide 5.2 0
General Store 9.8 14.5
Retired 2.2 3.6
7811
18029
5881 5955
8744
18570
8285
14675
0
2000
4000
6000
8000
10000
12000
14000
16000
18000
20000
2005 2006 2007 2008 2009 2010 2011 2012
Dis
char
ge (
ft3
/Se
c)
August
© 2018 Discovery Publication. All Rights Reserved. www.discoveryjournals.org OPEN ACCESS
ARTICLE RESEARCH
Pag
e64
8
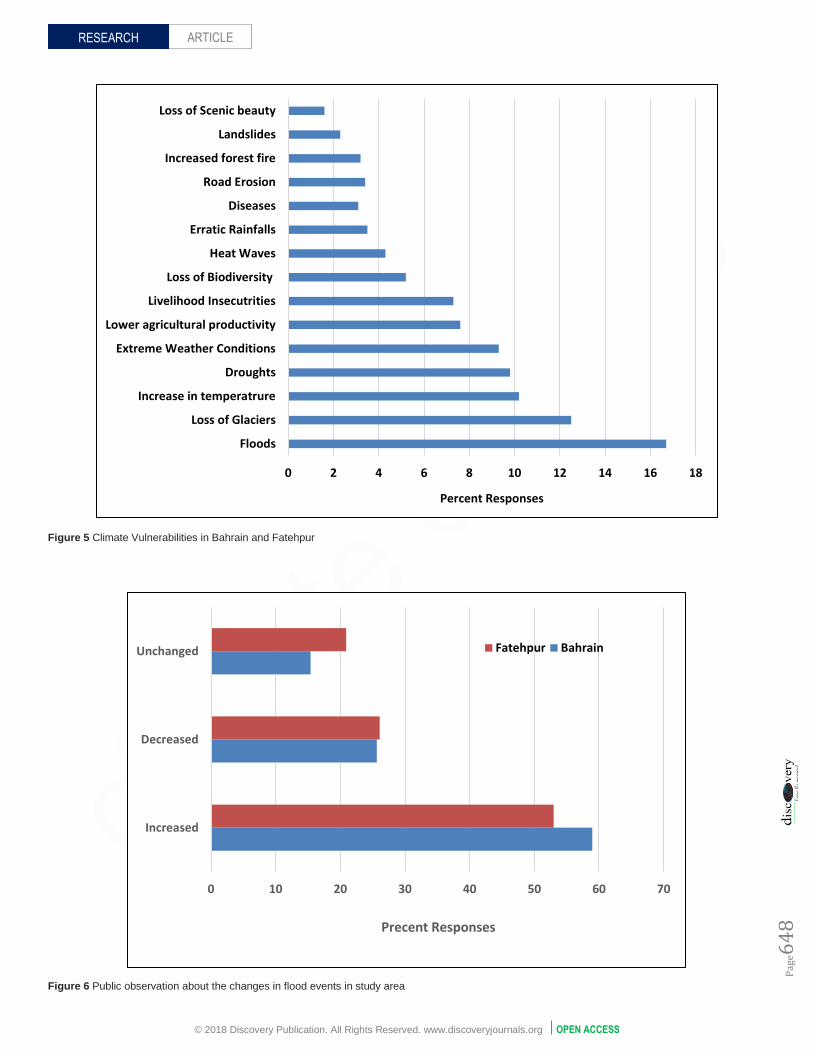
Figure 5 Climate Vulnerabilities in Bahrain and Fatehpur
Figure 6 Public observation about the changes in flood events in study area
0 2 4 6 8 10 12 14 16 18
Floods
Loss of Glaciers
Increase in temperatrure
Droughts
Extreme Weather Conditions
Lower agricultural productivity
Livelihood Insecutrities
Loss of Biodiversity
Heat Waves
Erratic Rainfalls
Diseases
Road Erosion
Increased forest fire
Landslides
Loss of Scenic beauty
Percent Responses
0 10 20 30 40 50 60 70
Increased
Decreased
Unchanged
Precent Responses
Fatehpur Bahrain

© 2018 Discovery Publication. All Rights Reserved. www.discoveryjournals.org OPEN ACCESS
ARTICLE RESEARCH
Pag
e64
9
Figure 7 Public beliefs about relationship of floods to climate change in the study area Table 2 Floods Damages Received by the Respondents/Households in the Study Area
Flood damages Bahrain (Percent) Fatehpur (Percent)
Human Life 2.4 3
House 26.4 31.2
Land/agriculture 41.4 50.3
Businesses 22.1 13.2
Other 7.7 2.3
Total 100 100
for July and 18570 cusecs for August. The data is not sufficient to draw
future projections as data records of 30 to 50 years are required for
assessing future trends (Salma, 2011) but it provides ample evidence for
the event under reference and shows the severity of the floods.
As discussed before due to heavy deforestation in the catchment
area, the fluvial processes of all the river systems have been affected
seriously. There is a close link between the loss of forest cover and
floods because during the past two decades, the forest resources have
cruelly and indiscriminately destroyed (Kruseman & Pellegrini, 2013;
Atta-ur-Rahman & Khan, 2013). Due to the above-mentioned reasons,
and especially the four-day wet spell over the catchments of almost all
the river in Pakistan, the flood originated. In KP province Swat,
Panjkora and Kabul Rivers explicitly experienced high flood discharges
during its course (Atta-ur-Rahman & Khan, 2013).
Socio-economic Profile of Respondents
The study revealed assorted socio-economic characteristics of the
respondents in the study area (Table 1). The average family size is
greater than normal in both the UCs due to joint family system of the
area. Within both the studied UCs most of the surveyed respondents
belong to 31-40 years age with slightly higher (61.5%) for Bahrain. In
Fatehpur, comparatively more respondents belong to the age group 21-
30 years. With respect to education, 53.8% of the respondents in
Bahrain have No Formal Education followed by 23% of Primary/Middle
standard education. Education ratio in the Fatehpur is slightly different
where majority (34.8%) of the respondents belong to Primary/Middle
standard education followed by respondents having No Formal
Education (32.6%). Within both the cases, respondents with post Matric
qualification are below 6%. Income distribution of the respondents show
low to higher income levels in the studied UCs. Majority (48.7%) of the
respondents in Bahrain had moderate income while in Fatehpur,
majority (34.8) of respondents belonged to Very Low-Income Group.
The surveyed respondents predominantly belonged to tourism sector in
Bahrain and agriculture-based livelihoods in Fatehpur.
Public Perceptions about Climate and Flood Vulnerabilities
Climate Vulnerabilities in the Study Area
Figure 5 lists the climate change vulnerabilities in Bahrain and Fatehpur
as reported by the respondents. Majority (16.7) of the respondents
0 10 20 30 40 50 60 70 80 90
Yes
Not Sure/May be
Prefer not to answer
Precent Responses
Fatehpur Bahrain

© 2018 Discovery Publication. All Rights Reserved. www.discoveryjournals.org OPEN ACCESS
ARTICLE RESEARCH
Pag
e65
0
reported floods as climate change vulnerability in both the UCs. Loss of
glacier (12.5%), Increase in temperature (10.2%), Droughts (9.8%) and
Extreme Weather Conditions (9.3%) are the other climate
vulnerabilities. Lower agricultural productivity, diseases, livelihood
insecurities, loss of bio-diversity, extreme weather conditions, landslides
and loss of scenic beauty are directly linked with the negative impacts of
climate change on livelihoods and household welfare. On the contrary,
increase in temperature, erratic rainfalls and heat waves dictates the
climate variability in the study area. Local elders during the interviews
expressed that there is visible change in the climate system of the study
area since the past couple is changed. The weather was much colder
before as compared to these days.
Perceived Flood Variability
To know the extent of the changes in flooding events in the study area,
respondents were asked whether floods have decreased or increased in
the past two decades or remained unchanged. The survey results show
that the in the study are increasing and getting dangerous since the past
two decades in both the administrative units (Figure 6).Majority (59%)
of the respondents in Bahrain reported that flood events have increased
while comparatively more respondents in Fatehpur reported decrease
and no change in the flood events.
In the other question, respondents were asked about the relationship
of climate change and floods. In response most of the respondents (76-
85%) in the study area believe that floods are a precursor of climate
change. A little number of the response were not sure about the
relationship or didn’t chose to answer the question. Interviews from the
local communities revealed that despite the overall decrease in the
rainfall, uncertainty in the climate system is resulting in abrupt events of
rainfall are causing floods in the sampled union councils which was not
the case in the past. The survey results are depicted in figure 7.
Flood Damages in the Study Area
As shown in Table 2, respondents were asked about the damages
received because of flooding, land/agriculture was reported as the major
sector affected by the floods in both the administrative units. As most of
the survey respondents in Fatehpur belong to agriculture sector therefore
they tend to report more about land/agriculture damages in the
respective administrative unit. Damage incurred to businesses included
hotels, restaurants, shops and plazas which is higher in Bahrain (22.1%)
compared to Fatehpur (13.2%) because majority of the survey
respondents in this UC belonged to tourism-based livelihoods. Apart
from livelihood-based damages, the study area suffered with human and
infrastructure losses. In both the UCs, relatively high response rate was
observed for damages received to houses.
Agriculture
The 2010 floods in district brought a great devastation to agricultural
lands, irrigation system, water supply and drainage system, and roads
infrastructure etc.The land holdings of the farmers are on average low
due to the low availability of agricultural lands in the area, so damages
to these fertile soils made a great deal of resource loss in the study area.
Local communities during the interviews expressed that they had not
been compensated for the losses they had incurred during the floods.
Many of the fertile lands were swept away by the floods, which cannot
be rehabilitated without external support from the government or
international. According to Panhwar (2011), the floods swept away the
coniferous forests and top fertile soil, which cannot be replenished over
the coming decades. The loss of forest cover and soil directly affected
many animals and avian species, either washed away with the flood or
forced to relocate. The agriculture sector is one of the badly affected
entity in district Swat. The survey results are consistent with the
damages reported by other researches. The monsoon floods of 2010
quadrupled the troubles of farmers as 60 per cent of farming land, or
150,000 of 250,000 acres of land was washed away by the floods in
district Swat (Khaliq, 2011a).
Tourism
The floods of 2010 damaged the infrastructure and road fabric of the
district, negatively affecting the tourism sector in the valley. Due to the
floods, the tourism hotspots including FizaGhat, Madyan, Bahrrain and
Kalam were severely affected (Khan et al., 2010). The Taliban
insurgency and monsoon floods badly affected tourism causing heavy
financial losses to the hotel industry in Swat valley and other scenic
spots. About 107 hotels are being destroyed by the floods in District
Swat (Khaliq, 2011b). Collectively more than 800 hotels have been
affected in the valley depriving thousands of peoples of their
livelihoods (Khaliq, 2011b). According to the preliminary damage
and needs assessment survey conducted by Asian Development Bank
(2010), 320 hotels existed in district Swat (baseline data acquired
from USAID), 70 hotels were completely damaged due to 2010
floods. A respondent expressed his loss that ““I lost half of my hotel
building due to 2010 flooding in River Swat (the hotel is situated along
the bank of River Swat)”. Many of these instances are available where
people lost their jobs and assets.
Majority of the individuals are concerned about their livelihoods as
the climate change is going to affect tourism industry in district Swat by
reducing the number of tourist visiting to the area. Field visits to the
study area indicated various problems to the tourism sector. The
government is still unable to rehabilitate the damaged infrastructure in
the upper reaches of district Swat such as Makyal, Kalam, Ushu and
Utror. The damaged roads in the area is restricting the tourist movement
to the area thus by affecting the whole tourism sector. The government
should take solid steps in rehabilitating the damaged infrastructure such
as roads, bridges etc. the steps will not only improve the lives of the
inhabitants but will help in the promotion of eco-tourism in the district.
Fisheries
Fisheries is one of the important livelihood sources of the study area.
The River Swat which extends to a length of 250 Km is home to more
than 50 freshwater fish species. The limiting factors for fishery
production in the study area includes overfishing, flooding in River
Swat, water pollution, fishing in breeding, change in water temperature
and use of illegal fishing techniques. Floods are one of the major
limiting factor for the fishery industry in district Swat.The floods
destroyed the fisheries sector in the district by damaging the habitats in
River Swat and private fish farms as reported by respondents. The 2010
flooding event destroyed fishery sector causing large scale mortalities of
fish in River Swat and its tributaries. A total of 26 trout and 17 carp fish
farms in both public and private sectors were destroyed while the trout
hatchery of Madyan city was completely damaged while Mahsheer fish
hatchery near Chakdara was partially damaged (Khan et al., 2010; ADB,
2010).
Floods effect the riverine ecosystem from microorganism to fish.
Young fish tends to suffer more from the floods when the timing of high
water flows coincides with the delicate life stage of fish (Godlewska et
al., 2003). Moreover, the floods can change the group structure of fishes
in rivers (Akhtar et al., 2014).

© 2018 Discovery Publication. All Rights Reserved. www.discoveryjournals.org OPEN ACCESS
ARTICLE RESEARCH
Pag
e65
1
CONCLUSION AND FUTURE RECOMMENDATIONS
Pakistan is vulnerable to many climate induced hazards including
floods, droughts, heat waves, extreme weather events etc. The flooding
event of 2010 was one of the greatest river disasters in modern history,
which affected more than 14 million people in Pakistan. Although, the
extreme rainfall between the months of July and September 2010 is the
main contributing factor to this disaster, yet the human interventions in
the river systems over the years made this disaster a catastrophe.
According to the international and national organizations, the total direct
and indirect losses caused by floods accounted for US Dollars 9 billion
while the cost of reconstruction and rehabilitation needed was estimated
from US Dollars 6 to 8 billion. After the floods, government of Pakistan
and international organizations collectively contributed to the
rehabilitation efforts of the flood damages in district Swat. Although
infrastructure in various effected areas have been restored, yet there is
much still to do. Tourism sector is still not fully functional fully because
of the dilapidated road infrastructure in the upper part of the district.
The study area is most vulnerable to the negative impacts of climate
change. Climate variability and increasing extreme weathers events are
resulting in livelihood insecurities among the local communities. Poor
households with low resource base and adaptation capabilities are most
vulnerable to the natural disasters.
This research recommends that government should prioritize the
effected livelihoods of the study area by extending their support to the
affected communities. Intensive research is needed to investigate to a
full extent the climate change vulnerabilities particularly extreme
weather events in the area. Local communities should be equipped with
climate change knowledge and extension of climate technologies to
offset the vulnerabilities with effective climate adaptation plans.
MATERIAL AND METHODS
The survey was conducted using interview method of research. Two
administrative units (Union Councils) namely Bahrain and Fatehpur
were purposively selected for the study. Bahrain is a well-known tourist
destination of the district, with tourism as the main livelihood source.
Fatehpur is also known for its scenic beauty and majority of the public is
involved in agriculture-based livelihoods. Situated along the river Swat,
both administrative units were hugely affected by the floods.
In the step of data collection, available literature from research
publications and departmental reports were utilized to assess the
damages caused by the 2010 flooding event, hence the causes and
damages of floods were documented. Moreover, discharge data of River
Swat at Khwazakhela gauge station for the months of July and August
through the years 2005 to 2013 were acquired from the Irrigation
Department to know the extent of River discharge variation over the
years. In the second step, a total of 85 respondents were interviewed
using semi-structured questionnaire. The questionnaire covered topics
flood damages, climate vulnerabilities and adaptation strategies in the
study area. The results were analyzed using Statistical Package for
Social Scientists (SPSS) Version 20.0 in the form of descriptive
statistics and graphs. Figure 1 shows extent of the study area and
sampled Union Councils.
REFERENCES 1. Akhtar, N., & Pathan, A. J. (2014). Exploring the Avian Fauna of Swat,
Khyber Pakhtunkhwa, Pakistan. British Journal of Poultry
Sciences, 3(1), 20-26.
2. Asian Development Bank. (2010). Pakistan Floods 2010: preliminary
damage and need assessment. Islamabad, Pakistan; 2010. http:/
/www.adb.org/sites/default/files/linked-documents/44372-01-pak-oth-
02.pdf [May 14, 2016]
3. Atta-ur-Rehman., & Khan, A. N. (2011). Analysis of flood causes and
associated socio-economic damages in the Hindukush region. Natural
hazards, 59(3), 1239-1260. DOI 10.1007/s11069-011-9830-8.
4. Atta-ur-Rehman., & Khan, A. N. (2013). Analysis of 2010-flood
causes, nature and magnitude in the Khyber Pakhtunkhwa,
Pakistan. Natural hazards, 66(2), 887-904.
5. Baig, M.A., 2008. Floods and flood plains in Pakistan. In: 20th
International Congress on Irrigation and Drainage, Lahore, Pakistan.
6. Gaurav, K., Sinha, R., & Panda, P. K. (2011). The Indus flood of 2010
in Pakistan: a perspective analysis using remote sensing
data. Natural hazards, 59(3), 1815-1826.
7. Godlewska, M., Mazurkiewicz-Boroń, G., Pociecha, A., Wilk-Woźniak,
E., &Jelonek, M. (2003). Effects of flood on the functioning of the
Dobczyce reservoir ecosystem. Hydrobiologia, 504(1-3), 305-313.
8. Government of Pakistan. (2010). Task Force on Climate Change:
Final Report, Islamabad: Planning Commission.
9. IUCN Pakistan. (2009). Climate Change Disaster Management in
Pakistan, IUCN Pakistan, Islamabad, Pakistan.
10. Khaliq, F. (2011a, January 10). Devastation: Call for revival of
Swat agriculture. The Express Tribune. Retrieved from http://
tribune.com.pk/ 11. Khaliq, F. (2011b, January 12). Reviving tourism: Aid rekindles hope
among Swat hoteliers. The Express Tribune. Retrieved from
http://tribune.com.pk/ 12. Khan, A., Khan, M., Ayaz, Said A., Ali Z., Khan, H., Ahmad, N., &
Garstang, R. (2010). Rapid Assessment of Flood Impact on the
Environment in Selected Affected Areas of Pakistan. Pakistan
Wetlands Programme and UNDP Pakistan. Pp 35
13. Kruseman, G., & Pellegrini, L. (2013). Institutions and forest
management in the Swat region of Pakistan. Nature's Wealth: The
Economics of Ecosystem Services and Poverty, pp.234-258.
14. Panhwar, N. A. (2011). The Indus Flood 2010; Perspectives, Issues
and Strategies. Centre for Environment & Development.
15. Tariq, M. A. U. R., & van de Giesen, N. (2012). Floods and flood
management in Pakistan. Physics and Chemistry of the Earth, Parts
A/B/C, 47, 11-20.
16. Webster, P. J., Toma, V. E., & Kim, H. M. (2011). Were the 2010
Pakistan floods predictable?. Geophysical research letters, 38,
L04806, doi:10.1029/2010GL046346 17. Ahmad, H., M. Öztürk, W. Ahmad and S.M. Khan. 2015. Status of
Natural Resources in the 442 Uplands of the Swat Valley Pakistan. In
Climate Change Impacts on High-Altitude 443 Ecosystems. (pp. 49-
98). Springer International Publishing.
18. PPAF, 2013. Developmental Profile of www.ppaf.org.pk/Italian/.../
District%20Profile%20Report%20Swat.docxDistrict Swat, Situation
Analysis & Baseline Surveys 580 for Poverty Reduction through Rural
Development in KPK, FATA & Baluchistan. Pakistan 581 Poverty
Alleviation Fund (PPAF). 582. Accessed 583 February 29, 2016.
19. Khan, S. R., & Khan, S. R. (2009). Assessing poverty-deforestation
links: Evidence from Swat, Pakistan. Ecological Economics, 68(10),
2607–2618. https://doi.org/10.1016/j.ecolecon.2009.04.018
20. Sabir, M. (2003). Evaluation of Surface Water Resources And
Sediment Load in Indus And Swat Kohistan North Pakistan. Retrieved
from http://eprints.hec.gov.pk/2848/.
21. Ahmad, H., Öztürk, M., Ahmad, W., & Khan, S. M. (2015). Status of
Natural Resources in the Uplands of the Swat Valley Pakistan. In
Climate Change Impacts on High-Altitude Ecosystems (pp. 49-98).
Springer International Publishing.
22. Bazinni, F., (2013). Atlas of natural resources evaluation in swat
valley, Khyber Pakhtunkhwa, Islamic republic of Pakistan. Italian
Development Cooperation, Ministry of Foreign Affairs.
http://goo.gl/Tp7Y41 [February 29, 2016]
23. Government of Pakistan. (1999). District Census Report of Swat.
Islamabad:Statistics Division, Population Census Organization.
24. Dahri, Z. H., Ahmad, B., Leach, J. H., & Ahmad, S. (2011). Satellite-
© 2018 Discovery Publication. All Rights Reserved. www.discoveryjournals.org OPEN ACCESS
ARTICLE RESEARCH
Pag
e65
2
basedsnowcover distribution and associated snowmelt runoff
modeling in Swat RiverBasin of Pakistan. Proceedings of the Pakistan
Academy of Sciences, 48(1), 19-32.
25. Hasan, Z., Ahmad, I., Yousuf, M., & Khan, J. (2013). Fish Biodiversity
of River Swat. Pakistan Journal of Zoology, 45(283-289).
26. Yousafzai, A. M., Khan, W., & Hasan, Z. (2013). Fresh records on
water quality and ichthyo diversity of River Swat at Charsadda,
Khyber Pakhtunkhwa. Pak J Zool, 45(6), 1727-1734.
27. PDMA. (2015a). Overview of Natural Disasters 2015 Impact,
Response andManaging Risks. Provincial Disaster Management
Authority, Government ofKhyber Pakhtunkhwa. http://www.pdma.
gov.pk/ [Nov 22, 2016]
28. Kruseman, G., & Pellegrini, L. (2013). Institutions and forest
management inthe Swat region of Pakistan. Nature's Wealth: The
Economics of Ecosystem Services and Poverty, pp.234-258.
Keywords
Climate Change, Climate Vulnerability, Floods, Livelihoods, Tourism
Article History
Received: 02 April 2018
Accepted: 17 May 2018
Published: October - December 2018
Citation
Muhammad Suleman Bacha, Mohammad Nafees, Muhammad. Flooding
as precursor of climate variability: causes and damages of 2010 flood
event in District Swat, Pakistan. Climate Change, 2018, 4(16), 642-652
Publication License
This work is licensed under a Creative Commons Attribution
4.0 International License.
General Note
Article is recommended to print as color version in recycled paper.
Save Trees, Save Climate.