MONGOLIA - Climate Change Knowledge Portal
28
MONGOLIA CLIMATE RISK COUNTRY PROFILE
-
Upload
khangminh22 -
Category
Documents
-
view
5 -
download
0
Transcript of MONGOLIA - Climate Change Knowledge Portal

iiCLIMATE RISK COUNTRY PROFILE: MONGOLIA
COPYRIGHT© 2021 by the World Bank Group1818 H Street NW, Washington, DC 20433Telephone: 202-473-1000; Internet: www.worldbank.org
© 2021 Asian Development Bank6 ADB Avenue, Mandaluyong City, 1550 Metro Manila, PhilippinesTel +63 2 8632 4444; Fax +63 2 8636 2444www.adb.org
This work is a product of the staff of the World Bank Group (WBG) and the Asian Development Bank (ADB) and with external contributions. The opinions, findings, interpretations, and conclusions expressed in this work are those of the authors’ and do not necessarily reflect the views or the official policy or position of the WBG, its Board of Executive Directors, or the governments it represents or of ADB, its Board of Governors, or the governments they represent.
The WBG and ADB do not guarantee the accuracy of the data included in this work and do not make any warranty, express or implied, nor assume any liability or responsibility for any consequence of their use. This publication follows the WBG’s practice in references to member designations, borders, and maps. ADB, however, recognizes “China” as the People’s Republic of China. The boundaries, colors, denominations, and other information shown on any map in this work, or the use of the term “country” do not imply any judgment on the part of the WBG or ADB, their respective Boards, or the governments they represent, concerning the legal status of any territory or geographic area or the endorsement or acceptance of such boundaries.
The mention of any specific companies or products of manufacturers does not imply that they are endorsed or recommended by either the WBG or ADB in preference to others of a similar nature that are not mentioned.
RIGHTS AND PERMISSIONS The material in this work is subject to copyright. Because the WB and ADB encourage dissemination of their knowledge, this work may be reproduced, in whole or in part, for noncommercial purposes as long as full attribution to this work is given. This work is licensed under the Creative Commons Attribution-NonCommercial 3.0 IGO License. To view a copy of this license, visit http://creativecommons.org/licenses/by-nc/3.0/igo/ or send a letter to Creative Commons, PO Box 1866, Mountain View, CA 94042, USA.
This CC license does not apply to WBG or non-ADB copyright materials in this publication. If the material is attributed to another source, please contact the copyright owner or publisher of that source for permission to reproduce it. WBG or ADB cannot be held liable for any claims that arise as a result of your use of the material.
Please cite the work as follows: Climate Risk Country Profile: Mongolia (2021): The World Bank Group and the Asian Development Bank.
Any queries on rights and licenses, including subsidiary rights, should be addressed to World Bank Publications, The World Bank Group, 1818 H Street NW, Washington, DC 20433, USA; fax: 202-522-2625; e-mail: [email protected].
Cover Photos: © Khasar Sandag/World Bank, “Autumn comes early in Mongolia” September 21, 2013 via Flickr, Creative Commons CC BY-NC-ND 2.0. © Khasar Sandag/World Bank, “A herder boy in rural Mongolia” April 20, 2013 via Flickr, Creative Commons CC BY-NCND 2.0.
Graphic Design: Circle Graphics, Reisterstown, MD.

iiiCLIMATE RISK COUNTRY PROFILE: MONGOLIA
ACKNOWLEDGEMENTSThis profile is part of a series of Climate Risk Country Profiles that are jointly developed by the World Bank Group (WBG) and the Asian Development Bank (ADB). These profiles synthesize the most relevant data and information on climate change, disaster risk reduction, and adaptation actions and policies at the country level. The profile is designed as a quick reference source for development practitioners to better integrate climate resilience in development planning and policy making. This effort is co-led by Veronique Morin (Senior Climate Change Specialist, WBG). Ana E. Bucher (Senior Climate Change Specialist, WBG) and Arghya Sinha Roy (Senior Climate Change Specialist, ADB).
This profile was written by Alex Chapman (Consultant, ADB), William Davies (Consultant, ADB), Ciaran Downey (Consultant). Technical review of the profiles was undertaken by Robert L. Wilby (Loughborough University). Additional support was provided by MacKenzie Dove (Senior Climate Change Consultant, WBG), Jason Johnston (Operations Analyst, WBG), Yunziyi Lang (Climate Change Analyst, WBG), Adele Casorla-Castillo (Consultant, ADB), and Charles Rodgers (Consultant, ADB). This profile also benefitted from inputs of WBG and ADB regional staff and country teams.
Climate and climate-related information is largely drawn from the Climate Change Knowledge Portal (CCKP), a WBG online platform with available global climate data and analysis based on the latest Intergovernmental Panel on Climate Change (IPCC) reports and datasets. The team is grateful for all comments and suggestions received from the sector, regional, and country development specialists, as well as climate research scientists and institutions for their advice and guidance on use of climate related datasets.

ivCLIMATE RISK COUNTRY PROFILE: MONGOLIA
FOREWORD . . . . . . . . . . . . . . . . . . . . . . . . . . . . . . . . . . . . 1
KEY MESSAGES . . . . . . . . . . . . . . . . . . . . . . . . . . . . . . . . . . 2
COUNTRY OVERVIEW . . . . . . . . . . . . . . . . . . . . . . . . . . . . . . . 2
CLIMATOLOGY . . . . . . . . . . . . . . . . . . . . . . . . . . . . . . . . . . 5Climate Baseline 5
Overview 5Key Trends 6
Climate Future 7Overview 7
CLIMATE RELATED NATURAL HAZARDS . . . . . . . . . . . . . . . . . . . . . .11Heatwaves 11Drought and Dust 12Flood 13
CLIMATE CHANGE IMPACTS . . . . . . . . . . . . . . . . . . . . . . . . . . . 14Natural Resources 14
Water 14Landcover and Biodiversity 15
Economic Sectors 15Agriculture and Livestock Production 15Urban and Energy 17
Communities 19Poverty and Inequality 19Vulnerability to Climate-Related Disaster 19Human Health 20
POLICIES AND PROGRAMS . . . . . . . . . . . . . . . . . . . . . . . . . . . 21National Adaptation Policies and Strategies 21Climate Change Priorities of ADB and the WBG 22
CONTENTS

1CLIMATE RISK COUNTRY PROFILE: MONGOLIA
Climate change is a major risk to good development outcomes, and the World Bank Group is committed to playing an important role in helping countries integrate climate action into their core development agendas. The World Bank Group (WBG) and the Asian Development Bank (ADB) are committed to supporting client countries to invest in and build a low-carbon, climate-resilient future, helping them to be better prepared to adapt to current and future climate impacts.
Both institutions are investing in incorporating and systematically managing climate risks in development operations through their individual corporate commitments.
For the World Bank Group: a key aspect of the World Bank Group’s Action Plan on Adaptation and Resilience (2019) is to help countries shift from addressing adaptation as an incremental cost and isolated investment to systematically incorporating climate risks and opportunities at every phase of policy planning, investment design, implementation and evaluation of development outcomes. For all International Development Association and International Bank for Reconstruction and Development operations, climate and disaster risk screening is one of the mandatory corporate climate commitments. This is supported by the World Bank Group’s Climate and Disaster Risk Screening Tool which enables all Bank staff to assess short- and long-term climate and disaster risks in operations and national or sectoral planning processes. This screening tool draws up-to-date and relevant information from the World Bank’s Climate Change Knowledge Portal, a comprehensive online ‘one-stop shop’ for global, regional, and country data related to climate change and development.
For the Asian Development Bank (ADB): its Strategy 2030 identified “tackling climate change, building climate and disaster resilience, and enhancing environmental sustainability” as one of its seven operational priorities. Its Climate Change Operational Framework 2017–2030 identified mainstreaming climate considerations into corporate strategies and policies, sector and thematic operational plans, country programming, and project design, implementation, monitoring, and evaluation of climate change considerations as the foremost institutional measure to deliver its commitments under Strategy 2030. ADB’s climate risk management framework requires all projects to undergo climate risk screening at the concept stage and full climate risk and adaptation assessments for projects with medium to high risk.
Recognizing the value of consistent, easy-to-use technical resources for our common client countries as well as to support respective internal climate risk assessment and adaptation planning processes, the World Bank Group’s Climate Change Group and ADB’s Sustainable Development and Climate Change Department have worked together to develop this content. Standardizing and pooling expertise facilitates each institution in conducting initial assessments of climate risks and opportunities across sectors within a country, within institutional portfolios across regions, and acts as a global resource for development practitioners.
For common client countries, these profiles are intended to serve as public goods to facilitate upstream country diagnostics, policy dialogue, and strategic planning by providing comprehensive overviews of trends and projected changes in key climate parameters, sector-specific implications, relevant policies and programs, adaptation priorities and opportunities for further actions.
We hope that this combined effort from our institutions will spur deepening of long-term risk management in our client countries and support further cooperation at the operational level.
Bernice Van Bronkhorst Preety BhandariGlobal Director Chief of Climate Change and Disaster Risk Management Thematic Group Climate Change Group concurrently Director Climate Change and Disaster Risk Management DivisionThe World Bank Group Sustainable Development and Climate Change Department Asian Development Bank
FOREWORD

2CLIMATE RISK COUNTRY PROFILE: MONGOLIA
• Mongolia has already experienced significant climate changes, with warming of over 2°C and declines in
rainfall reported between 1940 and 2015.
• Recent climate changes have led to chronic drought, and increased exposure to secondary impacts such as
dust storms.
• Mongolia faces rates of warming far higher than the global average. On the highest future emissions pathway
(RCP8.5) average warming could exceed 5°C by the end of the century. Warming in maximum and minimum
daily temperatures is expected to be faster than the average rate, potentially amplifying the stress exerted on
human health, livelihoods, and ecosystems.
• The intensity of extreme climate-driven hazards including heat wave, drought, and river flood, is expected to
increase.
• Mongolia’s unique ecosystems are likely to come under pressure from long-term warming and drying processes,
with shifts in species ranges likely, and potential loss of forest cover and associated species.
• Changes in climatic conditions are projected to place further downward pressure on yields of current agricultural
crops, particularly wheat, threatening Mongolia’s food security.
• Without concerted disaster risk reduction efforts and support to communities to adapt Mongolia’s poorest
communities face significant damage and loss.
• Focus is needed on the interplay between climate changes and current development trends in Mongolia,
unplanned development in flood exposed areas and air pollution issues could interact with climate changes to
enhance health risks and inequalities.
KEY MESSAGES
COUNTRY OVERVIEW
Mongolia is a landlocked country of East Asia characterized by unique ecosystems and cultures. Mongolia’s
vast steppe plains and deserts experience about 250 sunny days every year, leading to the country
commonly being termed ‘the land of the blue sky’. Mongolia has a very low population density, with many
of its communities traditionally nomadic pastoralists. On some indicators of human development Mongolia performs
very well, with notably high rates of adult literacy and primary education.1 Recent years have seen rapid urbanization,
with 68.5% (2019) of the country’s population living in the Ulaanbaatar2. This transition in lifestyles and livelihoods
has presented many challenges (see key indicators in Table 1). Due to the severe and widespread economic
impact of the coronavirus disease (COVID 19) pandemic, the Mongolian economy contracted by 5.3% in 2020, its
worst contraction since the early 1990s. A sharp decline in global demand for key commodities and border were
among the key external factors that negatively impacted the economy; the economy is expected to recover in 2021.3
1 UNICEF (2015). At a glance: Mongolia. URL: https://www.unicef.org/infobycountry/mongolia_statistics.html [accessed 20/12/2018]2 World Bank (2021). World Development Indicators. World Bank DataBank. [accessed 5 February, 2021]. URL: https://databank.
worldbank.org/source/world-development-indicators3 World Bank Group (2021). Mongolia, Overview. URL: https://www.worldbank.org/en/country/mongolia/overview

3CLIMATE RISK COUNTRY PROFILE: MONGOLIA
The contribution of agriculture to Mongolia’s economy has declined in recent years, constituting 12% of GDP,
compared to the 50% contribution from the service sector. Agriculture and particularly livestock herding remain
important employers and sources of subsistence for a large proportion of the population, but also represent a
vulnerability. The impacts associated with the climate-related disaster, locally termed dzud (recognized when a
strong winter follows a dry summer) can be severe, resulting in the loss of millions of livestock as in 2009–10.
Mongolia’s geographic location, extreme weather and fragile ecosystems, coupled with prominent pastoral livestock
and rain-fed agriculture sectors, make Mongolia’s economy, livelihood and traditional cultures highly vulnerable to
climate change risks.
Historical climate warming is believed to have taken place at some of the fastest rates in the world in Mongolia and
other shifts in climate dynamics are already strongly impacting on lives and livelihoods. In response, Mongolia has
engaged closely with international efforts to mitigate climate change and its impacts. In 2016 the nation ratified the
Paris Climate Agreement, in 2018 released its Third National Communication to the UNFCCC and in adopted its
Updated Nationally Determined Contributions in 2020. Key national policy documents include the National Action
Plan on Climate Change (2011–2021) and the Green Development Policy (2014–2030).
TABLE 1 . Key indicators
Indicator Value Source
Population Undernourished4 21.3% (2017–2019) FAO, 2020
National Poverty Rate5 28.4% (2018) ADB, 2020a
Share of Income Held by Bottom 20%6 7.9% (2018) World Bank, 2019
Net Annual Migration Rate7 −0.03% (2015–2020) UNDESA, 2019
Infant Mortality Rate (Between Age 0 and 1)8 1.8% (2015–2020) UNDESA, 2019
Average Annual Change in Urban Population9 1.63% (2015–2020) UNDESA, 2018
Dependents per 100 Independent Adults10 55 (2020) UNDESA, 2019
Urban Population as % of Total Population11 68.7% (2020) CIA, 2020
External Debt Ratio to GNI12 253.9% (2018) ADB, 2020b
Government Expenditure Ratio to GDP13 37.5% (2019) ADB, 2020b
4 FAO, IFAD, UNICEF, WFP, WHO (2020). The state of food security and nutrition in the world. Transforming food systems for affordable healthy diets. FAO. Rome. URL: http://www.fao.org/documents/card/en/c/ca9692en/
5 ADB (2020a). Basic Statistics 2020. URL: https://www.adb.org/publications/basic-statistics-2020 [accessed 27/01/21]6 World Bank (2019). Income share held by lowest 20%. URL: https://data.worldbank.org/ [accessed 17/12/20]7 UNDESA (2019). World Population Prospects 2019: MIGR/1. URL: https://population.un.org/wpp/Download/Standard/Population/
[accessed 17/12/20]8 UNDESA (2019). World Population Prospects 2019: MORT/1-1. URL: https://population.un.org/wpp/Download/Standard/Population/
[accessed 17/12/20]9 UNDESA (2019). World Urbanization Prospects 2018: File 6. URL: https://population.un.org/wup/Download/ [accessed 17/12/20]10 UNDESA (2019). World Population Prospects 2019: POP/11-A. URL: https://population.un.org/wpp/Download/Standard/Population/
[accessed 17/12/20]11 CIA (2020). The World Factbook. Central Intelligence Agency. Washington DC. URL: https://www.cia.gov/the-world-factbook/12 ADB (2020b). Key Indicators for Asia and the Pacific 2020. Asian Development Bank. URL: https://www.adb.org/publications/
key-indicators-asia-and-pacific-202013 ADB (2020b). Key Indicators for Asia and the Pacific 2020. Asian Development Bank. URL: https://www.adb.org/publications/
key-indicators-asia-and-pacific-2020

4CLIMATE RISK COUNTRY PROFILE: MONGOLIA
Green, Inclusive and Resilient RecoveryThe coronavirus disease (COVID-19) pandemic has led to unprecedented adverse social and economic impacts.
Further, the pandemic has demonstrated the compounding impacts of adding yet another shock on top of
the multiple challenges that vulnerable populations already face in day-to-day life, with the potential to create
devastating health, social, economic and environmental crises that can leave a deep, long-lasting mark. However,
as governments take urgent action and lay the foundations for their financial, economic, and social recovery, they
have a unique opportunity to create economies that are more sustainable, inclusive and resilient. Short and long-
term recovery efforts should prioritize investments that boost jobs and economic activity; have positive impacts on
human, social and natural capital; protect biodiversity and ecosystems services; boost resilience; and advance the
decarbonization of economies.
This document aims to succinctly summarize the climate risks faced by Mongolia. This includes rapid onset and
long-term changes in key climate parameters, as well as impacts of these changes on communities, livelihoods and
economies, many of which are already underway. This is a high-level synthesis of existing research and analyses,
focusing on the geographic domain of Mongolia, therefore potentially excluding some international influences
and localized impacts. The core data presented is sourced from the database sitting behind the World Bank
Group’s Climate Change Knowledge Portal (CCKP),
incorporating climate projections from the Coupled
Model Inter-comparison Project Phase 5 (CMIP5).
This document is primarily meant for WBG and ADB
staff to inform their climate actions and to direct
them to many useful sources of secondary data and
research.
Due to a combination of political, geographic, and
social factors, Mongolia is recognized as vulnerable
to climate change impacts, ranked 67th out of
181 countries in the 2020 ND-GAIN Index.14 The
ND-GAIN Index ranks 181 countries using a score
which calculates a country’s vulnerability to climate
change and other global challenges as well as their
readiness to improve resilience. The more vulnerable
a country is the lower their score, while the more
ready a country is to improve its resilience the higher it
will be. Norway has the highest score and is ranked 1st.
Figure 1 is a time-series plot of the ND-GAIN Index
showing Mongolia’s progress.Mongolia
Sco
re
50
45
47.5
52.5
55
57.5
1995 1997 1999 2001 2003 2005 2007 2009 2011 2013
FIGURE 1 . The ND-GAIN Index score (out of 100) summarizes a country’s vulnerability to climate change and other global challenges in combination with its readiness to improve resilience It aims to help businesses and the public sector better prioritize investments for a more efficient response to the immediate global challenges ahead
14 University of Notre Dame (2019). Notre Dame Global Adaptation Initiative. URL: https://gain.nd.edu/our-work/country-index/

5CLIMATE RISK COUNTRY PROFILE: MONGOLIA
Climate Baseline
OverviewMongolia has a strongly continental climate, with four distinctive seasons, high fluctuations of temperature, low
precipitation and marked regional variations depending on latitude and altitude. Average temperatures range
between around −4°C and −8°C in and between mountain ranges climbing to around 2°C in the steppe desert
region and around 6°C in the southern desert bordering China. Temperature varies dramatically throughout the year
(Figure 2), which demonstrates the latest climatology (1991–2020). Historically, maximum temperatures have
peaked at around 24°C in July, while January minimum temperatures fall to around −28°C. Annual precipitation
rarely exceeds 400 millimeters (mm) and is typically much lower in the south and central desert and steppe
regions. In the Gobi Desert, annual rainfall is only 40 mm. Nationally, an estimated 85% of precipitation falls
between April and September.15 Small inter-annual variations in precipitation can lead to severe drought events,
with some regions not experiencing rainfall at all. Figure 3 shows observed spatial variation for temperature and
precipitation across Mongolia.
Annual Cycle
CLIMATOLOGY
Rainfall Temperature
Tem
pera
ture
(°C
) Rainfall (m
m)0
–30
30
60
0
25
50
75
Jan Feb Mar Apr May Jun Jul Aug Sep Oct Nov Dec
FIGURE 2 . Average monthly temperature and rainfall in Mongolia, 1991–2020 16
15 Ministry of Environment and Tourism (2018). Third National Communication to the UNFCCC. URL: https://unfccc.int/sites/default/files/resource/06593841_Mongolia-NC3-2-Mongolia%20TNC%202018%20pr.pdf
16 WBG Climate Change Knowledge Portal (CCKP, 2020). Climate Data: Historical. URL: https://climateknowledgeportalworldbank.org/country/mongolia/climate-data-historical

6CLIMATE RISK COUNTRY PROFILE: MONGOLIA
Special Variation
FIGURE 3 . Annual mean temperature (°C) (left), and annual mean rainfall (mm) (right) in Mongolia over the period 1991–202017
Key TrendsTemperatureVery high rates of historical warming are reported in Mongolia’s Third National Communication to the UNFCCC.
Between 1940 and 2015 average temperatures rose by an average 2.24°C. As would be expected this rise has
been associated with a decline in frost days and an increase in hot summer days. Notably, the rise in temperatures
differs between extremes. Maximum temperatures have risen 2.6°C while minimum temperatures have risen only
0.3°C over the same period. Research has suggested that temperature trends can vary locally, influenced by altitude
and by biome (i.e. the type of land cover).18
PrecipitationA decline in average annual precipitation of 7% over the
period 1940–2015 is reported in Mongolia’s Third National
Communication to the UNFCCC. The country’s central
regions have felt this decline in rainfall most strongly. This
sits alongside a proportionately large increase in winter
snowfall. The number of consecutive wet days and the
number of days with heavy precipitation are also believed
to have declined over the period 1971–2015. However,
all these trends have low statistical significance and
should be approached with caution. Local knowledge and
observation has identified an increase in the frequency of
thunderstorms and short high-intensity rainfall events.19
A Precautionary Approach
Studies published since the last iteration of
the IPCC’s report (AR5), such as Gasser et al.
(2018), have presented evidence which
suggests a greater probability that earth will
experience medium and high-end warming
scenarios than previously estimated.20 Climate
change projections associated with the
highest emissions pathway (RCP8.5) are
presented here to facilitate decision making
which is robust to these risks.
17 WBG Climate Change Knowledge Portal (CCKP, 2020). Climate Data: Historical. URL: https://climateknowledgeportalworldbank.org/country/mongolia/climate-data-historical
18 Lu, N., Wilske, B., Ni, J., John, R. and Chen, J. (2009). Climate change in Inner Mongolia from 1955 to 2005—trends at regional, biome and local scales. Environmental Research Letters, 4(4), p. 045006. URL: https://iopscience.iop.org/article/ 10.1088/1748-9326/4/4/045006
19 Goulden, C.E., Mead, J., Horwitz, R., Goulden, M., Nandintsetseg, B., McCormick, S., Boldgiv, B. and Petraitis, P.S. (2016). Interviews of Mongolian herders and high resolution precipitation data reveal an increase in short heavy rains and thunderstorm activity in semi-arid Mongolia. Climatic Change, 136(2), pp. 281–295. URL: https://www.cabdirect.org/cabdirect/abstract/20163198353
20 Gasser, T., Kechiar, M., Ciais, P., Burke, E. J., Kleinen, T., Zhu, D., . . . Obersteiner, M. (2018). Path-dependent reductions in CO2 emission budgets caused by permafrost carbon release. Nature Geoscience, 11, 830–835. URL: https://www.nature.com/articles/s41561-018-0227-0?WT.feed_name=subjects_climate-sciences
7CLIMATE RISK COUNTRY PROFILE: MONGOLIA
Climate Future
OverviewThe main data source for the World Banks’ Climate Change Knowledge Portal (CCKP) is the Coupled Model Inter-
comparison Project Phase 5 (CMIP5) models, which are utilized within the Fifth Assessment Report (AR5) of the
Intergovernmental Panel on Climate Change (IPCC), providing estimates of future temperature and precipitation.
Four Representative Concentration Pathways (i.e. RCP2.6, RCP4.5, RCP6.0, and RCP8.5) were selected and
defined by their total radiative forcing (cumulative measure of GHG emissions from all sources) pathway and level
by 2100. In this analysis RCP2.6 and RCP8.5, the extremes of low and high emissions pathways, are the primary
focus RCP2.6 represents a very strong mitigation scenario, whereas RCP8.5 assumes business-as-usual scenario.
For more information, please refer to the RCP Database.
Tables 2 and 3 below, provide information on temperature projections and anomalies for the four RCPs over two
distinct time horizons; presented against the reference period of 1986–2005. In subsequent analysis RCP2.6 and
RCP8.5, the extremes of low and high emissions pathways, are the primary focus. RCP2.6 would require rapid
and systemic global action, achieving emissions reduction throughout the 21st century enough to reach net zero
global emissions by around 2080. RCP8.5 assumes annual global emissions will continue to increase throughout
the 21st century. Climate changes under each emissions pathway are presented against a reference period of
1986–2005 for all indicators.
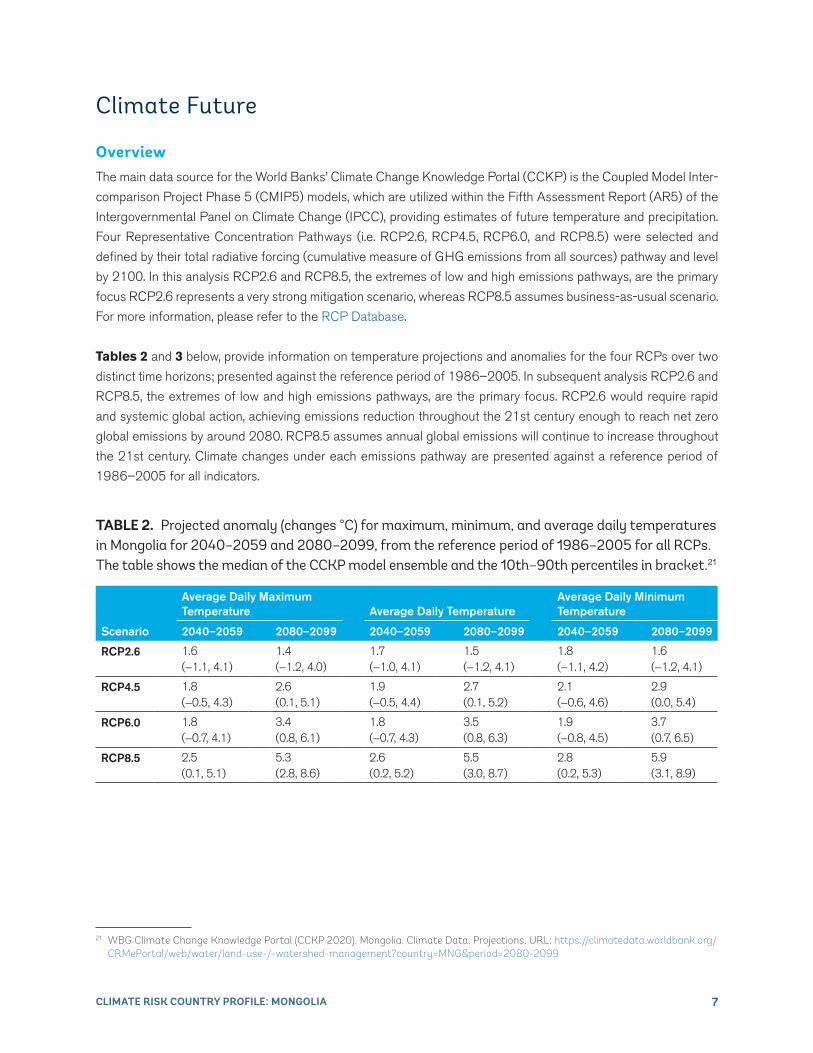
TABLE 2 . Projected anomaly (changes °C) for maximum, minimum, and average daily temperatures in Mongolia for 2040–2059 and 2080–2099, from the reference period of 1986–2005 for all RCPs The table shows the median of the CCKP model ensemble and the 10th–90th percentiles in bracket 21
Average Daily Maximum Temperature Average Daily Temperature
Average Daily Minimum Temperature
Scenario 2040–2059 2080–2099 2040–2059 2080–2099 2040–2059 2080–2099
RCP2.6 1.6(−1.1, 4.1)
1.4(−1.2, 4.0)
1.7(−1.0, 4.1)
1.5(−1.2, 4.1)
1.8(−1.1, 4.2)
1.6(−1.2, 4.1)
RCP4.5 1.8(−0.5, 4.3)
2.6(0.1, 5.1)
1.9(−0.5, 4.4)
2.7(0.1, 5.2)
2.1(−0.6, 4.6)
2.9(0.0, 5.4)
RCP6.0 1.8(−0.7, 4.1)
3.4(0.8, 6.1)
1.8(−0.7, 4.3)
3.5(0.8, 6.3)
1.9(−0.8, 4.5)
3.7(0.7, 6.5)
RCP8.5 2.5(0.1, 5.1)
5.3(2.8, 8.6)
2.6(0.2, 5.2)
5.5(3.0, 8.7)
2.8(0.2, 5.3)
5.9(3.1, 8.9)
21 WBG Climate Change Knowledge Portal (CCKP 2020). Mongolia. Climate Data. Projections. URL: https://climatedata.worldbank.org/CRMePortal/web/water/land-use-/-watershed-management?country=MNG&period=2080-2099

8CLIMATE RISK COUNTRY PROFILE: MONGOLIA
Model EnsembleClimate projections presented in this document are
derived from datasets available through the CCKP,
unless otherwise stated. These datasets are processed
outputs of simulations performed by multiple General
Circulation Models (GCM) (for further information see
Flato et al., 2013).22 Collectively, these different GCM
simulations are referred to as the ‘model ensemble’.
Due to the differences in the way GCMs represent
the key physical processes and interactions within the
climate system, projections of future climate conditions
can vary widely between different GCMs, this is
particularly the case for rainfall related variables and
at national and local scales. The range of projections
from 16 GCMs for annual average temperature change
and annual precipitation change in Mongolia under
RCP8.5 is shown in Figure 4. Spatial representation
of future projections of annual temperature and
precipitation for mid and late century under RCP8.5
are presented in Figure 5.
TABLE 3 . Projections of average temperature anomaly (°C) in Mongolia for different seasons (3-monthly time slices) over different time horizons and emissions pathways, showing the median estimates of the full CCKP model ensemble and the 10th and 90th percentiles in brackets 20
2040–2059 2080–2099
Scenario Jun–Aug Dec–Feb Jun–Aug Dec–Feb
RCP2.6 1.7(−1.5, 4.8)
2.2(−1.3, 4.4)
1.7(−1.7, 4.6)
1.8(−1.2, 4.2)
RCP4.5 2.2(−0.9, 4.9)
2.0(−1.0, 4.5)
2.9(−0.3, 5.9)
3.0(−0.1, 5.3)
RCP6.0 1.9(−0.8, 4.8)
2.2(−1.4, 4.7)
3.7(0.7, 7.3)
4.0(0.3, 6.4)
RCP8.5 2.6(0.0, 6.0)
2.7(−0.4, 5.2)
5.5(2.7, 9.6)
5.7(3.2, 8.7)
FIGURE 4 . ‘Projected average temperature anomaly’ and ‘projected annual rainfall anomaly’ in Mongolia Outputs of 16 models within the ensemble simulating RCP8 5 over the period 2080–2099 Models shown represent the subset of models within the ensemble which provide projections across all RCPs and therefore are most robust for comparison20 Three models are labelled
–10% 0% 10% 20% 30% 50% 60% 70%Average annual precipitation anomaly (%)
Ave
rage
tem
pera
ture
ano
mal
y (°
C)
gfdl_esm2m
ipsl_cm5a_mr
miroc_esm_chem
0
1
2
3
4
5
6
7
8
9
10
Median,10th and 90th
Percentiles
40%
22 Flato, G., Marotzke, J., Abiodun, B., Braconnot, P., Chou, S. C., Collins, W., . . . Rummukainen, M. (2013). Evaluation of Climate Models. Climate Change. (2013). The Physical Science Basis. Contribution of Working Group I to the Fifth Assessment Report of the Intergovernmental Panel on Climate Change, 741–866. URL: http://www.climatechange2013.org/images/report/ WG1AR5_ALL_FINAL.pdf

9CLIMATE RISK COUNTRY PROFILE: MONGOLIA
Spatial Variation
FIGURE 5 . CMIP5 ensemble projected change (32 GCMs) in annual temperature (top) and precipitation (bottom) by 2040–2059 (left) and by 2080–2090 (right) relative to 1986–2005 baseline under RCP8 523
TemperatureProjections of future temperature change are presented in three primary formats. Shown in Table 2 are the
changes (anomalies) in maximum and minimum temperatures over the given time period, as well as changes in the
average temperature. Figures 6 and 7 display the annual and monthly temperature projections. While similar, these
three indicators can provide slightly different information. Monthly and annual temperatures are most commonly
used for general estimation of climate change, but the maximums and minimums can explain more about how
daily life might change in a region, affecting key variables such as the viability of ecosystems, health impacts,
productivity of labor, and the yield of crops, which are often disproportionately influenced by temperature extremes.
There is good agreement among models that Mongolia should expect temperature rises at rates well above the
global average. Under the highest emissions scenario (RCP8.5) Mongolia is projected to experience a rise of
around 5.3°C by the 2090s, compared to a global average of around 3.7°C. A significantly lower rise of only 1.6°C
is projected under the lowest emissions pathway (RCP2.6) over the same time horizon. Rises in minimum and
maximum temperatures are projected to be more rapid than the rise in average temperature (Table 2), reflecting
a transition in the climate regime which could have major implications for ecosystems and human health. Even
under RCP4.5, a lower emissions pathway, minimum temperatures are projected to rise by around 3.0°C. As shown
in Figure 7 and Table 3 temperature rises are also projected to be spread unevenly throughout the year, with
somewhat slower rises projected during the summer months from April to July.
23 WBG Climate Change Knowledge Portal (CCKP 2020). Mongolia. Climate Data. Projections. URL: https://climatedata.worldbank.org/CRMePortal/web/water/land-use-/-watershed-management?country=MNG&period=2080-2099

10CLIMATE RISK COUNTRY PROFILE: MONGOLIA
Historical RCP 2.6 RCP 4.5 RCP 6.0 RCP 8.5
1980 2000 2020 2040 2060 2080 2100Year
degF
1400
1200
1000
800
600
400
200
FIGURE 6 . Historic and projected average annual temperature in Mongolia under RCP2 6 (blue) and RCP8 5 (red) estimated by the model ensemble Shading represents the standard deviation of the model ensemble 24
Jan Feb Mar Apr May Jun Jul Aug Sep Oct Nov Dec
11
10
9
8
7
6
5
4
3
2
degr
eesC
FIGURE 7 . Projected change (anomaly) in monthly temperature, shown by month, for Mongolia for the period 2080–2099 under RCP8 5 The value shown represents the median of the model ensemble with the shaded areas showing the 10th–90th percentiles 23
PrecipitationThere is reasonable agreement among climate
models that Mongolia can expect a slight increase in
annual precipitation under most emissions scenarios
(Figure 4). By the 2090s this increase is projected
by the CCKP model ensemble to be in the range
of 8%–14% (Figure 8). The model subset utilized
in Mongolia’s Third National Communication to the
UNFCCC makes similar projections. The downscaling
work conducted alongside this study points to similar
increases in precipitation but finds inconsistent trends
in sub-national variation.
Alongside these annual trends Mongolia is expected
to experience an increase in the intensity of extreme
rainfall events. Globally the intensity of sub-daily extreme rainfall events appears to be increasing with temperature,
a finding supported by evidence from different regions of Asia.25 The CCKP model ensemble projects increase
in the total maximum rainfall falling in 1- and 5-day periods over Mongolia. Notably, all these projected changes
appear counter to the historical drying trend reported over the period 1940–2015 in Mongolia’s Third National
Communication to the UNFCCC. Further research is required to verify both historical and projected estimates.
700
650
600
550
500
450
400
350
300
250
200
mm
Historical RCP 2.6 RCP 4.5 RCP 6.0 RCP 8.5
FIGURE 8 . Projected average annual precipitation for Mongolia in the period 2080–2099 23
24 WBG Climate Change Knowledge Portal (CCKP 2020). Mongolia. Climate Data. Projections. URL: https://climatedata.worldbank.org/CRMePortal/web/water/land-use-/-watershed-management?country=MNG&period=2080-2099
25 Westra, S., Fowler, H. J., Evans, J. P., Alexander, L. V., Berg, P., Johnson, F., Kendon, E. J., Lenderink, G., Roberts, N. (2014). Future changes to the intensity and frequency of short-duration extreme rainfall. Reviews of Geophysics, 52, 522–555. URL: https://agupubs.onlinelibrary.wiley.com/doi/10.1002/2014RG000464

11CLIMATE RISK COUNTRY PROFILE: MONGOLIA
Mongolia’s global rank on the INFORM 2019 risk index (101 out of 191 countries) indicates moderate
levels of exposure to hazards and vulnerability (Table 4). Unsurprisingly, exposure to drought is identified
as the strongest driver of risk in Mongolia. On this indicator Mongolia ranks as the 27th most exposed
nation in the world. The section which follows, analyses climate change influences on the exposure component of
risk in Mongolia. As seen in Figure 1, the ND-GAIN Index presents an overall picture of a country’s vulnerability
and capacity to improve its resilience. In contrast, the Inform Risk Index identifies specific risks across a country to
support decisions on prevention, preparedness, response and a country’s overall risk management.
CLIMATE RELATED NATURAL HAZARDS
TABLE 4 . Selected indicators from the INFORM 2019 Index for Risk Management for Mongolia For the sub-categories of risk (e g “Flood”) higher scores represent greater risks Conversely the most at-risk country is ranked 1st Global averages are shown in brackets
Flood (0–10)
Tropical Cyclone (0–10)
Drought (0–10)
Vulnerability (0–10)
Lack of Coping Capacity (0–10)
Overall Inform Risk Level (0–10) Rank (1–191)
4.4 [4.5] 0.0 [1.7] 5.7 [3.2] 3.7 [3.6] 5.1 [4.5] 3.4 [3.8] 101
HeatwavesMongolia can experience high maximum temperatures, despite a national average monthly maximum of
only 6°C and an average July maximum of 24°C. At sub-national level, considerably higher temperatures can
occasionally be experienced in some lower altitude
regions, including in the capital Ulaanbaatar, but
particularly in and around the Gobi desert. The current
median probability of a heat wave (defined as a period
of 3 or more days where the daily temperature is
above the long-term 95th percentile of daily mean
temperature) is around 2%.26
The CCKP model ensemble projects notable
increases in the future probability of heatwave under
all emissions pathways. By the 2090s, the annual
average probability is projected to reach 5%–16%
(Figure 9). This indicator is of limited use as it reflects
the constant rising of average temperatures away
from the long-term daily mean, particularly under
higher emissions pathways. Another lens through
which to view extreme heat is the annual maximum
0.25
0.20
0.15
0.10
0.05
0
daily
pro
babi
lity
Historical RCP 2.6 RCP 4.5 RCP 6.0 RCP 8.5
FIGURE 9 . Projected change in the probability of observing a heat wave in Mongolia for the period 2080–2099 A ‘Heat Wave’ is defined as a period of 3 or more days where the daily temperature is above the long-term 95th percentile of daily mean temperature 23
26 WBG Climate Change Knowledge Portal (CCKP 2020). Mongolia. Climate Data. Projections. URL: https://climatedata.worldbank.org/CRMePortal/web/water/land-use-/-watershed-management?country=MNG&period=2080-2099

12CLIMATE RISK COUNTRY PROFILE: MONGOLIA
of daily maximum temperatures. This indicator rises from a baseline (1986–2005) of around 34°C to 40°C by
2080–2099 under the highest emissions pathway (RCP8.5). Even under the lowest emissions pathway (RCP2.6)
temperatures exceed 35°C on an annual basis over the 2030s.
Drought and DustTwo primary types of drought may affect Mongolia, meteorological (usually associated with a precipitation deficit)
and hydrological (usually associated with a deficit in surface and subsurface water flow, potentially originating in
the region’s wider river basins). At present Mongolia faces an annual median probability of severe meteorological
drought of around 4%, as defined by a standardized precipitation evaporation index (SPEI) of less than −2.
However, other more complex forms of drought develop in Mongolia as a result of its unique set of climate
parameters. Dry summers followed by cold winters create a form of natural hazard locally termed dzud. Mongolia’s
local drought index, reported in its Third National Communication to the UNFCCC shows a strong sustained
period of summer drought from 2000 through to 2015, at a level unprecedented over the period 1940–2000.
Studies have also shown an increase in the frequency of both meteorological and pasture drought over the period
1965–2010.27 This trend is supported by local knowledge and observations and is suggested to have driven an
increase in the frequency of dust storms over Mongolia’s drier areas.28,29
Naumann et al. (2018)30 provide a global overview of changes in drought conditions under different warming
scenarios. The East Asia region is projected to experience an increase in the frequency of severe drought events
under all warming scenarios. At levels of global warming
above 2°C, a severe drought event which previously
took place only once every 100 years is projected to
take place at least once every 40 years.
The CCKP model ensemble shows the likelihood
of future meteorological drought, as defined as
an SPEI index of less than −2, increasing very
dramatically by 2080–2099 under all emissions
pathways (Figure 10). This measure of drought
particularly captures the transition of large areas of
Mongolia’s land surface to more arid and hyper-arid
(i.e. chronically drought affected) environments.31
Modelling reported in Mongolia’s Third National
1.0
0.9
0.8
0.7
0.6
0.5
0.4
0.3
0.2
0.1
0
unitl
ess
Historical RCP 2.6 RCP 4.5 RCP 6.0 RCP 8.5
FIGURE 10 . Annual probability of experiencing a ‘severe drought’ in Mongolia (−2 SPEI index) in 2080–2099 under four emissions pathways 23
27 Nandintsetseg, B., & Shinoda, M. (2013). Assessment of drought frequency, duration, and severity and its impact on pasture production in Mongolia. Natural Hazards, 66, 995–1008. URL: https://link.springer.com/article/10.1007/s11069-012-0527-4
28 Marin, A. (2010). Riders under storms: contributions of nomadic herders’ observations to analyzing climate change in Mongolia. Global Environmental Change, 20(1), pp. 162–176. DOI: https://doi.org/10.1016/j.gloenvcha.2009.10.004
29 Lee, E.H. and Sohn, B.J. (2011). Recent increasing trend in dust frequency over Mongolia and Inner Mongolia regions and its association with climate and surface condition change. Atmospheric Environment, 45(27), pp. 4611–4616. URL: https://link.springer.com/article/10.1007/s13753-015-0062-5
30 Naumann, G., Alfieri, L., Wyser, K., Mentaschi, L., Betts, R. A., Carrao, H., . . . Feyen, L. (2018). Global Changes in Drought Conditions Under Different Levels of Warming. Geophysical Research Letters, 45(7), 3285–3296. DOI: https://doi.org/10.1002/2017GL076521
31 Huang, J., Yu, H., Guan, X., Wang, G., Guo, R. (2015). Accelerated dryland expansion under climate change. Nature Climate Change: 6: 166–171. URL: https://www.nature.com/articles/nclimate2837
13CLIMATE RISK COUNTRY PROFILE: MONGOLIA
Communication to the UNFCCC also projects significant rises in the probability of the dzud phenomenon. Increases in
the probability of dzud events are projected to be between 5%–40% by 2080 in the study. Further research is required
to provide more localized estimates of drought probability, and to investigate the future of dzud and hydrological drought.
FloodTwo key types of flood affect Mongolia’s communities, river flooding and flash (or surface) flooding. The World
Resources Institute’s AQUEDUCT Global Flood Analyzer can be used to establish a baseline level of river flood
exposure. As of 2010, assuming protection for up to a 1-in-10-year event, the population annually affected by
flooding in Mongolia is estimated at 10,100 people and expected impact on GDP at $37 million. This contrasts
with UNISDR’s estimate of total average annual losses to all types of flood of $39 million.32 UNSIDR’s estimate
is likely an underestimate as the underlying dataset does not capture smaller-scale events which go unrecorded;
however, AQUEDUCT is also subject to model biases. Flash flooding also contributes to loss of life and livelihood
in Mongolia, accounting for 24% of deaths to natural hazards between 2004–2015, according to Mongolia’s Third
National Communication, and having a poorly understood economic impact.
Development and climate change are both likely to increase these figures. The climate change component can be
isolated and by 2030 is expected to increase the population annually affected by river flooding by 4,000 people,
and its GDP impact by $49 million under the RCP8.5 emissions pathway (AQUEDUCT Scenario B).33 Paltan et al.
(2018) demonstrate that even under lower emissions pathways coherent with the Paris Climate Agreement most
Asian countries could face an increase in the frequency of extreme river flows. What would historically have been
a 1-in-100-year flow, could become a 1-in-50 year or 1-in-25 year event in most of South, Southeast, and East
Asia and there is good agreement among models on this trend. This trend is projected to affect rivers in Mongolia’s
northern and western regions. As shown in Table 5 the projected impact is to increase the population exposed to
extreme floods by around 6,000–28,000 people by 2035–2044.
The climate change influence on flash flooding is less well understood but the CCKP model ensemble projects rise
in the quantity of rainfall deposited during extreme rainfall events in the order of 5%–15% by the 2090s, depending
on the model and emissions pathway selected.25 These projections highlight the need for further research to
understand and map future flash flood risk. Future flash flood risk is complicated and driven by rapid poorly planned
development on exposed plots of land at the fringes of Ulaanbaatar.34
32 UNISDR (2014). PreventionWeb: Basic country statistics and indicators. URL: https://www.preventionweb.net/countries [accessed 14/08/2018]
33 WRI (2018). AQUEDUCT Global Flood Analyzer. URL: https://floods.wri.org/# [Accessed: 22/11/2018]34 Saizen, I., Tsutsumida, N., Ishii, R. and Matsuoka, M., 2015. The detection of increasing vulnerability to flash flood in peri-urban
area of Ulaanbaatar, Mongolia through spatial analysis of VHR satellite imageries. In Proceedings of the 36th Asian Conference on Remote Sensing (p. 6). URL: https://simdos.unud.ac.id/uploads/file_penelitian_1_dir/ada619cc4f0a56fa0effc7e6f75877b4.pdf

14CLIMATE RISK COUNTRY PROFILE: MONGOLIA
TABLE 5 . Estimated number of people in Mongolia affected by an extreme river flood (extreme flood is defined as being in the 90th percentile in terms of numbers of people affected) in the historic period 1971–2004 and the future period 2035–2044 Figures represent an average of all four RCPs and assume present day population distributions 35
Estimate
Population Exposed to Extreme Flood (1971–2004)
Population Exposed to Extreme Flood (2035–2044)
Increase in Affected Population
16.7 Percentile 19,157 35,358 16,201
Median 27,350 54,864 27,514
83.3 Percentile 51,260 57,698 6,438
Natural Resources
WaterAs reported in Mongolia’s Third National Communication to the UNFCCC the climate conditions experienced over
the period 2000–2015 presented major challenges to Mongolia’s communities. River flow volume remained well
below the long-term average for much of the period. This resulted in a reduction in the national surface area of lake
cover of around 7% and the drying up of approximately 600 lakes. Over the same period glacial melting is believed
to have accelerated, with the glacial surface area in Mongolia reducing by around 14% between 2000–2011.
These trends of hydrological decline also bear out over longer time frames, lakes surface areas declined over
the period 1974–201336 and glacier surface area fell around 30% over the period 1940–2011.37 Notably over
50% of the runoff flowing from the Altai Mountains region in the west of Mongolia currently derives from melting
snow and glaciers. When seen in the context of a wide variety of projected shifts in other hydrological indicators,
such as increases in evaporation and evapotranspiration, and runoff volume, it becomes clear that Mongolia faces
a potentially significant shift in its hydrological regime. Despite projected increases in precipitation, it is believed
that lake water levels in dry steppe and desert regions could decline. Increases in lake water level are projected in
Mongolia’s northern regions. In the longer term, it is also possible that the seasonality of runoff could shift, as the
smoothing effect of glacier meltwater reduces.
CLIMATE CHANGE IMPACTS
35 Willner, S., Levermann, A., Zhao, F., Frieler, K. (2018) Adaptation required to preserve future high-end river flood risk at present levels. Science Advances: 4:1. URL: https://advances.sciencemag.org/content/4/1/eaao1914
36 Szumińska, D. (2016). Changes in surface area of the Böön Tsagaan and Orog lakes (Mongolia, Valley of the Lakes, 1974–2013) compared to climate and permafrost changes. Sedimentary Geology, 340, pp. 62–73. DOI: 10.1016/j.sedgeo.2016.03.002
37 Tao, S., Fang, J., Zhao, X., Zhao, S., Shen, H., Hu, H., . . . Guo, Q. (2015). Rapid loss of lakes on the Mongolian Plateau. Proceedings of the National Academy of Sciences, 112(7), 2281–2286. URL: https://www.pnas.org/content/112/7/2281

15CLIMATE RISK COUNTRY PROFILE: MONGOLIA
Landcover and BiodiversityThe major projected changes in Mongolia’s climatic regime may have serious implications for its biodiversity,
ecosystems, and unique biomes. One study has described the combined impact of ongoing climate change and
overgrazing as “decimating” the Mongolian steppes.38 Indeed, the rate of biomass loss is described as comparable
with the rate of global deforestation of tropical rainforests. The prolonged drought afflicted period between
2000–2015 highlighted the vulnerability of Mongolia’s ecosystems to future increases in drought probability.
Notably, vegetation associated with Mongolia’s drier biomes has been shown to be particularly sensitive to
prolonged water scarcity.39 Over longer periods species and biome range shifts are likely to result, with early signs
already identified in steppe plant communities,40 which have moved an estimated 100 meters upslope, according
to Mongolia’s Third National Communication.
Large parts of Mongolia’s territory are among regions identified as likely to see an increase in arid and hyper-arid
land-cover under higher emissions pathways.41 Mongolia’s Third National Communication to the UNFCCC reports
that northwards expansion of these land-cover types is expected. Based on a downscaled model (therefore limited
by driving global climate model) the report also projects complex changes in the distribution of different tree
species, and overall a net reduction in forest cover in the range of 1%–6% by the period 2081–2100.
Another feature of the Mongolian landscape is the substantial area covered by permafrost (subsurface soil which
remains permanently below freezing). As of 2015 approximately 29% of Mongolia’s land area is estimated to
be permafrost. This area is projected to reduce substantially as the climate warms. Mongolia’s Third National
Communication to the UNFCCC projects coverage will decline to 22% over 2016–2035, 11% by 2046–2065,
and 1% by the 2090s. Alongside these very significant land-cover transitions Mongolia’s report to the UNFCCC
highlights potentially significant declines in the suitable habitat range of a large number of cornerstone Mongolian
animal species.
Economic Sectors
Agriculture and Livestock ProductionClimate change could influence food production via direct and indirect effects on crop growth. Direct effects include
alterations to carbon dioxide availability, precipitation and temperatures. Indirect effects include through impacts
on water resource availability and seasonality, soil organic matter transformation, soil erosion, changes in pest and
disease profiles, the arrival of invasive species, and decline in arable areas due to the submergence of coastal lands
38 Liu, Y. Y., Evans, J. P., McCabe, M. F., de Jeu, R. A. M., van Dijk, A. I. J. M., Dolman, A. J., & Saizen, I. (2013). Changing Climate and Overgrazing Are Decimating Mongolian Steppes. PLOS ONE, 8(2), 1–6. URL: https://journals.plos.org/plosone/article?id=10.1371/journal.pone.0057599
39 John, R., Chen, J., Ou-Yang, Z.-T., Xiao, J., Becker, R., Samanta, A., . . . Batkhishig, O. (2013). Vegetation response to extreme climate events on the Mongolian Plateau from 2000 to 2010. Environmental Research Letters, 8(3), 35033. URL: https://peerj.com/articles/7735/
40 Liancourt, P., Spence, L. A., Boldgiv, B., Lkhagva, A., Helliker, B. R., Casper, B. B., & Petraitis, P. S. (2012). Vulnerability of the northern Mongolian steppe to climate change: insights from flower production and phenology. Ecology, 93(4), 815–824. URL: https://esajournals.onlinelibrary.wiley.com/doi/10.1890/11-1003.1
41 Huang, J., Yu, H., Guan, X., Wang, G., & Guo, R. (2016). Accelerated dryland expansion under climate change. Nature Climate Change, 6(2), 166–171. URL: https://www.nature.com/articles/nclimate2837?proof=t
16CLIMATE RISK COUNTRY PROFILE: MONGOLIA
and desertification. On an international level, these impacts are expected to damage key staple crop yields,
even on lower emissions pathways. Tebaldi and Lobell (2018) estimate 5% and 6% declines in global wheat and
maize yields respectively even if the Paris Climate Agreement is met and warming is limited to 1.5°C.42 Shifts in
the optimal and viable spatial ranges of certain crops are also inevitable, though the extent and speed of those
shifts remains dependent on the emissions pathway.
Mongolia’s crop production is typically very low productivity and conducted on a very small proportion
of the nation’s surface area. Only around 28% of the nation’s wheat demand and 49% of vegetable demand
is satisfied by local production, with a substantial deficit made up through food imports. There is potential for
this deficit to grow as Mongolia’s Third National
communication to the UNFCCC projects potentially
very significant wheat yield declines, potentially in the
range of 20%–50% by 2080. Research conducted
in neighboring Inner Mongolia Autonomous Region
suggests these losses are already being driven
by rising temperature and declining rainfall in
the spring growing season.43 Overall, one study
has suggested that the Mongolian crop agriculture
sector could lose around $3 million per year under
1.5°C of global warming, and around $12 million
under 3°C of global warming.44 While relatively small
on the national level, these changes are likely to be
significant for the estimated 65,000 people working
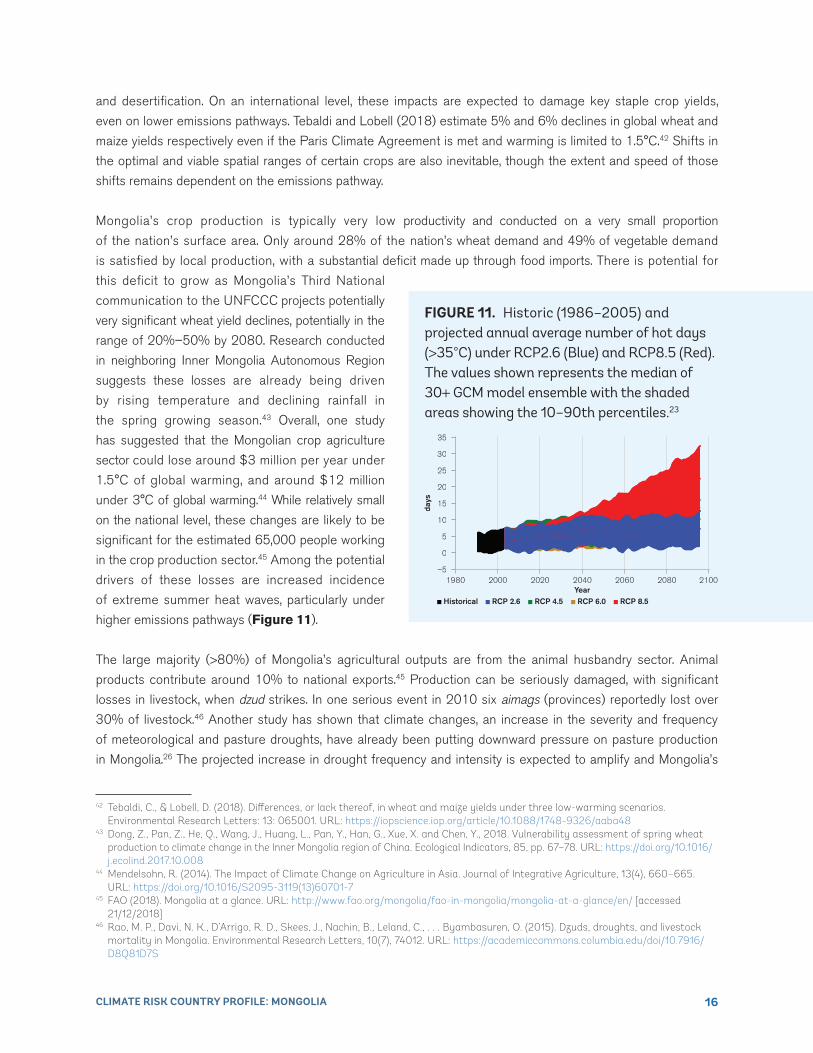
in the crop production sector.45 Among the potential
drivers of these losses are increased incidence
of extreme summer heat waves, particularly under
higher emissions pathways (Figure 11).
The large majority (>80%) of Mongolia’s agricultural outputs are from the animal husbandry sector. Animal
products contribute around 10% to national exports.45 Production can be seriously damaged, with significant
losses in livestock, when dzud strikes. In one serious event in 2010 six aimags (provinces) reportedly lost over
30% of livestock.46 Another study has shown that climate changes, an increase in the severity and frequency
of meteorological and pasture droughts, have already been putting downward pressure on pasture production
in Mongolia.26 The projected increase in drought frequency and intensity is expected to amplify and Mongolia’s
Historical RCP 2.6 RCP 4.5 RCP 6.0 RCP 8.5
35
30
25
20
15
10
5
0
–5
days
1980 2000 2020 2040 2060 2080 2100Year
FIGURE 11 . Historic (1986–2005) and projected annual average number of hot days (>35°C) under RCP2 6 (Blue) and RCP8 5 (Red) The values shown represents the median of 30+ GCM model ensemble with the shaded areas showing the 10–90th percentiles 23
42 Tebaldi, C., & Lobell, D. (2018). Differences, or lack thereof, in wheat and maize yields under three low-warming scenarios. Environmental Research Letters: 13: 065001. URL: https://iopscience.iop.org/article/10.1088/1748-9326/aaba48
43 Dong, Z., Pan, Z., He, Q., Wang, J., Huang, L., Pan, Y., Han, G., Xue, X. and Chen, Y., 2018. Vulnerability assessment of spring wheat production to climate change in the Inner Mongolia region of China. Ecological Indicators, 85, pp. 67–78. URL: https://doi.org/10.1016/ j.ecolind.2017.10.008
44 Mendelsohn, R. (2014). The Impact of Climate Change on Agriculture in Asia. Journal of Integrative Agriculture, 13(4), 660–665. URL: https://doi.org/10.1016/S2095-3119(13)60701-7
45 FAO (2018). Mongolia at a glance. URL: http://www.fao.org/mongolia/fao-in-mongolia/mongolia-at-a-glance/en/ [accessed 21/12/2018]
46 Rao, M. P., Davi, N. K., D’Arrigo, R. D., Skees, J., Nachin, B., Leland, C., . . . Byambasuren, O. (2015). Dzuds, droughts, and livestock mortality in Mongolia. Environmental Research Letters, 10(7), 74012. URL: https://academiccommons.columbia.edu/doi/10.7916/D8Q81D7S
17CLIMATE RISK COUNTRY PROFILE: MONGOLIA
National Communication to the UNFCCC suggests a potential increase in livestock losses to drought events of
around 50% by the 2050s under RCP4.5. Further research is required to constrain the potential impacts of plant
productivity declines in Mongolia’s pastures, and potential spread of new pests and disease. There is growing
evidence that the combined impact of climate changes and the transition that is taking place in the global and
Mongolian economic systems threatens the viability of the traditional nomadic pastoralist culture.47
A further, and perhaps lesser appreciated influence of climate change on agricultural production is through its
impact on the health and productivity of the labor force. Dunne et al. (2013) suggest that global labor productivity
during peak months has already dropped by 10% as a result of warming, and that a decline of up to 20% might
be expected by 2050 under the highest emissions pathway (RCP8.5).48 However, as Mongolia experiences a
greater degree of cold stress it is possible that climate changes could increase the productivity of the labor
force outside of extreme climate events. Further research is required to better understand the implications
for Mongolia’s pastoralists. In combination, it is highly likely that the above processes will have a considerable
impact on national food consumption patterns both through direct impacts on internal agricultural operations.
Challenges to food security and nutrition may also present as a result of the likely increase in food prices on the
global market as a result of global climate change impacts.49
Urban and EnergyUrbanization has presented very significant challenges in Mongolia. The rapid transition of many communities away
from nomadic and rural livelihoods to sedentary urban settlement has tested local governance and infrastructure,
and issues with low water quality, poor sanitation, and poor air quality have prevailed.50 A key feature of the
unplanned settlement that has taken place has been the migration of communities into hazard prone areas, notably
exposed to flash flooding.51 Given projections of intensified extreme rainfall, there is potential for significantly
enhanced risk levels.
Another way in which climate change could interact with urban environments is through heat impacts. Research
has established a reasonably well constrained relationship between temperature stress and labor productivity,
household consumption patterns, and (by proxy) household living standards.52 In general, the impact of an increase
in temperature on these indicators depends on whether the temperature rise moves the ambient temperature
47 Lkhagvadorj, D., Hauck, M., Dulamsuren, C., & Tsogtbaatar, J. (2013). Pastoral nomadism in the forest-steppe of the Mongolian Altai under a changing economy and a warming climate. Journal of Arid Environments, 88, 82–89. DOI: https://doi.org/10.1016/ j.jaridenv.2012.07.019
48 Dunne, J. P., Stouffer, R. J., & John, J. G. (2013). Reductions in labour capacity from heat stress under climate warming. Nature Climate Change, 3(6), 563–566. URL: http://www.precaution.org/lib/noaa_reductions_in_labour_capacity_2013.pdf
49 Myers, S. S., Smith, M. R., Guth, S., Golden, C. D., Vaitla, B., Mueller, N. D., . . . Huybers, P. (2017). Climate Change and Global Food Systems: Potential Impacts on Food Security and Undernutrition. Annual Review of Public Health, 38(1), 259–277. URL: https://www.annualreviews.org/doi/abs/10.1146/annurev-publhealth-031816-044356
50 Lhamsuren, K., Choijiljav, T., Budbazar, E., Vanchinkhuu, S., Blanc, D. C., & Grundy, J. (2012). Taking action on the social determinants of health: improving health access for the urban poor in Mongolia. International Journal for Equity in Health, 11(1), 15. URL: https://www.ncbi.nlm.nih.gov/pmc/articles/PMC3349495/
51 Saizen, I., & Tsutsumida, N. (2017). The Rapid Development of Settlements in Flood-Prone Areas in Peri-Urban Ulaanbaatar, Mongolia: Monitoring and Spatial Analysis Using VHR Satellite Imageries. In M. Banba & R. Shaw (Eds.), Land Use Management in Disaster Risk Reduction (pp. 137–148). Springer. URL: https://link.springer.com/chapter/10.1007/978-4-431-56442-3_8
52 Mani, M., Bandyopadhyay, S., Chonabayashi, S., Markandya, A., Mosier, T. (2018) South Asia’s Hotspots: The Impact of Temperature and Precipitation changes on living standards. South Asian Development Matters. World Bank, Washington DC. URL: https://openknowledge.worldbank.org/handle/10986/28723

18CLIMATE RISK COUNTRY PROFILE: MONGOLIA
closer to, or further away from, the optimum temperature range. The optimum range can vary depending on local
conditions and adaptations. In Mongolia it is likely that the net change could be to move temperature towards
more optimal levels for human functioning. However, this shift should be seen in the context of potential negative
impacts on traditional ways of life and livelihoods which rely upon the historical climate regime. In addition,
Mongolia’s continental climate can still lead to extreme heat, with temperatures over 30°C often experienced
in the capital Ulaanbaatar, most commonly in July and August. As shown in Figure 11, and as indicated by
the projected increase in maximum temperatures shown in Table 2, these temperature extremes are likely
to grow significantly. Furthermore, as Ulaanbaatar expands warming may be exacerbated by the urban heat
island affect (UHI). Dark surfaces, residential and industrial sources of heat, an absence of vegetation, and air
pollution53 can push temperatures higher than those
of the rural surroundings, commonly anywhere in
the range of 0.1°C−3°C in global mega-cities.54 In
Ulaanbaatar, an average UHI intensity of 1.6°C has
been measured, with an average daily maximum UHI
of 4.3°C. However, the UHI effect is strongly biased
towards the winter months, somewhat mitigating its
impact on extreme high temperatures.55
Research suggests that on average a one degree
change in ambient temperature can result in a
0.5%–8.5% change in electricity demand.56 Notably
this serves business and residential air heating and
cooling systems. The projected change in overall
heating demand is shown in Figure 12 and represents
a very significant potential reduction. Mongolia’s
energy systems may nonetheless be challenged during
future extreme heat events as the summer demand
for air cooling systems grows.Historical RCP 2.6 RCP 4.5 RCP 6.0 RCP 8.5
1980 2000 2020 2040 2060 2080 2100Year
degF
13000
12500
12000
11500
11000
10500
10000
9500
9000
8500
8000
FIGURE 12 . Historic and projected annual heating degree days in Mongolia (cumulative degrees below 65°F) under RCP2 6 (Blue) and RCP8 5 (Red) The values shown represent the median of 30+ GCM model ensemble with the shaded areas showing the 10–90th percentiles 23
53 Cao, C., Lee, X., Liu, S., Schultz, N., Xiao, W., Zhang, M., & Zhao, L. (2016). Urban heat islands in China enhanced by haze pollution. Nature Communications, 7, 1–7. URL: https://www.nature.com/articles/ncomms12509
54 Zhou, D., Zhao, S., Liu, S., Zhang, L., & Zhu, C. (2014). Surface urban heat island in China’s 32 major cities: Spatial patterns and drivers. Remote Sensing of Environment, 152, 51–61. DOI: 10.1016/j.rse.2014.05.017
55 Ganbat, G., Han, J.Y., Ryu, Y.H. and Baik, J.J. (2013). Characteristics of the urban heat island in a high-altitude metropolitan city, Ulaanbaatar, Mongolia. Asia-Pacific Journal of Atmospheric Sciences, 49(4), pp. 535–541. URL: https://link.springer.com/content/pdf/10.1007/s13143-013-0047-5.pdf
56 Santamouris, M., Cartalis, C., Synnefa, A., & Kolokotsa, D. (2015). On the impact of urban heat island and global warming on the power demand and electricity consumption of buildings—A review. Energy and Buildings, 98, 119–124. DOI: https://doi.org/10.1016/ j.enbuild.2014.09.052

19CLIMATE RISK COUNTRY PROFILE: MONGOLIA
Communities
Poverty and InequalitySince its revolution in 1990 levels of inequality in income, health and well-being outcomes are believed to have
grown substantially in Mongolia. As reported by the UN in 2018 these inequalities are demonstrated most starkly in
the differing levels of access to basic services such as clean water, with notable differences between rural and urban
areas, and within urban areas between Ger dwellers and apartment dwellers.57 High levels of poverty have prevailed,
and undernourishment has persisted despite high levels of GDP growth (Table 1). The Mongolian government
aims to eradicate extreme poverty by 2030 but recognizes in its Third National Communication that climate change
poses major challenges to this ambition. In addition, global research has shown that growth in inequality could
further damage poverty alleviation progress through its known negative impact on disaster recovery.58
Many of the climate changes projected are likely to disproportionately affect the poorest groups in society.
For instance, heavy manual labour jobs are commonly among the lowest paid whilst also being most at risk of
productivity losses due to heat stress.59 Poorer businesses are least able to afford air conditioning, an increasing
need given the projected increase in cooling days. Poorer farmers and communities are least able to afford local
water storage, irrigation infrastructure, and technologies for adaptation which will help them to cope with increased
drought intensity and crop range shifts.
Vulnerability to Climate-Related DisasterVulnerability to natural hazards, and particularly the dzud phenomenon, remains high in Mongolia. This is driven by
various factors including multidimensional poverty rates, undernourishment, and governance weaknesses. This
vulnerability is reflected in historical economic losses to disaster. The severe dzud of 2010 cost an estimated 2%
of GDP in lost agricultural output.60 Dzud has also been linked to increased infant mortality rates.61
A vulnerability assessment conducted in the nation’s Third National Communication to the UNFCCC suggested
that the net contribution of natural hazards to risk could increase over the period 2046–2065 as a result of climate
change in almost all Aimags (provinces). The assessment suggests that western Aimags face both the highest
current hazard risk and are likely to experience the greater increase in hazard risk. Without disaster risk reduction
and adaptation activities aimed at reducing community vulnerability and improving coping capacity this increase is
likely to increase the probability of disaster.
57 Statement at the conclusion of the official visit to Mongolia by the special rapporteur on the human rights to safe drinking water and sanitation, Mr Léo Heller. 2018. URL: https://www.ohchr.org/en/NewsEvents/Pages/DisplayNews.aspx?NewsID=22957&LangID=E [accessed 28/02/2019]
58 Tselios, V., & Tompkins, E. L. (2018). What causes nations to recover from disasters? An inquiry into the role of wealth, income inequality, and social welfare provisioning. International Journal of Disaster Risk Reduction. URL: https://eprints.soton.ac.uk/ 425762/
59 Kjellstrom, T., Briggs, D., Freyberg, C., Lemke, B., Otto, M., Hyatt, O. (2016) Heat, human performance, and occupational health: A key issue for the assessment of global climate change impacts. Annual Review of Public Health: 37: 97–112. DOI: 10.1146/ annurev-publhealth-032315-021740
60 World Bank (2015) Mongolia agriculture sector risk assessment. URL: https://openknowledge.worldbank.org/bitstream/handle/ 10986/23354/Mongolia000agr0tor0risk0assessment.pdf?sequence=1 [accessed 21/12/2018]
61 Otani, S., Onishi, K., Kurozawa, Y., Kurosaki, Y., Bat-Oyun, T., Shinoda, M., & Mu, H. (2016). Assessment of the Effects of Severe Winter Disasters (Dzud) on Public Health in Mongolia on the Basis of Loss of Livestock. Disaster Medicine and Public Health Preparedness, 10(4), 549–552. URL: https://pubmed.ncbi.nlm.nih.gov/27019011/

20CLIMATE RISK COUNTRY PROFILE: MONGOLIA
GenderAn increasing body of research has shown that climate-related disasters have impacted human populations in
many areas including agricultural production, food security, water management and public health. The level of
impacts and coping strategies of populations depends heavily on their socio-economic status, socio-cultural
norms, access to resources, poverty as well as gender. Research has also provided more evidence that the effects
are not gender neutral, as women and children are among the highest risk groups. Key factors that account
for the differences between women’s and men’s vulnerability to climate change risks include: gender-based
differences in time use; access to assets and credit, treatment by formal institutions, which can constrain women’s
opportunities, limited access to policy discussions and decision making, and a lack of sex-disaggregated data for
policy change.62
Human HealthNutritionThe World Food Programme (2015) estimate that without adaptation action the risk of hunger and child malnutrition
on a global scale could increase by 20% by 2050.63 Malnourishment is already prevalent in Mongolia, estimated
at 20% between 2014–2016. Projected declines in agricultural yields, as well as increased incidence of natural
hazards threatens to reduce food availability. However, another major threat to nutrition and food security in
Mongolia is the impact of climate change on the nation’s supply chain of imported food. One study has suggested
climate change may increase food prices in Mongolia by up to 38% by 2050,64 though many uncertainties affect
this projection, including the emissions pathway and adaptation success in countries exporting to Mongolia. This
price increase is significant as Mongolia has high dependence on food imports, importing, in economic terms,
almost as much as it produces internally.65
Heat-Related MortalityResearch has placed a threshold of 35°C (wet bulb ambient air temperature) on the human body’s ability to regulate
temperature, beyond which even a very short period of exposure can present risk of serious ill-health and death66.
Temperatures significantly lower than the 35°C threshold of ‘survivability’ can still represent a major threat to human
health. Climate change could push global temperatures closer to this temperature ‘danger zone’ both through slow-
onset warming and intensified heat waves. The CCKP model ensemble projects that temperatures could approach
this threshold through the 21st century in Mongolia, with potential for the 35°C Heat Index mark to be passed
occasionally under RCP8.5 by the 2090s.
62 World Bank Group (2016). Gender Equality, Poverty Reduction, and Inclusive Growth. URL: http://documents1.worldbank.org/curated/en/820851467992505410/pdf/102114-REVISED-PUBLIC-WBG-Gender-Strategy.pdf
63 WFP (2016). Two minutes on climate change and hunger: A zero hunger world needs climate resilience. The World Food Programme. URL: https://www.wfp.org/publications/two-minutes-climate-change-and-hunger
64 Mosnier, A., Obersteiner, M., Havlík, P., Schmid, E., Khabarov, N., Westphal, M., . . . Albrecht, F. (2014). Global food markets, trade and the cost of climate change adaptation. Food Security, 6(1), 29–44. URL: https://link.springer.com/article/10.1007%2Fs12571-013-0319-z
65 Mongolia (2020). Agricultural Sector. Export.gov — Mongolia. URL: https://www.export.gov/article?id=Mongolia-Agricultural-Sector [accessed 01/03/2019]
66 Im, E. S., Pal, J. S., & Eltahir, E. A. B. (2017). Deadly heat waves projected in the densely populated agricultural regions of South Asia. Science Advances, 3(8), 1–8. URL: https://advances.sciencemag.org/content/3/8/e1603322

21CLIMATE RISK COUNTRY PROFILE: MONGOLIA
Honda et al. (2014) utilized the A1B emissions scenario from CMIP3 (most comparable to RCP6.0) to estimate
that without adaptation, annual heat-related deaths in the East Asian region could increase 245% by 2030
and 421% by 2050.67 The potential reduction in heat-related deaths achievable by pursuing lower emissions
pathways is significant, as demonstrated by Mitchell et al. (2018).68 However, in Mongolia there is also potential for
a reduction in cold-related deaths, but baseline data and projections are lacking.
DiseaseMongolia’s Third National Communication identifies several diseases which may expand their range in and into
Mongolia as the climate warms. Potential issues include increased prevalence of tick-borne diseases and diarrheal
disease, the latter having been linked to both drought and flood events.69 The National Communication also contains
extensive assessment and discussion of the likely increase in pest and disease impacts on livestock.
Air QualityUlaanbaatar is one of the world’s most polluted cities, with very poor air quality becoming increasingly well
documented.70 Research is needed to better understand the potential intersection of air pollution with extreme
heat and drought events. Disaster risk research and reduction efforts are also needed to address the increasing
risk of dust storms to Mongolia’s communities.
National Adaptation Policies and Strategies
Policy/Strategy/Plan Status Document Access
National Communications to the UNFCCC Three submitted Latest: April, 2018
Updated Nationally Determined Contribution (NDC) to Paris Climate Agreement Submitted October, 2020
Technology Needs Assessment — Climate Change Adaptation in Mongolia Completed 2013
National Action Program on Climate Change Enacted 2011
POLICIES AND PROGRAMS
67 Honda, Y., Kondo, M., McGregor, G., Kim, H., Guo, Y-L, Hijioka, Y., Yoshikawa, M., Oka, K., Takano, S., Hales, S., Sari Kovats, R. (2014) Heat-related mortality risk model for climate change impact projection. Environmental Health and Preventive Medicine 19: 56–63. DOI: 10.1007/s12199-013-0354-6
68 Mitchell, D., Heaviside, C., Schaller, N., Allen, M., Ebi, K. L., Fischer, E. M., . . . Vardoulakis, S. (2018). Extreme heat-related mortality avoided under Paris Agreement goals. Nature Climate Change, 8(7), 551–553. URL: https://pubmed.ncbi.nlm.nih.gov/30319715/
69 Wu, X., Lu, Y., Zhou, S., Chen, L., & Xu, B. (2016). Impact of climate change on human infectious diseases: Empirical evidence and human adaptation. Environment International, 86, 14–23. DOI: https://doi.org/10.1016/j.envint.2015.09.007
70 Hasenkopf, C.A., Veghte, D.P., Schill, G.P., Lodoysamba, S., Freedman, M.A. and Tolbert, M.A., 2016. Ice nucleation, shape, and composition of aerosol particles in one of the most polluted cities in the world: Ulaanbaatar, Mongolia. Atmospheric environment, 139, pp. 222–229. URL: https://pennstate.pure.elsevier.com/en/publications/ice-nucleation-shape-and-composition-of-aerosol-particles-in-one-

22CLIMATE RISK COUNTRY PROFILE: MONGOLIA
Climate Change Priorities of ADB and the WBGADB — Country Partnership StrategyADB agreed a Country Partnership Strategy (CPS) with Mongolia which covered the period 2017–2020.
Climate change features strongly and is primarily found in the third pillar of engagement, environmental stability.
Specifically, the CPS aims to:
(i) Improve natural resource management to promote sustainable resource use and prevent further degradation
of natural resources.
(ii) Broaden climate change response to support the government’s compliance with COP21 targets and
promote the use of renewable energy.
(iii) Build capacity on disaster risk management to improve disaster preparedness mechanisms and climate
change adaptation.
WBG — Country Partnership FrameworkThe WBG agreed a Country Partnership Framework (CPF) with Mongolia which covered the period 2013–2017.
The 2021–2025 CFP is currently under development. Through this Framework, climate change is addressed most
directly under the third pillar of engagement, which aims to: address vulnerabilities through improved access to
services and better service delivery, social safety net provision, and improved disaster risk management. A specific
target is to work closely with the authorities to reduce vulnerabilities of herders and increase the resilience of
ecosystems, as well as reduce vulnerability of households exposed to natural hazards and pollution.71
71 WBG (2020). Country Partnership Framework for Mongolia. DRAFT. URL: https://consultations.worldbank.org/sites/default/files/consultations/1456/Mongolia%20CPF%20Concept%20Note%20for%20consultations_eng%20FINAL.pdf