Edited by - Nepal Climate Change & Development Portal
162
xviii Edited by: Krishna P. Acharya, Resham B. Dangi, Devesh M. Tripathi, Bryan R. Bushley, Rishikesh R. Bhandary and Bhola Bhattarai
-
Upload
khangminh22 -
Category
Documents
-
view
1 -
download
0
Transcript of Edited by - Nepal Climate Change & Development Portal

xviii
Edited by:Krishna P. Acharya, Resham B. Dangi, Devesh M. Tripathi,
Bryan R. Bushley, Rishikesh R. Bhandary and Bhola Bhattarai

Ready for REDD?
Taking Stock of Experience,Opportunities and Challengesin Nepal
Edited by: Krishna P. AcharyaResham B. DangiDevesh M. TripathiBryan R. BushleyRishikesh R. BhandaryBhola Bhattarai

ii
Disclaimer
The views reflected in this collection are those of the authors. They do notnecessarily reflect the views of their institutions or the financial contributorsof this book.
Citation
Acharya, K.P., Dangi, R.B., Tripathi, D.M., Bushley, B.R., Bhandary, R.R.and Bhattarai, B. (eds.). 2009. Ready for REDD? Taking Stock of Experience,Opportunities and Challenges in Nepal. Nepal Foresters’ Association:Kathmandu, Nepal.
Printed at: Mass Printing Press, Kathmandu
Cover Photo: Krishna P. Acharya
ISBN: 978-9937-2-1967-9
Published by: Nepal Foresters’ Association
© by Nepal Foresters’ Association 2009All rights reserved.

iii
Acknowledgements viAbout the Authors viiList of Abbreviations xPreface xi
Chapter 1 - REDD, REDD+ and Co-Benefits 11.1 Introduction 11.2 REDD+ and Conservation 41.3 REDD+ and Co-benefits: Awin-win scenario? 61.4 Recommendations for successful REDD+ implementation 81.5 Conclusions 8
Chapter 2 - A Quick Review of Potential Benefits andCosts of REDD in Nepal 92.1 Overview of forest carbon stocks 92.2 Potential benefits of REDD 112.3 Various costs associated with REDD 122.4 Factors influencing the costs 142.5 Discussion 152.6 Conclusion 18
Chapter 3 - Implications for community forest policyunder the proposed REDD policy 213.1 Introduction 213.2 Policy on Reduced Emission from Deforestation and
Degradation (REDD) 233.3 Community forestry policy in Nepal 243.4 Carbon impacts of community forest management 253.5 National-level policy issues 263.6 International-level policy issues 303.7 Conclusion 32
Table of Contents

iv
Chapter 4 - Bringing Peoples’ Perspectives:Making REDD Effective in Nepal 334.1 Introduction 334.2 What is REDD? 354.3 Why REDD for Nepal and where? 364.4 REDD and Civil Society Institutions 374.5 Distribution of REDD benefits 384.6 New directions for REDD 39
Chapter 5 - Indigenous peoples and REDD:Challenges and Opportunities in Nepal 415.1 Introduction 415.2 Natural resources and identity of indigenous peoples 435.3 Livelihood strategies of indigenous peoples 445.4 Indigenous peoples, land and resources 455.5 REDD and Indigenous Peoples 465.6 Conclusion 48
Chapter 6 - Understanding Forest Degradation in Nepal 496.1 Introduction 506.2 Datasets 526.3 Methodology 566.4 Results 606.5 Discussion 656.6 Conclusions 68
Chapter 7 - Preparing Institutions for REDD 757.1 REDD: Global and National Context 757.2 REDD to REDD+: Are CFUGs Nepal’s advantage? 767.3 Addressing sustainable livelihoods 777.4 Lack of policy and legal coherence 787.5 Challenges in the global REDD architecture 817.6 Conclusion 84

v
Chapter 8 - Review of Studies on REDD in Nepal:Status, Gaps and Ways Forward 858.1 Background and intent of the paper 868.2 Methodology 878.3 Findings 878.4 Discussion 958.5. Conclusions and ways forward 97
Chapter 9 - Carbon Finance and REDD:Lessons and Ways Forward 1019.1 Trends in deforestation; global characteristics 1029.2 State of the market 1039.3 Challenges in using a market system 1059.4 Readiness and upfront financing 1089.5 Conclusion 110
Chapter 10 - Forest carbon accounting:Lessons learnt from a pilot project in Western Nepal 11310.1 The pilot project 11410.2 Selection of carbon accounting methodology 11510.3 Methods 11610.4 The way forward 12610.5 Lessons for national and sub-national REDD projects 12810.6 Conclusion 130
References 133

vi
Acknowledgements
We would like to thank the editors, Krishna P. Acharya, Resham B. Dangi,Bryan R. Bushley, Rishikesh R. Bhandary and Bhola Bhattarai for taking onthis major task. This collection will be indispensable to understanding REDDin the Nepali context and will serve to sensitize readers to the developmentof national strategies, climate negotiations and practical experiences in thearea of climate and forestry policy, and what they mean for Nepal.
Our sincere thanksgo to the authors and reviewers for their hard work. Theyinclude Ugan Manandhar, Krishna P. Acharya, Resham B. Dangi, Bhaskar S.Karky, Margaret Skutsch, Kamal Banskota, Bhola Bhattarai, Pasang Sherpa,Nima Lama, Pasang D. Sherpa, Prakash Lamsal, Eak Rana, Keshab Goutam,Rishikesh R. Bhandary, Mohan B. Gurung, Keshav R. Kanel, Bryan R.Bushley, Phil Shearman, and Buddi S. Poudel. We thank them for producingsuch a valuable piece of work in this new and unchartered territory.
We would also like to express our appreciation to Michael Kollmair of theInternational Center for Integrated Mountain Development (ICIMOD) forhis support and encouragement. We thank our friends from the Federation ofCommunity Forest Users, Nepal (FECOFUN), Bhola Bhattarai, JagannathJoshi, Rajan Regmi and Bimal Acharya, for their ongoing support andcontributions. A vote of thanks also goes to our colleagues from WWF-NepalSantosh Mani Nepal, Ugan Manandhar and Anil Manandhar for theirdedication and assistance.
Finally, this project would not have been possible without generous financialassistance from WWF-Nepal, FECOFUN, and ICIMOD. We owe them oursincerest gratitude and appreciation.
Devesh M.Tripathi, PresidentNepal Foresters’ Association

vii
About the Authors
Mr. Krishna P. Acharya currently works for the Ministry of Forests andSoil Conservation. He as over 15 years experience in forestry research anddevelopment, having served in different capacities at the Department of ForestResearch and Survey. He led the natural forest management andsocioeconomic sections of the department. He has published more than 60journal articles in national and international peer reviewed journals.
Dr. Kamal Banskota is working for UN Habitat in Kabul Afghanistan. Beforethis appointment, he was working for the International Centre forIntegratedMountain Development (ICIMOD) as the head of the EconomicAnalysis Division. His key areas of interest are in tourism, renewable energy,natural resources and the environment, and poverty. He has been working inthese and related fields for the last 25 years.
Mr. Rishikesh R. Bhandary is a graduate student at the Fletcher School ofLaw and Diplomacy, Tufts University. His research interests are in theoverlapping areas of negotiations, development and environmental policy.He has been exploring the foreign policy implications of adaptation measuresthat Nepal will take in response to climate change, focusing on waterresources.
Mr. Bhola Bhattarai is General Secretary of the Federation of CommunityForestry Users, Nepal (FECOFUN). He has been working with FECOFUNforthe last 12 years in different capacities. He began his involvement incommunity forestry from his own community forestry user group and is nowan elected representative of nearly 15 thousand groups nationwide. He focuseson policy processes, especially those related to forests and climate change.
Mr. Resham B. Dangi, is currently working in the capacity of Under Secretaryat the Policy and Program Development Unit of the REDD-Forestry andClimate Change Cell in the Ministry of Forests and Soil Conservation. Hehas worked with the Department of Forests for the last twenty-three years indifferent capacities. His area of interests is in common property resourceeconomics, natural resource policy and the economics of climate change.

viii
Mr. Keshab R. Goutam is an Assistant Research Officer in the Departmentof Forest Research and Survey, Kathmandu. He is currently involved inresearch related to forest management, biodiversity conservation and climatechange. He has earned Masters degrees in Environmental Management andDevelopment from the Australian National University. He has more than adecade’s experience in the field of forestry and environmental resourcesmanagement.
Mr. Mohan B. Gurung, is a Senior Research Officer at WinrockInternational–Nepal. He is currently involved in devising carbon accountingtools and techniques best suited for early action pilot projects on forest carbonand REDD. He has extensive experience in the field of forest and NTFPinventory.
Mr. Prakash Lamsal, works in the Department of Forests, Kathmandu,Nepal. He has gained significant experience in forest management and hasserved in different districts in the Middle Hills in various capacities. Hisinterests and work areas lie in forest management and planning. He completedhis masters degree from Reading University in the United Kingdom.
Mr. Ugan Manandhar joined WWF Nepal’s Climate Change and Energyprogram in September 2006. He has been working with WWF in the field ofalternative energy and is responsible for the development of many renewableenergy projects. In his current capacity he works with the Government ofNepal on issues related to climate policies and action plans. He alsoparticipates in the Climate Negotiations as a government delegate.
Dr. Bhaskar S. Karky has been working with International Centre forIntegrated Mountain Development (ICIMOD) in the Economic AnalysisDivision as a Research Fellow since 2007. He is an Economist working onclimate policy and REDD issues. His area of interest lies is climate changepolicies, and environmental and development economics.
Mr. Nima Lama is the Secretary for Foreign Affairs of the Nepal Federationof Indigenous Nationalities (NEFIN). He is also the focal person of the NEFINClimate Change-REDD Partnership Program in South and Southeast Asiaand is a member of National REDD-Forestry and Climate Change Cell.

ix
Mr. Eak Rana, is currently working with the International Center forIntegrated Mountain Development (ICIMOD) as Project Coordinator in theREDD Project that is being implemented in collaboration with ICIMOD,ANSAB and FECOFUN. He has experience in the field of forest and resourcegovernance. His key area of interest includes governance issues related topaymentsfor ecosystem services.
Mr. Phil Shearman, is associated with the University of Papua New GuineaRemote Sensing Centre. This Center is a teaching and research facilityfocusing on land use and land cover in Papua New Guinea.
Mr. Pasang Sherpa, is a Lecturer of Sociology at the Department of Sociology& Anthropology at Trichandra Multiple Campus, Tribhuwan Univeristy. Heis also affiliated with the Sherpa Association of Nepal (SAN), The Sociologicaland Anthropological Society of Nepal (SASON), the Janajati and Dalit StudyCentre (JDSC), and UNESCO Nepal, and is currently a member of a high-level task force for the revision of the list of Indigenous Nationalities.
Ms. Pasang D. Sherpa is National Coordinator of the Nepal Federation ofIndigenous Nationalities (NEFIN)’s Climate Change-REDD PartnershipProgram in South and Southeast Asia. She has contributedto differentmagazines, journals and national newspapers on the socio-cultural issues ofindigenous peoples in Nepal.
Dr. Margaret Skutsch is an Associate Professor at the University of Twentein The Netherlands and of the Centro de Investigaciones en GeographíaAmbiental, at the Universidad Nacional Autonoma de Mexico, Morelia,Mexico. She has been engaged in research on the management and impactsof community forest management in Africa and Asia for 30 years, and is thedirector of the international research programme “Kyoto: Think Global ActLocal”.

x
List of Abbreviations
AFOLU Agriculture, Forestry and other Land UseAOSIS Association of Small Island StatesCDM Clean Development MechanismCDM EB Clean Development Mechanism Executive BoardCER Certified Emissions ReductionCFs Community forestsCFUG Community Forest User GroupCOP Conference of Partiesd.b.h. Diameter at breast heightDoF Department of ForestsEUA European Union AllowancesFCPF Forest Carbon Partnership Facilityha Hectare(s)IPCC Inter-Governmental Panel on Climate ChangeLDC Least Development CountriesLULUCF Land Use, Land Use Change and ForestryMFSC Ministry of Forests and Soil ConservationMVC Most Vulnerable CountriesNAPA National Adaptation Plan of ActionREDD Reducing Emissions from Deforestation and Forest
DegradationRWG REDD Working GrouptCER Temporary Certified Emission ReductionUNEP United Nations Environment ProgrammeUNFCCC United Nations Framework Convention on Climate
ChangeVCS Voluntary Carbon Standards

xi
Preface
Forests play a key role in climate change as both sinks and sources of carbondioxide. It has been estimated that deforestation and forest degradationcontribute up to 20 percent of global emissions of carbon dioxide annually—more than the entire transportation sector—and that standing forests sequesterabout 20 percent of global carbon dioxide emissions. Moreover, forests arethought to provide a more cost-effective means of reducing global carbondioxide emissions than other sectors. Thus, if incentives could be providedto curb the deforestation and forest degradation plaguing many tropicalcountries,then forests could have a net positive impact on carbon sequestrationand thereby contribute substantially to mitigating climate change. This isexactly what REDD (Reducing Emissions from Deforestation and ForestDegradation), a new mechanism currently being negotiated under the UnitedNations Framework Convention on Climate Change (UNFCCC) climate talks,would do.
Forests are also inextricably linked to the livelihoods of people in Nepal andother developing countries. Thus, REDD offers the promise of not onlymitigating climate change, but also of reducing the incidence of poverty,bolstering local livelihoods, and supporting other co-benefits like biodiversityconservation and ecosystem services. However, there are also many challengesto its effective implementation in Nepal. These include technical, ecological,social, institutional, political, and economic issues. As the country has beenfocusing on broad-based sustainable development, any REDD mechanismshould be designed and implemented according to the principles of social,economic and ecological sustainability. By reviewing current experience,capacities, opportunities and challenges in the context of Nepal, this bookaims to inform policy makers, practitioners, civil society representatives, andthe general public about the potential and prerequisites for implementingREDD in a socially equitable, economically viable and ecologically beneficialmanner.
Defining the shape of REDD
The ongoing climate negotiations are actively considering REDD as a meansof mitigating global climate change by preserving and sequestering carbonin forests. This emerging mechanism would compensate developing countries,and their communities, for their forest conservation and regeneration efforts.
xii
Considerable progress has been made on REDD negotiations in recent monthsand it seems increasingly plausible that a general consensus on a global policyframework for REDD may be reached by the end of the December 2009Conference of Parties (COP-15) climate talks in Copenhagen, or at follow-up talks in 2010.
In Nepal, the government, donor agencies and some civil society organizationshave embraced the promise of REDD, fast-tracking national policydevelopment and instigating various piloting and awareness-raising activitiesin order to get “ready for REDD”. They recognize that this emergingmechanism presents an opportunity for Nepal and its forest-dependentcommunities to reap significant benefits and to play an active role in climatechange mitigation. In fact, REDD could acknowledge the important role thatforests and the communities that protect them already play through carbonsequestration; and also provide incentives for both governments and localstakeholders to bolster their forest conservation efforts.
Nepal has also invested considerable energy in lobbying for the mechanismat the international level, and for the conceptual evolution from RED, toREDD, to REDD+(+). The specific shape or scope of REDD has strongimplications for Nepal’s ability to benefit from the new mechanism.
REDD+ refers to ‘avoided deforestation’ plus ‘forest enhancement’. RED(D)was initially conceived an ‘avoided deforestation’ mechanism and wassupported by countries with significant forest cover and high rates ofdeforestation (e.g. Brazil, Indonesia, Papua New Guinea). Globally, Nepaldoes not score particularly high on either of these criteria. However, Nepal isoften touted as an international example of successful community-based forestmanagement, especially in the Middle Hills region where deforestation hasbeen steadily reduced over the past couple of decades. In many instances, thecondition of these forests is being continually enhanced, thus contributing toa steady increase in carbon stocks. As a result, Nepal has lobbied for theinclusion of “forest enhancement” (i.e., REDD+) to make it more competitivein a global carbon-trading scheme. In the international arena, the meaning of“REDD+” is often expanded to include both forest enhancement and socialand biodiversity co-benefits, in addition to avoiding deforestation and forestdegradation.
REDD++ is a relatively new proposal advanced by some countries, with noclear international consensus yet on its viability or desirability. It wouldincorporate all emissions from different land uses and land use change,

xiii
including afforestation, grasslands and agricultural lands. It is unclear yetwhether REDD++ would work to Nepal’s advantage. However, the complexityof measuring, monitoring and recording carbon emissions and/or stocks inother types of land use would certainly pose additional technical andinstitutional challenges and increase transaction costs.
Experience, challenges and opportunities for REDD
Nepal has many attributes that are conducive to effective engagement withan international carbon trading mechanism like REDD. These include anextensive network of experienced local forest management institutions; asupportive legal and policy framework for the devolution of forestmanagement; strong ongoing donor support for initiatives in the forestrysector; significant biophysical potential for reducing deforestation in the sub-tropical Terai (plains) region; continued forest enhancement in the MiddleHills region; growing experience and capacity in measuring and monitoringforest carbon stocks; and significant opportunities for reducing poverty andstrengthening livelihood resilience, preserving biodiversity and criticalecosystem services, and promoting adaptation to climate change.
Despite these attributes and synergies, however, there are significantchallenges and risks for effective engagement with REDD in Nepal. Keytechnical and ecological challenges include ensuring the permanence andadditionality of carbon stocks, preventing leakage, and setting an appropriatehistorical baseline or reference scenario for assessing reductions indeforestation and forest degradation. Establishment of an effective systemfor monitoring, reporting and verifying (MRV) of carbon stocks could alsoprove difficult. Furthermore, a strong focus on carbon could present risks forpreserving biodiversity;and ensuring the ecological integrity of forests wouldrequire additional transaction costs for REDD.
There are also profound social and institutional issues. Adopting a nationalinstitutional framework to ensure equity, efficiency and accountability inverifying and compensating for carbon gains could prove difficult givencurrent governance issues in the forestry sector. It is critical to develop clearbenefit-sharing and governance mechanisms that ensure the equitabledistribution of carbon payments among all relevant stakeholders and withinlocal communities. While much of the focus for REDD has been oncommunity forests, equity issues also apply to other types of local forestmanagement, such as leasehold forests, religious forests, collaborative forestry

xiv
and buffer zone community forests. Failure to include these in a nationalREDD program could heighten social and political tensions. REDD couldalso threaten the livelihoods of indigenous peoples, the poor, and other forest-dependent and marginalized communities who rely heavily on forests fortheir livelihoods, by diminishing their access to vital forest products for bothsubsistence and commercial uses.
Political, legal and economic barriers are also substantial. The governmentof Nepal is currently preoccupied with maintaining political stability andconsensus, forging a federalist system, and writing a new constitution.Persistent political rivalries pose an ongoing challenge to effective governancein all sectors at the national and sub-national levels. Lack of coordinationamong government ministries for policy development also presents achallenge. Furthermore, while forest policies in Nepal are very supportive ofcommunity-based forest management in principle, tenuous tenure regimesand a lack of clear ownership rights remain an obstacle to the ability ofcommunities to claim full benefits from their forest resources, includingcarbon. Last, but not least, Nepal’s ability to benefit from a mechanism likeREDD depends not only on its own technical, ecological, social, institutional,political and legal assets, but also on the final shape that REDD takes in theinternational negotiations, and its resulting competitiveness in a global carbonmarket vis-à-vis other countries with significant carbon stocks and/ordeforestation rates, such as Brazil and Indonesia.
Lessons for future research and action
These challenges for implementing a REDD scheme in Nepal point to someopportunities and directions for future research and action.
This volume provides insights on the experience, challenges and opportunitiesfor implementing REDD in Nepal. The chapters present evidence fromempirical studies and analyses highlighting the experience and challenges ofmonitoring and measuring deforestation (Chapters 8 and 10), forestdegradation and carbon stocks (Chapter 6); the implications of REDD forlocal livelihoods (Chapters 4 and 5) and associated costs an benefits (Chapter2); the potential value of carbon and its ability to compete economically withother important uses of forests and to offset deforestation and forestdegradation (Chapter 3); risks related to the resource rights and land tenureof local communities and indigenous peoples (Chapter 5); institutionalconsiderations for ensuring the equitable sharing of benefits among actors at
xv
all levels, and within local communities (Chapter 7); and the implications ofinternational policy processes (Chapters 1 and 3), and global carbon marketsand mechanisms(Chapter 9), for Nepal’s ability to benefit from REDD.
Although these chapters reveal that there is already some experience andcapacity for evaluating the technical, ecological and livelihood implicationsof REDD, there is also a need for more extensive and robust studies—especially for measuring forest degradation—and for more studies focusedon institutional, governance, market and financing issues and implications inparticular. For instance, the role of the private sector in REDD is scarcelymentioned in existing studies and policy dialogues. Furthermore, while muchof the research and writing on REDD has focused on community forestry asthe logical vehicle for REDD in Nepal (including many of the chapters inthis volume), the focus needs to be expanded to include other areas. Whilecommunity forestry is undeniably the hallmark of Nepal’s forestry sector—and has been effective in slowing or reversing deforestation trends in someareas, especially in the Middle Hills—it covers only about one quarter ofNepal’s forests. Thus, although community forestry may represent acomparative advantage for Nepal in terms of REDD, the remaining threequarters must also be included for a comprehensive, national-level programto succeed.
The studies also reveal that research has been limited in the Nepali context.Most of the technical studies that estimate carbon inventories have basedtheir methodologies on other studies that were done in contexts quite differentfrom Nepal. Though it is laudable that researchers have maintainedmethodological rigor, there is a need to have more Nepal-specific estimatesthat can inform policy. Developing local capacity and appropriatemethodologies for measuring and valuing carbon are important stepping-stones to building a comprehensive system of payments for valuable ecosystemservices that will provide not only climate change mitigation, but also lastingbenefits for rural livelihoods, biodiversity and ecosystem services.
Even though there are substantial political challenges, the ongoingconstitution-writing and climate policy formulation processes offer Nepal amajor opportunity to build institutions that are efficient, yet flexible andadaptive. As regulatory and institutional processes must be able to react tothe rapid developments of the REDD process, a review of the currentgovernment processes is needed. The REDD policy formulation andimplementation process will test the ability of the government and thecommunity forest user groups—together with other stakeholders—to devise

xvi
a fair, flexible and effective mechanism that is able to generate significantemissions reductions and distribute the associated benefits in an efficientand just manner.Moreover, while REDD does offer numerous potentialbenefits for Nepal’s forest-dependent communities and forest conservationefforts, these benefits need to be carefully assessed in light of currentcapacities, international policy developments and global carbon markets.
This volume contains works covering various dimensions of REDD“readiness” and has also uncovered areas that need further research likeMonitoring, Reporting and Verification (MRV). REDD is a very dynamicmechanism that features prominently on the agenda for COP 15. Thus wecan expect some major policy developments to take place toward reducingemissions from deforestation and forest degradation.
A Nepali version of this volume will be subsequently released featuringupdates after the Copenhagen Climate Talks. Through the publication of bothan English and a Nepali version, we hope that we will be able to reach abroader audience in Nepal and beyond.

1
Chapter 1
REDD, REDD+ and Co-Benefits
- Ugan Manandhar1
Abstract
The largest terrestrial natural sinks of the world are now getting a great dealof recognition for their contribution to helping combat climate change. Thesesinks act as a huge source of GHG emissions and contribute nearly 30% ofglobal emissions, out of which two thirds result from deforestation and forestdegradation. This sector has not gained much recognition since the 1992 RioEarth Summit, despite the fact that every year more than 13 million ha offorest area is lost, resulting in higher concentrations of CO2 in the atmospherethan those coming from other fossil fuels based transport sector.
The coming years before 2102 at the UNFCCC negotiations will see debateson REDD and REDD+ issues in both the post-Kyoto regime and the nationalframeworks relating to policies, co-benefits and benefit-sharing mechanisms.Forest ecosystems can help us combat climate change at a large scale andthus REDD/REDD+ strategies must be guided by high quality research, groundrealities and the geo-political context of nations. This chapter focuses onREDD, REDD+ and co-benefits.
1.1 Introduction
REDD is primarily about reducing atmospheric carbon dioxide emissions asan element of a comprehensive approach mandated by the Bali Action Plan.The Bali Action Plan, a decision adopted at the Conference of Party meetingin Bali, Indonesia in December 2007 (COP 13), explicitly mentions the needto address REDD to mitigate GHGs:
Policy approaches and positive incentives on issues relating to reducingemissions from deforestation and forest degradation in developing countries;1 WWF-Nepal, E-mail: [email protected].

Ready for REDD? Taking Stock of Experience, Opportunities and Challenges in Nepal
2
and the role of conservation, sustainable management of forests andenhancement of forest carbon stocks in developing countries.
With recent developments, REDD+ has drawn more attention towardsactivities related to the conservation and sustainable management of forestsand to enhancements of forest carbon stocks. The proposed mechanism startedwith:
• RED: Reducing emissions from deforestation, then moving to;
• REDD: Reducing emissions from deforestation and forest degradation,and finally;
• REDD+: Reducing emissions from deforestation and forestdegradation, plus forest enhancement.
With the negotiations now focused on REDD+, this mechanism is expectedto present new opportunities to help conserve natural forests at a global level.However, unless environmental safeguards are strongly enforced to achievereal emissions reductions, REDD+ could lead to the conversion of naturalforests into plantations.
Deforestation and forest degradation are ongoing issues that are firmlyentrenched in Nepal and around the world. Deforestation is not a result ofirrationality, ignorance or stupidity as people receive, or expect to receive,real benefits from deforestation and unsustainable forest harvesting.Considering the size of the global carbon pool in forests, and its potentialclimatic effects on natural and anthropogenic emissions, the management offorest carbon must be an important element of any international agreementon climate change. Economists have argued that the conservation of tropicalforests will be difficult, unless people who use these forests are compensatedfor the environmental services their forests provide to the world community(Pearce 1996). In this regard, the Kyoto Protocol has proven ineffective, dueto the absence of a mechanism that compensates avoided deforestation andthe lack of incentives to reduce carbon emissions through improved forestmanagement.
Land use, land-use change and forestry (LULUCF) activities are a major sourceof carbon emissions and active contributors to global warming. TheIntergovernmental Panel on Climate Change (IPCC) estimates that 1.6 billiontons of carbon are released into the atmosphere annually from land-use change.A major share of these emissions can be attributed directly to tropical

3
deforestation (Denman etal. 2007). This represents about one fifth of thecurrent global carbon emissions, exceeding emissions from the fossil-fuel-intensive global transport sector.
Avoided deforestation was not accepted as an eligible Clean DevelopmentMechanism (CDM) activity in the Marrakesh Accords. This is primarilybecause of the difficulty of addressing and estimating the extent of leakage.Additionality, and setting appropriate baselines were also seen as criticalobstacles. Finally, the fear of avoided deforestation generating credits thatwould crowd the carbon market and discourage mitigation in other sectorsalso played a role in its exclusion (Aukland et al. 2003; Forner et al. 2006; deJong et al. 2007; Skutsch et al. 2007).
In response to calls from a number of parties to revisit deforestation in theclimate change agenda, in Montreal at the Eleventh Session of the Conferenceof the Parties (COP11), in December 2005, launched a two-year process toexplore a mechanism for reducing emissions from deforestation in developingcountries. This process has focused on documenting and exchanging relevantscientific, technical and methodological considerations and experiences,including policy approaches and positive incentives. The proposal for a post-2012 international agreement that includes avoided deforestation in non Annex-I countries is now undergoing public scrutiny.
Deforestation and forest degradation result from various causes, most ofwhich originate outside of the forestry sector. Understanding these causesis crucial to identifying appropriate incentives to curb deforestation whilealso providing benefits to people whose livelihoods depend on forests.As mentioned above, the Bali Action Plan included “enhanced cooperationon policy approaches and positive incentives on issues relating to reducingemissions from deforestation and forest degradation in developingcountries” (REDD). REDD has consequently been mainstreamed intonegotiations for the post-Kyoto regime. In the current discourse, variousoptions for the design of REDD are on the table. The World Bank launcheda forest carbon fund for development of the REDD initiative called theForest Carbon Partnership Facility (FCPF) at the COP 13. Nepal, alongwith 37 other countries, has been selected to participate in the FCPFmechanism, through which the facility will implement and evaluateperformance-based pilot incentive programs. Besides theFCPF and thesimilar UN-REDD Programme, voluntary carbon markets are also likelyto implement avoided deforestation projects under REDD.
Chapter 1 - REDD, REDD+ and Co-Benefits
Ready for REDD? Taking Stock of Experience, Opportunities and Challenges in Nepal
4
The purpose of this chapter is to provide a partial answer to the question ofhow REDD and REDD+ can help support forest conservation, save protectedareas and achieve co-benefits like poverty reduction and biodiversityconservation.
1.2 REDD+ and Conservation
Conservation, as used in the UNFCCC context, means actions to prevent landuse activities that cause the conversion of forested lands into other uses, orthe depletion of carbon stocks in ecosystems. Conservation is not only pertinentto countries with high rates of deforestation, but it is also important forcountries with high forest cover and low deforestation rates.
Conservation can be achieved through the following measures:• Establishing and managing protected areas and connectivity corridors• Recognizing and supporting conservation actions by forest dependent
communities including indigenous peoples and community-conservedareas
• Land stewardship agreements and conservation easements• Payments for provision of the ecosystem services generated by
protected ecosystems, including water supply and the provision ofwildlife habitat, among others.
The debate on REDD+ is still ongoing in the climate change negotiations.The objectives and scope are yet to be defined for REDD+ in COP 15, as theintersessional meetings were not successful in doing so. Whether the proposedmechanism will have a broad mandate to include LULUCF or AFOLU is stillbeing negotiated.
Conservation is being recognized by the REDD+ mechanism, but it shouldfurther provide adequate scope and impetus for the effectiveness ofconservation efforts; underpinning that it is a necessary component of therelationship between biodiversity and climate change mitigation.
The attention of policy-makers and the public has now been attracted by thepossibility of significant international transfers of funds under a post-Kyotoagreement to finance REDD+. This is one major attraction. The funds couldcome through either a specific fund-based mechanism under the UNFCCC

5
under the authority and guidance of COP, or a flexible mechanism combininga fund-basedand market-based approach developed through experiences andlessons learnt.The market could be a so-called “sustaining financingmechanism” in the long run. This ongoing debate asks policy-makers tocarefully weigh the costs and benefits of having a national-level REDD+program or a sub-national, project-based program. Policy makers also mustconsider the impact on indigenous and local peoples and design ways forcommunity-based projects to benefit.
Estimates of the potential global value of REDD+ payments depend mainlyon the underlying assumptions. Assuming a conservative carbon value of $10per ton of carbon dioxide (CO2e), estimates include a net present value of$150 billion (Chomitz et al. 2007) and annual revenue of $2.3-12 billion(Ebeling 2006; El Lakany et al. 2007). But with more positive assumptionsabout the carbon price ($10-20/t CO2e) and deforestation reduction rates (20-50 per cent), estimates for annual REDD revenues are at $7-23 billion (ElLakany et al. 2007). Hence the REDD+ program could be a significant sourceof sustainable finance.
Forests provide a number of valuable goods and services to society. The factthat they can act as a sink and source for atmospheric carbon dioxide putsmore weight to the fact that standing forests must be valued and conserved.However, high returns from alternative land uses,the lack of remuneration forforest ecosystem services, land grabs, as well as poor public policies andgovernance,presents a challenge for the protection of forest ecosystems andprovides incentives for deforestation.
Policy-makers must understand the drivers of deforestation and degradationto formulate appropriate responses, and the general public must recognizethe dual role of forests in mitigation and adaptation. The government mustalso play a supportive role in laying the groundwork for REDD+implementation by addressing critical technical issues, such as the baselineyear, additionality, permanence and leakage.
The Stern Review (2006) on the economics of climate change noted that REDDcould be a cost-effective route to address climate change. The argument forinclusion of forests in a future climate agreement is twofold: forests are thelargest source of emissions not included in the current Kyoto agreement, andthe costs of reducing forest-related emissions compare favorably with thecosts of reductions in other sectors.
Chapter 1 - REDD, REDD+ and Co-Benefits
Ready for REDD? Taking Stock of Experience, Opportunities and Challenges in Nepal
6
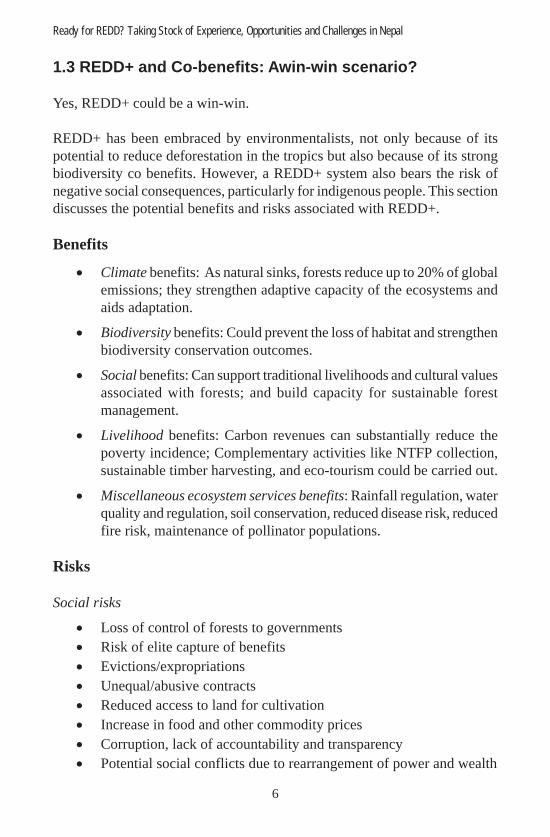
1.3 REDD+ and Co-benefits: Awin-win scenario?
Yes, REDD+ could be a win-win.
REDD+ has been embraced by environmentalists, not only because of itspotential to reduce deforestation in the tropics but also because of its strongbiodiversity co benefits. However, a REDD+ system also bears the risk ofnegative social consequences, particularly for indigenous people. This sectiondiscusses the potential benefits and risks associated with REDD+.
Benefits
• Climate benefits: As natural sinks, forests reduce up to 20% of globalemissions; they strengthen adaptive capacity of the ecosystems andaids adaptation.
• Biodiversity benefits: Could prevent the loss of habitat and strengthenbiodiversity conservation outcomes.
• Social benefits: Can support traditional livelihoods and cultural valuesassociated with forests; and build capacity for sustainable forestmanagement.
• Livelihood benefits: Carbon revenues can substantially reduce thepoverty incidence; Complementary activities like NTFP collection,sustainable timber harvesting, and eco-tourism could be carried out.
• Miscellaneous ecosystem services benefits: Rainfall regulation, waterquality and regulation, soil conservation, reduced disease risk, reducedfire risk, maintenance of pollinator populations.
Risks
Social risks
• Loss of control of forests to governments• Risk of elite capture of benefits• Evictions/expropriations• Unequal/abusive contracts• Reduced access to land for cultivation• Increase in food and other commodity prices• Corruption, lack of accountability and transparency• Potential social conflicts due to rearrangement of power and wealth

7
Carbon Value
Bio
div
ers
ity
Valu
e
Favorable
for REDD
At
Risk??
Environmental Risks
• Forests are only valued for their carbon stock value• International leakage may occur if not all countries participate in
REDD
Negotiators should remain cognizant of these associated risks and benefits,while designing the REDD+ mechanism.Maximizing benefits and reducingriskscould be achieved through:
• Including forest-dependent people in the design process of a REDD+mechanism;
• Developing a stringent mechanism to include safeguards;• Respecting customary and traditional tenure and use rights;• Requiring free, prior, and informed consent from local and indigenous
communities;• Including ‘pro-poor’ provisions;• Developing a market for REDD+ projects with exceptional social
benefits
Figure 1.1 What is Favorable for REDD?
Chapter 1 - REDD, REDD+ and Co-Benefits

Ready for REDD? Taking Stock of Experience, Opportunities and Challenges in Nepal
8
1.4 Recommendations for successful REDD+ implementation
Information dissemination at both the national and local levels is crucial forgenerating interest and participation in the REDD+ design process. As Nepaldoes not have many of the requirements of immediate REDD+ implementation,upfront financing must be made available. The World Bank has already takena step forward in this regard through its FCPF program. Technical assistanceis needed to gain an understanding of forest-related emissions in Nepal. Bystrengthening national and local institutions, Nepal will be in a strongerposition to implement REDD. However, as this and other chapters argue,there are some institutional gaps that need to be addressed.
Nepal is one of the least developed countries (LDCs) and people depend onforests for a wide range of goods and services. Therefore, any REDD+mechanism must be pro-poor. Furthermore, tenure and access rights need tobe clarified so that potential conflicts are prevented. Broad-based participationin the design and implementation of REDD+ is needed to protect the rights ofthe people and for their overall support. This can be strengthened through atransparent and accountable process that regards equity as a fundamental pillar.As the REDD+ mechanism is still under negotiations, only pilot projects havebeen operating. Since we do not have complete information on the implicationsof providing incentives to reduce forest related emissions, we must maintaina high degree of flexibility in the REDD+ architecture. This flexibility can bemaintained by periodically reviewing the mechanism and its impacts and usingbroad definitions for land-use types so that unanticipated areas can beincorporated if there is a need.
1.5 Conclusions
A REDD+ agreement will have ecosystem impacts with broad implications.Significant co-benefits can be achieved if proper safeguards are kept in place.Hence, REDD+ can play a strong role in not just mitigation, but also in adaptation,by increasing the resilience of ecosystems. As REDD+ is a new concept whosearchitecture is still being developed, new policies need to be introduced while oldones must be updated and brought in line with the new mechanism.. Thegovernment can play a major role in guiding the implementation and operation ofa REDD+ mechanism. An effective, efficient and transparent governance structureshould be created to ensure maximum benefits. This governance structure mustbe able to address the associated risks while ensuring that it is still an efficientmechanism for reducing carbon dioxide emissions.

9
Chapter 2
A Quick Review of Potential Benefits andCosts of REDD in Nepal
- Resham B. Dangi2and Krishna P. Acharya3
Abstract
The contribution of forests in removing carbon from the atmosphere andholding it in forest biomass is referred to as mitigation, while enhancing theresilience of people and ecosystems is referred to as adaptation. This indicatesthat forests are not just collections of carbon sticks. REDD (ReducingEmissions from Deforestation and Forest Degradation) has emerged as anincentive mechanism for developing countries to invest in forest managementactivities to abate emissions. The various costs involved may not allow allforests to be economically viable for REDD. This chapter attempts to assessthe scope of REDD in Nepal based on the prevailing carbon stocks and thepotential costs involved in the future.
2.1 Overview of forest carbon stocks
Reduced Emissions from Deforestation and Degradation of forests (REDD)is an emerging market-based approach under the United Nations FrameworkConvention on Climate Change (UNFCCC). It is estimated that the forestrysector is responsible for 17.4 percent of global GHG emission (Nabuurs et al.2007). An oft-quoted estimated figure of emissions from deforestation globallyin the 1990s is about 5.8 GtCO2 per year (TERI 2008). The ongoingdeforestation and forest degradation in the tropics has made a substantialcontribution to increasesin GHG emissions from terrestrial ecosystems. Bycurbing this trend, we could substantially reduce future atmospheric levels ofcarbon dioxide.2 Ministry of Forests and Soil Conservation, Nepal.
Email: [email protected] Ministry of Forests and Soil Conservation, Nepal.
Email: [email protected]

Ready for REDD? Taking Stock of Experience, Opportunities and Challenges in Nepal
10
REDD can be an effective incentive for developing countries to invest inforest management activities to enhance the carbon sequestration potential ofnatural forests. Additional carbon sequestered in forests through specificmanagement interventions can be sold in the carbon markets. Therefore,effective measures to reduce the current rate of deforestation and degradationare prerequisites to participation in a global carbon market. Since carboncredits are issued on the basis of carbon captured, this process bears no risk tothe production potential of the forest or its health. Realizing this advantage,many developing countries have been involved in the REDD readiness processthrough different funding mechanisms. Nepal is one of the countries supportedby the Forest Carbon Partnership Forestry (FCPF) program of the World Bankto enhance its readiness to participate in REDD.
Nepal is broadly divided into five physiographic regions. These include thelow-lying Sub-tropical Terai (including the Siwalik hills), the middlemountains, high mountains, and the snow covered high Himalayas (LRMP1986). The major land-use categories include forests, agriculture, grasslandsand others. The area occupied by forested land (FAO 2002) is about 29 percentof the total national territory (DFRS 1999). The forest conditions, vegetationtypes, and production potential of forests are very heterogeneous both acrossand within the physiographic regions. Forests can be sub-divided into fourbroad categories based on the global ecological zones of the IPCCGuidelines(2006).
The average growing stock of Nepal varies from 81 to 172 m3 Ha-1 (Amatya etal. 2002) and the average biomass growth is estimated to range from 0.59 to2.34 MT d.m. per ha per year (WECS 2001). The average carbon inaboveground biomass is estimated to be around 76 metric tons per ha forTerai forests, 37 metric tons per hafor the Middle Mountains, and 57 metrictons per haasthe national average (Oli and Shrestha 2009). Since this estimateexcludes soil carbon, the estimated total forest carbon stock needs to beproperly adjusted. The default values given in the IPCC guidelines indicatethat the highest biomass stock is intropical rainforests (300 metric tons d.m.per ha) and the lowest in Boreal woodlots (15 metric tons d.m. per ha).Comparing these global values of biomass stock to the national average isimportant to understand the scope of REDD in Nepal.
A recent pilot study done in western Terai has estimated the average forestcarbon stock to be around 231 metric tons per ha. The carbon stocks in treesabove ground, below ground and in soil organic carbon (SOC) have been

11
estimated to be about 68, 18, and 143 metric tons per ha,respectively (Gurung2009). This clearly indicates that the share of SOC is almost 60 percent of thetotal forest carbon stock. This data is in line with other pilot study results likethe WRI(1994) quoted in MoPE;the 2004 estimate of carbon stocks in theAnnapurna Conservation area ofabout 77 tons per ha;and the 52.5 and 66.25metric tons per ha for above ground biomass quoted by Baskota et al. (2006)andRana(2006), respectively, in the community managed hill forests of Nepal.
Since Nepal has not yet developed a national emissions reference scenario orbaseline for forest carbon stocks, the available data from pilot study reportshave been taken as the source of basic information for a quick assessment ofREDD’s scope in Nepal. There is no doubt that all forests do have somepotentialto sequester carbon from the atmosphere, but the sequestrationcapacity varies according to vegetation type and spatial location. Forests havingeither low carbon uptake capacity or high opportunity costs may not beeconomically viable for REDD. Therefore, this chapterattempts to criticallyreview the potential benefits and costs of different forest types and concludeswith policy recommendations for developing a national REDD strategy inNepal.
2.2 Potential benefits of REDD
Carbon sequestration for climate change mitigation offers one example of apositive global externality (Kant and Berry 2005).Forests can fix and maintaincarbon (mitigation) and contribute to enhancing the resilience of people andecosystems (adaptation). In the last three decades, the world has realized thatthe “trees are not forests and forests are much more than trees” (Kant 2004).Ifwe are to consider the potential risks of climate change in developing countries,we must also realize that a forest is not only a bundle of trees or carbon sticks;it is also one of the most cost-effective adaptation measures for forest-dependent rural communities.
Like many other developing countries, Nepal allocates a large share of herpublic funds to agricultural development and other social development sectorslike health, education, and law enforcement. Adequate funds are not availablefor forestry development. Developing countries are under a high threat ofdeforestation and forest degradation, because of this underinvestment inforests. To reduce these threats, developing countries need to assess alternativefunding sources. REDD could be a potential alternative source of revenue as
Chapter 2 - A Quick Review of Potential Benefits and Costs of REDD in Nepal

Ready for REDD? Taking Stock of Experience, Opportunities and Challenges in Nepal
12
long as carbon accounting and monitoring processes are affordable andfeasible.
Additional carbon sequestered in forests due to reductions in deforestationand forest degradation can be estimated with the help of remote sensing andGIS techniques. However, such estimation is complex for forest degradationdue to two important reasons: lack of a common definition as to whatdegradation entails; and methodological issuesconcerning its monitoring andmeasurement.
Though REDD has only recently emerged as a new climate change policyoption, it also enhances the potential of forests to deliver multiple benefitsincluding, but not limited to, biodiversity conservation, improved resilienceof ecosystems, environmental services, livelihood improvements, and goodgovernance.Better management of forests will also contribute to reducing therisk of natural disastersandthe loss of life and physical property from forestfires. Therefore, the success of REDD will depend on the effectiveness offorest management interventions in curbing the current rate of deforestationand forest degradation.
It is also evident that the sustainable management of forests (SMF) could beinstrumental in reducing carbon emissions, enhancing carbon sequestration,and increasing the supply of forest biomass.Since a well-managed forest helpsto reduce soil erosion, improve watershed conditions, increase fresh watersupply, and enhance the potential for provision of other essential ecosystemservices, forests are vital safety nets for climate change adaptation. Thesefunctions illustrate that adaptation and mitigation are not only interlinked,but also mutually supportive.This indicates that REDD could be an optionthat is an additional bonus to SMF. However, it is difficult to estimated thebenefits of REDD until the COP 15 decisions are unveiled in late December2009.
2.3 Various costs associated with REDD
There are various types of costs described in the economics literature: threecategories by Alexander et al. (2008) and Pagiola et al. (2009); and fivecategories by Boucher (2008). In this chapter, costs have been discussed underfour categories based on their relevance to carbon emissions reductions andcarbon removal enhancement.

13
(a) Opportunity Costs: This includes the foregone profits from replacing aforest production system by alternative land-use practices. In our case,the foregone revenue includes the potential of receiving revenue fromother best alternative land-use practices including agriculture, settlementsand animal husbandry. It is a general practice to compare the net presentvalue (NPV) of two competing land uses, such as agriculture vs. forestryproduction, over a duration of 30-40 years. The net opportunity cost isestimated by subtracting the NPV of forests from the NPV of agriculture.Since carbon stocks are held in the forest biomass, the opportunity costis divided by the quantity of carbon stocks. The value thus obtained givesthe estimated payments required per tons of carbon sequestered in theforests to compensate for the opportunity cost of maintaining the forestsinstead of choosing the alternative land use systems. These costs comprisethe largest portion of REDD-related costs.
(b) Implementation costs: These include costs involved in planning, landmanagement, and forest management. The government also needs toprepare a REDD strategy and an institutional setup to promote readinessfor REDD implementation. All expenses related to readiness andimplementation are included under this expenditure. These costs makedirect contributions in reducing emissions or enhancing removal of carbonfrom the atmosphere.
(c) Transaction Costs: This includes all costs involved in brokerage,verification, certification, insurance and reserves. Countries with largecontiguous forests can supply large quantities of carbon to the market.Transaction costs will increase if forests are small, fragmented, and locatedin areas with difficult topography. Poor negotiation skills will also increasethis cost. This expenditure does not directly contribute to carbonsequestration by the forests.Buyers will be more interested in big suppliersfor two basic reasons—assurance and reasonable carbon price.
(d) Administrative Costs: This includes expenses for regulatory actions,forest patrolling, controlling leakage, and documentation. These costsdirectly contribute to emissions reductions and atmospheric carbondioxide removal. This cost increases if property rights over forests andgovernance are poor.
Chapter 2 - A Quick Review of Potential Benefits and Costs of REDD in Nepal

Ready for REDD? Taking Stock of Experience, Opportunities and Challenges in Nepal
14
2.4 Factors influencing the costs
Carbon sequestration costsare sensitive to changes in the following factors:
(a) Forest management regime: Intensive forest management requires ahigh level of investment. The implementation and administrative coststructure changes along with the intensity of management interventions.These costs are relatively low in community-managed forests comparedto government-managed forests because of the high level of involvementof local people in community managed forests.
(b) Incidence of forestproduct harvesting: Short and repeated harvestingincreases the cost of carbon sequestration. Forests located near villagesare repeatedly used by local users to satisfy their needs. Consequently,forests located in difficult terrain, protected areas, and far from thesettlements have limited or specific product harvesting and have lowadministrative costs as a result.
(c) Forest types: The rate of carbon sequestration is high for fast-growingtree species. The carbon sequestration cost will be lower in these speciescompared to slow-growing tree species. Therefore, lowland forests cansequester more carbon on average than the high mountain forests in agiven time period. As the lowland forests have fast-growing tree species,the average cost of carbon sequestration is less than in higher altitudeareas.
(d) Change in relative prices offorest products: If the market price of woodproducts suddenly increases, then the expected revenue from the sale ofwood products can surpass the expected revenue from carbon trading. Inthis situation, the opportunity cost of carbon sequestration will go up.
(e) Change in the relative prices ofagricultural commodities: If there is asudden price hike in agricultural products, then the expected revenuefrom the agriculture land use will exceed the revenue from forest landuse. Hence, the opportunity cost and the administrative costs of REDDwill substantially increase.
(f) Discount rate: An increase in the discount rate will increase the marginalcost of carbon sequestration.

15
2.5 Discussion
As Simula (2009) suggests,a program to reduce the impacts of deforestationand degradation on climate change would depend on accurate and preciseestimates of emissions resulting from land-use changes and how theseemissions change over time. Carbon credit buyers will expect the use of arobust methodology of carbon accounting and monitoring. Developingcountries like Nepal, where the national forest inventory data and technicalcapacity are poor, and periodic accounting of changes in forest cover, biomassstocks, carbon emissions and carbon removals are limited, would require asubstantial amount of investment. The current annual budget available to theforestry sector is inadequate to carry out these tasks.
There is a high level of deforestation in the lowland forests of the Terai andthe Inner Terai, due to population expansion and economic development. Sincethese forests contain high-value commercial tree species, illicit felling, timbersmuggling, and forest encroachment are common problems. The entire regionis also well suited for agricultural production and is regarded as the foodbasket of the nation.
Infrastructure development, especially the construction of rural roads insidethe forests, has substantially increased the rent value of land. There is greatpressure on such lands to capture the additional land rent. Competition betweenthe two production systems—forestry and agriculture—will continue inlowlands unless revenue from forest land use is sufficient enough to coverthe rent made by the agricultural land-use system. If the current trend is notaverted, forest degradation will continue due to the high rate of forestencroachment, forest fragmentation, and exploitation of the forest for woodproducts.If these forests are not properly managed, the potential of the foreststo produce valuable timber will fall off in the future and there is great risk ofconverting these forests into their best alternative land uses. This may happendue to the trade-off between high opportunity costsof maintaining forestsvis-à-vis the high valueof land for agriculture, especially in light of Nepal’spersistent food security problem.
Figure 2.1 can be used to support the above-mentioned interpretation. It isobvious from the figure that the various costs will have a substantial impactonprofit margins from REDD. Since this figure is a general framework, a morespecific one can be developed for different forest types based on physiographicregions, topography, road access, the extent of forests, stand structure, andforest health.
Chapter 2 - A Quick Review of Potential Benefits and Costs of REDD in Nepal

Ready for REDD? Taking Stock of Experience, Opportunities and Challenges in Nepal
16
As we have argued earlier, degraded forest patches in the lowlands are underhigh risk of conversion into other land-use systems. Therefore, these forestsneed immediate restoration and rehabilitation activities. For this, a substantialamount of the public budget will be required in the future if these forests areto be managed under REDD. As illustrated in Figure 2.1, most of the lowlandfragmented forests are represent by the area left of point C where profit fromREDD will be just enough to cover the cost. Beyond point D there is no rentavailable from carbon trading. Hence, maintaining forests for REDD beyondthis point is not profitable. However, big contiguous forest blocks of lowlandsare represented by the area to the left of point B. These forests have potentialfor both REDD and for commercial purposes as they can produce high profitmargins.
Figure 2.1 Implementation of various costs in REDD implementation in different foresttypes of Nepal(Source: Lobowski 2008).
Due to their difficult physiographic conditions, mountain forests areunreachable and are characterized by slow-growing tree species. Forestslocated on steeply sloped mountains are difficult to access and are not suitablefor growing agricultural crops. The remoteness and low human pressures haveallowed forest blocks to remain intact in the mountains. These forests are lessvulnerable to deforestation due to their limited alternative uses. Since theseforests are occupied by endemic flora and fauna species, they are also important
Non-additional
PAs
Forest frontier
Affordable
Non affordable
Forest/ Agri mosaic
Intact forests Degraded forests Margins of land use transfer
Supply of Carbon Credits
AB C D

17
for biodiversity conservation. As a result of the limited land use options, theopportunity cost of REDD in the mountain region is low. However, carbonaccounting and monitoring costs are high in these forests. In our above figure,these forests are represented by the area close to point B.
Middle hill forests are under heavy pressure tosatisfy local demand for forestproducts. Almost 70 percent of the forests in the mid-hills are under communityforests (CF). Almost 20 percent of the CFs are smaller than 10 ha; 50 percentof the CFs are smaller than 50 ha; and almost 90 percent of the CFs are lessthan 200 ha in size. This clearly indicates that the transaction costsof REDDwould be substantially high due to the many small CF units. The administrativeand implementation costs, however, will be lower than in government-managedforests.
Furthermore, the opportunity costs would be lower than that of lowland forests’for two vital reasons. First, fertile forested lands have already been convertedto agriculture lands and residual forest areas are not appropriate for commercialfarming. Second, local users are involved in managing accessible forests forlocal use. REDD implementation in these forests is possible, but the availablerent will be low due to high transaction costs. These forests are representedby the area between point B and C in Figure 5.1. Therefore, implementationof REDD on a small-scale could bear the potential risk of shifting the pressurefor meeting local demands of forest products to the nearby forests,resultingin leakage.
As shown in Figure 2.1, forests representing the area between A and B willproduce the maximum rent. This area includes forests from protected areas(PAs) and intact forest blocks outside the PAs in lowlands and PAs and intactforest blocks in the high mountains. Since PAs are not considered additional,these forests will only qualify for REDD if the COP-15 negotiations endorsethe forest conservation through REDD+.
Nepal has made policy submissions in favor of a nested REDD approach.Initial learning from elsewhere indicates that the national approach willgenerate credits at low costs but equity issues might emerge due to weakgovernance. It is argued that a sub-national approach would be effective incases where governance is weak, but transaction cost per unit of carbon creditwill go up. As a result, a market-based REDD approach will offer less benefitsto CFs. CFs could benefit more from a voluntary market under fair tradeconditions. Using the voluntary market, however, still does not eliminate the
Chapter 2 - A Quick Review of Potential Benefits and Costs of REDD in Nepal

Ready for REDD? Taking Stock of Experience, Opportunities and Challenges in Nepal
18
risk of elite capture among and across CFs due the differences in the level ofknowledge, skills, capacity and governance.
From the above discussion, we can conclude that effective implementation ofREDD will demand a robust carbon estimation and monitoring methodology.There is a need for up-front initial investments in national forest inventoryand capacity building. If Nepal is committed to adopt tier 3 (earlier submissionto SBSTA) for measurement, reporting and verification (MRV), a substantialamount of funds will be needed. If we critically assess the expected benefitsfrom REDD,tier 2looks more appropriate for Nepal.
2.6 Conclusion
The majority of Nepal’s population lives in rural areas and uses bio-fuel asthe major source of household energy. By changing the current consumptionpatterns to more sustainable options, not only would we reduce the pressureon forests for fuelwood, but we would also reduce carbon dioxide emissionsto the atmosphere. Countries like Nepal that depend primarily on forest-basedenergy sources need to enhance the productivity of the forests for sustainablesupply of bio-energy. Appropriate silviculturalpractices must be adopted toenhance the growth of forests. Sustainable management of forests is alsoimportant to sustain the agricultural production system in Nepal. The lowallocation of public funds tothe forestry sector has made the implementationof SFM projects difficult. The REDD mechanism has emerged as anopportunity to contribute to the integrated forest development of Nepal.
Poverty alleviation is one of the prime concerns. Resilience of vulnerablepeople and ecosystems should be improved to reduce the risks associatedwith climate change. Low carbon development (LCD) could be an alternativeoption to benefit local communities through creating more jobs in the greensectors and adopting climate-friendly and more efficient technologies. Thiscan only be implemented through a set of national policies on carbon emissionsand regulations on carbon intensive products.
In recent years, it has been observed that poor people living in rural areashave become very vulnerable to natural disasters. This is particularly so inthe western region of the country where the incidence of both natural disastersand poverty are high. Because of these natural disasters, people are moredependent on forests for their survival. Our focus should be on improving the

19
productivity of forests and maintaining the resilience capacity of localecosystems. The adoption of SMF will enhance both mitigation and adaptationefforts.
Though all forests have the potential to sequester carbon, the sequestrationrates are different for different types of forests. The potentiality of forests tohold carbon is determined by the harvesting cycle and the removal scale.Forests managed for the supply of consumptive goods have frequent removalof forest biomass, thereby causing the amount of additional carbon sequesteredover a time interval to be lower than that of forest with limited access forshort harvesting periods.
Forests located in the high mountains have low potential leakage rates. Thismakes these forests attractive for REDD projects provided that transactioncosts (MRV and brokerage) are low. Most of the accessible forests in the mid-hills are managed by communities. These forests are also suitable for REDD,aslong as users form a group to deal with buyers in the voluntary market. Thelarge tracts of intact forests in the lowlands are also suitable for REDD, butthey require intensive management. The fragmented forests along theagricultural and settlement frontiers have high opportunity costs and are thusnot efficient for REDD.This chapter has shown that there are many costsassociated with REDD and it is advised to assess the REDD potential ofdifferent forests before developing a baseline and national system for Nepal.
Chapter 2 - A Quick Review of Potential Benefits and Costs of REDD in Nepal

Ready for REDD? Taking Stock of Experience, Opportunities and Challenges in Nepal
20

21
Chapter 3
Implications for community forest policyunder the proposed REDD policy
- Bhaskar S. Karky4, Margaret Skutsch5 and Kamal Banskota6
Abstract
Biological sequestration of CO2 by community forests assists in reducingatmospheric CO2. Nepal has been successful in implementing community forestmanagement (CFM) in the Himalayan region. This has led the government totry to link community forestry with the emerging global carbon policy for thepost-2012 period. To this end, Nepal is trying to prepare for a ReducedEmission from Deforestation and Degradation (REDD) policy with supportfrom the World Bank’s Forest Carbon Partnership Facility. However, addingvalue to existing CFM by managing carbon requires new national policies.The ownership of carbon from community forests is still unclear. There mustbe a single desk in the country that coordinates all carbon credits to reducepotential conflict among government ministries. With the country adopting afederalist structure, the existing rights of the forest user groups must bemaintained. At the international level, REDD policy must be written so that itallows CFM to be included in national carbon trading regimes. In practicethis means that REDD policy must award credits not just for reduceddeforestation and reduced forest degradation, but also for forest enhancement.The proposed REDD policy must also devise a suitable baseline methodologythat captures forest degradation and the diversity of forest conditions in Nepal.
3.1 Introduction
At the Conference of Parties to the UNFCCC to be held in Copenhagen inDecember 2009, a new treaty to mitigate climate change will be adopted to4 Economic Analysis Division, International Centre for Integrated Mountain
Development, P O Box 3226, Kathmandu, Nepal, E-mail: [email protected] University of Twente, P O Box 217, Enschede AE 7500, The Netherlands6 UNHABITAT, Afghanistan

Ready for REDD? Taking Stock of Experience, Opportunities and Challenges in Nepal
22
replace the Kyoto Protocol after it expires in December 2012. As agreed inthe Bali Action Plan’s Decision 2/CP13, the international community is nowengaged in a debate to formulate a new framework for inclusion of the forestrysector, so that it may play a more profound role than it has under the KyotoProtocol. There is a strong move now to find ways to reduce CO2 emissionsfrom terrestrial ecosystems by reducing deforestation and forest degradationrates in the tropics. This falls under a new proposed policy called ReducedEmission from Deforestation and Forest Degradation (REDD) in developingcountries (Gullisom et al.2007: 985-986).
While discussions continue at the international level, the implications of thispolicy for people whose livelihoods are dependent on forest resources needsto be carefully considered. Many local communities in developing countriesdepend on forests for both subsistence and commercial products that directlysupport their livelihoods, and their activities may be threatened if nationalgovernments choose to protect forests for carbon credits by fencing them offand prohibiting access by local people. These communities have been engagedin managing and conserving forest resources to meet their subsistence needs.They will be affected by REDD if their national governments decide toparticipate in this policy. If carbon credits or other forms of payment areissued, questions will arise as to whether, and how, their past, present andfuture efforts to reduce deforestation and degradation will be rewarded.
Community forest management (CFM) could be a cost-effective way ofreducing emissions under REDD (Skutsch et al. 2007). However, makingsuch a mechanism work for the benefit of both the credit buyer (from theindustrialised world) and community groups (from developing countries), whomight be among the possible sellers, is a challenging task. In subsistenceeconomies, community-managed forests typically provide a number of tangiblebenefits for communities. Policies such as REDD need to safeguard localcommunity rights and interests in this regard. If they are ignored, communitiesmay not be willing to participate in such international programmes, or theymay end up losing out if the national governments decides to participate inREDD.
This paper focuses on the case of Nepal, which has had a long and relativelysuccessful history of community forest management. It highlights the rolethat Nepal’s CFM plays in climate stabilization, presenting data on how muchcarbon is saved by activities of the forest management groups (CFUGs), andanalyses policies related to community forest and carbon trading. The objective

23
of the paper is to identify a number of potential difficulties that could emergeif CFM is to be rewarded for carbon under the REDD policy.
3.2 Policy on Reduced Emission from Deforestation andDegradation (REDD)
The REDD policy was originally conceived as an instrument to reward averagereductions in rates of deforestation at national level (Santilli et al. 2005), buthas developed into a broader mechanism that may also include curbing forestdegradation and forest management activities of various types which result inenhanced forest stocks. In the discussions regarding formulation of the policy,the need for a social welfare dimension and respect for the rights of indigenouspeoples has been recognized. Although the associated rewards system forcarbon has not yet been fully worked out, there is a strong move towards amarket-based system in which Certified Emission Reduction Credits (CERs)will be traded, in a similar way to credits under the Clean DevelopmentMechanism of the Kyoto Protocol. As some countries have also been arguingfor a fund based mechanism, it is possible that a hybrid system will be devised.Whether and how CFM will be recognized under REDD is not known at thisstage. This probably will not be an issue that is decided by internationalparties to the UNFCCC but at the national level. Nevertheless, it is importantthat the potential role of CFM is fully recognized at UNFCCC level, and thatthe international policy is written in a manner that is conducive to its inclusion.
The World Bank is already providing support for REDD through the ForestCarbon Partnership Facility (FCPF) with a target funding of US$ 300 millionto jump start REDD policy in developing countries. The fund provides grantsupport to prepare institutions and to build capacity for REDD related projectslike establishing emission reference levels and monitoring systems and foradopting strategies to reduce deforestation. The FCPF may be regarded as aprecursor and a stimulus to REDD in the same way that Activities ImplementedJointly (AIJ) operated prior to the first commitment period on an experimentalphase before the Clean Development Mechanism was fully introduced.
Nepal participated in FCPF’s call for submission of a Readiness- Project IdeaNote (R-PIN) in early 2008. Largely based on Nepal’s experience with CFM,the R-PIN was selected by the World Bank in July 2008 along with R-PINsfrom 13 other tropical countries. Thus, Nepal may be able to implement aprototype of REDD in the short term if its gets selected to participate in the
Chapter 3 - Implications for community forest policy under the proposed REDD policy

Ready for REDD? Taking Stock of Experience, Opportunities and Challenges in Nepal
24
Carbon Finance Mechanism of the FCPF. If it does, it could be an opportunityfor Nepal to gain experience and build capacity to operationalise a nationalREDD programme, involving community forest users in this experiment. Theexperience from FCPF may be valuable for the development of REDD policyunder UNFCCC, and the case of Nepal will be useful for demonstrating thevalue of CFM in this regard and for illuminating any policy issues that maybe involved.
3.3 Community forestry policy in Nepal
Although communities have managed forests in Nepal for as long as the areahas been inhabited, CFM as a programme came into being in the 1980s as thegovernment recognized that this was the best way to halt rampant degradationand deforestation. This process was shaped by the democratization processof the last thirty years in Nepali politics, and donor funding has stimulated aprocess of devolution in the forestry sector. For this reason, “the power toenact legislation, write manuals and shape the practice of forest managementon the ground is more diffuse and less concentrated in Nepal’s forestadministration….” (Blaikie and Springate-Baginski 2007:8).
Nepal is in fact a leading country in institutionalizing the concept of CFM innational forest policy, with about 35% of the total population of the countrymanaging around 1.1 m ha or 25% of the national forest (Kanel 2004). Thisdecentralized policy is based on grassroots-level forest management institutionscalled Community Forest User Groups (CFUGs), which are the hallmark ofNepal’s community forestry policy. These CFUGs have joined together toform the National Federation of Forest Users Nepal (FECOFUN). FECOFUNadvocates for community forestry user grouprights, locally, nationally,regionally and internationally, and is an autonomous, non-partisan, sociallyinclusive, non-profit organization, as well as Nepal’s largest civil societyorganization with more than 14,000 CFUGs as members (FECOFUN 2008).
However, despite the success of CFM in the Nepal, at the national level,deforestation and forest degradation continue. Based on the FAO CountryReport (2005: 10) data, Nepal has an annual deforestation rate of -1.63%from 1990 to 2005 which is higher than for most other countries. Between thesame period, shrubland also increased by 4.05% annually, indicating aconversion of forested land into degraded forests. This clearly calls for CFMto expand into areas that are being degraded and REDD may have an important

25
Biomass
Category Carbon Pools
Mean Carbon
Pool Size
(tCO2 per ha)
Mean Annual
Increment
(tCO2 per ha)
Above
Ground
Tree Biomass 157.89 6.23
Herbs, Shrubs, Grass
NA NA
Litter NA NA
Below
Ground
Tree Biomass (root system)
19.73 0.81
Soil Organic Carbon (to 1 m)
326.7 NA
Total 504.31 7.04
Source: Karky 2008
role to play in this regard. However, to date, the carbon impacts of CFM havenot been measured. In a research project carried out in three sites, the growthof forest biomass under community management was monitored over a periodof four years. The results of this study are presented below.
3.4 Carbon impacts of community forest management
The measurements at the three sites show that, from a climate changeperspective, community forestry results in avoided deforestation, avoidedforest degradation and enhanced biomass growth. Using IPCC (2003)methodology, field survey data on biomass change over four years at threedifferent sites in the mid- and high hills of the Himalayan region (Table 3.1)shows that the mean carbon pool size of a community managed forest(excluding litter and herbs, shrubs) is 504.31 tCO2 per ha including soil organiccarbon (SOC) up to 1m depth. Before being brought under CFM, these forestswere losing biomass. The forest is now maintained by CFUGs by deployingstrict protective measures, mostly in the form of restricting the rate ofharvesting of firewood and fodder to sustainable levels. In addition to haltingdeforestation and degradation, these management strategies result in increasedgrowth of biomass. The annual mean increment rate for carbon sequestrationwas found to be 7.04 tCO2 per hectare per year excluding SOC.
Table 3.1 Average CO2 pool size and yearly incremental growth rate in 3 communitymanaged forests in Nepal over a three-year period.
Chapter 3 - Implications for community forest policy under the proposed REDD policy

Ready for REDD? Taking Stock of Experience, Opportunities and Challenges in Nepal
26
These figures provide an indication that CFM is an effective instrument inboth reducing emissions and increasing carbon sinks in Nepal. The questionsthat arise from these findings are as follows:
• Should communities whose forest management efforts result in annualincreases in carbon stocks be rewarded for this?
• Would payments to communities for carbon-stock increases encouragethese communities to manage their forests even more carefully toincrease the stocks even more, and would it encourage morecommunities to participate in CFM?
To answer these questions it is first necessary to address some policy issuesrelated to community forestry in general.
3.5 National-level policy issues
Overlapping rights over forest products at national level
Ownership of forest carbon is not clear. The Forest Act 1993 is a major legalinstrument that devolved responsibility for forest management to the locallevel. The Forest Act 1993 acknowledged the CFUGs for the first time andgave them usufruct rights, while the state maintained the ownership of forestland. A further improvement was made to this act by the Forest Regulation1995 which stated that CFUGs could have their own wood-based industryonce they crossed the sustained-yield threshold. This permits them to sell anysurplus. The Forest Act 1993 guarantees non-interference from the governmentforest office in the operation of the CFUG and in the management of thecommunity forest as long as the CFUG complies with the Forest Act and theRegulation and follows the CFUG’s Operational Plan (Bhatia 1999: 12).However, in the Forest Act, there are some grey areas where the rights overforest products overlap with other Acts as shown in Table 9.2. With the newprospect of carbon trading, rights and ownership are even more ambiguous.In the prevailing forestry practice, and as guaranteed by the Forest Act 1993,CFUGs have usufruct rights over forest resources as well as the responsibilityfor forest management and conservation, through the District Forest Office.However, as shown in Table 2, there are areas where this contradicts withother Acts, which could result in disputed ownership if carbon trading isintroduced.

27
Forest
Products
F
orest
Act
19
93
Local
Self
-
Go
vern
an
ce
Act
1998
Nep
al
Min
es
Act
1966
Wa
ter
Reso
urces
Act
1992
CD
MP
oli
cy
for
Nep
al
(A/R
)
R-P
IN(F
CP
F)
Fuelwood, dried
timber, twigs,
branches, bushes
User Group
VDC
Herbs, NTFPs User
Group DDC
Mines
(stone, sand, soil,
natural
elements)
User Group
VDC and
DDC
Gov’t of Nepal
Prohibited herbs Gov’t of
Nepal
Resin
User Group,
Gov’t of Nepal
Drift wood
(in rivers)
User Group
DDC
Straw, grass User
Group VDC
Water resources User
Group VDC, DDC
Gov’t of Nepal
Gov’t of Nepal
Natural heritage User
Group
Carbon credits
Gov’t of Nepal: MOE
(UNFCCC-
DNA)
Gov’t of Nepal:
MOFSC (REDD
Cell)
Source: Belbase and Regmi 2002
Table 3.2 Overlapping rights regarding forest products in Nepal
The lowest administrative unit in Nepal is called the Village DevelopmentCommittee (VDC). Above it is the District Development Committee (DDC)as the apex of local government; there are 75 DDCs in the country.
Chapter 3 - Implications for community forest policy under the proposed REDD policy

Ready for REDD? Taking Stock of Experience, Opportunities and Challenges in Nepal
28
The Local Self Governance Act (LSGA) 1998 under Section 58(d) and (e)gives the VDC the right to sell forest resources to generate income from theVDC area. The LSGA 1998 in Section 68 1(c) and (d) further stipulates thatnatural heritage including forests and forest resources falling within the VDCarea are the property of the VDC. Belbase and Regmi (2002:14) claim that “itis unclear if community forests would also be considered as VDC property,as the legislation appears to imply (by explicitly stipulating that the VDC hasfull rights over the forest granted by the prevailing forest laws and governmentof Nepal)”.
In the matter of ownership over mined products (e.g., material found in theforest area such as quarried stone, sand, soil, and most other natural elementswith the exception of oil), the Forest Act 1993 gives ownership to CFUGs,while the LSGA 1998 gives ownership to the VDC and DDC, and the NepalMines Act 1966 gives ownership rights to the government of Nepal. Similarly,regarding water resources in the community forest area, the Water ResourcesAct 1992 assigns ownership to the government of Nepal.
Carbon trading is in its infancy and there is a lack of clear policies governingit. The Designated National Authority (DNA) of the UNFCCC is the agencythat provides oversight to make sure that carbon trading projects meet thesustainable development requirement. This authority extends to the coveragearea of CDM and includes afforestation and reforestation projects. However,under the World Bank’s Forest Carbon Partnership Facility (FCPF), forestprojects fall under the Ministry of Forests and Soil Conservation. This showsthe need for inter ministerial coordination for institutional readiness to facilitateforest carbon finance.
The ownership rights of CFUGs have not been delineated in either the DNA’sscope of work or the Ministry of Forests and Soil Conservation’s projects.The Operational Plans of CFUGs have not yet included carbon managementin their programmes. This means that at the community level, the ownershipof carbon is not clear. It is not yet known whether and how the UNFCCCREDD policy will recognize the ownership of forest carbon at local levels,although this will probably be regarded as a matter for national governmentsto decide. How the government will recognize carbon ownership claims fromcommunity managed forests is therefore a key issue to be negotiated internallythat can be guided through the future forest carbon finance mechanism.

29
Overlapping rights over coordinating carbon trade
One of the major obstacles is the lack of an appropriate institution to coordinateCFM and carbon trading. In order to coordinate with the CDM market, thegovernment of Nepal made the Ministry of Environment (MOE) responsible tofunction as the Designated National Authority to the UNFCCC in December2005. All CDM projects and matters related to the global climate treaty arecoordinated by the DNA through the MOE. The DNA has an 11-member steeringcommittee to ensure inter-sectoral coordination and to provide guidance onCDM matters. There is one member from the Ministry of Forest and SoilConservation (MOFSC) represented in the steering committee of the DNA.
A fundamental problem with this is that the DNA in Nepal was formed withthe sole objective to coordinate CDM projects with the UNFCCC. UNFCCCREDD is however outside this mandate.
Furthermore, in Nepal CFM falls under the MOFSC while expertise on theUNFCCC climate treaty and GHG inventory lie with the MOE and the DNA.Forestry related expertise and specifically CFM related data and regulationsare monitored by the Community Forest Department of the MOFSC. Onlythe DNA officials attend the UNFCCC related SBSTA and COP meetings.Consequently, when Nepal made two submissions on REDD to the SBSTA inFebruary 2007 and March 2008 relating to Nepal’s views on community forestand climate policy, they were made by DNA through the MOE.
The UNFCCC focal point is MOEwhile the World Bank collaborates withthe MOFSC for the R-PIN. In future, when and if REDD deals with national-level baselines and a national-level payment system, there could be conflictinginterests between the MOE and MOFSC over control and monitoring of carbontrading in the forestry sector.
Federal structure
Nepal became the newest republic in the world by declaring itself a FederalDemocratic Republic in May 2008, and is now in the process of writing anew constitution. Some argue that the new constitution will pave the way formore decentralized policies giving more regional autonomy. Considering thatthe proposed REDD policy will be implemented at national level, withpayments made centrally, attention needs to be given to how these will bedistributed among regions, given the differences in forest ecology betweendifferent regions. It needs to be seen on what basis Nepal will be divided i.e.
Chapter 3 - Implications for community forest policy under the proposed REDD policy
Ready for REDD? Taking Stock of Experience, Opportunities and Challenges in Nepal
30
geographical, social and/or ethical factors and then how REDD resourceswill be allocated between such federated states. The political ecology offorest management under a federated structure will influence its compatibilitywith REDD global carbon policies. FECOFUN has already voiced its concernthat when Nepal is divided into federated states, the existing CFUGs andtheir rights should not be taken by the state governments. Establishing therights of the CFUGs and their political relationship with the state governmentsis important in shaping the future of CFM, especially when there is valueaddition in forest resources through carbon revenue.
3.6 International-level policy issues
At the global level, there are two main policy uncertainties that need to beaddressed if community forest management is to participate in REDD. Thetwo issues are related to methodology and uncertainty in carbon accountingmethods and baselines as discussed below.
Uncertain carbon accounting criteria
Under REDD, the way in which carbon is accounted will be a key criterionthat will determine whether community forest users will be able to participatein REDD or not. The COP 13 decision on REDD (2/CP13) has explicitlymentioned addressing emissions from deforestation and degradation, but it isnot yet clear if forest enhancement will also be rewarded.
CFM contributes to reducing emissions from activities taken to 1) avoiddeforestation, 2) avoid forest degradation (reduce removal of woody biomass)and from 3) enhancement of biomass by implementing protective measures.For Nepal, of these three, forest enhancement – increasing the stock and thesink in managed forests – is the most important in terms of carbon preservedin community managed forests.
If communities are to earn financial rewards, those from avoided deforestationand avoided degradation would be small in comparison to those from enhancedforest biomass. Furthermore, avoiding deforestation is easy to account for asit can be measured in area terms. Forest biomass enhancement is accountedby recording the incremental biomass based on the IPCC Good PracticeGuideline (IPCC 2003). But measuring degradation is more complicated asforest degradation refers to unsustainable removal of woody biomass by localcommunities for meeting their sustenance needs without decreasing the forest

31
area. So, to claim what is saved by reducing degradation requires a specialcarbon accounting method that considers historical harvesting rates andcompares these to harvesting rates under current management practices. TheUNFCCC has not yet come up with a definition for forest degradation, muchless with a methodology to measure it.
Uncertain baseline construction
In addition to the issue of appropriate carbon accounting methods, the questionof baselines is uncertain under REDD. A national reference scenario (baseline)has been proposed that could be operationalised within the country, withsmaller baselines at regional levels that add up to the national baseline. Howthe baselines will be determined for deforestation and degradation and howthese will be combined are major concerns that REDD policy needs to address.What is clear is that credits will be allocated to each country solely on thebasis of its overall achievements, taking into account both gains and lossescompared to the national reference scenario.
Deforestation and forest degradation reference scenarios will have to beestablished using two different methodologies because of the inherent differencesin these activities and in the data required and available. A deforestation referencescenario can be based on remotely sensed imagery over a historical period thatshows changes in the area covered by forests, and using statistical (secondary)data on carbon stock in different types of forests to calculate the change interms of tons of carbon. The reference scenario may be projected into thefuture either by using very simple assumptions (linear continuation of pastpatterns) or more sophisticated approaches (relating the past changes to particulardrivers, and using predictions of these drivers to forecast forest areas likely tobe lost in the future under ‘business-as-usual’ conditions). The technical problemsinvolved in establishing deforestation reference scenarios can be solved relativelyeasily, as the methodology for accounting for deforestation can follow Chapter3 of the IPCC Good Practice Guideline (IPCC 2003).
The forest degradation reference scenario, on the other hand, is much moredifficult to establish because most degradation cannot be detected fromremotely sensed imagery. There is no current or historical record of the spatialpattern of forest degradation (which areas are being degraded and the amountof biomass lost) because of lack of forest inventory data in most developingcountries. Furthermore, the Good Practice Guideline 2003 (IPCC 2003)provides no clear recommendations for methodology for assessing andquantifying forest degradation rates.
Chapter 3 - Implications for community forest policy under the proposed REDD policy

Ready for REDD? Taking Stock of Experience, Opportunities and Challenges in Nepal
32
3.7 Conclusion
Nepal has very high rates of deforestation and degradation denoting itspotential to qualify for REDD. The CFM sector has contributed to thesustainable management of forests in about 1.1 m ha or around 25% of thetotal national forest area. Without the CFM policy, deforestation anddegradation probably would have been much higher. So CFM policy could bethe entry point for REDD, contributing to the expansion of sustainable forestmanagement practices in areas with high deforestation and degradation rates.From this analysis, it is now clear that there must be changes made at differentlevels to allow the mechanisms of the emerging climate treaty to work togetherwith CFM. First, ownership of carbon from community managed forests mustbe spelt out clearly in national legislation and these rules must not contradictwith other Acts. Carbon management and ownership must also be included ineach CFUG’s Operational Plan. Secondly, there must be a single desk thatwill coordinate credits for CDM AR, the World Bank’s R-PIN and the proposedUNFCCC REDD programme, thereby eliminating conflicts of interest betweenagencies. Thirdly, the existing rights of the community forestry sector shouldbe maintained and further strengthened in the new federal structure of thecountry, as this is necessary to create a conducive environment to implementREDD within the country.
At the international policy level, REDD must be written in such a way thatCFM can be included at the national level. In practice, this means that REDDpolicy must award credits not just for reduced deforestation and reduced forestdegradation but also for forest enhancement. The proposed REDD policymust also come up with a suitable baseline methodology that captures forestdegradation.
It is time to analyze CFM in the broader context of the global climate treaty.This paper comes at the right time as global leaders will meet this Decemberin Copenhagen to discuss a global climate treaty. At the national level, Nepalis restructuring its political and administrative system, and has to reconsiderhow to manage CFM under a new federal structure. This is the ideal time tohighlight the issues of local forest users in the wider context of climate changeand carbon trading so that global climate agreements can be designed so thatCFM with its demonstrated effectiveness in mitigation can be used by countriesunder the emerging UNFCCC REDD policy.
33
Chapter 4
Bringing Peoples’ Perspectives: MakingREDD Effective in Nepal
- Bhola Bhattarai7
Abstract
Climate change has captured the public attention on an unprecedented scale.While some of the specific impacts of climate change are still being questioned,the role of humans in contributing to climate change has been fully recognizedin scientific, policy and public circles. Now the international community isattempting to forge consensus on issues such as who should be responsiblefor mitigating climate change, by how much, and who should pay for it. Oneof the mitigation mechanisms being discussed is Reducing Emissions fromDeforestation and Forest Degradation (REDD), which proposes that developedcountries be allowed to compensate developing countries for their forestconservation and regeneration efforts, as a part of meeting their mitigationobligations. This chapter discusses the social, economic and legal implicationsof REDD for community forestry in Nepal and presents a vision for sharingcarbon payments at the national level.
4.1 Introduction
Climate change is the direct result of an increased atmospheric concentrationof greenhouse gases (GHGs). These GHGs are emitted from a wide variety ofsources like fossil fuel based transportation, industrial complexes, agriculturalland, and deforested and degraded land. The focus of this chapter is on reducingemissions from deforestation and degradation.
Deforestation and forest degradation have been estimated to account for upto 20% of total annual GHG emissions. Changes in forest cover and carbonstocks have been particularly prominent in developing countries, and especially
7 Federation of Community Forest Users, Nepal

Ready for REDD? Taking Stock of Experience, Opportunities and Challenges in Nepal
34
in the least developed countries (LDCs). As these countries continue to grow,their deforestation and degradation rates have only increased. If these ratesare not checked, the contribution of deforestation and forest degradation toGHG emissions will continue to rise and will have far reaching consequencesfor livelihoods and ecosystem services in general.
A new mechanism called Reducing Emissions from Deforestation and ForestDegradation (REDD) has now been incorporated into the climate changenegotiations agenda and is included under the mitigation section of the BaliAction Plan. Recently, interest in the potential to use this mechanism to addressdeforestation and forest degradation has been high. As has already beenmentioned, deforestation and forest degradation account for a substantialportion of the total global emissions profile, so any overall mitigation strategythat does not take this sector into account will not be complete. Furthermore,REDD has the possibility of contributing substantial emissions mitigationwith low costs, and of promoting numerous co-benefits related to biodiversityand livelihoods.
The increasing pace of deforestation and forest degradation in developingcountries is alarming. While this provides clear evidence of the need to takeimmediate action to address these issues, we must also understand that forestsare under extreme pressure to deliver resources. Forested land is constantlybeing encroached upon and converted into agricultural land and other uses,posing a serious challenge to its sustainable management. This is onlyindicative of the extent to which people depend on these resources. Muchmore research is required to better understand the nexus between livelihoodsand forests, and the specific forces driving deforestation and degradation.
Much of the current debate on REDD has centered on how to provide thenecessary incentives to mitigate greenhouse gases and to increase participationin this process by different stakeholders. Some of the questions being askedare: How do we reduce deforestation rates? How do developed countriescontribute to this process? How is revenue sharing done inside the countrybetween the concerned stakeholders? And what will be the overarchingmechanism? These critical questions are being discussed both nationally andinternationally.

35
4.2 What is REDD?
REDD is a mechanism through which the abatement of greenhouse gasesfrom deforestation and forest degradation can be achieved through a series ofincentives. These incentives are provided by developed countries to developingcountries for taking actions that reduce forest-related emissions. Thismechanism recognizes the historical role that developed countries have playedin causing climate change, as well as their higher level of resources for pursuingthe mitigation of GHGs. As there are many stakeholders in the REDD process,a lot of interest has been generated about the architecture of this mechanism.In Nepal’s case, some of the key stakeholders are the community forests,indigenous and local communities, the local and central governments, andcivil society at large. Some of the major issues that have emerged in theinternational arena include:
• The need to obtain prior and informed consent of concernedindigenous and local communities in line with ILO 169 and theUNDRIP Convention;
• Recognition of the ownership and access rights of local and indigenouscommunities over forest resources (i.e., the state should play the roleof a facilitator and provide policy guidelines under a comprehensiveand strategic framework);
• The imperative of establishing revenue-sharing mechanisms througha multi-stakeholder group process (i.e., the primary beneficiaries ofcarbon-related revenues must be the actors that have played thestrongest role in halting deforestation and degradation);
• Simplification of modalities for carbon trading (As carbon trading isa new and technical area) in order to minimize transaction costs andmaximize efficiency;
• A need for recognition that REDD must not only benefit countriesthat have only begun to reduce deforestation and degradation now—but also those that have successfully already initiated actions toconserve and regenerate forests in the past;
• Ensuring the participation of, and guaranteeing benefits for, women,Dalits, indigenous and local communities, youth and othermarginalized stakeholders.
Chapter 4 - Bringing Peoples’ Perspectives: Making REDD Effective in Nepal

Ready for REDD? Taking Stock of Experience, Opportunities and Challenges in Nepal
36
The aforementioned points are only some of the key issues that need to beaddressed. Scientists and technical experts, negotiators, and non-governmentalorganizations have been working hard to ensure that a proper REDDmechanism is designed so that GHG mitigation is carried out while providingthe strongest benefits to relevant stakeholders.
International negotiations on REDD have been underway and have taken afew strides in 2009, with numerous inter-sessional that were held betweenthe UNFCCC’s annual Conference of Parties (COP) meetings. When theparties meet this December in Copenhagen, it is likely that a general frameworkwill be agreed upon for REDD. We can anticipate this mechanism to comeinto force only after 2012, that is, after the first commitment period of theKyoto Protocol is over. As the level of preparedness is low, some countrieswill need some extra time after 2012 to build the necessary capacity toimplement such a mechanism. However, they should do whatever they cannow to prepare for REDD, with support from donor organizations.
4.3 Why REDD for Nepal and where?
Though Nepal’s forest cover and deforestation and degradation rates havebeen high historically, local communities have been playing a major role inconserving forests for the past several years. These efforts have beeninstrumental in checking deforestation and degradation. As a result, voicesare being raised to press for the recognition of community forests’ role inclimate change mitigation. Because carbon stock enhancement has beenconsidered to be a key aspect of this debate, REDD has morphed into REDD+,with the plus indicating carbon stock enhancement, rights of communitypeople, biodiversity conservation, livelihood benefits and other associatedsocial capitals particularly in the context of community and participatoryforestry. A REDD mechanism alone, without its “+” component, may not beadequate to reward those community forest user groups who have significantlycontributed not only to revitalize the degraded forest but also reduce povertythrough conservation. Therefore, Nepal should advocate for REDD+ to harnessbenefits from the evolving REDD mechanism so as to ensure that the benefitsgoes to the historically good doing communities in conservation.
The World Bank, through is Forest Carbon Partnership Facility (FCPF)program, has provided USD 200,000 for REDD ‘readiness’. This fund hasbeen provided under the expectation that it will help to improve the capacity

37
of necessary institutions to implement a REDD framework in the days tocome. The Ministry of Forests and Soil Conservation has established a REDD-Forestry and Climate Change Cell to oversee this task. A working group hasbeen formed to implement these activities. In this forum, suggestions fromthe civil society and concerned stakeholders are given due importance. TheREDD Working Group has been focused on forming the Readiness Plan underthe World Bank’s FCPF initiative.
4.4 REDD and Civil Society Institutions
Civil society groups have formed the Civil Society REDD Action Group.This group has been building internal capacity, formulating position papers,and providing input and suggestions to the government, among other things.Community Forest User Groups have been a key player in using the media tosensitize the public to issues about climate change. Similarly, communityforest user groups (CFUGs) and NEFIN have been working to increase theirreach and capacity. Through a collaborative pilot project of FECOFUN,ICIMOD and ANSAB, action research is being conducted in three differentwatersheds to better understand carbon trading opportunities that can arisefrom a REDD mechanism.
The role of civil society institutions has been wide-reaching. These institutionshave been working with local groups to build capacity and raise awareness,while also providing advice and inputs to the government and attending
Box 4.1 – REDD Pilot Project
ICIMOD, FECOFUN and ANSAB have been running pilot projects in Gorkha,Dolakha and Chitwan districts. These pilot projects are being carried out in theLudikhola, Charnawati and Kayarkhola watersheds. The project areas includearound 20,000 hectares and involve about 182 CFUGs in total. After CFUGs expresstheir interest to the district FECOFUN office, FECOFUN organizes awareness-raising and capacity-building activities so that these CFUGs can participate inthe program.
This pilot project has been illustrating both the social and technical challenges inimplementing a REDD system. Operational plans that are formulated by theCFUGs are also being discussed to identify how these plans can be synchronizedwith a national level REDD framework. By holding discussions at differentlevels—village, district and national—the project aims to build an inclusivemethod so that the views of different stakeholders are well represented.
Chapter 4 - Bringing Peoples’ Perspectives: Making REDD Effective in Nepal
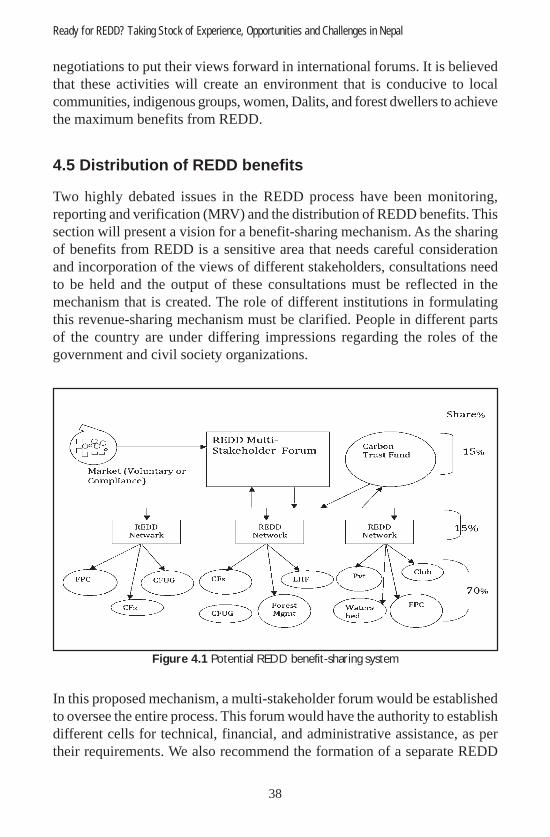
Ready for REDD? Taking Stock of Experience, Opportunities and Challenges in Nepal
38
negotiations to put their views forward in international forums. It is believedthat these activities will create an environment that is conducive to localcommunities, indigenous groups, women, Dalits, and forest dwellers to achievethe maximum benefits from REDD.
4.5 Distribution of REDD benefits
Two highly debated issues in the REDD process have been monitoring,reporting and verification (MRV) and the distribution of REDD benefits. Thissection will present a vision for a benefit-sharing mechanism. As the sharingof benefits from REDD is a sensitive area that needs careful considerationand incorporation of the views of different stakeholders, consultations needto be held and the output of these consultations must be reflected in themechanism that is created. The role of different institutions in formulatingthis revenue-sharing mechanism must be clarified. People in different partsof the country are under differing impressions regarding the roles of thegovernment and civil society organizations.
Figure 4.1 Potential REDD benefit-sharing system
In this proposed mechanism, a multi-stakeholder forum would be establishedto oversee the entire process. This forum would have the authority to establishdifferent cells for technical, financial, and administrative assistance, as pertheir requirements. We also recommend the formation of a separate REDD

39
Carbon Trust Fund that would manage the carbon payments through atransparent and accountable process. REDD networks would be established,using existing networks where possible. These networks would involve localforest managers. The network would be inclusive and would represent localand indigenous groups, women, Dalits and forest dwellers. These stakeholderswould all play an important role in benefit sharing. These networks are alsoexpected to play a coordinating role amongst different stakeholders. Forestmanagers at the village level would not just generate interest and mobilizeuser groups for REDD implementation, but would also be instrumental inensuring that REDD benefits reach those who are the most vulnerable andimpoverished. These groups could also take up other activities apart fromforest conservation like alternative energy promotion and educationalcampaigns.
Even though the exact architecture of the REDD mechanism may not befinalized until a few years down the line, it is still necessary to do an analysisof existing institutions and their capacities. The following must be kept inmind while formulating a REDD mechanism:
• Active participation of stakeholders right from the preparation phaseneeds to be generated
• Forest dependent communities need to be closely consulted with andprograms must only be formulated after their views have been takeninto account;
• The benefit-sharing mechanism must recognize the role of local andindigenous communities in forest conservation;
• Consensus must be forged amongst different stakeholders to take thisforward; and
• Different aspects of REDD like effective policy formulation,transparent decision-making processes, equitable participation, andprior and informed consent must be ensured.
4.6 New directions for REDD
It is high time for all of the concerned stakeholders - e.g., CFUGs, forestmanagers’ associations, government and non-governmental organizations, etc.- to engage in serious dialogue about how best devise a REDD mechanism.For this mechanism to yield benefits to local and indigenous communities,
Chapter 4 - Bringing Peoples’ Perspectives: Making REDD Effective in Nepal
Ready for REDD? Taking Stock of Experience, Opportunities and Challenges in Nepal
40
women, and Dalits, they must express their concerns and actively participatein the policy formulation and project preparation phase. Policy makers needto concentrate on how to allow benefits to reach the village level in the mostefficient manner. Similarly, non-governmental actors must come together todecide how to best support the government during international negotiations.They must also continue to carry out awareness and capacity buildinginitiatives. Government officials must also realize that their goals will befulfilled only when the goals of local and indigenous communities are met.

41
Chapter 5
Indigenous peoples and REDD: Challengesand Opportunities in Nepal
- Pasang Sherpa8, Nima Lama9 and Pasang D. Sherpa10
Abstract
59 indigenous nationalities comprise 37% out of the total population in Nepal.Historically, indigenous peoples have a very special relationship with forests,water and land resources, which provide important cultural, spiritual andreligious symbols in their lives. However, after the Forest Act in 1993, theirownership has been transferred to the government. Thus access by indigenousgroups to natural resources was constricted. If a scheme for ReducingEmissions from Deforestation and Degradation (REDD) is designed andimplemented with concern for the rights of indigenous peoples over theiraccess to the forest, they would contribute to the reduction of emissions andcarbon sequestration through their traditional indigenous customary practicesof forest management. However, if a REDD scheme is developed without theirfree prior informed consent and participation, it would not only threaten theirlivelihoods but also violate their rights secured by the UN Declaration on theRights of Indigenous Peoples, and limit the scheme’s potential for reducingemissions.
5.1 Introduction
Nepal is a secular, multicultural, multilingual, multi-ethnic and multi-religiouscountry of the Himalayan region. Geographically, Nepal is divided into thehigh Himalayas, the high mountains, the middle mountains, the Siwalik (low
8 Lecturer, Department of Sociology and Anthropology, Trichandra College; TribhuvanUniversity, Kathmandu; Email: [email protected]
9 Mr. Nima Lama, Secretary-Foreign Affairs; Nepal Federation of Indigenous Nationalities(NEFIN); Kusunti, Lalitpur; Email: [email protected]
10 Ms. Pasang Dolma Sherpa, National Coordinator; NEFIN Climate Change-REDDPartnership Program in South Asia and Southeast Asia, Golphutar, Kathmandu; Email:[email protected]

Ready for REDD? Taking Stock of Experience, Opportunities and Challenges in Nepal
42
Mountain (18) Bara Gaunle, Bhotia, Byanshi, Chairotan, Dolpo, Larke, Lhomi (Shingsawa), Lhopa, Marphali Thakali, Mugali, Siyar, Sherpa, Tanbe, Thakali, Thudam, Tin Gaule Thakali, Topkegole, Walung.
Hill (24) Bankaria, Baramo, Bhujel/Gharti, Chepang, Chhantyal, Dura, Gurung, Hayu, Hyolmo, Jirel, Kushbadia/Patharkatta, Kusunda, Lepcha, Limbu, Magar, Newar, Pahari, Phree, Rai, Sunuwar, Surel, Tamang, Thami, Yakkha.
Inner Tarai (7) Danuwar, Kumal, Bote, Raute, Darai, Majhi, Raji
Tarai (10) Dhanuk, Dhimal, Gangai, Jhangad (Urau), Kisan, Meche, Rajbanshi (Koch), Satar (Santhal), Tharu, Tajpuriya
Source: NEFDIN 2002
hills) and the Terai (plains) regions. Despite its small size, Nepal containstremendous biological, sociocultural and ethnic diversity (Bhattachan 2008).
The Government promulgated the Act of National Foundation for Developmentof Indigenous Nationalities in 2002 and identified 59 indigenous nationalitiesand defines indigenous peoples as “a tribe or community having its own motherlanguage, traditional rites and customs, distinct cultural identity, distinct socialstructure, and written or unwritten history” (NEFDIN 2002). Out of theestimated 300 million indigenous peoples in the world, 8.27 million live inNepal, comprising approximately 37 percent of the country’s total population(CBS 2001). The 2001 National Census identified only 43 out of 59 indigenouspeoples (listed in Table 5.2). This underestimation is most likely due toclassification errors. For example, two or more groups have been lumpedtogether while some groups have been included in the category of unidentifiedcaste/ethnic groups. Some argue that certain groups have been excludedaltogether (NEFIN, 2005). As a result, the exact number of indigenousnationalities is still not determined. Table 5.1 shows the list of Indigenouspeoples living in different regions of Nepal.
Classification of indigenous peoples in Nepal
The Nepal Federation of Indigenous Nationalities (NEFIN) has dividedindigenous nationalities into five groups based on literacy rates, occupation,land ownership, and population. Table 5.2 shows this categorization.
Table 5.1 Indigenous nationalities of Nepal

43
Endangered
Groups
Bankariya, Kusunda, Kushbadia, Raute, Surel, Hayu, Raji, Kisan, Lepcha, Meche
Highly
Marginalized
Groups
Santhal, Jhangad, Chepang, Thami, Majhi, Bote, Dhanuk (Rajbansi), Lhomi (Singsawa), Thudamba, Siyar (Chumba), Baramu, Danuwar
Marginalized
Groups
Sunuwar, Tharu, Tamang, Bhujel, Kumal, Rajbansi (Koch), Gangai,Dhimal, Bhote, Darai, Tajpuria, Pahari, Dhokpya (Topkegola), Dolpo, Free, Magal, Larke (Nupriba), Lhopa, Dura, Walung.
Disadvantaged
Groups
Jirel, Tangbe (Tangbetani), Hyolmo, Limbu, Yakkha, Rai, Chhantyal, Magar, Chhairotan, Tingaunle Thakali, Bahragaunle, Byansi, Gurung, Marphali Thakali, Sherpa.
Advanced Groups Newar, Thakali.
Table 5.2 Classification of indigenous nationalities in Nepal
5.2 Natural resources and identity of indigenous peoples
Historically, indigenous peoples have a very special relationship with naturalresources. Natural resources are not only the basis of the livelihoods ofindigenous communities, but they are also interlinked with their cosmologyand life systems. These resources have deeper cultural meanings: indigenousderive their sense of identity by living in certain areas and using location-specific natural resources.
Natural resources, like land, forests and water, provide important cultural andreligious symbols for the indigenous peoples of Nepal like the Rais andSherpas. Daniggelis (1997) posits that “Farmers’ symbolic relationship withthe jungle (forest) is laden with cultural meanings and woven into their oraltradition [and are used to] describe the cosmological system.” (Daniggelis1997: 109). He also gives the example of origin myths from the Rai communitythat shows the importance of plants and animals in the metaphysical system.Furthermore, these myths contain numerous references to the “jungal” and itis clearly evident that nature is an inseparable part of their cosmologicalunderstanding.
Indigenous peoples like the Chepangs need their own traditional land to burydead bodies. Similarly, Bote, Majhis and Rajis worship fish and boats using
Chapter 5 - Indigenous peoples and REDD: Challenges and Opportunities in Nepal

Ready for REDD? Taking Stock of Experience, Opportunities and Challenges in Nepal
44
Indigenous Groups
Fora
gin
g
Ho
rtic
ult
ure
Past
ora
lism
Ag
ricult
ure
Ind
ust
ry
Raute, Kushbadia + - - - -
Kusunda, Bankariya, Chepang +/- + +/- - -
Thami, Raji, Hyayu +/- + +/- - -
Majhi, Bote, Musahar +/- + - + -
Jirel, Larke, Siyar, Tangwe - - + + +/-
Walung, Topke, Thudam, Lhomi, Sherpa, Holmo, Dolpo, Bhote, Lhopa, Mugali
- - + + -
Gurung, Byansi - - + + +
Limbu, Lepcha, Yakkha, Rai, Sunuwar, Surel, Tamang, Pahari, Free, Baramo, Bhujel, Dura, Chantyal, Magar
- +/- - + -
certain plants from the forest. These examples show the inextricable link betweennature, indigenous peoples and their livelihoods. As natural resources formsuch an important component of their culture, any disruption in access to naturalresources has deep-seated implications for their identity and sense of self.
Local institutions of property ownership often differ from the mainstream legalsystem. In many cases, these groups have been using and managing naturalresources without any formal property ownership—through traditionalunderstandings and customary practices. As the relationship between indigenouspeoples and natural resources has been ongoing for generations, they feelparticularly committed to managing these resources under their own methodsand systems. However, since indigenous peoples have faced political, economicand legal interventions, the continuation of their traditional practices and naturalresource management methods has been challenged and many have discontinuedthem (Uprety and Adhikari 2006) argues that such changes have violated theirrights and have relegated indigenous groups to marginalized actors.
5.3 Livelihood strategies of indigenous peoples
Indigenous peoples of Nepal are engaged in different traditional and non-traditional occupations. Table 5.3 shows the basic livelihood strategies ofdifferent indigenous groups.
Table 5.3 Livelihood strategies of indigenous peoples in Nepal

45
Table 5.3 clearly shows that Raute and Kusbadia still depend largely on huntingand gathering. These groups do not generally hoard or accumulate propertyand they exchange the products they produce through a barter system. Thismakes it difficult for them to adjust in a setting where legal institutions do nottake these considerations into account.
Rautes forage in the hills of certain western regions and Kushbadiyas wanderin the western Terai areas to barter their products with food or sell them tomeet their daily needs. They are uneducated and are ruled by their owncustomary laws. Kushanada and Bankariya have abandoned their hunting andgathering nomadic ways of life. Though they have adopted permanentsettlement, they are still highly dependent on forest resources. As they alsousually have no evidence of land ownership, their livelihoods have becomethreatened as well. In addition, they have not been able to fully adapt to anon-nomadic lifestyle, especially to new agricultural innovations. Similarly,indigenous peoples living in the Himalayan region rely on animal husbandryand trade for their livelihood, while indigenous peoples from the mid hillsdepend mainly on agriculture. Indigenous peoples from the Terai depend onagriculture as well, which sometimes takes the form of dry farming.
5.4 Indigenous peoples, land and resources
The ownership of natural resources, especially land, has always symbolizedwealth, power, social prestige and security for indigenous peoples. However,indigenous peoples are usually marginalized from by such ownership systems.For example, 80 % of the indigenous people are ‘marginal cultivators’ (withless than 1 acre) or small cultivators (having 1-2 acres) (IIDS 2002). A largenumber of indigenous peoples have no land to claim as their own and live aswage laborers. These figures show that the majority of indigenous peoplesare deprived of land ownership in Nepal. As a result, they tend to experienceheightened food insecurity and threats to the preservation of their culturalidentity.
Danuwar, Durai, Kumal, Mache, Kisan, Santhal, Rajbansi, Tajpuria, Dhimal, Gangai, Jhangad, Tharu, Dhanuk
- -- - + -
Chairotan, Tin Gaunle Thkali, Barha Gaunle - - +/- +/- +
Newar, Thakali, Marphali Thakali - - - + +
Source: IIDS 2002, Note: + means main strategy, - secondary strategy, +/- some groups orgroup members are involved in this strategy.
Chapter 5 - Indigenous peoples and REDD: Challenges and Opportunities in Nepal
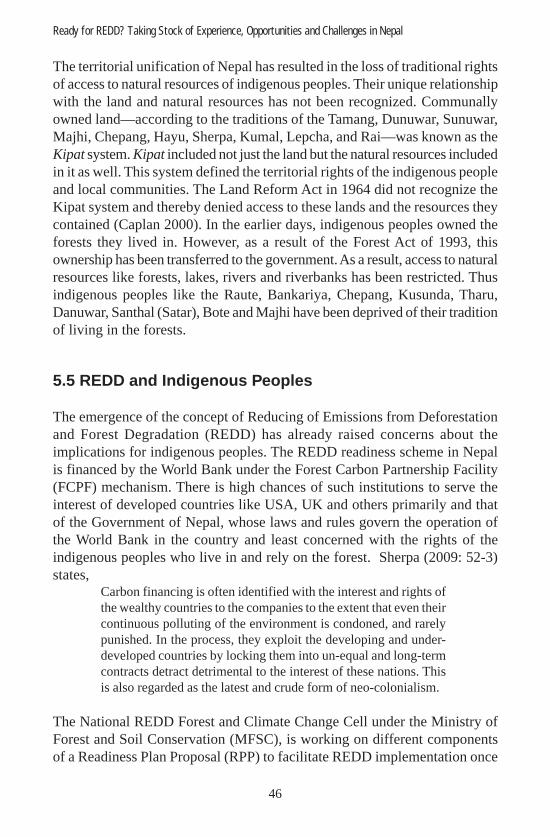
Ready for REDD? Taking Stock of Experience, Opportunities and Challenges in Nepal
46
The territorial unification of Nepal has resulted in the loss of traditional rightsof access to natural resources of indigenous peoples. Their unique relationshipwith the land and natural resources has not been recognized. Communallyowned land—according to the traditions of the Tamang, Dunuwar, Sunuwar,Majhi, Chepang, Hayu, Sherpa, Kumal, Lepcha, and Rai—was known as theKipat system. Kipat included not just the land but the natural resources includedin it as well. This system defined the territorial rights of the indigenous peopleand local communities. The Land Reform Act in 1964 did not recognize theKipat system and thereby denied access to these lands and the resources theycontained (Caplan 2000). In the earlier days, indigenous peoples owned theforests they lived in. However, as a result of the Forest Act of 1993, thisownership has been transferred to the government. As a result, access to naturalresources like forests, lakes, rivers and riverbanks has been restricted. Thusindigenous peoples like the Raute, Bankariya, Chepang, Kusunda, Tharu,Danuwar, Santhal (Satar), Bote and Majhi have been deprived of their traditionof living in the forests.
5.5 REDD and Indigenous Peoples
The emergence of the concept of Reducing of Emissions from Deforestationand Forest Degradation (REDD) has already raised concerns about theimplications for indigenous peoples. The REDD readiness scheme in Nepalis financed by the World Bank under the Forest Carbon Partnership Facility(FCPF) mechanism. There is high chances of such institutions to serve theinterest of developed countries like USA, UK and others primarily and thatof the Government of Nepal, whose laws and rules govern the operation ofthe World Bank in the country and least concerned with the rights of theindigenous peoples who live in and rely on the forest. Sherpa (2009: 52-3)states,
Carbon financing is often identified with the interest and rights ofthe wealthy countries to the companies to the extent that even theircontinuous polluting of the environment is condoned, and rarelypunished. In the process, they exploit the developing and under-developed countries by locking them into un-equal and long-termcontracts detract detrimental to the interest of these nations. Thisis also regarded as the latest and crude form of neo-colonialism.
The National REDD Forest and Climate Change Cell under the Ministry ofForest and Soil Conservation (MFSC), is working on different componentsof a Readiness Plan Proposal (RPP) to facilitate REDD implementation once
47
the mechanism takes effect. Although there is also a representation ofindigenous peoples along with the representations from the donor agencies,non government organizations and government organizations, the workshopis always designed through a top-down approach. Unless the ever practiceddesign is altered and extend the space for the adequate involvement of theindigenous groups in the design and implementation process, indigenous rightswill not be protected. In such a case, such approach may sow the seed ofconflict in the mind of indigenous peoples once they find themselves with thegreat risk of sustaining their livelihoods. Therefore, concerning the reason ofconflict in the past 10 years in Nepal, the Government of Nepal should nowrealize the historical blunder for suppressing the indigenous knowledge,language and culture in the name of unification of the nation (Awasthi 2004).Thus respect the rights and ensure their full participation in the decision makingbodies that would severely impact on their lives remain only in papers.
Although Nepal has already signed for United Nation Declaration on the Rightsof the Indigenous Peoples (UNDRIP) and ratified ILO Convention 169 in2007, the fate of indigenous peoples for securing their traditional land,resources and their free and prior consent for developing any national policiesand programs is still not in practice. This is clearly in violation of the spirit ofILO 169 and UNDRIP. Tauli-Corpuz ( 2009) presents the high risks of REDD/REDD + for indigenous peoples in the governance that would exclude theindigenous peoples from decision making process due to highly centralized,top-down management of forests… corruption and embezzlement ofinternational funds by national elites (p. 74-75). Therefore, although REDDhas already been explicitly mentioned in the Bali Action Plan, negotiationsare bound to affect the access rights of indigenous communities to forests.Barnsley (2009: 3-4) states:
Indigenous Peoples have voiced a number of grave concerns. Firstthey were not adequately consulted in the design of the Forest CarbonPartnership Facility (FCPF). It is vital that they should be consultedin relation to any particular projects under the facility that mightaffect them, and that any such project fully take account of andrecognize any Indigenous rights that may be affected… There issome concern about the fact that it is mostly the government andthe private sector entities that have caused deforestation and it isthese same entities that are likely to now benefit from the facility.
This calls for a radical departure from the top-down decision-making system andasks for an inclusive approach to making decisions about natural resources, whichhave direct implications for the identity and livelihoods of indigenous peoples.
Chapter 5 - Indigenous peoples and REDD: Challenges and Opportunities in Nepal

Ready for REDD? Taking Stock of Experience, Opportunities and Challenges in Nepal
48
5.6 Conclusion
If REDD is designed and implemented with the support and participation ofindigenous peoples, with their rights duly recognized and respected, themechanism can make an even greater contribution to emissions reductionsand carbon sequestration. Indigenous peoples would be encouraged to continueand promote their traditional practices that can act as safeguards to ensuresustainable forest management. This will also have a direct positive result forthe livelihoods of indigenous peoples.
If the REDD mechanism is designed properly, it would help to strengthen theimplementation of international agreements to which Nepal is a party,UNDRIP, ILO 169, and existing national laws and policies on indigenouspeoples rights. This could be an opportunity to push for the development oflegislation to protect indigenous peoples’ rights to their forest and carbon inthe absence of such laws.
The REDD scheme is also a great opportunity for raising the awareness ofindigenous peoples on sustainable resource management. At the same time,this is also an opportunity for indigenous people to share their traditionalknowledge of sustainable forest management so that it can be applied to abroader setting.
However, the present, top down and highly centralized management systemmay exclude the indigenous peoples’ participation in the decision-makingprocesses. This will underscore the important role that indigenous peopleshave in providing safeguards through their traditional practices. Furthermore,not including indigenous people in the process can threaten the livelihoods ofthese communities if access to forest resources is restricted, because thelivelihoods of traditional indigenous people who are forest dwellers—likethe Chepang, Raute, Raji, Bankariya—depend on forest resources.
Blocking indigenous cultural values over the resources and compensatingthem with money from carbon trading will not work. It is imperative to restoreto them their sense of ownership over the resources for sustaining theirtraditional values, culture, skills and knowledge while developing REDDimplementation framework without which the REDD mechanism is bound tofail. If the indigenous rights over the resources are recognized and fully engagedin the development relevant policies and programs implementation, theirinvolvement would not only sustain their traditional livelihoods but also fulfillthe global goal of emissions reductions.

49
Chapter 6
Understanding Forest Degradation in Nepal
- Krishna P. Acharya11, Resham B. Dangi12 and Phil Shearman13
Abstract
Forests provide a wide range of provisioning, regulating, cultural and othersupporting services for human well being. These are collectively known asecosystem services. The sustainability of forest ecosystem depends onsustained management, efficient utilization and effective protection measuresagainst deforestation and degradation. Current global discussions on forestdegradation have been focused on reduction of emissions from sources andremoval enhancement from sinks, i.e. carbon services. In Nepal, the role ofother environmental services–like water harvesting, soil conservation, andbiodiversity conservation—are also equally important for sustaining rurallivelihoods and maintaining environmental conditions. For these reasons, itis imperative to develop a common understanding about forest degradationamong forestry professionals, policy makers, and politicians. This will behelpful in developing appropriate public policies to address the forestdegradation problem. This paper aims to review past forest resourceassessment methodologies and their findings on forest degradation. Finallythe paper concludes by comparing potential methods for assessing forestdegradation in Nepal.
The need for accurate differentiation of the determinants of forest qualityhas been recognized since the first forest resources assessments wereconducted in the early 1960s. All subsequent forest resource assessmentshave identified criteria and indicators for investigating forest degradation.But many of these criteria have been different, resulting in the surveys beinglargely incompatible. Forest degradation has been generally understood asa reduction in the production capacity of commercial timber volume. Changesin tree canopy cover were used as a key criterion in these assessments. This
11 Ministry of Forests and Soil Conservation, Nepal.12 Ministry of Forests and Soil Conservation, Nepal.13 University of Papua New Guinea, Papua New Guinea.

Ready for REDD? Taking Stock of Experience, Opportunities and Challenges in Nepal
50
was assessed through the measurement of canopy closure, number of treesper unit area, growing stock, regeneration capacity, stand maturity, lopping,species dominancy, grazing, and soil surface erosion. The assessment toolsincluded field surveys, satellite images, aerial photography, ground checksand/or a combination of these methodologies.
These approaches neither recognized ongoing degradation within the canopyof ‘high stocking’ forests, nor the degree of understory degradation. Inaddition, tradeoffs with other kinds of ecosystem services were not considered.This paper argues that the assessment of forest degradation should be basedon the resultant outcomes of all kinds of forest services rather than theaccounting of individual services. The use of high resolution satellite imagery,combined with field surveys is a suitable approach for such assessments.Finally, the paper argues that forest services should be understoodcomprehensively to prevent the emergence of new drivers of degradation.
6.1 Introduction
Forests are an integral part of the farming system in Nepal. Farmers requireaccess to forest products such as leafy biomass for fodder and animal bedding,fuelwood for energy, and timber for building and agricultural implements(Mahat 1987; Gilmour and Fisher 1991; Malla 2000). In the high altitudeJumla area, it was estimated that maintaining one hectare (ha) of paddy landrequires up to 50 ha of forest and grazing land (Whitemand 1980). Similarly,in the middle hills, Wyatt-Smith estimated that 3.5 ha of forest are requiredto maintaining one ha of agricultural land (Wyatt-Smith, 1982). In 2006-07,fuelwood derived from forests constituted 84% of the total Nepalese energyconsumption (WECS 2007). Similarly, about 42 percent of the fodderrequirement for livestock production is derived from forests (WECS 2007;Pandey 1982). In addition, a number of forest products such as high valuemedicinal and aromatic plants are facing excessive and unsustainable harvestpressure and degradation (MoEST 2008). The forestry sector contributes 9.5%of the national gross domestic and about 27.5% when indirect services areincluded. Of concern is the fact that over 28 percent of the country’s forestsare estimated to be in degraded condition (DFRS 2008; MoEST 2008).
The Ministry of Forests and Soil Conservation and its departments haveundertaken several forest resource assessments since the 1960s. The scopeof these resource assessments has ranged from national level studies to site-

51
specific community-level research. These inventories have differed in theirobjectives and methodology. There are two key areas that determine whetherdifferent forest inventories or resource assessments can be compared withone another for the purposes of measuring forest change over time. Firstly,the processes that cause deforestation and degradation, such as logging,clearance by smallholders or slash and burn agriculturalists, and harvestingof fuelwood and non-timber forest products, are not detectable in coarse ormoderate resolution imagery, and they occur heterogeneously across thelandscape (Tucker and Townshend 2000, Asner et al. 2005, Grainger 2008).An area of forest that has had the edges encroached on by agriculture, or thathas been hollowed out by logging can appear to be intact forest in moderateor coarse resolution imagery, when in fact substantial change has occurred.A high resolution spatially accurate boundary between what is forest andwhat is not forest is essential for detecting such incremental or small scaleforest change. The spatially heterogeneous nature of forest change is alsonot captured well by mapping the boundary between forest and non-forestusing only a sample of imagery covering the area being mapped (Tucker andTownshend 2000, Grainger 2008). Adequately and accurately measuringdeforestation and degradation requires that the forest boundary in all forestassessments being compared be mapped using wall-to-wall, high resolutionimagery or aerial photography (Tucker and Townshend 2000, Grainger 2008).
The second key determinant of whether different forest assessments orinventories can be compared to measure deforestation and forest degradationare the definitions of ‘forest’, ‘deforestation’ and ‘degradation’ used by eachassessment. Some inventories define ‘forest’ as “closed canopy”; others define‘forest’ using a threshold of canopy cover. The FAO (2005) defines forest aspossessing at least 10% to 30% canopy cover. However, under the MarrakeshAccords countries have the ability to constitute these definitions to suitetheir specific forest types and conditions. Nonetheless, accurately measuringdeforestation and degradation requires the comparison of forest assessmentsthat use the same definition of forest. Similarly, forest degradation may bedefined in several different ways, including changes in canopy cover, loss ofbiomass, and loss of biodiversity. Measurement of forest degradation alsorequires a consistent definition of what is meant by degradation across thedifferent inventories or the forest assessments being compared.
This paper reviews the various forest inventories that have been conductedin Nepal. In addition, two economic studies in Nepal were evaluated. Thispaper aims to discuss the major findings of different methodologies that havebeen used, and to offer an approach that could potentially be utilised for
Chapter 6 - Understanding Forest Degradation in Nepal
Ready for REDD? Taking Stock of Experience, Opportunities and Challenges in Nepal
52
future assessments of forest degradation. It also critically assesses to whatdegree each inventory or assessment can be compared with one another tomeasure deforestation and degradation in Nepal, with respect to the resolution(high vs. moderate vs. low), coverage of the mapping (wall-to-wall vs.sampling), forest definition, and definition of degradation.
6.2 Datasets
This section presents a brief summary of the 5 forest resource assessments,and two economic studies of forest resources in Nepal.
1. Forest Resources Survey Office (FRSO), 1963/64. The forest resourcesurvey office conducted the first forest inventory during the period of1963-67 using 1953-58 (Indian photography) and 1963-64 aerialphotography. It used visual interpretation of aerial photographs using asampling strategy, and mapping combined with some field inventory. Theland categories include forest, cropland, grassland, urban areas, water,badly eroded land and barren land. The forest land was subdivided intocommercial and non-commercial forest. The inventory concentrated onlyon assessing the extent of existing forest area, and growing stock/ha upto 10 cm top diameter. It did not cover high altitude forest areas.
2. Land Resource Mapping Project (LRMP), 1978/79. The LRMP wasjointly implemented by the Government of Nepal and Kenting EarthSciences Limited Canada with financial support from the Government ofCanada. The objectives were to develop appropriate forest land use mapsbased on forest types, composition, and structure and land degradationstatus. The project was implemented between 1977 to 1984. The forestresource assessment was made through the combined use of aerialphotographs (1977-79), extensive ground truthing, land surveys andtopographic maps. This assessment used wall-to-wall coverage in bothhigh- and low-altitude forests. The study mapped forests and scrubsseparately and within their forest classification, four density classes weredelineated (0-10%; 10-40%; 40-70%; 70-100%). Additionally, each forestzone was defined according to the dominant forest type (coniferous,hardwood, or mixed) and the presence of various dominant species. Theresolution of the aerial pictures was approximately 1:12,000 allowingthe creation of landcover maps at both 1:25,000 and 1:50,000 scales.These landcover maps remain the only national, wall-to-wall assessment
53
of Nepal’s forests, and could be used as a baseline against which changein forest cover and degradation can be measured. It also holds the potentialfor creating a provisional biomass surface record for the country.
The LRMP was definitive about the limitations of comparing its resultswith that of the 1964 work done by the FRSO: “Different boundaries andclassifications do not allow this study to be compared with the ForestResources Survey Data based on the 1964-1965 aerial photography”.
3. Master Plan for the Forestry Sector (MPFS), 1989. The Master Planfor the Forestry Sector (MPFS) was generated by the Ministry of Forestsand Soil Conservation. The data were essentially based on LRMPinformation and forest inventory data from the Forest Survey and ResearchOffice. The aim was to update resource information changes that occurredduring the intervening period of LRMP, but it was essentially based onLRMP data.
4. National Forest Inventory (NFI), 1994. The National Forest Inventory(NFI) was started in the early 1990s and completed in 1998 with a baseyear of 1994. The program was implemented by the DFRS with supportfrom the Government of Finland. The NFI used a combination of satelliteimage analysis of Landsat imagery, aerial photographs and fieldmeasurements in four different surveys, each using different techniques.The satellite imagery was of high resolution, but only covered part of theTerai region. In the Siwaliks and other lowland areas, District Inventoriesthat employed wall-to-wall delineation of forest cover from aerial photoswere employed. The majority of the country, termed the ‘Hilly Area’ wassampled using aerial photography collected in 1989-1992. Thisphotography was coarser in resolution than that used by the LRMP andMPFS mapping. An examination of the scale of mapping suggests aresolution of about 1:50,000. Coarser survey measurements were usedin hill forests compared to that used in flatter terrain. The point samplingof these photos was used to derive forest area statistics over the hilly areathrough extrapolation.
The definition of “Forest” used in the NFI entailed a crown cover of lessthan 10% and an area of less than 1 hectare. It also included temporarilycut areas that ‘will be replanted’. Their definition of ‘shrub’ (not scrub)was similar to forest ‘except well defined stems cannot be found’. Whatis a well defined stem? This was perhaps the ‘achillies heel’ of the hills
Chapter 6 - Understanding Forest Degradation in Nepal

Ready for REDD? Taking Stock of Experience, Opportunities and Challenges in Nepal
54
inventory. Put simply, the visibility of stems in 1:12,000 photos issubstantially better than in 1:50,000 photos. Vegetation classified by theLRMP as low canopy-over forest, was more likely to be classified asshrub in the DFRS 1999 work, simply because of the scale issue. Theother main issue with the classification of vegetation in the DRFS (1999)assessment into two classes is that ‘forest’ is the same (statistically)whether it has a 100% crown cover or an 11% crown cover. Clearly, froma biomass perspective, forests need to be categorized with a greater degreeof accuracy.
The DFRS (1999) stated, “Comparison of the results of this inventory toones made previously is difficult because the definitions used and theadministrative boundaries differ. However, the only previous inventorythat is somewhat compatible is that from the 1970s as this did samplingover the whole country”. This is a doubtful statement. The LRMP usedwall-to-wall classification; the DRFS (1999) was a pastiche of differentsurvey types from different dates, but predominantly was a low-resolutionsampling exercise. They cannot really be compared. But of course theyhave been due to the lack of alternative data.
5. Forest Cover Change Analysis of the Terai Districts (DoF), 2005. Thestudy presents the extent of forest cover and annual rate of change in 20Terai districts. It was commissioned by the Department of Forests. Theforest cover change was estimated by analysing satellite images fromdifferent time periods, supported by ground verification. Imageinterpretation and classification was undertaken at a high resolution and‘wall-to-wall’. The major drawbacks were in the definitions of the classesthat were used themselves. Specifically, the “Forest” class used the ‘FAOdefinition’ of >10% crown cover. Considering that intact forest in thisregion would have a crown cover of around 70%, this would have over-estimated the amount of forest within the region. However, it seems thatthe training areas used in the supervised classification procedure wereactually skewed towards higher coverage areas, so this may not havebeen a major source of error. Of greater concern was the definition ofdegraded forest as “forest land with less than 10% cover” This meantthat intact forest could be transferred to scrub, while still being classifiedas forest.
The key problem was in the reporting of these data, there was an emphasison the very low rate of ‘deforestation’ of only 0.08% per annum. In fact,

55
when degradation was included (as most of it should have been recordedas deforestation), the rate of change was closer to 1.3% per annum. Itprobably needs to be accepted that these degraded forests are likely to beon a one-way trajectory to being deforested. Degradation is commonlythe first step in deforestation. This issue is even more important underthe new emphasis on the carbon content of these forests.
6. Economic Valuation of Ecological Goods and Services (ESE), 2005.The study was commissioned by the Ministry of Forests and SoilConservation, Government of Nepal. The study estimated the value ofgoods and services of forest ecosystems representing different ecologicalzones and management regimes. However, the study did not cover all theecological regions.
7. Contribution of Forestry Sector to Gross Domestic Product in Nepal(GDP), 2008.The DFRS conducted this study to estimate the actualcontribution of the forestry sector to national GDP. Both the use and non-use values were taken into consideration in estimating the contribution.The use values include consumptive goods like timber, fuelwood, grass/fodder/bedding materials, NTFPs, sand and boulders. Similarly, the non-use values included recreation, eco-tourism, soil conservation and greencarbon sequestration.
A summary of major resource assessment studies and their linkages withthematic elements of sustainable forest management (SFM) is presented inthe Table 6.1. The information reveals that not all elements of SFM werecovered in these measurements. The table shows that resource assessmentswere focused on the investigation of the extent of forest area and the estimationof timber volume. Recently, two economic studies on the valuation of forestservices have added carbon, biodiversity and protective function of the forestsin their assessments. The health of forests and their vitality has yet to beconsidered in any assessment.
Chapter 6 - Understanding Forest Degradation in Nepal

Ready for REDD? Taking Stock of Experience, Opportunities and Challenges in Nepal
56
No. Study Year Responsible
Organisation
SFM
thematic
element
1 Forest Resources Survey 1974 FRSO(DFRS) 1, 5
2 Land Resource Mapping Project 1978/79 LRMP/WECS 1, 5
3 Mater Plan for the Forestry Sector 1986 MoFSC/DFRS 1, 5, 7
4 National Forest Inventory 1994 DFRS 1, 5
5Forest Cover Change Analysis of the Terai Districts
2005 DoF 1
6Economic Valuation of Ecological Goods and Services
2005 MoFSC 2, 4,5, 6, 7
7Contribution of Forestry Sector to Gross Domestic Product in Nepal
2008 DFRS 2, 4, 5, 6, 7
6.3 Methodology
Assessment and tools
It is commonly agreed that measuring forest degradation is substantially morecomplex and difficult than measuring deforestation (Panta et al 2008; Lambin1999; Souza et al 2003). Table 6.2 summarises the criteria used in definingforest degradation and the methods used for the Nepalese assessments. Thisshows that all previous resource assessments have incorporated measurementsin the parameters of forest quality – however the tree canopy stocking levelwas found to be the main criterion used in most assessments. Hence, commonacceptance on forest degradation in these assessments is the reduction inproduction capacity of timber volume. The stocking level was linked withforest productivity. Proxy measurements used include canopy closure, numberof mature trees, number of preferred trees density, cut stump, growing stock,regeneration capacity, stand maturity, lopping, species composition, grazing,and soil surface erosion.
Note: Thematic elements of sustainable forest management are: 1. Extent of forest resources;2. Contribution to the Carbon cycle, forests and climate change; 3. Forest health and vitality;4. Biological diversity; 5. Productive functions of forests; 6. Protective functions of forests;and 7. Socio-economic functions of forests. (Source FAO 2009)
Table 6.1 Strategic forest assessment in Nepal and linkages with SFM

57
Stu
dy
Deg
rad
ati
on
crit
eria
Ind
ica
tors
Met
ho
ds
Pro
ced
ure
1.
FR
SO
Sto
ckin
gcl
ass
(Cro
wn
cove
r<
10
%as
ano
nfo
rest
area
)an
dd
ensi
tycl
ass)
Scr
uban
dsh
rub
Enc
roac
hed
fore
st
•C
row
ncl
osu
rean
dn
um
ber
of
rep
rod
ucti
on
size
tree
s/ha
(wel
lst
ock
ed-
>7
0%
and
abo
ve7
99
rep
rod
ucti
on
size
tree
/acr
e,M
ediu
m4
0-6
9%
or
40
0-6
99
rep
rod
ucti
on
size
tree
/acr
e;1
0-3
9%
or
10
0-3
99re
pro
duc
tio
nsi
zetr
ee/a
cre)
•L
and
sw
ith
un
mer
chan
tab
letr
eean
dsh
rub
spec
ies
gro
win
gin
bus
h-l
ike
clu
mp
s.
•H
eav
yan
dre
pea
ted
fuel
wo
od
cutt
ing
s
•L
and
s1
0%
or
mo
reco
vere
db
ytr
eecr
ow
nan
dco
ntai
nin
gco
mm
erci
alti
mb
ers
but
curr
entl
yb
eing
cult
ivat
ed,
unl
ikel
yto
rem
ain
asfo
rest
s
•N
ole
giti
mat
eo
wne
rshi
p
•M
eans
esti
mat
or
•V
isua
lin
terp
reta
tio
no
fae
rial
pho
togr
aphs
•1
:12
,00
0to
1:6
0,0
00
aeri
alp
hoto
grap
hs
•D
ot
coun
ting
•A
rea
rect
ific
atio
nan
dad
just
men
t
•F
ield
inve
nto
ryin
com
mer
cial
fore
st
•1
”=1
mil
ela
ndus
em
app
rep
ared
usin
gae
rial
pho
togr
aph
s,
•P
hys
iogr
aphi
cre
gio
nsd
ivid
ed
•F
ore
st,
Cro
pla
nd,
Gra
ss,
Urb
an,
Wat
er,B
adly
ero
ded
and
Bar
ren
•F
ore
stsu
bd
ivid
edin
toco
mm
erci
al/n
on
com
mer
cial
fore
st
•A
rea
rect
ific
atio
n
•F
ore
stm
app
ing
3”=
1m
ile
Fo
rest
inven
tory
for
vo
lum
ean
d
gro
wth
info
rmat
ion
•S
yste
mat
icgr
ido
f3
.2k
mx
16
.1k
m
•C
lust
ero
f5
,8
00
m2
rect
angu
lar
plo
t
•S
tum
ps
reco
rded
wit
hsp
ecie
s&
size
•L
oca
tio
no
fm
easu
red
tree
sm
app
ed
•5
circ
ular
sub
-plo
tso
f5
.27
ftra
diu
sus
edto
reco
rdre
pro
duc
tio
nan
dd
om
inan
tcr
ow
nco
ver.
•C
oni
fer
gro
wth
esti
mat
edb
yb
ori
ngs
2.
LR
MP
Sta
ndst
ock
ing
So
ilsu
rfac
eer
osi
on
•C
row
nd
ensi
tyis
%o
fgr
ou
ndar
eaco
vere
db
ytr
eecr
ow
ns
asvi
ewed
on
the
pho
togr
aph
or
fro
mai
r(C
row
nd
ensi
ty<
10
%as
non
-fo
rest
,cr
ow
nco
ver
<4
0%
•V
isua
lin
terp
reta
tio
no
fae
rial
pho
togr
aphs
(bla
ckan
dw
hite
•L
and
util
isat
ion
clas
sifi
cati
on
in4
phy
sio
grap
hic
regi
on
s
•A
eria
lan
dgr
ou
ndre
conn
aiss
ance
•F
ore
stre
conn
aiss
ance
,gr
ou
ndch
eck
•F
ore
st,
cult
ivat
ed,
gra
ssla
nds,
shru
b
Tab
le 6
.2 R
evie
w o
f met
hods
use
d in
fore
st a
sses
smen
t st
udie
s
Chapter 6 - Understanding Forest Degradation in Nepal
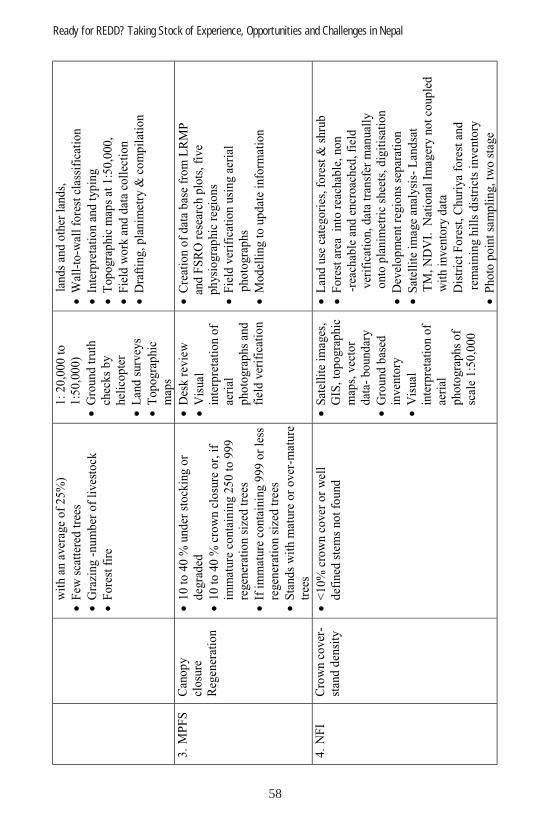
Ready for REDD? Taking Stock of Experience, Opportunities and Challenges in Nepal
58
wit
han
aver
age
of
25
%)
•F
ewsc
atte
red
tree
s
•G
razi
ng
-nu
mb
ero
fli
ves
tock
•F
ore
stfi
re
1:
20
,00
0to
1:5
0,0
00
)
•G
round
truth
chec
ks
by
hel
ico
pte
r
•L
and
surv
eys
•T
op
ogra
phic
map
s
land
san
do
ther
land
s,
•W
all-
to-w
all
fore
stcl
assi
fica
tio
n
•In
terp
reta
tio
nan
dty
pin
g
•T
op
ogra
phic
map
sat
1:5
0,0
00,
•F
ield
wo
rkan
dd
ata
coll
ecti
on
•D
raft
ing,
pla
nim
etry
&co
mp
ilat
ion
3.
MP
FS
Can
op
ycl
osu
reR
egen
erat
ion
•1
0to
40
%und
erst
ock
ing
or
deg
rad
ed
•1
0to
40
%cr
ow
ncl
osu
reo
r,if
imm
ature
conta
inin
g2
50
to99
9re
gen
erat
ion
size
dtr
ees
•If
imm
ature
conta
inin
g9
99
or
less
regen
erat
ion
size
dtr
ees
•S
tand
sw
ith
mat
ure
or
over
- mat
ure
tree
s
•D
esk
revie
w
•V
isual
inte
rpre
tati
on
of
aeri
alp
ho
togra
phs
and
fiel
dver
ific
atio
n
•C
reat
ion
of
dat
ab
ase
fro
mL
RM
Pan
dF
SR
Ore
sear
chp
lots
,fi
ve
ph
ysi
ogra
phic
regio
ns
•F
ield
ver
ific
atio
nusi
ng
aeri
alp
ho
togra
phs
•M
od
elli
ng
toup
dat
ein
form
atio
n
4.
NF
IC
row
nco
ver
-st
and
den
sity
•<
10
%cr
ow
nco
ver
or
wel
ld
efin
edst
ems
no
tfo
und
•S
atel
lite
imag
es,
GIS
,to
po
gra
phic
map
s,vec
tor
dat
a-b
ound
ary
•G
round
bas
edin
ven
tory
•V
isual
inte
rpre
tati
on
of
aeri
alp
ho
togra
phs
of
scal
e1
:50
,000
•L
and
use
cate
go
ries
,fo
rest
&sh
rub
•F
ore
star
eain
tore
achab
le,
no
n-r
each
able
and
encr
oac
hed
,fi
eld
ver
ific
atio
n,
dat
atr
ansf
erm
anual
lyo
nto
pla
nim
etri
csh
eets
,d
igit
isat
ion
•D
evel
op
men
tre
gio
ns
sep
arat
ion
•S
atel
lite
imag
ean
alysi
s-L
and
sat
TM
,N
DV
I.N
atio
nal
Imag
ery
no
tco
up
led
wit
hin
ven
tory
dat
a
Dis
tric
tF
ore
st,
Ch
uri
ya
fore
stan
d
rem
ainin
ghil
lsd
istr
icts
inven
tory
•P
ho
top
oin
tsa
mp
lin
g,
two
stag
e

59
clus
ter
des
igni
ng,
4x4
km
,m
anua
ltr
ansf
er,
ster
eosc
op
efo
rla
nd
use
5.
Do
FC
row
nco
ver
tree
sto
ckin
g
•D
egra
ded
fore
stm
eans
spar
sely
dis
trib
uted
tree
so
rfo
rest
land
wit
h<
10
%cr
ow
nco
ver
incl
udin
gsh
rub
.
•O
nly
cond
ucte
din
Ter
ai
•G
IS,
Sat
elli
teim
ages
anal
ysis
and
gro
und
veri
fica
tio
n
•S
atel
lite
imag
ean
alys
isan
dfi
eld
veri
fica
tio
n
•L
and
sat
TM
19
90/9
1an
d2
000
/01
•D
istr
icts
leve
lo
utp
uts
6.
ES
ES
tand
den
sity
Use
valu
eo
fec
osy
stem
serv
ices
•<
10
%cr
ow
nco
ver
asd
egra
ded
fore
sto
rsh
rub
land
•F
ore
stin
vent
ory
•Q
uest
ion
nair
es
•M
arke
tp
rice
•M
arke
tp
rice
of
sub
stit
utes
•B
enef
its
tran
sfer
•T
ota
lne
tst
ock
•T
erai
,siw
alik
san
dm
idd
lehi
lls
regi
ons
in1
2d
istr
icts
cove
ring
Sal
,T
erai
hard
wo
od
,P
ine,
Sub
-tem
per
ate
fore
stan
dsh
rub
land
.
•C
om
mu
nity
fore
sts,
pro
tect
edar
easy
stem
and
gove
rnm
ent
man
aged
regi
mes
surv
eyed
7.
GD
PS
tand
den
sity
•<
10
%cr
ow
nco
ver
and
shru
bas
deg
rad
edfo
rest
•G
roun
db
ased
fore
stin
vent
ory
•Q
uest
ion
nair
e
•E
cono
mic
valu
atio
n
•M
arke
tp
rice
•M
arke
tp
rice
of
sub
stit
utes
•B
enef
its
tran
sfer
•T
ota
lne
tst
ock
•H
igh-
Hil
ls,
Mid
-Hil
ls&
Ter
aire
gio
ns
•S
al,
Ter
aiM
ixed
Har
dw
oo
d,
Kha
ir/
Sis
soo
,L
ow
erS
lop
eM
ixed
Har
dw
oo
d,
Chi
rp
ine,
Up
per
Slo
pe
Mix
edH
ard
wo
od
,O
ak/
Cas
tano
psi
san
dO
ther
sfo
rest
typ
es,
•M
anag
emen
tre
gim
es–
Lea
seho
ld,
Go
vern
men
tm
anag
ed,
Rel
igio
us,
Co
mm
uni
ty&
pro
tect
edar
eas.
Chapter 6 - Understanding Forest Degradation in Nepal

Ready for REDD? Taking Stock of Experience, Opportunities and Challenges in Nepal
60
Forest Shrub Forest and Shrub
total Study Year
Area (1.000 ha)
% Area (1,000 ha)
% Area (1,000 ha)
%
FSRO 1964 6402 46 - - 6402 46
LRMP 1978-9 5616.8 38 689 5 6285 43
MPFS 1985-6 5424 37 706 5 6210 42
NFI 1994 4268.8 29 1560 11 5828 40
6.4 Results
The FRSO survey recognised forest quality differentiation primarily basedon stand size, density classes, crown closure, and merchantable volume.However, there was no clear definition and assessment of forest degradation.Degradation was characterised by fewer number of trees, lopped trees,unwanted/non-commercial tree species, heavy grazing pressure, unpalatablespecies, and bushy species. However, it did identify encroached forests as akind of degraded forest. The LRMP forest assessment is the only one of the5 resource assessments examined—excluding the MPFS analysis, which wasderived from the LRMP assessment—to be based on wall-to-wall highresolution mapping of the national forest. All five assessments used a definitionof >10% canopy cover to define forest and <10% canopy cover to defineeither ‘shrubland’ or ‘degraded forest’. The NFI assessment is the only onenot to distinguish between different forest classes according to canopy density.The FRSO, LRMP, and MPFS assessments delineated multiple forest classesbetween 10% and 100% canopy closure.
Of the five forest assessments conducted in Nepal, only two cover all of theforest area, the LRMP from 1978/9 and the NFI from 1994, although theMPFS can be compared to the LRMP from which it was derived. However,the LRMP assessment was a wall-to-wall and high resolution assessment,whilst the NFI used mapping based on a sample of imagery and a muchcoarser survey technique to determine forest and shrub cover in the majorityof the country. Table 3 highlights the extent of forest and shrub categoriesreported from the different studies. Further details are presented in Annex 1.
Tables 6.3 and 6.4 suggest that the total shrub and forest area have not changedmuch in the last few decades, although the forest cover has been degrading.Table 3 shows that, initially, shrub was not included as a separate land usecategory, but since LRMP it is an important land use category.
Table 6.3 Extent of forest and shrub land cover in Nepal

61
Shrub land Study Year
Area 000 ha %
Forest degradation % per year (1978/79 to 1994)
LRMP 1978/79 689 4.7 5.57
NFI 1994 1560 10.6
Table 6.4 Estimation of forest degradation rate in terms of increase in shrub land
A comparison of the LRMP with the MPFS analysis shows a small increasein shrub cover (~0.1%) at the expense of forest cover over 6-8 years. However,a comparison of NFI with LRMP appears to suggest that the area under shrubland increased by 126 percent from 1978/79 to 1994, or on average 5.57%per year. At face value, a comparison between the NFI and LRMP assessmentssuggests that there was no significant change in the area of total forest andshrub land, but that the extent of shrub land more than doubled at the expenseof forest cover. However, it is unclear whether this was genuine forest changeor a product of the varying quality of the forest surveys used. To explore thishypothesis, a comparison was conducted between the area of the NFI 1994assessment where high quality (wall to wall) surveys were conducted (largelythe Terai) with the areas where the NFI 1994 data detected big increases inforest to shrub conversion (see Figure 6.1 below).
This comparison suggests that in those development regions which had greater‘wall-to-wall’ coverage and less sampling the recorded forest-to-shrub coverwas less, and vice versa. Overall, 84% of the variation in forest to shrubconversion detected by comparing the NFI 1994 forest assessment with theLRMP assessment could be explained by variation in the survey quality ofthe NFI 1994 survey. Indeed it is possible that the 126% increase in shrubcover at the expense of forest cover is largely a by-product of the lowerresolution and sample-based mapping used in the hilly areas in the NFIassessment rather than a comprehensive measurement of actual degradationthrough forest to shrub conversion.
Degradation assessment methods
The methodologies used in past assessment can be grouped into AerialPhotography, Field Survey, Satellite Image and Ecosystem Service Valuation.The following table compares the strengths and weakness among these variousmethodologies and their accuracy level. The analysis reflected in the tableindicates that forest degradation assessment accuracy increases if it issupported by ground-based data.
Chapter 6 - Understanding Forest Degradation in Nepal
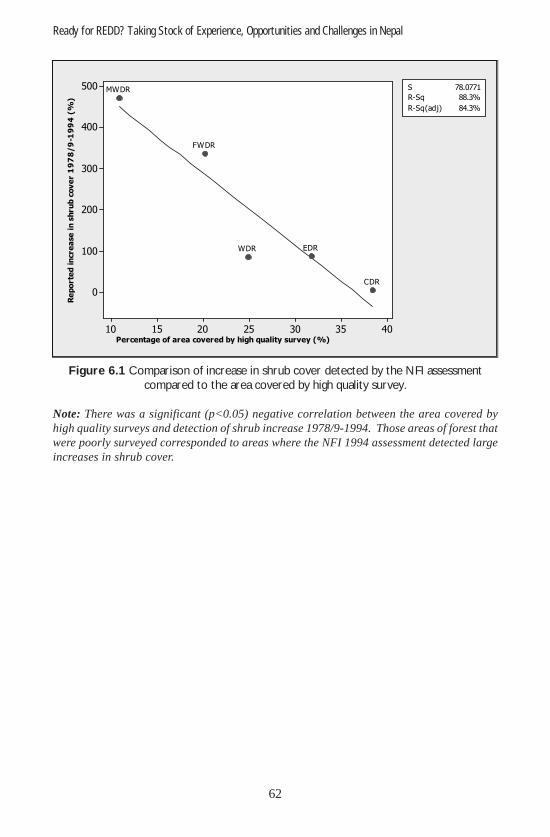
Ready for REDD? Taking Stock of Experience, Opportunities and Challenges in Nepal
62
�
40353025201510
500
400
300
200
100
0
Percentage of area covered by high quality survey (%)
Re
po
rte
din
cre
ase
insh
ru
bco
ve
r1
97
8/
9-1
99
4(%
)
S 78.0771
R-Sq 88.3%
R-Sq(adj) 84.3%
EDR
CDR
WDR
MWDR
FWDR
Figure 6.1 Comparison of increase in shrub cover detected by the NFI assessmentcompared to the area covered by high quality survey.
Note: There was a significant (p<0.05) negative correlation between the area covered byhigh quality surveys and detection of shrub increase 1978/9-1994. Those areas of forest thatwere poorly surveyed corresponded to areas where the NFI 1994 assessment detected largeincreases in shrub cover.

63
Met
ho
do
log
yA
dv
an
tag
eou
sD
isa
dv
an
tag
eou
sA
ccu
racy
Lev
elC
ost
sIm
pli
cati
on
sfo
r
Nep
al
Aer
ial
pho
togra
ph
y•
Eas
yto
und
erst
and
tolo
cal
com
mu
nit
y
•V
isib
leto
dem
onst
rate
fore
std
egra
dat
ion
such
ascr
ow
nco
ver
chan
ge,
shif
tin
gcu
ltiv
atio
n,
fore
stfr
agm
enta
tio
n
•L
on
gex
per
ience
•In
fras
truct
ure
exit
s
•R
equir
elo
win
put
on
tech
no
log
y
•D
iffi
cult
yin
mo
unta
inar
ea
•H
igh
cost
s,
•H
igh
tim
ere
quir
emen
t,
•N
earl
yab
and
oned
and
rep
lace
db
ynew
tech
no
logie
s.
•N
ola
test
aeri
alp
ho
togra
phs
avai
lab
le
•D
egra
dat
ion
elem
ents
such
asgra
zin
g,
fire
dam
age,
fore
stN
TF
Ps
and
und
erst
ory
dam
age,
encr
oac
hm
ent
isno
tco
mp
lete
lyd
etec
tab
le
Hig
hH
igh
No
rece
nt
aeri
alp
ho
togra
phs
avai
lab
le-
less
use
ful
Fie
ldsu
rvey
•D
ata
avai
lab
lefo
rco
mp
aris
on
•M
ore
accu
rate
,
•W
idel
yund
erst
oo
d,
•C
hea
pla
bo
r,b
ut
qual
ity
cont
rol
dif
ficu
lt
•C
onsi
der
able
exp
erie
nce
•S
imp
lete
chno
log
y
•C
aptu
real
lkin
ds
of
eco
syst
emse
rvic
es
•M
ore
reso
urc
es,
•L
on
gti
me
req
uir
emen
t
•D
iffi
cult
inm
ounta
inte
rrai
n
•N
ore
cent
dat
aav
aila
ble
Hig
h(S
td.
erro
rfo
rth
eto
p4
volu
me
ranged
fro
m2
.61
%to
6.6
6%
).
Med
ium
Co
nsi
der
able
exp
erie
nce
exis
ts,
lab
or
isch
eap
-st
ill
ago
od
op
tio
n,
com
mu
nit
yin
vo
lvem
ent
isav
aila
ble
,p
rop
ose
dF
INN
IDA
assi
stan
cesu
rvey
wil
lgen
erat
enew
dat
a,b
ut
this
is
Tab
le 6
.5 R
elev
ancy
of d
iffer
ent
fore
st d
egra
datio
n as
sess
men
t m
etho
dolo
gies
in N
epal
(Bas
ed o
n Ph
otog
raph
s 1:
12,0
0 to
1: 6
0,00
0 an
d La
ndsa
t T
M im
ages
exp
erie
nces
)
Chapter 6 - Understanding Forest Degradation in Nepal
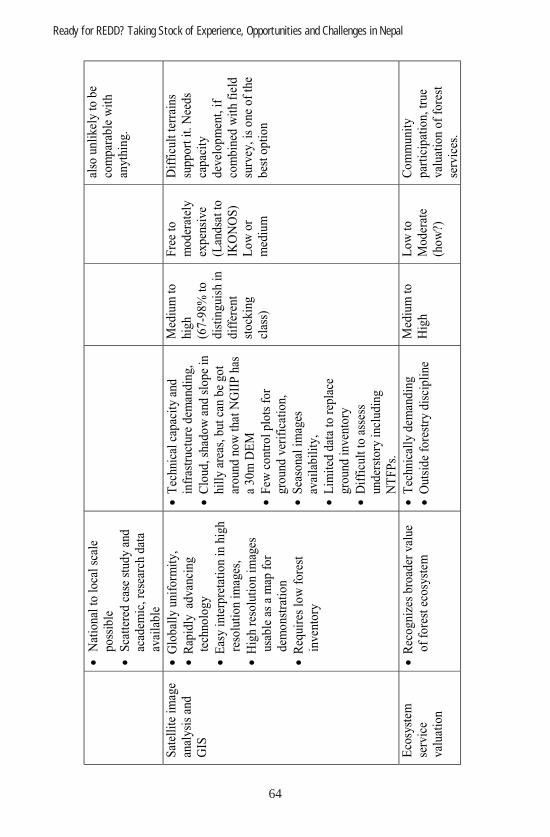
Ready for REDD? Taking Stock of Experience, Opportunities and Challenges in Nepal
64
•N
atio
nal
tolo
cal
scal
ep
oss
ible
•S
catt
ered
case
stud
yan
dac
adem
ic,
rese
arch
dat
aav
aila
ble
also
unli
kely
tob
eco
mp
arab
lew
ith
anyt
hin
g.
Sat
elli
teim
age
anal
ysis
and
GIS
•G
lob
ally
uni
form
ity,
•R
apid
lyad
vanc
ing
tech
nolo
gy
•E
asy
inte
rpre
tati
on
inhi
ghre
solu
tio
nim
ages
,
•H
igh
reso
luti
on
imag
esus
able
asa
map
for
dem
ons
trat
ion
•R
equi
res
low
fore
stin
vent
ory
•T
echn
ical
cap
acit
yan
din
fras
truc
ture
dem
and
ing,
•C
loud
,sh
ado
wan
dsl
op
ein
hill
yar
eas,
but
can
be
got
aro
und
now
that
NG
IIP
has
a3
0m
DE
M
•F
ewco
ntro
lp
lots
for
gro
und
veri
fica
tio
n,
•S
easo
nal
imag
esav
aila
bil
ity,
•L
imit
edd
ata
tore
pla
cegr
oun
din
vent
ory
•D
iffi
cult
toas
sess
und
erst
ory
incl
udin
gN
TF
Ps.
Med
ium
tohi
gh
(67
-98
%to
dis
tin
gui
shin
dif
fere
ntst
ock
ing
clas
s)
Fre
eto
mo
der
atel
yex
pen
sive
(Lan
dsa
tto
IKO
NO
S)
Lo
wo
rm
ediu
m
Dif
ficu
ltte
rrai
ns
sup
po
rtit
.N
eed
sca
pac
ity
dev
elo
pm
ent,
ifco
mb
ined
wit
hfi
eld
surv
ey,
iso
neo
fth
eb
est
op
tio
n
Eco
syst
emse
rvic
eva
luat
ion
•R
eco
gni
zes
bro
ader
valu
eo
ffo
rest
eco
syst
em•
Tec
hnic
ally
dem
and
ing
•O
utsi
de
fore
stry
dis
cip
line
Med
ium
toH
igh
Lo
wto
Mo
der
ate
(ho
w?)
Co
mm
uni
typ
arti
cip
atio
n,tr
ueva
luat
ion
of
fore
stse
rvic
es.

65
6.5 Discussion
Nepal has substantial experience in ground-based forest inventory techniques.These have generated considerable data, although of varying levels ofaccessibility. However, inventories seem to have been focused on thequantification of commercial timber volumes and were not designed for theassessment forest degradation per se. Recent economic studies are muchwider in scopethan previous forest inventories, incorporating the concept ofecosystem services.
A limitation of assessing both deforestation and degradation in Nepal is theuse of different methodologies amongst national scale forest inventories suchas the LRMP and NFI. A comparison between these two assessments suggeststhat both deforestation and degradation rates are very high. However, asFigure 1 shows, this is likely to be at least partially a by-product of low-resolution sample-based mapping, rather than actual conversion of forest toshrub cover. Thus, it seems likely that the NFI and the LRMP forestassessments are incompatible. Comparing a wall-to wall assessment (LRMP)with a sampling-based assessment, where coarser techniques were used inhigher altitude forest has substantial potential for error (Townshend and Tucker2000, Grainger 2008). Due to the coarse scale of mapping, a lot of what theNFI 1994 assessment called ‘shrub’ would probably have been called ‘forest’in the LRMP. This was likely a consequence of their attempt to use coarser-scale aerial photography from which it is difficult to distinguish between‘forest’ and ‘shrub’. This also means that the often cited deforestation ratefor Nepal likely to be an overestimation.
The most commonly used methods of forest assessment are ground-basedforest inventory, aerial photography, satellite image analysis, or somecombination of these. Crown cover has been taken as a proxy for degradation,but this is unable to address broader elements of forest degradation or thecomplexity of ecosystem change. Canopy reduction will reduce biomass butmay enhance watershed conservation, carbon sequestration or biodiversity.Table 6 shows that understory degradation is also a fundamental contributorto degradation. Crown cover assessment alone is unable to account for manyof the drivers of degradation. It is possible that more finely tuned field surveys,when combined with image analysis may be able to capture the consequencesof other drivers of degradation.
Chapter 6 - Understanding Forest Degradation in Nepal

Ready for REDD? Taking Stock of Experience, Opportunities and Challenges in Nepal
66
Note: The variable assessments of satellite imagery in regard to the detectability of these drivers
relates to the resolution of available imagery.
Detectability
(low to high, 1-3) Level and drivers
of degradation
Level of
significance
Key
degradation
element Field
survey
Aerial
Photos Images
Fuel wood removal
High Biomass, understory
3 2 1-3
Timber removal (local)
High Crown cover, biomass
3 2 1-3
Timber removal (industrial)
High Crown cover, biomass
3 3 3
Fodder, leaf litter removal
High Biomass, understory
3 2 1
Over-extraction of medicinal & other species
High Understory, biomass, biodiversity
3 1 1
Encroachment High Crown cover, habitat, biomass, understory
3 3 3
Overgrazing High Understory, soil, habitat
3 1 1-3
Development activities- Road
High Crown cover, habitat, biomass, fragmentation
3 3 3
Forest fire Medium Understory, biomass, soil, biodiversity
2 1 3
Settlements to landless
Medium Crown cover, habitat, biomass
3 2 2-3
Invasive species Low Biomass, understory, habitat, biodiversity
3 1 1-3
Rot disease Low Biomass 3 1 1-3
Table 6.6 Drivers of degradation and detectability of different methods
There is more confusion about the other studies and their definitions ofdegradation. The NFI defined shrub land as an area essentially the same asforests but where well-defined stems cannot be found. This implies the needto use the same technique of visual inspection of 1:50,000 aerial photos. TheDoF study definition of degraded forest included sparsely distributed treesor forest land with less than 10 % crown cover, including shrubs. Thesedefinitions suggest that the authors of these studies regarded shrub land as a

67
type of degraded forest. However, in some cases, these studies have useddifferent definitions of degraded forests and shrub lands, creating confusionand an inability to robustly compare datasets. The inherently fuzzy boundarybetween land cover categories needs to be removed by providing clear, simpleand consistent definition for all assessments—or alternatively acceptinggradations within land-cover categories.
There have been several other spatial and temporal assessments of forestconditions of Nepal that suggest that forest degradation is causing changesin the forest structure, composition, stocking and forest types; change of thevertical structure; or alteration of other attributes. Sharma and Suoheimo(1995) found that about 45% of trees are affected by the rot diseases inMakawanpur and Rautahat districts. Similarly, Acharya (1998) stated thatthere is degradation within existing forest stock due to repeated loggingpractices resulting in lower quality forest types. This was illustrated thoughthe conversion of Sal forest (>60 % of basal area) to Sal Terai Hardwood andfinally to Terai Hardwood.
It is generally perceived that Nepal is suffering acutely from different driversof forest degradation. Forest encroachment is a particularly serious problemin the Terai plains. There, a recent estimate showed that about 100,000 ha offorest is under encroachment with the distinct potential for further degradationthrough encroachment by illegal squatters.High altitude forests continue tobe degraded due to the presence of significantly higher livestock densitythan the estimated local carrying capacities (MoEST 2008; NBS 2002). Table6 illustrates that degradation can be the results of a single factor or, morecommonly, of a combination of multiple factors. It’s monitoring and controlis critical if we are to maintain subsistence economies, which are based onthe exploitation of natural resources as a major source of livelihoods. Thedetection of such drivers is limited with remote sensing, unless high-resolutionimagery is used, or unless it is supported by ground-based data. In summary,forest degradation may occur in following ways:
1. Reduction in biophysical attributes of forests, such as crown cover,in such a way that forest remains as forest, with over 10 % closure.
2. Reduction of crown cover from shrub land or degraded forest until itis converted to other land use. As is the case with 1 above this has animplication for many ecosystem services, including carbonsequestration.
Chapter 6 - Understanding Forest Degradation in Nepal

Ready for REDD? Taking Stock of Experience, Opportunities and Challenges in Nepal
68
3. Degradation may occur in the understory due to the removal of NTFPsand other resources, or because of fire.
There is a need for the development of a comprehensive methodology tounderstand and value forest degradation from the perspective of ecosystemservices. This need is further enhanced by the necessity for Nepal to preparefor the monitoring requirements of emerging REDD (Reducing Emissionsfrom Deforestation and Forest Degradation) opportunities. The generationof transferable and robust data will require the use and interpretation of high-resolution satellite images in combination with field surveys. It is hoped thatthe proposed field-based inventory, soon to be commenced with the assistancefrom the Government of Finland, will generate substantial spatial and temporalinformation for the country. Additionally, another wall-to-wall high resolutionforest cover map for Nepal is urgently required to overcome the limitationsof the NFI 1994 assessment. Nepal’s overall deforestation and degradationrate will be clear by new high resolution, wall-to-wall assessment.
It is also recommended that a participatory ecosystem services valuationapproach (PESVA) be considered to better understand the value of ecosystemservices. The adoption of simple techniques that can be carried out bycommunity institutions for community forest management will clearly helpour understanding of forest degradation. The PESVA requires expert inputson the development of methodologies, indices, default values, keys and simpleprocedures.
There is also a need for a clearer conceptual definition of forest degradationthat is more practical and useful for Nepal. In addition to biophysicalindicators, this definition needs to consider impacts on ecosystem services,fragmentation, local drivers of degradation, and opportunity costs. Definitionsare only practical if they can actually be measured. Likewise, research toassess understory vegetation in different conditions using images needs specialconsideration.
6.6 Conclusions
Forest degradation is a unique process affecting the provision of valuableecosystem services (MEA 2005). It is also commonly the first stage in acontinuous process leading inexorably to outright deforestation. It is the resultof many drivers operating independently or synergistically at different scales,

69
times and locations. These drivers vary across and within different countries.Due to the heterogeneity of the drivers, and the often incremental or smallscale over which they operate, wall-to-wall high resolution mapping is anecessary prerequisite for their detection. In Nepal, a detailed and morespecific understanding of these drivers is necessary to address forestdegradation. There is also a need for a comprehensive methodology tounderstand and value forest degradation from the perspective of ecosystemservices. This is especially true in a country like Nepal, where the economyis predominantly subsistence-based and where poor people and forest dwellersdepend on ecosystem services for their daily needs.
Nepal has substantial experience in the implementation of ground-based forestinventories, which have established considerable data on forest stocks. Themethods that have been used within this work have been focused on aerialphotograph interpretation, fieldwork and, to a lesser extent, satellite imageanalysis. The further development of methodologies to assess degradationwill largely be constrained by the lack of development of a compatible,measurable definition or definitions. Different organizations have useddifferent definitions and a consensus definition is needed. Similarly, a cleardistinction between shrub land and degraded forest, and methods to assessshrub lands, are urgently required. Similarly, several policy documents haveused the term ‘forest degradation’ to mean different things. This needs to beresolved. It is the view of this author that such a definition should considerthe full range of biophysical and socio-economic conditions. Nevertheless,in Nepal, a robust methodology which can capture the range of drivers causingforest degradation is necessary.
The present methodologies can be improved in two ways. Firstly, the use ofhigh-resolution satellite images supported by ground-based inventories is anecessary activity. Such work should cover major forest types, physiographicregions and management regimes. The use of satellite images and field-basedinventories is suitable to assess biomass, growing stock, basal area, speciescomposition, and forest structure and type. This approach will combine thestrengths of both methods. A second approach would be PESVA which willbe based on the concept of forest ecosystem services value (ESV). The ESVapproach should consider the use value (UV) concept instead of total economicvalue (TEV). It should also consider the direct use value (DUV) and theindirect use value (IUV) concepts, which rely more critically on forestconditions. ESV is sum of different components of ecosystem service values.Periodic monitoring and comparison of indices with a baseline could provide
Chapter 6 - Understanding Forest Degradation in Nepal
Ready for REDD? Taking Stock of Experience, Opportunities and Challenges in Nepal
70
information about the extent of forest degradation or enhancement. PESVAneeds additional research to create default values using available informationand expert consultation. An assessment methodology that can be applied atthe community level where communities are managing forests is essential. Italso requires developing simple formats, guidelines and procedures.
Improvement in our understanding of forest degradation is required forcapacity development, commitments at the political and bureaucratic level,and development of legal measures to underpin forest monitoring. This willrequire the coordination of agencies using remote-sensing data, as well as animproved understanding of the diverse nature of local drivers of degradationand the measurement of opportunity costs. There is also a strong need toestablish an effective national degradation monitoring system.

71
An
ne
x:
Fin
din
gs
of
pa
st
ass
es
sm
en
tsin
Ne
pa
l
Stu
dy
Key
fin
din
gs
rela
ted
tofo
rest
deg
rad
ati
on
Infe
ren
ces
FR
SO
Are
a:
45
.5%
of
land
cover
edb
yfo
rest
,o
ut
of
wh
ich
47
%is
com
mer
cial
.W
her
eas
inh
ills
58
.1%
fore
stla
nd
s,co
mm
erci
alfo
rest
area
inth
ehil
l3
4.4
%
Co
mp
osi
tio
n:
Sal
cover
s2
0.7
%,
saw
nti
mb
erst
and
s7
7%
and
23
%p
ole
/sap
ling
/reg
ener
atio
nst
and
Sto
ckin
g:
Aver
age
vo
lum
e6
3m
3/h
a.In
Hil
ls,
35
.1%
of
com
mer
cial
fore
stis
wel
lst
ock
ed,
28
.5%
med
ium
and
8.7
%is
po
orl
yst
ock
ed,
over
sto
ryp
oo
rw
ith
und
erst
ory
med
ium
7.6
,o
ver
sto
ryp
oo
rund
erst
ory
wel
lst
ock
edw
ell
sto
cked
3.3
%an
do
ver
sto
rym
ediu
mw
ith
und
erst
ory
wel
lst
ock
ed1
6.8
%
Tre
ed
istr
ibu
tio
n:
Inh
ills
,4
7%
of
tree
bel
ow
22
-inch
dia
met
ercl
ass
are
fro
mund
esir
able
spec
ies
(no
tu
sed
for
ind
ust
rial
wo
od
,d
esir
able
spec
ies
are
sal,
Asn
a,K
hai
r,C
hir
pin
e,B
lue
Pin
e,S
pru
ce,
Fir
and
Hem
lock
)
No
nco
mm
erci
al
fore
st:
Inhil
ls,
encr
oac
hm
ent:
0.0
6p
erce
nt
of
no
nco
mm
erci
alfo
rest
area
(523
6ac
re);
Scr
ub
and
shru
b:
5.2
8%
(79
720
3ac
re)
Fo
cus
was
on
tota
lm
erch
anta
ble
vo
lum
eo
fse
lect
edsp
ecie
sin
com
mer
cial
fore
star
ea
Fo
rest
encr
oac
hm
ent
was
reco
gnis
edd
ue
tofu
elw
oo
dex
trac
tio
nan
dlo
pp
ing.
LR
MP
Are
a:F
ore
star
ea5
6,1
6,8
00
ha(3
8.0
1%
),sh
rub
6,8
9,9
00
ha
(4.6
8%
),>
40
%cr
ow
nco
ver
is2
8.1
%
Sto
ckin
g:
34
%(e
xcl
ud
ing
Hig
hH
imal
)o
ffo
rest
isu
nd
erst
ock
edd
egra
ded
fore
sts;
55
%o
ffo
rest
isin
ver
yp
oo
rco
nd
itio
nin
mid
dle
mo
unta
ins;
Fo
rest
area
sar
eco
nver
tin
gin
tod
egra
ded
fore
st-s
hru
b
MP
FS
Are
a:
Fo
rest
37
.4%
,S
hru
bla
nd
san
dd
egra
ded
fore
sts:
5%
(70
6,0
00
ha)
P24
,M
PF
S
Co
mp
osi
tio
n:
59
%har
dw
oo
ds,
17
%co
nif
ers
and
24
%m
ixed
fore
sts.
Po
lere
pro
duct
ion
size
const
itute
so
nly
1%
of
vo
lum
e/ha,
wh
erea
ssm
all
tim
ber
65
.2%
and
rem
ain
ing
1/3
rdb
y
Alm
ost
60
%sh
rub
land
sar
ein
mid
dle
hil
ls.
Shru
bla
nd
sin
crea
sed
due
too
ver
cut
for
fuel
wo
od
and
Chapter 6 - Understanding Forest Degradation in Nepal
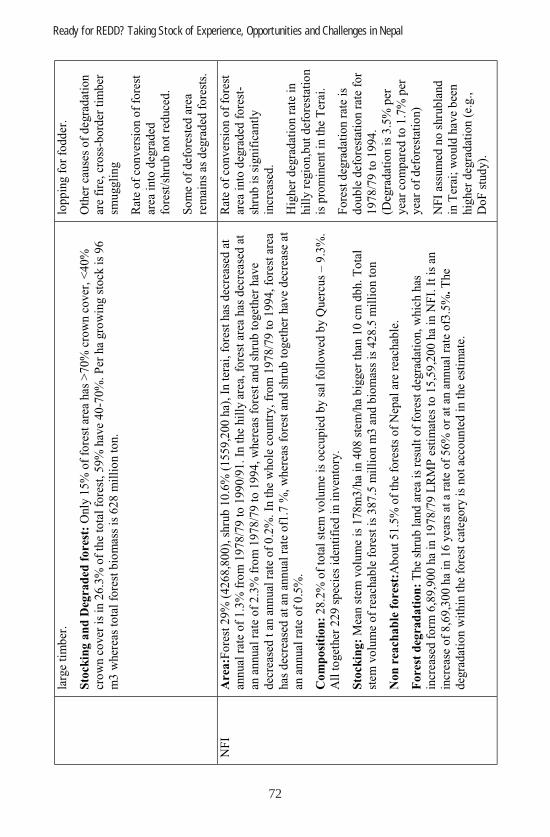
Ready for REDD? Taking Stock of Experience, Opportunities and Challenges in Nepal
72
larg
eti
mb
er.
Sto
ckin
ga
nd
Deg
rad
edfo
rest
:O
nly
15
%o
ffo
rest
area
has
>7
0%
cro
wn
cover
,<
40
%cr
ow
nco
ver
isin
26
.3%
of
the
tota
lfo
rest
,5
9%
hav
e4
0-7
0%
.P
erha
gro
win
gst
ock
is9
6m
3w
her
eas
tota
lfo
rest
bio
mas
sis
62
8m
illi
on
ton.
lop
pin
gfo
rfo
dd
er.
Oth
erca
use
so
fd
egra
dat
ion
are
fire
,cr
oss
-bo
rder
tim
ber
smu
ggli
ng
Rat
eo
fco
nver
sio
no
ffo
rest
area
into
deg
rad
edfo
rest
/shru
bno
tre
duce
d.
So
me
of
def
ore
sted
area
rem
ain
sas
deg
rad
edfo
rest
s.
NF
IA
rea
:Fo
rest
29
%(4
26
8,8
00),
shru
b1
0.6
%(1
55
9,2
00
ha)
,In
tera
i,fo
rest
has
dec
reas
edat
ann
ual
rate
of
1.3
%fr
om
19
78
/79
to19
90
/91
.In
the
hil
lyar
ea,
fore
star
eahas
dec
reas
edat
anan
nual
rate
of
2.3
%fr
om
19
78
/79
to19
94
,w
her
eas
fore
stan
dsh
rub
toget
her
hav
ed
ecre
ased
tan
ann
ual
rate
of
0.2
%.
Inth
ew
ho
leco
untr
y,
fro
m1
97
8/7
9to
199
4,
fore
star
eahas
dec
reas
edat
anan
nual
rate
of1
.7%
,w
her
eas
fore
stan
dsh
rub
toget
her
hav
ed
ecre
ase
atan
annual
rate
of
0.5
%.
Co
mp
osi
tio
n:
28
.2%
of
tota
lst
emvo
lum
eis
occ
up
ied
by
sal
foll
ow
edb
yQ
uer
cus
–9
.3%
.A
llto
get
her
22
9sp
ecie
sid
enti
fied
inin
ven
tory
.
Sto
ckin
g:
Mea
nst
emvo
lum
eis
17
8m
3/h
ain
40
8st
em/h
ab
igger
than
10
cmd
bh.
To
tal
stem
vo
lum
eo
fre
achab
lefo
rest
is3
87
.5m
illi
on
m3
and
bio
mas
sis
42
8.5
mil
lio
nto
n
No
nre
ach
ab
lefo
rest
:Ab
out
51
.5%
of
the
fore
sts
of
Nep
alar
ere
achab
le.
Fo
rest
deg
rad
ati
on
:T
he
shru
bla
nd
area
isre
sult
of
fore
std
egra
dat
ion,
whic
hhas
incr
ease
dfo
rm6
,89
,90
0ha
in1
97
8/7
9L
RM
Pes
tim
ates
to1
5,5
9,2
00
ha
inN
FI.
Itis
anin
crea
seo
f8
,69
,30
0ha
in1
6yea
rsat
ara
teo
f5
6%
or
atan
ann
ual
rate
of3
.5%
.T
he
deg
rad
atio
nw
ith
inth
efo
rest
cate
go
ryis
no
tac
coun
ted
inth
ees
tim
ate.
Rat
eo
fco
nver
sio
no
ffo
rest
area
into
deg
rad
edfo
rest
-sh
rub
issi
gn
ific
antl
yin
crea
sed
.
Hig
her
deg
rad
atio
nra
tein
hil
lyre
gio
n,b
ut
def
ore
stat
ion
isp
rom
inen
tin
the
Ter
ai.
Fo
rest
deg
rad
atio
nra
teis
do
ub
led
efo
rest
atio
nra
tefo
r1
97
8/7
9to
19
94
.(D
egra
dat
ion
is3
.5%
per
yea
rco
mp
ared
to1
.7%
per
yea
ro
fd
efo
rest
atio
n)
NF
Ias
sum
edno
shru
bla
nd
inT
erai
;w
ould
hav
eb
een
hig
her
deg
rad
atio
n(e
.g.,
Do
Fst
ud
y).

73
Do
FT
ota
lfo
rest
area
in2
0te
rai
dis
tric
tsis
11
49
49
4ha
(exc
lud
ing
pro
tect
edar
ea).
Out
of
the
tota
l,8
8%
(10
113
62
ha)
isfo
rest
and
12
%(1
38
132
)is
deg
rad
edfo
rest
.D
ecre
asin
gtr
end
inla
ndco
ver
chan
gein
Ter
aip
lain
sfr
om
19
90
/91
to2
000
/01
.
Enc
roac
hm
ent
affe
cts
fore
std
ecli
nep
rofo
und
ly.
ES
ET
hehi
ghe
stab
solu
teva
lue
per
haw
asfo
und
inth
eS
alfo
rest
(Nrs
3m
illi
on)
.
Wit
hin
the
Ter
aifo
rest
eco
syst
ems,
the
abso
lute
valu
eo
fsh
rub
land
(Nrs
0.7
6m
illi
on
isha
lfth
ato
fT
erai
Mix
edH
ard
wo
od
Fo
rest
(Nrs
1.5
mil
lio
n).
The
shru
bla
nds
have
low
erp
erha
valu
esco
mp
ared
tofo
rest
sec
osy
stem
sin
the
resp
ecte
dre
gio
n.
Pin
efo
rest
has
the
low
est
valu
esw
ith
inth
efo
rest
eco
syst
ems.
The
reis
vari
atio
nin
TU
Vp
erha
insi
xre
sear
chsi
tes.
Itis
mai
nly
due
tova
riat
ion
inex
isti
ng
sto
cko
fth
efo
rest
.
Fo
rest
eco
syst
emse
rvic
esva
ryac
cord
ing
tola
ndus
e,fo
rest
typ
e,p
hys
iogr
aphi
cre
gio
n.
Val
ues
of
all
thre
eT
erai
eco
syst
ems
are
hig
her
than
hil
lsec
osy
stem
s.
Ser
vice
sca
nb
eva
lued
by
use
valu
eo
fth
eec
osy
stem
serv
ices
.
GD
PF
ore
stry
sect
or
cont
rib
utio
nto
GD
Pin
the
pas
tw
asge
nera
lly
esti
mat
ed4
.4%
com
par
edto
9.4
5%
,w
here
asit
is2
7.5
5%
incl
udin
gin
tan
gib
leb
enef
its.
Fo
rest
cont
rib
ute
sig
nifi
cant
lyto
GN
P.
Fo
rest
eco
syst
ems
mu
stb
eva
lued
.
Chapter 6 - Understanding Forest Degradation in Nepal

Ready for REDD? Taking Stock of Experience, Opportunities and Challenges in Nepal
74

75
Chapter 7
Preparing Institutions for REDD
- Prakash Lamsal14 and Rishikesh R. Bhandary15
Abstract
Reducing emissions from deforestation and forest degradation (REDD) indeveloping countries received formal recognition and policy priority after itwas identified under the Bali Action Plan. Starting out as a proposal presentedby Papua New Guinea, Costa Rica and eight other countries, REDD has nowbeen globally recognized as a crucial component of mitigation efforts and israpidly taking shape as the UNFCCC negotiations proceed. Such a mechanismhas the potential to improve livelihoods and provide other co-benefits, likebiodiversity, while aiding in the global effort to mitigate greenhouse gases.Asemissions from deforestation and forest degradation presently make up aroundone fifth of total annual carbon dioxide emissions, any effective global mitigationeffort needs to include REDD. (Angelsen and Atmadja 2008). REDD also offersa cost effective way to mitigate greenhouse gases, while simultaneouslydelivering strong co-benefits, like aiding poverty alleviation and conservingbiodiversity. This chapter attempts to assess Nepal’s policy and institutionalarrangements in the context of climate change in general, and REDD inparticular. Existing policy and institutional gaps are briefly analyzed, alongwith the implications for the implementation of a REDD mechanism.
7.1 REDD: Global and National Context
Nepal has joined hands with its international allies to combat globaldesertification, mitigate greenhouse gases and conserve biodiversity by beinga party to the Rio Conventions and the Kyoto Protocol. Nepal ratified theUN Framework Convention on Climate Change in May 1994 paving way fora greater international role and voice in the climate change debate along withmeeting the accompanying obligations.14 Department of Forests, Ministry of Forests and Soil Conservation, Government of Nepal
E-mail: [email protected] The Fletcher School, Tufts University

Ready for REDD? Taking Stock of Experience, Opportunities and Challenges in Nepal
76
Nepal’s deforestation and forest degradation rates show that emissionreductions can be achieved in Nepal by a mechanism that addresses the driversof these processes. As Ojha et al. (2008) write, during the period 1979-1994,forest cover decreased in Nepal by 24% while the shrub area increased byaround 126%. They argue that this is indicative of high degradation rates.Furthermore, Kotru (2009) argues that the deforestation and degradation rateshave increased during the past ten years mainly because of “encroachments,conversion of farm lands and felling of trees” in the Terai. As recent data isnot available for forest related emissions, Kotru argues that the emissionshave significantly increased, resulting in an enhanced potential for REDD-related projects in the Terai.
Pokharel and Byrne (2009) have claimed that deforestation and forestdegradation are driven mainly by the “lack of property rights, lack ofinstitutional capacity and lack of appropriate institutional arrangements forsustainable forest management”. Hence, if a mechanism is able to addressthese issues it will significantly reduce deforestation, and thus can play amajor role in not only sustainable forest management, but in sustainabledevelopment as well.
The CDM process does not include avoided deforestation or carbon stockenhancements, but is limited to afforestation and reforestation (A/R) projects.However, for REDD, the international debate has shifted from only addressingdeforestation and degradation to including carbon stock enhancement as well.CFUGs therefore are able to meet the criteria of sustainable forest managementthat includes carbon stock enhancement and avoided deforestation with stronglivelihood benefits. Hence, the question is not whether Nepal’s forests havepotential for carbon financing, but to what extend and under what conditions(Ojha et al. 2008, Pokharel and Byrne 2009).
7.2 REDD to REDD+: Are CFUGs Nepal’s advantage?
The necessity to address not just deforestation and forest degradation, butcarbon stock enhancements and sustainable forest management practices hasbeen recognized. Community forests can potentially be included in theresulting “REDD+” regime. As stands, many community forest user groupsare not in a position to benefit from REDD, because their forests are notexperiencing deforestation or forest degradation. Therefore, REDD wouldhave to be expanded to REDD plus in order for them to benefit. However,REDD could benefit areas not currently under community forestry that are

77
presently facing deforestation and forest degradation such as in the Terai andinner Terai.
As per the Forest Act (1993), all forests in Nepal fall under either NationalForest land or private forests. Community forests (CFs) are government-ownedforests where the rights have been transferred as per the Operational Planagreed on between the community forest user group (CFUG) and theDepartment of Forests, through the District Forest Office. Provisions like theright to use forest products such as wood and non-wood products are more orless clear in groups’ Operational Plans. However provisions related to carbonrights and carbon revenue are not included in the plan and this will have to besorted out at the regulatory level.
Nepal’s community forests (CFs) are considered to be exemplary of bestpractices in sustainable forest management. Most of these CFs are located inthe mid-hills region. The higher altitudes possess few community forests inspite of having high forest cover, as these forests are not very accessible.Similarly, in the Terai region community forests are also limited, making uponly seven percent of the total community forest user groups (CFUGs)nationwide, due to a reluctance on the part of the forest department to handovervaluable forest lands. The Terai is also where most of Nepal’s deforestationhas taken place during the last 20 years.
Studies indicate that community forest density has increased by up to 21%per year. Nepal has a total of 1.219 million ha of community forests managedby 14,337 CFUGs with 1, 647, 700 households directly engaged in thisprocess. The average size of a community forest is 85ha. As a result, anymechanism that is able to incorporate all of the CFs and to expand to newareas, mainly in the Terai, is bound impact a substantial portion of thepopulation.
7.3 Addressing sustainable livelihoods
Forests play a major role in the livelihoods of Nepal’s rural communities.Pokharel and Byrne (2009) write that nationwide 69% of the households usefirewood and 75% of the households collect fodder. However, the level ofdependence is not the same for everyone, since those having access to privateforests and other means depend less on community forests. The poorest peopleare particularly dependent on forests for a variety of resources like timber,firewood and fodder.
Chapter 7 - Preparing Institutions for REDD

Ready for REDD? Taking Stock of Experience, Opportunities and Challenges in Nepal
78
Though community forest user groups have prospects to receive financialbenefits for maintaining and enhancing carbon stocks, any mechanism thatregulates access to ensure permanence will “disproportionately and negativelyaffect” poor people (Pokharel and Byrne 2009). This problem is compoundedby the historical and social nature of inequality and access. Therefore, anymechanism that regulates forest use must simultaneously address livelihoodconcerns and the drivers of deforestation.
Furthermore, the extent of revenue flow, under a market system, depends onthe price of REDD credits. If the price of these credits is low and theopportunity cost of other land use options or management systems is high,forest carbon revenues will not be able to avert pressures to deforest. Leitmann(in Vickers 2008) estimates that the price will be sufficiently high to beeffective in many areas where timber production is the main opportunitycost, but it is unlikely to match the economic benefits of ranching or soyacultivation in the Amazon.
7.4 Lack of policy and legal coherence
Coordination
Ministry of Environment (MOE) is the state focal agency for climate changeissues and is also the Designated National Authority (DNA) for UNFCCC.This ministry has been making decisions regarding the issuance of carboncredits as well, under the Kyoto Protocol’s Clean Development Mechanism(CDM). As REDD comes under the aegis of the forestry sector, the Ministryof Forests and Soil Conservation (MFSC) has recently established a REDD,Forestry and Climate Change Cell under its foreign aid coordination division.
The REDD Cell staff consists of experts from forestry research and extensionservices. This team works as a technical expert group to implement the processof REDD in Nepal. The MFSC has envisioned a separate division under theministry to deal with environmental issues including payment ofenvironmental services and REDD. The Multi-stakeholder National REDDWorking Group (RWG) is entrusted with the task of making principal decisionson REDD implementation, support and control of the REDD Cell. Thisworking group is made up of a wide variety of stakeholders, includingagencies, non-governmental organizations, community forestry networks,donor agencies, members of indigenous groups, and the private sector. As

79
afforestation and reforestation (A/R) activities have already been includedunder the CDM (whose DNA is the MOE), there is a strong possibility thatany REDD mechanism that rewards carbon stock enhancements will need tobe integrated with A/R activities under the CDM, thereby making it necessaryfor inter-ministerial coordination. Although the MOE and MFSC have similarobjectives, no formal institutional linkage exists between these two ministries.
The Climate Change Council, chaired by the Prime Minister, providesinstitutional space for high-level coordination as it is charged with overseeingclimate change activities in the country. As this council carries considerablepolitical weight, it could serve to fill the institutional voids to ensurecoordination amongst the line ministries and divisions.
Cross-sectoral coordination and cooperation is weak and has been very limited.Though high-level multi-stakeholder forums have been formed and strategicplans have been formulated, action at the operational level has been lacking.For example, the National Biodiversity Coordination Committee was formedunder the chairmanship of the minister of the MFSC in 2003, but it has notmet for the last two years.
National policy instruments created to address climate change are yet to besynchronized with national development priorities. In addition, there has beenweak coordination amongst the different donor agencies and internationaland national non-governmental organizations working on REDD and climatechange. Though these entities have been engaged in pilot studies, research,and awareness programs, such programs have been confined to the capitaland a few districts without much coordination with the government.
Local-level bodies, like district forestry coordination committees, have beenestablished to mobilize local action and in the spirit of decentralizedgovernance of natural resources. With renewed emphasis on local governancebeing placed as the Constituent Assembly debates over the exact nature ofthe federal structure, carbon rights and distribution of carbon benefits needto be clearly defined. Pokharel and Byrne (2009) argue that, because localbodies have been inactive due to the political conflict, tensions have not yetemerged between the center and the local bodies. As the peace process takeshold and the local bodies start to exercise their roles in forest governance,clashes with the central government seem inevitable, unless theaforementioned issues are properly addressed. The new constitution has the
Chapter 7 - Preparing Institutions for REDD

Ready for REDD? Taking Stock of Experience, Opportunities and Challenges in Nepal
80
opportunity to clearly delineate the devolution of powers. This could help toovercome existing conflicting roles of different bodies.
An example is the legal incoherence reflected in the Local Self-GovernanceAct 1999 (LSGA) and the Forest Act regarding the management of forestsand related revenues. The LSGA gives autonomy to local governments or“bodies”—especially District Development Committees and VillageDevelopment Committees—to manage natural resources including air, water,land and forests. However, these provisions are not aligned with many of thesectoral acts, including the Forest Act 1993, and thus create legal ambiguitiesbetween local governments and CFUGs. The question of ownership of forestresources or the stipulation to tax the sale of forest products (possibly includingcarbon) will need to be clarified and a benefit sharing mechanism craftedthat can function in a federal state structure.
Tenure Rights
As Staddon (2009) writes, the access rights to community forests are detailedin the operational plan of all CFUGs. One of the main advantages of thissystem is that the access rights are clearly defined. However, the Departmentof Forests grants such rights for only up to ten years. After this period, theoperational plans must be renewed. As the life cycle of a carbon financeproject will likely be longer than 10 years, this introduces a major element ofuncertainty regarding the CFUG’s ownership over the carbon resources inthe community forest once the tenure period is over.
As mentioned above, access rights are well defined, however, carbon rightsare not. The issue of carbon rights brings to the forefront the state of devolutionof rights from the center to the local bodies. Most of the forests are owned bythe government, but rights over “standing biomass” have been granted to thecommunities according to their operational plans. As these plans don’t clearlymention carbon rights, this issue must be clarified at the regulatory level.Furthermore, even within the communities, the issue of equity remains critical.Without a system that guarantees special provisions to the poor and indigenousgroups, a carbon tenure system will be incomplete.
As CFUGs already exist as formal and recognized units, using the existingframework for any emission reduction project will have many benefits. Forexample, these groups already have accounts that can be used to channel
81
funds that could be generated through a REDD mechanism (Pokharel andByrne 2009). Nonetheless, a revenue-sharing mechanism needs to be workedout to ensure that the financial benefits received address the needs of poorand indigenous groups and others who may be impacted by a REDDmechanism.
The current revenue distribution system could serve as a precedent for sharingcarbon revenue. Currently, CFUGs retain the entire revenue from the sale offorest products except for high value products. These high value productsare taxed at 15% if they are sold outside of the CF. Similarly, the governmentcould tax the proceeds that the CF gets from a carbon finance project. Theexact modalities will have to be worked out, depending on how thenegotiations play out. This is described in more detail below.
If only a REDD mechanism comes into effect, without including forestenhancement, this will not be to the direct benefit of existing communityforest user groups. As community forests have already been working on carbonstock enhancement and they have been effective in halting degradation, onlynew community forests will benefit from such a mechanism. This could createperverse incentives for existing CFUGs to degrade their forests. Without aregulatory intervention that compensates existing community forest groupsfor their role in sustainable forest management, the ultimate goal of emissionsreductions may not be achieved.
If a REDD plus mechanism is adopted, however, CFs are positioned to benefit,but still face many technical challenges, like proving additionality, which aredescribed in the next section. This demonstrates the need for an active role tobe played by the government to set a regulatory process that will ensure thatthey benefit from any global forestry related emissions reduction mechanism.What is beyond doubt is that the formal recognition of rights and tenure ofCFUGs will be a comparative advantage for Nepal. However, challengesstill remain in terms of establishing clear rules for carbon tenure.
7.5 Challenges in the global REDD architecture
In order for REDD to be an effective mechanism, it will have to satisfy anumber of technical criteria, including additionality, leakage and permanence.An exploration of these three critical areas will help to elucidate howready Nepal is, through institutional and policy processes, for a REDDmechanism.
Chapter 7 - Preparing Institutions for REDD

Ready for REDD? Taking Stock of Experience, Opportunities and Challenges in Nepal
82
Additionality
The fundamental concept of additionality is this basic question: Would theemission reductions have occurred if the activity were not implemented asan offset project? Though this definition has been extremely contentiousparticularly in CDM projects, additionality is nonetheless essential to ensureenvironmental integrity. If binding emission targets are being met with creditsgenerated from emission reductions that would have happened regardless,this undermines the mitigation goal. As a result, scholars like Karky andBanskota (2007, 2009) have expressed concern regarding the eligibility ofCFs, even under a REDD plus system.
The Department of Forests requires that the communities include sustainableforest management in their operational plans. Therefore, as sustainable forestmanagement occurs in the CFs, even in the absence of a REDD plusmechanism, CFs would not fulfill the additionality requirement. However,forest areas that have not yet been handed over to CFUGs would be morelikely to meet this criteria. Therefore, even by progressing to a REDD plusmechanism from a REDD only one, the question of additionality is notaddressed and could result in the disqualifications of many CFs.
A possible remedy is in the choice of the baseline year. Most of the CFUGswere established in the late 1980s and early 1990s. These areas did experiencesignificant degradation and deforestation before this period. A baseline yearthat is set before the establishment of the CFUGs would demonstrate thecarbon stock enhancement activities of these groups. However, the setting ofthe baseline depends partially on the outcome of international negotiations,and still does not fully address the additionality issue.
Leakage
The criterion of no leakage requires that a reduction in carbon emissions inone area does not result in increased emissions in another area. Leakagesalready occur under the existing community forest system, in which someCFUGs protect their own forests and use the adjoining government forestsfor their livelihood needs, including fuelwood collection, timber and livestockgrazing. This is primarily the result of weak enforcement mechanisms ofgovernment bodies.
Furthermore, the extent of leakage will be, in part, influenced by the scale ofthe baseline and crediting. For example, if we have a unified national-level

83
baseline and crediting system, reductions that take place in the communityforests may be canceled out and voided by the increase in emissions fromencroachments in government forests. Hence, if a national baseline andcrediting approach are used, Nepal may not receive any net credits at all.
The voluntary carbon market has provided methods for monitoring leakage.As livelihood options are a major concern for Nepal, leakage must be seen inthis light as well. Restricting land use options for local people and enforcingcontracts that limit access to resources could very well aggravate poverty.This needs to be given further attention in considerations for the design ofleakage monitoring mechanisms.
Permanence
There are two fundamental issues that determine whether the permanencecriterion can be met:
1. The period of time and extent to which communities’ forest use andtenure rights are formalized; and
2. Whether it is in the economic interest of the rural communities (i.e.whether carbon is worth more than other alternative uses of the forestland)
Regarding forest rights, CFUGs are not registered under a particular timeframe. The access right that the Department of Forests grants the user groupis however limited by the operational plan. These operational plans arerenewable every 5-10 years depending on the user group. As the user groupshave rights to operate as long as they are legally allowed to do so, permanencecan be assured with the current legal and legislative framework as long as theoperational plans are renewed on a regular basis. However, any legislation oraction that denies the rights of the community forest user group will affectthe permanence of the carbon sequestered in the forest. Furthermore, unclearaccess rights will also dampen investor confidence in such projects, especiallyin the case of the voluntary market. Conversely, any operational plan that isable to address the aforementioned drivers will significantly reducedeforestation. Such a plan will also aid in ensuring permanence.
Next, any long-term carbon finance projects that CFUGs enter into will limitother land use options. Since under a market-based carbon offset scheme, the
Chapter 7 - Preparing Institutions for REDD

Ready for REDD? Taking Stock of Experience, Opportunities and Challenges in Nepal
84
financial rewards that the CFUGs get will be contingent upon the price ofcarbon, a reduced price of carbon will increase the opportunity cost of otheroptions. Unforeseen climatic changes may also necessitate greater use of forestservices for adaptive purposes than agreed to in the contract, thereby placingforest users under undue pressure. These factors will determine whether thedrivers of deforestation and forest degradation can be checked in the long term.
Along with the issues mentioned above, we must duly recognize that Nepalis a country recovering from a decade-long conflict. Staddon (2009) writesthat ensuring permanence will be difficult when there are “areas with unclearland ownership, political instability and conflicts.” Political stability willplay a major role in determining enforceability of contracts, without whichpermanence cannot be guaranteed.
7.6 Conclusion
Forestry is a dynamic sector, which could be further affected by a rapidlyevolving mechanism that will address emissions from deforestation and forestdegradation and promote carbon stock enhancement. Policy, legal andorganizational instruments must be flexible enough to address newdevelopments that emerge from international climate negotiations. While thedevelopment and institutionalization of participatory forestry programs overthe years has been encouraging, a regulatory framework must be devised toensure the effective involvement of all relevant stakeholders (Kotru 2009).
The challenge is to develop a national framework and policies that are flexibleand compatible with those international regulations that will be worked outin subsequent negotiations. Such a framework must be firmly placed withinthe broader context of Nepal’s priorities on poverty reduction and inclusivelocal social development.
The government’s low capacity to implement its own policy, coupled with aseriously lacking inter-ministerial coordination, have left many uncertaintiesand grey areas. The exact role of different state agencies and their coordinationmust also be made clear, along with the synergies that can be realized withthe support of civil society networks. This requires an urgent need for inter-agency cooperation and institutional capacity building within the MFSC andits departments. Moreover, as negotiations are still underway, Nepal mustput forward issues and options that take into account and strive to address itsinstitutional strengths and weaknesses.
85
Chapter 8
Review of Studies on REDD in Nepal:Status, Gaps and Ways Forward
- Eak Rana16and Keshab R. Goutam17
Abstract
Nepal is in the process of preparing a national REDD strategy. Individuals,groups and organizations have embarked on various initiatives in thisregard. This paper reviews studies on REDD in the context of Nepal. Thisreview reveals that most of the studies have had difficulties estimating forestcarbon stocks, while others have tried to establish links between thesecarbon stocks and revenue generation for livelihood benefits. While somescholars have shown that a REDD scheme could significantly contribute topoverty reduction, others do not agree and suggest developing a schemethat incorporates payments for carbon enhancements through sustainableforest management instead. Though the use of internationally acceptedmethodologies to estimate carbon in different pools is promising, the applieddefault values seem inconsistent among the studies. The studies were alsoconfined to community forests, excluding three quarters of the country’sforest areas. Similarly, very few studies focus on the Terai and high mountainregions. This chapter suggests a need for further assessment ofcomplementary activities and finding ways to consolidate various REDD-related initiatives being undertaken in Nepal. It also highlights the needfor wider consultation and dialogue among government and civil societyto define an equitable payment mechanism, clarify forest and carbon tenureregimes, and address issues concerning the rights of indigenous peoplesand forest dwellers.
16 REDD Project Coordinator-ICIMOD17 Assistant Research Officer, DFRS

Ready for REDD? Taking Stock of Experience, Opportunities and Challenges in Nepal
86
8.1 Background and intent of the paper
The 13th Conference of Parties (COP) of the United Nations FrameworkConvention on Climate Change (UNFCCC) held in December 2007 in Bali,Indonesia brought the forestry sector into the climate change frameworkthrough a new approach called Reducing Emissions from Deforestation andForest Degradation (REDD). Reducing emissions from deforestation andforest degradation has long been considered a potential area for abatement,and it is possible that a mechanism will finally be agreed upon during theCOP-15 meetings in December 2009 in Copenhagen.
Some REDD-related activities have been initiated in several countries withthe support of multilateral institutions. Under the Forest Carbon PartnershipFacility (FCPF) of the World Bank, Nepal has also embarked upon programsto strengthen its readiness for REDD. As the potential REDD mechanismwill probably go into effect once the first commitment period of the KyotoProtocol expires in 2012, Nepal needs to be ready on all fronts ranging frominstitutions to technical capacity (Kotru 2008).
Numerous studies have already been initiated by non-governmentalorganizations. For example, to assess the feasibility of REDD in Nepal, WWF-Nepal undertook a study in the Western Terai region. Similarly, through itsKyoto: Think Global Act Local project, ICIMOD carried out carbonaccounting studies in three different ecological regions of Nepal. Individualresearchers and university students have also contributed to this initiative bycarrying out REDD-related research and case studies on different scales. Theseinitiatives haven’t been carried out with proper coordination amongst differentgroups. This poses a problem to feed the results into a process to make acoherent REDD strategy. We strongly feel the need to consolidate researchfindings and experiences so that national actors of the REDD initiative canmake informed decisions.
As the architecture of the proposed REDD program is still being negotiatedand worked out, we can presume that any REDD program will need to havea credible carbon monitoring system, information collection and managementinfrastructure, institutional setup, and mechanisms for participatory decision-making and equitable benefit sharing. This chapter attempts to review, analyzeand consolidate REDD related studies conducted in Nepal. More specifically,the paper encompasses the following objectives:

87
• Assemble a set of REDD-related studies conducted in Nepal• Review and analyze the focus of the studies• Identify the gaps of REDD initiatives and explore future actions
8.2 Methodology
This chapter is entirely based on an extensive literature review. In particular,10 REDD-related studies, carried out by domestic and international universitystudents and organizations, were reviewed. During the review, the studieswere categorized and analyzed to synthesize the information on the followingkey aspects:
• Study focus• Study methodologies used• Major findings
8.3 Findings
Study profile and geographic focus
Out of the total 10 studies reviewed, nine were individual studies conductedby university students. Half of the studies were undertaken by undegraduatestudents (BSc) of the Institute of Forestry, Tribhuwan University, Nepal astheir theses. The next half included three masters degree theses, a doctoraldissertation and a study conducted by an organization (see Table 8.1 below).Majority of the studies were carried out in 2008 while three were carried outin 2005 when the idea of REDD had not fully emerged in the global context.Except for one of the studies, which covered community forests of the highmountain region, almost all of the others focused on the middle hills only.
Focus and key dimensions of the studies
Table 8.2 illustrates the key dimensions covered by the reviewed studies ascategorized under the focus areas mentioned above. A majority of the studieshave concentrated on the estimation of carbon stock. Some studies have givendue focus to valuing environmental services including carbon sequestration,and thus exploring the prospects for REDD in Nepal.
Chapter 8 - Review of Studies on REDD in Nepal: Status, Gaps and Ways Forward

Ready for REDD? Taking Stock of Experience, Opportunities and Challenges in Nepal
88
Study
Number
Study by
Author(s) and
Year
Study Level and
Associated
University/Organization
Study Area
Study1 Singh, P.B. 2005 BSc, Tribhuvan University, IoF Nepal
Kusunde CF, Kaski district
Study2 Bhandari, S.K. 2008
BSc, Tribhuvan University, IoF Nepal
Kafley CF, Lalitpur district
Study3 Ranabhat et al 2008
BSc, Tribhuvan University, IoF Nepal
CFs of Kaski district
Study4 Shrestha, B.P. 2008
BSc, Tribhuvan University
Two CFs of Palpa District
Study5 GC, D.B. 2008 BSc, Tribhuvan University
Singana VDC, Baglung district
Study6 Adhikari, K. 2005 MA, Environmental Science, Tribhuvan University
Sunaulo Ghaympe Danda CF, Kathmandu district
Study7 Dahal, Y. 2008 MSc, Tribhuvan University, IoF Nepal
CFs of Palpa district
Study8 Rana, E. 2008 MSc, Technical University of Menchen, Germany
Torikhet CF, Dhading district
Study9 Karky, B.S. 2008 PhD, University of Twente, the Netherlands
Manang, Lalitpur and Ilam districts
Study10 Nepal Foresters’ Association, 2008
WWF Nepal Kailali, Dang, Nawalparasi, Chitwan and Morang districts
Table 8.1 Profile of studies reviewed

89
Study Focus Key Dimensions of the
Study
Supported
by
Unilinear Quantitative Analysis of carbon storage
Methodologies Spatial coverage of carbon estimation Carbon pool
Study 1, 2, 3, 4, 5 & 6
Valuation of Carbon Sequestration and Water Supply Services Feasibility study of REDD
Define Environmental Services Valuation Methodologies Precondition and technical issues of REDD
Study 7, 8, 9 & 10
Analysis of Deforestation Analysis of deforestation trend in Nepal
Study 10
Policy Review and Livelihood Impact Policy issues
Scope of REDD in Nepal Impact of REDD on local Livelihoods of forest users
Study 8, 9 & 10
Poverty Reduction through carbon trade
Benefits of carbon trade Study 4
One of the studies (Study 10) has attempted to analyze deforestation trendsin Nepal. Some studies have also reviewed existing forest management andenvironment related policies.Three studies (Studies 8, 9, 10) have examinedthe potential impact of REDD on the livelihoods of forest users.One study(Study 4) has paid special attention to the role of carbon trading in reducingpoverty incidence among local forest users in Nepal. Study 9, a doctoraldissertation, has estimated the carbon stocks in various eco-regions of Nepalwith an emphasis on identifying carbon trade opportunities in the community-managed forests of Nepal.
Carbon estimation: species focus and coverage
All of the studies that estimated carbon sequestration focused on communityforests. Some of the studies have focused on calculations of a single specieswhile others have computed carbon sequestration estimates for a particularcommunity forest to assess its carbon trading potential. Some of these studieshave also gone further to assess the potential of the carbon market to reducepoverty. Thus, there is considerable variation in the objectives, methodologies,scope and findings of the studies (see Table 8.3).
Table 8.2 Key focus and dimensions of the studies
Chapter 8 - Review of Studies on REDD in Nepal: Status, Gaps and Ways Forward

Ready for REDD? Taking Stock of Experience, Opportunities and Challenges in Nepal
90
p g
Spatial Coverage Focus of Carbon
Estimation
Carbon calculation of single Community forest
CFUG
Comparative Calculation of Carbon in seven Community Forests of different tree species
Pinus roxburghii and Schima-Castanopsisforest
Per ha Carbon sequestrating calculation based on secondary information
Carbon estimation based on ICIMOD information
Carbon calculation of two forest species of Single Community Forest
Schima Castanopsis and Shorea Robusta
Carbon calculation of single species Bamboo
Table 8.3 Carbon estimation and spatial coverage of reviewed studies
Carbon estimation: carbon pools considered
As indicated by IPCC (2003) and McDicken (1997), most of the studiesestimating carbon content focus on five different carbon pools: above groundbiomass, leaf litter, dead materials, below ground biomass and soil carbon,as depicted in Table 8.4. The studies that were reviewed have followed thesame approach. Some of the studies, because of associated limitations, haveavoided soil carbon content estimation. All of the studies have used ground-based inventory methods for carbon estimation.
An allometric equation developed by MPFS has been used to calculatestanding tree biomass. A few studies were found using a biomass tableprepared by DFRS to calculate tree biomass of more than 5 cm dbh (diameterat breast height). All of the studies followed the destructive harvesting methodto calculate undergrowth—seedlings and saplings of less than 5 cm dbh.Oven-dried biomass for dead materials and litter was estimated by laboratoryanalysis. Below ground root biomass was calculated using a default valuereferred to by various authors (Studies 1,2,3,4,5 and 6). Soil carbon wasestimated using the Walkey-Black wet oxidation method in all of the studies.Aminor variation in computation techniques for aboveground biomass wasfound. However, most of the authors applied the equation developed by MPFS.
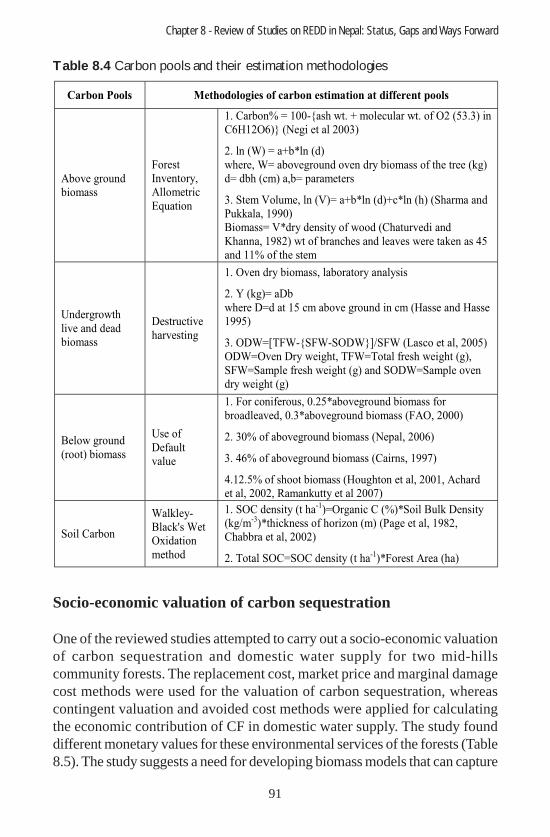
91
Carbon Pools Methodologies of carbon estimation at different pools
Above ground biomass
Forest Inventory, Allometric Equation
1. Carbon% = 100-{ash wt. + molecular wt. of O2 (53.3) in C6H12O6)} (Negi et al 2003)
2. ln (W) = a+b*ln (d) where, W= aboveground oven dry biomass of the tree (kg) d= dbh (cm) a,b= parameters
3. Stem Volume, ln (V)= a+b*ln (d)+c*ln (h) (Sharma and Pukkala, 1990) Biomass= V*dry density of wood (Chaturvedi and Khanna, 1982) wt of branches and leaves were taken as 45 and 11% of the stem
Undergrowth live and dead biomass
Destructive harvesting
1. Oven dry biomass, laboratory analysis
2. Y (kg)= aDb where D=d at 15 cm above ground in cm (Hasse and Hasse 1995)
3. ODW=[TFW-{SFW-SODW}]/SFW (Lasco et al, 2005) ODW=Oven Dry weight, TFW=Total fresh weight (g), SFW=Sample fresh weight (g) and SODW=Sample oven dry weight (g)
Below ground (root) biomass
Use of Default value
1. For coniferous, 0.25*aboveground biomass for broadleaved, 0.3*aboveground biomass (FAO, 2000)
2. 30% of aboveground biomass (Nepal, 2006)
3. 46% of aboveground biomass (Cairns, 1997)
4.12.5% of shoot biomass (Houghton et al, 2001, Achard et al, 2002, Ramankutty et al 2007)
Soil Carbon
Walkley-Black's Wet Oxidation method
1. SOC density (t ha-1)=Organic C (%)*Soil Bulk Density (kg/m-3)*thickness of horizon (m) (Page et al, 1982, Chabbra et al, 2002)
2. Total SOC=SOC density (t ha-1)*Forest Area (ha)
Table 8.4 Carbon pools and their estimation methodologies
Socio-economic valuation of carbon sequestration
One of the reviewed studies attempted to carry out a socio-economic valuationof carbon sequestration and domestic water supply for two mid-hillscommunity forests. The replacement cost, market price and marginal damagecost methods were used for the valuation of carbon sequestration, whereascontingent valuation and avoided cost methods were applied for calculatingthe economic contribution of CF in domestic water supply. The study founddifferent monetary values for these environmental services of the forests (Table8.5). The study suggests a need for developing biomass models that can capture
Chapter 8 - Review of Studies on REDD in Nepal: Status, Gaps and Ways Forward

Ready for REDD? Taking Stock of Experience, Opportunities and Challenges in Nepal
92
the carbon dynamics of different forest management regimes and of individualforest species. The study also serves to find the quantity of avoided carbonemissions and carbon enhancement of various forest regimes. This also pavesthe way for defining performance based payment mechanisms of varied forestmanagement regimes in Nepal.
Table 8.5 Socio-economic valuation of carbon sequestration and water supply
Analysis of deforestation trends
The study conducted by WWF in collaboration with NFA included an analysisof deforestation trends in Nepal. A range of techniques, including GIS andRemote Sensing, were used to identify the status of forest cover change infive districts, one from each of the five development regions of the country.
Table 8.6 Methodologies used for analyzing deforestation in Nepal
Methodologies Used
Satellite data acquisition of five district using GIS and Remote Sensing
Geo Tiff file format of Landsat data acquired from Global Land Cover Facility/Earth Science Data Interface
Carried out Layer Stackinig Operation
Calculated Normalized Difference Vegetation Index (NDVI) of all sets of imagesusing Red and IR bands of image
Area calculation of both forest and non-forest using mosaic preparation
Themes of
Economic
Valuation
Methodologies Used
Average monetary
value of per unit ton
of carbon in US$
Carbon Sequestration
Replacement Cost Method
Market Price Method
Marginal Damage Method
24.25
27.57
28.35
Domestic Water Supply
Contingent Valuation (stated preferences method)
Avoided Cost Method
Mean willingness to pay hh-1 31.3
Value of Water Supply Service per ha 5,438

93
Review and assessment of policy
Studies 8, 9 and 10 have reviewed international policy negotiations relatedto REDD, climate change and the carbon market. Study 8 has analyzed policyand legislations in the forestry sector and other relevant policies that adhereto climate change and the carbon market. Study 9 reviews a wide range ofperspectives on international policy accords and national policies . Existingforest management regimes and potential implications of a REDD schemehave also been analyzed in this study. A summary of the studies is presentedin Table 8.7 below.
Assessment of potential impact of REDD on local livelihoods
Study 9 has attempted to assess the potential impact of the REDD initiativeon the livelihoods of forest users based on the assumption that the existingforest resource collection practices in community forest would change tomeet REDD requirements. The study revealed that forest users would benefitless from carbon trading in a REDD mechanism unless co-benefits aregenerated from forest conservation. The study suggests that sustainable forestmanagement could be one of the best options to enhance carbon stocks withoutcompromising forest product collection by forest users. On the economicimpact, the study revealed that additional household earnings from REDDcontribute only insignificantly to the economic enhancement of the poor andthe marginalized unless there is a fair distribution of carbon revenues firmlyput in place.The study highlighted the possibility of elite capture whenmonetary flows begin through REDD in the absence of a formal and obligatorybenefit-distribution mechanism.
Carbon trade and poverty reduction
Study 3 was concerned with assessing the contribution of carbon revenues toreducing persistent poverty among forest users. The study, conducted in aCF located in the mid-hills, has estimated an earning of NRs.189,487 per haof CF annually if the sequestrated carbondioxide is traded at the rate of US$6 per ton. The study has concluded that additional earnings from carbon canlower the existing poverty incidence of 59% to 1.6% within a period of 25years (Table 8.8).
Chapter 8 - Review of Studies on REDD in Nepal: Status, Gaps and Ways Forward

Ready for REDD? Taking Stock of Experience, Opportunities and Challenges in Nepal
94
Policy
Coverage
Methodologies
Used
Analyzed
Contents Findings
International policy initiatives, protocol and treaty
International Policy arrangements
Backdrop ahead to evolve REDD principle
Price missing of ecosystem services-economic perspectives and human right perspectives-polluter pays principles are responsible for emergence of climate change and carbon market including REDD issue for creating mechanism of positive incentives to individuals, communities and countries.
Harmonization of Forestry Sector Policy to REDD requirements
Nepal has ratified and accessed to international framework, treaties and protocal including UNFCCC, Kyoto Protocol, Convention on Biological Diversity and already abided by ILO 169 and UNDRIP.
Forestry sector institutional arrangements and existing of monitoring and communication systems
Majority of forest management policies and legislation were formulated before the inception of climate change and carbon market idea. Existing policies don't clerly feature the provision of Payment for Ecosystem Services. Forest policies also lacks to define explicitely concerns of indigenous peoples and forest dwellers in distributing forest resources based on their level of livelihood and cultural connectivity with forest and their contribution in conserving forest.
Forest management regimes and contribution in REDD principle
Nepal is managing its forest through variety of management practices. Forest transitions and their contribution to abate deforestation and forest degradation vary among the foreand the forest of different regimes.
National forest management policies and institutional arrangement
Literature review, Internet surfing and review of National Policy related to forestry sector as well as other relevant legislations including Interim Plan, Local Self Governance Act, National Conservation Strategy, Interim constitutions
Pre-condition of REDD and Nepal's Status
Nepal has little capacity and institutional setup for defining historical deforestation trends, consistent methodologies of monitoring. Strategies are insufficient to avoiding leakage, non-permanence, additionality.
Table 8.7 Policy analysis, methodologies, contents and findings

95
Table 8.8 Assessment of carbon benefits in reducing poverty
8.4 Discussion
Amidst evolving interest ina forest carbon market through an innovativeREDD mechanism, a range of related studies have been undertaken by variousindividuals and organizations in Nepal. Most of the studies have confinedtheir focus to carbon stock estimations in community forests. This indicatesthe widely acknowledged role of community forests in playing a strong rolein conservation. Studies undertaken after 2005, when the concept of carbonmarketsrapidly evolved through the Kyoto Protocol, have linked forest carbonstocks with their economic value.
One study, bearing strong policy relevance, has attempted to analyze historicaldeforestation trends in Nepal. Angelsen et al.(2008) highlights that some ofthe submissions on REDD to the UNFCCC suggest defining a historicaldeforestation rate and distinguishing it from the business as usual (BAU)and crediting baselines.
Like deforestation, forest degradation is another important source ofemissions. As both deforestation and degradation have been recognized inthe Bali Action Plan as areas for mitigation activities, it is essential to measureforest degradation to appropriately address it. However, none of the studiesreviewed have taken degradation into account. According to the IPCC (2003),monitoring, reporting and verifying (MRV) deforestation and forestdegradation has two components: monitoring changes in forest area by foresttype; and monitoring the average carbon stock per unit area and forest type.According to Karkyet al. (2008), a reference scenario for forest degradation
Methodology Content of Analysis Findings
PRA tools (HH survey, group discussion and key informant survey for socioeconomic data collection
A total amount of NRs. 189,487 per hectare of CF could be earned every year if per tCO2 is traded at the rate of US$ 6
Secondary data (ICIMOD 2006) for biomass and carbon stock estimation
Annual income of CF through carbon trade Contribution of Carbon trade to reduce poverty of forest users This revenue can lower the
existing poverty incidence of 59% to 1.6% within a period of 25 years
Chapter 8 - Review of Studies on REDD in Nepal: Status, Gaps and Ways Forward

Ready for REDD? Taking Stock of Experience, Opportunities and Challenges in Nepal
96
is much more difficult to establish that that for deforestation because most ofthe degradation cannot be detected from remotely sensed imagery. As a result,none of the reviewed studies have addressed degradation.
Studies fully examining potential payment mechanisms are also lacking.Angelsen et al. (2008) suggest that REDD should go beyond its climateobjectives to include the provision oflivelihood benefits and poverty reduction,and the protection of rights and biodiversity. They also highlight theimportance of equity considerations, including the fair distribution of benefitsbetween and within countries and groups.
Some of the studies have explored potential livelihood impacts of REDDprojects on local forest users.These studies do not differentiate the level ofdependency that different users within a forest user group have based ontheir economic background, ethnic group and cultural groups. ICIMOD, incollaboration with ANSAB and FECOFUN is piloting a project in threewatersheds of Nepal to establish a national governance and payment systemfor emissions reductions through the sustainable management of forests,including the distribution of benefits to indigenous peoples and forest-dependent communities (K. Oli personal communication 2009).
Most of the studies that have provided insights into international policieshave focused on policy review and analysis. A PhD dissertation (Study 9)has illustrated the backdrop of the emergence carbon markets and climatechange issues. Economic and humanitarian perspectives described in thisdissertation have given a clear indication of the reasons why the globalcommunity came up with a binding agreement—the Kyoto Protocol.
Governance and the distribution of benefits from carbon sequestration, bothat the national level and within groups of forest dwellers, indigenous peoplesand forest dependents, are two growing concerns about REDD. Dhakal (2008)highlights that REDD activities can weaken a community’s control over itslocal resources. Nonetheless, only a few studies have made investigations inthis regard. Similarly, Pokharelet al.(2008)have pointed out that a democratic,open and inclusive, multi-stakeholder action group could be a good vehiclefor implementing REDD.
The REDD-Forestry and Climate Change Cell has been established as aseparate unit under the Ministry of Forests and Soil Conservation (MFSC)and has been working as the focal point of the World Bank’s FCPF. With

97
support from FCPF, the Cell has been leading the process of preparing Nepal’sReadiness Project Proposal Plan (RPPP), following approval of the ReadinessPlan Idea Note (R-PIN) in 2008. This is the first phase of the World Bank’sForest Carbon Partnership Facility (FCPF) that aims to build the capacityneeded to operate a REDD mechanism nationally. We must also assess howeffectively the REDD-Forestry and Climate Change Cell has been functioningto set up a national REDD strategy.
Increasing the institutional and human capacity at the national, regional,district, sub-district and community levels is one of the key strategies neededfor development of a REDD Program in Nepal (Pokharel et al. 2008). Studiesare also needed to evaluate the extent our existing institutional and humancapacity meets the demands of an effective REDD implementation in Nepal.
8.5. Conclusions and ways forward
Except for a single study that was carried out in the high mountains, all of theother studies that did forest inventory related calculations were confined tothe mid-hills. Community forests have been reasonably successful inrejuvenating degraded forests in the mid-hills. Since REDD is proposed forboth the national and sub-national levels, we need estimates of forest biomassfor community forests in the Terai, as well as state-managed forests in differentecological regions and socioeconomic settings.
Past studies have adopted internationally approved methodologies to measurecarbon stock. Maintaining consistency among the studies is important, whilemeasuring forest carbon within a country. Though some encouraginginitiatives are already taking place, further efforts are needed to pave theway for future REDD actions.
Consultation, coordination and cooperation
Though REDD has only recently emerged as a widely recognized essentialcomponent of any global GHG mitigation agreement, Nepal has already beenable to receive several funding opportunities to pilot REDD activities. TheREDD Cell has been functioning as the focal point for the World Bank’sFCPF REDD program which has mainly targeted capacity building. NEFIN’sREDD awareness project and governance and payment system project by
Chapter 8 - Review of Studies on REDD in Nepal: Status, Gaps and Ways Forward

Ready for REDD? Taking Stock of Experience, Opportunities and Challenges in Nepal
98
ICIMOD and its partners are being operated with the support of NORAD.WWF in partnership with Winrock International Nepal is undertaking a REDDmethodology project. CARE Denmark has funded a COP 15 project and isbeing implemented by CARE Nepal in partnership with FECOFUN. Bilateralprojects including SNV and LFP are also undertaking awareness raising andcapacity building activities. These examples serve to show that majorsynergies can be realized if these and future activities move forward in acoordinated manner, complementing each other and contributing to the overallgoal of an effective national REDD strategy.This requires constant dialogueand consultation among the implementing organizations, civil society groups,indigenous peoples and forest-dependent communities. The Ministry ofEnvironment, the focal point of UNFCCC, should be brought to the forefrontof the REDD debate and discussion.
Land tenure and ownership
Forest and land tenure, ownership and concerns of indigenous peoples, forestdwellers and forest dependents are key issues of the emerging REDDarchitecture. Community Forest User Groups in Nepal are endowed withcollective use rights, while the tenure of land still rests with the government.Moreover, forest policies and regulations do not explicitly reflect the rights ofIPs and forest dwellers within forest user groups. The collective rights of forestusers are shaped by an operational plan, which is normally approved for aperiod of five to ten years. The plan becomes effective once the District ForestOfficer or the Regional directorate approves it. As the time horizon for REDDprojects will likely exceed the time duration for which tenure is granted, it iscrucial to define a forest tenure system and carbon ownership arrangement thatis fully compatible with the REDD process currently under negotiation.
REDD or REDD+?
The original idea of REDD mainly concerns creating positive incentivesfor reducing deforestation and forest degradation. REDD+ takes a widerapproach by incorporating carbon stock enhancements through sustainableforest management and conservation, with explicit recognition of co-benefitslike biodiversity conservation, socioeconomic development, ecosystemservices and livelihood improvements. Nepal’s forests are under differentmanagement regimes and this has implications for the extent of benefitsthat can be realized.

99
As one fourth of the total forest area is under community-based management,this area benefits from REDD+ as CBFM is an instrument that abatesdeforestation and degradation and enhances carbon stocks through sustainableforest management. On the other hand, state-managed forests wheredeforestation and forest degradation is rampant will potentially benefit fromREDD. An alternative could be to deal with REDD and REDD+ separatelyfor state-managed and community-managed forests, respectively. A logicalassessment is required for determining the best choice among the options inorder to pursue anational level REDD strategy.
Issues of indigenous peoples, forest dwellers and forest dependents
Issues related to land tenure, property rights and customary rights ofindigenous peoples, forest dwellers and forest-dependent communitiesneeds to be settled prior to initiating REDD activities. Nepal is a signatoryto the ILO Convention 169, obligating it to recognize the rights ofindigenous peoples (UNDRIP 2007).Broad stakeholder consultations mustbe held with IP groups so that their concerns and interests are duly reflectedin Nepal’s REDD strategy.
Review of institutional restructuring and strengthening
The government’s initiative to establish the REDD-Forestry and ClimateChange Cell under MFSC is recognized as an encouraging step. The Cell isexpected to facilitate the preparation of the Readiness Proposal Plans underthe World Bank’s FCPF. A review of larger bodies like MFSC and relevantcivil society organizations like FECOFUN should be conducted, particularlyin light of their vertical organizational structures to ready these institutionsfor REDD+.
Policy review and reforms
REDD is a recently developed approach for recognizingand supporting therole of standing forestsin combating climate change. Nepal’s policies relatedto forest management should be reviewed and customized to meet therequirements that will most likely shape the REDD mechanism. Studies arerequired to assess to what extent forest management policies are supportiveof a REDD mechanism.
Chapter 8 - Review of Studies on REDD in Nepal: Status, Gaps and Ways Forward

Ready for REDD? Taking Stock of Experience, Opportunities and Challenges in Nepal
100
Information management and communication strategy
An assessment of the existing information management infrastructure isurgently needed to find out whether current technologies and human resourceswill able to meet the international standards for REDD. Similarly, increasingthe level of awareness amongst government personnel, private sector actors,civil society groups and forest users, including indigenous peoples and forestdwellers, is an urgent task without which REDD implementation will beextremely difficult.Formulating a REDD communications strategy through aconsultation process will help to enhance information management for REDD.
Payment distribution structuring
A much more thorough assessment of the level of forest dependency of usersof different economic, ethnic and cultural backgrounds in needed to understandthe potential impact of REDD on their livelihoods. This understanding willbe instrumental to designing an appropriate payment distribution mechanism.Reviewing the existing practices of benefit distribution between the stateand forest user groups would be the first step towards understanding thesedynamics and their implications for a pro-poor REDD program in Nepal.

101
Chapter 9
Carbon Finance and REDD: Lessons andWays Forward
- Rishikesh R. Bhandary18
Abstract
Reducing emissions for deforestation and degradation has achieved renewedattention after it was placed under the Bali Action Plan during COP-13 inDecember 2007. There had been many attempts to include avoideddeforestation under mechanisms like the Clean Development Mechanism(CDM), but because of many unsettled technicalities and the fear of generatingexcessive hot air this had not been accomplished. The compromise positionin COP6 was to allow afforestation and reforestation (A/R) under the CDMand to move avoided deforestation and land use changes and degradation tothe purview of the Adaptation Fund.
Viana (2009) argues that deforestation is mainly driven by the “perceptionof economic gains and not by ignorance, irrationality or stupidity.” In orderto prevent deforestation, therefore, actors need to be convinced that it ismore economically beneficial to keep the forests intact than to cut or degradethem. Efforts to reduce deforestation have taken the form of either nationalregulations and law enforcement or domestic and international incentivesfor sustainable forest management. Traditionally, governments haveformulated legal instruments to address deforestation. However, these effortshave not been supported by funds through national sources. Internationalbodies have not paid enough attention to forests either. Until recently, theWorld Bank considered investments in forests to be too risky (World Bank).
This chapter reviews carbon financing mechanisms available for emissionreduction projects under the proposed REDD system. The majority of thechapter will focus on lessons learned from the Clean Development Mechanismand the voluntary markets. It is hoped that this review will help to shed lighton how Nepal needs to ready itself to compete internationally for REDDfinance, and what it can realistically expect from a market-based system.
18 The Fletcher School, Tufts University; E-mail: [email protected]

Ready for REDD? Taking Stock of Experience, Opportunities and Challenges in Nepal
102
9.1 Trends in deforestation; global characteristics
Country level emission data are still being developed and this gap makes itdifficult to do cross-country comparisons to assess the relative attractivenessin terms of REDD projects. Table 9.1, excerpted from WRI’s (2008) report,shows two studies that it has carried out. Two countries alone account foralmost half of the world’s deforestation related emissions: Brazil’s share is25%, while Indonesia’s is 23%. Forested lands are under severe pressurefrom cattle and soya industries in Brazil and pulp and palm oil industries inIndonesia. These products are mostly traded and bilateral trade flows can beanalyzed to pinpoint the flow of these commodities. In addition, there areonly a handful of prominent enterprises that dominate these industries. Thehigh transaction costs of REDD encourages companies to seek large projectsto exploit economies of scale. This will divert the financial flows to thesetwo countries. As a result, these countries offer immense opportunities toachieve major emission reductions.
Nigeria, Democratic Republic of Congo and Burma are the next three topemitters from deforestation collectively accounting for 13% of the total (WRI2008). Because of weak governance in all three of these countries, it is likelythat investors will stay away from them.
The statistics in Table 9.1 below refer to net emissions, assuming that 3 tonsof carbon are equivalent to 11 tons of carbon dioxide. Global Timber’s“Informal Note” (2009) argues that the net emissions actually underestimatethe emissions as the list includes countries like Brazil, Malaysia and Indonesiathat have expanded plantations at the cost of biodiversity and localcommunities.
This uneven distribution of forest-related emissions shows that REDD has astrong potential to act in a similar manner to the CDM in terms of projectdistribution. China, India and Brazil are the hosts of most of the CDM projectsand based on a cursory assessment, Brazil and Indonesia will be the favoritedestinations of project developers. Project developers will instinctually preferleast-cost abatement options where they can obtain the maximum number ofcredits. These countries are the most likely sources of the cheapest credits.
It is important for Nepali policy makers to understand how it can createnational preparedness so that it can be a major player in the market. To do so,the expectations of the credit buyers need to be understood in the context of

103
Table 9.1 Top 25 Countries in Terms of Emissions from Deforestation
Source: WRI 2008
a global market-based mechanism. If carefully crafted, REDD has the potentialto unleash financial flows to a sector that has been traditionally neglectedand underfunded, so that tangible livelihood benefits are achieved whilecontributing to the global goal of climate change mitigation.
9.2 State of the market
Forestry-generated offsets are popular in the voluntary market (Hamilton etal. 2008). Though avoided deforestation are also project options in thevoluntary market, these projects account for less than 5% of the total value.This denotes substantial space to generate credits outside of the compliance
Chapter 9 - Carbon Finance and REDD: Lessons and Ways Forward

Ready for REDD? Taking Stock of Experience, Opportunities and Challenges in Nepal
104
market. However, the voluntary markets that exist are only a fraction of thecompliance markets like the CDM. Capoor and Ambrosi (2009) estimate themarket value of CDM projects was over USD 13 billion accounting for 95%of the entire global market value. The voluntary market on the other hand isworth only about USD 265 million, of which only 15% are forestry-relatedoffsets.
A key question that needs to be asked is: how much money is necessary toimplement a mechanism that can play a major role in reducing forest-relatedemissions? This will help us to assess whether the proposed framework willactually deliver the necessary volume of financial resources to serve as anadequate incentive for the conservation and sustainable management of forestsworldwide. The 2008 Eliasch Review has estimated the required amount tobe between USD 17-33 billion dollars annually to halve greenhouse gasemissions from deforestation by 2030 (IIED 2009). Ebeling and Yasue (2008)have estimated this amount to be in the range of USD 2-30 billion. As theexact architecture of REDD is not known yet and is still being negotiated,and the existing forest carbon market is limited, these modeling results arebased on a number of assumptions and vary considerably due to the largeuncertainty element. Some key factors that can play a role in arriving at afigure are the extent of fungibility with other markets, and the depth ofemission cuts taken and associated mitigation costs in other sectors.
What is clear from the literature is that the flows generated by a market-based system alone will not be sufficient to reduce emissions significantlybased on the estimates calculated to curb forest related emissions significantly.At the same time, Viana (2009) argues that the funds generated through thismarket process will also be substantially higher than what we can expectfrom the voluntary side. Direct grants and/or contributions have not beenexpected to total much, based on the reality of low ODA flows, especially inthe forestry sector. Funds can be generated outside of the market systemthrough a few sources. For example, the emission allowances can be auctionedoff as is done in the EU Emissions Cap-and-Trade System. Bilateral assistancefunds could be another source.
There have not been many studies that have explored the financial side ofREDD and other carbon offset projects, especially taking into account theopportunity costs of alternative land use options. A comparative study takingthree community forests into account found that, on average, these forestssequestered 6.89 tons of carbon dioxide equivalent per ha per year. Staddon

105
(2009) argues that this is only USD 82.68 per ha assuming carbon prices inthe range of USD 12-15. Though this would make a total of USD 90 millionper year for the community forests, which is substantially higher than whatthey currently make, this revenue estimate needs to be assessed in light ofthe high transaction costs and the revenue forgone (i.e., opportunity costs)from other land-use options (Banskota et al 2007).
9.3 Challenges in using a market system
This section describes a few selected issues that pose threats that couldundermine the effectiveness of market-based system in simultaneouslyachieving the goals of emissions reductions and co-benefits.
Non-permanence: Failure of CDM afforestation/reforestation
Forest-related emissions reductions are different from other emissionsreductions in that there remains a chance that the carbon sequestered oremission avoided will not be permanent. Addressing this very concern,temporary credits were issued for CDM A/R projects called tCERs. Thesehold an expiry date ranging from five to nine years. The more long-termcredits are called ICERs and are valid for the entire duration of the creditingperiod (Dutschke et al 2004). Temporary credits, however, have low pricescompared to permanent credits. In addition, temporary credits need to bereplaced when they expire at the end of the commitment period for tCERS,or at the end of the crediting period of ICERs. Private investors have beenhesitant to buy temporary credits. Permanent credits are available at fairlycheap prices and purchasing these credits doesn’t require investors to buymore after the temporary ones expire.
Market flooding
Papua New Guinea and Costa Rica have proposed using a historical referencelevel as the baseline. Critics have pointed out that this approach will create“hot air” as it doesn’t take into account the nature of deforestation and how itevolves over time. Hot air can be generated when carbon credits don’t reallyrepresent actual emissions reductions and in this context overestimatingdeforestation would allow more credits to be claimed than the reductions
Chapter 9 - Carbon Finance and REDD: Lessons and Ways Forward

Ready for REDD? Taking Stock of Experience, Opportunities and Challenges in Nepal
106
made. The forest transition theory posits that a country may start with a highdeforestation rate but will not continue to do so forever. This is because themarginal cost of deforestation increases and, after a certain point, actors realizethat deforesting does not yield any gain. As a result, any baseline that takeshistorical reference levels could be capturing only a certain temporal phaseof the forest transition trajectory and the resulting baseline would eitherunderestimate or overestimate the credits that can be generated.
Countries that have large tracts of forests and low deforestation rates areagainst using the historical reference line. They argue that their incomes arestill rising and that their historical deforestation rates are not reflective ofwhat can be anticipated. However, to get these countries on board, targetscould be given above their current deforestation rates. This would createmassive hot air and deflate the price of credits.
If REDD credits cannot be traded in the compliance markets under the KyotoProtocol or in regional markets like EU ETS, investor interest becomes limited.Some countries like Brazil have opposed using REDD credits to helpdeveloped countries meet their compliance targets as a matter of principle—based on the notion that developed countries have an historical responsibilitydue to their past and present emissions. Others point out that allowing thefull fungibility of REDD credits with credits from compliance markets willflood the market. Karsenty (2008) argues that a possible solution can be tohave very stringent targets so that new credits can be absorbed.
If REDD credits were tradeable with CDM and the market of inter Annex 1countries, the same permanence issue as those faced by A/R projects underthe CDM would re-emerge. Will a country that is rewarded for reduceddeforestation in a first commitment period be forced to make a refund if itoversteps its target for a subsequent period? One obvious solution would beto use the same temporary credits already in force for the A/R CDM credit.Such temporary credits are suggested not only for addressing the risk of non-permanence, but also to mitigate the risk of market flooding. However, it isacknowledged that for the CDM, temporary credits are one of the causes ofthe failure of forestry projects, since the market is unwilling to buy them.
In the context of REDD, the important takeaway from the CDM experienceis that the essential fungibility between European Union Allowances (EUAs)and Certified Emission Reductions (CERs) of the CDM was critical toensuring strong linkages between their respective markets, and therefore theliquidity of the CER market.
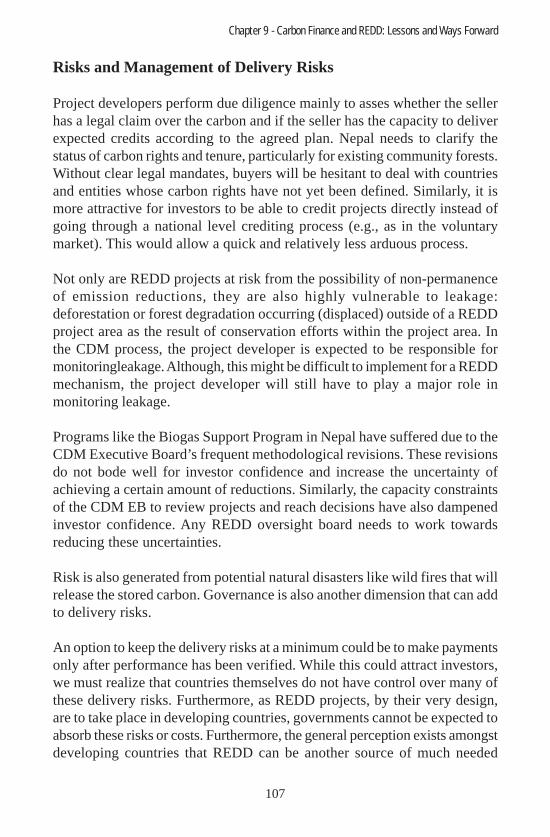
107
Risks and Management of Delivery Risks
Project developers perform due diligence mainly to asses whether the sellerhas a legal claim over the carbon and if the seller has the capacity to deliverexpected credits according to the agreed plan. Nepal needs to clarify thestatus of carbon rights and tenure, particularly for existing community forests.Without clear legal mandates, buyers will be hesitant to deal with countriesand entities whose carbon rights have not yet been defined. Similarly, it ismore attractive for investors to be able to credit projects directly instead ofgoing through a national level crediting process (e.g., as in the voluntarymarket). This would allow a quick and relatively less arduous process.
Not only are REDD projects at risk from the possibility of non-permanenceof emission reductions, they are also highly vulnerable to leakage:deforestation or forest degradation occurring (displaced) outside of a REDDproject area as the result of conservation efforts within the project area. Inthe CDM process, the project developer is expected to be responsible formonitoringleakage. Although, this might be difficult to implement for a REDDmechanism, the project developer will still have to play a major role inmonitoring leakage.
Programs like the Biogas Support Program in Nepal have suffered due to theCDM Executive Board’s frequent methodological revisions. These revisionsdo not bode well for investor confidence and increase the uncertainty ofachieving a certain amount of reductions. Similarly, the capacity constraintsof the CDM EB to review projects and reach decisions have also dampenedinvestor confidence. Any REDD oversight board needs to work towardsreducing these uncertainties.
Risk is also generated from potential natural disasters like wild fires that willrelease the stored carbon. Governance is also another dimension that can addto delivery risks.
An option to keep the delivery risks at a minimum could be to make paymentsonly after performance has been verified. While this could attract investors,we must realize that countries themselves do not have control over many ofthese delivery risks. Furthermore, as REDD projects, by their very design,are to take place in developing countries, governments cannot be expected toabsorb these risks or costs. Furthermore, the general perception exists amongstdeveloping countries that REDD can be another source of much needed
Chapter 9 - Carbon Finance and REDD: Lessons and Ways Forward

Ready for REDD? Taking Stock of Experience, Opportunities and Challenges in Nepal
108
revenue to support the forestry sector. If these countries are to be asked tofront the initial costs and bear delivery risks, interest will surely dwindle asmost countries simply do not have the necessary funds to initiate theseprograms.
As already mentioned, governance indicators will also influence decisionson where to locate REDD projects. One of the many causes of deforestationand degradation is weak governance and corruption, and unless this isaddressed countries will not likely be the recipients of REDD financing, whichcould help them achieve reductions in the deforestation rate (Ebeling andYasue 2008).
To overcome these issues, alternative financing sources to cover upfront costswill need to be explored at different levels. The Prototype Carbon Fund, aprogram of the World Bank that has helped to fund upfront costs for CDMprojects, and has also bought pre-sold credits (rights to unissued credits), hascontributed to reducing the risks associated with receipt of payments bydeveloping countries. However, the World Bank has come under much attackfor the low price (USD 7 per ton of carbon dioxide equivalent) at which itbought the credits generated in some CDM projects in Nepal. While it isextremely necessary and vital for a body to assist as a risk buffer and as asource of upfront capital, the host country and associated actors must feelthat they are gaining from the process as well.
9.4 Readiness and upfront financing
As the ICF International report writes (Meridian Institute 2009), significantpreparation is necessary to make sure that countries have the necessaryinfrastructure in place to implement a REDD plus mechanism. There aremajor costs that need to be borne before a market approach, or a combinedmarket-based and –fund-based approach, can be initiated. Transaction costsfor REDD are very high. For example, existing carbon stocks need to bequantified and this does not come cheap. Similarly, Costa (2007) argues thatmonitoring and verification costs are also significant, particularly fordegradation.
Without a proper mechanism to raise the necessary funds for these upfrontcosts, countries will not be in a position to implement REDD. Karsenty (2008)argues that global initiatives like the World Bank’s Forest Carbon Partnership

109
Approach Description Local National
Risk buffers Percentage (often around 30% of credits are withheld from sale as insurance in the event that the project or program fails
Equity issue if other projects in national REDD systems fail and national accounting is corrected
Lower overall income because credits withheld in buffer account
Replacement of issued credits by sellers
By bringing new areas under REDD schemes if areas from which credits have been pre-sold fail to deliver credits
High risk if cannot replace credits; Prevents access if cannot guarantee replacement
Temporary credits Expire after a certain period and need to be replaced. Used in CDM A/R projects
Lower overall investment but potentially less risky for sellers
Low income because low interest by investors (based on CDM)
Payment after verification
Ex-post payments can significantly reduce risks for buyers
Poor market access if no upfront capital;Could result in transfer of liabilities from governments taking on upfront costs
LDCs may lose out if flow levels of upfront capital available
Portfolio approaches
A range of project areas and types are developed. Sourcing credits from such a portfolio reduces risks arising from forest fires and disease that may only affect certain geographic regions.
Lower income and poorer equity of benefits for high-risk activities; Conversely could increase risk-taking by governments.
Increased overall investment; Promotes wider range of geographic areas to be included within a country.
Source: Peskett et al. 2008
Table 9.2 Implications of different risk management approaches
Chapter 9 - Carbon Finance and REDD: Lessons and Ways Forward

Ready for REDD? Taking Stock of Experience, Opportunities and Challenges in Nepal
110
Fund (FCPF) and the UN-REDD Programme can help to generate the levelof ‘readiness’ that REDD requires.
Though there are many pilot programs and support projects that are in place,the FCPF is the most extensive program that is helping to build capacity andalso pilot projects at the same time. FCPF was “officially launched in COP13as a new prototype fund for ‘avoided deforestation and degradation’”(Karsenty 2009). The box below summarizes the activities covered by FCPF.Based on the areas mentioned, two issues come to the forefront: tacklingdeforestation and degradation requires a broad range of strategies and notjust the ‘quick fixes’ that some reports seem to imply; and an active role ofthe government is necessary to ensure that REDD can be implementedeffectively.
Box 9.1. FCPF-supported actions to address deforestation and degradation
• Removing subsidies leading to deforestation and degradation• Improving forest-related law enforcement• Securing rights for indigenous and forest dwellers• Devolving forest management to local communities• Forest certification initiatives• Conservation concessions• Strengthening the protected area network• Direct payments for environmental services• Improving fire prevention and suppression• Forest management plans for rational use of forest resources• Reduced-impact logging• Reforestation of degraded lands to meet timber and energy needs• Alternative livelihood programs• Intensifying agriculture and promoting agroforestry
9.5 Conclusion
Carbon markets have the potential to deliver vast amounts of money basedon a few fundamental principles. The cost efficiency of achieving the emissionreductions is probably the most important determinant of the direction offinancial flow under a market-based system. As this chapter has described,there are a number of risks associated with REDD credits. Without addressing

111
these risks at the policy level, Nepal cannot be made competitive on thisfront.
The current type and distribution of CDM projects gives us a strong hint atwhat to expect from a market-based REDD system. It will not be a surprise ifmost of the projects under a REDD mechanism go to Brazil and Indonesia,the two countries that make up the largest share of global forest-relatedemissions. Furthermore, REDD may not deliver the co-benefits thatproponents say it will. If we look at the majority of the CDM projects, theyinvolve making minor changes in industrial processes and one can questionhow such changes are leading to sustainable development and technologytransfer.
Working in Nepal’s favor, however, is the experience of community forestsin sustainable management of forests. As the community forest user groupsexist as federated bodies, they also offer the opportunity to bundle projectstogether. Without this possibility, taking a project wise approach, transactioncosts would be much too high. The government must facilitate localinvolvement in REDD by extending tenure and land rights to the CFUGs sothat they can enter into contracts with project developers.
Furthermore, REDD has substantial costs that need to be borne before a propermechanism can come into effect. Though FCPF has been helping to preparesome countries, whether the scale of financial and technical assistance that itpromises to offer will be enough is yet to be known. Karsenty (2008) arguesthat the implications of requiring upfront funds extends to the poverty andequity dimensions. The poorest countries are less likely to participate if thepayment of REDD credits is only on delivery or evidence of carbon stockgains.
Developing a full appreciation of what risks are considered by investors inthe carbon market will help to think about how domestic institutions canrespond accordingly. It has been shown that carbon markets together withfund-based mechanisms can supply the necessary financial resources to bothaddress emission reduction objectives and achieve livelihood benefits.
Chapter 9 - Carbon Finance and REDD: Lessons and Ways Forward

Ready for REDD? Taking Stock of Experience, Opportunities and Challenges in Nepal
112

113
Chapter 10
Forest carbon accounting: Lessons learntfrom a pilot project in Western Nepal
- Mohan B Gurung19
Abstract
In spite of accounting for 17-25% of anthropogenic emissions, deforestationwas not included in the Kyoto Protocol. The UN Convention on ClimateChange has recently decided to include it in future agreements and has askedits scientific board to study methodological and scientific issues related topositive incentives for reducing emissions from deforestation and forestdegradation (REDD) in a post-2012 climate change regime. Assessing forestcarbon budgets has received much attention in recent years (IPCC 2000,2001, 2007). The estimation of carbon stocks provides objective informationto support consultations, negotiations and policy processes.
A wide range of organizations and experts are involved in developingmethodologies for the quantification of carbon sequestrated by forests andare working to include forests in carbon offsetting schemes. Various toolsand techniques have been developed so far to assess forest carbon for bothvoluntary and regulated markets. The technical standards, guidelines andmethodologies for carbon and other green house gas accounting are criticaltools that shape the rules of the game in the international climate changepolitics. This paper reveals that much more research needs to be done toobtain estimates specific to Nepal that can be used for carbon accounting.Cost effective methods that incorporate broad based local participation canbe used. However, different methods have to be carefully weighed beforeembarking on forest carbon accounting projects.
19 Senior Research Officer, Winrock International, Nepal;E-mail: [email protected]

Ready for REDD? Taking Stock of Experience, Opportunities and Challenges in Nepal
114
10.1 The pilot project
As a part ofstrengthening capacity to understand the science ofREDD,especially the interface between forests and climate, anearly actionpilot study has been undertaken in the western Terai region of Nepal by theTerai Arc landscape (TAL) program, with technical support from WinrockInternational-Nepal and financial support from WWF Nepal. This study aimsto assess the carbon sequestration potential, permanency, leakage and risksof carbon emission from forests. The initiative also aims to establish a baselinefor the early action pilot project through enhancing knowledge and thescientific basis for REDD.The ultimate goal of the project is to ensure theecological, economic and socio-cultural integrity of the critical bottlenecksthrough forest carbon financing which will also serve as a basis for theformulation of REDD policy and programs in Nepal.
Figure 10.1 The project area consists of a pristineBombax spp forest
The study was carried out in two forest blocks of three district–Dang, Bankeand Bardia—during 2009. The study sites are located in the Khata corridorand the Lamahi-Mahadevpuri complex, which are part of the Terai ArcLandscape. The study area covers a total of 133,000 ha out of which 71,000ha are classified as a dry tropical forest ecological region based on theguidelines set forth by the IPCC (2006). The areas are lowlands with thealtitude going down to below 300 m. They have a pronounced dry seasonthat extends over five months with rainfall of less than 1500 mm per year.

115
10.2 Selection of carbon accounting methodology
Selection of an appropriate carbon accounting methodology depends on thenature of the proposed project. As the IPCC Guidelines for NationalGreenhouse Gas Inventory (2006, Volume 4) for Agriculture, Forestry andOther Land Use (AFOLU) sectorsare mainly designed for national-levelinventories, there is less detail given on project-specific methods. MacDicken(1997), Pearson et al. (2007) and others have designed tools and techniquessuitable for use at the project level or at a single site. Similarly, the VoluntaryCarbon Standard (VCS) focus more on estimating leakage, permanency andadditionality while the REDD Sourcebook offers guidance on methodologicalissues covering remote sensing and ground-based techniques. All of theseguidelines help to build a hybrid methodology that is able to accommodatethe local context, the nature and the size of the proposed project.
Gibbs et al. (2007) have enumerated a number of methods to estimate forestcarbon stocks at different tiers with various levels of accuracy. It is morefeasible to rely on ground-based forest inventory rather that remotely senseddata to estimate forest carbon stock, because of the cost involved in installingand managing high-tech remote sensing equipments. (Gibbs et al. 2007).They also argue that forest inventory methods whereby ground-basedmeasurements of tree diameters or volume are related to forest carbon stocksusing allometric relationships have a very low level of uncertainty. Thereforea ground-based inventory method was used to estimate carbon stocks for thestudy, while remote sensing was used to analyze historic land cover and tomake projections in lieu of the lack of historic forest carbon data.
To encourage broad-based participation for the robustness on methodologicalissues of forest carbon accounting, expert consultations and peerreviewsofthe proposed methodology were carried out. The proposed methodologyincluded input from experts and the results of other pilot projects. The PeerReview Committee included experts from the fields of soil science, biometrics,forest inventory, forest carbon inventory, remote sensing and geographicinformation system, community forestry, biodiversity conservation andclimate change. Inputs from both national and international experts wereincorporated into the methodology. The pilot study was carried out in March2009 while fieldwork was carried out during April-May 2009.
Chapter 10 - Forest carbon accounting: Lessons learnt from a pilot project in Western Nepal

Ready for REDD? Taking Stock of Experience, Opportunities and Challenges in Nepal
116
10.3 Methods
Human resources and field equipment
By training local people in carbon inventory techniques, a community-basedcarbon monitoring program can be created to ensure sustainability. Communityforest user groups already practice forest monitoring in Nepal while preparingthe forest inventory documents for the periodic renewal of their communityforest management plans. Therefore, Local Resource Persons (LRPs) for forestcarbon inventory were trained as a starting point for community-based carbonmonitoring. The inventory team members were equipped with a set ofequipment, including a location map of sample plots with coordinatesuploaded in GPS, to determine the exact location of the sample plots. Allequipment was calibrated, and the weight and size of the sampling bags werenoted down prior to conducting field measurements.
Land cover change analysis
Landsat ETM+ imagesfrom the years 1999, 2001 and 2006 were geo-referenced with sub-pixel accuracy. The thermal band was re-sampled to a30-meter pixel size to normalize the spatial scale differences between theoptical and the thermal bands. The spectral radiances of each of the sevenbands (band 1 to 7 of the ETM+ imagery) were calculated and converted toreflectance. Thiscalculation was used as the basis for further analysis.
A semi-expert system in image classification, Rikimaru (1996) introducedan alternative deductive approach, i.e. forest canopy density mapper (FCD),to map forest canopy density using four indices from Landsat TM: vegetation,bare soil, shadow and surface temperature. This model involves bio-spectralphenomenon modeling and analysis utilizing data derived from four indices:Advance Vegetation Index (AVI), Bare Soil Index (BI), Shadow Index (SI),and Thermal Index (TI). Using these four indices, the canopy density foreach pixel was calculated in percentages. AVI reacts more sensitively to thevegetation quantity, compared toNormalized Differrence Vegetation Index(NDVI). Shadow index increases as the forest density increases. The ThermalIndex increases as the vegetation quantity decreases and the Bare Soil Indexincreases as the degree of bare soil exposure of an area increases.The fourindices were expressed in percentages for each pixel.

117
Based on these four variables, ten canopy density classes, namely 1-10, 11-20… 91-100, were obtained. As the focus is on forests,patches with vegetationcanopy density of less than 10% and patches of vegetation smaller than 0.5ha were discarded from the analysis. The remaining canopy density classesbetween 10-100% were grouped into three classes according to the classesmentioned in the Master Plan for Forest Sector of Nepal (1988):
• 10-40%: Degraded Forest• 41-70%: Moderate-Density Forest• > 71%: DenseForest
Carbon stock estimation and projection
Field sample size
A pilot inventory was carried out to estimate the variance of the carbon stockin the forest strata. This is required to calculate the number of plots requiredfor the inventory. The following statistical formula adopted from Pearson etal. (2005) was used to determine the required number of sample plots:
n =
( )2
2
22
2
sNt
ENsN
×+×
×
(Equation 1)
Where,E = Allowable error or the desired half-width of the confidence interval,
calculated by multiplying the mean carbon stock by the desired precision(that is, mean carbon stock x 0.1, for 10 per cent precision),
t = the sample statistic from the t-distribution for the 95 per cent confidencelevel. t is usually set at 2 as the sample size is unknown at this stage,
N = Number of sampling units for stratum (= area of stratum in hectares or areaof the plot in hectares),
n = Number of sampling units in the populations = Standard deviation of stratum
Field measurement
With the help of a GPS, 500 square meter size circular plots for tree wereestablished as permanent plots. Tree height was measured using a SuntoClinometer and a Haglof DME. Each tree within the plot was marked with a
Chapter 10 - Forest carbon accounting: Lessons learnt from a pilot project in Western Nepal
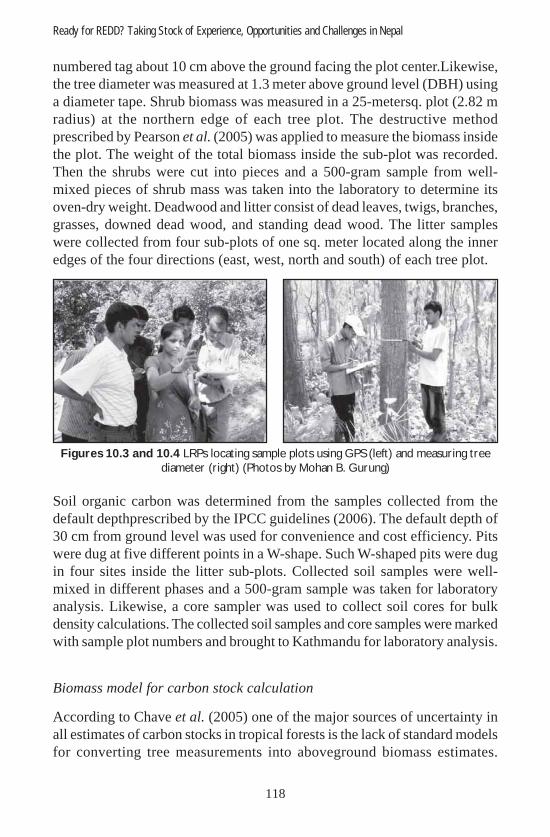
Ready for REDD? Taking Stock of Experience, Opportunities and Challenges in Nepal
118
Figures 10.3 and 10.4 LRPs locating sample plots using GPS (left) and measuring treediameter (right) (Photos by Mohan B. Gurung)
Soil organic carbon was determined from the samples collected from thedefault depthprescribed by the IPCC guidelines (2006). The default depth of30 cm from ground level was used for convenience and cost efficiency. Pitswere dug at five different points in a W-shape. Such W-shaped pits were dugin four sites inside the litter sub-plots. Collected soil samples were well-mixed in different phases and a 500-gram sample was taken for laboratoryanalysis. Likewise, a core sampler was used to collect soil cores for bulkdensity calculations. The collected soil samples and core samples were markedwith sample plot numbers and brought to Kathmandu for laboratory analysis.
Biomass model for carbon stock calculation
According to Chave et al. (2005) one of the major sources of uncertainty inall estimates of carbon stocks in tropical forests is the lack of standard modelsfor converting tree measurements into aboveground biomass estimates.
numbered tag about 10 cm above the ground facing the plot center.Likewise,the tree diameter was measured at 1.3 meter above ground level (DBH) usinga diameter tape. Shrub biomass was measured in a 25-metersq. plot (2.82 mradius) at the northern edge of each tree plot. The destructive methodprescribed by Pearson et al. (2005) was applied to measure the biomass insidethe plot. The weight of the total biomass inside the sub-plot was recorded.Then the shrubs were cut into pieces and a 500-gram sample from well-mixed pieces of shrub mass was taken into the laboratory to determine itsoven-dry weight. Deadwood and litter consist of dead leaves, twigs, branches,grasses, downed dead wood, and standing dead wood. The litter sampleswere collected from four sub-plots of one sq. meter located along the inneredges of the four directions (east, west, north and south) of each tree plot.

119
Ecological domain
description Model
dbh
range Source
Altitude: 350 m asl Rainfall: =1200 mm Dry months: 7 Forest type: Dry tropical
ln (AGB)= -2.235+0.916 ln (D2Hρ)
5-34.7 cm
Chave et al (2005)
This biomass regression model seeks information on the trunk diameter D(in cm), total tree height H (in m) and wood specific gravity ñ (in g/cm3).Tree diameter and height were measured in the field, while wood specificgravity was derived from the “Master Plan for the Forestry Sector Nepal:Forest resources information status and development plan”. A weightedspecific gravity of 0.878 and 0.87 for Sal (Shorea robusta) and its associatedspecies and Khair-Sissoo (Acacia catechu - Dalbergia sissoo) trees wereused, respectively. The biomass of individual trees was multiplied by thecarbon fraction prescribed by IPCC (2006) (Table 10.2).
Published regression models here in Nepal are usually based on a small numberof directly harvested trees and include very few large diameter trees. Hence,these estimates do not represent forests in general. This explains why twomodels constructed for the same forest may yield different AGB estimates, adifference exacerbated for large trees, which poses a greater uncertainty forstand-level biomass estimates (Brown 1997; Nelson et al. 1999; Clark andClark 2000; Houghton et al. 2001; Chave et al. 2004). The biomass modeldeveloped for the Nepalese tree species neither coversall diameter classes,nor are they available for all species. Moreover, they have not considered thewood specific gravity of each species which Chave et al. (2005) concludes tobe an important variable in biomass function.
Furthermore,as the natural forests of the project area contain many tree speciesper ha, one cannot use species-specific regression models. Instead, mixedspecies tree biomass regression models must be used. To overcome thelimitations of locally available models, we used the following regressionmodel,which was critically assessed by Chave et al. (2005) and comparedwith five other different models for quality and robustness in the forests ofUttar Pradesh, India. Uttar Pradesh shares similar climatic conditions andvegetation types with Nepal. Chave et al. (2005) claimed that the regressionmodel has just –0.39% departure between estimated and measured biomassand has performed the best fordry tropical forest types of Uttar Pradesh,India.Still, this model only covers a DBH range of up to 34.7 cm.
Table 10.1 Model used to estimate aboveground biomass of trees
Chapter 10 - Forest carbon accounting: Lessons learnt from a pilot project in Western Nepal

Ready for REDD? Taking Stock of Experience, Opportunities and Challenges in Nepal
120
Aboveground shrub and litter biomass
Shrub samples collected through the destructive method were oven dried inthe laboratory. The green weights of the samples were also taken at theinventory spot. The ration of oven-dry weight to green weight was used toextrapolate the total oven-dry weight of the shrub mass of the sample plot.Similarly, an expansion factor of oven-dry shrub biomass derived from theshrub sample plot area (25 sq. m) and the total oven-dry shrub biomass of thesample plot were used to calculate total shrub biomass per ha for the entireproject area. A similar technique was applied to calculate the litter biomassof the sample plots of the entire project area.
Below-ground biomass
IPCC (2006) has recommended the default value in Table 10.3 for the ratioof belowground to aboveground biomass.However, most of the sample plotsof the project area have more than 20 mg aboveground biomass per ha. Thusthe ratio of 0.28 was used for the calculation of belowground biomass, toprovide a conservative estimate of total biomass. The product of the ratio (R)and the aboveground biomass of the sample plot gives the belowgroundbiomass in kg.
Soil organic carbon
Analysis of soil samples was done in the Soil Science laboratory of theNational Agriculture Research Council (NARC) in Kathmandu. Two tests—
DomainTree
Parts
Carbon Fraction (CF)
Mg C (Mg d.m.)-1
Reference
Tropical
All 0.47 (0.44-0.49)
Andreae and Merlet, 2001; Chambers et al., 2001; McGroddy et al., 2004; Lasco and Pulhin, 2003
*�����-�(.//0�1��2�
Table 10.2 Carbon Fraction of Aboveground Biomass
The carbon content of individual trees was summed up and divided by thesample plot area to determine the expansion factor of carbon per unit area.The total carbon stock of the forest area was calculated by multiplying thetotal forest area by this expansion factor.

121
Domain Ecological
Zone
Aboveground
Biomass
Ratio(R)
(mgshoot)-1
Reference
Aboveground biomass <20 Mg ha-1
0.56 (0.28-0.68)
Tropical Tropical dry forest Aboveground
biomass >20 Mg ha-1
0.28 (0.27-0.28)
Mokanyet al.2006
Source: IPCC, 2006
for soil bulk density and soil organic carbon—were carried out to determinethe total soil organic carbon content in the project area. The Soil Bulk Densityis the ratio of oven-dry mass to the core volume of the sample. It wasdetermined by the core method. The sample was dried at 1100± 10 C andweighed for the oven-dry mass, which was divided by the volume of thecylindrical metal sampler. The soil organic carbon (SOC) analysis was doneusing the Colorimetric method with the external heating method and standardlaboratory procedures described by Anderson et al. (1993) and Baker (1976).From the values obtained, SOC (Mg ha-1) was calculated using the equationadopted from Pearson et al. (2005), given below:
SOC (Mg/ha) =(Soil Bulk Density (gm/cm3) × Soil Depth (cm) × C) × 100
(Equation 2)
Where C is the carbon fraction of the sample expressed as a decimal.
The total soil carbon stock in the forest was calculated from the averagecarbon stock of all plots, extrapolated to per ha and multiplied by the totalforest area.
Total carbon stock
All biomass measurements, including aboveground biomass, belowgroundbiomass, and litter were converted into carbon content and summed up fortheir respective plots in tons of carbon per hectare using an appropriateexpansion factor based on the area of each plot. The expansion factor for thetotal forest area was derived by summing up the carbon per hectare resultsfor all plots, including soil organic carbon, divided by the total number of
Table 10.3 Ratio of Belowground Biomass to Aboveground Biomass
Chapter 10 - Forest carbon accounting: Lessons learnt from a pilot project in Western Nepal

Ready for REDD? Taking Stock of Experience, Opportunities and Challenges in Nepal
122
sample plots. This expansion factor was used to calculate the total carbonstock of the project area.
Projecting baseline and with-project scenario
The baseline scenario provides potential forest cover change andcorresponding carbon stock changes under a business-as-usual (i.e. no-project)scenario. To define the current status of carbon stock and project the futuresequestration potential of the forests, two types of data were analyzed: i)spatial data to estimate the current area under different land uses as well asfuture projections; and ii) forest carbon inventory data to estimate the carbonstock (Mg C ha-1) in the major carbon pools. The deforestation rate withoutthe project scenario is the product of the area that would have been deforestedin the absence of the project and the carbon stock lost through deforestation.The carbon stock lost through deforestation is the average carbon stock perha minus the average residual carbon stock that remains post-deforestation.
To estimate the effect of protecting such an area on the net reduction ofcarbon dioxide emissions, it is important to determine the likelihood or riskthat a given area will be deforested. Projected rates of deforestation cansubsequently be combined with this risk assessment and estimates of carbonstocks in the forests to produce estimates of the net GHG emissions thatwould occur if the area was not protected. To develop a framework forreporting carbon benefits from forest protection activities, a spatial modelingapproach of deforestation and quantitative analysis of future modeleddeforestation (projected baseline) combined with a field inventory was used.Carbon stock changes due to degradation will bedetermined by the stockdifference of the permanent sample plots in the subsequent inventories.
The baseline scenario was compared to the with-project scenario, in whichfewer hectares are deforested and there is a lower rate of degradation due toproject activities. Emissions reductions from avoided deforestationattributable to the project were then calculated as the difference between thewith-project and without-project hectares deforested multiplied by the averagecarbon stock lost through deforestation.
Drivers of deforestation and forest degradation
Baseline drivers of deforestation and forest degradation are defined as theactivities predominantly taking place in the absence of the project, which the

123
project will reduce. Like elsewhere in the country, the project-specificdriversof deforestation and forest degradation lie outside the direct influence of theforestry sector. The major drivers of deforestation and degradation areagriculture, energy, urbanization, infrastructure development and demographicchanges.The drivers act at different levels and the people engaged in activitiesthat cause deforestation and degradation are called ‘baseline agents’. Baselineagents of deforestation and forest degradation in the project area includeforest dependent communities, migrants, landless and forest dwellers, cattleranchers, fuelwood collectors, and timber contractors, including industrieslike Katha-cutch, pulp and paper, plywood and furniture.
With-project deforestation projection
After 20 years of project implementation, the deforestation rate is assumedto be constant for the remainder of the 30-year analysis period as we assumethat there is some residual deforestation that cannot be eliminated. Thefollowing exponential decay function was used:
Ratetime2 = Ratetime1×(1-k)20
Projection of emissions reductions
By multiplying the difference in the area deforested with and without theproject,during the project period,with the average CO2 emissions fromdeforestation per ha gives an estimate of the avoided emissions attributableto the project each year.This is a conservative estimate of emission reductionsthat could be claimed by the project. This estimate is most likely anunderestimation of the emission reductions achieved as the technique usedwas conservative and does not incorporate the carbon stored in wood productsfor a long period of time. Non-CO2 GHG emissions represent an additionaland potentially significant component of the project’s overall GHG emissionsbenefit. The current analysis does not consider any changes in non-CO2 GHGemissions due to avoided deforestation. However, methane (CH4) emissionsfrom forest fire could be a significant part of the baseline scenario.
Leakage, permanency and additionality
Leakage as a negative externality of the project can cause loss of net carbonbenefits of the project as a consequence of the implementation of leakage
Chapter 10 - Forest carbon accounting: Lessons learnt from a pilot project in Western Nepal

Ready for REDD? Taking Stock of Experience, Opportunities and Challenges in Nepal
124
triggering project activities. Leakage is associated with drivers and agents ofdeforestation and degradation. The potential magnitude of leakage of anyactivity is determined by the extent of the unmet demand and the compatibilityof the activity with present land use and management practices. During thebaseline study, project activities that can trigger possible leakage wereidentified and alternative livelihood activities were explored in order to reduceleakage. Potential leakage was estimated using a twin track approach: byidentifying the key indicators such as demand and supply of fuelwood andtimber from the project area and by establishing permanent sample plots inthe leakage belts.
Baselinesof the rate of collection of fuelwood, timber and other forest productsfrom the project area were collected through participatory rural appraisaland a household survey. During each verification period, subtracting the with-project rate from the baseline rate of forest products collection provides anestimate of the volume of fuelwood, timber and other forest products displacedoutside the project area by the project activity. Furthermore, permanent sampleplots at the major leakage belts were established for monitoring andverification purposes.
Forests are not permanent stores of carbon; natural or anthropogenicdisturbances, such as fire, pests or land-use change decisions can result inGHG emissions from forests that were once protected. The potentialreversibility of sequestered/protected carbon must be addressed to be eligiblefor REDD/VCS crediting.REDD activities will delay deforestation for a finiteperiod of time (VCS 2007). To mitigate the risk of non-permanence, VCSuses a buffer mechanism to secure long-term carbon benefits of the REDDproject activities. However, at this preliminary stage, only the principal riskfactors for a REDD project and potential mitigating activitieswereidentifiedduring the survey and consultation workshops using PRA tools.
Drivers and agents that bear risks for permanence were identified. The overallrisk rating of the project is recommended to be done in the stages of projectdesign, implementation and monitoring. During project design, non-permanence risk analysis was recommended following the VCS (2007)recommended “risk likelihoods x significance” approach to assess bothquantitative and qualitative risks in an integrated manner and to come to asingle overall risk classification of “low”, “medium”, “high” or “unacceptablyhigh”.

125
In order to satisfy additionality, the project must demonstrate that the increasein the carbon stock from the project is additional to what would have happenedin the absence of the project. The following three VCS-proposed tests werecarried out to demonstrate that the project was additional:
• Project test• Performance test• Technology test
Quality assurance and quality control
Forest inventory teams were comprised of a forest technician, local resourcepersons and community members. The teams were supported by forestryexperts from Winrock International and WWF. Prior to conducting field work,each member of the team was trained on all aspects of data collection. Stepby step procedures and standard data collection formswere prepared for thefield work. Checking of measurement techniques as well as measured datawasalso done by the experts. A Forest Carbon Expert and a Social SurveyExpert monitored, supervised and carried out different checks in order toensure the quality of the field work. Two different types of checks wereconducted during the baseline survey:
• Hot Check and• Blind Check
Hot checks were done during the inventory work in the presence of crewmembers and feedback and suggestions were provided on the spot. Besideson the spot coaching, guidance through mobile phone was provided in thecase of any confusion during the field work. Blind checks were carried outafter the completion of inventory work by the crew.
Uncertainty assessment
The calculation of total uncertainty was done by the simple error propagationmethod.
Chapter 10 - Forest carbon accounting: Lessons learnt from a pilot project in Western Nepal

Ready for REDD? Taking Stock of Experience, Opportunities and Challenges in Nepal
126
10.4 The way forward
Frequency of monitoring
Since the measurement involvedground based carbon inventory, samemethodis recommended for monitoring purposes in the future as well.However, since the magnitude and rate of change of carbon stocks variesfrom pool to pool, different time intervals are prescribed for the purpose ofmonitoring. Considering global as well as national practicesof forest inventory,five-year intervals are recommended for the re-measurement of biomass.Thiscan be shortened upon the availability of resources for inventory and therequirements of verification. To detect carbon emissions from forestdegradation, yearly monitoring is recommended. Soil organic carbon is to bemeasured every 10 years due to the slow response of the soil.
Capacity building of stakeholders and community-based carbonmonitoring
The project area is a mosaic of forest management modes, includingcommunity forests, government-managed national forests, private forests andagro-forestry plots. The study estimated that a significant part of the projectforest area is covered by community forests. Management practices of thesecommunity forests, therefore, play a vital role both in the carbon sequestrationrate as well as the permanency of the sequestrated carbon. Capacity buildingof these communities for an optimal combination of management practicesto derive multiple benefits and perform carbon monitoring should be acomponentof the project. Development of LRPs during the baseline inventoryperiod was the first step towards capacity building of the local communities.These LRPs are expected to support the concerned CFUGs in future carbonand forest inventory work. Such inventory work is mandatory for the renewalof community forest management plans which are usually stipulated for fiveyears.
In order to increase carbon sequestration rates to maximize benefits fromcarbon financing, it is imperative to integrate carbon stock inventories intocommunity forest management plans. The management activities that increasethe sequestration rate and reduce emissions should be incorporated intomanagement plans. This can be done by community-based training andawareness-building activities during the project period. Periodic carbon
127
inventory data should be incorporated into the community forest managementplans as carbon sequestration is one of the forest management objectives.
Scoping for the voluntary market
The baseline information is required for the preparation of a project designdocument for the carbon forestry project. Even in the best-case scenario,REDD will take more time to materialize under a compliance market.Therefore the project can benefit from the voluntary market. The ex-antequantification of the baseline and with-project scenario were calculated inorder to determine the feasibility of the project and to select significant carbonpools. Some carbon pools were excluded from the calculation to generate aconservative estimate of the number of carbon credits generated. To be eligiblefor REDD projects under VCS, the boundary of the REDD activity should beclearly delineatedand defined and include only land qualifying as “forest”for a minimum of 10 years prior tothe project start date.
The project comprises the following VCS REDD activities:
• Avoiding unplanned frontier deforestation and degradation(AUFDD): reduces GHG emissionsby stopping deforestation/degradation of degraded to mature forests at the frontier that hasbeenexpanding historically, or will expand in the future, as a result ofimproved forest access.
• Avoiding unplanned mosaic deforestation and degradation(AUMDD): reduces GHG emissionsby stopping deforestation/degradation of degraded to mature forests occurring under themosaicconfiguration.
The baseline report of the proposed project for VCS REDD has two maincomponents:
• A land-use and land-cover change component; and
• An associated carbon stock change component.
Baselineprojections of deforestation and degradation under the AUFDD andAUMDD activities have been developed considering the deforestation ratesof the Terai region in which the project area is located. Thistakes into accounthistorical deforestation and degradation rates.Also the proposed regionalbaseline areais similar to the project area in terms ofthe drivers of
Chapter 10 - Forest carbon accounting: Lessons learnt from a pilot project in Western Nepal

Ready for REDD? Taking Stock of Experience, Opportunities and Challenges in Nepal
128
deforestation/degradation, landscapeconfiguration and socio-economic andcultural conditions.
10.5 Lessons for national and sub-national REDD projects
Choice of methods
As discussed earlier, the baseline report of the proposed project for VCSREDD has to have two main components: a land-use and land-cover changecomponent; and an associated carbon stock change component. To detectland-use and land-cover change in the project area, remote sensing is notonly a useful tool but it can also be used for stratification of the project area.However, the lack of Landsat images for the desired years was a majorchallenge for the study. Adequate planning is essential for the use of remotesensing in forest carbon inventories.In Nepal’s context, communityinvolvement in carrying out regular forest inventories is high. In addition,the field labor costs are low. Considering the limited access to remote sensing,ground-based forest inventory techniques for measuring changes in carbonstocks should be given priority.
Two methods can be employed to determine carbon stock changes: the Gain-Loss Method based on estimates of annual change in biomass from estimatesof biomass gain and loss; and a Stock-Difference Method which estimatesthe difference in total biomass carbon stock over a particular time period.The biomass gain-loss method is applicable for all tiers. The stock-differencemethod will provide more reliable estimates for relatively large increases ordecreases in biomass or where very accurate forest inventories are carriedout. Since the project area covers a small area, the stock difference methodwas applied. For the national inventory system, the availability of data andinformation fromecological surveys, forest ownership patterns, activity data,conversion and expansion factors, as well as cost-benefitanalysis should betaken into consideration while choosing a methodology.
Biomass models
The IPCC Guidelines recommend local biomass models to estimate theaboveground and belowground biomass. However, there are some limitationsto using biomass models developed for Nepalese tree species. These biomass

129
modelshave coveredonly a small range of diameter classes and have notconsidered wood specific gravity of the species that Chave et al. (2005)conclude to be an important variable in the biomass function. The biomassmodels of major tree species and their associated species covering largerdiameter classes should be developed and used for carbon accounting.Otherwise, we have to rely on regional models that are publishedinternationally and may not yield the best estimates for Nepal.
Degradation analysis
Monitoring forest degradation requires mapping to be carried out at leastannually as the spatial signatures of the degraded forests can substantiallywithin one year. (GOFC-GOLD Project Office 2008). Due to the unavailabilityof annual images of the project area, it was not possible to predict the trendsin forest degradation and, consequently, avoidance of emissions from forestdegradation. In addition, monitoring methods based on remote sensing maynot be appropriate when gaps in the forest canopy are not detected. Therefore,the annual measurement of permanent sample plots, at least at the initialperiod, is recommended to detect and prepare a model of forest degradation.Ground measurements are also important to cover collection of dead woodand understory vegetation.
Institutional capacity
A suitable degree of organizational capacity within the country is required toestablish andoperate a national forest-carbon monitoring program.Prerequisites include the acquisition of different typesof data, analysis,estimation, and international reporting. Different actors and sectors need towork in coordination to make the monitoring system efficient in the longterm.Sustainability considerations are important in setting up a REDDmonitoring system.UNFCCC (2009) has recommended the establishment andmaintenance the following institutions as a minimum, with a clear definitionofroles and responsibilities:
• A national coordination and steering body or advisory board
• Central carbon monitoring, estimation and reporting authority/department
• Forest carbon monitoring implementation units
Chapter 10 - Forest carbon accounting: Lessons learnt from a pilot project in Western Nepal
Ready for REDD? Taking Stock of Experience, Opportunities and Challenges in Nepal
130
Like elsewhere, carbon inventory is in its infant stages in Nepal. TheDepartment of Forest Survey, which is responsible for monitoring nationalforest resources and reporting, and the Department of Forests, which regularlycarries out forest inventories for the preparation of community forests’Operational Plans, are yet to develop their capacities in this new field.Organizations like Winrock International/WWF, ICIMOD and individualresearchers have been working to take this forward. It is essential toconsolidate the knowledge of such organizations and individuals to design anational monitoring, reporting and verification (MRV) plan for the successof REDD in Nepal. In addition, research on the development of biomassmodels, upgrading facilities of central laboratories and devising robust andcontext-specific degradation analysis tools should be given major attention.Community forest management plans should incorporate carbon as a forestproduct and incorporate management activities for optimum carbonsequestration.
10.6 Conclusion
The pilot project was envisioned to ensure ecological, economic and socio-cultural integrity of the critical bottlenecks of the Terai Arc Landscape throughforest carbon financing. To realize this objective, a study was carried out toassess the carbon sequestration potential of the forests of the study area andto establish a baseline for the early action pilot project through enhancingknowledge and the scientific basis for REDD. The WWF/Winrock jointinitiative under the TAL program was the first in Nepal to provide majorsupport to prepare Nepal for REDD.
The carbon accounting methodology adopted for the study is based on thenational green house gas inventory guidelines (IPCC 2006). To address theissues of leakage, permanency and additionality, the Voluntary CarbonStandards (2007) were followed whereas the Bio-Carbon Fund/WinrockInternational “Sourcebook for land use, land use change and forestry projects”was followed for field measurements. Furthermore, the “REDD Source bookof Methods and Procedures for Monitoring, Measuring and Reporting”prepared by the GOFC-GOLD Project Office was used for the land use andland use change analysis.The pilot study demonstrated that state-of-the-artcarbon accounting technologies can be implemented in Nepal in collaborationwith local stakeholders. In addition, this project has also demonstrated thatby involving local stakeholders, carbon accounting can be made more
131
sustainable and cost-effective, especially in terms of monitoring, reportingand verification (MRV) procedures.
The study has faced several limiting factors andidentified gaps in carbonaccounting that should be addressed in national level MRV systems. The useof and access to remote sensing technologies and their implications fordependency on developed countries; the development of appropriate biomassmodels for a wide range of forest types including important parameters;capacity building of local stakeholders; choice of methods; the equipping ofcentral laboratories; selection of degradation analysis methods; and theoptimal combination of multiple forest management objectives are some ofthe issues that need to be addressed in a national level MRV system. Researchand the sharing of innovative technologies across the North-South, South-South, and South-North divides, and among the various stakeholders withina country, should be encouraged. The establishment of an effective andefficient institutional setup at the national as well as regional level thatencourages broad-based participation is also key to making REDD a reality.
Chapter 10 - Forest carbon accounting: Lessons learnt from a pilot project in Western Nepal

Ready for REDD? Taking Stock of Experience, Opportunities and Challenges in Nepal
132

133
References
Acharya, K.P. 2000. Unfavourable Structure of Forest in the Terai of NepalNeeds Immediate Management. Banko Janakari 10(2). pp. 25-28.
Adhikari, K. 2005. Estimating Carbon Dynamics in a Nepalese CommunityForest, MSc Thesis. Tribhuvan University: Kathmandu.
Alexander, Pfaff and Robalino, Juan. 2008. Evaluating policy impacts on tropicaldeforestation: Implication for REDD costs. Workshop on “ The cost ofreducing carbon emissions from deforestation and forest degradation” May27th 2008. Washington, DC.
Amatya, S.M., and Shrestha, K.R. 2002. Nepal Forestry Handbook. ForestryResearch Support Programme for Asia and the Pacific (FORSPA) Food andAgriculture Organization of the United Nations: Bangkok.
Anderson, J M., and Ingram, J. S. I. 1993. Tropical Soil Biology and Fertility: Ahandbook of Methods. CAB International.
Angelsen, A. (ed.). 2008. Moving ahead with REDD: Issues, Options andImplications. CIFOR: Bogor.
Asner, G.P., Knapp, D.E., Broadbent, E.N., Oliveira, P.J.C., Keller, M., and Silva,J.N.M. 2005. Selective logging in the Brazilian Amazon, Science, 310. pp.480–482.
Avery, T. E. and Burkhart, H. E., eds. 1983. Forest Measurements. 3rd ed. NewYork: McGraw-Hill.
Awasthi, L.D. 2004. Exploring monolingual school practices in multilingualNepal. Unpublished doctoral dissertation,.Danish University of Education:Copenhagen.
Bajracharya, M.K. 1986. Forests of Nepal: an introduction.
Barnsley, Ingrid. 2009. Reducing emissions from deforestation and forestdegradation in developing countries (REDD): A guide for IndigenousPeoples. United Nations University Institute of Advanced Studies:Yokohama.
Belbase, N. and Regmi, D.C. 2002. Potential for Conflict: Community Forestryand Decentralisation Legislation in Nepal. Talking Points 1/10. ICIMOD:Kathmandu.

Ready for REDD? Taking Stock of Experience, Opportunities and Challenges in Nepal
134
Bhandari, S.K. 2008. Prospects of carbon trade in poverty reduction in Nepal,A case study of Kafley Community Forest on Lamatar VDC, Lalitpur,Business Development Studies Thesis. Kathmandu University: Kathmandu.
Bhattachan, K.B. 2008. Minorities & IPs of Nepal. National Coalition AgainstRacial Discrimination (NCARD): Kathmandu.
Blaikie, P. and Springate-Baginski, O. 2007. Setting Up Key Policy Issues inParticipatory Forest Management. Forests, People and Power: The PoliticalEcology of Reform in South Asia. Blaikie, P. and Springate-Baginski, O.,(eds). Earthscan: London. pp: 1-23.
Caplan, L. 2000. Land and social change in east-Nepal: a study of Hindu-tribalrelation. Himal Books: Lalitpur.
Capoor, K. and Ambrosi, P. 2009. State and Trends of the Carbon Market2009.The World Bank: Washington, DC.
CCBA. 2008. Climate, Community & Biodiversity Project Design Standards.Second Edition. CCBA, Arlington, VA. December, 2008. Available at:www.climate-standards.org. (accessed at November 15 2009)
Central Bureau of Statistics (CBS). 2001. Population Monograph. Kathmandu.
Chave, J., Andalo, C., Brown, S., Cairns, M. A., Chambers, J. Q., Eamus, E.D.,Folster, H., Fromard, F., Higuchi, N., Kira, T., Lescure, J. P., Nelson, B. W.,Ogawa, H., Puig, H., Reira, B., and Yakamura, T. 2005. Tree allometry andimproved estimation of carbon stocks and balance in tropical forests.Ecosystem Ecology. Oecologia 145. pp 87–99.
Daniggelis, E. 1997. Hidden wealth: the survival strategy of foraging farmersin the upper arun valley eastern Nepal. Mandala Book Point: Kathmandu.
DFRS. 1999. Forest Resources of Nepal. Department of Forest Research andSurvey, Publication no. 74. Kathmandu.
DFRS. 2008. Contribution of Forestry Sector to Gross Domestic Product inNepal, Department of Forest Research and Survey. Kathmandu
Dhakal, B. 2008. Carbon Liability, Market Price Risk and Social Impact ofReducing Emissions from Deforestation and Forest Degradation (REDD)Program. Journal of Forest and Livelihood 8 (1). pp: 60.
DoF. 2000. Biomass and Volume Tables with Species Description for CommunityForest Management. Tree Improvement and Silviculture Component.Government of Nepal.

135
Doug, B. 2008. Estimating the costs and the potential of reducing emissionsfrom deforestation: Tropical Forests and Climate. Briefing No. 1. Union ofConcerned Scientist.
Ebeling, J. and Yasue, M. 2008. Generating carbon finance through avoideddeforestation and its potential to create climatic, conservation, and humandevelopment benefits. Philosophical Transactions of the Royal Society B,363. pp. 1917–1924.
Eliasch J. 2008. Climate change: Financing global forests - Eliasch Review.UK Office of Climate Change: www.occ.gov.uk/activities/eliasch.htm.
FACD. 2009. Official Record of Foreign Aid Coordination Division. Ministryof Forests and Soil Conservation: Kathmandu.
FAO. 2005. Global Forest Resources Assessment 2005: Nepal Country Report.Forestry Department, FAO, Country Report 192. FAO, Rome.
FAO. 2004. FAO Forestry Country Profile. Natural woody vegetation. Availableat: http://www.fao.org/forestry/6426/en/npl
FAO. 2006. Global Forest Resources Assessment 2005. Progress towardssustainable forest management. FAO Forestry paper 147.FAO, Rome.
FAO. 2009. Global Forest Resources Assessment 2010. Nepal Country report.FAO, Rome.
Federation of Community Forestry Users-Nepal (FECOFUN) Webpage, 2008:http://www.fecofun.org/page.php?page=introduction
FSCC. 2003. Proceedings of the Eleventh Meeting of the Forestry SectorCoordination Committee, 28 February 2003. Organized by Ministry ofForests and Soil Conservation.
G.C., D.B. 2008. Carbon Sequestration Potential and Uses of Dendrocalamusstrictus, BSc Thesis. Institute of Forestry, Tribhuvan University: Kathmandu.
Gibbs, H. K., Brown, S., Niles, J. O., and Foley, J. A. 2007. Monitoring andEstimating Tropical Forest Carbon Stocks: Making REDD a reality.Environment Research Letters2(2007). pp. 13.
Giest, H.J. and Lambin, E.F., 2002. Proximate causes and underlying drivingforces of tropical deforestation. Bioscience 52 (2): pp. 143-149.
Gilmour, D.A. and Fisher, R.J. 1991. Villagers, Forest and Foresters: thePhilosophy, Process and Practice of Community Forestry in Nepal.Kathmandu, Sahayogi Press. pp.212.
References

Ready for REDD? Taking Stock of Experience, Opportunities and Challenges in Nepal
136
Global Timber. An informal note on REDD investment and “deforestation”emissions. http://www.globaltimber.org.uk/REDD.pdf (accessed onNovember 26 2009)
GOFC-GOLD Project Office. 2008. Reducing Greenhouse Gas Emissions fromDeforestation and Degradation in Developing Countries: a Sourcebook ofMethods and Procedures for Monitoring, Measuring and Reporting. GOFC-GOLD Report version COP13-2. Natural Resources Canada. Alberta,Canada. Available at: http://www.gofc-gold.uni-jena.de/redd/
GoN. 1993. Forest Act 1993.
GoN. 2000. Nepal National Capacity Self-Assessment Report and Action Plan.National Capacity Self Assessment for Global Environment Management.Ministry of Environment, Science and Technology. Kathmandu.
GoN. 2006. Interim Constitution of Nepal. Himali Prakashan: Kathmandu.
GoN/CFDP. 2003. Samudayik Ban Srot Sarbenchhan Margadarsan, Departmentof Forest, Kathmandu.
Grainger, A. 2008. Difficulties in tracking the long-term global trend in tropicalforest area. Proceedings of the National Academy of Science USA, 105.pp.818–823.
Gullison, R.E., Frumhoff, P.C., Canadell, J.G., Field, C.B., Nepstad, D.C.,Hayhoe, K. Avissar, R., Curran, L.M., Friedlingstein, P., Jones, C.D. andNobre, C. 2007. Tropical Forests and Climate Policy. Science 316. pp. 985-986.
Gurung, M B. and Joshi, C. 2009. Assessment of Forest Carbon Potential ofRiverine Forests at the Khata Corridor and Lamahi-Mahadevpuri Complex,Nepal. Baseline Report submitted to WWF.
Gurung, M. 2009. Assessment of forest carbon potential of riverine forests atthe Khata Corridor and Lamahi-Mahadevpuri complex. Presented in NationalSharing Workshop in Everest Hotel on 25th August 2009. Organized byWWF-Nepal/WINROCK international and Terai Arc Landscape.
HMG. 1966. Forest statistics of Terai and Adjoining Regions. Forest ResourcesSurvey, Department of Forestry. Nepal.
HMG. 1969. Timber Resources and Development Opportunities in the LowerBheri and Karnali Region. Forest Resources Survey. Department of Forestry:Nepal.

137
HMG. 1973. Forest statistics: Hill region, Forest Resources Survey. Departmentof Forestry: Nepal.
ICF International. 2009. Fostering Carbon Markets Investment in REDD: FinalReport. Meridien Institute.
INSEC. 2004. Nepal Human Rights Year Book. Kathmandu
IPCC. 2003.Good Practice Guidance for Land Use, Land Use Change andForestry, edited by Penman, J, M Gytarsky, T Hirashi T Krug, D Kruger, RPipatti, L Buendia, K Miwa, T Ngara, K Tanabe, and F Wagner.Intergovernmental Panel on Climate Change.
IPCC. 2000. Land use, land-use change, and forestry. Special Report of theIntergovernmental Panel on Climate Change. Cambridge University Press,Cambridge.
IPCC. 2001. Climate Change 2001. The Scientific Basis. Contribution of WorkingGroup I to the Third Assessment Report of the Intergovernmental Panel onClimate Change. New York: Cambridge University Press.
IPCC. 2001. Land Use, Land-Use Change and Forestry.IPCC Special reportson Climate Change. Available at: http://www.grida.no/publications/other/ipcc_sr/
IPCC. 2003. Good Practice Guidance for Land Use, Land-Use Change andForestry. IPCC National Greenhouse Gas Inventories Programme, Institutefor Global Environment Strategies, Kanagawa, Japan.
IPCC. 2006. Eggleston, H. S., Buendia, L., Miwa, K., Ngara, T. and Tanabe, K.(eds.). IPCC Guidelines for National Greenhouse Gas Inventories. Preparedby the National Greenhouse Gas Inventories Programme. Institute for GlobalEnvironmental Strategies: Japan.
IPCC. 2007. Summary for Policymakers. Solomon, S., Qin, D., Manning, M.,Chen, Z., Marquis, M., Averyt, K.B., Tignor, M. and Miller, H.L. (eds.).Climate Change 2007: The Physical Science Basis. Contribution of WorkingGroup I to the Fourth Assessment Report of the Intergovernmental Panelon Climate Change. Cambridge, UK: Cambridge University Press.
Jackson, J. K. 1987. Manual of Afforestation in Nepal. Nepal-UK ForestryResearch Project, Kathmandu.
Kanel, R.K. 2004. Twenty Five Years’ of Community Forestry: Contribution toMillennium Development Goals. Proceedings of the Twenty-five Tears ofCommunity Forestry: Proceedings of the Fourth National Workshop on
References

Ready for REDD? Taking Stock of Experience, Opportunities and Challenges in Nepal
138
Community Forestry, Kanel, R.K., Mathema, P., Kandel, B.R., Niraula, D.R., Sharma, A. R. and Gautam, M., (eds). Kathmandu. pp. 4-18.
Kanninen, M., Murdiyarso, D., Seymour, F., Angelsen, A. Wunder, S., German,L. Do Trees Grow on Money? The Implications of Deforestation Researchfor Policies to Promote REDD. Forest Perspectives 4. CIFOR: Bogor.
Kant, S. 2004. Economics of sustainable forest management. Forest Policy andEconomics 6 (3-4): 197-203.
Kant, S., and Berry, R.A. (eds.). (2005). Economics, sustainablity, and naturalresources: Economics of sustainable forest management. Dordrecht: Springer
Karky, B. S. and Banskota, K. 2008. Reducing Emissions from Nepal’sCommunity Forests: Discussion for CoP 14 in Poznan.Journal of Forestand Livelihood Vol 8 (1). pp.34.
Karky, B.S. 2008. The Economics of Reducing Emissions from CommunityManaged Forests in Nepal Himalaya. PhD thesis, University of Twente,Centre for Clean Technology and Environmental Policy. Enschede.
Karky, B.S. and Banskota, K. 2009. Reducing Emissions from Nepal’sCommunity Managed Forests: Discussion for COP 14 in Poznan. Journalof Forest and Livelihood 8 (1).
Karsenty, Alain. 2008. The Architecture of Proposed REDD Schemes After Bali:Facing Critical Choices. International Forestry Review 10 (3).
Khanal, Y. 2008. Valuation of Carbon Sequestration and Water Supply Servicesin Community Forests of Palpa District, MSc Thesis. Institute of Forestry:Pokhara.
Kotru, R. 2008. Nepal’s National REDD Framework: How to Start? Journal ofForest and Livelihood Vol 8 (1). pp.52.
Lambin, E.F. 1999. Monitoring forest degradation in tropical regions by remotesensing: some methodological issues. Global Ecology and Biogeography 8.pp. 191-198.
LRMP. 1985. Land Utilization Report, HMG/Kenting Earth Science Limited.
LRMP. 1986. Summary Report, HMGN/Government of Canada. Kenting EarthSciences Limited: Kathmandu.
Lubowski, N. R. 2008. Moving ahead with REDD: Issues, options, andimplications. CIFOR: Bogor.

139
Lubowski, N. R. 2008. The role of REDD in stabilizing greenhouse gasconcentrations: lessons from economic models. Brief info No 18. CIFOR:Bogor.
MacDicken, K. 1997. A Guide to Monitoring Carbon Storage in Forestry andAgroforestry Projects. Winrock International: Arlington.
Mahat, T.B.S. 1987. Forestry-Farming Linkages in the Mountains. ICIMODOccasional Paper No. 7. Kathmandu. pp.48.
Malla, YB. 2000. Impacts of Community Forestry Policy in Rural Livelihoodsand Food Security in Nepal. Unasylva 200. pp.38–45.
MEA, 2005. Millennium Ecosystem Assessment. Ecosystem and Human WellBeing: Synthesis report. Island Press: Washington DC.
MFSC. 2006. Agreements between Ministry of Forests and Soil Conservationand FECOFUN, ACOFUN. Ministry of Forests and Soil ConservationOfficial Report.
MoE. 2009. National Adaptation Program of Action (NAPA) Project to ClimateChange in Nepal. NAPA Progress Updates 1: August 2009
MoEST. 2008. State of the Environment (Agriculture, Forest and Biodiversity).Ministry of Science, Technology and Environment: Kathmandu.
MoFSC. 2005. Economic Valuation of Ecological Goods and Services. Ministryof Forest and Soil Conservation: Kathmandu.
Mokany, K., Raison, J. R. and Prokushkin, A. S. 2006. Critical analysis of root-shoot ratios in terrestrial biomes. Glob. Change Biology 12 (1). pp. 84-96.
MoPE, 2004. Initial national communication to the Conference of the Parties ofthe United Nations Framework Convention on Climate Change. Ministry ofPopulation and Environment (MoPE). Kathmandu.
Motel, P. et al. 2009. A methodology to estimate the impacts of domestic policieson deforestation: Compensated successful efforts for avoided deforestation“REDD”. Ecological Economics 68 (2009): pp. 680-691.
Moura- Costa, P. 2009. Avoided Deforestation as a GHG Mitigation ComplianceActivity. Ecosecurities PLC.
MPFS. 1989. Master Plan for Forestry Sector, Forestry Resource Informationand Planning Report. Ministry of Forest and Soil Conservation: Kathmandu.
References

Ready for REDD? Taking Stock of Experience, Opportunities and Challenges in Nepal
140
NASA. 2005. Landsat 7 Science data user handbook. Available at: http://ltpwww.gsfc.nasa.gov/IAS/handbook/handbook_toc.html.
NBS 2002. Nepal Biodiversity Strategy. Ministry of Forests and SoilConservation: Kathmandu.
NEFDIN. 2002. National foundation for the development of indigenousnationalities Act. Kathmandu.
Nepal Foresters’ Association. 2008. Feasibility Analysis of REDD (ReducingEmissions from Deforestation and Degradation in developing countries) inthe context of Nepal. WWF-Nepal: Kathmandu.
Ojha, H., Baral. J., Dahal, N. Subedi, R. and Branney, P. 2008. Can Nepal Benefitfrom Forest Carbon Financing? An Assessment of Opportunities, Challengesand Possible Actions. Livelihoods and Forestry Programme.
Oli, B. N. & Shrestha, K. 2009. Carbon Status in Forests of Nepal: An Overview.Forest and Livelihood, 8(1). pp. 62-66.
Pagiola. S., and Bosquet, B. 2009. Estimating the costs of REDD at the countrylevel. Version-1 (24 February 2009). Forest Carbon Partnership Facility. TheWorld Bank: Washington, DC.
Pandey, K.K. 1982. Fodder trees and tree fodder in Nepal. Swiss DevelopmentCorporation and Swiss Federal Institute of Forest Research: Switzerland.
Panta, M., Kyrhyun, K. and C. Joshi 2008. Temporal mapping of deforestationand forest degradation in Nepal: Applications to forest conservation, ForestEcology and Management (256). pp. 1587-1595.
Parker, C., Mitchell, A. Trivedi, M., and Mardas, N. 2009. The Little REDD+Book. Global Canopy Foundation.
Pearce, D. 1996. Global Environmental Value and the Tropical Forests:Demonstration and Capture. In Smith, J., and Scherr, S.J., 2002. Forestcarbon and Local Livelihoods: Assessment of Opportunities and Policyrecommendations. CIFOR Occasional Paper no. 37.
Pearson, T. R.H.; Brown, S. L.; Birdsey, R. A. 2007. In Measurement Guidelinesfor the Sequestration of Forest Carbon. General Technical Report NRS-18.Newtown Square, PA: U.S. Department of Agriculture.
Pearson, T., Walker, S. and Brown, S. 2005. Sourcebook for land use, land-usechange and forestry projects. Winrock International and the BioCarbon Fundof the World Bank.

141
Penman, J. et al. 2003. Good practice guidance for land use, land-use changeand forestry.IPCC National Greenhouse Gas Inventories Programme andInstitute for Global Environmental Strategies, Kanagawa, Japan.Availableat: http://www.ipcc-nggip.iges.or. jp/public/gpglulucf/gpglulucf.htm
Peskett, Leo, Huberman, David, Bowen-Jones, Evan, Edwards, Guy and Brown,Jessica. 2008. Making REDD Work for the Poor. Poverty EnvironmentPartnership Report.
Pokharel, B. and Baral, J.C. 2008. From Green to REDD, from Aid to Trade:Translating the Forest Carbon Concept into Practice. Journal of Forest andLivelihood Vol 8 (1). pp.39.
Pokharel, B., Byrne, S. 2009. Climate Change Mitigation and AdaptationStrategies in Nepal’s Forest Sector: Can Rural Communities Benefit? NSCFPDiscussion Paper No. 7. Nepal-Swiss Community Forestry Project:Kathmandu.
Putz, F. E., Zuidema, Pieter A., Pinard, M. A., Boot, R. G., Sayer, J. A., Sheil,D., Sist, P., Elias, Vanclay, J. K. 2008. Improved Tropical Forest Managementfor Carbon Retention. PLos Biology 6(7). pp. 166.
Rana, E.B. 2008. REDD- an Option of Carbon Finance and Its Impact ofLivelihoods of Users in Nepal: A Case Studry from Dhading District, MScThesis. University of Munich: Germany.
Ranabhat, S., Awasthi, K.D. and Malla, R. 2008. Carbon Sequestration Potentialof Alnus nepalensis in the mid hills of Nepal, A Case Study from KaskiDistrict. Banko Jankari 18(2). pp. 3-9.
REDD-Monitor. 2008. Analysis, opinions, news and views about ReducedEmissions from Deforestation and Forest Degradation. REDD-Monitor.Available at:
http://www.redd-monitor.org/2008/11/03/what-is-a-forest/#more-380
Rikimaru, A. 1996. LANDSAT TM Data processing Guide for Forest CanopyDensity Mapping and Monitoring Model. ITTO workshop on utilization ofremote sensing in site assessment and planning for rehabilitation of logged-over forests. Bangkok, Thailand, July 30-Agusut 1,1996. pp.1-8.
Rikimaru, A. 2002. Concept of FCD mapping model and semi-expert system.Paper presented at the International Workshop on Tropical Forest CoverAssessment and Conservation Issues in Southeast Asia, 12–14 February 2002.Dehradun, India, IIRS.
References

Ready for REDD? Taking Stock of Experience, Opportunities and Challenges in Nepal
142
Rikimaru, A., S. Miyatake. 1997. Development of Forest Canopy DensityMapping and Monitoring Model Using Indices of Vegetation, Bare Soil andShadow. Available at: http://www.gisdevelopment.net/aars/acrs/1997/ts5/ts5006.shtml
Roy, P.S., S. Miyatake., A.Rikimaru. 1997. Biophysical Spectral ResponseModeling Approach for Forest Density Stratification. Available at: http://www.gisdevelopment.net/aars/acrs/1997/ts5/ts5008.shtml
Rudel, T.K., O.T. Coomes, E. Moran, F. Achard, A. Angelson, J. Xu, and E.Lambin, 2005. Forest transitions: Towards a global understanding of landuse change (Part A). Global Environmental Change 15 (1). pp. 23-31.
Santilli, M., Moutinho, P., Schwartzman, S., Nepstad, D., Curran, L., Nobre, C.2005. Tropical Deforestation and the Kyoto Protocol: An Editorial Essay.Climate Change 7. Mountinho, P. and Schwartzman, S. Instituto de PesquisaAmbiental da Amazonia and Environment Defense. Belem.
Seppala, R., Buck, A., and Katila, P. (eds.) 2009. Making Forests Fit for ClimateChange. ERWENKO.
Sharma, S. and J. Suoheimo 1995. Observation on rot in sal forests in the Terai,FMUDP working paper (20). HMGN/FINNIDA: Kathmandu.
Sherpa, P. D. 2002. Adivasis/Janajatis in National development: Major Issues,Constraints and Opportunities. IIDS: Kathmandu.
Sherpa, P. D. 2005. ILO Convention no 169 and peace building in Nepal. NEFIN:Kathmandu.
Sherpa, P.D. 2009.Challenges and Opportunities for indigenous nationalities inthe face of REDD partnerships in Nepal. Indigneous affairs: REDD andindigenous peoples. IWGIA: Denmark.
Shrestha, B.P. 2008. An Analytical Study of Carbon Sequestration in ThreeDifferent Forest Types of Mid-Hills of Nepal, A Case Study from Palpa,MSc Thesis. Institute of Forestry, Tribhuvan University: Pokhara.
Simula, M. 2009. Towards defining Forest degradation: Comparative analysisof existing definitions.Discussion Paper presented at the Technical Meetingon Assessment and Monitoring of Forest Degradation September 8-10 2009.FAO: Rome.
Singh, P.B. 2005. Carbon Sequestration in Community Forest System, BScThesis. Institute of Forestry, Tribhuvan University: Pokhara.

143
Skutsch, M., Bird, N., Trines, E., Dutschke, M., Frumhoff, P., de Jong, B.H.J.,van Laake, P., Masera, O., & D. Murdiyarso. 2007. “Clearing the Way forReducing Emissions from Tropical Deforestation.” Environmental Scienceand Policy, 10. pp. 322-34.
Souza, C., Firestone L., Moreira Silva L. Roberts, D. 2003. Mapping ForestDegradation in the Eastern Amazon from SPOT 4 through Spectral MixtureModels. Remote Sensing of Environment 87. pp. 494-506.
Springate-Baginski, O., Blaikie, P., Banerjee, A., Bhatta, B., Dev, O.P., Reddy,V.R., Reddy, M.G., Saigal, S., Sarap, K. and Madhu, S. 2008. Forests, Peopleand Power: The Political Ecology of Reform in South Asia. Blaikie, P. andSpringate-Baginski, O. (eds). Earthscan: London. pp: 27-60.
Staddon, S. 2009. Carbon Financing and Community Forestry: A Review of theQuestions, Challenges, and the Case of Nepal. Journal of Forest andLivelihood 8 (1).
Tauli-Corpuz, V., Chavez, R.D., Baldo-Soriano, E., Magata, H., Golocan, C.,Bugtong, M. V., Enkiwe-Abayao, L. and Carino, J. 2009. Guide on climatechange & indigenous peoples. TEBTEBBA: Baguuio.
Tewari, A. and Karky, B. S. 2007. Carbon Measurement Methodology andResults. Reducing Carbon Emissions through Community-managed Forestsin the Himalaya. Kamal Baskota, Bhaskar Singh Karky and Margaret Skutsch(eds.). ICIMOD: Kathmandu.
Tucker, C.J., Townshend, J.R.G. 2000. Strategies for monitoring tropicaldeforestation using satellite data. International Journal of Remote Sensing21. pp.1461–1471.
Uprety and Adhikari. 2006. A case study on marginalized indigenouscommunities’ access to natural resources in Nepal: National laws, policiesand practices. A report submitted to ICARRD. Kathmandu.
VCS. 2007. Voluntary Carbon Standard : Guidance for Agriculture, Forestryand Other Land Use Projects. VCS.
VCS. 2008. Voluntary Carbon Standard: Tool for AFOLU Methodological Issues.VCS
Viana, V. 2009. Financing REDD: Meshing Markets with Government Funds.IIED Briefing Papers (March 2009).
Viana, V. 2009. Seeing REDD in the Amazon: A win for people, trees and climate.IIED Opinions (March 2009).
References

Ready for REDD? Taking Stock of Experience, Opportunities and Challenges in Nepal
144
WECS. 2001. Wood energy planning Nepal. Water and Energy CommissionSecretariat. HMG: Nepal.
WECS. 2008. Structure of Energy Consumption in Nepal. WECS, Kathmandu(unpublished office record).
Whitemand, P.T.S. 1980. Agronomy research in the hills areas of Nepal. Terminalreport. FAO: Rome.
WRI. http://www.wri.org/stories/2008/07/groundbreaking-study-finds-hotspots-most-responsible-deforestation
WWF. Nd. WWF Forest Carbon Project Checklist. WWF.
Wyatt-Smith, J. 1982. The Agriculture System in the Hills of Nepal. APPROSC.
Zahabu, E. 2009.Community measurement of carbon stock changes for REDD.Presented at the technical meeting on assessment and monitoring of forestdegradation September 8-10 2009. FAO: Rome.

xvii
International climate negotiations are starting to give shape to anew policy mechanism that will provide incentives to reducecarbon dioxide emissions from deforestation and forestdegradation (REDD) by compensating developing countries fortheir forest conservation and regeneration efforts. How ready isNepal to implement REDD? Does it have the necessaryinstitutions and technical capacity? To what extent can Nepalbenefit, and in what areas and ways?
Ready for REDD? Taking Stock of Experience,Opportunities and Challenges in Nepal attempts to bringtogether some of the research and analyses that have been donein Nepal’s context. The book aims to introduce the REDD processto the general reader and to help them understand theimplications for Nepal. Anyone wanting to learn more aboutREDD’s diverse sociocultural, technical, economic, ecological,institutional and political challenges and opportunities in aspecific geographical context will benefit greatly from this volume.
ISBN 993721967 - 1