Gabon - Climate Change Knowledge Portal
32
GABON CLIMATE RISK COUNTRY PROFILE
-
Upload
khangminh22 -
Category
Documents
-
view
1 -
download
0
Transcript of Gabon - Climate Change Knowledge Portal

iiCLIMATE RISK COUNTRY PROFILE: GABON
COPYRIGHT© 2021 by the World Bank Group1818 H Street NW, Washington, DC 20433Telephone: 202-473-1000; Internet: www.worldbank.org
This work is a product of the staff of the World Bank Group (WBG) and with external contributions. The opinions, findings, interpretations, and conclusions expressed in this work are those of the authors and do not necessarily reflect the views or the official policy or position of the WBG, its Board of Executive Directors, or the governments it represents.
The WBG does not guarantee the accuracy of the data included in this work and do not make any warranty, express or implied, nor assume any liability or responsibility for any consequence of their use. This publication follows the WBG’s practice in references to member designations, borders, and maps. The boundaries, colors, denominations, and other information shown on any map in this work, or the use of the term “country” do not imply any judgment on the part of the WBG, its Boards, or the governments it represents, concerning the legal status of any territory or geographic area or the endorsement or acceptance of such boundaries.
The mention of any specific companies or products of manufacturers does not imply that they are endorsed or recommended by the WBG in preference to others of a similar nature that are not mentioned.
RIGHTS AND PERMISSIONSThe material in this work is subject to copyright. Because the WBG encourages dissemination of its knowledge, this work may be reproduced, in whole or in part, for noncommercial purposes as long as full attribution to this work is given.
Please cite the work as follows: Climate Risk Profile: Gabon (2021): The World Bank Group.
Any queries on rights and licenses, including subsidiary rights, should be addressed to World Bank Publications, The World Bank Group, 1818 H Street NW, Washington, DC 20433, USA; fax: 202-522-2625; e-mail: [email protected].
Cover Photos: © Philip Schuler/World Bank, “Dried Vlei with Petrified tree” August 11, 2011 via Flickr, Creative Commons CC BY-NC-ND 2.0. © John Hogg/World Bank, “Windhoek” September 3, 2007 via Flickr, Creative Commons CC BY-NC-ND 2.0.
Graphic Design: Circle Graphics, Reisterstown, MD.

iiiCLIMATE RISK COUNTRY PROFILE: GABON
ACKNOWLEDGEMENTSThis profile is part of a series of Climate Risk Country Profiles developed by the World Bank Group (WBG). The country profile synthesizes most relevant data and information on climate change, disaster risk reduction, and adaptation actions and policies at the country level. The country profile series are designed as a quick reference source for development practitioners to better integrate climate resilience in development planning and policy making. This effort is managed and led by Veronique Morin (Senior Climate Change Specialist, WBG) and Ana E. Bucher (Senior Climate Change Specialist, WBG).
This profile was written by MacKenzie Dove (Senior Climate Change Consultant, WBG). Additional support was provided by Jason Johnston (Operations Analyst, WBG) and Yunziyi Lang (Climate Change Analyst, WBG).
Climate and climate-related information is largely drawn from the Climate Change Knowledge Portal (CCKP), a WBG online platform with available global climate data and analysis based on the latest Intergovernmental Panel on Climate Change (IPCC) reports and datasets. The team is grateful for all comments and suggestions received from the sector, regional, and country development specialists, as well as climate research scientists and institutions for their advice and guidance on use of climate related datasets.

ivCLIMATE RISK COUNTRY PROFILE: GABON
FOREWORD . . . . . . . . . . . . . . . . . . . . . . . . . . . . . . . . . . . . 1
COUNTRY OVERVIEW . . . . . . . . . . . . . . . . . . . . . . . . . . . . . . . 2
CLIMATOLOGY . . . . . . . . . . . . . . . . . . . . . . . . . . . . . . . . . . 5Climate Baseline 5
Overview 5Key Trends 6
Climate Future 7Overview 7Key Trends 9
CLIMATE RELATED NATURAL HAZARDS . . . . . . . . . . . . . . . . . . . . . 10Overview 10Key Trends 11Implications for DRM 12
CLIMATE CHANGE IMPACTS TO KEY SECTORS . . . . . . . . . . . . . . . . . . 13Agriculture 13Water 15Energy 17Health 19Coastal Zone and Sea Level Rise 21
ADAPTATION . . . . . . . . . . . . . . . . . . . . . . . . . . . . . . . . . . 23Institutional Framework for Adaptation 23Policy Framework for Adaptation 24Recommendations 25
Research Gaps 25Data and Information Gaps 25Institutional Gaps 25
CONTENTS

1CLIMATE RISK COUNTRY PROFILE: GABON
Climate change is a major risk to good development outcomes, and the World Bank Group is committed to playing
an important role in helping countries integrate climate action into their core development agendas. The World
Bank Group is committed to supporting client countries to invest in and build a low-carbon, climate-resilient future,
helping them to be better prepared to adapt to current and future climate impacts.
The World Bank Group is investing in incorporating and systematically managing climate risks in development
operations through its individual corporate commitments.
A key aspect of the World Bank Group’s Action Plan on Adaptation and Resilience (2019) is to help countries
shift from addressing adaptation as an incremental cost and isolated investment to systematically incorporating
climate risks and opportunities at every phase of policy planning, investment design, implementation and evaluation
of development outcomes. For all IDA and IBRD operations, climate and disaster risk screening is one of the
mandatory corporate climate commitments. This is supported by the Bank Group’s Climate and Disaster Risk
Screening Tool which enables all Bank staff to assess short- and long-term climate and disaster risks in operations
and national or sectoral planning processes. This screening tool draws up-to-date and relevant information from
the World Bank’s Climate Change Knowledge Portal, a comprehensive online ‘one-stop shop’ for global, regional,
and country data related to climate change and development.
Recognizing the value of consistent, easy-to-use technical resources for client countries as well as to support
respective internal climate risk assessment and adaptation planning processes, the World Bank Group’s Climate
Change Group has developed this content. Standardizing and pooling expertise facilitates the World Bank Group in
conducting initial assessments of climate risks and opportunities across sectors within a country, within institutional
portfolios across regions, and acts as a global resource for development practitioners.
For developing countries, the climate risk profiles are intended to serve as public goods to facilitate upstream
country diagnostics, policy dialogue, and strategic planning by providing comprehensive overviews of trends
and projected changes in key climate parameters, sector-specific implications, relevant policies and programs,
adaptation priorities and opportunities for further actions.
It is my hope that these efforts will spur deepening of long-term risk management in developing countries and our
engagement in supporting climate change adaptation planning at operational levels.
Bernice Van BronkhorstGlobal Director
Climate Change Group (CCG)
The World Bank Group (WBG)
FOREWORD

2CLIMATE RISK COUNTRY PROFILE: GABON
COUNTRY OVERVIEW
Gabon is located in West Africa across the
equator, between 2°30′ North and 3°55′ South latitude and 8°30′ East and 14°30′
East longitude. The western coastal boarder is along
the Atlantic Ocean, south of the Bight of Biafra.
Gabon shares land borders with Equatorial Guinea
and Cameroon to the north, and Republic of Congo
to the east and south. The country has a surface area
of 268,000 square kilometers, with forests covering
85% of the territory.1 Gabon’s terrain includes a
narrow coastal plain, with central African mangroves,
a hilly interior and savanna grassland and forest
in the east and south (Figure1). Gabon has over
20 million hectares of forests. The country’s sea-front
is associated with numerous rivers, resulting in
significant marine and continental fish stocks. Over
70% of the country’s population lives in the coastal
areas, which also houses the majority of economic
activities. Gabon also has a wealth of extractive natural
resources, primarily manganese, oil as well as its
timber and forest reserves.2
Gabon is a relatively sparsely populated country with a population of 2.2 million people (2019), with a population
growth rate of 2.5%. The country’s Gross Domestic Product (GDP) was more than $16.6 billion (2019), with a
current annual growth rate of 3.4 % (Table 1).4 The country has one of the highest urbanization rates in Africa
(89.7%)5 and this is expected to rise to 92% and 95% by 2030 and 2050, respectively. The country’s population
projected to reach 2.7 million people by 2030 and 3.8 million by 2050.6
1 World Bank (2021). Gabon Country Overview. URL: http://www.worldbank.org/en/country/gabon/overview2 Gabon (2011). Second National Communication on Climate Change to the UNFCCC. URL: https://unfccc.int/sites/default/files/
resource/Second%20Nat%20Com_GABON_Complete.pdf3 World Bank (2020). Internal Climate Migration Profile – Gabon.4 World Bank (2021). World Development Indicators: Gabon. URL: http://databank.worldbank.org/data/reports.aspx?source=2&country=GBN5 World Bank Group (2020). Gabon. Increasing Economic Diversification & Equalizing Opportunity to Accelerate Poverty Reduction.
Systematic Country Diagnostic. URL: https://openknowledge.worldbank.org/bitstream/handle/10986/34108/Gabon-Systematic-Country-Diagnostic.pdf?sequence=4&isAllowed=y
6 World Bank Open Data (2021). Data Retrieved March 2021. Data Bank: Population Estimates and Projections, Gabon. URL: https://databank.worldbank.org/data/reports.aspx?source=health-nutrition-and-population-statistics:-population-estimates-and-projections
FIGURE 1 . Topography of Gabon3

3CLIMATE RISK COUNTRY PROFILE: GABON
Gabon is a high-income country with one of the most developed economies in sub-Saharan Africa; the majority
of its income derived from oil revenues. It is the fifth largest oil producer in Africa and has experienced strong
economic growth over the past decade due to its and manganese production. On average, over the past five years,
the oil sector has accounted for 80% of exports, 45% of GDP, and 60% of budget revenue.7 In Gabon, services
provide about 66% of employment, agriculture 19% and mining at just 5% to employment; tourism is estimated
at approximately 4%. Employment in manufacturing is limited, however, growing sub-sectors like agribusiness
and wood manufacturing show promise of ultimately generating more jobs. Agriculture dominates the rural labor
market; the public sector and related formal services dominate in Libreville and Port-Gentil.8 The country is rich in
natural resources and its economy is highly dependent on the extraction of natural resources, such as Oil timber
for export.9
Significant wealth disparity remains across the country, specifically between the highly urbanized coastal regions
(Estuaire and Ogooué-Maritime), areas with extractive activities (Haut-Ogooué), and the less densely populated
provinces of Ogooué-Ivindo, Ogooué-Lolo, Nyanga, and Ngounié, which have limited access to resources and
services. Over 95.1% of households in urban areas have access to safe drinking water, versus only 30% of
households in rural areas have access to safe drinking water.10 Electricity reaches 86.4% of households overall, but
only 37.4% in rural areas. The most recent household budget survey (conducted in 2017) 33.4% of the population
are unable to meet basic needs.11 Using the international poverty line of US$5.50 per capita per day (2011
purchasing power parity), 32% of the population is poor. Approximately, 59.5% of the rural population lives in
poverty, compared to 29.4% in urban areas.12
TABLE 1 . Data snapshot: Key development indicators13
Indicator
Life Expectancy at Birth, Total (Years) (2019) 66.5
Population Density (People per sq. km Land Area) (2018) 8.2
% of Population with Access to Electricity (2018) 93.0%
GDP per Capita (Current US$) (2019) $7,767.00
7 World Bank (2020). Gabon Country Overview. URL: http://www.worldbank.org/en/country/gabon/overview8 World Bank (2020). Poverty Assessment – Gabon. URL: https://openknowledge.worldbank.org/handle/10986/334299 Gabon (2011). Second National Communication on Climate Change to the UNFCCC. URL: https://unfccc.int/sites/default/files/
resource/Second%20Nat%20Com_GABON_Complete.pdf10 World Bank Group (2020). Gabon. Increasing Economic Diversification & Equalizing Opportunity to Accelerate Poverty Reduction.
Systematic Country Diagnostic. URL: https://openknowledge.worldbank.org/bitstream/handle/10986/34108/Gabon-Systematic-Country-Diagnostic.pdf?sequence=4&isAllowed=y
11 International Household Survey Network (2017). Enquête pour l’Evaluation Pauvreté 2017. URL: https://catalog.ihsn.org/index.php/catalog/7826
12 World Bank (2020). Poverty Assessment – Gabon. URL: https://openknowledge.worldbank.org/handle/10986/3342913 World Bank (2020). DataBank – World Development Indicators. URL: https://databank.worldbank.org/source/world-development-
indicators

4CLIMATE RISK COUNTRY PROFILE: GABON
The ND-GAIN Index14 ranks 181 countries using a score which calculates a country’s vulnerability to climate change
and other global challenges as well as their readiness to improve resilience. This Index aims to help businesses and
the public sector better identify vulnerability and readiness in order to better prioritize investment for more efficient
responses to global challenges. Due to a combination of political, geographic, and social factors, Gabon is recognized
as vulnerable to climate change, ranked 117 out
of 181 countries in the 2020 ND-GAIN Index.
However, relative to other countries, Gabon’s current
vulnerabilities are manageable but improvements
in readiness will help the country better adapt to
future challenges. While Gabon is the 94th most
vulnerable country, it is the 40th least ready country;
its combined scores places it in 117th position out of
181 countries. The more vulnerable a country is the
lower their score, while the more ready a country is
to improve its resilience the higher it will be. Norway
has the highest score and is ranked 1st. Figure 2
is a time-series plot of the ND-GAIN Index showing
Gabon’s progress.
Given Gabon’s geographic location, hydrographic outlay and that the majority of the population and economic
activities are located along the coast, the country is highly vulnerable to climate change impacts. Increasing
temperatures, rising seas, and changing precipitation patterns present significant pressure on vulnerable groups,
urban infrastructure, and the economy. Furthermore, while Gabon is reliant upon rainfed agriculture for its agriculture
sector and food security. Gabon submitted its Second National Communication to the UNFCCC (NC2) in 2011
and its Nationally Determined Contributions (NDC) in 2016. The country’s adaptation priorities include protecting
its coastal zone, fishing agriculture and forestry sector. The country is committed to improving its agricultural sector
in support of the country’s continued economic development efforts.
Green, Inclusive and Resilient RecoveryThe coronavirus disease (COVID-19) pandemic has led to unprecedented adverse social and economic impacts.
Further, the pandemic has demonstrated the compounding impacts of adding yet another shock on top of the
multiple challenges that vulnerable populations already face in day-to-day life, with the potential to create devastating
health, social, economic and environmental crises that can leave a deep, long-lasting mark. However, as governments
take urgent action and lay the foundations for their financial, economic, and social recovery, they have a unique
opportunity to create economies that are more sustainable, inclusive and resilient. Short and long-term recovery
efforts should prioritize investments that boost jobs and economic activity; have positive impacts on human, social
and natural capital; protect biodiversity and ecosystems services; boost resilience; and advance the decarbonization
of economies.
FIGURE 2 . ND-GAIN Index for Gabon
Gabon
1995 1997 1999 2001 2003 2005 2007 2009 2011 2013
Sco
re
40
41
42
43
44
45
46
14 University of Notre Dame (2020). Notre Dame Global Adaptation Initiative. URL: https://gain.nd.edu/our-work/country-index/

5CLIMATE RISK COUNTRY PROFILE: GABON
Climate Baseline
OverviewLocated along the equator, the country is largely composed of plateaus and hills, covering 3/4 of the country, with
the highest mountain reaching 1,000 meters (m). Gabon has an extremely dense hydrological network that feeds
two rivers: Ogooué and Nyanga, as well as high basins of small northern coastal rivers. The country has a moist, hot
climate of typically tropical regions. Precipitation is abundant, ranging from 1,500 millimeters (mm) to 3,500 mm
per year and spread almost throughout the year. Gabon’s climate is influenced by the Inter Tropical Convergence
Zone (ITCZ) and the northeast trade winds from the high Sahara Desert as well as the humidity stemming from
the ocean on its western coast.15
Temperatures are high and relatively constant throughout the year. Analysis of data from the World Bank Group’s
Climate Change Knowledge Portal (CCKP) (Table 2) shows historical information for 1901–2020. Gabon experiences
average temperatures year-round of 25°C to 27°C in coastal lowlands and 22°C–25°C inland. The country has a
single wet season between October and May, when an average of 200 mm–250 mm of rainfall is received. January
to April is typically the hottest season.16 The country has experienced some of its highest temperatures along the
coast and in the capital city of Libreville. The country’s two seasons are clearly defined by the country’s rainfall
patterns, shown through its most recent climatology, 1991 to 2020 (Figure 3). Figure 4 shows the spatial variation
of observed average annual precipitation and temperature across Gabon.
CLIMATOLOGY
15 Gabon (2011). Second National Communication on Climate Change to the UNFCCC. URL: https://unfccc.int/sites/default/files/resource/Second%20Nat%20Com_GABON_Complete.pdf
16 McSweeney, C. and Lizcano, G. (2011). UNDP Climate Change Country Profiles: Gabon. University of Oxford. URL: https://www. geog.ox.ac.uk/research/climate/projects/undp-cp/UNDP_reports/Gabon/Gabon.hires.report.pdf
TABLE 2 . Data snapshot: Summary statistics
Climate Variables 1901–2020
Mean Annual Temperature (°C) 25.0°C
Mean Annual Precipitation (mm) 1,807.0 mm
Mean Maximum Annual Temperature (°C) 29.3°C
Mean Minimum Annual Temperature (°C) 20.9°C

6CLIMATE RISK COUNTRY PROFILE: GABON
Key TrendsTemperatureWhile historical weather data is sparse for Gabon experienced general warming, with mean annual temperature
increasing 0.6°C since 1960 (Figure 5). While this increase is realized over the whole country, it has been observed
to be most rapid in January and February. Over this period, the number of ‘hot’ days and nights have been observed to
Tem
pera
ture
(°C
) Rainfall (m
m)
24
21.6
26.4
28.8
0
100
200
300
Rainfall Temperature
Jan Feb Mar Apr May Jun Jul Aug Sep Oct Nov Dec
FIGURE 3 . Average monthly temperature and rainfall of Gabon for 1991–202017
FIGURE 4 . Map of average annual temperature (°C) (left); annual precipitation (mm) (right) of Gabon, 1991–202018
17 WBG Climate Change Knowledge Portal (CCKP, 2021). Gabon. URL: https://climateknowledgeportal.worldbank.org/country/gabon18 WBG Climate Change Knowledge Portal (CCKP, 2021). Gabon. URL: https://climateknowledgeportal.worldbank.org/country/gabon

7CLIMATE RISK COUNTRY PROFILE: GABON
FIGURE 5 . Observed temperature for Gabon, 1901–202020
Annual Mean 5 Year Smoothing
1909 1919 19591929 1939 1949 1969 1979 19991989 2009 2019
Tem
pera
ture
(°C
)
24
25
26
19 Gabon (2011). Second National Communication on Climate Change to the UNFCCC. URL: https://unfccc.int/sites/default/files/resource/Second%20Nat%20Com_GABON_Complete.pdf
20 WB Climate Change Knowledge Portal (CCKP, 2021). Gabon URL: https://climateknowledgeportal.worldbank.org/country/gabon/climate-data-historical
21 McSweeney, C. and Lizcano, G. (2011). UNDP Climate Change Country Profiles: Gabon. University of Oxford. URL: https://www.geog.ox.ac.uk/research/climate/projects/undp-cp/UNDP_reports/Gabon/Gabon.hires.report.pdf
22 Gabon (2011). Second National Communication on Climate Change to the UNFCCC. URL: https://unfccc.int/sites/default/files/resource/Second%20Nat%20Com_GABON_Complete.pdf
PrecipitationMean annual rainfall over Gabon has been observed to have decreased at an average rate of 3.8 mm per month,
per decade since 1960 to date. These trends have been observed to be most acute in January and February and
during the March, April, May rainfall season, declining at 5% per decade since 1960.21 Historical records have
observed seasonal precipitation with a slight decrease between January and May. The dry season has observed
precipitation to have increased slightly since the 1960s. September and October, have also observed slightly higher
precipitation volumes over the past 30 years.22
Climate Future
OverviewThe main data source for the World Bank Group’s CCKP is the CMIP5 (Coupled Inter-comparison Project
Phase5) data ensemble, which builds the database for the global climate change projections presented in the
Fifth Assessment Report (AR5) of the Intergovernmental Panel on Climate Change (IPCC). Four Representative
Concentration Pathways (i.e. RCP2.6, RCP4.5, RCP6.0, and RCP8.5) were selected and defined by their total
radiative forcing (cumulative measure of GHG emissions from all sources) pathway and level by 2100. The RCP2.6
for example represents a very strong mitigation scenario, whereas the RCP8.5 assumes business-as-usual scenario.
For more information, please refer to the RCP Database. For simplification, these scenarios are referred to as a
low (RCP2.6); a medium (RCP4.5) and a high (RCP8.5) emission scenario in this profile. Table 3 provides CMIP5
projections for essential climate variables under high emission scenario (RCP 8.5) over 4 different time horizons.
Figure 6 presents the multi-model (CMIP5) ensemble of 32 Global Circulation Models (GCMs) showing the
projected changes in annual precipitation and temperature for the periods 2040–2059 and 2080–2099.
increase considerably. Seasonally, temperatures in Gabon have risen more significantly in winter months, dry season
temperatures recording increases of 0.69°C in June, 0.68°C in July, and 0.69°C in August.19

8CLIMATE RISK COUNTRY PROFILE: GABON
TABLE 3 . Data snapshot: CMIP5 ensemble projection
Cmip5 Ensemble Projection 2020–2039 2040–2059 2060–2079 2080–2099
Annual Temperature Anomaly (°C) +0.6°C to +1.3°C(+0.9°C)
+1.3°C to +2.3°C(+1.6°C)
+2.0°C to +3.6°C(+2.5°C)
+2.7°C to +4.8°C(+3.3°C)
Annual Precipitation Anomaly (mm) -18.2 to +30.6 (6.2 mm)
-15.1 to +52.7 (17.0 mm)
-7.3 to +80.5(31.5 mm)
-12.0 to +87.3(37.7 mm)
Note: The table shows CMIP5 ensemble projection under RCP8.5. Bold value is the range (10th–90th Percentile) and values in parentheses show the median (or 50th Percentile).
23 WBG Climate Change Knowledge Portal (CCKP, 2021). Gabon Projected Future Climate. URL: https://climateknowledgeportal.worldbank.org/country/gabon/climate-data-projections
FIGURE 6 . CMIP5 ensemble projected change (32 GCMs) in annual temperature (top) and precipitation (bottoms) by 2040–2059 (left) and by 2080–2099 (right), relative to 1986–2005 baseline under RCP8 523

9CLIMATE RISK COUNTRY PROFILE: GABON
Key TrendsTemperatureMean annual temperatures in Gabon are projected to continue to increase through the 2050s by 0.9°C to 2.5°C
and as high as a 4°C temperature increase by the end of the century. This projected rate of warming is believed
to occur at a faster rate in the inland areas of Gabon, and slower on the coastal regions. Expected trends due
to climatic change will not only result in higher temperatures but will increase the frequency of days and nights
considered as ‘hot’ within the current climate. In Gabon, hot days are projected to increase 25–75% annually by the
2060s. Hot nights are also projected to significantly increase.24 Max temperatures are projected to see the greatest
degree of change, per decade. Increasing temperature trends are expected to experience significant increase in
late summer months (June to October) as well as winter and spring seasons.25
Across all emission scenarios, temperatures will continue to increase for Gabon throughout the end of the century.
As seen in Figure 7, under a high-emission scenario (RCP8.5), average temperatures will increase rapidly by
mid-century. Across the seasonal cycle (Figure 8), temperatures above 25°C are expected to stay the same, with
potential to increase from October to January. These trends are aggregated at a national level, and temperature
variations do exist between the inland areas, which are expected to be hotter than coastal zones. Increased heat
and extreme heat conditions will impact human health, agriculture, water resources, and ecosystems.
Historical RCP 2.6 RCP 4.5 RCP 6.0 RCP 8.5
1980 2000 2020 2040 2060 2080 2100Year
30
29
28
27
26
25
24
Tem
pera
ture
(°C
)
FIGURE 7 . Historical and projected average temperature for Gabon from 1986 to 2099 (Reference Period, 1986–2005)26
Jan Feb Mar Apr May Jun Jul Aug Sep Oct Nov Dec
1.5
1.0
0.5
0
–0.5
–1.0
Day
s
FIGURE 8 . Projected change in Summer Days (Tmax >25°C) (RCP8 5 Ensemble, Reference Period, 1986–2005)27
24 Fosto-Nguemo, T. et al. (2016). Assessment of simulated rainfall and temperature from the regional climate model REMO and future changes over Central Africa. Climate Dynamics. 48. pp. 3685–3705. URL: https://link.springer.com/article/10.1007/s00382-016-3294-1
25 Gabon (2011). Second National Communication on Climate Change to the UNFCCC. URL: https://unfccc.int/sites/default/files/resource/Second%20Nat%20Com_GABON_Complete.pdf
26 WBG Climate Change Knowledge Portal (CCKP, 2021). Interactive Climate Indicator Dashboard - Agriculture. Gabon. URL https://climatedata.worldbank.org/CRMePortal/web/agriculture/crops-and-land-management?country=GAB&period=2080-2099
27 WBG Climate Change Knowledge Portal (CCKP, 2021). Interactive Climate Indicator Dashboard - Agriculture. Gabon. URL https://climatedata.worldbank.org/CRMePortal/web/agriculture/crops-and-land-management?country=GAB&period=2080-2099
10CLIMATE RISK COUNTRY PROFILE: GABON
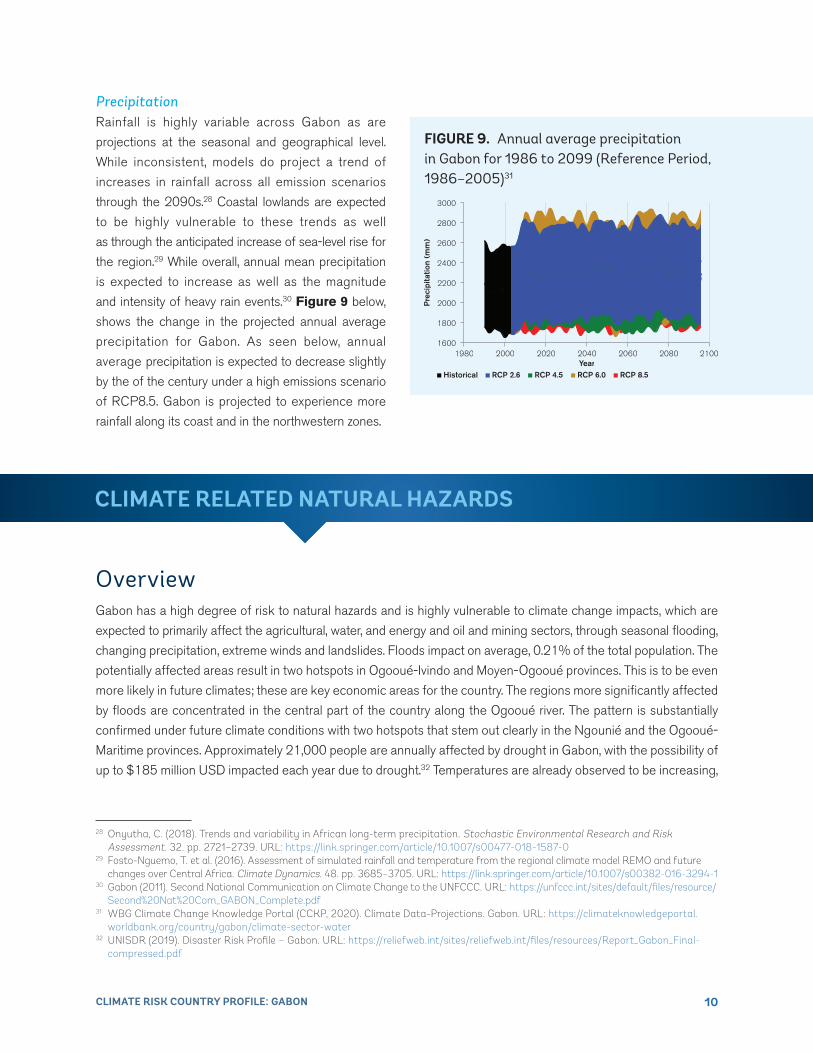
PrecipitationRainfall is highly variable across Gabon as are
projections at the seasonal and geographical level.
While inconsistent, models do project a trend of
increases in rainfall across all emission scenarios
through the 2090s.28 Coastal lowlands are expected
to be highly vulnerable to these trends as well
as through the anticipated increase of sea-level rise for
the region.29 While overall, annual mean precipitation
is expected to increase as well as the magnitude
and intensity of heavy rain events.30 Figure 9 below,
shows the change in the projected annual average
precipitation for Gabon. As seen below, annual
average precipitation is expected to decrease slightly
by the of the century under a high emissions scenario
of RCP8.5. Gabon is projected to experience more
rainfall along its coast and in the northwestern zones.
Historical RCP 2.6 RCP 4.5 RCP 6.0 RCP 8.5
1980 2000 2020 2040 2060 2080 2100Year
3000
2800
2600
2400
2200
2000
1800
1600
Pre
cipi
tatio
n (m
m)
FIGURE 9 . Annual average precipitation in Gabon for 1986 to 2099 (Reference Period, 1986–2005)31
OverviewGabon has a high degree of risk to natural hazards and is highly vulnerable to climate change impacts, which are
expected to primarily affect the agricultural, water, and energy and oil and mining sectors, through seasonal flooding,
changing precipitation, extreme winds and landslides. Floods impact on average, 0.21% of the total population. The
potentially affected areas result in two hotspots in Ogooué-Ivindo and Moyen-Ogooué provinces. This is to be even
more likely in future climates; these are key economic areas for the country. The regions more significantly affected
by floods are concentrated in the central part of the country along the Ogooué river. The pattern is substantially
confirmed under future climate conditions with two hotspots that stem out clearly in the Ngounié and the Ogooué-
Maritime provinces. Approximately 21,000 people are annually affected by drought in Gabon, with the possibility of
up to $185 million USD impacted each year due to drought.32 Temperatures are already observed to be increasing,
CLIMATE RELATED NATURAL HAZARDS
28 Onyutha, C. (2018). Trends and variability in African long-term precipitation. Stochastic Environmental Research and Risk Assessment. 32. pp. 2721–2739. URL: https://link.springer.com/article/10.1007/s00477-018-1587-0
29 Fosto-Nguemo, T. et al. (2016). Assessment of simulated rainfall and temperature from the regional climate model REMO and future changes over Central Africa. Climate Dynamics. 48. pp. 3685–3705. URL: https://link.springer.com/article/10.1007/s00382-016-3294-1
30 Gabon (2011). Second National Communication on Climate Change to the UNFCCC. URL: https://unfccc.int/sites/default/files/resource/Second%20Nat%20Com_GABON_Complete.pdf
31 WBG Climate Change Knowledge Portal (CCKP, 2020). Climate Data-Projections. Gabon. URL: https://climateknowledgeportal.worldbank.org/country/gabon/climate-sector-water
32 UNISDR (2019). Disaster Risk Profile – Gabon. URL: https://reliefweb.int/sites/reliefweb.int/files/resources/Report_Gabon_Final-compressed.pdf

11CLIMATE RISK COUNTRY PROFILE: GABON
and there likely to be more extreme weather events occurring in Gabon’s near to medium term future.33 This is
expected to have primary impact to agriculture and water sectors as well as to wider population health. Vulnerable
groups, such as rural communities, the poor and the elderly are particularly at risk to natural hazards and increasing
impacts of climate change.
Data from the Emergency Event Database: EM-Dat database, presented in Table 4, shows the country has endured
various natural hazards, including bacterial and viral diseases, river floods and intense storms.
TABLE 4 . Natural disasters in Gabon, 1900–202034
Natural Hazard 1900–2020 Subtype
Events Count
Total Deaths
Total Affected
Total Damage (’000 USD)
EpidemicViral Disease 7 116 18,576
Bacterial Disease 1 0 132 0
Flood Riverine Flood 2 1 87,845 0
Storm Convective Storm 3 0 4,330 0
Key TrendsFlooding, including coastal, urban and riverine floods, is a particular high-hazard for Gabon and potentially damaging
and life-threatening river floods are expected to occur at least once in the next 10 years. Flooding along river areas
is also expected as an immediate as well as long-term hazard for both rural and urban areas. Surface flood hazard
in urban and rural areas is also expected to occur. Gabon is also at significant risk to sea-level rise and the resulting
coastal area flooding, which may also impact coastal cities as well as oil extraction operations.
Natural disasters, such as flooding, in the coastal area is expected to cause significant economic losses for coastal
infrastructure and related livelihoods. For example, the Port of Gentil is only four meters above sea level.35 Gabon is
not uniformly developed and population density greatly varies throughout the country. Therefore, the same harmful
event, such as extreme heat or flooding has different risk of a disaster, depending on the location of the event.36
Figure 10 shows the present risk of river flood and coastal flood.
33 UNDRR (2020). Gabon – Risk Sensitive Budget Review. URL: https://www.preventionweb.net/files/70703_gabonweb.pdf34 EM-DAT: The Emergency Events Database - Universite catholique de Louvain (UCL) - CRED, D. Guha-Sapir, Brussels, Belgium.
URL: http://emdat.be/emdat_db/35 Nachmany, M. et al. (2015). Climate Change Legislation in Gabon. LSE Grantham Institute. URL: http://www.lse.ac.uk/
GranthamInstitute/wp-content/uploads/2015/05/GABON.pdf36 GFDRR (2020). Gabon overview. URL: https://www.gfdrr.org/sites

12CLIMATE RISK COUNTRY PROFILE: GABON
FIGURE 10 . Risk of river flood (L);37 risks of coastal flood (R)38
Implications for DRMMany sectors in Gabon do not have risk assessments (i.e. partial flood risk assessment) or strategic climate risk
adaptation plans. Furthermore, the country has yet to establish a functional data flow mechanism in order to have
comprehensive understanding of natural hazards in all sectors. Additionally, Gabon does not have a central, national
database which can systematically collect and analyze disaster loss data. To increase its resilience to natural
hazards and climate change impacts, Gabon is working to establish scientific and technical expertise within the
Disaster Management Agencies, coupled with appropriate financial support (estimated at 2 billion CFA) with
greater regional engagement. At an operational level, the country’s Department of Disasters needs to scale up its
operational capacities and collaboration across existing sectors, and institute contingency plans and procedures.
Development of early warning systems can improve the country’s preparedness and resilience.39
37 ThinkHazard! (2020). Gabon River Flood. URL: http://thinkhazard.org/en/report/89-gabon/FL38 ThinkHazard! (2020). Gabon – Coastal Flood. URL: http://thinkhazard.org/en/report/89-gabon/CF39 PreventionWeb (2015). Rapport national de suivi sur la mise en œuvre du Cadre d’action de Hyogo (2013–2015). URL: https://www.
preventionweb.net/files/41836_GAB_NationalHFAprogress_2013-15.pdf

13CLIMATE RISK COUNTRY PROFILE: GABON
Gabon is expected to experience adverse impacts of climate change throughout the country and across key
sectors, the most significant impacts being increased temperatures, changing precipitation patterns with
areas at risk of annual decreases in rainfall, prevalence of new disease vectors, rises in sea temperature,
and increasing number of consecutive dry and hot days. Visible signs of climate change include annual variation in
crop yield, increased numbers of deaths of chronic patients, sea level rise, a longer touristic season and the potential
development of new touristic destination due to change in local climate.40 Variable precipitation and increasing
temperatures is resulting in an increasingly riskier agricultural and water availability environment. Furthermore,
climate change and global temperature increases are impacting sea level rise, which will also have an impact
on the country. Climate change is expected to result in significant economic impacts to the key sectors, such as
agriculture. Financial constraints and limited institutional capacity have limited adaptation capabilities and effective
response to climatic hazards in the country. This further threatens future sustainable agricultural production as well
as opportunity to expand and the country’s burgeoning tourism sector.
GenderAn increasing body of research has shown that climate-related disasters have impacted human populations in many
areas including agricultural production, food security, water management and public health. The level of impacts
and coping strategies of populations depends heavily on their socio-economic status, socio-cultural norms, access
to resources, poverty as well as gender. Research has also provided more evidence that the effects are not gender
neutral, as women and children are among the highest risk groups. Key factors that account for the differences
between women’s and men’s vulnerability to climate change risks include: gender-based differences in time use;
access to assets and credit, treatment by formal institutions, which can constrain women’s opportunities, limited
access to policy discussions and decision making, and a lack of sex-disaggregated data for policy change.41
Agriculture
OverviewThe Gabonese agricultural sector includes food crops, rubber, and palm oil. It employs approximately 20% of
the population, yet the sector’s contribution to GDP in 2017 was estimated at 5%. Gabon relies heavily on food
imports, which account for the majority of domestic food consumption. Imported food is sourced primarily from
France, South Africa, and Cameroon. Gabon has 22 million hectares of forest and just one million hectares of arable
agricultural land. Northern Gabon is a prime location for rubber plantations, and the sector has increased markedly
in recent years.42 Gabon’s agricultural sector is particularly vulnerable to climate change, and remains relatively
CLIMATE CHANGE IMPACTS TO KEY SECTORS
40 Gabon (2011). Second National Communication on Climate Change to the UNFCCC. URL: https://unfccc.int/sites/default/files/resource/Second%20Nat%20Com_GABON_Complete.pdf
41 World Bank Group (2016). Gender Equality, Poverty Reduction, and Inclusive Growth. URL: http://documents1.worldbank.org/curated/en/820851467992505410/pdf/102114-REVISED-PUBLIC-WBG-Gender-Strategy.pdf
42 IFAD (2020). Gabonese Republic, Country Strategy Note. URL: https://www.ifad.org/documents/38711644/40077965/ Country%20Strategy%20Note-%202020-2022/36610c0a-bd07-2624-607c-2151aec0d437

14CLIMATE RISK COUNTRY PROFILE: GABON
underdeveloped and with farms predominately at subsistence level. The sector’s vulnerability to climate change
is of distinct concern to the country, especially as an estimated 5% of the heavily forested country is arable and
currently used for plantation and subsistence farming.43
Climate Change ImpactsChanges in temperature and precipitation is expected to impact the physical, chemical and biological composition of
the country’s soil. Agricultural productivity is expected to decrease under a medium warming scenario. Additionally,
increased rainfall may result in erosion for some areas and changing soil quality and moisture may also alter the
balance of micro-organisms.44 Reduced precipitation and increasing heat trends for much of the country’s agricultural
areas are also expected to be impacted by increasing number of consecutive dry days. Diminished surface water
runoff may also affect groundwater levels, affecting drinking water supplies as well as water availability for irrigation.
The projected increased heat will increase stress on crops and is also likely to alter the length of the growing
seasons. Decreased water availability is likely to reduce yields and the reduction in soil moisture may alter suitable
areas for agriculture or the production of specific crops. Increased heat and water scarcity conditions are likely to
increase evapotranspiration, expected to contribute to
crop failure and overall yield reductions. An increased
likelihood of droughts and prolonged dry periods will
also exacerbate land degradation. As temperatures
rise, so will the likely increase of pests and risk of fire.
Increased frequency and intensity of extreme events
may change or impact species composition and alter
‘regulating services’ such as soil water maintenance,
base flows and filtration.45 Figure 11 shows the
change for average daily max-temperature across
seasonal cycles. These higher temperatures have
implications for impacts to soil moisture and crop
growth and as seen in the graph below, show an
increase throughout the year. Jan Feb Mar Apr May Jun Jul Aug Sep Oct Nov Dec
6.0
5.5
5.0
4.5
4.0
3.5
3.0
2.5
2.0
Tem
pera
ture
(°C
)
FIGURE 11 . Average daily max temperature for Gabon (RCP8 5 Ensemble, Reference Period, 1986–2005)46
43 Gabon (2011). Second National Communication on Climate Change to the UNFCCC. URL: https://unfccc.int/sites/default/files/resource/Second%20Nat%20Com_GABON_Complete.pdf
44 Adaptation Partnership (2011). Gabon, Review of current and planned adaptation action in Middle Africa. URL: https://www.preventionweb.net/publications/view/25288
45 Gabon (2011). Second National Communication on Climate Change to the UNFCCC. URL: https://unfccc.int/sites/default/files/resource/Second%20Nat%20Com_GABON_Complete.pdf
46 WBG Climate Change Knowledge Portal (CCKP, 2021). Gabon Agriculture. Dashboard URL: https://climatedata.worldbank.org/CRMePortal/web/agriculture/crops-and-land-management?country=GAB&period=2080-2099

15CLIMATE RISK COUNTRY PROFILE: GABON
Adaptation OptionsIrrigation is one measure which can prevent or minimize the effects of climate change, in particular for areas
experiencing decreased precipitation. Given Gabon’s dependency upon agriculture as well as existing vulnerability
to climate change, key adaptation actions have been recommended such as to conduct necessary research in
order to define the critical climate thresholds for local crops; improve the technical capacities to support traditional
cultivation practices become more resilient to climate change; implement soil protection and restoration measures in
order to improve soil fertility; and initiate agro-forestry projects in an effort to enrich soils.47 Gabon also began its
National Agricultural Investment and Food and Nutrition Security Plan (2017–2022), which is meant to increase
crop and livestock productivity and fish production, increase capacities of smallholder producers and support
improved governance for the agricultural and rural sector.48 The Gabonese Government is also working to enhance
the economic contributions from the country’s agriculture to the overall economy and enhance ‘non-timber’ forest
products and further develop livestock and fisheries. These efforts will also improve the country’s food security
situation and enhance income generating activities.49
Water
OverviewClimate change will impact Gabon’s water supply, impacting demand from the agricultural sector as well as increasing
drinking requirements from population growth. Annual distribution of rainfall is of great interest to the water industry
as the distribution of water throughout the year is critical for planning of resources as well as for safety against
disasters. While the country is currently listed as a low-risk for water scarcity for drinking, the threat for salinization
and coastal flooding remains high. Gabon’s vulnerability related to the primary impact of increased rainfall may
have in some areas, leading to increased river volumes, erosion and loss of soil and the resulting implication on
vegetation, proliferation of marsh lands, fisheries and fish population distributions, as well as water-borne diseases.
Additionally, physical infrastructure and habitats remains at risk50, and flooding can damage sanitation infrastructure
and lead to the spread of fecal waste through flood water. The capital city, Libreville, is built on a flat peninsula,
which is bordered by the Atlantic Ocean and Komo and Mondah estuaries. During high tides, seawater flows into
all rivers, resulting in surface water resources becoming too brackish to be used for drinking water and the city has
been forced to source water from remote rivers (often 45–55 km away).51
47 Adaptation Partnership (2011). Gabon, Review of current and planned adaptation action in Middle Africa. URL: https://www.preventionweb.net/publications/view/25288
48 IFAD (2020). Gabonese Republic, Country Strategy Note. URL: https://www.ifad.org/documents/38711644/40077965/ Country%20Strategy%20Note-%202020-2022/36610c0a-bd07-2624-607c-2151aec0d437
49 Gabon (2011). Second National Communication on Climate Change to the UNFCCC. URL: https://unfccc.int/sites/default/files/resource/Second%20Nat%20Com_GABON_Complete.pdf
50 Adaptation Partnership (2011). Gabon, Review of current and planned adaptation action in Middle Africa. URL: https://www.preventionweb.net/publications/view/25288
51 Collignon B., and Ondo C. (2017). Managed Aquifer Recharge (MAR) to Supply Libreville, a Water-Stressed City (Gabon). In: Renard P., Bertrand C. (eds) EuroKarst 2016, Neuchâtel. Advances in Karst Science. Springer, Cham. DOI: https://doi.org/10.1007/978-3-319-45465-8_26

16CLIMATE RISK COUNTRY PROFILE: GABON
Climate Change ImpactsProjected temperature increases and precipitation trends are also expected to result in hydrological impacts of the
country’s watercourses, such as catchments, rivers and coastlines. Increasing temperatures will also play an adverse
role in evapotranspiration, changes in groundwater inflow, water level in rivers and lakes, and water temperatures.
Changes in precipitation will influence not only the discharge, but the intensity, time period and frequency of floods
and droughts as well as soil humidity, ground water recharge and the amount of water flowing through rivers. The
changing in rainfall partners and intensity, shown in the graph below by the projected increasing number of days
with very heavy precipitation through the end of the century.52
Rainfall and evaporation changes also impact rates of surface water infiltration and the recharge rates for groundwater.
Low-water storage capacity increases the country’s dependence on unreliable rainfall patterns. Changes in rainfall
and evaporation translate directly to changes in surface water infiltration and groundwater re-charge. This has the
potential for further decreased reliability of unimproved groundwater sources and surface water sources during
droughts or prolonged dry seasons. Increased strain on pumping mechanisms leading to breakdowns if maintenance
is neglected and the potential for falling water levels in the immediate vicinity of well or borehole, particularly in areas
of high demand. Additionally, temperature increases have the potential to result in increased soil moisture deficits
even under conditions of increasing rainfall.53
Figure 12 shows the projected annual Standardized Precipitation Evapotranspiration Index (SPEI) through the
end of the century. SPEI is an index which represents the measure of the given water deficit in a specific location,
accounting for contributions of temperature-dependent evapotranspiration and providing insight into increasing or
decreasing pressure on water resources. Negative
values for SPEI represent dry conditions, with values
below −2 indicating severe drought conditions, likewise
positive values indicate increased wet conditions.
This is an important understanding for the water
sector in regards to quantity and quality of supply
for human consumption and agriculture use as well
as for the energy sector as reductions in water
availability impacts river flow and the hydropower
generating capabilities. As seen in the chart below, in
aggregate, Gabon is projected to experience similar
dry conditions as present day. However, western
areas of the country are projected to increase in
aridity, with heavy rainfall events likely to increase
in intensity.Historical RCP 2.6 RCP 4.5 RCP 6.0 RCP 8.5
3
2
1
0
–1
–2
–3
–4
Inde
x
FIGURE 12 . Annual SPEI drought index in Gabon for the period, 1986 to 2099 (Reference Period, 1986–2005)54
52 Goldstein et al., (2017). Spatial planning for a green economy: National-level hydrologic ecosystem services priority areas for Gabon. PLOS ONE. DOI: https://doi.org/10.1371/journal.pone.0179008
53 WBG Climate Change Knowledge Portal (CCKP, 2021). Gabon Water Sector. URL: https://climateknowledgeportal.worldbank.org/country/gabon/climate-sector-water
54 WBG Climate Change Knowledge Portal (CCKP, 2021). Gabon. Water Sector Dashboard. URL: https://climatedata.worldbank.org/CRMePortal/web/water/land-use-/-watershed-management?country=GAB&period=2080-2099

17CLIMATE RISK COUNTRY PROFILE: GABON
Adaptation OptionsClimate change adaptation for the water sector in Gabon requires further investments in flood defense, an integrated
approach to water resources management and irrigation. For the hydrology and water resources sector, the following
research activities related to climate change impacts and adaptation are proposed. The construction of dikes and flood
protection infrastructure is recommended to control water flow and protection of embankments against erosion, as
well as additional construction of damns and basins for increased water storage capacity. Dredging activities should be
carried out to reduce ‘water flow resistance’ or by enlarging waterways for lower water levels and improved navigability.55
The establishment and implementation of early warning systems should be put in place, particularly for the Ogooué
Basin in order to manage the area’s rapid water rise. Risk prevention plans with a focus on flooding should be put in place
in conjunction with mapping exercises to identify at-risk areas.56 Social protection measures should be implemented for
populations living in at-risk-areas such as resettlement programs, and mainstreaming climate-resilience aspects into
technical designs, management and operation of water and sanitation systems in order to make them less vulnerable.
Development of a national database and system of rainfall-runoff models to project the effects of rainfall changes (for
climate variability and climate change) on runoff and discharges (including peak and low flows). This should be done in
important river basins and catchments and linked to an expanded national runoff and flood reporting system.57
Energy
OverviewGabon is one of the top five oil producers in sub-Saharan Africa and one of the leading countries in its oil exploration
and production, however the country has been facing declining output for more than a decade. The economy and
energy sector remain highly dependent upon the country’s oil production, with oil revenues accounting for 45% of
total government revenue and crude export accounting for nearly 74% of total export revenue in 2019.58 Gabon’s
electricity supply is through seven hydroelectric facilities. A heavy fuel station was commissioned in 2000 to meet
the increasing demands of Libreville, however new studies are underway to find more economical and efficient
power generation facilities.59 Still, the World Bank estimates that only 60% of Gabon’s population has access to
electricity. According to the US Energy Information Administration (EIA), nearly 50% of energy consumption is from
biomass and waste (wood, crop residues, manure, and charcoal), the rural population’s primary method of meeting
household cooking and heating needs. Amidst rising electricity demand among both residential and industrial
consumers and frequent electricity shortages, Gabon is currently working to expand the electricity supply and meet
increasing demand, primarily by building hydropower plants and extending transmission lines. However, expansion
of hydropower does not erase concerns regarding electricity reliability, as key business hubs in the country have
previously experienced blackouts during periods of low rainfall.60
55 Goldstein et al., (2017). Spatial planning for a green economy: National-level hydrologic ecosystem services priority areas for Gabon. PLOS ONE. DOI: https://doi.org/10.1371/journal.pone.0179008
56 Gabon (2011). Second National Communication on Climate Change to the UNFCCC. URL: https://unfccc.int/sites/default/files/resource/Second%20Nat%20Com_GABON_Complete.pdf
57 Collignon B., and Ondo C. (2017). Managed Aquifer Recharge (MAR) to Supply Libreville, a Water-Stressed City (Gabon). In: Renard P., Bertrand C. (eds) EuroKarst 2016, Neuchâtel. Advances in Karst Science. Springer, Cham. DOI: https://doi.org/10.1007/978-3-319-45465-8_26
58 US Energy Information Administration (2021). Independent Statistics and Analysis, Gabon. URL: https://www.eia.gov/international/overview/country/GAB
59 Gabon (2011). Second National Communication on Climate Change to the UNFCCC. URL: https://unfccc.int/sites/default/files/resource/Second%20Nat%20Com_GABON_Complete.pdf
60 Nachmany, M. et al. (2015). Climate Change Legislation in Gabon. LSE Grantham Institute. URL: http://www.lse.ac.uk/GranthamInstitute/wp-content/uploads/2015/05/GABON.pdf

18CLIMATE RISK COUNTRY PROFILE: GABON
Climate Change ImpactsGabon’s energy sector is sensitive to changes in seasonal weather patterns and extremes that can affect the supply of
energy, impact transmission capacity, disrupt oil production, and impact the integrity of transmission pipelines and
power distribution.61 A key issue to Gabon’s energy sector is water availability and rising temperatures, coupled
with growing consumer demand. Increased temperatures with decreased or limited water availability will impact
the country’s hydropower generation as well as cooling capabilities for power generating systems.62 An increased
frequency of heavy rains as well as river flooding can also impact hydropower capacity from increased sedimentation.
Sea lever rise may damage coastal infrastructure and/or transmission and distribution capabilities. Coastal erosion,
coastal flooding, or storm surges can also impact supply.63
Cooling Degree Days show the relationship between daily heat and cooling demand, typically sourced through
a form of active cooling or an evaporative process. The change in cooling degree days provides insight into the
potential for extended seasons of power demand or periods in which cooling demand (power demands) might
increase. As seen in Figure 13, seasonal increases for cooling demands are expected to increase throughout
the year. Warm Spell Duration represents the number of days in a sequence of at least six days in which the daily
maximum temperature is greater than the 90th percentile of daily maximum temperature. Figure 14 shows warm
spells are expected to sharply increase in the second half of the century.
Year
Tem
pera
ture
(°F
)
1980 2000 2020 2040 2060 2080 2100
7500
7000
6500
6000
5500
5000
4500
4000
8000
Historical RCP 2.6 RCP 4.5 RCP 6.0 RCP 8.5
FIGURE 13 . Change in Cooling Degree Days (65°F) in Gabon for the period 2040–2059 (Reference Period, 1986–2005)64
Historical RCP 2.6 RCP 4.5 RCP 6.0 RCP 8.5
1980 2000 2020 2040 2060 2080 2100Year
350
300
250
200
150
100
50
0
–50
–100
Day
s
FIGURE 14 . Warm Spell Duration Index in Gabon for the period 1986 to 2099 (Reference Period, 1986–2005)65
61 US Energy Information Administration (2021). Independent Statistics and Analysis, Gabon. URL: https://www.eia.gov/international/overview/country/GAB
62 WBG Climate Change Knowledge Portal (CCKP, 2021). Gabon. Energy Sector. URL: https://climateknowledgeportal.worldbank.org/country/gabon/climate-sector-energy
63 USAID (2018). Climate Risk Profile – West Africa. Fact Sheet. URL: https://www.climatelinks.org/sites/default/files/asset/document/West_Africa_CRP_Final.pdf
64 WBG Climate Change Knowledge Portal (CCKP, 2021). Gabon – Energy. URL: https://climateknowledgeportal.worldbank.org/country/gabon/climate-sector-energy
65 WBG Climate Change Knowledge Portal (CCKP, 2021). Gabon. Energy Sector Dashboard. URL: https://climatedata.worldbank.org/CRMePortal/web/energy/oil-gas-and-coal-mining?country=GAB&period=2080-2099

19CLIMATE RISK COUNTRY PROFILE: GABON
Adaptation OptionsTo ensure the resilience of energy infrastructure to current climate variability and projected future climate change,
the continued provision of basic services to the public and industry needs to be provided to enhance the quality
of decision making. The Gabonese Government and individual departments should understand the inherent
vulnerabilities in this energy sector and develop flexible adaptation strategies for existing and planned infrastructure.
These should coincide with the continued need to electrify the rest of the country, particularly in rural areas.66
Consideration should be given to the capacity of energy systems to sustain cumulative impacts; the redundancy at
peak periods; the sensitivity of regulators to climate change pressures on infrastructure and the possible need for
redundant capacity; demand management and energy conservation strategies. Institutionalized measures for energy
saving will allow decreasing consumption of primary energy, mainly natural gas. Additional investments can be made
in energy efficiency and renewable energy sources; a high priority for both economic (decrease in costs for energy
generation) and climate mitigation (decrease in volumes of greenhouse gas emissions).67
Health
OverviewGabon’s health sector is plagued by malaria, premature birth, acute respiratory infections, HIV and diarrheal diseases,
which are the leading causes of death among children under the age of five. The country has seen an increase in the
prevalence of noncommunicable diseases, in particular cardiovascular diseases, diabetes, renal failure and cancers.
Gabon bears a double burden of communicable and noncommunicable disease, each with high mortality rates.
Through a 2008 health financing reform, Gabon instituted a system of mandatory health insurance and established
a national mandatory health insurance and social security fund; currently this fund covers 60% of the population.68
In 2010, a new national health policy was adopted, with the goal of improving public health by reducing maternal,
infant and child mortality and the prevalence of malaria, HIV/AIDS, tuberculosis, neglected tropical diseases and
noncommunicable diseases. The country’s health system continues to have a number of obstacles to contend with:
some health departments are not operational, the quality of health care is poor, essential medicines are scarce,
information systems are dysfunctional, and the community is not involved in the management of health issues. The
principal challenges facing the health system are to reduce maternal and infant mortality, and to control communicable
and noncommunicable diseases.69
66 Goldstein et al., (2017). Spatial planning for a green economy: National-level hydrologic ecosystem services priority areas for Gabon. PLOS ONE. DOI: https://doi.org/10.1371/journal.pone.0179008
67 EIA (2017). Gabon. URL: https://www.eia.gov/international/overview/country/GAB68 Sango, N.A. and Yaya, S. (2019). Wealth Status, Health Insurance, and Maternal Health Care Utilization in Africa: Evidence from
Gabon. BioMed Research International. Research Article. DOI: https://doi.org/10.1155/2020/403683069 WHO (2014). Country Cooperation Strategy – at a glance. Gabon. URL: https://apps.who.int/iris/bitstream/handle/10665/136840/
ccsbrief_gab_en.pdf?sequence=1

20CLIMATE RISK COUNTRY PROFILE: GABON
Climate Change ImpactsClimate change will pose numerous direct impacts and increasing risks to the country’s population health. Higher
incidence of hot and dry summers with increased night and day temperatures as well as maximum daily temperatures
are expected. More frequent occurrences of heat waves will pose a serious threat to human health, particularly for
highly vulnerable groups: elderly and chronically ill. Major identified health risks for Gabon from climate variability
are the projected increase in water-borne diseases. Projected increasing annual mean temperatures and the
projected change annual mean temperature through the 2050s will impact human and animal health, as well as
present more conducive environments for bacteria, pathogens and vector borne diseases.70 Warmer and drier
conditions as projected by climate scenarios may favor the spread of diseases borne by food or water, such as
diarrhea and dysentery.
Rising temperatures are of increasing concern. The annual distribution of days with a high-heat index provides
insight into the health hazard of heat. Figure 15 shows the expected Number of Days with a Heat Index >35°C for
the 2090s. As seen in this figure, a sharp increase in these days starting from the mid-century, under the highest
emission scenario (RCP8.5). Night temperatures (>20°C), are expected to rapidly rise in a high-emission scenario.
The health impacts of heat can be projected and monitored through the frequency of tropical nights. Tropical Nights
(Figure 16) represents the projected increase in tropical nights for different emission scenarios to demonstrate
the difference in expected numbers of tropical nights.
Historical RCP 2.6 RCP 4.5 RCP 6.0 RCP 8.5
1980 2000 2020 2040 2060 2080 2100Year
350
300
250
200
150
100
50
0
–50
–100
Day
s
FIGURE 15 . Days with a Heat Index >35°C (Reference Period, 1986–2005)71
Historical RCP 2.6 RCP 4.5 RCP 6.0 RCP 8.5
1980 2000 2020 2040 2060 2080 2100Year
380
360
340
320
300
280
260
240
220
Nig
hts
FIGURE 16 . Number of Tropical Nights (Tmin >20°C) (Reference Period, 1986–2005)72
70 Adaptation Partnership (2011). Gabon, Review of current and planned adaptation action in Middle Africa. URL: https://www.preventionweb.net/publications/view/25288
71 WBG Climate Change Knowledge Portal (CCKP, 2021). Gabon. Health Sector Dashboard. URL: https://climatedata.worldbank.org/CRMePortal/web/health/systems-and-service?country=GAB&period=2080-2099
72 WBG Climate Change Knowledge Portal (CCKP, 2021). Gabon. Health Sector Dashboard. URL: https://climatedata.worldbank.org/CRMePortal/web/health/systems-and-service?country=GAB&period=2080-2099

21CLIMATE RISK COUNTRY PROFILE: GABON
Adaptation OptionsGabon’s health care system personnel are not fully aware of the relationship between climate change and variability
and health impacts. There has been no specific training of the personnel in regard to adaptation to climate change and
mitigating its negative health impacts. Increases in training and capacity can improve the level of knowledge and
skills to prevent diseases connected with climatic factors, however this knowledge remains relatively limited among
the general population. Likewise, general awareness campaigns regarding climate change and its impact to human
health is critical, especially for most vulnerable groups such as children and the elderly. The expansion of studied
on the assessment of climate change impacts on population health have been requested.73
Early warning systems can also be developed to improve the country’s resilience by providing timely information
on the atmospheric state and effects of such a state on the organism. Additionally, biometeorological forecasts
can impact human health through daily public informing on expected meteorological conditions in order to give
certain advice on health protection and symptoms prevention. Specific action should be targeted to strengthen the
screening for river blindness; implementation for improved drinking water purification and delivery systems; reduced
deforestation rates and increased research around the links between population displacement, human health and
the risks of climate-related diseases.74
Coastal Zone and Sea Level Rise
OverviewGabon’s coastal waters and marine Exclusive Economic Zone represent major economic, social and ecological
importance for the country.75 Gabon’s coastal environment is located in two distinct climatic areas: the equatorial
climate of transition in the central area and the equatorial climate of transition in the south-west and central Atlantic
coast. The equatorial climate of transition in the central area has the estuarine climate, situated in the coastal area
north-west of the country including Coco Beach and Libreville. This sub climate is characterized by high precipitation,
varying between 2,000 mm to 3,800 mm per year. Its coast includes Africa’s third largest freshwater delta, and
possibly one of the most intact across the continent. The wetlands of the Ogooué Delta, known as the Bas Ogooué,
and coastal habitats to the north and south are a complex mosaic of freshwater, estuarine and dryland habitats,
which provide a wealth of important ecosystem services for people and nature. They filter water and remove
sediments and toxins that may arise from upstream urban areas and agricultural, forestry and mining operations; and
they absorb water during the rainy season and minimize downstream floods to communities living in the riparian or
floodplain zones. The biodiversity of the region supports nesting, rearing and feeding for many fish and other species
upon which local communities depend for their livelihoods. The wetlands of the Bas Ogooué also provide habitat for
a vast diversity of plants, birds, amphibians, mammals, reptiles and other species.76
73 Gabon (2011). Second National Communication on Climate Change to the UNFCCC. URL: https://unfccc.int/sites/default/files/resource/Second%20Nat%20Com_GABON_Complete.pdf
74 Adaptation Partnership (2011). Gabon, Review of current and planned adaptation action. URL: https://www.preventionweb.net/publications/view/25288
75 Gabon (2011). Second National Communication on Climate Change to the UNFCCC. URL: https://unfccc.int/sites/default/files/resource/Second%20Nat%20Com_GABON_Complete.pdf
76 Faure, F. and Moussounda, C. (2009). Gabon, in Odido M. and Mazzilli S. (Eds), UNESCO-IOC. African oceans and coasts, pp. 83–88. URL: http://fust.iode.org/sites/fust.iode.org/files/public/images/odinafrica/Chapter_7_6_Gabon.pdf

22CLIMATE RISK COUNTRY PROFILE: GABON
Climate Change ImpactsThe majority of the population and infrastructure is located along the coast and Gabon’s coastal zone includes the
Estuaire, Ogooué Maritime and Nyanga. Increasing population growth and demographic pressures of the main
coastal towns (Libreville, Port-Gentil, Gamba and Mayumba), unsustainable use of resources, increased coastal
storms, coastal erosion and the observed rapid rise in sea level with its indirect impacts (the salinization of water,
habitat destruction, erosion), make the Gabonese coast extremely vulnerable.77
Gabon has a large maritime area estimated at about 265,000 km2, which includes a territorial sea of 12 nautical
miles. The large coast and marine waters are rich in mineral and biological resources. Climate change is expected
to have substantial implications for Gabon’s marine ecosystems and fish stocks. Though the region is highly
productive due to major ocean currents, human activities (e.g. pollution, coastal development, over and illegal
fishing), and changes in environmental conditions, such as increases in sea surface temperature, ocean acidification,
decline in oxygen content, rise in sea levels, and increased ultraviolet exposure, have and will continue to adversely
affect marine organisms and the associated ecosystem goods and services derived from them, such as fisheries.
Navigation, port activities, exploitation of marine resources, tourism, and coastal development all play important
roles in the development of the country. These areas are threatened by rising sea levels, coastal erosion, pollution,
and over exploitation. Estimates suggest that the coastal shore erosion has experienced 100 to 250 m shoreline
erosion since 1950, most specifically seen along Cap-Lopez to the north of Port-Gentil. Mangrove systems have
disappeared at a rate of 50 hectares per year between 1960 and 1990. Expected sea level rise, storm surge and
heavy storms are expected to put coastal zone communities, infrastructure and economies at high risk. Figure 17
shows the annual average sea level change from 1993 to 2015.
FIGURE 17 . Sea level rise in Gabon
Sea
Lev
el A
nom
aly
(mm
)
–25
0
25
50
75
YearSea Level Anomaly
1993 1995 1997 1999 2001 2003 2005 2007 2009 2011 2013 2015
77 Faure, F. and Moussounda, C. (2009). Gabon, in Odido M. and Mazzilli S. (Eds), UNESCO-IOC. African oceans and coasts, pp. 83–88. URL: http://fust.iode.org/sites/fust.iode.org/files/public/images/odinafrica/Chapter_7_6_Gabon.pdf

23CLIMATE RISK COUNTRY PROFILE: GABON
AdaptationGabon is working to adapt to the negative impacts of coastal erosion through the construction and expansion of
embankments, dykes and walls along the sea front form Pointe Clairette to Point Iguiri. Additionally, the country
is implanting beach recharging form Cap Lopez to Pointe Ozouri and the backfilling of the lowlands inland along
the Atlantic coastline and the deltaic plain of Mbéga-Mandorové. Investment in municipalities can support basic
infrastructure for water treatment. Additional research is needed for the country to better define sea-level rise and
ongoing coastal erosion as well as increasing risk of salinization of fresh water sources.78 To improve marine and
coastal resources management, Gabon has implemented “Gabon Bleu,” a Presidential marine conservation initiative
aimed at the sustainable management of Gabon’s coastal and oceanic waters, which has included the creation of
a comprehensive marine protected area network covering 26% of its exclusive economic zone.
Institutional Framework for AdaptationGabon’s climate change strategies have been led by the Ministry of Forests, Water, Fisheries and the Environment
and the Protection of Nature. As a member to the Central African Forests Commission (COMIFAC), Gabon is
supporting regional efforts to implement responsible forestry management against climate change vulnerabilities.
Gabon is also one of four countries participating in a continent-wide climate change adaptation program.79 These
efforts are designed to specifically support and build technical capacities and coastal zone resiliency. Gabon
established a National Council on Climate Change with its Climate Change Communication Committee in 2010. The
Climate Council falls under the President’s direct authority, and is charged with preparing and managing the National
Climate Plan (developed in 2012) This Climate Plan was developed as an approach to preserve the rainforests
and manage industrial emissions. The plan is integrated into the government’s broader strategic development goals
produced with the National Commission on Sustainable Development and through the newly-created Ministry of
Economy and Sustainable Development.80
ADAPTATION
78 Gabon (2011). Second National Communication on Climate Change to the UNFCCC. URL: https://unfccc.int/sites/default/files/resource/Second%20Nat%20Com_GABON_Complete.pdf
79 Gabon (2011). Second National Communication on Climate Change to the UNFCCC. URL: https://unfccc.int/sites/default/files/resource/Second%20Nat%20Com_GABON_Complete.pdf
80 Nachmany, M. et al. (2015). Climate Change Legislation in Gabon. Grantham Research Institute on Climate Change and the Environment. URL: https://www.lse.ac.uk/GranthamInstitute/wp-content/uploads/2015/05/GABON.pdf

24CLIMATE RISK COUNTRY PROFILE: GABON
Policy Framework for AdaptationGabon issued its First National Communication in 2005 and Second National Communication in 2011. As Gabon has
one of the highest levels of development among central-West Africa and is not characterized as a Least Developed
Country, and thus is not required to prepare a National Adaptation Program of Action under the UNFCCC. Gabon
established a Climate Council in 2010 in an effort to develop specific climate change related activities.81 The Ministries
of Planning, Finance and Environment intend to create a National Adaptation Fund.82
Gabonese Government is working to support climate change planning and adaptation measures are integrated with
sectoral adaptation strategies and mainstreamed across government planning; at the time of writing, the country was
preparing a new climate law, with estimated completion by the end of 2021. Current government strategies relating to
climate change in the country emphasize challenges faced by climate change, with little development of short to long
term adaptation and mitigation strategies. Government ministries and national bodies will need to take into account
the future effects of climate change when developing their strategic plans for the coming years and decades, including
ministries and agencies responsible for the agricultural, energy, tourism and water sectors. Additional evidence to
inform policy and adaptation strategies is needed for the development of a more comprehensive adaptation framework.
There is potential for the country to develop a low-carbon economy and to begin to actively adapt to climate change.
This reality, along with mainstreamed adaptation and resilience planning needs to be driven by concerted government
effort, in coordination to the development of effective cooperation and collaboration between relevant government
departments to adequately integrate climate change adaptation in existing policies, foster the elaboration of a national
climate change adaptation strategy, and national climate change adaptation plan. Gabon has made a firm commitment
to reducing emissions by introducing a carbon fee, promoting renewable energy, encouraging energy efficiency, and
committing to GHG reductions under the Kyoto Protocol.83
National Frameworks and Plans
• Nationally Determined Contribution (2016) French
• Second National Communication the UNFCCC (2011) French
• Initial National Communication the UNFCCC (2005) French
• National Strategy on Coastal Adaptation to Climate Change (2013) French
• National Climate Plan (2012) French
81 Nachmany, M. et al. (2015). Climate Change Legislation in Gabon. Grantham Research Institute on Climate Change and the Environment. URL: https://www.lse.ac.uk/GranthamInstitute/wp-content/uploads/2015/05/GABON.pdf
82 Adaptation Partnership (2011). Gabon, Review of current and planned adaptation action. URL: https://www.preventionweb.net/publications/view/25288
83 Gabon (2011). Second National Communication on Climate Change to the UNFCCC. URL: https://unfccc.int/sites/default/files/resource/Second%20Nat%20Com_GABON_Complete.pdf

25CLIMATE RISK COUNTRY PROFILE: GABON
Recommendations
Research Gaps• Increase data collection on the nature and magnitude of physical and biophysical climate change impacts
under differing scenarios, specifically for Gabon’s health sector and coastal zones
• Undertake risk assessments to develop a better understanding of important indicators of climate change
impacts for the future to define key vulnerabilities to the energy, agriculture and fisheries sectors
• Develop monitoring and evaluation systems to observe changes to coastlines and land usage
• Widen the participation of public, scientific institutions, women and local communities in planning and
management, taking into account approaches and methods of gender equity
• Invest in necessary technical improvements to national hydrometeorological observation equipment, networks
and technical analysis capabilities
Data and Information Gaps• Improve Gabon’s hydro-met database and weather service capabilities, especially coastal storm detection
• Improve data availability for key sectors such as agriculture, tourism, water resources, and others, the data is
not available to estimate the impacts of future climate change. Much of the data needed to estimate the future
damages from climate change and avoid them through adaptation would also help with existing climate variability
and help better target existing policies/ programs. This includes making data openly available which is paid for
by the public budget
• Further develop forest maintenance and monitoring capabilities to support efforts of the country’s REDD+
goals and related financial mechanisms
• Development of early warning systems about dangerous hydrometeorological phenomena and climate risk
management
Institutional Gaps• Establish institutional capacity for providing timely early warning systems
• Coordinate of the activities of various actors and sectors, including - government agencies, ministries, and
private entities and firms84
• Integrate of climate into national planning — Sectoral plans should be developed for the coming 20–30 years
and beyond and climate and climate change should be incorporated as a factor. This includes the development
of physical plans on the coast to minimize the risk from sea-level rise, targeting subsidies in the agriculture
sector to reduce climate vulnerability, physical planning and energy planning that will reduce emissions but also
take into account changing environmental conditions, being prepared to deal with health problems which may
arise from heat waves, and many other areas
84 Gabon (2011). Second National Communication on Climate Change to the UNFCCC. URL: https://unfccc.int/sites/default/files/resource/Second%20Nat%20Com_GABON_Complete.pdf